UNITED STATES
SECURITIES AND EXCHANGE COMMISSION
Washington, D.C. 20549
FORM N-CSR
CERTIFIED SHAREHOLDER REPORT OF REGISTERED
MANAGEMENT INVESTMENT COMPANIES
Investment Company Act File Number 811-10467
Causeway Capital Management Trust
(Exact name of registrant as specified in charter)
11111 Santa Monica Boulevard, 15th Floor
Los Angeles, CA 90025
(Address of principal executive offices) (Zip code)
SEI Investments Global Funds Services
One Freedom Valley Drive
Oaks, PA 19456
(Name and address of agent for service)
Registrant’s telephone number, including area code: 1-866-947-7000
Date of fiscal year end: September 30, 2013
Date of reporting period: September 30, 2013
| Item 1. | Reports to Stockholders. |
TABLE OF CONTENTS
LETTER TO SHAREHOLDERS
For the fiscal year ended September 30, 2013, Causeway Global Absolute Return Fund’s (the “Fund” or “Fund’s”) Institutional Class returned 4.29%, and Investor Class returned 3.79%, compared to the BofA Merrill Lynch 3-Month U.S. Treasury Bill Index return of 0.10%. During the same period, global equity markets, as represented by the MSCI World Index (“World Index”), returned 20.90%. At fiscal year end, the Fund had net assets of approximately $63 million.
Performance Review
The Fund’s global long portfolio takes long positions in securities under swap agreements, and the Fund’s global short portfolio takes short positions in securities under swap agreements. The global long portfolio outperformed the World Index, contributing to overall performance, while the global short portfolio also benefited the Fund by underperforming the World Index.
Other than a brief pullback in June and again in August, global developed equities ascended virtually unabated during fiscal 2013. Liquidity fueled demand for developed market equities, as monetary authorities in the United States, Japan, and Europe continued to provide substantial “quantitative easing.” The brief disruption in performance was caused by the introduction of the term “tapering” — a reduction in the pace of the bond-purchasing program by the United States Federal Reserve (the “Fed”). Markets were spooked briefly, but investors calmed down after the Fed provided further clarity, stating that its ability to remove stimulus is data-dependent, and the rate of unemployment would need to decline further.
Every market and every sector in the World Index advanced during the fiscal year. The best performing markets included Greece, Finland, France, the Netherlands, and Switzerland. The biggest laggards (albeit each in positive territory) included Israel, Singapore, Norway, Canada and one market that is not part of the World Index, but is in the Fund’s investable universe — South Korea. From a sector perspective, consumer discretionary, financials, industrials, and health care outperformed compared to the Index, while materials, energy, utilities, and information technology underperformed.
For the fiscal year, long exposures in the materials, telecommunication services, automobiles & components, and health care equipment & services industry groups, as well as an underweight to the technology hardware & equipment industry group contributed the most to the global long portfolio’s performance relative to the World Index. Exposures to securities in the consumer services, software & services, and transportation industry groups, as well as an overweight to the energy industry group and an underweight to the retailing industry group detracted from relative performance. Two of the largest individual contributors to long-side performance this year were automobile manufacturers, Toyota Motor (Japan) and Daimler (Germany). Additional top contributors to absolute return included database provider & publisher, Reed Elsevier (Netherlands), commercial jet manufacturer, Boeing (United States), and securities exchange, NASDAQ OMX (United States). The biggest laggard on the long side was for-profit education provider, Apollo (United States). Additional top individual detractors included post & parcel delivery provider, PostNL (Netherlands), energy services company, Petrofac (United Kingdom), money transfer company, Western Union (United States), and marine & offshore engineering company, Sembcorp Industries (Singapore).
| | | | |
| 2 | | Causeway Global Absolute Return Fund | | |
We use a quantitative approach to select securities for the global short portfolio of the Fund. Our quantitative framework seeks to take short positions in stocks that we believe are overvalued and have deteriorating earnings growth dynamics, poor technical price movements, and insolvency risk and/or inferior quality of earnings. For the fiscal year, the valuation category of metrics demonstrated the strongest predictive power — meaning overvalued stocks depreciated, as expected. Our financial strength and quality metrics also successfully identified underperforming stocks. Our technical metrics were neutral, while our earnings growth metrics did not demonstrate predictive power over this fiscal year period.
The global short portfolio’s relative added value for the fiscal year was due primarily to strong stock selection. We had particular success identifying downside candidates in Japan, Australia, and the euro zone. We also benefited by allocating more short exposure to the United Kingdom and Singapore (compared to the World Index). From an industry perspective, added value was concentrated in the commercial banks, pharmaceuticals, diversified financial services, and health care equipment & services. From a stock perspective, short positions in Commerzbank AG (Germany), Echo Entertainment Group (Australia), Apple (United States), Intuitive Surgical (United States), and Whitehaven Coal (Australia) were particularly effective, as all of these stocks substantially underperformed the World Index. Detractors from short-side performance were primarily concentrated within the metals & mining, computers & peripherals, semiconductors & equipment, and real estate management & development industries. At the stock level, our principal detractors were focused in the United States and included asset manager, Blackrock (United States), semiconductor equipment maker, Lam Research (United States), technology company, Hewlett-Packard (United States), real estate developer, Soho China (Hong Kong), and business service provider, HMS Holdings (United States). The share prices of these companies appreciated substantially during our holding periods, negatively impacting performance.
Significant Portfolio Changes
Our disciplined purchase and sale process led the portfolio management team to reduce long exposure to several securities that reached fair value. The largest decreases in exposure during the period included plant construction engineering firm, JGC (Japan), Air Products & Chemicals (United States), integrated energy producer, Total (France), nuclear power plant construction company, Babcock & Wilcox (United States), and energy exploration & production company, BG Group (United Kingdom). Significant exposure increases this fiscal year included four energy-related companies, Technip (France), Imperial Oil (Canada), Royal Dutch Shell (United Kingdom), and National Oilwell Varco (United States). An additional top “purchase” or exposure increase included global financial services giant, Citigroup (United States).
Long-side exposures to currencies, industries, and countries are largely a by-product of our bottom-up stock selection process. With that said, long-side weights in the energy, telecommunication services, and banks industry groups increased the most compared to the beginning of the fiscal year, while weights in the capital goods, consumer durables & apparel, and health care equipment & services industry groups
| | | | | | |
| | | Causeway Global Absolute Return Fund | | | 3 | |
incurred the greatest decreases. From a regional perspective, the most notable weight changes included higher exposure to companies listed in the United Kingdom and Canada. The most significantly reduced country weights included the United States and France.
On the short side of the portfolio, and consistent with the shorter time horizon of our quantitative investment process, portfolio turnover for the period was higher than that of the long side. Notable names in which we increased short exposure included Standard Life (United Kingdom), Fresenius Medical Care (Germany), Wal-Mart Stores (United States), American Campus Communities (United States), and Bank of Nova Scotia (Canada). Notable names in which we reduced or covered short exposure included PepsiCo (United States), Soho China (Hong Kong), Ventas (United States), Equity LifeStyle Properties (United States), and Nintendo (Japan).
In terms of combined long/short positioning, we have increased net exposure (absolute value of long exposures minus short exposures) to Canada and the United Kingdom and reduced net exposure to France and the United States. From an economic sector perspective, we increased net exposure to energy and financials (the latter by covering some of our negative bias) and reduced net exposure to health care and industrials. At the end of the fiscal year, total gross exposure (leverage) was modestly lower from the end of the prior year, and net exposure was slightly lower as well. We continue to seek below-equity market volatility for the portfolios.
Investment Outlook
At present on the long side of the portfolio, we are seeking a balance between exposures to stocks with the potential for earnings recovery, typically via restructuring and improved management, and those offering ballast. The higher equity markets rise, the more we emphasize stocks that could help reduce the risk in the global long portfolio in changing market conditions. In the wake of the recent equity bull market, our portfolio managers are attempting to emphasize stability of future returns. This is not an easy task when many of the lower-volatility stocks carry full valuations. Our research team has found several interesting candidates with recovery potential, and some prospect of earnings stability. These stocks also offer competitive risk-adjusted estimated returns in our ranking model. We also aim to have large long-side weights in companies that we believe will enjoy the tailwinds of a favorable industry position.
We are encouraged by the gradual improvement in performance in some of the more controversial long-side exposures such as those in the energy and banking sectors. Commodity-related stocks have disappointed with concerns of slowing Chinese growth. Add to this the problems associated with current account deficits in other major emerging markets such as India and Indonesia. Reflecting this pessimism, energy stocks have fared poorly relative to buoyant market indices over the past 12 months. We have spent this year positioning the long portfolio to take advantage of stable energy demand and likely crude oil supply disruptions. We have emphasized companies in the oil & gas services sector globally, as they should benefit from the inexorable need for more exploration, even in hostile, deep-water environments. In banking, our emphasis remains tilted toward healthy franchises which should benefit
| | | | |
| 4 | | Causeway Global Absolute Return Fund | | |
from a slow and steady recovery in property values and a more normal environment ahead for net interest margins and bad debts. As major developed markets regions (United States, Europe, and Japan) must endure years of public sector deleveraging ahead, we expect monetary policy conditions to remain accommodative, thereby supporting the case for equities.
In times of market duress, the quantitatively-managed short side of the portfolio is critical to dampen overall portfolio volatility and provide an additional source of return. We continue to monitor over 3,000 stocks for overvaluation, situations where we expect growth to falter, financial stress or accounting gimmickry, and/or unusual price movements. We believe the environment is fertile for our quantitative approach, and are finding many opportunities to hedge the long side of the portfolio with attractive downside (short) candidates.
On an aggregate long/short portfolio basis, we continue to maintain a near market-neutral posture, of -4.4% net exposure overall. At the sector level, our largest net biases are to energy and industrials where we have significant positive net exposure. Our greatest negative net exposure is to financials and utilities. From a regional perspective, we are currently net biased towards the United Kingdom and the Netherlands and biased against the United States and Spain. Total gross exposure was 295% (2.95x) as of September 30, 2013, and is consistent with our goal of delivering volatility below equity market volatility.
We thank you for your continued confidence in Causeway Global Absolute Return Fund.
October 31, 2013
| | | | | | |
 | |  | |  | |  |
| | | |
| Harry W. Hartford | | Sarah H. Ketterer | | James A. Doyle | | Jonathan P. Eng |
| Portfolio Manager | | Portfolio Manager | | Portfolio Manager | | Portfolio Manager |
| | | | | | |
 | |  | |  | |  |
| | | |
| Kevin Durkin | | Conor Muldoon | | Arjun Jayaraman | | MacDuff Kuhnert |
| Portfolio Manager | | Portfolio Manager | | Portfolio Manager | | Portfolio Manager |
| | |
 | |  |
| |
| Foster Corwith | | Alessandro Valentini |
| Portfolio Manager | | Portfolio Manager |
| | | | | | |
| | | Causeway Global Absolute Return Fund | | | 5 | |
The above commentary expresses the portfolio managers’ views as of the date shown and should not be relied upon by the reader as research or investment advice. These views are subject to change. There is no guarantee that any forecasts made will come to pass.
Investing involves risk including loss of principal. In addition to the normal risks associated with investing, international investments may involve risk of capital loss from unfavorable fluctuation in currency values, from differences in generally accepted accounting principles or from economic or political instability in other nations. Emerging markets involve heightened risks related to the same factors as well as increased volatility and lower trading volume. Diversification does not prevent all investment losses.
The Fund is not appropriate for all investors. The Fund uses swap agreements to obtain long and short exposures to securities. Swaps are derivatives which involve the use of leverage, and the Fund will use significant leverage. The use of leverage is speculative and will magnify any losses. Short positions will lose money if the price of the underlying security increases, and losses on shorts are therefore potentially unlimited. The use of swap agreements involves significant swap expenses including financing charges and transaction costs which will reduce investment returns and increase investment losses. The Fund risks loss of the amount due under a swap agreement if the counterparty defaults. The Fund currently enters into swap agreements primarily with one counterparty, focusing its exposure to the credit risk of that counterparty. Swap agreements involve liquidity risks since the Fund may not be able to exit security exposures immediately, particularly during periods of market turmoil. The Fund settles swap agreements at least monthly which can cause it to realize ordinary income and short-term capital gains, if any, throughout the year that, when distributed to shareholders, will be taxable to them as ordinary income rather than at lower long-term capital gains rates. While the total dollar amounts of long and short exposures are expected to be approximately equal, the global long portfolio and the global short portfolio will be managed using different styles and, as a result, will have exposures that will not be hedged. This is not a complete list of the Fund’s risks. See the Fund’s prospectus for additional information on risks.
| | | | |
| 6 | | Causeway Global Absolute Return Fund | | |
Comparison of Change in the Value of a $10,000 Investment in Causeway Global Absolute Return Fund, Investor Class shares versus the BofA Merrill Lynch 3-Month US Treasury Bill Index
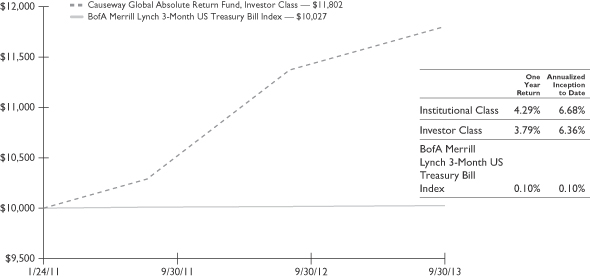
The performance in the above graph does not reflect the deduction of taxes the shareholder will pay on Fund distributions or the redemptions of Fund shares. The inception date of Causeway Global Absolute Return Fund was January 24, 2011. The BofA Merrill Lynch 3-Month US Treasury Bill Index return is from January 24, 2011.
The performance data represents past performance and is not an indication of future results. Investment return and the principal value of an investment will fluctuate so that an investor’s shares, when redeemed, may be worth less than their original cost and current performance may be higher or lower than the performance quoted. For performance data current to the most recent month end, please call 1-866-947-7000 or visit www.causewayfunds.com. Investment performance reflects fee waivers in effect. In the absence of such fee waivers, total return would be reduced. Total returns assume reinvestment of dividends and capital gains distributions at net asset value when paid. Investor Class shares pay a shareholder service fee of up to 0.25% per annum of average daily net assets. Institutional Class shares pay no shareholder service fee. The Fund imposes a 2% redemption fee on the value of shares redeemed less than 60 days after purchase. If your account incurred a redemption fee, your performance will be lower than the performance shown here. For more information, please see the prospectus.
The BofA Merrill Lynch 3-Month US Treasury Bill Index is comprised of a single issue purchased at the beginning of the month and held for a full month. Each month the index is rebalanced and the issue selected is the outstanding Treasury Bill that matures closest to, but not beyond 3 months from, the rebalancing date. The Treasury Bills comprising the Index are guaranteed by the U.S. government as to the timely payment of interest and principal. The Index is gross of withholding taxes and assumes reinvestment of dividends and capital gains. The Index does not reflect the payment of transaction costs, fees and expenses associated with an investment in the Fund. It is not possible to invest directly in an index. While the Fund may invest a portion of its assets in Treasury Bills, it will primarily be exposed to notional positions in securities that will not be similarly guaranteed by the U.S. government. An investment in the Fund involves special risks (please see Note 5 in the Notes to Financial Statements).
| | | | | | |
| | | Causeway Global Absolute Return Fund | | | 7 | |
SCHEDULE OF INVESTMENTS (000)*
September 30, 2013
| | | | | | | | |
| Causeway Global Absolute Return Fund | | Number of Shares | | | Value | |
SHORT-TERM INVESTMENT | | | | | | | | |
Dreyfus Cash Management,
Institutional Class, 0.040% **,1 | | | 61,851,643 | | | $ | 61,852 | |
| | | | | | | | |
Total Short-Term Investment | | | | | | | | |
(Cost $61,852) — 98.7% | | | | | | | 61,852 | |
| | | | | | | | |
Total Investment — 98.7% | | | | | | | | |
(Cost $61,852) | | | | | | | 61,852 | |
| | | | | | | | |
Other Assets in Excess of Liabilities — 1.3% | | | | | | | 801 | |
| | | | | | | | |
Net Assets — 100.0% | | | | | | $ | 62,653 | |
| | | | | | | | |
A list of outstanding total return swap agreements held by the Fund at September 30, 2013, is as follows:
| | | | | | | | | | | | | | | | | | |
| Counterparty | | Reference Entity/
Obligation | | Fixed
payments
paid | | Total
Return
received
or paid | | Termination
Date | | | Net
Notional
Amount2 | | | Net
Unrealized
Appreciation
(Depreciation) | |
Long Positions | | | | | | | | | | | | | | | | | | |
Morgan Stanley | | Canada Custom Basket of Securities | | Long:
Fed Funds-1 day + 0.50% | | Total Return of the basket of securities | | | 1/30/2014 | | | $ | 4,180 | | | $ | 6 | |
| | | | | | |
Morgan Stanley | | United Kingdom Custom Basket of Securities | | Long:
Fed Funds-1 day + 0.55% Short:
Fed Funds-1 day – 0.35% | | Total Return of the basket of securities | | | 1/29/2015 | | | | 5,395 | | | | (19 | ) |
| | | | | | |
Morgan Stanley | | Singapore Custom Basket of Securities | | Long:
Fed Funds-1 day + 0.55% Short:
Fed Funds-1 day – 0.50% | | Total Return of the basket of securities | | | 1/30/2014 | | | | 23 | | | | (9 | ) |
| | | | | | |
Morgan Stanley | | South Korea Custom Basket of Securities | | Long:
Fed Funds-1 day + 0.65% | | Total Return of the basket of securities | | | 1/30/2014 | | | | 1,900 | | | | — | |
| | | | | | |
Morgan Stanley | | Europe Custom Basket of Securities (Local) | | Long:
EONIA-1 day + 0.55% Short:
EONIA-1 day – 0.40% to EONIA-1 day – 0.88% | | Total Return of the basket of securities | | | 1/30/2014 | | | | 18 | | | | — | |
| | | | | | |
Morgan Stanley | | United States Custom Basket of Long Securities | | Long:
Fed Funds-1 day + 0.50% | | Total Return of the basket of securities | | | 1/30/2014 | | | | 36,167 | | | | 36 | |
The accompanying notes are an integral part of the financial statements.
| | | | |
| 8 | | Causeway Global Absolute Return Fund | | |
SCHEDULE OF INVESTMENTS (000)* (concluded)
September 30, 2013
| | | | | | | | | | | | | | | | | | |
| Counterparty | | Reference Entity/
Obligation | | Fixed
payments
paid | | Total
Return
received
or paid | | Termination
Date | | | Net
Notional
Amount2 | | | Net
Unrealized
Appreciation
(Depreciation) | |
Short Positions | | | | | | | | | | | | | | | | | | |
Morgan Stanley | | Europe Custom Basket of Securities | | Long: Fed
Funds-1 day + 0.55%
Short:
Fed Funds-1 day – 0.40%to Fed Funds-1 day – 0.88% | | Total Return of the basket of securities | | | 1/29/2015 | | | $ | (1,253 | ) | | $ | — | |
| | | | | | |
Morgan Stanley | | Japan Custom Basket of Securities | | Long:
Fed Funds-1 day + 0.55% Short:
Fed Funds-1 day – 0.40% to Fed Funds-1 day – 1.50% | | Total Return of the basket of securities | | | 1/29/2015 | | | | (1,670 | ) | | | 15 | |
| | | | | | |
Morgan Stanley | | Australia Custom Basket of Securities | | Short:
Fed Funds-1 day – 0.50% to Fed Funds-1 day -1.11% | | Total Return of the basket of securities | | | 1/29/2015 | | | | (1,724 | ) | | | (11 | ) |
| | | | | | |
Morgan Stanley | | Hong Kong Custom Basket of Securities | | Long:
Fed Funds-1 day + 0.55% Short:
Fed Funds-1 day – 0.50% to Fed Funds – 1.25% | | Total Return of the basket of securities | | | 1/29/2015 | | | | (5 | ) | | | 30 | |
| | | | | | |
Morgan Stanley | | Canada Custom Basket of Securities | | Short:
Fed Funds-1 day – 0.35% | | Total Return of the basket of securities | | | 1/29/2015 | | | | (4,184 | ) | | | (17 | ) |
| | | | | | |
Morgan Stanley | | United States Custom Basket of Short Securities | | Short:
Fed Funds-1 day – 0.35% to Fed Funds-1 day – 2.50% | | Total Return of the basket of securities | | | 1/29/2015 | | | | (41,873 | ) | | | (85 | ) |
| | | | | | | | | | | | | | | | | | |
| | | | | | | | | | | | | | | | $ | (54 | ) |
| | | | | | | | | | | | | | | | | | |
| ** | The rate reported is the 7-day effective yield as of September 30, 2013. |
| 1 | Of this investment $31,773 was pledged and segregated with the custodian as collateral for outstanding total return equity swap agreements. |
| 2 | The net notional amount is the sum of long and short positions. The gross notional amount of long positions and short positions at September 30, 2013 is $47,683 and $(50,709), respectively. The gross notional amounts are representative of the volume of activity during the year ended September 30, 2013. |
The accompanying notes are an integral part of the financial statements.
| | | | | | |
| | | Causeway Global Absolute Return Fund | | | 9 | |
SECTOR DIVERSIFICATION
As of September 30, 2013, the sector diversification was as follows (Unaudited):
| | | | |
| Causeway Global Absolute Return Fund | | % of Net Assets | |
| Short-Term Investment | | | 98.7% | |
| | | | |
| Other Assets in Excess of Liabilities | | | 1.3 | |
| | | | |
| Net Assets | | | 100.0% | |
| | | | |
The accompanying notes are an integral part of the financial statements.
| | | | |
| 10 | | Causeway Global Absolute Return Fund | | |
STATEMENT OF ASSETS AND LIABILITIES (000)*
| | | | |
| | | CAUSEWAY GLOBAL
ABSOLUTE RETURN
FUND | |
| |
| | | 9/30/13 | |
ASSETS: | | | | |
Investments at Value (Cost $61,852) | | $ | 61,852 | |
Receivable Due from Swap Counterparty | | | 2,258 | |
Receivable for Fund Shares Sold | | | 268 | |
Unrealized Appreciation on Total Return Swaps | | | 87 | |
Prepaid Expenses | | | 7 | |
Receivable for Dividends | | | 1 | |
| | | | |
Total Assets | | | 64,473 | |
| | | | |
LIABILITIES: | | | | |
Payable Due to Swap Counterparty | | | 1,337 | |
Payable for Fund Shares Redeemed | | | 193 | |
Unrealized Depreciation on Total Return Swaps | | | 141 | |
Payable Due to Adviser | | | 63 | |
Payable for Shareholder Services Fees — Investor Class | | | 11 | |
Payable Due to Administrator | | | 3 | |
Payable for Trustees’ Fees | | | 2 | |
Other Accrued Expenses | | | 70 | |
| | | | |
Total Liabilities | | | 1,820 | |
| | | | |
Net Assets | | $ | 62,653 | |
| | | | |
NET ASSETS: | | | | |
Paid-in Capital (unlimited authorization — no par value) | | $ | 62,114 | |
Undistributed Net Investment Income | | | 3,283 | |
Accumulated Net Realized Loss on Swap Contracts | | | (2,690 | ) |
Net Unrealized Depreciation on Swap Contracts | | | (54 | ) |
| | | | |
Net Assets | | $ | 62,653 | |
| | | | |
Net Asset Value Per Share (based on net assets of
$32,888,456 ÷ 2,949,402 shares) — Institutional Class | | | $11.15 | |
| | | | |
Net Asset Value Per Share (based on net assets of
$29,764,834 ÷ 2,682,741 shares) — Investor Class | | | $11.09 | |
| | | | |
| * | Except for Net Asset Value data. |
The accompanying notes are an integral part of the financial statements.
| | | | | | |
| | | Causeway Global Absolute Return Fund | | | 11 | |
STATEMENT OF OPERATIONS (000)
| | | | |
| | | CAUSEWAY GLOBAL
ABSOLUTE RETURN
FUND | |
| |
| | | 10/01/12 to
9/30/13 | |
INVESTMENT INCOME: | | | | |
Dividend Income | | $ | 28 | |
| | | | |
Total Investment Income | | | 28 | |
| | | | |
EXPENSES: | | | | |
Investment Advisory Fees | | | 785 | |
Shareholder Service Fees — Investor Class | | | 69 | |
Transfer Agent Fees | | | 68 | |
Professional Fees | | | 52 | |
Administration Fees | | | 40 | |
Registration Fees | | | 27 | |
Printing Fees | | | 19 | |
Custodian Fees | | | 7 | |
Trustees’ Fees | | | 5 | |
Pricing Fees | | | 1 | |
Other Fees | | | 9 | |
| | | | |
Total Expenses | | | 1,082 | |
| | | | |
LESS: | | | | |
Waiver of Investment Advisory Fees | | | (97 | ) |
| | | | |
| |
Net Expenses | | | 985 | |
| | | | |
Net Investment Loss | | | (957 | ) |
| | | | |
Net Realized and Unrealized Gain (Loss) on Swap Contracts: | | | | |
Net Realized Gain from Swap Contracts | | | 1,672 | |
Net Change in Unrealized Depreciation on Swap Contracts | | | (19 | ) |
| | | | |
Net Realized and Unrealized Gain on Swap Contracts | | | 1,653 | |
| | | | |
| Net Increase in Net Assets Resulting from Operations | | $ | 696 | |
| | | | |
The accompanying notes are an integral part of the financial statements.
| | | | |
| 12 | | Causeway Global Absolute Return Fund | | |
STATEMENTS OF CHANGES IN NET ASSETS (000)
| | | | | | | | |
| | | CAUSEWAY GLOBAL
ABSOLUTE RETURN FUND | |
| | |
| | | 10/01/12 to
9/30/13 | | | 10/01/11 to
9/30/12 | |
OPERATIONS: | | | | | | | | |
Net Investment Loss | | $ | (957 | ) | | $ | (719 | ) |
Net Realized Gain from Swap Contracts | | | 1,672 | | | | 3,054 | |
Net Change in Unrealized Depreciation on Swap Contracts | | | (19 | ) | | | (18 | ) |
| | | | | | | | |
Net Increase in Net Assets Resulting From Operations | | | 696 | | | | 2,317 | |
| | | | | | | | |
DIVIDENDS AND DISTRIBUTIONS TO SHAREHOLDERS: | | | | | | | | |
Dividends from Net Investment Income: | | | | | | | | |
Institutional Class | | | (870 | ) | | | (125 | ) |
Investor Class | | | (766 | ) | | | (76 | ) |
| | | | | | | | |
Total Dividends from Net Investment Income | | | (1,636 | ) | | | (201 | ) |
| | | | | | | | |
Distributions from Net Capital Gains: | | | | | | | | |
Institutional Class | | | — | | | | (378 | ) |
Investor Class | | | — | | | | (245 | ) |
| | | | | | | | |
Total Distributions from Net Capital Gains | | | — | | | | (623 | ) |
| | | | | | | | |
Total Dividends and Distributions to Shareholders | | | (1,636 | ) | | | (824 | ) |
Net Increase in Net Assets Derived from Capital Share Transactions(1) | | | 468 | | | | 47,330 | |
Redemption Fees(2) | | | — | | | | 3 | |
| | | | | | | | |
Total Increase (Decrease) in Net Assets | | | (472 | ) | | | 48,826 | |
| | | | | | | | |
NET ASSETS: | | | | | | | | |
Beginning of Year | | | 63,125 | | | | 14,299 | |
| | | | | | | | |
End of Year | | $ | 62,653 | | | $ | 63,125 | |
| | | | | | | | |
Undistributed Net Investment Income | | $ | 3,283 | | | $ | 1,636 | |
| | | | | | | | |
| (1) | See Note 7 in the Notes to Financial Statements. |
| (2) | See Note 2 in the Notes to Financial Statements. |
Amounts designated as “—” are $0.
The accompanying notes are an integral part of the financial statements.
| | | | | | |
| | | Causeway Global Absolute Return Fund | | | 13 | |
FINANCIAL HIGHLIGHTS
For the Years or Period Ended September 30,
For a Share Outstanding Throughout the Periods
| | | | | | | | | | | | | | | | | | | | | | | | | | | | | | | | |
| | | Net Asset
Value,
Beginning
of Period ($) | | | Net
Investment
Loss ($) | | | Net Realized
and
Unrealized
Gain on
Swap
Contracts ($) | | | Total
from
Operations ($) | | | Dividends
from Net
Investment
Income ($) | | | Distributions
from
Capital
Gains ($) | | | Total
Dividends
and
Distributions ($) | | | Redemption
Fees ($) | |
CAUSEWAY GLOBAL ABSOLUTE RETURN FUND† | |
Institutional | |
2013 | | | 10.99 | | | | (0.18 | ) | | | 0.62 | | | | 0.44 | | | | (0.28 | ) | | | — | | | | (0.28 | ) | | | — | |
2012 | | | 10.31 | | | | (0.19 | ) | | | 1.28 | | | | 1.09 | | | | (0.10 | ) | | | (0.31 | ) | | | (0.41 | ) | | | — | |
2011(1)(2) | | | 10.00 | | | | (0.12 | ) | | | 0.43 | | | | 0.31 | | | | — | | | | — | | | | — | | | | — | |
Investor | | | | | | | | | | | | | | | | | | | | | | | | | | | | | | | | |
2013 | | | 10.96 | | | | (0.20 | ) | | | 0.59 | | | | 0.39 | | | | (0.26 | ) | | | — | | | | (0.26 | ) | | | — | |
2012 | | | 10.29 | | | | (0.21 | ) | | | 1.28 | | | | 1.07 | | | | (0.09 | ) | | | (0.31 | ) | | | (0.40 | ) | | | — | |
2011(1)(2) | | | 10.00 | | | | (0.15 | ) | | | 0.44 | | | | 0.29 | | | | — | | | | — | | | | — | | | | — | |
| (1) | Commenced operations on January 24, 2011. |
| (2) | All ratios for periods of less than one year are annualized. Total returns and portfolio turnover rate are for the period indicated and have not been annualized. |
| † | Per share amounts calculated using average shares method. |
Amounts designated as “—” are $0 or round to $0.
The accompanying notes are an integral part of the financial statements.
| | | | |
| 14 | | Causeway Global Absolute Return Fund | | |
| | | | | | | | | | | | | | | | | | | | | | | | | | |
Net Asset
Value, End
of Period ($) | | | Total
Return (%) | | | Net Assets,
End of
Period
($000) | | | Ratio of
Expenses to
Average Net
Assets (%) | | | Ratio of
Expenses
to Average
Net Assets
(Excluding
Waivers) (%) | | | Ratio
of Net
Investment
Loss
to Average
Net Assets (%) | | | Portfolio
Turnover
Rate (%) | |
| | | | | | | | | | | | | | | | | | | | | | | | | | |
| | | | | | | | | | | | | | | | | | | | | | | | | | |
| | 11.15 | | | | 4.29 | | | | 32,888 | | | | 1.75 | | | | 1.94 | | | | (1.69 | ) | | | — | |
| | 10.99 | | | | 10.65 | | | | 30,986 | | | | 1.82 | | | | 2.31 | | | | (1.75 | ) | | | — | |
| | 10.31 | | | | 3.10 | | | | 11,444 | | | | 1.85 | | | | 3.51 | | | | (1.77 | ) | | | — | |
| | | | | | | | | | | | | | | | | | | | | | | | | | |
| | 11.09 | | | | 3.79 | | | | 29,765 | | | | 2.00 | | | | 2.19 | | | | (1.94 | ) | | | — | |
| | 10.96 | | | | 10.50 | | | | 32,139 | | | | 2.07 | | | | 2.54 | | | | (1.99 | ) | | | — | |
| | 10.29 | | | | 2.90 | | | | 2,855 | | | | 2.10 | | | | 3.33 | | | | (2.06 | ) | | | — | |
The accompanying notes are an integral part of the financial statements.
| | | | | | |
| | | Causeway Global Absolute Return Fund | | | 15 | |
NOTES TO FINANCIAL STATEMENTS
Causeway Global Absolute Return Fund (the “Fund”) is a series of Causeway Capital Management Trust (the “Trust”). The Trust is an open-end management investment company registered under the Investment Company Act of 1940, as amended (the “1940 Act”) and is a Delaware statutory trust that was established on August 10, 2001. The Fund commenced operations on January 24, 2011. The Fund is authorized to offer two classes of shares, the Institutional Class and the Investor Class. The Declaration of Trust authorizes the issuance of an unlimited number of shares of beneficial interest of the Fund. The Fund is diversified. The Fund’s prospectus provides a description of the Fund’s investment objectives, policies and strategies. The Trust has four additional series, the financial statements of which are presented separately.
| 2. | | Significant Accounting Policies |
The following is a summary of the significant accounting policies consistently followed by the Fund.
Use of Estimates in the Preparation of Financial Statements – The preparation of financial statements in conformity with U.S. generally accepted accounting principles (“U.S. GAAP”) requires management to make estimates and assumptions that affect the reported amount of net assets and liabilities and disclosure of contingent assets and liabilities at the date of the financial statements and the reported amounts of increases and decreases in net assets from operations during the reporting period. Actual results could differ from those estimates.
Security Valuation – Over-the-counter financial derivative instruments, such as swap agreements, derive their value from underlying asset prices, indices, reference rates, and other inputs, or a combination of
these factors. These contracts are normally valued on the basis of broker dealer quotations.
Except as described below, securities listed on a securities exchange (except the NASDAQ Stock Market (“NASDAQ”)), or Over-the-Counter (“OTC”) for which market quotations are available are valued at the last reported sale price as of the close of trading on each business day, or, if there is no such reported sale, at the last reported bid price for long positions. For securities traded on NASDAQ, the NASDAQ Official Closing Price will be used. Securities listed on multiple exchanges or OTC markets are valued on the exchange or OTC market considered by the Fund to be the primary market. The prices for foreign securities are reported in local currency and converted to U.S. dollars using currency exchange rates. If a security price cannot be obtained from an independent pricing agent, the Fund seeks to obtain a bid price from at least one independent broker. Investments in the Dreyfus Cash Management money market fund are valued daily at the net asset value per share.
Securities and derivative contracts for which market prices are not “readily available” are valued in accordance with fair value pricing procedures approved by the Fund’s Board of Trustees (the “Board”). The Fund’s fair value pricing procedures are implemented through a fair value committee (the “Committee”) designated by the Board. Some of the more common reasons that may necessitate that a security be valued using fair value pricing procedures include: the security’s trading has been halted or suspended; the security has been delisted from a national exchange; the security’s primary trading market is temporarily closed at a time when under normal conditions it would be open; the security’s primary pricing source is not able or willing to provide a price; or the security is a swap agreement that is not publicly traded. When the Committee values a security in accordance with the fair value pricing procedures,
| | | | |
| 16 | | Causeway Global Absolute Return Fund | | |
NOTES TO FINANCIAL STATEMENTS
(continued)
the Committee will determine the value after taking into consideration relevant information reasonably available to the Committee.
In accordance with the authoritative guidance on fair value measurements and disclosure under U.S. GAAP, the Fund discloses fair value of its investments in a hierarchy that prioritizes the inputs to valuation techniques used to measure the fair value. The objective of a fair value measurement is to determine the price that would be received to sell an asset or paid to transfer a liability in an orderly transaction between market participants at the measurement date (an exit price). Accordingly, the fair value hierarchy gives the highest priority to quoted prices (unadjusted) in active markets for identical assets or liabilities (Level 1) and the lowest priority to unobservable inputs (Level 3). The guidance establishes three levels of fair value hierarchy as follows:
| | • | | Level 1 — Unadjusted quoted prices in active markets for identical, unrestricted assets or liabilities that the Fund has the ability to access at the measurement date; |
| | • | | Level 2 — Quoted prices in markets which are not active, or prices based on inputs that are observable (either directly or indirectly) for substantially the full term of the asset or liability; and |
| | • | | Level 3 — Prices, inputs or exotic modeling techniques which are both significant to the fair value measurement and unobservable (supported by little or no market activity). |
Investments are classified within the level of the lowest significant input considered in determining fair value. Investments classified within Level 3 whose fair value measurement considers several inputs may include Level 1 or Level 2 inputs as components of the overall fair value measurement.
The table below sets forth information about the level within the fair value hierarchy at which the Fund’s investments and other financial instruments are measured at September 30, 2013:
| | | | | | | | | | | | | | | | |
Investment in
Securities | | Level 1
(000) | | | Level 2
(000) | | | Level 3
(000) | | | Total
(000) | |
Short-Term Investment | | $ | 61,852 | | | $ | — | | | $ | — | | | $ | 61,852 | |
| | | | |
| Total Investment in Securities | | $ | 61,852 | | | $ | — | | | $ | — | | | $ | 61,852 | |
| | | | |
| | | | |
Other Financial
Instruments | | Level 1
(000) | | | Level 2
(000) | | | Level 3
(000) | | | Total
(000) | |
Total Return Swaps* | | | | | | | | | | | | | | | | |
Unrealized Appreciation | | $ | — | | | $ | 87 | | | $ | — | | | $ | 87 | |
Unrealized Depreciation | | | — | | | | (141 | ) | | | — | | | | (141 | ) |
| | | | |
| Total Other Financial Instruments | | $ | — | | | $ | (54 | ) | | $ | — | | | $ | (54 | ) |
| | | | |
| * | Total return swap contracts are valued at the unrealized appreciation (depreciation) on the instrument. |
Please refer to the Schedule of Investments for additional information regarding the composition of the amounts listed above.
Changes in valuation techniques may result in transfers in or out of an investment’s assigned level within the hierarchy during the reporting period. For the Fund there were no transfers between Level 1 and Level 2 during the reporting period, based on the input level assigned under the hierarchy at the beginning and end of the reporting period. For the year ended September 30, 2013, there were no significant changes to the Fund’s fair value methodologies.
Federal Income Taxes – It is the Fund’s intention to continue to qualify as a regulated investment company under Subchapter M of the Internal Revenue Code and to distribute all of its taxable income. Accordingly, no provision for Federal income taxes has been made in the financial statements.
| | | | | | |
| | | Causeway Global Absolute Return Fund | | | 17 | |
NOTES TO FINANCIAL STATEMENTS
(continued)
The Fund evaluates tax positions taken or expected to be taken in the course of preparing the Fund’s tax returns to determine whether it is “more-likely-than not” (i.e., greater than 50-percent) that each tax position will be sustained upon examination by a taxing authority based on the technical merits of the position. Tax positions not deemed to meet the more likely-than-not threshold are recorded as a tax benefit or expense in the current year. The Fund did not record any tax provision in the current period. However, management’s conclusions regarding tax positions taken may be subject to review and adjustment at a later date based on factors including, but not limited to, examination by tax authorities (i.e., the last 3 tax year ends, as applicable), on-going analysis of and changes to tax laws, regulations and interpretations thereof.
As of and during the year ended September 30, 2013, the Fund did not have a liability for any unrecognized tax benefits. The Fund recognizes interest and penalties, if any, related to unrecognized tax benefits as income tax expense in the Statement of Operations. During the year, the Fund did not incur any significant interest or penalties.
Security Transactions and Related Income – Security transactions are accounted for on the date the security is purchased or sold (trade date). Dividend income is recognized on the ex-dividend date, and interest income is recognized using the accrual basis of accounting. Costs used in determining realized gains and losses on the sales of investment securities are those of the specific securities sold.
Swap Agreements – Under a swap agreement, the Fund pays the other party to the agreement (a “swap counterparty”) fees plus an amount equal to any negative total returns from stipulated underlying investments identified by the Fund’s portfolio managers. In
exchange, the counterparty pays the Fund an amount equal to any positive total returns from the stipulated underlying investments. The returns to be “swapped” between the Fund and the swap counterparty will be calculated with reference to a “notional” amount, i.e., the dollar amount hypothetically invested, long or short, in a particular security or group of securities. The Fund’s returns will generally depend on the net amount to be paid or received under the swap agreement, which will depend on the market movements of the stipulated underlying securities. The Fund’s net asset value will reflect any amounts owed to the Fund by the swap counterparty (when the Fund’s position under a swap agreement is, on a net basis, “in the money”) or amounts owed by the Fund to the counterparty (when the Fund’s position under a swap agreement is, on a net basis, “out of the money”).
Swap Agreements and Leverage – Normally, the Fund’s assets (other than the swap agreements) will be directly invested primarily in money market instruments and U.S. Treasury securities that will be used to support and cover the Fund’s obligations under its swap agreements. However, the use of a swap agreement allows the Fund to obtain investment exposures greater than it could otherwise obtain with direct investments, allowing it to effectively increase, or leverage, its total long and short investment exposures.
Expense/Classes – Expenses that are directly related to one Fund of the Trust are charged directly to that Fund. Other operating expenses of the Trust are prorated to the Fund and the other series of the Trust on the basis of relative daily net assets. Class specific expenses are borne by that class of shares. Income, realized and unrealized gains/losses and non-class specific expenses are allocated to the respective classes on the basis of relative daily net assets.
| | | | |
| 18 | | Causeway Global Absolute Return Fund | | |
NOTES TO FINANCIAL STATEMENTS
(continued)
Dividends and Distributions – Dividends from net investment income, if any, are declared and paid on an annual basis. Any net realized capital gains on sales of securities are distributed to shareholders at least annually.
Redemption Fee – The Fund imposes a redemption fee of 2% on the value of capital shares redeemed by shareholders less than 60 days after purchase. The redemption fee also applies to exchanges from the Fund. The redemption fee is paid to the Fund. The redemption fee does not apply to shares purchased through reinvested distributions or shares redeemed through designated systematic withdrawal plans. The redemption fee does not normally apply to accounts designated as omnibus accounts with the transfer agent. These are arrangements through financial intermediaries where the purchase and sale orders of a number of persons are aggregated before being communicated to the Fund. However, the Fund may seek agreements with these intermediaries to impose the Fund’s redemption fee or a different redemption fee on their customers if feasible, or to impose other appropriate restrictions on excessive short-term trading. The officers of the Fund may waive the redemption fee for shareholders in asset allocation and similar investment programs reasonably believed not to be engaged in short-term market timing, including for holders of shares purchased by Causeway Capital Management LLC (the “Adviser”) for its clients to rebalance their portfolios. For the year ended September 30, 2013, the Investor Class retained $95 in redemption fees.
| 3. | | Investment Advisory, Administration, Shareholder Service and Distribution Agreements |
The Trust, on behalf of the Fund, has entered into an Investment Advisory Agreement (the “Advisory Agreement”) with the Adviser. Under the Advisory Agreement, the Adviser is entitled to a monthly fee
equal to an annual rate of 1.50% of the Fund’s average daily net assets. The Adviser contractually agreed through January 31, 2014 to waive its fee and, to the extent necessary, reimburse the Fund to keep total annual fund operating expenses (excluding swap agreement financing charges and transaction costs, borrowing expenses, dividend expenses on securities sold short, brokerage fees and commissions, interest, taxes, shareholder service fees, fees and expenses of other funds in which the Fund invests, and extraordinary expenses) from exceeding 1.75% of Institutional Class and Investor Class average daily net assets. For the year ended September 30, 2013, the Adviser waived $96,682.
The Trust and SEI Investments Global Funds Services (the “Administrator”) have entered into an Administration Agreement. Under the terms of the Administration Agreement, the Administrator is entitled to an annual fee which is calculated daily and paid monthly based on the aggregate average daily net assets of the Trust as follows: 0.06% up to $1 billion; 0.05% of the assets exceeding $1 billion up to $2 billion; 0.04% of the assets exceeding $2 billion up to $3 billion; 0.03% of the assets exceeding $3 billion up to $4 billion; and 0.02% of the assets exceeding $4 billion. The Fund is subject to a minimum annual fee of $40,000. If the Fund has three or more share classes, it shall be subject to an additional minimum fee of $20,000 per additional share class (over two).
The Trust has adopted a Shareholder Service Plan and Agreement for Investor Class shares that allows the Trust to pay broker-dealers and other financial intermediaries a fee of up to 0.25% per annum of average daily net assets for services provided to Investor Class shareholders. For the year ended September 30, 2013, the Investor Class paid 0.25% of average daily net assets under this plan.
| | | | | | |
| | | Causeway Global Absolute Return Fund | | | 19 | |
NOTES TO FINANCIAL STATEMENTS
(continued)
The Trust and SEI Investments Distribution Co. (the “Distributor”) have entered into a Distribution Agreement. The Distributor receives no fees for its distribution services under this agreement.
The officers of the Trust are also officers or employees of the Administrator or Adviser. They receive no fees for serving as officers of the Trust.
As of September 30, 2013, approximately $5.949 million of the net assets of the Fund were held by affiliated investors.
| 4. | | Investment Transactions |
During the year ended September 30, 2013, there were no security purchases or sales, other than short-term investments.
| 5. | | Derivatives and Risks of Investing |
A swap agreement is a form of derivative that includes leverage, allowing the Fund to obtain the right to a return on a stipulated capital base that exceeds the amount the Fund has invested. The use of swap agreements could cause the Fund to be more volatile, resulting in larger gains or losses in response to changes in the values of the securities underlying the swap agreements than if the Fund had made direct investments. Use of leverage involves special risks and is speculative. If the Adviser is incorrect in evaluating long and short exposures, leverage will magnify any losses, and such losses may be significant. By using swap agreements, the Fund is exposed to liquidity risks since it may not be able to close out a swap agreement immediately, particularly during times of market turmoil. It may also be difficult to value a swap agreement if the Fund has difficulty in closing the position.
The use of derivative contracts exposes an investor to various market risks. The Fund’s investment in total
return equity swap agreements exposed the Fund to equity risk for the year ended September 30, 2013. Equity risk is the risk that the value of a particular stock or stock market to which the Fund has long exposure is falling, or to which the Fund has short exposure is rising. The fair value, if any, of the total return equity swap agreements as of September 30, 2013 is reported on the Statement of Assets and Liabilities. The related change in unrealized and realized gains or losses for the reporting period is reported on the Statement of Operations.
The Fund currently expects to settle swap agreements at least monthly, and may do so more frequently, which will cause the Fund to realize ordinary income and short-term capital gains, if any, throughout the year that, when distributed to shareholders, will be taxable to them as ordinary income rather than at lower long-term capital gains rates.
By using swap agreements, the Fund is exposed to additional risks concerning the counterparty. For example, the Fund bears the risk of loss of the amount expected to be received under a swap agreement in the event of the default or bankruptcy of the counterparty, or if the counterparty fails to honor its obligations. The Fund currently has entered into swap agreements with a single counterparty, focusing its exposure to the counterparty credit risk of that single counterparty. Further, the swap counterparty’s obligations to the Fund likely will not be collateralized. The Fund intends, however, to settle swap agreements at least monthly, and may do so more frequently, so that net gains under swap agreements with a single counterparty do not exceed 5% of the Fund’s total assets at any given time.
There is the risk that the counterparty refuses to continue to enter into swap agreements with the Fund in the future, or requires increased fees, which could
| | | | |
| 20 | | Causeway Global Absolute Return Fund | | |
NOTES TO FINANCIAL STATEMENTS
(continued)
impair the Fund’s ability to achieve its investment objective. A swap counterparty may also increase its collateral requirements, which may limit the Fund’s ability to use leverage and reduce investment returns. In addition, if the Fund cannot locate a counterparty willing to enter into transactions with the Fund, it will not be able to implement its investment strategy. As of September 30, 2013, the Fund’s swap agreements were with one counterparty.
| 6. | | Federal Tax Information |
The Fund is classified as a separate taxable entity for Federal income tax purposes. The Fund intends to continue to qualify as a separate “regulated investment company” under Subchapter M of the Internal Revenue Code and make the requisite distributions to shareholders that will be sufficient to relieve it from Federal income tax and Federal excise tax. Therefore, no Federal tax provision is required. To the extent that dividends from net investment income and distributions from net realized capital gains exceed amounts reported in the financial statements, such amounts are reported separately.
The Fund may be subject to taxes imposed by countries in which it invests in issuers existing or operating in such countries. Such taxes are generally based on income earned. The Fund accrues such taxes when the related income is earned. Dividend and interest income is recorded net of non-U.S. taxes paid.
The amounts of distributions from net investment income and net realized capital gains are determined in accordance with Federal income tax regulations, which may differ from those amounts determined under U.S. GAAP. These book/tax differences are either temporary or permanent in nature. The character of distributions made during the year from net investment income or
net realized gains, and the timing of distributions made during the year may differ from the year that the income or realized gains (losses) were recorded by the Fund. To the extent these differences are permanent, adjustments are made to the appropriate equity accounts in the period that the differences arise.
Accordingly, the following permanent differences, which are primarily due to swap contract related period payments, were reclassified to/(from) the following accounts as of September 30, 2013 (000):
| | | | | | |
Undistributed
Net Investment
Income (loss) | | | Accumulated
Net Realized
Gain (loss) | |
| $ | 4,240 | | | $ | (4,240 | ) |
These reclassifications had no impact on net assets or net asset value per share.
The tax character of dividends and distributions declared during the fiscal years ended September 30, 2013 and September 30, 2012 were as follows (000):
| | | | | | | | | | | | |
| | | Ordinary
Income | | | Long-Term
Capital Gain | | | Total | |
2013 | | $ | 1,636 | | | $ | — | | | $ | 1,636 | |
2012 | | | 824 | | | | — | | | | 824 | |
As of September 30, 2013, the components of distributable earnings on a tax basis were as follows (000):
| | | | |
Undistributed Ordinary Income | | $ | 3,283 | |
Post October Losses | | | (2,372 | ) |
Capital Loss Carryforwards | | | (318 | ) |
Unrealized Depreciation | | | (54 | ) |
| | | | |
Total Distributable Earnings | | $ | 539 | |
| | | | |
Post-October Capital represents losses realized on securities transactions from November 1, 2012 through September 30, 2013 that, in accordance with Federal income tax regulations, the Fund may elect to defer and treat as having arisen in the following fiscal year.
| | | | | | |
| | | Causeway Global Absolute Return Fund | | | 21 | |
NOTES TO FINANCIAL STATEMENTS
(continued)
Under the recently enacted Regulated Investment Company Modernization Act of 2010, the Fund is permitted to carry forward capital losses incurred in taxable years beginning after December 22, 2010 for an unlimited period. However, any losses incurred during those future taxable years are required to be used prior to the losses incurred in pre-enactment taxable years. As a result of this ordering rule, pre-enactment capital loss carryforwards may be more likely to expire unused. Additionally, post-enactment capital losses that are carried forward will retain their character as either short-term or long-term capital losses rather than being considered all short-term as under previous law. Losses carried forward under these new provisions are as follows:
| | | | | | | | | | | | |
| | | Short-Term
Loss (000) | | | Long-Term
Loss (000) | | | Total
(000) | |
Causeway Global Absolute Return Fund | | $ | 318 | | | $ | — | | | $ | 318 | |
For the year ended September 30, 2013, the Fund did not use any capital loss carryforwards.
At September 30, 2013, the total cost of securities for Federal income tax purposes and the aggregate gross unrealized appreciation and depreciation on investment securities for the Fund were as follows (000):
| | | | | | | | | | | | | | |
Federal
Tax Cost | | | Appreciated
Securities | | | Depreciated
Securities | | | Net
Unrealized
Appreciation | |
| $ | 61,852 | | | $ | — | | | $ | — | | | $ | — | |
| 7. | | Capital Shares Issued and Redeemed (000) |
| | | | | | | | | | | | | | | | |
| | | Year Ended
September 30, 2013 | | | Year Ended
September 30, 2012 | |
| | | Shares | | | Value | | | Shares | | | Value | |
Institutional Class | | | | | | | | | | | | | | | | |
Shares Sold | | | 2,780 | | | $ | 29,043 | | | | 1,772 | | | $ | 19,273 | |
Shares Issued in Reinvestment of
Dividends and Distributions | | | 81 | | | | 818 | | | | 47 | | | | 502 | |
Shares Redeemed | | | (2,731 | ) | | | (27,209 | ) | | | (110 | ) | | | (1,179 | ) |
| | | | | | | | | | | | | | | | |
Increase in Shares Outstanding
Derived from Institutional Class Transactions | | | 130 | | | | 2,652 | | | | 1,709 | | | | 18,596 | |
| | | | | | | | | | | | | | | | |
Investor Class | | | | | | | | | | | | | | | | |
Shares Sold | | | 1,147 | | | | 11,933 | | | | 3,441 | | | | 37,172 | |
Shares Issued in Reinvestment of
Dividends and Distributions | | | 57 | | | | 574 | | | | 29 | | | | 311 | |
Shares Redeemed | | | (1,455 | ) | | | (14,691 | ) | | | (814 | ) | | | (8,749 | ) |
| | | | | | | | | | | | | | | | |
Increase (Decrease) in Shares Outstanding
Derived from Investor Class Transactions | | | (251 | ) | | | (2,184 | ) | | | 2,656 | | | | 28,734 | |
| | | | | | | | | | | | | | | | |
Increase (Decrease) in Shares Outstanding from
Capital Share Transactions | | | (121 | ) | | $ | 468 | | | | 4,365 | | | $ | 47,330 | |
| | | | | | | | | | | | | | | | |
| | | | |
| 22 | | Causeway Global Absolute Return Fund | | |
NOTES TO FINANCIAL STATEMENTS
(concluded)
| 8. | | Significant Shareholder Concentration |
As of September 30, 2013, one of the Fund’s shareholders owned 10% of net assets in the Institutional Class.
| 9. | | New Accounting Pronouncements |
In June 2013, the Financial Accounting Standards Board issued an update (“ASU 2013-08”) to ASC Topic 946, Financial Services — Investment Companies (“Topic 946”). ASU 2013-08 amends the guidance in Topic 946 for determining whether an entity qualifies as an investment company and requires certain additional disclosures. ASU 2013-08 is effective for interim and annual reporting periods in fiscal years that begin after December 15, 2013. Management is currently evaluating the impact, if any, of ASU 2013-08 on the Fund’s financial statements.
In December 2011, the Financial Accounting Standards Board issued a further update to the guidance “Balance
Sheet — Disclosures about Offsetting Assets and Liabilities.” The amendments to this standard require an entity to disclose information about offsetting and related arrangements to enable users of its financial statements to understand the effect of those arrangements on its financial position. The amended guidance is effective for interim and annual reporting periods beginning after January 1, 2013. Management has evaluated the implications of this update and does not believe the adoption will have a material impact on the financial statements.
The Fund has evaluated the need for disclosures and/or adjustments resulting from subsequent events through the date the financial statements were issued. Based on this evaluation, no adjustments were required to the financial statements.
| | | | | | |
| | | Causeway Global Absolute Return Fund | | | 23 | |
REPORT OF INDEPENDENT REGISTERED PUBLIC ACCOUNTING FIRM
To the Board of Trustees and Shareholders of Causeway Global Absolute Return Fund:
In our opinion, the accompanying statement of assets and liabilities, including the schedules of investments, and the related statements of operations and of changes in net assets and the financial highlights present fairly, in all material respects, the financial position of Causeway Global Absolute Return Fund (the “Fund”) at September 30, 2013, the results of its operations for the year then ended, the changes in its net assets for each of the two years in the period then ended and the financial highlights for each of the periods presented, in conformity with accounting principles generally accepted in the United States of America. These financial statements and financial highlights (hereafter referred to as “financial statements”) are the responsibility of the Fund’s management; our responsibility is to express an opinion on these financial statements based on our audits. We conducted our audits of these financial statements in accordance with the standards of the Public Company Accounting Oversight Board (United States). Those standards require that we plan and perform the audit to obtain reasonable assurance about whether the financial statements are free of material misstatement. An audit includes examining, on a test basis, evidence supporting the amounts and disclosures in the financial statements, assessing the accounting principles used and significant estimates made by management, and evaluating the overall financial statement presentation. We believe that our audits, which included confirmation of securities at September 30, 2013 by correspondence with the custodian and brokers, provide a reasonable basis for our opinion.
PricewaterhouseCoopers LLP
Los Angeles, California
November 26, 2013
| | | | |
| 24 | | Causeway Global Absolute Return Fund | | |
NOTICE TO SHAREHOLDERS (Unaudited)
The information set forth below is for the Fund’s fiscal year as required by federal laws. Shareholders, however, must report distributions on a calendar year basis for income tax purposes, which may include distributions for portions of two fiscal years of the Fund. Accordingly, the information needed by shareholders for income tax purposes will be sent to them in early 2014. Please consult your tax adviser for proper treatment of this information.
For the fiscal year ended September 30, 2013, the Fund is designating the following items with regard to distributions paid during the year:
| | | | | | | | | | | | | | | | | | |
| (A) | | | (B) | | | (C) | | | (D) | | | (E) | |
| | | | |
Long Term
Capital Gains
Distributions
(Tax Basis) | | | Ordinary
Income
Distributions
(Tax Basis) | | | Tax Exempt
Distributions
(Tax Basis) | | | Total
Distributions
(Tax Basis) | | | Dividends(1)
for Corporate
Dividends Received
Deduction
(Tax Basis) | |
| | 0.00 | % | | | 100.00 | % | | | 0.00 | % | | | 100.00 | % | | | 0.00 | % |
| | | | |
| (F) | | | (G) | | | (H) | | | | | | | |
| | | | |
Qualified
Dividend
Income | | | Interest
Related
Dividends | | | Qualified
Short-Term
Capital
Gain
Dividends | | | | | | | |
| | 0.00 | % | | | 0.00 | % | | | 0.00 | % | | | | | | | | |
(1) Qualified Dividends represent dividends which qualify for the corporate dividends received deduction.
Items (A), (B), (C) and (D) are based on a percentage of the Fund’s total distribution including pass-through as foreign tax credit.
Item (E) is based on a percentage of ordinary income distributions of the Fund.
Item (F) represents the amount of “Qualified Dividend Income” as defined in the Jobs and Growth Tax Relief Reconciliation Act of 2003 and is reflected as a percentage of “Ordinary Income Distributions”. It is the Fund’s intention to designate the maximum amount permitted by the law up to 100%.
Item (G) is the amount of “Interest Related Dividends” as created by the American Jobs Creation Act of 2004 and is reflected as a percentage of net investment income distributions that is exempt from U.S. withholding tax when paid to foreign investors.
Item (H) is the amount of “Qualified Short-Term Capital Gain Dividends” as created by the American Jobs Creation Act of 2004 and is reflected as a percentage of short-term capital gain distributions that is exempt from U.S. withholding tax when paid to foreign investors.
| | | | | | |
| | | Causeway Global Absolute Return Fund | | | 25 | |
TRUSTEES AND OFFICERS INFORMATION (Unaudited)
Information pertaining to the Trustees and Officers of the Trust is set forth below. Trustees who are not deemed to be “interested persons” of the Trust as defined in the 1940 Act are referred to as “Independent Trustees.” Trustees who are deemed to be “interested persons” of the Trust are referred to as “Interested Trustees.” The Trust’s Statement of Additional Information (“SAI”) includes additional information about the Trustees and Officers. The SAI may be obtained without charge by calling 1-866-947-7000.
| | | | | | | | | | |
Name
Address,
Age1 | | Position(s)
Held with the
Company | | Term of
Office
and
Length of
Time
Served2 | | Principal
Occupation(s)
During Past
Five Years | | Number of
Portfolios
in Trust
Complex
Overseen by
Trustee3 | | Other
Directorships
Held by
Trustee4 |
INDEPENDENT TRUSTEE | | | | | | | | | | |
John R. Graham Age: 52 | | Trustee; Chairman of the Audit Committee | | Trustee since 10/08; Chairman since 4/13 | | Film Composer (since 2005); Senior Vice President, Corporate Financial Development and Communications, The Walt Disney Company (2004-2005); Senior Vice President, Mergers and Acquisitions, Lehman Brothers Inc. (2000-2004). | | 5 | | none |
| | | | | |
Lawry J. Meister Age: 51 | | Trustee | | Since 10/08 | | President, Steaven Jones Development Company, Inc. (real estate firm) (since 1995); President, Creative Office Properties (since 2012). | | 5 | | none |
| | | | | |
Victoria B. Rogers Age: 51 | | Trustee | | Since 4/13 | | President, the Rose Hills Foundation (since 1996). | | 5 | | Director, TCW Funds, Inc. and TCW Strategic Income Fund, Inc. |
| | | | | |
Eric H. Sussman Age: 47 | | Trustee; Chairman of the Board | | Trustee since 9/01; Chairman since 4/13 | | Senior Lecturer (since July 2011) and Lecturer (1995-June 2011), Anderson Graduate School of Management, University of California, Los Angeles; President, Amber Capital, Inc. (real estate investment and financial planning firm) (since 1993). | | 5 | | Trustee, Presidio Funds (until 2010) |
INTERESTED TRUSTEE5 | | | | | | | | | | |
Mark D. Cone Age: 45 | | Trustee | | Since 10/08 | | Executive Vice President and Chief Marketing Officer of the Adviser (since 2001). | | 5 | | none |
| | | | |
| 26 | | Causeway Global Absolute Return Fund | | |
TRUSTEES AND OFFICERS INFORMATION (Unaudited)
(continued)
| | | | | | | | | | |
Name
Address,
Age1 | | Position(s)
Held with the
Company | | Term of
Office
and
Length of
Time
Served2 | | Principal
Occupation(s)
During Past
Five Years | | Number of
Portfolios
in Trust
Complex
Overseen by
Trustee3 | | Other
Directorships
Held by
Trustee4 |
OFFICERS |
Turner Swan 11111 Santa Monica Blvd., 15th Floor Los Angeles, CA 90025 Age: 51 | | President | | Since 8/01 | | General Counsel, Secretary, and Member of the Adviser (since 2001); Compliance Officer of the Adviser (since 2010). | | N/A | | N/A |
| | | | | |
Gracie V. Fermelia 11111 Santa Monica Blvd., 15th Floor Los Angeles, CA 90025 Age: 51 | | Chief Compliance Officer and Assistant Secretary | | CCO since 7/05; Asst. Sect. since 8/01 | | Chief Compliance Officer of the Adviser (since July 2005); Chief Operating Officer and Member of the Adviser (since 2001). | | N/A | | N/A |
| | | | | |
Michael Lawson6 One Freedom Valley Drive Oaks, PA 19456 Age: 52 | | Treasurer | | Since 7/05 | | Director of the Administrator’s Fund Accounting department (since July 2005); Manager in the Administrator’s Fund Accounting department (November 1998 to July 2005). | | N/A | | N/A |
| | | | | |
Gretchen W. Corbell 11111 Santa Monica Blvd., 15th Floor Los Angeles, CA 90025 Age: 42 | | Secretary | | Since 10/11 | | Associate Attorney of the Adviser (since 2004). | | N/A | | N/A |
| | | | | |
Lisa Whittaker6 One Freedom Valley Drive Oaks, PA 19456 Age: 34 | | Vice President and Assistant Secretary | | Since 8/13 | | Corporate Counsel of the Administrator (since 2012); Associate Counsel and Compliance Officer, The Glendmede Trust Company, N.A. (2011-2012); Associate, Drinker Biddle & Reath LLP (2006-2011). | | N/A | | N/A |
| | | | | |
Carolyn F. Mead6 One Freedom Valley Drive Oaks, PA 19456 Age: 56 | | Vice President and Assistant Secretary | | Since 7/08 | | Corporate Counsel of the Administrator (since 2007); Associate Counsel, Stradley, Ronan, Stevens & Young LLP (2004-2007). | | N/A | | N/A |
| | | | | | |
| | | Causeway Global Absolute Return Fund | | | 27 | |
TRUSTEES AND OFFICERS INFORMATION (Unaudited)
(concluded)
| | | | | | | | | | |
Name
Address,
Age1 | | Position(s)
Held with the
Company | | Term of
Office
and
Length of
Time
Served2 | | Principal
Occupation(s)
During Past
Five Years | | Number of
Portfolios
in Trust
Complex
Overseen by
Trustee3 | | Other
Directorships
Held by
Trustee4 |
Bernadette Sparling6 One Freedom Valley Drive Oaks, PA 19456 Age: 36 | | Vice President and Assistant Secretary | | Since 7/08 | | Corporate Counsel of the Administrator (since 2005); Associate Counsel, Blank Rome LLP (2001-2005). | | N/A | | N/A |
| 1 | Each Trustee may be contacted by writing to the Trustee c/o Causeway Capital Management Trust, One Freedom Valley Drive, Oaks, PA 19456. |
| 2 | Each Trustee holds office during the lifetime of the Trust or until his or her sooner resignation, retirement, removal, death or incapacity in accordance with the Trust’s Declaration of Trust. The president, treasurer and secretary each holds office at the pleasure of the Board of Trustees or until he or she sooner resigns in accordance with the Trust’s Bylaws. |
| 3 | The “Trust Complex” consists of all registered investment companies for which Causeway Capital Management LLC serves as investment adviser. As of September 30, 2013, the Trust Complex consisted of one investment company with five portfolios — the International Value Fund, the Emerging Markets Fund, the Global Value Fund, the International Opportunities Fund, and the Global Absolute Return Fund. |
| 4 | Directorships of companies required to report to the Securities and Exchange Commission under the Securities Exchange Act of 1934 (i.e., “public companies”) or other investment companies registered under the 1940 Act. |
| 5 | Mr. Cone is considered an “interested person” of the Trust as defined in the 1940 Act because he is an employee of the Adviser. |
| 6 | These officers of the Trust also serve as officers of one or more mutual funds for which SEI Investments Company or an affiliate acts as investment manager, administrator or distributor. |
| | | | |
| 28 | | Causeway Global Absolute Return Fund | | |
DISCLOSURE OF FUND EXPENSES (Unaudited)
As a shareholder of the Fund, you incur two types of costs: (1) transaction costs, including redemption fees, and (2) ongoing costs, including management fees, shareholder service fees, and other Fund expenses. It is important for you to understand the impact of these costs on your investment returns.
Ongoing operating expenses are deducted from a mutual fund’s gross income and directly reduce its final investment return. These expenses are expressed as a percentage of a mutual fund’s average net assets; this percentage is known as a mutual fund’s expense ratio.
The following examples use the expense ratio and are intended to help you understand the ongoing costs (in dollars) of investing in the Fund and to compare these costs with those of other mutual funds. The examples are based on an investment of $1,000 made at the beginning of the period shown and held for the entire period.
The table on the next page illustrates the Fund’s costs in two ways:
Actual Fund Return. This section helps you to estimate the actual expenses after fee waivers that the Fund incurred over the period. The “Expenses Paid During Period” column shows the actual dollar expense cost incurred by a $1,000 investment in the Fund, and the “Ending Account Value” number is derived from deducting that expense cost from the Fund’s gross investment return.
You can use this information, together with the actual amount you invested in the Fund, to estimate the expenses you paid over that period. Simply divide your actual account value by $1,000 to arrive at a ratio (for example, an $8,600 account value divided by $1,000 = 8.6), then multiply that ratio by the number shown under “Expenses Paid During Period.”
Hypothetical 5% Return. This section helps you compare the Fund’s costs with those of other mutual funds. It assumes that the Fund had an annual 5% return before expenses during the year, but that the expense ratio (Column 3) for the period is unchanged. This example is useful in making comparisons because the Securities and Exchange Commission requires all mutual funds to make this 5% calculation. You can assess the Fund’s comparative cost by comparing the hypothetical result for the Fund in the “Expenses Paid During Period” column with those that appear in the same charts in the shareholder reports for other mutual funds.
NOTE: Because the return is set at 5% for comparison purposes — NOT the Fund’s actual return — the account values shown may not apply to your specific investment.
| | | | | | |
| | | Causeway Global Absolute Return Fund | | | 29 | |
DISCLOSURE OF FUND EXPENSES (Unaudited)
(concluded)
| | | | | | | | | | | | | | | | |
| | | Beginning
Account
Value
4/01/13 | | | Ending
Account
Value
9/30/13 | | | Annualized
Expense
Ratios | | | Expenses
Paid
During
Period* | |
Causeway Global Absolute Return Fund | | | | | | | | | | | | | | | | |
| | | | |
Actual Portfolio Return | | | | | | | | | | | | | | | | |
Institutional Class | | $ | 1,000.00 | | | $ | 1,135.40 | | | | 1.75 | % | | $ | 9.37 | |
| | | | |
Hypothetical 5% Return | | | | | | | | | | | | | | | | |
| Institutional Class | | $ | 1,000.00 | | | $ | 1,016.30 | | | | 1.75 | % | | $ | 8.84 | |
| | | | |
Actual Portfolio Return | | | | | | | | | | | | | | | | |
Investor Class | | $ | 1,000.00 | | | $ | 1,132.80 | | | | 2.00 | % | | $ | 10.68 | |
| | | | |
Hypothetical 5% Return | | | | | | | | | | | | | | | | |
| Investor Class | | $ | 1,000.00 | | | $ | 1,015.06 | | | | 2.00 | % | | $ | 10.09 | |
| * | Expenses are equal to the Fund’s annualized expense ratio multiplied by the average account value over the period, multiplied by 183/365 (to reflect the one-half year period.) |
| | | | |
| 30 | | Causeway Global Absolute Return Fund | | |
STATEMENT REGARDING BASIS FOR APPROVAL OF INVESTMENT ADVISORY AGREEMENT (Unaudited)
Section 15(c) of the Investment Company Act of 1940, as amended (the “1940 Act”) requires the Board of Trustees (the “Board”) of Causeway Capital Management Trust (the “Trust”) annually to approve continuance of the investment advisory agreement (the “Advisory Agreement”) between the Trust and Causeway Capital Management LLC (the “Adviser”) with respect to Causeway Global Absolute Return Fund (the “Fund”). Continuance of the Advisory Agreement must be approved by a majority of the Trustees and a majority of the independent Trustees (i.e., Trustees who are not “interested persons” of the Trust as defined in the 1940 Act). The Board was comprised of four independent Trustees and one interested Trustee when the continuation of the Advisory Agreement was last considered.
Information Received. At each regular quarterly meeting, the Board reviews a wide variety of materials relating to the nature, extent and quality of the Adviser’s services, including information concerning the Fund’s performance. At least annually, the Board is provided with additional quantitative and qualitative information to assist it in evaluating whether to approve the continuance of the Advisory Agreement. The Board met on August 7, 2013, to consider whether to approve the continuance of the Advisory Agreement for an additional one-year period. In connection with that meeting, the Trustees received and reviewed extensive materials prepared by the Adviser relating to the Advisory Agreement in response to information requested on the independent Trustees’ behalf by their independent legal counsel.
Factors Considered. In reviewing the Advisory Agreement, the Trustees considered a number of factors including, but not limited to: (1) the nature, extent and quality of the services provided by the Adviser, (2) the investment performance of the Fund, (3) comparisons of the services rendered and the amounts paid under the Advisory Agreement with those of other funds, (4) the costs of the services provided and estimated profits or losses realized by the Adviser and its affiliates from their relationship with the Fund, (5) the extent to which economies of scale would be realized as the Fund grows and whether fee levels reflect these economies of scale for the benefit of Fund investors, and (6) any other benefits that would be derived by the Adviser from its relationship with the Fund.
First, regarding the nature, extent and quality of the services provided by the Adviser, the Trustees considered, among other things, the Adviser’s personnel, experience, track record and compliance program. The Trustees considered the qualifications, backgrounds and responsibilities of the Adviser’s principal personnel who provide services to the Fund, as well as the level of attention those individuals provide to the Fund. The Trustees noted the Adviser’s commitment to devoting resources to staffing and the technology in support of its investment management services. They also reviewed the Adviser’s investment philosophy and processes and its compliance program, and considered the scope of the Adviser’s services to the Fund. The Trustees concluded that the nature, extent and quality of the services provided by the Adviser continued to benefit the Fund and its shareholders and would do so during the next one-year contract renewal period.
Second, regarding the investment performance of the Fund, the Trustees reviewed the investment results of the Fund’s Institutional and Investor share classes for various periods ended June 30, 2013, compared to the results of the BofA Merrill Lynch 3-Month U.S. Treasury Bill Index (the “Index”), the averages of the mutual funds included in the Morningstar Market Neutral category of funds, and the averages of the mutual funds included in the Morningstar Long/Short category of funds. They noted that the Fund was moved from the Morningstar Long/Short category to the Morningstar Market Neutral category in February 2012. The Trustees noted that the Fund had outperformed the Index for
| | | | | | |
| | | Causeway Global Absolute Return Fund | | | 31 | |
STATEMENT REGARDING BASIS FOR APPROVAL OF INVESTMENT ADVISORY AGREEMENT (Unaudited)
(continued)
the one-year and since inception periods. They noted that the Institutional Class had outperformed the average of the funds in the Morningstar Market Neutral category for the one-year and since-inception periods, while the Investor Class underperformed the average of the Market Neutral category funds for the one-year period and outperformed the average of the Market Neutral category funds for the since-inception period. They noted that both Classes underperformed the average of the funds in the Morningstar Long-Short category for the one-year period, but significantly outperformed the Long-Short category fund average for the since-inception period. The Trustees concluded that the Adviser’s record in managing the Fund indicates that its continued management will benefit the Fund and its shareholders.
Third, regarding the Fund’s advisory fee and total expenses:
| | • | | The Trustees compared the Fund’s advisory fee with those of other similar mutual funds. They noted that although the Fund’s advisory fee is higher than the average and median fees of the mutual funds in the Morningstar Market Neutral category (by 29 and 25 basis points, respectively), the Fund involves an active global investment program with both long and short exposures and leverage that is complex and requires substantial investment and administrative resources to manage. They also noted that as a result of the fee waivers required by the Adviser’s expense limit agreement, the effective advisory fee charged to the Fund is substantially lower than the contractual 150 basis points per annum. |
| | • | | The Trustees compared the Fund’s expenses with those of other similar mutual funds. They noted that, after application of the Adviser’s expense limit agreement, the expense ratio of the Fund’s Institutional Class is above the average and median of the mutual funds in the Morningstar Market Neutral category (by 18 and 22 basis points, respectively), and the expense ratio of the Fund’s Investor Class is above the average and median of the mutual funds in the category (by 43 and 47 basis points, respectively). They noted that the Fund’s total assets are significantly less than the average assets of the funds in its category. They also noted that the Adviser limits contractually the Fund’s expenses (excluding swap agreement financing charges and transaction costs, borrowing expenses, dividend expenses on securities sold short, brokerage fees and commissions, interest, taxes, shareholder service fees, fees and expenses of other funds in which the Fund invests, and extraordinary expenses). The Trustees concluded that the Fund’s advisory fee and expenses were reasonable and appropriate. |
| | • | | The Trustees compared the Fund’s advisory fee with the fees charged by the Adviser to other clients. They noted that the Adviser does not currently manage assets of other clients pursuant to its global absolute return strategy, but compared the Fund’s advisory fee with the standard advisory fee offered by the Adviser to separate account clients. The Trustees also noted that, although the separate account performance-based fee may be lower than the advisory fee paid by the Fund, the difference appropriately reflected the Adviser’s significantly greater responsibilities with respect to the Fund, which include the provision of many additional administrative and shareholder services (such as services related to the Fund’s disclosure documents, financial statements, 1940 Act compliance policies and procedures, preparation of Board and committee materials and meetings, annual Board reports and certifications, participation in regulatory examinations and legal and compliance matters, oversight of |
| | | | |
| 32 | | Causeway Global Absolute Return Fund | | |
STATEMENT REGARDING BASIS FOR APPROVAL OF INVESTMENT ADVISORY AGREEMENT (Unaudited)
(concluded)
| | daily valuation, oversight of Fund service providers, negotiation of Fund intermediary agreements, coordination with Fund intermediaries providing shareholder recordkeeping services, shareholder communications, and due diligence for advisers, consultants and institutional investors). |
The Trustees concluded that the Fund’s advisory fee and expense ratio as reduced are reasonable and appropriate under the circumstances.
Fourth, the Trustees considered the Advisor’s costs of providing services to the Fund and the estimated profits or losses realized by the Adviser from its relationship with the Fund. They reviewed the Adviser’s after tax net loss with respect to such services for the twelve months ended June 30, 2013, and the methodology used to generate that estimate, and noted that the cost allocation methodology presented to the Trustees was reasonable. They also noted that, due to its expense limit agreement with respect to the Fund, the Adviser may continue to experience losses managing the Fund for a period of time.
Fifth, regarding economies of scale, the Trustees observed that, although the Fund’s advisory fee did not have breakpoints, it is difficult to determine the existence or extent of any economies of scale. They noted that the Adviser had incurred significant losses in managing the Fund and may continue to incur losses until the Fund’s assets grow significantly and concluded that under the circumstances the Adviser was sharing any economies of scale with the Fund appropriately pending the Fund’s future potential asset growth.
Sixth, regarding any other benefits derived by the Adviser from its relationship with the Fund — often called “fallout” benefits — the Trustees observed that the Adviser does not earn common “fall-out” benefits such as affiliated custody fees, affiliated transfer agency fees, affiliated brokerage commissions, profits from rule 12b-1 fees, “contingent deferred sales commissions,” “float” benefits on short-term cash, or soft dollar research services. They noted that the Fund’s trades are principal transactions under swaps and do not generate “commissions” that can be used for soft dollars.
Approval. At the August 7, 2013 meeting, the Trustees discussed the information and factors noted above and considered the approval of the Advisory Agreement with representatives of the Adviser. The independent Trustees also met in a private session with independent counsel at which no representatives of the Adviser were present. In their deliberations, the independent Trustees did not identify any particular information or factor that was determinative or controlling, each Trustee did not necessarily attribute the same weight to each factor, and the foregoing summary does not detail all the matters considered. Based on their review, the Trustees (including the independent Trustees) unanimously concluded that the Advisory Agreement is fair and reasonable to the Fund and its shareholders, that the Fund’s advisory fee is reasonable and that renewal of the Advisory Agreement is in the best interests of the Fund and its shareholders, and the Board of Trustees unanimously approved renewal of the Advisory Agreement for a twelve-month period beginning September 20, 2013.
| | | | | | |
| | | Causeway Global Absolute Return Fund | | | 33 | |
INVESTMENT ADVISER:
Causeway Capital Management LLC
11111 Santa Monica Boulevard
15th Floor
Los Angeles, CA 90025
DISTRIBUTOR:
SEI Investments Distribution Co.
One Freedom Valley Drive
Oaks, PA 19456
TO OBTAIN MORE INFORMATION:
Call 1-866-947-7000 or visit us online at
www.causewayfunds.com
This material must be preceded or accompanied by a current prospectus.
The Fund files its complete schedule of portfolio holdings with the Securities and Exchange Commission (“Commission”) for the first and third quarters of each fiscal year on Form N-Q within sixty days after the end of the period. The Fund’s Forms N-Q are available on the Commission’s website at http://www.sec.gov, and may be reviewed and copied at the Commission’s Public Reference Room in Washington, DC. Information on the operation of the Public Reference Room may be obtained by calling 1-800-SEC-0330.
A description of the policies and procedures that the Fund uses to determine how to vote proxies relating to portfolio securities, as well as information relating to how the Trust voted proxies relating to portfolio securities during the most recent 12-month period ended June 30, is available (i) without charge, upon request, by calling 1-866-947-7000; and (ii) on the Commission’s website at http://www. sec.gov.
CCM-AR-101-0300

The registrant has adopted a code of ethics that applies to the registrant’s principal executive officer, principal financial officer and principal accounting officer. During the fiscal year ended September 30, 2013, there were no material changes or waivers to the code of ethics.
| Item 3. | Audit Committee Financial Expert. |
(a)(1) The registrant’s board of trustees has determined that the registrant has at least one audit committee financial expert serving on the audit committee.
(a)(2) The audit committee financial experts are Eric Sussman, Lawry Meister, John Graham and Victoria B. Rogers. Each audit committee financial expert is independent as defined in Form N-CSR Item 3(a)(2).
| Item 4. | Principal Accountant Fees and Services. |
Aggregate fees billed to the registrant for professional services rendered by the registrant’s principal accountant for the fiscal years ended September 30, 2013 and 2012 were as follows:
| | | | | | | | |
| | | 2013 | | | 2012 | |
(a) Audit Fees | | $ | 170,810 | | | $ | 206,720 | |
(b) Audit-Related Fees | | | None | | | | None | |
(c) Tax Fees(1) | | $ | 40,600 | | | $ | 36,140 | |
(d) All Other Fees | | | None | | | | None | |
Note:
| (1) | Tax fees include amounts related to tax return and excise tax calculation reviews and foreign tax reclaim services. |
(e)(1) The registrant’s audit committee has adopted a charter that requires it to pre-approve the engagement of auditors to (i) audit the registrant’s financial statements, (ii) provide other audit or non-audit services to the registrant, or (iii) provide non-audit services to the registrant’s investment adviser if the engagement relates directly to the operations and financial reporting of the registrant.
(e)(2) No services included in paragraphs (b) through (d) of this Item were approved by the audit committee pursuant to paragraph (c)(7)(i)(C) of Rule 2-01 of Regulation S-X.
(f) Not applicable.
(g) For the fiscal year ended September 30, 2013, the aggregate non-audit fees billed by the registrant’s accountant for services rendered to the registrant and the registrant’s investment adviser were $40,600 and $237,091, respectively. For the fiscal year ended September 30, 2012, the aggregate non-audit fees billed by the registrant’s accountant for services rendered to the registrant and the registrant’s investment adviser were $36,140 and $198,414, respectively.
(h) The audit committee considered whether the provision of non-audit services rendered to the registrant’s investment adviser by the registrant’s principal accountant that were not pre-approved pursuant to paragraph (c)(7)(ii) of Rule 2-01 of Regulation S-X was compatible with maintaining the principal accountant’s independence.
| Item 5. | Audit Committee of Listed Registrants. |
Not applicable to open-end management investment companies.
| Item 6. | Schedule of Investments |
See Item 1.
Item 7. Disclosure of Proxy Voting Policies and Procedures for Closed-End Management Investment Companies.
Not applicable to open-end management investment companies.
| Item 8. | Portfolio Managers of Closed-End Management Investment Companies |
Not applicable to open-end management investment companies.
Item 9. Purchases of Equity Securities by Closed-End Management Investment Company and Affiliated Purchasers.
Not applicable to open-end management investment companies.
| Item 10. | Submission of Matters to a Vote of Security Holders. |
There have been no material changes to the registrant’s procedures by which shareholders may recommend nominees to the registrant’s board of trustees since the registrant’s last filing on Form N-CSR.
| Item 11. | Controls and Procedures. |
(a) The certifying officers, whose certifications are included herewith, have evaluated the registrant’s disclosure controls and procedures within 90 days of the filing date of this report. In their opinion, based on their evaluation, the registrant’s disclosure controls and procedures are adequately designed, and are operating effectively to ensure, that information required to be disclosed by the registrant in the reports it files or submits under the Securities Exchange Act of 1934 is recorded, processed, summarized and reported within the time periods specified in the Securities and Exchange Commission’s rules and forms.
(b) There were no changes in the registrant’s internal control over financial reporting that occurred during the registrant’s second fiscal quarter of the period covered by this report that have materially affected, or are reasonably likely to materially affect, the registrant’s internal control over financial reporting.
(a)(1) Code of Ethics attached hereto.
(a)(2) Separate certifications for the principal executive officer and the principal financial officer of the registrant as required by Rule 30a-2(a) under the Investment Company Act of 1940 (17 CFR 270.30a-2(a)) are filed herewith.
(b) Officer certifications as required by Rule 30a-2(b) under the Investment Company Act of 1940 (17 CFR 270.30a-2(b)) also accompany this filing as an exhibit.
SIGNATURES
Pursuant to the requirements of the Securities Exchange Act of 1934 and the Investment Company Act of 1940, the registrant has duly caused this report to be signed on its behalf by the undersigned, thereunto duly authorized.
| | | | | | |
| (Registrant) | | | | | | Causeway Capital Management Trust |
| | | |
| By (Signature and Title)* | | | | | | /s/ Turner Swan |
| | | | | | Turner Swan, President |
| | | |
| Date: December 6, 2013 | | | | | | |
Pursuant to the requirements of the Securities Exchange Act of 1934 and the Investment Company Act of 1940, this report has been signed below by the following persons on behalf of the registrant and in the capacities and on the dates indicated.
| | | | | | |
| By (Signature and Title)* | | | | | | /s/ Turner Swan |
| | | | | | Turner Swan, President |
| | | |
| Date: December 6, 2013 | | | | | | |
| | | |
| By (Signature and Title)* | | | | | | /s/ Michael Lawson |
| | | | | | Michael Lawson, Treasurer |
| | | |
| Date: December 6, 2013 | | | | | | |
| * | Print the name and title of each signing officer under his or her signature. |