UNITED STATES
SECURITIES AND EXCHANGE COMMISSION
Washington, D.C. 20549
FORM N-CSR
CERTIFIED SHAREHOLDER REPORT OF REGISTERED
MANAGEMENT INVESTMENT COMPANIES
Investment Company Act File Number 811-10467
Causeway Capital Management Trust
(Exact name of registrant as specified in charter)
11111 Santa Monica Boulevard, 15th Floor
Los Angeles, CA 90025
(Address of principal executive offices) (Zip code)
SEI Investments Global Funds Services
One Freedom Valley Drive
Oaks, PA 19456
(Name and address of agent for service)
Registrant’s telephone number, including area code: 1-866-947-7000
Date of fiscal year end: September 30, 2015
Date of reporting period: September 30, 2015
| Item 1. | Reports to Stockholders. |
TABLE OF CONTENTS
LETTER TO SHAREHOLDERS
For the fiscal year ended September 30, 2015, Causeway Emerging Markets Fund’s (the “Fund’s”) Institutional Class returned -16.94% and Investor Class returned -17.17%, compared to -18.98% for the MSCI Emerging Markets Index (Gross) (“EM Index”). Since the Fund’s inception on March 30, 2007, its average annual total returns are 2.29% for the Institutional Class and 2.14% for the Investor Class, compared to 0.94% for the EM Index. At fiscal year-end, the Fund had net assets of $2.0 billion.
Performance Review
Emerging markets equities fell sharply over the fiscal year. Stability in US economic growth contrasted sharply with weak growth expectations in China, tempering expectations of a global economic upswing. Hungary was the only country in the EM Index to post positive performance during the fiscal year. Following that, many of the remaining best performing markets were in the emerging Asia region, including China and the Philippines. The weakest performing markets in the EM Index included Greece, Colombia, and Brazil. Not surprisingly, Greece was the worst performing market during the fiscal year, as fears of its exit from the Eurozone nearly reached a tipping point. From a sector perspective, nearly every sector experienced losses in double-digit territory, led by weak performance in the energy, materials, and utilities sectors. Health care, while still negative, was the strongest performing sector and the only sector to post single-digit negative performance. It was followed by the information technology and consumer staples sectors.
We use a combination of stock-specific factors and top-down analysis to rank the stocks in our investable universe. Our alpha (return in excess of the EM Index) forecasting factors played a critical role navigating the markets over the fiscal year. With the exception of our sector factor, every other factor posted positive performance relative to the EM Index during the fiscal year — led by strong relative performance from our macroeconomic, currency, and earnings growth factors. Our bottom-up value factors, which have the greatest influence on our stock ranking process, also finished the fiscal year with positive performance. In addition to the previously-mentioned earnings growth factor strength, the technical indicators factor augmented the generally flat relative returns from our value factor. Over the period, particularly in down markets, investors focused on the health of developing economies, preferring characteristics favored by our macroeconomic factors: current account surpluses, low real interest rates and robust fiscal positions. Our currency factors helped reduce the Fund’s exposure to high-inflation currencies that are sensitive to external shocks. Lastly, our country factor performance was also accretive to relative performance.
Stock selection drove the Fund’s excess return compared to the EM Index. Holdings in China, Brazil, India, Malaysia, and Indonesia were the top country-level contributors to relative return. Holdings in South Korea, United Arab Emirates, Thailand, Philippines, and the Czech Republic detracted from relative performance. From a sector perspective, the top contributors to relative outperformance were positions in the industrials, materials, and financials sectors. Holdings in the information technology and utilities
| | | | |
| 2 | | Causeway Emerging Markets Fund | | |
sectors, as well as an overweight position in the energy sector, detracted from relative performance. The top individual contributors to performance relative to the EM Index were overweight positions in construction group, China Communications Construction Co. Ltd. (China), transportation systems construction company, China Railway Group Ltd. (China), and technology design & manufacturing company, Pegatron Corp. (Taiwan). The top detractor from relative performance was an underweight position in internet gaming company, Tencent Holdings (China). Overweight positions in bank, Banco do Brasil SA (Brazil) and state-owned oil & gas company, PTT Public Company (Thailand) also detracted.
Significant Portfolio Changes
At the country level, over the past year the Fund increased its overweight position compared to the EM Index to South Korea, China, and Mexico. South Korean companies have been exhibiting positive price momentum, while the earnings growth of companies in Mexico has been improving. In addition, the Fund increased its active weight (difference between Fund exposure and EM Index exposure) in China largely due to a switch back into Chinese-listed Tencent Holdings from South-African listed Naspers (which holds a large stake in Tencent Holdings) in an effort to mitigate currency risk associated with the South African Rand. We are more cautious about investment opportunities in South Africa, Taiwan, and Thailand, and as such, have reduced the Fund’s active weight in these markets. In addition to the previously-mentioned currency risk, South African equities performed relatively well over the last year, leading to deteriorating valuation opportunities for the Fund. Equities in Taiwan and Thailand suffered from deteriorating earnings growth and weak price momentum, respectively.
We increased the Fund’s active exposure to the energy and industrials sectors over the year, as the earnings growth characteristics of stocks in these sectors appeared to be reaching a cyclical trough. We reduced the Fund’s active exposure to the consumer discretionary and materials sectors, where poor valuation and momentum were negatively impacting expectations for positive performance.
Investment Outlook
Recent underperformance of companies with earnings especially sensitive to economic growth has sustained a substantial valuation gap between “cheap” cyclical and more “expensive” defensive stocks. This past summer, the fear trade appeared to reach an extreme, as Chinese domestic equities swooned like the proverbial canary in a coal mine. Even the mine itself looks imperiled. We appear to have a more sanguine view of global gross domestic product (GDP) than market consensus, and we have found the overwhelmingly greatest upside potential in companies with economically cyclical earnings. We believe that diversified alpha exposure is paramount to delivering excess return throughout market cycles, particularly as investor risk tolerances adjust to reflect changing liquidity conditions. The Fund’s use of multiple alpha-ranking factors is a hallmark of our investment process. Diversification of alpha sources should benefit the Fund’s risk-adjusted long-term returns across changing market regimes. Our one-year expectations currently include a modestly rising level of global demand for crude oil, a concerted effort
| | | | | | |
| | | Causeway Emerging Markets Fund | | | 3 | |
to boost fiscal spending by the Chinese government, and a resulting bottoming of most commodity prices. We believe that equity markets will discount a return to reflation many months before such improvement is reflected in the actual economic data.
We thank you for your continued confidence in Causeway Emerging Markets Fund, and look forward to serving you in the future.
September 30, 2015
| | | | |
 | |  | |  |
| | |
| Arjun Jayaraman | | MacDuff Kuhnert | | Joseph Gubler |
| Portfolio Manager | | Portfolio Manager | | Portfolio Manager |
The above commentary expresses the portfolio managers’ views as of the date shown and should not be relied upon by the reader as research or investment advice. These views are subject to change. There is no guarantee that any forecasts made will come to pass.
Investing involves risk including loss of principal. In addition to the normal risks associated with investing, international investments may involve risk of capital loss from unfavorable fluctuation in currency values, from differences in generally accepted accounting principles or from economic or political instability in other nations. Emerging markets involve heightened risks related to the same factors as well as increased volatility and lower trading volume. Diversification does not prevent all investment losses.
| | | | |
| 4 | | Causeway Emerging Markets Fund | | |
Comparison of Change in the Value of a $10,000 Investment in Causeway Emerging Markets Fund, Investor Class shares versus the MSCI Emerging Markets Index (Gross)
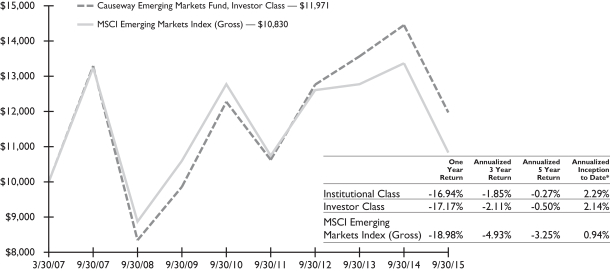
The performance in the above graph does not reflect the deduction of taxes the shareholder will pay on Fund distributions or the redemptions of Fund shares.
* The inception date of Causeway Emerging Markets Fund was March 30, 2007. The MSCI Emerging Markets Index (Gross) inception to date return is from March 30, 2007.
The performance data represents past performance and is not an indication of future results. Investment return and the principal value of an investment will fluctuate so that an investor’s shares, when redeemed, may be worth less than their original cost and current performance may be higher or lower than the performance quoted. For performance data current to the most recent month end, please call 1-866-947-7000 or visit www.causewayfunds.com. Investment performance reflects contractual fee waivers during certain periods. In the absence of such fee waivers, total return would be reduced. Total returns assume reinvestment of dividends and capital gains distributions at net asset value when paid. Investor Class shares pay a shareholder service fee of up to 0.25% per annum of average daily net assets. Institutional Class shares pay no shareholder service fee. For the fiscal year ended September 30, 2015, the Fund’s gross ratios of expenses in relation to net assets were 1.19% and 1.46% for the Institutional Class and Investor Class, respectively. The Fund imposes a 2% redemption fee on the value of shares redeemed less than 60 days after purchase. If your account incurred a redemption fee, your performance will be lower than the performance shown here. For more information, please see the prospectus.
The MSCI Emerging Markets Index (Gross) (the “Index”) is a free float-adjusted market capitalization index, designed to measure equity market performance of emerging markets, consisting of 23 emerging country indices. The Index is gross of withholding taxes, assumes reinvestment of dividends and capital gains, and does not reflect the payment of transaction costs, fees and expenses associated with an investment in the Fund. It is not possible to invest directly in an index. There are special risks in foreign investing (please see Note 5 in the Notes to Financial Statements).
MSCI has not approved, reviewed or produced this report, makes no express or implied warranties or representations, and is not liable whatsoever for any data in this report. You may not redistribute the MSCI data or use it as a basis for other indices or investment products.
| | | | | | |
| | | Causeway Emerging Markets Fund | | | 5 | |
SCHEDULE OF INVESTMENTS (000)*
September 30, 2015
| | | | | | | | |
| Causeway Emerging Markets Fund | |
Number of Shares | | | Value | |
| | | | | | | | |
COMMON STOCK | | | | | | | | |
| Brazil — 2.8% | | | | | | |
Banco do Brasil SA | | | 4,776,500 | | | $ | 18,109 | |
JBS SA | | | 7,222,600 | | | | 30,588 | |
Light SA | | | 793,700 | | | | 2,320 | |
Porto Seguro SA | | | 604,200 | | | | 4,572 | |
| | | | | | | | |
| | | | | | | 55,589 | |
| | | | | | | | |
| China — 23.3% | | | | | | |
Agile Property Holdings Ltd. | | | 10,294,000 | | | | 5,374 | |
Bank of China Ltd., Class H | | | 73,597,000 | | | | 31,738 | |
China CITIC Bank Corp. Ltd., Class H | | | 19,514,000 | | | | 11,363 | |
China Communications Construction Co. Ltd., Class H | | | 16,006,000 | | | | 19,855 | |
China Construction Bank Corp., Class H | | | 74,187,000 | | | | 49,507 | |
China Lumena New Materials Corp.1,2,3 | | | 10,564,000 | | | | — | |
China Mobile Ltd. ADR | | | 1,092,300 | | | | 64,992 | |
China Petroleum & Chemical Corp., Class H | | | 49,146,000 | | | | 30,104 | |
China Railway Construction Corp. Ltd., Class H | | | 13,473,000 | | | | 19,931 | |
China Railway Group Ltd., Class H | | | 20,775,000 | | | | 18,975 | |
China Traditional Chinese Medicine Co. Ltd.2 | | | 17,058,000 | | | | 12,868 | |
Datang International Power Generation Co. Ltd., Class H | | | 15,950,000 | | | | 6,055 | |
FerroChina Ltd.1,2,3 | | | 258,000 | | | | — | |
Guangzhou R&F Properties Co. Ltd., Class H | | | 8,926,000 | | | | 8,121 | |
Industrial & Commercial Bank of China, Class H | | | 17,258,000 | | | | 9,970 | |
JA Solar Holdings Co. Ltd. ADR2 | | | 1,473,200 | | | | 11,491 | |
KWG Property Holding Ltd. | | | 10,228,500 | | | | 6,755 | |
NetEase Inc. ADR | | | 202,200 | | | | 24,288 | |
PetroChina Co. Ltd., Class H | | | 11,910,000 | | | | 8,294 | |
PICC Property & Casualty Co. Ltd., Class H | | | 17,528,000 | | | | 34,332 | |
Poly Property Group Co. Ltd. | | | 12,595,000 | | | | 3,483 | |
Shanghai Pharmaceuticals Holding Co. Ltd., Class H | | | 6,007,900 | | | | 12,592 | |
Shimao Property Holdings Ltd. | | | 3,937,000 | | | | 5,949 | |
Sihuan Pharmaceutical Holdings Group Ltd.1,4 | | | 4,433,000 | | | | 1,097 | |
The accompanying notes are an integral part of the financial statements.
| | | | |
| 6 | | Causeway Emerging Markets Fund | | |
SCHEDULE OF INVESTMENTS (000)* (continued)
September 30, 2015
| | | | | | | | |
| Causeway Emerging Markets Fund | |
Number of Shares | | | Value | |
| | | | | | | | |
| China — (continued) | | | | | | |
Skyworth Digital Holdings Ltd. | | | 16,124,000 | | | $ | 10,975 | |
TCL Communication Technology Holdings Ltd. | | | 5,499,000 | | | | 3,969 | |
Tencent Holdings Ltd. | | | 2,095,800 | | | | 35,328 | |
Zhejiang Expressway Co. Ltd., Class H | | | 9,888,000 | | | | 10,801 | |
| | | | | | | | |
| | | | | | | 458,207 | |
| | | | | | | | |
| Czech Republic — 0.7% | | | | | | |
CEZ AS | | | 629,691 | | | | 13,098 | |
| | | | | | | | |
| India — 10.7% | | | | | | |
Ashok Leyland Ltd.2 | | | 11,749,527 | | | | 16,610 | |
Bank of Baroda | | | 6,639,429 | | | | 18,692 | |
Cairn India Ltd. | | | 2,390,538 | | | | 5,616 | |
Ceat Ltd. | | | 569,915 | | | | 11,163 | |
Cipla Ltd. | | | 1,778,150 | | | | 17,262 | |
Dr Reddy’s Laboratories Ltd. | | | 345,149 | | | | 21,949 | |
HCL Technologies Ltd. | | | 1,127,641 | | | | 16,911 | |
Hindustan Petroleum Corp. Ltd. | | | 1,535,410 | | | | 18,109 | |
Indiabulls Housing Finance Ltd. | | | 393,999 | | | | 4,780 | |
Lupin Ltd. | | | 503,567 | | | | 15,634 | |
NMDC Ltd. | | | 3,105,910 | | | | 4,414 | |
Power Finance Corp. Ltd. | | | 3,524,210 | | | | 12,392 | |
Rural Electrification Corp. Ltd. | | | 3,395,976 | | | | 14,226 | |
Sintex Industries Ltd. | | | 6,736,523 | | | | 10,847 | |
Tata Motors Ltd. | | | 430,403 | | | | 1,958 | |
Tata Motors Ltd. ADR2 | | | 319,900 | | | | 7,198 | |
UPL Ltd. | | | 1,662,562 | | | | 11,651 | |
| | | | | | | | |
| | | | | | | 209,412 | |
| | | | | | | | |
| Indonesia — 0.4% | | | | | | |
Adhi Karya Persero Tbk PT | | | 17,431,200 | | | | 2,686 | |
Indofood Sukses Makmur Tbk PT | | | 12,587,900 | | | | 4,738 | |
| | | | | | | | |
| | | | | | | 7,424 | |
| | | | | | | | |
The accompanying notes are an integral part of the financial statements.
| | | | | | |
| | | Causeway Emerging Markets Fund | | | 7 | |
SCHEDULE OF INVESTMENTS (000)* (continued)
September 30, 2015
| | | | | | | | |
| Causeway Emerging Markets Fund | |
Number of Shares | | | Value | |
| | | | | | | | |
| Malaysia — 0.4% | | | | | | |
IJM Corp. Berhad | | | 6,444,800 | | | $ | 4,721 | |
UMW Holdings Bhd | | | 1,901,100 | | | | 3,250 | |
| | | | | | | | |
| | | | | | | 7,971 | |
| | | | | | | | |
| Mexico — 4.2% | | | | | | |
Alfa SAB de CV, Class A | | | 9,622,100 | | | | 18,715 | |
America Movil SAB de CV, Class L ADR | | | 1,091,100 | | | | 18,058 | |
Arca Continental SAB de CV | | | 2,224,500 | | | | 12,527 | |
Gruma SAB de CV, Class B | | | 1,073,600 | | | | 14,766 | |
Kimberly-Clark de Mexico SAB de CV, Class A | | | 7,316,600 | | | | 16,546 | |
Mexico Real Estate Management SA de CV5 | | | 1,730,473 | | | | 2,187 | |
| | | | | | | | |
| | | | | | | 82,799 | |
| | | | | | | | |
| Philippines — 0.8% | | | | | | |
Megaworld Corp. | | | 44,584,400 | | | | 4,173 | |
Universal Robina Corp. | | | 2,919,100 | | | | 12,002 | |
| | | | | | | | |
| | | | | | | 16,175 | |
| | | | | | | | |
| Poland — 3.5% | | | | | | |
PGE Polska Grupa Energetyczna SA | | | 2,815,343 | | | | 10,003 | |
Polski Koncern Naftowy Orlen SA | | | 1,798,799 | | | | 31,407 | |
Powszechny Zaklad Ubezpieczen SA | | | 240,310 | | | | 24,674 | |
Tauron Polska Energia SA | | | 4,142,860 | | | | 3,578 | |
| | | | | | | | |
| | | | | | | 69,662 | |
| | | | | | | | |
| Qatar — 1.0% | | | | | | |
Barwa Real Estate Co. | | | 652,027 | | | | 7,670 | |
Commercial Bank QSC | | | 305,542 | | | | 4,740 | |
Industries Qatar QSC | | | 190,384 | | | | 6,445 | |
| | | | | | | | |
| | | | | | | 18,855 | |
| | | | | | | | |
| Russia — 4.3% | | | | | | |
Gazprom PAO ADR | | | 4,123,961 | | | | 16,638 | |
Lukoil PJSC ADR | | | 521,193 | | | | 17,752 | |
The accompanying notes are an integral part of the financial statements.
| | | | |
| 8 | | Causeway Emerging Markets Fund | | |
SCHEDULE OF INVESTMENTS (000)* (continued)
September 30, 2015
| | | | | | | | |
| Causeway Emerging Markets Fund | |
Number of Shares | | | Value | |
| | | | | | | | |
| Russia — (continued) | | | | | | |
PhosAgro OAO GDR | | | 740,617 | | | $ | 10,247 | |
Sberbank of Russia ADR | | | 2,713,210 | | | | 13,435 | |
Surgutneftegas OAO ADR | | | 2,536,071 | | | | 12,977 | |
Tatneft PAO ADR | | | 453,974 | | | | 12,731 | |
| | | | | | | | |
| | | | | | | 83,780 | |
| | | | | | | | |
| South Africa — 6.0% | | | | | | |
Barloworld Ltd. | | | 903,115 | | | | 4,929 | |
FirstRand Ltd. | | | 9,727,421 | | | | 34,566 | |
MMI Holdings Ltd. | | | 4,181,279 | | | | 7,195 | |
Netcare Ltd. | | | 3,792,863 | | | | 9,959 | |
Redefine Properties Ltd.5 | | | 19,825,042 | | | | 16,757 | |
Sibanye Gold Ltd. | | | 3,439,131 | | | | 3,909 | |
Steinhoff International Holdings Ltd. | | | 2,257,468 | | | | 13,862 | |
Vodacom Group Ltd. | | | 2,760,205 | | | | 27,456 | |
| | | | | | | | |
| | | | | | | 118,633 | |
| | | | | | | | |
| South Korea — 17.4% | | | | | | |
BNK Financial Group Inc. | | | 947,313 | | | | 10,984 | |
CJ Corp. | | | 49,021 | | | | 10,947 | |
Daesang Corp. | | | 238,872 | | | | 6,229 | |
e-LITECOM Co. Ltd. | | | 184,508 | | | | 3,239 | |
Hanwha Corp. | | | 328,367 | | | | 10,815 | |
Hyosung Corp. | | | 215,309 | | | | 20,567 | |
Hyundai Marine & Fire Insurance Co. Ltd. | | | 338,756 | | | | 8,643 | |
KB Financial Group Inc. | | | 1,099,086 | | | | 32,670 | |
Kia Motors Corp. | | | 713,548 | | | | 32,346 | |
Korea Aerospace Industries Ltd. | | | 344,956 | | | | 19,870 | |
Korea Electric Power Corp. | | | 1,025,228 | | | | 42,269 | |
KT&G Corp. | | | 238,300 | | | | 22,440 | |
LG Display Co. Ltd. | | | 266,258 | | | | 5,083 | |
NH Investment & Securities Co. Ltd. | | | 1,649,064 | | | | 13,942 | |
Samsung Electronics Co. Ltd. | | | 58,426 | | | | 56,057 | |
The accompanying notes are an integral part of the financial statements.
| | | | | | |
| | | Causeway Emerging Markets Fund | | | 9 | |
SCHEDULE OF INVESTMENTS (000)* (continued)
September 30, 2015
| | | | | | | | |
| Causeway Emerging Markets Fund | |
Number of Shares | | | Value | |
| | | | | | | | |
| South Korea — (continued) | | | | | | |
SK Holdings Co. Ltd. | | | 41,122 | | | $ | 8,488 | |
SK Hynix Inc. | | | 330,237 | | | | 9,418 | |
SK Telecom Co. Ltd. | | | 13,574 | | | | 3,011 | |
SK Telecom Co. Ltd. ADR | | | 827,100 | | | | 20,181 | |
Tovis Co. Ltd. | | | 438,461 | | | | 3,670 | |
| | | | | | | | |
| | | | | | | 340,869 | |
| | | | | | | | |
| Taiwan — 12.8% | | | | | | |
Asustek Computer Inc. | | | 841,300 | | | | 7,234 | |
Chicony Electronics Co. Ltd. | | | 1,994,596 | | | | 4,611 | |
Compal Electronics Inc. | | | 12,300,316 | | | | 6,987 | |
Coretronic Corp. | | | 3,726,000 | | | | 3,373 | |
Fubon Financial Holding Co. Ltd. | | | 18,598,000 | | | | 29,114 | |
HON HAI Precision Industry Co. Ltd. | | | 17,626,294 | | | | 46,048 | |
Innolux Corp. | | | 16,627,000 | | | | 5,207 | |
Inventec Corp. | | | 12,347,000 | | | | 5,883 | |
Lite-On Technology Corp. | | | 10,173,246 | | | | 9,372 | |
Merida Industry Co. Ltd. | | | 904,907 | | | | 4,887 | |
Pegatron Corp. | | | 13,449,000 | | | | 32,914 | |
Pou Chen Corp. | | | 9,183,000 | | | | 13,814 | |
Powertech Technology Inc. | | | 6,467,000 | | | | 11,715 | |
President Chain Store Corp. | | | 825,000 | | | | 5,145 | |
Siliconware Precision Industries Co. Ltd. | | | 4,242,000 | | | | 5,288 | |
Taiwan PCB Techvest Co. Ltd. | | | 3,698,000 | | | | 3,857 | |
Taiwan Semiconductor Manufacturing Co. Ltd. ADR | | | 1,364,700 | | | | 28,318 | |
TTY Biopharm Co. Ltd. | | | 2,935,000 | | | | 8,567 | |
WPG Holdings Ltd. | | | 6,562,000 | | | | 6,339 | |
Yuanta Financial Holding Co. Ltd. | | | 31,959,850 | | | | 11,883 | |
| | | | | | | | |
| | | | | | | 250,556 | |
| | | | | | | | |
| Thailand — 2.3% | | | | | | |
Bangchak Petroleum PCL | | | 5,083,500 | | | | 4,811 | |
Bangkok Dusit Medical Services PCL | | | 10,484,100 | | | | 5,355 | |
The accompanying notes are an integral part of the financial statements.
| | | | |
| 10 | | Causeway Emerging Markets Fund | | |
SCHEDULE OF INVESTMENTS (000)* (continued)
September 30, 2015
| | | | | | | | |
| Causeway Emerging Markets Fund | |
Number of Shares | | | Value | |
| | | | | | | | |
| Thailand — (continued) | | | | | | |
PTT PCL | | | 3,506,900 | | | $ | 23,283 | |
Sansiri PCL | | | 181,951,166 | | | | 8,547 | |
Thanachart Capital PCL | | | 4,206,200 | | | | 3,682 | |
| | | | | | | | |
| | | | | | | 45,678 | |
| | | | | | | | |
| Turkey — 3.9% | | | | | | |
Eregli Demir ve Celik Fabrikalari TAS | | | 7,065,505 | | | | 8,722 | |
Ford Otomotiv Sanayi AS | | | 372,396 | | | | 3,980 | |
TAV Havalimanlari Holding AS | | | 1,256,273 | | | | 9,871 | |
Tekfen Holding AS | | | 4,575,573 | | | | 6,328 | |
Tupras Turkiye Petrol Rafinerileri AS | | | 1,169,496 | | | | 28,664 | |
Turk Hava Yollari AO2 | | | 6,320,824 | | | | 16,676 | |
Turk Traktor ve Ziraat Makineleri AS | | | 123,873 | | | | 3,001 | |
| | | | | | | | |
| | | | | | | 77,242 | |
| | | | | | | | |
| United Arab Emirates — 1.3% | | | | | | |
Dubai Islamic Bank PJSC | | | 6,323,747 | | | | 11,576 | |
First Gulf Bank PJSC | | | 3,570,564 | | | | 13,582 | |
| | | | | | | | |
| | | | | | | 25,158 | |
| | | | | | | | |
Total Common Stock | | | | | | | | |
(Cost $2,173,968) — 95.8% | | | | | | | 1,881,108 | |
| | | | | | | | |
PREFERENCE STOCK | | | | | | | | |
| Brazil — 2.2% | | | | | | |
Bradespar SA | | | 2,061,100 | | | | 4,299 | |
Cia Energetica de Sao Paulo | | | 1,075,000 | | | | 4,119 | |
Cia Paranaense de Energia | | | 763,600 | | | | 6,306 | |
Itausa – Investimentos Itau SA | | | 10,653,910 | | | | 19,188 | |
Petroleo Brasileiro SA, Class A ADR2 | | | 2,725,800 | | | | 10,031 | |
| | | | | | | | |
| | | | | | | 43,943 | |
| | | | | | | | |
| South Korea — 0.2% | | | | | | |
LG Chemical Ltd. | | | 16,953 | | | | 2,730 | |
| | | | | | | | |
Total Preference Stock | | | | | | | | |
(Cost $81,209) — 2.4% | | | | | | | 46,673 | |
| | | | | | | | |
The accompanying notes are an integral part of the financial statements.
| | | | | | |
| | | Causeway Emerging Markets Fund | | | 11 | |
SCHEDULE OF INVESTMENTS (000)* (concluded)
September 30, 2015
| | | | | | | | |
| Causeway Emerging Markets Fund | | Number of Shares/Warrants | | | Value | |
| | | | | | | | |
EXCHANGE TRADED FUNDS | | | | | | | | |
iShares Core MSCI Emerging Markets ETF | | | 77,031 | | | $ | 3,073 | |
iShares MSCI Emerging Markets ETF | | | 334,081 | | | | 10,951 | |
Vanguard FTSE Emerging Markets ETF | | | 197,676 | | | | 6,541 | |
| | | | | | | | |
Total Exchange Traded Funds | | | | | | | | |
(Cost $21,344) — 1.1% | | | | | | | 20,565 | |
| | | | | | | | |
WARRANT | | | | | | | | |
Sansiri PCL, Expires 11/24/20172 | | | 14,133,566 | | | | 74 | |
| | | | | | | | |
Total Warrant | | | | | |
(Cost $0) — 0.0% | | | | | | | 74 | |
| | | | | | | | |
SHORT-TERM INVESTMENT | | | | | | | | |
Dreyfus Cash Management,
Institutional Class, 0.050%** | | | 12,525,888 | | | | 12,526 | |
| | | | | | | | |
Total Short-Term Investment | | | | | |
(Cost $12,526) — 0.6% | | | | | | | 12,526 | |
| | | | | | | | |
Total Investments — 99.9% | | | | | |
(Cost $2,289,047) | | | | | | | 1,960,946 | |
| | | | | | | | |
Other Assets in Excess of Liabilities — 0.1% | | | | 2,134 | |
| | | | | | | | |
Net Assets — 100.0% | | | $ | 1,963,080 | |
| | | | | | | | |
| ** | The rate reported is the 7-day effective yield as of September 30, 2015. |
| 1 | Securities considered illiquid. The total market value of such securities as of September 30, 2015 was $1,097 (000) and represented 0.1% of net assets. |
| 2 | Non-income producing security. |
| 3 | Security is fair valued at zero due to company’s insolvency. |
| 4 | Security fair valued using methods determined in good faith by the Fair Value Committee designated by the Board of Trustees. The total market value of such securities as of September 30, 2015 was $1,097 (000) and represented 0.1% of net assets. |
| 5 | Real Estate Investment Trust. |
| ADR | American Depositary Receipt |
| FTSE | Financial Times London Stock Exchange |
| GDR | Global Depositary Receipt |
Amounts designated as “—” are $0 or are rounded to $0.
The accompanying notes are an integral part of the financial statements.
| | | | |
| 12 | | Causeway Emerging Markets Fund | | |
SECTOR DIVERSIFICATION
As of September 30, 2015, the sector diversification was as follows (Unaudited):
| | | | | | | | | | | | |
| Causeway Emerging Markets Fund | | Common
Stock | | | Preference
Stock | | | % of
Net Assets | |
| | | |
Financials | | | 25.4% | | | | 1.0% | | | | 26.4% | |
| | | |
Information Technology | | | 17.6 | | | | 0.0 | | | | 17.6 | |
| | | |
Energy | | | 10.7 | | | | 0.5 | | | | 11.2 | |
| | | |
Industrials | | | 10.7 | | | | 0.0 | | | | 10.7 | |
| | | |
Telecommunication Services | | | 6.8 | | | | 0.0 | | | | 6.8 | |
| | | |
Consumer Staples | | | 6.4 | | | | 0.0 | | | | 6.4 | |
| | | |
Health Care | | | 5.4 | | | | 0.0 | | | | 5.4 | |
| | | |
Consumer Discretionary | | | 5.3 | | | | 0.0 | | | | 5.3 | |
| | | |
Utilities | | | 3.9 | | | | 0.5 | | | | 4.4 | |
| | | |
Materials | | | 3.6 | | | | 0.4 | | | | 4.0 | |
| | | | | | | | | | | | |
| Total | | | 95.8 | | | | 2.4 | | | | 98.2 | |
| | | |
| Exchange Traded Funds | | | | | | | | | | | 1.1 | |
| | | | | | | | | �� | | | |
| Warrant | | | | | | | | | | | 0.0 | |
| | | | | | | | | | | | |
| Short-Term Investment | | | | | | | | | | | 0.6 | |
| | | | | | | | | | | | |
| Other Assets in Excess of Liabilities | | | | | | | | | | | 0.1 | |
| | | | | | | | | | | | |
| Net Assets | | | | | | | | | | | 100.0% | |
| | | | | | | | | | | | |
The accompanying notes are an integral part of the financial statements.
| | | | | | |
| | | Causeway Emerging Markets Fund | | | 13 | |
STATEMENT OF ASSETS AND LIABILITIES (000)*
| | | | |
| | | CAUSEWAY EMERGING
MARKETS FUND | |
| |
| | | 9/30/15 | |
ASSETS: | | | | |
Investments at Value (Cost $2,289,047) | | $ | 1,960,946 | |
Receivable for Fund Shares Sold | | | 15,585 | |
Receivable for Dividends | | | 6,483 | |
Receivable for Investment Securities Sold | | | 2,045 | |
Foreign Currency (Cost $724) | | | 725 | |
Receivable for Tax Reclaims | | | 25 | |
Prepaid Expenses | | | 11 | |
Unrealized Appreciation on Spot Foreign Currency Contracts | | | 5 | |
| | | | |
Total Assets | | | 1,985,825 | |
| | | | |
LIABILITIES: | | | | |
Payable for Investment Securities Purchased | | | 12,842 | |
Payable for Fund Shares Redeemed | | | 6,314 | |
Payable Due to Adviser | | | 1,584 | |
Accrued Foreign Capital Gains Tax on Appreciated Securities | | | 1,036 | |
Payable for Shareholder Services Fees — Investor Class | | | 123 | |
Payable Due to Administrator | | | 49 | |
Payable for Trustees’ Fees | | | 18 | |
Unrealized Depreciation on Spot Foreign Currency Contracts | | | 5 | |
Other Accrued Expenses | | | 774 | |
| | | | |
Total Liabilities | | | 22,745 | |
| | | | |
Net Assets | | $ | 1,963,080 | |
| | | | |
NET ASSETS: | | | | |
Paid-in Capital (unlimited authorization — no par value) | | $ | 2,294,492 | |
Undistributed Net Investment Income | | | 25,448 | |
Accumulated Net Realized Loss on Investments and Foreign Currency Transactions | | | (27,633 | ) |
Net Unrealized Depreciation on Investments | | | (328,101 | ) |
Accrued Foreign Capital Gains Tax on Appreciated Securities | | | (1,036 | ) |
Net Unrealized Depreciation on Foreign Currencies and Translation of Other Assets and Liabilities Denominated in Foreign Currencies | | | (90 | ) |
| | | | |
Net Assets | | $ | 1,963,080 | |
| | | | |
Net Asset Value Per Share (based on net assets of
$1,348,772,811 ÷ 134,934,105 shares) — Institutional Class | | | $10.00 | |
| | | | |
Net Asset Value Per Share (based on net assets of
$614,307,146 ÷ 61,035,166 shares) — Investor Class | | | $10.06 | |
| | | | |
| * | Except for Net Asset Value data. |
The accompanying notes are an integral part of the financial statements.
| | | | |
| 14 | | Causeway Emerging Markets Fund | | |
STATEMENT OF OPERATIONS (000)
| | | | |
| | | CAUSEWAY EMERGING
MARKETS FUND | |
| |
| | | 10/01/14 to
9/30/15 | |
INVESTMENT INCOME: | | | | |
Dividend Income (net of foreign taxes withheld of $5,647) | | $ | 47,773 | |
| | | | |
Total Investment Income | | | 47,773 | |
| | | | |
EXPENSES: | | | | |
Investment Advisory Fees | | | 14,166 | |
Custodian Fees | | | 1,654 | |
Shareholder Service Fees — Investor Class | | | 599 | |
Administration Fees | | | 447 | |
Registration Fees | | | 143 | |
Transfer Agent Fees | | | 130 | |
Professional Fees | | | 86 | |
Trustees’ Fees | | | 60 | |
Line of Credit | | | 43 | |
Income Tax(1) | | | 33 | |
Printing Fees | | | 23 | |
Pricing Fees | | | 17 | |
Other Fees | | | 49 | |
| | | | |
Total Expenses | | | 17,450 | |
| | | | |
Net Investment Income | | | 30,323 | |
| | | | |
Net Realized and Unrealized Gain (Loss) on Investments and Foreign Currency Transactions: | | | | |
Net Realized Loss on Investments(2) | | | (12,072 | ) |
Net Realized Loss from Foreign Currency Transactions | | | (1,648 | ) |
Net Change in Unrealized Depreciation on Investments | | | (358,002 | ) |
Net Change in Accrued Foreign Capital Gains Tax on Appreciated Securities | | | 1,006 | |
Net Change in Unrealized Depreciation on Foreign Currency and Translation of Other Assets and Liabilities Denominated in Foreign Currency | | | (9 | ) |
| | | | |
Net Realized and Unrealized Loss on Investments and Foreign Currency Transactions | | | (370,725 | ) |
| | | | |
| Net Decrease in Net Assets Resulting from Operations | | $ | (340,402 | ) |
| | | | |
| (1) | See Note 2 in the Notes to Financial Statements. |
| (2) | Includes realized gains as a result of an in-kind redemption (see Note 10 in the Notes to Financial Statements). |
The accompanying notes are an integral part of the financial statements.
| | | | | | |
| | | Causeway Emerging Markets Fund | | | 15 | |
STATEMENTS OF CHANGES IN NET ASSETS (000)
| | | | | | | | |
| | | CAUSEWAY EMERGING
MARKETS FUND | |
| | |
| | | 10/01/14 to
9/30/15 | | | 10/01/13 to
9/30/14 | |
OPERATIONS: | | | | | | | | |
Net Investment Income | | $ | 30,323 | | | $ | 14,328 | |
Net Realized Gain (Loss) on Investments | | | (12,072 | ) | | | 5,910 | |
Net Realized Loss from Foreign Currency Transactions | | | (1,648 | ) | | | (1,065 | ) |
Net Change in Unrealized Appreciation (Depreciation) on Investments | | | (358,002 | ) | | | 18,979 | |
Net Change in Accrued Foreign Capital Gains Tax on Appreciated Securities | | | 1,006 | | | | (1,930 | ) |
Net Change in Unrealized Depreciation on Foreign Currency and Translation of Other Assets and Liabilities Denominated in Foreign Currency | | | (9 | ) | | | (82 | ) |
| | | | | | | | |
Net Increase (Decrease) in Net Assets Resulting From Operations | | | (340,402 | ) | | | 36,140 | |
| | | | | | | | |
DIVIDENDS AND DISTRIBUTIONS TO SHAREHOLDERS: | | | | | | | | |
Dividends from Net Investment Income: | | | | | | | | |
Institutional Class | | | (22,262 | ) | | | (3,949 | ) |
Investor Class | | | (1,098 | ) | | | (312 | ) |
| | | | | | | | |
Total Dividends from Net Investment Income | | | (23,360 | ) | | | (4,261 | ) |
| | | | | | | | |
Net Increase in Net Assets Derived from Capital Share Transactions(1)(2) | | | 1,406,461 | | | | 636,736 | |
Redemption Fees(3) | | | 66 | | | | 40 | |
| | | | | | | | |
Total Increase in Net Assets | | | 1,042,765 | | | | 668,655 | |
| | | | | | | | |
NET ASSETS: | | | | | | | | |
Beginning of Year | | | 920,315 | | | | 251,660 | |
| | | | | | | | |
End of Year | | $ | 1,963,080 | | | $ | 920,315 | |
| | | | | | | | |
Undistributed Net Investment Income | | $ | 25,448 | | | $ | 14,700 | |
| | | | | | | | |
| (1) | Includes redemptions as a result of an in-kind transfer of securities (see Note 10 in the Notes to Financial Statements). |
| (2) | See Note 7 in Notes to Financial Statements. |
| (3) | See Note 2 in the Notes to Financial Statements. |
The accompanying notes are an integral part of the financial statements.
| | | | |
| 16 | | Causeway Emerging Markets Fund | | |
This page intentionally left blank.
FINANCIAL HIGHLIGHTS
For the fiscal years ended September 30,
For a Share Outstanding Throughout the Fiscal Years
| | | | | | | | | | | | | | | | | | | | | | | | | | | | | | | | |
| | | | | | | | | |
| | | Net Asset
Value,
Beginning
of Year ($) | | | Net
Investment
Income ($) | | |
Net Realized
and
Unrealized
Gain
(Loss) on
Investments ($) | | | Total
from
Operations ($) | | | Dividends
from Net
Investment
Income ($) | | | Distributions
from
Capital
Gains ($) | | | Total
Dividends
and
Distributions ($) | | | Redemption
Fees ($) | |
CAUSEWAY EMERGING MARKETS FUND† | |
Institutional | | | | | | | | | | | | | | | | | | | | | | | | | | | | | |
2015 | | | 12.33 | | | | 0.24 | | | | (2.29 | ) | | | (2.05 | ) | | | (0.28 | ) | | | — | | | | (0.28 | ) | | | — | (1) |
2014 | | | 11.65 | | | | 0.28 | | | | 0.51 | | | | 0.79 | | | | (0.11 | ) | | | — | | | | (0.11 | ) | | | — | |
2013 | | | 11.19 | | | | 0.24 | | | | 0.50 | | | | 0.74 | | | | (0.28 | ) | | | — | | | | (0.28 | ) | | | — | |
2012 | | | 9.39 | | | | 0.28 | | | | 1.62 | | | | 1.90 | | | | (0.10 | ) | | | — | | | | (0.10 | ) | | | — | |
2011 | | | 11.07 | | | | 0.26 | | | | (1.68 | ) | | | (1.42 | ) | | | (0.26 | ) | | | — | | | | (0.26 | ) | | | — | |
Investor | | | | | | | | | | | | | | | | | | | | | | | | | | | | | |
2015 | | | 12.40 | | | | 0.29 | | | | (2.39 | ) | | | (2.10 | ) | | | (0.24 | ) | | | — | | | | (0.24 | ) | | | — | (1) |
2014 | | | 11.72 | | | | 0.23 | | | | 0.53 | | | | 0.76 | | | | (0.08 | ) | | | — | | | | (0.08 | ) | | | — | |
2013 | | | 11.26 | | | | 0.20 | | | | 0.51 | | | | 0.71 | | | | (0.25 | ) | | | — | | | | (0.25 | ) | | | — | |
2012 | | | 9.45 | | | | 0.26 | | | | 1.63 | | | | 1.89 | | | | (0.08 | ) | | | — | | | | (0.08 | ) | | | — | |
2011 | | | 11.14 | | | | 0.30 | | | | (1.75 | ) | | | (1.45 | ) | | | (0.25 | ) | | | — | | | | (0.25 | ) | | | 0.01 | |
| (1) | Amount represents less than $0.01 per share. |
| † | Per share amounts calculated using average shares method. |
Amounts designated as “—” are $0 or round to $0.
The accompanying notes are an integral part of the financial statements.
| | | | |
| 18 | | Causeway Emerging Markets Fund | | |
| | | | | | | | | | | | | | | | | | | | | | | | | | |
Net Asset
Value, End
of Year ($) | | | Total
Return (%) | | | Net Assets,
End of
Year
($000) | | | Ratio of
Expenses to
Average Net
Assets (%) | | | Ratio of
Expenses
to Average
Net Assets
(Excluding
Waivers and
Reimburse-
ments) (%) | | | Ratio
of Net
Investment
Income
to Average
Net Assets (%) | | | Portfolio
Turnover
Rate (%) | |
| | | | | | | | | | | | | | | | | | | | | | | | | | |
| | | | | | | | | | | | | | | | | | | | | | | | | | |
| | 10.00 | | | | (16.94 | ) | | | 1,348,773 | | | | 1.19 | | | | 1.19 | | | | 2.06 | | | | 100 | |
| | 12.33 | | | | 6.84 | | | | 852,202 | | | | 1.20 | | | | 1.20 | | | | 2.31 | | | | 112 | |
| | 11.65 | | | | 6.54 | | | | 211,572 | | | | 1.30 | | | | 1.30 | | | | 2.09 | | | | 95 | |
| | 11.19 | | | | 20.36 | | | | 102,810 | | | | 1.35 | | | | 1.43 | | | | 2.61 | | | | 74 | |
| | 9.39 | | | | (13.33 | ) | | | 53,748 | | | | 1.35 | | | | 1.59 | | | | 2.25 | | | | 95 | |
| | | | | | | | | | | | | | | | | | | | | | | | | | |
| | 10.06 | | | | (17.17 | ) | | | 614,307 | | | | 1.46 | | | | 1.46 | | | | 2.55 | | | | 100 | |
| | 12.40 | | | | 6.55 | | | | 68,113 | | | | 1.45 | | | | 1.45 | | | | 1.89 | | | | 112 | |
| | 11.72 | | | | 6.28 | | | | 40,088 | | | | 1.55 | | | | 1.55 | | | | 1.69 | | | | 95 | |
| | 11.26 | | | | 20.10 | | | | 34,598 | | | | 1.55 | | | | 1.63 | | | | 2.46 | | | | 74 | |
| | 9.45 | | | | (13.41 | ) | | | 27,027 | | | | 1.55 | | | | 1.78 | | | | 2.52 | | | | 95 | |
The accompanying notes are an integral part of the financial statements.
| | | | | | |
| | | Causeway Emerging Markets Fund | | | 19 | |
NOTES TO FINANCIAL STATEMENTS
Causeway Emerging Markets Fund (the “Fund”) is a series of Causeway Capital Management Trust (the “Trust”). The Trust is an open-end management investment company registered under the Investment Company Act of 1940, as amended (the “1940 Act”) and is a Delaware statutory trust that was established on August 10, 2001. The Fund began operations on March 30, 2007. The Fund is authorized to offer two classes of shares, the Institutional Class and the Investor Class. The Declaration of Trust authorizes the issuance of an unlimited number of shares of beneficial interest of the Fund. The Fund is diversified. The Fund’s prospectus provides a description of the Fund’s investment objectives, policies and strategies. The Trust has five additional series, the financial statements of which are presented separately.
| 2. | | Significant Accounting Policies |
The following is a summary of the significant accounting policies consistently followed by the Fund.
Use of Estimates in the Preparation of Financial Statements – The Fund is an investment company that applies the accounting and reporting guidance issued in Topic 946 by the U.S. Financial Accounting Standards Board. The Fund’s financial statements have been prepared to comply with U.S. generally accepted accounting principles (“U.S. GAAP”). The preparation of financial statements in conformity with U.S. GAAP requires management to make estimates and assumptions that affect the reported amount of net assets and liabilities and disclosure of contingent assets and liabilities at the date of the financial statements and the reported amounts of increases and decreases in net assets from operations during the reporting period. Actual results could differ from those estimates.
Security Valuation – Except as described below, securities listed on a securities exchange (except the NASDAQ
Stock Market (“NASDAQ”)) or Over-the-Counter (“OTC”) for which market quotations are available) are valued at the last reported sale price as of the close of regular trading on each business day, or, if there is no such reported sale, at the last reported bid price for long positions. For securities traded on NASDAQ, the NASDAQ Official Closing Price will be used. Securities listed on multiple exchanges or OTC markets are valued on the exchange or OTC market considered by the Fund to be the primary market. The prices for foreign securities are reported in local currency and converted to U.S. dollars using currency exchange rates. Prices for most securities held in the Fund are provided daily by recognized independent pricing agents. If a security price cannot be obtained from an independent pricing agent, the Fund seeks to obtain a bid price from at least one independent broker. Investments in the Dreyfus Cash Management money market fund are valued daily at the net asset value per share.
Securities for which market prices are not “readily available” are valued in accordance with fair value pricing procedures approved by the Fund’s Board of Trustees (the “Board”). The Fund’s fair value pricing procedures are implemented through a fair value committee (the “Committee”) designated by the Board. Some of the more common reasons that may necessitate that a security be valued using fair value pricing procedures include: the security’s trading has been halted or suspended; the security has been delisted from a national exchange; the security’s primary trading market is temporarily closed at a time when under normal conditions it would be open; or the security’s primary pricing source is not able or willing to provide a price. When the Committee values a security in accordance with the fair value pricing procedures, the Committee will determine the value after taking into consideration relevant information reasonably available to the Committee.
The Fund uses a third party vendor to fair value certain non-U.S. securities if there is a movement in the U.S.
| | | | |
| 20 | | Causeway Emerging Markets Fund | | |
NOTES TO FINANCIAL STATEMENTS
(continued)
market that exceeds thresholds established by the Committee. The vendor provides fair values for foreign securities based on factors and methodologies involving, generally, tracking valuation correlations between the U.S. market and each non-U.S. security.
In accordance with the authoritative guidance on fair value measurements and disclosure under U.S. GAAP, the Fund discloses fair value of its investments in a hierarchy that prioritizes the inputs to valuation techniques used to measure the fair value. The
objective of a fair value measurement is to determine the price that would be received to sell an asset or paid to transfer a liability in an orderly transaction between market participants at the measurement date (an exit price). Accordingly, the fair value hierarchy gives the highest priority to quoted prices (unadjusted) in active markets for identical assets or liabilities (Level 1) and the lowest priority to unobservable inputs (Level 3). The guidance establishes three levels of fair value hierarchy as follows:
| | • | | Level 1 — Unadjusted quoted prices in active markets for identical, unrestricted assets or liabilities that the Fund has the ability to access at the measurement date; |
| | • | | Level 2 — Quoted prices in markets which are not active, or prices based on inputs that are observable (either directly or indirectly) for substantially the full term of the asset or liability; and |
| | • | | Level 3 — Prices, inputs or exotic modeling techniques which are both significant to the fair value measurement and unobservable (supported by little or no market activity). |
Investments are classified within the level of the lowest significant input considered in determining fair value. Investments classified within Level 3 which fair value measurement considers several inputs may include Level 1 or Level 2 inputs as components of the overall fair value measurement.
The following table sets forth information about the levels within the fair value hierarchy at which the Fund’s investments are measured at September 30, 2015:
| | | | | | | | | | | | | | | | |
Investments in
Securities | | Level 1
(000) | | | Level 2†
(000) | | | Level 3††
(000) | | | Total
(000) | |
Common Stock | | | | | | | | | | | | | | | | |
Brazil | | $ | 55,589 | | | $ | — | | | $ | — | | | $ | 55,589 | |
China | | | 100,771 | | | | 356,339 | | | | 1,097 | | | | 458,207 | |
Czech Republic | | | — | | | | 13,098 | | | | — | | | | 13,098 | |
India | | | 7,198 | | | | 202,214 | | | | — | | | | 209,412 | |
Indonesia | | | — | | | | 7,424 | | | | — | | | | 7,424 | |
Malaysia | | | — | | | | 7,971 | | | | — | | | | 7,971 | |
Mexico | | | 82,799 | | | | — | | | | — | | | | 82,799 | |
Philippines | | | — | | | | 16,175 | | | | — | | | | 16,175 | |
Poland | | | — | | | | 69,662 | | | | — | | | | 69,662 | |
Qatar | | | — | | | | 18,855 | | | | — | | | | 18,855 | |
Russia | | | — | | | | 83,780 | | | | — | | | | 83,780 | |
South Africa | | | — | | | | 118,633 | | | | — | | | | 118,633 | |
South Korea | | | 20,181 | | | | 320,688 | | | | — | | | | 340,869 | |
Taiwan | | | 28,318 | | | | 222,238 | | | | — | | | | 250,556 | |
Thailand | | | — | | | | 45,678 | | | | — | | | | 45,678 | |
Turkey | | | — | | | | 77,242 | | | | — | | | | 77,242 | |
United Arab Emirates | | | — | | | | 25,158 | | | | — | | | | 25,158 | |
| | | | |
| | | | |
Total Common Stock | | | 294,856 | | | | 1,585,155 | | | | 1,097 | | | | 1,881,108 | |
| | | | |
| | | | |
Preference Stock | | | | | | | | | | | | | | | | |
Brazil | | | 43,943 | | | | — | | | | — | | | | 43,943 | |
South Korea | | | — | | | | 2,730 | | | | — | | | | 2,730 | |
| | | | |
| | | | |
Total Preference Stock | | | 43,943 | | | | 2,730 | | | | — | | | | 46,673 | |
| | | | |
| | | | |
Exchange Traded Funds | | | 20,565 | | | | — | | | | — | | | | 20,565 | |
| | | | |
| | | | |
Warrant | | | 74 | | | | — | | | | — | | | | 74 | |
| | | | |
| | | | |
Short-Term Investment | | | 12,526 | | | | — | | | | — | | | | 12,526 | |
| | | | |
| | | | |
Total Investments in Securities | | $ | 371,964 | | | $ | 1,587,885 | | | $ | 1,097 | | | $ | 1,960,946 | |
| | | | |
| † | Holdings represent securities trading outside the United States, the values of which were adjusted as a result of significant market movements following the close of local trading or due to “Foreign Line” securities using “Local Line” prices. Securities with a value of $1,152,563 (000), which represented 58.7% of the net assets of the Fund, transferred from Level 1 to Level 2 since the prior fiscal year end, primarily due to significant market movements following the close of local trading. |
| †† | A reconciliation of Level 3 investments and disclosures of significant unobservable inputs are presented when the Fund has a significant amount of Level 3 investments at the beginning and/or end of the period in relation to net assets. Management has concluded that Level 3 investments are not material in relation to net assets. |
| | | | | | |
| | | Causeway Emerging Markets Fund | | | 21 | |
NOTES TO FINANCIAL STATEMENTS
(continued)
Please refer to the Schedule of Investments for additional information regarding the composition of the amounts listed above.
Changes in valuation techniques may result in transfers in or out of an investment’s assigned level within the hierarchy during the reporting period. Changes in the classification between Levels 1 and 2 occur primarily when foreign equity securities are fair valued by the Fund’s third party vendor using other observable market–based inputs in place of closing exchange prices due to events occurring after foreign market closures and/or due to adjustments to security values due to “Foreign Line” securities using “Local Line” prices.
For the fiscal year ended September 30, 2015, one security transferred to Level 3 because trading in its shares was suspended. Transfers between levels are recognized at period end.
For the fiscal year ended September 30, 2015, there were no significant changes to the Fund’s fair value methodologies.
Federal Income Taxes – It is the Fund’s intention to continue to qualify as a regulated investment company under Subchapter M of the Internal Revenue Code and to distribute all of its taxable income. Accordingly, no provision for Federal income taxes has been made in the financial statements.
The Fund evaluates tax positions taken or expected to be taken in the course of preparing the Fund’s tax returns to determine whether it is “more-likely-than not” (i.e., greater than 50-percent) that each tax position will be sustained upon examination by a taxing authority based on the technical merits of the position. Tax positions not deemed to meet the more likely- than-not threshold are recorded as a tax benefit or expense in the current year. The Fund did not record any tax provision in the
current period. However, management’s conclusions regarding tax positions taken may be subject to review and adjustment at a later date based on factors including, but not limited to, examination by tax authorities (i.e., the last 3 tax year ends, as applicable), on-going analysis of and changes to tax laws, regulations and interpretations thereof.
As of and during the fiscal year ended September 30, 2015, the Fund did not have a liability for any unrecognized tax benefits. The Fund recognizes interest and penalties, if any, related to unrecognized tax benefits as income tax expense in the Statement of Operations. During the fiscal year, the Fund did not incur any significant interest or penalties.
During the fiscal year ended September 30, 2015, the Fund incurred federal excise tax in the amount of $32,561. No other provisions for federal income taxes have been made in the financial statements.
Security Transactions and Related Income – Security transactions are accounted for on the date the security is purchased or sold (trade date). Dividend income is recognized on the ex-dividend date, and interest income is recognized using the accrual basis of accounting. Costs used in determining realized gains and losses on the sales of investment securities are those of the specific securities sold.
Foreign Currency Translation – The books and records of the Fund are maintained in U.S. dollars on the following basis:
(1) the market value or fair value of investment securities, assets and liabilities is converted at the current rate of exchange; and
(2) purchases and sales of investment securities, income and expenses are converted at the relevant rates of exchange prevailing on the respective dates of such transactions.
| | | | |
| 22 | | Causeway Emerging Markets Fund | | |
NOTES TO FINANCIAL STATEMENTS
(continued)
The Fund does not isolate that portion of gains and losses on investments in equity securities that is due to changes in the foreign exchange rates from that which is due to changes in market prices of equity securities.
Foreign Currency Exchange Contracts – When the Fund purchases or sells foreign securities, it may enter into foreign currency exchange contracts to minimize foreign exchange risk from the trade date to the settlement date of the transaction. Losses from these transactions may arise from changes in the value of the foreign currency or if the counterparties do not perform under the contract’s terms.
Expense/Classes – Expenses that are directly related to one Fund of the Trust are charged directly to that Fund. Other operating expenses of the Trust are prorated to the Fund and the other series of the Trust on the basis of relative daily net assets. Class specific expenses are borne by that class of shares. Income, realized and unrealized gains/losses and non-class specific expenses are allocated to the respective classes on the basis of relative daily net assets.
Dividends and Distributions – Dividends from net investment income, if any, are declared and paid on an annual basis. Any net realized capital gains on sales of securities are distributed to shareholders at least annually.
Redemption Fee – The Fund imposes a redemption fee of 2% on the value of capital shares redeemed by shareholders less than 60 days after purchase. The redemption fee also applies to exchanges from the Fund. The redemption fee is paid to the Fund. The redemption fee does not apply to shares purchased through reinvested distributions or shares redeemed
through designated systematic withdrawal plans. The redemption fee does not normally apply to accounts designated as omnibus accounts with the transfer agent.
These are arrangements through financial intermediaries where the purchase and sale orders of a number of persons are aggregated before being communicated to the Fund. However, the Fund may seek agreements with these intermediaries to impose the Fund’s redemption fee or a different redemption fee on their customers if feasible, or to impose other appropriate restrictions on excessive short-term trading. The officers of the Fund may waive the redemption fee for shareholders in asset allocation and similar investment programs reasonably believed not to be engaged in short-term market timing, including for holders of shares purchased by Causeway Capital Management LLC (the “Adviser”) for its clients to rebalance their portfolios. For the fiscal year ended September 30, 2015, the Institutional Class and Investor Class retained $43,961 and $22,001 in redemption fees, respectively.
| 3. | | Investment Advisory, Administration, Shareholder Service and Distribution Agreements |
The Trust, on behalf of the Fund, has entered into an Investment Advisory Agreement (the “Advisory Agreement”) with the Adviser. Under the Advisory Agreement, the Adviser is entitled to a monthly fee equal to an annual rate of 1.00% of the Fund’s average daily net assets. The Adviser contractually agreed through January 31, 2016 to waive its fee and, to the extent necessary, reimburse the Fund to keep total annual fund operating expenses (excluding brokerage fees and commissions, interest, taxes, shareholder service fees, fees and expenses of other funds in which the Fund invests, and extraordinary expenses) from exceeding 1.35% of Institutional Class and Investor Class average daily net assets. No waivers or reimbursements were required for the fiscal year ended September 30, 2015.
The Trust and SEI Investments Global Funds Services (the “Administrator”) have entered into an Administration
| | | | | | |
| | | Causeway Emerging Markets Fund | | | 23 | |
NOTES TO FINANCIAL STATEMENTS
(continued)
Agreement. Under the terms of the Administration Agreement, the Administrator is entitled to an annual fee which is calculated daily and paid monthly based on the aggregate average daily net assets of the Trust subject to a minimum annual fee.
The Trust has adopted a Shareholder Service Plan and Agreement for Investor Class shares that allows the Trust to pay broker-dealers and other financial intermediaries a fee of up to 0.25% per annum of average daily net assets for services provided to Investor Class shareholders. For the fiscal year ended September 30, 2015, the Investor Class paid 0.25% of average daily net assets under this plan.
The Trust and SEI Investments Distribution Co. (the “Distributor”) have entered into a Distribution Agreement. The Distributor receives no fees from the Fund for its distribution services under this agreement.
The officers of the Trust are also officers or employees of the Administrator or Adviser. They receive no fees for serving as officers of the Trust.
As of September 30, 2015, approximately $1.309 million of the net assets were held by affiliated investors.
| 4. | | Investment Transactions |
The cost of security purchases and the proceeds from the sale of securities, other than short-term investments, during the fiscal year ended September 30, 2015, for the Fund were as follows:
| | | | | | |
Purchases
(000) | | | Sales
(000) | |
| $ | 2,813,465 | | | $ | 1,398,483 | |
| 5. | | Risks of Foreign Investing |
Because the Fund invests most of its assets in foreign securities, the Fund is subject to further risks. For
example, the value of the Fund’s securities may be affected by social, political and economic developments and U.S. and foreign laws relating to foreign investment. Furthermore, because the Fund invests in securities denominated in foreign currencies, the Fund’s securities may go down in value depending on foreign exchange rates. Other risks include trading, settlement, custodial, and other operational risks; withholding or other taxes; and the less stringent investor protection and disclosure standards of some foreign markets. All of these factors can make foreign securities less liquid, more volatile and harder to value than U.S. securities. These risks are higher for emerging markets investments.
| 6. | | Federal Tax Information |
The Fund is classified as a separate taxable entity for Federal income tax purposes. The Fund intends to continue to qualify as a separate “regulated investment company” under Subchapter M of the Internal Revenue Code and make the requisite distributions to shareholders that will be sufficient to relieve it from Federal income tax and Federal excise tax. Therefore, normally no Federal tax provision is required. During the fiscal year ended September 30, 2015, the Fund incurred federal excise tax in the amount of $32,561. No other provisions for federal income taxes have been made in the financial statements. To the extent that dividends from net investment income and distributions from net realized capital gains exceed amounts reported in the financial statements, such amounts are reported separately.
The Fund may be subject to taxes imposed by countries in which it invests in issuers existing or operating in such countries. Such taxes are generally based on income earned. The Fund accrues such taxes when the related income is earned. Dividend and interest income is recorded net of non-U.S. taxes paid. Gains realized by the Fund on the sale of securities in certain countries are
| | | | |
| 24 | | Causeway Emerging Markets Fund | | |
NOTES TO FINANCIAL STATEMENTS
(continued)
subject to non-U.S. taxes. The Fund records a liability based on unrealized gains to provide for potential non-U.S. taxes payable upon the sale of these securities. For the fiscal year ended September 30, 2015, non-U.S. taxes paid on realized gains were $0 and non-U.S. taxes accrued on unrealized gains were $1,036,310.
The amounts of distributions from net investment income and net realized capital gains are determined in accordance with Federal income tax regulations, which may differ from those amounts determined under U.S. GAAP. These book/tax differences are either temporary or permanent in nature. The character of distributions made during the year from net investment income or net realized gains, and the timing of distributions made during the year may differ from the year that the income or realized gains (losses) were recorded by the Fund. To the extent these differences are permanent, adjustments are made to the appropriate equity accounts in the period that the differences arise.
Accordingly, the following permanent differences, which are primarily due to a redemption in kind, non-deductible excise tax, realized losses on foreign currency transactions and gains and losses on passive foreign investment companies, were reclassified to/(from) the following accounts as of September 30, 2015 (000):
| | | | | | | | | | |
Paid-in
Capital | | | Undistributed
Net
Investment
Income (Loss) | | | Accumulated
Net Realized
Gain (Loss) | |
| $ | 764 | | | $ | 3,785 | | | $ | (4,549 | ) |
The reclassifications had no impact on net assets or net asset value per share.
The tax character of dividends and distributions declared during the fiscal years ended September 30, 2015 and September 30, 2014 were as follows (000):
| | | | | | | | |
| | | Ordinary
Income | | | Total | |
2015 | | $ | 23,360 | | | $ | 23,360 | |
2014 | | | 4,261 | | | | 4,261 | |
As of September 30, 2015, the components of distributable earnings on a tax basis were as follows (000):
| | | | |
Undistributed Ordinary Income | | $ | 28,852 | |
Unrealized Depreciation | | | (343,500 | ) |
Post October Losses | | | (16,761 | ) |
Other Temporary Differences | | | (3 | ) |
| | | | |
Total Accumulated Losses | | $ | (331,412 | ) |
| | | | |
Post-October Capital and Currency Losses represent losses realized on securities and currency transactions from November 1, 2014 through September 30, 2015 that, in accordance with Federal income tax regulations, the Fund may elect to defer and treat as having arisen in the following fiscal year.
For Federal income tax purposes, capital losses incurred in taxable years beginning before December 22, 2010 may be carried forward for a maximum period of eight years and applied against future net realized gains.
For the fiscal year ended September 30, 2015, the Fund used $5,318 (000) in capital loss carryforwards.
Under the Regulated Investment Company Modernization Act of 2010, the Fund is permitted to carry forward capital losses incurred in taxable years beginning after December 22, 2010 for an unlimited period. However, any losses incurred during those future taxable years are required to be used prior to the losses incurred in pre-enactment taxable years. As a result of this ordering rule, pre-enactment capital loss carryforwards may be more likely to expire unused. Additionally, post-enactment capital losses that are carried forward will retain their character as either short-term or long-term capital losses rather than being considered all short-term as under previous law.
| | | | | | |
| | | Causeway Emerging Markets Fund | | | 25 | |
NOTES TO FINANCIAL STATEMENTS
(continued)
At September 30, 2015, the total cost of securities for Federal income tax purposes and the aggregate gross unrealized appreciation and depreciation on investment securities for the Fund were as follows (000):
| | | | | | | | | | | | |
Federal
Tax Cost | | Appreciated
Securities | | | Depreciated
Securities | | | Net
Unrealized
Depreciation | |
| $2,303,319 | | $ | 43,340 | | | $ | (385,713 | ) | | $ | (342,373 | ) |
| 7. | | Capital Shares Issued and Redeemed (000) |
| | | | | | | | | | | | | | | | |
| | | Fiscal Year Ended
September 30, 2015 | | | Fiscal Year Ended
September 30, 2014 | |
| | | Shares | | | Value | | | Shares | | | Value | |
Institutional Class | | | | | | | | | | | | | | | | |
Shares Sold | | | 84,367 | | | $ | 976,713 | | | | 58,073 | | | $ | 697,646 | |
Shares Issued in Reinvestment of
Dividends and Distributions | | | 1,837 | | | | 21,093 | | | | 323 | | | | 3,738 | |
Shares Redeemed Inkind | | | (1,386 | ) | | | (16,668 | ) | | | — | | | | — | |
Shares Redeemed | | | (19,011 | ) | | | (212,668 | ) | | | (7,434 | ) | | | (89,117 | ) |
| | | | | | | | | | | | | | | | |
Increase in Shares Outstanding
Derived from Institutional Class Transactions | | | 65,807 | | | | 768,470 | | | | 50,962 | | | | 612,267 | |
| | | | | | | | | | | | | | | | |
Investor Class | | | | | | | | | | | | | | | | |
Shares Sold | | | 79,455 | | | | 892,801 | | | | 3,755 | | | | 44,405 | |
Shares Issued in Reinvestment of
Dividends and Distributions | | | 92 | | | | 1,064 | | | | 26 | | | | 306 | |
Shares Redeemed | | | (24,004 | ) | | | (255,874 | ) | | | (1,710 | ) | | | (20,242 | ) |
| | | | | | | | | | | | | | | | |
Increase in Shares Outstanding
Derived from Investor Class Transactions | | | 55,543 | | | | 637,991 | | | | 2,071 | | | | 24,469 | |
| | | | | | | | | | | | | | | | |
Increase in Shares Outstanding from
Capital Share Transactions | | | 121,350 | | | $ | 1,406,461 | | | | 53,033 | | | $ | 636,736 | |
| | | | | | | | | | | | | | | | |
| 8. | | Significant Shareholder Concentration |
As of September 30, 2015, two of the Fund’s shareholders of record owned 53% of net assets in the Institutional Class.
Under the Trust’s organizational documents, each Trustee, officer, employee or other agent of the Trust is indemnified against certain liabilities that may arise out of the performance of his or her duties to the Fund. Additionally, in the normal course of business, the Fund
enters into contracts, including the Fund’s servicing agreements, that contain a variety of indemnification clauses. The Fund’s maximum exposure under these arrangements is unknown as this would involve future claims that may be made against the Fund that have not yet occurred. The risk of material loss as a result of such indemnification claims is considered remote.
| 10. | | In-Kind Transfers of Securities |
During the fiscal year ended September 30, 2015, the Fund redeemed shares of beneficial interest in exchange
| | | | |
| 26 | | Causeway Emerging Markets Fund | | |
NOTES TO FINANCIAL STATEMENTS
(concluded)
for securities. These securities were transferred at their fair value on the date of such transactions.
| | | | | | | | | | | | |
| | | Shares
Redeemed
(000) | | | Value ($
000) | | | Gain ($ 000) | |
10/16/14 | | | 6,467 | | | $ | 8,448 | | | $ | 796 | |
The Fund entered into an agreement, on February 24, 2015, which enables it to participate in a $10 million secured committed revolving line of credit, along with certain other series of the Trust, with The Bank of New York Mellon (the “Custodian”) which expires February 24, 2016. The proceeds from the borrowings, if any, shall be used to finance the Fund’s short-term
general working capital requirements, including the funding of shareholder redemptions. Interest, if any, is charged to the Fund based on its borrowings during the period at the applicable rate plus 1.5%. The Fund is also charged a portion of a commitment fee of 0.12% per annum. As of September 30, 2015, there were no borrowings outstanding under the line of credit.
The Fund has evaluated the need for disclosures and/or adjustments resulting from subsequent events through the date the financial statements were available to be issued. Based on this evaluation, no adjustments were required to the financial statements.
| | | | | | |
| | | Causeway Emerging Markets Fund | | | 27 | |
REPORT OF INDEPENDENT REGISTERED PUBLIC ACCOUNTING FIRM
To the Board of Trustees and Shareholders of
Causeway Emerging Markets Fund:
In our opinion, the accompanying statement of assets and liabilities, including the schedule of investments, and the related statements of operations and of changes in net assets and the financial highlights present fairly, in all material respects, the financial position of Causeway Emerging Markets Fund (the “Fund”) at September 30, 2015, the results of its operations for the year then ended, the changes in its net assets for each of the two years in the period then ended and the financial highlights for each of the five years in the period then ended in conformity with accounting principles generally accepted in the United States of America. These financial statements and financial highlights (hereafter referred to as “financial statements”) are the responsibility of the Fund’s management. Our responsibility is to express an opinion on these financial statements based on our audits. We conducted our audits of these financial statements in accordance with the standards of the Public Company Accounting Oversight Board (United States). Those standards require that we plan and perform the audit to obtain reasonable assurance about whether the financial statements are free of material misstatement. An audit includes examining, on a test basis, evidence supporting the amounts and disclosures in the financial statements, assessing the accounting principles used and significant estimates made by management, and evaluating the overall financial statement presentation. We believe that our audits, which included confirmation of securities at September 30, 2015 by correspondence with the custodian and brokers, provide a reasonable basis for our opinion.
PricewaterhouseCoopers LLP
Los Angeles, California
November 24, 2015
| | | | |
| 28 | | Causeway Emerging Markets Fund | | |
NOTICE TO SHAREHOLDERS (Unaudited)
The information set forth below is for the Fund’s fiscal year as required by federal laws. Shareholders, however, must report distributions on a calendar year basis for income tax purposes, which may include distributions for portions of two fiscal years of the Fund. Accordingly, the information needed by shareholders for income tax purposes will be sent to them in early 2016. Please consult your tax adviser for proper treatment of this information.
For the fiscal year ended September 30, 2015, the Fund is designating the following items with regard to distributions paid during the year:
| | | | | | | | | | | | | | | | | | |
| (A) | | | (B) | | | (C) | | | (D) | | | (E) | |
| | | | |
Long Term
Capital Gains Distributions (Tax Basis) | | | Ordinary
Income
Distributions
(Tax Basis) | | | Tax Exempt
Distributions
(Tax Basis) | | | Total
Distributions
(Tax Basis) | | | Dividends(1)
for Corporate
Dividends Received
Deduction
(Tax Basis) | |
| | 0.00 | % | | | 100.00 | % | | | 0.00 | % | | | 100.00 | % | | | 0.00 | % |
| | | | |
| (F) | | | (G) | | | (H) | | | | | | | |
| | | | |
Qualified
Dividend
Income | | | Interest
Related
Dividends | | | Qualified
Short-Term
Capital
Gain
Dividends | | | | | | | |
| | 98.26 | % | | | 0.00 | % | | | 0.00 | % | | | | | | | | |
Foreign taxes accrued during the fiscal year ended September 30, 2015, amounted to $5,455,355 and are expected to be passed through to shareholders as foreign tax credits on Form 1099 – Dividend for the year ending December 31, 2015. In addition, for the fiscal year ended September 30, 2015, gross income derived from sources within foreign countries amounted to $50,339,546 for the Fund.
(1) Qualified Dividends represent dividends which qualify for the corporate dividends received deduction.
Items (A), (B), (C) and (D) are based on a percentage of the Fund’s total distribution including pass-through as foreign tax credit.
Item (E) is based on a percentage of ordinary income distributions of the Fund.
Item (F) represents the amount of “Qualified Dividend Income” as defined in the Jobs and Growth Tax Relief Reconciliation Act of 2003 and is reflected as a percentage of “Ordinary Income Distributions.” It is the Fund’s intention to designate the maximum amount permitted by the law up to 100%.
Item (G) is the amount of “Interest Related Dividends” as created by the American Jobs Creation Act of 2004 and is reflected as a percentage of net investment income distributions that is exempt from U.S. withholding tax when paid to foreign investors.
Item (H) is the amount of “Qualified Short-Term Capital Gain Dividends” as created by the American Jobs Creation Act of 2004 and is reflected as a percentage of short-term capital gain distributions that is exempt from U.S. withholding tax when paid to foreign investors.
| | | | | | |
| | | Causeway Emerging Markets Fund | | | 29 | |
TRUSTEES AND OFFICERS INFORMATION (Unaudited)
Information pertaining to the Trustees and Officers of the Trust is set forth below. Trustees who are not deemed to be “interested persons” of the Trust as defined in the 1940 Act are referred to as “Independent Trustees.” The Trust’s Statement of Additional Information (“SAI”) includes additional information about the Trustees and Officers. The SAI may be obtained without charge by calling 1-866-947-7000.
| | | | | | | | | | |
Name
Address,
Age1 | | Position(s) Held with the Company | | Term of
Office
and
Length of
Time
Served2 | | Principal
Occupation(s)
During Past
Five Years | | Number of Portfolios
in Trust
Complex
Overseen by Trustee3 | | Other
Directorships Held by
Trustee4 |
INDEPENDENT
TRUSTEES | | | | | | | | | | |
John R. Graham
Age: 54 | | Trustee; Chairman of the Audit Committee | | Trustee
since 10/08; Audit Chairman since 4/13 | | Film Composer (since 2005); Senior Vice President, Corporate Financial Development and Communications, The Walt Disney Company (2004-2005); Senior Vice President, Mergers and Acquisitions, Lehman Brothers Inc. (2000-2004). | | 6 | | None |
| | | | | |
Lawry J. Meister
Age: 53 | | Trustee | | Since 10/08 | | President, Steaven Jones Development Company, Inc. (real estate firm) (since 1995); President, Creative Office Properties (real estate firm) (since 2012). | | 6 | | None |
| | | | | |
Victoria B. Rogers
Age: 54 | | Trustee | | Since 4/13 | | President, the Rose Hills Foundation (since 1996). | | 6 | | Director, TCW Funds, Inc. and TCW Strategic Income Fund |
| | | | | |
Eric H. Sussman
Age: 49 | | Trustee; Chairman of the Board | | Trustee
since 9/01; Board Chairman since 4/13 | | Senior Lecturer (since July 2011) and Lecturer (1995-June 2011), Anderson Graduate School of Management, University of California, Los Angeles; President, Amber Capital, Inc. (real estate investment and financial planning firm) (since 1993). | | 6 | | None |
| | | | |
| 30 | | Causeway Emerging Markets Fund | | |
TRUSTEES AND OFFICERS INFORMATION (Unaudited)
(continued)
| | | | | | | | | | |
Name
Address,
Age1 | | Position(s) Held with the Company | | Term of Office
and
Length of Time
Served2 | | Principal
Occupation(s)
During Past
Five Years | | Number of Portfolios in Trust Complex Overseen by Trustee3 | | Other Directorships
Held by
Trustee4 |
OFFICERS | | | | | | | | | | |
Turner Swan
11111 Santa Monica
Blvd.,
15th Floor
Los Angeles, CA 90025
Age: 53 | | President | | Since 8/01 | | General Counsel, Secretary, and Member of the Adviser (since 2001); Compliance Officer of the Adviser (since 2010). | | N/A | | N/A |
| | | | | |
Kurt J. Decko
11111 Santa Monica
Blvd.,
15th Floor
Los Angeles, CA 90025
Age: 40 | | Chief Compliance Officer and Assistant Secretary | | Since 1/15 | | Chief Compliance Officer/Senior Legal Counsel of the Adviser (since January 2015); Partner, K&L Gates LLP (2010-2014). | | N/A | | N/A |
| | | | | |
Eric Kleinschmidt5
One Freedom Valley Drive
Oaks, PA 19456 Age: 47 | | Treasurer | | Since 8/14 | | Director of Fund Accounting, SEI Investments Company (since 2004). | | N/A | | N/A |
| | | | | |
Gretchen W. Corbell
11111 Santa Monica
Blvd.,
15th Floor
Los Angeles, CA 90025
Age: 44 | | Secretary | | Since 10/11 | | Attorney of the Adviser (since 2004). | | N/A | | N/A |
| | | | | |
Gracie V. Fermelia
11111 Santa Monica Blvd.,
15th Floor
Los Angeles, CA 90025
Age: 54 | | Vice President and Assistant Secretary | | Vice President (since 1/15); Assistant Secretary (since 8/01) | | Chief Operating Officer and Member of the Adviser (since 2001); Chief Compliance Officer of the Adviser and the Trust (2005-2015). | | N/A | | N/A |
| | | | | |
Lisa Whittaker5
One Freedom Valley Drive Oaks, PA 19456
Age: 36 | | Vice President and Assistant Secretary | | Since 8/13 | | Corporate Counsel of the Administrator (since 2012); Associate Counsel and Compliance Officer, The Glendmede Trust Company, N.A. (2011-2012); Associate, Drinker Biddle & Reath LLP (2006-2011). | | N/A | | N/A |
| | | | | | |
| | | Causeway Emerging Markets Fund | | | 31 | |
TRUSTEES AND OFFICERS INFORMATION (Unaudited)
(concluded)
| 1 | Each Trustee may be contacted by writing to the Trustee c/o Causeway Capital Management Trust, One Freedom Valley Drive, Oaks, PA 19456. |
| 2 | Each Trustee holds office during the lifetime of the Trust or until his or her sooner resignation, retirement, removal, death or incapacity in accordance with the Trust’s Declaration of Trust. The president, treasurer and secretary each holds office at the pleasure of the Board of Trustees or until he or she sooner resigns in accordance with the Trust’s Bylaws. |
| 3 | The “Trust Complex” consists of all registered investment companies for which Causeway Capital Management LLC serves as investment adviser. As of September 30, 2015, the Trust Complex consisted of one investment company with six portfolios — the International Value Fund, the Emerging Markets Fund, the Global Value Fund, the International Opportunities Fund, the Global Absolute Return Fund, and the International Small Cap Fund. |
| 4 | Directorships of companies required to report to the Securities and Exchange Commission under the Securities Exchange Act of 1934 (i.e., “public companies”) or other investment companies registered under the 1940 Act. |
| 5 | These officers of the Trust also serve as officers of one or more mutual funds for which SEI Investments Company or an affiliate acts as investment manager, administrator or distributor. |
| | | | |
| 32 | | Causeway Emerging Markets Fund | | |
DISCLOSURE OF FUND EXPENSES (Unaudited)
As a shareholder of the Fund, you incur two types of costs: (1) transaction costs, including redemption fees, and (2) ongoing costs, including management fees, shareholder service fees, and other Fund expenses. It is important for you to understand the impact of these costs on your investment returns.
Ongoing operating expenses are deducted from a mutual fund’s gross income and directly reduce its final investment return. These expenses are expressed as a percentage of a mutual fund’s average net assets; this percentage is known as a mutual fund’s expense ratio.
The following examples use the expense ratio and are intended to help you understand the ongoing costs (in dollars) of investing in the Fund and to compare these costs with those of other mutual funds. The examples are based on an investment of $1,000 made at the beginning of the period shown and held for the entire period (April 1, 2015 to September 30, 2015).
The table on the next page illustrates the Fund’s costs in two ways:
Actual Fund Return. This section helps you to estimate the actual expenses after fee waivers that the Fund incurred over the period. The “Expenses Paid During Period” column shows the actual dollar expense cost incurred by a $1,000 investment in the Fund, and the “Ending Account Value” number is derived from deducting that expense cost from the Fund’s gross investment return.
You can use this information, together with the actual amount you invested in the Fund, to estimate the expenses you paid over that period. Simply divide your actual account value by $1,000 to arrive at a ratio (for example, an $8,600 account value divided by $1,000 = 8.6), then multiply that ratio by the number shown under “Expenses Paid During Period.”
Hypothetical 5% Return. This section helps you compare the Fund’s costs with those of other mutual funds. It assumes that the Fund had an annual 5% return before expenses during the year, but that the expense ratio (Column 3) for the period is unchanged. This example is useful in making comparisons because the Securities and Exchange Commission requires all mutual funds to make this 5% calculation. You can assess the Fund’s comparative cost by comparing the hypothetical result for the Fund in the “Expenses Paid During Period” column with those that appear in the same charts in the shareholder reports for other mutual funds.
NOTE: Because the return is set at 5% for comparison purposes — NOT the Fund’s actual return — the account values shown may not apply to your specific investment.
| | | | | | |
| | | Causeway Emerging Markets Fund | | | 33 | |
DISCLOSURE OF FUND EXPENSES (Unaudited)
(concluded)
| | | | | | | | | | | | | | | | |
| | | Beginning
Account
Value
4/01/15 | | | Ending
Account
Value
9/30/15 | | | Annualized
Expense
Ratios | | | Expenses
Paid
During
Period* | |
Causeway Emerging Markets Fund | | | | | | | | | | | | | |
| | | | |
Actual Portfolio Return | | | | | | | | | | | | | | | | |
Institutional Class | | $ | 1,000.00 | | | $ | 836.80 | | | | 1.20 | % | | $ | 5.53 | |
| | | | |
Hypothetical 5% Return | | | | | | | | | | | | | | | | |
| Institutional Class | | $ | 1,000.00 | | | $ | 1,019.05 | | | | 1.20 | % | | $ | 6.07 | |
Causeway Emerging Markets Fund | | | | | | | | | | | | | |
| | | | |
Actual Portfolio Return | | | | | | | | | | | | | | | | |
Investor Class | | $ | 1,000.00 | | | $ | 835.50 | | | | 1.47 | % | | $ | 6.76 | |
| | | | |
Hypothetical 5% Return | | | | | | | | | | | | | | | | |
| Investor Class | | $ | 1,000.00 | | | $ | 1,017.70 | | | | 1.47 | % | | $ | 7.44 | |
| * | Expenses are equal to the Fund’s annualized expense ratio multiplied by the average account value over the period, multiplied by 183/365 (to reflect the one-half year period). |
| | | | |
| 34 | | Causeway Emerging Markets Fund | | |
STATEMENT REGARDING BASIS FOR APPROVAL OF INVESTMENT ADVISORY AGREEMENT (Unaudited)
At a meeting on August 3, 2015, the Trustees considered and approved the renewal of the investment advisory agreement (the “Advisory Agreement”) between Causeway Capital Management Trust (the “Trust”) and Causeway Capital Management LLC (the “Adviser”) with respect to Causeway Emerging Markets Fund (the “Fund”) for a twelve-month period beginning September 20, 2015. Section 15(c) of the Investment Company Act of 1940, as amended (the “1940 Act”) requires the Board of Trustees (the “Board”) of the “Trust annually to approve continuance of the Advisory Agreement. Continuance of the Advisory Agreement must be approved by a majority of the Trustees and a majority of the independent Trustees (i.e., Trustees who are not “interested persons” of the Trust as defined in the 1940 Act). The Board was comprised of four independent Trustees when the continuation of the Advisory Agreement was considered.
Information Received. At each regular quarterly meeting, the Board reviews a wide variety of materials relating to the nature, extent and quality of the Adviser’s services, including information concerning the Fund’s performance. In connection with their August 3, 2015 meeting, the Trustees received and reviewed extensive quantitative and qualitative materials prepared by the Adviser relating to the Advisory Agreement in response to information requested on the independent Trustees’ behalf by their independent legal counsel.
Factors Considered. In reviewing the Advisory Agreement, the Trustees considered a number of factors including, but not limited to: (1) the nature, extent and quality of the services provided by the Adviser, (2) the investment performance of the Fund, (3) comparisons of the services rendered and the amounts paid under the Advisory Agreement with those of other funds and those of the Adviser under other investment advisory agreements with other registered investment companies and other types of clients, (4) the costs of the services provided and estimated profits realized by the Adviser and its affiliates from their relationship with the Fund, (5) the extent to which economies of scale would be realized as the Fund grows and whether fee levels reflect these economies of scale for the benefit of Fund investors, and (6) any other benefits derived by the Adviser from its relationship with the Fund.
First, regarding the nature, extent and quality of the services provided by the Adviser, the Trustees considered, among other things, the Adviser’s personnel, experience, track record and compliance program. The Trustees considered the qualifications, backgrounds and responsibilities of the Adviser’s principal personnel who provide services to the Fund, as well as the level of attention those individuals provide to the Fund. The Trustees noted the Adviser’s commitment to devoting resources to staffing and technology in support of its investment management services. They also reviewed the Adviser’s investment philosophy and processes and its compliance program, and considered the scope of the Adviser’s services to the Fund. The Trustees concluded that the nature, extent and quality of the services provided by the Adviser continued to benefit the Fund and its shareholders and would do so during the next one-year contract renewal period.
Second, regarding the investment performance of the Fund, the Trustees reviewed the investment results of the Fund’s Institutional and Investor share classes for various periods ended June 30, 2015, compared to the results of the MSCI Emerging Markets Index (Gross) (the “Index”) and the averages of the mutual funds included in the Morningstar U.S. Open End Diversified Emerging Markets funds category of funds. They noted that the Fund had outperformed the
| | | | | | |
| | | Causeway Emerging Markets Fund | | | 35 | |
STATEMENT REGARDING BASIS FOR APPROVAL OF INVESTMENT ADVISORY AGREEMENT (Unaudited)
(continued)
Index and the Morningstar category averages for the one-year, three-year, five-year and since inception periods. The Trustees concluded that the Adviser’s record in managing the Fund indicates that its continued management will benefit the Fund and its shareholders.
Third, regarding the Fund’s advisory fee and total expenses:
| | • | | The Trustees compared the Fund’s advisory fee and total expenses with those of other similar mutual funds. They noted that the Fund’s advisory fee is the same as the average and median advisory fees charged by funds in the Morningstar U.S. Open End Diversified Emerging Markets funds category, and its expense ratios are below the average and median of the funds in that Morningstar category. |
| | • | | The Trustees compared the Fund’s advisory fee with the fee charged by the Adviser to other clients, observing that the separate accounts in the Adviser’s emerging markets strategy have constraints that are not comparable to those of the Fund. The Trustees noted that, although the fees paid by the Adviser’s other accounts were lower than the advisory fee paid by the Fund, the differences appropriately reflected the Adviser’s significantly greater responsibilities with respect to the Fund, which include the provision of many additional administrative and shareholder services (such as services related to the Fund’s disclosure documents, financial statements, 1940 Act compliance policies and procedures, preparation of Board and committee materials and meetings, annual Board reports and certifications, oversight of daily valuation, oversight of Fund service providers, negotiation of Fund intermediary agreements, coordination with Fund intermediaries providing shareholder recordkeeping services, shareholder communications, and due diligence for advisers, consultants and institutional investors). |
The Trustees concluded that the Fund’s advisory fee and expense ratio are reasonable and appropriate under the circumstances.
Fourth, the Trustees considered the Adviser’s costs of providing services to the Fund and estimated profits realized by the Adviser from its relationship with the Fund. They reviewed the Adviser’s estimated after-tax profit margin with respect to such services for the twelve months ended June 30, 2015 and the methodology used to generate that estimate, and noted that the cost allocation methodology presented to the Trustees was reasonable. They also observed that the Adviser’s estimated profitability was within the range cited as reasonable in various court decisions. After consideration of these matters, the Trustees concluded that the Adviser’s operating margin with respect to its relationship with the Fund is reasonable.
Fifth, regarding economies of scale, the Trustees observed that, although the Fund’s advisory fee schedule does not contain fee breakpoints, it is difficult to determine the existence or extent of any economies of scale. They noted that the Adviser is sharing economies of scale through reasonable advisory fee levels, expense limit agreements, and devoting additional resources to staff and technology to focus on continued performance and service to the Fund’s shareholders. They also noted that, in the Fund’s prior years, the Adviser incurred significant losses in managing the Fund. The Trustees concluded that under the circumstances the Adviser is sharing any economies of scale with the Fund appropriately.
| | | | |
| 36 | | Causeway Emerging Markets Fund | | |
STATEMENT REGARDING BASIS FOR APPROVAL OF INVESTMENT ADVISORY AGREEMENT (Unaudited)
(concluded)
Sixth, regarding any other benefits derived by the Adviser from its relationship with the Fund — often called “fall-out” benefits — the Trustees observed that the Adviser does not earn “fall-out” benefits such as affiliated custody fees, affiliated transfer agency fees, affiliated brokerage commissions, profits from rule 12b-1 fees, “contingent deferred sales commissions” or “float” benefits on short-term cash. The Trustees concluded that the primary “fall-out” benefit received by the Adviser is research services provided by brokers used by the Fund and that this benefit is reasonable in relation to the value of the services that the Adviser provides to the Fund.
Approval. At the August 3, 2015 meeting, the Trustees considered the approval of the Advisory Agreement and discussed the information and factors noted above with representatives of the Adviser. The independent Trustees also met in a private session with independent counsel at which no representatives of the Adviser were present. In their deliberations, the independent Trustees did not identify any particular information or factor that was determinative or controlling, each Trustee did not necessarily attribute the same weight to each factor, and the foregoing summary does not detail all the matters considered. Based on their review, the Trustees (including the independent Trustees) unanimously concluded that the Advisory Agreement is fair and reasonable to the Fund and its shareholders, the Fund’s advisory fee is reasonable and renewal of the Advisory Agreement is in the best interests of the Fund and its shareholders, and the Board of Trustees approved the renewal of the Advisory Agreement for a twelve-month period beginning September 20, 2015.
| | | | | | |
| | | Causeway Emerging Markets Fund | | | 37 | |
INVESTMENT ADVISER:
Causeway Capital Management LLC
11111 Santa Monica Boulevard
15th Floor
Los Angeles, CA 90025
DISTRIBUTOR:
SEI Investments Distribution Co.
One Freedom Valley Drive
Oaks, PA 19456
TO OBTAIN MORE INFORMATION :
Call 1-866-947-7000 or visit us online at
www.causewayfunds.com
This material must be preceded or accompanied by a current prospectus.
The Fund files its complete schedule of portfolio holdings with the Securities and Exchange Commission (“Commission”) for the first and third quarters of each fiscal year on Form N-Q within sixty days after the end of the period. The Fund’s
Forms N-Q are available on the Commission’s website at http://www.sec.gov, and may be reviewed and copied at the Commission’s Public Reference Room in Washington, DC. Information on the operation of the Public Reference Room may be obtained by calling 1-800-SEC-0330.
A description of the policies and procedures that the Fund uses to determine how to vote proxies relating to portfolio securities, as well as information relating to how the Trust voted proxies relating to portfolio securities during the most recent 12-month period ended June 30, is available (i) without charge, upon request, by calling 1-866-947-7000; and (ii) on the Commission’s website at http://www. sec.gov.
CCM-AR-002-0900
The registrant has adopted a code of ethics that applies to the registrant’s principal executive officer, principal financial officer and principal accounting officer. During the fiscal year ended September 30, 2015, there were no material changes or waivers to the code of ethics.
| Item 3. | Audit Committee Financial Expert. |
(a)(1) The registrant’s board of trustees has determined that the registrant has at least one audit committee financial expert serving on the audit committee.
(a)(2) The audit committee financial experts are Eric Sussman, Lawry Meister, John Graham and Victoria B. Rogers. Each audit committee financial expert is independent as defined in Form N-CSR Item 3(a)(2).
| Item 4. | Principal Accountant Fees and Services. |
Aggregate fees billed to the registrant for professional services rendered by the registrant’s principal accountant for the fiscal years ended September 30, 2015 and 2014 were as follows:
| | | | | | | | |
| | | | | 2015 | | | | 2014 |
| (a) | | Audit Fees | | $134,460 | | | | $188,960 |
| (b) | | Audit-Related Fees | | None | | | | None |
| (c) | | Tax Fees(1) | | $129,000 | | | | $41,848 |
| (d) | | All Other Fees | | None | | | | None |
Note:
| (1) | Tax fees include amounts related to tax return and excise tax calculation reviews and foreign tax reclaim services. |
(e)(1) The registrant’s audit committee has adopted a charter that requires it to pre-approve the engagement of auditors to (i) audit the registrant’s financial statements, (ii) provide other audit or non-audit services to the registrant, or (iii) provide non-audit services to the registrant’s investment adviser if the engagement relates directly to the operations and financial reporting of the registrant.
(e)(2) No services included in paragraphs (b) through (d) of this Item were approved by the audit committee pursuant to paragraph (c)(7)(i)(C) of Rule 2-01 of Regulation S-X.
(f) Not applicable.
(g) For the fiscal year ended September 30, 2015, the aggregate non-audit fees billed by the registrant’s accountant for services rendered to the registrant and the registrant’s investment adviser were $162,980. For the fiscal year ended September 30, 2014, the aggregate non-audit fees billed by the registrant’s accountant for services rendered to the registrant and the registrant’s investment adviser were $340,363.
(h) The audit committee considered whether the provision of non-audit services rendered to the registrant’s investment adviser by the registrant’s principal accountant that were not pre-approved pursuant to paragraph (c)(7)(ii) of Rule 2-01 of Regulation S-X was compatible with maintaining the principal accountant’s independence.
| Item 5. | Audit Committee of Listed Registrants. |
Not applicable to open-end management investment companies.
| Item 6. | Schedule of Investments |
See Item 1.
| Item 7. | Disclosure of Proxy Voting Policies and Procedures for Closed-End Management Investment Companies. |
Not applicable to open-end management investment companies.
| Item 8. | Portfolio Managers of Closed-End Management Investment Companies |
Not applicable to open-end management investment companies.
| Item 9. | Purchases of Equity Securities by Closed-End Management Investment Company and Affiliated Purchasers. |
Not applicable to open-end management investment companies.
| Item 10. | Submission of Matters to a Vote of Security Holders. |
There have been no material changes to the registrant’s procedures by which shareholders may recommend nominees to the registrant’s board of trustees since the registrant’s last filing on Form N-CSR.
| Item 11. | Controls and Procedures. |
(a) The certifying officers, whose certifications are included herewith, have evaluated the registrant’s disclosure controls and procedures within 90 days of the filing date of this report. In their opinion, based on their evaluation, the registrant’s disclosure controls and procedures are adequately designed, and are operating effectively to ensure, that information required to be disclosed by the registrant in the reports it files or submits under the Securities Exchange Act of 1934 is recorded, processed, summarized and reported within the time periods specified in the Securities and Exchange Commission’s rules and forms.
(b) There were no changes in the registrant’s internal control over financial reporting that occurred during the registrant’s second fiscal quarter of the period covered by this report that have materially affected, or are reasonably likely to materially affect, the registrant’s internal control over financial reporting.
(a)(1) Code of Ethics attached hereto.
(a)(2) Separate certifications for the principal executive officer and the principal financial officer of the registrant as required by Rule 30a-2(a) under the Investment Company Act of 1940 (17 CFR 270.30a-2(a)) are filed herewith.
(b) Officer certifications as required by Rule 30a-2(b) under the Investment Company Act of 1940 (17 CFR 270.30a-2(b)) also accompany this filing as an exhibit.
SIGNATURES
Pursuant to the requirements of the Securities Exchange Act of 1934 and the Investment Company Act of 1940, the registrant has duly caused this report to be signed on its behalf by the undersigned, thereunto duly authorized.
| | | | | | |
| (Registrant) | | | | | | Causeway Capital Management Trust |
| | | |
By (Signature and Title)* | | | | | | /s/ Turner Swan |
| | | | | | Turner Swan, President |
Date: December 4, 2015
Pursuant to the requirements of the Securities Exchange Act of 1934 and the Investment Company Act of 1940, this report has been signed below by the following persons on behalf of the registrant and in the capacities and on the dates indicated.
| | | | | | |
By (Signature and Title)* | | | | | | /s/ Turner Swan |
| | | | | | Turner Swan, President |
Date: December 4, 2015
| | | | | | |
By (Signature and Title)* | | | | | | /s/ Eric Kleinschmidt |
| | | | | | Eric Kleinschmidt, Treasurer |
Date: December 4, 2015
| * | Print the name and title of each signing officer under his or her signature. |