UNITED STATES
SECURITIES AND EXCHANGE COMMISSION
Washington, D.C. 20549
FORM N-CSR
CERTIFIED SHAREHOLDER REPORT OF REGISTERED
MANAGEMENT INVESTMENT COMPANIES
Investment Company Act File Number 811-10467
Causeway Capital Management Trust
(Exact name of registrant as specified in charter)
11111 Santa Monica Boulevard, 15th Floor
Los Angeles, CA 90025
(Address of principal executive offices) (Zip code)
SEI Investments Global Funds Services
One Freedom Valley Drive
Oaks, PA 19456
(Name and address of agent for service)
Registrant’s telephone number, including area code: 1-866-947-7000
Date of fiscal year end: September 30, 2015
Date of reporting period: September 30, 2015
| Item 1. | Reports to Stockholders. |
TABLE OF CONTENTS
LETTER TO SHAREHOLDERS
For the fiscal year ended September 30, 2015, Causeway International Opportunities Fund’s (the “Fund’s”) Institutional Class returned -11.83% and Investor Class returned -12.11% compared to the MSCI All Country World Index ex US (Gross) (“ACWI ex US Index”) return of -11.78%. Since the Fund’s inception on December 31, 2009, its average annual total returns are 4.77% for the Institutional Class and 4.50% for the Investor Class compared to the ACWI ex US Index’s average annual total return of 2.68%. At fiscal year-end, the Fund had net assets of $118.9 million.
During the fiscal year, on October 15, 2014, the Fund restructured from a “fund of funds” that allocated substantially all of its assets in Causeway International Value Fund (the “Value Fund”) and Causeway Emerging Markets Fund (the “EM Fund,” and together the “underlying funds”) to a fund making direct investments in securities. References to holdings and industries relating to periods prior to October 15, 2014 are based on the underlying funds in proportion to the Fund’s holdings.
Performance Review
Low interest rates, abundant liquidity, competitive currency devaluations and renewed optimism for Europe and Japan could not overcome concerns of weakening global growth, the Greek debt crisis, uncertainty about the strength of the Chinese economy, the timing of a shift in the U.S. Federal Reserve Bank’s (Fed’s) monetary policy, and concerns of a U.S. government shutdown. These competing forces pressured developed equity markets during the fiscal year. No sectors posted positive returns over the fiscal year, though the consumer staples and health care sectors delivered the least negative performance. Companies in the energy and materials sectors were the worst performers, with double digit losses. The top performing markets for the period included Ireland, Denmark, Hungary, Israel, and Belgium. The weakest markets for the period included Greece, Kazakhstan, Colombia, Brazil, and Norway. Most foreign currencies declined against the U.S. dollar during the fiscal year, providing additional headwinds to U.S. dollar-based investors.
Emerging markets equities fell sharply over the fiscal year. Stability in U.S. economic growth contrasted sharply with weak growth expectations in China, tempering expectations of a global economic upswing. Emerging markets as a whole largely detracted from overall performance, particularly with weakness in the emerging Asia region. Not surprisingly, Greece was a challenging market during the fiscal year, as fears of its exit from the Eurozone nearly reached a tipping point.
For the developed markets portion of the portfolio, Fund holdings in the automobiles & components, technology hardware & equipment, insurance, food beverage & tobacco, and utilities industry groups detracted the most from the Fund’s performance relative to the ACWI ex US Index. Holdings in the materials, transportation, banks, consumer services, and telecommunication services industry groups helped to offset some of the relative underperformance. The largest individual detractor from performance was automobile manufacturer, Volkswagen AG (Germany). Revelations that the company deliberately installed a defeat device to circumvent U.S. Environmental Protection Agency (EPA)
| | | | |
| 2 | | Causeway International Opportunities Fund | | |
emissions testing reduced its market capitalization by approximately 40% as investors sold shares on the news. Additional top detractors included oil exploration & production company, Baytex Energy (Canada), electrical & electronic equipment manufacturer, Hitachi Ltd. (Japan), energy services firm, Technip SA (France), and banking & financial services provider, HSBC Holdings Plc (United Kingdom). The top individual contributor to return was multinational airline holding company, International Consolidated Airlines Group SA (United Kingdom). Additional top contributors included cruise ship operator, Carnival (United Kingdom), print & publishing company, RELX NV (Netherlands), telecommunication services provider, KDDI Corp. (Japan), and paints & coatings producer, Akzo Nobel NV (Netherlands).
We use a combination of stock-specific factors and top-down analysis to rank the stocks in the emerging markets portion of our investable universe. Our alpha — meaning, for the emerging markets portion, return in excess of the MSCI Emerging Markets Index (“EM Index”) — forecasting factors played a critical role navigating the markets over the fiscal year. With the exception of our sector factor, every other factor posted positive performance relative to the EM Index during the fiscal year — led by strong relative performance from our macroeconomic, currency, and earnings growth factors. Our bottom-up value factors, which have the greatest influence on our stock ranking process, also finished the fiscal year with positive performance. In addition to the previously-mentioned earnings growth factor strength, the technical indicators factor augmented the generally flat relative returns from our value factor. Over the period, particularly in down markets, investors focused on the health of developing economies, preferring characteristics favored by our macroeconomic factors: current account surpluses, low real interest rates and robust fiscal positions. Our currency factors helped reduce the Fund’s exposure to high-inflation currencies that are sensitive to external shocks. Finally, our country factor performance was also accretive to relative performance.
Stock selection drove the emerging markets portfolio’s excess return compared to the EM Index. Holdings in China, Brazil, India, Malaysia, and Indonesia were the top country-level contributors to relative return. Holdings in South Korea, United Arab Emirates, Thailand, Philippines, and the Czech Republic detracted from relative performance. From a sector perspective, the top contributors to relative outperformance were positions in the industrials, materials, and financials sectors. Holdings in the information technology and utilities sectors, as well as an overweight position in the energy sector, detracted from relative performance in the emerging markets portfolio. The top individual contributors to relative performance in the emerging markets portfolio were overweight positions in construction group, China Communications Construction Co. Ltd. (China), transportation systems construction company, China Railway Group Ltd. (China), and technology design & manufacturing company, Pegatron Corp. (Taiwan). The top detractor from relative performance was an underweight position in internet gaming company, Tencent Holdings (China). Overweight positions in bank, Banco do Brasil SA (Brazil) and state-owned oil & gas company, PTT Public Company (Thailand) also detracted.
| | | | | | |
| | | Causeway International Opportunities Fund | | | 3 | |
Significant Portfolio Changes
Our disciplined purchase and sale process led the portfolio management team to reduce exposure to several holdings that reached fair value in our view. Besides the Value Fund and EM Fund sales related to the restructuring, the largest full sales during the fiscal year included luxury automobile & truck manufacturer, Daimler AG (Germany), metals & mining company, Rio Tinto Plc (United Kingdom), home improvement retailer, Kingfisher Plc (United Kingdom), oil & gas exploration company, BG Group Plc (United Kingdom), and construction & mining equipment manufacturer, Komatsu Ltd. (Japan). Significant purchases this fiscal year (outside of the rebalancing that took place during the Fund restructuring) included utilities provider, SSE Plc (United Kingdom), pharmaceutical & consumer healthcare company, GlaxoSmithKline Plc (United Kingdom), automobile manufacturer, Volkswagen AG (Germany), major passenger railway operator, East Japan Railway Co. (Japan), and alcoholic beverage distributor, Diageo Plc (United Kingdom). With the exception of East Japan Railway Co., all of these securities represented new purchases for the Fund.
The Fund’s weights in the utilities, food beverage & tobacco, and pharmaceuticals & biotechnology industry groups increased the most compared to the beginning of the fiscal year, while weights in the capital goods, materials, and telecommunication services industry groups experienced the greatest decrease. From a regional perspective, the most notable weight changes included higher exposure to companies listed in the United Kingdom, Spain, and South Korea. The most significantly reduced country weights included China, Singapore, and Taiwan. At the end of the fiscal year, the three largest industry group exposures (absolute weights) in the Fund were in banks, pharmaceutical & biotechnology, and energy.
Equity Allocation Model Update
We use a proprietary quantitative equity allocation model that assists the portfolio managers in determining the weight of emerging versus developed markets in the Fund. We identify five primary factors as most indicative of the ideal allocation target: valuation, financial strength, macroeconomic, earnings growth, and risk aversion. Currently, we are modestly underweight relative to the weight of emerging markets in the ACWI ex US Index, having closed much of the gap in recent weeks. Valuation is positive in our model, indicating that emerging markets’ asset class is undervalued when compared with the developed markets’ asset class. Our risk aversion factor concludes that investors’ appetite for risk has decreased, a positive indicator for our model. Our macroeconomic factor, which measures the slope of the global yield curve, is negative on emerging markets. Our financial strength metrics, which include such measures as interest coverage and return on equity, are negative for emerging markets. Finally, our earnings growth factor is negative for emerging markets over the period, indicating that the near-term earnings revisions profile of emerging markets is inferior to that of developed markets.
As of September 30, 2015, the Fund invested 77.3% of its net assets in developed market equities and 19.6% in emerging markets equities, compared to 69.7% of its net assets in the Value Fund and 26.3%
| | | | |
| 4 | | Causeway International Opportunities Fund | | |
in the EM Fund at the beginning of the period. A portion of the reduction in the emerging markets weight was due to sales of South Korean and Chinese companies that were held by the Value Fund prior to the Fund restructuring from a “fund of funds” to directly investing in portfolio securities. Nevertheless, our allocation decision shifted from overweight in emerging markets relative to the ACWI ex US Index to underweight, providing a modest tailwind to relative performance over the fiscal year.
Investment Outlook
Recent underperformance of companies with earnings especially sensitive to economic growth has sustained a substantial valuation gap between “cheap” cyclical and more “expensive” defensive stocks. This past summer, the fear trade appeared to reach an extreme, as Chinese domestic equities swooned like the proverbial canary in a coal mine. Even the mine itself looks imperiled. We appear to have a more sanguine view of global gross domestic product (GDP) than market consensus, and we have found the overwhelmingly greatest upside potential in companies with economically cyclical earnings. Our one-year expectations currently include a modestly rising level of global demand for crude oil, a concerted effort to boost fiscal spending by the Chinese government, and a resulting bottoming of most commodity prices. We believe that developed equity markets will discount a return to reflation many months before such improvement is reflected in the actual economic data. We are most interested in the beneficiaries of an upturn in the U.S. yield curve, such as the highest-quality banks and insurance companies as well as consumer cyclical stocks (especially those likely to benefit from improved consumer spending courtesy of lower energy prices). This partially rosy scenario does depend, however, on some visible effort by the Eurozone and Japanese governments to stimulate weak domestic demand by implementing structural reforms. As the European Central Bank’s Mario Draghi noted last July: “No monetary stimulus, indeed no fiscal stimulus, can be successful unless accompanied by the right structural policies — policies that foster potential growth and instill confidence.”
In the emerging markets portion of the Fund, we believe that diversified alpha exposure is paramount to delivering excess return throughout market cycles, particularly as investor risk tolerances adjust to reflect changing liquidity conditions. The Fund’s use of multiple alpha-ranking factors is a hallmark of our emerging markets’ investment process. Diversification of alpha sources should benefit the Fund’s risk-adjusted long-term returns across changing market regimes.
We thank you for your continued confidence in Causeway International Opportunities Fund.
September 30, 2015
| | | | |
 | |  | |  |
| | |
| Harry W. Hartford | | Sarah H. Ketterer | | James A. Doyle |
| Portfolio Manager | | Portfolio Manager | | Portfolio Manager |
| | | | | | |
| | | Causeway International Opportunities Fund | | | 5 | |
| | | | |
 | |  | |  |
| | |
| Jonathan P. Eng | | Conor Muldoon | | Arjun Jayaraman |
| Portfolio Manager | | Portfolio Manager | | Portfolio Manager |
| | |
 | |  | |  |
| | |
| MacDuff Kuhnert | | Foster Corwith | | Alessandro Valentini |
| Portfolio Manager | | Portfolio Manager | | Portfolio Manager |
| | |
 | |  | | |
| | |
| Joseph Gubler | | Ellen Lee | | |
| Portfolio Manager | | Portfolio Manager | | |
The above commentary expresses the portfolio managers’ views as of the date shown and should not be relied upon by the reader as research or investment advice. These views are subject to change. There is no guarantee that any forecasts made will come to pass.
Investing involves risk including loss of principal. In addition to the normal risks associated with investing, international investments may involve risk of capital loss from unfavorable fluctuation in currency values, from differences in generally accepted accounting principles or from economic or political instability in other nations. Emerging markets involve heightened risks related to the same factors as well as increased volatility and lower trading volume. Diversification does not prevent all investment losses.
| | | | |
| 6 | | Causeway International Opportunities Fund | | |
Comparison of Change in the Value of a $10,000 Investment in Causeway International Opportunities Fund, Investor Class shares versus the MSCI All Country World Index ex US (Gross)
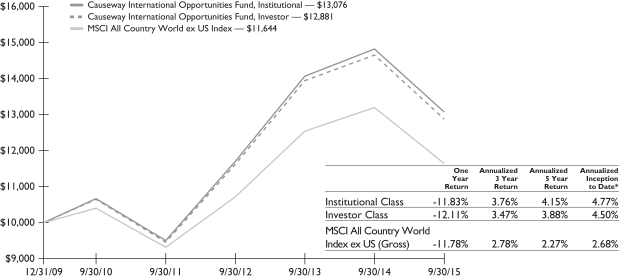
The performance in the above graph does not reflect the deduction of taxes the shareholder will pay on Fund distributions or the redemptions of Fund shares.
* The inception date of Causeway International Opportunities Fund was December 31, 2009. The MSCI All Country World Index ex U.S (Gross) inception to date return is from December 31, 2009.
The performance data represents past performance and is not an indication of future results. Investment return and the principal value of an investment will fluctuate so that an investor’s shares, when redeemed, may be worth less than their original cost and current performance may be higher or lower than the performance quoted. For performance data current to the most recent month end, please call 1-866-947-7000 or visit www.causewayfunds.com. Investment performance reflects expense reimbursements in effect. In the absence of such expense reimbursements, total return would be reduced. The contractual expense limits are in effect until January 31, 2016. Total returns assume reinvestment of dividends and capital gains distributions at net asset value when paid. Investor Class shares pay a shareholder service fee of up to 0.25% per annum of average daily net assets. Institutional Class shares pay no shareholder service fee. For the fiscal year ended September 30, 2015, the Fund’s gross ratios of expenses in relation to net assets were 1.17% and 1.44% for the Institutional Class and Investor Class, respectively. The Fund imposes a 2% redemption fee on the value of shares redeemed less than 60 days after purchase. If your account incurred a redemption fee, your performance will be lower than the performance shown here. For more information, please see the prospectus.
The MSCI All Country World Index ex US (Gross) is a free float-adjusted market capitalization weighted index, designed to measure the equity performance of developed and emerging markets excluding the U.S. market, consisting of 45 country indices. The Index is gross of withholding taxes, assumes reinvestment of dividends and capital gains, and does not reflect the payment of transaction costs, fees and expenses associated with an investment in the Fund. It is not possible to invest directly in an index. There are special risks in foreign investing (please see Note 5 in the Notes to Financial Statements).
MSCI has not approved, reviewed or produced this report, makes no express or implied warranties or representations, and is not liable whatsoever for any data in this report. You may not redistribute the MSCI data or use it as a basis for other indices or investment products.
| | | | | | |
| | | Causeway International Opportunities Fund | | | 7 | |
SCHEDULE OF INVESTMENTS (000)*
September 30, 2015
| | | | | | | | |
| Causeway International Opportunities Fund | | Number of Shares | | | Value | |
COMMON STOCK | | | | | | | | |
| Australia — 0.6% | | | | | | |
Westfield Corp.1 | | | 97,251 | | | $ | 684 | |
| | | | | | | | |
| Belgium — 0.6% | | | | | | |
KBC Groep NV | | | 11,036 | | | | 698 | |
| | | | | | | | |
| Brazil — 1.0% | | | | | | |
Banco do Brasil SA | | | 44,900 | | | | 170 | |
BTG Pactual Group | | | 30,000 | | | | 199 | |
Cia De Bebidas Das Americas ADR | | | 67,800 | | | | 332 | |
JBS SA | | | 88,500 | | | | 375 | |
Light SA | | | 13,700 | | | | 40 | |
Porto Seguro SA | | | 6,900 | | | | 52 | |
| | | | | | | | |
| | | | | | | 1,168 | |
| | | | | | | | |
| Canada — 1.5% | | | | | | |
Baytex Energy Corp. | | | 107,663 | | | | 344 | |
Imperial Oil Ltd. | | | 43,830 | | | | 1,389 | |
| | | | | | | | |
| | | | | | | 1,733 | |
| | | | | | | | |
| China — 4.6% | | | | | | |
Bank of China Ltd., Class H | | | 1,319,000 | | | | 569 | |
Belle International Holdings Ltd. | | | 145,000 | | | | 126 | |
Changyou.com Ltd. ADR2 | | | 3,100 | | | | 55 | |
China Communications Construction Co. Ltd., Class H | | | 171,000 | | | | 212 | |
China Construction Bank Corp., Class H | | | 575,000 | | | | 384 | |
China Everbright Bank Co. Ltd., Class H | | | 520,000 | | | | 227 | |
China Lumena New Materials Corp.2,3 | | | 196,000 | | | | — | |
China Mobile Ltd. ADR | | | 9,800 | | | | 583 | |
China Petroleum & Chemical Corp., Class H | | | 952,000 | | | | 583 | |
China Railway Construction Corp. Ltd., Class H | | | 122,000 | | | | 181 | |
China Railway Group Ltd., Class H | | | 106,000 | | | | 97 | |
China Southern Airlines Co. Ltd., Class H | | | 148,000 | | | | 109 | |
Datang International Power Generation Co. Ltd., Class H | | | 140,000 | | | | 53 | |
Dongfeng Motor Group Co. Ltd., Class H | | | 50,000 | | | | 63 | |
The accompanying notes are an integral part of the financial statements.
| | | | |
| 8 | | Causeway International Opportunities Fund | | |
SCHEDULE OF INVESTMENTS (000)* (continued)
September 30, 2015
| | | | | | | | |
| Causeway International Opportunities Fund | | Number of Shares | | | Value | |
| China — (continued) | | | | | | |
Great Wall Motor Co. Ltd., Class H | | | 21,000 | | | $ | 23 | |
Guangzhou R&F Properties Co. Ltd., Class H | | | 160,800 | | | | 146 | |
Huabao International Holdings Ltd. | | | 108,000 | | | | 34 | |
Industrial & Commercial Bank of China, Class H | | | 254,000 | | | | 147 | |
JA Solar Holdings Co. Ltd. ADR2 | | | 10,900 | | | | 85 | |
Jiangnan Group Ltd. | | | 320,000 | | | | 66 | |
JinkoSolar Holding Co. Ltd. ADR2 | | | 6,300 | | | | 138 | |
KWG Property Holding Ltd. | | | 103,000 | | | | 68 | |
NetEase Inc. ADR | | | 800 | | | | 96 | |
PetroChina Co. Ltd., Class H | | | 94,000 | | | | 66 | |
PICC Property & Casualty Co. Ltd., Class H | | | 28,000 | | | | 55 | |
Poly Property Group Co. Ltd. | | | 113,000 | | | | 31 | |
Shenzhen Investment Ltd. | | | 424,000 | | | | 151 | |
Sihuan Pharmaceutical Holdings Group Ltd.3 | | | 247,000 | | | | 61 | |
Skyworth Digital Holdings Ltd. | | | 344,000 | | | | 234 | |
Tencent Holdings Ltd. | | | 30,500 | | | | 514 | |
WuXi PharmaTech Cayman Inc. ADR2 | | | 3,500 | | | | 151 | |
Zhejiang Expressway Co. Ltd., Class H | | | 154,000 | | | | 168 | |
| | | | | | | | |
| | | | | | | 5,476 | |
| | | | | | | | |
| Czech Republic — 0.2% | | | | | | |
CEZ AS | | | 9,032 | | | | 188 | |
| | | | | | | | |
| France — 12.8% | | | | | | |
AXA SA | | | 24,050 | | | | 584 | |
BNP Paribas SA | | | 32,835 | | | | 1,933 | |
Engie SA | | | 132,911 | | | | 2,150 | |
Legrand SA | | | 36,764 | | | | 1,956 | |
Sanofi-Aventis SA | | | 29,243 | | | | 2,784 | |
Schneider Electric SE | | | 35,036 | | | | 1,962 | |
Technip SA | | | 31,203 | | | | 1,477 | |
Total SA | | | 53,157 | | | | 2,391 | |
| | | | | | | | |
| | | | | | | 15,237 | |
| | | | | | | | |
The accompanying notes are an integral part of the financial statements.
| | | | | | |
| | | Causeway International Opportunities Fund | | | 9 | |
SCHEDULE OF INVESTMENTS (000)* (continued)
September 30, 2015
| | | | | | | | |
| Causeway International Opportunities Fund | | Number of Shares | | | Value | |
| Germany — 4.3% | | | | | | |
Bayer AG | | | 13,236 | | | $ | 1,698 | |
Linde AG | | | 12,508 | | | | 2,032 | |
SAP SE | | | 21,877 | | | | 1,417 | |
| | | | | | | | |
| | | | | | | 5,147 | |
| | | | | | | | |
| India — 1.1% | | | | | | |
Dr Reddy’s Laboratories Ltd. ADR | | | 8,400 | | | | 537 | |
ICICI Bank Ltd. ADR | | | 56,300 | | | | 472 | |
Infosys Ltd. ADR | | | 8,700 | | | | 166 | |
Tata Motors Ltd. ADR2 | | | 4,200 | | | | 94 | |
| | | | | | | | |
| | | | | | | 1,269 | |
| | | | | | | | |
| Indonesia — 0.2% | | | | | | |
Adhi Karya Persero Tbk PT | | | 388,400 | | | | 60 | |
Bank Negara Indonesia Persero Tbk PT | | | 181,400 | | | | 51 | |
Indofood Sukses Makmur Tbk PT | | | 235,600 | | | | 89 | |
Kalbe Farma Tbk PT | | | 331,000 | | | | 31 | |
| | | | | | | | |
| | | | | | | 231 | |
| | | | | | | | |
| Ireland — 0.6% | | | | | | |
Ryanair Holdings PLC ADR | | | 9,700 | | | | 759 | |
| | | | | | | | |
| Japan — 12.1% | | | | | | |
East Japan Railway Co. | | | 31,200 | | | | 2,629 | |
Hitachi Ltd. | | | 453,000 | | | | 2,286 | |
KDDI Corp. | | | 129,600 | | | | 2,901 | |
Nikon Corp. | | | 139,000 | | | | 1,681 | |
Shin-Etsu Chemical Co. Ltd. | | | 20,800 | | | | 1,067 | |
Sumitomo Mitsui Financial Group Inc. | | | 42,300 | | | | 1,604 | |
Toyota Motor Corp. | | | 36,900 | | | | 2,160 | |
| | | | | | | | |
| | | | | | | 14,328 | |
| | | | | | | | |
| Malaysia — 0.1% | | | | | | |
UMW Holdings Bhd | | | 49,100 | | | | 84 | |
| | | | | | | | |
The accompanying notes are an integral part of the financial statements.
| | | | |
| 10 | | Causeway International Opportunities Fund | | |
SCHEDULE OF INVESTMENTS (000)* (continued)
September 30, 2015
| | | | | | | | |
| Causeway International Opportunities Fund | | Number of Shares | | | Value | |
| Mexico — 0.4% | | | | | | |
Alfa SAB de CV, Class A | | | 45,900 | | | $ | 89 | |
Arca Continental SAB de CV | | | 23,300 | | | | 131 | |
Gruma SAB de CV, Class B | | | 6,200 | | | | 85 | |
Kimberly-Clark de Mexico SAB de CV, Class A | | | 86,500 | | | | 196 | |
| | | | | | | | |
| | | | | | | 501 | |
| | | | | | | | |
| Netherlands — 6.9% | | | | | | |
Akzo Nobel NV | | | 55,050 | | | | 3,580 | |
PostNL NV2 | | | 202,395 | | | | 740 | |
RELX NV | | | 212,746 | | | | 3,476 | |
Unilever NV | | | 11,052 | | | | 443 | |
| | | | | | | | |
| | | | | | | 8,239 | |
| | | | | | | | |
| Philippines — 0.1% | | | | | | |
Megaworld Corp. | | | 444,000 | | | | 42 | |
Universal Robina Corp. | | | 17,060 | | | | 70 | |
| | | | | | | | |
| | | | | | | 112 | |
| | | | | | | | |
| Poland — 0.7% | | | | | | |
PGE Polska Grupa Energetyczna SA | | | 53,239 | | | | 189 | |
Polski Koncern Naftowy Orlen SA | | | 18,135 | | | | 317 | |
Powszechny Zaklad Ubezpieczen SA | | | 2,947 | | | | 302 | |
Tauron Polska Energia SA | | | 73,832 | | | | 64 | |
| | | | | | | | |
| | | | | | | 872 | |
| | | | | | | | |
| Qatar — 0.1% | | | | | | |
Barwa Real Estate Co. | | | 12,506 | | | | 147 | |
| | | | | | | | |
| Russia — 0.8% | | | | | | |
Gazprom PAO ADR | | | 60,855 | | | | 246 | |
Lukoil PJSC ADR | | | 8,116 | | | | 276 | |
PhosAgro OAO GDR | | | 8,735 | | | | 121 | |
Sberbank of Russia ADR | | | 3,023 | | | | 15 | |
Surgutneftegas OAO ADR | | | 52,983 | | | | 271 | |
| | | | | | | | |
| | | | | | | 929 | |
| | | | | | | | |
The accompanying notes are an integral part of the financial statements.
| | | | | | |
| | | Causeway International Opportunities Fund | | | 11 | |
SCHEDULE OF INVESTMENTS (000)* (continued)
September 30, 2015
| | | | | | | | |
| Causeway International Opportunities Fund | | Number of Shares | | | Value | |
| South Africa — 1.0% | | | | | | |
FirstRand Ltd. | | | 69,379 | | | $ | 247 | |
Liberty Holdings Ltd. | | | 3,779 | | | | 35 | |
MMI Holdings Ltd. | | | 105,720 | | | | 182 | |
Redefine Properties Ltd.1 | | | 54,984 | | | | 46 | |
Sanlam Ltd. | | | 42,832 | | | | 185 | |
Sibanye Gold Ltd. | | | 70,606 | | | | 80 | |
Steinhoff International Holdings Ltd. | | | 43,785 | | | | 269 | |
Vodacom Group Ltd. | | | 15,706 | | | | 156 | |
| | | | | | | | |
| | | | | | | 1,200 | |
| | | | | | | | |
| South Korea — 3.4% | | | | | | |
Amorepacific Corp. | | | 869 | | | | 283 | |
BNK Financial Group Inc. | | | 5,788 | | | | 67 | |
CJ Corp. | | | 857 | | | | 191 | |
Daesang Corp. | | | 1,688 | | | | 44 | |
GS Retail Co. Ltd. | | | 3,800 | | | | 196 | |
Hanwha Corp. | | | 2,638 | | | | 87 | |
Heung-A Shipping Co. Ltd., Class A | | | 28,071 | | | | 51 | |
Hyosung Corp. | | | 2,249 | | | | 215 | |
Hyundai Marine & Fire Insurance Co. Ltd. | | | 6,475 | | | | 165 | |
KB Financial Group Inc. | | | 6,149 | | | | 183 | |
Kia Motors Corp. | | | 5,404 | | | | 245 | |
Korea Electric Power Corp. | | | 11,858 | | | | 489 | |
KT&G Corp. | | | 3,991 | | | | 376 | |
LG Display Co. Ltd. | | | 12,027 | | | | 230 | |
NongShim Co. Ltd. | | | 400 | | | | 124 | |
Samsung Electronics Co. Ltd. | | | 910 | | | | 873 | |
SK Hynix Inc. | | | 3,788 | | | | 108 | |
SK Telecom Co. Ltd. ADR | | | 3,500 | | | | 86 | |
Tovis Co. Ltd. | | | 6,555 | | | | 55 | |
Woori Bank | | | 3,585 | | | | 28 | |
| | | | | | | | |
| | | | | | | 4,096 | |
| | | | | | | | |
The accompanying notes are an integral part of the financial statements.
| | | | |
| 12 | | Causeway International Opportunities Fund | | |
SCHEDULE OF INVESTMENTS (000)* (continued)
September 30, 2015
| | | | | | | | |
| Causeway International Opportunities Fund | | Number of Shares | | | Value | |
| Spain — 1.8% | | | | | | |
CaixaBank SA | | | 406,710 | | | $ | 1,570 | |
Tecnicas Reunidas SA | | | 12,442 | | | | 551 | |
| | | | | | | | |
| | | | | | | 2,121 | |
| | | | | | | | |
| Switzerland — 11.2% | | | | | | |
Aryzta AG2 | | | 27,635 | | | | 1,171 | |
Cie Financiere Richemont SA | | | 18,175 | | | | 1,414 | |
Clariant AG | | | 58,896 | | | | 992 | |
Credit Suisse Group AG | | | 22,105 | | | | 531 | |
Givaudan SA | | | 278 | | | | 452 | |
Novartis AG | | | 26,641 | | | | 2,449 | |
Roche Holding AG | | | 8,217 | | | | 2,181 | |
UBS Group AG | | | 132,489 | | | | 2,450 | |
Zurich Insurance Group AG | | | 7,000 | | | | 1,719 | |
| | | | | | | | |
| | | | | | | 13,359 | |
| | | | | | | | |
| Taiwan — 2.4% | | | | | | |
Chicony Electronics Co. Ltd. | | | 43,215 | | | | 100 | |
Chong Hong Construction Co. Ltd. | | | 21,000 | | | | 27 | |
Compal Electronics Inc. | | | 119,000 | | | | 68 | |
Coretronic Corp. | | | 83,000 | | | | 75 | |
Fubon Financial Holding Co. Ltd. | | | 19,000 | | | | 30 | |
HON HAI Precision Industry Co. Ltd. | | | 238,150 | | | | 622 | |
Innolux Corp. | | | 473,000 | | | | 148 | |
Inventec Corp. | | | 134,000 | | | | 64 | |
Lite-On Technology Corp. | | | 94,470 | | | | 87 | |
MediaTek Inc. | | | 8,000 | | | | 60 | |
Pegatron Corp. | | | 171,000 | | | | 418 | |
Pou Chen Corp. | | | 39,000 | | | | 59 | |
Powertech Technology Inc. | | | 73,000 | | | | 132 | |
President Chain Store Corp. | | | 8,000 | | | | 50 | |
Ruentex Development Co. Ltd. | | | 84,000 | | | | 92 | |
Taiwan PCB Techvest Co. Ltd. | | | 83,000 | | | | 87 | |
Taiwan Semiconductor Manufacturing Co. Ltd. ADR | | | 21,600 | | | | 448 | |
The accompanying notes are an integral part of the financial statements.
| | | | | | |
| | | Causeway International Opportunities Fund | | | 13 | |
SCHEDULE OF INVESTMENTS (000)* (continued)
September 30, 2015
| | | | | | | | |
| Causeway International Opportunities Fund | | Number of Shares | | | Value | |
| Taiwan — (continued) | | | | | | |
Wan Hai Lines Ltd. | | | 108,000 | | | $ | 68 | |
Wistron Corp. | | | 65,967 | | | | 34 | |
WPG Holdings Ltd. | | | 163,000 | | | | 158 | |
| | | | | | | | |
| | | | | | | 2,827 | |
| | | | | | | | |
| Thailand — 0.8% | | | | | | |
Bangchak Petroleum PCL | | | 126,700 | | | | 120 | |
Bangkok Dusit Medical Services PCL | | | 439,300 | | | | 224 | |
Bangkok Expressway PCL | | | 122,400 | | | | 123 | |
PTT PCL | | | 47,000 | | | | 312 | |
Sansiri PCL | | | 1,085,400 | | | | 51 | |
Thanachart Capital PCL | | | 73,400 | | | | 64 | |
| | | | | | | | |
| | | | | | | 894 | |
| | | | | | | | |
| Turkey — 0.8% | | | | | | |
Emlak Konut Gayrimenkul Yatirim Ortakligi AS1 | | | 60,444 | | | | 50 | |
Eregli Demir ve Celik Fabrikalari TAS | | | 101,780 | | | | 126 | |
Ford Otomotiv Sanayi AS | | | 4,179 | | | | 45 | |
Kardemir Karabuk Demir Celik Sanayi ve Ticaret AS, Class D2 | | | 107,241 | | | | 44 | |
TAV Havalimanlari Holding AS | | | 16,809 | | | | 132 | |
Tupras Turkiye Petrol Rafinerileri AS | | | 19,395 | | | | 475 | |
Turk Traktor ve Ziraat Makineleri AS | | | 2,759 | | | | 67 | |
| | | | | | | | |
| | | | | | | 939 | |
| | | | | | | | |
| United Arab Emirates — 0.4% | | | | | | |
DAMAC Properties Dubai Co. PJSC | | | 220,000 | | | | 183 | |
Dubai Islamic Bank PJSC | | | 78,159 | | | | 143 | |
Emaar Properties PJSC | | | 39,592 | | | | 70 | |
First Gulf Bank PJSC | | | 31,141 | | | | 119 | |
| | | | | | | | |
| | | | | | | 515 | |
| | | | | | | | |
| United Kingdom — 22.2% | | | | | | |
Aviva PLC | | | 382,173 | | | | 2,614 | |
The accompanying notes are an integral part of the financial statements.
| | | | |
| 14 | | Causeway International Opportunities Fund | | |
SCHEDULE OF INVESTMENTS (000)* (continued)
September 30, 2015
| | | | | | | | |
| Causeway International Opportunities Fund | | Number of Shares | | | Value | |
| United Kingdom — (continued) | | | | | | |
Balfour Beatty PLC | | | 282,889 | | | $ | 1,077 | |
Barclays PLC | | | 613,083 | | | | 2,269 | |
British American Tobacco PLC | | | 59,034 | | | | 3,257 | |
Carnival PLC | | | 34,339 | | | | 1,777 | |
Diageo PLC | | | 64,010 | | | | 1,720 | |
GlaxoSmithKline PLC | | | 133,183 | | | | 2,556 | |
HSBC Holdings PLC | | | 319,200 | | | | 2,397 | |
International Consolidated Airlines Group SA2 | | | 170,491 | | | | 1,523 | |
Lloyds Banking Group PLC | | | 1,786,782 | | | | 2,034 | |
Michael Page International PLC | | | 90,457 | | | | 650 | |
SSE PLC | | | 122,449 | | | | 2,771 | |
Vodafone Group PLC | | | 569,722 | | | | 1,797 | |
| | | | | | | | |
| | | | | | | 26,442 | |
| | | | | | | | |
Total Common Stock | | | | | | | | |
(Cost $119,805) — 92.7% | | | | | | | 110,195 | |
| | | | | | | | |
PREFERRED STOCK | | | | | | | | |
| Germany — 1.6% | | | | | | |
Volkswagen AG | | | 17,573 | | | | 1,931 | |
| | | | | | | | |
Total Preferred Stock | | | | | | | | |
(Cost $3,896) — 1.6% | | | | | | | 1,931 | |
| | | | | | | | |
EXCHANGE TRADED FUND | | | | | | | | |
WisdomTree India Earnings Fund | | | 52,800 | | | | 1,052 | |
| | | | | | | | |
Total Exchange Traded Fund | | | | | | | | |
(Cost $1,065) — 0.9% | | | | | | | 1,052 | |
| | | | | | | | |
PREFERENCE STOCK | | | | | | | | |
| Brazil — 0.3% | | | | | | |
Bradespar SA | | | 19,300 | | | | 40 | |
Cia Energetica de Minas Gerais | | | 17,800 | | | | 31 | |
Cia Energetica de Sao Paulo | | | 12,200 | | | | 47 | |
Cia Paranaense de Energia | | | 11,200 | | | | 93 | |
The accompanying notes are an integral part of the financial statements.
| | | | | | |
| | | Causeway International Opportunities Fund | | | 15 | |
SCHEDULE OF INVESTMENTS (000)* (concluded)
September 30, 2015
| | | | | | | | |
| Causeway International Opportunities Fund | | Number of Shares | | | Value | |
| Brazil — (continued) | | | | | | |
Itausa — Investimentos Itau SA | | | 34,830 | | | $ | 63 | |
Petroleo Brasileiro SA, Class A ADR2 | | | 31,200 | | | | 115 | |
Vale SA, Class B ADR | | | 6,400 | | | | 21 | |
| | | | | | | | |
| | | | | | | 410 | |
| | | | | | | | |
| South Korea — 0.1% | | | | | | |
LG Chemical Ltd. | | | 370 | | | | 59 | |
| | | | | | | | |
Total Preference Stock | | | | | | | | |
(Cost $782) — 0.4% | | | | | | | 469 | |
| | | | | | | | |
SHORT-TERM INVESTMENT | | | | | | | | |
Dreyfus Cash Management,
Institutional Class, 0.050%** | | | 3,562,461 | | | | 3,562 | |
| | | | | | | | |
Total Short-Term Investment | | | | | | | | |
(Cost $3,562) — 3.0% | | | | | | | 3,562 | |
| | | | | | | | |
Total Investments — 98.6% | | | | | | | | |
(Cost $129,110) | | | | | | | 117,209 | |
| | | | | | | | |
Other Assets in Excess of Liabilities — 1.4% | | | | | | | 1,647 | |
| | | | | | | | |
Net Assets — 100.0% | | | | | | $ | 118,856 | |
| | | | | | | | |
| ** | The rate reported is the 7-day effective yield as of September 30, 2015. |
| 1 | Real Estate Investment Trust. |
| 2 | Non-income producing security. |
| 3 | Securities considered illiquid. The total market value of such securities as of September 30, 2015 was $61 (000) and represented 0.1% of net assets. |
| ADR | American Depositary Receipt |
| GDR | Global Depositary Receipt |
Amounts designated as “—” are $0 or are rounded to $0.
The accompanying notes are an integral part of the financial statements.
| | | | |
| 16 | | Causeway International Opportunities Fund | | |
SECTOR DIVERSIFICATION
As of September 30, 2015, the sector diversification was as follows (Unaudited):
| | | | | | | | | | | | | | | | |
| Causeway International Opportunities Fund | | Common
Stock | | | Preferred
Stock | | | Preference
Stock | | | % of
Net Assets | |
| | | | |
Financials | | | 22.1% | | | | 0.0% | | | | 0.1% | | | | 22.2% | |
| | | | |
Consumer Discretionary | | | 9.9 | | | | 1.6 | | | | 0.0 | | | | 11.5 | |
| | | | |
Health Care | | | 10.7 | | | | 0.0 | | | | 0.0 | | | | 10.7 | |
| | | | |
Energy | | | 9.7 | | | | 0.0 | | | | 0.1 | | | | 9.8 | |
| | | | |
Industrials | | | 9.6 | | | | 0.0 | | | | 0.0 | | | | 9.6 | |
| | | | |
Materials | | | 8.7 | | | | 0.0 | | | | 0.1 | | | | 8.8 | |
| | | | |
Consumer Staples | | | 7.5 | | | | 0.0 | | | | 0.0 | | | | 7.5 | |
| | | | |
Information Technology | | | 7.2 | | | | 0.0 | | | | 0.0 | | | | 7.2 | |
| | | | |
Telecommunication Services | | | 4.6 | | | | 0.0 | | | | 0.0 | | | | 4.6 | |
| | | | |
Utilities | | | 2.7 | | | | 0.0 | | | | 0.1 | | | | 2.8 | |
| | | | | | | | | | | | | | | | |
| Total | | | 92.7 | | | | 1.6 | | | | 0.4 | | | | 94.7 | |
| | | | |
| Exchange Traded Funds | | | | | | | | | | | | | | | 0.9 | |
| | | | | | | | | | | | | | | | |
| Short-Term Investment | | | | | | | | | | | | | | | 3.0 | |
| | | | | | | | | | | | | | | | |
| Other Assets in Excess of Liabilities | | | | | | | | | | | | | | | 1.4 | |
| | | | | | | | | | | | | | | | |
| Net Assets | | | | | | | | | | | | | | | 100.0% | |
| | | | | | | | | | | | | | | | |
The accompanying notes are an integral part of the financial statements.
| | | | | | |
| | | Causeway International Opportunities Fund | | | 17 | |
STATEMENT OF ASSETS AND LIABILITIES (000)*
| | | | |
| | | CAUSEWAY INTERNATIONAL
OPPORTUNITIES
FUND | |
| |
| | | 9/30/15 | |
ASSETS: | | | | |
Investments at Value (Cost $129,110) | | $ | 117,209 | |
Receivable for Fund Shares Sold | | | 1,325 | |
Receivable for Dividends | | | 359 | |
Receivable for Investment Securities Sold | | | 124 | |
Foreign Currency (Cost $62) | | | 62 | |
Receivable for Tax Reclaims | | | 48 | |
Prepaid Expenses | | | 2 | |
| | | | |
Total Assets | | | 119,129 | |
| | | | |
LIABILITIES: | | | | |
Payable for Investment Securities Purchased | | | 73 | |
Payable Due to Adviser | | | 59 | |
Payable for Shareholder Services Fees — Investor Class | | | 3 | |
Payable Due to Administrator | | | 3 | |
Payable for Trustees’ Fees | | | 1 | |
Other Accrued Expenses | | | 134 | |
| | | | |
Total Liabilities | | | 273 | |
| | | | |
Net Assets | | $ | 118,856 | |
| | | | |
NET ASSETS: | | | | |
Paid-in Capital (unlimited authorization — no par value) | | $ | 129,193 | |
Undistributed Net Investment Income | | | 1,496 | |
Accumulated Net Realized Gain on Investments and Foreign Currency Transactions | | | 71 | |
Net Unrealized Depreciation on Investments | | | (11,901 | ) |
Net Unrealized Depreciation on Foreign Currencies and Translation of Other Assets and Liabilities Denominated in Foreign Currencies | | | (3 | ) |
| | | | |
Net Assets | | $ | 118,856 | |
| | | | |
Net Asset Value Per Share (based on net assets of
$115,881,246 ÷ 10,035,356 shares) — Institutional Class | | | $11.55 | |
| | | | |
Net Asset Value Per Share (based on net assets of
$2,975,012 ÷ 259,345 shares) — Investor Class | | | $11.47 | |
| | | | |
| * | Except for Net Asset Value data. |
The accompanying notes are an integral part of the financial statements.
| | | | |
| 18 | | Causeway International Opportunities Fund | | |
STATEMENT OF OPERATIONS (000)
| | | | |
| | | CAUSEWAY INTERNATIONAL
OPPORTUNITIES
FUND | |
| |
| | | 10/01/14 to
9/30/15 | |
INVESTMENT INCOME: | | | | |
Dividend Income (net of foreign taxes withheld of $246) | | $ | 2,466 | |
| | | | |
Total Investment Income | | | 2,466 | |
| | | | |
EXPENSES: | | | | |
Investment Advisory Fees | | | 715 | |
Custodian Fees | | | 134 | |
Transfer Agent Fees | | | 59 | |
Professional Fees | | | 41 | |
Line of Credit | | | 34 | |
Administration Fees | | | 29 | |
Pricing Fees | | | 27 | |
Printing Fees | | | 22 | |
Registration Fees | | | 10 | |
Shareholder Service Fees — Investor Class | | | 6 | |
Trustees’ Fees | | | 4 | |
Other Fees | | | 3 | |
| | | | |
Total Expenses | | | 1,084 | |
| | | | |
LESS: | | | | |
Waiver of Investment Advisory Fees | | | (136 | ) |
| |
Net Expenses | | | 948 | |
| | | | |
Net Investment Income | | | 1,518 | |
| | | | |
Realized and Unrealized Gain (Loss) on Investments, Affiliated Investments and Foreign Currency Transactions: | | | | |
Net Realized Gain on Investments | | | 866 | |
Net Realized Loss on Sale of Affiliated Investments | | | (761 | ) |
Net Realized Loss from Foreign Currency Transactions | | | (2 | ) |
Net Change in Unrealized Depreciation on Investments | | | (11,901 | ) |
Net Change in Unrealized Depreciation on Affiliated Investments | | | (3,791 | ) |
Net Change in Unrealized Depreciation on Foreign Currency and Translation of Other Assets and Liabilities Denominated in Foreign Currency | | | (3 | ) |
| | | | |
Net Realized and Unrealized Loss on Investments, Affiliated Investments and Foreign Currency Transactions: | | | (15,592 | ) |
| | | | |
| Net Decrease in Net Assets Resulting from Operations | | $ | (14,074 | ) |
| | | | |
The accompanying notes are an integral part of the financial statements.
| | | | | | |
| | | Causeway International Opportunities Fund | | | 19 | |
STATEMENTS OF CHANGES IN NET ASSETS (000)
| | | | | | | | |
| | | CAUSEWAY INTERNATIONAL OPPORTUNITIES FUND | |
| | |
| | | 10/01/14 to
9/30/15 | | | 10/01/13 to
9/30/14 | |
OPERATIONS: | | | | | | | | |
Net Investment Income | | $ | 1,518 | | | $ | 405 | |
Net Realized Gain on Investments | | | 866 | | | | — | |
Net Realized Gain (Loss) on Sale of Affiliated Investments | | | (761 | ) | | | 3,047 | |
Net Realized Loss from Foreign Currency Transactions | | | (2 | ) | | | — | |
Net Change in Unrealized Depreciation on Investments | | | (11,901 | ) | | | — | |
Net Change in Unrealized Depreciation on Affiliated Investments | | | (3,791 | ) | | | (2,005 | ) |
Net Change in Unrealized Depreciation on Foreign Currency and Translation of Other Assets and Liabilities Denominated in Foreign Currency | | | (3 | ) | | | — | |
| | | | | | | | |
Net Increase (Decrease) in Net Assets Resulting From Operations | | | (14,074 | ) | | | 1,447 | |
| | | | | | | | |
DIVIDENDS AND DISTRIBUTIONS TO SHAREHOLDERS: | | | | | | | | |
Dividends from Net Investment Income: | | | | | | | | |
Institutional Class | | | — | | | | (405 | ) |
Investor Class | | | — | | | | (12 | ) |
| | | | | | | | |
Total Dividends from Net Investment Income | | | — | | | | (417 | ) |
| | | | | | | | |
Distributions from Net Capital Gains: | | | | | | | | |
Institutional Class | | | (2,926 | ) | | | (237 | ) |
Investor Class | | | (67 | ) | | | (9 | ) |
| | | | | | | | |
Total Distributions from Net Capital Gains | | | (2,993 | ) | | | (246 | ) |
| | | | | | | | |
Total Dividends and Distributions to Shareholders | | | (2,993 | ) | | | (663 | ) |
| | |
Net Increase in Net Assets Derived from Capital Share Transactions(1) | | | 57,736 | | | | 33,243 | |
| | | | | | | | |
Total Increase in Net Assets | | | 40,669 | | | | 34,027 | |
| | | | | | | | |
NET ASSETS: | | | | | | | | |
Beginning of Year | | | 78,187 | | | | 44,160 | |
| | | | | | | | |
End of Year | | $ | 118,856 | | | $ | 78,187 | |
| | | | | | | | |
Undistributed (Distributions in Excess of) Net Investment Income | | $ | 1,496 | | | $ | (35 | ) |
| | | | | | | | |
| (1) | See Note 7 in Notes to Financial Statements. |
Amounts designated as “—” are $0 or round to $0.
The accompanying notes are an integral part of the financial statements.
| | | | |
| 20 | | Causeway International Opportunities Fund | | |
This page intentionally left blank.
FINANCIAL HIGHLIGHTS
For the fiscal years ended September 30,
For a Share Outstanding Throughout the Fiscal Years
| | | | | | | | | | | | | | | | | | | | | | | | | | | | | | | | |
| | | Net Asset Value, Beginning of Year ($) | | | Net Investment Income ($) | | |
Net Realized and Unrealized Gain (Loss) on Investments ($) | | | Total from Operations ($) | | | Dividends from Net Investment Income ($) | | | Distributions from Capital Gains ($) | | | Total Dividends and Distributions ($) | | | Redemption Fees ($) | |
CAUSEWAY INTERNATIONAL OPPORTUNITIES FUND† | |
Institutional | |
2015 | | | 13.61 | | | | 0.21 | | | | (1.78 | ) | | | (1.57 | ) | | | — | | | | (0.49 | ) | | | (0.49 | ) | | | — | (1) |
2014 | | | 13.11 | | | | 0.12 | | | | 0.58 | | | | 0.70 | | | | (0.13 | ) | | | (0.07 | ) | | | (0.20 | ) | | | — | |
2013 | | | 11.15 | | | | 0.24 | | | | 1.99 | | | | 2.23 | | | | (0.25 | ) | | | (0.02 | ) | | | (0.27 | ) | | | — | |
2012 | | | 9.35 | | | | 0.20 | | | | 1.91 | | | | 2.11 | | | | (0.28 | ) | | | (0.03 | ) | | | (0.31 | ) | | | — | |
2011 | | | 10.67 | | | | 0.05 | | | | (1.18 | ) | | | (1.13 | ) | | | (0.19 | ) | | | — | | | | (0.19 | ) | | | — | |
Investor | | | | | | | | | | | | | | | | | | | | | | | | | | | | | |
2015 | | | 13.56 | | | | 0.20 | | | | (1.80 | ) | | | (1.60 | ) | | | — | | | | (0.49 | ) | | | (0.49 | ) | | | — | |
2014 | | | 13.07 | | | | 0.11 | | | | 0.55 | | | | 0.66 | | | | (0.10 | ) | | | (0.07 | ) | | | (0.17 | ) | | | — | |
2013 | | | 11.12 | | | | 0.08 | | | | 2.11 | | | | 2.19 | | | | (0.22 | ) | | | (0.02 | ) | | | (0.24 | ) | | | — | |
2012 | | | 9.32 | | | | 0.10 | | | | 1.98 | | | | 2.08 | | | | (0.25 | ) | | | (0.03 | ) | | | (0.28 | ) | | | — | |
2011 | | | 10.65 | | | | 0.11 | | | | (1.27 | ) | | | (1.16 | ) | | | (0.17 | ) | | | — | | | | (0.17 | ) | | | — | |
| † | Per share amounts calculated using average shares method. |
| (1) | Amount represents less than $0.01 per share. |
| (2) | In October 2014, the Fund converted from a fund of funds to direct investing in securities and, since that time, no longer invests and is no longer subject to the fees and expenses of other Causeway Funds. At the same time, and following shareholder approval of a new investment advisory agreement, the Fund became subject to an investment advisory fee and entered into a new Expense Limit Agreement with the Adviser that limits expenses at a higher level than previously applicable to the Fund. |
| (3) | Portfolio turnover rate includes transactions related to the Fund’s conversion from a fund of funds investing in other Causeway Funds to direct investing in securities in October 2014. |
Amounts designated as “—” are $0 or round to $0.
The accompanying notes are an integral part of the financial statements.
| | | | |
| 22 | | Causeway International Opportunities Fund | | |
| | | | | | | | | | | | | | | | | | | | | | | | | | |
Net Asset Value, End of Year ($) | | | Total Return (%) | | | Net Assets, End of Year ($000) | | | Ratio of Expenses to Average Net Assets (%) | | | Ratio of Expenses to Average Net Assets (Excluding Waivers and Reimburse-
ments) (%) | | | Ratio of Net Investment Income to Average Net Assets (%) | | | Portfolio Turnover Rate (%) | |
| | | | | | | | | | | | | | | | | | | | | | | | | | |
| | | | | | | | | | | | | | | | | | | | | | | | | | |
| | 11.55 | | | | (11.83 | ) | | | 115,881 | | | | 1.02 | (2) | | | 1.17 | | | | 1.64 | | | | 37 | (3) |
| | 13.61 | | | | 5.39 | | | | 76,848 | | | | 0.11 | | | | 0.38 | | | | 0.88 | | | | 33 | |
| | 13.11 | | | | 20.22 | | | | 42,476 | | | | 0.11 | | | | 0.62 | | | | 2.00 | | | | 7 | |
| | 11.15 | | | | 23.11 | | | | 14,887 | | | | 0.11 | | | | 1.39 | | | | 1.95 | | | | 5 | |
| | 9.35 | | | | (10.90 | ) | | | 7,351 | | | | 0.11 | | | | 2.74 | | | | 0.46 | | | | 5 | |
| | | | | | | | | | | | | | | | | | | | | | | | | | |
| | 11.47 | | | | (12.11 | ) | | | 2,975 | | | | 1.28 | (2) | | | 1.44 | | | | 1.56 | | | | 37 | (3) |
| | 13.56 | | | | 5.08 | | | | 1,338 | | | | 0.36 | | | | 0.63 | | | | 0.80 | | | | 33 | |
| | 13.07 | | | | 19.95 | | | | 1,684 | | | | 0.36 | | | | 0.88 | | | | 0.65 | | | | 7 | |
| | 11.12 | | | | 22.84 | | | | 561 | | | | 0.36 | | | | 1.61 | | | | 0.95 | | | | 5 | |
| | 9.32 | | | | (11.13 | ) | | | 167 | | | | 0.36 | | | | 3.62 | | | | 0.99 | | | | 5 | |
The accompanying notes are an integral part of the financial statements.
| | | | | | |
| | | Causeway International Opportunities Fund | | | 23 | |
NOTES TO FINANCIAL STATEMENTS
Causeway International Opportunities Fund (the “Fund”) is a series of Causeway Capital Management Trust (the “Trust”). The Trust is an open-end management investment company registered under the Investment Company Act of 1940, as amended (the “1940 Act”) and is a Delaware statutory trust that was established on August 10, 2001. The Fund began operations on December 31, 2009. The Fund is authorized to offer two classes of shares, the Institutional Class and the Investor Class. The Declaration of Trust authorizes the issuance of an unlimited number of shares of beneficial interest of the Fund. The Fund is diversified. The Fund’s prospectus provides a description of the Fund’s investment objectives, policies and strategies. The Trust has five additional series, the financial statements of which are presented separately.
On October 15, 2014, the Fund converted from a “fund of funds” to a Fund making direct investments in securities and the Fund no longer invests in Causeway Emerging Markets Fund and Causeway International Value Fund.
| 2. | | Significant Accounting Policies |
The following is a summary of the significant accounting policies consistently followed by the Fund.
Use of Estimates in the Preparation of Financial Statements – The Fund is an investment company that applies the accounting and reporting guidance issued in Topic 946 by the U.S. Financial Accounting Standards Board. The Fund’s financial statements have been prepared to comply with U.S. generally accepted accounting principles (“U.S. GAAP”). The preparation of financial statements in conformity with U.S. GAAP requires management to make estimates and assumptions that affect the reported amount of net assets and
liabilities and disclosure of contingent assets and liabilities at the date of the financial statements and the reported amounts of increases and decreases in net assets from operations during the reporting period. Actual results could differ from those estimates.
Security Valuation – Except as described below, securities listed on a securities exchange (except the NASDAQ Stock Market (“NASDAQ”)) or Over-the-Counter (“OTC”) for which market quotations are available are valued at the last reported sale price as of the close of regular trading on each business day, or, if there is no such reported sale, at the last reported bid price for long positions. For securities traded on NASDAQ, the NASDAQ Official Closing Price will be used. Securities listed on multiple exchanges or OTC markets are valued on the exchange or OTC market considered by the Fund to be the primary market. The prices for foreign securities are reported in local currency and converted to U.S. dollars using currency exchange rates. Prices for most securities held in the Fund are provided daily by recognized independent pricing agents. If a security price cannot be obtained from an independent pricing agent, the Fund seeks to obtain a bid price from at least one independent broker. Investments in the Dreyfus Cash Management money market fund are valued daily at the net asset value per share.
Securities for which market prices are not “readily available” are valued in accordance with fair value pricing procedures approved by the Fund’s Board of Trustees (the “Board”). The Fund’s fair value pricing procedures are implemented through a Fair Value Committee (the “Committee”) designated by the Board. Some of the more common reasons that may necessitate that a security be valued using fair value pricing procedures include: the security’s trading has been halted or suspended; the security has been delisted from a national
| | | | |
| 24 | | Causeway International Opportunities Fund | | |
NOTES TO FINANCIAL STATEMENTS
(continued)
exchange; the security’s primary trading market is temporarily closed at a time when under normal conditions it would be open; or the security’s primary pricing source is not able or willing to provide a price. When the Committee values a security in accordance with the fair value pricing procedures, the Committee will determine the value after taking into consideration relevant information reasonably available to the Committee.
The Fund uses a third party vendor to fair value certain non-U.S. securities if there is a movement in the U.S. market that exceeds thresholds established by the Committee. The vendor provides fair values for foreign securities based on factors and methodologies involving, generally, tracking valuation correlations between the U.S. market and each non-U.S. security.
In accordance with the authoritative guidance on fair value measurements and disclosure under U.S. GAAP, the Fund discloses fair value of its investments in a hierarchy that prioritizes the inputs to valuation techniques used to measure the fair value. The objective of a fair value measurement is to determine the price that would be received to sell an asset or paid to transfer a liability in an orderly transaction between market participants at the measurement date (an exit price). Accordingly, the fair value hierarchy gives the highest priority to quoted prices (unadjusted) in active markets for identical assets or liabilities (Level 1) and the lowest priority to unobservable inputs (Level 3). The guidance establishes three levels of fair value hierarchy as follows:
| | • | | Level 1 — Unadjusted quoted prices in active markets for identical, unrestricted assets or liabilities that the Fund has the ability to access at the measurement date; |
| | • | | Level 2 — Quoted prices in markets which are not active, or prices based on inputs that are |
| | | observable (either directly or indirectly) for substantially the full term of the asset or liability; and |
| | • | | Level 3 — Prices, inputs or exotic modeling techniques which are both significant to the fair value measurement and unobservable (supported by little or no market activity). |
Investments are classified within the level of the lowest significant input considered in determining fair value. Investments classified within Level 3 whose fair value measurement considers several inputs may include Level 1 or Level 2 inputs as components of the overall fair value measurement.
The following table sets forth information about the levels within the fair value hierarchy at which the Fund’s investments are measured at September 30, 2015:
| | | | | | | | | | | | | | | | |
Investments in
Securities | | Level 1
(000) | | | Level 2†
(000) | | | Level 3††
(000) | | | Total (000) | |
Common Stock | | | | | | | | | | | | | | | | |
Australia | | $ | — | | | $ | 684 | | | $ | — | | | $ | 684 | |
Belgium | | | — | | | | 698 | | | | — | | | | 698 | |
Brazil | | | 1,168 | | | | — | | | | — | | | | 1,168 | |
Canada | | | 1,733 | | | | — | | | | — | | | | 1,733 | |
China | | | 1,108 | | | | 4,307 | | | | 61 | | | | 5,476 | |
Czech Republic | | | — | | | | 188 | | | | — | | | | 188 | |
France | | | — | | | | 15,237 | | | | — | | | | 15,237 | |
Germany | | | — | | | | 5,147 | | | | — | | | | 5,147 | |
India | | | 1,269 | | | | — | | | | — | | | | 1,269 | |
Indonesia | | | — | | | | 231 | | | | — | | | | 231 | |
Ireland | | | 759 | | | | — | | | | — | | | | 759 | |
Japan | | | — | | | | 14,328 | | | | ��� | | | | 14,328 | |
Malaysia | | | — | | | | 84 | | | | — | | | | 84 | |
Mexico | | | 501 | | | | — | | | | — | | | | 501 | |
Netherlands | | | — | | | | 8,239 | | | | — | | | | 8,239 | |
Philippines | | | — | | | | 112 | | | | — | | | | 112 | |
Poland | | | — | | | | 872 | | | | — | | | | 872 | |
Qatar | | | — | | | | 147 | | | | — | | | | 147 | |
Russia | | | — | | | | 929 | | | | — | | | | 929 | |
South Africa | | | — | | | | 1,200 | | | | — | | | | 1,200 | |
South Korea | | | 86 | | | | 4,010 | | | | — | | | | 4,096 | |
Spain | | | — | | | | 2,121 | | | | — | | | | 2,121 | |
Switzerland | | | — | | | | 13,359 | | | | — | | | | 13,359 | |
| | | | | | |
| | | Causeway International Opportunities Fund | | | 25 | |
NOTES TO FINANCIAL STATEMENTS
(continued)
| | | | | | | | | | | | | | | | |
Investments in
Securities | | Level 1
(000) | | | Level 2†
(000) | | | Level 3††
(000) | | | Total (000) | |
Taiwan | | $ | 448 | | | $ | 2,379 | | | $ | — | | | $ | 2,827 | |
Thailand | | | — | | | | 894 | | | | — | | | | 894 | |
Turkey | | | — | | | | 939 | | | | — | | | | 939 | |
United Arab Emirates | | | — | | | | 515 | | | | — | | | | 515 | |
United Kingdom | | | — | | | | 26,442 | | | | — | | | | 26,442 | |
| | | | |
Total Common Stock | | | 7,072 | | | | 103,062 | | | | 61 | | | | 110,195 | |
| | | | |
Preferred Stock | | | — | | | | 1,931 | | | | — | | | | 1,931 | |
| | | | |
Exchange Traded Fund | | | 1,052 | | | | — | | | | — | | | | 1,052 | |
| | | | |
Preference Stock | | | | | | | | | | | | | | | | |
Brazil | | | 410 | | | | — | | | | — | | | | 410 | |
South Korea | | | — | | | | 59 | | | | — | | | | 59 | |
| | | | |
Total Preference Stock | | | 410 | | | | 59 | | | | — | | | | 469 | |
| | | | |
Short-Term Investment | | | 3,562 | | | | — | | | | — | | | | 3,562 | |
| | | | |
Total Investments in Securities | | $ | 12,096 | | | $ | 105,052 | | | $ | 61 | | | $ | 117,209 | |
| | | | |
| † | Holdings represent securities trading outside the United States, the values of which were adjusted as a result of significant market movements following the close of local trading or due to “Foreign Line” securities using “Local Line” prices. |
| †† | A reconciliation of Level 3 investments and disclosures of significant unobservable inputs are presented when the Fund has a significant amount of Level 3 investments at the beginning and/or end of the period in relation to net assets. Management has concluded that Level 3 investments are not material in relation to net assets. |
Please refer to the Schedule of Investments for additional information regarding the composition of the amounts listed above.
Changes in valuation techniques may result in transfers in or out of an investment’s assigned level within the hierarchy during the reporting period. Changes in the classification between Levels 1 and 2 occur primarily when foreign equity securities are fair valued by the Fund’s third party vendor using other observable market–based
inputs in place of closing exchange prices due to events occurring after foreign market closures and/or due to adjustments to security values due to “Foreign Line” securities using “Local Line” prices.
During the fiscal year ended September 30, 2015, the Fund converted from a fund of funds to direct investing in securities and direct investments in Thailand became Level 2 due to “Foreign Line” securities using “Local Line” prices. In addition, one security became Level 3 because trading in its shares was suspended. Transfers between levels are recognized at period end.
For the fiscal year ended September 30, 2015, in connection with the Fund’s conversion from a fund of funds to direct investing, and the Fund no longer investing in underlying Causeway Funds, the Fund became subject to security valuation polices described in note 2, including the fair value methodologies described therein.
Federal Income Taxes – It is the Fund’s intention to continue to qualify as a regulated investment company under Subchapter M of the Internal Revenue Code and to distribute all of its taxable income. Accordingly, no provision for Federal income taxes has been made in the financial statements.
The Fund evaluates tax positions taken or expected to be taken in the course of preparing the Fund’s tax returns to determine whether it is “more-likely-than not” (i.e., greater than 50-percent) that each tax position will be sustained upon examination by a taxing authority based on the technical merits of the position. Tax positions not deemed to meet the more likely-than-not threshold are recorded as a tax benefit or expense in the current year. The Fund did not record any tax provision in the current period. However, management’s conclusions regarding tax positions taken may be subject to review and adjustment at a later date based on factors including, but not limited to, examination by tax authorities (i.e., the last 3
| | | | |
| 26 | | Causeway International Opportunities Fund | | |
NOTES TO FINANCIAL STATEMENTS
(continued)
tax year ends, as applicable), on-going analysis of and changes to tax laws, regulations and interpretations thereof.
As of and during the fiscal year ended September 30, 2015, the Fund did not have a liability for any unrecognized tax benefits. The Fund recognizes interest and penalties, if any, related to unrecognized tax benefits as income tax expense in the Statement of Operations. During the fiscal year, the Fund did not incur any significant interest or penalties.
Security Transactions and Related Income – Security transactions are accounted for on the date the security is purchased or sold (trade date). Dividend income is recognized on the ex-dividend date, and interest income is recognized using the accrual basis of accounting. Costs used in determining realized gains and losses on the sales of investment securities are those of the specific securities sold.
Foreign Currency Translation – The books and records of the Fund are maintained in U.S. dollars on the following basis:
(1) the market value or fair value of investment securities, assets and liabilities is converted at the current rate of exchange; and
(2) purchases and sales of investment securities, income and expenses are converted at the relevant rates of exchange prevailing on the respective dates of such transactions.
The Fund does not isolate that portion of gains and losses on investments in equity securities that is due to changes in the foreign exchange rates from that which is due to changes in market prices of equity securities.
Foreign Currency Exchange Contracts – When the Fund purchases or sells foreign securities, it may enter into
foreign currency exchange contracts to minimize foreign exchange risk from the trade date to the settlement date of the transaction. Losses from these transactions may arise from changes in the value of the foreign currency or if the counterparties do not perform under the contract’s terms.
Expense/Classes – Expenses that are directly related to one Fund of the Trust are charged directly to that Fund. Other operating expenses of the Trust are prorated to the Fund and the other series of the Trust on the basis of relative daily net assets. Class specific expenses are borne by that class of shares. Income, realized and unrealized gains/losses and non-class specific expenses are allocated to the respective classes on the basis of relative daily net assets.
Dividends and Distributions – Dividends from net investment income, if any, are declared and paid on an annual basis. Any net realized capital gains on sales of securities are distributed to shareholders at least annually.
Redemption Fee – The Fund imposes a redemption fee of 2% on the value of capital shares redeemed by shareholders less than 60 days after purchase. The redemption fee also applies to exchanges from the Fund. The redemption fee is paid to the Fund. The redemption fee does not apply to shares purchased through reinvested distributions or shares redeemed through designated systematic withdrawal plans. The redemption fee does not normally apply to accounts designated as omnibus accounts with the transfer agent. These are arrangements through financial intermediaries where the purchase and sale orders of a number of persons are aggregated before being communicated to the Fund. However, the Fund may seek agreements with these intermediaries to impose the Fund’s redemption fee or a different redemption fee on their
| | | | | | |
| | | Causeway International Opportunities Fund | | | 27 | |
NOTES TO FINANCIAL STATEMENTS
(continued)
customers if feasible, or to impose other appropriate restrictions on excessive short-term trading. The officers of the Fund may waive the redemption fee for shareholders in asset allocation and similar investment programs reasonably believed not to be engaged in short-term market timing, including for holders of shares purchased by Causeway Capital Management LLC (the “Adviser”) for its clients to rebalance their portfolios. For the fiscal year ended September 30, 2015, the Institutional Class retained $110 in redemption fees and the Investor Class did not retain any redemption fees.
| 3. | | Investment Advisory, Administration, Shareholder Service and Distribution Agreements |
The Trust, on behalf of the Fund, has entered into an Investment Advisory Agreement (the “Advisory Agreement”) with the Adviser. Under the Advisory Agreement, the Adviser is entitled to a monthly fee equal to an annual rate of 0.80% of the Fund’s average daily net assets. Prior to October 15, 2014, the Adviser was not paid any fees as the Fund was a fund of funds investing primarily in Causeway International Value Fund and Causeway Emerging Markets Fund which separately paid advisory fees to the Adviser. The fund converted from a fund of funds to direct investing in portfolio securities on October 15, 2014. The Adviser has contractually agreed through January 31, 2016 to reimburse the Fund to the extent necessary to keep total annual fund operating expenses (excluding brokerage fees and commissions, interest, taxes, shareholder service fees, fees and expenses of other funds in which the Fund invests, and extraordinary expenses) from exceeding 1.05% of Institutional Class and Investor Class average daily net assets (0.11% before October 15, 2014). For the fiscal year ended September 30, 2015, the Adviser waived fees of $136,205. The waived fees are not subject to recapture.
The Trust and SEI Investments Global Funds Services (the “Administrator”) have entered into an Administration Agreement. Under the terms of the Administration Agreement, the Administrator is entitled to an annual fee which is calculated daily and paid monthly based on the aggregate average daily net assets of the Trust subject to a minimum annual fee.
The Trust has adopted a Shareholder Service Plan and Agreement for Investor Class shares that allows the Trust to pay broker-dealers and other financial intermediaries a fee of up to 0.25% per annum of average daily net assets for services provided to Investor Class shareholders. For the fiscal year ended September 30, 2015, the Investor Class paid 0.25% of average daily net assets under this plan.
The Trust and SEI Investments Distribution Co. (the “Distributor”) have entered into a Distribution Agreement. The Distributor receives no fees for its distribution services under this agreement.
The officers of the Trust are also officers or employees of the Administrator or Adviser. They receive no fees for serving as officers of the Trust.
As of September 30, 2015, approximately $1.511 million of the net assets were held by affiliated investors.
| 4. | | Investment Transactions |
The cost of security purchases and the proceeds from the sale of securities, other than short-term investments, during the fiscal year ended September 30, 2015, for the Fund were as follows:
| | | | | | |
Purchases
(000) | | | Sales
(000) | |
| $ | 97,644 | | | $ | 32,646 | |
| | | | |
| 28 | | Causeway International Opportunities Fund | | |
NOTES TO FINANCIAL STATEMENTS
(continued)
The following is a rollforward of affiliated investments as of September 30, 2015 (000):
| | | | | | | | |
| | | Causeway
Emerging
Markets Fund | | | Causeway
International
Value Fund | |
Beginning balance as of September 30, 2014 | | $ | 16,977 | | | $ | 61,207 | |
Purchases | | | 153 | | | | 530 | |
Sales | | | (16,710 | ) | | | (57,605 | ) |
Realized Gain (Loss) | | | (420 | ) | | | (341 | ) |
Unrealized Gain (Loss) | | | — | | | | (3,791 | ) |
| | | | | | | | |
Ending balance as of September 30, 2015 | | $ | — | | | $ | — | |
| | | | | | | | |
| 5. | | Risks of Foreign Investing |
Because the Fund invests most of its assets in foreign securities, the Fund is subject to further risks. For example, the value of the Fund’s securities may be affected by social, political and economic developments and U.S. and foreign laws relating to foreign investment. Further, because the Fund invests in securities denominated in foreign currencies, the Fund’s securities may go down in value depending on foreign exchange rates. Other risks include trading, settlement, custodial, and other operational risks; withholding or other taxes; and the less stringent investor protection and disclosure standards of some foreign markets. All of these factors can make foreign securities less liquid, more volatile and harder to value than U.S. securities. These risks are higher for emerging markets investments.
| 6. | | Federal Tax Information |
The Fund is classified as a separate taxable entity for Federal income tax purposes. The Fund intends to continue to qualify as a separate “regulated investment company” under Subchapter M of the Internal Revenue Code and make the requisite distributions to shareholders that will be sufficient to relieve it from Federal income
tax and Federal excise tax. Therefore, no Federal tax provision is required. To the extent that dividends from net investment income and distributions from net realized capital gains exceed amounts reported in the financial statements, such amounts are reported separately.
The Fund may be subject to taxes imposed by countries in which it invests in issuers existing or operating in such countries. Such taxes are generally based on income earned. The Fund accrues such taxes when the related income is earned. Dividend and interest income is recorded net of non-U.S. taxes paid.
The amounts of distributions from net investment income and net realized capital gains are determined in accordance with Federal income tax regulations, which may differ from those amounts determined under U.S. GAAP. These book/tax differences are either temporary or permanent in nature. The character of distributions made during the year from net investment income or net realized gains, and the timing of distributions made during the year may differ from the year that the income or realized gains (losses) were recorded by the Fund. To the extent these differences are permanent, adjustments are made to the appropriate equity accounts in the period that the differences arise.
Accordingly, the following permanent differences, which are primarily due to PFICs and foreign currency transactions, were reclassified to/(from) the following accounts as of September 30, 2015 (000):
| | | | | | |
Undistributed
Net Investment
Income | | | Accumulated
Net Realized
Loss | |
| $ | 13 | | | $ | (13 | ) |
| | | | | | |
| | | Causeway International Opportunities Fund | | | 29 | |
NOTES TO FINANCIAL STATEMENTS
(continued)
The tax character of dividends and distributions declared during the fiscal years ended September 30, 2015 and September 30, 2014 were as follows (000):
| | | | | | | | | | | | |
| | | Ordinary
Income | | | Long-Term
Capital Gain | | | Total | |
2015 | | $ | — | | | $ | 2,993 | | | $ | 2,993 | |
2014 | | | 417 | | | | 246 | | | | 663 | |
As of September 30, 2015, the components of distributable earnings on a tax basis were as follows (000):
| | | | |
Undistributed Ordinary Income | | $ | 1,520 | |
Undistributed Long-Term Capital Gains | | | 158 | |
Unrealized Depreciation | | | (12,015 | ) |
| | | | |
Total Accumulated Losses | | $ | (10,337 | ) |
| | | | |
At September 30, 2015, the total cost of securities for Federal income tax purposes and the aggregate gross unrealized appreciation and depreciation on investment securities for the Fund were as follows (000):
| | | | | | | | | | | | | | |
Federal
Tax Cost | | | Appreciated
Securities | | | Depreciated
Securities | | | Net
Unrealized
Depreciation | |
| $ | 129,221 | | | $ | 2,505 | | | $ | (14,517 | ) | | $ | (12,012 | ) |
| 7. | | Capital Shares Issued and Redeemed (000) |
| | | | | | | | | | | | | | | | |
| | | Fiscal Year Ended
September 30, 2015 | | | Fiscal Year Ended
September 30, 2014 | |
| | | Shares | | | Value | | | Shares | | | Value | |
Institutional Class | | | | | | | | | | | | | | | | |
Shares Sold | | | 4,323 | | | $ | 54,788 | | | | 3,304 | | | $ | 45,908 | |
Shares Issued in Reinvestment of Dividends and Distributions | | | 230 | | | | 2,925 | | | | 49 | | | | 642 | |
Shares Redeemed | | | (163 | ) | | | (2,083 | ) | | | (946 | ) | | | (12,894 | ) |
| | | | | | | | | | | | | | | | |
Increase in Shares Outstanding Derived from Institutional Class Transactions | | | 4,390 | | | | 55,630 | | | | 2,407 | | | | 33,656 | |
| | | | | | | | | | | | | | | | |
Investor Class | | | | | | | | | | | | | | | | |
Shares Sold | | | 207 | | | | 2,710 | | | | 36 | | | | 491 | |
Shares Issued in Reinvestment of Dividends and Distributions | | | 5 | | | | 67 | | | | 2 | | | | 21 | |
Shares Redeemed | | | (51 | ) | | | (671 | ) | | | (68 | ) | | | (925 | ) |
| | | | | | | | | | | | | | | | |
Increase (Decrease) in Shares Outstanding Derived from Investor Class Transactions | | | 161 | | | | 2,106 | | | | (30 | ) | | | (413 | ) |
| | | | | | | | | | | | | | | | |
Increase in Shares Outstanding from Capital Share Transactions | | | 4,551 | | | $ | 57,736 | | | | 2,377 | | | $ | 33,243 | |
| | | | | | | | | | | | | | | | |
| | | | |
| 30 | | Causeway International Opportunities Fund | | |
NOTES TO FINANCIAL STATEMENTS
(concluded)
| 8. | | Significant Shareholder Concentration |
As of September 30, 2015, three of the Fund’s shareholders of record owned 64% of net assets in the Institutional Class.
Under the Trust’s organizational documents, each Trustee, officer, employee or other agent of the Trust is indemnified against certain liabilities that may arise out of the performance of his or her duties to the Fund. Additionally, in the normal course of business, the Fund enters into contracts, including the Fund’s servicing agreements, that contain a variety of indemnification clauses. The Fund’s maximum exposure under these arrangements is unknown as this would involve future claims that may be made against the Fund that have not yet occurred. The risk of material loss as a result of such indemnification claims is considered remote.
| 10. | | In-Kind Transfers of Securities |
During the fiscal year ended September 30, 2015, the Fund exchanged shares of beneficial interest in Causeway Emerging Markets Fund and shares of beneficial interest in Causeway International Value Fund for securities. These securities, valued at $62,259,055, were transferred at their fair value on October 16, 2014, the date of such transactions. There was no gain or loss recognized as a result of these in-kind exchanges.
The Fund entered into an agreement on, February 24, 2015, which enables it to participate in a $10 million secured committed revolving line of credit, along with certain other series of the Trust, with The Bank of New York Mellon (the “Custodian”) which expires February 24, 2016. The proceeds from the borrowings, if any, shall be used to finance the Fund’s short-term general working capital requirements, including the funding of shareholder redemptions. Interest, if any, is charged to the Fund based on its borrowings during the period at the applicable rate plus 1.5%. The Fund is also charged a portion of a commitment fee of 0.12% per annum. As of September 30, 2015, there were no borrowings outstanding made under the line of credit.
The Fund has evaluated the need for disclosures and/or adjustments resulting from subsequent events through the date the financial statements were available to be issued. Based on this evaluation, no adjustments were required to the financial statements.
| | | | | | |
| | | Causeway International Opportunities Fund | | | 31 | |
REPORT OF INDEPENDENT REGISTERED PUBLIC ACCOUNTING FIRM
To the Board of Trustees and Shareholders of
Causeway International Opportunities Fund:
In our opinion, the accompanying statement of assets and liabilities, including the schedule of investments, and the related statements of operations and of changes in net assets and the financial highlights present fairly, in all material respects, the financial position of Causeway International Opportunities Fund (the “Fund”) at September 30, 2015, the results of its operations for the year then ended, the changes in its net assets for each of the two years in the period then ended and the financial highlights for each of the five years in the period then ended in conformity with accounting principles generally accepted in the United States of America. These financial statements and financial highlights (hereafter referred to as “financial statements”) are the responsibility of the Fund’s management. Our responsibility is to express an opinion on these financial statements based on our audits. We conducted our audits of these financial statements in accordance with the standards of the Public Company Accounting Oversight Board (United States). Those standards require that we plan and perform the audit to obtain reasonable assurance about whether the financial statements are free of material misstatement. An audit includes examining, on a test basis, evidence supporting the amounts and disclosures in the financial statements, assessing the accounting principles used and significant estimates made by management, and evaluating the overall financial statement presentation. We believe that our audits, which included confirmation of securities at September 30, 2015 by correspondence with the custodian and broker and by agreement to the underlying ownership records of the transfer agent, provide a reasonable basis for our opinion.
PricewaterhouseCoopers LLP
Los Angeles, California
November 24, 2015
| | | | |
| 32 | | Causeway International Opportunities Fund | | |
NOTICE TO SHAREHOLDERS (Unaudited)
The information set forth below is for the Fund’s fiscal year as required by federal laws. Shareholders, however, must report distributions on a calendar year basis for income tax purposes, which may include distributions for portions of two fiscal years of the Fund. Accordingly, the information needed by shareholders for income tax purposes will be sent to them in early 2016. Please consult your tax adviser for proper treatment of this information.
For the fiscal year ended September 30, 2015, the Fund is designating the following items with regard to distributions paid during the year:
| | | | | | | | | | | | | | | | | | |
| (A) | | | (B) | | | (C) | | | (D) | | | (E) | |
| | | | |
Long Term Capital Gains Distributions (Tax Basis) | | | Ordinary
Income
Distributions
(Tax Basis) | | | Tax Exempt
Distributions
(Tax Basis) | | | Total
Distributions
(Tax Basis) | | | Dividends(1)
for Corporate
Dividends Received
Deduction
(Tax Basis) | |
| | 93.91% | | | | 6.09% | | | | 0.00% | | | | 100.00% | | | | 1.83% | |
| | | | |
| (F) | | | (G) | | | (H) | | | | | | | |
| | | | |
Qualified Dividend Income | | | Interest
Related
Dividends | | | Qualified
Short-Term
Capital
Gain
Dividends | | | | | | | |
| | 100.00% | | | | 0.00% | | | | 0.00% | | | | | | | | | |
Foreign taxes accrued during the fiscal year ended September 30, 2015, amounted to $194,246 and are expected to be passed through to shareholders as foreign tax credits on Form 1099 – Dividend for the year ended December 31, 2015. In addition, for the fiscal year ended September 30, 2015, gross income derived from sources within foreign countries amounted to $2,728,709 for the Fund.
| (1) | Qualified Dividends represent dividends which qualify for the corporate dividends received deduction. |
Items (A), (B), (C) and (D) are based on a percentage of the Fund’s total distribution including pass-through as foreign tax credit.
Item (E) is based on a percentage of ordinary income distributions of the Fund.
Item (F) represents the amount of “Qualified Dividend Income” as defined in the Jobs and Growth Tax Relief Reconciliation Act of 2003 and is reflected as a percentage of “Ordinary Income Distributions.” It is the Fund’s intention to designate the maximum amount permitted by the law up to 100%.
Item (G) is the amount of “Interest Related Dividends” as created by the American Jobs Creation Act of 2004 and is reflected as a percentage of net investment income distributions that is exempt from U.S. withholding tax when paid to foreign investors.
Item (H) is the amount of “Qualified Short-Term Capital Gain Dividends” as created by the American Jobs Creation Act of 2004 and is reflected as a percentage of short-term capital gain distributions that is exempt from U.S. withholding tax when paid to foreign investors.
| | | | | | |
| | | Causeway International Opportunities Fund | | | 33 | |
TRUSTEES AND OFFICERS INFORMATION (Unaudited)
Information pertaining to the Trustees and Officers of the Trust is set forth below. Trustees who are not deemed to be “interested persons” of the Trust as defined in the 1940 Act are referred to as “Independent Trustees.” The Trust’s Statement of Additional Information (“SAI”) includes additional information about the Trustees and Officers. The SAI may be obtained without charge by calling 1-866-947-7000.
| | | | | | | | | | |
Name
Address,
Age1 | | Position(s) Held with the Company | | Term of Office and Length of Time Served2 | | Principal Occupation(s) During Past Five Years | | Number of Portfolios in Trust Complex Overseen by Trustee3 | | Other Directorships Held by Trustee4 |
INDEPENDENT TRUSTEES | | | | | | | | | | |
John R. Graham Age: 54 | | Trustee; Chairman of the Audit Committee | | Trustee since 10/08; Audit Chairman since 4/13 | | Film Composer (since 2005); Senior Vice President, Corporate Financial Development and Communications, The Walt Disney Company (2004-2005); Senior Vice President, Mergers and Acquisitions, Lehman Brothers Inc. (2000-2004). | | 6 | | none |
| | | | | |
Lawry J. Meister Age: 53 | | Trustee | | Since 10/08 | | President, Steaven Jones Development Company, Inc. (real estate firm) (since 1995); President, Creative Office Properties (real estate firm) (since 2012). | | 6 | | none |
| | | | | |
Victoria B. Rogers Age: 54 | | Trustee | | Since 4/13 | | President, the Rose Hills Foundation (since 1996). | | 6 | | Director, TCW Funds, Inc. and TCW Strategic Income Fund |
| | | | | |
Eric H. Sussman Age: 49 | | Trustee; Chairman of the Board | | Trustee since 9/01; Board Chairman since 4/13 | | Senior Lecturer (since July 2011) and Lecturer (1995-June 2011), Anderson Graduate School of Management, University of California, Los Angeles; President, Amber Capital, Inc. (real estate investment and financial planning firm) (since 1993). | | 6 | | none |
| | | | |
| 34 | | Causeway International Opportunities Fund | | |
TRUSTEES AND OFFICERS INFORMATION (Unaudited)
(continued)
| | | | | | | | | | |
Name Address, Age1 | | Position(s) Held with the Company | | Term of Office and Length of Time Served2 | | Principal Occupation(s) During Past Five Years | | Number of Portfolios in Trust Complex Overseen by Trustee3 | | Other Directorships Held by Trustee4 |
OFFICERS | | | | | | | | | | |
Turner Swan 11111 Santa Monica Blvd., 15th Floor Los Angeles, CA 90025 Age: 53 | | President | | Since 8/01 | | General Counsel, Secretary, and Member of the Adviser (since 2001); Compliance Officer of the Adviser (since 2010). | | N/A | | N/A |
| | | | | |
Kurt J. Decko 11111 Santa Monica Blvd., 15th Floor Los Angeles, CA 90025 Age: 40 | | Chief Compliance Officer and Assistant Secretary | | Since 1/15 | | Chief Compliance Officer/Senior Legal Counsel of the Adviser (since January 2015); Partner, K&L Gates LLP (2010-2014). | | N/A | | N/A |
| | | | | |
Eric Kleinschmidt5 One Freedom Valley Drive Oaks, PA 19456 Age: 47 | | Treasurer | | Since 8/14 | | Director of Fund Accounting, SEI Investments Company (since 2004). | | N/A | | N/A |
| | | | | |
Gretchen W. Corbell 11111 Santa Monica Blvd., 15th Floor Los Angeles, CA 90025 Age: 44 | | Secretary | | Since 10/11 | | Attorney of the Adviser (since 2004). | | N/A | | N/A |
| | | | | |
Gracie V. Fermelia 11111 Santa Monica Blvd., 15th Floor Los Angeles, CA 90025 Age: 54 | | Vice President and Assistant Secretary | | Vice President (since 1/15); Assistant Secretary (since 8/01) | | Chief Operating Officer and Member of the Adviser (since 2001); Chief Compliance Officer of the Adviser and the Trust (2005-2015). | | N/A | | N/A |
| | | | | | |
| | | Causeway International Opportunities Fund | | | 35 | |
TRUSTEES AND OFFICERS INFORMATION (Unaudited)
(concluded)
| | | | | | | | | | |
Name Address, Age1 | | Position(s) Held with the Company | | Term of Office and Length of Time Served2 | | Principal Occupation(s) During Past Five Years | | Number of Portfolios in Trust Complex Overseen by Trustee3 | | Other Directorships Held by Trustee4 |
Lisa Whittaker5 One Freedom Valley Drive Oaks, PA 19456 Age: 36 | | Vice President and Assistant Secretary | | Since 8/13 | | Corporate Counsel of the Administrator (since 2012); Associate Counsel and Compliance Officer, The Glendmede Trust Company, N.A. (2011-2012); Associate, Drinker Biddle & Reath LLP (2006-2011). | | N/A | | N/A |
| 1 | Each Trustee may be contacted by writing to the Trustee c/o Causeway Capital Management Trust, One Freedom Valley Drive, Oaks, PA 19456. |
| 2 | Each Trustee holds office during the lifetime of the Trust or until his or her sooner resignation, retirement, removal, death or incapacity in accordance with the Trust’s Declaration of Trust. The president, treasurer and secretary each holds office at the pleasure of the Board of Trustees or until he or she sooner resigns in accordance with the Trust’s Bylaws. |
| 3 | The “Trust Complex” consists of all registered investment companies for which Causeway Capital Management LLC serves as investment adviser. As of September 30, 2015, the Trust Complex consisted of one investment company with six portfolios — the International Value Fund, the Emerging Markets Fund, the Global Value Fund, the International Opportunities Fund, the Global Absolute Return Fund, and the International Small Cap Fund. |
| 4 | Directorships of companies required to report to the Securities and Exchange Commission under the Securities Exchange Act of 1934 (i.e., “public companies”) or other investment companies registered under the 1940 Act. |
| 5 | These officers of the Trust also serve as officers of one or more mutual funds for which SEI Investments Company or an affiliate acts as investment manager, administrator or distributor. |
| | | | |
| 36 | | Causeway International Opportunities Fund | | |
DISCLOSURE OF FUND EXPENSES (Unaudited)
As a shareholder of the Fund, you incur two types of costs: (1) transaction costs, including redemption fees, and (2) ongoing costs, including management fees, shareholder service fees, and other Fund expenses. It is important for you to understand the impact of these costs on your investment returns.
Ongoing operating expenses are deducted from a mutual fund’s gross income and directly reduce its final investment return. These expenses are expressed as a percentage of a mutual fund’s average net assets; this percentage is known as a mutual fund’s expense ratio.
The following examples use the expense ratio and are intended to help you understand the ongoing costs (in dollars) of investing in the Fund and to compare these costs with those of other mutual funds. The examples are based on an investment of $1,000 made at the beginning of the period shown and held for the entire period (April 1, 2015 to September 30, 2015).
The table on the next page illustrates the Fund’s costs in two ways:
Actual Fund Return. This section helps you to estimate the actual expenses after fee waivers that the Fund incurred over the period. The “Expenses Paid During Period” column shows the actual dollar expense cost incurred by a $1,000 investment in the Fund, and the “Ending Account Value” number is derived from deducting that expense cost from the Fund’s gross investment return.
You can use this information, together with the actual amount you invested in the Fund, to estimate the expenses you paid over that period. Simply divide your actual account value by $1,000 to arrive at a ratio (for example, an $8,600 account value divided by $1,000 = 8.6), then multiply that ratio by the number shown under “Expenses Paid During Period.”
Hypothetical 5% Return. This section helps you compare the Fund’s costs with those of other mutual funds. It assumes that the Fund had an annual 5% return before expenses during the year, but that the expense ratio (Column 3) for the period is unchanged. This example is useful in making comparisons because the Securities and Exchange Commission requires all mutual funds to make this 5% calculation. You can assess the Fund’s comparative cost by comparing the hypothetical result for the Fund in the “Expenses Paid During Period” column with those that appear in the same charts in the shareholder reports for other mutual funds.
NOTE: Because the return is set at 5% for comparison purposes — NOT the Fund’s actual return — the account values shown may not apply to your specific investment.
| | | | | | |
| | | Causeway International Opportunities Fund | | | 37 | |
DISCLOSURE OF FUND EXPENSES (Unaudited)
(concluded)
| | | | | | | | | | | | | | | | |
| | | Beginning
Account
Value
4/01/15 | | | Ending
Account
Value
9/30/15 | | | Annualized
Expense
Ratios | | | Expenses
Paid
During
Period* | |
Causeway International Opportunities Fund | | | | | | | | | | | | | |
| | | | |
Actual Portfolio Return | | | | | | | | | | | | | | | | |
Institutional Class | | $ | 1,000.00 | | | $ | 881.70 | | | | 1.05 | % | | $ | 4.95 | |
| | | | |
Hypothetical 5% Return | | | | | | | | | | | | | | | | |
Institutional Class | | $ | 1,000.00 | | | $ | 1,019.80 | | | | 1.05 | % | | $ | 5.32 | |
Causeway International Opportunities Fund | | | | | | | | | | | | | |
| | | | |
Actual Portfolio Return | | | | | | | | | | | | | | | | |
Investor Class | | $ | 1,000.00 | | | $ | 880.30 | | | | 1.30 | % | | $ | 6.13 | |
| | | | |
Hypothetical 5% Return | | | | | | | | | | | | | | | | |
| Investor Class | | $ | 1,000.00 | | | $ | 1,018.55 | | | | 1.30 | % | | $ | 6.58 | |
| * | Expenses are equal to the Fund’s annualized expense ratio multiplied by the average account value over the period, multiplied by 183/365 (to reflect the one-half year period.) |
| | | | |
| 38 | | Causeway International Opportunities Fund | | |
INVESTMENT ADVISER:
Causeway Capital Management LLC
11111 Santa Monica Boulevard
15th Floor
Los Angeles, CA 90025
DISTRIBUTOR:
SEI Investments Distribution Co.
One Freedom Valley Drive
Oaks, PA 19456
TO OBTAIN MORE INFORMATION:
Call 1-866-947-7000 or visit us online at www.causewayfunds.com
This material must be preceded or accompanied by a current prospectus.
The Fund files its complete schedule of portfolio holdings with the Securities and Exchange Commission (“Commission”) for the first and third quarters of each fiscal year on Form N-Q within sixty days after the end of the period. The Fund’s Forms N-Q are available on the Commission’s website at http://www.sec.gov, and may be reviewed and copied at the Commission’s Public Reference Room in Washington, DC. Information on the operation of the Public Reference Room may be obtained by calling 1-800-SEC-0330.
A description of the policies and procedures that the Fund uses to determine how to vote proxies relating to portfolio securities, as well as information relating to how the Trust voted proxies relating to portfolio securities during the most recent 12-month period ended June 30, is available (i) without charge, upon request, by calling 1-866-947-7000; and (ii) on the Commission’s website at http://www. sec.gov.
CCM-AR-004-0600
The registrant has adopted a code of ethics that applies to the registrant’s principal executive officer, principal financial officer and principal accounting officer. During the fiscal year ended September 30, 2015, there were no material changes or waivers to the code of ethics.
| Item 3. | Audit Committee Financial Expert. |
(a)(1) The registrant’s board of trustees has determined that the registrant has at least one audit committee financial expert serving on the audit committee.
(a)(2) The audit committee financial experts are Eric Sussman, Lawry Meister, John Graham and Victoria B. Rogers. Each audit committee financial expert is independent as defined in Form N-CSR Item 3(a)(2).
| Item 4. | Principal Accountant Fees and Services. |
Aggregate fees billed to the registrant for professional services rendered by the registrant’s principal accountant for the fiscal years ended September 30, 2015 and 2014 were as follows:
| | | | | | | | |
| | | | | 2015 | | | | 2014 |
| (a) | | Audit Fees | | $134,460 | | | | $188,960 |
| (b) | | Audit-Related Fees | | None | | | | None |
| (c) | | Tax Fees(1) | | $129,000 | | | | $41,848 |
| (d) | | All Other Fees | | None | | | | None |
Note:
| (1) | Tax fees include amounts related to tax return and excise tax calculation reviews and foreign tax reclaim services. |
(e)(1) The registrant’s audit committee has adopted a charter that requires it to pre-approve the engagement of auditors to (i) audit the registrant’s financial statements, (ii) provide other audit or non-audit services to the registrant, or (iii) provide non-audit services to the registrant’s investment adviser if the engagement relates directly to the operations and financial reporting of the registrant.
(e)(2) No services included in paragraphs (b) through (d) of this Item were approved by the audit committee pursuant to paragraph (c)(7)(i)(C) of Rule 2-01 of Regulation S-X.
(f) Not applicable.
(g) For the fiscal year ended September 30, 2015, the aggregate non-audit fees billed by the registrant’s accountant for services rendered to the registrant and the registrant’s investment adviser were $162,980. For the fiscal year ended September 30, 2014, the aggregate non-audit fees billed by the registrant’s accountant for services rendered to the registrant and the registrant’s investment adviser were $340,363.
(h) The audit committee considered whether the provision of non-audit services rendered to the registrant’s investment adviser by the registrant’s principal accountant that were not pre-approved pursuant to paragraph (c)(7)(ii) of Rule 2-01 of Regulation S-X was compatible with maintaining the principal accountant’s independence.
| Item 5. | Audit Committee of Listed Registrants. |
Not applicable to open-end management investment companies.
| Item 6. | Schedule of Investments |
See Item 1.
| Item 7. | Disclosure of Proxy Voting Policies and Procedures for Closed-End Management Investment Companies. |
Not applicable to open-end management investment companies.
| Item 8. | Portfolio Managers of Closed-End Management Investment Companies |
Not applicable to open-end management investment companies.
| Item 9. | Purchases of Equity Securities by Closed-End Management Investment Company and Affiliated Purchasers. |
Not applicable to open-end management investment companies.
| Item 10. | Submission of Matters to a Vote of Security Holders. |
There have been no material changes to the registrant’s procedures by which shareholders may recommend nominees to the registrant’s board of trustees since the registrant’s last filing on Form N-CSR.
| Item 11. | Controls and Procedures. |
(a) The certifying officers, whose certifications are included herewith, have evaluated the registrant’s disclosure controls and procedures within 90 days of the filing date of this report. In their opinion, based on their evaluation, the registrant’s disclosure controls and procedures are adequately designed, and are operating effectively to ensure, that information required to be disclosed by the registrant in the reports it files or submits under the Securities Exchange Act of 1934 is recorded, processed, summarized and reported within the time periods specified in the Securities and Exchange Commission’s rules and forms.
(b) There were no changes in the registrant’s internal control over financial reporting that occurred during the registrant’s second fiscal quarter of the period covered by this report that have materially affected, or are reasonably likely to materially affect, the registrant’s internal control over financial reporting.
(a)(1) Code of Ethics attached hereto.
(a)(2) Separate certifications for the principal executive officer and the principal financial officer of the registrant as required by Rule 30a-2(a) under the Investment Company Act of 1940 (17 CFR 270.30a-2(a)) are filed herewith.
(b) Officer certifications as required by Rule 30a-2(b) under the Investment Company Act of 1940 (17 CFR 270.30a-2(b)) also accompany this filing as an exhibit.
SIGNATURES
Pursuant to the requirements of the Securities Exchange Act of 1934 and the Investment Company Act of 1940, the registrant has duly caused this report to be signed on its behalf by the undersigned, thereunto duly authorized.
| | | | | | |
| (Registrant) | | | | | | Causeway Capital Management Trust |
| | | |
By (Signature and Title)* | | | | | | /s/ Turner Swan |
| | | | | | Turner Swan, President |
Date: December 4, 2015
Pursuant to the requirements of the Securities Exchange Act of 1934 and the Investment Company Act of 1940, this report has been signed below by the following persons on behalf of the registrant and in the capacities and on the dates indicated.
| | | | | | |
By (Signature and Title)* | | | | | | /s/ Turner Swan |
| | | | | | Turner Swan, President |
Date: December 4, 2015
| | | | | | |
By (Signature and Title)* | | | | | | /s/ Eric Kleinschmidt |
| | | | | | Eric Kleinschmidt, Treasurer |
Date: December 4, 2015
| * | Print the name and title of each signing officer under his or her signature. |