UNITED STATES
SECURITIES AND EXCHANGE COMMISSION
Washington, D.C. 20549
FORM N-CSR
CERTIFIED SHAREHOLDER REPORT OF REGISTERED
MANAGEMENT INVESTMENT COMPANIES
Investment Company Act File Number 811-10467
Causeway Capital Management Trust
(Exact name of registrant as specified in charter)
11111 Santa Monica Boulevard, 15th Floor
Los Angeles, CA 90025
(Address of principal executive offices) (Zip code)
SEI Investments Global Funds Services
One Freedom Valley Drive
Oaks, PA 19456
(Name and address of agent for service)
Registrant’s telephone number, including area code: 1-866-947-7000
Date of fiscal year end: September 30, 2015
Date of reporting period: September 30, 2015
| Item 1. | Reports to Stockholders. |
TABLE OF CONTENTS
LETTER TO SHAREHOLDERS
For the fiscal year ended September 30, 2015, Causeway Global Absolute Return Fund’s (the “Fund’s”) Institutional Class returned -4.68% and Investor Class returned -4.98% compared to the BofA Merrill Lynch 3-Month U.S. Treasury Bill Index (“Index”) return of 0.02%. Since the Fund’s inception on January 24, 2011, its average annual total returns are 3.08% for the Institutional Class and 2.79% for the Investor Class compared to the Index’s average annual total return of 0.07%. During the same period, global equity markets, as represented by the MSCI World Index (Gross) (“World Index”), returned 6.92%. At fiscal year-end, the Fund had net assets of $98.0 million.
Performance Review
The Fund’s global long portfolio takes long positions in securities under swap agreements, and the Fund’s global short portfolio takes short positions in securities under swap agreements. For the fiscal year, the global long portfolio underperformed the World Index, detracting from overall performance, while the global short portfolio benefited the Fund by slightly underperforming the World Index.
Low interest rates, abundant liquidity, competitive currency devaluations, and renewed optimism for Europe and Japan could not overcome concerns of weakening global growth, the Greek debt crisis, uncertainty about the strength of the Chinese economy, the timing of a shift in the U.S. Federal Reserve Bank’s (Fed) monetary policy, and concerns of a U.S. government shutdown. These competing forces pressured global equity markets during the fiscal year. The two best performing sectors during the period were consumer discretionary and consumer staples. The two weakest performing sectors, posting double digit losses, were energy and materials. The top performing markets included Ireland, Denmark, Israel, Belgium, and the United States. The weakest markets for the period included Norway, Portugal, Canada, Singapore, and Australia. Currency proved a headwind as major currencies declined against the U.S. Dollar.
For the fiscal year, Fund exposures in the long side of the portfolio in the transportation, materials, telecommunication services, utilities, and consumer services industry groups contributed to relative performance. Exposures in the automobiles & components, energy, technology hardware & equipment, and capital goods industry groups, along with an underweight position in the retailing industry group, detracted the most from the Fund’s performance relative to the World Index. The largest individual detractor from performance was automobile manufacturer, Volkswagen AG (Germany). Revelations that the company deliberately installed a defeat device to circumvent U.S. Environmental Protection Agency (EPA) emissions testing reduced its market capitalization by approximately 40% as investors sold shares on the news. Additional top detractors included oil field equipment manufacturer, National Oilwell Varco, Inc. (United States), oil & gas exploration company, CNOOC Ltd. (Hong Kong), electrical & electronic equipment manufacturer, Hitachi Ltd. (Japan), and integrated energy company, Chevron Corp. (United States). The top individual contributor to return was multinational airline holding company, International Consolidated Airlines Group SA (United Kingdom). Additional top contributors
| | | | |
| 2 | | Causeway Global Absolute Return Fund | | |
included pharmaceutical giant, Eli Lilly & Co. (United States), health insurance provider, UnitedHealth Group, Inc. (United States), design-to-distribution business process services technology company, SYNNEX Corp. (United States), and cruise ship operator, Carnival Corp. (United States).
We use a quantitative approach to select securities for the global short portfolio of the Fund. Our process seeks to take short positions in stocks which we believe are overvalued and have deteriorating earnings growth dynamics, poor technical price movements, and insolvency risk and/or inferior quality of earnings. During the fiscal year, all factor categories demonstrated predictive power with the exception of value. Companies with worsening earnings growth dynamics, weak technical indicators, and those demonstrating potential insolvency and/or accounting chicanery underperformed, as anticipated. Companies with expensive valuations performed in-line with the market.
The global short portfolio’s relative added value for the fiscal year was due primarily to stock selection. We had particular success identifying downside candidates in the United States, Germany, and Japan. From an industry group perspective, added value was concentrated in capital goods, health care equipment & services, telecommunications services, and retailing. From a stock exposure perspective, short positions in online search and content provider, Yahoo! (United States), pipeline operator, Kinder Morgan (United States), oil and gas producer, Tullow Oil (United Kingdom), mobile communications provider, Softbank (Japan), and aerospace engine manufacturer, Rolls-Royce Holdings (United Kingdom) were particularly effective, as all of these stocks substantially underperformed the World Index. Detractors from short-side performance were primarily concentrated within the real estate, banks, energy, and insurance industry groups. At the stock exposure level, our principal detractors included property developer, China Overseas Land & Investment (Hong Kong), coffee retailer, Starbucks (United States), home entertainment company, Nintendo (Japan), online retailing giant, Amazon (United States), and pharmaceuticals manufacturer, Bristol-Myers Squibb (United States). The share prices of these companies appreciated substantially during our holding periods, negatively impacting performance.
Significant Portfolio Changes
In the global long portfolio, our disciplined purchase and sale process led the portfolio management team to reduce exposure to several holdings that reached fair value in our view. The largest exposure reductions during the fiscal year included International Consolidated Airlines Group SA, (United Kingdom), rail based transporter, CSX Corp. (United States), energy services company, Technip SA (France), industrial gas company, Linde AG (Germany), and print & publishing company, RELX NV (Netherlands). Significant increases in exposures this fiscal year included airline operator, Delta Air Lines, Inc. (United States),
pharmaceutical & consumer healthcare company, GlaxoSmithKline Plc (United Kingdom), major passenger railway operator, East Japan Railway Co. (Japan), digital wireless communications equipment manufacturer, QUALCOMM, Inc. (United States), and apparel designer & manufacturer, PVH Corp. (United States). All of these exposures represented new positions for the global long portfolio over the fiscal year.
Long-side exposures to currencies, industries, and countries are a by-product of our bottom-up stock selection process. The global long portfolio’s weights in the utilities, technology hardware & equipment, and consumer durables & apparel industry groups increased the most compared to the beginning of the
| | | | | | |
| | | Causeway Global Absolute Return Fund | | | 3 | |
fiscal year, while weights in the materials, media, and capital goods experienced the greatest decrease. From a regional perspective, the most notable weight changes included higher exposure to companies listed in the United States, United Kingdom, and Canada. The most significantly reduced country weights included France, the Netherlands, and Switzerland. At the end of the fiscal year, the three largest industry group exposures (absolute weights) in the global long portfolio were in pharmaceuticals & biotechnology, banks, and telecommunication services.
In the global short portfolio, consistent with the shorter time horizon of our quantitative investment process, portfolio turnover for the period was higher than that of the long side. Notable names in which we increased short exposure included social network provider, Facebook (United States), waste disposal company, Stericycle (United States), telecommunications operator, AT&T (United States), holdings company, Berkshire Hathaway (United States), and renewable energy generator, Enel Green Power (Italy). Notable names in which we reduced or covered short exposure included wireless tower REIT, Crown Castle International (United States), retailer, Wal-Mart Stores (United States), telecommunications operator, Verizon Communications, Inc. (United States), digital wireless communications equipment manufacturer, QUALCOMM (United States), and robotics equipment manufacturer, Fanuc Corp. (Japan).
In terms of combined long/short positioning, we have increased net exposure (absolute value of long exposures minus short exposures) to the United Kingdom and France and reduced net exposure to the United States and Italy. From an economic sector perspective, we increased net exposure to information technology and utilities and reduced net exposure to industrials and consumer staples. As of September 30, 2015, total gross exposure (leverage) was modestly higher from the end of the prior fiscal year, and net exposure was slightly higher.
Investment Outlook
Recent underperformance of companies with earnings especially sensitive to economic growth has sustained a substantial valuation gap between “cheap” cyclical and more “expensive” defensive stocks. This past summer, the fear trade appeared to reach an extreme, as Chinese domestic equities swooned like the proverbial canary in a coal mine. Even the mine itself looked imperiled. We appear to have a more sanguine view of global gross domestic product (GDP) than market consensus. With regard to the global long portfolio, we have found the overwhelmingly greatest upside potential in companies with economically cyclical earnings. Our one-year expectations currently include a modestly rising level of global demand for crude oil, a concerted effort to boost fiscal spending by the Chinese government, and a resulting bottoming of most commodity prices. We believe that global equity markets will discount a return to reflation many months before such improvement is reflected in the actual economic data. We are most interested in the beneficiaries of an upturn in the U.S. yield curve, such as the highest-quality banks and insurance companies as well as consumer cyclical stocks (especially those likely to benefit from improved consumer spending courtesy of lower energy prices). This partially rosy scenario does depend, however, on some visible effort by the Eurozone and Japanese governments to stimulate weak domestic demand by implementing structural reforms. As the European Central Bank’s Mario Draghi noted last July: “No monetary stimulus, indeed no fiscal stimulus, can be successful unless accompanied by the right structural policies — policies that foster potential growth and instill confidence.”
| | | | |
| 4 | | Causeway Global Absolute Return Fund | | |
The global short portfolio continues to dampen overall portfolio volatility while seeking shorter-term opportunities to the downside. On an aggregate long/short portfolio basis, we are maintaining a near market-neutral posture, with -4.64% net exposure overall (long exposures minus absolute value of short exposures). Consistent with our goal of delivering low equity market sensitivity, we target a 0 expected beta1 to the World Index, but not necessarily zero net dollar exposure. On an aggregate basis, our largest net biases by sector are toward information technology and telecommunications, where we have significant positive net exposure, and against consumer staples and financials, where we have meaningful negative net exposure. By geography, we are net biased toward the United Kingdom and France, and biased against the United States and Italy. Gross exposure (leverage) for the Fund is 310% (3.10x) as of September 30, 2015.
We thank you for your continued confidence in Causeway Global Absolute Return Fund.
September 30, 2015
| | | | |
 | |  | |  |
| | |
| Harry W. Hartford | | Sarah H. Ketterer | | James A. Doyle |
| Portfolio Manager | | Portfolio Manager | | Portfolio Manager |
| | |
 | |  | |  |
| | |
| Jonathan P. Eng | | Conor Muldoon | | Foster Corwith |
| Portfolio Manager | | Portfolio Manager | | Portfolio Manager |
| | |
 | |  | |  |
| | |
| Alessandro Valentini | | Arjun Jayaraman | | MacDuff Kuhnert |
| Portfolio Manager | | Portfolio Manager | | Portfolio Manager |
| 1 | “Beta” is a measurement of sensitivity to the benchmark index. A beta of 1 indicates that a portfolio’s value will move in line with the index. A beta of less than 1 means that the portfolio will be less volatile than the index; a beta of greater than 1 indicates that the security’s price will be more volatile than the index. |
| | | | | | |
| | | Causeway Global Absolute Return Fund | | | 5 | |
| | | | |
 | |  | | |
| | |
| Joseph Gubler | | Ellen Lee | | |
| Portfolio Manager | | Portfolio Manager | | |
The above commentary expresses the portfolio managers’ views as of the date shown and should not be relied upon by the reader as research or investment advice. These views are subject to change. There is no guarantee that any forecasts made will come to pass.
Investing involves risk including loss of principal. In addition to the normal risks associated with investing, international investments may involve risk of capital loss from unfavorable fluctuation in currency values, from differences in generally accepted accounting principles or from economic or political instability in other nations. Emerging markets involve heightened risks related to the same factors as well as increased volatility and lower trading volume. Diversification does not prevent all investment losses.
The Fund is not appropriate for all investors. The Fund uses swap agreements to obtain long and short exposures to securities. Swaps are derivatives which involve the use of leverage, and the Fund will use significant leverage. The use of leverage is speculative and magnifies any losses. Short positions lose money if the price of the underlying security increases, and losses on shorts are therefore potentially unlimited. The use of swap agreements involves significant swap expenses including financing charges and transaction costs which reduce investment returns and increase investment losses. The Fund risks loss of the amount due under a swap agreement if the counterparty defaults. The Fund currently enters into swap agreements primarily with one counterparty, focusing its exposure to the credit risk of that counterparty. Swap agreements involve liquidity risks since the Fund may not be able to exit security exposures immediately, particularly during periods of market turmoil. The Fund settles swap agreements at least monthly which can cause it to realize ordinary income and short-term capital gains, if any, throughout the year that, when distributed to shareholders, will be taxable to them as ordinary income rather than at lower long-term capital gains rates. While the total dollar amounts of long and short exposures are expected to be approximately equal, the global long portfolio and the global short portfolio are managed using different styles and, as a result, will have exposures that will not be hedged. This is not a complete list of the Fund’s risks. See the Fund’s prospectus for additional information on risks.
| | | | |
| 6 | | Causeway Global Absolute Return Fund | | |
Comparison of Change in the Value of a $10,000 Investment in the Causeway Global Absolute Return Fund, Institutional or Investor, versus the BofA Merrill Lynch 3-Month US Treasuries Index
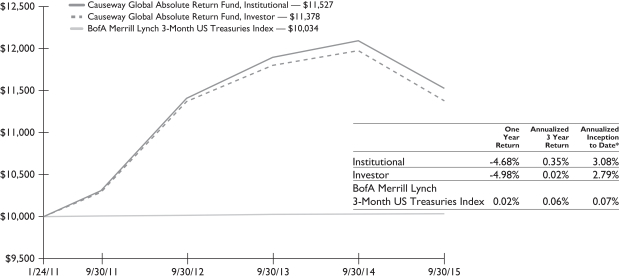
The performance in the above graph does not reflect the deduction of taxes the shareholder will pay on Fund distributions or the redemptions of Fund shares.
*The inception date of Causeway Global Absolute Return Fund was January 24, 2011. The BofA Merrill Lynch 3-Month US Treasury Bill Index inception to date return is from January 24, 2011.
The performance data represents past performance and is not an indication of future results. Investment return and the principal value of an investment will fluctuate so that an investor’s shares, when redeemed, may be worth less than their original cost and current performance may be higher or lower than the performance quoted. For performance data current to the most recent month end, please call 1-866-947-7000 or visit www.causewayfunds.com. Investment performance reflects contractual fee waivers in effect. In the absence of such fee waivers, total return would be reduced. Total returns assume reinvestment of dividends and capital gains distributions at net asset value when paid. Investor Class shares pay a shareholder service fee of up to 0.25% per annum of average daily net assets. Institutional Class shares pay no shareholder service fee. For the fiscal year ended September 30, 2015, the Fund’s gross ratios of expenses in relation to net assets were 1.66% and 1.91% for the Institutional Class and Investor Class, respectively. Until April 30, 2015, the Fund imposed a 2% redemption fee on the value of shares redeemed less than 60 days after purchase. If your account incurred a redemption fee, your performance will be lower than the performance shown here. For more information, please see the prospectus.
The benchmark index for the Global Absolute Return Fund is the BofA Merrill Lynch 3-Month US Treasury Bill Index (the “Index”). This Index is comprised of a single issue purchased at the beginning of the month and held for a full month. Each month the Index is rebalanced and the issue selected is the outstanding Treasury Bill that matures closest to, but not beyond three months from, the rebalancing date. The Index is gross of withholding taxes, assumes reinvestment of dividends and capital gains, and does not reflect the payment of transaction costs, fees and expenses associated with an investment in the Fund. The Treasury Bills comprising the Index are guaranteed by the U.S. government as to the timely payment of interest and principal. The Fund will primarily be exposed to equity securities, which are not guaranteed. It is not possible to invest directly in an index. There are special risks in foreign investing (please see Note 5 in the Notes to Financial Statements).
| | | | | | |
| | | Causeway Global Absolute Return Fund | | | 7 | |
SCHEDULE OF INVESTMENTS (000)*
September 30, 2015
| | | | | | | | |
| Causeway Global Absolute Return Fund | | Number of Shares | | | Value | |
SHORT-TERM INVESTMENT | | | | | | | | |
Dreyfus Cash Management,
Institutional Class, 0.040%**,1 | | | 101,282,694 | | | $ | 101,283 | |
| | | | | | | | |
Total Short-Term Investment | | | | | | | | |
(Cost $101,283) — 103.3% | | | | | | | 101,283 | |
| | | | | | | | |
Total Investments — 103.3% | | | | | | | | |
(Cost $101,283) | | | | | | | 101,283 | |
| | | | | | | | |
Liabilities in Excess of Other Assets — (3.3)% | | | | | | | (3,245 | ) |
| | | | | | | | |
Net Assets — 100.0% | | | | | | $ | 98,038 | |
| | | | | | | | |
A list of outstanding total return swap agreements held by the Fund at September 30, 2015, is as follows:
| | | | | | | | | | | | | | | | | | |
| Counterparty | | Reference Entity/
Obligation | | Fixed Payments Paid | | Total Return Received or Paid | | Termination
Date | | | Net
Notional
Amount2 | | | Net
Unrealized
Depreciation | |
Long Positions† | | | | | | | | | | | | | | | | | | |
Morgan Stanley | | United States Custom Basket of Securities | | Long: Fed Funds-1 day + 0.50% | | Total Return of the basket of securities | | | 2/1/2016 | | | $ | 75,621 | | | $ | (2,430 | ) |
| | | | | | |
Morgan Stanley | | Hong Kong Basket of Securities | | Long: Fed Funds-1 day + 0.55% Short: Fed Funds-1 day – 0.50% | | Total Return of the basket of securities | | | 1/31/2017 | | | | 732 | | | | (763 | ) |
| | | | | | |
Morgan Stanley | | United Kingdom Custom Basket of Securities | | Long: Fed Funds-1 day + 0.55% Short: Fed Funds-1 day – 0.35% | | Total Return of the basket of securities | | | 1/31/2017 | | | | 11,500 | | | | (399 | ) |
| | | | | | |
Morgan Stanley | | South Korea Custom Basket of Securities | | Long: Fed Funds-1 day + 0.85% Short: Fed Funds-1 day – 0.50% to Fed Funds-1 day
– 0.54% | | Total Return of the basket of securities | | | 6/8/2017 | | | | 3,303 | | | | (74 | ) |
| | | | | | |
Morgan Stanley | | Canada Custom Basket of Securities | | Long: Fed Funds-1 day + 0.50% | | Total Return of the basket of securities | | | 3/28/2016 | | | | 2,563 | | | | (282 | ) |
The accompanying notes are an integral part of the financial statements.
| | | | |
| 8 | | Causeway Global Absolute Return Fund | | |
SCHEDULE OF INVESTMENTS (000)* (continued)
September 30, 2015
| | | | | | | | | | | | | | | | | | |
| Counterparty | | Reference Entity/
Obligation | | Fixed Payments Paid | | Total Return Received or Paid | | Termination
Date | | | Net
Notional
Amount2 | | | Net
Unrealized Appreciation (Depreciation) | |
Short Positions†† | | | | | | | | | | | | | | |
Morgan Stanley | | United States Custom Basket of Short Securities | | Short: Fed Funds-1 day – 0.35% to Fed Funds-1 day – 1.28% | | Total Return of the basket of securities | | | 1/31/2017 | | | $ | (84,454 | ) | | $ | 3,251 | |
| | | | | | |
Morgan Stanley | | Canada Custom Basket of Securities | | Short: Fed Funds-1 day – 0.35% to Fed Funds-1 day – 1.03% | | Total Return of the basket of securities | | | 1/31/2017 | | | | (4,960 | ) | | | (265 | ) |
| | | | | | |
Morgan Stanley | | Europe Custom Basket of Securities | | Long: Fed Funds-1 day + 0.55% Short: Fed Funds-1 day – 0.40% | | Total Return of the basket of securities | | | 1/31/2017 | | | | (444 | ) | | | (152 | ) |
| | | | | | |
Morgan Stanley | | Europe Custom Basket of Securities (Local) | | Long: EONIA + 0.55% Short: EONIA-1 day – 0.40% to EONIA-1 day – 0.50% | | Total Return of the basket of securities | | | 11/2/2015 | | | | (2,438 | ) | | | (2,025 | ) |
| | | | | | |
Morgan Stanley | | Japan Custom Basket of Securities | | Long: Fed Funds-1 day + 0.55% Short: Fed Funds-1 day – 0.40 to
– 0.78% | | Total Return of the basket of securities | | | 1/31/2017 | | | | (175 | ) | | | 317 | |
| | | | | | |
Morgan Stanley | | Australia Custom Basket of Securities | | Short: Fed Funds-1 day – 0.50% | | Total Return of the basket of securities | | | 1/31/2017 | | | | (3,720 | ) | | | (82 | ) |
| | | | | | |
Morgan Stanley | | Singapore Custom Basket of Securities | | Short: Fed Funds-1 day – 0.50% | | Total Return of the basket of securities | | | 4/20/2017 | | | | (2,135 | ) | | | 166 | |
| | | | | | | | | | | | | | | | | | |
| | | | | | | | | | | | | | | | $ | (2,738 | ) |
| | | | | | | | | | | | | | | | | | |
| † | The following tables represent the individual stock exposures comprising the Long Custom Basket Total Return Swaps as of September 30, 2015. |
| | | | | | | | | | |
| United States Custom Basket of Securities | |
| Shares | | | Description | | Currency | | Net Unrealized
Appreciation
(Depreciation) | |
| | — | | | Altria Group Inc. | | USD | | $ | 84 | |
| | 23,100 | | | American Express Co. | | USD | | | (61 | ) |
| | 28,000 | | | United Health Group | | USD | | | 21 | |
| | 28,900 | | | Synnex Corp. | | USD | | | 168 | |
The accompanying notes are an integral part of the financial statements.
| | | | | | |
| | | Causeway Global Absolute Return Fund | | | 9 | |
SCHEDULE OF INVESTMENTS (000)* (continued)
September 30, 2015
| | | | | | | | | | |
| United States Custom Basket of Securities (continued) | |
| Shares | | | Description | | Currency | | Net Unrealized
Appreciation
(Depreciation) | |
| | 35,100 | | | PVH Corp. | | USD | | $ | (573 | ) |
| | 39,900 | | | Chevron Corp. | | USD | | | (43 | ) |
| | 42,822 | | | Johnson & Johnson | | USD | | | 3 | |
| | 43,846 | | | Eli Lilly & Co. | | USD | | | 83 | |
| | 44,390 | | | Prudential Financial | | USD | | | (173 | ) |
| | 48,900 | | | Cabelas | | USD | | | (124 | ) |
| | 54,100 | | | SM Energy Co. | | USD | | | (235 | ) |
| | 60,949 | | | Carnival Corp. | | USD | | | 48 | |
| | 61,200 | | | United Continental Holding Inc. | | USD | | | (242 | ) |
| | 63,000 | | | Wells Fargo & Co. | | USD | | | (103 | ) |
| | 68,700 | | | Qualcomm Inc. | | USD | | | (165 | ) |
| | 71,400 | | | National Oilwell Varco Inc. | | USD | | | (302 | ) |
| | 86,700 | | | Delta Airlines Inc. | | USD | | | 92 | |
| | 92,500 | | | PPL Corp. | | USD | | | 234 | |
| | 94,631 | | | Citigroup Inc. | | USD | | | (360 | ) |
| | 105,110 | | | U S G Corp. | | USD | | | (411 | ) |
| | 105,220 | | | Microsoft Corp. | | USD | | | 108 | |
| | 121,743 | | | Mattel Inc. | | USD | | | (244 | ) |
| | 127,596 | | | Oracle Corp. | | USD | | | (126 | ) |
| | 178,751 | | | EMC Corp. | | USD | | | (109 | ) |
| | | | | | | | | | |
| | | | | | | | $ | (2,430 | ) |
| | | | | | | | | | |
| |
| Hong Kong Custom Basket of Securities | | | |
| Shares | | | Description | | Currency | | Net Unrealized
Appreciation
(Depreciation) | |
| | (4,336,000) | | | China Agri | | HKD | | $ | 57 | |
| | (888,000) | | | China Overseas | | HKD | | | (115 | ) |
| | (731,696) | | | Fosun International Ltd. | | HKD | | | (65 | ) |
| | (520,000) | | | AIA | | HKD | | | 187 | |
| | (283,000) | | | Jiangxi Copper | | HKD | | | 14 | |
| | (265,500) | | | Beijing Enterprises | | HKD | | | (42 | ) |
| | (82,000) | | | China Unicom | | HKD | | | 4 | |
| | (50,200) | | | Hong Kong Exchanges and Clearing Ltd. | | HKD | | | 11 | |
The accompanying notes are an integral part of the financial statements.
| | | | |
| 10 | | Causeway Global Absolute Return Fund | | |
SCHEDULE OF INVESTMENTS (000)* (continued)
September 30, 2015
| | | | | | | | | | |
| Hong Kong Custom Basket of Securities (continued) | | | |
| Shares | | | Description | | Currency | | Net Unrealized
Appreciation
(Depreciation) | |
| | (33,000) | | | Galaxy Entertainment Group | | HKD | | $ | 21 | |
| | (217) | | | Sun Hung Kai Properties | | HKD | | | — | |
| | 392,500 | | | China Mobile | | HKD | | | (40 | ) |
| | 451,600 | | | HSBC | | HKD | | | (158 | ) |
| | 589,421 | | | China Mer Holdings | | HKD | | | (224 | ) |
| | 2,193,000 | | | CNOOC Ltd. | | HKD | | | (413 | ) |
| | | | | | | | | | |
| | | | | | | | $ | (763 | ) |
| | | | | | | | | | |
| | |
| United Kingdom Custom Basket of Securities | | | | | |
| Shares | | | Description | | Currency | | Net Unrealized
Appreciation
(Depreciation) | |
| | (586,240) | | | Cable & Wireless Communications | | GBP | | $ | 35 | |
| | (316,041) | | | Royal Bank of Scotland Group | | GBP | | | 129 | |
| | (249,414) | | | Standard Life Assurance Co | | GBP | | | 75 | |
| | (243,505) | | | Rolls-Royce Holdings PLC | | GBP | | | 288 | |
| | (75,934) | | | National Grid | | GBP | | | (52 | ) |
| | (69,769) | | | Tullow Oil | | GBP | | | 61 | |
| | (64,224) | | | Amec Foster Wheeler PLC | | GBP | | | 100 | |
| | (45,882) | | | Prudential PLC | | GBP | | | 16 | |
| | (16,432) | | | Astrazeneca | | GBP | | | (14 | ) |
| | (14,109) | | | Johnson Matthey PLC | | GBP | | | 60 | |
| | (6,045) | | | Pearson PLC | | GBP | | | — | |
| | (1,064) | | | Lonmin PLC | | GBP | | | — | |
| | (1) | | | Rentokil Initial | | GBP | | | — | |
| | 54,803 | | | British American Tobacco PLC | | GBP | | | 138 | |
| | 143,669 | | | SSE PLC | | GBP | | | 15 | |
| | 206,921 | | | Michael Page International PLC | | GBP | | | (67 | ) |
| | 212,316 | | | Glaxosmithkline PLC | | GBP | | | (247 | ) |
| | 564,853 | | | Aviva PLC | | GBP | | | (340 | ) |
| | 916,924 | | | Barclays PLC | | GBP | | | (285 | ) |
| | 936,097 | | | Vodafone | | GBP | | | (311 | ) |
| | | | | | | | | | |
| | | | | | | | $ | (399 | ) |
| | | | | | | | | | |
The accompanying notes are an integral part of the financial statements.
| | | | | | |
| | | Causeway Global Absolute Return Fund | | | 11 | |
SCHEDULE OF INVESTMENTS (000)* (continued)
September 30, 2015
| | | | | | | | | | |
| South Korea Custom Basket of Securities | | | | | |
| Shares | | | Description | | Currency | | Net Unrealized
Appreciation
(Depreciation) | |
| | (16,464) | | | Daewoo International | | KRW | | $ | (3 | ) |
| | — | | | Hyundai Glovis Co. Ltd. | | KRW | | | — | |
| | (928) | | | Hyundai Mobis | | KRW | | | (20 | ) |
| | 7,236 | | | Hyundai Motor | | KRW | | | 92 | |
| | — | | | KB Financial Group | | KRW | | | — | |
| | (13,811) | | | Lotte Shopping | | KRW | | | (215 | ) |
| | (648) | | | Posco | | KRW | | | 8 | |
| | 3,553 | | | Samsung Electronics | | KRW | | | 64 | |
| | (14,574) | | | Samsung SDI | | KRW | | | (301 | ) |
| | (3,114) | | | Shinhan Finance | | KRW | | | (6 | ) |
| | 19,035 | | | SK Telecom | | KRW | | | 307 | |
| | | | | | | | | | |
| | | | | | | | $ | (74 | ) |
| | | | | | | | | | |
| | |
Canada Custom Basket of Securities | | | | | |
| Shares | | | Description | | Currency | | Net Unrealized
Depreciation | |
| | 80,900 | | | Imperial Oil | | CAD | | $ | (282 | ) |
| | | | | | | | | | |
| †† | The following tables represent the individual stock exposures comprising the Short Custom Basket Total Return Swaps as of September 30, 2015. |
| | | | | | | | | | |
| United States Custom Basket of Securities | | | | | |
| Shares | | | Description | | Currency | | Net Unrealized
Appreciation | |
| | (164,000) | | | Hertz Global Holdings Inc. | | USD | | $ | 278 | |
| | (125,600) | | | Wright Medical | | USD | | | 256 | |
| | (113,900) | | | Brookdale Senior Living Inc. | | USD | | | 479 | |
| | (96,900) | | | Yahoo Inc. | | USD | | | 318 | |
| | (96,300) | | | Kinder Morgan Inc. | | USD | | | 455 | |
| | (94,100) | | | AT&T Inc. | | USD | | | 33 | |
| | (89,600) | | | Ford Motor Co. | | USD | | | 8 | |
| | (85,700) | | | Loews Corp. | | USD | | | 20 | |
| | (84,000) | | | Twitter Inc. | | USD | | | 71 | |
The accompanying notes are an integral part of the financial statements.
| | | | |
| 12 | | Causeway Global Absolute Return Fund | | |
SCHEDULE OF INVESTMENTS (000)* (continued)
September 30, 2015
| | | | | | | | | | |
| United States Custom Basket of Securities (continued) | | | | | |
| Shares | | | Description | | Currency | | Net Unrealized
Appreciation
(Depreciation) | |
| | (57,800) | | | Bank of America | | USD | | $ | 39 | |
| | (56,700) | | | Coca Cola Co. | | USD | | | (65 | ) |
| | (55,200) | | | ITC Holdings Corp. | | USD | | | (48 | ) |
| | (53,200) | | | Intel Corp | | USD | | | (98 | ) |
| | (44,200) | | | Procter & Gamble | | USD | | | (59 | ) |
| | (43,200) | | | Medtronic Inc. | | USD | | | 214 | |
| | (35,700) | | | Allstate | | USD | | | (11 | ) |
| | (34,900) | | | Facebook Inc. | | USD | | | (17 | ) |
| | (32,996) | | | Energy Transfer Partners | | USD | | | 253 | |
| | (31,400) | | | American Homes 4 Rent | | USD | | | (5 | ) |
| | (29,900) | | | KLA-Tencor | | USD | | | (52 | ) |
| | (29,200) | | | American International Group | | USD | | | 94 | |
| | (25,200) | | | Baxter International, Inc. | | USD | | | 138 | |
| | (23,300) | | | Berkshire | | USD | | | 84 | |
| | (22,300) | | | ResMed | | USD | | | 15 | |
| | (22,100) | | | Stericycle Inc. | | USD | | | 22 | |
| | (21,200) | | | Starbucks Corp. | | USD | | | (45 | ) |
| | (19,800) | | | Praxair Inc. | | USD | | | 55 | |
| | (19,600) | | | Philip Morris | | USD | | | (19 | ) |
| | (16,000) | | | United Parcel Service | | USD | | | (34 | ) |
| | (15,900) | | | Aetna Inc. | | USD | | | 48 | |
| | (15,800) | | | McKesson Corp. | | USD | | | 193 | |
| | (14,600) | | | Idexx Labs | | USD | | | (41 | ) |
| | (14,600) | | | Insulet Corp. | | USD | | | 42 | |
| | (14,400) | | | Treehouse Foods | | USD | | | 22 | |
| | (13,900) | | | Apple Inc. | | USD | | | 34 | |
| | (13,300) | | | JPMorgan Chase & Co. | | USD | | | 41 | |
| | (13,200) | | | Schlumberger Ltd. | | USD | | | 104 | |
| | (12,300) | | | Monsanto | | USD | | | 143 | |
| | (12,100) | | | Visa Inc. | | USD | | | 18 | |
| | (10,400) | | | WP Glimcher Inc. | | USD | | | 2 | |
| | (8,900) | | | Wynn Resorts | | USD | | | 195 | |
| | (8,100) | | | Darling Ingredients Inc. | | USD | | | 13 | |
| | (7,800) | | | LinkedIn Corp | | USD | | | (78 | ) |
| | (7,600) | | | Tesla Motors | | USD | | | 3 | |
The accompanying notes are an integral part of the financial statements.
| | | | | | |
| | | Causeway Global Absolute Return Fund | | | 13 | |
SCHEDULE OF INVESTMENTS (000)* (continued)
September 30, 2015
| | | | | | | | | | |
| United States Custom Basket of Securities (continued) | | | | | |
| Shares | | | Description | | Currency | | Net Unrealized
Appreciation
(Depreciation) | |
| | (6,800) | | | Du Pont Co. | | USD | | $ | 15 | |
| | (6,100) | | | Cerner Corp. | | USD | | | 11 | |
| | (4,500) | | | Biogen Inc. | | USD | | | 36 | |
| | (4,300) | | | Enterprise Products Partners L.P. | | USD | | | 14 | |
| | (4,100) | | | Transdigm Group, Inc. | | USD | | | 60 | |
| | (2,900) | | | Alliance Data | | USD | | | (5 | ) |
| | (2,800) | | | Air Methods | | USD | | | 9 | |
| | (2,700) | | | Colfax Group | | USD | | | 24 | |
| | (2,700) | | | Fastenal Co. | | USD | | | 5 | |
| | (2,600) | | | Intercontinential Exchange, Inc. | | USD | | | (26 | ) |
| | (2,500) | | | Tyson Foods | | USD | | | (4 | ) |
| | (2,000) | | | Chipotle Mexican Grill | | USD | | | (21 | ) |
| | (1,700) | | | Dominion Resources, Inc. | | USD | | | (2 | ) |
| | (1,500) | | | Taubman Centers, Inc. | | USD | | | (1 | ) |
| | (1,400) | | | Harris Corp. | | USD | | | 2 | |
| | (1,200) | | | Mcdonalds Corp. | | USD | | | (5 | ) |
| | (1,200) | | | Union Pacific | | USD | | | (4 | ) |
| | (900) | | | J M Smucker | | USD | | | 3 | |
| | (900) | | | Vertex Pharmaceuticals, Inc. | | USD | | | 21 | |
| | (800) | | | Amazon.Com Inc. | | USD | | | (2 | ) |
| | (800) | | | Fleetcor Technologies Inc. | | USD | | | 9 | |
| | (600) | | | Palo Alto Network Inc. | | USD | | | (6 | ) |
| | | | | | | | | | |
| | | | | | | | $ | 3,251 | |
| | | | | | | | | | |
| | |
| Canada Custom Basket of Securities | | | | | |
| Shares | | | Description | | Currency | | Net Unrealized
Appreciation
(Depreciation) | |
| | (1,868,300) | | | Bombardier | | CAD | | $ | (508 | ) |
| | (67,800) | | | Enbridge | | CAD | | | 240 | |
| | (3,300) | | | Telus Corp. | | CAD | | | 3 | |
| | (100) | | | Blackberry Ltd. | | CAD | | | — | |
| | | | | | | | | | |
| | | | | | | | $ | (265 | ) |
| | | | | | | | | | |
The accompanying notes are an integral part of the financial statements.
| | | | |
| 14 | | Causeway Global Absolute Return Fund | | |
SCHEDULE OF INVESTMENTS (000)* (continued)
September 30, 2015
| | | | | | | | | | |
| Europe Custom Basket of Securities | | | | | |
| Shares | | | Description | | Currency | | Net Unrealized
Appreciation
(Depreciation) | |
| | (42,366) | | | Nestle AG | | CHF | | $ | (58 | ) |
| | (10,108) | | | Dufry AG | | CHF | | | 177 | |
| | 42,746 | | | Novartis AG | | CHF | | | (271 | ) |
| | | | | | | | | | |
| | | | | | | | $ | (152 | ) |
| | | | | | | | | | |
| | |
| Europe Custom Basket of Securities (Local) | | | | | |
| Shares | | | Description | | Currency | | Net Unrealized
Appreciation
(Depreciation) | |
| | (1,591,117) | | | Enel Green Power SpA | | EUR | | $ | 14 | |
| | (428,476) | | | Unicredito SpA | | EUR | | | 123 | |
| | (221,419) | | | Telefonica Esp | | EUR | | | 434 | |
| | (52,501) | | | Deutsche Bank AG | | EUR | | | 129 | |
| | (33,905) | | | BMW | | EUR | | | 112 | |
| | (23,595) | | | Anheuser Busch InBev | | EUR | | | 59 | |
| | (23,204) | | | ASML Holding NV | | EUR | | | 90 | |
| | (14,000) | | | Daimler AG | | EUR | | | 78 | |
| | (3,587) | | | Fresenius Medical Care | | EUR | | | (12 | ) |
| | (1,506) | | | BASF SE | | EUR | | | 6 | |
| | 27,478 | | | Volkswagen AG | | EUR | | | (2,123 | ) |
| | 37,227 | | | Sanofi | | EUR | | | (138 | ) |
| | 53,926 | | | Schneider SA | | EUR | | | (382 | ) |
| | 64,958 | | | Akzo Nobel | | EUR | | | (172 | ) |
| | 571,967 | | | Caixa Bank | | EUR | | | (266 | ) |
| | 571,967 | | | Caixa Bank SA | | EUR | | | 23 | |
| | | | | | | | | | |
| | | | | | | | $ | (2,025 | ) |
| | | | | | | | | | |
| | |
| Japan Custom Basket of Securities | | | | | |
| Shares | | | Description | | Currency | | Net Unrealized
Appreciation | |
| | (142,200) | | | Seibu Holdings Inc. | | JPY | | $ | 257 | |
| | (114,100) | | | Nippon Paint Holdings Co. Ltd. | | JPY | | | 303 | |
| | (78,800) | | | Honda Motor Co. Ltd. | | JPY | | | 151 | |
The accompanying notes are an integral part of the financial statements.
| | | | | | |
| | | Causeway Global Absolute Return Fund | | | 15 | |
SCHEDULE OF INVESTMENTS (000)* (continued)
September 30, 2015
| | | | | | | | | | |
| Japan Custom Basket of Securities (continued) | | | | | |
| Shares | | | Description | | Currency | | Net Unrealized
Appreciation
(Depreciation) | |
| | (53,600) | | | Softbank Corp. | | JPY | | $ | 671 | |
| | (28,000) | | | Rakuten Inc. | | JPY | | | 25 | |
| | (12,000) | | | Toray Industries Inc. | | JPY | | | 3 | |
| | (11,600) | | | Sumco Corp. | | JPY | | | 4 | |
| | (10,700) | | | Ricoh Co. Ltd. | | JPY | | | (4 | ) |
| | (3,400) | | | Canon Inc. | | JPY | | | 6 | |
| | (3,100) | | | Takeda Pharmaceutical Co. Ltd. | | JPY | | | 15 | |
| | (1,500) | | | Eisai Co. Tld. | | JPY | | | 8 | |
| | 48,000 | | | East Japan Railway Co. | | JPY | | | (396 | ) |
| | 166,800 | | | Kddi Corp. | | JPY | | | (411 | ) |
| | 539,000 | | | Hitachi Ltd. | | JPY | | | (315 | ) |
| | | | | | | | | | |
| | | | | | | | $ | 317 | |
| | | | | | | | | | |
| | |
| Australia Custom Basket of Securities | | | | | |
| Shares | | | Description | | Currency | | Net Unrealized
Appreciation
(Depreciation) | |
| | (161,548) | | | APA Group | | AUD | | $ | (36 | ) |
| | (46,206) | | | Commonwealth Bank of Australia | | AUD | | | 20 | |
| | (45,926) | | | Telstra Corp. | | AUD | | | — | |
| | (28,967) | | | Insurance Australia Ltd. | | AUD | | | 3 | |
| | (1,675) | | | CSL Ltd. | | AUD | | | 3 | |
| | — | | | Scentre Group REIT | | AUD | | | (72 | ) |
| | | | | | | | | | |
| | | | | | | | $ | (82 | ) |
| | | | | | | | | | |
| | |
| Singapore Custom Basket of Securities | | | | | |
| Shares | | | Description | | Currency | | Net Unrealized
Appreciation | |
| | (990,300) | | | Global Logistic Properties | | SGD | | $ | 133 | |
| | (282,700) | | | Singtel | | SGD | | | 33 | |
| | | | | | | | | | |
| | | | | | | | $ | 166 | |
| | | | | | | | | | |
The accompanying notes are an integral part of the financial statements.
| | | | |
| 16 | | Causeway Global Absolute Return Fund | | |
SCHEDULE OF INVESTMENTS (000)* (concluded)
September 30, 2015
| ** | The rate reported is the 7-day effective yield as of September 30, 2015. |
| 1 | Of this investment, $82,471 (000) was pledged and segregated with the custodian as collateral for outstanding total return equity swap agreements. |
| 2 | The net notional amount is the sum of long and short positions. The gross notional amount of long positions and short positions at September 30, 2015 is $93,719 (000) and $(98,326) (000), respectively. The gross notional amounts are representative of the volume of activity during the fiscal year ended September 30, 2015. |
| GBP | British Pound Sterling |
| REIT | Real Estate Investment Trust |
Amounts designated as “—” are $0 or round to $0.
The accompanying notes are an integral part of the financial statements.
| | | | | | |
| | | Causeway Global Absolute Return Fund | | | 17 | |
SECTOR DIVERSIFICATION
As of September 30, 2015, the sector diversification was as follows (Unaudited):
| | | | |
| Causeway Global Absolute Return Fund | | % of Net Assets | |
| Short-Term Investment | | | 103.3% | |
| | | | |
| Liabilities in Excess of Other Assets | | | -3.3 | |
| | | | |
| Net Assets | | | 100.0% | |
| | | | |
The accompanying notes are an integral part of the financial statements.
| | | | |
| 18 | | Causeway Global Absolute Return Fund | | |
STATEMENT OF ASSETS AND LIABILITIES (000)*
| | | | |
| | �� | CAUSEWAY GLOBAL
ABSOLUTE RETURN
FUND | |
| |
| | | 9/30/15 | |
ASSETS: | | | | |
Investments at Value (Cost $101,283) | | $ | 101,283 | |
Unrealized Appreciation on Total Return Swaps | | | 3,734 | |
Receivable for Fund Shares Sold | | | 52 | |
Prepaid Expenses | | | 6 | |
Receivable for Dividends | | | 1 | |
| | | | |
Total Assets | | | 105,076 | |
| | | | |
LIABILITIES: | | | | |
Unrealized Depreciation on Total Return Swaps | | | 6,472 | |
Payable for Fund Shares Redeemed | | | 291 | |
Payable Due to Adviser | | | 123 | |
Due to Custodian | | | 49 | |
Payable for Shareholder Services Fees — Investor Class | | | 21 | |
Payable Due to Administrator | | | 3 | |
Payable for Trustees’ Fees | | | 1 | |
Other Accrued Expenses | | | 78 | |
| | | | |
Total Liabilities | | | 7,038 | |
| | | | |
Net Assets | | $ | 98,038 | |
| | | | |
NET ASSETS: | | | | |
Paid-in Capital (unlimited authorization — no par value) | | $ | 106,972 | |
Undistributed Net Investment Income | | | 5,490 | |
Accumulated Net Realized Loss on Investments | | | (11,686 | ) |
Net Unrealized Depreciation on Swap Contracts | | | (2,738 | ) |
| | | | |
Net Assets | | $ | 98,038 | |
| | | | |
Net Asset Value Per Share (based on net assets of
$71,204,355 ÷ 6,852,816 shares) — Institutional Class | | | $10.39 | |
| | | | |
Net Asset Value Per Share (based on net assets of
$26,833,200 ÷ 2,605,364 shares) — Investor Class | | | $10.30 | |
| | | | |
| * | Except for Net Asset Value data. |
The accompanying notes are an integral part of the financial statements.
| | | | | | |
| | | Causeway Global Absolute Return Fund | | | 19 | |
STATEMENT OF OPERATIONS (000)
| | | | |
| | | CAUSEWAY GLOBAL
ABSOLUTE RETURN
FUND | |
| |
| | | 10/01/14 to
9/30/15 | |
INVESTMENT INCOME: | | | | |
Interest | | $ | 24 | |
| | | | |
Total Investment Income | | | 24 | |
| | | | |
EXPENSES: | | | | |
Investment Advisory Fees | | | 2,056 | |
Shareholder Service Fees — Investor Class | | | 86 | |
Transfer Agent Fees | | | 72 | |
Administration Fees | | | 44 | |
Professional Fees | | | 34 | |
Printing Fees | | | 27 | |
Registration Fees | | | 22 | |
Custodian Fees | | | 13 | |
Trustees’ Fees | | | 5 | |
Pricing Fees | | | 1 | |
Other Fees | | | 7 | |
| | | | |
Total Expenses | | | 2,367 | |
| | | | |
Net Investment Loss | | | (2,343 | ) |
| | | | |
Net Realized and Unrealized Gain (Loss) on Swap Contracts: | | | | |
Net Realized Gain from Swap Contracts | | | 392 | |
Net Change in Unrealized Depreciation on Swap Contracts | | | (5,378 | ) |
| | | | |
Net Realized and Unrealized Loss on Swap Contracts | | | (4,986 | ) |
| | | | |
| Net Decrease in Net Assets Resulting from Operations | | $ | (7,329 | ) |
| | | | |
The accompanying notes are an integral part of the financial statements.
| | | | |
| 20 | | Causeway Global Absolute Return Fund | | |
STATEMENTS OF CHANGES IN NET ASSETS (000)
| | | | | | | | |
| | | CAUSEWAY GLOBAL
ABSOLUTE RETURN FUND | |
| | |
| | | 10/01/14 to
9/30/15 | | | 10/01/13 to
9/30/14 | |
OPERATIONS: | | | | | | | | |
Net Investment Loss | | $ | (2,343 | ) | | $ | (2,121 | ) |
Net Realized Gain from Swap Contracts | | | 392 | | | | 1,143 | |
Net Change in Unrealized Appreciation (Depreciation) on Swap Contracts | | | (5,378 | ) | | | 2,694 | |
| | | | | | | | |
Net Increase (Decrease) in Net Assets Resulting From Operations | | | (7,329 | ) | | | 1,716 | |
| | | | | | | | |
DIVIDENDS AND DISTRIBUTIONS TO SHAREHOLDERS: | | | | | | | | |
Dividends from Net Investment Income: | | | | | | | | |
Institutional Class | | | — | | | | (2,436 | ) |
Investor Class | | | — | | | | (1,424 | ) |
| | | | | | | | |
Total Dividends from Net Investment Income | | | — | | | | (3,860 | ) |
| | | | | | | | |
Net Increase (Decrease) in Net Assets Derived from Capital Share Transactions(1) | | | (60,561 | ) | | | 105,357 | |
Redemption Fees(2) | | | 20 | | | | 42 | |
| | | | | | | | |
Total Increase (Decrease) in Net Assets | | | (67,870 | ) | | | 103,255 | |
| | | | | | | | |
NET ASSETS: | | | | | | | | |
Beginning of Year | | | 165,908 | | | | 62,653 | |
| | | | | | | | |
End of Year | | $ | 98,038 | | | $ | 165,908 | |
| | | | | | | | |
Undistributed (Distributions in Excess of) Net Investment Income | | $ | 5,490 | | | $ | (1,014 | ) |
| | | | | | | | |
| (1) | See Note 7 in the Notes to Financial Statements. |
| (2) | See Note 2 in the Notes to Financial Statements. |
Amount designated as “—” is $0 or has been rounded to $0.
The accompanying notes are an integral part of the financial statements.
| | | | | | |
| | | Causeway Global Absolute Return Fund | | | 21 | |
FINANCIAL HIGHLIGHTS
For the fiscal years or period ended September 30,
For a Share Outstanding Throughout the Fiscal Years or Period
| | | | | | | | | | | | | | | | | | | | | | | | | | | | | | | | |
| | | Net Asset
Value,
Beginning
of Period ($) | | | Net
Investment
Loss ($) | | | Net Realized
and
Unrealized
Gain
(Loss) on
Investments ($) | | | Total
from
Operations ($) | | | Dividends
from Net
Investment
Income ($) | | | Distributions
from
Capital
Gains ($) | | | Total
Dividends
and
Distributions ($) | | | Redemption
Fees ($) | |
CAUSEWAY GLOBAL ABSOLUTE RETURN FUND† | |
Institutional | | | | | | | | | | | | | | | | | | | | | | | | | | | | | |
2015 | | | 10.90 | | | | (0.18 | ) | | | (0.33 | ) | | | (0.51 | ) | | | — | | | | — | | | | — | | | | — | (1) |
2014 | | | 11.15 | | | | (0.18 | ) | | | 0.36 | | | | 0.18 | | | | (0.43 | ) | | | — | | | | (0.43 | ) | | | — | |
2013 | | | 10.99 | | | | (0.18 | ) | | | 0.62 | | | | 0.44 | | | | (0.28 | ) | | | — | | | | (0.28 | ) | | | — | |
2012 | | | 10.31 | | | | (0.19 | ) | | | 1.28 | | | | 1.09 | | | | (0.10 | ) | | | (0.31 | ) | | | (0.41 | ) | | | — | |
2011(2)(3) | | | 10.00 | | | | (0.12 | ) | | | 0.43 | | | | 0.31 | | | | — | | | | — | | | | — | | | | — | |
Investor | | | | | | | | | | | | | | | | | | | | | | | | | | | | | |
2015 | | | 10.84 | | | | (0.20 | ) | | | (0.34 | ) | | | (0.54 | ) | | | — | | | | — | | | | — | | | | — | (1) |
2014 | | | 11.09 | | | | (0.21 | ) | | | 0.37 | | | | 0.16 | | | | (0.41 | ) | | | — | | | | (0.41 | ) | | | — | |
2013 | | | 10.96 | | | | (0.20 | ) | | | 0.59 | | | | 0.39 | | | | (0.26 | ) | | | — | | | | (0.26 | ) | | | — | |
2012 | | | 10.29 | | | | (0.21 | ) | | | 1.28 | | | | 1.07 | | | | (0.09 | ) | | | (0.31 | ) | | | (0.40 | ) | | | — | |
2011(2)(3) | | | 10.00 | | | | (0.15 | ) | | | 0.44 | | | | 0.29 | | | | — | | | | — | | | | — | | | | — | |
| (1) | Amount represents less than $0.01 per share. |
| (2) | Commenced operations on January 24, 2011. |
| (3) | All ratios for periods less than one year are annualized. Total returns and portfolio turnover rate are for the period indicated and have not been annualized. |
| † | Per share amounts calculated using average shares method. |
Amounts designated as “—” are $0 or round to $0.
The accompanying notes are an integral part of the financial statements.
| | | | |
| 22 | | Causeway Global Absolute Return Fund | | |
| | | | | | | | | | | | | | | | | | | | | | | | | | |
Net Asset
Value, End
of Period ($) | | | Total
Return (%) | | | Net Assets,
End of
Period
($000) | | | Ratio of
Expenses to
Average Net
Assets (%) | | | Ratio of
Expenses
to Average
Net Assets
(Excluding
Reimburse- ments) (%) | | | Ratio
of Net
Investment
Loss
to Average
Net Assets (%) | | | Portfolio
Turnover
Rate (%) | |
| | | | | | | | | | | | | | | | | | | | | | | | | | |
| | | | | | | | | | | | | | | | | | | | | | | | | | |
| | 10.39 | | | | (4.68 | ) | | | 71,205 | | | | 1.66 | | | | 1.66 | | | | (1.65 | ) | | | — | |
| | 10.90 | | | | 1.64 | | | | 120,731 | | | | 1.71 | | | | 1.71 | | | | (1.68 | ) | | | — | |
| | 11.15 | | | | 4.29 | | | | 32,888 | | | | 1.75 | | | | 1.94 | | | | (1.69 | ) | | | — | |
| | 10.99 | | | | 10.65 | | | | 30,986 | | | | 1.82 | | | | 2.31 | | | | (1.75 | ) | | | — | |
| | 10.31 | | | | 3.10 | | | | 11,444 | | | | 1.85 | | | | 3.51 | | | | (1.77 | ) | | | — | |
| | | | | | | | | | | | | | | | | | | | | | | | | | |
| | 10.30 | | | | (4.98 | ) | | | 26,833 | | | | 1.91 | | | | 1.91 | | | | (1.90 | ) | | | — | |
| | 10.84 | | | | 1.46 | | | | 45,177 | | | | 1.96 | | | | 1.96 | | | | (1.93 | ) | | | — | |
| | 11.09 | | | | 3.79 | | | | 29,765 | | | | 2.00 | | | | 2.19 | | | | (1.94 | ) | | | — | |
| | 10.96 | | | | 10.50 | | | | 32,139 | | | | 2.07 | | | | 2.54 | | | | (1.99 | ) | | | — | |
| | 10.29 | | | | 2.90 | | | | 2,855 | | | | 2.10 | | | | 3.33 | | | | (2.06 | ) | | | — | |
The accompanying notes are an integral part of the financial statements.
| | | | | | |
| | | Causeway Global Absolute Return Fund | | | 23 | |
NOTES TO FINANCIAL STATEMENTS
Causeway Global Absolute Return Fund (the “Fund”) is a series of Causeway Capital Management Trust (the “Trust”). The Trust is an open-end management investment company registered under the Investment Company Act of 1940, as amended (the “1940 Act”) and is a Delaware statutory trust that was established on August 10, 2001. The Fund commenced operations on January 24, 2011. The Fund is authorized to offer two classes of shares, the Institutional Class and the Investor Class. The Declaration of Trust authorizes the issuance of an unlimited number of shares of beneficial interest of the Fund. The Fund is diversified. The Fund’s prospectus provides a description of the Fund’s investment objectives, policies and strategies. The Trust has five additional series, the financial statements of which are presented separately.
| 2. | | Significant Accounting Policies |
The following is a summary of the significant accounting policies consistently followed by the Fund.
Use of Estimates in the Preparation of Financial Statements – The Fund is an investment company that applies the accounting and reporting guidance issued in Topic 946 by the U.S. Financial Accounting Standards Board. The Fund’s financial statements have been prepared to comply with U.S. generally accepted accounting principles (“U.S. GAAP”). The preparation of financial statements in conformity with U.S. GAAP requires management to make estimates and assumptions that affect the reported amount of net assets and liabilities and disclosure of contingent assets and liabilities at the date of the financial statements and the reported amounts of increases and decreases in net assets from operations during the reporting period. Actual results could differ from those estimates.
Security Valuation – Over-the-counter financial derivative instruments, such as swap agreements, derive their value from underlying asset prices, indices, reference rates, and other inputs, or a combination of these factors. These contracts are normally valued on the basis of broker dealer (i.e. swap counterparty) quotations.
Except as described below, securities listed on a securities exchange (except the NASDAQ Stock Market (“NASDAQ”)), or Over-the-Counter (“OTC”) for which market quotations are available are valued at the last reported sale price as of the close of trading on each business day, or, if there is no such reported sale, at the last reported bid price for long positions. For securities traded on NASDAQ, the NASDAQ Official Closing Price will be used. Securities listed on multiple exchanges or OTC markets are valued on the exchange or OTC market considered by the Fund to be the primary market. The prices for foreign securities are reported in local currency and converted to U.S. dollars using currency exchange rates. If a security price cannot be obtained from an independent pricing agent, the Fund seeks to obtain a bid price from at least one independent broker. Investments in the Dreyfus Cash Management money market fund are valued daily at the net asset value per share.
Securities and derivative contracts for which market prices are not “readily available” are valued in accordance with fair value pricing procedures approved by the Fund’s Board of Trustees (the “Board”). The Fund’s fair value pricing procedures are implemented through a fair value committee (the “Committee”) designated by the Board. Some of the more common reasons that may necessitate that a security be valued using fair value pricing procedures include: the security’s trading has been halted or suspended; the security has been delisted from a national exchange; the security’s primary trading market is temporarily closed at a time when under
| | | | |
| 24 | | Causeway Global Absolute Return Fund | | |
NOTES TO FINANCIAL STATEMENTS
(continued)
normal conditions it would be open; the security’s primary pricing source is not able or willing to provide a price; or the security is a swap agreement that is not publicly traded. When the Committee values a security in accordance with the fair value pricing procedures, the Committee will determine the value after taking into consideration relevant information reasonably available to the Committee.
In accordance with the authoritative guidance on fair value measurements and disclosure under U.S. GAAP, the Fund discloses fair value of its investments in a hierarchy that prioritizes the inputs to valuation techniques used to measure the fair value. The objective of a fair value measurement is to determine the price that would be received to sell an asset or paid to transfer a liability in an orderly transaction between market participants at the measurement date (an exit price). Accordingly, the fair value hierarchy gives the highest priority to quoted prices (unadjusted) in active markets for identical assets or liabilities (Level 1) and the lowest priority to unobservable inputs (Level 3). The guidance establishes three levels of fair value hierarchy as follows:
| | • | | Level 1 — Unadjusted quoted prices in active markets for identical, unrestricted assets or liabilities that the Fund has the ability to access at the measurement date; |
| | • | | Level 2 — Quoted prices in markets which are not active, or prices based on inputs that are observable (either directly or indirectly) for substantially the full term of the asset or liability; and |
| | • | | Level 3 — Prices, inputs or exotic modeling techniques which are both significant to the fair value measurement and unobservable (supported by little or no market activity). |
Investments are classified within the level of the lowest significant input considered in determining fair value. Investments classified within Level 3 which fair value measurement considers several inputs may include Level 1 or Level 2 inputs as components of the overall fair value measurement.
The table below sets forth information about the levels within the fair value hierarchy at which the Fund’s investments and other financial instruments are measured at September 30, 2015:
| | | | | | | | | | | | | | | | |
Investments in
Securities | | Level 1
(000) | | | Level 2
(000) | | | Level 3
(000) | | | Total
(000) | |
| Short-Term Investment | | $ | 101,283 | | | $ | — | | | $ | — | | | $ | 101,283 | |
| | | | |
| Total Investments in Securities | | $ | 101,283 | | | $ | — | | | $ | — | | | $ | 101,283 | |
| | | | |
| | | | |
Other Financial
Instruments | | Level 1
(000) | | | Level 2
(000) | | | Level 3
(000) | | | Total
(000) | |
Total Return Equity Swaps* | | | | | | | | | | | | | | | | |
Unrealized Appreciation | | $ | — | | | $ | 3,734 | | | $ | — | | | $ | 3,734 | |
Unrealized Depreciation | | | — | | | | (6,472 | ) | | | — | | | | (6,472 | ) |
| | | | | | | | | | | | | | | | |
| | $ | — | | | $ | (2,738 | ) | | $ | — | | | $ | (2,738 | ) |
| | | | | | | | | | | | | | | | |
| * | Total return swap contracts are valued at the unrealized appreciation (depreciation) of the instrument. |
Please refer to the Schedule of Investments for additional information regarding the composition of the amounts listed above.
Changes in valuation techniques may result in transfers in or out of an investment’s assigned level within the hierarchy during the reporting period. For the fiscal year ended September 30, 2015, there were no transfers between Level 1 and Level 2 based on the input level assigned under the hierarchy at the beginning and end of the reporting period.
For the fiscal year ended September 30, 2015, there were no significant changes to the Fund’s fair value methodologies.
| | | | | | |
| | | Causeway Global Absolute Return Fund | | | 25 | |
NOTES TO FINANCIAL STATEMENTS
(continued)
Federal Income Taxes – It is the Fund’s intention to continue to qualify as a regulated investment company under Subchapter M of the Internal Revenue Code and to distribute all of its taxable income. Accordingly, no provision for Federal income taxes has been made in the financial statements.
The Fund evaluates tax positions taken or expected to be taken in the course of preparing the Fund’s tax returns to determine whether it is “more-likely-than not” (i.e., greater than 50-percent) that each tax position will be sustained upon examination by a taxing authority based on the technical merits of the position. Tax positions not deemed to meet the more likely- than-not threshold are recorded as a tax benefit or expense in the current year. The Fund did not record any tax provision in the current period. However, management’s conclusions regarding tax positions taken may be subject to review and adjustment at a later date based on factors including, but not limited to, examination by tax authorities (i.e., the last 3 tax year ends, as applicable), on-going analysis of and changes to tax laws, regulations and interpretations thereof.
As of and during the fiscal year ended September 30, 2015, the Fund did not have a liability for any unrecognized tax benefits. The Fund recognizes interest and penalties, if any, related to unrecognized tax benefits as income tax expense in the Statement of Operations. During the period, the Fund did not incur any significant interest or penalties.
Security Transactions and Related Income – Security transactions are accounted for on the date the security is purchased or sold (trade date). Dividend income is recognized on the ex-dividend date, and interest income is recognized using the accrual basis of accounting. Costs used in determining realized gains and losses on the sales of investment securities are those of the specific securities sold.
Swap Agreements – Under a swap agreement, the Fund pays the other party to the agreement (a “swap counterparty”) fees plus an amount equal to any negative total returns from stipulated underlying investments identified by the Fund’s portfolio managers. In exchange, the counterparty pays the Fund an amount equal to any positive total returns from the stipulated underlying investments. The returns to be “swapped” between the Fund and the swap counterparty will be calculated with reference to a “notional” amount, i.e., the dollar amount hypothetically invested, long or short, in a particular security or group of securities. The Fund’s returns will generally depend on the net amount to be paid or received under the swap agreement, which will depend on the market movements of the stipulated underlying securities. The Fund’s net asset value will reflect any amounts owed to the Fund by the swap counterparty (when the Fund’s position under a swap agreement is, on a net basis, “in the money”) or amounts owed by the Fund to the counterparty (when the Fund’s position under a swap agreement is, on a net basis, “out of the money”).
Swap Agreements and Leverage – Normally, the Fund’s assets (other than the swap agreements) will be directly invested primarily in money market instruments and U.S. Treasury securities that will be used to support and cover the Fund’s obligations under its swap agreements. However, the use of a swap agreement allows the Fund to obtain investment exposures greater than it could otherwise obtain with direct investments, allowing it to effectively increase, or leverage, its total long and short investment exposures.
Expense/Classes – Expenses that are directly related to one Fund of the Trust are charged directly to that Fund. Other operating expenses of the Trust are prorated to the Fund and the other series of the Trust on the basis
| | | | |
| 26 | | Causeway Global Absolute Return Fund | | |
NOTES TO FINANCIAL STATEMENTS
(continued)
of relative daily net assets. Class specific expenses are borne by that class of shares. Income, realized and unrealized gains/losses and non-class specific expenses are allocated to the respective classes on the basis of relative daily net assets.
Dividends and Distributions – Dividends from net investment income, if any, are declared and paid on an annual basis. Any net realized capital gains on sales of securities are distributed to shareholders at least annually.
Redemption Fee – Until April 30, 2015, the Fund imposed a redemption fee of 2% on the value of capital shares redeemed by shareholders less than 60 days after purchase. The redemption fee also applied to exchanges from the Fund. The redemption fee was paid to the Fund. The redemption fee did not apply to shares purchased through reinvested distributions or shares redeemed through designated systematic withdrawal plans. The redemption fee did not normally apply to accounts designated as omnibus accounts with the transfer agent. These are arrangements through financial intermediaries where the purchase and sale orders of a number of persons are aggregated before being communicated to the Fund. However, the Fund may have sought agreements with these intermediaries to impose the Fund’s redemption fee or a different redemption fee on their customers if feasible, or to impose other appropriate restrictions on excessive short-term trading. The officers of the Fund may have waived the redemption fee for shareholders in asset allocation and similar investment programs reasonably believed not to be engaged in short-term market timing, including for holders of shares purchased by Causeway Capital Management LLC (the “Adviser”) for its clients to rebalance their portfolios. For the fiscal year ended September 30, 2015, the Institutional Class and Investor Class retained $19,329 and $607 in redemption fees, respectively. The redemption fee no longer applies after April 30, 2015.
| 3. | | Investment Advisory, Administration, Shareholder Service and Distribution Agreements |
The Trust, on behalf of the Fund, has entered into an Investment Advisory Agreement (the “Advisory
Agreement”) with the Adviser. Under the Advisory Agreement, the Adviser is entitled to a monthly fee equal to an annual rate of 1.50% of the Fund’s average daily net assets. The Adviser contractually agreed through January 31, 2016 to waive its fee and, to the extent necessary, reimburse the Fund to keep total annual fund operating expenses (excluding swap agreement financing charges and transaction costs, borrowing expenses, dividend expenses on securities sold short, brokerage fees and commissions, interest, taxes, shareholder service fees, fees and expenses of other funds in which the Fund invests, and extraordinary expenses) from exceeding 1.75% of Institutional Class and Investor Class average daily net assets. No waivers or reimbursements were required for the fiscal year ended September 30, 2015.
The Trust and SEI Investments Global Funds Services (the “Administrator”) have entered into an Administration Agreement. Under the terms of the Administration Agreement, the Administrator is entitled to an annual fee which is calculated daily and paid monthly based on the aggregate average daily net assets of the Trust subject to a minimum annual fee.
The Trust has adopted a Shareholder Service Plan and Agreement for Investor Class shares that allows the Trust to pay broker-dealers and other financial intermediaries a fee of up to 0.25% per annum of average daily net assets for services provided to Investor Class shareholders. For the fiscal year ended September 30, 2015, the Investor Class paid 0.25% of average daily net assets under this plan.
| | | | | | |
| | | Causeway Global Absolute Return Fund | | | 27 | |
NOTES TO FINANCIAL STATEMENTS
(continued)
The Trust and SEI Investments Distribution Co. (the “Distributor”) have entered into a Distribution Agreement. The Distributor receives no fees from the Fund for its distribution services under this agreement.
The officers of the Trust are also officers or employees of the Administrator or Adviser. They receive no fees for serving as officers of the Trust.
As of September 30, 2015, approximately $3.268 million of the net assets were held by affiliated investors.
| 4. | | Investment Transactions |
During the fiscal year ended September 30, 2015, there were no security purchases or sales, other than short-term investments.
| 5. | | Derivatives and Risks of Investing |
A swap agreement is a form of derivative that includes leverage, allowing the Fund to obtain the right to a return on a stipulated capital base that exceeds the amount the Fund has invested. The use of swap agreements could cause the Fund to be more volatile, resulting in larger gains or losses in response to changes in the values of the securities underlying the swap agreements than if the Fund had made direct investments. Use of leverage involves special risks and is speculative. If the Adviser is incorrect in evaluating long and short exposures, leverage will magnify any losses, and such losses may be significant. By using swap agreements, the Fund is exposed to liquidity risks since it may not be able to close out a swap agreement immediately, particularly during times of market turmoil. It may also be difficult to value a swap agreement if the Fund has difficulty in closing the position.
The use of derivative contracts exposes an investor to various market risks. The Fund’s investment in total return equity swap agreements exposed the Fund to equity risk for the fiscal year ended September 30, 2015. Equity risk is the risk that the value of a particular stock or stock market
to which the Fund has long exposure is falling, or to which the Fund has short exposure is rising. The fair value of the total return equity swap agreements as of September 30, 2015 is reported on the Statement of Assets and Liabilities. The related change in unrealized and realized gains or losses for the reporting period is reported on the Statement of Operations.
The Fund currently expects to settle swap agreements at least monthly, and may do so more frequently, which will cause the Fund to realize ordinary income and short-term capital gains, if any, throughout the year that, when distributed to shareholders, will be taxable to them as ordinary income rather than at lower long-term capital gains rates.
By using swap agreements, the Fund is exposed to additional risks concerning the counterparty. For
example, the Fund bears the risk of loss of the amount expected to be received under a swap agreement in the event of the default or bankruptcy of the counterparty, or if the counterparty fails to honor its obligations. The Fund currently has entered into swap agreements with a single counterparty, focusing its exposure to the counterparty credit risk of that single counterparty. Further, the swap counterparty’s obligations to the Fund likely will not be collateralized. The Fund intends, however, to settle swap agreements at least monthly, and may do so more frequently, so that net gains under swap agreements with a single counterparty do not exceed 5% of the Fund’s total assets at any given time.
There is the risk that the counterparty refuses to continue to enter into swap agreements with the Fund in the future, or requires increased fees, which could impair the Fund’s ability to achieve its investment objective. A swap counterparty may also increase its collateral requirements, which may limit the Fund’s ability to use leverage and reduce investment returns. In addition, if the Fund cannot locate a counterparty willing to enter into transactions with the Fund, it will not be able to implement its investment strategy. As of September 30, 2015, the Fund’s swap agreements were with one counterparty.
| | | | |
| 28 | | Causeway Global Absolute Return Fund | | |
NOTES TO FINANCIAL STATEMENTS
(continued)
ISDA Master Arrangement
The Fund is party to an International Swaps and Derivatives Association, Inc. Master Agreement and Credit Support Annex (“ISDA Master Agreement”) which governs its swap agreements. The ISDA Master Agreement includes provisions for general obligations, representations, agreements, collateral and events of default or termination. Events of termination include conditions that may entitle the counterparty to elect to terminate early and cause settlement of all outstanding transactions under the ISDA Master Agreement. Any election to terminate early could be material to the financial statements.
As of September 30, 2015, there was $82,471,174 pledged as collateral for swap agreements under the ISDA Master Agreement.
The following is a summary by counterparty of the market value of swap agreements and collateral (received)/pledged for the Fund as of September 30, 2015*:
All numbers have been rounded (000):
| | | | | | | | | | | | |
| | | Assets | | | Liabilities | | | | |
| Counterparty | | Total
Return
Swaps | | | Total
Return
Swaps | | | Total
Over the
Counter | |
Morgan Stanley | | $ | 3,734 | | | $ | (6,472 | ) | | $ | (2,738 | ) |
| | | | | | | | | | |
Net Market
Value of
Swaps | | | Collateral
(Received)/
Pledged | | | Net
Exposures† | |
| $ | (2,738 | ) | | $ | 2,738 | | | $ | — | |
| † | Net Exposures represents the net receivable/(payable) that would be due from/to the counterparty in the event of default. Exposure from swaps can only be netted across transactions governed under the same master agreement with the same legal entity. |
| * | Collateral received/pledged is limited to the net outstanding amount due to/from an individual counterparty. The actual collateral amount received/pledged may exceed this amount and may fluctuate in value. |
Because the Fund has significant exposure to foreign securities, the Fund is subject to further risks. For example, the value of the Fund’s exposures may be affected by social, political and economic developments and U.S. and foreign laws relating to foreign investment. Further, because the Fund has exposures to securities denominated in foreign currencies, the Fund’s value could decrease depending on foreign exchange rates. Other risks applicable to foreign companies that could impact the value of their securities, and thus the value of the Fund’s exposures, include trading, settlement, custodial, and other operational risks; withholding or other taxes; and the less stringent investor protection and disclosure standards of some foreign markets. All of these factors can make foreign securities less liquid, more volatile and harder to value than U.S. securities. These risks are higher for emerging markets investments.
| 6. | | Federal Tax Information |
The Fund is classified as a separate taxable entity for Federal income tax purposes. The Fund intends to
continue to qualify as a separate “regulated investment company” under Subchapter M of the Internal Revenue Code and make the requisite distributions to shareholders that will be sufficient to relieve it from Federal income tax and Federal excise tax. Therefore, no Federal tax provision is required. To the extent that dividends from net investment income and distributions from net realized capital gains exceed amounts reported in the financial statements, such amounts are reported separately.
The Fund may be subject to taxes imposed by countries in which it invests in issuers existing or operating in such countries. Such taxes are generally based on income earned. The Fund accrues such taxes when the related income is earned. Dividend and interest income is recorded net of non-U.S. taxes paid.
| | | | | | |
| | | Causeway Global Absolute Return Fund | | | 29 | |
NOTES TO FINANCIAL STATEMENTS
(continued)
The amounts of distributions from net investment income and net realized capital gains are determined in accordance with Federal income tax regulations, which may differ from those amounts determined under U.S. GAAP. These book/tax differences are either temporary or permanent in nature. The character of distributions made during the year from net investment income or net realized gains, and the timing of distributions made during the year may differ from the year that the income or realized gains (losses) were recorded by the Fund. To the extent these differences are permanent, adjustments are made to the appropriate equity accounts in the period that the differences arise.
Accordingly, the following permanent differences, which are primarily due to swap contract related period payments, were reclassified to/(from) the following accounts as of September 30, 2015 (000):
| | | | | | |
Undistributed
Net Investment
Income | | | Accumulated
Net Realized
Loss | |
| $ | 8,847 | | | $ | (8,847 | ) |
The reclassifications had no impact on net assets or net asset value per share.
The tax character of dividends and distributions declared during the fiscal years ended September 30, 2015 and September 30, 2014 were as follows (000):
| | | | | | | | |
| | | Ordinary
Income | | | Total | |
2015 | | $ | — | | | $ | — | |
2014 | | | 3,860 | | | | 3,860 | |
As of September 30, 2015, the components of accumulated losses on a tax basis were as follows (000):
| | | | |
Undistributed Ordinary Income | | $ | 5,490 | |
Capital Loss Carryforwards | | | (2,375 | ) |
Unrealized Depreciation | | | (2,738 | ) |
Post October Losses | | | (9,311 | ) |
| | | | |
Total Accumulated Losses | | $ | (8,934 | ) |
| | | | |
Post-October Losses represents losses realized on securities transactions from November 1, 2014 through September 30, 2015, that, in accordance with Federal income tax regulations, the Fund may elect to defer and treat as having arisen in the following fiscal year.
Deferred Late-Year Losses represent ordinary losses realized on investment transactions from January 1, 2015 through September 30, 2015 and specified losses realized on investment transactions from October 1, 2014 through September 30, 2015. The Fund elects to defer the Late-Year Loss and treat it as having arisen in the following fiscal year.
Under the Regulated Investment Company Modernization Act of 2010, the Fund is permitted to carry forward capital losses incurred in taxable years beginning after December 22, 2010 for an unlimited period. However, any losses incurred during those future taxable years are required to be used prior to the losses incurred in pre-enactment taxable years. As a result of this ordering rule, pre-enactment capital loss carryforwards may be more likely to expire unused. Additionally, post-enactment capital losses that are carried forward will retain their character as either short-term or long-term capital losses rather than being considered all short-term as under previous law. Losses carried forward under these provisions are as follows:
| | | | | | | | | | | | |
| | | Short-Term
Loss (000) | | | Long-Term
Loss (000) | | | Total
(000) | |
Causeway Global Absolute Return Fund | | $ | 2,375 | | | $ | — | | | $ | 2,375 | |
For the fiscal year ended September 30, 2015, the Fund used $706 (000) in capital loss carryforwards.
| | | | |
| 30 | | Causeway Global Absolute Return Fund | | |
NOTES TO FINANCIAL STATEMENTS
(concluded)
At September 30, 2015, the cost basis of securities for Federal income tax purposes is equal to the cost basis used for financial reporting purposes.
| 7. | | Capital Shares Issued and Redeemed (000) |
| | | | | | | | | | | | | | | | |
| | | Fiscal Year Ended
September 30, 2015 | | | Fiscal Year Ended
September 30, 2014 | |
| | | Shares | | | Value | | | Shares | | | Value | |
Institutional Class | | | | | | | | | | | | | | | | |
Shares Sold | | | 3,847 | | | $ | 41,247 | | | | 9,688 | | | $ | 105,932 | |
Shares Issued in Reinvestment of
Dividends and Distributions | | | — | | | | — | | | | 140 | | | | 1,527 | |
Shares Redeemed | | | (8,066 | ) | | | (85,182 | ) | | | (1,705 | ) | | | (18,510 | ) |
| | | | | | | | | | | | | | | | |
Increase (Decrease) in Shares Outstanding
Derived from Institutional Class Transactions | | | (4,219 | ) | | | (43,935 | ) | | | 8,123 | | | | 88,949 | |
| | | | | | | | | | | | | | | | |
Investor Class | | | | | | | | | | | | | | | | |
Shares Sold | | | 867 | | | | 9,160 | | | | 3,243 | | | | 35,608 | |
Shares Issued in Reinvestment of
Dividends and Distributions | | | — | | | | — | | | | 99 | | | | 1,079 | |
Shares Redeemed | | | (2,431 | ) | | | (25,786 | ) | | | (1,856 | ) | | | (20,279 | ) |
| | | | | | | | | | | | | | | | |
Increase (Decrease) in Shares Outstanding
Derived from Investor Class Transactions | | | (1,564 | ) | | | (16,626 | ) | | | 1,486 | | | | 16,408 | |
| | | | | | | | | | | | | | | | |
Increase (Decrease) in Shares Outstanding from
Capital Share Transactions | | | (5,783 | ) | | $ | (60,561 | ) | | | 9,609 | | | $ | 105,357 | |
| | | | | | | | | | | | | | | | |
| 8. | | Significant Shareholder Concentration |
As of September 30, 2015, two of the Fund’s shareholders of record owned 62% of net assets in the Institutional Class.
Under the Trust’s organizational documents, each Trustee, officer, employee or other agent of the Trust is indemnified against certain liabilities that may arise out of the performance of his or her duties to the Fund. Additionally, in the normal course of business, the Fund enters into contracts, including the Fund’s servicing agreements, that contain a variety of indemnification
clauses. The Fund’s maximum exposure under these arrangements is unknown as this would involve future claims that may be made against the Fund that have not yet occurred. The risk of material loss as a result of such indemnification claims is considered remote.
The Fund has evaluated the need for disclosures and/or adjustments resulting from subsequent events through the date the financial statements were available to be issued. Based on this evaluation, no disclosures or adjustments were required to the financial statements.
| | | | | | |
| | | Causeway Global Absolute Return Fund | | | 31 | |
REPORT OF INDEPENDENT REGISTERED PUBLIC ACCOUNTING FIRM
To the Board of Trustees and Shareholders of
Causeway Global Absolute Return Fund:
In our opinion, the accompanying statement of assets and liabilities, including the schedule of investments, and the related statements of operations and of changes in net assets and the financial highlights present fairly, in all material respects, the financial position of Causeway Global Absolute Return Fund (the “Fund”) at September 30, 2015, the results of its operations for the year then ended, the changes in its net assets for each of the two years in the period then ended and the financial highlights for each of the periods presented in conformity with accounting principles generally accepted in the United States of America. These financial statements and financial highlights (hereafter referred to as “financial statements”) are the responsibility of the Fund’s management. Our responsibility is to express an opinion on these financial statements based on our audits. We conducted our audits of these financial statements in accordance with the standards of the Public Company Accounting Oversight Board (United States). Those standards require that we plan and perform the audit to obtain reasonable assurance about whether the financial statements are free of material misstatement. An audit includes examining, on a test basis, evidence supporting the amounts and disclosures in the financial statements, assessing the accounting principles used and significant estimates made by management, and evaluating the overall financial statement presentation. We believe that our audits, which included confirmation of securities at September 30, 2015 by correspondence with the custodian and brokers, provide a reasonable basis for our opinion.
PricewaterhouseCoopers LLP
Los Angeles, California
November 24, 2015
| | | | |
| 32 | | Causeway Global Absolute Return Fund | | |
TRUSTEES AND OFFICERS INFORMATION (Unaudited)
Information pertaining to the Trustees and Officers of the Trust is set forth below. Trustees who are not deemed to be “interested persons” of the Trust as defined in the 1940 Act are referred to as “Independent Trustees.” The Trust’s Statement of Additional Information (“SAI”) includes additional information about the Trustees and Officers. The SAI may be obtained without charge by calling 1-866-947-7000.
| | | | | | | | | | |
Name Address, Age1 | | Position(s)
Held with the
Company | | Term of Office and Length of Time Served2 | | Principal Occupation(s) During Past Five Years | | Number of Portfolios in Trust Complex Overseen by Trustee3 | | Other Directorships Held by Trustee4 |
INDEPENDENT TRUSTEES | | | | | | | | | | |
John R. Graham Age: 54 | | Trustee; Chairman of the Audit Committee | | Trustee since 10/08; Audit Chairman since 4/13 | | Film Composer (since 2005); Senior Vice President, Corporate Financial Development and Communications, The Walt Disney Company (2004-2005); Senior Vice President, Mergers and Acquisitions, Lehman Brothers Inc. (2000-2004). | | 6 | | None |
| | | | | |
Lawry J. Meister Age: 53 | | Trustee | | Since 10/08 | | President, Steaven Jones Development Company, Inc. (real estate firm) (since 1995); President, Creative Office Properties (real estate firm) (since 2012). | | 6 | | None |
| | | | | |
Victoria B. Rogers Age: 54 | | Trustee | | Since 4/13 | | President, the Rose Hills Foundation (since 1996). | | 6 | | Director, TCW Funds, Inc. and TCW Strategic Income Fund |
| | | | | |
Eric H. Sussman Age: 49 | | Trustee; Chairman of the Board | | Trustee since 9/01; Board Chairman since 4/13 | | Senior Lecturer (since July 2011) and Lecturer (1995-June 2011), Anderson Graduate School of Management, University of California, Los Angeles; President, Amber Capital, Inc. (real estate investment and financial planning firm) (since 1993). | | 6 | | None |
| | | | | | |
| | | Causeway Global Absolute Return Fund | | | 33 | |
TRUSTEES AND OFFICERS INFORMATION (Unaudited)
(continued)
| | | | | | | | | | |
Name Address, Age1 | | Position(s)
Held with the
Company | | Term of Office and Length of Time Served2 | | Principal Occupation(s) During Past Five Years | | Number of Portfolios in Trust Complex Overseen by Trustee3 | | Other Directorships Held by Trustee4 |
OFFICERS | | | | | | | | | | |
Turner Swan 11111 Santa Monica Blvd., 15th Floor Los Angeles, CA 90025 Age: 53 | | President | | Since 8/01 | | General Counsel, Secretary, and Member of the Adviser (since 2001); Compliance Officer of the Adviser (since 2010). | | N/A | | N/A |
| | | | | |
Kurt J. Decko 11111 Santa Monica Blvd., 15th Floor Los Angeles, CA 90025 Age: 40 | | Chief Compliance Officer and Assistant Secretary | | Since 1/15 | | Chief Compliance Officer/Senior Legal Counsel of the Adviser (since January 2015); Partner, K&L Gates LLP (2010-2014). | | N/A | | N/A |
| | | | | |
Eric Kleinschmidt5 One Freedom Valley Drive
Oaks, PA 19456
Age: 47 | | Treasurer | | Since 8/14 | | Director of Fund Accounting, SEI Investments Company (since 2004). | | N/A | | N/A |
| | | | | |
Gretchen W. Corbell 11111 Santa Monica Blvd., 15th Floor Los Angeles, CA 90025 Age: 44 | | Secretary | | Since 10/11 | | Attorney of the Adviser (since 2004). | | N/A | | N/A |
| | | | | |
Gracie V. Fermelia 11111 Santa Monica Blvd., 15th Floor Los Angeles, CA 90025 Age: 54 | | Vice President and Assistant Secretary | | Vice President (since 1/15); Assistant Secretary (since 8/01) | | Chief Operating Officer and Member of the Adviser (since 2001); Chief Compliance Officer of the Adviser and the Trust (2005-2015). | | N/A | | N/A |
| | | | |
| 34 | | Causeway Global Absolute Return Fund | | |
TRUSTEES AND OFFICERS INFORMATION (Unaudited)
(concluded)
| | | | | | | | | | |
Name Address, Age1 | | Position(s)
Held with the
Company | | Term of Office and Length of Time Served2 | | Principal Occupation(s) During Past Five Years | | Number of Portfolios in Trust Complex Overseen by Trustee3 | | Other Directorships Held by Trustee4 |
Lisa Whittaker5 One Freedom Valley Drive Oaks, PA 19456 Age: 36 | | Vice President and Assistant Secretary | | Since 8/13 | | Corporate Counsel of the Administrator (since 2012); Associate Counsel and Compliance Officer, The Glendmede Trust Company, N.A. (2011-2012); Associate, Drinker Biddle & Reath LLP (2006-2011). | | N/A | | N/A |
| 1 | Each Trustee may be contacted by writing to the Trustee c/o Causeway Capital Management Trust, One Freedom Valley Drive, Oaks, PA 19456. |
| 2 | Each Trustee holds office during the lifetime of the Trust or until his or her sooner resignation, retirement, removal, death or incapacity in accordance with the Trust’s Declaration of Trust. The president, treasurer and secretary each holds office at the pleasure of the Board of Trustees or until he or she sooner resigns in accordance with the Trust’s Bylaws. |
| 3 | The “Trust Complex�� consists of all registered investment companies for which Causeway Capital Management LLC serves as investment adviser. As of September 30, 2015, the Trust Complex consisted of one investment company with six portfolios — the International Value Fund, the Emerging Markets Fund, the Global Value Fund, the International Opportunities Fund, the Global Absolute Return Fund, and the International Small Cap Fund. |
| 4 | Directorships of companies required to report to the Securities and Exchange Commission under the Securities Exchange Act of 1934 (i.e., “public companies”) or other investment companies registered under the 1940 Act. |
| 5 | These officers of the Trust also serve as officers of one or more mutual funds for which SEI Investments Company or an affiliate acts as investment manager, administrator or distributor. |
| | | | | | |
| | | Causeway Global Absolute Return Fund | | | 35 | |
DISCLOSURE OF FUND EXPENSES (Unaudited)
As a shareholder of the Fund, you incur two types of costs: (1) transaction costs, including redemption fees, and (2) ongoing costs, including management fees, shareholder service fees, and other Fund expenses. It is important for you to understand the impact of these costs on your investment returns.
Ongoing operating expenses are deducted from a mutual fund’s gross income and directly reduce its final investment return. These expenses are expressed as a percentage of a mutual fund’s average net assets; this percentage is known as a mutual fund’s expense ratio.
The following examples use the expense ratio and are intended to help you understand the ongoing costs (in dollars) of investing in the Fund and to compare these costs with those of other mutual funds. The examples are based on an investment of $1,000 made at the beginning of the period shown and held for the entire period (April 1, 2015 to September 30, 2015).
The table on the next page illustrates the Fund’s costs in two ways:
Actual Fund Return. This section helps you to estimate the actual expenses after fee waivers that the Fund incurred over the period. The “Expenses Paid During Period” column shows the actual dollar expense cost incurred by a $1,000 investment in the Fund, and the “Ending Account Value” number is derived from deducting that expense cost from the Fund’s gross investment return.
You can use this information, together with the actual amount you invested in the Fund, to estimate the expenses you paid over that period. Simply divide your actual account value by $1,000 to arrive at a ratio (for example, an $8,600 account value divided by $1,000 = 8.6), then multiply that ratio by the number shown under “Expenses Paid During Period.”
Hypothetical 5% Return. This section helps you compare the Fund’s costs with those of other mutual funds. It assumes that the Fund had an annual 5% return before expenses during the year, but that the expense ratio (Column 3) for the period is unchanged. This example is useful in making comparisons because the Securities and Exchange Commission requires all mutual funds to make this 5% calculation. You can assess the Fund’s comparative cost by comparing the hypothetical result for the Fund in the “Expenses Paid During Period” column with those that appear in the same charts in the shareholder reports for other mutual funds.
NOTE: Because the return is set at 5% for comparison purposes — NOT the Fund’s actual return — the account values shown may not apply to your specific investment.
| | | | |
| 36 | | Causeway Global Absolute Return Fund | | |
DISCLOSURE OF FUND EXPENSES (Unaudited)
(concluded)
| | | | | | | | | | | | | | | | |
| | | Beginning
Account
Value
4/01/15 | | | Ending
Account
Value
9/30/15 | | | Annualized
Expense
Ratios | | | Expenses
Paid
During
Period* | |
Causeway Global Absolute Return Fund | | | | | | | | | | | | | | | | |
| | | | |
Actual Portfolio Return | | | | | | | | | | | | | | | | |
Institutional Class | | $ | 1,000.00 | | | $ | 993.30 | | | | 1.68 | % | | $ | 8.39 | |
| | | | |
Hypothetical 5% Return | | | | | | | | | | | | | | | | |
| Institutional Class | | $ | 1,000.00 | | | $ | 1,016.70 | | | | 1.68 | % | | $ | 8.49 | |
Causeway Global Absolute Return Fund | | | | | | | | | | | | | | | | |
| | | | |
Actual Portfolio Return | | | | | | | | | | | | | | | | |
Investor Class | | $ | 1,000.00 | | | $ | 992.30 | | | | 1.93 | % | | $ | 9.64 | |
| | | | |
Hypothetical 5% Return | | | | | | | | | | | | | | | | |
| Investor Class | | $ | 1,000.00 | | | $ | 1,015.39 | | | | 1.93 | % | | $ | 9.75 | |
| * | Expenses are equal to the Fund’s annualized expense ratio multiplied by the average account value over the period, multiplied by 183/365 (to reflect the one-half year period.) |
| | | | | | |
| | | Causeway Global Absolute Return Fund | | | 37 | |
STATEMENT REGARDING BASIS FOR APPROVAL OF INVESTMENT ADVISORY AGREEMENT (Unaudited)
At a meeting on August 3, 2015, the Trustees considered and approved the renewal of the investment advisory agreement (the “Advisory Agreement”) between Causeway Capital Management Trust (the “Trust”) and Causeway Capital Management LLC (the “Adviser”) with respect to Causeway Global Absolute Return Fund (the “Fund”) for a twelve-month period beginning September 20, 2015. Section 15(c) of the Investment Company Act of 1940, as amended (the “1940 Act”) requires the Board of Trustees (the “Board”) of the Trust annually to approve continuance of the Advisory Agreement. Continuance of the Advisory Agreement must be approved by a majority of the Trustees and a majority of the independent Trustees (i.e., Trustees who are not “interested persons” of the Trust as defined in the 1940 Act). The Board was comprised of four independent Trustees when the continuation of the Advisory Agreement was considered.
Information Received. At each regular quarterly meeting, the Board reviews a wide variety of materials relating to the nature, extent and quality of the Adviser’s services, including information concerning the Fund’s performance. In connection with their August 3, 2015 meeting, the Trustees received and reviewed extensive quantitative and qualitative materials prepared by the Adviser relating to the Advisory Agreement in response to information requested on the independent Trustees’ behalf by their independent legal counsel.
Factors Considered. In reviewing the Advisory Agreement, the Trustees considered a number of factors including, but not limited to: (1) the nature, extent and quality of the services provided by the Adviser, (2) the investment performance of the Fund, (3) comparisons of the services rendered and the amounts paid under the Advisory Agreement with those of other funds and other types of clients, (4) the costs of the services provided and estimated profits or losses realized by the Adviser and its affiliates from their relationship with the Fund, (5) the extent to which economies of scale would be realized as the Fund grows and whether fee levels reflect these economies of scale for the benefit of Fund investors, and (6) any other benefits that would be derived by the Adviser from its relationship with the Fund.
First, regarding the nature, extent and quality of the services provided by the Adviser, the Trustees considered, among other things, the Adviser’s personnel, experience, track record and compliance program. The Trustees considered the qualifications, backgrounds and responsibilities of the Adviser’s principal personnel who provide services to the Fund, as well as the level of attention those individuals provide to the Fund. The Trustees noted the Adviser’s commitment to devoting resources to staffing the technology in support of its investment management services. They also reviewed the Adviser’s investment philosophy and processes and its compliance program, and considered the scope of the Adviser’s services to the Fund. The Trustees concluded that the nature, extent and quality of the services provided by the Adviser continued to benefit the Fund and its shareholders and would do so during the next one-year contract renewal period.
Second, regarding the investment performance of the Fund, the Trustees reviewed the investment results of the Fund’s Institutional and Investor share classes for various periods ended June 30, 2015, compared to the results of the BofA Merrill Lynch 3-Month U.S. Treasury Bill Index (the “Index’), the averages of the mutual funds included in the Morningstar Market Neutral category of funds, and the averages of the mutual funds included in the Morningstar Long/Short category of funds. They noted that the Fund was moved from the Morningstar Long/Short category to the Morningstar Market Neutral category in February 2012. The Trustees noted that the Fund had outperformed the Index for the three-year and since inception periods, but underperformed the Index for the prior one-year period. In addition, they noted that both share classes had underperformed the average of the funds in the Morningstar Market Neutral category for the one-year and three-
| | | | |
| 38 | | Causeway Global Absolute Return Fund | | |
STATEMENT REGARDING BASIS FOR APPROVAL OF INVESTMENT ADVISORY AGREEMENT (Unaudited)
(continued)
year periods, but had outperformed the average for the since-inception period. They noted that both share classes underperformed the average of the funds in the Morningstar Long-Short category for the one-year, three-year and since-inception periods. The Trustees concluded that the Adviser’s record in managing the Fund indicates that its continued management will benefit the Fund and its shareholders.
Third, regarding the Fund’s advisory fee and total expenses:
| | • | | The Trustees compared the Fund’s advisory fee with those of other similar mutual funds. They noted that although the Fund’s advisory fee is higher than the average and median fees of the mutual funds in the Morningstar Market Neutral category (by 34 and 25 basis points, respectively) and the average and median fees of the mutual funds in the Morningstar Long-Short category (by 26 and 25 basis points, respectively), the Fund involves an active global investment program with both long and short exposures and leverage that is complex and requires substantial investment and administrative resources to manage. |
| | • | | The Trustees compared the Fund’s expenses with those of other similar mutual funds. They noted that the expense ratio of the Fund’s Institutional Class is above the average and median of the mutual funds in the Morningstar Market Neutral category (by 11 and 23 basis points, respectively), and the expense ratio of the Fund’s Investor Class is above the average and median of the mutual funds in the category (by 36 and 48 basis points, respectively). They also noted that the expense ratio of the Fund’s Institutional Class is lower than the average and 1 basis point higher than the median of the mutual funds in the Morningstar Long-Short category, and the expense ratio of the Fund’s Investor Class is above the average and median of the mutual funds in the category (by 22 and 26 basis points, respectively). In addition, they noted that the Fund’s total assets are significantly less than the average assets of the funds in its category. They also observed that, although Fund expenses had decreased so that it was not currently triggered, the Adviser continues to limit contractually the Fund’s expenses (excluding swap agreement financing charges and transaction costs, borrowing expenses, dividend expenses on securities sold short, brokerage fees and commissions, interest, taxes, shareholder service fees, fees and expenses of other funds in which the Fund invests, and extraordinary expenses). The Trustees concluded that the Fund’s advisory fee and expenses were reasonable and appropriate. |
| | • | | The Trustees compared the Fund’s advisory fee with the fees charged by the Adviser to other clients. They noted that the Adviser does not currently manage assets of other clients pursuant to its global absolute return strategy, but compared the Fund’s advisory fee with the standard advisory fee offered by the Adviser to separate account clients. The Trustees also noted that, although the separate account performance-based fee may be lower than the advisory fee paid by the Fund, the difference appropriately reflected the Adviser’s significantly greater responsibilities with respect to the Fund, which include the provision of many additional administrative and shareholder services (such as services related to the Fund’s disclosure documents, financial statements, 1940 Act compliance policies and procedures, preparation of Board and committee materials and meetings, annual Board reports and certifications, oversight of daily valuation, oversight of Fund service providers, negotiation of Fund intermediary agreements, coordination with Fund intermediaries providing shareholder recordkeeping services, shareholder communications, and due diligence for advisers, consultants and institutional investors). |
| | | | | | |
| | | Causeway Global Absolute Return Fund | | | 39 | |
STATEMENT REGARDING BASIS FOR APPROVAL OF INVESTMENT ADVISORY AGREEMENT (Unaudited)
(concluded)
The Trustees concluded that the Fund’s advisory fee and expense ratio as reduced are reasonable and appropriate under the circumstances.
Fourth, the Trustees considered the Adviser’s costs of providing services to the Fund and the estimated profits or losses realized by the Adviser from its relationship with the Fund. They reviewed the Adviser’s estimated after-tax profit margin with respect to such services for the twelve months ended June 30, 2015, and the methodology used to generate that estimate, and noted that the cost allocation methodology presented to the Trustees was reasonable. They also observed that the Adviser’s estimated profitability was within the range cited as reasonable in various court decisions. After consideration of these matters, the Trustees concluded that the Adviser’s operating margin with respect to its relationship with the Fund is reasonable.
Fifth, regarding economies of scale, the Trustees observed that, although the Fund’s advisory fee did not have breakpoints, it is difficult to determine the existence or extent of any economies of scale. They noted that the Adviser is sharing economies of scale through reasonable advisory fee levels, an expense limit agreement, and devoting additional resources to staff and technology to focus on continued performance and service to the Fund’s shareholders. They also noted that, in the Fund’s prior years, the Adviser incurred significant losses in managing the Fund. The Trustees concluded that under the circumstances the Adviser is sharing any economies of scale with the Fund appropriately.
Sixth, regarding any other benefits derived by the Adviser from its relationship with the Fund — often called “fallout” benefits — the Trustees observed that the Adviser does not earn “fall-out” benefits such as affiliated custody fees, affiliated transfer agency fees, affiliated brokerage commissions, profits from rule 12b-1 fees, “contingent deferred sales commissions,” “float” benefits on short-term cash, or soft dollar research services. They noted that the Fund’s trades are principal transactions under swaps and do not generate “commissions” that can be used for soft dollars.
Approval. At the August 3, 2015 meeting, the Trustees discussed the information and factors noted above and considered the approval of the Advisory Agreement with representatives of the Adviser. The independent Trustees also met in a private session with independent counsel at which no representatives of the Adviser were present. In their deliberations, the independent Trustees did not identify any particular information or factor that was determinative or controlling, each Trustee did not necessarily attribute the same weight to each factor, and the foregoing summary does not detail all the matters considered. Based on their review, the Trustees (including the independent Trustees) unanimously concluded that the Advisory Agreement is fair and reasonable to the Fund and its shareholders, that the Fund’s advisory fee is reasonable and that renewal of the Advisory Agreement is in the best interests of the Fund and its shareholders, and the Board of Trustees unanimously approved renewal of the Advisory Agreement for a twelve-month period beginning September 20, 2015.
| | | | |
| 40 | | Causeway Global Absolute Return Fund | | |
INVESTMENT ADVISER:
Causeway Capital Management LLC
11111 Santa Monica Boulevard
15th Floor
Los Angeles, CA 90025
DISTRIBUTOR:
SEI Investments Distribution Co.
One Freedom Valley Drive
Oaks, PA 19456
TO OBTAIN MORE INFORMATION:
Call 1-866-947-7000 or visit us online at
www.causewayfunds.com
This material must be preceded or accompanied by a current prospectus.
The Fund files its complete schedule of portfolio holdings with the Securities and Exchange Commission (“Commission”) for the first and third quarters of each fiscal year on Form N-Q within sixty days after the end of the period. The Fund’s Forms N-Q are available on the Commission’s website at http://www.sec.gov, and may be reviewed and copied at the Commission’s Public Reference Room in Washington, DC. Information on the operation of the Public Reference Room may be obtained by calling 1-800-SEC-0330.
A description of the policies and procedures that the Fund uses to determine how to vote proxies relating to portfolio securities, as well as information relating to how the Trust voted proxies relating to portfolio securities during the most recent 12-month period ended June 30, is available (i) without charge, upon request, by calling 1-866-947-7000; and (ii) on the Commission’s website at http://www. sec.gov.
CCM-AR-101-0500

The registrant has adopted a code of ethics that applies to the registrant’s principal executive officer, principal financial officer and principal accounting officer. During the fiscal year ended September 30, 2015, there were no material changes or waivers to the code of ethics.
| Item 3. | Audit Committee Financial Expert. |
(a)(1) The registrant’s board of trustees has determined that the registrant has at least one audit committee financial expert serving on the audit committee.
(a)(2) The audit committee financial experts are Eric Sussman, Lawry Meister, John Graham and Victoria B. Rogers. Each audit committee financial expert is independent as defined in Form N-CSR Item 3(a)(2).
| Item 4. | Principal Accountant Fees and Services. |
Aggregate fees billed to the registrant for professional services rendered by the registrant’s principal accountant for the fiscal years ended September 30, 2015 and 2014 were as follows:
| | | | | | | | |
| | | | | 2015 | | | | 2014 |
| (a) | | Audit Fees | | $134,460 | | | | $188,960 |
| (b) | | Audit-Related Fees | | None | | | | None |
| (c) | | Tax Fees(1) | | $129,000 | | | | $41,848 |
| (d) | | All Other Fees | | None | | | | None |
Note:
| (1) | Tax fees include amounts related to tax return and excise tax calculation reviews and foreign tax reclaim services. |
(e)(1) The registrant’s audit committee has adopted a charter that requires it to pre-approve the engagement of auditors to (i) audit the registrant’s financial statements, (ii) provide other audit or non-audit services to the registrant, or (iii) provide non-audit services to the registrant’s investment adviser if the engagement relates directly to the operations and financial reporting of the registrant.
(e)(2) No services included in paragraphs (b) through (d) of this Item were approved by the audit committee pursuant to paragraph (c)(7)(i)(C) of Rule 2-01 of Regulation S-X.
(f) Not applicable.
(g) For the fiscal year ended September 30, 2015, the aggregate non-audit fees billed by the registrant’s accountant for services rendered to the registrant and the registrant’s investment adviser were $162,980. For the fiscal year ended September 30, 2014, the aggregate non-audit fees billed by the registrant’s accountant for services rendered to the registrant and the registrant’s investment adviser were $340,363.
(h) The audit committee considered whether the provision of non-audit services rendered to the registrant’s investment adviser by the registrant’s principal accountant that were not pre-approved pursuant to paragraph (c)(7)(ii) of Rule 2-01 of Regulation S-X was compatible with maintaining the principal accountant’s independence.
| Item 5. | Audit Committee of Listed Registrants. |
Not applicable to open-end management investment companies.
| Item 6. | Schedule of Investments |
See Item 1.
| Item 7. | Disclosure of Proxy Voting Policies and Procedures for Closed-End Management Investment Companies. |
Not applicable to open-end management investment companies.
| Item 8. | Portfolio Managers of Closed-End Management Investment Companies |
Not applicable to open-end management investment companies.
| Item 9. | Purchases of Equity Securities by Closed-End Management Investment Company and Affiliated Purchasers. |
Not applicable to open-end management investment companies.
| Item 10. | Submission of Matters to a Vote of Security Holders. |
There have been no material changes to the registrant’s procedures by which shareholders may recommend nominees to the registrant’s board of trustees since the registrant’s last filing on Form N-CSR.
| Item 11. | Controls and Procedures. |
(a) The certifying officers, whose certifications are included herewith, have evaluated the registrant’s disclosure controls and procedures within 90 days of the filing date of this report. In their opinion, based on their evaluation, the registrant’s disclosure controls and procedures are adequately designed, and are operating effectively to ensure, that information required to be disclosed by the registrant in the reports it files or submits under the Securities Exchange Act of 1934 is recorded, processed, summarized and reported within the time periods specified in the Securities and Exchange Commission’s rules and forms.
(b) There were no changes in the registrant’s internal control over financial reporting that occurred during the registrant’s second fiscal quarter of the period covered by this report that have materially affected, or are reasonably likely to materially affect, the registrant’s internal control over financial reporting.
(a)(1) Code of Ethics attached hereto.
(a)(2) Separate certifications for the principal executive officer and the principal financial officer of the registrant as required by Rule 30a-2(a) under the Investment Company Act of 1940 (17 CFR 270.30a-2(a)) are filed herewith.
(b) Officer certifications as required by Rule 30a-2(b) under the Investment Company Act of 1940 (17 CFR 270.30a-2(b)) also accompany this filing as an exhibit.
SIGNATURES
Pursuant to the requirements of the Securities Exchange Act of 1934 and the Investment Company Act of 1940, the registrant has duly caused this report to be signed on its behalf by the undersigned, thereunto duly authorized.
| | | | | | |
| (Registrant) | | | | | | Causeway Capital Management Trust |
| | | |
By (Signature and Title)* | | | | | | /s/ Turner Swan |
| | | | | | Turner Swan, President |
Date: December 4, 2015
Pursuant to the requirements of the Securities Exchange Act of 1934 and the Investment Company Act of 1940, this report has been signed below by the following persons on behalf of the registrant and in the capacities and on the dates indicated.
| | | | | | |
By (Signature and Title)* | | | | | | /s/ Turner Swan |
| | | | | | Turner Swan, President |
Date: December 4, 2015
| | | | | | |
By (Signature and Title)* | | | | | | /s/ Eric Kleinschmidt |
| | | | | | Eric Kleinschmidt, Treasurer |
Date: December 4, 2015
| * | Print the name and title of each signing officer under his or her signature. |