UNITED STATES
SECURITIES AND EXCHANGE COMMISSION
Washington, D.C. 20549
FORM N-CSR
CERTIFIED SHAREHOLDER REPORT OF REGISTERED
MANAGEMENT INVESTMENT COMPANIES
Investment Company Act File Number 811-10467
Causeway Capital Management Trust
(Exact name of registrant as specified in charter)
11111 Santa Monica Boulevard, 15th Floor
Los Angeles, CA 90025
(Address of principal executive offices) (Zip code)
SEI Investments Global Funds Services
One Freedom Valley Drive
Oaks, PA 19456
(Name and address of agent for service)
Registrant’s telephone number, including area code: 1-866-947-7000
Date of fiscal year end: September 30, 2015
Date of reporting period: September 30, 2015
| Item 1. | Reports to Stockholders. |
TABLE OF CONTENTS
LETTER TO SHAREHOLDERS
From inception on October 20, 2014 through September 30, 2015, Causeway International Small Cap Fund’s (the “Fund’s”) Institutional Class returned 1.20% and Investor Class returned 1.00%, compared to -1.30% for the MSCI ACWI ex USA Small Cap Index (Gross) (“Index”). At fiscal period-end, the Fund had net assets of $9.3 million.
Performance Review
As global equity markets continued to face a challenging macroeconomic environment, international small capitalization stocks were negatively impacted and posted negative performance during the period since Fund inception in the fourth quarter of calendar 2014. Nonetheless, smaller capitalization equities outperformed larger capitalization equities in both developed and emerging markets. The weakest performance in the Index was from the energy sector, which posted negative returns more than three times worse than any other sector. In addition, the utilities and materials sectors were also negative performers. Some of this underperformance was offset by positive contributions from the health care, consumer staples, and consumer discretionary sectors.
To evaluate stocks in our investable universe, our multi-factor quantitative model employs four broad factor categories: valuation, earnings growth, technical indicators, and quality. All four factor groups generated positive performance relative to the Index during the fiscal period, with technical indicators and earnings growth being the strongest. Financial strength also performed relatively well, which is not surprising given that the asset class experienced a negative fiscal period and companies with strong balance sheets were better able to weather the storm. When the asset class as a whole has negative performance, as it did during the fiscal period, risk aversion typically increases, which is not normally conducive for the outperformance of “cheap” securities. However, the positive relative performance of our value factor is encouraging and an indication that it could continue to contribute positively to performance if risk aversion reverts to more normal levels.
Fund holdings in the industrials, materials, and consumer staples sectors contributed the most to the Fund’s excess return compared to the Index. However, holdings in the utilities, information technology, and financials sectors offset some of that outperformance. The largest contributor to relative performance was bakery retailer, Greggs Plc (United Kingdom). Additional top contributors included gold exploration company, Evolution Mining (Australia), jeweler, Lao Feng Xiang Co., Ltd. (China), integrated shipping & logistics company, DFDS A/S (Denmark), and automobile services provider, Bilia AB (Sweden). The largest detractor from relative performance was electric utility provider, Light S.A. (Brazil). Additional top detractors included pharmaceutical producer, Medivir AB (Sweden), oil exploration & production company, Fred. Olsen Energy ASA (Norway), bank, PT Bank Pembangunan Daerah Jawa Barat dan Banten T (Indonesia), and engineering & infrastructure management services provider, Downer EDI Ltd. (Australia).
| | | | |
| 2 | | Causeway International Small Cap Fund | | |
Significant Portfolio Changes
In light of the Fund’s inception in October 2014, all existing positions and exposures were initiated during the period. Our bottom-up quantitative security selection model guides the Fund’s exposure to industry groups and countries. As of September 30, 2015, the Fund’s largest overweights (relative to the Index) by industry group were toward transportation, retailing, and food & staples retailing; while the Fund’s largest underweights (relative to the Index) were to capital goods, software & services, and materials. From a country perspective, the largest active country overweights relative to the Index were to Sweden, China, and New Zealand, while the largest active country underweights were to the United Kingdom, Japan, and Switzerland.
Significant purchases this period, which comprised the largest positions in the Fund at the end of the fiscal period, included gold exploration company, Evolution Mining (Australia), integrated shipping & logistics company, DFDS A/S (Denmark), automobile and automobile services provider, Bilia AB (Sweden), opioid addiction pharmaceutical specialty company, Indivior Plc (United Kingdom), and pharmaceuticals business, Toho Holdings Co., Ltd (Japan).
Investment Outlook
Aversion to risk by investors provides a challenging environment for smaller capitalization stocks. After spiking to the highest level we have seen in almost four years in August, the CBOE Volatility Index (“VIX”) closed September at 24.5, which indicates a relatively high degree of fear and reluctance to buy risky assets. Given their lower liquidity and higher volatility, smaller capitalization securities fall into this category. Until the VIX returns to lower levels, we anticipate smaller capitalization stocks will continue to face headwinds. Nevertheless, valuations remain compelling and the short-term earnings growth expectations for smaller capitalization stocks have improved and are now in line with their large capitalization peers. We believe that our quantitative investment process and risk measurement tools allow us to screen for minimum liquidity thresholds, model the expected market impact from a new position, and incorporate this directly into our net estimate for expected alpha (return in excess of the Index). It is this process that we believe positions the strategy for consistent, long-term results.
| | | | | | |
| | | Causeway International Small Cap Fund | | | 3 | |
We thank you for your continued confidence in Causeway International Small Cap Fund, and look forward to serving you in the future.
September 30, 2015
| | | | |

| | 
| | 
|
| | |
| Arjun Jayaraman | | MacDuff Kuhnert | | Joseph Gubler |
| Portfolio Manager | | Portfolio Manager | | Portfolio Manager |
The above commentary expresses the portfolio managers’ views as of the date shown and should not be relied upon by the reader as research or investment advice. These views are subject to change. There is no guarantee that any forecasts made will come to pass.
Investing involves risk including loss of principal. In addition to the normal risks associated with investing, international investments may involve risk of capital loss from unfavorable fluctuation in currency values, from differences in generally accepted accounting principles or from economic or political instability in other nations. Emerging markets involve heightened risks related to the same factors as well as increased volatility and lower trading volume. Investments in smaller companies involve additional risks and typically exhibit higher volatility. Diversification does not prevent all investment losses.
| | | | |
| 4 | | Causeway International Small Cap Fund | | |
Comparison of Change in the Value of a $10,000 Investment in Causeway International Small Cap Fund, Investor Class shares versus the MSCI ACWI ex USA Small Cap Index (Gross)
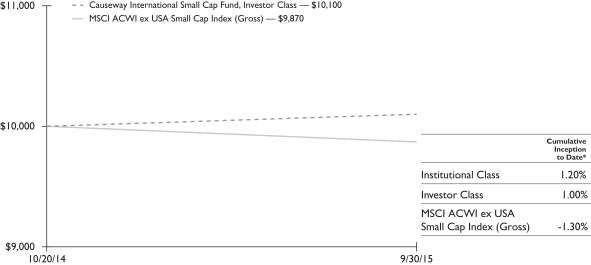
The performance in the above graph does not reflect the deduction of taxes the shareholder will pay on Fund distributions or the redemptions of Fund shares.
*The inception date of Causeway International Small Cap Fund was October 20, 2014.
The MSCI ACWI ex USA Small Cap Index (Gross) inception to date return is from October 20, 2014.
The performance data represents past performance and is not an indication of future results. Investment return and the principal value of an investment will fluctuate so that an investor’s shares, when redeemed, may be worth less than their original cost and current performance may be higher or lower than the performance quoted. For performance data current to the most recent month end, please call 1-866-947-7000 or visit www.causewayfunds.com. Investment performance reflects contractual fee waivers during certain periods. In the absence of such fee waivers, total return would have been reduced. The contractual expense limits are in effect until January 31, 2016. Total returns assume reinvestment of dividends and capital gains distributions at net asset value when paid. Investor Class shares pay a shareholder service fee of up to 0.25% per annum of average daily net assets. Institutional Class shares pay no shareholder service fee. For the period ended September 30, 2015, the Fund’s annualized gross ratios of expenses in relation to net assets were 3.40% and 3.64% for the Institutional Class and Investor Class, respectively, and the Fund’s annualized ratios of expenses in relation to net assets after fee waivers and reimbursements were 1.30% and 1.55% for the Institutional Class and Investor Class, respectively. The Fund imposes a 2% redemption fee on the value of shares redeemed less than 60 days after purchase. If your account incurred a redemption fee, your performance will be lower than the performance shown here. For more information, please see the prospectus.
The MSCI ACWI ex USA Small Cap Index (Gross) is a free float-adjusted market capitalization weighted index, designed to measure the equity market performance of smaller capital stocks in developed and emerging markets, excluding the US market, consisting of 45 country indices. The index covers approximately 14% of the free float adjusted market capitalization in each country. It is not possible to invest directly in an index. There are special risks in foreign investing (please see Note 5 in the Notes to Financial Statements).
MSCI has not approved, reviewed or produced this report, makes no express or implied warranties or representations, and is not liable whatsoever for any data in this report. You may not redistribute the MSCI data or use it as a basis for other indices or investment products.
| | | | | | |
| | | Causeway International Small Cap Fund | | | 5 | |
SCHEDULE OF INVESTMENTS (000)*
September 30, 2015
| | | | | | | | |
| Causeway International Small Cap Fund | | Number of Shares | | | Value | |
COMMON STOCK | | | | | | | | |
| Australia — 5.5% | | | | | | |
CSR Ltd. | | | 10,783 | | | $ | 22 | |
Downer EDI Ltd. | | | 54,620 | | | | 129 | |
Echo Entertainment Group Ltd. | | | 9,932 | | | | 34 | |
Evolution Mining Ltd. | | | 224,895 | | | | 200 | |
Fairfax Media Ltd. | | | 44,792 | | | | 28 | |
Monadelphous Group Ltd. | | | 2,914 | | | | 13 | |
OZ Minerals Ltd. | | | 24,636 | | | | 58 | |
Sigma Pharmaceuticals Ltd. | | | 48,175 | | | | 25 | |
| | | | | | | | |
| | | | | | | 509 | |
| | | | | | | | |
| Austria — 0.6% | | | | | | |
Austria Technologie & Systemtechnik AG | | | 3,670 | | | | 54 | |
| | | | | | | | |
| Canada — 5.8% | | | | | | |
AGF Management Ltd., Class B | | | 19,300 | | | | 77 | |
Air Canada, Class B1 | | | 1,100 | | | | 9 | |
Celestica Inc.1 | | | 5,700 | | | | 73 | |
Dream Global Real Estate Investment Trust2 | | | 1,200 | | | | 8 | |
Dream Office Real Estate Investment Trust2 | | | 1,200 | | | | 19 | |
Just Energy Group Inc. | | | 1,900 | | | | 12 | |
Morguard Real Estate Investment Trust2 | | | 2,300 | | | | 24 | |
Northern Property Real Estate Investment Trust2 | | | 1,900 | | | | 28 | |
RONA Inc. | | | 2,500 | | | | 25 | |
Transcontinental Inc., Class A | | | 11,900 | | | | 169 | |
Yellow Pages Ltd.1 | | | 7,800 | | | | 93 | |
| | | | | | | | |
| | | | | | | 537 | |
| | | | | | | | |
| China — 7.4% | | | | | | |
China Aoyuan Property Group Ltd. | | | 254,000 | | | | 48 | |
China Lesso Group Holdings Ltd. | | | 9,000 | | | | 7 | |
Fantasia Holdings Group Co. Ltd. | | | 733,500 | | | | 83 | |
Future Land Development Holdings Ltd. | | | 54,000 | | | | 7 | |
Huangshan Tourism Development Co. Ltd., Class B | | | 36,300 | | | | 56 | |
KWG Property Holding Ltd. | | | 203,000 | | | | 134 | |
The accompanying notes are an integral part of the financial statements.
| | | | |
| 6 | | Causeway International Small Cap Fund | | |
SCHEDULE OF INVESTMENTS (000)* (continued)
September 30, 2015
| | | | | | | | |
| Causeway International Small Cap Fund | | Number of Shares | | | Value | |
| China — (continued) | | | | | | |
Lao Feng Xiang Co. Ltd., Class B | | | 36,752 | | | $ | 150 | |
Shanghai Diesel Engine Co. Ltd., Class B | | | 10,100 | | | | 7 | |
Shanghai Jinjiang International Industrial Investment Co., Ltd., Class B | | | 28,000 | | | | 42 | |
Shanghai Mechanical and Electrical Industry Ltd., Class B | | | 57,100 | | | | 130 | |
Skyworth Digital Holdings Ltd. | | | 36,000 | | | | 25 | |
| | | | | | | | |
| | | | | | | 689 | |
| | | | | | | | |
| Denmark — 2.1% | | | | | | |
DFDS A/S | | | 6,120 | | | | 195 | |
| | | | | | | | |
| France — 2.2% | | | | | | |
Boiron S.A. | | | 682 | | | | 66 | |
Sartorius Stedim Biotech | | | 479 | | | | 142 | |
| | | | | | | | |
| | | | | | | 208 | |
| | | | | | | | |
| Germany — 2.6% | | | | | | |
Deutsche Beteiligungs AG | | | 6,112 | | | | 170 | |
Patrizia Immobilien AG | | | 3,146 | | | | 75 | |
| | | | | | | | |
| | | | | | | 245 | |
| | | | | | | | |
| Indonesia — 1.4% | | | | | | |
Bank Pembangunan Daerah Jawa Barat Dan Banten | | | 3,006,900 | | | | 127 | |
| | | | | | | | |
| Italy — 3.9% | | | | | | |
Astaldi SpA | | | 9,291 | | | | 85 | |
ASTM SpA | | | 13,293 | | | | 177 | |
Banca IFIS SpA | | | 4,530 | | | | 105 | |
| | | | | | | | |
| | | | | | | 367 | |
| | | | | | | | |
| Japan — 18.0% | | | | | | |
Alpine Electronics Inc. | | | 4,500 | | | | 49 | |
Alps Electric Co. Ltd. | | | 3,000 | | | | 85 | |
CONEXIO Corp. | | | 3,000 | | | | 29 | |
DTS Corp. | | | 400 | | | | 9 | |
EDION Corp. | | | 4,700 | | | | 32 | |
The accompanying notes are an integral part of the financial statements.
| | | | | | |
| | | Causeway International Small Cap Fund | | | 7 | |
SCHEDULE OF INVESTMENTS (000)* (continued)
September 30, 2015
| | | | | | | | |
| Causeway International Small Cap Fund | | Number of Shares | | | Value | |
| Japan — (continued) | | | | | | |
Foster Electric Co. Ltd. | | | 7,500 | | | $ | 150 | |
Geo Holdings Corp. | | | 7,500 | | | | 120 | |
Japan Aviation Electronics Industry Ltd. | | | 1,000 | | | | 15 | |
JVC Kenwood Corp. | | | 3,100 | | | | 7 | |
Kenedix Retail REIT Corp.2 | | | 4 | | | | 8 | |
K’s Holdings Corp. | | | 2,000 | | | | 63 | |
Matsumotokiyoshi Holdings Co. Ltd. | | | 200 | | | | 9 | |
Mitsumi Electric Co. Ltd. | | | 10,300 | | | | 57 | |
Nichi-Iko Pharmaceutical Co. Ltd. | | | 1,900 | | | | 50 | |
Sekisui House Reit Inc.2 | | | 9 | | | | 9 | |
Sojitz Corp. | | | 85,900 | | | | 160 | |
Sumitomo Forestry Co. Ltd. | | | 5,400 | | | | 61 | |
Taiyo Yuden Co. Ltd. | | | 3,500 | | | | 46 | |
Takasago Thermal Engineering Co. Ltd. | | | 2,700 | | | | 37 | |
T-Gaia Corp. | | | 8,200 | | | | 128 | |
Toda Corp. | | | 8,000 | | | | 35 | |
Toho Holdings Co. Ltd. | | | 8,800 | | | | 184 | |
Tokai Rika Co. Ltd. | | | 3,000 | | | | 62 | |
Towa Pharmaceutical Co. Ltd. | | | 2,400 | | | | 154 | |
UKC Holdings Corp. | | | 2,000 | | | | 38 | |
Yaoko Co. Ltd. | | | 1,000 | | | | 45 | |
Yuasa Trading Co. Ltd. | | | 1,800 | | | | 37 | |
| | | | | | | | |
| | | | | | | 1,679 | |
| | | | | | | | |
| Malaysia — 1.7% | | | | | | |
Top Glove Corp. BHD | | | 88,300 | | | | 162 | |
| | | | | | | | |
| Mexico — 1.7% | | | | | | |
Mexico Real Estate Management SA de CV2 | | | 125,600 | | | | 159 | |
| | | | | | | | |
| New Zealand — 3.3% | | | | | | |
Air New Zealand Ltd. | | | 107,799 | | | | 170 | |
Fisher & Paykel Healthcare Corp. Ltd. | | | 7,526 | | | | 34 | |
Nuplex Industries Ltd. | | | 41,093 | | | | 102 | |
| | | | | | | | |
| | | | | | | 306 | |
| | | | | | | | |
The accompanying notes are an integral part of the financial statements.
| | | | |
| 8 | | Causeway International Small Cap Fund | | |
SCHEDULE OF INVESTMENTS (000)* (continued)
September 30, 2015
| | | | | | | | |
| Causeway International Small Cap Fund | | Number of Shares | | | Value | |
| Norway — 2.8% | | | | | | |
Aker ASA, Class A | | | 6,084 | | | $ | 106 | |
Bakkafrost | | | 4,921 | | | | 157 | |
| | | | | | | | |
| | | | | | | 263 | |
| | | | | | | | |
| Philippines — 1.7% | | | | | | |
Cebu Air Inc. | | | 84,010 | | | | 156 | |
| | | | | | | | |
| Singapore — 0.2% | | | | | | |
Keppel DC2 | | | 13,000 | | | | 10 | |
Mapletree Logistics Trust2 | | | 10,400 | | | | 7 | |
| | | | | | | | |
| | | | | | | 17 | |
| | | | | | | | |
| South Africa — 1.0% | | | | | | |
Emira Property Fund Ltd.2 | | | 38,117 | | | | 49 | |
Telkom SA Ltd. | | | 9,017 | | | | 43 | |
| | | | | | | | |
| | | | | | | 92 | |
| | | | | | | | |
| South Korea — 6.5% | | | | | | |
BGF retail Co. Ltd. | | | 879 | | | | 150 | |
Daeduck GDS Co. Ltd. | | | 3,132 | | | | 26 | |
Korea Petrochemical Industries Co. Ltd. | | | 775 | | | | 109 | |
Korean Reinsurance Co. | | | 12,584 | | | | 151 | |
Tongyang Life Insurance | | | 13,946 | | | | 168 | |
| | | | | | | | |
| | | | | | | 604 | |
| | | | | | | | |
| Spain — 1.4% | | | | | | |
Corp. Financiera Alba SA | | | 2,519 | | | | 105 | |
Duro Felguera SA | | | 6,651 | | | | 15 | |
Saeta Yield SA | | | 974 | | | | 9 | |
| | | | | | | | |
| | | | | | | 129 | |
| | | | | | | | |
| Sweden — 6.5% | | | | | | |
Axfood AB | | | 10,933 | | | | 181 | |
Bilia AB, Class A | | | 9,595 | | | | 192 | |
Byggmax Group AB | | | 15,301 | | | | 137 | |
The accompanying notes are an integral part of the financial statements.
| | | | | | |
| | | Causeway International Small Cap Fund | | | 9 | |
SCHEDULE OF INVESTMENTS (000)* (continued)
September 30, 2015
| | | | | | | | |
| Causeway International Small Cap Fund | | Number of Shares | | | Value | |
| Sweden — (continued) | | | | | | |
Dios Fastigheter AB | | | 1,304 | | | $ | 9 | |
Hemfosa Fastigheter AB | | | 5,663 | | | | 60 | |
SAS AB1 | | | 15,522 | | | | 29 | |
| | | | | | | | |
| | | | | | | 608 | |
| | | | | | | | |
| Taiwan — 2.7% | | | | | | |
Coretronic Corp. | | | 73,000 | | | | 66 | |
Elitegroup Computer Systems Co. Ltd. | | | 146,000 | | | | 86 | |
Taiwan Surface Mounting Technology Co. Ltd. | | | 30,450 | | | | 28 | |
Wan Hai Lines Ltd. | | | 96,000 | | | | 61 | |
WT Microelectronics Co. Ltd. | | | 11,726 | | | | 12 | |
| | | | | | | | |
| | | | | | | 253 | |
| | | | | | | | |
| Thailand — 1.5% | | | | | | |
AP Thailand PCL | | | 42,900 | | | | 7 | |
Bangchak Petroleum PCL | | | 23,400 | | | | 22 | |
Krungthai Card PCL | | | 40,200 | | | | 104 | |
Muangthai Leasing PCL | | | 19,000 | | | | 8 | |
| | | | | | | | |
| | | | | | | 141 | |
| | | | | | | | |
| Turkey — 1.1% | | | | | | |
Cimsa Cimento Sanayi VE Ticaret AS | | | 21,740 | | | | 107 | |
| | | | | | | | |
| United Arab Emirates — 0.2% | | | | | | |
Amanat Holdings PJSC1 | | | 46,776 | | | | 9 | |
Dubai Parks & Resorts PJSC1 | | | 31,240 | | | | 11 | |
| | | | | | | | |
| | | | | | | 20 | |
| | | | | | | | |
| United Kingdom — 12.1% | | | | | | |
Debenhams PLC | | | 40,289 | | | | 48 | |
Go-Ahead Group PLC | | | 256 | | | | 10 | |
Greggs PLC | | | 11,042 | | | | 182 | |
Hargreaves Services PLC | | | 5,899 | | | | 31 | |
Home Retail Group PLC | | | 57,166 | | | | 118 | |
Indivior PLC | | | 57,053 | | | | 196 | |
The accompanying notes are an integral part of the financial statements.
| | | | |
| 10 | | Causeway International Small Cap Fund | | |
SCHEDULE OF INVESTMENTS (000)* (concluded)
September 30, 2015
| | | | | | | | |
| Causeway International Small Cap Fund | | Number of Shares | | | Value | |
| United Kingdom — (continued) | | | | | | |
Intermediate Capital Group PLC | | | 4,263 | | | $ | 33 | |
Lancashire Holdings Ltd. | | | 8,604 | | | | 90 | |
Lookers PLC | | | 15,566 | | | | 39 | |
Man Group PLC | | | 74,583 | | | | 173 | |
Northgate PLC | | | 4,283 | | | | 29 | |
Phoenix Group Holdings | | | 11,077 | | | | 137 | |
Playtech PLC | | | 2,900 | | | | 36 | |
| | | | | | | | |
| | | | | | | 1,122 | |
| | | | | | | | |
Total Common Stock | | | | | | | | |
(Cost $9,074) — 93.9% | | | | | | | 8,749 | |
| | | | | | | | |
EXCHANGE TRADED FUNDS | | | | | | | | |
Market Vectors India Small-Cap Index ETF | | | 9,200 | | | | 389 | |
Vanguard FTSE All-World ex-US Small-Cap ETF | | | 1,700 | | | | 154 | |
| | | | | | | | |
Total Exchange Traded Funds | | | | | | | | |
(Cost $550) — 5.8% | | | | | | | 543 | |
| | | | | | | | |
Total Investments — 99.7% | | | | | | | | |
(Cost $9,624) | | | | | | | 9,292 | |
| | | | | | | | |
Other Assets in Excess of Liabilities — 0.3% | | | | | | | 25 | |
| | | | | | | | |
Net Assets — 100.0% | | | | | | $ | 9,317 | |
| | | | | | | | |
| 1 | Non-income producing security. |
| 2 | Real Estate Investment Trust. |
| FTSE | Financial Times London Stock Exchange |
The accompanying notes are an integral part of the financial statements.
| | | | | | |
| | | Causeway International Small Cap Fund | | | 11 | |
SECTOR DIVERSIFICATION
As of September 30, 2015, the sector diversification was as follows (Unaudited):
| | | | |
| Causeway International Small Cap Fund | | % of Net Assets | |
| |
Financials | | | 22.5% | |
| |
Consumer Discretionary | | | 17.0 | |
| |
Industrials | | | 16.4 | |
| |
Health Care | | | 12.0 | |
| |
Consumer Staples | | | 7.8 | |
| |
Materials | | | 7.5 | |
| |
Information Technology | | | 7.5 | |
| |
Utilities | | | 2.1 | |
| |
Energy | | | 0.6 | |
| |
Telecommunication Services | | | 0.5 | |
| | | | |
| Total | | | 93.9 | |
| |
| Exchange Traded Funds | | | 5.8 | |
| | | | |
| Other Assets in Excess of Liabilities | | | 0.3 | |
| | | | |
| Net Assets | | | 100.0% | |
| | | | |
The accompanying notes are an integral part of the financial statements.
| | | | |
| 12 | | Causeway International Small Cap Fund | | |
STATEMENT OF ASSETS AND LIABILITIES (000)*
| | | | |
| | | CAUSEWAY
INTERNATIONAL
SMALL CAP FUND | |
| |
| | | 9/30/15 | |
ASSETS: | | | | |
Investments at Value (Cost $9,624) | | $ | 9,292 | |
Receivable for Investment Securities Sold | | | 122 | |
Receivable for Dividends | | | 30 | |
Prepaid Expenses | | | 17 | |
Receivable Due from Adviser | | | 8 | |
Receivable for Tax Reclaims | | | 3 | |
| | | | |
Total Assets | | | 9,472 | |
| | | | |
LIABILITIES: | | | | |
Due to Custodian | | | 79 | |
Payable Due to Administrator | | | 2 | |
Other Accrued Expenses | | | 74 | |
| | | | |
Total Liabilities | | | 155 | |
| | | | |
Net Assets | | $ | 9,317 | |
| | | | |
NET ASSETS: | | | | |
Paid-in Capital (unlimited authorization — no par value) | | $ | 9,549 | |
Undistributed Net Investment Income | | | 168 | |
Accumulated Net Realized Loss on Investments and Foreign Currency Transactions | | | (65 | ) |
Net Unrealized Depreciation on Investments | | | (332 | ) |
Net Unrealized Depreciation on Foreign Currencies and Translation of Other Assets and Liabilities Denominated in Foreign Currencies | | | (3 | ) |
| | | | |
Net Assets | | $ | 9,317 | |
| | | | |
Net Asset Value Per Share (based on net assets of
$8,663,374 ÷ 855,817 shares) — Institutional Class | | | $10.12 | |
| | | | |
Net Asset Value Per Share (based on net assets of
$653,498 ÷ 64,713 shares) — Investor Class | | | $10.10 | |
| | | | |
| * | Except for Net Asset Value per share data. |
The accompanying notes are an integral part of the financial statements.
| | | | | | |
| | | Causeway International Small Cap Fund | | | 13 | |
STATEMENT OF OPERATIONS (000)
| | | | |
| | | CAUSEWAY
INTERNATIONAL
SMALL CAP FUND | |
| |
| | | 10/20/14* to
9/30/15 | |
INVESTMENT INCOME: | | | | |
Dividend Income (net of foreign taxes withheld of $38) | | $ | 273 | |
| | | | |
Total Investment Income | | | 273 | |
| | | | |
EXPENSES: | | | | |
Investment Advisory Fees | | | 76 | |
Transfer Agent Fees | | | 55 | |
Custodian Fees | | | 32 | |
Professional Fees | | | 24 | |
Pricing Fees | | | 23 | |
Administration Fees | | | 19 | |
Printing Fees | | | 17 | |
Registration Fees | | | 6 | |
Line of Credit | | | 3 | |
Shareholder Service Fees — Investor Class | | | 1 | |
| | | | |
Total Expenses | | | 256 | |
| | | | |
Waiver of Investment Advisory Fees | | | (76 | ) |
Reimbursement of Other Expenses | | | (81 | ) |
| | | | |
Total Waiver and Reimbursement | | | (157 | ) |
| | | | |
| |
Net Expenses | | | 99 | |
| | | | |
Net Investment Income | | | 174 | |
| | | | |
Net Realized and Unrealized Gain (Loss) on Investments and Foreign Currency Transactions: | | | | |
Net Realized Loss on Investments | | | (63 | ) |
Net Realized Loss from Foreign Currency Transactions | | | (8 | ) |
Net Change in Unrealized Depreciation on Investments | | | (332 | ) |
Net Change in Unrealized Depreciation on Foreign Currency and Translation of Other Assets and Liabilities Denominated in Foreign Currency | | | (3 | ) |
| | | | |
Net Realized and Unrealized Loss on Investments and Foreign Currency Transactions | | | (406 | ) |
| | | | |
| Net Decrease in Net Assets Resulting from Operations | | $ | (232 | ) |
| | | | |
| * | Commencement of operations. |
The accompanying notes are an integral part of the financial statements.
| | | | |
| 14 | | Causeway International Small Cap Fund | | |
STATEMENT OF CHANGES IN NET ASSETS (000)
| | | | |
| | | CAUSEWAY
INTERNATIONAL
SMALL CAP FUND | |
| |
| | | 10/20/14* to
9/30/15 | |
OPERATIONS: | | | | |
Net Investment Income | | $ | 174 | |
Net Realized Loss on Investments | | | (63 | ) |
Net Realized Loss from Foreign Currency Transactions | | | (8 | ) |
Net Change in Unrealized Depreciation on Investments | | | (332 | ) |
Net Change in Unrealized Depreciation on Foreign Currency and Translation of Other Assets and Liabilities Denominated in Foreign Currency | | | (3 | ) |
| | | | |
Net Decrease in Net Assets Resulting From Operations | | | (232 | ) |
| | | | |
Net Increase in Net Assets Derived from Capital Share Transactions(1) | | | 9,549 | |
| | | | |
Total Increase in Net Assets | | | 9,317 | |
| | | | |
NET ASSETS: | | | | |
Beginning of Period | | | — | |
| | | | |
End of Period | | $ | 9,317 | |
| | | | |
Undistributed Net Investment Income | | $ | 168 | |
| | | | |
| * | Commencement of operations. |
| (1) | See Note 7 in the Notes to Financial Statements. |
The accompanying notes are an integral part of the financial statements.
| | | | | | |
| | | Causeway International Small Cap Fund | | | 15 | |
FINANCIAL HIGHLIGHTS
For the period ended September 30, 2015
For a Share Outstanding Throughout the Period
| | | | | | | | | | | | | | | | | | | | | | | | | | | | | | | | |
| | | Net Asset
Value,
Beginning
of Period ($) | | | Net
Investment
Income ($) | | | Net Realized
and
Unrealized Loss on
Investments ($) | | | Total
from Operations ($) | | | Dividends from Net
Investment Income ($) | | | Distributions
from
Capital Gains ($) | | | Total
Dividends
and Distributions ($) | | | Redemption Fees ($) | |
CAUSEWAY INTERNATIONAL SMALL CAP FUND† | |
Institutional | |
2015(1)(2) | | | 10.00 | | | | 0.23 | | | | (0.11 | ) | | | 0.12 | | | | — | | | | — | | | | — | | | | — | |
Investor | | | | | | | | | | | | | | | | | | | | | | | | | | | | | | | | |
2015(1)(2) | | | 10.00 | | | | 0.23 | | | | (0.13 | ) | | | 0.10 | | | | — | | | | — | | | | — | | | | — | |
| † | Per share amounts calculated using average shares method. |
| (1) | Commenced operations on October 20, 2014. |
| (2) | All ratios for periods less than one year are annualized. Total returns and portfolio turnover rate are for the period indicated and have not been annualized. |
Amounts designated as “—” are $0 or round to $0.
The accompanying notes are an integral part of the financial statements.
| | | | |
| 16 | | Causeway International Small Cap Fund | | |
| | | | | | | | | | | | | | | | | | | | | | | | | | |
Net Asset Value, End of Period ($) | | | Total
Return (%) | | | Net Assets,
End of
Period ($000) | | | Ratio of
Expenses to
Average Net
Assets (%) | | | Ratio of
Expenses
to Average
Net Assets
(Excluding
Waivers and
Reimburse-
ments) (%) | | | Ratio
of Net
Investment Income to Average Net Assets (%) | | | Portfolio Turnover Rate (%) | |
| | | | | | | | | | | | | | | | | | | | | | | | | | |
| | | | | | | | | | | | | | | | | | | | | | | | | | |
| | 10.12 | | | | 1.20 | | �� | | 8,663 | | | | 1.30 | | | | 3.40 | | | | 2.30 | | | | 76 | |
| | | | | | | | | | | | | | | | | | | | | | | | | | |
| | 10.10 | | | | 1.00 | | | | 654 | | | | 1.55 | | | | 3.64 | | | | 2.30 | | | | 76 | |
The accompanying notes are an integral part of the financial statements.
| | | | | | |
| | | Causeway International Small Cap Fund | | | 17 | |
NOTES TO FINANCIAL STATEMENTS
Causeway International Small Cap Fund (the “Fund”) is a series of Causeway Capital Management Trust (the “Trust”). The Trust is an open-end management investment company registered under the Investment Company Act of 1940, as amended (the “1940 Act”) and is a Delaware statutory trust that was established on August 10, 2001. The Fund began operations on October 20, 2014. The Fund is authorized to offer two classes of shares, the Institutional Class and the Investor Class. The Declaration of Trust authorizes the issuance of an unlimited number of shares of beneficial interest of the Fund. The Fund is diversified. The Fund’s prospectus provides a description of the Fund’s investment objectives, policies and strategies. The Trust has five additional series, the financial statements of which are presented separately.
| 2. | | Significant Accounting Policies |
The following is a summary of the significant accounting policies consistently followed by the Fund.
Use of Estimates in the Preparation of Financial Statements – The Fund is an investment company that applies the accounting and reporting guidance issued in Topic 946 by the U.S. Financial Accounting Standards Board. The Fund’s financial statements have been prepared to comply with U.S. generally accepted accounting principles (“U.S. GAAP”). The preparation of financial statements in conformity with U.S. GAAP requires management to make estimates and assumptions that affect the reported amount of net assets and liabilities and disclosure of contingent assets and liabilities at the date of the financial statements and the reported amounts of increases and decreases in net assets from operations during the reporting period. Actual results could differ from those estimates.
Security Valuation – Except as described below, securities listed on a securities exchange (except the NASDAQ Stock Market (“NASDAQ”)) or Over-the-Counter (“OTC”) for which market quotations are available) are valued at the last reported sale price as of the close of regular trading on each business day, or, if there is no such reported sale, at the last reported bid price for long positions. For securities traded on NASDAQ, the NASDAQ Official Closing Price will be used. Securities listed on multiple exchanges or OTC markets are valued on the exchange or OTC market considered by the Fund to be the primary market. The prices for foreign securities are reported in local currency and converted to U.S. dollars using currency exchange rates. Prices for most securities held in the Fund are provided daily by recognized independent pricing agents. If a security price cannot be obtained from an independent pricing agent, the Fund seeks to obtain a bid price from at least one independent broker. Investments in the Dreyfus Cash Management money market fund are valued daily at the net asset value per share.
Securities for which market prices are not “readily available” are valued in accordance with fair value pricing procedures approved by the Fund’s Board of Trustees (the “Board”). The Fund’s fair value pricing procedures are implemented through a fair value committee (the “Committee”) designated by the Board. Some of the more common reasons that may necessitate that a security be valued using fair value pricing procedures include: the security’s trading has been halted or suspended; the security has been delisted from a national exchange; the security’s primary trading market is temporarily closed at a time when under normal conditions it would be open; or the security’s primary pricing source is not able or willing to provide a price. When the Committee values a security in accordance with the fair value pricing procedures, the Committee
| | | | |
| 18 | | Causeway International Small Cap Fund | | |
NOTES TO FINANCIAL STATEMENTS
(continued)
will determine the value after taking into consideration relevant information reasonably available to the Committee.
The Fund uses a third party vendor to fair value certain non-U.S. securities if there is a movement in the U.S. market that exceeds thresholds established by the Committee. The vendor provides fair values for foreign securities based on factors and methodologies involving, generally, tracking valuation correlations between the U.S. market and each non-U.S. security.
In accordance with the authoritative guidance on fair value measurements and disclosure under U.S. GAAP, the Fund discloses fair value of its investments in a hierarchy that prioritizes the inputs to valuation techniques used to measure the fair value. The objective of a fair value measurement is to determine the price that would be received to sell an asset or paid to transfer a liability in an orderly transaction between market participants at the measurement date (an exit price). Accordingly, the fair value hierarchy gives the highest priority to quoted prices (unadjusted) in active markets for identical assets or liabilities (Level 1) and the lowest priority to unobservable inputs (Level 3).The guidance establishes three levels of fair value hierarchy as follows:
| | • | | Level 1 — Unadjusted quoted prices in active markets for identical, unrestricted assets or liabilities that the Fund has the ability to access at the measurement date; |
| | • | | Level 2 — Quoted prices in markets which are not active, or prices based on inputs that are observable (either directly or indirectly) for substantially the full term of the asset or liability; and |
| | • | | Level 3 — Prices, inputs or exotic modeling techniques which are both significant to the fair value measurement and unobservable (supported by little or no market activity). |
Investments are classified within the level of the lowest significant input considered in determining fair value. Investments classified within Level 3 whose fair value measurement considers several inputs may include Level 1 or Level 2 inputs as components of the overall fair value measurement.
The table below sets forth information about the levels within the fair value hierarchy at which the Fund’s investments are measured at September 30, 2015:
| | | | | | | | | | | | | | | | |
Investments in
Securities | | Level 1
(000) | | | Level 2†
(000) | | | Level 3
(000) | | | Total
(000) | |
Common Stock | | | | | | | | | | | | | | | | |
Australia | | $ | — | | | $ | 509 | | | $ | — | | | $ | 509 | |
Austria | | | — | | | | 54 | | | | — | | | | 54 | |
Canada | | | 537 | | | | — | | | | — | | | | 537 | |
China | | | — | | | | 689 | | | | — | | | | 689 | |
Denmark | | | 195 | | | | — | | | | — | | | | 195 | |
France | | | 66 | | | | 142 | | | | — | | | | 208 | |
Germany | | | — | | | | 245 | | | | — | | | | 245 | |
Indonesia | | | — | | | | 127 | | | | — | | | | 127 | |
Italy | | | — | | | | 367 | | | | — | | | | 367 | |
Japan | | �� | — | | | | 1,679 | | | | — | | | | 1,679 | |
Malaysia | | | — | | | | 162 | | | | — | | | | 162 | |
Mexico | | | 159 | | | | — | | | | — | | | | 159 | |
New Zealand | | | — | | | | 306 | | | | — | | | | 306 | |
Norway | | | — | | | | 263 | | | | — | | | | 263 | |
Philippines | | | — | | | | 156 | | | | — | | | | 156 | |
Singapore | | | — | | | | 17 | | | | — | | | | 17 | |
South Africa | | | 49 | | | | 43 | | | | — | | | | 92 | |
South Korea | | | — | | | | 604 | | | | — | | | | 604 | |
Spain | | | — | | | | 129 | | | | — | | | | 129 | |
Sweden | | | — | | | | 608 | | | | — | | | | 608 | |
Taiwan | | | — | | | | 253 | | | | — | | | | 253 | |
Thailand | | | — | | | | 141 | | | | — | | | | 141 | |
Turkey | | | — | | | | 107 | | | | — | | | | 107 | |
United Arab Emirates | | | — | | | | 20 | | | | — | | | | 20 | |
United Kingdom | | | — | | | | 1,122 | | | | — | | | | 1,122 | |
| | | | |
Total Common Stock | | | 1,006 | | | | 7,743 | | | | — | | | | 8,749 | |
| | | | |
Exchange Traded Funds | | | 543 | | | | — | | | | — | | | | 543 | |
| | | | |
Total Investments in Securities | | $ | 1,549 | | | $ | 7,743 | | | $ | — | | | $ | 9,292 | |
| | | | |
| † | Holdings represent securities trading outside the United States, the values of which were adjusted as a result of significant market movements following the close of local trading and/or due to “Foreign Line” securities using “Local Line” prices. |
| | | | | | |
| | | Causeway International Small Cap Fund | | | 19 | |
NOTES TO FINANCIAL STATEMENTS
(continued)
Please refer to the Schedule of Investments for additional information regarding the composition of the amounts listed above.
Changes in valuation techniques may result in transfers in or out of an investment’s assigned level within the hierarchy during the reporting period. Changes in the classification between Levels 1 and 2 occur primarily when foreign equity securities are fair valued by the Fund’s third party vendor using other observable market–based inputs in place of closing exchange prices due to events occurring after foreign market closures and/or due to adjustments to security values due to “Foreign Line” securities using “Local Line” prices.
For the period ended September 30, 2015, there were no significant changes to the Fund’s fair value methodologies.
Federal Income Taxes – It is the Fund’s intention to continue to qualify as a regulated investment company under Subchapter M of the Internal Revenue Code and to distribute all of its taxable income. Accordingly, no provision for Federal income taxes has been made in the financial statements.
The Fund evaluates tax positions taken or expected to be taken in the course of preparing the Fund’s tax returns to determine whether it is “more-likely-than not” (i.e., greater than 50-percent) that each tax position will be sustained upon examination by a taxing authority based on the technical merits of the position. Tax positions not deemed to meet the more likely-than-not threshold are recorded as a tax benefit or expense in the current year. The Fund did not record any tax provision in the current period. However, management’s conclusions regarding tax positions taken may be subject to review and adjustment at a later date based on factors including, but not limited to, examination by tax authorities (i.e., the last 3 tax year ends, as applicable), on-going
analysis of and changes to tax laws, regulations and interpretations thereof.
As of and during the period ended September 30, 2015, the Fund did not have a liability for any unrecognized tax benefits. The Fund recognizes interest and penalties, if any, related to unrecognized tax benefits as income tax expense in the Statement of Operations. During the period, the Fund did not incur any significant interest or penalties.
Security Transactions and Related Income – Security transactions are accounted for on the date the security is purchased or sold (trade date). Dividend income is recognized on the ex-dividend date, and interest income is recognized using the accrual basis of accounting. Costs used in determining realized gains and losses on the sales of investment securities are those of the specific securities sold.
Foreign Currency Translation – The books and records of the Fund are maintained in U.S. dollars on the following basis:
(1) the market value or fair value of investment securities, assets and liabilities is converted at the current rate of exchange; and
(2) purchases and sales of investment securities, income and expenses are converted at the relevant rates of exchange prevailing on the respective dates of such transactions.
The Fund does not isolate that portion of gains and losses on investments in equity securities that is due to changes in the foreign exchange rates from that which is due to changes in market prices of equity securities.
Foreign Currency Exchange Contracts – When the Fund purchases or sells foreign securities, it may enter into foreign currency exchange contracts to minimize foreign
| | | | |
| 20 | | Causeway International Small Cap Fund | | |
NOTES TO FINANCIAL STATEMENTS
(continued)
exchange risk from the trade date to the settlement date of the transaction. Losses from these transactions may arise from changes in the value of the foreign currency or if the counterparties do not perform under the contract’s terms.
Expense/Classes – Expenses that are directly related to one Fund of the Trust are charged directly to that Fund. Other operating expenses of the Trust are prorated to the Fund and the other series of the Trust on the basis of relative daily net assets. Class specific expenses are borne by that class of shares. Income, realized and unrealized gains/losses and non-class specific expenses are allocated to the respective classes on the basis of relative daily net assets.
Dividends and Distributions – Dividends from net investment income, if any, are declared and paid on an annual basis. Any net realized capital gains on sales of securities are distributed to shareholders at least annually.
Redemption Fee – The Fund imposes a redemption fee of 2% on the value of capital shares redeemed by shareholders less than 60 days after purchase. The redemption fee also applies to exchanges from the Fund. The redemption fee is paid to the Fund. The redemption fee does not apply to shares purchased through reinvested distributions or shares redeemed through designated systematic withdrawal plans. The redemption fee does not normally apply to accounts designated as omnibus accounts with the transfer agent. These are arrangements through financial intermediaries where the purchase and sale orders of a number of persons are aggregated before being communicated to the Fund. However, the Fund may seek agreements with these intermediaries to impose the Fund’s redemption fee or a different redemption fee on their customers if feasible, or to impose other appropriate
restrictions on excessive short-term trading. The officers of the Fund may waive the redemption fee for shareholders in asset allocation and similar investment programs reasonably believed not to be engaged in short-term market timing, including for holders of shares purchased by Causeway Capital Management LLC (the “Adviser”) for its clients to rebalance their portfolios. For the period ended September 30, 2015, the Fund did not retain any redemption fees.
| 3. | | Investment Advisory, Administration, Shareholder Service and Distribution Agreements |
The Trust, on behalf of the Fund, has entered into an Investment Advisory Agreement (the “Advisory Agreement”) with the Adviser. Under the Advisory Agreement, the Adviser is entitled to a monthly fee equal to an annual rate of 1.00% of the Fund’s average daily net assets. The Adviser has contractually agreed through January 31, 2016 to waive its fee and, to the extent necessary, reimburse the Fund to keep total annual fund operating expenses (excluding brokerage fees and commissions, interest, taxes, shareholder service fees, fees and expenses of other funds in which the Fund invests, and extraordinary expenses) from exceeding 1.30% of Institutional Class and Investor Class average daily net assets. For the period ended September 30, 2015, the Adviser waived its entire advisory fee of $75,714 and reimbursed expenses of $80,935. The expense reimbursements are not subject to recapture.
The Trust and SEI Investments Global Funds Services (the “Administrator”) have entered into an Administration Agreement. Under the terms of the Administration Agreement, the Administrator is entitled to an annual fee which is calculated daily and paid monthly based on the aggregate average daily net assets of the Trust subject to a minimum annual fee.
| | | | | | |
| | | Causeway International Small Cap Fund | | | 21 | |
NOTES TO FINANCIAL STATEMENTS
(continued)
The Trust has adopted a Shareholder Service Plan and Agreement for Investor Class shares that allows the Trust to pay broker-dealers and other financial intermediaries a fee of up to 0.25% per annum of average daily net assets for services provided to Investor Class shareholders. For the period ended September 30, 2015, the Investor Class paid 0.25% annualized of average daily net assets under this plan.
The Trust and SEI Investments Distribution Co. (the “Distributor”) have entered into a Distribution Agreement. The Distributor receives no fees for its distribution services under this agreement.
The officers of the Trust are also officers or employees of the Administrator or Adviser. They receive no fees for serving as officers of the Trust.
As of September 30, 2015, approximately $5.353 million of net assets were held by affiliated investors.
| 4. | | Investment Transactions |
The cost of security purchases and the proceeds from the sale of securities, other than short-term investments, during the period ended September 30, 2015, for the Fund were as follows:
| | | | | | |
Purchases
(000) | | | Sales
(000) | |
| $ | 15,791 | | | $ | 6,103 | |
| 5. | | Risks of Foreign and Small Cap Investing |
Because the Fund invests most of its assets in foreign securities, the Fund is subject to further risks. For example, the value of the Fund’s securities may be affected by social, political and economic developments and U.S. and foreign laws relating to foreign investment. Further, because the Fund invests in securities denominated in foreign currencies, the Fund’s securities
may go down in value depending on foreign exchange rates. Other risks include trading, settlement, custodial, and other operational risks; withholding or other taxes; and the less stringent investor protection and disclosure standards of some foreign markets. All of these factors can make foreign securities less liquid, more volatile and harder to value than U.S. securities. These risks are higher for emerging markets investments. Investments in smaller companies involve additional risks and typically exhibit higher volatility.
The Fund invests a significant portion of its assets in the securities of small capitalization companies. The values of securities of smaller, less well-known companies can be more sensitive to, and react differently to, company, political, market, and economic developments than the market as a whole and other types of securities. Small companies can have more limited product lines, markets, growth prospects, depth of management, and financial resources, and these companies may have shorter operating histories and less access to financing, creating additional risk. Further, small companies may be particularly affected by interest rate increases, as they may find it more difficult to borrow money to continue or expand operations, or may have difficulty in repaying any loans that have floating rates. Because of these and other risks, securities of small capitalization companies tend to be more volatile and less liquid than securities of medium and larger capitalization companies. During some periods, securities of small capitalization companies, as an asset class, have underperformed the securities of larger capitalization companies.
| 6. | | Federal Tax Information |
The Fund is classified as a separate taxable entity for Federal income tax purposes. The Fund intends to continue to qualify as a separate “regulated investment
| | | | |
| 22 | | Causeway International Small Cap Fund | | |
NOTES TO FINANCIAL STATEMENTS
(continued)
company” under Subchapter M of the Internal Revenue Code and make the requisite distributions to shareholders that will be sufficient to relieve it from Federal income tax and Federal excise tax. Therefore, no Federal tax provision is required. To the extent that dividends from net investment income and distributions from net realized capital gains exceed amounts reported in the financial statements, such amounts are reported separately.
The Fund may be subject to taxes imposed by countries in which it invests in issuers existing or operating in such countries. Such taxes are generally based on income earned. The Fund accrues such taxes when the related income is earned. Dividend and interest income are recorded net of non-U.S. taxes paid.
The amounts of distributions from net investment income and net realized capital gains are determined in accordance with Federal income tax regulations, which may differ from those amounts determined under U.S. GAAP. These book/tax differences are either temporary or permanent in nature. The character of distributions made during the year from net investment income or net realized gains, and the timing of distributions made during the year may differ from the year that the income or realized gains (losses) were recorded by the Fund. To the extent these differences are permanent, adjustments are made to the appropriate equity accounts in the period that the differences arise.
Accordingly, the following permanent differences, which are primarily due to realized losses on foreign currency transactions and gains and losses on passive foreign investment companies, were reclassified to/(from) the following accounts as of September 30, 2015.
| | | | | | |
Undistributed
Net Investment
Loss | | | Accumulated
Net Realized
Gain | |
| $ | (6 | ) | | $ | 6 | |
The reclassifications had no impact on net assets or net asset value per share.
As of September 30, 2015, the components of accumulated losses on a tax basis were as follows (000):
| | | | |
Undistributed Ordinary Income | | $ | 193 | |
Capital Loss Carryforwards | | | (65 | ) |
Unrealized Depreciation | | | (360 | ) |
| | | | |
Total Accumulated Losses | | $ | (232 | ) |
| | | | |
Under the Regulated Investment Company Modernization Act of 2010, the Portfolio is permitted to carry forward capital losses incur for an unlimited period. Capital losses that are carried forward will retain their character as either short-term or long-term capital losses. Losses carried forward are as follows:
| | | | | | | | | | | | |
| | | Short-Term
Loss (000) | | | Long-Term
Loss (000) | | | Total
(000) | |
Causeway International
Small Cap
Fund | | $ | 65 | | | $ | — | | | $ | 65 | |
At September 30, 2015, the total cost of securities for Federal income tax purposes and the aggregate gross unrealized appreciation and depreciation on investment securities for the Fund were as follows (000):
| | | | | | | | | | | | |
Federal
Tax Cost | | Appreciated
Securities | | | Depreciated
Securities | | | Net
Unrealized
Depreciation | |
| $9,649 | | $ | 664 | | | $ | (1,021 | ) | | $ | (357 | ) |
Foreign taxes accrued during the period ended September 30, 2015, amounted to $35,935 and are expected to be passed through to shareholders as foreign tax credits on Form 1099 – Dividend for the year ending December 31, 2015. In addition, for the period ended September 30, 2015, gross income derived from sources within foreign countries amounted to $309,581 for the Fund.
| | | | | | |
| | | Causeway International Small Cap Fund | | | 23 | |
NOTES TO FINANCIAL STATEMENTS
(concluded)
| 7. | | Capital Shares Issued and Redeemed (000) |
| | | | | | | | |
| | | Period Ended
September 30, 2015* | |
| | | Shares | | | Value | |
Institutional Class | | | | | | | | |
Shares Sold | | | 856 | | | $ | 8,903 | |
Shares Redeemed | | | — | | | | (4 | ) |
| | | | | | | | |
Increase in Shares Outstanding Derived from Institutional Class Transactions | | | 856 | | | | 8,899 | |
| | | | | | | | |
Investor Class | | | | | | | | |
Shares Sold | | | 118 | | | $ | 1,235 | |
Shares Redeemed | | | (53 | ) | | | (585 | ) |
| | | | | | | | |
Increase in Shares Outstanding Derived from Investor Class Transactions | | | 65 | | | | 650 | |
| | | | | | | | |
Increase in Shares Outstanding from Capital Share Transactions | | | 921 | | | $ | 9,549 | |
| | | | | | | | |
| * | Commenced operations on October 20, 2014. |
| 8. | | Significant Shareholder Concentration |
As of September 30, 2015, three of the Fund’s shareholders of record owned 91% of net assets in the Institutional Class.
Under the Trust’s organizational documents, each Trustee, officer, employee or other agent of the Trust is indemnified against certain liabilities that may arise out of the performance of his or her duties to the Fund. Additionally, in the normal course of business, the Fund enters into contracts, including the Fund’s servicing agreements, that contain a variety of indemnification clauses. The Fund’s maximum exposure under these arrangements is unknown as this would involve future claims that may be made against the Fund that have not yet occurred. The risk of material loss as a result of such indemnification claims is considered remote.
The Fund entered into an agreement, on February 24, 2015, which enables it to participate in a $10 million secured committed revolving line of credit, along with certain other series of the Trust, with The Bank of New York Mellon (the “Custodian”) which expires February 24, 2016. The proceeds from the borrowings, if any, shall be used to finance the Fund’s short-term general working capital requirements, including the funding of shareholder redemptions. Interest, if any, is charged to the Fund based on its borrowings during the period at the applicable rate plus 1.5%. The Fund is also charged a portion of a commitment fee of 0.12% per annum. As of September 30, 2015, there were no borrowings outstanding under the line of credit.
The Fund has evaluated the need for disclosures and/or adjustments resulting from subsequent events through the date the financial statements were issued. Based on this evaluation, no adjustments were required to the financial statements.
| | | | |
| 24 | | Causeway International Small Cap Fund | | |
REPORT OF INDEPENDENT REGISTERED PUBLIC ACCOUNTING FIRM
To the Board of Trustees and Shareholders of
Causeway International Small Cap Fund:
In our opinion, the accompanying statement of assets and liabilities, including the schedule of investments, and the related statements of operations and of changes in net assets and the financial highlights present fairly, in all material respects, the financial position of Causeway International Small Cap Fund (the “Fund”) at September 30, 2015, and the results of its operations, the changes in its net assets and the financial highlights for the period October 20, 2014 (commencement of operations) through September 30, 2015, in conformity with accounting principles generally accepted in the United States of America. These financial statements and financial highlights (hereafter referred to as “financial statements”) are the responsibility of the Fund’s management. Our responsibility is to express an opinion on these financial statements based on our audit. We conducted our audit of these financial statements in accordance with the standards of the Public Company Accounting Oversight Board (United States). Those standards require that we plan and perform the audit to obtain reasonable assurance about whether the financial statements are free of material misstatement. An audit includes examining, on a test basis, evidence supporting the amounts and disclosures in the financial statements, assessing the accounting principles used and significant estimates made by management, and evaluating the overall financial statement presentation. We believe that our audit, which included confirmation of securities at September 30, 2015 by correspondence with the custodian and brokers, provides a reasonable basis for our opinion.
PricewaterhouseCoopers LLP
Los Angeles, California
November 24, 2015
| | | | | | |
| | | Causeway International Small Cap Fund | | | 25 | |
TRUSTEES AND OFFICERS INFORMATION (Unaudited)
Information pertaining to the Trustees and Officers of the Trust is set forth below. Trustees who are not deemed to be “interested persons” of the Trust as defined in the 1940 Act are referred to as “Independent Trustees.” The Trust’s Statement of Additional Information (“SAI”) includes additional information about the Trustees and Officers. The SAI may be obtained without charge by calling 1-866-947-7000.
| | | | | | | | | | |
Name
Address,
Age1 | | Position(s) Held with the Company | | Term of
Office
and
Length of Time
Served2 | | Principal
Occupation(s)
During Past
Five Years | | Number of Portfolios
in Trust
Complex
Overseen by Trustee3 | | Other
Directorships Held by Trustee4 |
INDEPENDENT
TRUSTEES | | | | | | | | | | |
John R. Graham
Age: 54 | | Trustee; Chairman of the Audit Committee | | Trustee
since 10/08; Audit Chairman
since 4/13 | | Film Composer (since 2005); Senior Vice President, Corporate Financial Development and Communications, The Walt Disney Company (2004-2005); Senior Vice President, Mergers and Acquisitions, Lehman Brothers Inc. (2000-2004). | | 6 | | none |
| | | | | |
Lawry J. Meister
Age: 53 | | Trustee | | Since 10/08 | | President, Steaven Jones Development Company, Inc. (real estate firm) (since 1995); President, Creative Office Properties (real estate firm) (since 2012). | | 6 | | none |
| | | | | |
Victoria B. Rogers
Age: 54 | | Trustee | | Since 4/13 | | President, the Rose Hills Foundation (since 1996). | | 6 | | Director, TCW Funds, Inc. and TCW Strategic Income Fund |
| | | | | |
Eric H. Sussman
Age: 49 | | Trustee; Chairman of the Board | | Trustee
since 9/01; Board Chairman
since 4/13 | | Senior Lecturer (since July 2011) and Lecturer (1995-June 2011), Anderson Graduate School of Management, University of California, Los Angeles; President, Amber Capital, Inc. (real estate investment and financial planning firm) (since 1993). | | 6 | | none |
| | | | |
| 26 | | Causeway International Small Cap Fund | | |
TRUSTEES AND OFFICERS INFORMATION (Unaudited)
(continued)
| | | | | | | | | | |
Name
Address,
Age1 | | Position(s) Held with the Company | | Term of Office
and
Length of Time
Served2 | | Principal
Occupation(s)
During Past
Five Years | | Number of Portfolios in Trust Complex Overseen by Trustee3 | | Other Directorships
Held by
Trustee4 |
OFFICERS | | | | | | | | | | |
Turner Swan
11111 Santa Monica Blvd.,
15th Floor
Los Angeles, CA 90025
Age: 53 | | President | | Since 8/01 | | General Counsel, Secretary, and Member of the Adviser (since 2001); Compliance Officer of the Adviser (since 2010). | | N/A | | N/A |
| | | | | |
Kurt J. Decko
11111 Santa Monica Blvd.,
15th Floor
Los Angeles, CA 90025
Age: 40 | | Chief Compliance Officer and Assistant Secretary | | Since 1/15 | | Chief Compliance Officer/Senior Legal Counsel of the Adviser (since January 2015); Partner, K&L Gates LLP (2010-2014). | | N/A | | N/A |
| | | | | |
Eric Kleinschmidt5
One Freedom Valley Drive
Oaks, PA 19456
Age: 47 | | Treasurer | | Since 8/14 | | Director of Fund Accounting, SEI Investments Company (since 2004). | | N/A | | N/A |
| | | | | |
Gretchen W. Corbell
11111 Santa Monica Blvd.,
15th Floor
Los Angeles, CA 90025
Age: 44 | | Secretary | | Since 10/11 | | Attorney of the Adviser (since 2004). | | N/A | | N/A |
| | | | | |
Gracie V. Fermelia
11111 Santa Monica Blvd.,
15th Floor
Los Angeles, CA 90025
Age: 54 | | Vice President and Assistant Secretary | | Vice President (since 1/15); Assistant Secretary (since 8/01) | | Chief Operating Officer and Member of the Adviser (since 2001); Chief Compliance Officer of the Adviser and the Trust (2005-2015). | | N/A | | N/A |
| | | | | | |
| | | Causeway International Small Cap Fund | | | 27 | |
TRUSTEES AND OFFICERS INFORMATION (Unaudited)
(concluded)
| | | | | | | | | | |
Name
Address,
Age1 | | Position(s) Held with the Company | | Term of Office
and
Length of Time
Served2 | | Principal
Occupation(s)
During Past
Five Years | | Number of Portfolios in Trust Complex Overseen by Trustee3 | | Other Directorships Held by
Trustee4 |
Lisa Whittaker5 One Freedom Valley Drive Oaks, PA 19456 Age: 36 | | Vice President and Assistant Secretary | | Since 8/13 | | Corporate Counsel of the Administrator (since 2012); Associate Counsel and Compliance Officer, The Glendmede Trust Company, N.A. (2011-2012); Associate, Drinker Biddle & Reath LLP (2006-2011). | | N/A | | N/A |
| 1 | Each Trustee may be contacted by writing to the Trustee c/o Causeway Capital Management Trust, One Freedom Valley Drive, Oaks, PA 19456. |
| 2 | Each Trustee holds office during the lifetime of the Trust or until his or her sooner resignation, retirement, removal, death or incapacity in accordance with the Trust’s Declaration of Trust. The president, treasurer and secretary each holds office at the pleasure of the Board of Trustees or until he or she sooner resigns in accordance with the Trust’s Bylaws. |
| 3 | The “Trust Complex” consists of all registered investment companies for which Causeway Capital Management LLC serves as investment adviser. As of September 30, 2015, the Trust Complex consisted of one investment company with six portfolios — the International Value Fund, the Emerging Markets Fund, the Global Value Fund, the International Opportunities Fund, the Global Absolute Return Fund, and the International Small Cap Fund. |
| 4 | Directorships of companies required to report to the Securities and Exchange Commission under the Securities Exchange Act of 1934 (i.e., “public companies”) or other investment companies registered under the 1940 Act. |
| 5 | These officers of the Trust also serve as officers of one or more mutual funds for which SEI Investments Company or an affiliate acts as investment manager, administrator or distributor. |
| | | | |
| 28 | | Causeway International Small Cap Fund | | |
DISCLOSURE OF FUND EXPENSES (Unaudited)
As a shareholder of the Fund, you incur two types of costs: (1) transaction costs, including redemption fees, and (2) ongoing costs, including management fees, shareholder service fees, and other Fund expenses. It is important for you to understand the impact of these costs on your investment returns.
Ongoing operating expenses are deducted from a mutual fund’s gross income and directly reduce its final investment return. These expenses are expressed as a percentage of a mutual fund’s average net assets; this percentage is known as a mutual fund’s expense ratio.
The following examples use the expense ratio and are intended to help you understand the ongoing costs (in dollars) of investing in the Fund and to compare these costs with those of other mutual funds. The examples are based on an investment of $1,000 made at the beginning of the period shown and held for the entire period (April 1, 2015 to September 30, 2015).
The table on the next page illustrates the Fund’s costs in two ways:
Actual Fund Return. This section helps you to estimate the actual expenses after fee waivers that the Fund incurred over the period. The “Expenses Paid During Period” column shows the actual dollar expense cost incurred by a $1,000 investment in the Fund, and the “Ending Account Value” number is derived from deducting that expense cost from the Fund’s gross investment return.
You can use this information, together with the actual amount you invested in the Fund, to estimate the expenses you paid over that period. Simply divide your actual account value by $1,000 to arrive at a ratio (for example, an $8,600 account value divided by $1,000 = 8.6), then multiply that ratio by the number shown under “Expenses Paid During Period.”
Hypothetical 5% Return. This section helps you compare the Fund’s costs with those of other mutual funds. It assumes that the Fund had an annual 5% return before expenses during the year, but that the expense ratio (Column 3) for the period is unchanged. This example is useful in making comparisons because the Securities and Exchange Commission requires all mutual funds to make this 5% calculation. You can assess the Fund’s comparative cost by comparing the hypothetical result for the Fund in the “Expenses Paid During Period” column with those that appear in the same charts in the shareholder reports for other mutual funds.
NOTE: Because the return is set at 5% for comparison purposes — NOT the Fund’s actual return — the account values shown may not apply to your specific investment.
| | | | | | |
| | | Causeway International Small Cap Fund | | | 29 | |
DISCLOSURE OF FUND EXPENSES (Unaudited)
(concluded)
| | | | | | | | | | | | | | | | |
| | | Beginning Account Value 4/01/15 | | | Ending Account Value 9/30/15 | | | Annualized Expense Ratios | | | Expenses Paid During Period* | |
Causeway International Small Cap Fund | | | | | | | | | | | | | |
| | | | |
Actual Portfolio Return | | | | | | | | | | | | | | | | |
Institutional Class | | $ | 1,000.00 | | | $ | 939.60 | | | | 1.30 | % | | $ | 6.32 | |
| | | | |
Hypothetical 5% Return | | | | | | | | | | | | | | | | |
| Institutional Class | | $ | 1,000.00 | | | $ | 1,018.55 | | | | 1.30 | % | | $ | 6.58 | |
Causeway International Small Cap Fund | | | | | | | | | | | | | |
| | | | |
Actual Portfolio Return | | | | | | | | | | | | | | | | |
Investor Class | | $ | 1,000.00 | | | $ | 938.70 | | | | 1.55 | % | | $ | 7.53 | |
| | | | |
Hypothetical 5% Return | | | | | | | | | | | | | | | | |
| Investor Class | | $ | 1,000.00 | | | $ | 1,017.30 | | | | 1.55 | % | | $ | 7.84 | |
| * | Expenses are equal to the Fund’s annualized expense ratio multiplied by the average account value over the period, multiplied by 183/365 (to reflect the period since inception to period end.) |
| | | | |
| 30 | | Causeway International Small Cap Fund | | |
INVESTMENT ADVISER:
Causeway Capital Management LLC
11111 Santa Monica Boulevard
15th Floor
Los Angeles, CA 90025
DISTRIBUTOR:
SEI Investments Distribution Co.
One Freedom Valley Drive
Oaks, PA 19456
TO OBTAIN MORE INFORMATION:
Call 1-866-947-7000 or visit us online at www.causewayfunds.com
This material must be preceded or accompanied by a current prospectus.
The Fund will file its complete schedule of portfolio holdings with the Securities and Exchange Commission (“Commission”) for the first and third quarters of each fiscal year on Form N-Q within sixty days after the end of the period. The Fund’s Forms N-Q are available on the Commission’s website at http://www.sec.gov, and may be reviewed and copied at the Commission’s Public Reference Room in Washington, DC. Information on the operation of the Public Reference Room may be obtained by calling 1-800-SEC-0330.
A description of the policies and procedures that the Fund uses to determine how to vote proxies relating to portfolio securities, as well as information relating to how the Trust voted proxies relating to portfolio securities during the most recent 12-month period ended June 30, is available (i) without charge, upon request, by calling 1-866-947-7000; and (ii) on the Commission’s website at http://www. sec.gov.
CCM-AR-010-0100
The registrant has adopted a code of ethics that applies to the registrant’s principal executive officer, principal financial officer and principal accounting officer. During the fiscal year ended September 30, 2015, there were no material changes or waivers to the code of ethics.
| Item 3. | Audit Committee Financial Expert. |
(a)(1) The registrant’s board of trustees has determined that the registrant has at least one audit committee financial expert serving on the audit committee.
(a)(2) The audit committee financial experts are Eric Sussman, Lawry Meister, John Graham and Victoria B. Rogers. Each audit committee financial expert is independent as defined in Form N-CSR Item 3(a)(2).
| Item 4. | Principal Accountant Fees and Services. |
Aggregate fees billed to the registrant for professional services rendered by the registrant’s principal accountant for the fiscal years ended September 30, 2015 and 2014 were as follows:
| | | | | | | | |
| | | | | 2015 | | | | 2014 |
| (a) | | Audit Fees | | $134,460 | | | | $188,960 |
| (b) | | Audit-Related Fees | | None | | | | None |
| (c) | | Tax Fees(1) | | $129,000 | | | | $41,848 |
| (d) | | All Other Fees | | None | | | | None |
Note:
| (1) | Tax fees include amounts related to tax return and excise tax calculation reviews and foreign tax reclaim services. |
(e)(1) The registrant’s audit committee has adopted a charter that requires it to pre-approve the engagement of auditors to (i) audit the registrant’s financial statements, (ii) provide other audit or non-audit services to the registrant, or (iii) provide non-audit services to the registrant’s investment adviser if the engagement relates directly to the operations and financial reporting of the registrant.
(e)(2) No services included in paragraphs (b) through (d) of this Item were approved by the audit committee pursuant to paragraph (c)(7)(i)(C) of Rule 2-01 of Regulation S-X.
(f) Not applicable.
(g) For the fiscal year ended September 30, 2015, the aggregate non-audit fees billed by the registrant’s accountant for services rendered to the registrant and the registrant’s investment adviser were $162,980. For the fiscal year ended September 30, 2014, the aggregate non-audit fees billed by the registrant’s accountant for services rendered to the registrant and the registrant’s investment adviser were $340,363.
(h) The audit committee considered whether the provision of non-audit services rendered to the registrant’s investment adviser by the registrant’s principal accountant that were not pre-approved pursuant to paragraph (c)(7)(ii) of Rule 2-01 of Regulation S-X was compatible with maintaining the principal accountant’s independence.
| Item 5. | Audit Committee of Listed Registrants. |
Not applicable to open-end management investment companies.
| Item 6. | Schedule of Investments |
See Item 1.
| Item 7. | Disclosure of Proxy Voting Policies and Procedures for Closed-End Management Investment Companies. |
Not applicable to open-end management investment companies.
| Item 8. | Portfolio Managers of Closed-End Management Investment Companies |
Not applicable to open-end management investment companies.
| Item 9. | Purchases of Equity Securities by Closed-End Management Investment Company and Affiliated Purchasers. |
Not applicable to open-end management investment companies.
| Item 10. | Submission of Matters to a Vote of Security Holders. |
There have been no material changes to the registrant’s procedures by which shareholders may recommend nominees to the registrant’s board of trustees since the registrant’s last filing on Form N-CSR.
| Item 11. | Controls and Procedures. |
(a) The certifying officers, whose certifications are included herewith, have evaluated the registrant’s disclosure controls and procedures within 90 days of the filing date of this report. In their opinion, based on their evaluation, the registrant’s disclosure controls and procedures are adequately designed, and are operating effectively to ensure, that information required to be disclosed by the registrant in the reports it files or submits under the Securities Exchange Act of 1934 is recorded, processed, summarized and reported within the time periods specified in the Securities and Exchange Commission’s rules and forms.
(b) There were no changes in the registrant’s internal control over financial reporting that occurred during the registrant’s second fiscal quarter of the period covered by this report that have materially affected, or are reasonably likely to materially affect, the registrant’s internal control over financial reporting.
(a)(1) Code of Ethics attached hereto.
(a)(2) Separate certifications for the principal executive officer and the principal financial officer of the registrant as required by Rule 30a-2(a) under the Investment Company Act of 1940 (17 CFR 270.30a-2(a)) are filed herewith.
(b) Officer certifications as required by Rule 30a-2(b) under the Investment Company Act of 1940 (17 CFR 270.30a-2(b)) also accompany this filing as an exhibit.
SIGNATURES
Pursuant to the requirements of the Securities Exchange Act of 1934 and the Investment Company Act of 1940, the registrant has duly caused this report to be signed on its behalf by the undersigned, thereunto duly authorized.
| | | | | | |
| (Registrant) | | | | | | Causeway Capital Management Trust |
| | | |
By (Signature and Title)* | | | | | | /s/ Turner Swan |
| | | | | | Turner Swan, President |
Date: December 4, 2015
Pursuant to the requirements of the Securities Exchange Act of 1934 and the Investment Company Act of 1940, this report has been signed below by the following persons on behalf of the registrant and in the capacities and on the dates indicated.
| | | | | | |
By (Signature and Title)* | | | | | | /s/ Turner Swan |
| | | | | | Turner Swan, President |
Date: December 4, 2015
| | | | | | |
By (Signature and Title)* | | | | | | /s/ Eric Kleinschmidt |
| | | | | | Eric Kleinschmidt, Treasurer |
Date: December 4, 2015
| * | Print the name and title of each signing officer under his or her signature. |