UNITED STATES
SECURITIES AND EXCHANGE COMMISSION
Washington, D.C. 20549
FORM N-CSR
CERTIFIED SHAREHOLDER REPORT OF REGISTERED
MANAGEMENT INVESTMENT COMPANIES
Investment Company Act File Number 811-10467
Causeway Capital Management Trust
(Exact name of registrant as specified in charter)
11111 Santa Monica Boulevard, 15th Floor
c/o Causeway Capital Management LLC
Los Angeles, CA 90025
(Address of principal executive offices) (Zip code)
The Corporation Trust Company
Corporation Trust Center
1209 Orange Street
Wilmington DE, 19801
(Name and address of agent for service)
Registrant’s telephone number, including area code: 1-866-947-7000
Date of fiscal year end: September 30, 2019
Date of reporting period: September 30, 2019
| Item 1. | Reports to Stockholders. |
The registrant’s schedules as of the close of the reporting period, pursuant to Rule 30e-1 under the Investment Company Act of 1940, as amended (the “Act”) (17 CFR § 270.30e-1), are attached hereto. Note that the attached contains immaterial differences from the report transmitted to stockholders relating to Trustees and Officers Information (Unaudited) regarding positions of certain trustees and length of time served. The attached report is updated to indicate that the Chairman of the Audit Committee became Chairman of the Board on 1/19 and vice versa.
TABLE OF CONTENTS
LETTER TO SHAREHOLDERS
For the fiscal year ended September 30, 2019, Causeway International Opportunities Fund’s (the “Fund’s”) Institutional Class returned-5.43% and Investor Class returned-5.59% compared to the MSCI ACWI ex USA Index (Gross) (“Index”) return of-0.72%. Since the Fund’s inception on December 31, 2009, its average annual total returns are 4.76% for the Institutional Class and 4.51% for the Investor Class compared to the Index’s average annual total return of 4.66%. At fiscalyear-end, the Fund had net assets of $192.9 million.
Performance Review
Equity markets were volatile during the fiscal year, as geopolitical tensions and concerns of slowing economic growth gave rise to looser monetary policies. The US Federal Reserve (“Fed”) cut interest rates in July and September in an effort to prolong US economic expansion. Ongoing trade tensions between the US and China and supply chain disruption likely dampened investment spending for US companies. In Europe, the manufacturing sector deteriorated towards the end of the fiscal year, as German industries contended with a slowing Chinese economy. The European Central Bank (“ECB”) showed its willingness to use multiple monetary tools to thwart a recession. Outgoing ECB President Mario Draghi again lowered interest rates further into negative territory and announced the resumption of quantitative easing. The ECB’s forward guidance policy appears dovish indefinitely. Withlow-to-no cost of financing, governments in Europe and elsewhere may decide to amplify fiscal spending. Without fiscal intervention, a vicious cycle of nil return in savings forces aging European and Japanese populations to save even more, adding to demand for fixed income, and pushing interest rates lower. Despite the Fed’s interest rate cuts as economic data weakened, the US yield curve remains inverted, which is typically a negative indicator for emerging markets assets. The best performing markets in our investable universe included Brazil, Egypt, Russia, Turkey, and the Philippines. The biggest laggards included Argentina, Pakistan, Chile, Austria, and Mexico. The best performing sectors in the Index were utilities, consumer staples, and real estate, while energy, materials, and financials were the worst performing sectors.
For the fiscal year, Fund holdings in the energy, banks, insurance, food beverage & tobacco, and consumer services industry groups detracted the most from the Fund’s performance relative to the Index. Holdings in the pharmaceuticals & biotechnology, materials, automobiles & components, and consumer durables & apparel industry groups, as well as an underweight position in the media & entertainment industry group, offset some of the underperformance. The biggest detractor from absolute return was oil & natural gas producer, Encana (Canada). Other notable detractors included jet engine manufacturer, Rolls-Royce Holdings Plc (United Kingdom), banking & financial services company, UniCredit S.p.A. (Italy), life insurer, Prudential Plc (United Kingdom), and British American Tobacco Plc (United Kingdom). The largest contributor to absolute return was industrial gas company, Linde Plc (Germany). Additional top contributors included aerospace & defense manufacturer, Cobham Plc (United Kingdom), pharmaceutical company, AstraZeneca Plc (United Kingdom), multinational food processing company, JBS SA (Brazil), and pharmaceuticals & biotechnology company, Roche Holding AG (Switzerland).
Significant Portfolio Changes
The Fund allocates assets between developed and emerging markets. For the developed markets portfolio of the Fund, our disciplined purchase and sale process led the portfolio management team to reduce exposure to several holdings
| | | | | | |
| | | |
| 2 | | Causeway International Opportunities Fund | | | | |
that approached fair value in our view. The largest sales during the fiscal year included four full sales: Japan Airlines Co., Ltd. (Japan), luxury goods manufacturer & retailer, Compagnie Financiere Richemont (Switzerland), rail operator, Canadian Pacific Railway (Canada), and pharmaceutical & consumer healthcare company, GlaxoSmithKline Plc (United Kingdom), along with a reduced exposure to global life insurer, Manulife Financial (Canada). Significant purchases included four new additions to the Fund: integrated oil & gas company, Total (France), industrial conglomerate, Siemens AG (Germany),low-budget airline, Ryanair Holdings (Ireland), and pharmaceutical & chemicals company, Bayer AG (Germany), as well as an increased exposure to robotics manufacturer, FANUC Corp. (Japan).
The active exposure of the Fund’s emerging markets (“EM”) portfolio to several sectors and countries changed during the fiscal year as a result of our quantitative security selection process. We increased active weightings (compared to MSCI Emerging Markets Index weightings) to the consumer staples and consumer discretionary sectors, and reduced active weightings to the materials and industrials sectors. Notable changes in EM portfolio’s active country weightings included increases to exposure in China, Brazil, and Russia. We reduced exposure to Saudi Arabia, Malaysia, and Thailand. Significant net purchases over the fiscal year included internet commerce company, Alibaba Group Holding (China), mobile telecommunications operator, China Mobile Ltd. (China), and liquor producer, Kweichow Moutai Co (China). The largest sales included reduced exposure to products & services provider for the electronic components industry, SK hynix, Inc. (South Korea), state-owned oil & gas company, PTT Public Co., Ltd. (Thailand), and coal miner, China Shenhua Energy Co., Ltd. (China).
Equity Allocation Model Update
A proprietary quantitative equity allocation model assists the portfolio managers in determining the weight of EM versus developed markets in the Fund. In constructing the model, we identified five primary factors as most indicative of the ideal allocation target: valuation, quality, macroeconomic, earnings growth, and risk aversion. Currently, our allocation factor categories are mixed on EM and we have an underweight position in EM relative to the Index. Our valuation factor is currently positive. Our risk aversion factor, which assesses the emerging markets bond yield spread over U.S. Treasuries, the CBOE Volatility Index (VIX), and the CBOE Emerging Markets ETF Volatility Index (VXEEM), indicates that investors’ appetite for risk is high, a negative indicator for our model. Our earnings growth factor is positive for EM, indicating that the near-term earnings revisions profile of EM is superior to that of developed markets. Our quality metrics, which include such measures as profit margins and return on equity, are negative for EM. Our macroeconomic factor, which measures the slope of the global yield curve, is negative on EM.
Investment Outlook
We believe that fundamentals do prevail over the long-term…it is just very difficult to know when the market will turn. September witnessed a chain reaction of cheap stocks, often in cyclical industries, attracting bargain hunting — which, in turn, attracted more buying. Stock markets have a history of discounting future events long before they occur. We suggest that most developed market cyclical stocks priced in a recession by the end of August and are now moving upward on the hint of fiscal spending and recovery. We believe the Fund is well-positioned to benefit from a return to favor of value and cyclicality. If economically sensitive stocks outperform, we intend to use that opportunity to lower developed markets’ portfolio expected volatility with bargains from less cyclical sectors. Our fundamental
| | | | | | |
| | | |
| | Causeway International Opportunities Fund | | | 3 | |
research team has intensified efforts to persuade managements to commit to specific plans to improve earnings and returns on capital. While we wait, many of these portfolio companies return capital to shareholders, often via generous dividend payouts. This dividend income is striking in alow-income world, reducing the duration of the investment. For the developed markets portfolio, we are holding company managements’ collective “feet to the fire,” measuring their progress and holding them accountable to their operational restructuring plans. This makes our efforts in value investing “all weather,” though a tailwind for value risk would be welcome.
Compared to developed markets, September’s value rally in EM was more modest. In many developed markets, inverted yield curves and negative interest rates have become the norm and any hint of normalizing monetary policy can lead to sharp value rallies. In contrast, EM central banks are pursuing relatively orthodox monetary policies and EM yield curves are still positively sloped. EM value stocks trade at significant discounts to EM growth stocks while offering attractive dividend yields. We continue to emphasize value factors in our investment process, which should benefit the portfolio if EM value stocks rebound, which we believe they ultimately will.
We thank you for your continued confidence in Causeway International Opportunities Fund.
September 30, 2019
| | | | | | |
 | |  | |  | |  |
| | | |
| Harry W. Hartford | | Sarah H. Ketterer | | James A. Doyle | | Jonathan P. Eng |
| Portfolio Manager | | Portfolio Manager | | Portfolio Manager | | Portfolio Manager |
| | | | | | |
 | |  | |  | |  |
| | | |
| Conor Muldoon | | Steven Nguyen | | Arjun Jayaraman | | MacDuff Kuhnert |
| Portfolio Manager | | Portfolio Manager | | Portfolio Manager | | Portfolio Manager |
| | | | |
 | |  | |  |
| | |
| Alessandro Valentini | | Joseph Gubler | | Ellen Lee |
| Portfolio Manager | | Portfolio Manager | | Portfolio Manager |
The above commentary expresses the portfolio managers’ views as of the date shown and should not be relied upon by the reader as research or investment advice. These views are subject to change. There is no guarantee that any forecasts made will come to pass.
| | | | | | |
| | | |
| 4 | | Causeway International Opportunities Fund | | | | |
Holdings are subject to change. Current and future holdings are subject to risk. Securities mentioned do not make up the entire portfolio and, in the aggregate, may represent a small percentage of the portfolio.
Investing involves risk including loss of principal. In addition to the normal risks associated with investing, international investments may involve risk of capital loss from unfavorable fluctuation in currency values, from differences in generally accepted accounting principles or from economic or political instability in other nations. Emerging markets involve heightened risks related to the same factors as well as increased volatility and lower trading volume. Diversification does not prevent all investment losses.
A company may reduce or eliminate its dividend, causing losses to the Fund.
| | | | | | |
| | | |
| | Causeway International Opportunities Fund | | | 5 | |
Comparison of Change in the Value of a $10,000 Investment in Causeway International Opportunities Fund, Investor Class shares versus the MSCI ACWI ex USA Index (Gross) as of September 30, 2019
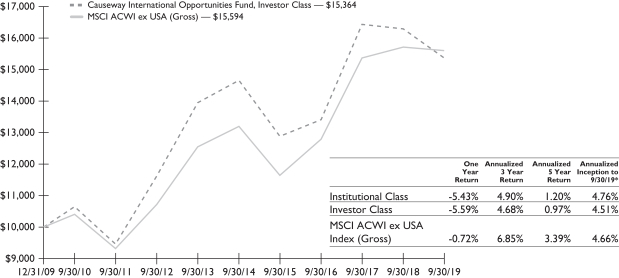
The performance in the above graph does not reflect the deduction of taxes the shareholder will pay on Fund distributions or the redemptions of Fund shares.
* Inception is December 31, 2009.
The performance data represents past performance and is not an indication of future results. Investment return and the principal value of an investment will fluctuate so that an investor’s shares, when redeemed, may be worth less than their original cost and current performance may be higher or lower than the performance quoted. For performance data current to the most recent month end, please call1-866-947-7000 or visit www.causewayfunds.com. Investment performance reflects expense reimbursements in effect during certain periods. In the absence of such expense reimbursements, total return would be reduced. The contractual expense limits are in effect until January 31, 2020. Total returns assume reinvestment of dividends and capital gains distributions at net asset value when paid. Investor Class shares pay a shareholder service fee of up to 0.25% per annum of average daily net assets. Institutional Class shares pay no shareholder service fee. Pursuant to the current January 25, 2019 prospectus, the Fund’s gross ratios of expenses in relation to average net assets were 1.05% and 1.30% for the Institutional Class and Investor Class, respectively. During the fiscal year, the Fund imposed a 2% redemption fee on the value of shares redeemed less than 60 days after purchase, however the Fund removed the redemption fee effective October 1, 2019. For more information, please see the prospectus. The MSCI ACWI ex USA Index (Gross) is a free float-adjusted market capitalization weighted index, designed to measure the equity performance of developed and emerging markets excluding the U.S. market, consisting of 46 country indices. The Index is gross of withholding taxes, assumes reinvestment of dividends and capital gains, and does not reflect the payment of transaction costs, fees and expenses associated with an investment in the Fund. It is not possible to invest directly in an index. There are special risks in foreign investing (please see Note 5 in the Notes to Financial Statements).
MSCI has not approved, reviewed or produced this report, makes no express or implied warranties or representations, and is not liable whatsoever for any data in this report. You may not redistribute the MSCI data or use it as a basis for other indices or investment products.
| | | | | | |
| | | |
| 6 | | Causeway International Opportunities Fund | | | | |
SCHEDULE OF INVESTMENTS (000)*
September 30, 2019
| | | | | | | | |
| Causeway International Opportunities Fund | | Number of Shares | | | Value | |
| | | | | | | | |
| | |
COMMON STOCK | | | | | | | | |
| | |
| Brazil — 1.9% | | | | | | |
| | |
Banco do Brasil SA1 | | | 59,500 | | | $ | 653 | |
| | |
Gerdau SA ADR | | | 21,234 | | | | 67 | |
| | |
IRB Brasil Resseguros SA | | | 31,200 | | | | 281 | |
| | |
JBS SA | | | 125,800 | | | | 991 | |
| | |
Lojas Renner SA | | | 20,422 | | | | 248 | |
| | |
Petrobras Distribuidora SA | | | 65,200 | | | | 431 | |
| | |
PPLA Participations Ltd.1 | | | 1,633 | | | | 1 | |
| | |
Qualicorp Consultoria e Corretora de Seguros SA | | | 37,400 | | | | 279 | |
| | |
Smiles Fidelidade SA | | | 20,100 | | | | 183 | |
| | |
Vale SA, Class B ADR | | | 45,441 | | | | 523 | |
| | | | | | | | |
| | |
| | | | | | | 3,657 | |
| | | | | | | | |
| | |
| Canada — 3.8% | | | | | | |
| | |
Canadian Imperial Bank of Commerce | | | 14,712 | | | | 1,214 | |
| | |
Encana Corp. | | | 534,538 | | | | 2,449 | |
| | |
Gildan Activewear Inc. | | | 58,994 | | | | 2,094 | |
| | |
Manulife Financial Corp. | | | 89,781 | | | | 1,646 | |
| | | | | | | | |
| | |
| | | | | | | 7,403 | |
| | | | | | | | |
| | |
| China — 8.0% | | | | | | |
| | |
Agile Property Holdings Ltd. | | | 106,000 | | | | 129 | |
| | |
Alibaba Group Holding Ltd. ADR1 | | | 10,667 | | | | 1,784 | |
| | |
Anhui Conch Cement Co. Ltd., Class H | | | 121,677 | | | | 723 | |
| | |
Bank of China Ltd., Class H | | | 2,226,000 | | | | 875 | |
| | |
China Communications Construction Co. Ltd., Class H | | | 299,000 | | | | 234 | |
| | |
China Construction Bank Corp., Class H | | | 1,768,741 | | | | 1,349 | |
| | |
China Everbright International Ltd. | | | 104,000 | | | | 80 | |
| | |
China Lumena New Materials Corp.1,2,3 | | | 196,000 | | | | — | |
| | |
China Mobile Ltd. | | | 97,000 | | | | 803 | |
| | |
China Mobile Ltd. ADR | | | 2,294 | | | | 95 | |
| | |
China Petroleum & Chemical Corp., Class H | | | 920,000 | | | | 547 | |
| | |
China Railway Construction Corp. Ltd., Class H | | | 237,000 | | | | 259 | |
The accompanying notes are an integral part of the financial statements.
| | | | | | |
| | | |
| | Causeway International Opportunities Fund | | | 7 | |
SCHEDULE OF INVESTMENTS (000)*(continued)
September 30, 2019
| | | | | | | | |
| Causeway International Opportunities Fund | | Number of Shares | | | Value | |
| | |
| China — (continued) | | | | | | |
| | |
China Railway Group Ltd., Class H | | | 319,000 | | | $ | 194 | |
| | |
China Telecom Corp. Ltd., Class H | | | 398,000 | | | | 181 | |
| | |
Daqo New Energy Corp. ADR1 | | | 3,484 | | | | 161 | |
| | |
Dongfeng Motor Group Co. Ltd., Class H | | | 186,000 | | | | 177 | |
| | |
Fosun International Ltd. | | | 183,500 | | | | 227 | |
| | |
Guangzhou Automobile Group Co. Ltd., Class H | | | 38,000 | | | | 36 | |
| | |
Guangzhou R&F Properties Co. Ltd., Class H | | | 256,000 | | | | 387 | |
| | |
JinkoSolar Holding Co. Ltd. ADR1 | | | 8,859 | | | | 141 | |
| | |
Kweichow Moutai Co. Ltd., Class A | | | 5,198 | | | | 837 | |
| | |
KWG Property Holding Ltd. | | | 232,404 | | | | 204 | |
| | |
Lenovo Group Ltd. | | | 574,000 | | | | 383 | |
| | |
Maanshan Iron & Steel Co. Ltd., Class H | | | 220,000 | | | | 83 | |
| | |
Nine Dragons Paper Holdings Ltd. | | | 90,000 | | | | 76 | |
| | | | | | | | |
| | |
Ping An Insurance Group Co. of China Ltd., Class H | | | 64,315 | | | | 739 | |
| | |
Qudian Inc. ADR1 | | | 24,600 | | | | 169 | |
| | |
Shanghai Pharmaceuticals Holding Co. Ltd., Class H | | | 103,439 | | | | 188 | |
| | |
Shenzhen Overseas Chinese Town Co. Ltd., Class A | | | 388,500 | | | | 383 | |
| | |
Shimao Property Holdings Ltd. | | | 155,000 | | | | 453 | |
| | |
Sinopharm Group Co. Ltd., Class H | | | 84,400 | | | | 264 | |
| | |
Tencent Holdings Ltd. | | | 47,469 | | | | 2,000 | |
| | |
Vipshop Holdings Ltd. ADR1 | | | 33,400 | | | | 298 | |
| | |
Xinyi Glass Holdings Ltd. | | | 108,000 | | | | 119 | |
| | |
Yum China Holdings Inc. | | | 8,100 | | | | 368 | |
| | |
YY Inc. ADR1 | | | 3,677 | | | | 206 | |
| | |
Zhejiang Expressway Co. Ltd., Class H | | | 272,000 | | | | 235 | |
| | | | | | | | |
| | |
| | | | | | | 15,387 | |
| | | | | | | | |
| | |
| Czech Republic — 0.1% | | | | | | |
| | |
CEZ AS | | | 6,542 | | | | 144 | |
| | | | | | | | |
| | |
| France — 5.6% | | | | | | |
| | |
AirFrance-KLM1 | | | 22,287 | | | | 233 | |
| | |
BNP Paribas SA | | | 76,319 | | | | 3,716 | |
| | |
Carrefour SA | | | 90,644 | | | | 1,587 | |
The accompanying notes are an integral part of the financial statements.
| | | | | | |
| | | |
| 8 | | Causeway International Opportunities Fund | | | | |
SCHEDULE OF INVESTMENTS (000)*(continued)
September 30, 2019
| | | | | | | | |
| Causeway International Opportunities Fund | | Number of Shares | | | Value | |
| | |
| France — (continued) | | | | | | |
| | |
Danone SA | | | 8,124 | | | $ | 716 | |
| | |
Ingenico Group SA | | | 6,850 | | | | 668 | |
| | |
Total SA | | | 74,226 | | | | 3,874 | |
| | | | | | | | |
| | |
| | | | | | | 10,794 | |
| | | | | | | | |
| | |
| Germany — 11.1% | | | | | | |
| | |
BASF SE | | | 85,455 | | | | 5,972 | |
| | |
Bayer AG | | | 28,022 | | | | 1,976 | |
| | |
Deutsche Post AG | | | 93,337 | | | | 3,118 | |
| | |
Infineon Technologies AG | | | 12,492 | | | | 225 | |
| | |
Linde PLC | | | 23,352 | | | | 4,531 | |
| | |
SAP SE | | | 26,033 | | | | 3,061 | |
| | |
Siemens AG | | | 24,265 | | | | 2,598 | |
| | | | | | | | |
| | |
| | | | | | | 21,481 | |
| | | | | | | | |
| | |
| India — 2.4% | | | | | | |
| | |
Aurobindo Pharma Ltd. | | | 22,999 | | | | 191 | |
| | |
Biocon Ltd. | | | 27,005 | | | | 85 | |
| | |
Dishman Carbogen Amcis Ltd. | | | 24,536 | | | | 58 | |
| | |
Dr Reddy’s Laboratories Ltd. ADR | | | 5,033 | | | | 191 | |
| | |
HCL Technologies Ltd. | | | 29,374 | | | | 448 | |
| | |
HEG Ltd. | | | 4,179 | | | | 56 | |
| | |
Hindalco Industries Ltd. | | | 178,574 | | | | 482 | |
| | |
Hindustan Petroleum Corp. Ltd. | | | 53,289 | | | | 227 | |
| | |
Hindustan Unilever Ltd. | | | 9,778 | | | | 273 | |
| | | | | | | | |
| | |
ICICI Bank Ltd. ADR | | | 15,971 | | | | 195 | |
| | |
Indian Oil Corp. Ltd. | | | 117,275 | | | | 244 | |
| | |
Jubilant Foodworks Ltd. | | | 3,323 | | | | 64 | |
| | |
Larsen & Toubro Ltd. | | | 9,716 | | | | 202 | |
| | |
Oil & Natural Gas Corp. Ltd. | | | 164,837 | | | | 306 | |
| | |
REC Ltd. | | | 128,135 | | | | 223 | |
| | |
Tata Consultancy Services Ltd. | | | 12,289 | | | | 364 | |
| | |
Tata Steel Ltd. | | | 75,666 | | | | 385 | |
The accompanying notes are an integral part of the financial statements.
| | | | | | |
| | | |
| | Causeway International Opportunities Fund | | | 9 | |
SCHEDULE OF INVESTMENTS (000)*(continued)
September 30, 2019
| | | | | | | | |
| Causeway International Opportunities Fund | | Number of Shares | | | Value | |
| | |
| India — (continued) | | | | | | |
| | |
Titan Co. Ltd. | | | 13,828 | | | $ | 248 | |
| | |
UPL Ltd. | | | 21,961 | | | | 187 | |
| | |
Vedanta Ltd. | | | 61,178 | | | | 133 | |
| | | | | | | | |
| | |
| | | | | | | 4,562 | |
| | | | | | | | |
| | |
| Indonesia — 0.1% | | | | | | |
| | |
Indofood Sukses Makmur Tbk PT | | | 219,800 | | | | 119 | |
| | | | | | | | |
| | |
| Ireland — 1.1% | | | | | | |
| | |
Ryanair Holdings PLC ADR1 | | | 32,846 | | | | 2,180 | |
| | | | | | | | |
| | |
| Italy — 3.0% | | | | | | |
| | |
UniCredit SpA | | | 492,104 | | | | 5,804 | |
| | | | | | | | |
| | |
| Japan — 11.8% | | | | | | |
| | |
Coca-Cola Bottlers Japan Holdings Inc. | | | 17,900 | | | | 401 | |
| | |
East Japan Railway Co. | | | 40,200 | | | | 3,833 | |
| | |
Fanuc Corp. | | | 20,700 | | | | 3,894 | |
| | |
KDDI Corp. | | | 151,100 | | | | 3,948 | |
| | |
Sompo Holdings Inc. | | | 64,900 | | | | 2,711 | |
| | |
Sumitomo Mitsui Financial Group Inc. | | | 58,400 | | | | 1,996 | |
| | |
Takeda Pharmaceutical Co. Ltd. | | | 173,700 | | | | 5,928 | |
| | | | | | | | |
| | |
| | | | | | | 22,711 | |
| | | | | | | | |
| | |
| Malaysia — 0.2% | | | | | | |
| | |
AirAsia Group Bhd | | | 341,100 | | | | 144 | |
| | |
Malayan Banking Bhd | | | 54,614 | | | | 111 | |
| | |
Tenaga Nasional Bhd | | | 32,000 | | | | 104 | |
| | | | | | | | |
| | |
| | | | | | | 359 | |
| | | | | | | | |
| | |
| Mexico — 0.2% | | | | | | |
| | |
Alfa SAB de CV, Class A | | | 161,248 | | | | 142 | |
| | |
Gruma SAB de CV, Class B | | | 6,033 | | | | 62 | |
| | |
Grupo Financiero Banorte SAB de CV, Class O | | | 34,469 | | | | 186 | |
| | | | | | | | |
| | |
| | | | | | | 390 | |
| | | | | | | | |
The accompanying notes are an integral part of the financial statements.
| | | | | | |
| | | |
| 10 | | Causeway International Opportunities Fund | | | | |
SCHEDULE OF INVESTMENTS (000)*(continued)
September 30, 2019
| | | | | | | | |
| Causeway International Opportunities Fund | | Number of Shares | | | Value | |
| | |
| Netherlands — 2.6% | | | | | | |
| | |
Akzo Nobel NV | | | 32,252 | | | $ | 2,875 | |
| | |
ING Groep NV | | | 210,775 | | | | 2,207 | |
| | | | | | | | |
| | |
| | | | | | | 5,082 | |
| | | | | | | | |
| | |
| Peru — 0.2% | | | | | | |
| | |
Credicorp Ltd. | | | 1,595 | | | | 332 | |
| | | | | | | | |
| | |
| Poland — 0.1% | | | | | | |
| | |
PGE Polska Grupa Energetyczna SA1 | | | 53,365 | | | | 106 | |
| | |
Polski Koncern Naftowy Orlen SA | | | 3,321 | | | | 82 | |
| | |
Powszechny Zaklad Ubezpieczen SA | | | 6,172 | | | | 58 | |
| | | | | | | | |
| | |
| | | | | | | 246 | |
| | | | | | | | |
| | |
| Qatar — 0.0% | | | | | | |
| | |
Qatar National Bank QPSC | | | 18,579 | | | | 98 | |
| | | | | | | | |
| | |
| Russia — 1.6% | | | | | | |
| | |
Gazprom PJSC ADR | | | 127,889 | | | | 883 | |
| | |
Lukoil PJSC ADR | | | 12,657 | | | | 1,047 | |
| | |
MMC Norilsk Nickel PJSC ADR | | | 7,419 | | | | 190 | |
| | |
Mobile TeleSystems PJSC ADR | | | 35,695 | | | | 289 | |
| | |
Sberbank of Russia PJSC ADR | | | 43,864 | | | | 622 | |
| | | | | | | | |
| | |
| | | | | | | 3,031 | |
| | | | | | | | |
| | |
| South Africa — 0.3% | | | | | | |
| | |
Absa Group Ltd. | | | 24,111 | | | | 243 | |
| | |
African Rainbow Minerals Ltd. | | | 7,495 | | | | 70 | |
| | |
Barloworld Ltd. | | | 19,980 | | | | 153 | |
| | |
Exxaro Resources Ltd. | | | 12,456 | | | | 107 | |
| | |
Mediclinic International PLC | | | 7,460 | | | | 30 | |
| | |
Redefine Properties Ltd.4 | | | 143,020 | | | | 74 | |
| | | | | | | | |
| | |
| | | | | | | 677 | |
| | | | | | | | |
| | |
| South Korea — 3.4% | | | | | | |
| | |
Daelim Industrial Co. Ltd. | | | 1,406 | | | | 122 | |
The accompanying notes are an integral part of the financial statements.
| | | | | | |
| | | |
| | Causeway International Opportunities Fund | | | 11 | |
SCHEDULE OF INVESTMENTS (000)*(continued)
September 30, 2019
| | | | | | | | |
| Causeway International Opportunities Fund | | Number of Shares | | | Value | |
| | |
| South Korea — (continued) | | | | | | |
| | |
Fila Korea Ltd. | | | 5,962 | | | $ | 289 | |
| | |
Hana Financial Group Inc. | | | 17,750 | | | | 523 | |
| | |
Hanwha Corp. | | | 5,038 | | | | 106 | |
| | |
Hyosung Corp. | | | 3,159 | | | | 221 | |
| | |
Hyundai Marine & Fire Insurance Co. Ltd. | | | 3,881 | | | | 86 | |
| | |
KB Financial Group Inc. | | | 16,171 | | | | 577 | |
| | |
Kia Motors Corp. | | | 13,585 | | | | 518 | |
| | |
LG Corp. | | | 4,084 | | | | 239 | |
| | |
LG Electronics Inc. | | | 4,601 | | | | 259 | |
| | |
Meritz Fire & Marine Insurance Co. Ltd. | | | 2,365 | | | | 38 | |
| | |
POSCO | | | 3,664 | | | | 695 | |
| | |
Samsung Electronics Co. Ltd. | | | 52,184 | | | | 2,140 | |
| | |
SK Telecom Co. Ltd. | | | 2,097 | | | | 423 | |
| | |
Woori Financial Group Inc. | | | 25,124 | | | | 262 | |
| | | | | | | | |
| | |
| | | | | | | 6,498 | |
| | | | | | | | |
| | |
| Spain — 0.9% | | | | | | |
| | |
CaixaBank SA | | | 648,184 | | | | 1,703 | |
| | | | | | | | |
| | |
| Switzerland — 5.8% | | | | | | |
| | |
ABB Ltd. | | | 272,668 | | | | 5,358 | |
| | |
Aryzta AG1 | | | 408,364 | | | | 311 | |
| | |
Novartis AG | | | 35,336 | | | | 3,064 | |
| | |
Roche Holding AG | | | 8,472 | | | | 2,465 | |
| | | | | | | | |
| | |
| | | | | | | 11,198 | |
| | | | | | | | |
| | |
| Taiwan — 3.5% | | | | | | |
| | |
Accton Technology Corp. | | | 81,000 | | | | 427 | |
| | |
Arcadyan Technology Corp. | | | 62,000 | | | | 183 | |
| | |
Compal Electronics Inc. | | | 204,000 | | | | 118 | |
| | |
Compeq Manufacturing Co. Ltd. | | | 162,000 | | | | 182 | |
| | |
Coretronic Corp. | | | 47,800 | | | | 57 | |
| | |
Delta Electronics Inc. | | | 92,000 | | | | 393 | |
| | |
FLEXium Interconnect Inc. | | | 45,732 | | | | 139 | |
The accompanying notes are an integral part of the financial statements.
| | | | | | |
| | | |
| 12 | | Causeway International Opportunities Fund | | | | |
SCHEDULE OF INVESTMENTS (000)*(continued)
September 30, 2019
| | | | | | | | |
| Causeway International Opportunities Fund | | Number of Shares | | | Value | |
| | |
| Taiwan — (continued) | | | | | | |
| | |
Formosa Chemicals & Fibre Corp. | | | 21,000 | | | $ | 59 | |
| | |
Fubon Financial Holding Co. Ltd. | | | 109,393 | | | | 157 | |
| | |
HON HAI Precision Industry Co. Ltd. | | | 270,292 | | | | 638 | |
| | |
Inventec Corp. | | | 282,000 | | | | 194 | |
| | |
Lite-On Technology Corp. | | | 133,896 | | | | 213 | |
| | |
MediaTek Inc. | | | 42,000 | | | | 500 | |
| | |
Pegatron Corp. | | | 67,938 | | | | 118 | |
| | |
Powertech Technology Inc. | | | 152,000 | | | | 427 | |
| | |
Radiant Opto-Electronics Corp. | | | 73,455 | | | | 280 | |
| | |
Realtek Semiconductor Corp. | | | 32,000 | | | | 237 | |
| | |
Sino-American Silicon Products Inc. | | | 115,000 | | | | 304 | |
| | |
Taiwan Semiconductor Manufacturing Co. Ltd. ADR | | | 30,177 | | | | 1,403 | |
| | |
TCI Co. Ltd. | | | 18,383 | | | | 185 | |
| | |
WPG Holdings Ltd. | | | 111,080 | | | | 137 | |
| | |
Yuanta Financial Holding Co. Ltd. | | | 398,000 | | | | 237 | |
| | |
Zhen Ding Technology Holding Ltd. | | | 74,000 | | | | 265 | |
| | | | | | | | |
| | |
| | | | | | | 6,853 | |
| | | | | | | | |
| | |
| Thailand — 0.7% | | | | | | |
| | |
Charoen Pokphand Foods PCL | | | 448,900 | | | | 385 | |
| | |
Kiatnakin Bank PCL | | | 89,500 | | | | 193 | |
| | |
Krung Thai Bank PCL | | | 198,500 | | | | 112 | |
| | |
Sansiri PCL | | | 2,257,200 | | | | 89 | |
| | |
Thanachart Capital | | | 203,500 | | | | 379 | |
| | |
Tisco Financial Group PCL | | | 80,100 | | | | 268 | |
| | | | | | | | |
| | |
| | | | | | | 1,426 | |
| | | | | | | | |
| | |
| Turkey — 0.3% | | | | | | |
| | |
Haci Omer Sabanci Holding AS | | | 73,252 | | | | 124 | |
| | |
Tekfen Holding AS | | | 92,055 | | | | 312 | |
| | |
Turkcell Iletisim Hizmetleri AS | | | 67,306 | | | | 155 | |
| | | | | | | | |
| | |
| | | | | | | 591 | |
| | | | | | | | |
The accompanying notes are an integral part of the financial statements.
| | | | | | |
| | | |
| | Causeway International Opportunities Fund | | | 13 | |
SCHEDULE OF INVESTMENTS (000)*(continued)
September 30, 2019
| | | | | | | | |
| Causeway International Opportunities Fund | | Number of Shares | | | Value | |
| | |
| United Arab Emirates — 0.2% | | | | | | |
| | |
DAMAC Properties Dubai Co. PJSC1 | | | 162,440 | | | $ | 38 | |
| | |
DP World PLC | | | 10,264 | | | | 144 | |
| | |
Dubai Islamic Bank PJSC | | | 98,666 | | | | 141 | |
| | | | | | | | |
| | |
| | | | | | | 323 | |
| | | | | | | | |
| | |
| United Kingdom — 24.2% | | | | | | |
| | |
AstraZeneca PLC | | | 38,140 | | | | 3,405 | |
| | |
Aviva PLC | | | 483,271 | | | | 2,373 | |
| | |
Balfour Beatty PLC | | | 394,110 | | | | 1,076 | |
| | |
Barclays PLC | | | 2,381,983 | | | | 4,405 | |
| | |
BP PLC | | | 613,745 | | | | 3,893 | |
| | |
British American Tobacco PLC | | | 124,757 | | | | 4,613 | |
| | |
Carnival PLC | | | 11,043 | | | | 458 | |
| | |
Cobham PLC1 | | | 710,055 | | | | 1,370 | |
| | |
Johnson Matthey PLC | | | 43,611 | | | | 1,639 | |
| | |
Lloyds Banking Group PLC | | | 3,238,385 | | | | 2,155 | |
| | |
Micro Focus International PLC | | | 106,626 | | | | 1,490 | |
| | |
Prudential PLC | | | 262,883 | | | | 4,767 | |
| | |
RELX PLC | | | 34,742 | | | | 825 | |
| | |
Rolls-Royce Group PLC1 | | | 426,707 | | | | 4,157 | |
| | |
Royal Dutch Shell PLC, Class B | | | 141,282 | | | | 4,162 | |
| | |
SSE PLC | | | 168,032 | | | | 2,573 | |
| | |
Vodafone Group PLC | | | 1,632,065 | | | | 3,251 | |
| | | | | | | | |
| | |
| | | | | | | 46,612 | |
| | | | | | | | |
| | |
Total Common Stock | | | | | | | | |
| | |
(Cost $196,665) — 93.1% | | | | | | | 179,661 | |
| | | | | | | | |
| | |
PREFERRED STOCK | | | | | | | | |
| | |
| Germany — 3.4% | | | | | | |
| | |
Volkswagen AG‡ | | | 38,959 | | | | 6,627 | |
| | | | | | | | |
| | |
Total Preferred Stock | | | | | | | | |
| | |
(Cost $6,138) — 3.4% | | | | | | | 6,627 | |
| | | | | | | | |
The accompanying notes are an integral part of the financial statements.
| | | | | | |
| | | |
| 14 | | Causeway International Opportunities Fund | | | | |
SCHEDULE OF INVESTMENTS (000)*(continued)
September 30, 2019
| | | | | | | | |
| Causeway International Opportunities Fund | | Number of Shares | | | Value | |
| | |
PREFERENCE STOCK | | | | | | | | |
| | |
| Brazil — 0.5% | | | | | | |
| | |
Cia Brasileira de Distribuicao1‡ | | | 18,600 | | | $ | 358 | |
| | |
Cia Paranaense de Energia‡ | | | 12,100 | | | | 145 | |
| | |
Itausa — Investimentos Itau SA‡ | | | 152,462 | | | | 486 | |
| | | | | | | | |
| | |
| | | | | | | 989 | |
| | | | | | | | |
| | |
| South Korea — 0.1% | | | | | | |
| | |
LG Chemical Ltd.‡ | | | 949 | | | | 133 | |
| | | | | | | | |
| | |
Total Preference Stock | | | | | | | | |
| | |
(Cost $1,217) — 0.6% | | | | | | | 1,122 | |
| | | | | | | | |
| | |
SHORT-TERM INVESTMENT | | | | | | | | |
| | |
Invesco Short-Term Investment Trust: Government & Agency Portfolio, Institutional Class, 1.830%** | | | 6,144,926 | | | | 6,145 | |
| | | | | | | | |
| | |
Total Short-Term Investment | | | | | | | | |
| | |
(Cost $6,145) — 3.2% | | | | | | | 6,145 | |
| | | | | | | | |
| | |
Total Investments — 100.3% | | | | | | | | |
| | |
(Cost $210,165) | | | | | | | 193,555 | |
| | | | | | | | |
| | |
Liabilities in Excess of Other Assets — (0.3)% | | | | | | | (631 | ) |
| | | | | | | | |
| | |
Net Assets — 100.0% | | | | | | $ | 192,924 | |
| | | | | | | | |
| ** | The rate reported is the7-day effective yield as of September 30, 2019. |
| ‡ | There is currently no rate available. |
| 1 | Non-income producing security. |
| 2 | Level 3 security in accordance with fair value hierarchy. Security fair valued using methods determined in good faith by the Fair Value Committee designated by the Board of Trustees. The total market value of such securities as of September 30, 2019 was $– and represented 0.0% of net assets. |
| 3 | Securities considered illiquid. The total market value of such securities as of September 30, 2019 was $– and represented 0.0% of net assets. |
| 4 | Real Estate Investment Trust. |
| ADR | American Depositary Receipt |
Amounts designated as “—” are $0 or are rounded to $0.
The accompanying notes are an integral part of the financial statements.
| | | | | | |
| | | |
| | Causeway International Opportunities Fund | | | 15 | |
SCHEDULE OF INVESTMENTS (000)*(continued)
September 30, 2019
The below table sets forth information about the Levels within the fair value hierarchy at which the Fund’s investments and other financial instruments are measured at September 30, 2019:
| | | | | | | | | | | | | | | | |
| Investments in Securities | | Level 1 | | | Level 2 | | | Level 3†† | | | Total | |
Common Stock | | | | | | | | | | | | | | | | |
Brazil | | $ | 3,657 | | | $ | — | | | $ | — | | | $ | 3,657 | |
Canada | | | 7,403 | | | | — | | | | — | | | | 7,403 | |
China | | | 15,387 | | | | — | | | | — | ^ | | | 15,387 | |
Czech Republic | | | 144 | | | | — | | | | — | | | | 144 | |
France | | | 10,794 | | | | — | | | | — | | | | 10,794 | |
Germany | | | 21,481 | | | | — | | | | — | | | | 21,481 | |
India | | | 4,562 | | | | — | | | | — | | | | 4,562 | |
Indonesia | | | 119 | | | | — | | | | — | | | | 119 | |
Ireland | | | 2,180 | | | | — | | | | — | | | | 2,180 | |
Italy | | | 5,804 | | | | — | | | | — | | | | 5,804 | |
Japan | | | 22,711 | | | | — | | | | — | | | | 22,711 | |
Malaysia | | | 359 | | | | — | | | | — | | | | 359 | |
Mexico | | | 390 | | | | — | | | | — | | | | 390 | |
Netherlands | | | 5,082 | | | | — | | | | — | | | | 5,082 | |
Peru | | | 332 | | | | — | | | | — | | | | 332 | |
Poland | | | 246 | | | | — | | | | — | | | | 246 | |
Qatar | | | 98 | | | | — | | | | — | | | | 98 | |
Russia | | | 3,031 | | | | — | | | | — | | | | 3,031 | |
South Africa | | | 677 | | | | — | | | | — | | | | 677 | |
South Korea | | | 6,498 | | | | — | | | | — | | | | 6,498 | |
Spain | | | 1,703 | | | | — | | | | — | | | | 1,703 | |
Switzerland | | | 11,198 | | | | — | | | | — | | | | 11,198 | |
Taiwan | | | 1,403 | | | | 5,450 | | | | — | | | | 6,853 | |
Thailand | | | — | | | | 1,426 | | | | — | | | | 1,426 | |
Turkey | | | 591 | | | | — | | | | — | | | | 591 | |
United Arab Emirates | | | 323 | | | | — | | | | — | | | | 323 | |
United Kingdom | | | 46,612 | | | | — | | | | — | | | | 46,612 | |
| | | | |
Total Common Stock | | | 172,785 | | | | 6,876 | | | | — | | | | 179,661 | |
| | | | |
Preferred Stock | | | 6,627 | | | | — | | | | — | | | | 6,627 | |
| | | | |
The accompanying notes are an integral part of the financial statements.
| | | | | | |
| | | |
| 16 | | Causeway International Opportunities Fund | | | | |
SCHEDULE OF INVESTMENTS (000)*(concluded)
September 30, 2019
| | | | | | | | | | | | | | | | |
| Investments in Securities | | Level 1 | | | Level 2 | | | Level 3†† | | | Total | |
Preference Stock | | | | | | | | | | | | | | | | |
Brazil | | $ | 989 | | | $ | — | | | $ | — | | | $ | 989 | |
South Korea | | | 133 | | | | — | | | | — | | | | 133 | |
| | | | |
Total Preference Stock | | | 1,122 | | | | — | | | | — | | | | 1,122 | |
| | | | |
Short-Term Investment | | | 6,145 | | | | — | | | | — | | | | 6,145 | |
| | | | |
Total Investments in Securities | | $ | 186,679 | | | $ | 6,876 | | | $ | — | | | $ | 193,555 | |
| | | | |
For the year ended September 30, 2019, there were no transfers in or out of Level 3.
| †† | As of September 30, 2019, securities with a value of $137, which represented 0.1% of the net assets of the Fund, transferred from Level 3 to Level 2, primarily due to the securities being fair valued at the prior fiscal year end, but not at the end of the current fiscal year end. A reconciliation of Level 3 investments and disclosures of significant unobservable inputs are presented when the Fund has a significant amount of Level 3 investments at the beginning and/or end of the period in relation to net assets. Management has concluded that Level 3 investments are not material in relation to net assets. |
| ^ | Security is fair valued at zero due to company’s insolvency. Level 3 security in accordance with fair value hierarchy. |
For more information on valuation inputs, see Note 2 in the Notes to Financial Statements.
Amounts designated as “—” are $0.
The accompanying notes are an integral part of the financial statements.
| | | | | | |
| | | |
| | Causeway International Opportunities Fund | | | 17 | |
SECTOR DIVERSIFICATION
As of September 30, 2019, the sector diversification was as follows (Unaudited):
| | | | | | | | | | | | | | | | |
| Causeway International Opportunities Fund | | Common
Stock | | | Preferred
Stock | | | Preference
Stock | | | % of
Net Assets | |
| | | | |
Financials | | | 22.6% | | | | 0.0% | | | | 0.2% | | | | 22.8% | |
| | | | |
Industrials | | | 16.5 | | | | 0.0 | | | | 0.0 | | | | 16.5 | |
| | | | |
Energy | | | 12.4 | | | | 0.0 | | | | 0.0 | | | | 12.4 | |
| | | | |
Health Care | | | 9.3 | | | | 0.0 | | | | 0.0 | | | | 9.3 | |
| | | | |
Information Technology | | | 7.9 | | | | 0.0 | | | | 0.0 | | | | 7.9 | |
| | | | |
Consumer Discretionary | | | 4.1 | | | | 3.4 | | | | 0.0 | | | | 7.5 | |
| | | | |
Materials | | | 6.7 | | | | 0.0 | | | | 0.1 | | | | 6.8 | |
| | | | |
Communication Services | | | 6.0 | | | | 0.0 | | | | 0.0 | | | | 6.0 | |
| | | | |
Consumer Staples | | | 5.4 | | | | 0.0 | | | | 0.2 | | | | 5.6 | |
| | | | |
Utilities | | | 1.6 | | | | 0.0 | | | | 0.1 | | | | 1.7 | |
| | | | |
Real Estate | | | 0.6 | | | | 0.0 | | | | 0.0 | | | | 0.6 | |
| | | | | | | | | | | | | | | | |
| Total | | | 93.1 | | | | 3.4 | | | | 0.6 | | | | 97.1 | |
| | | | |
| Short-Term Investment | | | | | | | | | | | | | | | 3.2 | |
| | | | | | | | | | | | | | | | |
| Liabilities in Excess of Other Assets | | | | | | | | | | | | | | | (0.3) | |
| | | | | | | | | | | | | | | | |
| Net Assets | | | | | | | | | | | | | | | 100.0% | |
| | | | | | | | | | | | | | | | |
The accompanying notes are an integral part of the financial statements.
| | | | | | |
| | | |
| 18 | | Causeway International Opportunities Fund | | | | |
STATEMENT OF ASSETS AND LIABILITIES (000)*
| | | | |
| | | CAUSEWAY
INTERNATIONAL
OPPORTUNITIES
FUND | |
| |
| | | 9/30/19 | |
ASSETS: | | | | |
Investments at Value (Cost $210,165) | | $ | 193,555 | |
Cash | | | 7 | |
Foreign Currency (Cost $80) | | | 80 | |
Receivable for Tax Reclaims | | | 526 | |
Receivable for Dividends | | | 439 | |
Receivable for Investment Securities Sold | | | 64 | |
Receivable for Fund Shares Sold | | | 27 | |
Prepaid Expenses | | | 9 | |
| | | | |
Total Assets | | | 194,707 | |
| | | | |
LIABILITIES: | | | | |
Payable for Investment Securities Purchased | | | 1,491 | |
Accrued Foreign Capital Gains Tax on Appreciated Securities | | | 28 | |
Unrealized Depreciation on Spot Foreign Currency Contracts | | | 1 | |
Payable Due to Adviser | | | 152 | |
Payable Due to Administrator | | | 5 | |
Payable for Trustees’ Fees | | | 3 | |
Payable for Shareholder Service Fees — Investor Class | | | 2 | |
Other Accrued Expenses | | | 101 | |
| | | | |
Total Liabilities | | | 1,783 | |
| | | | |
Net Assets | | $ | 192,924 | |
| | | | |
NET ASSETS: | | | | |
Paid-in Capital (unlimited authorization — no par value) | | $ | 206,957 | |
Total Distributable Loss | | | (14,033 | ) |
| | | | |
Net Assets | | $ | 192,924 | |
| | | | |
Net Asset Value Per Share (based on net assets of
$182,719,953 ÷ 14,485,102 shares) — Institutional Class | | | $12.61 | |
| | | | |
Net Asset Value Per Share (based on net assets of
$10,203,607 ÷ 815,310 shares) — Investor Class | | | $12.52 | |
| | | | |
| * | Except for Net Asset Value Per Share data. |
The accompanying notes are an integral part of the financial statements.
| | | | | | |
| | | |
| | Causeway International Opportunities Fund | | | 19 | |
STATEMENT OF OPERATIONS (000)
| | | | |
| | | CAUSEWAY
INTERNATIONAL
OPPORTUNITIES
FUND | |
| |
| | | 10/01/18 to
9/30/19 | |
INVESTMENT INCOME: | | | | |
Dividend Income (net of foreign taxes withheld of $572) | | $ | 7,539 | |
| | | | |
Total Investment Income | | | 7,539 | |
| | | | |
EXPENSES: | | | | |
Investment Advisory Fees | | | 1,402 | |
Custodian Fees | | | 189 | |
Professional Fees | | | 74 | |
Transfer Agent Fees | | | 61 | |
Administration Fees | | | 50 | |
Registration Fees | | | 30 | |
Shareholder Service Fees — Investor Class | | | 24 | |
Printing Fees | | | 15 | |
Pricing Fees | | | 8 | |
Trustees’ Fees | | | 7 | |
Line of Credit | | | 16 | |
Other Fees | | | 12 | |
| | | | |
Total Expenses | | | 1,888 | |
| | | | |
Waiver of Investment Advisory Fees | | | (17 | ) |
| | | | |
Total Waiver | | | (17 | ) |
| | | | |
| |
Net Expenses | | | 1,871 | |
| | | | |
Net Investment Income | | | 5,668 | |
| | | | |
Net Realized and Unrealized Gain (Loss) on Investments and Foreign Currency Transactions and Translations: | | | | |
Net Realized Gain on Investments | | | 485 | |
Net Realized Loss from Foreign Currency Transactions | | | (53 | ) |
Net Change in Unrealized Depreciation on Investments | | | (17,579 | ) |
Net Change in Accrued Foreign Capital Gains Tax on Appreciated Securities | | | (16 | ) |
Net Change in Unrealized Depreciation on Foreign Currency and Translation of Other Assets and Liabilities Denominated in Foreign Currency | | | (9 | ) |
| | | | |
Net Realized and Unrealized Loss on Investments and Foreign Currency Transactions and Translations | | | (17,172 | ) |
| | | | |
| Net Decrease in Net Assets Resulting from Operations | | $ | (11,504 | ) |
| | | | |
The accompanying notes are an integral part of the financial statements.
| | | | | | |
| | | |
| 20 | | Causeway International Opportunities Fund | | | | |
STATEMENTS OF CHANGES IN NET ASSETS (000)
| | | | | | | | |
| | | CAUSEWAY
INTERNATIONAL
OPPORTUNITIES FUND | |
| | |
| | | 10/01/18 to
9/30/19 | | | 10/01/17 to
9/30/18 | |
OPERATIONS: | | | | | | | | |
Net Investment Income | | $ | 5,668 | | | $ | 3,544 | |
Net Realized Gain on Investments | | | 485 | | | | 8,961 | |
Net Realized Loss from Foreign Currency Transactions | | | (53 | ) | | | (71 | ) |
Net Change in Unrealized Depreciation on Investments | | | (17,579 | ) | | | (15,505 | ) |
Net Change in Accrued Foreign Capital Gains Tax on Appreciated Securities | | | (16 | ) | | | 15 | |
Net Change in Unrealized Depreciation on Foreign Currency and Translation of Other Assets and Liabilities Denominated in Foreign Currency | | | (9 | ) | | | (12 | ) |
| | | | | | | | |
Net Decrease in Net Assets Resulting From Operations | | | (11,504 | ) | | | (3,068 | ) |
| | | | | | | | |
DISTRIBUTIONS: (1) | | | | | | | | |
Institutional Class | | | (3,950 | ) | | | (2,079 | ) |
Investor Class | | | (193 | ) | | | (110 | ) |
| | | | | | | | |
Total Distributions to Shareholders | | | (4,143 | ) | | | (2,189 | ) |
Net Increase in Net Assets Derived from Capital Share Transactions(2) | | | 35,710 | | | | 40,056 | |
Redemption Fees(3) | | | 24 | | | | 7 | |
| | | | | | | | |
Total Increase in Net Assets | | | 20,087 | | | | 34,806 | |
| | | | | | | | |
NET ASSETS: | | | | | | | | |
Beginning of Year | | | 172,837 | | | | 138,031 | |
| | | | | | | | |
End of Year(4) | | $ | 192,924 | | | $ | 172,837 | |
| | | | | | | | |
| (1) | Current presentation of distributions conforms with RegulationS-X disclosure simplification. Prior year distributions have been consolidated to conform with RegulationS-X disclosure simplification (See Note 11in Notes to Financial Statements). |
| (2) | See Note 7 in the Notes to Financial Statements. |
| (3) | See Note 2 in the Notes to Financial Statements. |
| (4) | Includes undistributed net investment income of $3,268, as of year end September 30, 2018. The Securities and Exchange Commission eliminated the requirement to disclose undistributed net investment income on November 5, 2018. |
Amounts designated as “—” are $0 or are rounded to $0.
The accompanying notes are an integral part of the financial statements.
| | | | | | |
| | | |
| | Causeway International Opportunities Fund | | | 21 | |
FINANCIAL HIGHLIGHTS
For the Fiscal Years ended September 30,
For a Share Outstanding Throughout the Fiscal Years
| | | | | | | | | | | | | | | | | | | | | | | | | | | | | | | | |
| | | Net Asset
Value,
Beginning
of Period ($) | | | Net
Investment
Income ($)† | | |
Net Realized
and
Unrealized
Gain
(Loss) on
Investments ($) | | | Total
from
Operations ($) | | | Dividends
from Net
Investment
Income ($) | | | Distributions
from
Capital
Gains ($) | | | Total
Dividends
and
Distributions ($) | | | Redemption
Fees ($) | |
CAUSEWAY INTERNATIONAL OPPORTUNITIES FUND | | | | | | | | | | | | | | | | | |
Institutional | | | | | | | | | | | | | | | | | | | | | | | | | | | | | |
2019 | | | 13.71 | | | | 0.41 | | | | (1.19 | ) | | | (0.78 | ) | | | (0.29 | ) | | | (0.03 | ) | | | (0.32 | ) | | | — | (1) |
2018 | | | 14.00 | | | | 0.31 | | | | (0.39 | ) | | | (0.08 | ) | | | (0.21 | ) | | | — | | | | (0.21 | ) | | | — | (1) |
2017 | | | 11.85 | | | | 0.24 | | | | 2.36 | | | | 2.60 | | | | (0.45 | ) | | | — | | | | (0.45 | ) | | | — | (1) |
2016 | | | 11.55 | | | | 0.24 | | | | 0.25 | (2) | | | 0.49 | | | | (0.16 | ) | | | (0.03 | ) | | | (0.19 | ) | | | — | (1) |
2015 | | | 13.61 | | | | 0.21 | | | | (1.78 | ) | | | (1.57 | ) | | | — | | | | (0.49 | ) | | | (0.49 | ) | | | — | (1) |
Investor | | | | | | | | | | | | | | | | | | | | | | | | | | | | | |
2019 | | | 13.60 | | | | 0.38 | | | | (1.17 | ) | | | (0.79 | ) | | | (0.26 | ) | | | (0.03 | ) | | | (0.29 | ) | | | — | (1) |
2018 | | | 13.90 | | | | 0.26 | | | | (0.37 | ) | | | (0.11 | ) | | | (0.19 | ) | | | — | | | | (0.19 | ) | | | — | (1) |
2017 | | | 11.77 | | | | 0.24 | | | | 2.31 | | | | 2.55 | | | | (0.42 | ) | | | — | | | | (0.42 | ) | | | — | (1) |
2016 | | | 11.47 | | | | 0.20 | | | | 0.27 | (2) | | | 0.47 | | | | (0.14 | ) | | | (0.03 | ) | | | (0.17 | ) | | | — | (1) |
2015 | | | 13.56 | | | | 0.20 | | | | (1.80 | ) | | | (1.60 | ) | | | — | | | | (0.49 | ) | | | (0.49 | ) | | | — | |
| † | Per share amounts calculated using average shares method. |
| (1) | Amount represents less than $0.01 per share (See Note 2 in the Notes to Financial Statements). |
| (2) | The amount shown for the year ended September 30, 2016, for a share outstanding throughout the year does not accord with the aggregate net gains on investments for that year because of the timing of the sales and repurchase of Fund shares in relation to fluctuating market value of the investments of the Fund. |
| (3) | In October 2014, the Fund converted from a fund of funds to direct investing in securities and, since that time, no longer invests in and is no longer subject to the fees and expenses of other Causeway Funds. At the same time, and following shareholder approval of a new investment advisory agreement, the Fund became subject to an investment advisory fee and entered into a new Expense Limit Agreement with the Adviser that limits expenses at a higher level than previously applicable to the Fund. |
| (4) | Portfolio turnover rate includes transactions related to the Fund’s conversion from a fund of funds investing in other Causeway Funds to direct investing in securities in October 2014. |
| (5) | The expense ratio includes aone-time adjustment as a result of a management change in accrual estimate relating to shareholder service fees. Had this adjustment been excluded, the ratios would have been 1.30%, 1.30% and 1.82%, respectively. |
Amounts designated as “—” are $0 or round to $0.
The accompanying notes are an integral part of the financial statements.
| | | | | | |
| | | |
| 22 | | Causeway International Opportunities Fund | | | | |
| | | | | | | | | | | | | | | | | | | | | | | | | | |
Net Asset
Value, End
of Period ($) | | | Total
Return (%) | | | Net Assets,
End of
Period
($000) | | | Ratio of
Expenses to
Average Net
Assets (%) | | | Ratio of
Expenses
to Average
Net Assets
(Excluding
Waiver and
Reimburse-
ments) (%) | | | Ratio
of Net
Investment
Income
to Average
Net Assets (%) | | | Portfolio
Turnover
Rate (%) | |
| | | | | | | | | | | | | | | | | | | | | | | | | | |
| | | | | | | | | | | | | | | | | | | | | | | | | | |
| | 12.61 | | | | (5.43 | ) | | | 182,720 | | | | 1.05 | | | | 1.06 | | | | 3.25 | | | | 43 | |
| | 13.71 | | | | (0.61 | ) | | | 163,508 | | | | 1.05 | | | | 1.05 | | | | 2.17 | | | | 35 | |
| | 14.00 | | | | 22.82 | | | | 130,357 | | | | 1.05 | | | | 1.23 | | | | 1.88 | | | | 62 | |
| | 11.85 | | | | 4.27 | | | | 103,665 | | | | 1.05 | | | | 1.10 | | | | 2.10 | | | | 63 | |
| | 11.55 | | | | (11.83 | ) | | | 115,881 | | | | 1.02 | (3) | | | 1.17 | | | | 1.64 | | | | 37 | (4) |
| | | | | | | | | | | | | | | | | | | | | | | | | | |
| | 12.52 | | | | (5.59 | ) | | | 10,204 | | | | 1.30 | | | | 1.31 | | | | 3.02 | | | | 43 | |
| | 13.60 | | | | (0.85 | ) | | | 9,329 | | | | 1.27 | (5) | | | 1.27 | (5) | | | 1.86 | (5) | | | 35 | |
| | 13.90 | | | | 22.54 | | | | 7,674 | | | | 1.30 | | | | 1.44 | | | | 1.86 | | | | 62 | |
| | 11.77 | | | | 4.07 | | | | 2,616 | | | | 1.30 | | | | 1.35 | | | | 1.72 | | | | 63 | |
| | 11.47 | | | | (12.11 | ) | | | 2,975 | | | | 1.28 | (3) | | | 1.44 | | | | 1.56 | | | | 37 | (4) |
The accompanying notes are an integral part of the financial statements.
| | | | | | |
| | | |
| | Causeway International Opportunities Fund | | | 23 | |
NOTES TO FINANCIAL STATEMENTS
Causeway International Opportunities Fund (the “Fund”) is a series of Causeway Capital Management Trust (the “Trust”). The Trust is anopen-end management investment company registered under the Investment Company Act of 1940, as amended (the “1940 Act”) and is a Delaware statutory trust that was established on August 10, 2001. The Fund began operations on December 31, 2009. The Fund is authorized to offer two classes of shares, the Institutional Class and the Investor Class. The Declaration of Trust authorizes the issuance of an unlimited number of shares of beneficial interest of the Fund. The Fund is diversified. The Fund’s prospectus provides a description of the Fund’s investment objectives, policies and strategies. The Trust has five additional series, the financial statements of which are presented separately.
| 2. | | Significant Accounting Policies |
The following is a summary of the significant accounting policies consistently followed by the Fund.
Use of Estimates in the Preparation of Financial Statements– The Fund is an investment company that applies the accounting and reporting guidance issued in Topic 946 by the U.S. Financial Accounting Standards Board. The Fund’s financial statements have been prepared to comply with U.S. generally accepted accounting principles (“U.S. GAAP”). The preparation of financial statements in conformity with U.S. GAAP requires management to make estimates and assumptions that affect the reported amount of net assets and liabilities and disclosure of contingent assets and liabilities at the date of the financial statements and the reported amounts of increases and decreases in net assets from operations during the reporting period. Actual results could differ from those estimates.
Security Valuation– Except as described below, securities listed on a securities exchange (except the NASDAQ Stock Market (“NASDAQ”)) orOver-the-Counter (“OTC”) for which market quotations are available are valued at the last reported sale price as of the close of trading on each business day, or, if there is no such reported sale, at the last reported bid price for long positions. For securities traded on NASDAQ, the NASDAQ Official Closing Price is used. Securities listed on multiple exchanges or OTC markets are valued on the exchange or OTC market considered by the Fund to be the primary market. The prices for foreign securities are reported in local currency and converted to U.S. dollars using currency exchange rates. Prices for most securities held in the Fund are provided daily by recognized independent pricing agents. If a security price cannot be obtained from an independent pricing agent, the Fund seeks to obtain a bid price from at least one independent broker. Investments in money market funds are valued daily at the net asset value per share.
Securities for which market prices are not “readily available” are valued in accordance with fair value pricing procedures approved by the Fund’s Board of Trustees (the “Board”). The Fund’s fair value pricing procedures are implemented through a Fair Value Committee (the “Committee”) designated by the Board. Some of the more common reasons that may necessitate that a security be valued using fair value pricing procedures include: the security’s trading has been halted or suspended; the security has been delisted from a national exchange; the security’s primary trading market is temporarily closed at a time when under normal conditions it would be open; or the security’s primary pricing source is not able or willing to provide a price. When the Committee values a security in accordance with the fair value pricing procedures, the Committee
| | | | | | |
| | | |
| 24 | | Causeway International Opportunities Fund | | | | |
NOTES TO FINANCIAL STATEMENTS
(continued)
will determine the value after taking into consideration relevant information reasonably available to the Committee.
The Fund uses a third party vendor to fair value certainnon-U.S. securities if there is a movement in the U.S. market that exceeds thresholds established by the Committee. The vendor provides fair values for foreign securities based on factors and methodologies involving, generally, tracking valuation correlations between the U.S. market and eachnon-U.S. security and such fair values are applied by the administrator if apre-determined confidence level is reached for the security.
In accordance with the authoritative guidance on fair value measurements and disclosure under U.S. GAAP, the Fund discloses fair value of its investments in a hierarchy that prioritizes the inputs to valuation techniques used to measure the fair value. The objective of a fair value measurement is to determine the price that would be received to sell an asset or paid to transfer a liability in an orderly transaction between market participants at the measurement date (an exit price). Accordingly, the fair value hierarchy gives the highest priority to quoted prices (unadjusted) in active markets for identical assets or liabilities (Level 1) and the lowest priority to unobservable inputs (Level 3). The guidance establishes three levels of fair value hierarchy as follows:
| | • | | Level 1 — Unadjusted quoted prices in active markets for identical, unrestricted assets or liabilities that the Fund has the ability to access at the measurement date; |
| | • | | Level 2 — Quoted prices for similar assets or liabilities in active markets, quoted prices for identical or similar assets or liabilities in markets which are not active, or prices based on inputs that are observable (either directly or indirectly); and |
| | • | | Level 3 — Prices, inputs or exotic modeling techniques which are both significant to the fair value measurement and unobservable (supported by little or no market activity). |
Investments are classified within the level of the lowest significant input considered in determining fair value. Investments classified within Level 3 which fair value measurement considers several inputs may include Level 1 or Level 2 inputs as components of the overall fair value measurement.
Changes in valuation techniques may result in transfers in or out of an investment’s assigned level within the hierarchy during the reporting period. Changes in the classification between Levels 1 and 2 occur primarily when foreign equity securities are fair valued by the Fund’s third party vendor using other observable market–based inputs in place of closing exchange prices due to events occurring after foreign market closures or when foreign markets are closed, and/or when adjustments are made to security values for “foreign line” securities using “local line” prices. Due to currency and ownership restrictions on foreign persons in certain countries, including without limitation Russia and Thailand, securities sometimes trade via a “foreign line” (designated for foreign ownership) and via a “local line” (shares traded locally and held by residents). Liquidity of shares held in the foreign line is often more limited than the local line. As the last traded price of a foreign line may not represent fair value, if the securities can readily be traded through a broker to access the local line, the securities may be priced using the last traded local line price.
For the fiscal year ended September 30, 2019, there were no changes to the Fund’s fair value methodologies.
Federal Income Taxes– The Fund intends to continue to qualify as a regulated investment company under
| | | | | | |
| | | |
| | Causeway International Opportunities Fund | | | 25 | |
NOTES TO FINANCIAL STATEMENTS
(continued)
Subchapter M of the Internal Revenue Code and to distribute substantially all of its taxable income. Accordingly, no provision for Federal income taxes has been made in the financial statements.
The Fund evaluates tax positions taken or expected to be taken in the course of preparing the Fund’s tax returns to determine whether it is“more-likely-than-not” (i.e., greater than50-percent) that each tax position will be sustained upon examination by a taxing authority based on the technical merits of the position. Tax positions not deemed to meet the“more-likely-than-not” threshold are recorded as a tax benefit or expense in the current year. The Fund did not record any tax provision in the current period. However, management’s conclusions regarding tax positions taken may be subject to review and adjustment at a later date based on factors including, but not limited to, examination by tax authorities (i.e., the last 3 tax years, as applicable), andon-going analysis of and changes to tax laws, regulations and interpretations thereof.
As of and during the fiscal year ended September 30, 2019, the Fund did not have a liability for any unrecognized tax benefits. The Fund recognizes interest and penalties, if any, related to unrecognized tax benefits as income tax expense in the Statement of Operations. During the fiscal year, the Fund did not incur any significant interest or penalties.
Security Transactions and Related Income – Security transactions are accounted for on the date the security is purchased or sold (trade date). Dividend income is recognized on theex-dividend date, and interest income is recognized using the accrual basis of accounting. Costs used in determining realized gains and losses on the sales of investment securities are those of the specific securities sold.
Foreign Currency Translation – The books and records of the Fund are maintained in U.S. dollars on the following basis:
(1) the market value or fair value of investment securities, assets and liabilities is converted at the current rate of exchange; and
(2) purchases and sales of investment securities, income and expenses are converted at the relevant rates of exchange prevailing on the respective dates of such transactions.
The Fund does not isolate that portion of gains and losses on investments in equity securities that is due to changes in the foreign exchange rates from that which is due to changes in market prices of equity securities.
Foreign Currency Exchange Contracts – When the Fund purchases or sells foreign securities, it enters into corresponding foreign currency exchange contracts to settle the securities transactions. Losses from these foreign exchange transactions may arise from changes in the value of the foreign currency between trade date and settlement date or if the counterparties do not perform under the contract’s terms.
Expense/Classes – Expenses that are directly related to one Fund of the Trust are charged directly to that Fund. Other operating expenses of the Trust are prorated to the Fund and the other series of the Trust on the basis of relative daily net assets. Expenses of the Shareholder Service Plan for the Investor Class are borne by that class of shares. Income, realized and unrealized gains (losses) andnon-class specific expenses are allocated to the respective classes on the basis of relative daily net assets.
Dividends and Distributions – Dividends from net investment income, if any, are declared and paid on an annual basis. Any net realized capital gains on sales of securities are distributed to shareholders at least annually.
| | | | | | |
| | | |
| 26 | | Causeway International Opportunities Fund | | | | |
NOTES TO FINANCIAL STATEMENTS
(continued)
Redemption Fee – Until October 1, 2019, the Fund imposed a redemption fee of 2% on the value of capital shares redeemed by shareholders less than 60 days after purchase. The redemption fee also applied to exchanges from the Fund. The redemption fee was paid to the Fund. The officers of the Fund were permitted to waive the redemption fee for shareholders in asset allocation and similar investment programs believed not to be engaged in short-term market timing, including for holders of shares purchased by Causeway Capital Management LLC (the “Adviser”) for its clients to rebalance their portfolios. For the fiscal year ended September 30, 2019, the Institutional Class and Investor Class retained $24,330 and $18 in redemption fees, respectively. The Fund removed the redemption fee, effective October 1, 2019.
Other– Brokerage commission recapture payments are credited to realized capital gains and are included in net realized gains from security transactions on the Statement of Operations. For the fiscal year ended September 30, 2019, the Fund received commission recapture payments of $3,521.
| 3. | | Investment Advisory, Administration, Shareholder Service and Distribution Agreements |
The Trust, on behalf of the Fund, has entered into an Investment Advisory Agreement (the “Advisory Agreement”) with the Adviser. Under the Advisory Agreement, the Adviser is entitled to a monthly fee equal to an annual rate of 0.80% of the Fund’s average daily net assets. The Adviser has contractually agreed through January 31, 2020 to waive its fee and to the extent necessary, reimburse the Fund to keep total annual fund operating expenses (excluding brokerage fees and commissions, interest, taxes, shareholder service fees, fees and expenses of other funds in which the
Fund invests, and extraordinary expenses) from exceeding 1.05% of Institutional Class and Investor Class average daily net assets. For the fiscal year ended September 30, 2019, the Adviser waived fees of $17,419. The waived fees are not subject to recapture.
The Trust and SEI Investments Global Funds Services (the “Administrator”) have entered into an Administration Agreement. Under the terms of the Administration Agreement, the Administrator is entitled to an annual fee which is calculated daily and paid monthly based on the aggregate average daily net assets of the Trust subject to a minimum annual fee.
The Trust has adopted a Shareholder Service Plan and Agreement for Investor Class shares that allows the Trust to pay broker-dealers and other financial intermediaries a fee of up to 0.25% per annum of average daily net assets for services provided to Investor Class shareholders. For the fiscal year ended September 30, 2019, the Investor Class paid 0.25% of average daily net assets under this plan.
The Trust and SEI Investments Distribution Co. (the “Distributor”) have entered into a Distribution Agreement. The Distributor receives no fees from the Fund for its distribution services under this agreement.
The officers of the Trust are also officers or employees of the Administrator or Adviser. They receive no fees for serving as officers of the Trust.
As of September 30, 2019, approximately $398 (000) of the Fund’s net assets were held by investors affiliated with the Adviser.
| 4. | | Investment Transactions |
The cost of security purchases and the proceeds from the sale of securities, other than short-term investments,
| | | | | | |
| | | |
| | Causeway International Opportunities Fund | | | 27 | |
NOTES TO FINANCIAL STATEMENTS
(continued)
during the fiscal year ended September 30, 2019, for the Fund were as follows (000):
| | | | | | |
| Purchases | | | Sales | |
| $ | 109,412 | | | $ | 72,831 | |
| 5. | | Risks of Foreign Investing |
Because the Fund invests most of its assets in foreign securities, the Fund is subject to additional risks. For example, the value of the Fund’s securities may be affected by social, political and economic developments and U.S. and foreign laws relating to foreign investments. Further, because the Fund invests in securities denominated in foreign currencies, the Fund’s securities may go down in value depending on foreign exchange rates. Other risks include trading, settlement, custodial, and other operational risks; withholding or other taxes; and the less stringent investor protection and disclosure standards of some foreign markets. All of these factors can make foreign securities less liquid, more volatile and harder to value than U.S. securities. These risks are higher for emerging markets investments.
| 6. | | Federal Tax Information |
The Fund is classified as a separate taxable entity for Federal income tax purposes. The Fund intends to continue to qualify as a separate “regulated investment company” under Subchapter M of the Internal Revenue Code and make the requisite distributions to shareholders that will be sufficient to relieve it from Federal income tax and Federal excise tax. Therefore, no Federal tax provision is required. To the extent that dividends from net investment income and distributions from net realized capital gains exceed amounts reported in the financial statements, such amounts are reported separately.
The Fund may be subject to taxes imposed by countries in which it invests in issuers existing or operating in such countries. Such taxes are generally based on income earned. The Fund accrues such taxes when the related income is earned. Dividend and interest income is recorded net ofnon-U.S. taxes paid. Gains realized by the Fund on the sale of securities in certain countries are subject tonon-U.S. taxes. The Fund records a liability based on unrealized gains to provide for potentialnon-U.S. taxes payable upon the sale of these securities. For the fiscal year ended September 30, 2019,non-U.S. taxes paid on realized gains were $0 andnon-U.S. taxes accrued on unrealized gains were $27,853.
The amounts of distributions from net investment income and net realized capital gains are determined in accordance with Federal income tax regulations, which may differ from those amounts determined under U.S. GAAP. These book/tax differences are either temporary or permanent in nature. The character of distributions made during the year from net investment income or net realized gains, and the timing of distributions made during the year may differ from those during the year that the income or realized gains (losses) were recorded by the Fund. To the extent these differences are permanent, adjustments are made to the appropriate equity accounts in the period that the differences arise.
During the year ended September 30, 2019, there were no permanent differences.
The tax character of dividends and distributions declared during the fiscal years ended September 30, 2019 and September 30, 2018 was as follows (000):
| | | | | | | | | | | | |
| | | Ordinary
Income | | | Long-Term
Capital Gain | | | Total | |
2019 | | $ | 3,722 | | | $ | 421 | | | $ | 4,143 | |
2018 | | | 2,189 | | | | — | | | | 2,189 | |
| | | | | | |
| | | |
| 28 | | Causeway International Opportunities Fund | | | | |
NOTES TO FINANCIAL STATEMENTS
(continued)
As of September 30, 2019, the components of accumulated losses on a tax basis were as follows (000):
| | | | |
Undistributed Ordinary Income | | $ | 5,236 | |
Post October Losses | | | (655 | ) |
Unrealized Depreciation | | | (18,614 | ) |
| | | | |
Total Accumulated Losses | | $ | (14,033 | ) |
| | | | |
Post-October losses represent losses realized on investment transactions from November 1, 2018 through September 30, 2019 that, in accordance with Federal income tax regulations, the Funds may elect to defer and treat as having arisen in the following fiscal year.
The Fund is permitted to carry forward capital losses for an unlimited period. Capital losses that are carried
forward will retain their character as either short-term or long-term capital losses. For the fiscal year ended September 30, 2019, the Fund utilized $1,061 (000) of capital loss carryforwards.
At September 30, 2019, the total cost of investments for Federal income tax purposes and the aggregate gross unrealized appreciation and depreciation on investments for the Fund was as follows (000):
| | | | | | | | | | | | | | |
Federal
Tax Cost | | | Appreciated
Securities | | | Depreciated
Securities | | | Net
Unrealized
Depreciation | |
| $ | 212,129 | | | $ | 8,565 | | | $ | (27,139 | ) | | $ | (18,574 | ) |
| 7. | | Capital Shares Issued and Redeemed (000) |
| | | | | | | | | | | | | | | | |
| | | Fiscal Year Ended
September 30, 2019 | | | Fiscal Year Ended
September 30, 2018 | |
| | | Shares | | | Value | | | Shares | | | Value | |
Institutional Class | | | | | | | | | | | | | | | | |
Shares Sold | | | 4,815 | | | $ | 61,220 | | | | 4,096 | | | $ | 58,687 | |
Shares Issued in Reinvestment of
Dividends and Distributions | | | 309 | | | | 3,538 | | | | 133 | | | | 1,922 | |
Shares Redeemed | | | (2,564 | ) | | | (30,652 | ) | | | (1,612 | ) | | | (22,403 | ) |
| | | | | | | | | | | | | | | | |
Increase in Shares Outstanding
Derived from Institutional Class Transactions | | | 2,560 | | | | 34,106 | | | | 2,617 | | | | 38,206 | |
| | | | | | | | | | | | | | | | |
Investor Class | | | | | | | | | | | | | | | | |
Shares Sold | | | 262 | | | | 3,219 | | | | 190 | | | | 2,649 | |
Shares Issued in Reinvestment of
Dividends and Distributions | | | 17 | | | | 193 | | | | 8 | | | | 110 | |
Shares Redeemed | | | (150 | ) | | | (1,808 | ) | | | (64 | ) | | | (909 | ) |
| | | | | | | | | | | | | | | | |
Increase in Shares Outstanding
Derived from Investor Class Transactions | | | 129 | | | | 1,604 | | | | 134 | | | | 1,850 | |
| | | | | | | | | | | | | | | | |
Net Increase in Shares Outstanding from
Capital Share Transactions | | | 2,689 | | | $ | 35,710 | | | | 2,751 | | | $ | 40,056 | |
| | | | | | | | | | | | | | | | |
| | | | | | |
| | | |
| | Causeway International Opportunities Fund | | | 29 | |
NOTES TO FINANCIAL STATEMENTS
(continued)
| 8. | | Significant Shareholder Concentration |
As of September 30, 2019, five of the Fund’s shareholders of record owned 81% of net assets in the Institutional Class. The Fund may be adversely affected when a shareholder purchases or redeems large amounts of shares, which may impact the Fund in the same manner as a high volume of redemption requests. Such large shareholders may include, but are not limited to, institutional investors and asset allocators who make investment decisions on behalf of underlying clients. Significant shareholder purchases and redemptions may adversely impact the Fund’s portfolio management and may cause the Fund to make investment decisions at inopportune times or prices or miss attractive investment opportunities. Such transactions may also increase the Fund’s transaction costs, accelerate the realization of taxable income if sales of securities result in gains, or otherwise cause the Fund to perform differently than intended.
Under the Trust’s organizational documents, each Trustee, officer, employee or other agent of the Trust is indemnified against certain liabilities that may arise out of the performance of his or her duties to the Fund. Additionally, in the normal course of business, the Fund enters into contracts, including the Fund’s servicing agreements, that contain a variety of indemnification clauses. The Fund’s maximum exposure under these arrangements is unknown as this would involve future claims that may be made against the Fund that have not yet occurred. The risk of material loss as a result of such indemnification claims is considered remote.
The Fund, along with certain other series of the Trust, is party to an agreement which enables it to participate in a $10 million secured committed revolving line of
credit with The Bank of New York Mellon which expires February 20, 2020. The proceeds from the borrowings, if any, are used to finance the Fund’s short-term general working capital requirements, including the funding of shareholder redemptions. Interest, if any, is charged to the Fund based on its borrowings during the period at the applicable rate plus 1.5%. The Fund is also charged a portion of a commitment fee of 0.175% per annum. For the year ended September 30, 2019, the Fund had average borrowings of $5 million over a period of thirteen days at a weighted average interest rate of 4.01%. Interest accrued on the borrowing during the year was $7,793. As of September 30, 2019, there were no borrowings outstanding under the line of credit.
| 11. | | New Accounting Pronouncements |
On August 17, 2018, the Securities and Exchange Commission adopted amendments to RegulationS-X. These changes are effective for periods after November 5, 2018. The amendments for registered investment companies focused on the presentation of distributable earnings, eliminating the need to present the components of distributable earnings on a book basis in the financial statements. The amendments also impacted the presentation of undistributed net investment income and distribution to shareholders on the Statement of Changes in Net Assets. The amounts presented in the current Statement of Changes in Net Assets represent the aggregate distributions of net investment income and realized capital gains, except for distributions classified as return of capital which are still presented separately. The disaggregated amounts from the prior fiscal year are broken out below if there were both distributions from net investment income and realized capital gains. Otherwise, the amount on the current Statement of Changes for the prior fiscal year end represents distributions of net investment income.
| | | | | | |
| | | |
| 30 | | Causeway International Opportunities Fund | | | | |
NOTES TO FINANCIAL STATEMENTS
(concluded)
The Fund has evaluated the need for disclosures and/or adjustments resulting from subsequent events through the date the financial statements were issued. Based on this evaluation, no disclosures or adjustments were required to the financial statements, except for the following: The Fund removed the redemption fee, effective October 1, 2019.
| | | | | | |
| | | |
| | Causeway International Opportunities Fund | | | 31 | |
REPORT OF INDEPENDENT REGISTERED PUBLIC
ACCOUNTING FIRM
Tothe Board of Trustees of Causeway Capital Management Trust and Shareholders of the
Causeway International Opportunities Fund
Opinion on the Financial Statements
We have audited the accompanying statement of assets and liabilities, including the schedule of investments, ofCauseway International Opportunities Fund (one of the funds constituting Causeway Capital Management Trust, referred to hereafter as the “Fund”)as of September 30, 2019, the related statement of operationsfor the year ended September 30, 2019, the statement of changes in net assets for each of the two years in the period ended September 30, 2019, including the related notes,and the financial highlights for each of the five years in the period ended September 30, 2019 (collectively referred to as the “financial statements”). In our opinion, the financial statements present fairly, in all material respects, the financial position of the Fund as of September 30, 2019, the results of its operations for the year then ended, the changes in its net assets for each of the two years in the period ended September 30, 2019 and the financial highlights for each of the five years in the period ended September 30, 2019 in conformity with accounting principles generally accepted in the United States of America.
Basis for Opinion
These financial statements are the responsibility of the Fund’s management. Our responsibility is to express an opinion on the Fund’s financial statements based on our audits. We are a public accounting firm registered with the Public Company Accounting Oversight Board (United States) (PCAOB) and are required to be independent with respect to the Fund in accordance with the U.S. federal securities laws and the applicable rules and regulations of the Securities and Exchange Commission and the PCAOB.
We conducted our audits of these financial statements in accordance with the standards of the PCAOB. Those standards require that we plan and perform the audit to obtain reasonable assurance about whether the financial statements are free of material misstatement, whether due to error or fraud.
Our audits included performing procedures to assess the risks of material misstatement of the financial statements, whether due to error or fraud, and performing procedures that respond to those risks. Such procedures included examining, on a test basis, evidence regarding the amounts and disclosures in the financial statements. Our audits also included evaluating the accounting principles used and significant estimates made by management, as well as evaluating the overall presentation of the financial statements. Our procedures included confirmation of securities owned as of September 30, 2019 by correspondence with the custodian, transfer agent and brokers; when replies were not received from brokers, we performed other auditing procedures. We believe that our audits provide a reasonable basis for our opinion.
/s/ PricewaterhouseCoopers LLP
Los Angeles, California
November 27, 2019
We have served as the auditor of one or more investment companies in Causeway Capital Management investment company group since 2001.
| | | | | | |
| | | |
| 32 | | Causeway International Opportunities Fund | | | | |
NOTICE TO SHAREHOLDERS (Unaudited)
The information set forth below is for the Fund’s fiscal year as required by federal laws. Shareholders, however, must report distributions on a calendar year basis for income tax purposes, which may include distributions for portions of two fiscal years of the Fund. Accordingly, the information needed by shareholders for income tax purposes will be sent to them in early 2020. Please consult your tax adviser for proper treatment of this information.
For the fiscal year ended September 30, 2019, the Fund is designating the following items with regard to distributions paid during the year:
| | | | | | | | | | | | | | | | | | |
| (A) | | | (B) | | | (C) | | | (D) | | | (E) | |
| | | | |
Long Term
Capital Gains
Distributions
(Tax Basis) | | | Ordinary
Income
Distributions
(Tax Basis) | | | Tax Exempt
Distributions
(Tax Basis) | | | Total
Distributions
(Tax Basis) | | | Dividends(1)
for Corporate
Dividends Received
Deduction
(Tax Basis) | |
| | 9.06 | % | | | 90.94 | % | | | 0.00 | % | | | 100.00 | % | | | 0.28 | % |
| | | | |
| (F) | | | (G) | | | (H) | | | | | | | |
| | | | |
Qualified
Dividend
Income | | | Interest
Related
Dividends | | | Qualified
Short-Term
Capital
Gain
Dividends | | | | | | | |
| | 100.00 | % | | | 0.00 | % | | | 0.00 | % | | | | | | | | |
Foreign taxes accrued during the fiscal year ended September 30, 2019, amounted to $506,983 and are expected to be passed through to shareholders as foreign tax credits on Form 1099 – Dividend for the year ended December 31, 2019. In addition, for the fiscal year ended September 30, 2019, gross income derived from sources within foreign countries amounted to $8,024,695 for the Fund.
| (1) | Qualified Dividends represent dividends which qualify for the corporate dividends received deduction. |
Items (A), (B), (C) and (D) are based on a percentage of the Fund’s total distribution including pass-through as foreign tax credit.
Item (E) is based on a percentage of ordinary income distributions of the Fund.
Item (F) represents the amount of “Qualified Dividend Income” as defined in the Jobs and Growth Tax Relief Reconciliation Act of 2003 and is reflected as a percentage of “Ordinary Income Distributions.” It is the Fund’s intent to designate the maximum amount permitted by the law up to 100%.
Item (G) is the amount of “Interest Related Dividends” as created by the American Jobs Creation Act of 2004 and is reflected as a percentage of net investment income distributions that is exempt from U.S. withholding tax when paid to foreign investors.
Item (H) is the amount of “Qualified Short-Term Capital Gain Dividends” as created by the American Jobs Creation Act of 2004 and is reflected as a percentage of short-term capital gain distributions that is exempt from U.S. withholding tax when paid to foreign investors.
| | | | | | |
| | | |
| | Causeway International Opportunities Fund | | | 33 | |
TRUSTEES AND OFFICERS INFORMATION (Unaudited)
Information pertaining to the Trustees and Officers of the Trust is set forth below. Trustees who are not deemed to be “interested persons” of the Trust as defined in the 1940 Act are referred to as “Independent Trustees.” The Trust’s Statement of Additional Information (“SAI”) includes additional information about the Trustees and Officers. The SAI may be obtained without charge by calling1-866-947-7000.
| | | | | | | | | | |
Name
Address, Age1 | | Position(s) Held with the Company | | Term of
Office
and Length of Time Served2 | | Principal Occupation(s) During Past Five Years | | Number of Portfolios in Trust Complex Overseen by Trustee3 | | Other Directorships Held by Trustee4 |
INDEPENDENT
TRUSTEES | | | | | | | | | | |
John R. Graham Age: 58 | | Trustee; Chairman of the Board since 1/19 | | Trustee since 10/08; Audit Chairman 4/13-12/18 | | Film Composer (since 2005); Senior Vice President, Corporate Financial Development and Communications, The Walt Disney Company (2004-2005); Senior Vice President, Mergers and Acquisitions, Lehman Brothers Inc. (2000-2004). | | 6 | | None |
| | | | | |
Lawry J. Meister Age: 57 | | Trustee | | Since 10/08 | | President, Steaven Jones Development Company, Inc. (real estate firm) (since 1995); President, Creative Office Properties (real estate firm) (since 2012). | | 6 | | None |
| | | | | |
Victoria B. Rogers Age: 58 | | Trustee | | Since 4/13 | | President, the Rose Hills Foundation (since 1996). | | 6 | | Director, TCW Funds, Inc. and TCW Strategic Income Fund |
| | | | | |
Eric H. Sussman Age: 53 | | Trustee; Chairman of the Audit Committee since 1/19 | | Trustee since 9/01; Board Chairman 4/13-12/18 | | Adjunct Professor (since July 2017), Senior Lecturer (June 2011-July 2017) and Lecturer (1995-June 2011), Anderson Graduate School of Management, University of California, Los Angeles; President, Amber Capital, Inc. (real estate investment and financial planning firm) (since 1993); Managing Partner, Clear Capital, LLC (real estate investment firm) (since 2008). | | 6 | | None |
| | | | | | |
| | | |
| 34 | | Causeway International Opportunities Fund | | | | |
TRUSTEES AND OFFICERS INFORMATION (Unaudited)
(continued)
| | | | | | | | | | |
Name Address, Age1 | | Position(s) Held with the Company | | Term of Office and Length of Time Served2 | | Principal Occupation(s) During Past Five Years | | Number of Portfolios in Trust Complex Overseen by Trustee3 | | Other Directorships Held by Trustee4 |
OFFICERS | | | | | | | | | | |
Turner Swan 11111 Santa Monica Blvd., 15th Floor Los Angeles, CA 90025 Age: 57 | | President | | Since 8/01 | | General Counsel, Secretary, and member of the Adviser or the Adviser’s parent (since 2001); Compliance Officer of the Adviser (since 2010). | | N/A | | N/A |
| | | | | |
Kurt J. Decko 11111 Santa Monica Blvd., 15th Floor Los Angeles, CA 90025 Age: 44 | | Chief Compliance Officer and Assistant Secretary | | Since 1/15 | | Chief Compliance Officer/Senior Legal Counsel of the Adviser (since January 2015); Partner, K&L Gates LLP (2010-2014). | | N/A | | N/A |
| | | | | |
Eric Kleinschmidt5 One Freedom Valley Drive Oaks, PA 19456 Age: 51 | | Treasurer | | Since 8/14 | | Director of Fund Accounting, SEI Investments Company (since 2004). | | N/A | | N/A |
| | | | | |
Gretchen W. Corbell 11111 Santa Monica Blvd., 15th Floor Los Angeles, CA 90025 Age: 48 | | Secretary | | Since 10/11 | | Attorney of the Adviser (since 2004). | | N/A | | N/A |
| | | | | |
Gracie V. Fermelia 11111 Santa Monica Blvd., 15th Floor Los Angeles, CA 90025 Age: 58 | | Vice President and Assistant Secretary | | Vice President (since 1/15); Assistant Secretary (since 8/01) | | Chief Operating Officer and member of the Adviser or the Adviser’s parent (since 2001); Chief Compliance Officer of the Adviser and the Trust(2005-2015). | | N/A | | N/A |
| | | | | |
Faith Kim 11111 Santa Monica Blvd., 15th Floor Los Angeles, CA 90025 Age: 39 | | Anti-Money Laundering Compliance Officer | | Since 8/19 | | Senior Fund Administrator of the Adviser (since 2018). Portfolio Administrator of the Adviser (2015-2018). | | N/A | | N/A |
| | | | | | |
| | | |
| | Causeway International Opportunities Fund | | | 35 | |
TRUSTEES AND OFFICERS INFORMATION (Unaudited)
(concluded)
| | | | | | | | | | |
Name Address, Age1 | | Position(s) Held with the Company | | Term of Office and Length of Time Served2 | | Principal Occupation(s) During Past Five Years | | Number of Portfolios in Trust Complex Overseen by Trustee3 | | Other Directorships Held by Trustee4 |
Dianne Descoteaux5 One Freedom Valley Drive Oaks, PA 19456 Age: 42 | | Vice President and Assistant Secretary | | Since 8/18 | | Corporate Counsel of the Administrator (since 2010). | | N/A | | N/A |
| 1 | Each Trustee may be contacted by writing to the Trustee c/o Causeway Capital Management Trust, One Freedom Valley Drive, Oaks, PA 19456. |
| 2 | Each Trustee holds office during the lifetime of the Trust or until his or her sooner resignation, retirement, removal, death or incapacity in accordance with the Trust’s Declaration of Trust. The president, treasurer, secretary and other officers each holds office at the pleasure of the Board of Trustees or until he or she sooner resigns in accordance with the Trust’s Bylaws. |
| 3 | The “Trust Complex” consists of all registered investment companies for which Causeway Capital Management LLC serves as investment adviser. As of September 30, 2019, the Trust Complex consisted of one investment company with six portfolios — International Value Fund, Emerging Markets Fund, Global Value Fund, International Opportunities Fund, Global Absolute Return Fund, and International Small Cap Fund. |
| 4 | Directorships of companies required to report to the Securities and Exchange Commission under the Securities Exchange Act of 1934 (i.e., “public companies”) or other investment companies registered under the 1940 Act. |
| 5 | These officers of the Trust also serve as officers of one or more mutual funds for which SEI Investments Company or an affiliate acts as investment manager, administrator or distributor. |
| | | | | | |
| | | |
| 36 | | Causeway International Opportunities Fund | | | | |
DISCLOSURE OF FUND EXPENSES (Unaudited)
As a shareholder of the Fund, you incur two types of costs: (1) transaction costs, including redemption fees, and (2) ongoing costs, including management fees, shareholder service fees, and other Fund expenses. It is important for you to understand the impact of these costs on your investment returns.
Ongoing operating expenses are deducted from a mutual fund’s gross income and directly reduce its final investment return. These expenses are expressed as a percentage of a mutual fund’s average net assets; this percentage is known as a mutual fund’s expense ratio.
The following examples use the expense ratio and are intended to help you understand the ongoing costs (in dollars) of investing in the Fund and to compare these costs with those of other mutual funds. The examples are based on an investment of $1,000 made at the beginning of the period shown and held for the entire period (April 1, 2019 to September 30, 2019).
The table on the next page illustrates the Fund’s costs in two ways:
Actual Fund Return.This section helps you to estimate the actual expenses after fee waivers that the Fund incurred over the period. The “Expenses Paid During Period” column shows the actual dollar expense cost incurred by a $1,000 investment in the Fund, and the “Ending Account Value” number is derived from deducting that expense cost from the Fund’s gross investment return.
You can use this information, together with the actual amount you invested in the Fund, to estimate the expenses you paid over that period. Simply divide your actual account value by $1,000 to arrive at a ratio (for example, an $8,600 account value divided by $1,000 = 8.6), then multiply that ratio by the number shown under “Expenses Paid During Period.”
Hypothetical 5% Return.This section helps you compare the Fund’s costs with those of other mutual funds. It assumes that the Fund had an annual 5% return before expenses during the year, but that the expense ratio (Column 3) for the period is unchanged. This example is useful in making comparisons because the Securities and Exchange Commission requires all mutual funds to make this 5% calculation. You can assess the Fund’s comparative cost by comparing the hypothetical result for the Fund in the “Expenses Paid During Period” column with those that appear in the same charts in the shareholder reports for other mutual funds.
NOTE:Because the return is set at 5% for comparison purposes — NOT the Fund’s actual return — the account values shown may not apply to your specific investment.
| | | | | | |
| | | |
| | Causeway International Opportunities Fund | | | 37 | |
DISCLOSURE OF FUND EXPENSES (Unaudited)
(concluded)
| | | | | | | | | | | | | | | | |
| | | Beginning
Account
Value
4/01/19 | | | Ending
Account
Value
09/30/19 | | | Annualized
Expense
Ratios | | | Expenses
Paid
During
Period* | |
Causeway International Opportunities Fund | | | | | | | | | | | | | |
| | | | |
Actual Portfolio Return | | | | | | | | | | | | | | | | |
Institutional Class | | $ | 1,000.00 | | | $ | 988.20 | | | | 1.05 | % | | $ | 5.23 | |
| | | | |
Hypothetical 5% Return | | | | | | | | | | | | | | | | |
| Institutional Class | | $ | 1,000.00 | | | $ | 1,019.80 | | | | 1.05 | % | | $ | 5.32 | |
Causeway International Opportunities Fund | | | | | | | | | | | | | |
| | | | |
Actual Portfolio Return | | | | | | | | | | | | | | | | |
Investor Class | | $ | 1,000.00 | | | $ | 988.20 | | | | 1.30 | % | | $ | 6.48 | |
| | | | |
Hypothetical 5% Return | | | | | | | | | | | | | | | | |
| Investor Class | | $ | 1,000.00 | | | $ | 1,018.55 | | | | 1.30 | % | | $ | 6.58 | |
| * | Expenses are equal to the Fund’s annualized expense ratio multiplied by the average account value over the period, multiplied by 183/365 (to reflect theone-half year period.) |
| | | | | | |
| | | |
| 38 | | Causeway International Opportunities Fund | | | | |
STATEMENT REGARDING BASIS FOR RENEWAL OF INVESTMENT ADVISORY AGREEMENT (Unaudited)
At a meeting on August 19, 2019, the Trustees considered and approved the renewal of the investment advisory agreement (the “Advisory Agreement”) between Causeway Capital Management Trust (the “Trust”) and Causeway Capital Management LLC (the “Adviser”) with respect to Causeway International Opportunities Fund (the “Fund”) for a twelve-month period beginning September 20, 2019. Section 15(c) of the Investment Company Act of 1940, as amended (the “1940 Act”) requires the Board of Trustees (the “Board”) of the Trust annually to approve continuance of the Advisory Agreement. Continuance of the Advisory Agreement must be approved by a majority of the Trustees and a majority of the independent Trustees (i.e., Trustees who are not “interested persons” of the Trust as defined in the 1940 Act). The Board was comprised of four independent Trustees when the continuation of the Advisory Agreement was considered.
Information Received. At each regular quarterly meeting, the Board reviews a wide variety of materials relating to the nature, extent and quality of the Adviser’s services, including information concerning the Fund’s performance. In addition, at a special meeting on June 24, 2019, the Trustees received and reviewed extensive quantitative and qualitative materials prepared by the Adviser relating to the Advisory Agreement in response to information requested on the independent Trustees’ behalf by their independent legal counsel. At the June special meeting, the Trustees received and reviewed a report prepared by Broadridge Financial Solutions, Inc. providing comparative expense and performance information about the Fund to assist with the annual review of the Advisory Agreement. Following that meeting, the Trustees requested additional information, and received and reviewed further materials prepared by the Adviser relating to their consideration of the renewal of the Advisory Agreement at the August 19, 2019 meeting.
Factors Considered. In reviewing the Advisory Agreement, the Trustees considered a number of factors including, but not limited to: (1) the nature, extent and quality of the services provided by the Adviser, (2) the investment performance of the Fund, (3) comparisons of the services rendered and the amounts paid under the Advisory Agreement with those of other funds and those of the Adviser under other investment advisory agreements with other types of clients, (4) the costs of the services provided and estimated profits realized by the Adviser and its affiliates from their relationship with the Fund, (5) the extent to which economies of scale would be realized as the Fund grows and whether fee levels reflect these economies of scale for the benefit of Fund investors, and (6) any other benefits derived by the Adviser from its relationship with the Fund.
First, regarding the nature, extent and quality of the services provided by the Adviser, the Trustees considered, among other things, the Adviser’s personnel, experience, track record, and compliance program. The Trustees considered the qualifications, backgrounds and responsibilities of the Adviser’s principal personnel who provide services to the Fund, as well as the level of attention those individuals provide to the Fund. The Trustees noted the Adviser’s commitment to devoting resources to staffing and technology in support of its investment management services. They also reviewed the Adviser’s investment philosophy and processes and its compliance program, its various administrative, legal and regulatory responsibilities, and considered the scope of the Adviser’s services to the Fund. The Trustees concluded that the nature, extent and quality of the services provided by the Adviser should continue to benefit the Fund and its shareholders.
| | | | | | |
| | | |
| | Causeway International Opportunities Fund | | | 39 | |
STATEMENT REGARDING BASIS FOR RENEWAL OF INVESTMENT ADVISORY AGREEMENT (Unaudited)
(continued)
Second, regarding the investment performance of the Fund, the Trustees reviewed the investment results of the Fund for various periods ended March 31, 2019, compared to the results of the MSCI ACWI ex USA Index (Gross), the median of the mutual funds included in the Morningstar U.S. Open End Foreign Large Value category, and the median of the funds in a peer group selected by Broadridge. They noted that, consistent with Broadridge’s practice, the Broadridge 15(c) Report focused on one class of shares – the Institutional Class – and that Investor Class shares are subject to a 25 basis point shareholder service fee, which increases expenses and reduces performance from that shown. They noted that the Institutional Class had underperformed its Broadridge peer group median for the priorone-year period, and had outperformed its peer group for the prior annualized three-year and five-year periods. Despite certain periods of relative underperformance, the Trustees concluded that the overall performance results and other considerations supported their view that the Adviser’s services to the Fund are of a high quality. The Trustees concluded that the Adviser’s record in managing the Fund indicated that its continued management would benefit the Fund and its shareholders.
Third, regarding the Fund’s advisory fee and total expenses as a percentage of the Fund’s average daily net assets:
| | • | | The Trustees compared the Fund’s advisory fee and expenses with those of other similar mutual funds. They noted that the Fund’s advisory fee was 80 basis points per annum compared to a median of 75 basis points for its Broadridge peer group and a range of55-110 basis points for the funds in its peer group. They noted that the Fund’s Institutional Class annual expense ratio of 105 basis points, after application of the Adviser’s expense limit agreement, was 7 basis points above the median of the funds in its Broadridge peer group and within the range of65-210 basis points for the funds in its peer group. |
| | • | | The Trustees compared the Fund’s advisory fee with the fees charged by the Adviser to other clients. The Trustees noted that, although the fees paid by the Adviser’s other accounts were lower than the fee paid by the Fund, the differences appropriately reflected the Adviser’s significantly greater responsibilities with respect to the Fund and the risks of managing a sponsored fund, and do not serve as a useful indication of whether the fees charged to the Fund are fair. The Trustees noted that the Adviser’s services to the Fund included the provision of many additional or more extensive administrative and shareholder services (such as services related to the Fund’s disclosure documents, financial statements, 1940 Act compliance policies and procedures, preparation of Board and committee materials and meetings, annual Board reports and certifications, oversight of daily valuation, oversight of Fund service providers, negotiation of Fund intermediary agreements, coordination with Fund intermediaries providing shareholder recordkeeping services, shareholder communications, and due diligence for advisers, consultants and institutional investors). |
The Trustees concluded that the Fund’s advisory fee and expense ratio were reasonable and appropriate under the circumstances.
Fourth, the Trustees considered the Adviser’s costs of providing services to the Fund and estimated profits realized by the Adviser from its relationship with the Fund. They reviewed the Adviser’s estimatedafter-tax profit margin with
| | | | | | |
| | | |
| 40 | | Causeway International Opportunities Fund | | | | |
STATEMENT REGARDING BASIS FOR RENEWAL OF INVESTMENT ADVISORY AGREEMENT (Unaudited)
(concluded)
respect to such services for the twelve months ended March 31, 2019 and the methodology used to generate that estimate, and noted that the cost allocation methodology presented to the Trustees was reasonable. They also observed that the Adviser’s estimated profitability was within the range cited as reasonable in various court decisions, even though it had increased from the prior year. They also received information about the profitability of certain publicly-traded asset management firms. After consideration of these matters, the Trustees concluded that the Adviser’s operating margin with respect to its relationship with the Fund was reasonable.
Fifth, regarding economies of scale, the Trustees observed that, although the Fund’s advisory fee schedule does not contain fee breakpoints, it is difficult to determine the existence or extent of any economies of scale. They noted that the Adviser is sharing economies of scale through reasonable advisory fee levels, expense limit agreements, and devoting additional resources to staff and technology to focus on continued performance and service to the Fund’s shareholders. They also noted that, in the Fund’s prior years, the Adviser incurred losses in managing the Fund. The Trustees concluded that under the circumstances the Adviser is sharing any economies of scale with the Fund appropriately.
Sixth, regarding any other benefits derived by the Adviser from its relationship with the Fund – often called“fall-out” benefits – the Trustees observed that the Adviser does not earn“fall-out” benefits such as affiliated custody fees, affiliated transfer agency fees, affiliated brokerage commissions, profits from rule12b-1 fees, “contingent deferred sales commissions,” or “float” benefits on short-term cash. The Trustees concluded that the primary“fall-out” benefit received by the Adviser is research services provided by brokers used by the Fund and that this benefit is reasonable in relation to the value of the services that the Adviser provides to the Fund.
Approval. At the June 24, 2019 and August 19, 2019 meetings, the Trustees discussed the information and factors noted above with representatives of the Adviser and, at the August 19, 2019 meeting, the Trustees considered the approval of the Advisory Agreement. The independent Trustees also met in a private session at all meetings with independent counsel at which no representatives of the Adviser were present. In their deliberations, the independent Trustees did not identify any particular information or factor that was determinative or controlling, each Trustee did not necessarily attribute the same weight to each factor, and the foregoing summary does not detail all the matters considered. Based on their review, the Trustees (including the independent Trustees) unanimously concluded that the Advisory Agreement is fair and reasonable to the Fund and its shareholders and that the Fund’s advisory fee is reasonable and renewal of the Advisory Agreement is in the best interests of the Fund and its shareholders, and the Board of Trustees unanimously approved renewal of the Advisory Agreement for a twelve-month period beginning September 20, 2019.
| | | | | | |
| | | |
| | Causeway International Opportunities Fund | | | 41 | |
INVESTMENT ADVISER:
Causeway Capital Management LLC
11111 Santa Monica Boulevard
15th Floor
Los Angeles, CA 90025
DISTRIBUTOR:
SEI Investments Distribution Co.
One Freedom Valley Drive
Oaks, PA 19456
To determine if the Fund is an appropriate investment for you, carefully consider the Fund’s investment objectives, risk factors, charges and expenses before investing. Please read the summary or full prospectus carefully before you invest or send money. To obtain additional information including charges, expenses, investment objectives, or risk factors, or to open an account, call 1.866.947.7000, or visit us online at www.causewayfunds.com.
The Fund files its complete schedule of portfolio holdings with the Securities and Exchange Commission (“Commission”) for the first and third quarters of each fiscal year on FormN-Q within sixty days after the end of the period. The Fund’s FormsN-Q are available on the Commission’s website at http://www.sec.gov, and may be reviewed and copied at the Commission’s Public Reference Room in Washington, DC. Information on the operation of the Public Reference Room may be obtained by calling1-800-SEC-0330.
A description of the policies and procedures that the Fund uses to determine how to vote proxies relating to portfolio securities, as well as information relating to how the Fund voted proxies relating to portfolio securities during the most recent12-month period ended June 30, is available (i) without charge, upon request, by calling1-866-947-7000; and (ii) on the Commission’s website at http://www. sec.gov.
Beginning on January 1, 2021, as permitted by regulations adopted by the Commission, we will no longer mail paper copies of the shareholder reports of the Fund, unless you specifically request paper copies of the reports from the Fund or from your financial intermediary, such as a broker-dealer or bank. Instead, the reports will be made available on the Fund’s website
(www.causewayfunds.com/fund-documents), and you will be notified by mail each time a report is posted and provided with a website link to access the report. If you already elected to receive shareholder reports electronically, you will not be affected by this change and you need not take any action. If you prefer to receive shareholder reports and other communications electronically, you may update your mailing preferences with your financial intermediary, or call1-866-947-7000 (for accounts held directly with the Fund).
You may elect to continue to receive paper copies of all future reports free of charge. If you invest through a financial intermediary, you may contact your financial intermediary to request that you continue to receive paper copies of your shareholder reports. If you invest directly with the Fund, you may inform the Fund that you wish to continue receiving paper copies of your shareholder reports by contacting us at1-866-947-7000. Your election to receive reports in paper will apply to all funds held with the Causeway Capital Management Trust or through your financial intermediary.
CCM-AR-004-1000

The registrant has adopted a code of ethics that applies to the registrant’s principal executive officer, principal financial officer and principal accounting officer. During the fiscal year ended September 30, 2019, there were no material changes or waivers to the code of ethics.
| Item 3. | Audit Committee Financial Expert. |
(a)(1) The registrant’s board of trustees has determined that the registrant has at least one audit committee financial expert serving on the audit committee.
(a)(2) The audit committee financial experts are Eric Sussman, Lawry Meister, John Graham and Victoria B. Rogers. Each audit committee financial expert is “independent” as that term is defined in Form N-CSR Item 3(a)(2).
| Item 4. | Principal Accountant Fees and Services. |
Aggregate fees billed to the registrant for professional services rendered by the registrant’s principal accountant for the fiscal years ended September 30, 2019 and 2018 were as follows:
| | | | |
| | | 2019 | | 2018 |
| (a) Audit Fees | | $261,070 | | $253,460 |
| (b) Audit-Related Fees | | None | | None |
| (c) Tax Fees(1) | | $59,340 | | $57,600 |
| (d) All Other Fees | | None | | None |
Note:
| | (1) | Tax fees include amounts related to tax return and excise tax calculation reviews and foreign tax reclaim services. |
(e)(1) The registrant’s audit committee has adopted a charter that requires it to pre-approve the engagement of auditors to (i) audit the registrant’s financial statements, (ii) provide other audit or non-audit services to the registrant, or (iii) provide non-audit services to the registrant’s investment adviser if the engagement relates directly to the operations and financial reporting of the registrant.
(e)(2) No services included in paragraphs (b) through (d) of this Item were approved by the audit committee pursuant to paragraph (c)(7)(i)(C) of Rule 2-01 of Regulation S-X.
(f) Not applicable.
(g) For the fiscal year ended September 30, 2019, the aggregate non-audit fees billed by the registrant’s accountant for services rendered to the registrant and the registrant’s investment adviser were $774,378. For the fiscal year ended September 30, 2018, the aggregate non-audit fees billed by the registrant’s accountant for services rendered to the registrant and the registrant’s investment adviser were $695,796.
(h) The audit committee considered whether the provision of non-audit services rendered to the registrant’s investment adviser by the registrant’s principal accountant that were not pre-approved pursuant to paragraph (c)(7)(ii) of Rule 2-01 of Regulation S-X was compatible with maintaining the principal accountant’s independence.
| Item 5. | Audit Committee of Listed Registrants. |
Not applicable to open-end management investment companies.
| Item 6. | Schedule of Investments |
Schedule of Investments is included as part of the Report to Shareholders filed under Item 1 of this form.
| Item 7. | Disclosure of Proxy Voting Policies and Procedures for Closed-End Management Investment Companies. |
Not applicable to open-end management investment companies.
| Item 8. | Portfolio Managers of Closed-End Management Investment Companies |
Not applicable. Effective for closed-end management investment companies for fiscal years ending on or after December 31, 2005.
| Item 9. | Purchases of Equity Securities by Closed-End Management Investment Company and Affiliated Purchasers. |
Not applicable to open-end management investment companies.
| Item 10. | Submission of Matters to a Vote of Security Holders. |
There have been no material changes to the registrant’s procedures by which shareholders may recommend nominees to the registrant’s board of trustees during the period covered by the report.
| Item 11. | Controls and Procedures. |
(a) The registrant’s principal executive and principal financial officers, or persons performing similar functions, have concluded that the registrant’s disclosure controls and procedures, as defined in Rule 30a-3(c) under the Act (17 CFR§270.30a-3(c)) as of a date within 90 days of the filing date of the report, are effective based on the evaluation of these controls and procedures required by Rule 30a-3(b) under the Act (17 CFR §270.30a-3(b)) and Rules 13a-15(b) or 15d-15(b) under the Exchange Act (17 CFR §270.30a-15(b) or §240.15d-15(b)).
(b) There were no changes in the registrant’s internal control over financial reporting (as defined in Rule 30a-3(d) under the Act (17CFR §270.3a-3(d)) that occurred during the period covered by this report that have materially affected, or are reasonably likely to materially affect, the registrant’s internal control over financial reporting.
| Items 12. | Disclosure of Securities Lending Activities for Closed-End Management Investment Companies. |
Not applicable to open-end management investment companies.
(a)(1) Code of Ethics attached hereto.
(a)(2) Separate certifications for the principal executive officer and the principal financial officer of the registrant as required by Rule 30a-2(a) under the Investment Company Act of 1940, as amended (17 CFR §270.30a-2(a)) are filed herewith.
(b) Officer certifications as required by Rule 30a-2(b) under the Investment Company Act of 1940, as amended (17 CFR §270.30a-2(b)) also accompany this filing as an exhibit.
SIGNATURES
Pursuant to the requirements of the Securities Exchange Act of 1934 and the Investment Company Act of 1940, the registrant has duly caused this report to be signed on its behalf by the undersigned, thereunto duly authorized.
| | | | | | |
| (Registrant) | | | | | | Causeway Capital Management Trust |
| | | |
| By | | | | | | /s/ Turner Swan |
| | | | | | Turner Swan, President |
Date: December 9, 2019
Pursuant to the requirements of the Securities Exchange Act of 1934 and the Investment Company Act of 1940, this report has been signed below by the following persons on behalf of the registrant and in the capacities and on the dates indicated.
| | | | | | |
| By | | | | | | /s/ Turner Swan |
| | | | | | Turner Swan, President |
Date: December 9, 2019
| | | | | | |
| By | | | | | | /s/ Eric Kleinschmidt |
| | | | | | Eric Kleinschmidt, Treasurer |
Date: December 9, 2019