UNITED STATES
SECURITIES AND EXCHANGE COMMISSION
Washington, D.C. 20549
FORM N-CSR
CERTIFIED SHAREHOLDER REPORT OF REGISTERED
MANAGEMENT INVESTMENT COMPANIES
Investment Company Act File Number 811-10467
Causeway Capital Management Trust
(Exact name of registrant as specified in charter)
11111 Santa Monica Boulevard, 15th Floor
c/o Causeway Capital Management LLC
Los Angeles, CA 90025
(Address of principal executive offices) (Zip code)
The Corporation Trust Company
Corporation Trust Center
1209 Orange Street
Wilmington DE, 19801
(Name and address of agent for service)
Registrant’s telephone number, including area code: 1-866-947-7000
Date of fiscal year end: September 30, 2022
Date of reporting period: September 30, 2022
| Item 1. | Reports to Stockholders. |
The registrant’s schedules as of the close of the reporting period, pursuant to Rule 30e-1 under the Investment Company Act of 1940, as amended (the “Act”) (17 CFR § 270.30e-1), are attached hereto.
TABLE OF CONTENTS
LETTER TO SHAREHOLDERS
For the fiscal year ended September 30, 2022, Causeway International Opportunities Fund’s (the “Fund” or “Fund’s”) Institutional Class returned -25.18% and Investor Class returned -25.37% compared to the MSCI ACWI ex US Index (Gross) (“Index”) return of -24.79%. Since the Fund’s inception on December 31, 2009, its average annual total returns are 3.12% for the Institutional Class and 2.87% for the Investor Class compared to the Index’s average annual total return of 3.28%. At fiscal year-end, the Fund had net assets of $166.4 million.
Performance Review
Developed equity markets depreciated during the fiscal year. Fourth quarter of 2021 economic data reflected pandemic-related restrictions but largely indicated resilient real gross domestic product growth globally. While 2022 began with a generally favorable backdrop for global economic activity, it was upended in late February by Russia’s invasion of Ukraine and subsequent economic shock. Sanctions from the US and European countries on Russia, ongoing supply chain bottlenecks related to the pandemic, and disruptions to energy and commodity markets exacerbated inflationary pressures. In the US, rampant inflation and a tight labor market compelled the Federal Reserve (“Fed”) to move more aggressively to raise interest rates. Monetary tightening typically impacts the global economy with a lag; however, signs of economic softening have already emerged. The JP Morgan Global Composite Purchasing Managers’ Index (“PMI”) survey ended August at 49.3, in contractionary territory for the first time since June 2020 when the Covid pandemic severely hampered economic activity. In Europe, the war in Ukraine and Russia’s curtailment of gas supplies continues to weigh on business and consumer sentiment. In September, the Eurozone’s consumer confidence indicator fell to an all-time low since the series began. Economic data continued to point to a slowdown, including the Eurozone’s composite PMI falling into contraction territory in the latter portion of the period. Despite the growth deceleration, inflationary pressures remain stubbornly high in Europe with both headline and core consumer price inflation increasing. As with the Fed, these developments should increase the pressure on the European Central Bank to accelerate its pace of monetary tightening to fight inflation. In the UK, fiscal policy announcements attracted significant attention at the end of September 2022. A mini-budget, ostensibly to supercharge economic growth, was greeted with derision and only succeeded in undermining the country’s fiscal position. Forced to intervene, the Bank of England (“BoE”) temporarily reversed course on quantitative tightening. UK consumer confidence dropped to a record low in September and the composite PMI pointed to a meaningful downturn in manufacturing output and stalled service sector growth. With core and headline inflation remaining well-above target levels, we believe the BoE will resume monetary tightening. In contrast to other developed market central banks, the Bank of Japan continues to buy Japanese government bonds, despite the yen depreciating to a 20-year low versus the US dollar. Japan is now one of the only remaining sovereigns with negative-yielding debt, as most European yields are firmly in positive territory. In China, the zero-Covid policy continues to hurt the economy. The World Bank now forecasts that the Chinese economy will grow 2.8% in 2022, down from expectations of 4.3% in June and 5.1% in December 2021. Amid a fragile economy and benign inflation environment, the People’s Bank of China lowered policy rates during the period. With two-year yields above 10-year yields, the US yield curve is inverted. This has historically been a negative indicator for emerging markets (“EM”) assets as it signals weak global growth prospects. Relatively high yields in the US have also buoyed the US dollar relative to most other currencies. EM currencies have generally depreciated relative to the US dollar, though EM currencies have fared better than many of their developed
| | | | | | |
| | | |
| 2 | | Causeway International Opportunities Fund | | | | |
market counterparts as most EM central banks have been proactively raising interest rates in anticipation of a Fed rate hiking cycle. The energy, utilities, and consumer staples sectors were the top performers for the trailing twelve-month period. The information technology, consumer discretionary, and communication services sectors lagged. The top performing markets in the Index were Indonesia, Qatar, and Kuwait. The weakest performing markets were Russia, Hungary, and Poland.
For the fiscal year, Fund holdings in the pharmaceuticals & biotechnology, consumer durables & apparel, and software & services industry groups, as well as an overweight position in the energy industry group and an underweight position in the media & entertainment industry group, contributed the most to the Fund’s performance relative to the Index. Holdings in the capital goods, materials, transportation, automobiles & components, and utilities industry groups offset some of the outperformance. The largest contributor to absolute return was luxury goods manufacturer & retailer, Compagnie Financiere Richemont SA (Switzerland). Additional top contributors included integrated oil & gas company, TotalEnergies SE (France), crude oil & natural gas company, BP Plc (United Kingdom), energy supermajor, Shell Plc (United Kingdom), and retail bank, CaixaBank SA (Spain). The biggest detractor from absolute return was jet engine manufacturer, Rolls-Royce Holdings Plc (United Kingdom). Other notable detractors included electric, gas & renewables power generation & distribution company, Enel SpA (Italy), life insurer, Prudential Plc (United Kingdom), rolling stock, signaling & services provider for the rail industry, Alstom SA (France), and business software & services provider, SAP SE (Germany).
Significant Portfolio Changes
Our disciplined purchase and sale process for the developed markets portion of the Fund led the portfolio management team to reduce exposure to several holdings that approached fair value in our view. The largest sales during the fiscal year included the full sales of diversified chemicals manufacturer, BASF SE (Germany), airline, Air Canada (Canada), and airliner manufacturer, Airbus SE (France), as well as reduced exposure to integrated oil & gas company, TotalEnergies SE (France) and crude oil & natural gas company, BP Plc (United Kingdom). Significant purchases included five new additions to the Fund: industrial gas provider, Air Liquide (France), freight rail operator, Canadian National Railway Co (Canada), global fashion retailer, Industria de Diseño Textil SA (Spain), communication services provider, Deutsche Telekom AG (Germany), and metals & mining company, Rio Tinto Plc (United Kingdom).
The Fund’s weights relative to the Index in the household & personal products, retailing, and health care equipment & services industry groups increased the most compared with the beginning of the fiscal year, while relative weights in the energy, capital goods, and pharmaceuticals & biotechnology industry groups were the greatest decreases. From a regional perspective, the most notable weight changes relative to the Index included increased exposure to the Netherlands and the United Kingdom. The most significantly reduced relative country weights included Switzerland and Germany. At the end of the fiscal year, the three largest industry group exposures from an absolute perspective for the Fund were to the banks, pharmaceuticals & biotechnology, and capital goods industry groups.
| | | | | | |
| | | |
| | Causeway International Opportunities Fund | | | 3 | |
Equity Allocation Model Update
A proprietary quantitative equity allocation model assists the portfolio managers in determining the weight of emerging versus developed markets in the Fund. In constructing the model, we identified five primary factors as most indicative of the ideal allocation target: valuation, quality, macroeconomic, earnings growth, and risk aversion. Currently, we are underweight emerging markets relative to the Index. Our valuation factor is currently neutral. Our quality metrics, which include such measures as profit margins and return on equity, are negative for emerging markets. Our earnings growth factor is negative for emerging markets, indicating that the near-term earnings revisions profile of emerging markets is inferior to that of developed markets. Our macroeconomic factor, which measures the slope of the global yield curve, is negative on emerging markets. Our risk aversion factor, which assesses the emerging markets bond yield spread over U.S. Treasuries, the CBOE Volatility Index (VIX), and the CBOE Emerging Markets ETF Volatility Index (VXEEM), indicates investors’ appetite for risk has decreased, a positive indicator in our model.
Investment Outlook
The average Euro Stoxx constituent is down 20% over the year to date period in euros, and 30% in US dollars. This makes cyclical stock laden Europe one of the worst performers of major stock market regions. Much of the pessimism surrounding Europe stems from concerns about global economic slowing, a potentially painful energy crisis this winter and more economic drag from a delayed reopening of the Chinese economy. After growth indices and the US market trampled value and MSCI ACWI indices in the most torrid part of this bull market over the past five years, it’s frustrating to see Europe lag in 2022’s bear markets. We believe that underperformance will close as the economic cycle bottoms and investors begin to anticipate economic (and earnings) recovery. As a value investor, we look beyond the next 12 months to evaluate the magnitude of earnings rebound in many of these hardest hit stocks, focusing our developed markets efforts on those with, in our view, superior financial strength. Weak domestic currencies in non-US markets are likely to offset – at least partially – the headwinds from economic slowing. We have identified developed markets companies overseas that trade at valuation discounts to US peers that far exceed, in our view, the gap explainable by fundamental criteria such as return on capital and earnings growth. We believe these types of investment opportunities in international developed markets, in industries such as enterprise software, industrial automation, specialty chemicals and appliances, are rare and typically don’t persist. We want to own these stocks, as others abandon them, as we believe they have the potential to deliver greater returns over the next few years than broad market averages.
Within the EM portion of the Fund, earnings growth upgrades for EM equities continue to lag those in developed markets as many developed ex-US countries are benefitting more from improved currency competitiveness following steep declines in their currencies relative to the US dollar. The EM sectors with the weakest net upgrades were information technology, real estate, and materials. Information technology reflects slowing global growth and a rebalancing of demand that was pulled forward during the Covid-19 pandemic. Real estate is primarily driven by slowing growth in the Chinese real estate sector, which is less impactful for China overall as the relative size of the sector has declined. Materials reflects the falling commodity prices resulting from a slowing global economy. The sectors with the strongest net upgrades were energy, consumer discretionary, and financials. Energy stocks have benefitted from relative strength in oil, coal, and natural gas prices. Consumer discretionary stocks reflect the strength in
| | | | | | |
| | | |
| 4 | | Causeway International Opportunities Fund | | | | |
Chinese online consumer companies and financials have been buoyed by rising interest rates. From a country perspective, South Korea, South Africa, and Taiwan had the weakest net upgrades. The South Korean and Taiwanese economies are technology-oriented and have been impacted by the slowdown in that sector. South Africa is a commodity-oriented economy and reflects falling commodity prices. Turkey, Saudi Arabia, and Indonesia have experienced positive net upgrades. While we incorporate growth expectations into our multi-factor investment process, we continue to emphasize valuation in our approach. With a balance of favorable valuation, growth, and price momentum characteristics relative to the Index, we believe the EM portfolio offers attractive risk-adjusted return potential looking forward.
We thank you for your continued confidence in Causeway International Opportunities Fund.
September 30, 2022
| | | | |

| | 
| | 
|
| | |
Brian Cho Portfolio Manager | | Jonathan Eng Portfolio Manager | | Joseph Gubler Portfolio Manager |
| | | | |

| |  | |  |
| | |
Harry Hartford Portfolio Manager | | Arjun Jayaraman Portfolio Manager | | Sarah Ketterer Portfolio Manager |
| | | | |

| |  | |  |
| | |
MacDuff Kuhnert Portfolio Manager | | Ellen Lee Portfolio Manager | | Conor Muldoon Portfolio Manager |
| | | | |
 | |  | |  |
| | |
Ryan Myers Portfolio Manager | | Steven Nguyen Portfolio Manager | | Alessandro Valentini Portfolio Manager |
| | | | | | |
| | | |
| | Causeway International Opportunities Fund | | | 5 | |
The above commentary expresses the portfolio managers’ views as of the date shown and should not be relied upon by the reader as research or investment advice. These views are subject to change. There is no guarantee that any forecasts made will come to pass.
Holdings are subject to change. Current and future holdings are subject to risk. Securities mentioned do not make up the entire portfolio and, in the aggregate, may represent a small percentage of the portfolio.
Investing involves risk including loss of principal. In addition to the normal risks associated with investing, international investments may involve risk of capital loss from unfavorable fluctuation in currency values, from differences in generally accepted accounting principles or from economic or political instability in other nations. Emerging markets involve heightened risks related to the same factors as well as increased volatility and lower trading volume. Diversification does not prevent all investment losses.
A company may reduce or eliminate its dividend, causing losses to the Fund.
| | | | | | |
| | | |
| 6 | | Causeway International Opportunities Fund | | | | |
Comparison of Change in the Value of a $10,000 Investment in Causeway International Opportunities Fund, Investor Class shares versus the MSCI ACWI ex USA Index (Gross) as of September 30, 2022
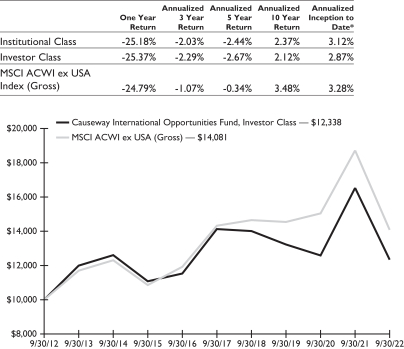
The performance in the above graph does not reflect the deduction of taxes the shareholder will pay on Fund distributions or the redemptions of Fund shares.
* Inception is December 31, 2009.
The performance data represents past performance and is not an indication of future results. Investment return and the principal value of an investment will fluctuate so that an investor’s shares, when redeemed, may be worth less than their original cost and current performance may be higher or lower than the performance quoted. For performance data current to the most recent month end, please call 1-866-947-7000 or visit www.causewayfunds.com. Investment performance reflects expense reimbursements in effect during certain periods. In the absence of such expense reimbursements, total return would be reduced. The contractual expense limits are in effect until January 31, 2024. Total returns assume reinvestment of dividends and capital gains distributions at net asset value when paid. Investor Class shares pay a shareholder service fee of up to 0.25% per annum of average daily net assets. Institutional Class shares pay no shareholder service fee. Pursuant to the current January 27, 2022 prospectus, as supplemented most recently June 30, 2022, the Fund’s annualized gross ratios of expenses in relation to average net assets were 0.99% and 1.24% for the Institutional Class and Investor Class, respectively, and the Fund’s annualized ratios of expenses in relation to net assets after fee waivers and reimbursements were 0.95% and 1.20% for the Institutional Class and Investor Class, respectively. For more information, please see the prospectus.
The MSCI ACWI ex USA Index (Gross) (the “Index”) is a free float-adjusted market capitalization weighted index, designed to measure the equity performance of developed and emerging markets excluding the U.S. market, consisting of 46 country indices. The Index is gross of withholding taxes, assumes reinvestment of dividends and capital gains, and does not reflect the payment of transaction costs, fees and expenses associated with an investment in the Fund. It is not possible to invest directly in an index. There are special risks in foreign investing (please see Note 5 in the Notes to Financial Statements).
MSCI has not approved, reviewed or produced this report, makes no express or implied warranties or representations, and is not liable whatsoever for any data in this report. You may not redistribute the MSCI data or use it as a basis for other indices or investment products.
| | | | | | |
| | | |
| | Causeway International Opportunities Fund | | | 7 | |
SCHEDULE OF INVESTMENTS (000)*
September 30, 2022
| | | | | | | | |
| Causeway International Opportunities Fund | | Number of Shares | | | Value | |
| | | | | | | | |
| | |
COMMON STOCK | | | | | | | | |
| | |
| Belgium — 0.6% | | | | | | |
| | |
Anheuser-Busch InBev S.A. | | | 23,037 | | | $ | 1,044 | |
| | | | | | | | |
| | |
Brazil — 2.0% | | | | | | | | |
| | |
Banco do Brasil SA | | | 118,800 | | | | 847 | |
| | |
JBS SA | | | 120,300 | | | | 563 | |
| | |
Marfrig Global Foods S.A. | | | 90,000 | | | | 165 | |
| | |
Minerva SA | | | 84,600 | | | | 196 | |
| | |
Petro Rio S.A. 1 | | | 39,500 | | | | 202 | |
| | |
Petroleo Brasileiro SA, Class A ADR | | | 51,882 | | | | 575 | |
| | |
SLC Agricola S.A. | | | 29,450 | | | | 236 | |
| | |
Suzano S.A. | | | 24,700 | | | | 204 | |
| | |
Vale SA, Class B ADR | | | 23,634 | | | | 315 | |
| | | | | | | | |
| | |
| | | | | | | 3,303 | |
| | | | | | | | |
| | |
Canada — 2.4% | | | | | | | | |
| | |
Alimentation Couche-Tard Inc. | | | 32,916 | | | | 1,325 | |
| | |
Canadian National Railway Co. | | | 24,287 | | | | 2,623 | |
| | | | | | | | |
| | |
| | | | | | | 3,948 | |
| | | | | | | | |
| | |
China — 9.0% | | | | | | | | |
| | |
360 DigiTech Inc. ADR | | | 34,715 | | | | 445 | |
| | |
Alibaba Group Holding Ltd. ADR 1 | | | 15,009 | | | | 1,201 | |
| | |
Anhui Conch Cement Co. Ltd., Class H | | | 138,177 | | | | 437 | |
| | |
Baidu Inc. ADR 1 | | | 2,375 | | | | 279 | |
| | |
Bank of China Ltd., Class H | | | 1,238,000 | | | | 404 | |
| | |
BYD Co. Ltd., Class H | | | 19,000 | | | | 468 | |
| | |
Chengxin Lithium Group Co. Ltd., Class A | | | 24,600 | | | | 162 | |
| | |
China Construction Bank Corp., Class H | | | 2,158,741 | | | | 1,246 | |
| | |
China Everbright Environment Group Ltd. | | | 421,000 | | | | 174 | |
| | |
China Galaxy Securities Co. Ltd., Class H | | | 367,000 | | | | 169 | |
| | |
China Lumena New Materials Corp. 1,2,3,4 | | | 4,900 | | | | — | |
| | |
China Petroleum & Chemical Corp., Class H | | | 1,194,000 | | | | 510 | |
| | |
China Railway Group Ltd., Class H | | | 818,000 | | | | 402 | |
The accompanying notes are an integral part of the financial statements.
| | | | | | |
| | | |
| 8 | | Causeway International Opportunities Fund | | | | |
SCHEDULE OF INVESTMENTS (000)* (continued)
September 30, 2022
| | | | | | | | |
| Causeway International Opportunities Fund | | Number of Shares | | | Value | |
| | | | | | | | |
| | |
| China — (continued) | | | | | | |
| | |
China Resources Pharmaceutical Group Ltd. | | | 217,000 | | | $ | 148 | |
| | |
China Shenhua Energy Co. Ltd., Class H | | | 214,500 | | | | 638 | |
| | |
China State Construction Engineering Corp. Ltd., Class A | | | 359,593 | | | | 260 | |
| | |
CITIC Ltd. | | | 374,000 | | | | 352 | |
| | |
COSCO SHIPPING Holdings Co. Ltd., Class H | | | 440,950 | | | | 513 | |
| | |
Daqo New Energy Corp. ADR1 | | | 9,505 | | | | 504 | |
| | |
Dongfeng Motor Group Co. Ltd., Class H | | | 366,000 | | | | 196 | |
| | |
FinVolution Group ADR | | | 23,386 | | | | 100 | |
| | |
Ganfeng Lithium Co. Ltd., Class H | | | 17,920 | | | | 118 | |
| | |
Guangzhou Automobile Group Co. Ltd., Class H | | | 210,000 | | | | 149 | |
| | |
Guangzhou Tinci Materials Technology Co. Ltd., Class A | | | 13,000 | | | | 80 | |
| | |
Industrial & Commercial Bank of China, Class H | | | 1,082,000 | | | | 508 | |
| | |
Intco Medical Technology Co. Ltd., Class A | | | 28,198 | | | | 79 | |
| | |
JD.com Inc. ADR | | | 10,290 | | | | 517 | |
| | |
Jiangxi Copper Co. Ltd., Class H | | | 198,000 | | | | 229 | |
| | |
Lenovo Group Ltd. | | | 382,000 | | | | 264 | |
| | |
Meituan, Class B1 | | | 3,900 | | | | 82 | |
| | |
NetEase Inc. ADR | | | 1,226 | | | | 93 | |
| | |
PetroChina Co. Ltd., Class H | | | 1,616,000 | | | | 661 | |
| | |
PICC Property & Casualty Co. Ltd., Class H | | | 706,000 | | | | 730 | |
| | |
Pinduoduo Inc. ADR1 | | | 7,750 | | | | 485 | |
| | |
Shanghai Pharmaceuticals Holding Co. Ltd., Class H | | | 84,439 | | | | 116 | |
| | |
Sinopharm Group Co. Ltd., Class H | | | 76,000 | | | | 152 | |
| | |
Skyworth Group Ltd. | | | 212,000 | | | | 85 | |
| | |
Tencent Holdings Ltd. | | | 42,431 | | | | 1,433 | |
| | |
Tongwei Co. Ltd., Class A | | | 65,093 | | | | 429 | |
| | |
Zhejiang Expressway Co. Ltd., Class H | | | 228,000 | | | | 155 | |
| | | | | | | | |
| | |
| | | | | | | 14,973 | |
| | | | | | | | |
| | |
France — 13.3% | | | | | | | | |
| | |
Air Liquide SA | | | 25,256 | | | | 2,887 | |
| | |
Alstom S.A. | | | 122,397 | | | | 1,980 | |
| | |
ArcelorMittal S.A. | | | 35,063 | | | | 698 | |
The accompanying notes are an integral part of the financial statements.
| | | | | | |
| | | |
| | Causeway International Opportunities Fund | | | 9 | |
SCHEDULE OF INVESTMENTS (000)* (continued)
September 30, 2022
| | | | | | | | |
| Causeway International Opportunities Fund | | Number of Shares | | | Value | |
| | | | | | | | |
| | |
| France — (continued) | | | | | | |
| | |
AXA SA | | | 136,544 | | | $ | 2,981 | |
| | |
BNP Paribas SA | | | 22,777 | | | | 962 | |
| | |
Carrefour SA | | | 84,396 | | | | 1,171 | |
| | |
Danone SA | | | 68,692 | | | | 3,248 | |
| | |
Pernod Ricard SA | | | 9,146 | | | | 1,678 | |
| | |
Sanofi | | | 32,141 | | | | 2,447 | |
| | |
TotalEnergies SE | | | 29,694 | | | | 1,393 | |
| | |
Valeo | | | 36,991 | | | | 559 | |
| | |
Vinci S.A. | | | 25,095 | | | | 2,029 | |
| | | | | | | | |
| | |
| | | | | | | 22,033 | |
| | | | | | | | |
| | |
Germany — 6.1% | | | | | | | | |
| | |
Bayer AG | | | 37,336 | | | | 1,720 | |
| | |
Covestro AG | | | 6,468 | | | | 185 | |
| | |
Deutsche Telekom AG | | | 122,232 | | | | 2,080 | |
| | |
RWE AG | | | 68,121 | | | | 2,504 | |
| | |
SAP SE | | | 34,933 | | | | 2,847 | |
| | |
Siemens AG | | | 8,367 | | | | 818 | |
| | | | | | | | |
| | |
| | | | | | | 10,154 | |
| | | | | | | | |
| | |
India — 4.1% | | | | | | | | |
| | |
Axis Bank Ltd. | | | 18,980 | | | | 170 | |
| | |
Bank of Baroda | | | 252,729 | | | | 407 | |
| | |
Coal India Ltd. | | | 134,444 | | | | 349 | |
| | |
GAIL India Ltd. | | | 275,017 | | | | 292 | |
| | |
Hindalco Industries Ltd. | | | 102,376 | | | | 485 | |
| | |
ICICI Bank Ltd. ADR | | | 36,385 | | | | 763 | |
| | |
Info Edge India Ltd. | | | 1,800 | | | | 85 | |
| | |
Infosys Ltd. ADR | | | 20,242 | | | | 343 | |
| | | | | | | | |
| | |
Mahindra & Mahindra Ltd. | | | 19,420 | | | | 300 | |
| | |
Maruti Suzuki India Ltd. | | | 1,158 | | | | 125 | |
| | |
NTPC Ltd. | | | 112,911 | | | | 221 | |
| | |
Oil & Natural Gas Corp. Ltd. | | | 345,464 | | | | 535 | |
The accompanying notes are an integral part of the financial statements.
| | | | | | |
| | | |
| 10 | | Causeway International Opportunities Fund | | | | |
SCHEDULE OF INVESTMENTS (000)* (continued)
September 30, 2022
| | | | | | | | |
| Causeway International Opportunities Fund | | Number of Shares | | | Value | |
| | | | | | | | |
| | |
| India — (continued) | | | | | | |
| | |
REC Ltd. | | | 250,048 | | | $ | 288 | |
| | |
SBI Cards & Payment Services Ltd. | | | 16,143 | | | | 180 | |
| | |
Shriram Transport Finance Co. Ltd. | | | 15,332 | | | | 224 | |
| | |
State Bank of India | | | 26,870 | | | | 174 | |
| | |
Sun Pharmaceutical Industries Ltd. | | | 47,613 | | | | 553 | |
| | |
Tata Steel Ltd. | | | 459,058 | | | | 554 | |
| | |
Trent Ltd. | | | 5,413 | | | | 94 | |
| | |
UPL Ltd. | | | 45,721 | | | | 375 | |
| | |
Vedanta Ltd. | | | 90,408 | | | | 297 | |
| | | | | | | | |
| | |
| | | | | | | 6,814 | |
| | | | | | | | |
| | |
| Indonesia — 0.8% | | | | | | |
| | |
Adaro Energy Indonesia Tbk PT | | | 847,800 | | | | 219 | |
| | |
Astra International | | | 417,400 | | | | 181 | |
| | |
Bank Mandiri Persero Tbk PT | | | 412,200 | | | | 253 | |
| | |
Bukit Asam Tbk PT | | | 322,100 | | | | 88 | |
| | |
Indo Tambangraya Megah Tbk PT | | | 54,900 | | | | 148 | |
| | |
Indofood Sukses Makmur Tbk PT | | | 252,300 | | | | 100 | |
| | |
Kalbe Farma Tbk PT | | | 950,700 | | | | 114 | |
| | |
Telkom Indonesia Persero Tbk PT | | | 313,200 | | | | 91 | |
| | |
United Tractors Tbk PT | | | 61,700 | | | | 132 | |
| | | | | | | | |
| | |
| | | | | | | 1,326 | |
| | | | | | | | |
| | |
| Ireland — 1.3% | | | | | | |
| | |
Ryanair Holdings PLC ADR1 | | | 38,070 | | | | 2,224 | |
| | | | | | | | |
| | |
| Italy — 5.3% | | | | | | |
| | |
Enel SpA | | | 821,230 | | | | 3,368 | |
| | |
UniCredit SpA | | | 530,415 | | | | 5,370 | |
| | | | | | | | |
| | |
| | | | | | | 8,738 | |
| | | | | | | | |
| | |
| Japan — 5.9% | | | | | | |
| | |
FANUC Corp. | | | 23,000 | | | | 3,229 | |
| | |
Murata Manufacturing Co. Ltd. | | | 34,000 | | | | 1,565 | |
The accompanying notes are an integral part of the financial statements.
| | | | | | |
| | | |
| | Causeway International Opportunities Fund | | | 11 | |
SCHEDULE OF INVESTMENTS (000)* (continued)
September 30, 2022
| | | | | | | | |
| Causeway International Opportunities Fund | | Number of Shares | | | Value | |
| | | | | | | | |
| | |
| Japan — (continued) | | | | | | |
| | |
Sumitomo Mitsui Financial Group Inc. | | | 59,800 | | | $ | 1,658 | |
| | |
Takeda Pharmaceutical Co. Ltd. | | | 100,800 | | | | 2,618 | |
| | |
Tokyo Electron Ltd. | | | 2,900 | | | | 714 | |
| | | | | | | | |
| | |
| | | | | | | 9,784 | |
| | | | | | | | |
| | |
| Mexico — 0.2% | | | | | | |
| | |
Alfa SAB de CV, Class A | | | 223,300 | | | | 142 | |
| | |
Arca Continental SAB de CV | | | 35,600 | | | | 256 | |
| | | | | | | | |
| | |
| | | | | | | 398 | |
| | | | | | | | |
| | |
| Netherlands — 4.2% | | | | | | |
| | |
Akzo Nobel NV | | | 52,051 | | | | 2,950 | |
| | |
ING Groep NV | | | 307,723 | | | | 2,636 | |
| | |
Koninklijke Philips NV | | | 90,019 | | | | 1,386 | |
| | | | | | | | |
| | |
| | | | | | | 6,972 | |
| | | | | | | | |
| | |
| Qatar — 0.2% | | | | | | |
| | |
Industries Qatar QSC | | | 73,529 | | | | 340 | |
| | | | | | | | |
| | |
| Russia — 0.0% | | | | | | |
| | |
Gazprom PJSC ADR1,2,3,4 | | | 165,932 | | | | — | |
| | |
LUKOIL PJSC ADR1,2,3,4 | | | 11,378 | | | | — | |
| | |
Sberbank of Russia PJSC ADR1,2,3,4 | | | 31,284 | | | | — | |
| | | | | | | | |
| | |
| | | | | | | — | |
| | | | | | | | |
| | |
| Saudi Arabia — 1.5% | | | | | | |
| | |
Abdullah Al Othaim Markets Co. | | | 2,920 | | | | 96 | |
| | |
Arab National Bank | | | 25,505 | | | | 207 | |
| | |
Bawan Co. | | | 19,424 | | | | 180 | |
| | |
Etihad Etisalat Co. | | | 10,991 | | | | 104 | |
| | |
Riyad Bank | | | 16,423 | | | | 138 | |
| | |
SABIC Agri-Nutrients Co. | | | 8,437 | | | | 350 | |
| | |
Sahara International Petrochemical Co. | | | 23,924 | | | | 262 | |
| | |
Saudi Arabian Oil Co. | | | 48,837 | | | | 465 | |
| | |
Saudi Electricity Co. | | | 28,765 | | | | 186 | |
The accompanying notes are an integral part of the financial statements.
| | | | | | |
| | | |
| 12 | | Causeway International Opportunities Fund | | | | |
SCHEDULE OF INVESTMENTS (000)* (continued)
September 30, 2022
| | | | | | | | |
| Causeway International Opportunities Fund | | Number of Shares | | | Value | |
| | | | | | | | |
| | |
| Saudi Arabia — (continued) | | | | | | |
| | |
Saudi National Bank | | | 18,309 | | | $ | 306 | |
| | |
Saudi Telecom Co. | | | 18,351 | | | | 191 | |
| | | | | | | | |
| | |
| | | | | | | 2,485 | |
| | | | | | | | |
| | |
| South Africa — 0.7% | | | | | | |
| | |
Absa Group Ltd. | | | 26,724 | | | | 260 | |
| | |
African Rainbow Minerals Ltd. | | | 24,187 | | | | 326 | |
| | |
Sasol Ltd. | | | 18,911 | | | | 296 | |
| | |
Sibanye Stillwater Ltd. | | | 138,891 | | | | 319 | |
| | | | | | | | |
| | |
| | | | | | | 1,201 | |
| | | | | | | | |
| | |
| South Korea — 3.5% | | | | | | |
| | |
DB Insurance Co. Ltd. | | | 3,088 | | | | 118 | |
| | |
DL E&C Co. Ltd. | | | 4,504 | | | | 107 | |
| | |
GS Holdings Corp. | | | 5,107 | | | | 148 | |
| | |
Hana Financial Group Inc. | | | 20,105 | | | | 494 | |
| | |
Hanwha Corp. | | | 9,327 | | | | 158 | |
| | |
Hyosung TNC Corp. | | | 771 | | | | 138 | |
| | |
Hyundai Marine & Fire Insurance Co. Ltd. | | | 6,706 | | | | 137 | |
| | |
KB Financial Group Inc. | | | 17,740 | | | | 536 | |
| | |
Kia Corp. | | | 14,830 | | | | 738 | |
| | |
LG Corp. | | | 1,244 | | | | 64 | |
| | |
LG Innotek Co. Ltd. | | | 1,410 | | | | 266 | |
| | |
LX INTERNATIONAL CORP | | | 9,910 | | | | 267 | |
| | |
LX Semicon Co. Ltd. | | | 2,611 | | | | 137 | |
| | |
Mirae Asset Securities Co. Ltd. | | | 17,935 | | | | 74 | |
| | |
POSCO Holdings Inc. | | | 2,735 | | | | 399 | |
| | |
Samsung Electronics Co. Ltd. | | | 40,907 | | | | 1,502 | |
| | |
Samsung Securities Co. Ltd. | | | 3,702 | | | | 79 | |
| | |
S-Oil Corp. | | | 3,395 | | | | 192 | |
| | |
Woori Financial Group Inc. | | | 13,688 | | | | 101 | |
| | |
Youngone Corp. | | | 3,241 | | | | 100 | |
| | | | | | | | |
| | |
| | | | | | | 5,755 | |
| | | | | | | | |
The accompanying notes are an integral part of the financial statements.
| | | | | | |
| | | |
| | Causeway International Opportunities Fund | | | 13 | |
SCHEDULE OF INVESTMENTS (000)* (continued)
September 30, 2022
| | | | | | | | |
| Causeway International Opportunities Fund | | Number of Shares | | | Value | |
| | | | | | | | |
| | |
| Spain — 5.3% | | | | | | |
| | |
Aena SME S.A.1 | | | 16,990 | | | $ | 1,763 | |
| | |
Amadeus IT Group S.A.1 | | | 67,167 | | | | 3,114 | |
| | |
CaixaBank SA | | | 83,477 | | | | 269 | |
| | |
Iberdrola S.A. | | | 153,558 | | | | 1,432 | |
| | |
Industria de Diseno Textil S.A. | | | 110,456 | | | | 2,279 | |
| | | | | | | | |
| | |
| | | | | | | 8,857 | |
| | | | | | | | |
| | |
| Sweden — 1.2% | | | | | | |
| | |
Electrolux AB, Class B | | | 30,897 | | | | 321 | |
| | |
Swedbank AB | | | 124,975 | | | | 1,641 | |
| | | | | | | | |
| | |
| | | | | | | 1,962 | |
| | | | | | | | |
| | |
| Switzerland — 5.5% | | | | | | |
| | |
Cie Financiere Richemont SA, Class A | | | 3,627 | | | | 342 | |
| | |
Novartis AG | | | 46,619 | | | | 3,554 | |
| | |
Roche Holding AG | | | 11,693 | | | | 3,807 | |
| | |
Zurich Insurance Group AG | | | 3,529 | | | | 1,407 | |
| | | | | | | | |
| | |
| | | | | | | 9,110 | |
| | | | | | | | |
| | |
| Taiwan — 3.8% | | | | | | |
| | |
Asia Vital Components Co. Ltd. | | | 24,000 | | | | 83 | |
| | |
Asustek Computer Inc. | | | 8,000 | | | | 59 | |
| | |
ChipMOS Technologies Inc. | | | 49,000 | | | | 46 | |
| | |
Evergreen Marine Corp. Taiwan Ltd. | | | 28,400 | | | | 129 | |
| | |
Fulgent Sun International Holding Co. Ltd. | | | 23,000 | | | | 115 | |
| | |
Gigabyte Technology Co. Ltd. | | | 64,000 | | | | 177 | |
| | |
Hon Hai Precision Industry Co. Ltd. | | | 297,292 | | | | 952 | |
| | |
Lite-On Technology Corp. | | | 129,896 | | | | 260 | |
| | |
MediaTek Inc. | | | 9,000 | | | | 155 | |
| | |
Primax Electronics Ltd. | | | 47,000 | | | | 94 | |
| | |
Sino-American Silicon Products Inc. | | | 31,000 | | | | 127 | |
| | |
Sitronix Technology Corp. | | | 30,000 | | | | 154 | |
| | |
Taiwan Semiconductor Manufacturing Co. Ltd. | | | 2,000 | | | | 27 | |
| | |
Taiwan Semiconductor Manufacturing Co. Ltd. ADR | | | 41,440 | | | | 2,841 | |
The accompanying notes are an integral part of the financial statements.
| | | | | | |
| | | |
| 14 | | Causeway International Opportunities Fund | | | | |
SCHEDULE OF INVESTMENTS (000)* (continued)
September 30, 2022
| | | | | | | | |
| Causeway International Opportunities Fund | | Number of Shares | | | Value | |
| | | | | | | | |
| | |
| Taiwan — (continued) | | | | | | |
| | |
Unimicron Technology Corp. | | | 58,000 | | | $ | 212 | |
| | |
United Microelectronics Corp. | | | 386,000 | | | | 432 | |
| | |
Yang Ming Marine Transport Corp. | | | 168,000 | | | | 323 | |
| | |
Zhen Ding Technology Holding Ltd. | | | 52,000 | | | | 173 | |
| | | | | | | | |
| | |
| | | | | | | 6,359 | |
| | | | | | | | |
| | |
Thailand — 0.9% | | | | | | | | |
| | |
Bangkok Chain Hospital PCL | | | 363,500 | | | | 171 | |
| | |
Bangkok Dusit Medical Services PCL, Class F | | | 289,200 | | | | 225 | |
| | |
Kasikornbank PCL | | | 44,100 | | | | 168 | |
| | |
Kiatnakin Phatra Bank PCL | | | 96,100 | | | | 174 | |
| | |
Krung Thai Bank PCL | | | 614,100 | | | | 271 | |
| | |
PTT Exploration & Production PCL | | | 97,800 | | | | 417 | |
| | |
Sri Trang Agro-Industry PCL | | | 108,800 | | | | 56 | |
| | |
Thai Union Group PCL, Class F | | | 165,100 | | | | 82 | |
| | | | | | | | |
| | |
| | | | | | | 1,564 | |
| | | | | | | | |
| | |
Turkey — 0.2% | | | | | | | | |
| | |
KOC Holding AS | | | 46,813 | | | | 114 | |
| | |
Turk Hava Yollari AO1 | | | 54,028 | | | | 205 | |
| | | | | | | | |
| | |
| | | | | | | 319 | |
| | | | | | | | |
| | |
United Arab Emirates — 0.8% | | | | | | | | |
| | |
Abu Dhabi Commercial Bank PJSC | | | 134,214 | | | | 329 | |
| | |
Abu Dhabi Ports Co. PJSC1 | | | 136,807 | | | | 191 | |
| | |
Aldar Properties PJSC | | | 195,582 | | | | 223 | |
| | |
Dubai Islamic Bank PJSC | | | 239,710 | | | | 389 | |
| | |
Fertiglobe PLC | | | 151,901 | | | | 236 | |
| | | | | | | | |
| | |
| | | | | | | 1,368 | |
| | | | | | | | |
| | |
United Kingdom — 19.6% | | | | | | | | |
| | |
AstraZeneca PLC | | | 26,631 | | | | 2,927 | |
| | |
Balfour Beatty PLC | | | 78,754 | | | | 270 | |
| | |
Barclays PLC | | | 1,573,943 | | | | 2,504 | |
The accompanying notes are an integral part of the financial statements.
| | | | | | |
| | | |
| | Causeway International Opportunities Fund | | | 15 | |
SCHEDULE OF INVESTMENTS (000)* (continued)
September 30, 2022
| | | | | | | | |
| Causeway International Opportunities Fund | | Number of Shares | | | Value | |
| | | | | | | | |
| | |
| United Kingdom — (continued) | | | | | | |
| | |
Berkeley Group Holdings PLC | | | 10,289 | | | $ | 376 | |
| | |
BP PLC | | | 291,766 | | | | 1,394 | |
| | |
British American Tobacco PLC | | | 45,319 | | | | 1,625 | |
| | |
Compass Group PLC | | | 114,595 | | | | 2,282 | |
| | |
GSK PLC | | | 80,984 | | | | 1,170 | |
| | |
Prudential PLC | | | 370,464 | | | | 3,626 | |
| | |
Reckitt Benckiser Group PLC | | | 50,093 | | | | 3,320 | |
| | |
RELX PLC (EUR) | | | 69,815 | | | | 1,701 | |
| | |
RELX PLC (GBP) | | | 66,612 | | | | 1,628 | |
| | |
Rio Tinto PLC | | | 26,434 | | | | 1,430 | |
| | |
Rolls-Royce Holdings PLC1 | | | 4,233,224 | | | | 3,242 | |
| | |
Unilever PLC | | | 83,714 | | | | 3,679 | |
| | |
WH Smith PLC1 | | | 113,768 | | | | 1,500 | |
| | | | | | | | |
| | |
| | | | | | | 32,674 | |
| | | | | | | | |
| | |
Total Common Stock | | | | | | | | |
| | |
(Cost $209,935) — 98.4% | | | | | | | 163,705 | |
| | | | | | | | |
| | |
SHORT-TERM INVESTMENT | | | | | | | | |
| | |
Invesco Short-Term Investment Trust: Government & Agency Portfolio, Institutional Class, 2.951%** | | | 1,905,401 | | | | 1,905 | |
| | | | | | | | |
| | |
Total Short-Term Investment | | | | | | | | |
| | |
(Cost $1,905) — 1.1% | | | | | | | 1,905 | |
| | | | | | | | |
| | |
Total Investments — 99.5% | | | | | | | | |
| | |
(Cost $211,840) | | | | | | | 165,610 | |
| | | | | | | | |
| | |
Other Assets in Excess of Liabilities — 0.5% | | | | | | | 747 | |
| | | | | | | | |
| | |
Net Assets — 100.0% | | | | | | $ | 166,357 | |
| | | | | | | | |
| ** | The rate reported is the 7-day effective yield as of September 30, 2022. |
| 1 | Non-income producing security. |
| 2 | Level 3 security in accordance with fair value hierarchy. |
| 3 | Securities considered illiquid. The total market value of such securities as of September 30, 2022 was $— (000) and represented 0.0% of net assets. |
| 4 | Security fair valued using methods determined in good faith by the Fair Value Committee. The total market value of such securities as of September 30, 2022 was $— (000) and represented 0.0% of net assets. |
The accompanying notes are an integral part of the financial statements.
| | | | | | |
| | | |
| 16 | | Causeway International Opportunities Fund | | | | |
SCHEDULE OF INVESTMENTS (000) (continued)
September 30, 2022
| ADR | American Depositary Receipt |
| PJSC | Public Joint-Stock Company |
Amounts designated as “—” are $0 or are rounded to $0.
The table below sets forth information about the Levels within the fair value hierarchy at which the Fund’s investments are measured at September 30, 2022:
| | | | | | | | | | | | | | | | |
| Investments in Securities | | Level 1 | | | Level 2 | | | Level 3† | | | Total | |
Common Stock | | | | | | | | | | | | | | | | |
Belgium | | $ | — | | | $ | 1,044 | | | $ | — | | | $ | 1,044 | |
Brazil | | | 3,303 | | | | — | | | | — | | | | 3,303 | |
Canada | | | 3,948 | | | | — | | | | — | | | | 3,948 | |
China | | | 3,624 | | | | 11,349 | | | | —^ | | | | 14,973 | |
France | | | — | | | | 22,033 | | | | — | | | | 22,033 | |
Germany | | | — | | | | 10,154 | | | | — | | | | 10,154 | |
India | | | 1,106 | | | | 5,708 | | | | — | | | | 6,814 | |
Indonesia | | | — | | | | 1,326 | | | | — | | | | 1,326 | |
Ireland | | | 2,224 | | | | — | | | | — | | | | 2,224 | |
Italy | | | — | | | | 8,738 | | | | — | | | | 8,738 | |
Japan | | | — | | | | 9,784 | | | | — | | | | 9,784 | |
Mexico | | | 398 | | | | — | | | | — | | | | 398 | |
Netherlands | | | — | | | | 6,972 | | | | — | | | | 6,972 | |
Qatar | | | — | | | | 340 | | | | — | | | | 340 | |
Russia | | | — | | | | — | | | | —^ | | | | — | |
Saudi Arabia | | | — | | | | 2,485 | | | | — | | | | 2,485 | |
South Africa | | | 326 | | | | 875 | | | | — | | | | 1,201 | |
South Korea | | | — | | | | 5,755 | | | | — | | | | 5,755 | |
Spain | | | — | | | | 8,857 | | | | — | | | | 8,857 | |
Sweden | | | — | | | | 1,962 | | | | — | | | | 1,962 | |
Switzerland | | | — | | | | 9,110 | | | | — | | | | 9,110 | |
Taiwan | | | 2,841 | | | | 3,518 | | | | — | | | | 6,359 | |
Thailand | | | — | | | | 1,564 | | | | — | | | | 1,564 | |
Turkey | | | — | | | | 319 | | | | — | | | | 319 | |
United Arab Emirates | | | — | | | | 1,368 | | | | — | | | | 1,368 | |
United Kingdom | | | 270 | | | | 32,404 | | | | — | | | | 32,674 | |
| | | | |
| | | | |
Total Common Stock | | | 18,040 | | | | 145,665 | | | | — | | | | 163,705 | |
| | | | |
| | | | |
Short-Term Investment | | | 1,905 | | | | — | | | | — | | | | 1,905 | |
| | | | |
| | | | |
Total Investments in Securities | | $ | 19,945 | | | $ | 145,665 | | | $ | — | | | $ | 165,610 | |
| | | | |
| | | | |
The accompanying notes are an integral part of the financial statements.
| | | | | | |
| | | |
| | Causeway International Opportunities Fund | | | 17 | |
SCHEDULE OF INVESTMENTS (000) (concluded)
September 30, 2022
| † | A reconciliation of Level 3 investments and disclosures of significant unobservable inputs are presented when the Fund has a significant amount of Level 3 investments at the beginning and/or end of the period in relation to net assets. Management has concluded that Level 3 investments are not material in relation to net assets. |
| ^ | Security is fair valued at zero. Level 3 security in accordance with fair value hierarchy. |
Amounts designated as “—” are $0 or are rounded to $0.
For more information on valuation inputs, see Note 2 in the Notes to Financial Statements.
The accompanying notes are an integral part of the financial statements.
| | | | | | |
| | | |
| 18 | | Causeway International Opportunities Fund | | | | |
SECTOR DIVERSIFICATION
As of September 30, 2022, the sector diversification was as follows (Unaudited):
| | | | | | | | |
| Causeway International Opportunities Fund | | Common
Stock | | | % of
Net Assets | |
| | |
Financials | | | 20.3% | | | | 20.3% | |
| | |
Industrials | | | 15.7 | | | | 15.7 | |
| | |
Health Care | | | 12.7 | | | | 12.7 | |
| | |
Consumer Staples | | | 11.6 | | | | 11.6 | |
| | |
Information Technology | | | 10.3 | | | | 10.3 | |
| | |
Materials | | | 7.8 | | | | 7.8 | |
| | |
Consumer Discretionary | | | 7.7 | | | | 7.7 | |
| | |
Utilities | | | 4.8 | | | | 4.8 | |
| | |
Energy | | | 4.6 | | | | 4.6 | |
| | |
Communication Services | | | 2.8 | | | | 2.8 | |
| | |
Real Estate | | | 0.1 | | | | 0.1 | |
| | | | | | | | |
| Total | | | 98.4 | | | | 98.4 | |
Short-Term Investment | | | | | | | 1.1 | |
| | | | | | | | |
| Other Assets in Excess of Liabilities | | | | | | | 0.5 | |
| | | | | | | | |
| Net Assets | | | | | | | 100.0% | |
| | | | | | | | |
The accompanying notes are an integral part of the financial statements.
| | | | | | |
| | | |
| | Causeway International Opportunities Fund | | | 19 | |
STATEMENT OF ASSETS AND LIABILITIES (000)*
| | | | |
| | | CAUSEWAY
INTERNATIONAL
OPPORTUNITIES
FUND | |
| |
| | | 9/30/22 | |
ASSETS: | | | | |
Investments at Value (Cost $211,840) | | $ | 165,610 | |
Cash | | | 250 | |
Foreign Currency (Cost $198) | | | 198 | |
Receivable for Investment Securities Sold | | | 1,892 | |
Receivable for Tax Reclaims | | | 718 | |
Receivable for Dividends | | | 362 | |
Receivable for Fund Shares Sold | | | 2 | |
Prepaid Expenses | | | 12 | |
| | | | |
Total Assets | | | 169,044 | |
| | | | |
LIABILITIES: | | | | |
Payable for Fund Shares Redeemed | | | 1,418 | |
Payable for Investment Securities Purchased | | | 984 | |
Payable Due to Adviser | | | 93 | |
Accrued Foreign Capital Gains Tax on Appreciated Securities | | | 30 | |
Payable for Trustees’ Fees | | | 4 | |
Payable for Shareholder Service Fees — Investor Class | | | 3 | |
Payable Due to Administrator | | | 3 | |
Unrealized Depreciation on Spot Foreign Currency Contracts | | | 2 | |
Other Accrued Expenses | | | 150 | |
| | | | |
Total Liabilities | | | 2,687 | |
| | | | |
Net Assets | | $ | 166,357 | |
| | | | |
NET ASSETS: | | | | |
Paid-in Capital (unlimited authorization — no par value) | | $ | 212,692 | |
Total Distributable Loss | | | (46,335 | ) |
| | | | |
Net Assets | | $ | 166,357 | |
| | | | |
Net Asset Value Per Share (based on net assets of
$151,612,488 ÷ 13,509,730 shares) — Institutional Class | | | $11.22 | |
| | | | |
Net Asset Value Per Share (based on net assets of
$14,744,908 ÷ 1,325,999 shares)—Investor Class | | | $11.12 | |
| | | | |
| * | Except for Net Asset Value Per Share data. |
The accompanying notes are an integral part of the financial statements.
| | | | | | |
| | | |
| 20 | | Causeway International Opportunities Fund | | | | |
STATEMENT OF OPERATIONS (000)
| | | | |
| | | CAUSEWAY
INTERNATIONAL
OPPORTUNITIES
FUND | |
| |
| | | 10/01/21 to
9/30/22 | |
INVESTMENT INCOME: | | | | |
Dividend Income (net of foreign taxes withheld of $1,166) | | $ | 8,213 | |
Interest Income | | | 3 | |
| | | | |
Total Investment Income | | | 8,216 | |
| | | | |
EXPENSES: | | | | |
Investment Advisory Fees | | | 2,020 | |
Administration Fees | | | 49 | |
Shareholder Service Fees — Investor Class | | | 48 | |
Custodian Fees | | | 110 | |
Professional Fees | | | 76 | |
Transfer Agent Fees | | | 63 | |
Registration Fees | | | 48 | |
Printing Fees | | | 25 | |
Trustees’ Fees | | | 15 | |
Line of Credit | | | 8 | |
Other Fees | | | 37 | |
| | | | |
Total Expenses | | | 2,499 | |
| | | | |
Waiver of Investment Advisory Fees | | | (49 | ) |
| | | | |
Total Waiver | | | (49 | ) |
| | | | |
| |
Net Expenses | | | 2,450 | |
| | | | |
Net Investment Income | | | 5,766 | |
| | | | |
Net Realized and Unrealized Gain (Loss) on Investments and Foreign Currency Transactions: | | | | |
Net Realized Loss on Investments | | | (885 | ) |
Foreign Capital Gains Tax | | | (3 | ) |
Net Realized Loss from Foreign Currency Transactions | | | (226 | ) |
Net Change in Unrealized Depreciation on Investments | | | (69,792 | ) |
Net Change in Accrued Foreign Capital Gains Tax on Appreciated Securities | | | 206 | |
Net Change in Unrealized Depreciation on Foreign Currency and Translation of Other Assets and Liabilities Denominated in Foreign Currency | | | (84 | ) |
| | | | |
Net Realized and Unrealized Loss on Investments and Foreign Currency Transactions | | | (70,784 | ) |
| | | | |
| Net Decrease in Net Assets Resulting from Operations | | $ | (65,018 | ) |
| | | | |
The accompanying notes are an integral part of the financial statements.
| | | | | | |
| | | |
| | Causeway International Opportunities Fund | | | 21 | |
STATEMENTS OF CHANGES IN NET ASSETS (000)
| | | | | | | | |
| | | CAUSEWAY
INTERNATIONAL
OPPORTUNITIES FUND | |
| | |
| | | 10/01/21 to
9/30/22 | | | 10/01/20 to
9/30/21 | |
OPERATIONS: | | | | | | | | |
Net Investment Income | | $ | 5,766 | | | $ | 4,195 | |
Net Realized Gain (Loss) on Investments | | | (885 | ) | | | 20,543 | |
Foreign Capital Gains Tax | | | (3 | ) | | | — | |
Net Realized Loss from Foreign Currency Transactions | | | (226 | ) | | | (4 | ) |
Net Change in Unrealized Appreciation (Depreciation) on Investments | | | (69,792 | ) | | | 34,015 | |
Net Change in Accrued Foreign Capital Gains Tax on Appreciated Securities | | | 206 | | | | (228 | ) |
Net Change in Unrealized Depreciation on Foreign Currency and Translation of Other Assets and Liabilities Denominated in Foreign Currency | | | (84 | ) | | | (29 | ) |
| | | | | | | | |
Net Increase (Decrease) in Net Assets Resulting From Operations | | | (65,018 | ) | | | 58,492 | |
| | | | | | | | |
DISTRIBUTIONS: | | | | | | | | |
Institutional Class | | | (4,160 | ) | | | (2,980 | ) |
Investor Class | | | (266 | ) | | | (169 | ) |
| | | | | | | | |
Total Distributions to Shareholders | | | (4,426 | ) | | | (3,149 | ) |
| | | | | | | | |
Net Increase (Decrease) in Net Assets Derived from Capital Share Transactions(1) | | | (47,700 | ) | | | 43,397 | |
| | | | | | | | |
Total Increase (Decrease) in Net Assets | | | (117,144 | ) | | | 98,740 | |
| | | | | | | | |
NET ASSETS: | | | | | | | | |
Beginning of Year | | | 283,501 | | | | 184,761 | |
| | | | | | | | |
End of Year | | $ | 166,357 | | | $ | 283,501 | |
| | | | | | | | |
| (1) | See Note 7 in the Notes to Financial Statements. |
The accompanying notes are an integral part of the financial statements.
| | | | | | |
| | | |
| 22 | | Causeway International Opportunities Fund | | | | |
This page intentionally left blank.
FINANCIAL HIGHLIGHTS
For the Fiscal Years Ended September 30,
For a Share Outstanding Throughout the Fiscal Years
| | | | | | | | | | | | | | | | | | | | | | | | | | | | | | | | |
| | | Net Asset
Value,
Beginning
of Year ($) | | | Net
Investment
Income ($)† | | |
Net Realized
and
Unrealized
Gain
(Loss) on
Investments ($) | | | Total
from
Operations ($) | | | Dividends
from Net
Investment
Income ($) | | | Distributions
from
Capital
Gains ($) | | | Total
Dividends
and
Distributions ($) | | | Redemption
Fees ($) | |
CAUSEWAY INTERNATIONAL OPPORTUNITIES FUND | |
Institutional | |
2022 | | | 15.24 | | | | 0.32 | | | | (4.10 | ) | | | (3.78 | ) | | | (0.24 | ) | | | — | | | | (0.24 | ) | | | — | |
2021 | | | 11.74 | | | | 0.25 | | | | 3.45 | | | | 3.70 | | | | (0.20 | ) | | | — | | | | (0.20 | ) | | | — | |
2020 | | | 12.61 | | | | 0.21 | | | | (0.73 | ) | | | (0.52 | ) | | | (0.35 | ) | | | — | | | | (0.35 | ) | | | — | |
2019 | | | 13.71 | | | | 0.41 | | | | (1.19 | ) | | | (0.78 | ) | | | (0.29 | ) | | | (0.03 | ) | | | (0.32 | ) | | | — | (1) |
2018 | | | 14.00 | | | | 0.31 | | | | (0.39 | ) | | | (0.08 | ) | | | (0.21 | ) | | | — | | | | (0.21 | ) | | | — | (1) |
Investor | |
2022 | | | 15.11 | | | | 0.30 | | | | (4.08 | ) | | | (3.78 | ) | | | (0.21 | ) | | | — | | | | (0.21 | ) | | | — | |
2021 | | | 11.64 | | | | 0.21 | | | | 3.43 | | | | 3.64 | | | | (0.17 | ) | | | — | | | | (0.17 | ) | | | — | |
2020 | | | 12.52 | | | | 0.18 | | | | (0.74 | ) | | | (0.56 | ) | | | (0.32 | ) | | | — | | | | (0.32 | ) | | | — | |
2019 | | | 13.60 | | | | 0.38 | | | | (1.17 | ) | | | (0.79 | ) | | | (0.26 | ) | | | (0.03 | ) | | | (0.29 | ) | | | — | (1) |
2018 | | | 13.90 | | | | 0.26 | | | | (0.37 | ) | | | (0.11 | ) | | | (0.19 | ) | | | — | | | | (0.19 | ) | | | — | (1) |
| † | Per share amounts calculated using average shares method. |
| (1) | Amount represents less than $0.01 per share. |
| (2) | The expense ratio includes a one-time adjustment as a result of a management change in accrual estimate relating to shareholder service fees. Had this adjustment been excluded, the ratios would have been 1.30%, 1.30% and 1.82%, respectively. |
Amounts designated as “—” are $0 or round to $0.
The accompanying notes are an integral part of the financial statements.
| | | | | | |
| | | |
| 24 | | Causeway International Opportunities Fund | | | | |
| | | | | | | | | | | | | | | | | | | | | | | | | | |
Net Asset
Value, End
of Year ($) | | | Total
Return (%) | | | Net Assets,
End of
Year
($000) | | | Ratio of
Expenses to
Average Net
Assets (%) | | | Ratio of
Expenses
to Average
Net Assets
(Excluding
Waivers and
Reimburse-
ments) (%) | | | Ratio
of Net
Investment
Income
to Average
Net Assets (%) | | | Portfolio
Turnover
Rate (%) | |
| | | | | | | | | | | | | | | | | | | | | | | | | | |
| | | | | | | | | | | | | | | | | | | | | | | | | | |
| | 11.22 | | | | (25.18 | ) | | | 151,612 | | | | 0.95 | | | | 0.97 | | | | 2.30 | | | | 60 | |
| | 15.24 | | | | 31.61 | | | | 264,723 | | | | 0.95 | | | | 0.99 | | | | 1.67 | | | | 45 | |
| | 11.74 | | | | (4.52 | ) | | | 173,273 | | | | 0.95 | | | | 1.02 | | | | 1.71 | | | | 55 | |
| | 12.61 | | | | (5.43 | ) | | | 182,720 | | | | 1.05 | | | | 1.06 | | | | 3.25 | | | | 43 | |
| | 13.71 | | | | (0.61 | ) | | | 163,508 | | | | 1.05 | | | | 1.05 | | | | 2.17 | | | | 35 | |
| | | | | | | | | | | | | | | | | | | | | | | | | | |
| | 11.12 | | | | (25.37 | ) | | | 14,745 | | | | 1.20 | | | | 1.22 | | | | 2.14 | | | | 60 | |
| | 15.11 | | | | 31.36 | | | | 18,778 | | | | 1.20 | | | | 1.24 | | | | 1.43 | | | | 45 | |
| | 11.64 | | | | (4.84 | ) | | | 11,488 | | | | 1.19 | | | | 1.26 | | | | 1.55 | | | | 55 | |
| | 12.52 | | | | (5.59 | ) | | | 10,204 | | | | 1.30 | | | | 1.31 | | | | 3.02 | | | | 43 | |
| | 13.60 | | | | (0.85 | ) | | | 9,329 | | | | 1.27 | (2) | | | 1.27 | (2) | | | 1.86 | (2) | | | 35 | |
The accompanying notes are an integral part of the financial statements.
| | | | | | |
| | | |
| | Causeway International Opportunities Fund | | | 25 | |
NOTES TO FINANCIAL STATEMENTS
Causeway International Opportunities Fund (the“Fund”) is a series of Causeway Capital Management Trust (the “Trust”). The Trust is an open-end management investment company registered under the Investment Company Act of 1940, as amended (the “1940 Act”) and is a Delaware statutory trust that was established on August 10, 2001. The Fund began operations on December 31, 2009. The Fund is authorized to offer two classes of shares, the Institutional Class and the Investor Class. The Declaration of Trust authorizes the issuance of an unlimited number of shares of beneficial interest of the Fund. The Fund is diversified. The Fund’s prospectus provides a description of the Fund’s investment objectives, policies and strategies. As of September 30, 2022, the Trust has five additional series, the financial statements of which are presented separately.
| 2. | | Significant Accounting Policies |
The following is a summary of the significant accounting policies consistently followed by the Fund.
Use of Estimates in the Preparation of Financial Statements – The Fund is an investment company that applies the accounting and reporting guidance issued in Topic 946 by the U.S. Financial Accounting Standards Board. The Fund’s financial statements have been prepared to comply with U.S. generally accepted accounting principles (“U.S. GAAP”). The preparation of financial statements in conformity with U.S. GAAP requires management to make estimates and assumptions that affect the reported amount of net assets and liabilities and disclosure of contingent assets and liabilities at the date of the financial statements and the reported amounts of increases and decreases in net assets from operations during the reporting period. Actual results could differ from those estimates.
Security Valuation – Except as described below, securities listed on a securities exchange (except the NASDAQ Stock Market (“NASDAQ”)) or Over-the-Counter (“OTC”) for which market quotations are available are valued at the last reported sale price as of the close of trading on each business day, or, if there is no such reported sale, at the last reported bid price for long positions. For securities traded on NASDAQ, the NASDAQ Official Closing Price is used. Securities listed on multiple exchanges or OTC markets are valued on the exchange or OTC market considered by the Fund to be the primary market. The prices for foreign securities are reported in local currency and converted to U.S. dollars using currency exchange rates. Prices for most securities held in the Fund are provided daily by recognized independent pricing agents. If a security price cannot be obtained from an independent pricing agent, the Fund seeks to obtain a bid price from at least one independent broker. Investments in money market funds are valued daily at the net asset value per share.
Securities for which market prices are not “readily available” are valued in accordance with fair value pricing procedures approved by the Fund’s Board of Trustees (the “Board”). The Fund’s fair value pricing procedures are overseen by the Fund’s valuation designee, Causeway Capital Management LLC (“Adviser”), and implemented through a Fair Value Committee (the “Committee”). Some of the more common reasons that may necessitate that a security be valued using fair value pricing procedures include: the security’s trading has been halted or suspended; the security has been delisted from a national exchange; the security’s primary trading market is temporarily closed at a time when under normal conditions it would be open; or the security’s primary pricing source is not able or willing to provide a price. When the Committee values a security in accordance with the fair value pricing procedures, the Committee will
| | | | | | |
| | | |
| 26 | | Causeway International Opportunities Fund | | | | |
NOTES TO FINANCIAL STATEMENTS
(continued)
determine the value after taking into consideration relevant information reasonably available to the Committee.
The Fund uses a third party vendor to fair value certain non-U.S. securities if there is a movement in the U.S. market that exceeds thresholds established by the Committee. The vendor provides fair values for foreign securities based on factors and methodologies involving, generally, tracking valuation correlations between the U.S. market and each non-U.S. security and such fair values are applied by the administrator if a pre-determined confidence level is reached for the security.
In accordance with the authoritative guidance on fair value measurements and disclosure under U.S. GAAP, the Fund discloses fair value of its investments in a hierarchy that prioritizes the inputs to valuation techniques used to measure the fair value. The objective of a fair value measurement is to determine the price that would be received to sell an asset or paid to transfer a liability in an orderly transaction between market participants at the measurement date (an exit price). Accordingly, the fair value hierarchy gives the highest priority to quoted prices (unadjusted) in active markets for identical assets or liabilities (Level 1) and the lowest priority to unobservable inputs (Level 3). The guidance establishes three levels of fair value hierarchy as follows:
| | • | | Level 1 — Unadjusted quoted prices in active markets for identical, unrestricted assets or liabilities that the Fund has the ability to access at the measurement date; |
| | • | | Level 2 — Quoted prices for similar assets or liabilities in active markets, quoted prices for identical or similar assets or liabilities in markets which are not active, or prices based on inputs that are observable (either directly or indirectly); and |
| | • | | Level 3 — Prices, inputs or exotic modeling techniques which are both significant to the fair value |
| | | measurement and unobservable (supported by little or no market activity). |
Investments are classified within the level of the lowest significant input considered in determining fair value. Investments classified within Level 3 which fair value measurement considers several inputs may include Level 1 or Level 2 inputs as components of the overall fair value measurement.
Changes in valuation techniques may result in transfers in or out of an investment’s assigned level within the hierarchy during the reporting period. Changes in the classification between Levels 1 and 2 occur primarily when foreign equity securities are fair valued by the Fund’s third party vendor using other observable market–based inputs in place of closing exchange prices due to events occurring after foreign market closures or when foreign markets are closed, and/or when adjustments are made to security values for “foreign line” securities using “local line” prices. Due to currency and ownership restrictions on foreign persons in certain countries, including without limitation Russia and Thailand, securities sometimes trade via a “foreign line”(designated for foreign ownership) and via a “local line” (shares traded locally and held by residents). Liquidity of shares held in the foreign line is often more limited than the local line. As the last traded price of a foreign line may not represent fair value, if the securities can readily be traded through a broker to access the local line, the securities may be priced using the last traded local line price.
As of and during the fiscal year ended September 30, 2022, there were no changes to the Fund’s fair value methodologies other than related to compliance with Rule 2a-5 under the 1940 Act.
| | | | | | |
| | | |
| | Causeway International Opportunities Fund | | | 27 | |
NOTES TO FINANCIAL STATEMENTS
(continued)
Federal Income Taxes – The Fund intends to continue to qualify as a regulated investment company under Subchapter M of the Internal Revenue Code and to distribute substantially all of its taxable income. Accordingly, no provision for Federal income taxes has been made in the financial statements.
The Fund evaluates tax positions taken or expected to be taken in the course of preparing the Fund’s tax returns to determine whether it is “more-likely-than-not” (i.e., greater than 50-percent) that each tax position will be sustained upon examination by a taxing authority based on the technical merits of the position. Tax positions not deemed to meet the “more-likely-than-not” threshold are recorded as a tax benefit or expense in the current year. The Fund did not record any tax provision in the current period. However, management’s conclusions regarding tax positions taken may be subject to review and adjustment at a later date based on factors including, but not limited to, examination by tax authorities (i.e., the last 3 tax years, as applicable), and on-going analysis of and changes to tax laws, regulations and interpretations thereof.
As of and during the fiscal year ended September 30, 2022, the Fund did not have a liability for any
unrecognized tax benefits. The Fund recognizes interest and penalties, if any, related to unrecognized tax benefits as income tax expense in the Statement of Operations. During the fiscal year, the Fund did not incur any significant interest or penalties.
The Fund files withholding tax reclaims in certain jurisdictions to recover a portion of amounts previously withheld. The Fund may record a reclaim receivable based on collectability, which includes factors such as the jurisdiction’s applicable laws, payment history and market convention. The Statement of Operations includes tax reclaims recorded as well as professional
and other fees, if any, associated with recovery of foreign withholding taxes.
Security Transactions and Related Income – Security transactions are accounted for on the date the security is purchased or sold (trade date). Dividend income is recognized on the ex-dividend date, and interest income is recognized using the accrual basis of accounting. Costs used in determining realized gains and losses on the sales of investment securities are those of the specific securities sold.
Foreign Currency Translation – The books and records of the Fund are maintained in U.S. dollars on the following basis:
(1) the market value or fair value of investment securities, assets and liabilities is converted at the current rate of exchange; and
(2) purchases and sales of investment securities, income and expenses are converted at the relevant rates of exchange prevailing on the respective dates of such transactions.
The Fund does not isolate that portion of gains and losses on investments in equity securities that is due to changes in the foreign exchange rates from that which is due to changes in market prices of equity securities.
Foreign Currency Exchange Contracts – When the Fund purchases or sells foreign securities, it enters into corresponding foreign currency exchange contracts to settle the securities transactions. Losses from these foreign exchange transactions may arise from changes in the value of the foreign currency between trade date and settlement date or if the counterparties do not perform under the contract’s terms.
Expense/Classes – Expenses that are directly related to one Fund of the Trust are charged directly to that Fund.
| | | | | | |
| | | |
| 28 | | Causeway International Opportunities Fund | | | | |
NOTES TO FINANCIAL STATEMENTS
(continued)
Other operating expenses of the Trust are prorated to the Fund and the other series of the Trust on the basis of relative daily net assets. Expenses of the Shareholder Service Plan and Agreement for the Investor Class are borne by that class of shares. Income, realized and unrealized gains (losses) and non-class specific expenses are allocated to the respective classes on the basis of relative daily net assets.
Dividends and Distributions – Dividends from net investment income, if any, are declared and paid on an annual basis. Any net realized capital gains on sales of securities are distributed to shareholders at least annually.
Cash – Idle cash may be swept into various time deposit accounts and is classified as cash on the Statement of Assets and Liabilities. The Fund maintains cash in bank deposit accounts which, at times, may exceed United States federally insured limits. Amounts invested and earned income are available on the same business day.
Other – Brokerage commission recapture payments are credited to realized capital gains and are included in net realized gains from security transactions on the Statement of Operations. For the fiscal year ended September 30, 2022, the Fund received commission recapture payments of $1,574.
| 3. | | Investment Advisory, Administration, Shareholder Service and Distribution Agreements |
The Trust, on behalf of the Fund, has entered into an Investment Advisory Agreement (the “Advisory Agreement”) with the Adviser. Under the Advisory Agreement, the Adviser is entitled to a monthly fee equal to an annual rate of 0.80% of the Fund’s average daily net assets. Effective July 1, 2022, the Adviser has contractually agreed through January 31, 2024 to waive its fee and, to the extent necessary, reimburse the Fund
to keep total annual fund operating expenses (excluding brokerage fees and commissions, interest, taxes, shareholder service fees, fees and expenses of other funds in which the Fund invests, tax reclaim-related fees and expenses, and extraordinary expenses) from exceeding 0.95% of Institutional Class and Investor Class average daily net assets. Prior to July 1, 2022, the Adviser had contractually agreed through January 31, 2023 to waive its fee and, to the extent necessary, reimburse the Fund to keep total annual fund operating expenses (excluding brokerage fees and commissions, interest, taxes, shareholder service fees, fees and expenses of other funds in which the Fund invests, and extraordinary expenses) from exceeding 0.85% of Institutional Class and Investor Class average daily net assets. For the fiscal year ended September 30, 2022, the Adviser waived $48,737 of its advisory fee. The expense waivers and reimbursements are not subject to recapture.
The Trust and SEI Investments Global Funds Services (the “Administrator”) have entered into an Administration Agreement. Under the terms of the Administration Agreement, the Administrator is entitled to an annual fee which is calculated daily and paid monthly based on the aggregate average daily net assets of the Trust subject to a minimum annual fee.
The Trust has adopted a Shareholder Service Plan and Agreement for Investor Class shares that allows the Trust to pay broker-dealers and other financial intermediaries a fee of up to 0.25% per annum of average daily net assets for services provided to Investor Class shareholders. For the fiscal year ended September 30, 2022, the Investor Class paid 0.25% annualized of average daily net assets under this plan.
The Trust and SEI Investments Distribution Co. (the “Distributor”) have entered into a Distribution Agreement. The Distributor receives no fees from the Fund for its distribution services under this agreement.
| | | | | | |
| | | |
| | Causeway International Opportunities Fund | | | 29 | |
NOTES TO FINANCIAL STATEMENTS
(continued)
The officers of the Trust are also officers or employees of the Administrator or Adviser. They receive no fees for serving as officers of the Trust.
As of September 30, 2022, approximately $238 (000) of the Fund’s net assets were held by investors affiliated with the Adviser.
| 4. | | Investment Transactions |
The cost of security purchases and the proceeds from the sales of securities, other than short-term investments, during the fiscal year ended September 30, 2022, for the Fund were as follows (000):
| | | | | | |
| Purchases | | | Sales | |
| $ | 146,780 | | | $ | 188,122 | |
| 5. | | Risks of Foreign Investing |
Because the Fund invests most of its assets in foreign securities, the Fund is subject to additional risks. For example, the value of the Fund’s securities may be affected by social, political and economic developments and U.S. and foreign laws relating to foreign investments. Further, because the Fund invests in securities denominated in foreign currencies, the Fund’s securities may go down in value depending on foreign exchange rates. Other risks include trading, settlement, custodial, and other operational risks; withholding or other taxes; and the less stringent investor protection and disclosure standards of some foreign markets. All of these factors can make foreign securities less liquid, more volatile and harder to value than U.S. securities. These risks are higher for emerging markets investments.
Global economies are increasingly interconnected, and political, economic and other conditions and events (including, but not limited to, natural disasters, pandemics, epidemics, wars, and social unrest) in one country or region might adversely impact a different
country or region. Furthermore, the occurrence of severe weather or geological events, fires, floods, earthquakes, climate change or other natural or man-made disasters, outbreaks of disease, epidemics and pandemics, malicious acts, cyber-attacks or terrorist acts, among other events, could adversely impact the performance of the Fund. These events may result in, among other consequences, closing borders, exchange closures, health screenings, healthcare service delays, quarantines, cancellations, supply chain disruptions, lower consumer demand, market volatility and general uncertainty. These events could adversely impact issuers, markets and economies over the short- and long-term, including in ways that cannot necessarily be foreseen. The Fund could be negatively impacted if the value of a portfolio holding were harmed by political or economic conditions or events. Moreover, negative political and economic conditions and events could disrupt the processes necessary for the Fund’s operations.
For example, global financial markets have experienced and may continue to experience significant volatility resulting from the spread of COVID-19. The COVID-19 pandemic has resulted in travel and border restrictions, quarantines, supply chain disruptions, labor restrictions, lower consumer demand and general market uncertainty. The effects of COVID-19, including new variants, have and may continue to adversely affect the global economy, the economies of certain nations and individual issuers, all of which may negatively impact the Fund. Similar consequences could arise as a result of the spread of other infectious diseases.
| 6. | | Federal Tax Information |
The Fund is classified as a separate taxable entity for Federal income tax purposes. The Fund intends to continue to qualify as a separate “regulated investment
| | | | | | |
| | | |
| 30 | | Causeway International Opportunities Fund | | | | |
NOTES TO FINANCIAL STATEMENTS
(continued)
company” under Subchapter M of the Internal Revenue Code and make the requisite distributions to shareholders that will be sufficient to relieve it from Federal income tax and Federal excise tax. Therefore, no Federal tax provision is required. To the extent that dividends from net investment income and distributions from net realized capital gains exceed amounts reported in the financial statements, such amounts are reported separately.
The Fund may be subject to taxes imposed by countries in which it invests in issuers existing or operating in such countries. Such taxes are generally based on income earned. The Fund accrues such taxes when the related income is earned. Dividend and interest income is recorded net of non-U.S. taxes paid. Gains realized by the Fund on the sale of securities in certain countries are subject to non-U.S. taxes. Expected capital gains taxes on appreciated securities, if any, are accrued as unrealized losses and incurred capital gains taxes are reflected as realized losses upon the sale of the related security. The Fund records a liability based on unrealized gains to provide for potential non-U.S. taxes payable upon the sale of these securities.
The amounts of distributions from net investment income and net realized capital gains are determined in accordance with Federal income tax regulations, which may differ from those amounts determined under U.S. GAAP. These book/tax differences are either temporary or permanent in nature. The character of distributions made during the year from net investment income or net realized gains, and the timing of distributions made during the year may differ from those during the year that the income or realized gains (losses) were recorded by the Fund. To the extent these differences are permanent, adjustments are made to the appropriate equity accounts in the period that the differences arise.
During the year ended September 30, 2022, there were no permanent differences credited or charged to Paid-in Capital and Distributable Earnings.
The tax character of dividends and distributions declared during the fiscal years ended September 30, 2022 and September 30, 2021 was as follows (000):
| | | | | | | | |
| | | Ordinary
Income | | | Total | |
2022 | | $ | 4,426 | | | $ | 4,426 | |
2021 | | | 3,149 | | | | 3,149 | |
As of September 30, 2022, the components of distributable earnings (accumulated losses) on a tax basis were as follows (000):
| | | | |
Undistributed Ordinary Income | | $ | 5,108 | |
Capital Loss Carryforwards | | | (257 | ) |
Unrealized Depreciation | | | (51,186 | ) |
| | | | |
Total Accumulated Losses | | $ | (46,335 | ) |
| | | | |
The Fund is permitted to carry forward capital losses for an unlimited period. Capital losses that are carried forward will retain their character as either short-term or long-term capital losses. Losses carried forward are as follows (000):
| | | | | | | | |
Short-Term Loss | | Long-Term Loss | | | Total | |
| $ 257 | | $ | — | | | $ | 257 | |
For the fiscal year ended September 30, 2022, the Fund utilized $1,612 (000) of long term capital loss carryforwards.
At September 30, 2022, the total cost of investments for Federal income tax purposes and the aggregate gross unrealized appreciation and depreciation on investments for the Fund were as follows (000):
| | | | | | | | | | | | | | |
Federal Tax
Cost | | | Appreciated
Securities | | | Depreciated
Securities | | | Net Unrealized
Depreciation | |
| $ | 216,684 | | | $ | 1,667 | | | $ | (52,741 | ) | | $ | (51,074 | ) |
| | | | | | |
| | | |
| | Causeway International Opportunities Fund | | | 31 | |
NOTES TO FINANCIAL STATEMENTS
(continued)
| 7. | | Capital Shares Issued and Redeemed (000) |
| | | | | | | | | | | | | | | | |
| | | Fiscal Year Ended
September 30, 2022 | | | Fiscal Year Ended
September 30, 2021 | |
| | | Shares | | | | Value | | | | Shares | | | | Value | |
Institutional Class | | | | | | | | | | | | | | | | |
Shares Sold | | | 1,638 | | | | $22,911 | | | | 3,113 | | | | $46,932 | |
Shares Issued in Reinvestment of
Dividends and Distributions | | | 253 | | | | 3,713 | | | | 188 | | | | 2,678 | |
Shares Redeemed | | | (5,750) | | | | (76,069) | | | | (690) | | | | (10,154) | |
| | | | | | | | | | | | | | | | |
Increase (Decrease) in Shares Outstanding
Derived from Institutional Class Transactions | | | (3,859) | | | | (49,445) | | | | 2,611 | | | | 39,456 | |
| | | | | | | | | | | | | | | | |
Investor Class | | | | | | | | | | | | | | | | |
Shares Sold | | | 374 | | | | 5,422 | | | | 376 | | | | 5,674 | |
Shares Issued in Reinvestment of
Dividends and Distributions | | | 18 | | | | 266 | | | | 12 | | | | 169 | |
Shares Redeemed | | | (309) | | | | (3,943) | | | | (132) | | | | (1,902) | |
| | | | | | | | | | | | | | | | |
Increase in Shares Outstanding
Derived from Investor Class Transactions | | | 83 | | | | 1,745 | | | | 256 | | | | 3,941 | |
| | | | | | | | | | | | | | | | |
Net Increase (Decrease) in Shares Outstanding from
Capital Share Transactions | | | (3,776) | | | | $(47,700) | | | | 2,867 | | | | $43,397 | |
| | | | | | | | | | | | | | | | |
| 8. | | Significant Shareholder Concentration |
As of September 30, 2022, five of the Fund’s shareholders of record owned 83% of the Institutional Class shares. The Fund may be adversely affected when a shareholder purchases or redeems large amounts of shares, which may impact the Fund in the same manner as a high volume of redemption requests. Such large shareholders may include, but are not limited to, institutional investors and asset allocators who make investment decisions on behalf of underlying clients. Significant shareholder purchases and redemptions may adversely impact the Fund’s portfolio management and may cause the Fund to make investment decisions at inopportune times or prices or miss attractive investment opportunities. Such transactions may also increase the Fund’s transaction costs, accelerate the realization of taxable income if sales of securities result in gains, or
otherwise cause the Fund to perform differently than intended.
Under the Trust’s organizational documents, each Trustee, officer, employee or other agent of the Trust is indemnified against certain liabilities that may arise out of the performance of his or her duties to the Fund. Additionally, in the normal course of business, the Fund enters into contracts, including the Fund’s servicing agreements that contain a variety of indemnification clauses. The Fund’s maximum exposure under these arrangements is unknown as this would involve future claims that may be made against the Fund that have not yet occurred. The risk of material loss as a result of such indemnification claims is considered remote.
| | | | | | |
| | | |
| 32 | | Causeway International Opportunities Fund | | | | |
NOTES TO FINANCIAL STATEMENTS
(concluded)
The Fund, along with certain other series of the Trust, is party to an agreement which enables it to participate in a $10 million secured committed revolving line of credit with The Bank of New York Mellon which expires February 15, 2023. The proceeds from the borrowings, if any, are used to finance the Fund’s short-term general working capital requirements, including the funding of shareholder redemptions. Interest, if any, is charged to the Fund based on its borrowings during the period at the applicable rate plus 1.5%. The Fund is also charged a portion of a commitment fee of 0.20% per annum. As of September 30, 2022, there were no borrowings outstanding under the line of credit.
The Fund has evaluated the need for disclosures and/or adjustments resulting from subsequent events through the date the financial statements were issued. Based on this evaluation, no disclosures and/or adjustments were required to the financial statements.
| | | | | | |
| | | |
| | Causeway International Opportunities Fund | | | 33 | |
REPORT OF INDEPENDENT REGISTERED PUBLIC ACCOUNTING FIRM
To the Board of Trustees of Causeway Capital Management Trust and Shareholders of the Causeway International Opportunities Fund
Opinion on the Financial Statements
We have audited the accompanying statement of assets and liabilities, including the schedule of investments, of Causeway International Opportunities Fund (one of the funds constituting Causeway Capital Management Trust, referred to hereafter as the “Fund”) as of September 30, 2022, the related statement of operations for the year ended September 30, 2022, the statement of changes in net assets for each of the two years in the period ended September 30, 2022, including the related notes, and the financial highlights for each of the five years in the period ended September 30, 2022 (collectively referred to as the “financial statements”). In our opinion, the financial statements present fairly, in all material respects, the financial position of the Fund as of September 30, 2022, the results of its operations for the year then ended, the changes in its net assets for each of the two years in the period ended September 30, 2022 and the financial highlights for each of the five years in the period ended September 30, 2022 in conformity with accounting principles generally accepted in the United States of America.
Basis for Opinion
These financial statements are the responsibility of the Fund’s management. Our responsibility is to express an opinion on the Fund’s financial statements based on our audits. We are a public accounting firm registered with the Public Company Accounting Oversight Board (United States) (PCAOB) and are required to be independent with respect to the Fund in accordance with the U.S. federal securities laws and the applicable rules and regulations of the Securities and Exchange Commission and the PCAOB.
We conducted our audits of these financial statements in accordance with the standards of the PCAOB. Those standards require that we plan and perform the audit to obtain reasonable assurance about whether the financial statements are free of material misstatement, whether due to error or fraud.
Our audits included performing procedures to assess the risks of material misstatement of the financial statements, whether due to error or fraud, and performing procedures that respond to those risks. Such procedures included examining, on a test basis, evidence regarding the amounts and disclosures in the financial statements. Our audits also included evaluating the accounting principles used and significant estimates made by management, as well as evaluating the overall presentation of the financial statements. Our procedures included confirmation of securities owned as of September 30, 2022 by correspondence with the custodian and brokers; when replies were not received from brokers, we performed other auditing procedures. We believe that our audits provide a reasonable basis for our opinion.
/s/ PricewaterhouseCoopers LLP
Los Angeles, California
November 28, 2022
We have served as the auditor of one or more investment companies in Causeway Capital Management Investment Company Complex since 2001.
| | | | | | |
| | | |
| 34 | | Causeway International Opportunities Fund | | | | |
NOTICE TO SHAREHOLDERS (Unaudited)
The information set forth below is for the Fund’s fiscal year as required by federal laws. Shareholders, however, must report distributions on a calendar year basis for income tax purposes, which may include distributions for portions of two fiscal years of the Fund. Accordingly, the information needed by shareholders for income tax purposes will be sent to them in early 2023. Please consult your tax adviser for proper treatment of this information.
For the fiscal year ended September 30, 2022, the Fund is designating the following items with regard to distributions paid during the year:
| | | | | | | | | | | | | | | | | | |
| (A) | | | (B) | | | (C) | | | (D) | | | (E) | |
| | | | |
Long Term Capital Gains Distributions (Tax Basis) | | | Ordinary
Income
Distributions
(Tax Basis) | | | Tax Exempt
Distributions
(Tax Basis) | | | Total
Distributions
(Tax Basis) | | | Dividends (1)
for Corporate
Dividends Received
Deduction
(Tax Basis) | |
| | 0.00% | | | | 100.00% | | | | 0.00% | | | | 100.00% | | | | 0.10% | |
| | | | |
| (F) | | | (G) | | | (H) | | | (I) | | | | |
| | | | |
Qualified Dividend Income | | | Interest
Related
Dividends | | | Qualified
Short-Term
Capital Gain
Dividends | | | Qualified
Foreign Tax
Credit Pass
Through | | | | |
| | 100.00% | | | | 0.07% | | | | 0.00% | | | | 15.91% | | | | | |
| (1) | Qualified Dividends represent dividends which qualify for the corporate dividends received deduction. |
Items (A), (B), (C) and (D) are based on a percentage of the Fund’s total distribution including pass-through as foreign tax credit.
Item (E) is based on a percentage of ordinary income distributions of the Fund.
Item (F) represents the amount of “Qualified Dividend Income” as defined in the Jobs and Growth Tax Relief Reconciliation Act of 2003 and is reflected as a percentage of “Ordinary Income Distributions.” It is the Fund’s intention to designate the maximum amount permitted by the law up to 100%.
Item (G) is the amount of “Interest Related Dividends” as created by the American Jobs Creation Act of 2004 and is reflected as a percentage of net investment income distributions that is exempt from U.S. withholding tax when paid to foreign investors.
Item (H) is the amount of “Qualified Short-Term Capital Gain Dividends” as created by the American Jobs Creation Act of 2004 and is reflected as a percentage of short-term capital gain distributions that is exempt from U.S. withholding tax when paid to foreign investors.
Item (I) is the amount of “Qualifying Foreign Taxes” as a percentage of ordinary distribution during the fiscal year ended September 30, 2022. The Fund accrued Foreign taxes during the fiscal year ended September 30, 2022, amounted to $837,286 and are expected to be passed through to shareholders as foreign tax credits on Form 1099 – Dividend for the year ended December 31, 2022. In addition, for the fiscal year ended September 30, 2022, gross income derived from sources within foreign countries amounted to $6,524,137 for the Fund.
| | | | | | |
| | | |
| | Causeway International Opportunities Fund | | | 35 | |
TRUSTEES AND OFFICERS INFORMATION (Unaudited)
Information pertaining to the Trustees and Officers of the Trust is set forth below. Trustees who are not deemed to be “interested persons” of the Trust as defined in the 1940 Act are referred to as “Independent Trustees.” The Trust’s Statement of Additional Information (“SAI”) includes additional information about the Trustees and Officers. The SAI may be obtained without charge by calling 1-866-947-7000.
| | | | | | | | | | |
Name Address, Age1 | | Position(s) Held with
the Company | | Term of Office and Length of Time Served2 | | Principal Occupation(s) During Past Five Years | | Number of Portfolios in Trust Complex Overseen by Trustee3 | | Other Directorships Held by Trustee4 |
INDEPENDENT TRUSTEES | | | | | | | | | | |
John R. Graham Age: 61 | | Trustee; Chairman of the Board since 1/19 | | Trustee since 10/08; Audit Chairman 4/13-12/18 | | Film Composer (since 2005); Senior Vice President, Corporate Financial Development and Communications, The Walt Disney Company (2004-2005); Senior Vice President, Mergers and Acquisitions, Lehman Brothers Inc. (2000-2004). | | 6 | | None |
| | | | | |
Lawry J. Meister Age: 60 | | Trustee | | Since 10/08 | | President, Steaven Jones Development Company, Inc. (real estate firm) (since 1995); President, Creative Office Properties (real estate firm)
(since 2012). | | 6 | | None |
| | | | | |
Victoria B. Rogers Age: 61 | | Trustee | | Since 4/13 | | President, Chief Executive Officer and Director, The Rose Hills Foundation (since 1996). | | 6 | | Director, TCW Funds, Inc. and TCW Strategic Income Fund, Inc. |
| | | | | |
Eric H. Sussman Age: 56 | | Trustee; Chairman of the Audit Committee since 1/19 | | Trustee since 9/01; Audit Chairman 10/04-4/12; Board Chairman 4/13-12/18 | | Adjunct Professor (since July 2017), Senior Lecturer (June 2011-July 2017) and Lecturer (1995-June 2011), Anderson Graduate School of Management, University of California, Los Angeles; President, Amber Capital, Inc. (real estate investment and financial planning firm) (since 1993); Managing Partner, Clear Capital, LLC (real estate investment firm)(since 2008). | | 6 | | None |
| | | | | | |
| | | |
| 36 | | Causeway International Opportunities Fund | | | | |
TRUSTEES AND OFFICERS INFORMATION (Unaudited)
(continued)
| | | | | | | | | | |
Name Address, Age1 | | Position(s) Held with the Company | | Term of Office and Length of Time Served2 | | Principal Occupation(s) During Past Five Years | | Number of Portfolios in Trust Complex Overseen by Trustee3 | | Other Directorships Held by Trustee4 |
OFFICERS | | | | | | | | | | |
Gracie V. Fermelia 11111 Santa Monica Blvd., 15th Floor Los Angeles, CA 90025 Age: 61 | | President | | Since 10/20 | | Chief Operating Officer and member of the Investment Adviser or the Investment Adviser’s parent (since 2001); Chief Compliance Officer of the Investment Adviser and the Trust (2005-2015). | | N/A | | N/A |
| | | | | |
Kurt J. Decko 11111 Santa Monica Blvd., 15th Floor Los Angeles, CA 90025 Age: 47 | | Chief Compliance Officer and Assistant Secretary | | Since 1/15 | | Chief Compliance Officer of the Investment Adviser (since January 2015); General Counsel of the Investment Adviser (since October 2020); member of the Investment Adviser’s parent (since 2021). | | N/A | | N/A |
| | | | | |
Eric Olsen5 One Freedom Valley Drive Oaks, PA 19456 Age: 52 | | Treasurer | | Since 3/21 | | Director, Fund Accounting, SEI Investments Global Funds Services (since 2021); Deputy Head of Fund Operations, Traditional Assets, Aberdeen Standard Investments (2013-2021). | | N/A | | N/A |
| | | | | |
Gretchen W. Corbell 11111 Santa Monica Blvd., 15th Floor Los Angeles, CA 90025 Age: 51 | | Secretary | | Since 10/11 | | Deputy General Counsel of the Investment Adviser (since 2022). Senior Attorney of the Investment Adviser (2004-2021). | | N/A | | N/A |
| | | | | |
Matthew M. Maher5 One Freedom Valley Drive Oaks, PA 19456 Age: 47 | | Vice President and Assistant Secretary | | Since 2/20 | | Corporate Counsel of the Administrator (since 2018). | | N/A | | N/A |
| | | | | |
Mindy Yu 11111 Santa Monica Blvd., 15th Floor Los Angeles, CA 90025 Age: 41 | | Anti-Money Laundering Compliance Officer | | Since 8/22 | | Deputy General Counsel of the Investment Adviser (since 2022). Senior Attorney of the Investment Adviser (2020-2021). Associate Attorney of the Investment Adviser (2012-2019). | | N/A | | N/A |
| | | | | | |
| | | |
| | Causeway International Opportunities Fund | | | 37 | |
TRUSTEES AND OFFICERS INFORMATION (Unaudited)
(concluded)
| 1 | Each Trustee may be contacted by writing to the Trustee c/o Causeway Capital Management Trust, One Freedom Valley Drive, Oaks, PA 19456. |
| 2 | Each Trustee holds office during the lifetime of the Trust or until his or her sooner resignation, retirement, removal, death or incapacity in accordance with the Trust’s Declaration of Trust. The president, treasurer, secretary and other officers each holds office at the pleasure of the Board of Trustees or until he or she sooner resigns in accordance with the Trust’s Bylaws. |
| 3 | The “Trust Complex” consists of all registered investment companies for which Causeway Capital Management LLC serves as investment adviser. As of September 30, 2022, the Trust Complex consisted of one investment company with six portfolios — International Value Fund, Emerging Markets Fund, Global Value Fund, International Opportunities Fund, International Small Cap Fund, and Concentrated Equity Fund. |
| 4 | Directorships of companies required to report to the Securities and Exchange Commission under the Securities Exchange Act of 1934 (i.e., “public companies”) or other investment companies registered under the 1940 Act. |
| 5 | These officers of the Trust also serve as officers of one or more mutual funds for which SEI Investments Company or an affiliate acts as investment manager, administrator or distributor. |
| | | | | | |
| | | |
| 38 | | Causeway International Opportunities Fund | | | | |
DISCLOSURE OF FUND EXPENSES (Unaudited)
As a shareholder of the Fund, you incur two types of costs: (1) transaction costs, including redemption fees, and (2) ongoing costs, including management fees, shareholder service fees, and other Fund expenses. It is important for you to understand the impact of these costs on your investment returns.
Ongoing operating expenses are deducted from a mutual fund’s gross income and directly reduce its final investment return. These expenses are expressed as a percentage of a mutual fund’s average net assets; this percentage is known as a mutual fund’s expense ratio.
The following examples use the expense ratio and are intended to help you understand the ongoing costs (in dollars) of investing in the Fund and to compare these costs with those of other mutual funds. The examples are based on an investment of $1,000 made at the beginning of the period shown and held for the entire period (April 1, 2022 to September 30, 2022).
The table on the next page illustrates the Fund’s costs in two ways:
Actual Fund Return. This section helps you to estimate the actual expenses after fee waivers that the Fund incurred over the period. The “Expenses Paid During Period” column shows the actual dollar expense cost incurred by a $1,000 investment in the Fund, and the “Ending Account Value” number is derived from deducting that expense cost from the Fund’s gross investment return.
You can use this information, together with the actual amount you invested in the Fund, to estimate the expenses you paid over that period. Simply divide your actual account value by $1,000 to arrive at a ratio (for example, an $8,600 account value divided by $1,000 = 8.6), then multiply that ratio by the number shown under “Expenses Paid During Period.”
Hypothetical 5% Return. This section helps you compare the Fund’s costs with those of other mutual funds. It assumes that the Fund had an annual 5% return before expenses during the year, but that the expense ratio (Column 3) for the period is unchanged. This example is useful in making comparisons because the Securities and Exchange Commission requires all mutual funds to make this 5% calculation. You can assess the Fund’s comparative cost by comparing the hypothetical result for the Fund in the “Expenses Paid During Period” column with those that appear in the same charts in the shareholder reports for other mutual funds.
NOTE: Because the return is set at 5% for comparison purposes — NOT the Fund’s actual return — the account values shown may not apply to your specific investment.
| | | | | | |
| | | |
| | Causeway International Opportunities Fund | | | 39 | |
DISCLOSURE OF FUND EXPENSES (Unaudited)
(concluded)
| | | | | | | | | | | | | | | | |
| | | Beginning
Account
Value
4/01/22 | | | Ending
Account
Value 9/30/22 | | | Annualized
Expense
Ratios | | | Expenses
Paid
During
Period* | |
Causeway International Opportunities Fund | | | | | | | | | | | | | |
| | | | |
Actual Fund Return | | | | | | | | | | | | | | | | |
Institutional Class | | $ | 1,000.00 | | | $ | 795.70 | | | | 0.95 | % | | $ | 4.28 | |
| | | | |
Hypothetical 5% Return | | | | | | | | | | | | | | | | |
Institutional Class | | $ | 1,000.00 | | | $ | 1,020.31 | | | | 0.95 | % | | $ | 4.81 | |
| | | | |
Actual Fund Return | | | | | | | | | | | | | | | | |
Investor Class | | $ | 1,000.00 | | | $ | 794.90 | | | | 1.20 | % | | $ | 5.40 | |
| | | | |
Hypothetical 5% Return | | | | | | | | | | | | | | | | |
| Investor Class | | $ | 1,000.00 | | | $ | 1,019.05 | | | | 1.20 | % | | $ | 6.07 | |
| * | Expenses are equal to the Fund’s annualized expense ratio multiplied by the average account value over the period, multiplied by 183/365 (to reflect the one-half year period shown). |
| | | | | | |
| | | |
| 40 | | Causeway International Opportunities Fund | | | | |
STATEMENT REGADING BASIS FOR RENEWAL OF INVESTMENT ADVISORY AGREEMENT (Unaudited)
At a meeting on August 8, 2022, the Trustees considered and approved the renewal of the investment advisory agreement (the “Advisory Agreement”) between Causeway Capital Management Trust (the “Trust”) and Causeway Capital Management LLC (the “Adviser”) with respect to Causeway International Opportunities Fund (the “Fund”) for a twelve-month period beginning September 20, 2022. Section 15(c) of the Investment Company Act of 1940, as amended (the “1940 Act”) requires the Board of Trustees (the “Board”) of the Trust annually to approve continuance of the Advisory Agreement. Continuance of the Advisory Agreement must be approved by a majority of the Trustees and a majority of the independent Trustees (i.e., Trustees who are not “interested persons” of the Trust as defined in the 1940 Act). The Board was comprised of four independent Trustees when the continuation of the Advisory Agreement was considered.
Information Received. At each regular quarterly meeting, the Board reviews a wide variety of materials relating to the nature, extent and quality of the Adviser’s services, including information concerning the Fund’s performance. In addition, at a special meeting on June 22, 2022, the Trustees received and reviewed extensive quantitative and qualitative materials prepared by the Adviser relating to the Advisory Agreement in response to information requested on the independent Trustees’ behalf by their independent legal counsel. At the June special meeting, the Trustees received and reviewed a report prepared by Broadridge Financial Solutions, Inc. providing comparative expense and performance information about the Fund to assist with the annual review of the Advisory Agreement. Following that meeting, the Trustees requested additional information, and received and reviewed further materials prepared by the Adviser relating to their consideration of the renewal of the Advisory Agreement at the August 8, 2022 meeting.
Factors Considered. In reviewing the Advisory Agreement, the Trustees considered a number of factors including, but not limited to: (1) the nature, extent and quality of the services provided by the Adviser, (2) the investment performance of the Fund, (3) comparisons of the services rendered and the amounts paid under the Advisory Agreement with those of other funds and those of the Adviser under other investment advisory agreements with other types of clients, (4) the costs of the services provided and estimated profits realized by the Adviser and its affiliates from their relationship with the Fund, (5) the extent to which economies of scale would be realized as the Fund grows and whether fee levels reflect these economies of scale for the benefit of Fund investors, and (6) any other benefits derived by the Adviser from its relationship with the Fund.
First, regarding the nature, extent and quality of the services provided by the Adviser, the Trustees considered, among other things, the Adviser’s personnel, experience, track record, and compliance program. The Trustees considered the qualifications, backgrounds and responsibilities of the Adviser’s principal personnel who provide services to the Fund, as well as the level of attention those individuals provide to the Fund. The Trustees noted the Adviser’s commitment to devoting resources to staffing and technology in support of its investment management services. They also reviewed the Adviser’s investment philosophy and processes and its compliance program, its various administrative, legal and regulatory responsibilities, and considered the scope of the Adviser’s services to the Fund. The Trustees concluded that the nature, extent and quality of the services provided by the Adviser should continue to benefit the Fund and its shareholders.
| | | | | | |
| | | |
| | Causeway International Opportunities Fund | | | 41 | |
STATEMENT REGADING BASIS FOR RENEWAL OF INVESTMENT ADVISORY AGREEMENT (Unaudited)
(continued)
Second, regarding the investment performance of the Fund, the Trustees reviewed the investment results of the Fund for various periods ended March 31, 2022, compared to the results of the MSCI ACWI ex USA Index (Gross), the median of the mutual funds included in the Morningstar Foreign Large Value category, and the median of the funds in a peer group selected by Broadridge. They noted that, consistent with Broadridge’s practice, the Broadridge 15(c) Report focused on one class of shares – the Institutional Class – and that Investor Class shares are subject to a 25 basis point shareholder service fee, which increases expenses and reduces performance from that shown. They noted that the Institutional Class had underperformed its Broadridge peer group median for the prior one-year and annualized three-year and ten-year periods, and outperformed its Broadridge peer group median for the annualized five-year period. The Trustees considered the Fund’s exposure to the value investment style, the impact of the COVID-19 pandemic, including ongoing lockdowns in certain jurisdictions, global uncertainties stemming from the invasion of Ukraine, and challenges for value investing relative to growth stock investing. Despite periods of relative underperformance, the Trustees concluded that the overall performance results and other considerations supported their view that the Adviser’s services to the Fund are of a high quality. The Trustees concluded that the Adviser’s record in managing the Fund in a manner consistent with the described investment strategy and style indicated that its continued management had the potential to benefit the Fund and its shareholders.
Third, regarding the Fund’s advisory fee and total expenses as a percentage of the Fund’s average daily net assets:
| | • | | The Trustees compared the Fund’s advisory fee and expenses with those of other similar mutual funds. They noted that the Fund’s advisory fee was 80 basis points per annum, the same as its Broadridge peer group median and within the range of 55-160 basis points for the funds in its peer group. The Trustees noted that the Fund’s Institutional Class annual expense ratio, after application of the Adviser’s expense limit, of 95 basis points was the same as the median of the funds in its Broadridge peer group and within the range of 70-192 basis points for the funds in its peer group. |
| | • | | The Trustees compared the Fund’s advisory fee with the fees charged by the Adviser to other clients. The Trustees noted that, although the fees paid by the Adviser’s other accounts were lower than the fee paid by the Fund, the differences appropriately reflected the Adviser’s significantly greater responsibilities with respect to the Fund and the risks of managing a sponsored fund, and are not determinative of whether the fees charged to the Fund are fair. The Trustees noted that the Adviser’s services to the Fund included the provision of many additional or more extensive administrative and shareholder services (such as services related to the Fund’s disclosure documents, financial statements, 1940 Act compliance policies and procedures, preparation of Board and committee materials and meetings, annual Board reports and certifications, oversight of daily valuation, oversight of Fund service providers, negotiation of Fund intermediary agreements, coordination with Fund intermediaries providing shareholder recordkeeping services, shareholder communications, and due diligence for advisers, consultants and institutional investors). |
| | | | | | |
| | | |
| 42 | | Causeway International Opportunities Fund | | | | |
STATEMENT REGADING BASIS FOR RENEWAL OF INVESTMENT ADVISORY AGREEMENT (Unaudited)
(concluded)
The Trustees concluded that the Fund’s advisory fee and expense ratio were reasonable and appropriate under the circumstances.
Fourth, the Trustees considered the Adviser’s costs of providing services to the Fund and estimated profits realized by the Adviser from its relationship with the Fund. They reviewed the Adviser’s estimated after-tax profit margin with respect to such services for the twelve months ended March 31, 2022 and the methodology used to generate that estimate, and noted that the cost allocation methodology presented to the Trustees was reasonable. They also observed that the Adviser’s estimated profitability was within the range cited as reasonable in various court decisions, even though it had increased from the prior year. After consideration of these matters, the Trustees concluded that the Adviser’s operating margin with respect to its relationship with the Fund was reasonable.
Fifth, regarding economies of scale, the Trustees observed that, although the Fund’s advisory fee schedule does not contain fee breakpoints, it is difficult to determine the existence or extent of any economies of scale. They noted that the Adviser is sharing economies of scale through reasonable advisory fee levels, expense limit agreements, and devoting additional resources to staff and technology to focus on continued performance and service to the Fund’s shareholders. They considered certain initiatives and noted that the Adviser continues to innovate and enhance its capabilities, and that innovation is a means of reinvesting in its services. They also noted the entrepreneurial risks taken by the Adviser in forming the Fund and that, in the Fund’s prior years, the Adviser incurred losses in managing the Fund. The Trustees concluded that under the circumstances the Adviser is sharing any economies of scale with the Fund appropriately.
Sixth, regarding any other benefits derived by the Adviser from its relationship with the Fund – often called “fall-out” benefits – the Trustees observed that the Adviser does not earn “fall-out” benefits such as affiliated custody fees, affiliated transfer agency fees, affiliated brokerage commissions, profits from rule 12b-1 fees, “contingent deferred sales commissions,” or “float” benefits on short-term cash. The Trustees concluded that the primary “fall-out” benefit received by the Adviser is research services provided by brokers used by the Fund and that this benefit is reasonable in relation to the value of the services that the Adviser provides to the Fund.
Approval. At the June 22, 2022 and August 8, 2022 meetings, the Trustees discussed the information and factors noted above with representatives of the Adviser and, at the August 8, 2022 meeting, the Trustees considered the approval of the Advisory Agreement. The independent Trustees also met in a private session at all meetings with independent counsel at which no representatives of the Adviser were present. In their deliberations, the independent Trustees did not identify any particular information or factor that was determinative or controlling, each Trustee did not necessarily attribute the same weight to each factor, and the foregoing summary does not detail all the matters considered. Based on their review, the Trustees (including the independent Trustees) unanimously concluded that the Advisory Agreement is fair and reasonable to the Fund and its shareholders and that the Fund’s advisory fee is reasonable and renewal of the Advisory Agreement is in the best interests of the Fund and its shareholders, and the Board of Trustees unanimously approved renewal of the Advisory Agreement for a twelve-month period beginning September 20, 2022.
| | | | | | |
| | | |
| | Causeway International Opportunities Fund | | | 43 | |
INVESTMENT ADVISER:
Causeway Capital Management LLC
11111 Santa Monica Boulevard
15th Floor
Los Angeles, CA 90025
DISTRIBUTOR:
SEI Investments Distribution Co.
One Freedom Valley Drive
Oaks, PA 19456
To determine if the Fund is an appropriate investment for you, carefully consider the Fund’s investment objectives, risk factors, charges and expenses before investing. Please read the summary or full prospectus carefully before you invest or send money. To obtain additional information including charges, expenses, investment objectives, or risk factors, or to open an account, call 1.866.947.7000, or visit us online at www.causewayfunds.com.
The Fund files its complete schedule of portfolio holdings with the Securities and Exchange Commission (“Commission”) for the first and third quarters of each fiscal year on Form N-PORT within sixty days after the end of the period. The Fund’s Forms N-PORT are available on the Commission’s website at http://www.sec.gov, and may be reviewed and copied at the Commission’s Public Reference Room in Washington, DC. Information on the operation of the Public Reference Room may be obtained by calling 1-800-SEC-0330.
A description of the policies and procedures that the Fund uses to determine how to vote proxies relating to portfolio securities, as well as information relating to how the Fund voted proxies relating to portfolio securities during the most recent 12-month period ended June 30, is available (i) without charge, upon request, by calling 1-866-947-7000; and (ii) on the Commission’s website at http://www. sec.gov.
CCM-AR-004-1300
The registrant has adopted a code of ethics that applies to the registrant’s principal executive officer, principal financial officer and principal accounting officer. During the fiscal year ended September 30, 2022, there were no material changes or waivers to the code of ethics.
| Item 3. | Audit Committee Financial Expert. |
(a)(1) The registrant’s board of trustees has determined that the registrant has at least one audit committee financial expert serving on the audit committee.
(a)(2) The audit committee financial experts are Eric Sussman, Lawry Meister, John Graham and Victoria B. Rogers. Each audit committee financial expert is “independent” as that term is defined in Form N-CSR Item 3(a)(2).
| Item 4. | Principal Accountant Fees and Services. |
Aggregate fees billed to the registrant for professional services rendered by the registrant’s principal accountant for the fiscal years ended September 30, 2022 and 2021 were as follows:
| | | | | | |
| | | 2022 | | 2021 |
(a) | | Audit Fees | | $288,580 | | $262,580 |
(b) | | Audit-Related Fees | | None | | None |
(c) | | Tax Fees(1) | | $64,080 | | $61,680 |
(d) | | All Other Fees | | None | | None |
Note:
| | (1) | Tax fees include amounts related to tax return and excise tax calculation reviews and foreign tax reclaim services. |
(e)(1) The registrant’s audit committee has adopted a charter that requires it to pre-approve the engagement of auditors to (i) audit the registrant’s financial statements, (ii) provide other audit or non-audit services to the registrant, or (iii) provide non-audit services to the registrant’s investment adviser if the engagement relates directly to the operations and financial reporting of the registrant.
(e)(2) No services included in paragraphs (b) through (d) of this Item were approved by the audit committee pursuant to paragraph (c)(7)(i)(C) of Rule 2-01 of Regulation S-X.
(f) Not applicable.
(g) For the fiscal year ended September 30, 2022, the aggregate non-audit fees billed by the registrant’s accountant for services rendered to the registrant and the registrant’s investment adviser were $735,331. For the fiscal year ended September 30, 2021, the aggregate non-audit fees billed by the registrant’s accountant for services rendered to the registrant and the registrant’s investment adviser were $691,495.
(h) The audit committee considered whether the provision of non-audit services rendered to the registrant’s investment adviser by the registrant’s principal accountant that were not pre-approved pursuant to paragraph (c)(7)(ii) of Rule 2-01 of Regulation S-X was compatible with maintaining the principal accountant’s independence.
(i) Not Applicable. The Registrant has not retained, for the preparation of the audit report on the financial statements included in the Form N-CSR, a registered public accounting firm that has a branch or office that is located in a foreign jurisdiction and that the Public Company Accounting Oversight Board (the “PCAOB”) has determined that the PCAOB is unable to inspect or investigate completely because of a position taken by an authority in the foreign jurisdiction.
(j) Not Applicable. The Registrant is not a “foreign issuer,” as defined in 17 CFR 240.3b-4.
| Item 5. | Audit Committee of Listed Registrants. |
Not applicable to open-end management investment companies.
| Item 6. | Schedule of Investments |
Schedule of Investments is included as part of the Report to Shareholders filed under Item 1 of this form.
| Item 7. | Disclosure of Proxy Voting Policies and Procedures for Closed-End Management Investment Companies. |
Not applicable to open-end management investment companies.
| Item 8. | Portfolio Managers of Closed-End Management Investment Companies |
Not applicable. Effective for closed-end management investment companies for fiscal years ending on or after December 31, 2005.
| Item 9. | Purchases of Equity Securities by Closed-End Management Investment Company and Affiliated Purchasers. |
Not applicable to open-end management investment companies.
| Item 10. | Submission of Matters to a Vote of Security Holders. |
There have been no material changes to the registrant’s procedures by which shareholders may recommend nominees to the registrant’s board of trustees during the period covered by the report.
| Item 11. | Controls and Procedures. |
(a) The registrant’s principal executive and principal financial officers, or persons performing similar functions, have concluded that the registrant’s disclosure controls and procedures, as defined in Rule 30a-3(c) under the Act (17 CFR§270.30a-3(c)) as of a date within 90 days of the filing date of the report, are effective based on the evaluation of these controls and procedures required by Rule 30a-3(b) under the Act (17 CFR §270.30a-3(b)) and Rules 13a-15(b) or 15d-15(b) under the Exchange Act (17 CFR §270.30a-15(b) or §240.15d-15(b)).
(b) There were no changes in the registrant’s internal control over financial reporting (as defined in Rule 30a-3(d) under the Act (17CFR §270.3a-3(d)) that occurred during the period covered by this report that have materially affected, or are reasonably likely to materially affect, the registrant’s internal control over financial reporting.
| Item 12. | Disclosure of Securities Lending Activities for Closed-End Management Investment Companies. |
Not applicable to open-end management investment companies.
(a)(1) Code of Ethics attached hereto.
(a)(2) Separate certifications for the principal executive officer and the principal financial officer of the registrant as required by Rule 30a-2(a) under the Investment Company Act of 1940, as amended (17 CFR §270.30a-2(a)) are filed herewith.
(b) Officer certifications as required by Rule 30a-2(b) under the Investment Company Act of 1940, as amended (17 CFR §270.30a-2(b)) also accompany this filing as an exhibit.
SIGNATURES
Pursuant to the requirements of the Securities Exchange Act of 1934 and the Investment Company Act of 1940, the registrant has duly caused this report to be signed on its behalf by the undersigned, thereunto duly authorized.
| | | | | | |
| (Registrant) | | | | | | Causeway Capital Management Trust |
| | | |
| By | | | | | | /s/ Gracie V. Fermelia |
| | | | | | Gracie V. Fermelia, President |
Date: December 9, 2022
Pursuant to the requirements of the Securities Exchange Act of 1934 and the Investment Company Act of 1940, this report has been signed below by the following persons on behalf of the registrant and in the capacities and on the dates indicated.
| | | | | | |
| By | | | | | | /s/ Gracie V. Fermelia |
| | | | | | Gracie V. Fermelia, President |
Date: December 9, 2022
| | | | | | |
| By | | | | | | /s/ Eric Olsen |
| | | | | | Eric Olsen, Treasurer |
Date: December 9, 2022