UNITED STATES
SECURITIES AND EXCHANGE COMMISSION
Washington, D.C. 20549
FORM N-CSR
CERTIFIED SHAREHOLDER REPORT OF REGISTERED
MANAGEMENT INVESTMENT COMPANIES
Investment Company Act File Number 811-10467
Causeway Capital Management Trust
(Exact name of registrant as specified in charter)
11111 Santa Monica Boulevard, 15th Floor
c/o Causeway Capital Management LLC
Los Angeles, CA 90025
(Address of principal executive offices) (Zip code)
The Corporation Trust Company
Corporation Trust Center
1209 Orange Street
Wilmington DE, 19801
(Name and address of agent for service)
Registrant’s telephone number, including area code: 1-866-947-7000
Date of fiscal year end: September 30, 2023
Date of reporting period: September 30, 2023
| Item 1. Reports | to Stockholders. |
(a) The registrant’s schedules as of the close of the reporting period, pursuant to Rule 30e-1 under the Investment Company Act of 1940, as amended (the “Act”) (17 CFR § 270.30e-1), are attached hereto.
L E T T E R T O S H A R E H O L D E R S
For the twelve months ended September 30, 2023, Causeway International Value Fund’s (the “Fund’s”) Institutional Class returned 42.26% and Investor Class returned 41.87% compared to the MSCI EAFE Index (Gross) (“Index”) return of 26.31%. Since the Fund’s inception on October 26, 2001, its average annual total returns are 6.92% for the Institutional Class and 6.67% for the Investor Class compared to the Index’s average annual total return of 5.90%. As of September 30, 2023, the Fund had net assets of $6.66 billion.
Performance Review
Global equity markets marched higher through the first portion of the fiscal year, fueled by lingering excesses of liquidity in the global financial system. But in recent months, “higher for longer” interest rates emerged as the dominant market theme, tempering investor enthusiasm and sending developed equity markets downwards. The world’s major central banks reduced liquidity and raised borrowing costs over the period, attempting to control inflation without jolting their economies into severe recessions. Thus far, the US economy has remained resilient, with low unemployment, high private consumption, and growing business investment. But the longer interest rates remain at or above current levels, the greater the risk of recession. European growth has weakened, and rising energy prices may already have pushed the region into recession. Europe is more exposed to China’s slowdown than the US. Sentiment is weak, and cautious consumers are accumulating personal savings. Both the Federal Reserve and the European Central Bank appear to have made enough progress combating inflation to be at or near the end of their rate-hiking cycles. In Japan, economic growth and inflation have risen, but the Bank of Japan has shown little inclination to abandon its negative policy rate. China is suffering from a distressed property market, weak exports, and high youth unemployment. Consumers remain downbeat, the government having failed to introduce comprehensive policies to boost their confidence. Geopolitical realignments are reshaping global trade and capital flows. With nearshoring, Mexico has become the largest trading partner of the US. Foreign direct investment between the US and China has declined sharply in recent years, as US investment dollars flow to Southeast Asia and Latin America. During the period, the best-performing country markets within the Index included Italy, Denmark, and Spain in local currency terms. The worst-performing country markets included Finland, Hong Kong, and Portugal. The top-performing sectors were financials, industrials, and consumer discretionary. The weakest-performing sectors were consumer staples, real estate, and communication services.
Fund holdings in the capital goods, banks, and software & services industry groups were the top contributors to the Fund’s performance relative to the Index. Holdings in the automobiles & components, household & personal products, and pharmaceuticals & biotechnology industry groups were the largest detractors from relative performance. The greatest stock-level contributors to absolute returns included jet engine manufacturer, Rolls-Royce Holdings PLC (United Kingdom), banking & financial services company, UniCredit SpA (Italy), and electric, gas & renewables power generation and distribution company, Enel Spa (Italy). The largest stock-level detractors from absolute returns included pharmaceuticals & biotechnology company, Roche Holding AG (Switzerland), beverage producer, Diageo PLC (United Kingdom), and luxury goods manufacturer, Kering SA (France).
Significant Portfolio Changes
The largest increases included energy majors, Shell PLC (United Kingdom) and BP PLC (United Kingdom), beverage producer, Diageo Plc (United Kingdom), insurer, Allianz SE (Germany), and luxury goods manufacturer, Kering SA (France). The largest decreases included jet engine manufacturer, Rolls-Royce Holdings Plc (United
| | | | | | |
| | | |
| 2 | | Causeway International Value Fund | | | | |
Kingdom), integrated resort developer & operator, Sands China Ltd. (Hong Kong), railway, Canadian National Railway Co (Canada), clothing company, Industria de Diseno Textil SA (Spain), and consumer goods company, Unilever PLC (United Kingdom).
Fund exposures to currencies, industries, and countries are largely a by-product of our bottom-up stock selection process. The Fund’s weights in the energy, food beverage & tobacco, and technology hardware & equipment industry groups were the largest increases during the period. The weights in the consumer services, pharmaceuticals biotechnology & life sciences, and transportation industry groups were the largest decreases. As of September 30, 2023, the three largest industry group exposures from an absolute perspective in the Fund were to pharmaceuticals biotechnology & life sciences, banks, and food beverage & tobacco. From a regional perspective, the most notable weight changes included higher allocations to the United Kingdom, Germany, and South Korea. The most significantly reduced country weights included Spain, Japan, and Hong Kong.
Investment Outlook
Causeway portfolio managers and analysts had an especially active period recently of international research travel, meeting with company managements across North America, Europe, and Asia. This outreach identified potential candidates for inclusion in client portfolios, and rigorous valuation analysis of these prospects is underway. Our fundamental research process can yield the most promising results in times of increasing investor caution. We continue to find areas of markets where investors may have underestimated medium-to-longer term earnings and cash flow. Concurrently, we seek ways to lower portfolio volatility. Recent portfolio additions include increased exposure to, in our view, attractively valued stocks in the energy and consumer staples sectors. The ongoing decline in US crude inventories is providing support to oil prices at current levels, and the valuations of certain European integrated energy companies appear compelling given prevailing oil prices. We believe that many of the consumer staples stocks we have identified through our bottom-up process offer above-market dividend yields, strong balance sheets, and less sensitivity to economic cycles than overall markets.
The “higher for longer” theme, coupled with uncertainty about the path of economic activity, will likely result in continued volatility in global equity markets. Causeway’s commitment to detailed and disciplined fundamental research aims to position the team well to identify mispriced securities in this dynamic environment on behalf of our clients.
We thank you for your continued confidence in Causeway International Value Fund.
September 30, 2023
| | | | |
 | |  | |  |
| Brian Woonhyung Cho | | Jonathan Eng | | Harry Hartford |
| Portfolio Manager | | Portfolio Manager | | Portfolio Manager |
| | | | | | |
| | | |
| | Causeway International Value Fund | | | 3 | |
| | | | |
 | |  | |  |
| Sarah Ketterer | | Ellen Lee | | Conor Muldoon |
| Portfolio Manager | | Portfolio Manager | | Portfolio Manager |
| | | | |
 | |  | | |
| Steven Nguyen | | Alessandro Valentini | | |
| Portfolio Manager | | Portfolio Manager | | |
The above commentary expresses the portfolio managers’ views as of the date shown and should not be relied upon by the reader as research or investment advice. These views are subject to change. There is no guarantee that any forecasts made will come to pass.
Holdings are subject to change. Current and future holdings are subject to risk. Securities mentioned do not make up the entire portfolio and, in the aggregate, may represent a small percentage of the portfolio.
Investing involves risk including loss of principal. In addition to the normal risks associated with investing, international investments may involve risk of capital loss from unfavorable fluctuation in currency values, from differences in generally accepted accounting principles or from economic or political instability in other nations. Emerging markets involve heightened risks related to the same factors as well as increased volatility and lower trading volume. Diversification does not prevent all investment losses.
A company may reduce or eliminate its dividend, causing losses to the Fund.
| | | | | | |
| | | |
| 4 | | Causeway International Value Fund | | | | |
Comparison of Change in the Value of a $10,000 Investment in Causeway International Value Fund, Investor Class shares versus the MSCI EAFE Index (Gross) as of September 30, 2023
| | | | | | | | | | | | | | | | | | | | |
| | | One Year
Return | | | Annualized
3 Year
Return | | | Annualized
5 Year
Return | | | Annualized
10 Year
Return | | | Annualized
Inception
to Date* | |
Institutional Class | | | 42.26% | | | | 14.46% | | | | 4.92% | | | | 4.15% | | | | 6.92% | |
Investor Class | | | 41.87% | | | | 14.21% | | | | 4.67% | | | | 3.91% | | | | 6.67% | |
MSCI EAFE Index (Gross) | | | 26.31% | | | | 6.28% | | | | 3.74% | | | | 4.32% | | | | 5.90% | |
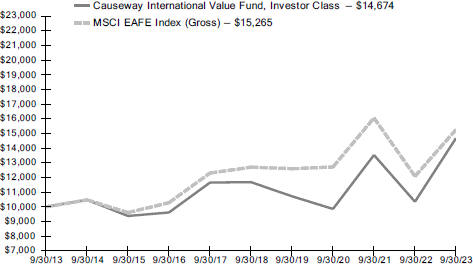
The performance in the above graph does not reflect the deduction of taxes a shareholder will pay on Fund distributions or the redemptions of Fund shares.
* Inception is October 26, 2001.
The performance data represents past performance and is not an indication of future results. Investment return and the principal value of an investment will fluctuate so that an investor’s shares, when redeemed, may be worth less than their original cost and current performance may be higher or lower than the performance quoted. For performance data current to the most recent month end, please call 1-866-947-7000 or visit www. causewayfunds.com. Investment performance reflects contractual fee waivers in effect during certain periods. In the absence of such fee waivers, total return would be reduced. The contractual expense limits are in effect until January 31, 2024. Total returns assume reinvestment of dividends and capital gains distributions at net asset value when paid. Investor Class shares pay a shareholder service fee of up to 0.25% per annum of average daily net assets. Institutional Class shares pay no shareholder service fee. Pursuant to the current January 27, 2023 prospectus, the Fund’s annualized gross ratios of expenses in relation to average net assets were 0.91% and 1.16% for the Institutional Class and Investor Class, respectively, and the Fund’s annualized ratios of expenses in relation to net assets after fee waivers and reimbursements were 0.88% and 1.13% for the Institutional Class and Investor Class, respectively. For more information, please see the prospectus.
The MSCI EAFE Index (Gross) (the “Index”) is a free float-adjusted market capitalization weighted index, designed to measure developed market equity performance excluding the U.S. and Canada, consisting of 21 stock markets in Europe, Australasia and the Far East. The Index is gross of withholding taxes and assumes reinvestment of dividends and capital gains, and does not reflect the payment of transaction costs, fees and expenses associated with an investment in the Fund. It is not possible to invest directly in an index. There are special risks in foreign investing (please see Note 5 in the Notes to Financial Statements).
MSCI has not approved, reviewed or produced this report, makes no express or implied warranties or representations, and is not liable whatsoever for any data in this report. You may not redistribute the MSCI data or use it as a basis for other indices or investment products.
| | | | | | |
| | | |
| | Causeway International Value Fund | | | 5 | |
S C H E D U L E O F I N V E S T M E N T S
September 30, 2023
| | | | | | | | |
| Causeway International Value Fund | | Number of Shares | | | Value (000) | |
| | | | | | | | |
| | |
COMMON STOCK | | | | | | | | |
| | |
Belgium — 1.4% | | | | | | | | |
Anheuser-Busch InBev S.A. | | | 1,696,999 | | | $ | 94,211 | |
| | | | | | | | |
| | |
Brazil — 0.6% | | | | | | | | |
Banco Bradesco SA ADR 1 | | | 14,567,068 | | | | 41,516 | |
| | | | | | | | |
| | |
Canada — 2.1% | | | | | | | | |
Alimentation Couche-Tard Inc. | | | 1,562,497 | | | | 79,353 | |
Canadian Pacific Kansas City Ltd. | | | 848,716 | | | | 63,086 | |
| | | | | | | | |
| | | | | | | 142,439 | |
| | | | | | | | |
| | |
China — 0.6% | | | | | | | | |
Beijing Capital International Airport Co. Ltd., Class H 1 | | | 36,066,000 | | | | 16,718 | |
Tencent Holdings Ltd. | | | 601,900 | | | | 23,535 | |
| | | | | | | | |
| | | | | | | 40,253 | |
| | | | | | | | |
| | |
France — 12.7% | | | | | | | | |
Air Liquide SA | | | 390,199 | | | | 65,940 | |
Alstom S.A. | | | 2,707,715 | | | | 64,698 | |
AXA SA | | | 3,935,895 | | | | 117,263 | |
BNP Paribas SA | | | 665,847 | | | | 42,541 | |
Carrefour SA | | | 3,508,560 | | | | 60,408 | |
Danone SA | | | 3,011,605 | | | | 166,397 | |
Kering S.A. | | | 172,955 | | | | 78,976 | |
Sanofi | | | 1,270,811 | | | | 136,345 | |
Valeo | | | 2,664,081 | | | | 45,995 | |
Vinci S.A. | | | 604,383 | | | | 67,106 | |
| | | | | | | | |
| | | | | | | 845,669 | |
| | | | | | | | |
| | |
Germany — 9.1% | | | | | | | | |
Allianz SE | | | 458,065 | | | | 109,304 | |
Bayer AG | | | 820,512 | | | | 39,427 | |
Deutsche Telekom AG | | | 7,026,383 | | | | 147,592 | |
LANXESS AG | | | 1,734,557 | | | | 44,105 | |
RWE AG | | | 1,929,558 | | | | 71,707 | |
SAP SE | | | 1,500,032 | | | | 194,781 | |
| | | | | | | | |
| | | | | | | 606,916 | |
| | | | | | | | |
| | |
Ireland — 1.3% | | | | | | | | |
Ryanair Holdings PLC ADR 1 | | | 850,741 | | | | 82,701 | |
| | | | | | | | |
The accompanying notes are an integral part of the financial statements.
| | | | | | |
| | | |
| 6 | | Causeway International Value Fund | | | | |
S C H E D U L E O F I N V E S T M E N T S (continued)
September 30, 2023
| | | | | | | | |
| Causeway International Value Fund | | Number of Shares | | | Value (000) | |
| | | | | | | | |
| | |
Italy — 5.4% | | | | | | | | |
Enel SpA | | | 24,637,736 | | | $ | 151,601 | |
UniCredit SpA | | | 8,503,181 | | | | 204,342 | |
| | | | | | | | |
| | | | | | | 355,943 | |
| | | | | | | | |
| | |
Japan — 4.8% | | | | | | | | |
FANUC Corp. | | | 661,500 | | | | 17,232 | |
Murata Manufacturing Co. Ltd. | | | 7,507,500 | | | | 137,350 | |
Sumitomo Mitsui Financial Group Inc. | | | 1,054,600 | | | | 51,848 | |
Takeda Pharmaceutical Co. Ltd. | | | 3,360,400 | | | | 104,360 | |
Tokyo Electron Ltd. | | | 81,600 | | | | 11,161 | |
| | | | | | | | |
| | | | | | | 321,951 | |
| | | | | | | | |
| | |
Netherlands — 5.1% | | | | | | | | |
Akzo Nobel NV | | | 1,920,752 | | | | 139,063 | |
ING Groep NV | | | 7,110,067 | | | | 94,340 | |
Koninklijke Philips NV 1 | | | 5,316,501 | | | | 106,606 | |
| | | | | | | | |
| | | | | | | 340,009 | |
| | | | | | | | |
| | |
Singapore — 0.9% | | | | | | | | |
United Overseas Bank Ltd. | | | 2,905,400 | | | | 60,573 | |
| | | | | | | | |
| | |
South Korea — 5.2% | | | | | | | | |
Samsung Electronics Co. Ltd. | | | 5,078,673 | | | | 256,748 | |
SK Hynix Inc. | | | 1,040,581 | | | | 88,100 | |
| | | | | | | | |
| | | | | | | 344,848 | |
| | | | | | | | |
| | |
Spain — 3.3% | | | | | | | | |
Aena SME S.A. | | | 630,438 | | | | 95,047 | |
Amadeus IT Group S.A. | | | 1,071,942 | | | | 64,916 | |
Iberdrola S.A. | | | 5,294,146 | | | | 59,303 | |
| | | | | | | | |
| | | | | | | 219,266 | |
| | | | | | | | |
| | |
Switzerland — 5.2% | | | | | | | | |
Novartis AG | | | 1,001,468 | | | | 102,702 | |
Roche Holding AG | | | 485,971 | | | | 132,967 | |
UBS Group AG | | | 1,850,070 | | | | 45,860 | |
Zurich Insurance Group AG | | | 142,916 | | | | 65,591 | |
| | | | | | | | |
| | | | | | | 347,120 | |
| | | | | | | | |
| | |
United Kingdom — 33.9% | | | | | | | | |
AstraZeneca PLC | | | 962,393 | | | | 130,362 | |
Barclays PLC | | | 83,425,645 | | | | 161,782 | |
Berkeley Group Holdings PLC | | | 798,916 | | | | 40,034 | |
BP PLC | | | 32,319,061 | | | | 209,546 | |
The accompanying notes are an integral part of the financial statements.
| | | | | | |
| | | |
| | Causeway International Value Fund | | | 7 | |
S C H E D U L E O F I N V E S T M E N T S (continued)
September 30, 2023
| | | | | | | | |
| Causeway International Value Fund | | Number of Shares | | | Value (000) | |
| | | | | | | | |
| | |
United Kingdom — (continued) | | | | | | | | |
British American Tobacco PLC | | | 2,779,547 | | | $ | 87,395 | |
Compass Group PLC | | | 3,024,103 | | | | 73,795 | |
Diageo PLC | | | 3,329,433 | | | | 123,249 | |
GSK PLC | | | 6,705,296 | | | | 122,063 | |
Legal & General Group PLC | | | 18,278,778 | | | | 49,622 | |
NatWest Group PLC | | | 11,867,234 | | | | 34,128 | |
Prudential PLC | | | 13,184,635 | | | | 142,978 | |
Reckitt Benckiser Group PLC | | | 2,147,664 | | | | 151,825 | |
RELX PLC (EUR) | | | 2,087,488 | | | | 70,734 | |
RELX PLC (GBP) | | | 1,042,527 | | | | 35,298 | |
Rio Tinto PLC | | | 1,698,258 | | | | 107,208 | |
Rolls-Royce Holdings PLC 1 | | | 144,680,158 | | | | 389,944 | |
Segro PLC 2 | | | 1,938,691 | | | | 17,017 | |
Shell PLC | | | 4,791,672 | | | | 154,538 | |
Unilever PLC | | | 1,770,945 | | | | 87,769 | |
WH Smith PLC | | | 3,877,525 | | | | 63,585 | |
| | | | | | | | |
| | | | | | | 2,252,872 | |
| | | | | | | | |
Total Common Stock | | | | | | | | |
(Cost $5,544,783) — 91.6% | | | | | | | 6,096,287 | |
| | | | | | | | |
| | |
EXCHANGE TRADED FUNDS | | | | | | | | |
iShares Core MSCI EAFE ETF | | | 343,100 | | | | 22,079 | |
iShares MSCI EAFE ETF | | | 4,745,100 | | | | 327,032 | |
| | |
| | | | | | | | |
Total Exchange Traded Funds | | | | | | | | |
(Cost $349,928) — 5.2% | | | | | | | 349,111 | |
| | | | | | | | |
The accompanying notes are an integral part of the financial statements.
| | | | | | |
| | | |
| 8 | | Causeway International Value Fund | | | | |
S C H E D U L E O F I N V E S T M E N T S (continued)
September 30, 2023
| | | | | | | | |
| Causeway International Value Fund | | Number of Shares | | | Value (000) | |
| | | | | | | | |
| | |
SHORT-TERM INVESTMENT | | | | | | | | |
Invesco Short-Term Investment Trust: | | | | | | | | |
Government & Agency Portfolio, Institutional Class, 5.262% * | | | 175,174,725 | | | $ | 175,175 | |
| | | | | | | | |
| | |
Total Short-Term Investment | | | | | | | | |
(Cost $ 175,175) — 2.6% | | | | | | | 175,175 | |
| | | | | | | | |
| | |
Total Investments — 99.4% | | | | | | | | |
(Cost $ 6,069,886) | | | | | | | 6,620,573 | |
| | | | | | | | |
| | |
Other Assets in Excess of Liabilities — 0.6% | | | | | | | 36,666 | |
| | | | | | | | |
| | |
Net Assets — 100.0% | | | | | | $ | 6,657,239 | |
| | | | | | | | |
| * | The rate reported is the 7-day effective yield as of September 30, 2023. |
| 1 | Non-income producing security. |
| 2 | Real Estate Investment Trust. |
| ADR | American Depositary Receipt |
| MSCI | Morgan Stanley Capital International |
The table below sets forth information about the Levels within the fair value hierarchy at which the Fund’s investments are measured at September 30, 2023:
| | | | | | | | | | | | | | | | |
| Investments in Securities | | Level 1
(000) | | | Level 2
(000) | | | Level 3
(000) | | | Total (000) | |
Common Stock | | | | | | | | | | | | | | | | |
Belgium | | $ | 94,211 | | | $ | — | | | $ | — | | | $ | 94,211 | |
Brazil | | | 41,516 | | | | — | | | | — | | | | 41,516 | |
Canada | | | 142,439 | | | | — | | | | — | | | | 142,439 | |
China | | | 40,253 | | | | — | | | | — | | | | 40,253 | |
France | | | 845,669 | | | | — | | | | — | | | | 845,669 | |
Germany | | | 606,916 | | | | — | | | | — | | | | 606,916 | |
Ireland | | | 82,701 | | | | — | | | | — | | | | 82,701 | |
Italy | | | 355,943 | | | | — | | | | — | | | | 355,943 | |
Japan | | | 321,951 | | | | — | | | | — | | | | 321,951 | |
The accompanying notes are an integral part of the financial statements.
| | | | | | |
| | | |
| | Causeway International Value Fund | | | 9 | |
S C H E D U L E O F I N V E S T M E N T S (concluded)
September 30, 2023
| | | | | | | | | | | | | | | | |
| Investments in Securities | | Level 1
(000) | | | Level 2
(000) | | | Level 3
(000) | | | Total (000) | |
Netherlands | | $ | 340,009 | | | $ | — | | | $ | — | | | $ | 340,009 | |
Singapore | | | 60,573 | | | | — | | | | — | | | | 60,573 | |
South Korea | | | — | | | | 344,848 | | | | — | | | | 344,848 | |
Spain | | | 219,266 | | | | — | | | | — | | | | 219,266 | |
Switzerland | | | 347,120 | | | | — | | | | — | | | | 347,120 | |
United Kingdom | | | 2,252,872 | | | | — | | | | — | | | | 2,252,872 | |
| | | | |
Total Common Stock | | | 5,751,439 | | | | 344,848 | | | | — | | | | 6,096,287 | |
| | | | |
Exchange Traded Funds | | | 349,111 | | | | — | | | | — | | | | 349,111 | |
| | | | |
Short-Term Investment | | | 175,175 | | | | — | | | | — | | | | 175,175 | |
| | | | |
Total Investments in Securities | | $ | 6,275,725 | | | $ | 344,848 | | | $ | — | | | $ | 6,620,573 | |
| | | | |
Amounts designated as “—” are $0 or are rounded to $0.
For more information on valuation inputs, see Note 2 in the Notes to Financial Statements.
The accompanying notes are an integral part of the financial statements.
| | | | | | |
| | | |
| 10 | | Causeway International Value Fund | | | | |
S E C T O R D I V E R S I F I C A T I O N
As of September 30, 2023, the sector diversification was as follows (Unaudited):
| | | | | | | | | | |
| Causeway International Value Fund | | Common Stock | | | % of Net
Assets | | | |
Industrials | | | 13.5% | | | | 13.5% | | | |
Information Technology | | | 10.3 | | | | 10.3 | | | |
Energy | | | 5.4 | | | | 5.4 | | | |
Financials | | | 16.7 | | | | 16.7 | | | |
Consumer Staples | | | 12.8 | | | | 12.8 | | | |
Utilities | | | 4.3 | | | | 4.3 | | | |
Communication Services | | | 2.6 | | | | 2.6 | | | |
Materials | | | 5.4 | | | | 5.4 | | | |
Health Care | | | 13.1 | | | | 13.1 | | | |
Consumer Discretionary | | | 7.2 | | | | 7.2 | | | |
Real Estate | | | 0.3 | | | | 0.3 | | | |
| | | | | | | | | | |
Total | | | 91.6% | | | | 91.6% | | | |
| | | |
Exchange Traded Funds | | | | | | | 5.2 | | | |
| | | | | | | | | | |
| | | |
Short-Term Investment | | | | | | | 2.6 | | | |
| | | | | | | | | | |
| | | |
Other Assets in Excess of Liabilities | | | | | | | 0.6 | | | |
| | | | | | | | | | |
| | | |
Net Assets | | | | | | | 100.0% | | | |
| | | | | | | | | | |
The accompanying notes are an integral part of the financial statements.
| | | | | | |
| | | |
| | Causeway International Value Fund | | | 11 | |
S T A T E M E N T O F A S S E T S A N D L I A B I L I T I E S (000)*
| | | | | | | | |
| |
| CAUSEWAY
INTERNATIONAL VALUE FUND 9/30/23 |
|
ASSETS: | | | | | | | | |
Investments at Value (Cost $6,069,886) | | | | | | $ | 6,620,573 | |
Foreign Currency (Cost $66) | | | | | | | 66 | |
Receivable for Tax Reclaims | | | | | | | 25,903 | |
Receivable for Fund Shares Sold | | | | | | | 14,292 | |
Receivable for Investment Securities Sold | | | | | | | 12,468 | |
Receivable for Dividends | | | | | | | 11,637 | |
Prepaid Expenses | | | | | | | 115 | |
| | | | | | | | |
Total Assets | | | | | | | 6,685,054 | |
| | | | | | | | |
LIABILITIES: | | | | | | | | |
Payable for Fund Shares Redeemed | | | | | | | 16,150 | |
Payable Due to Adviser | | | | | | | 4,326 | |
Payable for Income Tax Liability | | | | | | | 3,934 | |
Payable for Tax Agent Fees | | | | | | | 1,878 | |
Payable for Investment Securities Purchased | | | | | | | 265 | |
Payable for Shareholder Service Fees - Investor Class | | | | | | | 264 | |
Payable Due to Administrator | | | | | | | 106 | |
Payable for Trustees’ Fees | | | | | | | 104 | |
Unrealized Depreciation on Spot Foreign Currency Contracts | | | | | | | 42 | |
Other Accrued Expenses | | | | | | | 746 | |
| | | | | | | | |
Total Liabilities | | | | | | | 27,815 | |
| | | | | | | | |
Net Assets | | | | | | $ | 6,657,239 | |
| | | | | | | | |
NET ASSETS: | | | | | | | | |
Paid-in Capital (unlimited authorization — no par value) | | | | | | $ | 5,947,528 | |
Total Distributable Earnings | | | | | | | 709,711 | |
| | | | | | | | |
Net Assets | | | | | | $ | 6,657,239 | |
| | | | | | | | |
Net Asset Value Per Share (based on net assets of
$6,176,427,858 ÷ 334,689,882 shares) - Institutional Class | | | | | | $ | 18.45 | |
| | | | | | | | |
Net Asset Value Per Share (based on net assets of
$480,811,179 ÷ 26,283,999 shares) - Investor Class | | | | | | $ | 18.29 | |
| | | | | | | | |
* Except for Net Asset Value Per Share data.
The accompanying notes are an integral part of the financial statements.
| | | | | | |
| | | |
| 12 | | Causeway International Value Fund | | | | |
S T A T E M E N T O F O P E R A T I O N S (000)
| | | | | | |
| | | CAUSEWAY INTERNATIONAL VALUE FUND 10/01/22 to 9/30/23 | |
INVESTMENT INCOME: | | | | | | |
Dividend Income (net of foreign taxes withheld of $15,205) | | | | $ | 190,334 | |
| | | | | | |
Total Investment Income | | | | | 190,334 | |
| | | | | | |
EXPENSES: | | | | | | |
Investment Advisory Fees | | | | | 50,810 | |
Administration Fees | | | | | 1,210 | |
Shareholder Service Fees — Investor Class | | | | | 1,028 | |
Professional Fees | | | | | 2,013 | |
Transfer Agent Fees | | | | | 840 | |
Custodian Fees | | | | | 633 | |
Trustees’ Fees | | | | | 392 | |
Registration Fees | | | | | 299 | |
Printing Fees | | | | | 246 | |
Other Fees | | | | | 680 | |
| | | | | | |
Total Expenses | | | | | 58,151 | |
| | | | | | |
Waiver of Investment Advisory Fees | | | | | (1,456) | |
| | | | | | |
Total Waiver | | | | | (1,456) | |
| | | | | | |
| | |
Net Expenses | | | | | 56,695 | |
| | | | | | |
| | |
Net Investment Income | | | | | 133,639 | |
| | | | | | |
Net Realized Gain (Loss) on: | | | | | | |
Investments | | | | | 194,212 | |
Foreign Currency Transactions | | | | | (713) | |
| | | | | | |
Net Realized Gain (Loss) | | | | | 193,499 | |
| | | | | | |
Net Unrealized Appreciation (Depreciation) on: | | | | | | |
Investments | | | | | 1,691,177 | |
Foreign Currency and Translation of Other Assets and Liabilities Denominated in Foreign Currency | | | | | 1,788 | |
| | | | | | |
Net Unrealized Appreciation (Depreciation) | | | | | 1,692,965 | |
| | | | | | |
| | |
Net Realized and Unrealized Gain | | | | | 1,886,464 | |
| | | | | | |
| | |
Net Increase in Net Assets Resulting from Operations | | | | $ | 2,020,103 | |
| | | | | | |
The accompanying notes are an integral part of the financial statements.
| | | | | | |
| | | |
| | Causeway International Value Fund | | | 13 | |
S T A T E M E N T S O F C H A N G E S I N N E T A S S E T S (000)
| | | | | | | | |
| | | CAUSEWAY INTERNATIONAL
VALUE FUND | |
| | | 10/01/22 to
9/30/23 | | | 10/01/21 to
9/30/22 | |
OPERATIONS: | | | | | | | | |
Net Investment Income | | $ | 133,639 | | | $ | 107,766 | |
Net Realized Gain | | | 193,499 | | | | 70,599 | |
Net Change in Unrealized Appreciation (Depreciation) | | | 1,692,965 | | | | (1,672,216) | |
| | | | | | | | |
| | |
Net Increase (Decrease) in Net Assets Resulting From Operations | | | 2,020,103 | | | | (1,493,851) | |
| | | | | | | | |
DISTRIBUTIONS: | | | | | | | | |
Institutional Class | | | (96,504) | | | | (107,566) | |
Investor Class | | | (4,817) | | | | (5,808) | |
| | | | | | | | |
Total Distributions to Shareholders | | | (101,321) | | | | (113,374) | |
| | | | | | | | |
Net Increase (Decrease) in Net Assets Derived from Capital Share Transactions(1) | | | (151,725) | | | | 303,354 | |
| | | | | | | | |
Total Increase (Decrease) in Net Assets | | | 1,767,057 | | | | (1,303,871) | |
| | | | | | | | |
NET ASSETS: | | | | | | | | |
Beginning of Year | | | 4,890,182 | | | | 6,194,053 | |
| | | | | | | | |
End of Year | | $ | 6,657,239 | | | $ | 4,890,182 | |
| | | | | | | | |
(1) See Note 7 in the Notes to Financial Statements.
The accompanying notes are an integral part of the financial statements.
| | | | | | |
| | | |
| 14 | | Causeway International Value Fund | | | | |
This page intentionally left blank.
F I N A N C I A L H I G H L I G H T S
For the Fiscal Years Ended September 30,
For a Share Outstanding Throughout the Fiscal Years
| | | | | | | | | | | | | | | | | | | | | | | | | | | | | | | | |
| | | Net Asset
Value,
Beginning
of Year ($) | | | Net
Investment
Income
($)† | | | Net
Realized
and
Unrealized
Gain (Loss)
on Investments
($) | | | Total from
Operations
($) | | | Dividends
from Net
Investment
Income ($) | | | Distributions
from Capital
Gains ($) | | | Total
Dividends
and
Distributions
($) | | | Redemption
Fees ($) | |
Causeway International Value Fund | | | | | | | | | | | | | | | | | | | | | | | | | |
Institutional | | | | | | | | | | | | | | | | | | | | | | | | | | | | | | | | |
2023 | | | 13.20 | | | | 0.37 | | | | 5.16 | | | | 5.53 | | | | (0.28 | ) | | | — | | | | (0.28 | ) | | | — | |
2022 | | | 17.55 | | | | 0.30 | | | | (4.33) | | | | (4.03 | ) | | | (0.32 | ) | | | — | | | | (0.32 | ) | | | — | |
2021 | | | 12.93 | | | | 0.33 | | | | 4.51 | | | | 4.84 | | | | (0.22 | ) | | | — | | | | (0.22 | ) | | | — | |
2020 | | | 14.68 | | | | 0.21 | | | | (1.23) | | | | (1.02 | ) | | | (0.50 | ) | | | (0.23 | ) | | | (0.73 | ) | | | — | |
2019 | | | 16.53 | | | | 0.47 | | | | (1.84) | | | | (1.37 | ) | | | (0.37 | ) | | | (0.11 | ) | | | (0.48 | ) | | | —(1) | |
Investor | | | | | | | | | | | | | | | | | | | | | | | | | | | | | | | | |
2023 | | | 13.09 | | | | 0.35 | | | | 5.09 | | | | 5.44 | | | | (0.24 | ) | | | — | | | | (0.24 | ) | | | — | |
2022 | | | 17.40 | | | | 0.25 | | | | (4.28) | | | | (4.03 | ) | | | (0.28 | ) | | | — | | | | (0.28 | ) | | | — | |
2021 | | | 12.81 | | | | 0.29 | | | | 4.48 | | | | 4.77 | | | | (0.18 | ) | | | — | | | | (0.18 | ) | | | — | |
2020 | | | 14.55 | | | | 0.16 | | | | (1.21) | | | | (1.05 | ) | | | (0.46 | ) | | | (0.23 | ) | | | (0.69 | ) | | | — | |
2019 | | | 16.39 | | | | 0.44 | | | | (1.83) | | | | (1.39 | ) | | | (0.34 | ) | | | (0.11 | ) | | | (0.45 | ) | | | —(1) | |
| † | Per share amounts calculated using average shares method. |
| (1) | Amount represents less than $0.01 per share. |
| Amounts | | designated as “—” are $0 or round to $0. |
The accompanying notes are an integral part of the financial statements.
| | | | | | |
| | | |
| 16 | | Causeway International Value Fund | | | | |
| | | | | | | | | | | | | | | | | | | | | | | | | | | | | | |
| | | | Net Asset
Value, End of Year ($) | | | Total Return (%) | | | Net Assets,
End of Year ($000) | | | Ratio of
Expenses to
Average Net
Assets (%) | | | Ratio of
Expenses to Average
Net Assets
(Excluding
Waivers and
Reimburse-
ments) (%) | | | Ratio of Net Investment
Income to
Average Net Assets (%) | | | Portfolio
Turnover
Rate (%) | |
| | | | | | | | | | | | | | | | | | | | | | | | | | | | | | |
| | | | | | | | | | | | | | | | | | | | | | | | | | | | | | |
| | | | | 18.45 | | | | 42.26 | | | | 6,176,428 | | | | 0.88 | | | | 0.90 | | | | 2.11 | | | | 54 | |
| | | | | 13.20 | | | | (23.39 | ) | | | 4,628,087 | | | | 0.85 | | | | 0.88 | | | | 1.81 | | | | 58 | |
| | | | | 17.55 | | | | 37.59 | | | | 5,838,585 | | | | 0.85 | | | | 0.89 | | | | 1.94 | | | | 60 | |
| | | | | 12.93 | | | | (7.83 | ) | | | 4,537,029 | | | | 0.88 | | | | 0.88 | | | | 1.51 | | | | 57 | |
| | | | | 14.68 | | | | (8.01 | ) | | | 5,896,074 | | | | 0.90 | | | | 0.90 | | | | 3.18 | | | | 36 | |
| | | | | | | | | | | | | | | | | | | | | | | | | | | | | | |
| | | | | 18.29 | | | | 41.87 | | | | 480,811 | | | | 1.13 | | | | 1.15 | | | | 2.02 | | | | 54 | |
| | | | | 13.09 | | | | (23.54 | ) | | | 262,095 | | | | 1.10 | | | | 1.13 | | | | 1.55 | | | | 58 | |
| | | | | 17.40 | | | | 37.33 | | | | 355,468 | | | | 1.08 | | | | 1.12 | | | | 1.73 | | | | 60 | |
| | | | | 12.81 | | | | (8.06 | ) | | | 315,922 | | | | 1.11 | | | | 1.12 | | | | 1.18 | | | | 57 | |
| | | | | 14.55 | | | | (8.26 | ) | | | 615,202 | | | | 1.14 | | | | 1.14 | | | | 3.02 | | | | 36 | |
The accompanying notes are an integral part of the financial statements.
| | | | | | |
| | | |
| | Causeway International Value Fund | | | 17 | |
N O T E S T O F I N A N C I A L S T A T E M E N T S
Causeway International Value Fund (the “Fund”) is a series of Causeway Capital Management Trust (the “Trust”). The Trust is an open-end management investment company registered under the Investment Company Act of 1940, as amended (the “1940 Act”) and is a Delaware statutory trust that was established on August 10, 2001. The Fund began operations on October 26, 2001. The Fund is authorized to offer two classes of shares, the Institutional Class and the Investor Class. The Declaration of Trust authorizes the issuance of an unlimited number of shares of beneficial interest of the Fund. The Fund is diversified. The Fund’s prospectus provides a description of the Fund’s investment objectives, policies and strategies. As of September 30, 2023, the Trust has five additional series, the financial statements of which are presented separately.
| 2. | Significant Accounting Policies |
The following is a summary of the significant accounting policies consistently followed by the Fund.
Use of Estimates in the Preparation of Financial Statements – The Fund is an investment company that applies the accounting and reporting guidance issued in Topic 946 by the U.S. Financial Accounting Standards Board. The Fund’s financial statements have been prepared to comply with U.S. generally accepted accounting principles (“U.S. GAAP”). The preparation of financial statements in conformity with U.S. GAAP requires management to make estimates and assumptions that affect the reported amount of net assets and liabilities and disclosure of contingent assets and liabilities at the date of the financial statements and the reported amounts of increases and decreases in net assets from operations during the reporting period. Actual results could differ from those estimates.
Security Valuation – Except as described below, securities listed on a securities exchange (except the NASDAQ Stock Market (“NASDAQ”)) or Over-the-Counter (“OTC”) for which market quotations are available are valued at the last reported sale price as of the close of trading on each business day, or, if there is no such reported sale, at the last reported bid price for long positions. For securities traded on NASDAQ, the NASDAQ Official Closing Price is used. Securities listed on multiple exchanges or OTC markets are valued on the exchange or OTC market considered by the Fund to be the primary market. The prices for foreign securities are reported in local currency and converted to U.S. dollars using currency exchange rates. Prices for most securities held in the Fund are provided daily by recognized independent pricing agents. If a security price cannot be obtained from an independent pricing agent, the Fund seeks to obtain a bid price from at least one independent broker. Investments in money market funds are valued daily at the net asset value per share.
Securities for which market prices are not “readily available” are valued in accordance with fair value pricing procedures approved by the Fund’s Board of Trustees (the “Board”). The Fund’s fair value pricing procedures are overseen by the Fund’s valuation designee, Causeway Capital Management LLC (“Adviser”), and implemented through a Fair Value Committee (the “Committee”). Some of the more common reasons that may necessitate that a security be valued using fair value pricing procedures include: the security’s trading has been halted or suspended; the security has been delisted from a national exchange; the security’s primary trading market is temporarily closed at a time when under normal conditions it would be open; or the security’s primary pricing source is not able or willing to provide a price. When the Committee values a security in accordance with the fair value pricing procedures, the Committee will determine the value after taking
| | | | | | |
| | | |
| 18 | | Causeway International Value Fund | | | | |
N O T E S T O F I N A N C I A L S T A T E M E N T S
(continued)
into consideration relevant information reasonably available to the Committee.
The Fund uses a third party vendor to fair value certain non-U.S. securities if there is a movement in the U.S. market that exceeds thresholds established by the Committee. The vendor provides fair values for foreign securities based on factors and methodologies involving, generally, tracking valuation correlations between the U.S. market and each non-U.S. security and such fair values are applied by the administrator if a pre-determined confidence level is reached for the security.
In accordance with the authoritative guidance on fair value measurements and disclosure under U.S. GAAP, the Fund discloses fair value of its investments in a hierarchy that prioritizes the inputs to valuation techniques used to measure the fair value. The objective of a fair value measurement is to determine the price that would be received to sell an asset or paid to transfer a liability in an orderly transaction between market participants at the measurement date (an exit price). Accordingly, the fair value hierarchy gives the highest priority to quoted prices (unadjusted) in active markets for identical assets or liabilities (Level 1) and the lowest priority to unobservable inputs (Level 3). The guidance establishes three levels of fair value hierarchy as follows:
| | • | | Level 1 — Unadjusted quoted prices in active markets for identical, unrestricted assets or liabilities that the Fund has the ability to access at the measurement date; |
| | • | | Level 2 — Quoted prices for similar assets or liabilities in active markets, quoted prices for identical or similar assets or liabilities in markets which are not active, or prices based on inputs that are observable (either directly or indirectly); and |
| | • | | Level 3 — Prices, inputs or exotic modeling techniques which are both significant to the fair value measurement and unobservable (supported by little or no market activity). |
Investments are classified within the level of the lowest significant input considered in determining fair value. Investments classified within Level 3 which fair value measurement considers several inputs may include Level 1 or Level 2 inputs as components of the overall fair value measurement.
Changes in valuation techniques may result in transfers in or out of an investment’s assigned level within the hierarchy during the reporting period. Changes in the classification between Levels 1 and 2 occur primarily when foreign equity securities are fair valued by the Fund’s third party vendor using other observable market–based inputs in place of closing exchange prices due to events occurring after foreign market closures or when foreign markets are closed.
As of and during the fiscal year ended September 30, 2023, there were no changes to the Fund’s fair value methodologies.
Federal Income Taxes – The Fund intends to continue to qualify as a regulated investment company under Subchapter M of the Internal Revenue Code and to distribute substantially all of its taxable income. Accordingly, no provision for Federal income taxes has been made in the financial statements.
The Fund evaluates tax positions taken or expected to be taken in the course of preparing the Fund’s tax returns to determine whether it is “more-likely-than-not” (i.e., greater than 50-percent) that each tax position will be sustained upon examination by a taxing authority based on the technical merits of the position. Tax positions not deemed to meet the “more-likely-than-not” threshold are recorded as a tax benefit or expense in the current year. The Fund
| | | | | | |
| | | |
| | Causeway International Value Fund | | | 19 | |
N O T E S T O F I N A N C I A L S T A T E M E N T S
(continued)
did not record any tax provision in the current period. However, management’s conclusions regarding tax positions taken may be subject to review and adjustment at a later date based on factors including, but not limited to, examination by tax authorities (i.e., the last 3 tax years, as applicable), and on-going analysis of and changes to tax laws, regulations and interpretations thereof.
As of and during the fiscal year ended September 30, 2023, the Fund did not have a liability for any unrecognized tax benefits. The Fund recognizes interest and penalties, if any, related to unrecognized tax benefits as income tax expense in the Statement of Operations. During the fiscal year, the Fund did not incur any significant interest or penalties.
The Fund may receive payments for Article 63 EU Tax Reclaims (“EU tax reclaims”) related to previously withheld taxes on dividends earned in prior years. EU tax reclaims and associated late interest amounts awarded by European countries, if any, are included in Other Income and Interest Income, respectively, on the Statement of Operations. The Fund has also filed for additional EU tax reclaims. Generally, unless recovery amounts associated with EU tax reclaims are collectible and free from significant contingencies and uncertainties, recoveries will not be recognized in the Fund’s net asset value until collected. The receipt of EU tax reclaims and interest will result in a tax liability to the Fund to offset the tax benefits that shareholders received in the past. The precise amount of the tax liability is uncertain and is subject to settlement negotiations with the U.S. Internal Revenue Service (“U.S. IRS”). Based on information available as of the date of this report, the Fund has accrued an amount of the estimated tax liability payable to the U.S. IRS on behalf of its shareholders which is recorded as Payable for Income Tax Liability on the Statement of Assets and Liabilities.
Withholding taxes on foreign dividends have been provided for in accordance with the Fund’s understanding of the applicable country’s tax rules and rates. The Fund or its agent files withholding tax reclaims in certain jurisdictions to recover certain amounts previously withheld. The Fund may record a reclaim receivable based on collectability, which includes factors such as the jurisdiction’s applicable laws, payment history and market convention. Professional fees paid to those that provide assistance in receiving the tax reclaims, which generally are contingent upon successful receipt of reclaimed amounts, are recorded in Professional Fees on the Statement of Operations once the amounts are due. The professional fees related to pursuing these tax reclaims are not subject to the Adviser’s expense limit agreement described in Note 3.
Security Transactions and Related Income – Security transactions are accounted for on the date the security is purchased or sold (trade date). Dividend income is recognized on the ex-dividend date, and interest income is recognized using the accrual basis of accounting. Costs used in determining realized gains and losses on the sales of investment securities are those of the specific securities sold.
Foreign Currency Translation – The books and records of the Fund are maintained in U.S. dollars on the following basis:
(1) the market value or fair value of investment securities, assets and liabilities is converted at the current rate of exchange; and
(2) purchases and sales of investment securities, income and expenses are converted at the relevant rates of exchange prevailing on the respective dates of such transactions.
The Fund does not isolate that portion of gains and losses on investments in equity securities that is due
| | | | | | |
| | | |
| 20 | | Causeway International Value Fund | | | | |
N O T E S T O F I N A N C I A L S T A T E M E N T S
(continued)
to changes in the foreign exchange rates from that which is due to changes in market prices of equity securities.
Foreign Currency Exchange Contracts – When the Fund purchases or sells foreign securities, it enters into corresponding foreign currency exchange contracts to settle the securities transactions. Losses from these foreign exchange transactions may arise from changes in the value of the foreign currency between trade date and settlement date or if the counterparties do not perform under the contract’s terms.
Expense/Classes – Expenses that are directly related to one Fund of the Trust are charged directly to that Fund. Other operating expenses of the Trust are prorated to the Fund and the other series of the Trust on the basis of relative daily net assets. Expenses of the Shareholder Service Plan and Agreement for the Investor Class are borne by that class of shares. Income, realized and unrealized gains (losses) and non-class specific expenses are allocated to the respective classes on the basis of relative daily net assets.
Dividends and Distributions – Dividends from net investment income, if any, are declared and paid on an annual basis. Any net realized capital gains on sales of securities are distributed to shareholders at least annually.
Cash – Idle cash may be swept into various time deposit accounts and is classified as cash on the Statement of Assets and Liabilities. The Fund maintains cash in bank deposit accounts which, at times, may exceed United States federally insured limits. Amounts invested and earned income are available on the same business day.
Other – Brokerage commission recapture payments are credited to realized capital gains and are included in net realized gains from security transactions on the Statement of Operations. For the fiscal year ended
September 30, 2023, the Fund received commission recapture payments of $41,330.
| 3. | Investment Advisory, Administration, Shareholder Service and Distribution Agreements |
The Trust, on behalf of the Fund, has entered into an Investment Advisory Agreement (the “Advisory Agreement”) with the Adviser. Under the Advisory Agreement, the Adviser is entitled to a monthly fee equal to an annual rate of 0.80% of the Fund’s average daily net assets. The Adviser has contractually agreed through January 31, 2024 to waive its fee and, to the extent necessary, reimburse the Fund to keep total annual fund operating expenses (excluding brokerage fees and commissions, interest, taxes, shareholder service fees, fees and expenses of other funds in which the Fund invests, tax reclaim-related fees and expenses, and extraordinary expenses) from exceeding 0.85% of Institutional Class and Investor Class average daily net assets. For the fiscal year ended September 30, 2023, the Adviser waived $1,455,596 of its advisory fee. The expense waivers and reimbursements are not subject to recapture.
The Trust and SEI Investments Global Funds Services (the “Administrator”) have entered into an Administration Agreement. Under the terms of the Administration Agreement, the Administrator is entitled to an annual fee which is calculated daily and paid monthly based on the aggregate average daily net assets of the Trust subject to a minimum annual fee.
The Trust has adopted a Shareholder Service Plan and Agreement for Investor Class shares that allows the Trust to pay broker-dealers and other financial intermediaries a fee of up to 0.25% per annum of average daily net assets for services provided to Investor Class shareholders. For the fiscal year ended September 30, 2023, the Investor Class paid 0.25% annualized of average daily net assets under this plan.
| | | | | | |
| | | |
| | Causeway International Value Fund | | | 21 | |
N O T E S T O F I N A N C I A L S T A T E M E N T S
(continued)
The Trust and SEI Investments Distribution Co. (the “Distributor”) have entered into a Distribution Agreement. The Distributor receives no fees from the Fund for its distribution services under this agreement.
The officers of the Trust are also officers or employees of the Administrator or Adviser. They receive no fees for serving as officers of the Trust.
As of September 30, 2023, approximately $2,636 (000) of the Fund’s net assets were held by investors affiliated with the Adviser.
| 4. | Investment Transactions |
The cost of security purchases and the proceeds from the sales of securities, other than short-term investments, during the fiscal year ended September 30, 2023, for the Fund were as follows (000):
| | |
| Purchases | | Sales |
$3,324,480 | | $3,514,529 |
| 5. | Risks of Foreign Investing |
Because the Fund invests most of its assets in foreign securities, the Fund is subject to additional risks. For example, the value of the Fund’s securities may be affected by social, political and economic developments and U.S. and foreign laws relating to foreign investments. Further, because the Fund invests in securities denominated in foreign currencies, the Fund’s securities may go down in value depending on foreign exchange rates. Other risks include trading, settlement, custodial, and other operational risks; withholding or other taxes; and the less stringent investor protection and disclosure standards of some foreign markets. All of these factors can make foreign securities less liquid, more volatile and harder to value than U.S. securities. These risks are higher for emerging markets investments.
Global economies are increasingly interconnected, and political, economic and other conditions and events (including, but not limited to, wars, conflicts, natural disasters, pandemics, epidemics, inflation/ deflation, and social unrest) in one country or region might adversely impact a different country or region. Furthermore, the occurrence of severe weather or geological events, fires, floods, earthquakes, climate change or other natural or man-made disasters, outbreaks of disease, epidemics and pandemics, malicious acts, cyber-attacks or terrorist acts, among other events, could adversely impact the performance of the Fund. These events may result in, among other consequences, closing borders, exchange closures, health screenings, healthcare service delays, quarantines, cancellations, supply chain disruptions, lower consumer demand, market volatility and general uncertainty. These events could adversely impact issuers, markets and economies over the short- and long-term, including in ways that cannot necessarily be foreseen. The Fund could be negatively impacted if the value of a portfolio holding were harmed by political or economic conditions or events. Moreover, negative political and economic conditions and events could disrupt the processes necessary for the Fund’s operations.
For example, Russia’s invasion of Ukraine in February 2022, the resulting responses by the U.S. and other countries, and the potential for wider conflict, have increased and may continue to increase volatility and uncertainty in financial markets worldwide. The U.S. and other countries have imposed broad-ranging economic sanctions on Russia and Russian entities and individuals, and may impose additional sanctions, including on other countries that provide military or economic support to Russia. These sanctions, among other things, restrict companies from doing business with Russia and Russian issuers, and may adversely affect companies with economic or financial exposure to Russia and Russian issuers. The extent and duration
| | | | | | |
| | | |
| 22 | | Causeway International Value Fund | | | | |
N O T E S T O F I N A N C I A L S T A T E M E N T S
(continued)
of Russia’s military actions and the repercussions of such actions are not known. The invasion may widen beyond Ukraine and may escalate, including through retaliatory actions and cyberattacks by Russia and even other countries. These events may result in further and significant market disruptions and may adversely affect regional and global economies including those of Europe and the U.S. Certain industries and markets, such as those involving oil, natural gas and other commodities, as well as global supply chains, may be particularly adversely affected. Whether or not the Fund invests in securities of issuers located in Russia, Ukraine and adjacent countries or with significant exposure to issuers in these countries, these events could negatively affect the value and liquidity of the Fund’s investments.
| 6. | Federal Tax Information |
The Fund is classified as a separate taxable entity for Federal income tax purposes. The Fund intends to continue to qualify as a separate “regulated investment company” under Subchapter M of the Internal Revenue Code and make the requisite distributions to shareholders that will be sufficient to relieve it from Federal income tax and Federal excise tax. Therefore, no Federal tax provision is required. To the extent that dividends from net investment income and distributions from net realized capital gains exceed amounts reported in the financial statements, such amounts are reported separately.
The Fund may be subject to taxes imposed by countries in which it invests in issuers existing or operating in such countries. Such taxes are generally based on income earned. The Fund accrues such taxes when the related income is earned. Dividend and interest income is recorded net of non-U.S. taxes paid.
The amounts of distributions from net investment income and net realized capital gains are determined
in accordance with Federal income tax regulations, which may differ from those amounts determined under U.S. GAAP. These book/tax differences are either temporary or permanent in nature. The character of distributions made during the year from net investment income or net realized gains, and the timing of distributions made during the year may differ from those during the year that the income or realized gains (losses) were recorded by the Fund. To the extent these differences are permanent, adjustments are made to the appropriate equity accounts in the period that the differences arise.
During the fiscal year ended September 30, 2023, there were no permanent differences credited or charged to Paid-in Capital and Distributable Earnings.
The tax character of dividends and distributions declared during the fiscal years ended September 30, 2023 and September 30, 2022, was as follows (000):
| | | | | | | | |
| | | Ordinary
Income | | | Total | |
2023 | | $ | 101,321 | | | $ | 101,321 | |
2022 | | | 113,374 | | | | 113,374 | |
As of September 30, 2023, the components of distributable earnings (accumulated losses) on a tax basis were as follows (000):
| | | | |
Undistributed Ordinary Income | | $ | 194,891 | |
Undistributed Long-Term | | | | |
Capital Gains | | | 47,109 | |
Unrealized Appreciation | | | 467,669 | |
Other Temporary Differences | | | 42 | |
| | | | |
Total Distributable Earnings | | $ | 709,711 | |
| | | | |
For the fiscal year ended September 30, 2023, the Fund utilized $65,030 (000) of short term capital loss carryforwards.
At September 30, 2023, the total cost of investments for Federal income tax purposes and the aggregate
| | | | | | |
| | | |
| | Causeway International Value Fund | | | 23 | |
N O T E S T O F I N A N C I A L S T A T E M E N T S
(continued)
gross unrealized appreciation and depreciation on investments for the Fund were as follows (000):
| | | | | | | | |
Federal Tax
Cost | | Appreciated
Securities | | Depreciated
Securities | | Net Unrealized
Appreciation | |
| $6,151,415 | | $726,498 | | $(257,340) | | | $469,158 | |
| 7. | Capital Shares Issued and Redeemed (000) |
| | | | | | | | | | | | | | | | | | | | |
| | | Fiscal Year Ended
September 30, 2023 | | Fiscal Year Ended
September 30, 2022 |
| | | Shares | | Value | | Shares | | Value |
Institutional Class | | | | | | | | | | | | | | | | | | | | |
Shares Sold | | | | 79,758 | | | | $ | 1,400,984 | | | | | 93,697 | | | | $ | 1,530,038 | |
Shares Issued in Reinvestment of Dividends and
Distributions | | | | 5,483 | | | | | 87,181 | | | | | 5,709 | | | | | 97,277 | |
Shares Redeemed | | | | (101,053) | | | | | (1,752,791) | | | | | (81,571) | | | | | (1,319,320) | |
| | | | | | | | | | | | | | | | | | | | |
Increase (Decrease) in Shares Outstanding Derived from
Institutional Class Transactions | | | | (15,812) | | | | | (264,626) | | | | | 17,835 | | | | | 307,995 | |
| | | | | | | | | | | | | | | | | | | | |
Investor Class | | | | | | | | | | | | | | | | | | | | |
Shares Sold | | | | 13,822 | | | | | 243,405 | | | | | 5,786 | | | | | 93,488 | |
Shares Issued in Reinvestment of Dividends and
Distributions | | | | 298 | | | | | 4,716 | | | | | 336 | | | | | 5,686 | |
Shares Redeemed | | | | (7,859) | | | | | (135,220) | | | | | (6,525) | | | | | (103,815) | |
| | | | | | | | | | | | | | | | | | | | |
Increase (Decrease) in Shares Outstanding Derived from
Investor Class Transactions | | | | 6,261 | | | | | 112,901 | | | | | (403) | | | | | (4,641) | |
| | | | | | | | | | | | | | | | | | | | |
Net Increase (Decrease) in Shares Outstanding from
Capital Share Transactions | | | | (9,551) | | | | $ | (151,725) | | | | | 17,432 | | | | $ | 303,354 | |
| | | | | | | | | | | | | | | | | | | | |
| 8. | Significant Shareholder Concentration |
As of September 30, 2023, three of the Fund’s shareholders of record owned 51% of the Institutional Class shares. The Fund may be adversely affected when a shareholder purchases or redeems large amounts of shares, which may impact the Fund in the same manner as a high volume of redemption requests. Such large shareholders may include, but are not limited to, institutional investors and asset allocators who make investment decisions on behalf of underlying clients. Significant shareholder purchases and redemptions may adversely impact the Fund’s portfolio management and may cause the Fund to make investment decisions at inopportune times or prices or miss
attractive investment opportunities. Such transactions may also increase the Fund’s transaction costs, accelerate the realization of taxable income if sales of securities result in gains, or otherwise cause the Fund to perform differently than intended.
Under the Trust’s organizational documents, each Trustee, officer, employee or other agent of the Trust is indemnified against certain liabilities that may arise out of the performance of his or her duties to the Fund. Additionally, in the normal course of business, the Fund enters into contracts, including the Fund’s servicing agreements, that contain a variety of indem-
| | | | | | |
| | | |
| 24 | | Causeway International Value Fund | | | | |
N O T E S T O F I N A N C I A L S T A T E M E N T S
(concluded)
nification clauses. The Fund’s maximum exposure under these arrangements is unknown as this would involve future claims that may be made against the Fund that have not yet occurred. The risk of material loss as a result of such indemnification claims is considered remote.
The Fund has evaluated the need for disclosures and/ or adjustments resulting from subsequent events through the date the financial statements were issued. Based on this evaluation, no disclosures and/or adjustments were required to the financial statements.
| | | | | | |
| | | |
| | Causeway International Value Fund | | | 25 | |
R E P O R T O F I N D E P E N D E N T R E G I S T E R E D P U B L I C A C C O U N T I N G F I R M
To the Board of Trustees of Causeway Capital Management Trust and Shareholders of the Causeway International Value Fund
Opinion on the Financial Statements
We have audited the accompanying statement of assets and liabilities, including the schedule of investments, of Causeway International Value Fund (one of the funds constituting Causeway Capital Management Trust, referred to hereafter as the “Fund”) as of September 30, 2023, the related statement of operations for the year ended September 30, 2023, the statement of changes in net assets for each of the two years in the period ended September 30, 2023, including the related notes, and the financial highlights for each of the five years in the period ended September 30, 2023 (collectively referred to as the “financial statements”). In our opinion, the financial statements present fairly, in all material respects, the financial position of the Fund as of September 30, 2023, the results of its operations for the year then ended, the changes in its net assets for each of the two years in the period ended September 30, 2023, and the financial highlights for each of the five years in the period ended September 30, 2023 in conformity with accounting principles generally accepted in the United States of America.
Basis for Opinion
These financial statements are the responsibility of the Fund’s management. Our responsibility is to express an opinion on the Fund’s financial statements based on our audits. We are a public accounting firm registered with the Public Company Accounting Oversight Board (United States) (PCAOB) and are required to be independent with respect to the Fund in accordance with the U.S. federal securities laws and the applicable rules and regulations of the Securities and Exchange Commission and the PCAOB.
We conducted our audits of these financial statements in accordance with the standards of the PCAOB. Those standards require that we plan and perform the audit to obtain reasonable assurance about whether the financial statements are free of material misstatement, whether due to error or fraud.
Our audits included performing procedures to assess the risks of material misstatement of the financial statements, whether due to error or fraud, and performing procedures that respond to those risks. Such procedures included examining, on a test basis, evidence regarding the amounts and disclosures in the financial statements. Our audits also included evaluating the accounting principles used and significant estimates made by management, as well as evaluating the overall presentation of the financial statements. Our procedures included confirmation of securities owned as of September 30, 2023 by correspondence with the custodian and brokers; when replies were not received from brokers, we performed other auditing procedures. We believe that our audits provide a reasonable basis for our opinion.
/s/ PricewaterhouseCoopers LLP
Los Angeles, California
November 22, 2023
We have served as the auditor of one or more investment companies in Causeway Capital Management Investment Company Complex since 2001.
| | | | | | |
| | | |
| 26 | | Causeway International Value Fund | | | | |
N O T I C E T O S H A R E H O L D E R S (Unaudited)
The information set forth below is for the Fund’s fiscal year as required by federal laws. Shareholders, however, must report distributions on a calendar year basis for income tax purposes, which may include distributions for portions of two fiscal years of the Fund. Accordingly, the information needed by shareholders for income tax purposes will be sent to them in early 2024. Please consult your tax adviser for proper treatment of this information.
For the fiscal year ended September 30, 2023, the Fund is designating the following items with regard to distributions paid during the year:
| | | | | | | | |
(A) | | (B) | | (C) | | (D) | | (E) |
| | | | |
Long Term Capital Gains Distributions (Tax Basis) | | Ordinary Income Distributions (Tax Basis) | | Tax Exempt Distributions (Tax Basis) | | Total Distributions (Tax Basis) | | Dividends (1) for Corporate Dividends Received Deduction (Tax Basis) |
0.00% | | 100.00% | | 0.00% | | 100.00% | | 0.00% |
| | | | |
(F) | | (G) | | (H) | | (I) | | |
| | | | |
Qualified Dividend Income | | Interest Related Dividends | | Qualified Short-Term Capital Gain Dividends | | Qualified Foreign Tax Credit Pass Through | | |
99.05% | | 0.00% | | 0.00% | | 12.54% | | |
(1) Qualified Dividends represent dividends which qualify for the corporate dividends received deduction.
Items (A), (B), (C) and (D) are based on a percentage of the Fund’s total distribution including pass-through as foreign tax credit.
Item (E) is based on a percentage of ordinary income distributions of the Fund.
Item (F) represents the amount of “Qualified Dividend Income” as defined in the Jobs and Growth Tax Relief Reconciliation Act of 2003 and is reflected as a percentage of “Ordinary Income Distributions.” It is the Fund’s intention to designate the maximum amount permitted by the law up to 100%.
Item (G) is the amount of “Interest Related Dividends” as created by the American Jobs Creation Act of 2004 and is reflected as a percentage of net investment income distributions that is exempt from U.S. withholding tax when paid to foreign investors.
Item (H) is the amount of “Qualified Short-Term Capital Gain Dividends” as created by the American Jobs Creation Act of 2004 and is reflected as a percentage of short-term capital gain distributions that is exempt from U.S. withholding tax when paid to foreign investors.
Item (I) is the amount of “Qualifying Foreign Taxes” as a percentage of ordinary distribution during the fiscal year ended September 30, 2023. The Fund accrued Foreign taxes during the fiscal year ended September 30, 2023, amounted to $14,530,701 and are expected to be passed through to shareholders as foreign tax credits on Form 1099 – Dividend for the year ended December 31, 2023. In addition, for the fiscal year ended September 30, 2023, gross income derived from sources within foreign countries amounted to $156,631,565 for the Fund.
| | | | | | |
| | | |
| | Causeway International Value Fund | | | 27 | |
T R U S T E E S A N D O F F I C E R S I N F O R M A T I O N (Unaudited)
Information pertaining to the Trustees and Officers of the Trust is set forth below. Trustees who are not deemed to be “interested persons” of the Trust as defined in the 1940 Act are referred to as “Independent Trustees.” The Trust’s Statement of Additional Information (“SAI”) includes additional information about the Trustees and Officers. The SAI may be obtained without charge by calling 1-866-947-7000.
| | | | | | | | | | | | |
Name,Address Age1 | | Position(s) Held with the Company | | Term of Office and Length of Time Served2 | | Principal Occupation(s) During Past 5 Years | | Number of Portfolios in Trust Complex Overseen by Trustee3 | | | Other Directorships Held by Trustee4 |
| | | | | |
INDEPENDENT TRUSTEES | | | | | | | | | | | |
John R. Graham Age: 62 | | Trustee; Chairman of the Board since 1/19 | | Trustee since 10/08; Audit Chairman 4/13-12/18 | | Film Composer (since 2005); Senior Vice President, Corporate Financial Development and Communications, The Walt Disney Company (2004-2005); Senior Vice President, Mergers and Acquisitions, Lehman Brothers Inc. (2000-2004). | | | 6 | | | None. |
Lawry J. Meister Age: 61 | | Trustee | | Since 10/08 | | President, Steaven Jones Development Company, Inc. (real estate firm) (since 1995); President, Creative Office Properties (real estate firm) (since 2012). | | | 6 | | | None. |
Victoria B. Rogers Age: 62 | | Trustee | | Since 4/13 | | President, Chief Executive Officer and Director, The Rose Hills Foundation (since 1996). | | | 6 | | | Director, TCW Funds, Inc. and TCW Strategic Income Fund, Inc. |
| | | | | |
Eric H. Sussman Age: 57 | | Trustee; Chairman of the Audit Committee since 1/19 | | Trustee since 9/01; Audit Chairman 10/04-4/12; Board Chairman 4/13-12/18 | | Adjunct Professor (since July 2017), Senior Lecturer (June 2011-July 2017) and Lecturer (1995-June 2011), Anderson Graduate School of Management, University of California, Los Angeles; Managing Partner, Clear Capital, LLC (since 2009); President, Amber Capital, Inc. (real estate investment and financial planning firm) (since 1993); Managing Partner, Clear Capital, LLC (real estate investment firm) (since 2008). | | | 6 | | | None. |
| | | | | | |
| | | |
| 28 | | Causeway International Value Fund | | | | |
T R U S T E E S A N D O F F I C E R S I N F O R M A T I O N (Unaudited)
(continued)
| | | | | | | | | | |
Name,Address Age1 | | Position(s) Held with the Company | | Term of Office and Length of Time Served2 | | Principal Occupation(s) During Past 5 Years | | Number of Portfolios in Trust Complex Overseen by Trustee3 | | Other Directorships Held by Trustee4 |
| | | | | |
Officers | | | | | | | | | | |
Gracie V. Fermelia 11111 Santa Monica Blvd., 15th Floor Los Angeles, CA 90025 Age: 62 | | President | | Since 10/20 | | Chief Operating Officer and member of the Investment Adviser or the Investment Adviser’s parent (since 2001); Chief Compliance Officer of the Investment Adviser and the Trust (2005-2015). | | N/A | | None. |
Kurt J. Decko 11111 Santa Monica Blvd., 15th Floor Los Angeles, CA 90025 Age: 48 | | Chief Compliance Officer and Assistant Secretary | | Since 1/15 | | Chief Compliance Officer of the Investment Adviser (since January 2015); General Counsel of the Investment Adviser (since October 2020); member of the Investment Adviser’s parent (since 2021). | | N/A | | N/A |
Eric Olsen5 One Freedom Valley Drive Oaks, PA 19456 Age: 53 | | Treasurer | | Since 3/21 | | Director, Fund Accounting, SEI Investments Global Funds Services (since 2021); Deputy Head of Fund Operations, Traditional Assets, Aberdeen Standard Investments (2013-2021). | | N/A | | N/A |
Gretchen W. Corbell 11111 Santa Monica Blvd., 15th Floor Los Angeles, CA 90025 Age: 52 | | Secretary | | Since 10/11 | | Deputy General Counsel of the Investment Adviser (since 2022) (various positions since 2004). | | N/A | | N/A |
Matthew M. Maher5 One Freedom Valley Drive Oaks, PA 19456 Age: 48 | | Vice President and Assistant Secretary | | Since 2/20 | | Corporate Counsel of the Administrator (since 2018). | | N/A | | N/A |
Mindy Yu 11111 Santa Monica Blvd., 15th Floor Los Angeles, CA 90025 Age: 42 | | Anti-Money Laundering Compliance Officer | | Since 8/22 | | Deputy General Counsel of the Investment Adviser (since 2022) (various positions since 2012). | | N/A | | N/A |
| | | | | | |
| | | |
| | Causeway International Value Fund | | | 29 | |
T R U S T E E S A N D O F F I C E R S I N F O R M A T I O N (Unaudited)
(concluded)
| 1 | Each Trustee may be contacted by writing to the Trustee c/o Causeway Capital Management Trust, One Freedom Valley Drive, Oaks, PA 19456. |
| 2 | Each Trustee holds office during the lifetime of the Trust or until his or her sooner resignation, retirement, removal, death or incapacity in accordance with the Trust’s Declaration of Trust. The president, treasurer, secretary and other officers each holds office at the pleasure of the Board of Trustees or until he or she sooner resigns in accordance with the Trust’s Bylaws. |
| 3 | The “Trust Complex” consists of all registered investment companies for which Causeway Capital Management LLC serves as investment adviser. As of September 30, 2023, the Trust Complex consisted of one investment company with six portfolios — International Value Fund, Emerging Markets Fund, Global Value Fund, International Opportunities Fund, International Small Cap Fund, and Concentrated Equity Fund. |
| 4 | Directorships of companies required to report to the Securities and Exchange Commission under the Securities Exchange Act of 1934 (i.e., “public companies”) or other investment companies registered under the 1940 Act. |
| 5 | These officers of the Trust also serve as officers of one or more mutual funds for which SEI Investments Company or an affiliate acts as investment manager, administrator or distributor. |
| | | | | | |
| | | |
| 30 | | Causeway International Value Fund | | | | |
D I S C L O S U R E O F F U N D E X P E N S E S (Unaudited)
As a shareholder of the Fund, you incur two types of costs: (1) transaction costs, including redemption fees (if any), and (2) ongoing costs, including management fees, shareholder service fees, and other Fund expenses. It is important for you to understand the impact of these costs on your investment returns.
Ongoing operating expenses are deducted from a mutual fund’s gross income and directly reduce its final investment return. These expenses are expressed as a percentage of a mutual fund’s average net assets; this percentage is known as a mutual fund’s expense ratio.
The following examples use the expense ratio and are intended to help you understand the ongoing costs (in dollars) of investing in the Fund and to compare these costs with those of other mutual funds. The examples are based on an investment of $1,000 made at the beginning of the period shown and held for the entire period (April 1, 2023 to September 30, 2023).
The table on the next page illustrates the Fund’s costs in two ways:
Actual Fund Return. This section helps you to estimate the actual expenses after fee waivers that the Fund incurred over the period. The “Expenses Paid During Period” column shows the actual dollar expense cost incurred by a $1,000 investment in the Fund, and the “Ending Account Value” number is derived from deducting that expense cost from the Fund’s gross investment return.
You can use this information, together with the actual amount you invested in the Fund, to estimate the expenses you paid over that period. Simply divide your actual account value by $1,000 to arrive at a ratio (for example, an $8,600 account value divided by $1,000 = 8.6), then multiply that ratio by the number shown under “Expenses Paid During Period.”
Hypothetical 5% Return. This section helps you compare the Fund’s costs with those of other mutual funds. It assumes that the Fund had an annual 5% return before expenses during the year, but that the expense ratio (Column 3) for the period is unchanged. This example is useful in making comparisons because the Securities and Exchange Commission requires all mutual funds to make this 5% calculation. You can assess the Fund’s comparative cost by comparing the hypothetical result for the Fund in the “Expenses Paid During Period” column with those that appear in the same charts in the shareholder reports for other mutual funds.
NOTE: Because the return is set at 5% for comparison purposes — NOT the Fund’s actual return — the account values shown may not apply to your specific investment.
| | | | | | |
| | | |
| | Causeway International Value Fund | | | 31 | |
D I S C L O S U R E O F F U N D E X P E N S E S (Unaudited)
(concluded)
| | | | | | | | | | | | | | | | |
| | | Beginning
Account
Value
4/01/23 | | | Ending
Account
Value
9/30/23 | | | Annualized
Expense Ratios | | | Expenses
Paid During
Period* | |
Causeway International Value Fund | | | | | | | | | | | | | | | | |
Actual Fund Return | | | | | | | | | | | | | | | | |
Institutional Class | | | $1,000.00 | | | | $1,014.90 | | | | 0.88% | | | | $4.44 | |
Hypothetical 5% Return | | | | | | | | | | | | | | | | |
Institutional Class | | | $1,000.00 | | | | $1,020.66 | | | | 0.88% | | | | $4.46 | |
Actual Fund Return | | | | | | | | | | | | | | | | |
Investor Class | | | $1,000.00 | | | | $1,013.30 | | | | 1.13% | | | | $5.70 | |
Hypothetical 5% Return | | | | | | | | | | | | | | | | |
Investor Class | | | $1,000.00 | | | | $1,019.40 | | | | 1.13% | | | | $5.72 | |
| * | Expenses are equal to the Fund’s annualized expense ratio multiplied by the average account value over the period, multiplied by 183/365 (to reflect the one-half year period.) |
| | | | | | |
| | | |
| 32 | | Causeway International Value Fund | | | | |
S T A T E M E N T R E G A R D I N G B A S I S F O R R E N E W A L
O F I N V E S T M E N T A D V I S O R Y A G R E E M E N T (Unaudited)
At a meeting on August 23, 2023, the Trustees considered and approved the renewal of the investment advisory agreement (the “Advisory Agreement”) between Causeway Capital Management Trust (the “Trust”) and Causeway Capital Management LLC (the “Adviser”) with respect to Causeway International Value Fund (the “Fund”) for a twelve-month period beginning September 20, 2023. Section 15(c) of the Investment Company Act of 1940, as amended (the “1940 Act”) requires the Board of Trustees (the “Board”) of the Trust annually to approve continuance of the Advisory Agreement. Continuance of the Advisory Agreement must be approved by a majority of the Trustees and a majority of the independent Trustees (i.e., Trustees who are not “interested persons” of the Trust as defined in the 1940 Act). The Board was comprised of four independent Trustees when the continuation of the Advisory Agreement was considered.
Information Received. At each regular quarterly meeting, the Board reviews a wide variety of materials relating to the nature, extent and quality of the Adviser’s services, including information concerning the Fund’s performance. In addition, at a special meeting on June 5, 2023, the Trustees received and reviewed extensive quantitative and qualitative materials prepared by the Adviser relating to the Advisory Agreement in response to information requested on the independent Trustees’ behalf by their independent legal counsel. At the June special meeting, the Trustees also received and reviewed a report prepared by Broadridge Financial Solutions, Inc. providing comparative expense and performance information about the Fund to assist with the annual review of the Advisory Agreement. Following that meeting, the Trustees requested additional information, and received and reviewed further materials prepared by the Adviser relating to their consideration of the renewal of the Advisory Agreement at the August 23, 2023 meeting.
Factors Considered. In reviewing the Advisory Agreement, the Trustees considered a number of factors including, but not limited to: (1) the nature, extent and quality of the services provided by the Adviser, (2) the investment performance of the Fund, (3) comparisons of the services rendered and the amounts paid under the Advisory Agreement with those of other funds and those of the Adviser under other investment advisory agreements with other registered investment companies and other types of clients, (4) the costs of the services provided and estimated profits realized by the Adviser and its affiliates from their relationship with the Fund, (5) the extent to which economies of scale would be realized as the Fund grows and whether fee levels reflect these economies of scale for the benefit of Fund investors, and (6) any other benefits derived by the Adviser from its relationship with the Fund.
First, regarding the nature, extent and quality of the services provided by the Adviser, the Trustees considered, among other things, the Adviser’s personnel, experience, track record and compliance program. The Trustees considered the qualifications, backgrounds and responsibilities of the Adviser’s principal personnel who provide services to the Fund, as well as the level of attention those individuals provide to the Fund. The Trustees noted the Adviser’s commitment to devoting resources to staffing and technology in support of its investment management services. They also reviewed the Adviser’s investment philosophy and processes and its compliance program, its various administrative, legal and regulatory responsibilities, and considered the scope of the Adviser’s services to the Fund. The Trustees concluded that the nature, extent and quality of the services provided by the Adviser should continue to benefit the Fund and its shareholders.
| | | | | | |
| | | |
| | Causeway International Value Fund | | | 33 | |
S T A T E M E N T R E G A R D I N G B A S I S F O R R E N E W A L
O F I N V E S T M E N T A D V I S O R Y A G R E E M E N T (Unaudited)
(continued)
Second, regarding the investment performance of the Fund, the Trustees reviewed the investment results of the Fund for various periods ended March 31, 2023, compared to the results of the MSCI EAFE Index (Gross), the median of the mutual funds included in the Morningstar Foreign Large Value category, and the median of the funds in a peer group selected by Broadridge. They noted that, consistent with Broadridge’s practice, the Broadridge 15(c) Report focused on one class of shares – the Institutional Class – and that Investor Class shares are subject to a 25 basis point shareholder service fee, which increases expenses and reduces performance from that shown. They noted that the Institutional Class had outperformed its Broadridge peer group median for the prior one, and annualized three, five, and ten-year periods. The Trustees considered the Fund’s exposure to the value investment style, and global uncertainties and volatility, and concluded that the overall performance results and other considerations supported their view that the Adviser’s services to the Fund are of a high quality. The Trustees concluded that the Adviser’s record in managing the Fund in a manner consistent with the described investment strategy and style indicated that its continued management had the potential to benefit the Fund and its shareholders.
Third, regarding the Fund’s advisory fee and total expenses as a percentage of the Fund’s average daily net assets:
| | • | | The Trustees compared the Fund’s advisory fee and total expenses with those of other similar mutual funds. They noted that the Fund’s advisory fee was 80 basis points per annum compared to a median of 78 basis points for its Broadridge peer group and a range of 66-100 basis points for the funds in its peer group. The Trustees noted that the Fund’s Institutional Class annual expense ratio, after application of the Adviser’s expense limit, of 88 basis points was 2 basis points higher than the median of the funds in its Broadridge peer group and within the range of 71-106 basis points of the funds in its peer group. |
| | • | | The Trustees compared the Fund’s advisory fee with the fees charged by the Adviser to other clients. The Trustees noted that, although the fees paid by the Adviser’s other accounts were lower than the fee paid by the Fund, the differences appropriately reflected the Adviser’s significantly greater responsibilities with respect to the Fund and the risks of managing a sponsored fund, and are not determinative of whether the fees charged to the Fund are fair. The Trustees noted that the Adviser’s services to the Fund included the provision of many additional or more extensive administrative and shareholder services (such as services related to the Fund’s disclosure documents, financial statements, 1940 Act compliance policies and procedures, preparation of Board and committee materials and meetings, annual Board reports and certifications, oversight of daily valuation, oversight of Fund service providers, negotiation of Fund intermediary agreements, coordination with Fund intermediaries providing shareholder recordkeeping services, shareholder communications, and due diligence for advisers, consultants and institutional investors). |
The Trustees concluded that the Fund’s advisory fee and expense ratio were reasonable and appropriate under the circumstances.
Fourth, the Trustees considered the Adviser’s costs of providing services to the Fund and estimated profits realized by the Adviser from its relationship with the Fund. They reviewed the Adviser’s estimated after-tax profit margin
| | | | | | |
| | | |
| 34 | | Causeway International Value Fund | | | | |
S T A T E M E N T R E G A R D I N G B A S I S F O R R E N E W A L
O F I N V E S T M E N T A D V I S O R Y A G R E E M E N T (Unaudited)
(concluded)
with respect to such services for the twelve months ended March 31, 2023 and the methodology used to generate that estimate, and noted that the cost allocation methodology presented to the Trustees was reasonable. They also observed that the Adviser’s estimated profitability was within the range cited as reasonable in various court decisions, and had decreased from the prior year. After consideration of these matters, the Trustees concluded that the Adviser’s operating margin with respect to its relationship with the Fund was reasonable.
Fifth, regarding economies of scale, the Trustees observed that, although the Fund’s advisory fee schedule does not contain fee breakpoints, it is difficult to determine the existence or extent of any economies of scale. They noted that the Adviser is sharing economies of scale through reasonable advisory fee levels, expense limit agreements, and devoting additional resources to staff and technology, including cybersecurity, to focus on continued performance and service to the Fund’s shareholders. They considered certain initiatives and noted that the Adviser continues to innovate and enhance its capabilities, and that innovation is a means of reinvesting in its services. They also noted the entrepreneurial risks taken by the Adviser in forming the Fund and that, in the Fund’s prior years, the Adviser incurred losses in managing the Fund. The Trustees concluded that under the circumstances the Adviser is sharing any economies of scale with the Fund appropriately.
Sixth, regarding any other benefits derived by the Adviser from its relationship with the Fund – often called “fall-out” benefits — the Trustees observed that the Adviser does not earn “fall-out” benefits such as affiliated custody fees, affiliated transfer agency fees, affiliated brokerage commissions, profits from rule 12b-1 fees, “contingent deferred sales commissions” or “float” benefits on short-term cash. The Trustees concluded that the primary “fall-out” benefit received by the Adviser is research services provided by brokers used by the Fund and that this benefit is reasonable in relation to the value of the services that the Adviser provides to the Fund.
Approval. At the June 5, 2023 and August 23, 2023 meetings, the Trustees discussed the information and factors noted above with representatives of the Adviser and, at the August 23, 2023 meeting, the Trustees considered the approval of the Advisory Agreement. The independent Trustees also met in a private session at all meetings with independent counsel at which no representatives of the Adviser were present. In their deliberations, the independent Trustees did not identify any particular information or factor that was determinative or controlling, each Trustee did not necessarily attribute the same weight to each factor, and the foregoing summary does not detail all the matters considered. Based on their review, the Trustees (all of whom are independent) unanimously concluded that the Advisory Agreement is fair and reasonable to the Fund and its shareholders and that the Fund’s advisory fee is reasonable and renewal of the Advisory Agreement is in the best interests of the Fund and its shareholders, and the Board of Trustees unanimously approved renewal of the Advisory Agreement for a twelve-month period beginning September 20, 2023.
| | | | | | |
| | | |
| | Causeway International Value Fund | | | 35 | |
INVESTMENT ADVISER:
Causeway Capital Management LLC
11111 Santa Monica Boulevard
15th Floor
Los Angeles, CA 90025
DISTRIBUTOR:
SEI Investments Distribution Co.
One Freedom Valley Drive
Oaks, PA 19456
To determine if the Fund is an appropriate investment for you, carefully consider the Fund’s investment objectives, risk factors, charges and expenses before investing. Please read the summary or full prospectus carefully before you invest or send money. To obtain additional information including charges, expenses, investment objectives, or risk factors, or to open an account, call 1.866.947.7000, or visit us online at www.causewayfunds.com.
The Fund files its complete schedule of portfolio holdings with the Securities and Exchange Commission (“Commission”) for the first and third quarters of each fiscal year on Form N-PORT within sixty days after the end of the period. The Fund’s Forms N-PORT are available on the Commission’s website at http://www.sec.gov, and may be reviewed and copied at the Commission’s Public Reference Room in Washington, DC. Information on the operation of the Public Reference Room may be obtained by calling 1-800-SEC-0330.
A description of the policies and procedures that the Fund uses to determine how to vote proxies relating to portfolio securities, as well as information relating to how the Fund voted proxies relating to portfolio securities during the most recent 12-month period ended June 30, is available (i) without charge, upon request, by calling 1-866-947-7000; and (ii) on the Commission’s website at http://www. sec.gov.
CCM-AR-001-2200
(b) Not applicable.
The registrant has adopted a code of ethics that applies to the registrant’s principal executive officer, principal financial officer and principal accounting officer. During the fiscal year ended September 30, 2023, there were no material changes or waivers to the code of ethics.
| Item 3. Audit | Committee Financial Expert. |
(a)(1) The registrant’s board of trustees has determined that the registrant has at least one audit committee financial expert serving on the audit committee.
(a)(2) The audit committee financial experts are Eric Sussman, Lawry Meister, John Graham and Victoria B. Rogers. Each audit committee financial expert is “independent” as that term is defined in Form N-CSR Item 3(a)(2).
| Item 4. Principal | Accountant Fees and Services. |
Aggregate fees billed to the registrant for professional services rendered by the registrant’s principal accountant for the fiscal years ended September 30, 2023 and September 30, 2022 were as follows:
| | | | | | | | | | |
| | | | |
| | | | | 2023 | | | 2022 | |
| (a) | | Audit Fees | | $ | 308,780 | | | $ | 288,580 | |
| (b) | | Audit-Related Fees | | | None | | | | None | |
| (c) | | Tax Fees(1) | | $ | 68,520 | | | $ | 64,080 | |
| (d) | | All Other Fees | | | None | | | | None | |
| (1) | | Tax fees include amounts related to tax return and excise tax calculation reviews and foreign tax reclaim services. |
(e)(1) The registrant’s audit committee has adopted a charter that requires it to pre-approve the engagement of auditors to (i) audit the registrant’s financial statements, (ii) provide other audit or non-audit services to the registrant, or (iii) provide non-audit services to the registrant’s investment adviser if the engagement relates directly to the operations and financial reporting of the registrant.
(e)(2) No services included in paragraphs (b) through (d) of this Item were approved by the audit committee pursuant to paragraph (c)(7)(i)(C) of Rule 2-01 of Regulation S-X.
(f) Not applicable.
(g) For the fiscal year ended September 30, 2023, the aggregate non-audit fees billed by the registrant’s accountant for services rendered to the registrant and the registrant’s investment adviser were $868,973. For the fiscal year ended September 30, 2022, the aggregate non-audit fees billed by the registrant’s accountant for services rendered to the registrant and the registrant’s investment adviser were $735,331.
(h) The audit committee considered whether the provision of non-audit services rendered to the registrant’s investment adviser by the registrant’s principal accountant that were not pre-approved pursuant to paragraph (c)(7)(ii) of Rule 2-01 of Regulation S-X was compatible with maintaining the principal accountant’s independence.
(i) Not Applicable. The Registrant has not retained, for the preparation of the audit report on the financial statements included in the Form N-CSR, a registered public accounting firm that has a branch or office that is located in a foreign jurisdiction and that the Public Company Accounting Oversight Board (the “PCAOB”) has determined that the PCAOB is unable to inspect or investigate completely because of a position taken by an authority in the foreign jurisdiction.
(j) Not Applicable. The Registrant is not a “foreign issuer,” as defined in 17 CFR 240.3b-4.
| Item 5. | Audit Committee of Listed Registrants. |
Not applicable to open-end management investment companies.
| Item 6. | Schedule of Investments |
Schedule of Investments is included as part of the Report to Shareholders filed under Item 1 of this form.
| Item 7. Disclosure | of Proxy Voting Policies and Procedures for Closed-End Management Investment Companies. |
Not applicable to open-end management investment companies.
| Item 8. | Portfolio Managers of Closed-End Management Investment Companies |
Not applicable. Effective for closed-end management investment companies for fiscal years ending on or after December 31, 2005.
| Item 9. | Purchases of Equity Securities by Closed-End Management Investment Company and Affiliated Purchasers. |
Not applicable to open-end management investment companies.
| Item 10. | Submission of Matters to a Vote of Security Holders. |
There have been no material changes to the registrant’s procedures by which shareholders may recommend nominees to the registrant’s board of trustees during the period covered by the report.
| Item 11. | Controls and Procedures. |
(a) The registrant’s principal executive and principal financial officers, or persons performing similar functions, have concluded that the registrant’s disclosure controls and procedures, as defined in Rule 30a-3(c) under the Act (17 CFR §270.30a-3(c)) as of a date within 90 days of the filing date of the report, are effective based on the evaluation of these controls and procedures required by Rule 30a-3(b) under the Act (17 CFR §270.30a-3(b)) and Rules 13a-15(b) or 15d-15(b) under the Exchange Act (17 CFR §240.13a-15(b) or §240.15d-15(b)).
(b) There were no changes in the registrant’s internal control over financial reporting (as defined in Rule 30a-3(d) under the Act (17CFR §270.30a-3(d)) that occurred during the period covered by this report that have materially affected, or are reasonably likely to materially affect, the registrant’s internal control over financial reporting.
| Item 12. | Disclosure of Securities Lending Activities for Closed-End Management Investment Companies. |
Not applicable to open-end management investment companies.
(a)(1) Code of Ethics attached hereto.
(a)(2) Separate certifications for the principal executive officer and the principal financial officer of the registrant as required by Rule 30a-2(a) under the Investment Company Act of 1940, as amended (17 CFR §270.30a-2(a)) are filed herewith.
(b) Officer certifications as required by Rule 30a-2(b) under the Investment Company Act of 1940, as amended (17 CFR §270.30a-2(b)) also accompany this filing as an exhibit.
SIGNATURES
Pursuant to the requirements of the Securities Exchange Act of 1934 and the Investment Company Act of 1940, the registrant has duly caused this report to be signed on its behalf by the undersigned, thereunto duly authorized.
| | | | | | |
| (Registrant) | | | | | | Causeway Capital Management Trust |
| | | |
| By | | | | | | /s/ Gracie V. Fermelia |
| | | | | | Gracie V. Fermelia, President |
Date: December 8, 2023
Pursuant to the requirements of the Securities Exchange Act of 1934 and the Investment Company Act of 1940, this report has been signed below by the following persons on behalf of the registrant and in the capacities and on the dates indicated.
| | | | | | |
| By | | | | | | /s/ Gracie V. Fermelia |
| | | | | | Gracie V. Fermelia, President |
Date: December 8, 2023
| | | | | | |
| By | | | | | | /s/ Eric Olsen |
| | | | | | Eric Olsen, Treasurer |
Date: December 8, 2023