Free signup for more
- Track your favorite companies
- Receive email alerts for new filings
- Personalized dashboard of news and more
- Access all data and search results
Filing tables
Filing exhibits
LRN similar filings
- 9 Feb 24 Departure of Directors or Certain Officers
- 23 Jan 24 Second Quarter Fiscal 2024 Highlights Compared to 2023
- 7 Dec 23 Submission of Matters to a Vote of Security Holders
- 14 Nov 23 Regulation FD Disclosure
- 24 Oct 23 First Quarter Fiscal 2024 Highlights Compared to 2023
- 15 Aug 23 Earnings Per Share Grows 400% since 2020
- 9 Aug 23 Amendments to Articles of Incorporation or Bylaws
Filing view
External links
Exhibit 99.1
INVESTOR DAY 2023 November 14, 2023
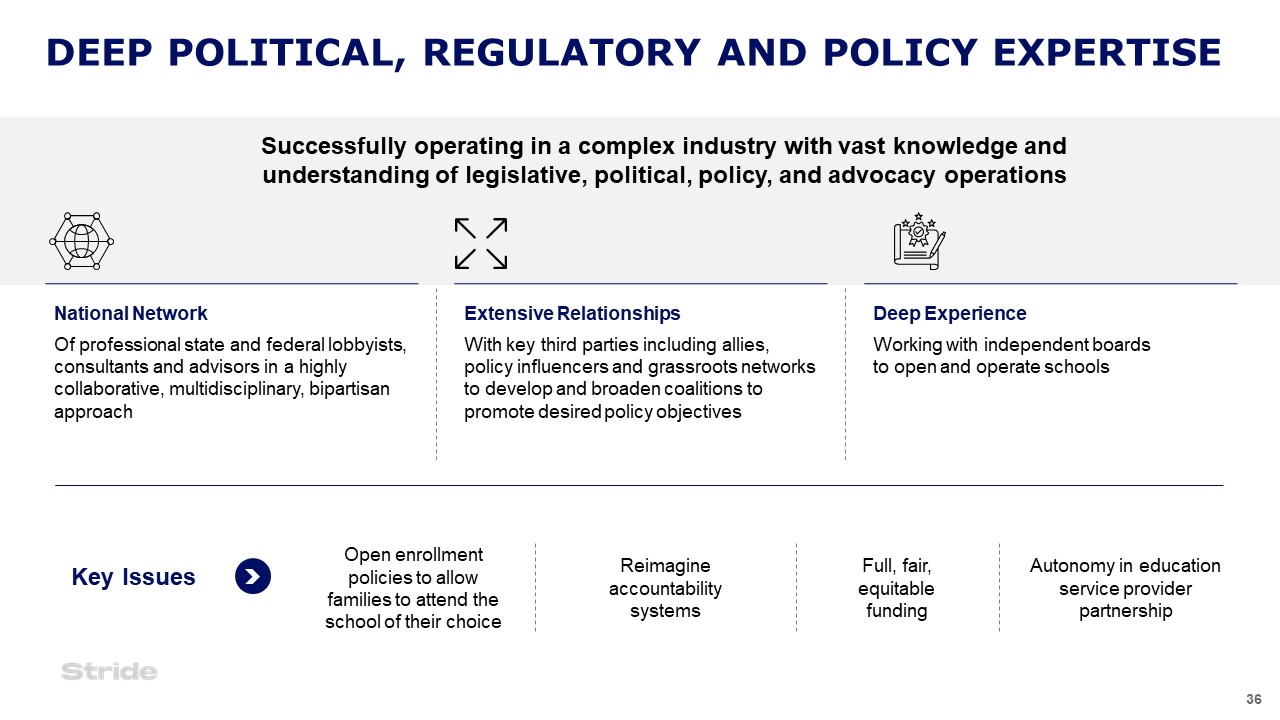
This presentation contains certain forward-looking statements within the meaning of the Private Securities Litigation Reform Act of 1995, which involve substantial risks and uncertainties. All statements in this presentation, except for historical facts, are considered forward-looking statements. We have tried, whenever possible, to identify these forward-looking statements using words such as “anticipates,” “believes,” “estimates,” “continues,” “likely,” “may,” “opportunity,” “potential,” “projects,” “will,” “will be,” “expects,” “plans,” “intends” and similar expressions whether in the negative or affirmative context. These statements reflect our current beliefs and are based upon information currently available to us. Accordingly, such forward-looking statements involve known and unknown risks, uncertainties and other factors which could lead to our actual results, performance or achievements differing materially from those expressed in, or implied by, such statements. These risks, uncertainties, factors and contingencies include, but are not limited to the following: reduction in per pupil funding amounts at the schools we serve; inability to achieve a sufficient level of new enrollments to sustain our business model; limitations of the enrollment data we present, which may not fully capture trends in the performance of our business; failure to enter into new school contracts or renew existing contracts, in part or in their entirety; failure of the schools we serve or ourselves to comply with federal, state and local regulations, resulting in a loss of funding, an obligation to repay funds previously received, or contractual remedies; governmental investigations that could result in fines, penalties, settlements, or injunctive relief; declines or variations in academic performance outcomes of the students and schools we serve, as curriculum standards, testing programs, and state accountability metrics evolve; harm to our reputation resulting from poor performance or misconduct by operators or us in any school in our industry and/or in any school in which we operate; legal and regulatory challenges from opponents of virtual public education or for-profit education companies; changes in national and local economic and business conditions and other factors, such as natural disasters, pandemics, outbreaks of contagious diseases, and other adverse public health developments; discrepancies in the interpretation of legislation by regulatory agencies that may lead to payment or funding disputes; termination of our contracts or a reduction in the scope of services with schools; failure to develop the Career Learning business; entry of new competitors with superior technologies and lower prices; unsuccessful integration of mergers, acquisitions and joint ventures; failure to further develop, maintain, and enhance our technology, products, services and brands; inadequate recruiting, training, and retention of effective teachers and employees; infringement of our intellectual property; disruptions to our Internet-based learning and delivery systems, including, but not limited to, our data storage systems and third-party cloud facilities, resulting from cybersecurity attacks; misuse or unauthorized disclosure of student and personal data; failure to prevent or mitigate a cybersecurity incident that affects our systems; any other risks and uncertainties associated with our business described in the Company’s filings with the Securities and Exchange Commission. Although the Company believes the expectations reflected in such forward-looking statements are based on reasonable assumptions, it can provide no assurance that these expectations will be attained or that any deviation will not be material. All information in this presentation is as of today’s date, and the Company undertakes no obligation to update any forward-looking statement to reflect actual results or changes in the Company’s expectations. SAFE HARBOR
AGENDA Themes Speaker Company Overview & Market Opportunity James Rhyu, CEO Schools James Rhyu, CEO Break New Products & Innovation James Rhyu, CEO Financial Overview & Outlook Donna Blackman, CFO Closing Remarks James Rhyu, CEO Break Q&A Panel James Rhyu, CEO Donna Blackman, CFO Tony Bennett, President, Schools Les Ottolenghi, CITO Todd Goldthwaite, Portfolio Companies Deb Hannah, CMO Val Maddy, CHRO Vince Mathis, General Counsel
Opportunity & Introduction James Rhyu CEO & Member of the Board of Directors
MASSIVE MARKET OPPORTUNITY IN US Total education spending in the US exceedsone trillion dollars, growing at 3% Spending on K-12 schools approaching $700 billion annually, growing at 3% 3% CAGR Direct Government Expenditure on Education, US Expenditures for Elementary & Secondary Education, US 3% CAGR Projected
Stride currently only operates in a few of the educational verticals STRIDE OFFERINGS AND OPPORTUNITIES Immediate Opportunity for Expansion
VIRTUAL EDUCATION PROGRAMS Full Time Online Programs Online programs for K - 12th grade in General Education and middle and high school in Career Learning K-12 programs designed to meet students at their point of need General Education and Career Learning Programs General Education Career Prep
INNOVATIVE EDUCATIONAL OFFERINGS Ability to leverage existing capabilities to expand into new products and markets New Products and Markets New Products and Markets Leveraging current educational assets to expand into large and growing addressable markets
STRONG EXECUTION TRACK RECORD Consistent revenue growth and return to enrollment growth following the pandemic surge Total Revenue ($M) FYE 6/30 Total Enrollment1 (K) QE 9/30 18% CAGR2 Depicts high-low range for guidance 1,960 – 2,030 1. Number based on the number of students enrolled at the end of Q1 (September 30th) of each fiscal year; 2. CAGR based on mid-point of guidance
STRONG EXECUTION TRACK RECORD Profitability growth with solid free cash flow Adj. Operating Income1 ($M) FYE 6/30 Free Cash Flow1 ($M) FYE 6/30 43% CAGR2 1. Adjusted operating income and free case flow are non-GAAP measures. 2. CAGR based on mid-point of guidance or target 150 – 175 35 82 139 137 47% CAGR2 Depicts high-low range for guidance or target
Consistent revenue and profitability growth have resulted in outperformance in the public markets with low price-to-earnings ratios DRIVING STOCKHOLDER VALUE Nasdaq +16% DJI +13% Russell -19% S&P +16% +125% Stride financials as of Sept. 30, 2023; indices financials as of Q2 2023; stock price data from Jan. 27, 2021 to Nov. 10, 2023 * Trailing 12 months ** Forward 12 months Relative Stock Performance Over Time Price-to-Earnings Year Ago* Current* Fwd Estimate** 16.68 15.69 14.49 S&P 19.35 19.37 19.72 Nasdaq 24.27 30.37 26.43 DJI 20.84 25.00 18.72 Russell 87.96 23.45 22.47
Share price outperforming EdTech and EdServices Peers – without multiple expansion DRIVING STOCKHOLDER VALUE +125% Relative Stock Performance Over Time Financials 3-Yr Rev CAGR Consensus EPS EV/Rev Multiple EV/EBITDA Multiple Fwd PE Estimate 9% $3.91 1.4X 7.7X 14.49 Powerschool 17% (0.14) 6.5X 30.1X 21.64 Instructure 20% (0.24) 7.2X 25.5X N/A Pearson N/A 0.60 2.0X 7.3X 14.22 Udemy 18% (0.73) 2.1X NM N/A Coursera 27% (0.85) 3.5X NM 322.58 Chegg 5% 0.12 1.9X 7.8X 7.54 Pearson +11% Chegg -91% Powerschool +20% Instructure +17% Udemy -52% Coursera -58% Stride financials as of Sept. 30, 2023; revenue CAGR use mid-point of current guidance; Pearson EPS converted to USD; PE forward 12 month estimates; stock price data from Jan. 27, 2021 to Nov. 10, 2023
COMPELLING LONG-TERM INVESTMENT THESIS Disruptor in Education Innovator with the scale, expertise & long-term customer relationships to change education Sustainable & Growing Virtual School Business Accelerating secular shift toward virtual education and school choice New Products & Technologies Leveraging capabilities and assets to address market failures or shortcomings Experienced & DiverseLeadership Team Deep educational regulatory & policy expertise Financial Track Record Consistent revenue and profitability growth with a strong balance sheet to support organic and inorganic growth
Market
MACRO TRENDS SUPPORT THE NEED FOR DISRUPTION IN EDUCATION Volatility Uncertainty Chaos
Labor Participation Rate 21% Millennials in the workforce who have changed jobs within one year Millennials who have 2 or more jobs 26% Share of global household wealth owned by top 10% 76% Labor Participation has been declining since the late 1990s/early 2000s Total Student Loan Debt in the US in 2023 $1.57T ECONOMIC UNCERTAINTY
INCREASING VOLATILITY
SIGNIFICANT SHIFTS IN LABOR MARKET Innovations have driven a significant shift in the labor force over the past 50 years, moving toward services-based careers Workforce by Industry (2023) Change from 1973 Job Growth Job Loss
NEW MARKET ENTRANTS HAVE DISRUPTED ALL MAJOR MARKETS IN THE PAST 20+ YEARS Technology and innovation have driven out incumbents at a pace not seen before in history Transportation Media Shopping Finance Transportation Advertising Advertising Transportation Lodging Video Conferencing Employees: 33K Employees: 13K Employees: 1.5M Employees: 128K Employees: 30K Employees: 66K Employees: 182K Employees: 4K Employees: 7K Employees: 8K
Despite the U.S.’ significant investment in education, nearly half of all U.S. public-school students are lagging in educational benchmarks U.S. EDUCATION LAGGING DESPITE INVESTMENT Highest Expenditure Lowest Expenditure Government and Private Expenditures as aPercent of GDP (2019) Americans’ Belief that K-12 Education isHeading in the Right Direction
HISTORICAL LEVELS OF DISSATISFACTION WITH U.S. EDUCATION Parental concern about learning and academic progress 38% Somewhat or Slightly Concerned 48% Extremely orModerately Concerned 14% Not atall Concerned Americans’ Satisfaction with U.S. Public Education The Nation’s Report Card projects that if future National Assessment of Educational Progress score patterns reflect historical trends, it will take decades to return to 2019 levels following the learning loss suffered during the COVID pandemic Coupled with concerns about academic progress
TEACHERS ARE LEAVING FOR OTHER OPPORTUNITIES Performance ofChildren’s Teachers K-12 Parents 7% 20% 37% 36% Only 55% Staffing shortages persist post-pandemic, even as parents express satisfaction with their students’ teachers 36K 2022 Estimated teacher vacancies up over 50% since last year 55K 2023 Of schools are fully staffed with teachers for all classes Fewer local education employees since the start of the pandemic Projected teacher turnover for 2022-23 and 2023-24 12% 100K
THE CURRENT RESPONSE IS FRAGMENTED AND NOT MEETING FAMILY'S NEEDS Of parents considered or searched for a new or different school for their student within the past year (Jan 2023) 54% Of parents favor school choice 66% Although parents are in favor of school choice and looking for options, their preferences are not being met Support for School Choice Options Parent Preferences Do Not Match Actual Enrollments
What do you need to be successful (High School Students)? 21% 2019 Percent of jobs on LinkedIn that don’t require a professional degree 29% 2023 Recruiters onLinkedIn are5 times more likelyto search by skillsthan degrees Of college graduates are in jobs that don’t require a degree Of jobs require specialized skills but not a degree 46% 43% SHIFTING ATTITUDES REGARDING TRADITIONAL FOUR-YEAR DEGREES 49% of High School students believe work experience is more important or as important as a college degree to be successful
U.S. EMPLOYERS’ SKILLS GAP CONTINUES TO GROW 4.4M Demand for workers exceeded supply of trained workers in top 10 career paths 87% Of companies are experiencing or expect to experience a significant skills gap within 3 years Yes Unsure No Do You Believe There is a Gap in the Skills Your Organization Needs and What Your Employees Possess?
27 CHANGE YOUR FUTURE Stride is positioned to change the future of education using technology to enhance student outcomes and prepare the workforce of tomorrow EDUCATION HAS NOT REALLY CHANGED IN 100+ YEARS
Schools
VIRTUAL SCHOOLS CAN PERSONALIZE LEARNING TO SERVE DIVERSE STUDENT NEEDS Additional students who should be labeled Gifted & Talented but are being overlooked 3.6M During the 2020-21 school year, 40% of public schools had a special education teaching vacancy The traditional U.S. public school system was designed to meet the needs of the “average” student, but no student is average Students with Disabilities (1976–2022) 1 in 5 High school students report being bullied in the prior school year
INCREASING DEMAND FOR VIRTUAL EDUCATION Secular Trends Driving Demand Growing acceptance and awareness of virtual and online learning Dissatisfaction with current public school systems Concerns about school safety Desire for more control over what your child is learning Digital-native parents used to learning and getting information online School districts shifting from print to digital format at accelerating rate Top Reasons Parents Enroll Students Concern about Environment at Previous School Politics in Curriculum Religion Struggling Academically Need Discipline Special Needs Value Flexibility & Learning at Own Pace Mobile Family Seeking 1:1 Instruction Need to Catch Up Academically Working Student Athlete Military Family Concern About Health & Overall Wellbeing Bullying Negative Social Experience Behavioral/Social Issues School Safety
Continued commitment to academic outcomes and improving student experience to drive higher satisfaction FOCUS ON CUSTOMER SATISFACTION Stride Satisfaction Metrics Satisfied Net Promoter Score Net Promoter Score 68 61 83% 81% School Curriculum Satisfied
STRONG SCHOOL AND PARTNER RELATIONSHIPS Long-standing customer relationships supported by unique combinationof offerings and expertise Meet Students’Unique Needs ProvideHow-To Expertise DeliverComprehensive Support DriveContinuous Innovation Help students reach their full potential through inspired teaching & personalized learning Apply best practices from 20+ years of experience & serving 2M+ students Provide dedicated support to navigate all aspects of running a school Invest in curriculum, technology, learningsystems & teacher support to ensure success Full time programs in31+ states 90+ Charter/districtcustomer mix 60% / 40%
K-12 FULL-TIME PROGRAMS Nationwide Reach GenEd States Career Learning States GenEd & Career States Students enrolled in full-time programs ~188K FY24 Career learning programs in 27 states and DC 55+ General education programs in 31 states and DC 90+ Student population covered by existing full-time offerings 75%
EXPANSION INTO NEW STATES AND MODELS Utilize multiple models to expand capacity in existing states andadd new states and geographies New States New or Expanded Programs Maryland Massachusetts Nebraska Connecticut New Hampshire California Georgia Nevada Kentucky Florida Louisiana North Carolina OtherModels Part-Time Online Private Programs Vouchers & ESAs Virtual Pre-K
Preparing students for the Three E’s: Education, Employment or Enlistment DRIVING ACADEMIC EXCELLENCE Education Prepare students for postsecondary opportunities with dual-credit options and AP courses Enlistment Prepare students with the skills they need to serve in our nation’s military Employment Ensure students graduate with industry-recognized credentials and are prepared for careers in high-growth, in-demand markets Student Acceptances to Leading Universities
Successfully operating in a complex industry with vast knowledge and understanding of legislative, political, policy, and advocacy operations DEEP POLITICAL, REGULATORY AND POLICY EXPERTISE Key Issues Open enrollment policies to allow families to attend the school of their choice Reimagine accountability systems Autonomy in education service provider partnership Full, fair, equitable funding National Network Of professional state and federal lobbyists, consultants and advisors in a highly collaborative, multidisciplinary, bipartisan approach Extensive Relationships With key third parties including allies, policy influencers and grassroots networks to develop and broaden coalitions to promote desired policy objectives Deep Experience Working with independent boards to open and operate schools
Break
New Offerings
PROVEN SUCCESS ENTERING ADJACENT MARKETS Career Learning Middle and High School programs launched just 7 years ago and now account for over 30% of revenue and enrollments 1. Number based on the number of students enrolled at the end of Q1 (September 30th) of each fiscal year Career Learning MS/HS Enrollment1 ($M) QE 9/30 $587M FY23 Career LearningMS/HS Revenue 93% of parents feel that Career Prep helps their high school student prepare for a career 84% of parents felt that taking career electives adequately prepared teens for college 90% of parents are satisfied with the Career Prep curriculum
ENTERING NEW MARKETS TO MAKE STRIDE PRODUCTS AVAILABLE TO MORE STUDENTS Leveraging existing assets to expand into large, fast-growing markets with a “fail-fast” mentality while incorporating innovative technologies into our core programs to enhance outcomes New Products Tallo Learning Hub Adult Learning E-Sports Tutoring New Technologies Bots G-AI Metaverse
ALLIED HEALTHCARE TRAINING Significant adjacent market opportunity in training and education Increase lifetime value of students (post-graduation) Additional job pathway and placement opportunities Leading assets with high growth and profitability MedCerts revenue grew almost 30% last year, in a large market with further growth potential Market Overall employment in healthcare occupations is projected to grow much faster than the average for all occupations from 2022 to 2032 About 1.8 million openings are projected each year, on average, due to employment growth and the need to replace workers who leave the occupations permanently ~30% RevenueGrowth ~90% GrossMargins 20K+ Enrollmentsin FY23 Proof Points
TUTORING MARKET AND ALIGNMENT Extensive learning loss in public schools: 89% of public schools reported that teachers have expressed concerns about getting students to meet academic standards Tutoring remans in high demand for districts: 87% of districts offer some form of tutoring to students 17% of students are currently participating in tutoring but 45% could benefit 37 state education agencies support tutoring programs $25B U.S. Private Tutoring Market Size (2022) Expected to grow at 10% annually (2022-2027) $3B U.S. Online Tutoring Market Size (2022) Expected to grow at 19% annually (2022-2027) Market
STRIDE TUTORING Leverages state-certified teachers to open a new market opportunity with a differentiated offering Staffed exclusively by state-certified teachers Leverages Stride’s teachers & recruitment Leverages Stride curriculum and online instruction capabilities Full integration across all K-12 subjects, grades, states Leverages team for B2B sales and marketing State-Certified Teachers as Tutors Offerings Across All Subjects English History Math Science ACT SAT
DIGITAL CONTENT MARKET $10B+ $8B+ $2.6B+ 75% Addressable Market for Digital Textbooks District spending on supplemental curriculum solutions Annual total spent by teachers on supplies, an average of $750 each Of parents would like a link to video info about their child's homework Of districts indicated they would be moving toward digital solutions in the next 3-5 years 51% Of districts indicate that they are already offering hybrid options 36% Of district leaders indicated that their district had invested in some form of personalized learning 97% Increase in the number of online tools used by teachers & students since 2019 100%
STRIDE LEARNING HUB Leverages Stride content to deliver short, 5-10-minute lessons to improve outcomes and support parents, teachers and students Expansion of existing assets into larger market opportunity Single platform addressing needs of learners, teachers and parents Cost-efficient approach for school districts and teachers Ability to grow community of users Increase Motivation Improve Retention Boost Confidence
CAREER AND SKILLS TRAINING MARKET 16M 1M+ 10.2M High school students - 4M graduates each year Students choose to not attend college following graduation Young adults without a bachelor's degree 33% Of all young adults aged 18-24 are employed and not in college Of students enrolled in 4-year colleges do not complete their degree within 6 years 56% Sectors # of Entry Level Jobs Technology/IT >200K Allied Health >600K Business >1M
TALLO CAREER PLATFORM Significant market opportunity utilizing existing capabilities Whitespace in early/Gen-Z talent offerings One-stop shop offering addressing needs of learners, schools and enterprises Favorable political and regulatory environment Leverage adult learning companies and partners to provide a suite of solutions for lifelong learning Tallo connects talent to opportunity by providing students the options to explore careers, find learning experiences to acquire the skills needed to succeed and connect them to employers Employer Partners Opportunities Scholarships Internships Apprenticeships Careers Community 2M+ Users 100K+ Jobs 30K+ Courses 17K+ Internships
ESPORTS MARKET 70% 56% Of U.S. parents believe video games positively influence their child Of parents play video games with their children at least once per week 25% 21% esports industry projected CAGR (2019 to 2025P) esports tournaments CAGR (2019 to 2030P) 3.1B+ video gamers 530M+ spectators worldwide 48
STRIDE ESPORTS Fast-growingadjacent market Significant whitespace in educational esports market First mover advantage Additional marketing exposure via esports leagues, etc. Stride esports leverages our existing relationships in the education market to expand into a massive, fast-growing market Minecraft Educational Worlds Atomic Rescue Civil War Egypt Jamestown Library League Ocean Climate Rome Tournaments
Innovation & AI
22% Of students reported using ChatGPT on a weekly basis or more 65% Of students agree that ChatGPT will be an essential tool for students' success in college and the workplace 91% Of teachers believe technology is important to get students back on track from academic losses 73% Of teachers agree that ChatGPT can help students learn at a faster pace 64% Of teachers plan to implement AI more often, from lesson planning, to creating new ideas, and using it as part of the curriculum TECHNOLOGY ADVANCEMENTS ARE RAPIDLYCHANGING EDUCATION Students Teachers Students Teachers
FOUNDATIONAL APPROACH TO INNOVATION & ARTIFICIAL INTELLIGENCE Use technology to improve efficiencies and outcomes across multiple vectors Front Office School Operations Curriculum Teaching Enrollment/Marketing Back Office HR Legal Finance InternalEfficiencies Student Progress Grading Tutoring Assessments Curriculum Improvement 24/7 Support Smart Tutoring/Customer Care Improving Existing Products Personalized Learning GenAI-supported learning pathways Curriculum New Development New Markets Improve speed to market Developing New Products
EMBRACING TECHNOLOGY TO IMPROVE STUDENT OUTCOMES Stride has always been at the forefront of implementing new technologies to improve student outcomes and will continue to embrace innovation Only 1 in 5 Socialization ~50% Amount of time teachers spend on administrative tasks, grading, lesson prep, and family communications Number of college-bound American high school students prepared for college-level courses in STEM #1 Reason for students leaving Stride programs
K12 ZONE ADDRESSES SOCIALIZATION Create your own avatar to engage with friends and other students Check out classes, games, the cafeteria, and explore your school Attend school assemblies andart competitions “I really like being able to talk to my friends, see my teachers, and meet other teachers I might have in junior high” - K12 Student “It’s like a recess for the virtual world in education. It’s a place where you can get to know others without the constraints of being in a classroom” - K12 Teacher Improving socialization in the virtual world using a virtual world built around an in-person experience for school in a safe environment
AI-POWERED CHAT FUNCTIONALITY TO ADDRESS LEARNING LOSS AT SCALE Offers step-by-step guidance Explains academic concepts clearly, aligning to state standards Curates curriculum recommendations for all developmental levels Upholds high academic integrity Provides an engaging user experience Connects learners with human tutors Chat-based tutoring can help students at their point of need and pin-point their challenges at any time of the day Stride Tutor AI Bot
AI-POWERED TEACHER GRADING ADDRESSES ADMINISTRATIVE TIME CONSTRAINTS LessonPlanning/Prep Student & Family Communications 15% 12% Grading Assignments Administrative Tasks 10% 10% Teacher Administrative Time Spent Teachers spend too much time on administrative tasks; technology can allow them to focus on student outcomes
T.I. BY K12 Develop AI-powered interface that students and teachers want to interact with Synthesize and utilize data with AI without losing the human touch Ensure AI adapts to evolving interests and needs of students without stifling individuality Developing intuitive AI-powered experience that builds personalized student personas to deliver customized support, and improve proficiency, retention, and graduation rates Goals
Financial Overview & Outlook Donna Blackman Chief Financial Officer
Adjusted operating income, adjusted EBITDA margin and free cash flow numbers are non-GAAP measures, a reconciliation of these non-GAAP financial measures to the most directly comparable GAAP financial measures is provided in the Appendix to this presentation. 1. Gross margin calculated as revenue less cost of goods sold divided by revenue; 2. Adjusted operating income is defined as income from operations as adjusted for stock-based compensation and amortization of intangible assets; 3. Adjusted EBITDA Margin is defined as Net income as adjusted for, among other things, tax expense (benefit), net interest expense (income), stock-based compensation and depreciation and amortization divided by revenue; 4. Free cash flow is defined as net cash provided by operating activities adjusted for purchase of property and equipment, capitalized software development costs and capitalized curriculum development costs. 5. Cash and cash equivalents as of June 30, 2023. STRONG FINANCIAL FOUNDATION $1.84Bn FY23 Revenue 16% Four-Year CAGR 35% FY23 Gross Margin1 $201Mn FY23 Adj. Operating Income2 33% Four-Year CAGR 16% FY23 Adj. EBITDA Margin3 $137Mn FY23 Free Cash Flow4 $411Mn Cash & Cash Equivalents5
Consistent growth in education fundingover time Narrowing funding gap to brick andmortar schools Improving yield EDUCATION SPENDING SUPPORTS CONSISTENTREVENUE GROWTH Current expenditures per pupil in public elementary and secondary schools, inflation adjusted: Selected years, through 2019-20, NCES 2% CAGR Full-time online students average 30% less in total funding than peers in traditional schools On average, funding for education outpaces inflation U.S. Per Student Expenditures Increases for Virtual K-12 funding driven by
DEMAND AND FUNDING INCREASES DRIVE CONSISTENT REVENUE GROWTH 48% 10% 9% 7%–10% YoY Growth (%) 1,960 – 2,030 Depicts low-high range for guidance Total Revenue ($M) FYE 6/30 Significant addressable market Increased acceptance and awareness of online learning Strength of Career Learning programs High barriers to entry
INCREASING EFFICIENCIES AND IMPROVING MARGINS 400 bps improvement SG&A as a Percent of Revenue Marketing Automation Lower customer acquisition costs by optimizing spending Implement robotic process automation across customer lifecycle, decrease administrative tasks including scheduling and grading Onboarding & School Start Centralization Lower support costs through self-service options and technology implementation, including conversational AI chat bots Use nationwide scale while increasing access, maintaining support levels and improving student outcomes Leverage technology and automation to improve efficiencies
IMPROVING GROSS MARGINS Investments in automation and process improvements Machine learning Robotic process automation Conversational AI chat bots Lower material costs from increased digital access Increased mix of higher-margin and Adult Learning revenue +200–250BPS Depicts low-high range for guidance Gross Margin (%) FYE 6/30 Drivers of Improved Margins
PROFITABILITY GROWTH OUTPACING REVENUE Adjusted operating income and adjusted EBITDA are non-GAAP measures a reconciliation of these non-GAAP financial measures to the most directly comparable GAAP financial measures is provided in the Appendix to this presentation. Leverage in business model leading to strong profitability growth Adj. Operating Income ($M) FYE 6/30 Adj. EBITDA ($M) FYE 6/30 Depicts low-high range for guidance or target
STRONG BALANCE SHEET WITH LOW DEBT Cash, Cash Equivalents & Marketable Securities 545.5 Accounts Receivable, Net 463.7 Accounts Payable 48.9 Total Debt Obligations 469.9 1. Leverage ratio is a non-GAAP measure defined as Net Debt (total debt obligations of $469.9M less cash and cash equivalents of $410.8M) divided by Adjusted EBITDA of $296.2M for the twelve months ended June 30, 2023 Select balance sheet and other information As of June 30, 2023 ($M) Leverageratio1 of 0.2x Cash position, low leverage ratio, and consistent cash flows provide options for capital allocation
Prioritizing organic growth, new product and technology development and synergistic M&A DISCIPLINED CAPITAL ALLOCATION Organic Growth Strategic Acquisitions Capital Return Invest in academic quality and student/customer experience to support outcomes and retention Technology advancements to improve personalization and outcomes Implement innovative products across portfolio Leverage platform across markets/verticals High-growth, high-margin targets providing synergies Evaluate approaches to return cash to stockholders over the long term
STRATEGIC APPROACH TO M&A Focus on alignment to strategy of innovation in education to drive long-term value and outcomes Operates in large or fast-growing nascent addressable market Combined company can accelerate revenue and profitability growth of both businesses Cultural fit and experienced management team Organic revenue growth stronger than underlying Stride growth rates Expected to be accretive to gross margin profile Profitable or clear path to FCF-positive within 12 months of acquisition Well-defined revenue and cost synergies Focus on high growth, higher margin companies in adjacent markets while maintaining our strong financial foundation Strategic Criteria Financial Filters
REAFFIRMING 2024 FINANCIAL GUIDANCE Guidance reaffirmed as of November 14, 2023 Current FY24 Guidance exceeds low end of FY25 targets from November 2020 Investor Day $65M – $75M CapitalExpenditures 25% – 27% Tax Rate $1.96B – $2.03B TotalRevenue + 7 – 10% Y/Y $250M – $275M Adj. OperatingIncome + 24 – 37% Y/Y $1.90B – $2.20B $250M – $350M FY24 Guidance Former FY25 Targets
Long-term financial targets supported by macro trends, new product investments and improving margins INTRODUCING NEW LONG-TERM FINANCIAL TARGETS Total Revenue ($B) 10% CAGR to mid-point 20% CAGR to mid-point Adj. Operating Income ($M) EPS ($) 20% CAGR to mid-point Depicts low-high range for target Adjusted operating income is non-GAAP measures a reconciliation of these non-GAAP financial measures to the most directly comparable GAAP financial measures is provided in the Appendix to this presentation.
Closing Remarks James Rhyu CEO & Member of the Board of Directors
Break
Q&A Panel
Q&A PANEL Donna Blackman Chief Financial Officer James Rhyu CEO and Member of the Board of Directors Dr. Tony Bennett President,Schools Les Ottolenghi Chief Information and Technology Officer Todd Goldthwaite GM, Portfolio Companies Deb Hannah Chief Marketing Officer Vince Mathis General Counsel Val Maddy Chief Human Resources Officer
UPCOMING INVESTOR EVENTS EVENT DATE HOST STRIDE ATTENDEES Non-Deal Roadshow Virtual November 29, 2023 Barrington Donna Blackman, CFO 1:1s BMO 2023 Growth & ESG Conference Virtual December 4, 2023 BMO Donna Blackman, CFO 1:1s 26th Annual Needham Growth Conference NYC January 17, 2024 Needham Donna Blackman, CFO Presentation and 1:1s Q2 FY23 Earnings Call January 26, 2024 James Rhyu, CEO Donna Blackman, CFO
Thank You
Appendix Appendix
RECONCILIATION OF INCOME FROM OPERATIONS TO ADJUSTED OPERATING INCOME 77 77 Year Ended June 30, ($, M) 2020 2021 2022 2023 2024 Guidance Low High Income from operations 32.5 110.5 156.6 165.5 210.5 228.5 Stock-based compensation expense 23.6 39.3 18.6 20.3 28.0 33.0 Amortization of intangible assets 6.0 11.6 13.0 15.2 11.5 13.5 Adjusted operating income 62.1 161.4 188.2 201.0 250.0 275.0
RECONCILIATION OF NET CASH PROVIDED BY OPERATING ACTIVITIES TO FREE CASH FLOW 78 78 Year EndedJune 30, ($, M) 2020 2021 2022 2023 2024 Target Low High Net cash provided by operating activities 80.4 134.2 206.9 203.1 Purchases of property and equipment (1.7) (3.6) (9.7) (4.3) Capitalized software development costs (24.0) (31.3) (42.2) (45.0) Capitalized curriculum development costs (19.3) (17.4) (15.7) (17.2) Free cash flow 35.4 81.9 139.3 136.6 150.0 175.0 Note: We are not able to forecast Net cash provided by operating activities on a forward-looking basis without unreasonable efforts due to the high variability and difficulty in predicting certain items that affect GAAP Net cash provided by operating activities. Free cash flow should not be used to predict Net cash provided by operating activities as the difference between the two measures is variable.
RECONCILIATION OF NET INCOME TO EBITDA AND ADJUSTED EBITDA 79 79 Year EndedJune 30, ($, M) 2020 2021 2022 2023 2024 Target Low High Net income (loss) 24.5 71.5 107.1 126.9 Interest (income) expense, net (0.7) 18.0 8.3 8.4 Other (income) expense, net (0.2) (2.8) 1.2 (15.4) Income tax expense 8.5 24.5 40.1 ��45.3 (Income) loss from equity method investments 0.4 (0.7) (0.1) 0.3 Depreciation and amortization 72.1 90.1 97.9 110.4 EBITDA 104.6 200.6 254.5 275.9 322.0 342.0 Stock-based compensation expense 23.6 39.3 18.6 20.3 28.0 33.0 Adjusted EBITDA 128.2 239.9 273.1 296.2 350.0 375.0 Note: We are not able to forecast Net income (loss) on a forward-looking basis without unreasonable efforts due to the high variability and difficulty in predicting certain items that affect GAAP Net income (loss), including, but not limited to, tax expense, interest expense and impairment expense. Adjusted EBITDA should not be used to predict Net income (loss) as the difference between the two measures is variable.