Exhibit 99.1
Slide: 1 Westfield Financial, Inc.14th Annual KBW Community Bank Investor Conference July 30 – 31, 2013
Slide: 2 Forward – looking statements Today’s presentation may contain “forward-looking statements” which may be identified by the use of suchwords as “believe,” “expect,” “anticipate,” “should,” “planned,” “estimated,” and “potential.” Examples offorward-looking statements include, but are not limited to, estimates with respect to our financial condition and results of operation and business that are subject to various factors which could cause actual results to differ materially from these estimates. These factors include, but are not limited to:changes in the interest rate environment that reduce margins; changes in the regulatory environment; the highly competitive industry and market area in which we operate; general economic conditions, either nationally or regionally, resulting in, among other things, a deterioration in credit quality; changes in business conditions and inflation; changes in credit market conditions;changes in the securities markets which affect investment management revenues; increases in Federal Deposit Insurance Corporation deposit insurance premiums and assessments could adversely affect our financial condition; changes in technology used in the banking business; the soundness of other financial services institutions which may adversely affect our credit risk;certain of our intangible assets may become impaired in the future;our controls and procedures may fail or be circumvented;new line of business or new products and services, which may subject us to additional risks;changes in key management personnel which may adversely impact our operations;the effect on our operations of recent legislative and regulatory initiatives that were or may be enacted in response to the ongoing financial crisis;severe weather, natural disasters, acts of war or terrorism and other external events which could significantly impact our business; andother factors detailed from time to time in our Securities and Exchange Commission (“SEC”) filings.Any or all of our forward-looking statements in today’s presentation or in any other public statements we make may turn out to be wrong. They can be affected by inaccurate assumptions we might make or known or unknown risks and uncertainties. Consequently, no forward-looking statements can be guaranteed. We disclaim any obligation to subsequently revise any forward-looking statements to reflect events or circumstances after the date of such statements, or to reflect the occurrence of anticipated or unanticipated events.
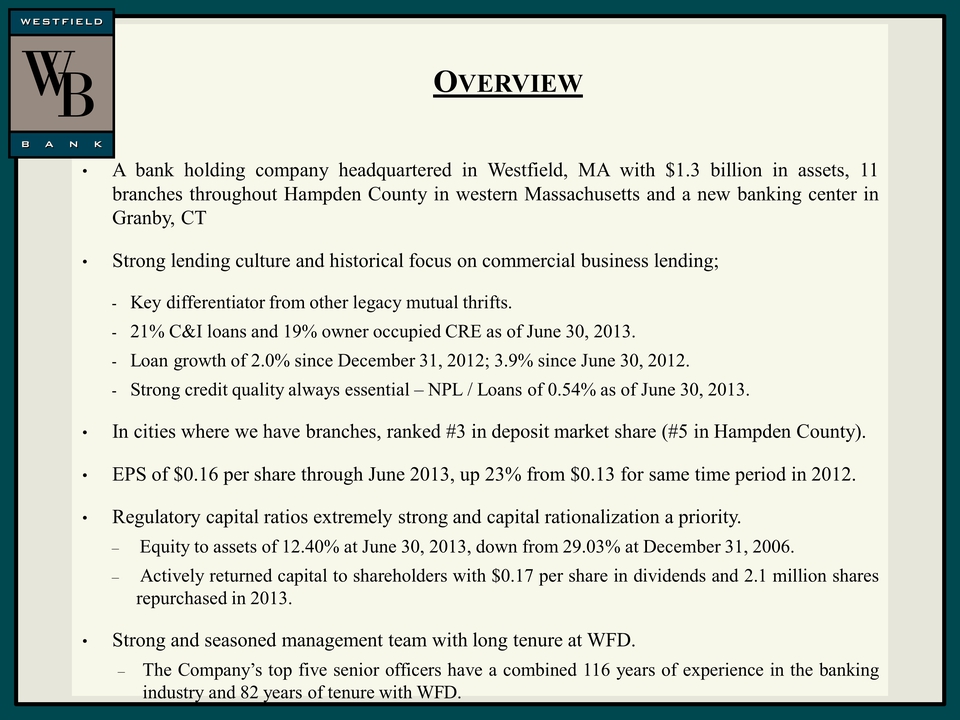
Slide: 3 Overview A bank holding company headquartered in Westfield, MA with $1.3 billion in assets, 11 branches throughout Hampden County in western Massachusetts and a new banking center in Granby, CTStrong lending culture and historical focus on commercial business lending;Key differentiator from other legacy mutual thrifts.21% C&I loans and 19% owner occupied CRE as of June 30, 2013.Loan growth of 2.0% since December 31, 2012; 3.9% since June 30, 2012.Strong credit quality always essential – NPL / Loans of 0.54% as of June 30, 2013.In cities where we have branches, ranked #3 in deposit market share (#5 in Hampden County).EPS of $0.16 per share through June 2013, up 23% from $0.13 for same time period in 2012.Regulatory capital ratios extremely strong and capital rationalization a priority. Equity to assets of 12.40% at June 30, 2013, down from 29.03% at December 31, 2006. Actively returned capital to shareholders with $0.17 per share in dividends and 2.1 million shares repurchased in 2013.Strong and seasoned management team with long tenure at WFD.The Company’s top five senior officers have a combined 116 years of experience in the banking industry and 82 years of tenure with WFD.
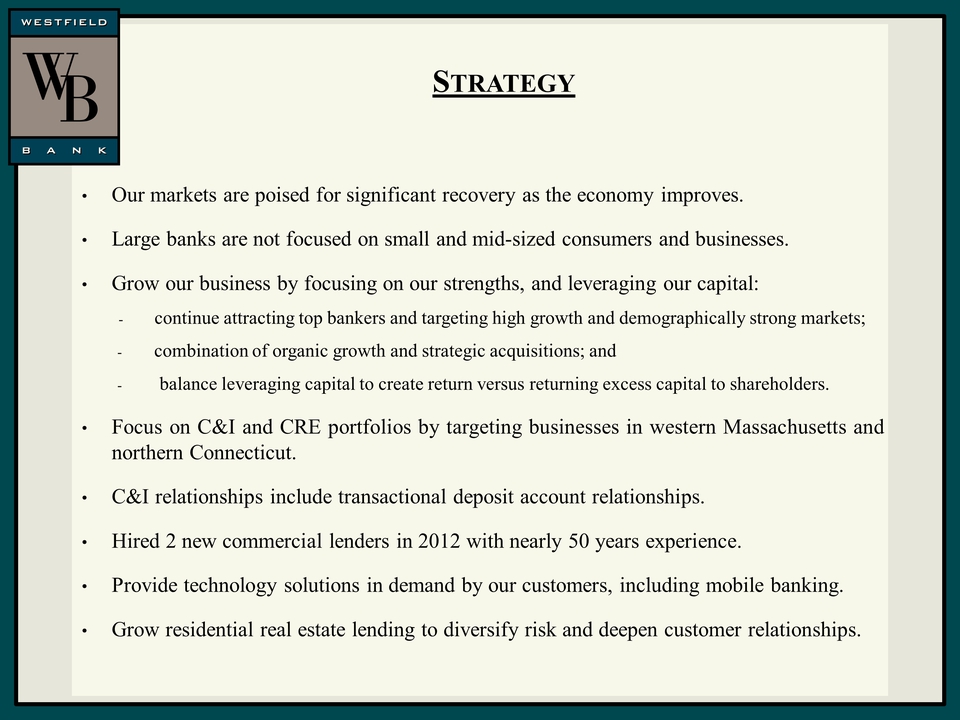
Slide: 4 Strategy Our markets are poised for significant recovery as the economy improves.Large banks are not focused on small and mid-sized consumers and businesses.Grow our business by focusing on our strengths, and leveraging our capital:continue attracting top bankers and targeting high growth and demographically strong markets;combination of organic growth and strategic acquisitions; andbalance leveraging capital to create return versus returning excess capital to shareholders.Focus on C&I and CRE portfolios by targeting businesses in western Massachusetts and northern Connecticut.C&I relationships include transactional deposit account relationships.Hired 2 new commercial lenders in 2012 with nearly 50 years experience.Provide technology solutions in demand by our customers, including mobile banking.Grow residential real estate lending to diversify risk and deepen customer relationships.
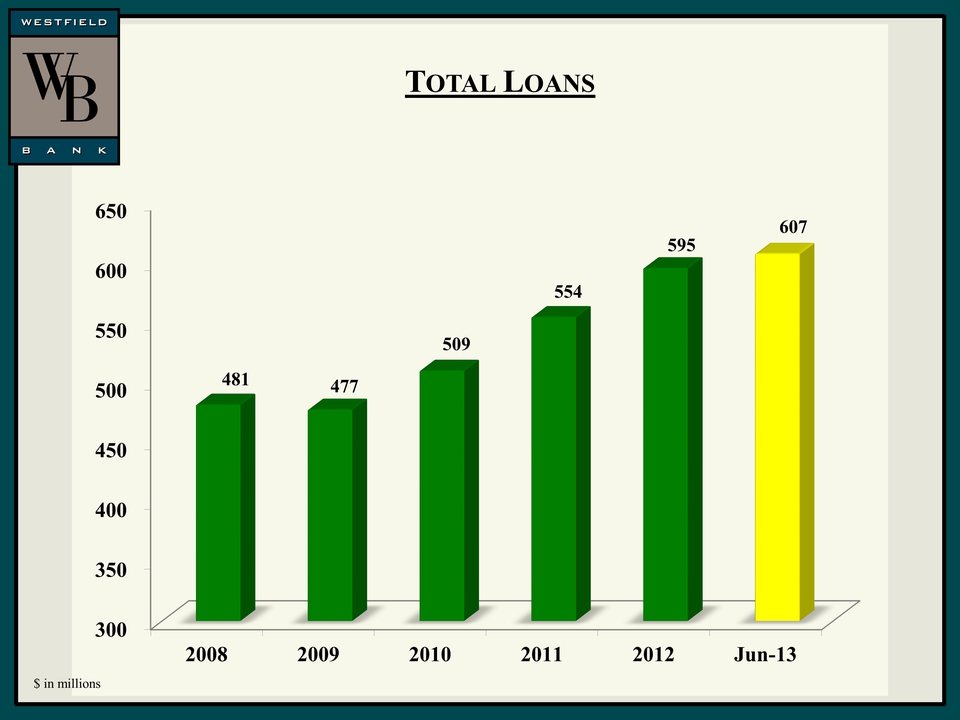
Slide: 5 $ in millions Total Loans
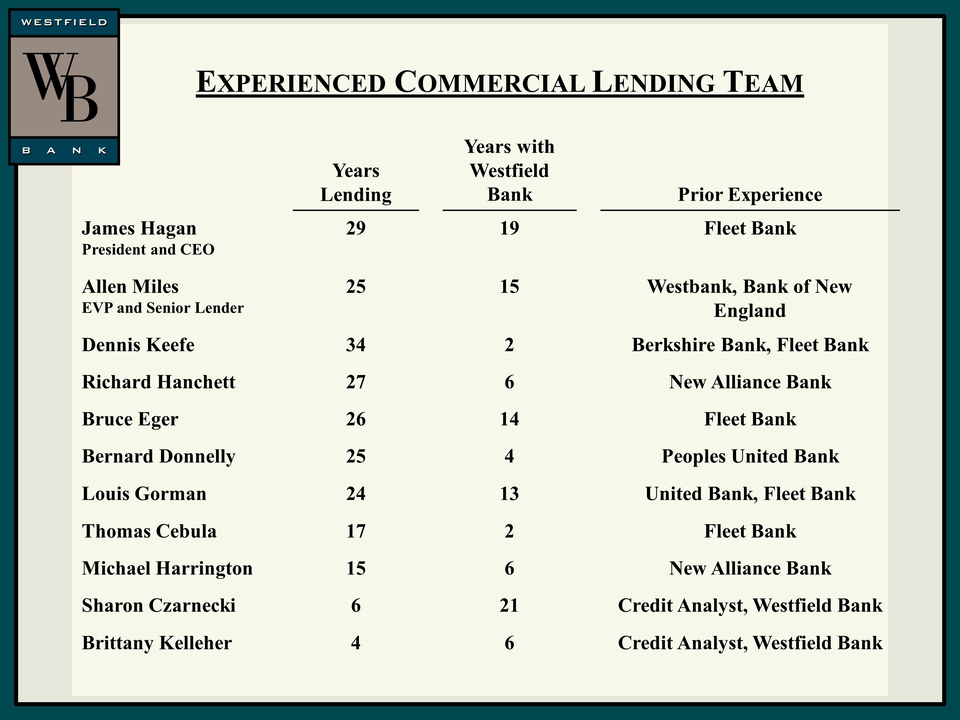
Slide: 6 Experienced Commercial Lending Team EXPERIENCED COMMERCIAL LENDING TEAM Years Lending Years with Westfield Bank Prior Experience James Hagan President and CEO 29 19 Fleet Bank Allen Miles EVP and Senior Lender 25 15 Westbank, Bank of New England Dennis Keefe 34 2 Berkshire Bank, Fleet Bank Richard Hanchett 27 6 New Alliance Bank Bruce Eger 26 14 Fleet Bank Bernard Donnelly 25 4 Peoples United Bank Louis Gorman 24 13 United Bank, Fleet Bank Thomas Cebula 17 2 Fleet Bank Michael Harrington 15 6 New Alliance Bank Sharon Czarnecki 6 21 Credit Analyst, Westfield Bank Brittany Kelleher 4 6 Credit Analyst, Westfield Bank
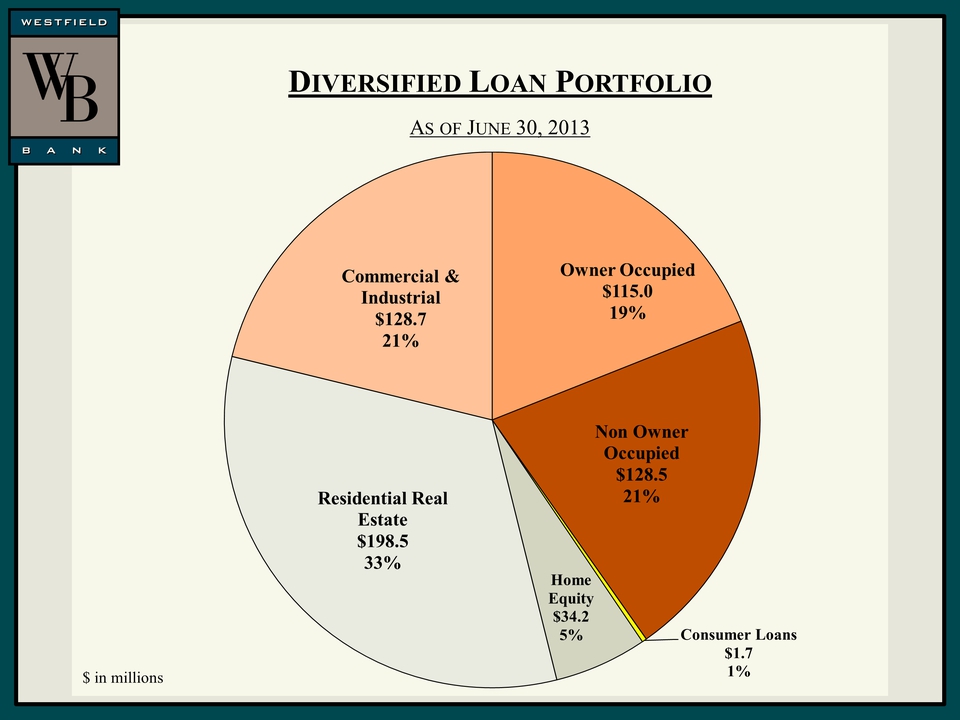
Slide: 7 Diversified Loan Portfolio As of June 30, 2013 $ in millions
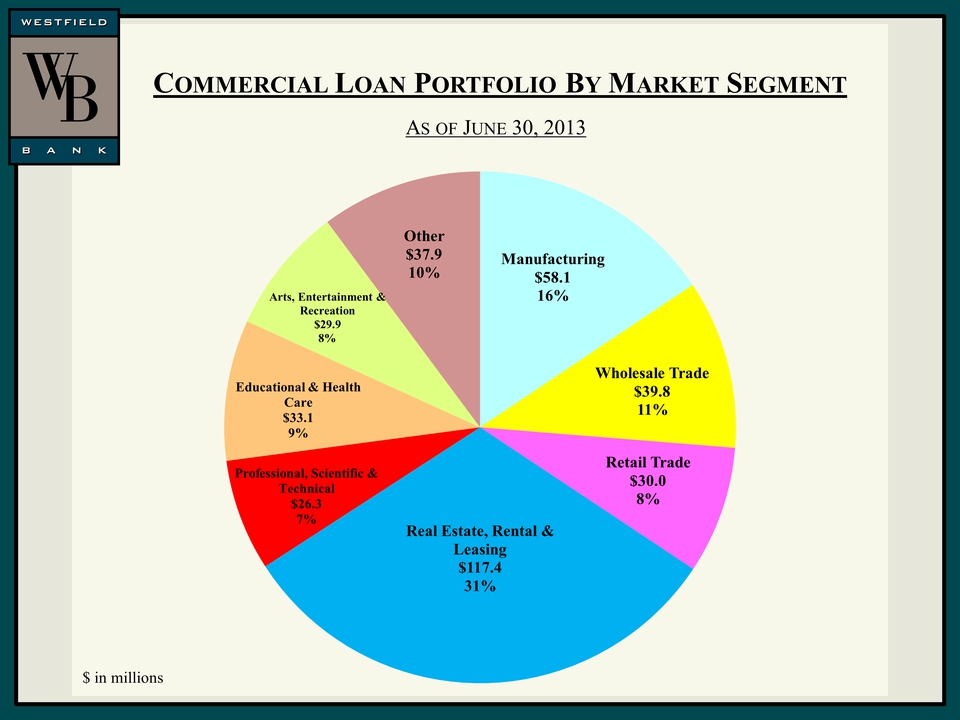
Slide: 8 As of June 30, 2013 $ in millions Commercial Loan Portfolio By Market Segment
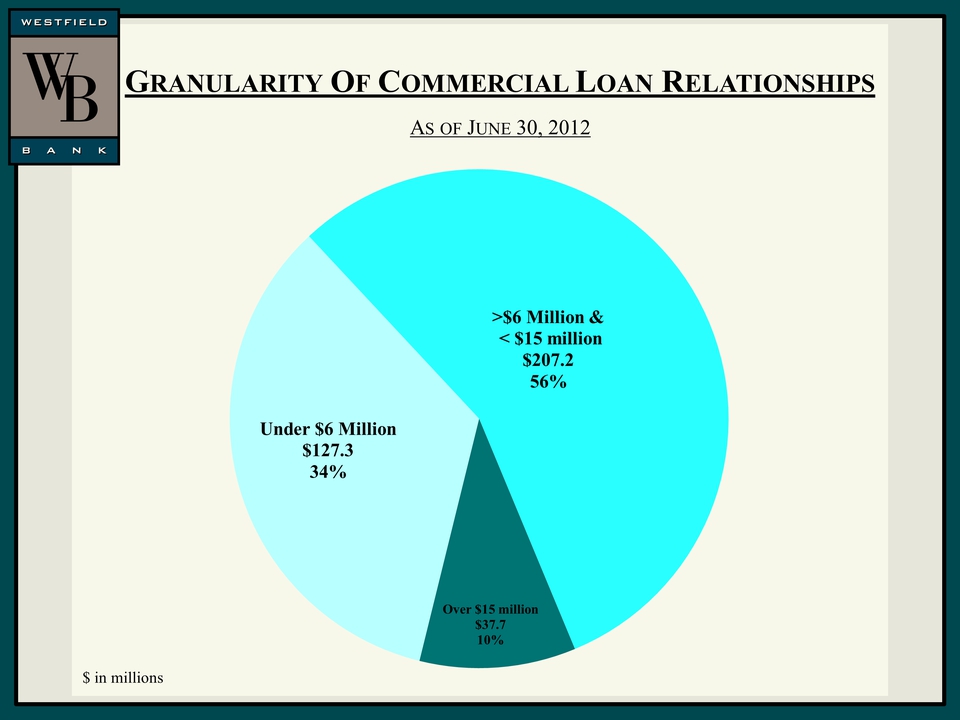
Slide: 9 As of June 30, 2012 $ in millions Granularity Of Commercial Loan Relationships
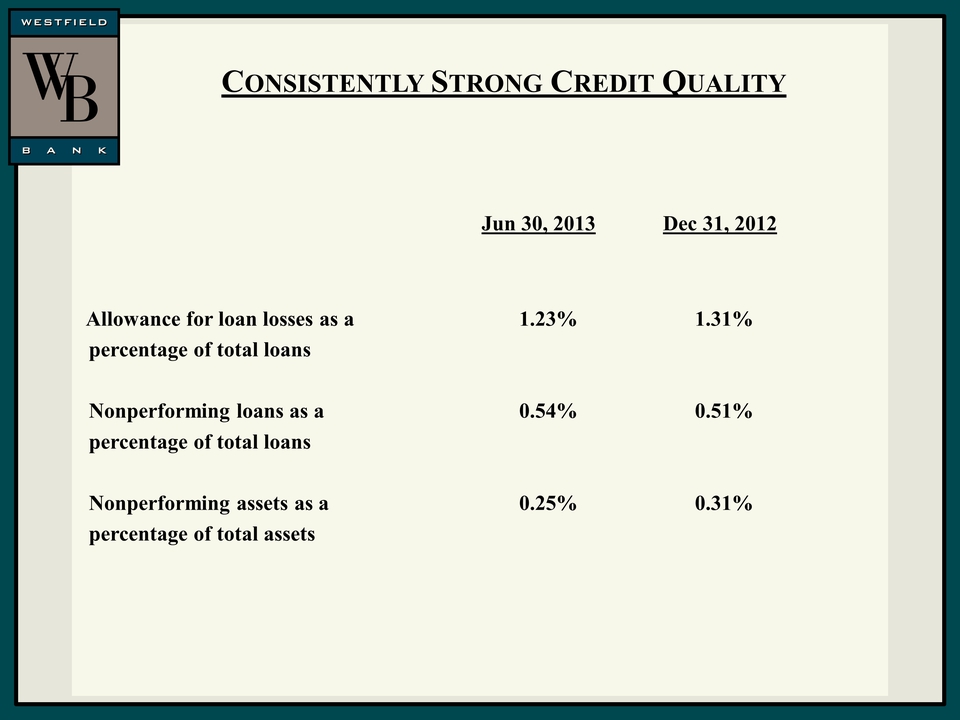
Slide: 10 Consistently Strong Credit Quality Jun 30, 2013Dec 31, 2012 Allowance for loan losses as a 1.23% 1.31%percentage of total loans Nonperforming loans as a 0.54% 0.51%percentage of total loans Nonperforming assets as a 0.25% 0.31%percentage of total assets
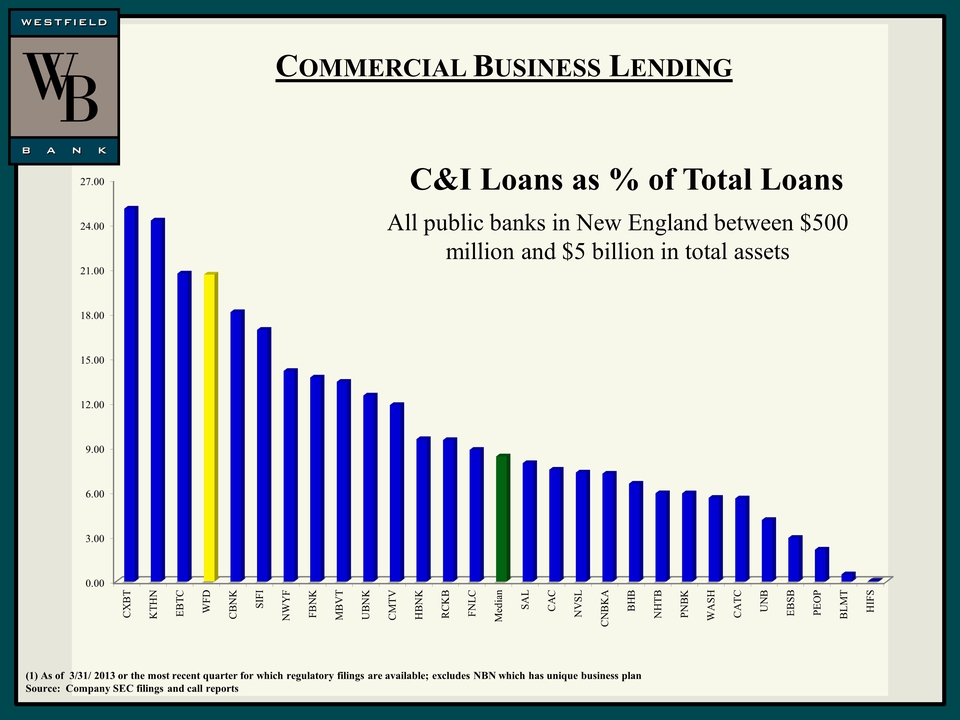
Slide: 11 (1) As of 3/31/ 2013 or the most recent quarter for which regulatory filings are available; excludes NBN which has unique business planSource: Company SEC filings and call reportsCommercial Business LendingC&I Loans as % of Total LoansAll public banks in New England between $500 million and $5 billion in total assets
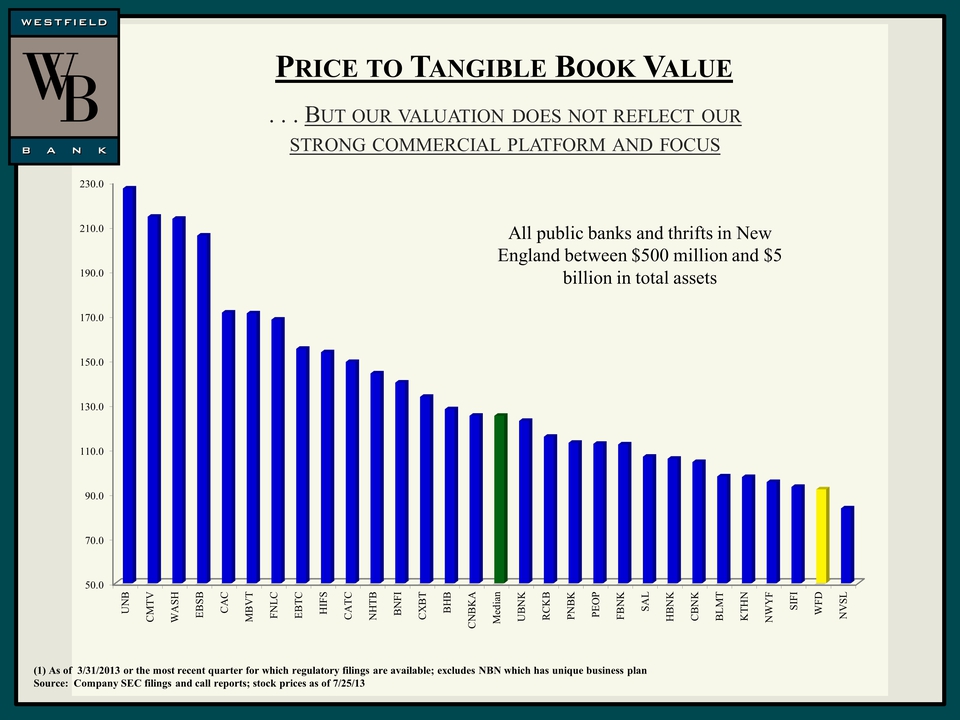
Slide: 12 Price to Tangible Book Value (1) As of 3/31/2013 or the most recent quarter for which regulatory filings are available; excludes NBN which has unique business planSource: Company SEC filings and call reports; stock prices as of 7/25/13. . . But our valuation does not reflect our strong commercial platform and focus All public banks and thrifts in New England between $500 million and $5 billion in total assets
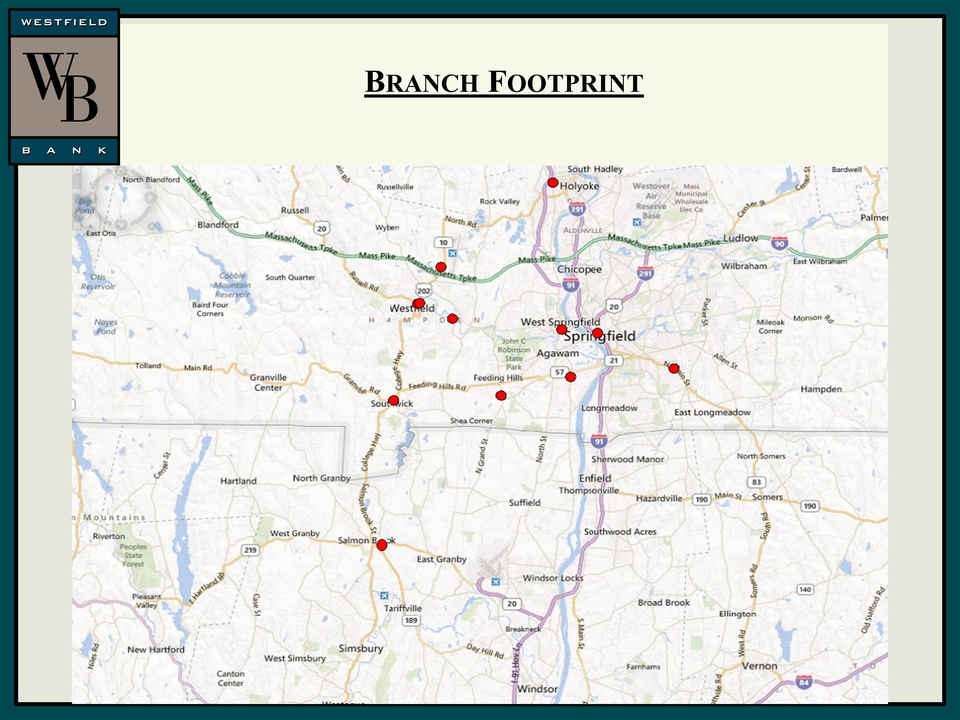
Slide: 13 Branch Footprint
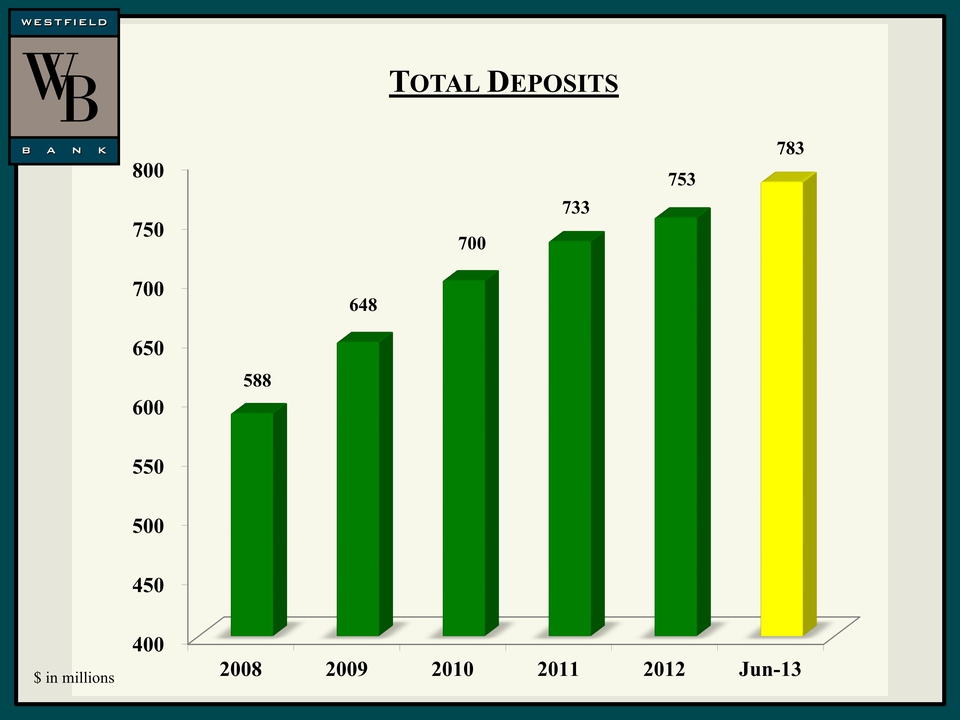
Slide: 14 $ in millions Total Deposits
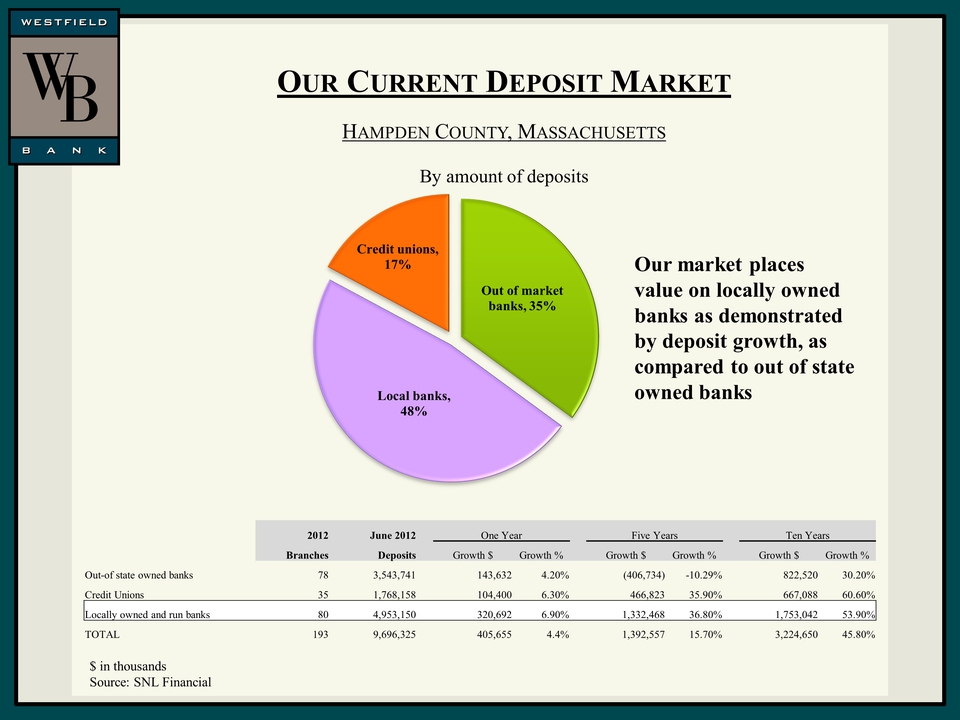
Slide: 15 $ in thousandsSource: SNL Financial Our Current Deposit Market Hampden County, MassachusettsBy amount of depositsOur market places value on locally owned banks as demonstrated by deposit growth, as compared to out of state owned banks 2012 June 2012 One Year Five Years Ten Years Branches Deposits Growth $ Growth % Growth $ Growth % Growth $ Growth % Out-of state owned banks 78 3,543,741 143,632 4.20% (406,734) -10.29% 822,520 30.20% Credit Unions 35 1,768,158 104,400 6.30% 466,823 35.90% 667,088 60.60% Locally owned and run banks 80 4,953,150 320,692 6.90% 1,332,468 36.80% 1,753,042 53.90% TOTAL 193 9,696,325 405,655 4.4% 1,392,557 15.70% 3,224,650 45.80%
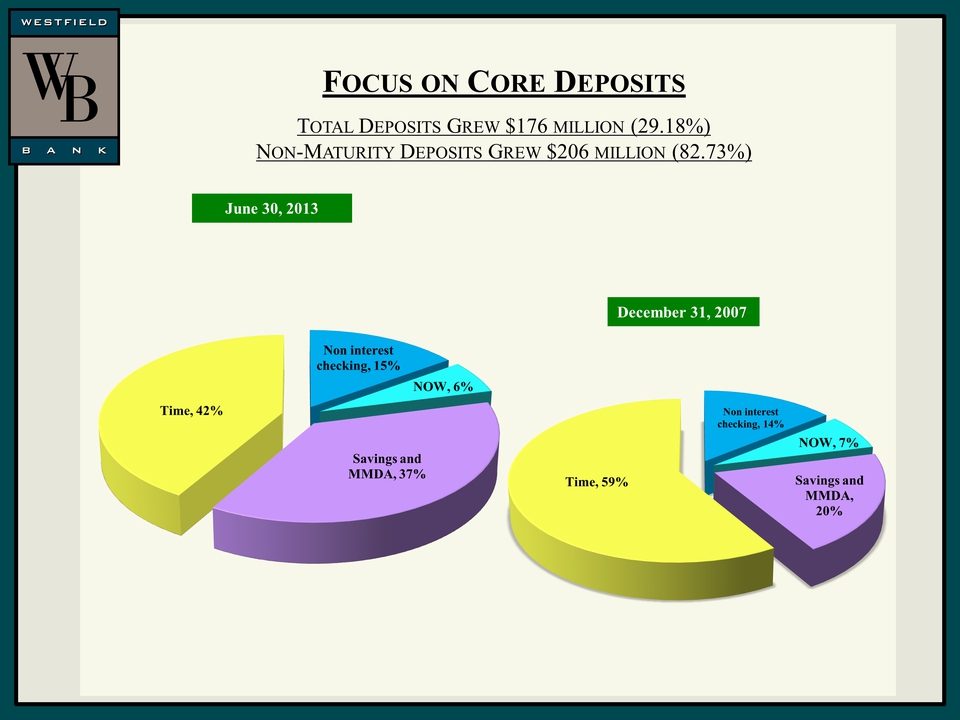
Slide: 16 Focus on Core Deposits Total Deposits Grew $176 million (29.18%)Non-Maturity Deposits Grew $206 million (82.73%)June 30, 2013December 31, 2007
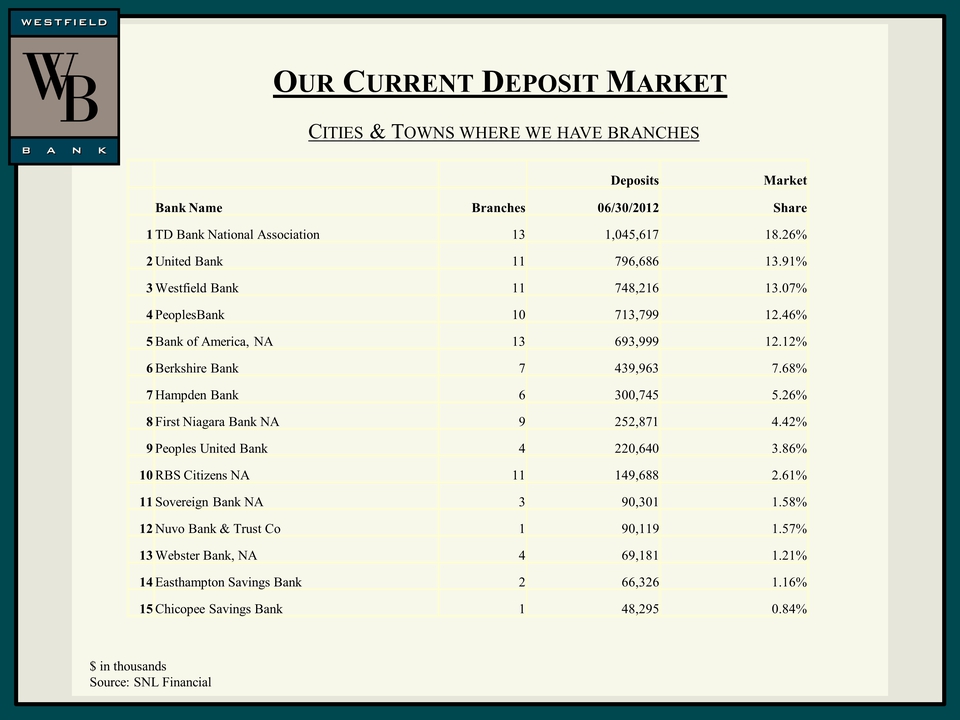
Slide: 17 OUR CURRENT DEPOSITMARKET CITIES & TOWNS WHERE WE HAVE BRANCHES Deposits Market Bank Name Branches 06/30/2012 Share 1 TD Bank National Association 13 1,045,617 18.26% 2 United Bank 11 796,686 13.91% 3Westfield Bank 11 748,216 13.07% 4 PeoplesBank 10 713,799 12.46% 5Bank of America, NA 13 693,999 12.12% 6Berkshire Bank 7 439,963 7.68% 7Hampden Bank 6 300,745 5.26% 8 First Niagara Bank NA 9 252,871 4.42% 9 Peoples United Bank 4 220,640 3.86% 10RBS Citizens NA 11 149,688 2.61% 11 Sovereign Bank NA 3 90,301 1.58% 12 Nuvo Bank & Trust Co 1 90,119 1.57% 13Webster Bank, NA 4 69,181 1.21% 14 Easthampton Savings Bank 2 66,326 1.16% 15Chicopee Savings Bank 1 48,295 0.84% $ in thousands Source: SNL Financial
Slide: 18 Granby Banking Center Full service banking center in Farmington Valley area.Commercial lending reach into Bloomfield, East Granby, Windsor, greater Hartford. Targeting areas with more affluent customers, including the Farmington Valley, which offers a strong residential lending opportunity.We compete well against national banks and have solid expertise in small business and commercial positioned against smaller community banks.More efficient modern branch.Small square footage; approximately 2,100 square feet.Use of modern technology.Deposit Imaging ATM.Cash Recyclers.Granby links our franchise and our new CT presence, only bank in both areas.
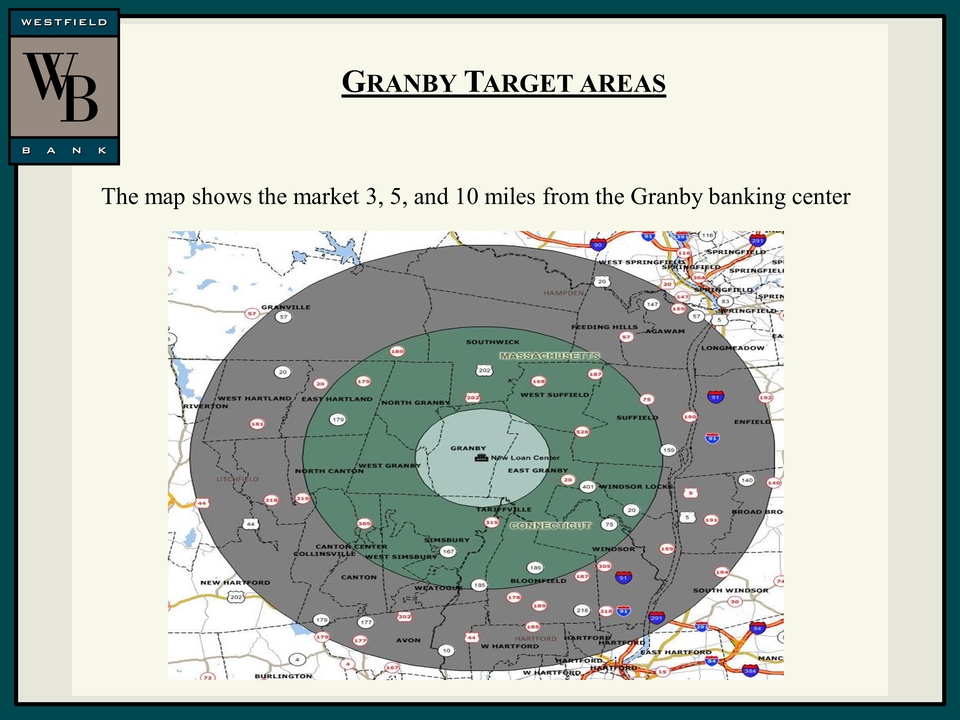
Slide: 19 Granby Target areas The map shows the market 3, 5, and 10 miles from the Granby banking center
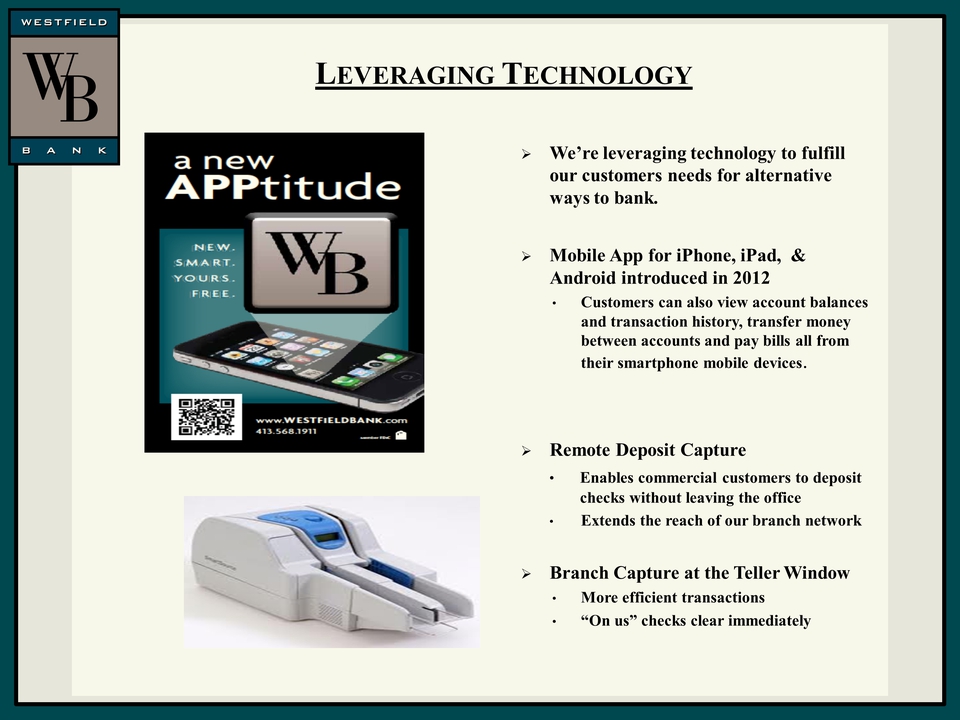
Slide: 20 Leveraging Technology We’re leveraging technology to fulfill our customers needs for alternative ways to bank.Mobile App for iPhone, iPad, & Android introduced in 2012 Customers can also view account balances and transaction history, transfer money between accounts and pay bills all from their smartphone mobile devices. Remote Deposit Capture Enables commercial customers to deposit checks without leaving the officeExtends the reach of our branch networkBranch Capture at the Teller WindowMore efficient transactions“On us” checks clear immediately
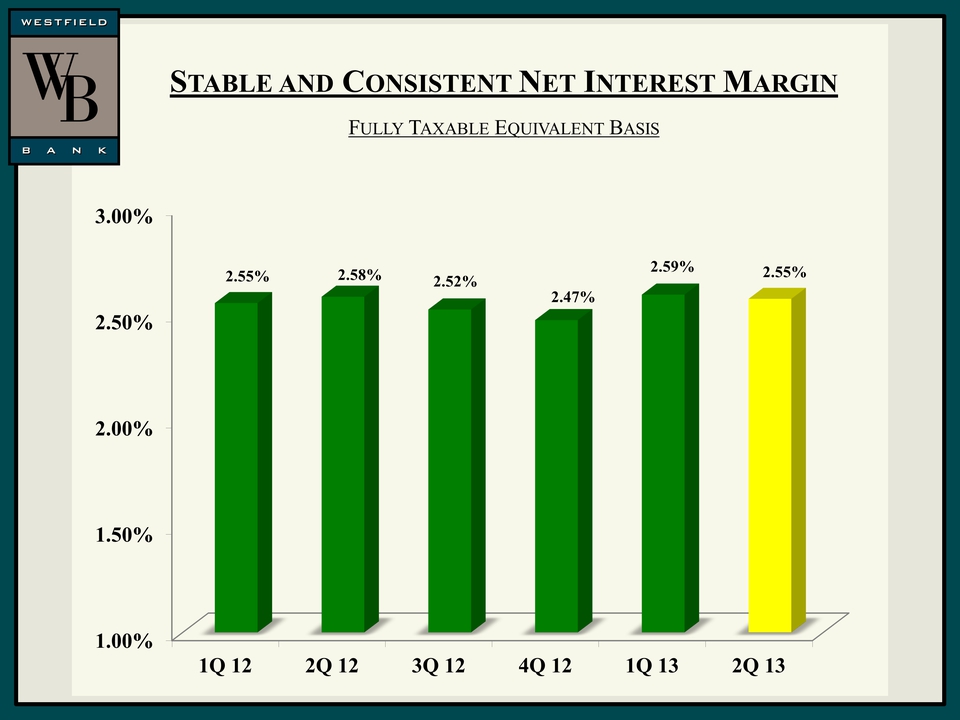
Slide: 21 Stable and Consistent Net Interest Margin Fully Taxable Equivalent Basis
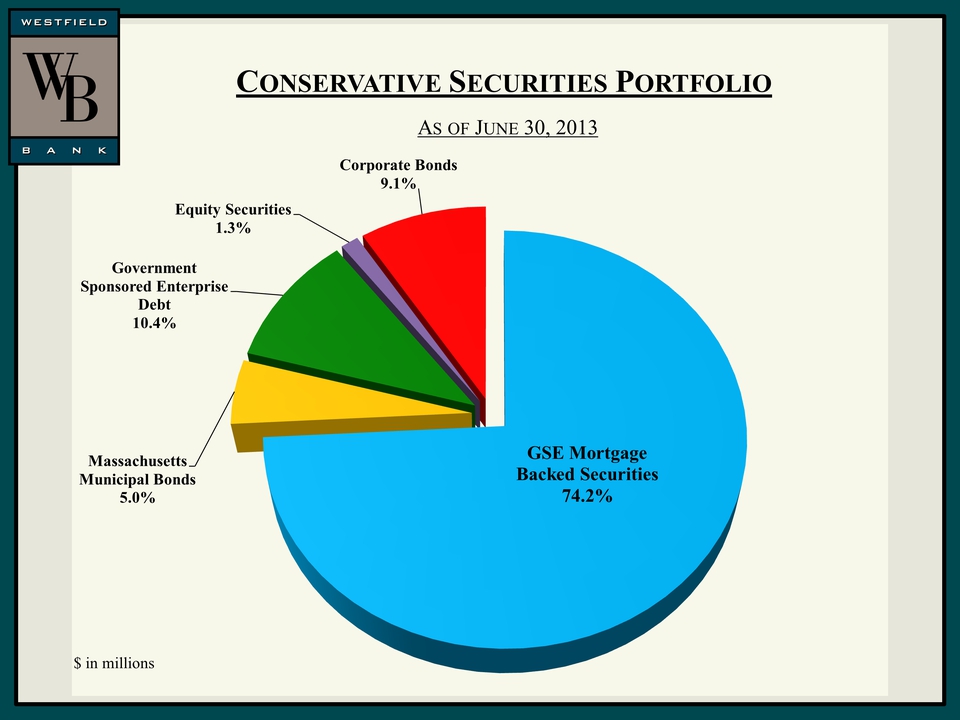
Slide: 22 Conservative Securities Portfolio As of June 30, 2013 $ in millions
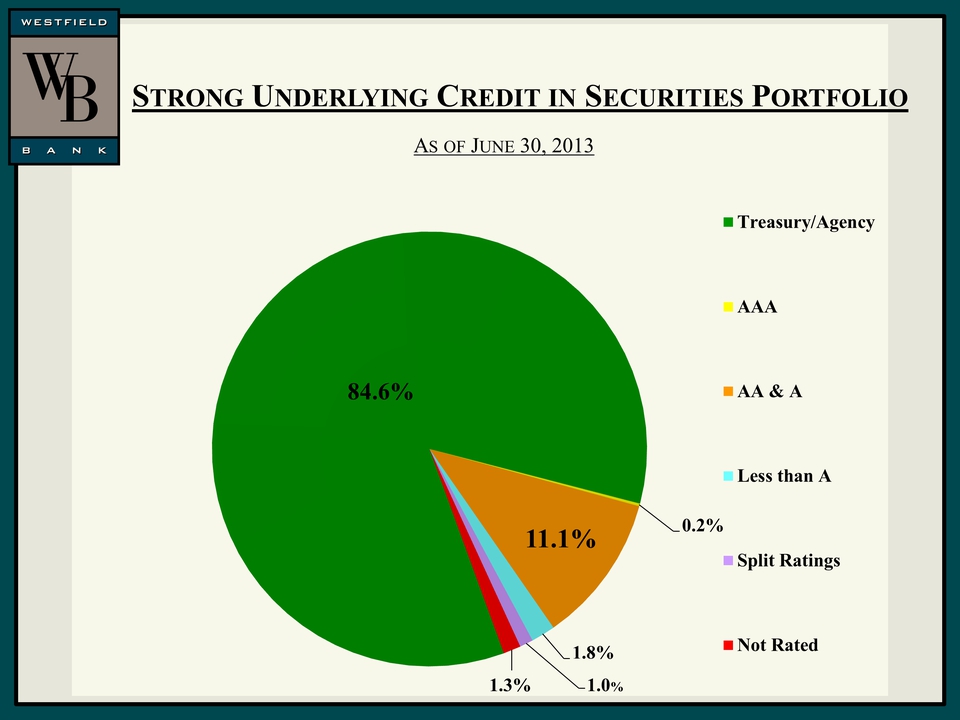
Slide: 23 As of June 30, 2013 Strong Underlying Credit in Securities Portfolio

Slide: 24 Capital Management A Combination of Four Initiatives Fund organic growth.Repurchase shares of our common stock.Pay dividends to shareholders.Finance acquisitions.We try to effectively balance leveraging our capital to earn a return on our shareholders’ investment versus returning the capital dollar-for-dollar in repurchases and dividends.
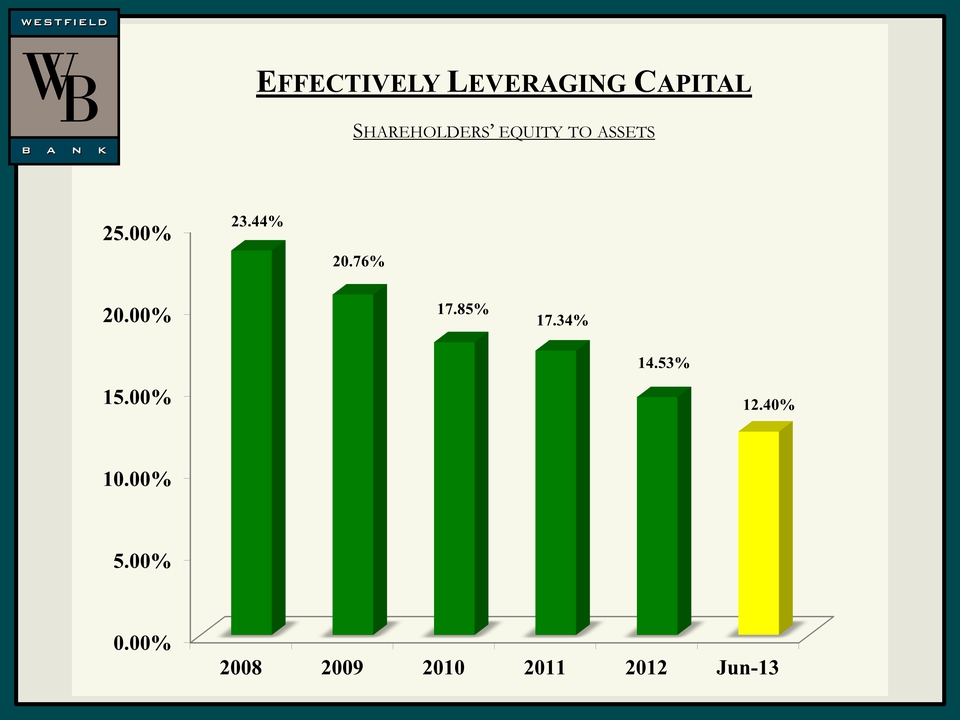
Slide: 25 Effectively Leveraging Capital Shareholders’ equity to assets
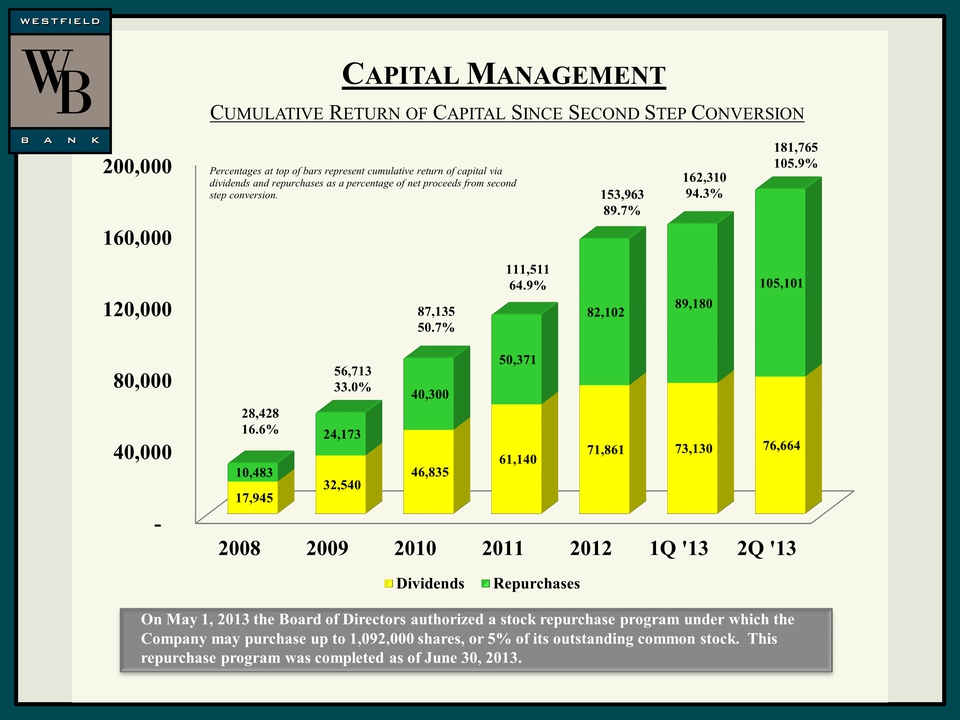
Slide: 26 Capital Management Cumulative Return of Capital Since Second Step ConversionOn May 1, 2013 the Board of Directors authorized a stock repurchase program under which the Company may purchase up to 1,092,000 shares, or 5% of its outstanding common stock. This repurchase program was completed as of June 30, 2013. Percentages at top of bars represent cumulative return of capital via dividends and repurchases as a percentage of net proceeds from second step conversion. 28,42816.6% 56,71333.0% 87,13550.7% 111,51164.9% 153,96389.7% 162,31094.3% 181,765105.9%
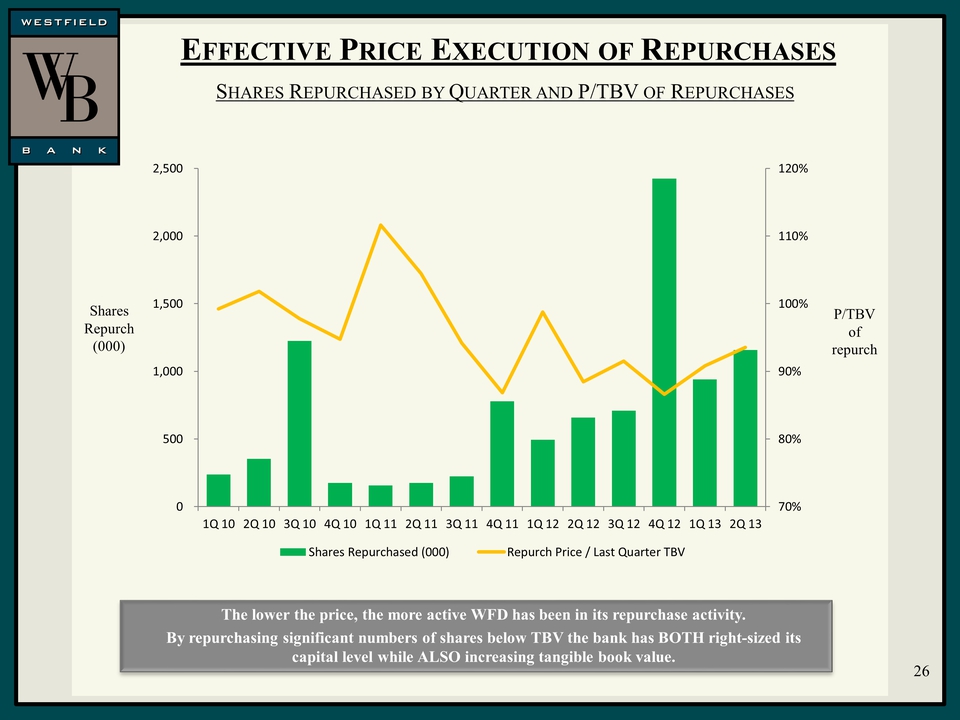
Slide: 27 Effective Price Execution of Repurchases Shares Repurchased by Quarter and P/TBV of RepurchasesThe lower the price, the more active WFD has been in its repurchase activity. By repurchasing significant numbers of shares below TBV the bank has BOTH right-sized its capital level while ALSO increasing tangible book value. SharesRepurch(000) P/TBVofrepurch 26
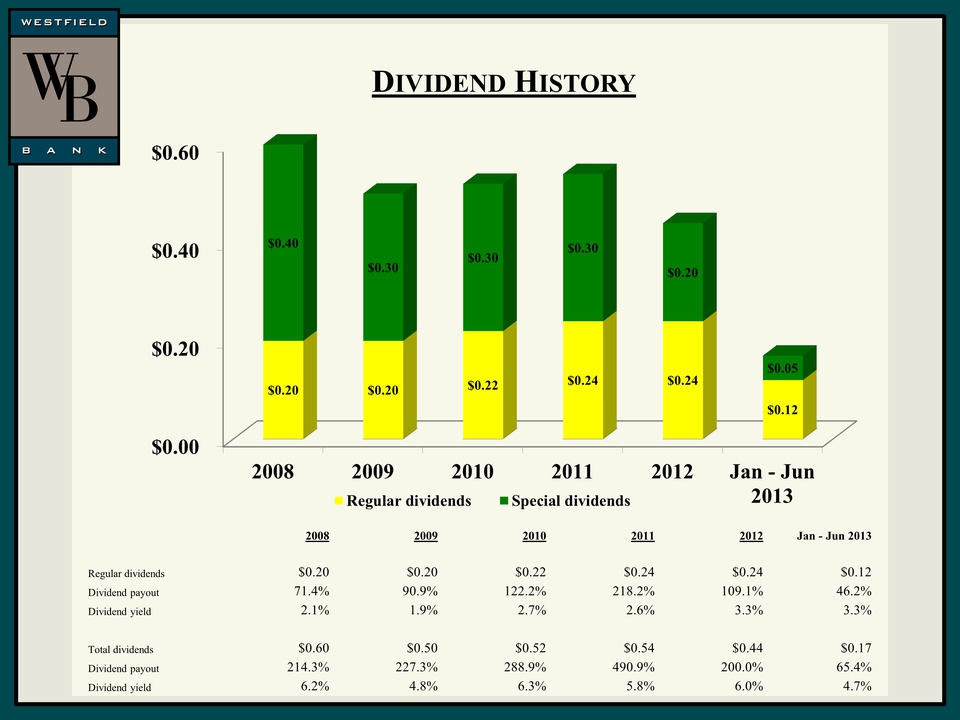
Slide: 28 DIVIDEND HISTORY $0.00 $0.20 $0.40 $0.60 2008 2009 2010 2011 2012 Jan - Jun 2013 $0.20 $0.20 $0.22 $0.24 $0.24 $0.12 $0.40 $0.30 $0.30 $0.30 $0.20 $0.05 Regular dividends Special dividends 2008 2009 2010 2011 2012 Jan - Jun 2013 Regular dividends $0.20 $0.20 $0.22 $0.24 $0.24 $0.12 Dividend payout 71.4% 90.9% 122.2% 218.2% 109.1% 46.2% Dividend yield 2.1% 1.9% 2.7% 2.6% 3.3% 3.3% Total dividends $0.60 $0.50 $0.52 $0.54 $0.44 $0.17 Dividend payout 214.3% 227.3% 288.9% 490.9% 200.0% 65.4% Dividend yield 6.2% 4.8% 6.3% 5.8% 6.0% 4.7%
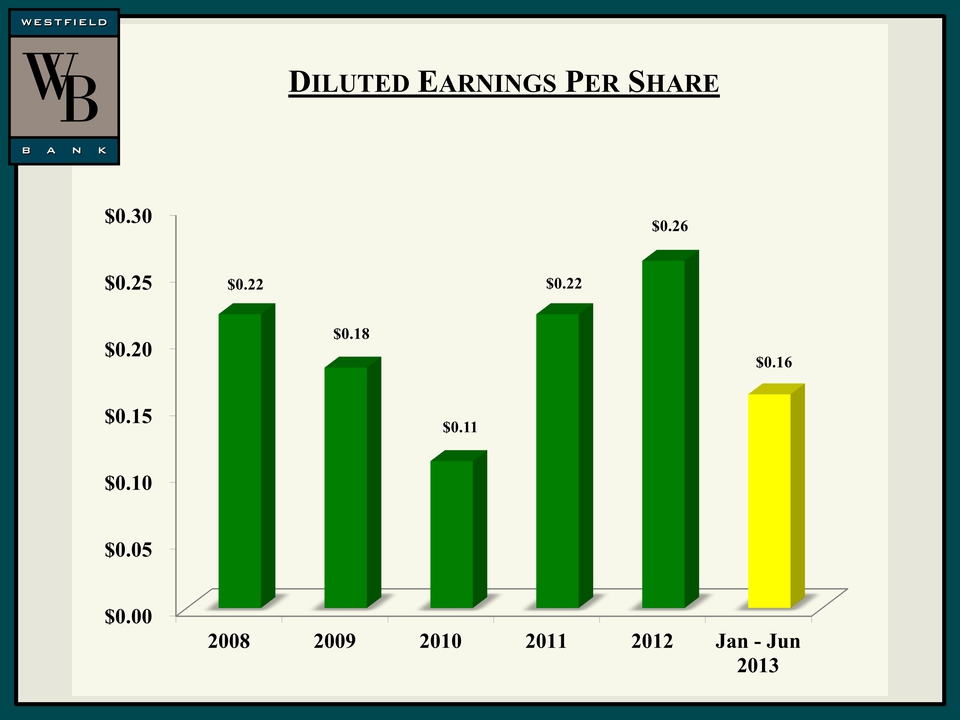
Slide: 29 Diluted Earnings Per Share
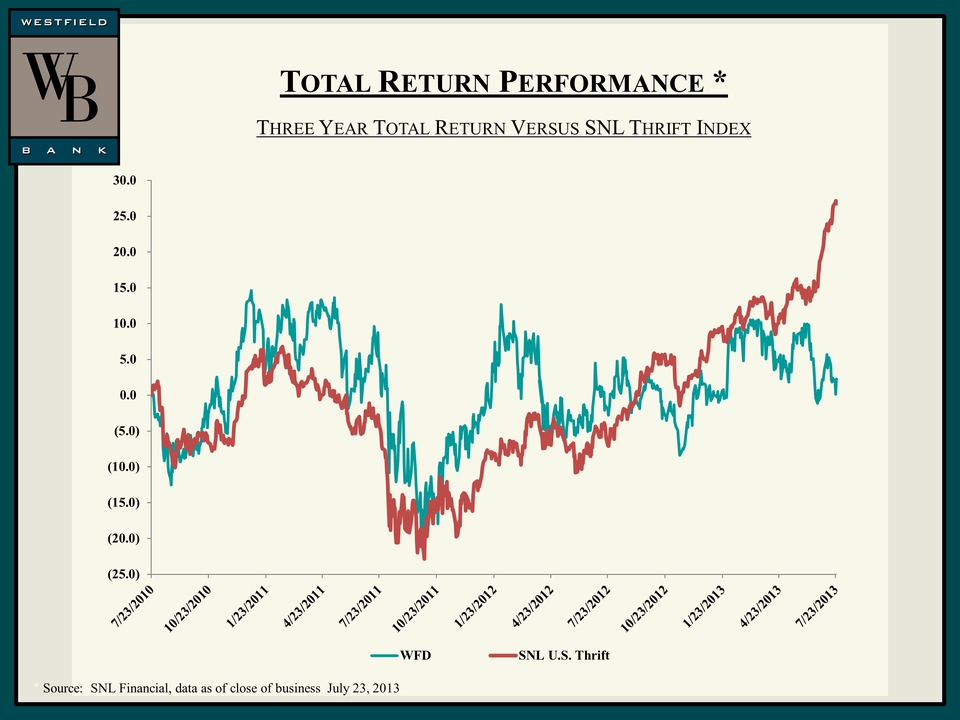
Slide: 30 Total Return Performance * Three Year Total Return Versus SNL Thrift Index* Source: SNL Financial, data as of close of business July 23, 2013.