Western New England Bancorp, Inc. 8-K
Exhibit 99.1

1 2019 Annual Shareholders’ Meeting May 14, 2019

Welcome to the 2019 Annual Shareholders’ Meeting James C. Hagan President Chief Executive Officer 2

Board of Directors James C . Hagan, President & Chief Executive Officer Christos A . Tapases , Chairman of the Board William J . Wagner , Vice Chairman of the Board Laura Benoit , Director Donna J . Damon , Director Gary G . Fitzgerald , Director William D . Masse , Director Lisa G . McMahon , Director Gregg F . Orlen , Director Paul C . Picknelly , Director Steven G . Richter , Director Philip R . Smith , Director Kevin M . Sweeney , Director 47 Palomba Drive, Enfield, CT 3

Introduction of Guests Paul M. Maleck , Law Offices of Doherty, Wallace, Pillsbury & Murphy, Inspector of Elections Richard Schaberg, Hogan Lovells, LLP Leslie Byron Reese III , Hogan Lovells, LLP John J. Doherty, CPA, CGMA, Wolf & Company, Independent Auditor Anthony Roberts, Wolf & Company, Independent Auditor Richard Quad, Griffin Financial, Investment Banker 655 Main Street, Agawam, MA 4
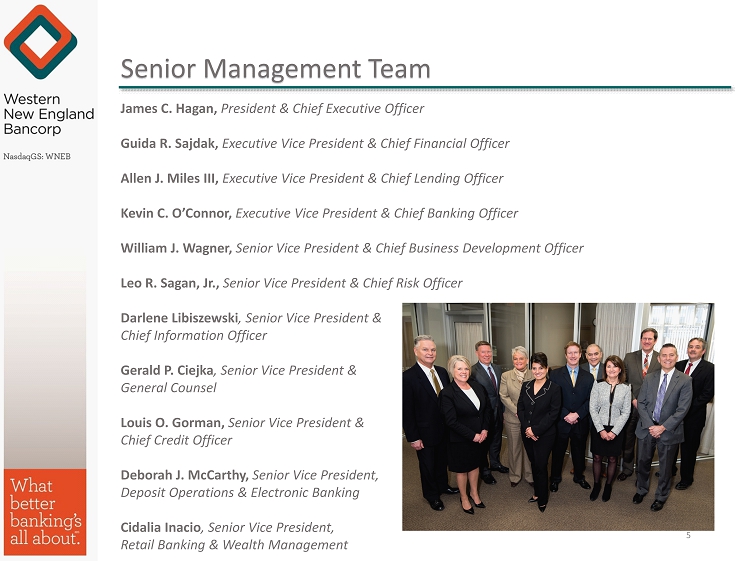
Senior Management Team James C . Hagan, President & Chief Executive Officer Guida R . Sajdak, Executive Vice President & Chief Financial Officer Allen J . Miles III, Executive Vice President & Chief Lending Officer Kevin C . O’Connor, Executive Vice President & Chief Banking Officer William J . Wagner, Senior Vice President & Chief Business Development Officer Leo R . Sagan, Jr . , Senior Vice President & Chief Risk Officer Darlene Libiszewski , Senior Vice President & Chief Information Officer Gerald P . Ciejka , Senior Vice President & General Counsel Louis O . Gorman, Senior Vice President & Chief Credit Officer Deborah J . McCarthy, Senior Vice President, Deposit Operations & Electronic Banking Cidalia Inacio , Senior Vice President, Retail Banking & Wealth Management 5

Proposals Proposal 1: Election of Directors to serve a three year term • Gary G. Fitzgerald • Paul C. Picknelly • Kevin M. Sweeney • Christos A. Tapases Proposal 2: Non - binding Advisory Vote on Executive Compensation “ Say on Pay” Proposal 3: Ratification of Independent Registered Public Accounting Firm for the year ending December 31, 2019 • Wolf & Company, P.C. 6 599 Memorial Drive, Chicopee, MA
Voting Results Paul M. Maleck Inspector of Elections 300 Southampton Road, Westfield, MA 7

Financial Results for 2018 and First Quarter 2019 Guida R. Sajdak Executive Vice President Chief Financial Officer 8

We may, from time to time, make written or oral “forward - looking statements” within the meaning of the Private Securities Litigation Reform Act of 1995 , including statements contained in our filings with the Securities and Exchange Commission (the “SEC”), our reports to shareholders and in other communications by us . This presentation contains “forward - looking statements” which may be identified by the use of such words as “believe,” “expect,” “anticipate,” “should,” “planned,” “estimated,” and “potential . ” Examples of forward looking statements include, but are not limited to, estimates with respect to our financial condition, results of operations and business that are subject to various factors which could cause actual results to differ materially from these estimates . These factors include, but are not limited to : • changes in the interest rate environment that reduce margins ; • changes in the regulatory environment ; • the highly competitive industry and market area in which we operate ; • general economic conditions, either nationally or regionally, resulting in, among other things, a deterioration in credit quality ; • changes in business conditions and inflation ; • changes in credit market conditions ; • changes in the securities markets which affect investment management revenues ; • increases in Federal Deposit Insurance Corporation deposit insurance premiums and assessments could adversely affect our financial condition ; • changes in technology used in the banking business ; • the soundness of other financial services institutions which may adversely affect our credit risk ; • certain of our intangible assets may become impaired in the future ; • our controls and procedures may fail or be circumvented ; • new lines of business or new products and services, which may subject us to additional risks ; • changes in key management personnel which may adversely impact our operations ; • the effect on our operations of governmental legislation and regulation, including changes in accounting regulation or standards, the nature and timing of the adoption and effectiveness of new requirements under the Dodd - Frank Act Wall Street Reform and Consumer Protection Act of 2010 , Basel guidelines, capital requirements and other applicable laws and regulations ; • severe weather, natural disasters, acts of war or terrorism and other external events which could significantly impact our business ; and • other factors detailed from time to time in our SEC filings . Although we believe that the expectations reflected in such forward - looking statements are reasonable, actual results may differ materially from the results discussed in these forward - looking statements . You are cautioned not to place undue reliance on these forward - looking statements, which speak only as of the date hereof . We do not undertake any obligation to republish revised forward - looking statements to reflect events or circumstances after the date hereof or to reflect the occurrence of unanticipated events . Forward Looking Statements 9
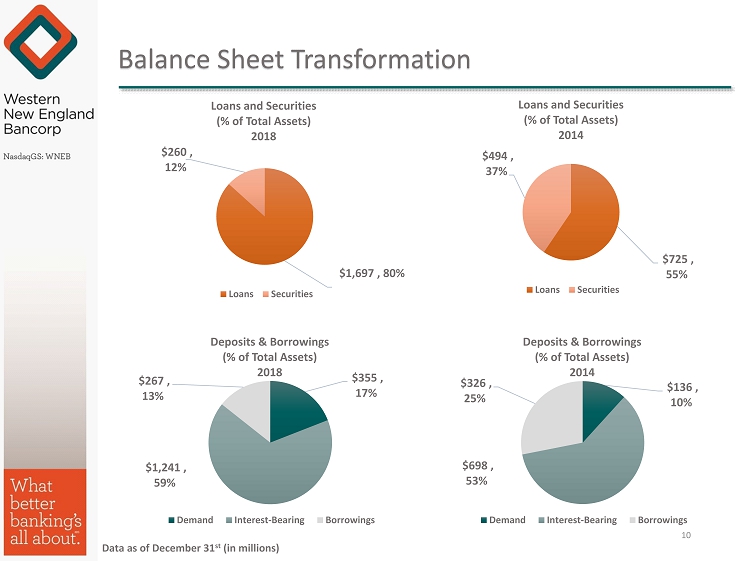
Balance Sheet Transformation $725 , 55% $494 , 37% Loans and Securities (% of Total Assets) 2014 Loans Securities Data as of December 31 st (in millions) $1,697 , 80% $260 , 12% Loans and Securities (% of Total Assets) 2018 Loans Securities $355 , 17% $1,241 , 59% $267 , 13% Deposits & Borrowings (% of Total Assets) 2018 Demand Interest-Bearing Borrowings $136 , 10% $698 , 53% $326 , 25% Deposits & Borrowings (% of Total Assets) 2014 Demand Interest-Bearing Borrowings 10

Asset Quality Indicators Continue to be Strong Non-performing Loans/Total Loans Non-performing Assets/ Total Assets 2014 1.22% 0.67% 2018 0.79% 0.64% 1.22% 0.67% 0.79% 0.64% 0.00% 0.20% 0.40% 0.60% 0.80% 1.00% 1.20% 1.40% Non - performing Loans to Total Loans Non - performing Assets to Total Assets Data as of December 31 st 11
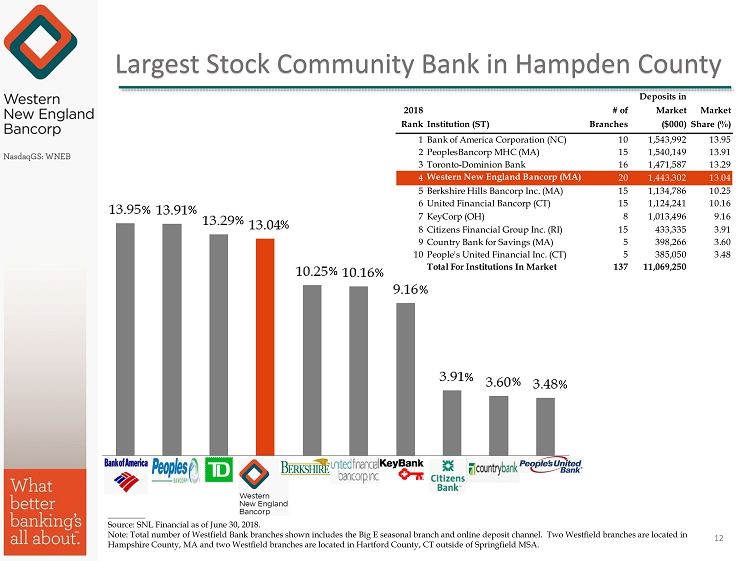
________ Source: SNL Financial as of June 30, 2018. Note: Total number of Westfield Bank branches shown includes the Big E seasonal branch and online deposit channel. Two Westf iel d branches are located in Hampshire County, MA and two Westfield branches are located in Hartford County, CT outside of Springfield MSA. Largest Stock Community Bank in Hampden County 2018 RankInstitution (ST) # of Branches Deposits in Market ($000) Market Share (%) 1Bank of America Corporation (NC) 10 1,543,992 13.95 2PeoplesBancorp MHC (MA) 15 1,540,149 13.91 3Toronto-Dominion Bank 16 1,471,587 13.29 4 Western New England Bancorp (MA) 20 1,443,302 13.04 5Berkshire Hills Bancorp Inc. (MA) 15 1,134,786 10.25 6United Financial Bancorp (CT) 15 1,124,241 10.16 7KeyCorp (OH) 8 1,013,496 9.16 8Citizens Financial Group Inc. (RI) 15 433,335 3.91 9Country Bank for Savings (MA) 5 398,266 3.60 10People's United Financial Inc. (CT) 5 385,050 3.48 Total For Institutions In Market 137 11,069,250 12 % % % % % % % % % %
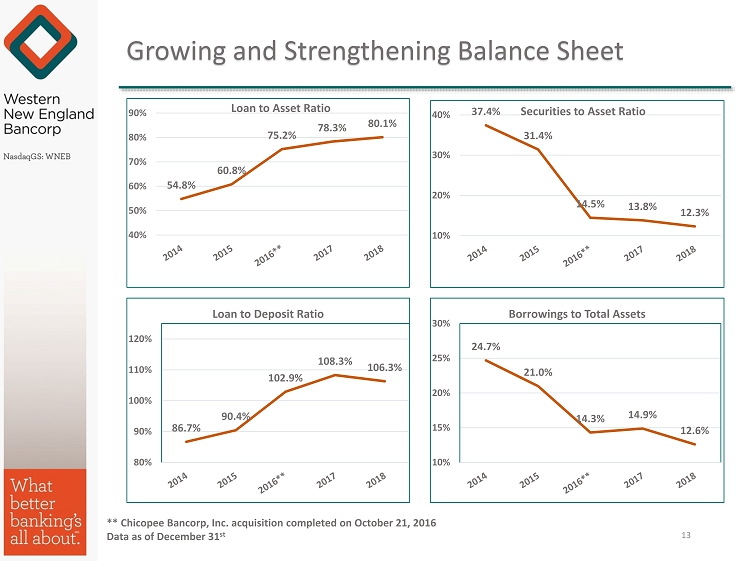
Growing and Strengthening Balance Sheet 54.8% 60.8% 75.2% 78.3% 80.1% 40% 50% 60% 70% 80% 90% Loan to Asset Ratio 86.7% 90.4% 102.9% 108.3% 106.3% 80% 90% 100% 110% 120% Loan to Deposit Ratio 37.4% 31.4% 14.5% 13.8% 12.3% 10% 20% 30% 40% Securities to Asset Ratio 24.7% 21.0% 14.3% 14.9% 12.6% 10% 15% 20% 25% 30% Borrowings to Total Assets ** Chicopee Bancorp, Inc. acquisition completed on October 21, 2016 Data as of December 31 st 13

Improved Profitability 0.48% 0.42% 0.54% 0.72% 0.77% 0.00% 0.10% 0.20% 0.30% 0.40% 0.50% 0.60% 0.70% 0.80% 0.90% 4.18% 4.10% 4.94% 5.97% 6.75% 0.00% 1.00% 2.00% 3.00% 4.00% 5.00% 6.00% 7.00% 8.00% Core ROAE $0.34 $0.33 $0.41 $0.50 $0.56 $0.00 $0.10 $0.20 $0.30 $0.40 $0.50 $0.60 Core EPS 2.60% 2.53% 2.70% 3.12% 3.08% 2.25% 2.45% 2.65% 2.85% 3.05% 3.25% 3.45% Net Interest Margin Core ROAA Core EPS, Core ROAA and Core ROAE exclude merger related costs, net of tax, and other non - recurring items in 2016, 2017 and 2018 . Core EPS, Core ROAA and Core ROAE are non - GAAP financial measures. Management believes Core EPS, Core ROAA and Core ROAE more accurately reflect the Company’s results of operations in the overall evaluation of its performance. Please refer to “Reconciliation of Non - GAAP to GAAP Financial Measures” for further details. **Chicopee Bancorp, Inc. acquisition completed on October 21, 2016. 14
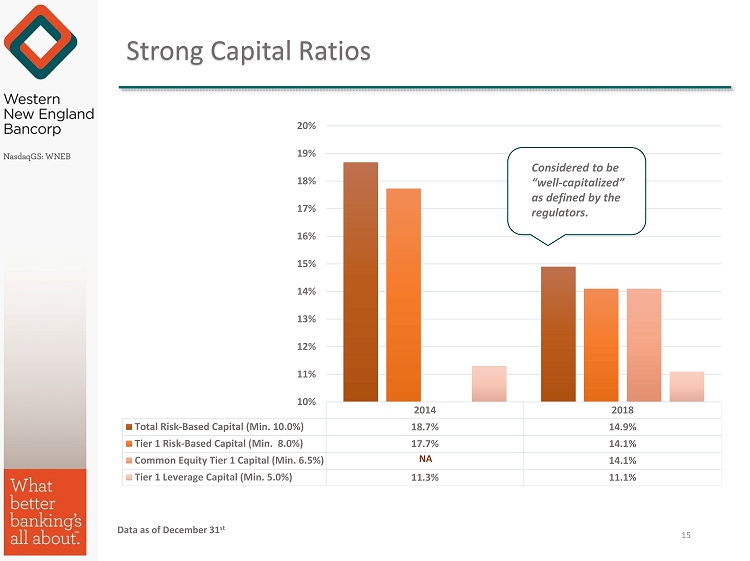
Strong Capital Ratios 2014 2018 Total Risk-Based Capital (Min. 10.0%) 18.7% 14.9% Tier 1 Risk-Based Capital (Min. 8.0%) 17.7% 14.1% Common Equity Tier 1 Capital (Min. 6.5%) 14.1% Tier 1 Leverage Capital (Min. 5.0%) 11.3% 11.1% 10% 11% 12% 13% 14% 15% 16% 17% 18% 19% 20% NA Considered to be “well - capitalized” as defined by the regulators. Data as of December 31 st 15
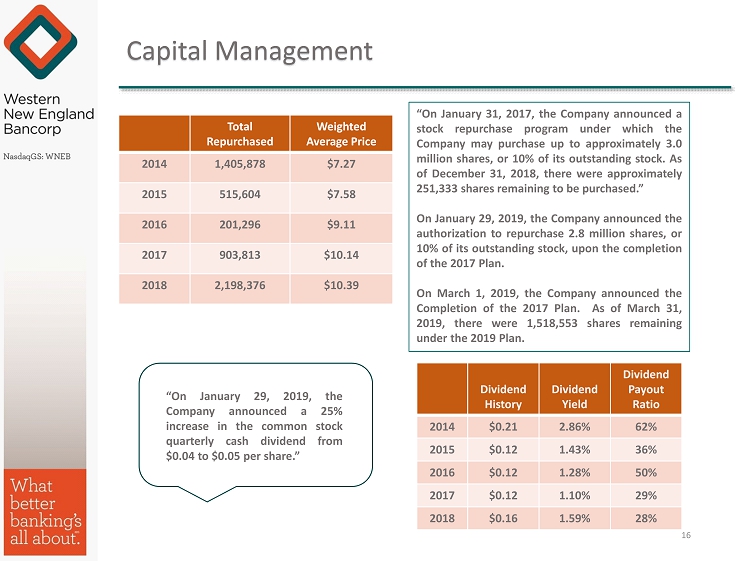
Capital Management Total Repurchased Weighted Average Price 2014 1,405,878 $7.27 2015 515,604 $7.58 2016 201,296 $9.11 2017 903,813 $10.14 2018 2,198,376 $10.39 Dividend History Dividend Yield Dividend Payout Ratio 2014 $0.21 2.86% 62% 2015 $0.12 1.43% 36% 2016 $0.12 1.28% 50% 2017 $0.12 1.10% 29% 2018 $0.16 1.59% 28% “On January 29 , 2019 , the Company announced a 25 % increase in the common stock quarterly cash dividend from $ 0 . 04 to $ 0 . 05 per share . ” “On January 31 , 2017 , the Company announced a stock repurchase program under which the Company may purchase up to approximately 3 . 0 million shares, or 10 % of its outstanding stock . As of December 31 , 2018 , there were approximately 251 , 333 shares remaining to be purchased . ” On January 29 , 2019 , the Company announced the authorization to repurchase 2 . 8 million shares, or 10 % of its outstanding stock, upon the completion of the 2017 Plan . On March 1 , 2019 , the Company announced the Completion of the 2017 Plan . As of March 31 , 2019 , there were 1 , 518 , 553 shares remaining under the 2019 Plan . 16
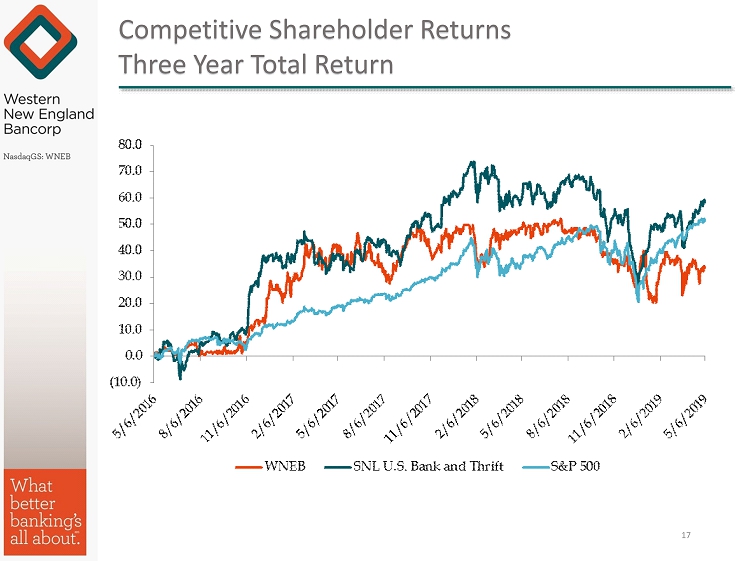
Competitive Shareholder Returns Three Year Total Return 17

1 st Quarter of 2019 1Q2019 4Q2018 1Q2018 EPS $0.13 $0.14 $0.12 Core (1) EPS $0.13 $0.14 $0.12 Earnings per Share 1Q2019 4Q2018 1Q2018 ROAA 0.66% 0.72% 0.69% Core (1) ROAA 0.66% 0.72% 0.69% Return on Average Assets Return on Average Equity 1Q2019 4Q2018 1Q2018 ROAE 6.05% 6.43% 5.82% Core (1) ROAE 6.01% 6.43% 5.79% 1Q2019 4Q2018 1Q2018 Net Interest Margin 2.97% 2.99% 3.12% Adjusted (2) Net Interest Margin 2.96% 2.97% 3.07% Net Interest Margin (1) Core EPS, Core ROAE and Core ROAA are non - GAAP financial measures . Management believes core EPS, Core ROAE and Core ROAA more accurately reflect the Company’s results of operations in the overall evaluation of its performance . Please refer to the “Reconciliation of Non - GAAP to GAAP Finance Measures” for further details . (2) Adjusted net interest margin is a non - GAAP financial measure that excludes the impact of purchase accounting amortization of $ 22 , 000 , $ 61 , 000 and $ 235 , 000 for the three months ended March 31 , 2019 , December 31 , 2018 and March 31 , 2018 , respectively . Please see Appendix for further details . March 31, 2019 December 31, 2018 Change in $ Change in % Total Loans $1.681 billion $1.697 billion $(16.2) million (1.0)% Total Deposits $1.630 billion $1.596 billion $33.8 million 2.1% Loan/Deposit Ratio 103% 106% 18
Business Overview Kevin C. O’Connor Executive Vice President & Chief Banking Officer 19

Who We Are Every day, we focus on showing Westfield Bank customers “ what better banking is all about . ” For us, the idea of better banking starts with putting customers first, while adhering to our core values . Our Core Values : • Integrity • Enhance Shareholder Value • Customer Focus • Community Focus Our Core Mission : The Company’s purpose drives the outcome we envision for Western New England Bancorp . Our purpose is to help customers succeed in our community, while creating and increasing shareholder value . 20 70 Center Street, Chicopee, MA.
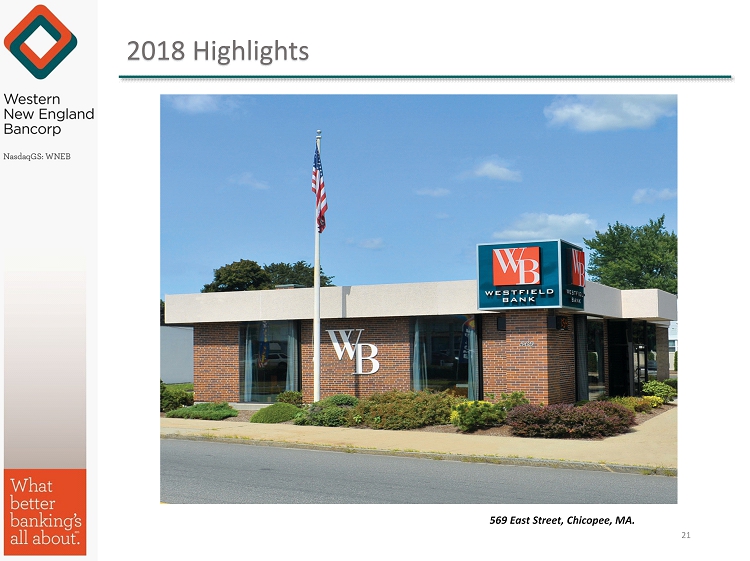
2018 Highlights 569 East Street, Chicopee, MA. 21

We relocated the Tower Square Branch to Center Court to increase visibility 1500 Main Street Springfield, MA. 1500 Main Street, Springfield, MA. Basketball Hall of Fame MGM Casino Springfield 22

We opened our 2 nd branch in Springfield, MA – Liberty Street Branch 1342 Liberty Street, Springfield, MA. 23
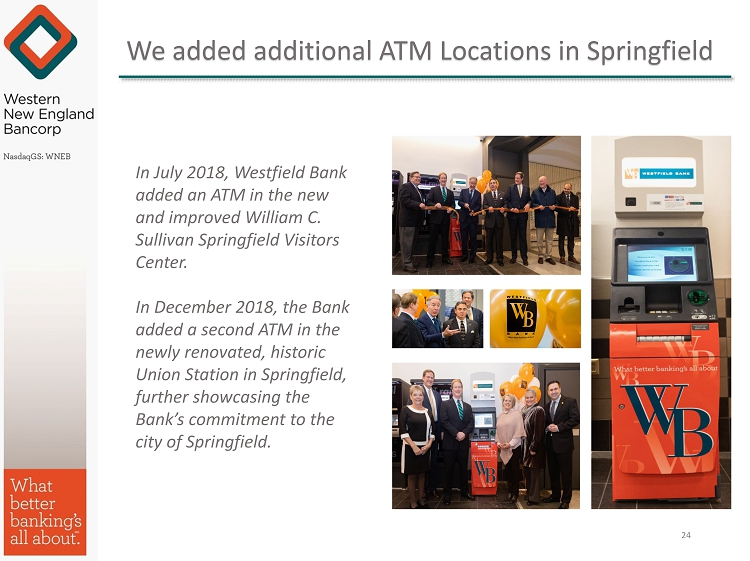
We added additional ATM Locations in Springfield 24 In July 2018, Westfield Bank added an ATM in the new and improved William C. Sullivan Springfield Visitors Center. In December 2018, the Bank added a second ATM in the newly renovated , historic Union Station in Springfield, further showcasing the Bank’s commitment to the city of Springfield .

Mortgage Banking Leadership We are proud to be recognized as the # 1 Mortgage Lender in Hampden County in 2018 by dollar amount . We would like to thank our residential team members, branch officers, realtors and customers for helping us with this accomplishment . We couldn’t do it without their commitment and dedication! 25
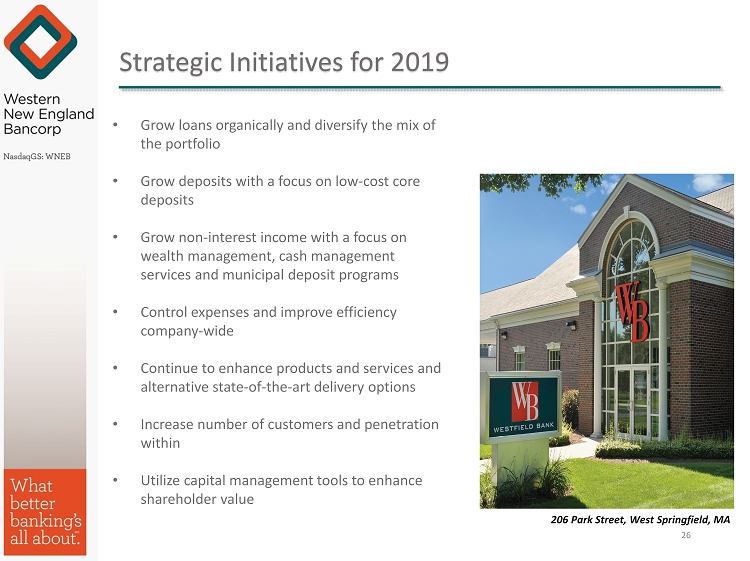
Strategic Initiatives for 2019 • Grow loans organically and diversify the mix of the portfolio • Grow deposits with a focus on low - cost core deposits • Grow non - interest income with a focus on wealth management, cash management services and municipal deposit programs • Control expenses and improve efficiency company - wide • Continue to enhance products and services and alternative state - of - the - art delivery options • Increase number of customers and penetration within • Utilize capital management tools to enhance shareholder value 206 Park Street, West Springfield, MA 26
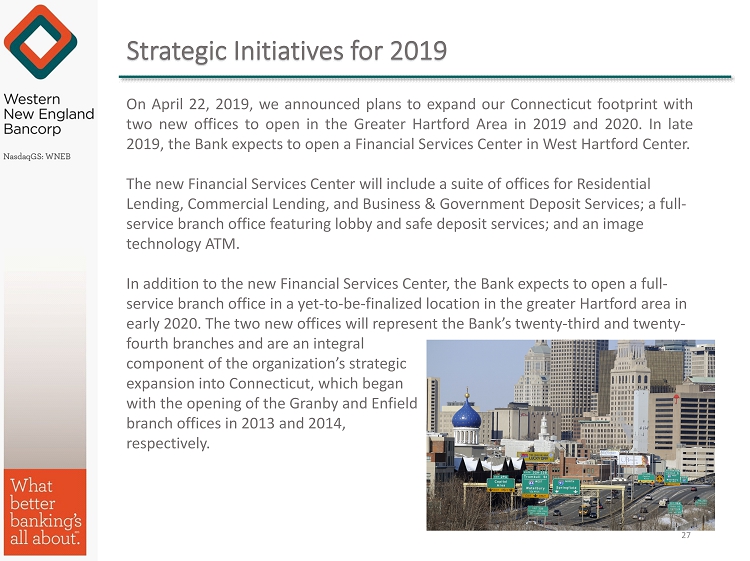
Strategic Initiatives for 2019 On April 22 , 2019 , we announced plans to expand our Connecticut footprint with two new offices to open in the Greater Hartford Area in 2019 and 2020 . In late 2019 , the Bank expects to open a Financial Services Center in West Hartford Center . The new Financial Services Center will include a suite of offices for Residential Lending, Commercial Lending, and Business & Government Deposit Services; a full - service branch office featuring lobby and safe deposit services; and an image technology ATM. In addition to the new Financial Services Center, the Bank expects to open a full - service branch office in a yet - to - be - finalized location in the greater Hartford area in early 2020. The two new offices will represent the Bank’s twenty - third and twenty - fourth branches and are an integral component of the organization’s strategic expansion into Connecticut, which began with the opening of the Granby and Enfield branch offices in 2013 and 2014, respectively. 27

Connecticut Strategy “ We are very pleased to expand our Connecticut footprint into the greater Hartford community.” “ Our new West Hartford Financial Center will host banking specialists from many areas of the bank,” said Mr. Hagan. “ Both of our new locations will offer the deposit, lending, and technology solutions our customers need — from individuals, to small businesses and large corporations, to municipalities.” “We’re confident that our community bank values , customer - first approach, and convenience - based products and services will be a great fit for the greater Hartford community, and we are very excited to meet our future customers.” – James Hagan, President and Chief Executive Officer 28
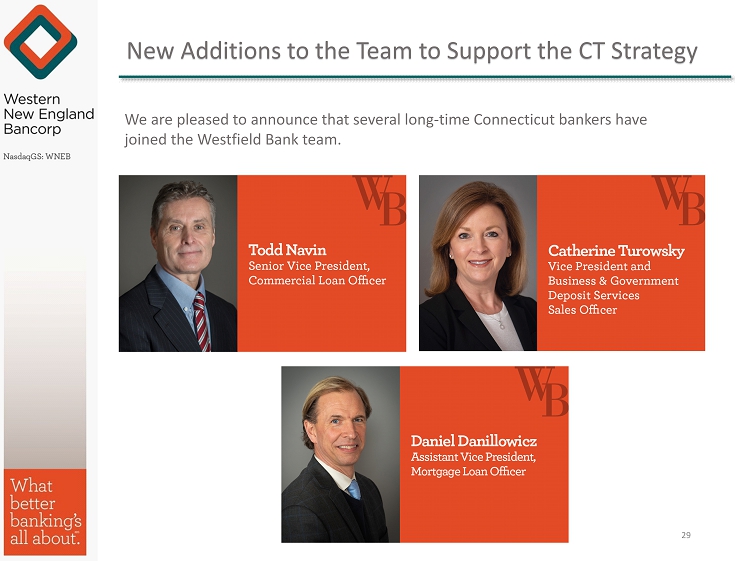
New Additions to the Team to Support the CT Strategy We are pleased to announce that several long - time Connecticut bankers have joined the Westfield Bank team. 29

Social Responsibility Proud member of the community 30

Social Responsibility Westfield Bank’s Future Fund was established in 2002 to support education, recreational, cultural and social service programs and projects in the community. The Future Fund is one of the many ways we pay tribute to our customers and contribute to important community - based initiatives. 31

Westfield Bank “What better banking’s all about” Thank you! James C. Hagan , President and Chief Executive Officer Guida R. Sajdak , Executive Vice President and Chief Financial Officer Meghan Hibner , Vice President and Investor Relations Officer 32 141 Elm Street, Westfield, MA

Reconciliation of Non - GAAP to GAAP Financial Measures 33 Three Months Ended March 31, December 31, March 31, 2019 2018 2018 Diluted EPS: Diluted EPS, as presented $ 0.13 $ 0.14 $ 0.12 Tax benefits impact (1) - - - Core diluted EPS, exclusive of tax benefits impact $ 0.13 $ 0.14 $ 0.12 Return on Average Equity: Return on average equity, as presented 6.05% 6.43% 5.82% Tax benefits impact (1) (0.04) - (0.03) Core return on average equity, exclusive of tax benefits impact 6.01% 6.43% 5.79% Return on Average Assets: Return on average assets, as presented 0.66% 0.72% 0.69% Tax benefits impact (1) - - - Core return on average assets, exclusive of tax benefits impact 0.66% 0.72% 0.69% (1) Tax benefit impact of stock option exercises and share vesting during the period presented.
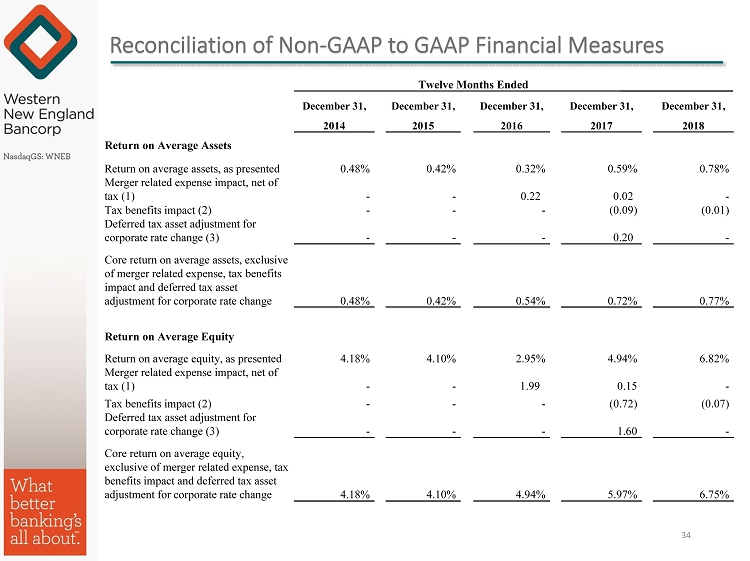
Reconciliation of Non - GAAP to GAAP Financial Measures 34 Twelve Months Ended December 31, December 31, December 31, December 31, December 31, 2014 2015 2016 2017 2018 Return on Average Assets Return on average assets, as presented 0.48% 0.42% 0.32% 0.59% 0.78% Merger related expense impact, net of tax (1) - - 0.22 0.02 - Tax benefits impact (2) - - - (0.09) (0.01) Deferred tax asset adjustment for corporate rate change (3) - - - 0.20 - Core return on average assets, exclusive of merger related expense, tax benefits impact and deferred tax asset adjustment for corporate rate change 0.48% 0.42% 0.54% 0.72% 0.77% Return on Average Equity Return on average equity, as presented 4.18% 4.10% 2.95% 4.94% 6.82% Merger related expense impact, net of tax (1) - - 1.99 0.15 - Tax benefits impact (2) - - - (0.72) (0.07) Deferred tax asset adjustment for corporate rate change (3) - - - 1.60 - Core return on average equity, exclusive of merger related expense, tax benefits impact and deferred tax asset adjustment for corporate rate change 4.18% 4.10% 4.94% 5.97% 6.75%

Reconciliation of Non - GAAP to GAAP Financial Measures 35 Twelve Months Ended December 31, December 31, December 31, December 31, December 31, 2014 2015 2016 2017 2018 Diluted EPS Diluted EPS, as presented $ 0.34 $ 0.33 $ 0.24 $ 0.41 $ 0.57 Merger related expense impact, net of tax (1) - - 0.17 0.02 - Tax benefits impact (2) - - - (0.06) (0.01) Deferred tax asset adjustment for corporate rate change (3) - - - 0.13 - Core diluted EPS, exclusive of merger related expense, tax benefits impact and deferred tax asset adjustment for corporate rate change $ 0.34 $ 0.33 $ 0.41 $ 0.50 $ 0.56 (1) Assumed tax rate for deductible expenses of 34.7% for the twelve months ended December 31, 2016 and 33.0% for the twelve mon ths ended December 31, 2017. (2) Tax benefit impact of the reversal of a deferred tax valuation allowance, stock option exercises and bank - owned life insuran ce death benefits. (3) Deferred tax asset adjustment recorded during the fourth quarter of 2017 upon enactment of the Tax Act.
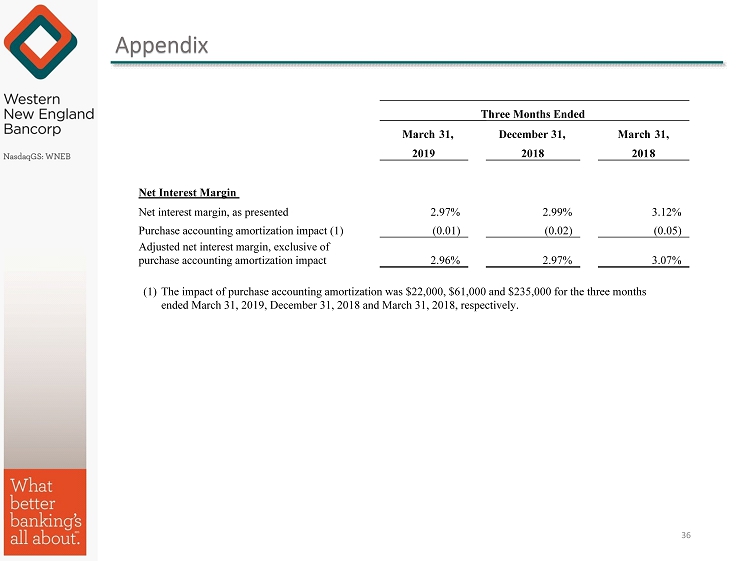
Appendix 36 Three Months Ended March 31, December 31, March 31, 2019 2018 201 8 Net Interest Margin Net interest margin, as presented 2.97% 2.99% 3.12% Purchase accounting amortization impact (1) (0.01) (0.02) (0.05) Adjusted net interest margin, exclusive of purchase accounting amortization impact 2.96% 2.97% 3.07% (1) The impact of purchase accounting amortization was $22,000, $61,000 and $235,000 for the three months ended March 31, 2019, December 31, 2018 and March 31, 2018, respectively.