Western New England Bancorp 8-K
Exhibit 99.1

Local banking is better than ever. INVESTOR PRESENTATION

FORWARD - LOOKING STATEMENTS 1 We may, from time to time, make written or oral “forward - looking statements” within the meaning of the Private Securities Litigation Reform Act of 1995 , including statements contained in our filings with the Securities and Exchange Commission (the “SEC”), our reports to shareholders and in other communications by us . This presentation contains “forward - looking statements” with respect to the Company’s financial condition, liquidity, results of operations, future performance, business, measures being taken in response to the coronavirus disease 2019 (“COVID - 19 ”) pandemic and the impact of COVID - 19 on the Company’s business . Forward - looking statements may be identified by the use of such words as “believe,” “expect,” “anticipate,” “should,” “planned,” “estimated,” and “potential . ” Examples of forward - looking statements include, but are not limited to, estimates with respect to our financial condition, results of operations and business that are subject to various factors which could cause actual results to differ materially from these estimates . These factors include, but are not limited to : • the duration and scope of the COVID - 19 pandemic and the local, national and global impact of COVID - 19; • actions governments, businesses and individuals take in response to the COVID - 19 pandemic ; • the speed and effectiveness of vaccine and treatment developments and their deployment, including public adoption rates of CO VID - 19 vaccines; • variations of COVID - 19, such as the Delta variant, and the response thereto; • the pace of recovery when the COVID - 19 pandemic subsides; • changes in the interest rate environment that reduce margins; • the effect on our operations of governmental legislation and regulation, including changes in accounting regulation or standa rds , the nature and timing of the adoption and effectiveness of new requirements under the Dodd - Frank Act Wall Street Reform and Consumer Protection Act of 2010 ( “Dodd - Frank Act”), Basel guidelines, capital requirements and other applicable laws and regulations; • the highly competitive industry and market area in which we operate; • general economic conditions, either nationally or regionally, resulting in, among other things, a deterioration in credit qua lit y; • changes in business conditions and inflation; • changes in credit market conditions; • the inability to realize expected cost savings or achieve other anticipated benefits in connection with business combinations an d other acquisitions; • changes in the securities markets which affect investment management revenues; • increases in Federal Deposit Insurance Corporation deposit insurance premiums and assessments; • changes in technology used in the banking business; • the soundness of other financial services institutions which may adversely affect our credit risk; • certain of our intangible assets may become impaired in the future; • our controls and procedures may fail or be circumvented; • new lines of business or new products and services, which may subject us to additional risks; • changes in key management personnel which may adversely impact our operations; • severe weather, natural disasters, acts of war or terrorism and other external events which could significantly impact our bu sin ess; and • other factors detailed from time to time in our SEC filings . Although we believe that the expectations reflected in such forward - looking statements are reasonable, actual results may differ materially from the results discussed in these forward - looking statements . You are cautioned not to place undue reliance on these forward - looking statements, which speak only as of the date hereof . We do not undertake any obligation to republish revised forward - looking statements to reflect events or circumstances after the date hereof or to reflect the occurrence of unanticipated events, except to the extent required by law .
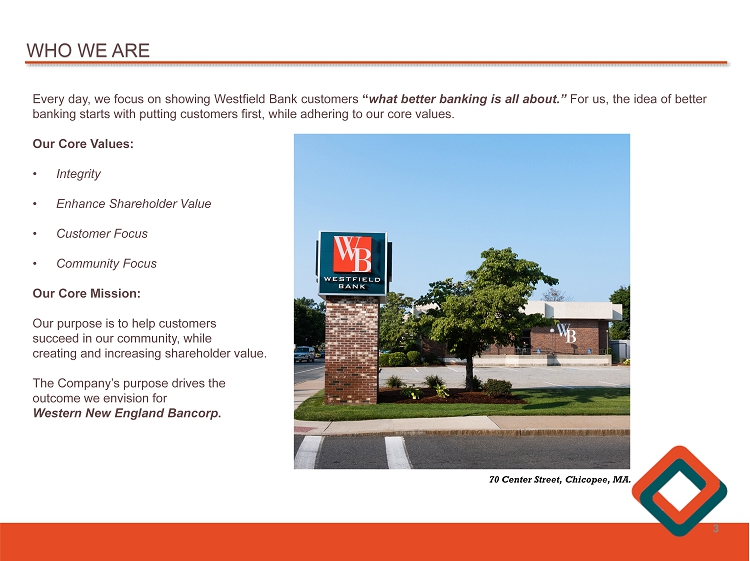
WHO WE ARE Every day, we focus on showing Westfield Bank customers “ what better banking is all about . ” For us, the idea of better banking starts with putting customers first, while adhering to our core values . Our Core Values : • Integrity • Enhance Shareholder Value • Customer Focus • Community Focus Our Core Mission : Our purpose is to help customers succeed in our community, while creating and increasing shareholder value . The Company’s purpose drives the outcome we envision for Western New England Bancorp . 3 70 Center Street, Chicopee, MA.

SENIOR MANAGEMENT TEAM James C . Hagan, President & Chief Executive Officer Guida R . Sajdak, Executive Vice President, Chief Financial Officer & Treasurer Allen J . Miles III, Executive Vice President & Chief Lender Officer Kevin C . O’Connor, Executive Vice President & Chief Banking Officer Louis O . Gorman, Senior Vice President & Chief Credit Officer Leo R . Sagan, Jr . , Senior Vice President & Chief Risk Officer Darlene Libiszewski , Senior Vice President & Chief Information Officer John Bonini , Senior Vice President & General Counsel Christine Phillips , Senior Vice President, Human Resources Deborah J . McCarthy, Senior Vice President, Deposit Operations & Electronic Banking Cidalia Inacio , Senior Vice President, Retail Banking & Wealth Management 4
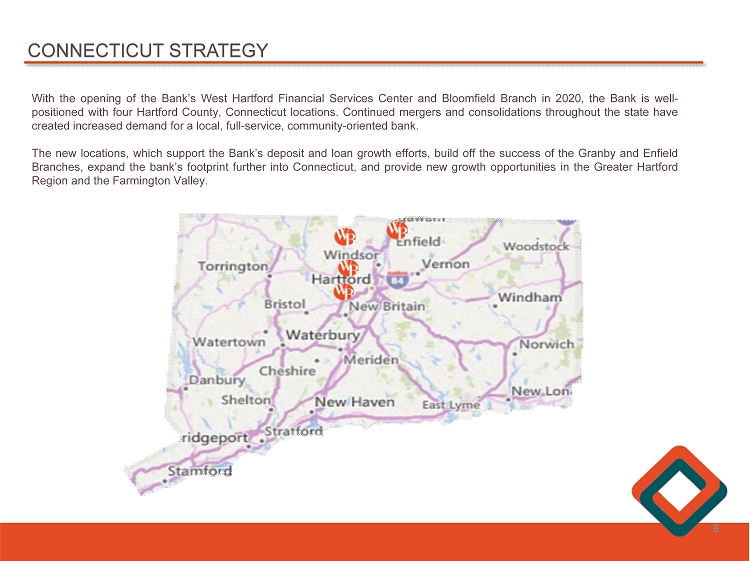
CONNECTICUT STRATEGY With the opening of the Bank’s West Hartford Financial Services Center and Bloomfield Branch in 2020 , the Bank is well - positioned with four Hartford County, Connecticut locations . Continued mergers and consolidations throughout the state have created increased demand for a local, full - service, community - oriented bank . The new locations, which support the Bank’s deposit and loan growth efforts, build off the success of the Granby and Enfield Branches, expand the bank’s footprint further into Connecticut, and provide new growth opportunities in the Greater Hartford Region and the Farmington Valley . 5
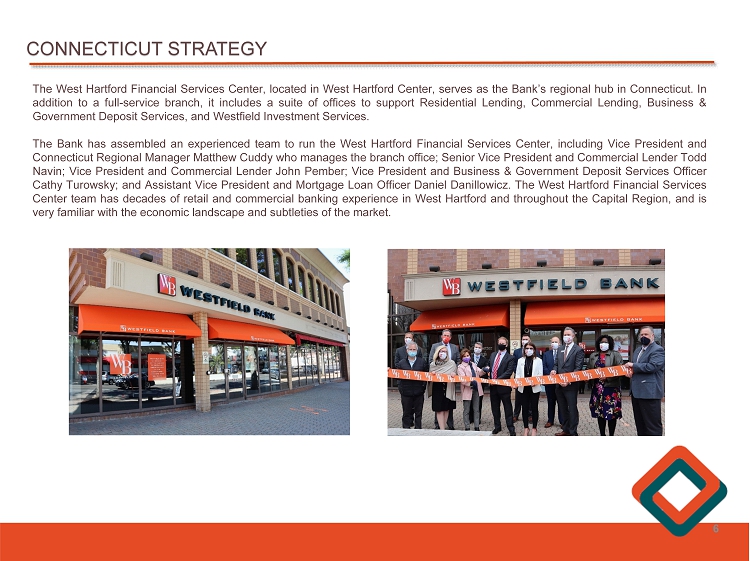
CONNECTICUT STRATEGY The West Hartford Financial Services Center, located in West Hartford Center, serves as the Bank’s regional hub in Connecticut . In addition to a full - service branch, it includes a suite of offices to support Residential Lending, Commercial Lending, Business & Government Deposit Services, and Westfield Investment Services . The Bank has assembled an experienced team to run the West Hartford Financial Services Center, including Vice President and Connecticut Regional Manager Matthew Cuddy who manages the branch office ; Senior Vice President and Commercial Lender Todd Navin ; Vice President and Commercial Lender John Pember ; Vice President and Business & Government Deposit Services Officer Cathy Turowsky ; and Assistant Vice President and Mortgage Loan Officer Daniel Danillowicz . The West Hartford Financial Services Center team has decades of retail and commercial banking experience in West Hartford and throughout the Capital Region, and is very familiar with the economic landscape and subtleties of the market . 6
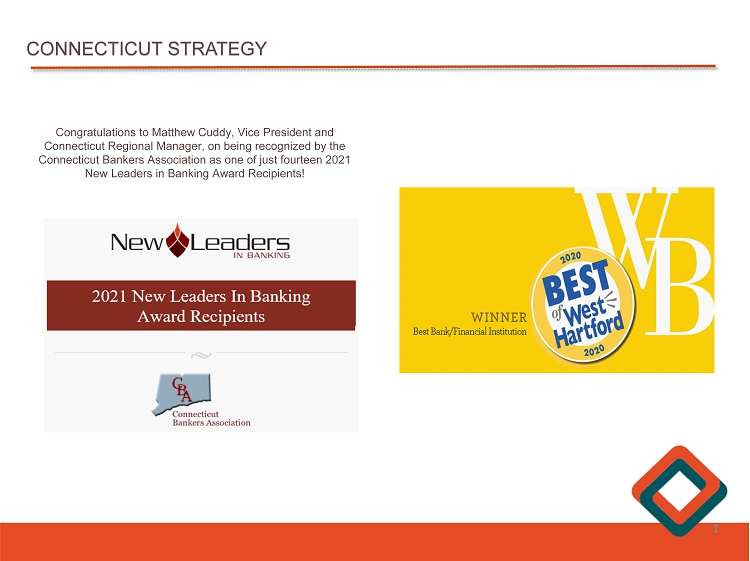
CONNECTICUT STRATEGY 7 Congratulations to Matthew Cuddy, Vice President and Connecticut Regional Manager, on being recognized by the Connecticut Bankers Association as one of just fourteen 2021 New Leaders in Banking Award Recipients!

CONNECTICUT STRATEGY The Bloomfield branch , located in the Copaco Shopping Center, is a full - service branch and includes drive - through teller and safe deposit services . The Copaco Shopping Center is composed of national and local brands and is a major shopping destination for the greater Bloomfield area, which offers both retail and commercial banking opportunities . Assistant Vice President and Branch Manager Lindsay Allen has extensive banking and branch management experience, having worked for both national and community banks, and is a Bloomfield resident . 8

CONNECTICUT STRATEGY Earlier this year, the Bank announced plans for the construction of a new branch office in Granby, Connecticut to replace its current location at the Granby Village Shops. The new standalone branch is located on East Granby Road (Route 20), a major travel rou te for both residents and commuters. The new branch will feature drive - up teller lanes, a drive - up ATM, safe deposit boxes, and a suite of private offices. 2

2 Q2021 EARNINGS 10 ($ in thousands , except EPS) 2Q2021 1Q2021 4Q2020 3Q2020 2Q2020 Net interest income $ 17,804 $ 18,026 $ 18,795 $ 15,990 $ 15,092 (Credit) p rovision for loan losses (1,200) 75 500 2,725 2,450 Non - interest income 2,409 3,004 2,462 2,177 2,087 Non - interest expense 13,674 13,327 14,338 12,853 12,245 Income before taxes 7,739 7,628 6,419 2,589 2,484 Income tax expense 2,087 1,837 1,406 488 463 Net income $ 5,652 $ 5,791 $ 5,013 $ 2,101 $ 2,021 Diluted earnings per share (EPS) $ 0.24 $ 0.24 $ 0.20 $ 0.08 $ 0.08 ROA 0.92% 0.98% 0.83% 0.35% 0.35% ROE 10.16% 10.35% 8.62% 3.61% 3.54% Net interest margin 3.06% 3.24% 3.30% 2.81% 2.74% Net interest margin, on a tax - equivalent basis 3.08% 3.26% 3.32% 2.83% 2.76%

NET INTEREST INCOME 11 $15.1 $16.0 $18.8 $18.0 $17.8 2.74% 2.81% 3.30% 3.24% 3.06% 2.72% 2.86% 3.19% 3.03% 2.98% 2.50% 2.70% 2.90% 3.10% 3.30% 3.50% 3.70% 2Q2020 3Q2020 4Q2020 1Q2021 2Q2021 $0.0 $2.0 $4.0 $6.0 $8.0 $10.0 $12.0 $14.0 $16.0 $18.0 $20.0 Net interest income Net interest margin (%) Adjusted net interest margin, excludes PPP Net interest income increased $ 2 . 7 million, or 18 . 0 % , from 2 Q 2020 to 2 Q 2021 and decreased $ 222 , 000 , or 1 . 2 % , from the linked quarter . The net interest margin increased from 2 . 74 % at 2 Q 2020 to 3 . 06 % at 2 Q 2021 . Excluding PPP income, the adjusted net interest margin decreased 5 basis points from 3 . 03 % in 1 Q 2021 to 2 . 98 % in 2 Q 2021 . ($ in millions)
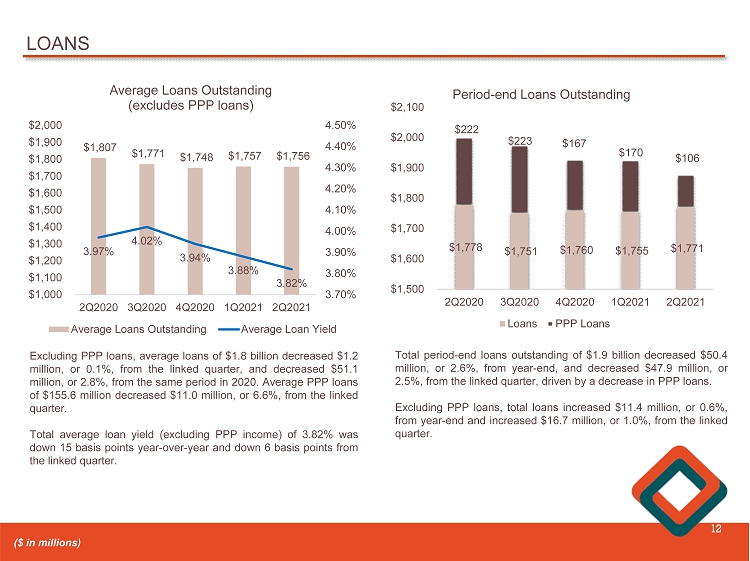
LOANS 12 $1,807 $1,771 $1,748 $1,757 $1,756 3.97% 4.02% 3.94% 3.88% 3.82% 3.70% 3.80% 3.90% 4.00% 4.10% 4.20% 4.30% 4.40% 4.50% 2Q2020 3Q2020 4Q2020 1Q2021 2Q2021 $1,000 $1,100 $1,200 $1,300 $1,400 $1,500 $1,600 $1,700 $1,800 $1,900 $2,000 Average Loans Outstanding (excludes PPP loans) Average Loans Outstanding Average Loan Yield $1,778 $1,751 $1,760 $1,755 $1,771 $222 $223 $167 $170 $106 2Q2020 3Q2020 4Q2020 1Q2021 2Q2021 $1,500 $1,600 $1,700 $1,800 $1,900 $2,000 $2,100 Period - end Loans Outstanding Loans PPP Loans Excluding PPP loans, average loans of $ 1 . 8 billion decreased $ 1 . 2 million, or 0 . 1 % , from the linked quarter, and decreased $ 51 . 1 million, or 2 . 8 % , from the same period in 2020 . Average PPP loans of $ 155 . 6 million decreased $ 11 . 0 million, or 6 . 6 % , from the linked quarter . Total average loan yield (excluding PPP income) of 3 . 82 % was down 15 basis points year - over - year and down 6 basis points from the linked quarter . Total period - end loans outstanding of $ 1 . 9 billion decreased $ 50 . 4 million , or 2 . 6 % , from year - end, and decreased $ 47 . 9 million , or 2 . 5 % , from the linked quarter, driven by a decrease in PPP loans . Excluding PPP loans, total loans increased $ 11 . 4 million, or 0 . 6 % , from year - end and increased $ 16 . 7 million, or 1 . 0 % , from the linked quarter . ($ in millions)
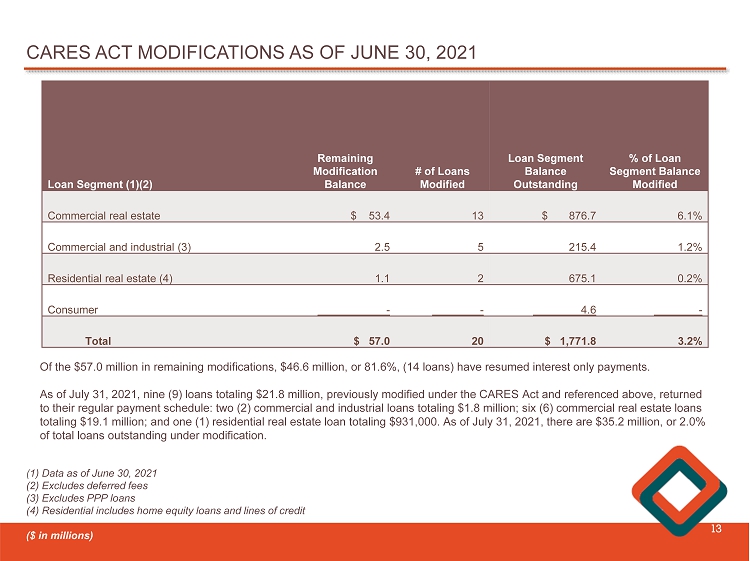
CARES ACT MODIFICATIONS AS OF JUNE 30, 2021 13 Loan Segment (1)(2) Remaining Modification Balance # of Loans Modified Loan Segment Balance Outstanding % of Loan Segment Balance Modified Commercial real estate $ 53.4 13 $ 876.7 6.1% Commercial and industrial ( 3 ) 2.5 5 215.4 1.2% Residential real estate ( 4 ) 1.1 2 675.1 0.2% Consumer - - 4.6 - Total $ 57.0 20 $ 1,771.8 3.2% ( 1) Data as of June 30, 2021 (2) Excludes deferred fees (3) Excludes PPP loans (4) Residential includes home equity loans and lines of credit ($ in millions) Of the $57.0 million in remaining modifications, $46.6 million, or 81.6%, (14 loans) have resumed interest only payments. As of July 31, 2021, nine (9) loans totaling $21.8 million, previously modified under the CARES Act and referenced above, ret urn ed to their regular payment schedule: two (2) commercial and industrial loans totaling $1.8 million; six (6) commercial real est ate loans totaling $19.1 million; and one (1) residential real estate loan totaling $931,000. As of July 31, 2021, there are $35.2 mill ion , or 2.0% of total loans outstanding under modification.

COMMERCIAL AND INDUSTRIAL LOAN TRENDS 14 $231 $222 $212 $205 $215 $222 $223 $167 $170 $106 2Q2020 3Q2020 4Q2020 1Q2021 2Q2021 $100 $150 $200 $250 $300 $350 $400 $450 $500 Commercial and Industrial Loans C&I Loans PPP Loans Commercial and industrial loans (“C&I”) of $ 320 . 9 million decreased $ 58 . 2 million , or 15 . 4 % , from December 31 , 2020 , driven by a decrease in PPP loans of $ 61 . 7 million, or 36 . 9 % . Commercial line of credit usage was 22 % for 2 Q 2021 , up from 17 % for both 1 Q 2021 and 4 Q 2020 . Line balances increased $ 14 . 2 million, or 29 . 5 % , from 4 Q 2020 . At June 30 , 2021 , there were 5 loans totaling $ 2 . 5 million remaining under CARES Act modifications, representing 1 . 2 % of total C&I loans, compared to $ 19 . 1 million, or 8 . 3 % of total C&I loans, at June 30 , 2020 . At June 30 , 2021 , total delinquent C&I loans totaled $ 428 thousand, or 0 . 2 % , of the C&I portfolio, excluding PPP loans . ($ in millions)
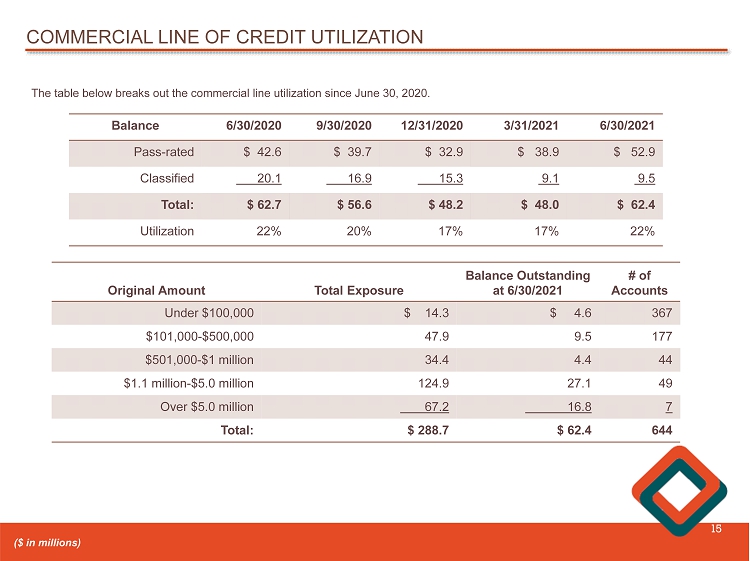
COMMERCIAL LINE OF CREDIT UTILIZATION 15 The table below breaks out the commercial line utilization since June 30, 2020. Balance 6/30/2020 9/30/2020 12/31/2020 3/31/2021 6/30/2021 Pass - rated $ 42.6 $ 39.7 $ 32.9 $ 38.9 $ 52.9 Classified 20.1 16.9 15.3 9.1 9.5 Total: $ 62.7 $ 56.6 $ 48.2 $ 48.0 $ 62.4 Utilization 22% 20% 17% 17% 22% Original Amount Total Exposure Balance Outstanding at 6/30/2021 # of Accounts Under $100,000 $ 14.3 $ 4.6 367 $101,000 - $500,000 47.9 9.5 177 $501,000 - $1 million 34.4 4.4 44 $1.1 million - $5.0 million 124.9 27.1 49 Over $5.0 million 67.2 16.8 7 Total: $ 288.7 $ 62.4 644 ($ in millions)
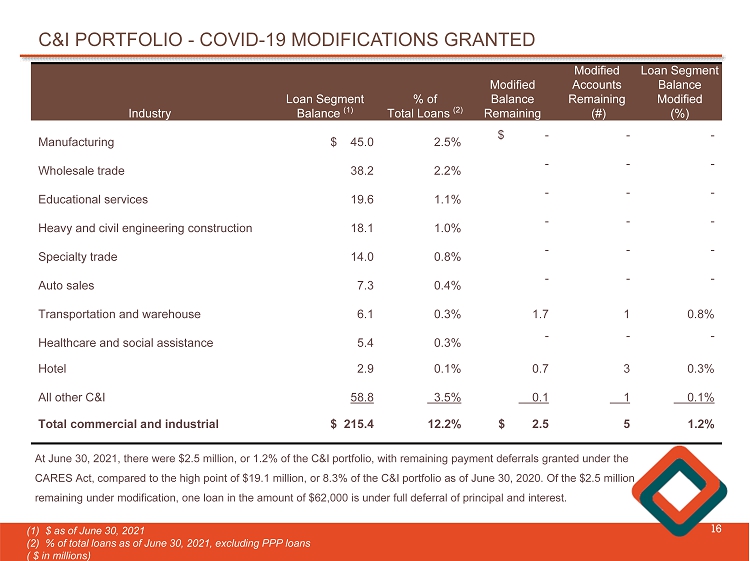
C&I PORTFOLIO - COVID - 19 MODIFICATIONS GRANTED 16 Industry Loan Segment Balance (1) % of Total Loans (2) Modified Balance Remaining Modified Accounts Remaining (#) Loan Segment Balance Modified (%) Manufacturing $ 45.0 2.5% $ - - - Wholesale trade 38.2 2.2% - - - Educational services 19.6 1.1% - - - Heavy and civil engineering construction 18.1 1.0% - - - Specialty trade 14.0 0.8% - - - Auto sales 7.3 0.4% - - - Transportation and warehouse 6.1 0.3% 1.7 1 0.8% Healthcare and social assistance 5.4 0.3% - - - Hotel 2.9 0.1% 0.7 3 0.3% All other C&I 58.8 3.5% 0.1 1 0.1% Total commercial and industrial $ 215.4 12.2% $ 2.5 5 1.2% At June 30, 2021, there were $2.5 million, or 1.2% of the C&I portfolio, with remaining payment deferrals granted under the CARES Act, compared to the high point of $19.1 million, or 8.3% of the C&I portfolio as of June 30, 2020. Of the $2.5 million remaining under modification, one loan in the amount of $62,000 is under full deferral of principal and interest. (1) $ as of June 30, 2021 (2) % of total loans as of June 30, 2021, excluding PPP loans ( $ in millions)
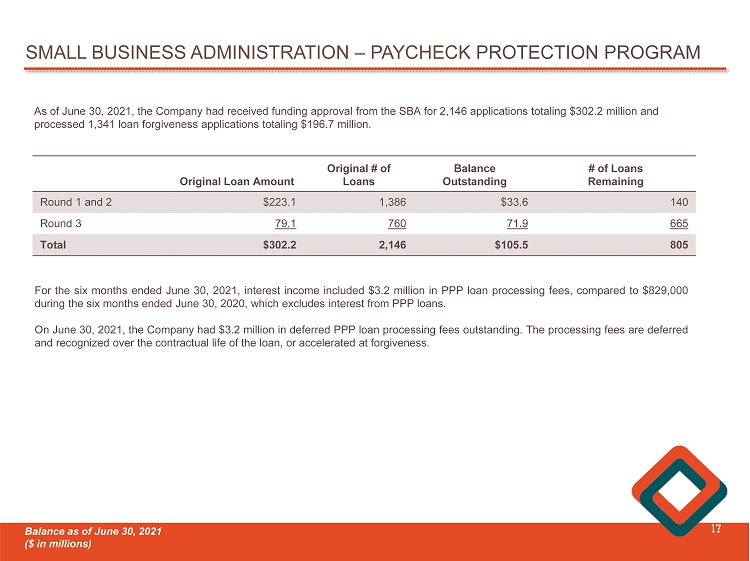
SMALL BUSINESS ADMINISTRATION – PAYCHECK PROTECTION PROGRAM 17 Balance as of June 30, 2021 ( $ in millions) Original Loan Amount Original # of Loans Balance Outstanding # of Loans Remaining Round 1 and 2 $223.1 1,386 $33.6 140 Round 3 79.1 760 71.9 665 Total $302.2 2,146 $105.5 805 As of June 30, 2021, the Company had received funding approval from the SBA for 2,146 applications totaling $302.2 million an d processed 1,341 loan forgiveness applications totaling $ 196.7 million. For the six months ended June 30 , 2021 , interest income included $ 3 . 2 million in PPP loan processing fees, compared to $ 829 , 000 during the six months ended June 30 , 2020 , which excludes interest from PPP loans . On June 30 , 2021 , the Company had $ 3 . 2 million in deferred PPP loan processing fees outstanding . The processing fees are deferred and recognized over the contractual life of the loan, or accelerated at forgiveness .
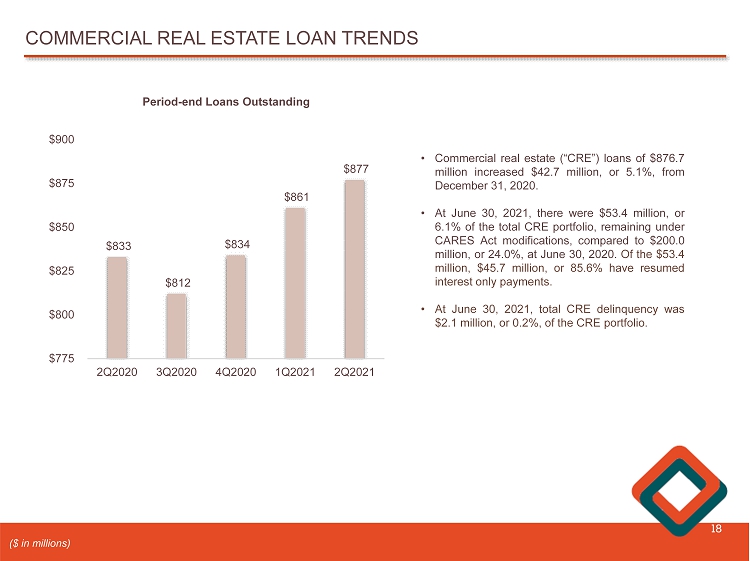
COMMERCIAL REAL ESTATE LOAN TRENDS 18 $833 $812 $834 $861 $877 2Q2020 3Q2020 4Q2020 1Q2021 2Q2021 $775 $800 $825 $850 $875 $900 • Commercial real estate (“CRE”) loans of $ 876 . 7 million increased $ 42 . 7 million, or 5 . 1 % , from December 31 , 2020 . • At June 30 , 2021 , there were $ 53 . 4 million, or 6 . 1 % of the total CRE portfolio, remaining under CARES Act modifications, compared to $ 200 . 0 million, or 24 . 0 % , at June 30 , 2020 . Of the $ 53 . 4 million, $ 45 . 7 million, or 85 . 6 % have resumed interest only payments . • At June 30 , 2021 , total CRE delinquency was $ 2 . 1 million, or 0 . 2 % , of the CRE portfolio . ($ in millions) Period - end Loans Outstanding
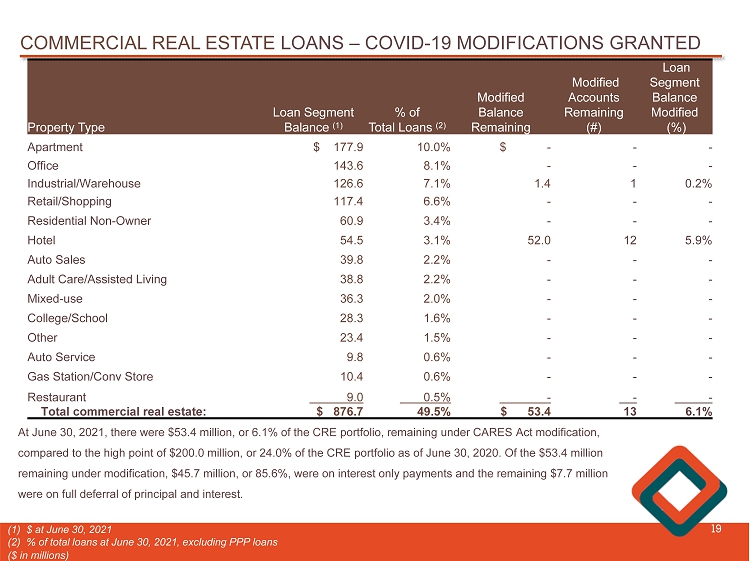
COMMERCIAL REAL ESTATE LOANS – COVID - 19 MODIFICATIONS GRANTED 19 Property Type Loan Segment Balance (1) % of Total Loans (2) Modified Balance Remaining Modified Accounts Remaining (#) Loan Segment Balance Modified (%) Apartment $ 177.9 10.0% $ - - - Office 143.6 8.1% - - - Industrial/Warehouse 126.6 7.1% 1.4 1 0.2% Retail/Shopping 117.4 6.6% - - - Residential Non - Owner 60.9 3.4% - - - Hotel 54.5 3.1% 52.0 12 5.9% Auto Sales 39.8 2.2% - - - Adult Care/Assisted Living 38.8 2.2% - - - Mixed - use 36.3 2.0% - - - College/School 28.3 1.6% - - - Other 23.4 1.5% - - - Auto Service 9.8 0.6% - - - Gas Station/Conv Store 10.4 0.6% - - - Restaurant 9.0 0.5% - - - Total commercial real estate : $ 876.7 49.5% $ 53.4 13 6.1% (1) $ at June 30, 2021 (2) % of total loans at June 30, 2021, excluding PPP loans ($ in millions) At June 30, 2021, there were $53.4 million, or 6.1% of the CRE portfolio, remaining under CARES Act modification, compared to the high point of $200.0 million, or 24.0% of the CRE portfolio as of June 30, 2020. Of the $53.4 million remaining under modification, $45.7 million, or 85.6%, were on interest only payments and the remaining $7.7 million were on full deferral of principal and interest.
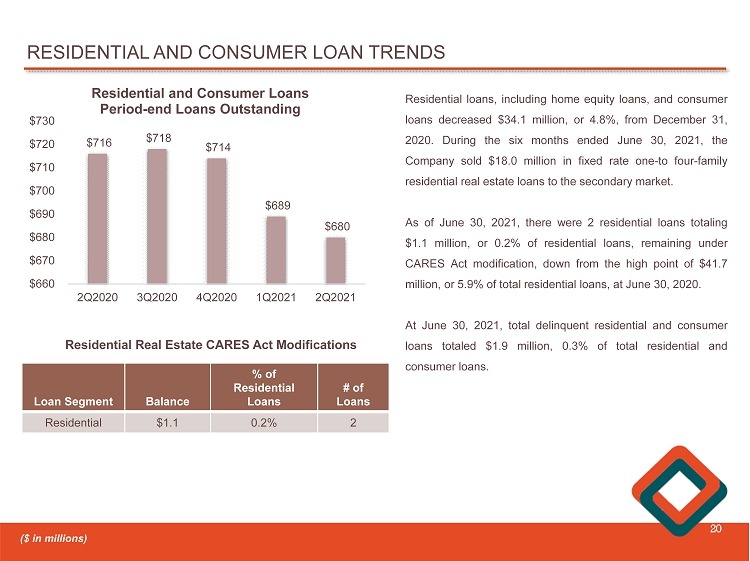
RESIDENTIAL AND CONSUMER LOAN TRENDS 20 $716 $718 $714 $689 $680 2Q2020 3Q2020 4Q2020 1Q2021 2Q2021 $660 $670 $680 $690 $700 $710 $720 $730 Residential and Consumer Loans Period - end Loans Outstanding Residential loans, including home equity loans, and consumer loans decreased $ 34 . 1 million, or 4 . 8 % , from December 31 , 2020 . During the six months ended June 30 , 2021 , the Company sold $ 18 . 0 million in fixed rate one - to four - family residential real estate loans to the secondary market . As of June 30 , 2021 , there were 2 residential loans totaling $ 1 . 1 million, or 0 . 2 % of residential loans, remaining under CARES Act modification, down from the high point of $ 41 . 7 million, or 5 . 9 % of total residential loans, at June 30 , 2020 . At June 30 , 2021 , total delinquent residential and consumer loans totaled $ 1 . 9 million, 0 . 3 % of total residential and consumer loans . Loan Segment Balance % of Residential L oans # of Loans Residential $1.1 0.2% 2 ($ in millions) Residential Real Estate CARES Act Modifications

TOTAL DEPOSITS 21 $1,319 $1,363 $1,448 $1,631 $1,727 2Q2020 3Q2020 4Q2020 1Q2021 2Q2021 $550 $750 $950 $1,150 $1,350 $1,550 $1,750 $1,950 PERIOD - END CORE DEPOSITS Period - end core deposits of $ 1 . 7 billion increased $ 279 . 2 million, or 19 . 3 % , from year - end, while time deposits of $ 453 . 6 million decreased $ 136 . 7 million, or 23 . 2 % , from year - end . The ratio of core deposits as a percentage of total deposits was 79 . 2 % at June 30 , 2021 , compared to 71 . 0 % at December 31 , 2020 . $629 $648 $590 $523 $454 2Q2020 3Q2020 4Q2020 1Q2021 2Q2021 $- $100 $200 $300 $400 $500 $600 $700 PERIOD - END TIME DEPOSITS ($ in millions)
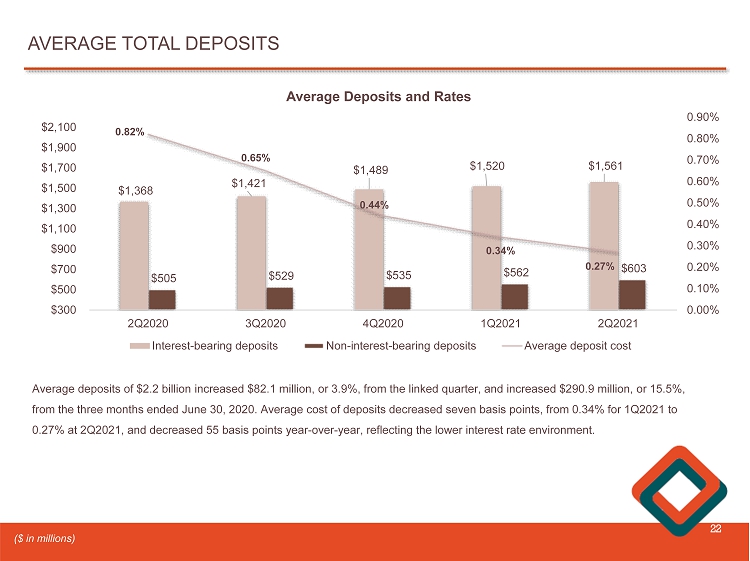
AVERAGE TOTAL DEPOSITS 22 $1,368 $1,421 $1,489 $1,520 $1,561 $505 $529 $535 $562 $603 0.82% 0.65% 0.44% 0.34% 0.27% 0.00% 0.10% 0.20% 0.30% 0.40% 0.50% 0.60% 0.70% 0.80% 0.90% 2Q2020 3Q2020 4Q2020 1Q2021 2Q2021 $300 $500 $700 $900 $1,100 $1,300 $1,500 $1,700 $1,900 $2,100 Average Deposits and Rates Interest-bearing deposits Non-interest-bearing deposits Average deposit cost Average deposits of $2.2 billion increased $82.1 million , or 3.9%, from the linked quarter, and increased $290.9 million, or 15.5%, from the three months ended June 30, 2020. Average cost of deposits decreased seven basis points, from 0.34% for 1Q2021 to 0.27% at 2Q2021, and decreased 55 basis points year - over - year, reflecting the lower interest rate environment. ($ in millions)

AVERAGE CORE DEPOSITS 23 $1,233 $1,325 $1,404 $1,515 $1,676 0.27% 0.25% 0.23% 0.21% 0.19% 0.00% 0.05% 0.10% 0.15% 0.20% 0.25% 0.30% 2Q2020 3Q2020 4Q2020 1Q2021 2Q2021 $1,000 $1,200 $1,400 $1,600 $1,800 $2,000 $2,200 Average Core Deposits and Rates Average core deposits, including non - interest bearing deposits, increased $ 161 . 4 million, or 10 . 7 % , from the linked quarter, and increased $ 443 . 4 million, or 36 . 0 % , year - over - year . The cost of core deposits decreased two basis points from the linked quarter, reflecting the lower interest rate environment . ($ in millions)
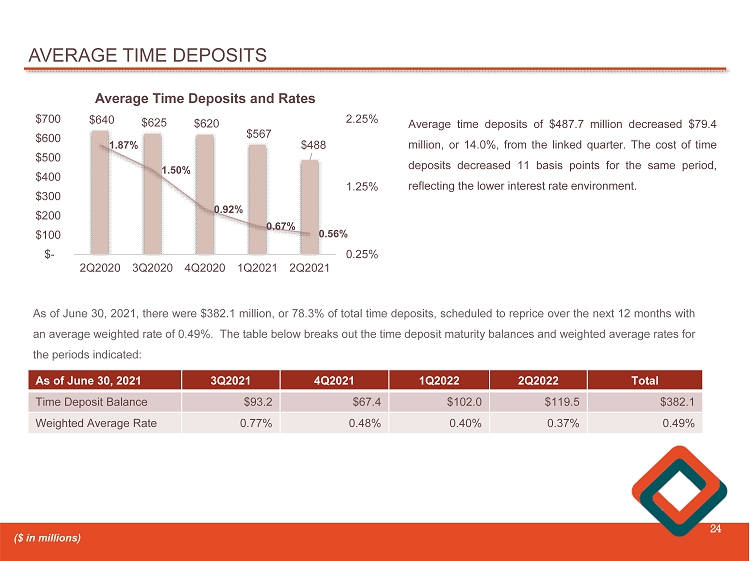
AVERAGE TIME DEPOSITS 24 $640 $625 $620 $567 $488 1.87% 1.50% 0.92% 0.67% 0.56% 0.25% 1.25% 2.25% 2Q2020 3Q2020 4Q2020 1Q2021 2Q2021 $- $100 $200 $300 $400 $500 $600 $700 Average Time Deposits and Rates Average time deposits of $ 487 . 7 million decreased $ 79 . 4 m illion , or 14 . 0 % , from the linked quarter . The cost of time deposits decreased 11 basis points for the same period, reflecting the lower interest rate environment . As of June 30 , 2021 , there were $ 382 . 1 million, or 78 . 3 % of total time deposits, scheduled to reprice over the next 12 months with an average weighted rate of 0 . 49 % . The table below breaks out the time deposit maturity balances and weighted average rates for the periods indicated : ($ in millions) As of June 30, 2021 3Q2021 4Q2021 1Q2022 2Q2022 Total Time Deposit Balance $93.2 $67.4 $102.0 $119.5 $382.1 Weighted Average Rate 0.77% 0.48% 0.40% 0.37% 0.49%
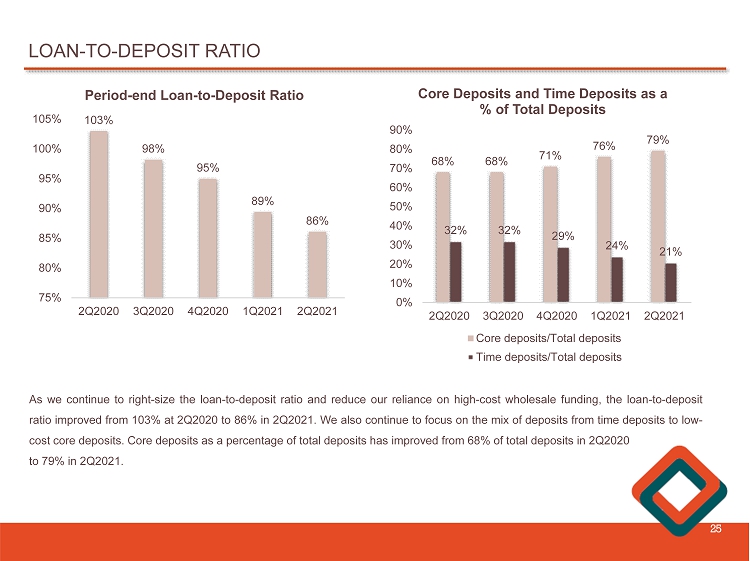
LOAN - TO - DEPOSIT RATIO 25 103% 98% 95% 89% 86% 2Q2020 3Q2020 4Q2020 1Q2021 2Q2021 75% 80% 85% 90% 95% 100% 105% Period - end Loan - to - Deposit Ratio 68% 68% 71% 76% 79% 32% 32% 29% 24% 21% 2Q2020 3Q2020 4Q2020 1Q2021 2Q2021 0% 10% 20% 30% 40% 50% 60% 70% 80% 90% Core Deposits and Time Deposits as a % of Total Deposits Core deposits/Total deposits Time deposits/Total deposits As we continue to right - size the loan - to - deposit ratio and reduce our reliance on high - cost wholesale funding, the loan - to - deposit ratio improved from 103 % at 2 Q 2020 to 86 % in 2 Q 2021 . We also continue to focus on the mix of deposits from time deposits to low - cost core deposits . Core deposits as a percentage of tota l deposits has improved from 68 % of total deposits in 2 Q 2020 to 79 % in 2 Q 2021 .
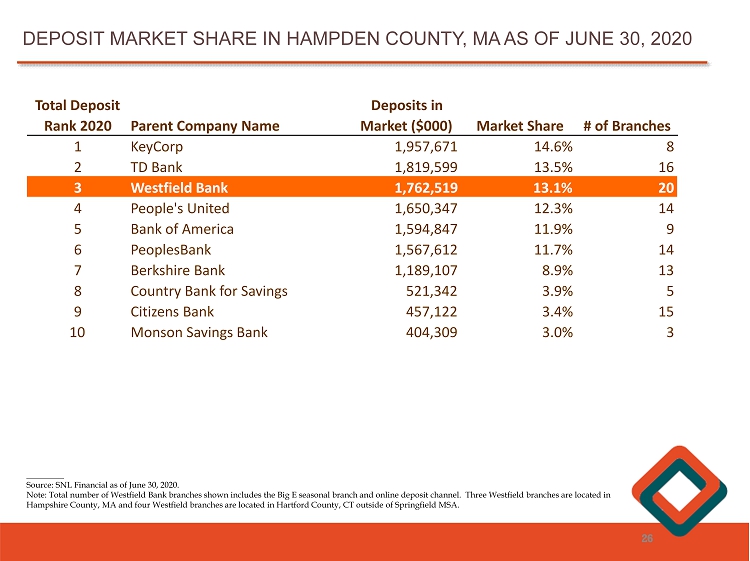
________ Source: SNL Financial as of June 30, 2020. Note: Total number of Westfield Bank branches shown includes the Big E seasonal branch and online deposit channel. Three Wes tfi eld branches are located in Hampshire County, MA and four Westfield branches are located in Hartford County, CT outside of Springfield MSA. DEPOSIT MARKET SHARE IN HAMPDEN COUNTY, MA AS OF JUNE 30, 2020 26 % Total Deposit Rank 2020 Parent Company Name Deposits in Market ($000) Market Share # of Branches 1 KeyCorp 1,957,671 14.6% 8 2 TD Bank 1,819,599 13.5% 16 3 Westfield Bank 1,762,519 13.1% 20 4 People's United 1,650,347 12.3% 14 5 Bank of America 1,594,847 11.9% 9 6 PeoplesBank 1,567,612 11.7% 14 7 Berkshire Bank 1,189,107 8.9% 13 8 Country Bank for Savings 521,342 3.9% 5 9 Citizens Bank 457,122 3.4% 15 10 Monson Savings Bank 404,309 3.0% 3

TOTAL BORROWINGS AND SUBORDINATED DEBT 27 $197 $151 $58 $43 $5 $ - $ - $ - $ - $20 $26 $ - $ - $ - $ - 2Q2020 3Q2020 4Q2020 1Q2021 2Q2021 $- $50 $100 $150 $200 $250 Period - end FHLB, Subordinated Debt & Payroll Protection Program Liquidity Facility FHLB Subordinated debt PPPLF ($ in millions) At June 30 , 2021 , total borrowings decreased $ 33 . 3 million, or 57 . 5 % , from $ 57 . 9 million at December 31 , 2020 , to $ 24 . 6 million . FHLB advances decreased $ 52 . 9 million, or 91 . 4 % , to $ 5 . 0 million . During the three months ended June 30 , 2021 , the Company prepaid $ 32 . 5 million of FHLB borrowings with a weighted average rate of 2 . 03 % . The prepayment took place on June 30 , 2021 and was accounted for as an early extinguishment of debt, resulting in a loss of $ 45 , 000 reported within non - interest expense . The extinguishment had no negative effect on our regulatory capital ratios since we reduced the size of our balance sheet . The extinguishment of the high - cost FHLB borrowings is expected to benefit the Company's net interest margin and net interest income compared to what we otherwise would have expected . During the three months ended June 30 , 2021 , the Company successfully completed an offering of $ 20 . 0 million in subordinated debt .
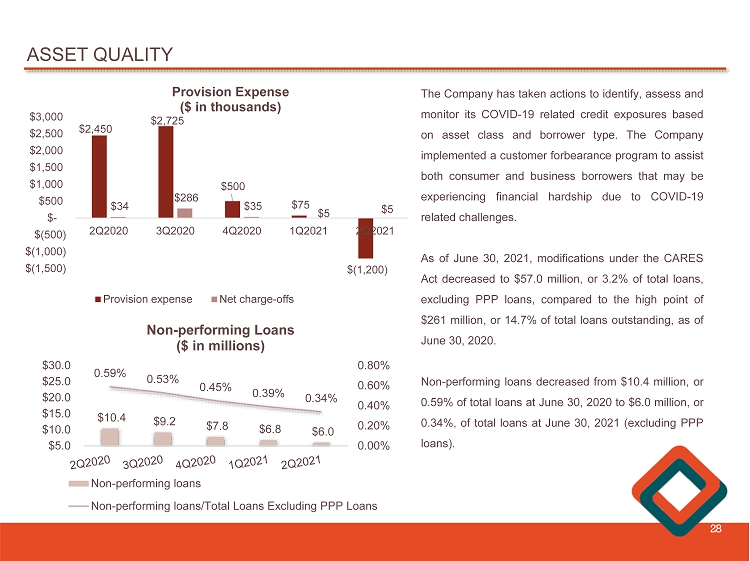
ASSET QUALITY 28 $10.4 $9.2 $7.8 $6.8 $6.0 0.59% 0.53% 0.45% 0.39% 0.34% 0.00% 0.20% 0.40% 0.60% 0.80% $5.0 $10.0 $15.0 $20.0 $25.0 $30.0 Non - performing Loans ($ in millions) Non-performing loans Non-performing loans/Total Loans Excluding PPP Loans The Company has taken actions to identify, assess and monitor its COVID - 19 related credit exposures based on asset class and borrower type . The Company implemented a customer forbearance program to assist both consumer and business borrowers that may be experiencing financial hardship due to COVID - 19 related challenges . As of June 30 , 2021 , modifications under the CARES Act decreased to $ 57 . 0 million, or 3 . 2 % of total loans, excluding PPP loans, compared to the high point of $ 261 million, or 14 . 7 % of total loans outstanding, as of June 30 , 2020 . Non - performing loans decreased from $ 10 . 4 million, or 0 . 59 % of total loans at June 30 , 2020 to $ 6 . 0 million, or 0 . 34 % , of total loans at June 30 , 2021 (excluding PPP loans) . $2,450 $2,725 $500 $75 $(1,200) $34 $286 $35 $5 $5 2Q2020 3Q2020 4Q2020 1Q2021 2Q2021 $(1,500) $(1,000) $(500) $- $500 $1,000 $1,500 $2,000 $2,500 $3,000 Provision Expense ($ in thousands) Provision expense Net charge-offs

ASSET QUALITY INDICATORS 29 2Q2020 3Q2020 4Q2020 1Q2021 2Q2021 Total loans modified under the CARES Act $261.0M $66.3M $76.9M $66.9M $57.0M Loans modified as a % of total loans (1) 14.7% 3.8% 4.4% 3.8% 3.2% Total delinquent loans $ $12.0M $6.7M $13.5M $9.3M $4.4M Delinquent loans as a % of total loans (1) 0.68% 0.38% 0.77% 0.53% 0.25% Non - performing loans (NPL) $ $10.4M $9.2M $7.8M $6.8M $6.0M NPL as a % of total loans (1) 0.59% 0.53% 0.45% 0.39% 0.34% NPL as a % of total assets (1) 0.47% 0.41% 0.36% 0.30% 0.25% Allowance for loan losses % of total loans (1) 1.03% 1.18% 1.20% 1.21% 1.12% Allowance for loan losses % of NPL 176% 225% 270% 313% 332% Net charge - offs $34K $286K $35K $5K $157K Net charge - offs as a % average loans (1) 0.00% 0.02% 0.00% 0.00% 0.01% (1) Excludes PPP loans
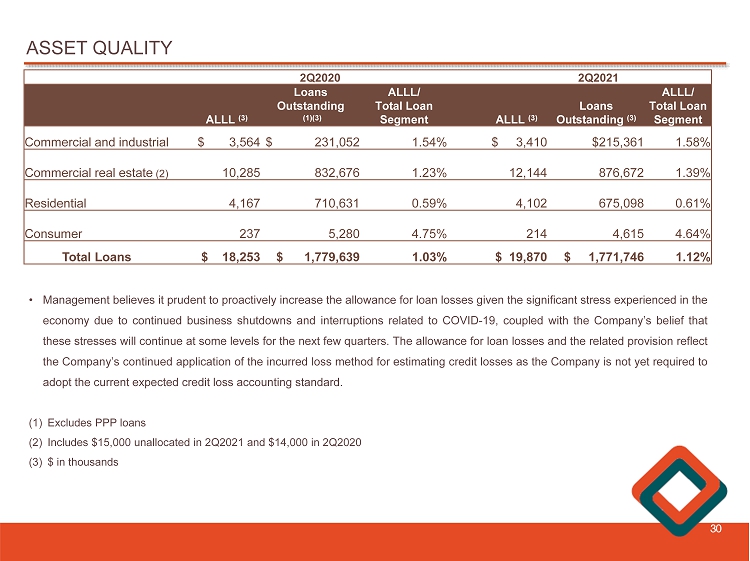
ASSET QUALITY 30 • Management believes it prudent to proactively increase the allowance for loan losses given the significant stress experienced in the economy due to continued business shutdowns and interruptions related to COVID - 19 , coupled with the Company’s belief that these stresses will continue at some levels for the next few quarters . The allowance for loan losses and the related provision reflect the Company’s continued application of the incurred loss method for estimating credit losses as the Company is not yet required to adopt the current expected credit loss accounting standard . (1) Excludes PPP loans (2) Includes $ 15 , 000 unallocated in 2 Q 2021 and $ 14 , 000 in 2 Q 2020 (3) $ in thousands 2Q2020 2Q2021 ALLL (3) Loans Outstanding (1)(3) ALLL/ Total Loan Segment ALLL (3) Loans Outstanding (3) ALLL/ Total Loan Segment Commercial and industrial $ 3,564 $ 231,052 1.54% $ 3,410 $215,361 1.58% Commercial real estate (2) 10,285 832,676 1.23% 12,144 876,672 1.39% Residential 4,167 710,631 0.59% 4,102 675,098 0.61% Consumer 237 5,280 4.75% 214 4,615 4.64% Total Loans $ 18,253 $ 1,779,639 1.03% $ 19,870 $ 1,771,746 1.12%
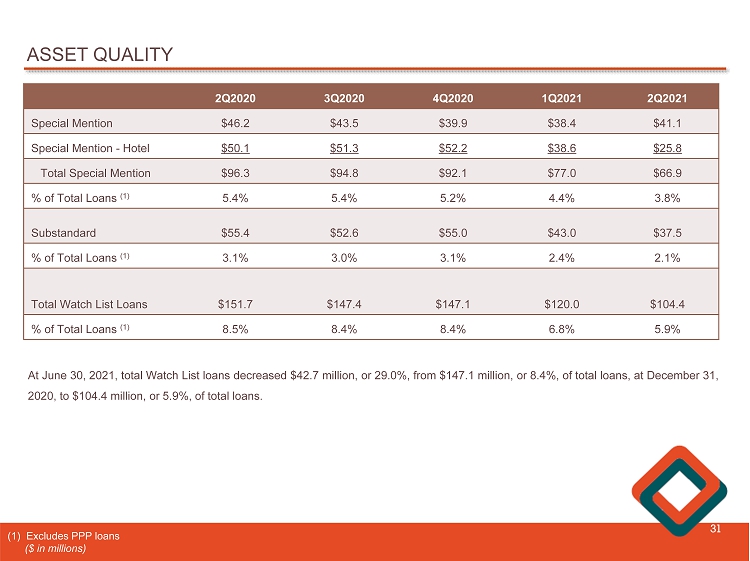
ASSET QUALITY 31 2Q2020 3Q2020 4Q2020 1Q2021 2Q2021 Special Mention $46.2 $43.5 $39.9 $38.4 $41.1 Special Mention - Hotel $50.1 $51.3 $52.2 $38.6 $25.8 Total Special Mention $96.3 $94.8 $92.1 $77.0 $66.9 % of Total Loans (1) 5.4% 5.4% 5.2% 4.4% 3.8% Substandard $55.4 $52.6 $55.0 $43.0 $37.5 % of Total Loans (1) 3.1% 3.0% 3.1% 2.4% 2.1% Total Watch List Loans $151.7 $147.4 $147.1 $120.0 $104.4 % of Total Loans (1) 8.5% 8.4% 8.4% 6.8% 5.9% At June 30 , 2021 , total Watch L ist loans decreased $ 42 . 7 million, or 29 . 0 % , from $ 147 . 1 million, or 8 . 4 % , of total loans, at December 31 , 2020 , to $ 104 . 4 million, or 5 . 9 % , of total loans . (1) Excludes PPP loans ($ in millions)
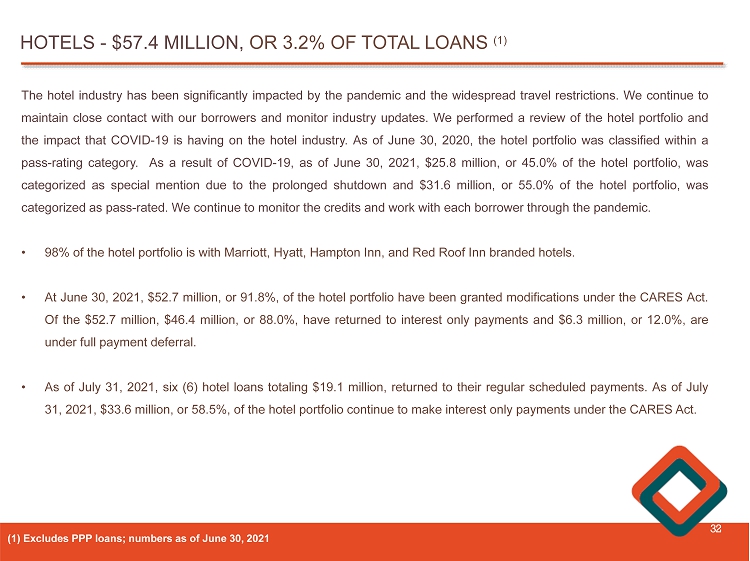
HOTELS - $57.4 MILLION, OR 3.2% OF TOTAL LOANS (1) 32 The hotel industry has been significantly impacted by the pandemic and the widespread travel restrictions . We continue to maintain close contact with our borrowers and monitor industry updates . We performed a review of the hotel portfolio and the impact that COVID - 19 is having on the hotel industry . As of June 30 , 2020 , the hotel portfolio was classified within a pass - rating category . As a result of COVID - 19 , as of June 30 , 2021 , $ 25 . 8 million, or 45 . 0 % of the hotel portfolio, was categorized as special mention due to the prolonged shutdown and $ 31 . 6 million, or 55 . 0 % of the hotel portfolio, was categorized as pass - rated . We continue to monitor the credits and work with each borrower through the pandemic . • 98 % of the hotel portfolio is with Marriott, Hyatt, Hampton Inn, and Red Roof Inn branded hotels . • At June 30 , 2021 , $ 52 . 7 million, or 91 . 8 % , of the hotel portfolio have been granted modifications under the CARES Act . Of the $ 52 . 7 million, $ 46 . 4 million, or 88 . 0 % , have returned to interest only payments and $ 6 . 3 million, or 12 . 0 % , are under full payment deferral . • As of July 31 , 2021 , six ( 6 ) hotel loans totaling $ 19 . 1 million, returned to their regular scheduled payments . As of July 31 , 2021 , $ 33 . 6 million, or 58 . 5 % , of the hotel portfolio continue to make interest only payments under the CARES Act . (1) Excludes PPP loans; numbers as of June 30, 2021
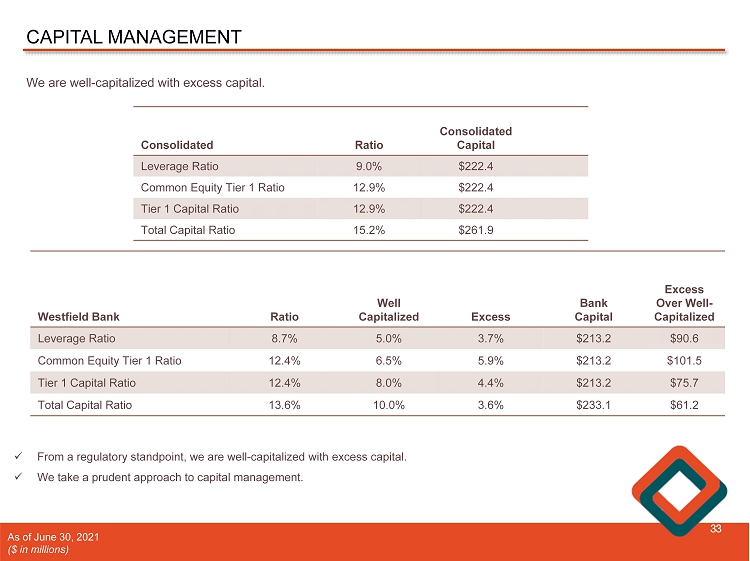
CAPITAL MANAGEMENT 33 We are well - capitalized with excess capital. Consolidated Ratio Consolidated Capital Leverage Ratio 9.0% $222.4 Common Equity Tier 1 Ratio 12.9% $222.4 Tier 1 Capital Ratio 12.9% $222.4 Total Capital Ratio 15.2% $261.9 x From a regulatory standpoint, we are well - capitalized with excess capital. x We take a prudent approach to capital management. As of June 30, 2021 ($ in millions) Westfield Bank Ratio Well Capitalized Excess Bank Capital Excess Over Well - Capitalized Leverage Ratio 8.7% 5.0% 3.7% $213.2 $90.6 Common Equity Tier 1 Ratio 12.4% 6.5% 5.9% $213.2 $101.5 Tier 1 Capital Ratio 12.4% 8.0% 4.4% $213.2 $75.7 Total Capital Ratio 13.6% 10.0% 3.6% $233.1 $61.2
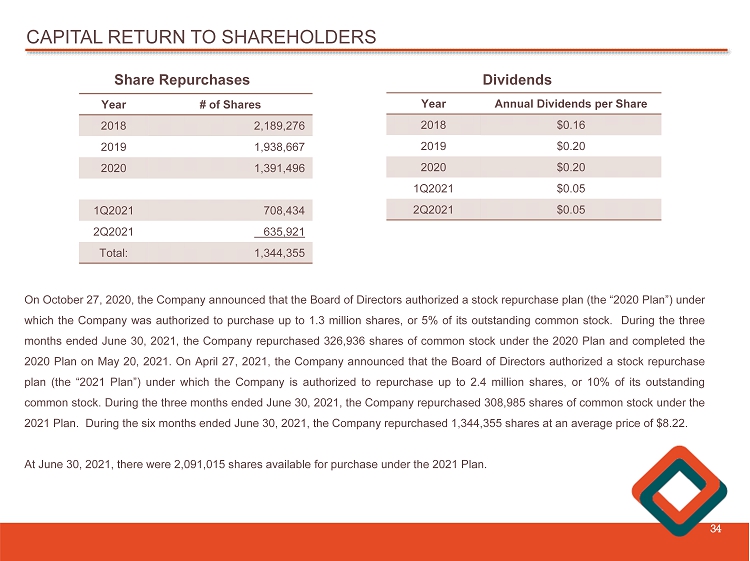
CAPITAL RETURN TO SHAREHOLDERS 34 Year # of Shares 2018 2,189,276 2019 1,938,667 2020 1,391,496 1Q2021 708,434 2Q2021 635,921 Total : 1,344,355 Year Annual Dividends per Share 2018 $0.16 2019 $0.20 2020 $0.20 1Q2021 $0.05 2Q2021 $0.05 Share Repurchases Dividends On October 27 , 2020 , the Company announced that the Board of Directors authorized a stock repurchase plan (the “ 2020 Plan”) under which the Company was authorized to purchase up to 1 . 3 million shares, or 5 % of its outstanding common stock . During the three months ended June 30 , 2021 , the Company repurchased 326 , 936 shares of common stock under the 2020 Plan and completed the 2020 Plan on May 20 , 2021 . On April 27 , 2021 , the Company announced that the Board of Directors authorized a stock repurchase plan (the “ 2021 Plan”) under which the Company is authorized to repurchase up to 2 . 4 million shares, or 10 % of its outstanding common stock . During the three months ended June 30 , 2021 , the Company repurchased 308 , 985 shares of common stock under the 2021 Plan . During the six months ended June 30 , 2021 , the Company repurchased 1 , 344 , 355 shares at an average price of $ 8 . 22 . At June 30 , 2021 , there were 2 , 091 , 015 shares available for purchase under the 2021 Plan .
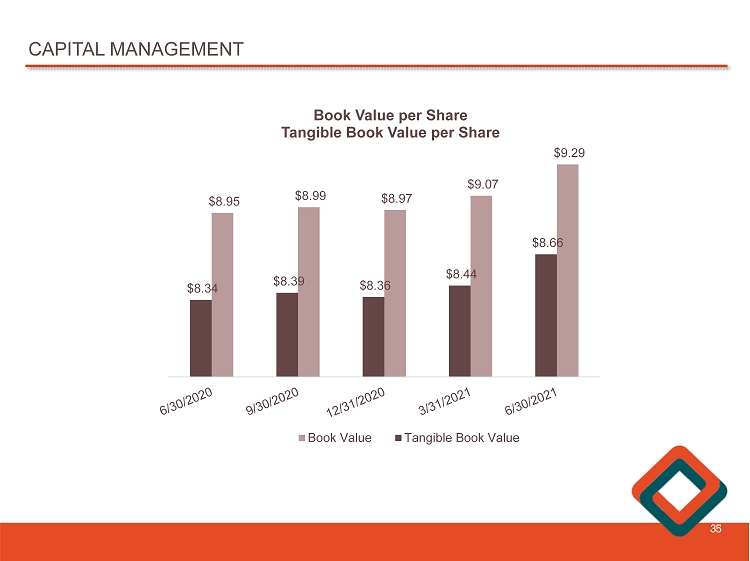
CAPITAL MANAGEMENT 35 $9.29 $9.07 $8.97 $8.99 $8.95 $8.66 $8.44 $8.36 $8.39 $8.34 Book Value per Share Tangible Book Value per Share Book Value Tangible Book Value
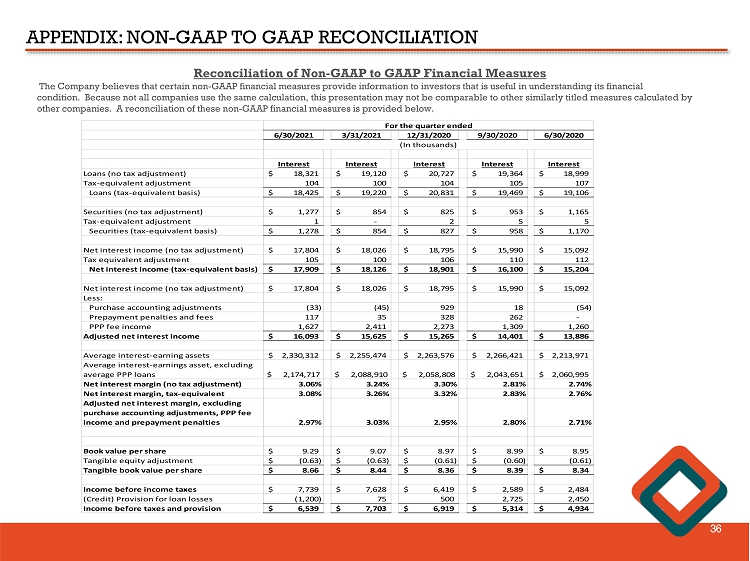
APPENDIX: NON - GAAP TO GAAP RECONCILIATION 36 Reconciliation of Non - GAAP to GAAP Financial Measures The Company believes that certain non - GAAP financial measures provide information to investors that is useful in understanding i ts financial condition. Because not all companies use the same calculation, this presentation may not be comparable to other similarly title d measures calculated by other companies. A reconciliation of these non - GAAP financial measures is provided below. 6/30/2021 3/31/2021 12/31/2020 9/30/2020 6/30/2020 Interest Interest Interest Interest Interest Loans (no tax adjustment) 18,321$ 19,120$ 20,727$ 19,364$ 18,999$ Tax-equivalent adjustment 104 100 104 105 107 Loans (tax-equivalent basis) 18,425$ 19,220$ 20,831$ 19,469$ 19,106$ Securities (no tax adjustment) 1,277$ 854$ 825$ 953$ 1,165$ Tax-equivalent adjustment 1 - 2 5 5 Securities (tax-equivalent basis) 1,278$ 854$ 827$ 958$ 1,170$ Net interest income (no tax adjustment) 17,804$ 18,026$ 18,795$ 15,990$ 15,092$ Tax equivalent adjustment 105 100 106 110 112 Net interest income (tax-equivalent basis) 17,909$ 18,126$ 18,901$ 16,100$ 15,204$ Net interest income (no tax adjustment) 17,804$ 18,026$ 18,795$ 15,990$ 15,092$ Less: Purchase accounting adjustments (33) (45) 929 18 (54) Prepayment penalties and fees 117 35 328 262 - PPP fee income 1,627 2,411 2,273 1,309 1,260 Adjusted net interest income 16,093$ 15,625$ 15,265$ 14,401$ 13,886$ Average interest-earning assets 2,330,312$ 2,255,474$ 2,263,576$ 2,266,421$ 2,213,971$ Average interest-earnings asset, excluding average PPP loans $ 2,174,717 $ 2,088,910 $ 2,058,808 $ 2,043,651 2,060,995$ Net interest margin (no tax adjustment) 3.06% 3.24% 3.30% 2.81% 2.74% Net interest margin, tax-equivalent 3.08% 3.26% 3.32% 2.83% 2.76% Adjusted net interest margin, excluding purchase accounting adjustments, PPP fee income and prepayment penalties 2.97% 3.03% 2.95% 2.80% 2.71% Book value per share 9.29$ 9.07$ 8.97$ 8.99$ 8.95$ Tangible equity adjustment (0.63)$ (0.63)$ (0.61)$ (0.60)$ (0.61) Tangible book value per share 8.66$ 8.44$ 8.36$ 8.39$ 8.34$ Income before income taxes 7,739$ 7,628$ 6,419$ 2,589$ 2,484$ (Credit) Provision for loan losses (1,200) 75 500 2,725 2,450 Income before taxes and provision 6,539$ 7,703$ 6,919$ 5,314$ 4,934$ For the quarter ended (In thousands)
WESTFIELD BANK “WHAT BETTER BANKING’S ALL ABOUT” James C. Hagan , President and Chief Executive Officer Guida R. Sajdak , Executive Vice President and Chief Financial Officer Meghan Hibner , Vice President and Investor Relations Officer 37 141 Elm Street, Westfield, MA