WESTERN NEW ENGLAND BANCORP, INC. 8-K
Exhibit 99.1

1 2022 Annual Shareholders’ Meeting May 11, 2022
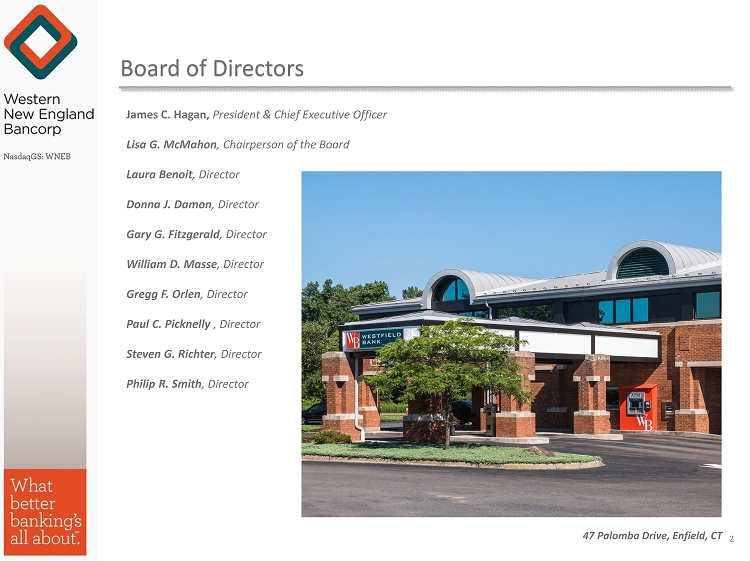
Board of Directors James C . Hagan, President & Chief Executive Officer Lisa G . McMahon , Chairperson of the Board Laura Benoit , Director Donna J . Damon , Director Gary G . Fitzgerald , Director William D . Masse , Director Gregg F . Orlen , Director Paul C . Picknelly , Director Steven G . Richter , Director Philip R . Smith , Director 47 Palomba Drive, Enfield, CT 2
Welcome to the Western New England Bancorp 2022 Annual Shareholders’ Meeting James C. Hagan President Chief Executive Officer 3
4 Board of Directors Western New England Bancorp

Board of Directors 5 Name Term to Expire Position Held Director Since Lisa G. McMahon 2023 Director, Chairperson of the Board 2014 Gary G. Fitzgerald 2022 Director 2016 Paul C. Picknelly 2022 Director 2016 Laura Benoit 2023 Director 2014 Donna J. Damon 2023 Director 2011 Steven G. Richter 2023 Director 2011 Jame s C. Hagan 2024 President, Chief Executive Officer , Director 2009 William D. Masse 2024 Director 2016 Gregg F. Orlen 2024 Director 2016 Philip R. Smith 2024 Director 2009
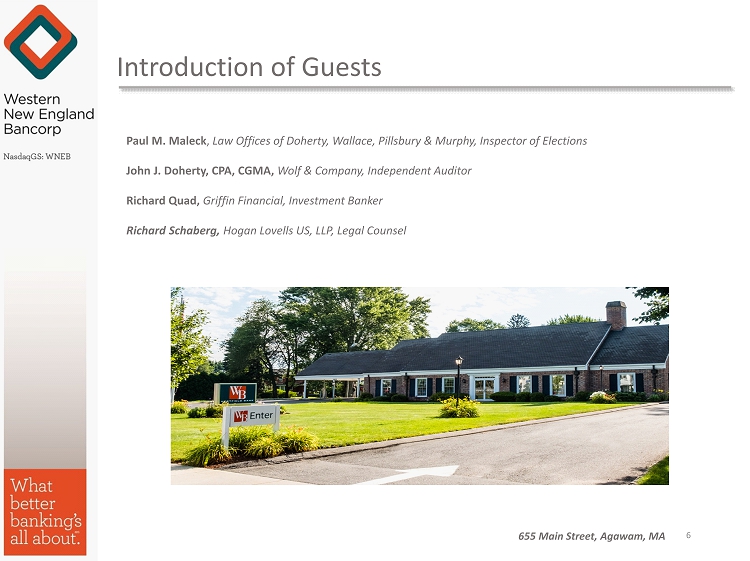
Introduction of Guests Paul M. Maleck , Law Offices of Doherty, Wallace, Pillsbury & Murphy, Inspector of Elections John J. Doherty, CPA, CGMA, Wolf & Company, Independent Auditor Richard Quad, Griffin Financial, Investment Banker Richard Schaberg, Hogan Lovells US, LLP, Legal Counsel 655 Main Street, Agawam, MA 6
Senior Management Team James C . Hagan, President & Chief Executive Officer Guida R . Sajdak, Executive Vice President & Chief Financial Officer Allen J . Miles, III, Executive Vice President & Chief Lending Officer Kevin C . O’Connor, Executive Vice President & Chief Banking Officer John E . Bonini , Senior Vice President & General Counsel Louis O . Gorman, Senior Vice President of Credit Administration & Chief Credit Officer Cidalia Inacio , Senior Vice President of Retail Banking & Wealth Management Darlene Libiszewski , Senior Vice President & Chief Information Officer Christine Phillips, Senior Vice President, Human Resources Director Leo R . Sagan, Jr . , Senior Vice President & Chief Risk Officer 7
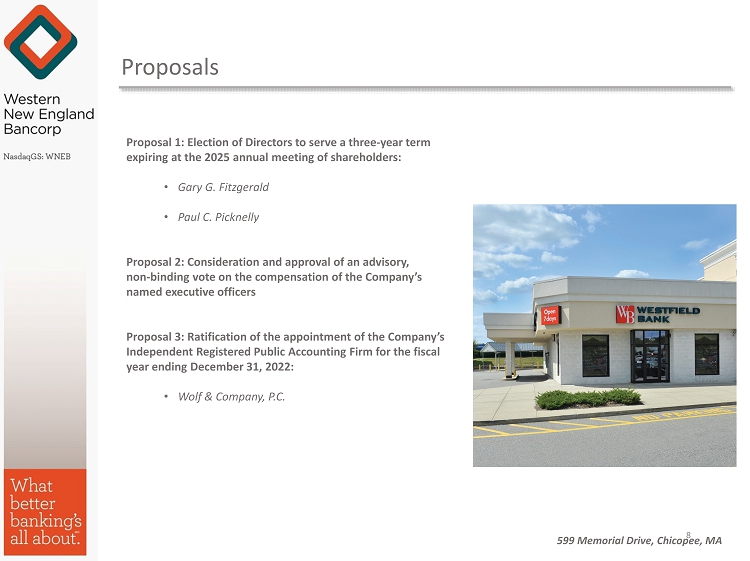
Proposals Proposal 1: Election of Directors to serve a three - year term expiring at the 2025 annual meeting of shareholders: • Gary G. Fitzgerald • Paul C. Picknelly Proposal 2: Consideration and approval of an advisory , non - binding vote on the compensation of the Company’s named executive officers Proposal 3: Ratification of the appointment of the Company’s Independent Registered Public Accounting Firm for the fiscal year ending December 31, 2022: • Wolf & Company, P.C. 8 599 Memorial Drive, Chicopee, MA

Voting Results Paul M. Maleck Inspector of Elections 300 Southampton Road, Westfield, MA 9
Financial Results for Fiscal Year 2021 and the First Quarter of 2022 Guida R. Sajdak Executive Vice President Chief Financial Officer 10
We may, from time to time, make written or oral “forward - looking statements” within the meaning of the Private Securities Litigation Reform Act of 1995 , including statements contained in our filings with the Securities and Exchange Commission (the “SEC”), our reports to shareholders and in other communications by us . This presentation contains “forward - looking statements” with respect to the Company’s financial condition, liquidity, results of operations, future performance, business, measures being taken in response to the coronavirus disease 2019 (“ COVID - 19 ”) pandemic and the impact of COVID - 19 on the Company’s business . Forward - looking statements may be identified by the use of such words as “believe,” “expect,” “anticipate,” “should,” “planned,” “estimated,” and “potential . ” Examples of forward - looking statements include, but are not limited to, estimates with respect to our financial condition, results of operations and business that are subject to various factors which could cause actual results to differ materially from these estimates . These factors include, but are not limited to : the duration and scope of the COVID - 19 pandemic and the local, national and global impact of COVID - 19 ; actions governments, businesses and individuals take in response to the COVID - 19 pandemic ; the speed and effectiveness of any COVID - 19 vaccines and treatment developments and their deployment, including public adoption rates of any COVID - 19 vaccines ; the emergence of new COVID - 19 variants, such as the Omicron variant, and the response thereto ; the pace of recovery when the COVID - 19 pandemic subsides ; changes in the interest rate environment that reduce margins ; the effect on our operations of governmental legislation and regulation, including changes in accounting regulation or standards, the nature and timing of the adoption and effectiveness of new requirements under the Dodd - Frank Act Wall Street Reform and Consumer Protection Act of 2010 , Basel guidelines, capital requirements and other applicable laws and regulations ; the highly competitive industry and market area in which we operate ; general economic conditions, either nationally or regionally, resulting in, among other things, a deterioration in credit quality ; changes in business conditions and inflation ; changes in credit market conditions ; the inability to realize expected cost savings or achieve other anticipated benefits in connection with business combinations and other acquisitions ; changes in the securities markets which affect investment management revenues ; increases in Federal Deposit Insurance Corporation deposit insurance premiums and assessments ; changes in technology used in the banking business ; the soundness of other financial services institutions which may adversely affect our credit risk ; certain of our intangible assets may become impaired in the future ; our controls and procedures may fail or be circumvented ; new lines of business or new products and services, which may subject us to additional risks ; changes in key management personnel which may adversely impact our operations ; severe weather, natural disasters, acts of war or terrorism and other external events which could significantly impact our business ; and other factors detailed from time to time in our SEC filings . Although we believe that the expectations reflected in such forward - looking statements are reasonable, actual results may differ materially from the results discussed in these forward - looking statements. You are cautioned not to place undue reliance on these forward - looking statement s, which speak only as of the date hereof. We do not undertake any obligation to republish revised forward - looking statements to reflect events or circumstan ces after the date hereof or to reflect the occurrence of unanticipated events, except to the extent required by law. Forward - Looking Statements 11
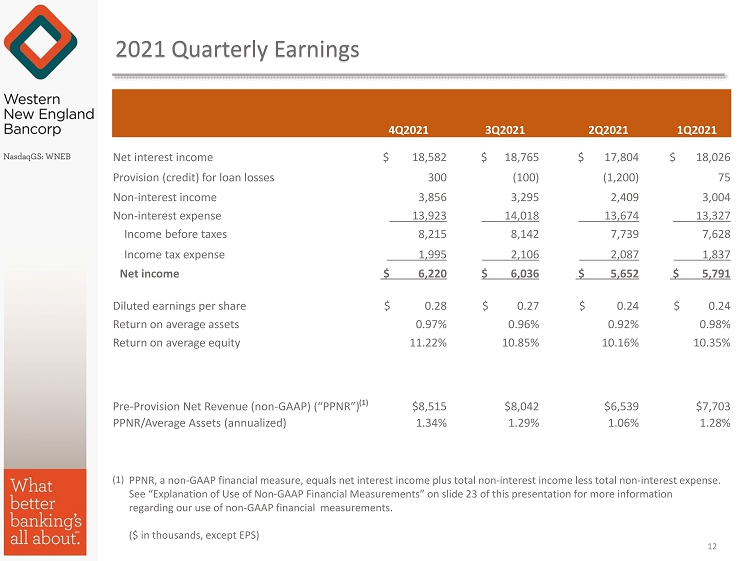
2021 Quarterly Earnings 12 4Q2021 3Q2021 2Q2021 1Q2021 Net interest income $ 18,582 $ 18,765 $ 17,804 $ 18,026 Provision (credit) for loan losses 300 (100) (1,200) 75 Non - interest income 3,856 3,295 2,409 3,004 Non - interest expense 13,923 14,018 13,674 13,327 Income before taxes 8,215 8,142 7,739 7,628 Income tax expense 1,995 2,106 2,087 1,837 Net income $ 6,220 $ 6,036 $ 5,652 $ 5,791 Diluted earnings per share $ 0.28 $ 0.27 $ 0.24 $ 0.24 Return on average assets 0.97% 0.96% 0.92% 0.98% Return on average equity 11.22% 10.85% 10.16% 10.35% Pre - Provision Net Revenue (non - GAAP) (“PPNR”) $8,515 $8,042 $6,539 $7,703 PPNR/Average Assets (annualized) 1.34% 1.29% 1.06% 1.28% (1) (1) PPNR, a non - GAAP financial measure, equals net interest income plus total non - interest income less total non - interest expense. See “Explanation of Use of Non - GAAP Financial Measurements” on slide 23 of this presentation for more information regarding our use of non - GAAP financial measurements. ($ in thousands, except EPS)
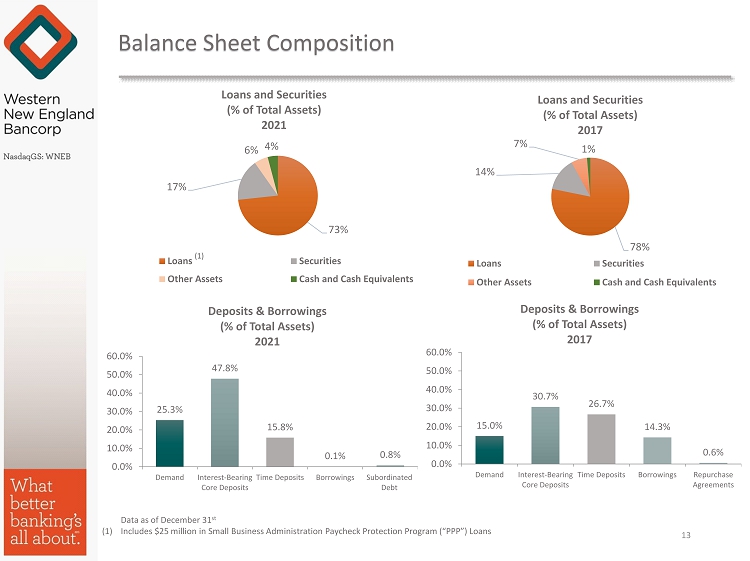
Balance Sheet Composition 78% 14% 7% 1% Loans and Securities (% of Total Assets) 2017 Loans Securities Other Assets Cash and Cash Equivalents Data as of December 31 st (1) Includes $25 million in Small Business Administration Paycheck Protection Program (“PPP”) Loans 73% 17% 6% 4% Loans and Securities (% of Total Assets) 2021 Loans Securities Other Assets Cash and Cash Equivalents 25.3% 47.8% 15.8% 0.1% 0.8% 0.0% 10.0% 20.0% 30.0% 40.0% 50.0% 60.0% Demand Interest-Bearing Core Deposits Time Deposits Borrowings Subordinated Debt Deposits & Borrowings (% of Total Assets) 2021 15.0% 30.7% 26.7% 14.3% 0.6% 0.0% 10.0% 20.0% 30.0% 40.0% 50.0% 60.0% Demand Interest-Bearing Core Deposits Time Deposits Borrowings Repurchase Agreements Deposits & Borrowings (% of Total Assets) 2017 13 (1)
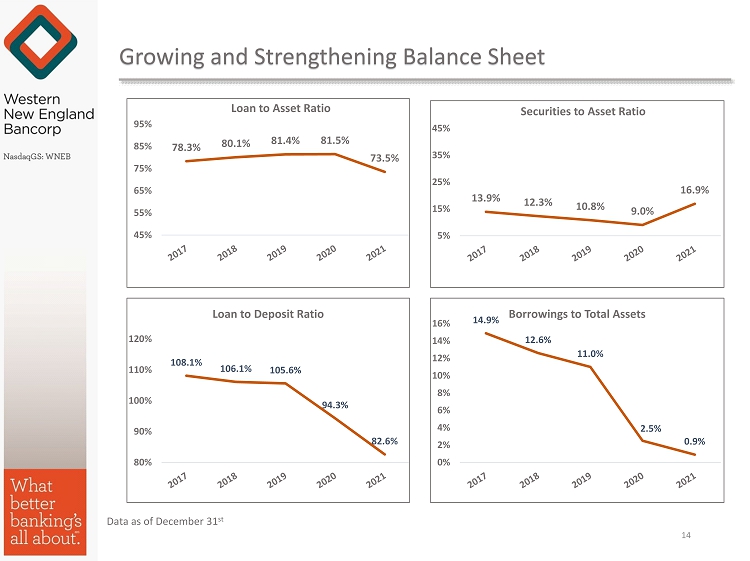
Growing and Strengthening Balance Sheet 78.3% 80.1% 81.4% 81.5% 73.5% 45% 55% 65% 75% 85% 95% Loan to Asset Ratio 108.1% 106.1% 105.6% 94.3% 82.6% 80% 90% 100% 110% 120% Loan to Deposit Ratio 13.9% 12.3% 10.8% 9.0% 16.9% 5% 15% 25% 35% 45% Securities to Asset Ratio 14.9% 12.6% 11.0% 2.5% 0.9% 0% 2% 4% 6% 8% 10% 12% 14% 16% Borrowings to Total Assets Data as of December 31 st 14

Asset Quality Indicators Continue to be Strong Data as of December 31 st (1) Excludes PPP loans 15 0.79% 1.20% 1.08% 0.00% 0.50% 1.00% 1.50% Allowance for Loan Losses to Total Loans 2019 2020 2021 142.72% 269.83% 398.60% -100.00% 100.00% 300.00% 500.00% Allowance for Loan Losses to Nonperforming Loans 2019 2020 2021 (1) 0.56% 0.45% 0.45% 0.36% 0.27% 0.20% 0.00% 0.10% 0.20% 0.30% 0.40% 0.50% 0.60% Nonperforming Loans/Total Loans Nonperforming Assets/Total Assets Nonperforming Loans to Total Loans Nonperforming Assets to Total Assets 2019 2020 2021 (1) (1) (1) (1) (1)
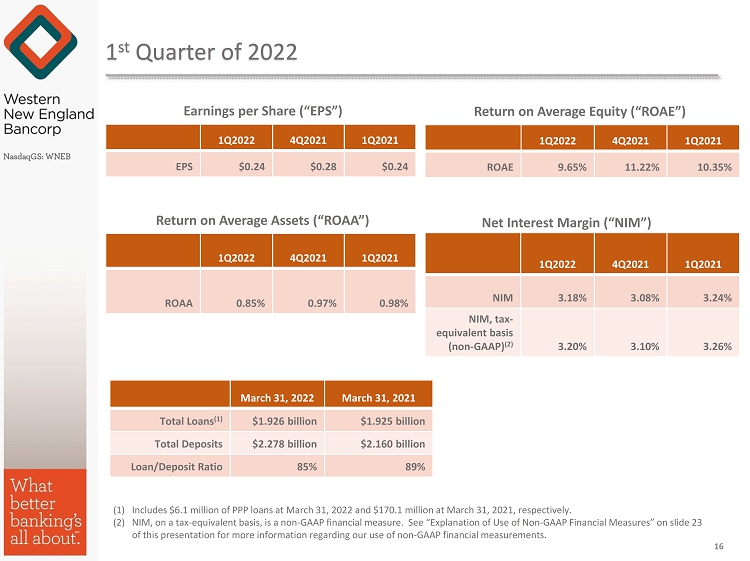
1 st Quarter of 2022 1Q2022 4Q2021 1Q2021 EPS $0.24 $0.28 $0.24 Earnings per Share (“EPS”) 1Q2022 4Q2021 1Q2021 ROAA 0.85% 0.97% 0.98% Return on Average Assets (“ROAA”) Return on Average Equity (“ROAE”) 1Q2022 4Q2021 1Q2021 ROAE 9.65% 11.22% 10.35% 1Q2022 4Q2021 1Q2021 NIM 3.18% 3.08% 3.24% NIM, tax - equivalent basis (non - GAAP) (2) 3.20% 3.10% 3.26% Net Interest Margin (“NIM”) March 31, 2022 March 31, 2021 Total Loans (1) $1.926 billion $1.925 billion Total Deposits $2.278 billion $2.160 billion Loan/Deposit Ratio 85% 89% 16 (1) Includes $6.1 million of PPP loans at March 31, 2022 and $170.1 million at March 31, 2021, respectively. (2) NIM, on a tax - equivalent basis, is a non - GAAP financial measure. See “Explanation of Use of Non - GAAP Financial Measures” on sli de 23 of this presentation for more information regarding our use of non - GAAP financial measurements.
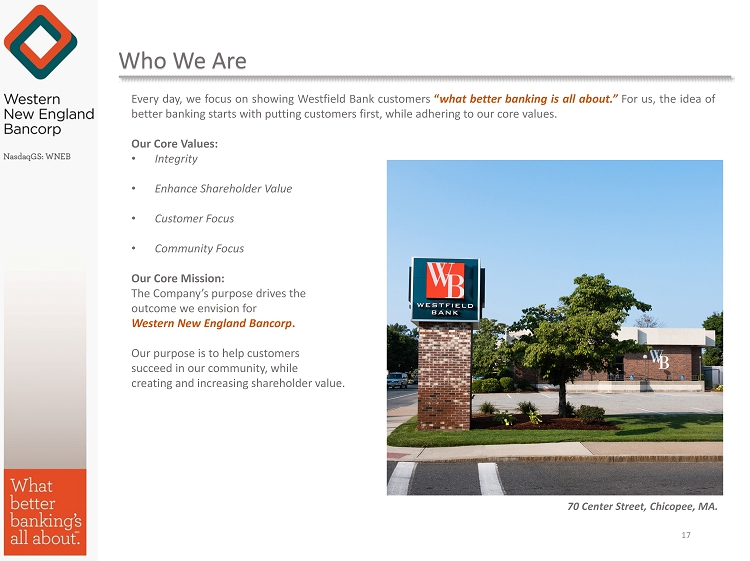
Who We Are Every day, we focus on showing Westfield Bank customers “ what better banking is all about . ” For us, the idea of better banking starts with putting customers first, while adhering to our core values . Our Core Values : • Integrity • Enhance Shareholder Value • Customer Focus • Community Focus Our Core Mission : The Company’s purpose drives the outcome we envision for Western New England Bancorp . Our purpose is to help customers succeed in our community, while creating and increasing shareholder value . 17 70 Center Street, Chicopee, MA.
Connecticut Strategy 18
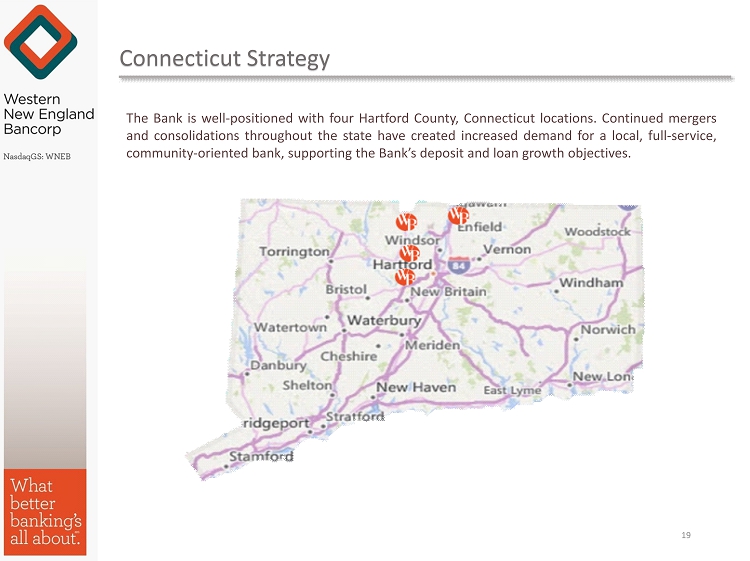
Connecticut Strategy 19 The Bank is well - positioned with four Hartford County, Connecticut locations . Continued mergers and consolidations throughout the state have created increased demand for a local, full - service, community - oriented bank, supporting the Bank’s deposit and loan growth objectives .

Connecticut Strategy 20 Congratulations to the West Hartford Financial Services Center team on being recognized as “Best Bank/Financial Institution” in the annual Best of West Hartford , marking two consecutive years that the Bank has earned the top spot.

21 “In 2021 , the Company saw significant loan production, increased PPP fees, lower cost of funds and asset quality metrics that achieved historical lows . These results were highlighted by increases in our low - cost core deposit categories, with core deposits as a whole increasing $ 402 million, or 27 . 7 % , as well as increases in our commercial and residential lending production . As we emerge from the pandemic, we are able to focus on more traditional and profitable banking activities, which assisted the Company in achieving record profitability in 2021 . During the first quarter of 2022 , we have seen the strongest growth from our commercial real estate lending portfolio . Additionally, during the first quarter, commercial real estate loans increased $ 59 . 5 million, or 6 . 1 % , as we continued to add new customer relationships throughout New England and in key strategic lending areas . We believe the balance sheet management steps we took in 2021 have directly resulted in an increase in net interest income and the net interest margin, which increased from 3 . 10 % in the fourth quarter of 2021 to 3 . 20 % in the first quarter of 2022 . We are well positioned for the anticipated increase in interest rates with a strong low - cost core deposit base . Our asset quality continues to remain extremely solid with historical lows for nonperforming loans to total loans of 0 . 21 % and our capital position continues to remain strong . We would like to thank the West Hartford community for naming Westfield Bank the “ 2021 Best of West Hartford – Best Bank/Financial Institution” for the second year in a row . I would also like to thank our customers, employees, Board of Directors and shareholders for their support as we continue our efforts to grow the Company in new markets now and in the future . ” President’s Message
22 Appendix
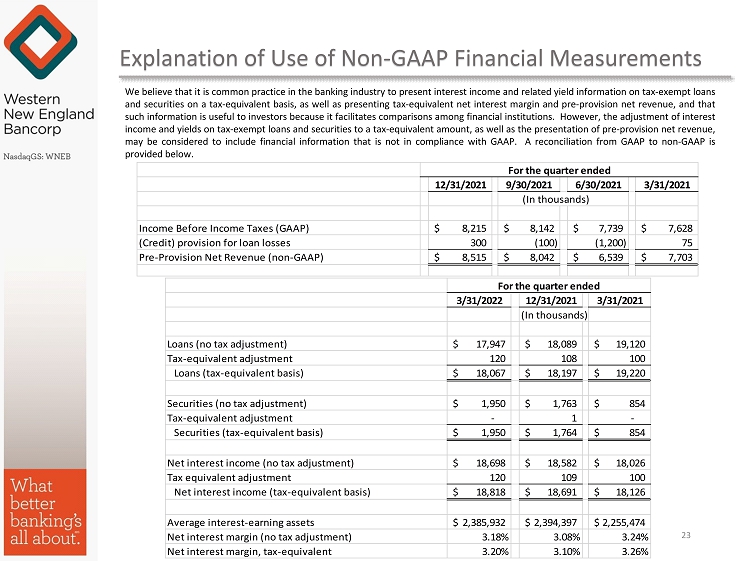
Explanation of Use of Non - GAAP Financial Measurements 23 We believe that it is common practice in the banking industry to present interest income and related yield information on tax - exempt loans and securities on a tax - equivalent basis, as well as presenting tax - equivalent net interest margin and pre - provision net revenue, and that such information is useful to investors because it facilitates comparisons among financial institutions . However, the adjustment of interest income and yields on tax - exempt loans and securities to a tax - equivalent amount, as well as the presentation of pre - provision net revenue, may be considered to include financial information that is not in compliance with GAAP . A reconciliation from GAAP to non - GAAP is provided below . 12/31/2021 9/30/2021 6/30/2021 3/31/2021 (In thousands) Income Before Income Taxes (GAAP) 8,215$ 8,142$ 7,739$ 7,628$ (Credit) provision for loan losses 300 (100) (1,200) 75 Pre-Provision Net Revenue (non-GAAP) 8,515$ 8,042$ 6,539$ 7,703$ For the quarter ended 3/31/2022 12/31/2021 3/31/2021 (In thousands) Loans (no tax adjustment) 17,947$ 18,089$ 19,120$ Tax-equivalent adjustment 120 108 100 Loans (tax-equivalent basis) 18,067$ 18,197$ 19,220$ Securities (no tax adjustment) 1,950$ 1,763$ 854$ Tax-equivalent adjustment - 1 - Securities (tax-equivalent basis) 1,950$ 1,764$ 854$ Net interest income (no tax adjustment) 18,698$ 18,582$ 18,026$ Tax equivalent adjustment 120 109 100 Net interest income (tax-equivalent basis) 18,818$ 18,691$ 18,126$ Average interest-earning assets 2,385,932$ 2,394,397$ 2,255,474$ Net interest margin (no tax adjustment) 3.18% 3.08% 3.24% Net interest margin, tax-equivalent 3.20% 3.10% 3.26% For the quarter ended
Westfield Bank “What better banking’s all about” Thank you! James C. Hagan , President and Chief Executive Officer Guida R. Sajdak , Executive Vice President and Chief Financial Officer Meghan Hibner , Vice President and Investor Relations Officer 24 141 Elm Street, Westfield, MA