Western New England Bancorp, Inc. 8-K
Exhibit 99.2

Local banking is better than ever. INVESTOR PRESENTATION 4TH QUARTER 2024

FORWARD - LOOKING STATEMENTS 2 We may, from time to time, make written or oral “forward - looking statements” within the meaning of the Private Securities Litigation Reform Act of 1995 , including statements contained in our filings with the Securities and Exchange Commission (the “SEC”), our reports to shareholders and in other communications by us . This Investor Presentation contains “forward - looking statements” with respect to the Company’s financial condition, liquidity , results of operations, future performance, and business . Forward - looking statements may be identified by the use of such words as “believe,” “expect,” “anticipate ,” “ should,” “planned,” “estimated,” and “potential . ” Examples of forward - looking statements include, but are not limited to, estimates with respect to our financial condition, results of operations and business that are subject to various factors which could cause actual results to differ materially from these estimates . These factors include, but are not limited to : • unpredictable changes in general economic or political conditions , financial markets, fiscal, monetary and regulatory policies, including actual or potential stress in the banking industry ; • the duration and scope of potential pandemics, including the emergence of new variants and the response thereto ; • unstable political and economic conditions which could materially impact credit quality trends and the ability to generate loans and gather deposits ; • inflation and governmental responses to inflation, including recent sustained increases and potential future increases in interest rates that reduce margins ; • the effect on our operations of governmental legislation and regulation, including changes in accounting regulation or standards, the nature and timing of the adoption and effectiveness of new requirements under the Dodd - Frank Wall Street Reform and Consumer Protection Act of 2010 , Basel guidelines, capital requirements and other applicable laws and regulations ; • significant changes in accounting, tax or regulatory practices or requirements ; • new legal obligations or liabilities or unfavorable resolutions of litigation ; • disruptive technologies in payment systems and other services traditionally provided by banks ; • the highly competitive industry and market area in which we operate ;
FORWARD - LOOKING STATEMENTS 3 • operational risks or risk management failures by us or critical third parties, including without limitation with respect to data processing, information systems, cybersecurity, technological changes, vendor issues, business interruption, and fraud risks ; • f ailure or circumvention of our internal controls or procedures ; • c hanges in the securities markets which affect investment management revenues ; • i ncreases in Federal Deposit Insurance Corporation deposit insurance premiums and assessments ; • the soundness of other financial services institutions which may adversely affect our credit risk; • certain of our intangible assets may become impaired in the future; • new lines of business or new products and services, which may subject us to additional risks; • changes in key management personnel which may adversely impact our operations; • severe weather, natural disasters, acts of war or terrorism and other external events which could significantly impact our business; and • other risk factors detailed from time to time in our SEC filings. Although we believe that the expectations reflected in such forward - looking statements are reasonable, actual results may differ materially from the results discussed in these forward - looking statements. You are cautioned not to place undue reliance on the se forward - looking statements, which speak only as of the date hereof. We do not undertake any obligation to republish revised for ward - looking statements to reflect events or circumstances after the date hereof or to reflect the occurrence of unanticipated events , except to the extent required by law.
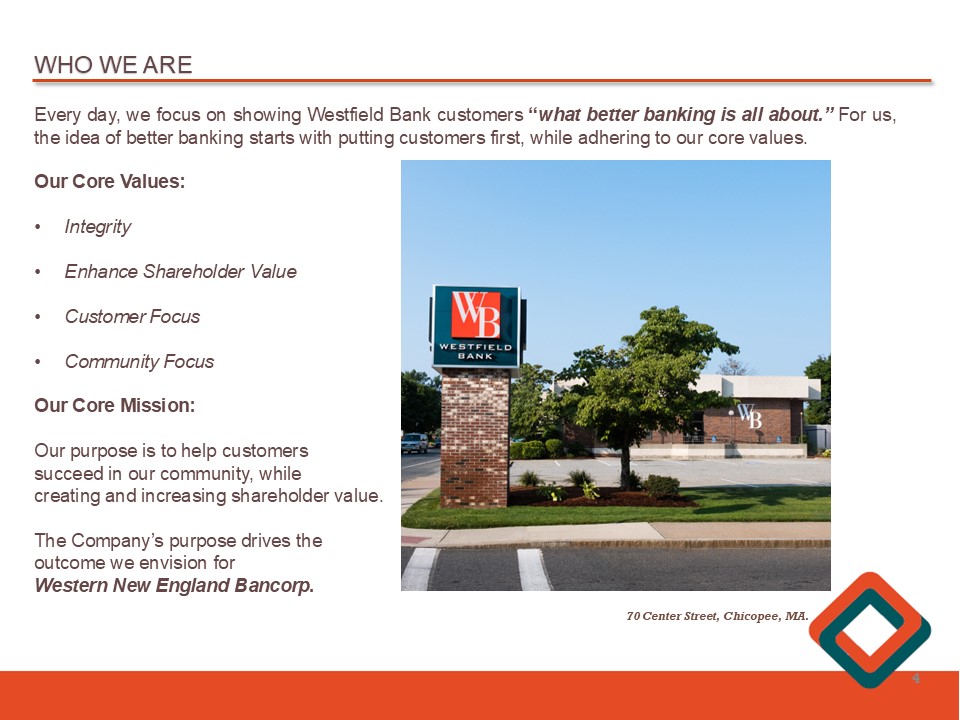
WHO WE ARE Every day, we focus on showing Westfield Bank customers “ what better banking is all about . ” For us, the idea of better banking starts with putting customers first, while adhering to our core values . Our Core Values : • Integrity • Enhance Shareholder Value • Customer Focus • Community Focus Our Core Mission : Our purpose is to help customers succeed in our community, while creating and increasing shareholder value . The Company’s purpose drives the outcome we envision for Western New England Bancorp . 4 70 Center Street, Chicopee, MA.

SENIOR MANAGEMENT TEAM James C . Hagan, President & Chief Executive Officer Guida R . Sajdak, Executive Vice President, Chief Financial Officer & Treasurer Allen J . Miles III, Executive Vice President & Chief Lending Officer Kevin C . O’Connor, Executive Vice President & Chief Banking Officer Daniel A . Marini , Senior Vice President, Retail Banking & Marketing Leo R . Sagan, Jr . , Senior Vice President & Chief Risk Officer Filipe Goncalves, Senior Vice President & Chief Credit Officer Darlene Libiszewski , Senior Vice President & Chief Information Officer John E . Bonini , Senior Vice President & General Counsel Christine Phillips , Senior Vice President, Human Resources Director 5
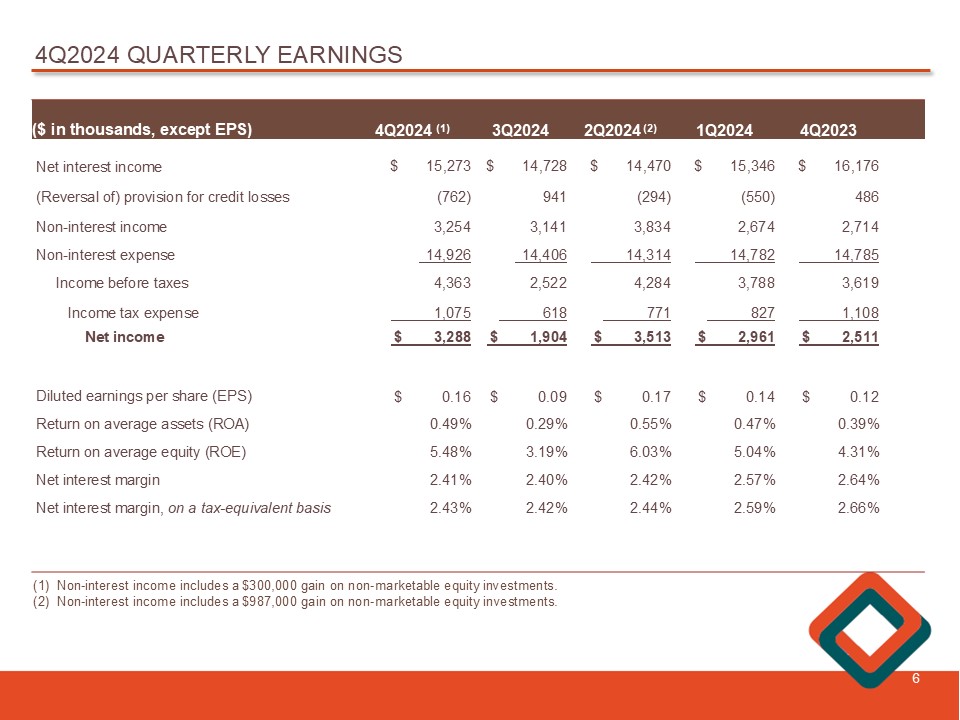
4 Q2024 QUARTERLY EARNINGS 6 4Q2023 1Q2024 2Q2024 (2) 3Q2024 4Q2024 (1) ($ in thousands , except EPS ) $ 16,176 $ 15,346 $ 14,470 $ 14,728 $ 15,273 Net interest income 486 (550) (294) 941 (762) (Reversal of) provision for credit losses 2,714 2,674 3,834 3,141 3,254 Non - interest income 14,785 14,782 14,314 14,406 14,926 Non - interest expense 3,619 3,788 4,284 2,522 4,363 Income before taxes 1,108 827 771 618 1,075 Income tax expense $ 2,511 $ 2,961 $ 3,513 $ 1,904 $ 3,288 Net income $ 0.12 $ 0.14 $ 0.17 $ 0.09 $ 0.16 Diluted earnings per share (EPS) 0.39% 0.47% 0.55% 0.29% 0.49% Return on average assets (ROA) 4.31% 5.04% 6.03% 3.19% 5.48% Return on average equity (ROE) 2.64% 2.57% 2.42% 2.40% 2.41% Net interest margin 2.66% 2.59% 2.44% 2.42% 2.43% Net interest margin, on a tax - equivalent basis (1) Non - interest income includes a $300,000 gain on non - marketable equity investments. (2) Non - interest income includes a $987,000 gain on non - marketable equity investments.

NET INTEREST INCOME AND NET INTEREST MARGIN 7 $16.2 $15.3 $14.5 $14.7 $15.3 2.64% 2.57% 2.42% 2.40% 2.41% 2.20% 2.40% 2.60% 2.80% 4Q2023 1Q2024 2Q2024 3Q2024 4Q2024 $0.0 $5.0 $10.0 $15.0 $20.0 $25.0 Net interest income ($) Net interest margin (%) On a sequential quarter basis, net interest income, our primary driver of revenues, increased $ 545 , 000 , or 3 . 7 % , to $ 15 . 3 million for the three months ended December 31 , 2024 , from $ 14 . 7 million for the three months ended September 30 , 2024 . The increase in net interest income was primarily due to an increase in interest income of $ 746 , 000 , or 2 . 7 % , partially offset by an increase in interest expense of $ 201 , 000 , or 1 . 5 % . The net interest margin was 2 . 41 % for the three months ended December 31 , 2024 compared to 2 . 40 % for the three months ended September 30 , 2024 . During the three months ended December 31 , 2024 and during the three months ended September 30 , 2024 , the Company had a fair value hedge which contributed to an increase in the net interest margin of one basis point for the three months ended December 31 , 2024 , compared to an increase of seven basis points during the three months ended September 30 , 2024 . Excluding the interest income attributed to the fair value hedge, the net interest margin increased seven basis points from 2 . 33 % for the three months ended September 30 , 2024 to 2 . 40 % for the three months ended December 31 , 2024 , respectively . The fair value hedge matured in October of 2024 . ($ in millions)
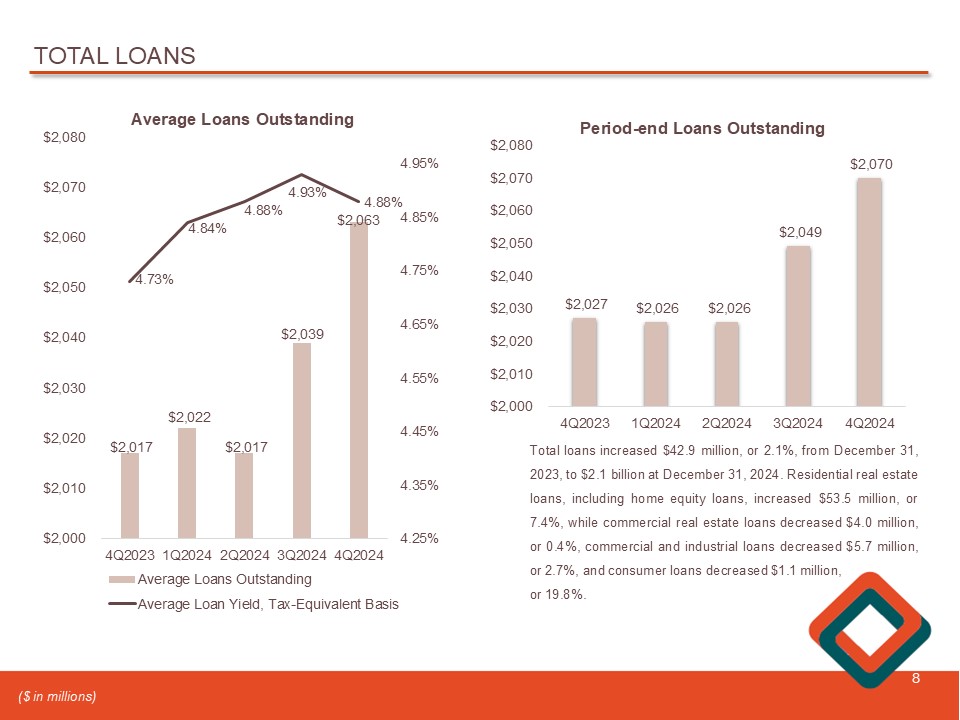
TOTAL LOANS 8 $2,017 $2,022 $2,017 $2,039 $2,063 4.73% 4.84% 4.88% 4.93% 4.88% 4.25% 4.35% 4.45% 4.55% 4.65% 4.75% 4.85% 4.95% 4Q2023 1Q2024 2Q2024 3Q2024 4Q2024 $2,000 $2,010 $2,020 $2,030 $2,040 $2,050 $2,060 $2,070 $2,080 Average Loans Outstanding Average Loans Outstanding Average Loan Yield, Tax-Equivalent Basis $2,027 $2,026 $2,026 $2,049 $2,070 4Q2023 1Q2024 2Q2024 3Q2024 4Q2024 $2,000 $2,010 $2,020 $2,030 $2,040 $2,050 $2,060 $2,070 $2,080 Period - end Loans Outstanding Total loans increased $ 42 . 9 million, or 2 . 1 % , from December 31 , 2023 , to $ 2 . 1 billion at December 31 , 2024 . Residential real estate loans, including home equity loans , increased $ 53 . 5 million, or 7 . 4 % , while commercial real estate loans decreased $ 4 . 0 million, or 0 . 4 % , commercial and industrial loans decreased $ 5 . 7 million, or 2 . 7 % , and consumer loans decreased $ 1 . 1 million, or 19 . 8 % . ($ in millions)
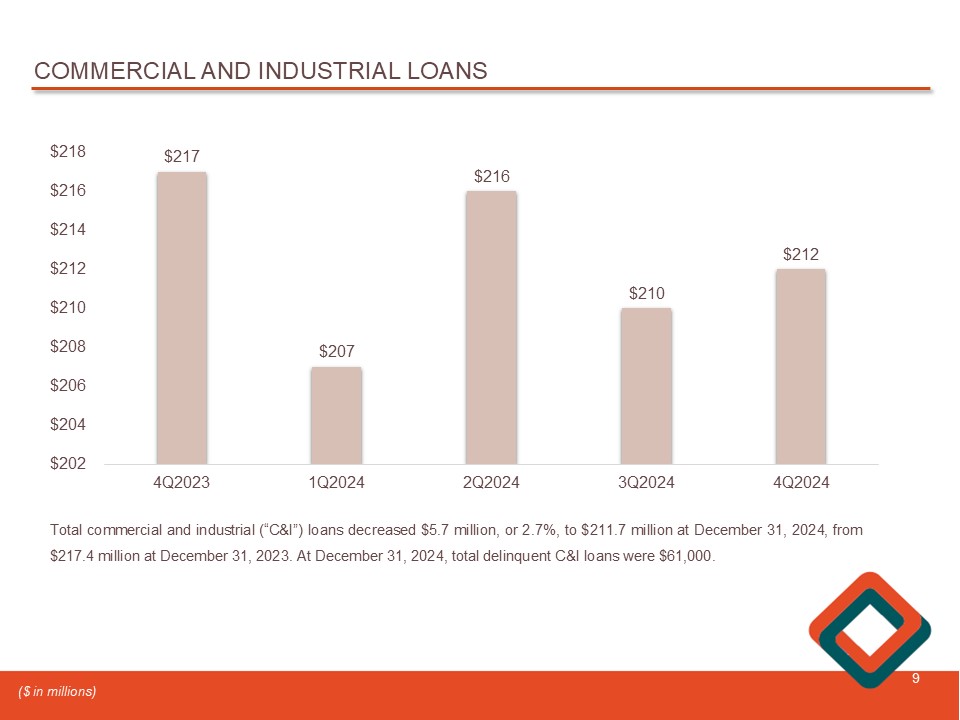
COMMERCIAL AND INDUSTRIAL LOANS 9 $217 $207 $216 $210 $212 4Q2023 1Q2024 2Q2024 3Q2024 4Q2024 $202 $204 $206 $208 $210 $212 $214 $216 $218 Total commercial and industrial (“C&I”) loans decreased $ 5 . 7 million, or 2 . 7 % , to $ 211 . 7 million at December 31 , 2024 , from $ 217 . 4 million at December 31 , 2023 . At December 31 , 2024 , total delinquent C&I loans were $ 61 , 000 . ($ in millions)
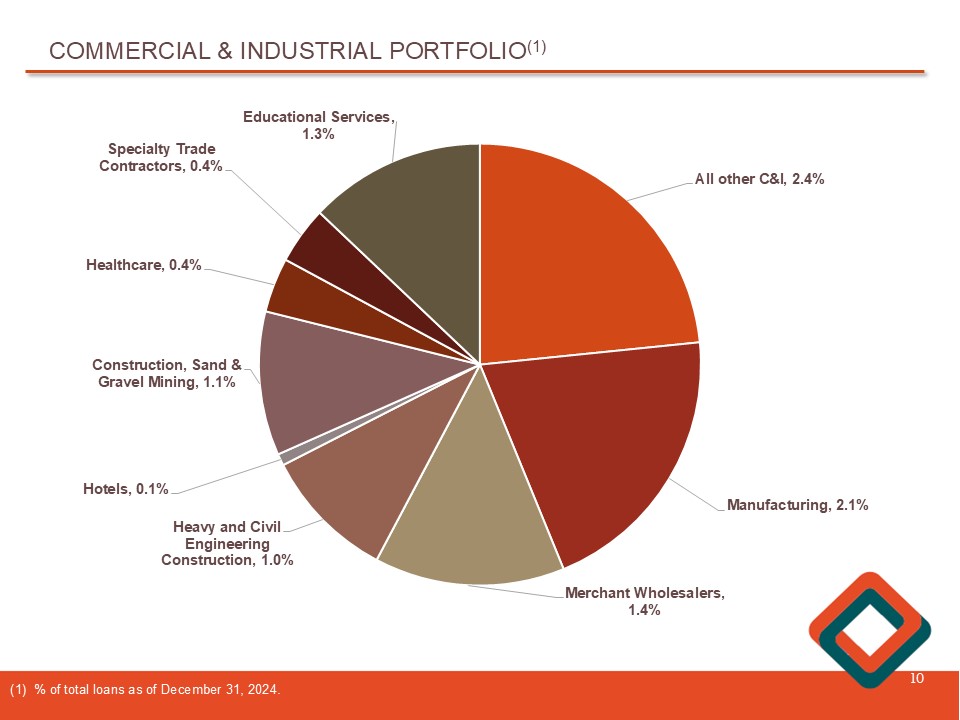
COMMERCIAL & INDUSTRIAL PORTFOLIO (1) 10 (1) % of total loans as of December 31, 2024. All other C&I , 2.4% Manufacturing , 2.1% Merchant Wholesalers , 1.4% Heavy and Civil Engineering Construction , 1.0% Hotels , 0.1% Construction, Sand & Gravel Mining , 1.1% Healthcare , 0.4% Specialty Trade Contractors , 0.4% Educational Services , 1.3%
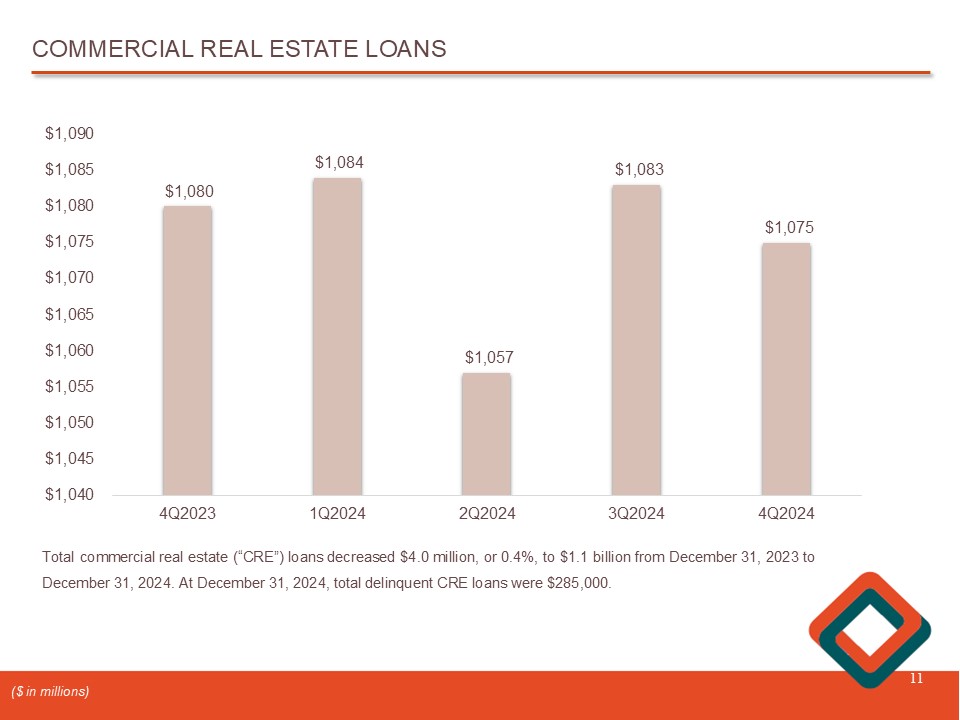
COMMERCIAL REAL ESTATE LOANS 11 $1,080 $1,084 $1,057 $1,083 $1,075 4Q2023 1Q2024 2Q2024 3Q2024 4Q2024 $1,040 $1,045 $1,050 $1,055 $1,060 $1,065 $1,070 $1,075 $1,080 $1,085 $1,090 Total commercial real estate (“CRE”) loans decreased $ 4 . 0 million, or 0 . 4 % , to $ 1 . 1 billion from December 31 , 2023 to December 31 , 2024 . At December 31 , 2024 , total delinquent CRE loans were $ 285 , 000 . ($ in millions)

COMMERCIAL REAL ESTATE LOANS (CRE) (1) 12 ($ in thousands) (1) As of December 31, 2024. (2) The total RBC ratio is based on Westfield Bank’s capital and due to loan classifications, the percentage of total RBC ma y d iffer from the Call Report. At December 31 , 2024 , the commercial real estate portfolio totaled $ 1 . 1 billion, and represented 52 . 0 % of total gross loans . Of the $ 1 . 1 billion, $ 880 . 8 million, or 81 . 9 % , were categorized as non - owner occupied commercial real estate and $ 194 . 9 million , or 18 . 1 % , were categorized as owner - occupied commercial real estate . % of Total Risk - Based Bank Capital (RBC) (2) % of Total Loans % of CRE Portfolio Total Owner Occupied Non - Owner Occupied Property Type 73.9% 9.7% 18.6% $ 200,115 $ 23,013 $ 177,102 Office 66.4% 8.7% 16.7% 179,874 - 179,874 Apartment 62.1% 8.1% 15.6% 168,281 51,618 116,663 Industrial 43.2% 5.7% 10.9% 117,041 7,105 109,936 Retail 25.0% 3.3% 6.3% 67,702 30,471 37,231 Other 28.7% 3.8% 7.2% 77,628 6,402 71,226 Mixed Use 15.9% 2.1% 4.0% 43,133 - 43,133 Hotel/Hospitality 14.5% 1.9% 3.6% 39,259 36,554 2,705 Automotive Sales 13.9% 1.8% 3.5% 37,754 6,119 31,635 Adult Care/Assisted Living 12.6% 1.6% 3.2% 34,094 329 33,765 Self Storage 8.1% 1.1% 2.0% 22,047 - 22,047 Student Housing 11.4% 1.5% 2.9% 30,987 10,045 20,942 Warehouse 11.3% 1.5% 2.9% 30,711 7,518 23,193 Shopping Center 10.0% 1.3% 2.5% 27,106 15,730 11,376 School/Higher Education 397.1% 52.0% 100.0% $ 1,075,732 $ 194,904 $ 880,828 Total commercial real estate loans 397.1% 71.9% 325.2% % of Total Bank Risk - Based Capital 18.1% 81.9% % of Total CRE Loans
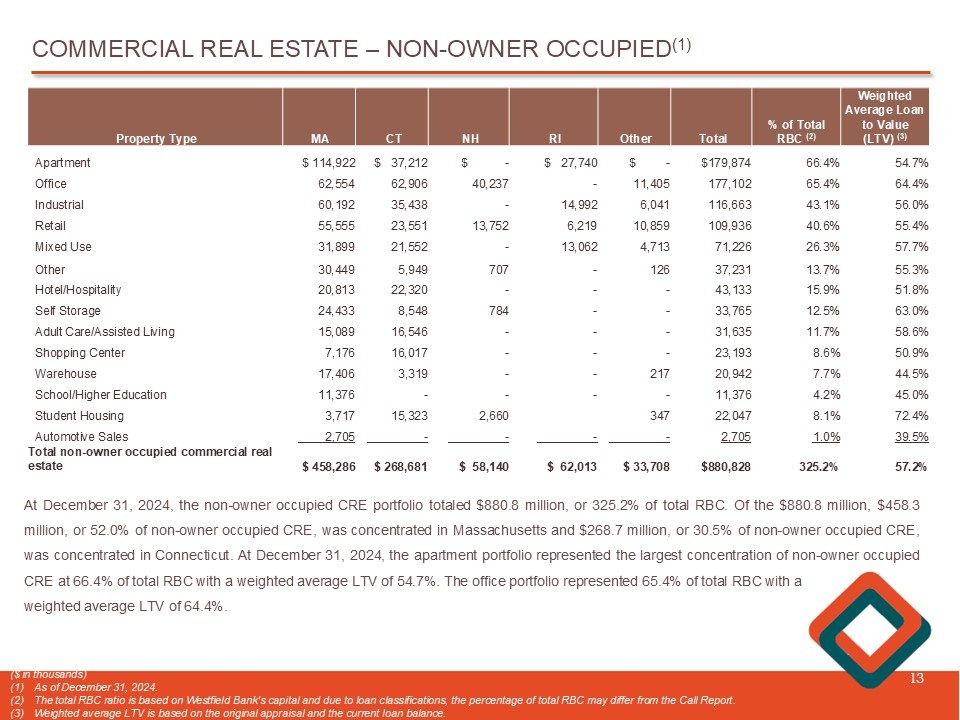
COMMERCIAL REAL ESTATE – NON - OWNER OCCUPIED (1) 13 At December 31 , 2024 , the non - owner occupied CRE portfolio totaled $ 880 . 8 million, or 325 . 2 % of total RBC . Of the $ 880 . 8 million, $ 458 . 3 million , or 52 . 0 % of non - owner occupied CRE, was concentrated in Massachusetts and $ 268 . 7 million, or 30 . 5 % of non - owner occupied CRE, was concentrated in Connecticut . At December 31 , 2024 , the apartment portfolio represented the largest concentration of non - owner occupied CRE at 66 . 4 % of t otal RBC with a weighted average LTV of 54 . 7 % . The office portfolio represented 65 . 4 % of total RBC with a weighted average LTV of 64 . 4 % . ($ in thousands) (1) As of December 31, 2024. (2) The total RBC ratio is based on Westfield Bank’s capital and due to loan classifications, the percentage of total RBC may differ fro m the Call Report . (3) Weighted average LTV is based on the original appraisal and the current loan balance. Weighted Average Loan to Value (LTV) (3) % of Total RBC (2) Total Other RI NH CT MA Property Type 54.7% 66.4% $179,874 $ - $ 27,740 $ - $ 37,212 $ 114,922 Apartment 64.4% 65.4% 177,102 11,405 - 40,237 62,906 62,554 Office 56.0% 43.1% 116,663 6,041 14,992 - 35,438 60,192 Industrial 55.4% 40.6% 109,936 10,859 6,219 13,752 23,551 55,555 Retail 57.7% 26.3% 71,226 4,713 13,062 - 21,552 31,899 Mixed Use 55.3% 13.7% 37,231 126 - 707 5,949 30,449 Other 51.8% 15.9% 43,133 - - - 22,320 20,813 Hotel/Hospitality 63.0% 12.5% 33,765 - - 784 8,548 24,433 Self Storage 58.6% 11.7% 31,635 - - - 16,546 15,089 Adult Care/Assisted Living 50.9% 8.6% 23,193 - - - 16,017 7,176 Shopping Center 44.5% 7.7% 20,942 217 - - 3,319 17,406 Warehouse 45.0% 4.2% 11,376 - - - - 11,376 School/Higher Education 72.4% 8.1% 22,047 347 2,660 15,323 3,717 Student Housing 39.5% 1.0% 2,705 - - - - 2,705 Automotive Sales 57.2% 325.2% $880,828 $ 33,708 $ 62,013 $ 58,140 $ 268,681 $ 458,286 Total non - owner occupied commercial real estate

COMMERCIAL REAL ESTATE – OFFICE BUILDINGS (1) 14 ($ in thousands) (1) As of December 31, 2024. (2) The total RBC ratio is based on Westfield Bank’s capital and due to loan classifications, the percentage of total RBC may dif fer from the Call Report. % of Total Bank RBC (2) % of Office Portfolio Total Owner Occupied Non - Owner Occupied By Collateral Type 43.4% 58.8% $ 117,644 $ 10,760 $ 106,884 Office/Medical 4.4% 6.0% 11,952 8,259 3,693 Office/Professional Metro 15.9% 21.5% 43,017 3,681 39,336 Office/Professional Suburban 10.2 % 13.7 % 27,502 313 27,189 Office/Professional Urban 73.9% 100.0% $ 200,115 $ 23,013 $ 177,102 Total Office Portfolio 73.9% 8.5% 65.4% Percent of RBC % of Total Bank RBC (2) % of Office Portfolio Total Owner Occupied Non - Owner Occupied By State 30.7% 41.5% $ 83,031 $ 20,477 $ 62,554 Massachusetts 24.2% 32.7% 65,442 2,536 62,906 Connecticut 14.9% 20.1% 40,237 - 40,237 New Hampshire 4.2 % 5.7 % 11,405 - 11,405 Other 73.9% 100.0% $ 200,115 $ 23,013 $ 177,102 Total Office Portfolio % of Total Bank RBC (2) % of Office Portfolio Total Owner Occupied Non - Owner Occupied By Risk Rating 70.5% 95.4% $ 190,809 $ 21,632 $ 169,177 Pass 3.2% 4.3% 8,649 724 7,925 Special Mention 0.2% 0.3% 657 657 - Substandard 73.9% 100.0% $ 200,115 $ 23,013 $ 177,102 Total Office Portfolio • As of December 31 , 2024 , the office portfolio totaled $ 200 . 1 million, or 73 . 9 % of RBC, and represented 18 . 6 % of total CRE loans . • Non - owner occupied office totaled $ 177 . 1 million, or 65 . 4 % of total RBC, and owner - occupied office totaled $ 23 . 0 million, or 8 . 5 % of total RBC . • Office exposure is concentrated in medical - office, totaling $ 117 . 6 million, or 58 . 8 % , of the total office portfolio . • Of the $ 200 . 1 million in total office, 41 . 5 % is concentrated in Massachusetts and 32 . 7 % is concentrated in Connecticut . The Company does not have any exposure in greater Boston or New York . • Of the $ 200 . 1 million in total office, 95 . 4 % of the office portfolio is in the pass - rated category . • There is approximately $ 36 . 8 million, or 18 . 4 % of the total office portfolio, maturing by the end of 2026 .
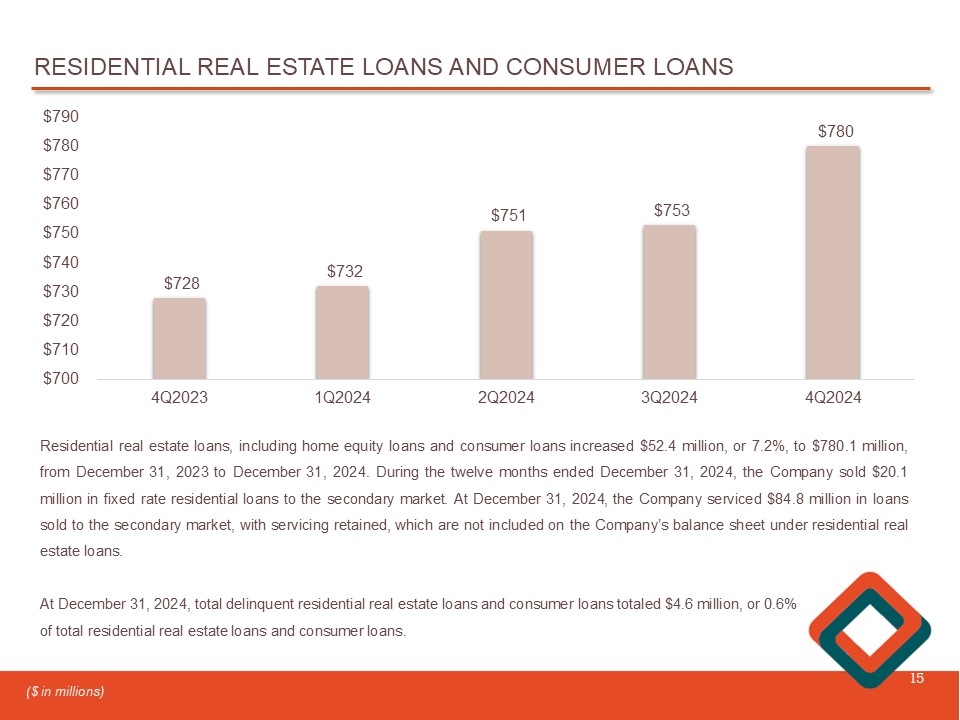
RESIDENTIAL REAL ESTATE LOANS AND CONSUMER LOANS 15 $728 $732 $751 $753 $780 4Q2023 1Q2024 2Q2024 3Q2024 4Q2024 $700 $710 $720 $730 $740 $750 $760 $770 $780 $790 Residential real estate loans , including home equity loans and consumer loans increased $ 52 . 4 million , or 7 . 2 % , to $ 780 . 1 million, from December 31 , 2023 to December 31 , 2024 . During the twelve months ended December 31 , 2024 , the Company sold $ 20 . 1 million in fixed rate residential loans to the secondary market . At December 31 , 2024 , the Company serviced $ 84 . 8 million in loans sold to the secondary market, with servicing retained, which are not included on the Company’s balance sheet under residential real estate loans . At December 31 , 2024 , total delinquent residential real estate loans and consumer loans totaled $ 4 . 6 million, or 0 . 6 % of total residential real estate loans and consumer loans . ($ in millions)
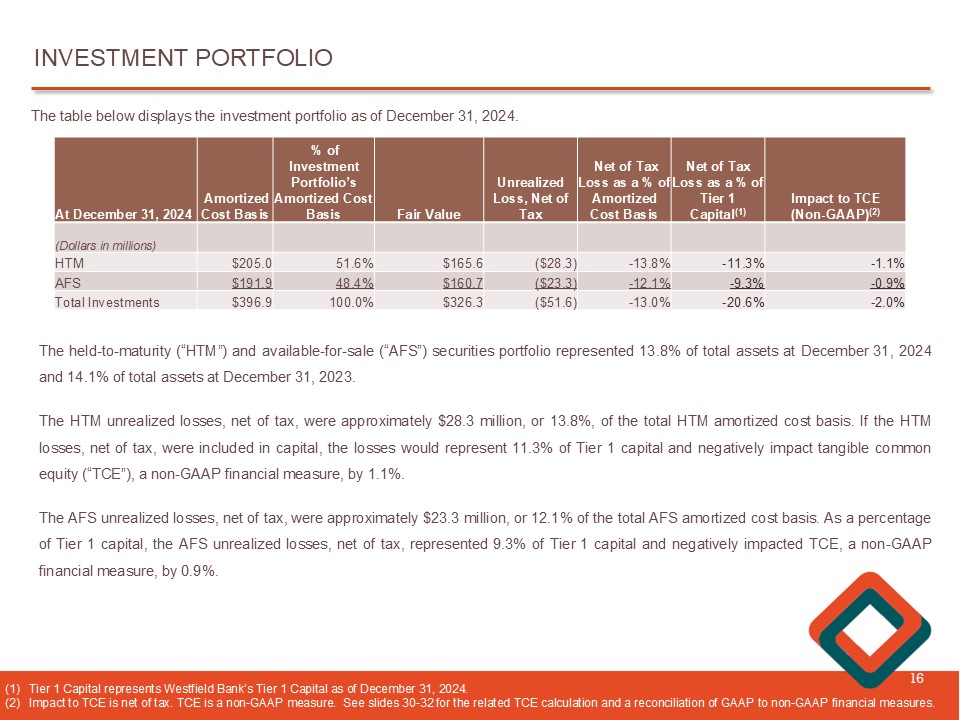
INVESTMENT PORTFOLIO 16 The held - to - maturity (“HTM”) and available - for - sale (“AFS”) securities portfolio represented 13 . 8 % of total assets at December 31 , 2024 and 14 . 1 % of total assets at December 31 , 2023 . The HTM unrealized losses, net of tax, were approximately $ 28 . 3 million, or 13 . 8 % , of the total HTM amortized cost basis . If the HTM losses, net of tax, were included in capital, the losses would represent 11 . 3 % of Tier 1 capital and negatively impact tangible common equity (“TCE”), a non - GAAP financial measure, by 1 . 1 % . The AFS unrealized losses, net of tax, were approximately $ 23 . 3 million , or 12 . 1 % of the total AFS amortized cost basis . As a percentage of Tier 1 capital, the AFS unrealized losses, net of tax, represented 9 . 3 % of Tier 1 capital and negatively impacted TCE, a non - GAAP financial measure, by 0 . 9 % . (1) Tier 1 Capital represents Westfield Bank’s Tier 1 Capital as of December 31, 2024. (2) Impact to TCE is net of tax. TCE is a non - GAAP measure. See slides 30 - 32 for the related TCE calculation and a reconciliation of GAAP to non - GAAP financial measures . The table below displays the investment portfolio as of December 31 , 2024 . Impact to TCE ( Non - GAAP) (2) Net of Tax Loss as a % of Tier 1 Capital (1) Net of Tax Loss as a % of Amortized Cost Basis Unrealized Loss, Net of Tax Fair Value % of Investment Portfolio’s Amortized Cost Basis Amortized Cost Basis At December 31, 2024 (Dollars in millions) - 1.1% - 11.3% - 13.8% ($28.3) $ 165.6 51.6% $ 205.0 HTM - 0.9% - 9.3% - 12.1% ($23.3) $ 160.7 48.4% $ 191.9 AFS - 2.0% - 20.6% - 13.0% ($ 51.6) $ 326.3 100.0% $ 396.9 Total Investments
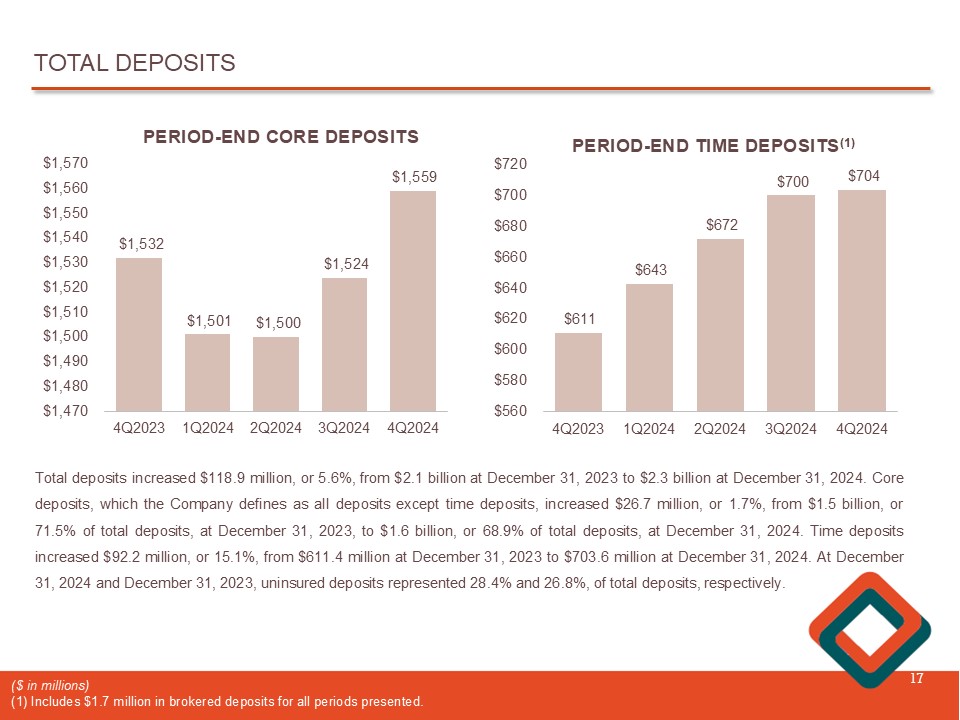
TOTAL DEPOSITS 17 $1,532 $1,501 $1,500 $1,524 $1,559 4Q2023 1Q2024 2Q2024 3Q2024 4Q2024 $1,470 $1,480 $1,490 $1,500 $1,510 $1,520 $1,530 $1,540 $1,550 $1,560 $1,570 PERIOD - END CORE DEPOSITS Total deposits increased $ 118 . 9 million, or 5 . 6 % , from $ 2 . 1 billion at December 31 , 2023 to $ 2 . 3 billion at December 31 , 2024 . Core deposits, which the Company defines as all deposits except time deposits, increased $ 26 . 7 million, or 1 . 7 % , from $ 1 . 5 billion, or 71 . 5 % of total deposits, at December 31 , 2023 , to $ 1 . 6 billion, or 68 . 9 % of total deposits, at December 31 , 2024 . Time deposits increased $ 92 . 2 million, or 15 . 1 % , from $ 611 . 4 million at December 31 , 2023 to $ 703 . 6 million at December 31 , 2024 . At December 31 , 2 024 and December 31 , 2023 , uninsured deposits represented 28 . 4 % and 26 . 8 % , of total deposits, respectively . $611 $643 $672 $700 $704 4Q2023 1Q2024 2Q2024 3Q2024 4Q2024 $560 $580 $600 $620 $640 $660 $680 $700 $720 PERIOD - END TIME DEPOSITS (1) ($ in millions) (1) Includes $1.7 million in brokered deposits for all periods presented.

AVERAGE TOTAL DEPOSITS 18 $1,588 $1,576 $1,589 $1,621 $1,684 $589 $558 $549 $559 $579 1.60% 1.75% 1.94% 2.04% 2.01% -0.25% 0.25% 0.75% 1.25% 1.75% 2.25% 2.75% 3.25% 4Q2023 1Q2024 2Q2024 3Q2024 4Q2024 $500 $700 $900 $1,100 $1,300 $1,500 $1,700 $1,900 Average Deposits and Rates Interest-bearing deposits Non-interest-bearing deposits Average deposit cost Total average deposits, consisting of interest - bearing and non - interest bearing deposits, increased $ 82 . 5 million, or 3 . 8 % , from $ 2 . 2 billion for the three months ended September 30 , 2024 , to $ 2 . 3 billion, for the three months ended December 31 , 2024 . The average cost of deposits decreased three basis points, from 2 . 04 % for the three months ended September 30 , 2024 to 2 . 01 % for the three months ended December 31 , 2024 . ($ in millions)

AVERAGE CORE AND TIME DEPOSITS 19 $1,573 $1,506 $1,488 $1,492 $1,562 0.76% 0.76% 0.87% 0.93% 0.98% 0.00% 0.20% 0.40% 0.60% 0.80% 1.00% $1,300 $1,350 $1,400 $1,450 $1,500 $1,550 $1,600 $1,650 $1,700 $1,750 $1,800 Average Core Deposits and Rates During the three months ended December 31 , 2024 , average core deposits of $ 1 . 6 billion, including non - interest bearing deposits, increased $ 70 . 9 million , or 4 . 8 % , from the three months ended September 30 , 2024 . During the three months ended December 31 , 2024 , average time deposits of $ 700 . 3 million increased $ 11 . 5 million, or 1 . 7 % , from the three months ended September 30 , 2024 . During the three months ended December 31 , 2024 , the average cost of core deposits, including non - interest bearing demand deposits, increased five ( 5 ) basis points from the three months ended September 30 , 2024 , while the cost of time deposits decreased 13 basis points during the same period . ($ in millions) $604 $628 $650 $689 $700 3.78% 4.12% 4.39% 4.44% 4.31% 0.25% 0.75% 1.25% 1.75% 2.25% 2.75% 3.25% 3.75% 4.25% 4.75% $540 $560 $580 $600 $620 $640 $660 $680 $700 $720 Average Time Deposits and Rates
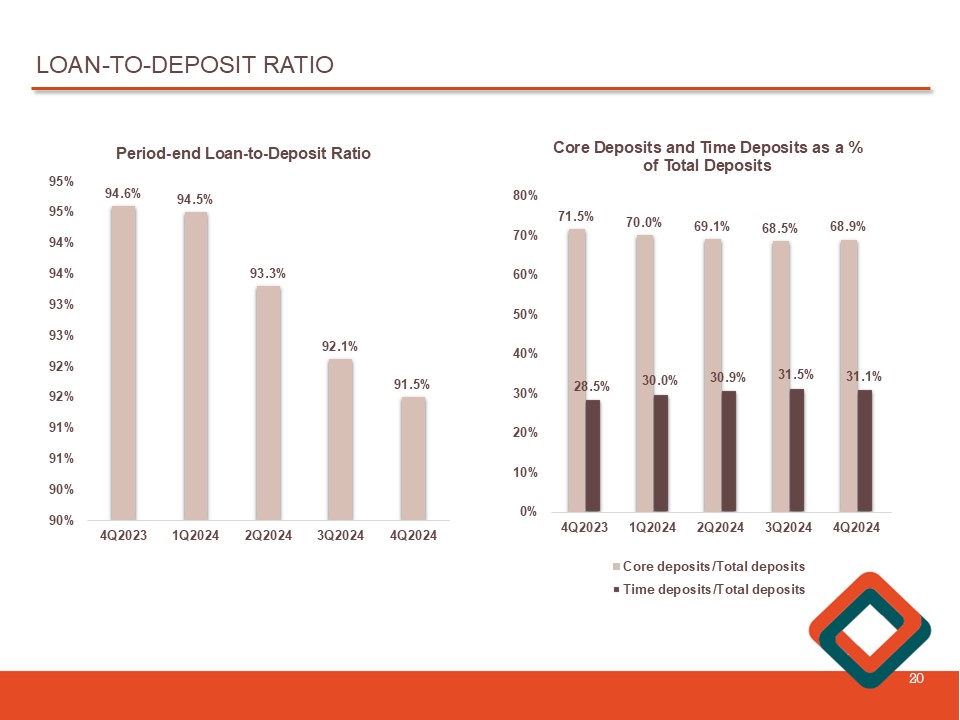
LOAN - TO - DEPOSIT RATIO 20 94.6% 94.5% 93.3% 92.1% 91.5% 4Q2023 1Q2024 2Q2024 3Q2024 4Q2024 90% 90% 91% 91% 92% 92% 93% 93% 94% 94% 95% 95% Period - end Loan - to - Deposit Ratio 71.5% 70.0% 69.1% 68.5% 68.9% 28.5% 30.0% 30.9% 31.5% 31.1% 4Q2023 1Q2024 2Q2024 3Q2024 4Q2024 0% 10% 20% 30% 40% 50% 60% 70% 80% Core Deposits and Time Deposits as a % of Total Deposits Core deposits/Total deposits Time deposits/Total deposits

WHOLESALE FUNDING 21 $156 $152 $155 $152 $123 4.83% 4.91% 5.00% 5.05% 5.04% 4.70% 4.75% 4.80% 4.85% 4.90% 4.95% 5.00% 5.05% 5.10% 4Q2023 1Q2024 2Q2024 3Q2024 4Q2024 $100 $110 $120 $130 $140 $150 $160 $170 Wholesale Funding (Includes $20 million in Subordinated Debt ) (1) FHLB Advances Average COF The Bank is considered to be well - capitalized as defined by regulators ( see slide 27 ) . The Bank’s Tier 1 Leverage Ratio to adjusted average assets was 9 . 34 % at December 31 , 2024 and 9 . 62 % at December 31 , 2023 . In addition, Westfield Bank’s TCE Ratio ( 2 ) , a non - GAAP financial measure, exceeds the Federal Home Loan Bank of Boston (“FHLB”) requirements to continue to utilize the FHLB as a funding source . At December 31 , 2024 , total borrowings decreased $ 33 . 4 million, or 21 . 3 % , from $ 156 . 5 million at December 31 , 2023 to $ 123 . 1 million . At December 31 , 2024 , short - term borrowings decreased $ 10 . 7 million, or 66 . 5 % , to $ 5 . 4 million , compared to $ 16 . 1 million at December 31 , 2023 , while long - term borrowings decreased $ 22 . 6 million, or 18 . 8 % , during the same period . The Company utilized the Bank Term Funding Program (“BTFP”), which was created in March 2023 to enhance banking system liquidity by allowing institutions to pledge certain securities at par value and borrow at a rate of ten basis points over the one - year overnight index swap rate . The BTFP was available to federally insured depository institutions in the U . S . , with advances having a term of up to one year with no prepayment penalties . The BTFP ceased extending new advances in March 2024 . At December 31 , 2023 , the Company’s outstanding balance under the BTFP was $ 90 . 0 million . There was no outstanding balances under the BTFP at December 31 , 2024 . At December 31 , 2024 , borrowings also consisted of $ 19 . 8 million in fixed - to - floating rate subordinated notes . (1) ($ in millions) (2) TCE is a non - GAAP measure. See slides 30 - 32 for the related TCE calculation and a reconciliation of GAAP to non - GAAP financial measures .

22 The Company’s liquidity position remains strong with solid core deposit relationships, cash, unencumbered securities and access to diversified borrowing sources . At December 31 , 2024 , the Company had available borrowing capacity with the FHLB of $ 461 . 6 million, including its overnight Ideal Way Line of Credit . In addition, at December 31 , 2024 , the Company had available borrowing capacity of $ 382 . 9 million from the Federal Reserve Discount Window, with no outstanding borrowings . At December 31 , 2024 , the Company also had available borrowing capacity of $ 25 . 0 million from two unsecured credit lines with correspondent banks, with no outstanding borrowings . At December 31 , 2024 , the Company had $ 1 . 1 billion in immediately available liquidity, compared to $ 643 . 6 million in uninsured deposits, or 28 . 4 % of total deposits, representing a coverage ratio of 172 % . Lastly, the Company has access to the brokered deposit market with approval from the Board of Directors to purchase brokered deposits in an amount not to exceed 10 % of total assets . At December 31 , 2024 , the Company had $ 1 . 7 million in brokered deposits included within time deposits on the balance sheet . LIQUIDITY Net Available Amount in Use at December 31 , 2024 Total Available ($ in millions) Internal Sources: $66.5 - $66.5 Cash and cash equivalents $156.3 - $156.3 Unpledged securities $ 13.2 - $ 13.2 Excess pledged securities External Sources: $461.6 $122.2 $574.3 FHLB $382.9 - $382.9 FRB Discount Window Other Unsecured: $25.0 - $25.0 Correspondent banks $ 1,105.5 $ 122.2 $ 1,218.2 Total Liquidity $643.6 Uninsured deposits 172% Liquidity/Total
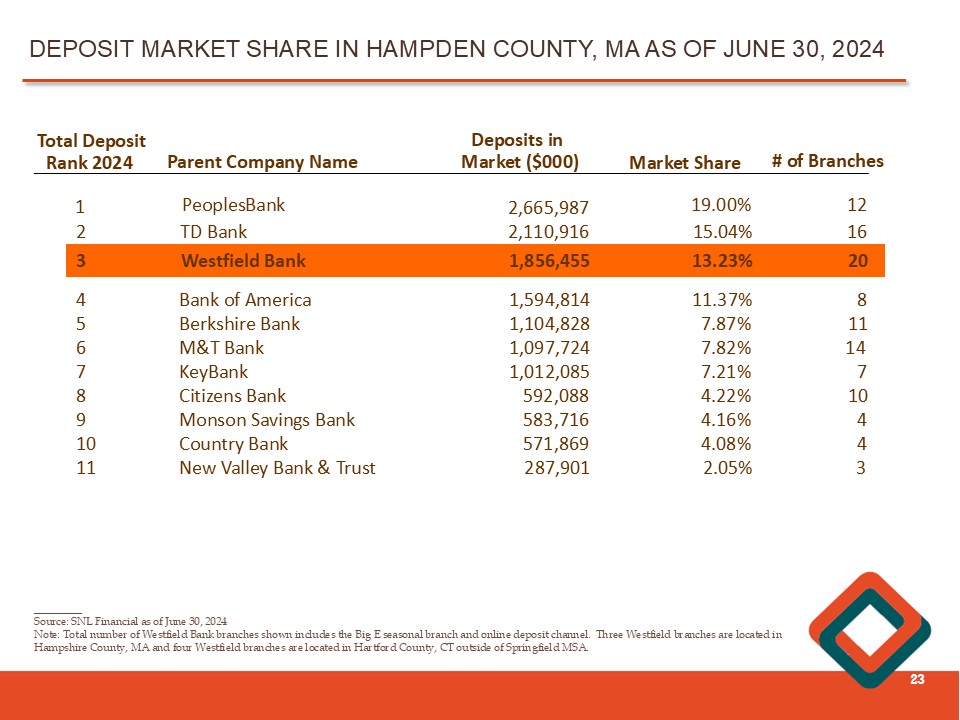
________ Source: SNL Financial as of June 30, 2024 Note: Total number of Westfield Bank branches shown includes the Big E seasonal branch and online deposit channel. Three Wes tfi eld branches are located in Hampshire County, MA and four Westfield branches are located in Hartford County, CT outside of Springfield MSA. DEPOSIT MARKET SHARE IN HAMPDEN COUNTY, MA AS OF JUNE 30, 2024 23 Total Deposit Rank 2024 Parent Company Name Deposits in Market ($000) Market Share # of Branches 1 PeoplesBank 2,665,987 19.00% 12 1,762,519 13.1% 20 3 Westfield Bank 1,856,455 13.23% 20 2 TD Bank 2,110,916 15.04% 16 4 Bank of America 1,594,814 11.37% 8 5 Berkshire Bank 1,104,828 7.87% 11 6 M&T Bank 1,097,724 7.82% 14 7 KeyBank 1,012,085 7.21% 7 8 Citizens Bank 592,088 4.22% 10 9 Monson Savings Bank 583,716 4.16% 4 10 Country Bank 571,869 4.08% 4 11 New Valley Bank & Trust 287,901 2.05% 3

ASSET QUALITY INDICATORS 24 4Q2024 3Q2024 2Q2024 1Q2024 4Q2023 $5.0M $4.3M $5.6M $4.7M $6.0M Total delinquent loans 0.24% 0.21% 0.27% 0.23% 0.30% Delinquent loans as a % of total loans $5.4M $4.9M $5.8M $5.8M $6.4M Nonperforming loans (NPL) 0.26% 0.24% 0.29% 0.29% 0.32% NPL as a % of total loans 0.20% 0.18% 0.23% 0.23% 0.25% NPL as a % of total assets 0.94% 0.97% 0.96% 0.98% 1.00% Allowance for credit losses % of total loans 363% 410% 333% 341% 316% Allowance for credit losses % of NPL ($128K) $98K $10K ($67K) $136K Net charge - offs (recoveries) (0.01%) 0.00% 0.00% 0.00% 0.01% Net charge - offs (recoveries) as a % average loans During the three months ended December 31 , 2024 , the Company recorded net recoveries of $ 128 , 000 compared to net charge - offs of $ 98 , 000 for the three months ended September 30 , 2024 . During the twelve months ended December 31 , 2024 , the Company recorded net recoveries of $ 87 , 000 , compared to net charge - offs of $ 2 . 0 million during the twelve months ended December 31 , 2023 . The net charge - offs during the twelve months ended December 31 , 2023 were related to one commercial relationship acquired in October 2016 from Chicopee Bancorp, Inc . The Company recorded a $ 1 . 9 million charge - off on the acquired commercial relationship , which represented the non - accretable credit mark that was required to be grossed - up to the loan’s amortized cost basis with a corresponding increase to the allowance for credit losses under the CECL implementation .

ASSET QUALITY 25 Management continues to remain attentive to any signs of deterioration in borrowers’ financial conditions and is proactive in taking the appropriate steps to mitigate risk . The allowance for credit losses as a percentage of total loans was 0 . 94 % at December 31 , 2024 , compared to 1 . 00 % at December 31 , 2023 . At December 31 , 2024 , the allowance for credit losses as a percentage of nonperforming loans was 362 . 9 % , compared to 315 . 6 % at December 31 , 2023 . December 31, 2023 December 31, 2024 ACL / Total Loan Segment Loans Outstanding (1) ACL (1) ACL / Total Loan Segment Loans Outstanding (1) Allowance for Credit Losses (ACL) (1) 1.17% $ 217,447 $ 2,537 1.17% $ 211,656 $ 2,477 Commercial and industrial 1.40% 1,079,751 15,141 1.27% 1,075,732 13,677 Commercial real estate 0.35% 722,154 2,548 0.41% 775,659 3,156 Residential (2) 0.75% 5,472 41 4.99% 4,391 219 Consumer - - - - - - Unallocated 1.00% $ 2,024,824 $ 20,267 0.94% $ 2,067,438 $ 19,529 Total Loans (1) ( $ in thousands) (2) Includes home equity loans and home equity lines of credit .
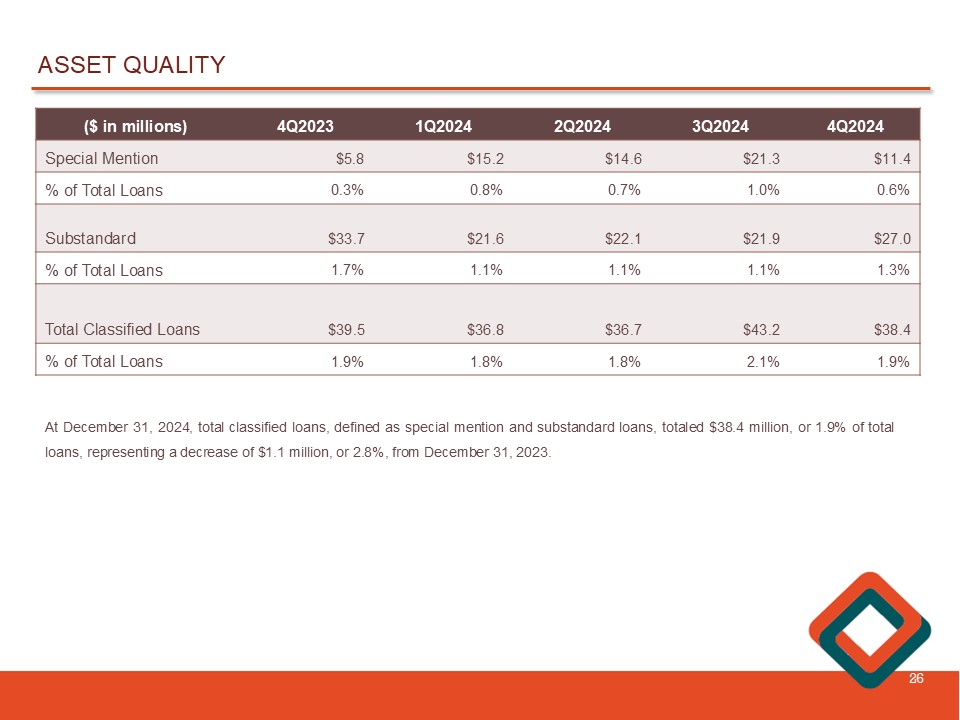
ASSET QUALITY 26 4Q2024 3Q2024 2Q2024 1Q2024 4Q2023 ($ in millions) $11.4 $21.3 $14.6 $15.2 $5.8 Special Mention 0.6% 1.0% 0.7% 0.8% 0.3% % of Total Loans $27.0 $21.9 $22.1 $21.6 $33.7 Substandard 1.3% 1.1% 1.1% 1.1% 1.7% % of Total Loans $38.4 $43.2 $36.7 $36.8 $39.5 Total Classified Loans 1.9% 2.1% 1.8% 1.8% 1.9% % of Total Loans At December 31 , 2024 , total classified loans, defined as special mention and substandard loans, totaled $ 38 . 4 million, or 1 . 9 % of total loans, representing a decrease of $ 1 . 1 million , or 2 . 8 % , from December 31 , 2023 .
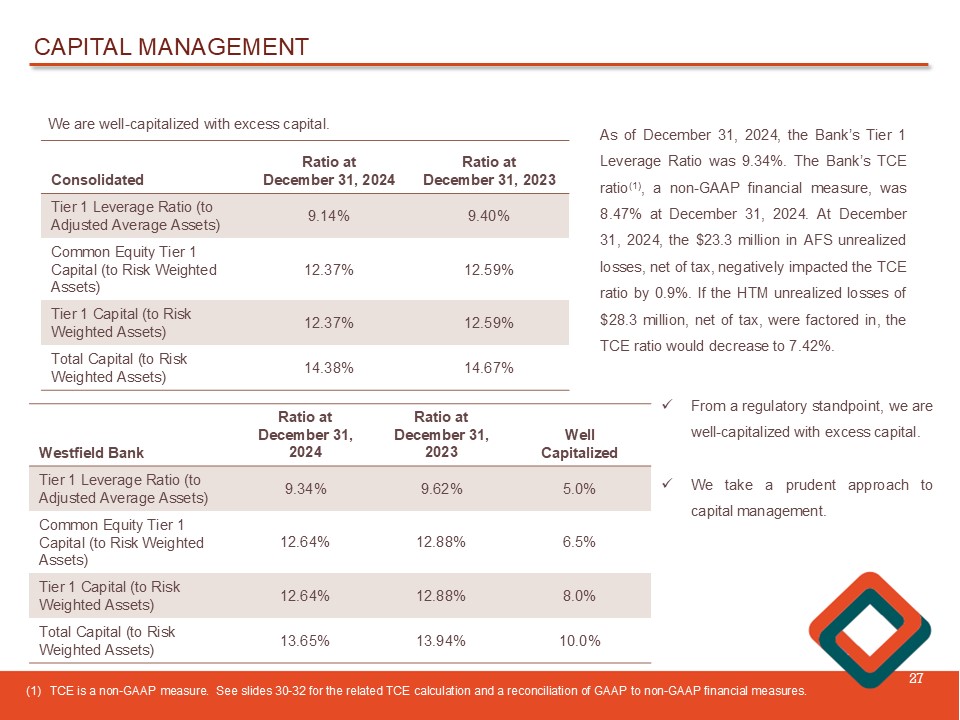
CAPITAL MANAGEMENT 27 We are well - capitalized with excess capital. Ratio at December 31, 2023 Ratio at December 31, 2024 Consolidated 9.40% 9.14% Tier 1 Leverage Ratio (to Adjusted Average Assets) 12.59% 12.37% Common Equity Tier 1 Capital (to Risk Weighted Assets) 12.59% 12.37% Tier 1 Capital (to Risk Weighted Assets) 14.67% 14.38% Total Capital (to Risk Weighted Assets) As of December 31 , 2024 , the Bank’s Tier 1 Leverage Ratio was 9 . 34 % . The Bank’s TCE ratio ( 1 ) , a non - GAAP financial measure, was 8 . 47 % at December 31 , 2024 . At December 31 , 2024 , the $ 23 . 3 million in AFS unrealized losses, net of tax, negatively impacted the TCE ratio by 0 . 9 % . If the HTM unrealized losses of $ 28 . 3 million, net of tax, were factored in, the TCE ratio would decrease to 7 . 42 % . Well Capitalized Ratio at December 31, 2023 Ratio at December 31, 2024 Westfield Bank 5.0% 9.62% 9.34% Tier 1 Leverage Ratio (to Adjusted Average Assets) 6.5% 12.88% 12.64% Common Equity Tier 1 Capital (to Risk Weighted Assets) 8.0% 12.88% 12.64% Tier 1 Capital (to Risk Weighted Assets) 10.0% 13.94% 13.65% Total Capital (to Risk Weighted Assets) (1) TCE is a non - GAAP measure. See slides 30 - 32 for the related TCE calculation and a reconciliation of GAAP to non - GAAP financial measures . x From a regulatory standpoint, we are well - capitalized with excess capital . x We take a prudent approach to capital management .
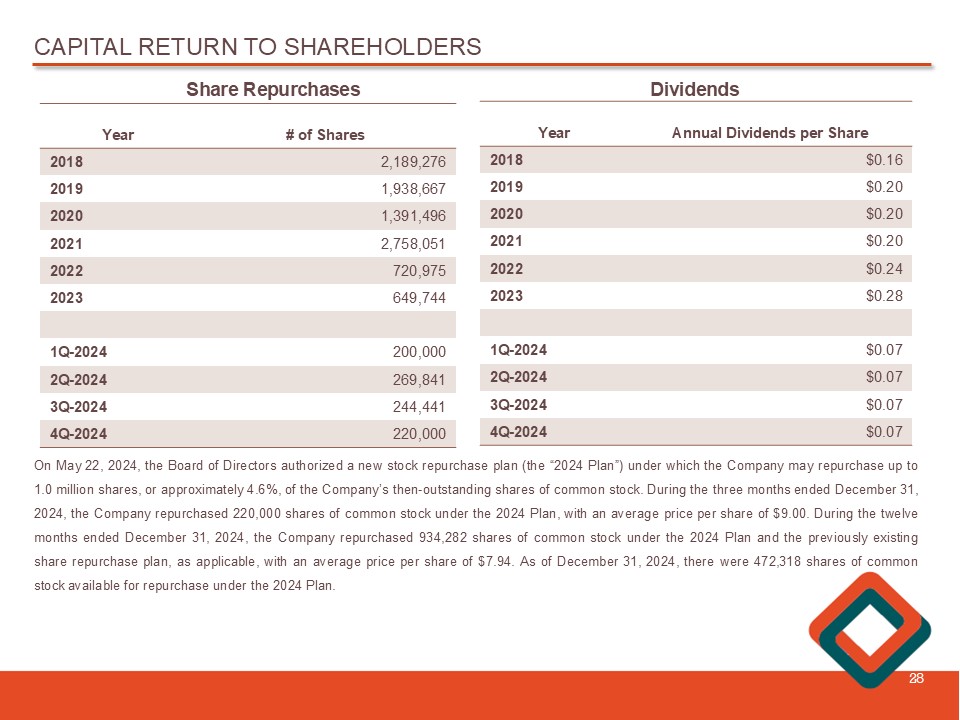
CAPITAL RETURN TO SHAREHOLDERS 28 # of Shares Year 2,189,276 2018 1,938,667 2019 1,391,496 2020 2,758,051 2021 720,975 2022 649,744 2023 200,000 1Q - 2024 269,841 2Q - 2024 244,441 3Q - 2024 220,000 4Q - 2024 Annual Dividends per Share Year $0.16 2018 $0.20 2019 $0.20 2020 $0.20 2021 $0.24 2022 $0.28 2023 $0.07 1Q - 2024 $0.07 2Q - 2024 $0.07 3Q - 2024 $0.07 4Q - 2024 Share Repurchases Dividends On May 22 , 2024 , the Board of Directors authorized a new stock repurchase plan (the “ 2024 Plan”) under which the Company may repurchase up to 1 . 0 million shares, or approximately 4 . 6 % , of the Company’s then - outstanding shares of common stock . During the three months ended December 31 , 2024 , the Company repurchased 220 , 000 shares of common stock under the 2024 Plan, with an average price per share of $ 9 . 00 . During the twelve months ended December 31 , 2024 , the Company repurchased 934 , 282 shares of common stock under the 2024 Plan and the previously existing share repurchase plan, as applicable, with an average price per share of $ 7 . 94 . As of December 31 , 2024 , there were 472 , 318 shares of common stock available for repurchase under the 2024 Plan .
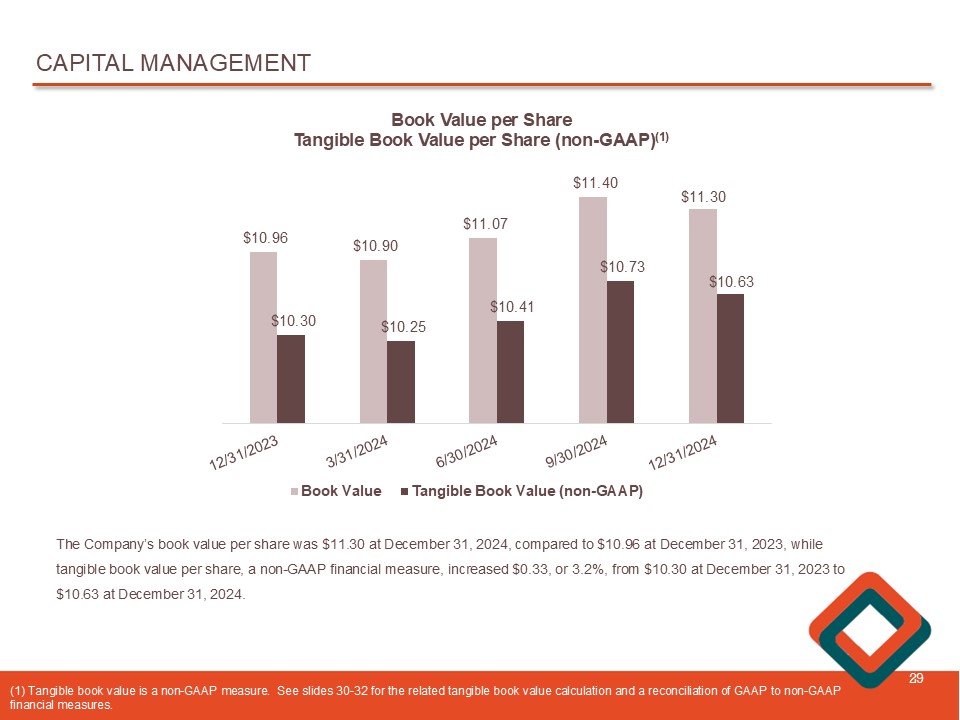
CAPITAL MANAGEMENT 29 $10.96 $10.90 $11.07 $11.40 $11.30 $10.30 $10.25 $10.41 $10.73 $10.63 Book Value per Share Tangible Book Value per Share (non - GAAP) (1) Book Value Tangible Book Value (non-GAAP) The Company’s book value per share was $11.30 at December 31, 2024, compared to $10.96 at December 31, 2023, while tangible book value per share, a non - GAAP financial measure, increased $0.33, or 3.2%, from $10.30 at December 31, 2023 to $10.63 at December 31, 2024. ( 1) Tangible book value is a non - GAAP measure. See slides 30 - 32 for the related tangible book value calculation and a reconcilia tion of GAAP to non - GAAP financial measures.

APPENDIX: NON - GAAP TO GAAP RECONCILIATION 30 Reconciliation of Non - GAAP to GAAP Financial Measures The Company believes that certain non - GAAP financial measures provide information to investors that is useful in understanding i ts financial condition. Because not all companies use the same calculation, this presentation may not be comparable to other similarly title d measures calculated by other companies. A reconciliation of these non - GAAP financial measures is provided below. 12/31/2024 9/30/2024 6/30/2024 3/31/2024 12/31/2023 Loan interest (no tax adjustment) 25,183$ 25,134$ 24,340$ 24,241$ 23,939$ Tax-equivalent adjustment 128 119 114 110 113 Loan interest (tax-equivalent basis) 25,311$ 25,253$ 24,454$ 24,351$ 24,052$ Net interest income (no tax adjustment) 15,273$ 14,728$ 14,470$ 15,346$ 16,176$ Tax equivalent adjustment 128 119 114 110 113 Net interest income (tax-equivalent basis) 15,401$ 14,847$ 14,584$ 15,456$ 16,289$ Net interest income (no tax adjustment) 15,273$ 14,728$ 14,470$ 15,346$ 16,176$ Less: Fair value hedge interest income 74 434 447 443 459 Adjusted net interest income (non-GAAP) 15,199$ 14,294$ 14,023$ 14,903$ 15,717$ Average interest-earning assets 2,517,017$ 2,441,236$ 2,400,633$ 2,403,086$ 2,427,112$ Net interest margin (no tax adjustment) 2.41% 2.40% 2.42% 2.57% 2.64% Net interest margin, tax-equivalent 2.43% 2.42% 2.44% 2.59% 2.66% Adjusted net interest margin, excluding fair value hedge interest income (non-GAAP) 2.40% 2.33% 2.35% 2.50% 2.57% For the quarter ended (Dollars in thousands)

APPENDIX: NON - GAAP TO GAAP RECONCILIATION 31 Reconciliation of Non - GAAP to GAAP Financial Measures The Company believes that certain non - GAAP financial measures provide information to investors that is useful in understanding i ts financial condition. Because not all companies use the same calculation, this presentation may not be comparable to other similarly title d measures calculated by other companies. A reconciliation of these non - GAAP financial measures is provided below. 12/31/2024 9/30/2024 6/30/2024 3/31/2024 12/31/2023 Book Value per Share (GAAP) 11.30$ 11.40$ 11.07$ 10.90$ 10.96$ Non-GAAP adjustments: Goodwill (0.60) (0.59) (0.58) (0.58) (0.58) Core deposit intangible (0.07) (0.08) (0.08) (0.07) (0.08) Tangible Book Value per Share (non-GAAP) 10.63$ 10.73$ 10.41$ 10.25$ 10.30$ Total Bank Equity (GAAP) 240,994$ 245,786$ 241,867$ 241,480$ 242,780$ Non-GAAP adjustments: Goodwill (12,487) (12,487) (12,487) (12,487) (12,487) Core deposit intangible net of associated deferred tax (1,033) (1,101) (1,168) (1,236) (1,303) Tangible Capital (non-GAAP) 227,474$ 232,198$ 228,212$ 227,757$ 228,990$ Tangible Capital (non-GAAP) 227,474$ 232,198$ 228,212$ 227,757$ 228,990$ Unrealized losses on HTM securities net of tax (28,346) (22,083) (28,869) (28,441) (25,649) Adjusted Tangible Capital For Impact of Unrealized Losses on HTM Securities Net of Tax (non-GAAP) 199,128$ 210,115$ 199,343$ 199,316$ 203,341$ Common Equity Tier (CET) 1 Capital 250,748$ 250,543$ 251,849$ 251,394$ 250,734$ Total Assets for Leverage Ratio (non-GAAP) 2,684,740$ 2,608,171$ 2,575,093$ 2,572,525$ 2,607,260$ Tier 1 Leverage Ratio 9.34% 9.61% 9.78% 9.77% 9.62% Tangible Common Equity (non-GAAP) =Tangible Capital (non-GAAP)/Total Assets for Leverage Ratio (non-GAAP) 8.47% 8.90% 8.86% 8.85% 8.78% Adjusted Tangible Common Equity for HTM Impact (non- GAAP) = Adjusted Tangible Capital For Impact of Unrealized Losses on HTM Securities Net of Tax (non-GAAP)/Total Assets for Leverage Ratio (non-GAAP) 7.42% 8.06% 7.74% 7.75% 7.80% For the quarter ended (Dollars in thousands)
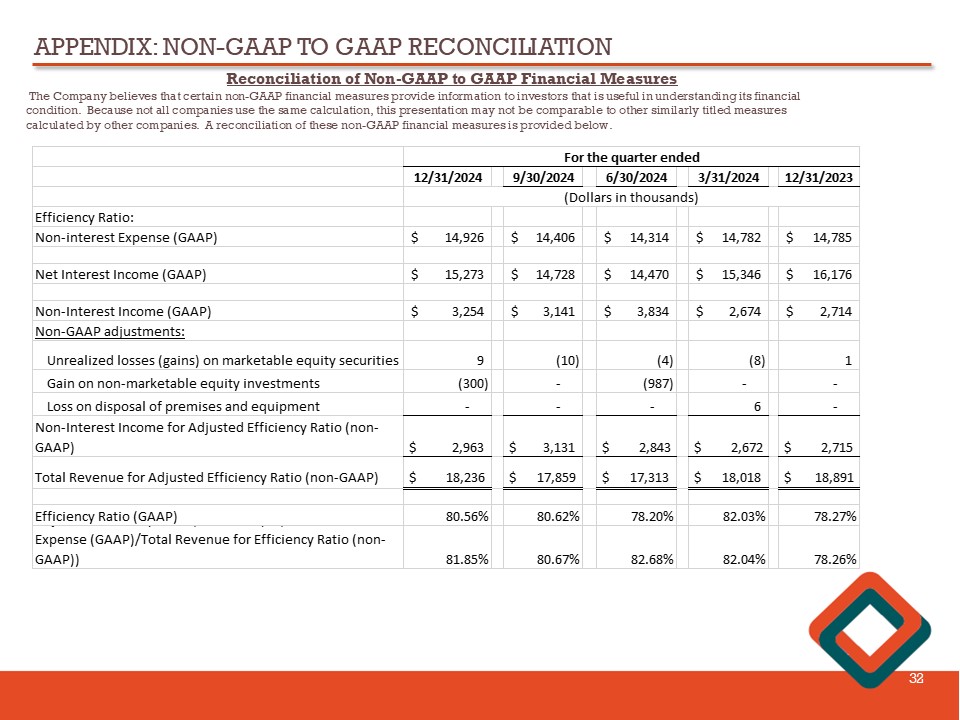
APPENDIX: NON - GAAP TO GAAP RECONCILIATION 32 Reconciliation of Non - GAAP to GAAP Financial Measures The Company believes that certain non - GAAP financial measures provide information to investors that is useful in understanding i ts financial condition. Because not all companies use the same calculation, this presentation may not be comparable to other similarly title d measures calculated by other companies. A reconciliation of these non - GAAP financial measures is provided below. 12/31/2024 9/30/2024 6/30/2024 3/31/2024 12/31/2023 Efficiency Ratio: Non-interest Expense (GAAP) 14,926$ 14,406$ 14,314$ 14,782$ 14,785$ Net Interest Income (GAAP) 15,273$ 14,728$ 14,470$ 15,346$ 16,176$ Non-Interest Income (GAAP) 3,254$ 3,141$ 3,834$ 2,674$ 2,714$ Non-GAAP adjustments: Unrealized losses (gains) on marketable equity securities 9 (10) (4) (8) 1 Gain on non-marketable equity investments (300) - (987) - - Loss on disposal of premises and equipment - - - 6 - Non-Interest Income for Adjusted Efficiency Ratio (non- GAAP) $ 2,963 $ 3,131 $ 2,843 $ 2,672 $ 2,715 Total Revenue for Adjusted Efficiency Ratio (non-GAAP) $ 18,236 $ 17,859 $ 17,313 $ 18,018 $ 18,891 Efficiency Ratio (GAAP) 80.56% 80.62% 78.20% 82.03% 78.27% Adjusted Efficiency Ratio (non-GAAP) = (Non-interest Expense (GAAP)/Total Revenue for Efficiency Ratio (non- GAAP)) 81.85% 80.67% 82.68% 82.04% 78.26% For the quarter ended (Dollars in thousands)
WESTFIELD BANK “WHAT BETTER BANKING’S ALL ABOUT” James C. Hagan , President and Chief Executive Officer Guida R. Sajdak , Executive Vice President and Chief Financial Officer Meghan Hibner , First Vice President and Investor Relations Officer 33 141 Elm Street, Westfield, MA