WESTERN NEW ENGLAND BANCORP, INC. 8-K
Exhibit 99.2

Local banking is better than ever. INVESTOR PRESENTATION 2ND QUARTER 2024
FORWARD - LOOKING STATEMENTS 2 We may, from time to time, make written or oral “forward - looking statements” within the meaning of the Private Securities Litigation Reform Act of 1995 , including statements contained in our filings with the Securities and Exchange Commission (the “SEC”), our reports to shareholders and in other communications by us . This Investor Presentation contains “forward - looking statements” with respect to the Company’s financial condition, liquidity , results of operations, future performance, and business . Forward - looking statements may be identified by the use of such words as “believe,” “expect,” “anticipate ,” “ should,” “planned,” “estimated,” and “potential . ” Examples of forward - looking statements include, but are not limited to, estimates with respect to our financial condition, results of operations and business that are subject to various factors which could cause actual results to differ materially from these estimates . These factors include, but are not limited to : • unpredictable changes in general economic conditions, financial markets, fiscal, monetary and regulatory policies, including actual or potential stress in the banking industry ; • the duration and scope of potential pandemics, including the emergence of new variants and the response thereto ; • unstable political and economic conditions which could materially impact credit quality trends and the ability to generate loans and gather deposits ; • inflation and governmental responses to inflation, including recent sustained increases and potential future increases in interest rates that reduce margins ; • the effect on our operations of governmental legislation and regulation, including changes in accounting regulation or standards, the nature and timing of the adoption and effectiveness of new requirements under the Dodd - Frank Wall Street Reform and Consumer Protection Act of 2010 , Basel guidelines, capital requirements and other applicable laws and regulations ; • significant changes in accounting, tax or regulatory practices or requirements ; • new legal obligations or liabilities or unfavorable resolutions of litigation ; • disruptive technologies in payment systems and other services traditionally provided by banks ; • the highly competitive industry and market area in which we operate ;
FORWARD - LOOKING STATEMENTS 3 • changes in business conditions and inflation ; • operational risks or risk management failures by us or critical third parties, including without limitation with respect to data processing, information systems, cybersecurity, technological changes, vendor issues, business interruption, and fraud risks ; • f ailure or circumvention of our internal controls or procedures ; • c hanges in the securities markets which affect investment management revenues ; • i ncreases in Federal Deposit Insurance Corporation deposit insurance premiums and assessments ; • the soundness of other financial services institutions which may adversely affect our credit risk; • certain of our intangible assets may become impaired in the future; • new lines of business or new products and services, which may subject us to additional risks; • changes in key management personnel which may adversely impact our operations; • severe weather, natural disasters, acts of war or terrorism and other external events which could significantly impact our business; and • other risk factors detailed from time to time in our SEC filings. Although we believe that the expectations reflected in such forward - looking statements are reasonable, actual results may differ materially from the results discussed in these forward - looking statements. You are cautioned not to place undue reliance on the se forward - looking statements, which speak only as of the date hereof. We do not undertake any obligation to republish revised for ward - looking statements to reflect events or circumstances after the date hereof or to reflect the occurrence of unanticipated events , except to the extent required by law.

WHO WE ARE Every day, we focus on showing Westfield Bank customers “ what better banking is all about . ” For us, the idea of better banking starts with putting customers first, while adhering to our core values . Our Core Values : • Integrity • Enhance Shareholder Value • Customer Focus • Community Focus Our Core Mission : Our purpose is to help customers succeed in our community, while creating and increasing shareholder value . The Company’s purpose drives the outcome we envision for Western New England Bancorp . 4 70 Center Street, Chicopee, MA.

SENIOR MANAGEMENT TEAM James C . Hagan, President & Chief Executive Officer Guida R . Sajdak, Executive Vice President, Chief Financial Officer & Treasurer Allen J . Miles III, Executive Vice President & Chief Lending Officer Kevin C . O’Connor, Executive Vice President & Chief Banking Officer Daniel A . Marini , Senior Vice President, Retail Banking & Marketing Leo R . Sagan, Jr . , Senior Vice President & Chief Risk Officer Filipe Goncalves, Senior Vice President & Chief Credit Officer Darlene Libiszewski , Senior Vice President & Chief Information Officer John E . Bonini , Senior Vice President & General Counsel Christine Phillips , Senior Vice President, Human Resources Director 5
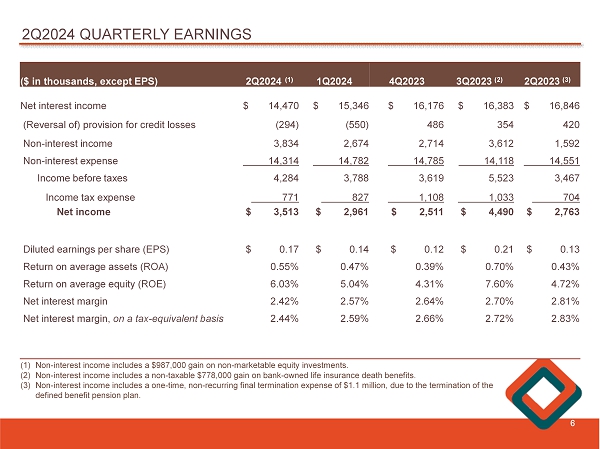
2 Q2024 QUARTERLY EARNINGS 6 2Q2023 (3) 3Q2023 (2) 4Q2023 1Q2024 2Q2024 (1) ($ in thousands , except EPS) $ 16,846 $ 16,383 $ 16,176 $ 15,346 $ 14,470 Net interest income 420 354 486 (550) (294) (R eversal of) provision for credit losses 1,592 3,612 2,714 2,674 3,834 Non - interest income 14,551 14,118 14,785 14,782 14,314 Non - interest expense 3,467 5,523 3,619 3,788 4,284 Income before taxes 704 1,033 1,108 827 771 Income tax expense $ 2,763 $ 4,490 $ 2,511 $ 2,961 $ 3,513 Net income $ 0.13 $ 0.21 $ 0.12 $ 0.14 $ 0.17 Diluted earnings per share (EPS) 0.43% 0.70% 0.39% 0.47% 0.55% Return on average assets (ROA) 4.72% 7.60% 4.31% 5.04% 6.03% Return on average equity (ROE) 2.81% 2.70% 2.64% 2.57% 2.42% Net interest margin 2.83% 2.72% 2.66% 2.59% 2.44% Net interest margin, on a tax - equivalent basis (1) Non - interest income includes a $987,000 gain on non - marketable equity investments. (2) Non - interest income includes a non - taxable $778,000 gain on bank - owned life insurance death benefits. (3) Non - interest income includes a one - time, non - recurring final termination expense of $1.1 million, due to the termination of the defined benefit pension plan .
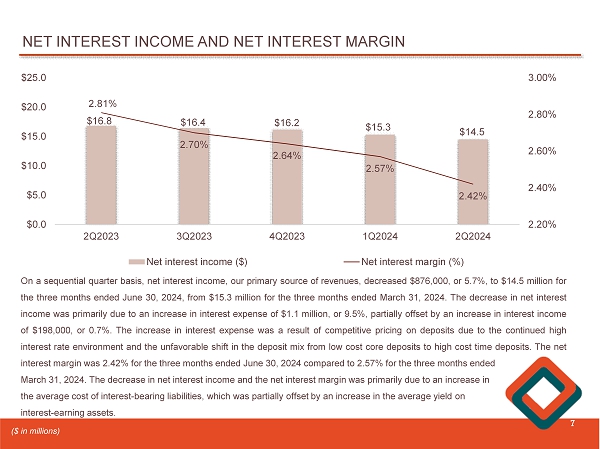
NET INTEREST INCOME AND NET INTEREST MARGIN 7 $16.8 $16.4 $16.2 $15.3 $14.5 2.81% 2.70% 2.64% 2.57% 2.42% 2.20% 2.40% 2.60% 2.80% 3.00% 2Q2023 3Q2023 4Q2023 1Q2024 2Q2024 $0.0 $5.0 $10.0 $15.0 $20.0 $25.0 Net interest income ($) Net interest margin (%) On a sequential quarter basis, net interest income, our primary source of revenues, decreased $ 876 , 000 , or 5 . 7 % , to $ 14 . 5 million for the three months ended June 30 , 2024 , from $ 15 . 3 million for the three months ended March 31 , 2024 . The decrease in net interest income was primarily due to an increase in interest expense of $ 1 . 1 million, or 9 . 5 % , partially offset by an increase in interest income of $ 198 , 000 , or 0 . 7 % . The increase in interest expense was a result of competitive pricing on deposits due to the continued high interest rate environment and the unfavorable shift in the deposit mix from low cost core deposits to high cost time deposits . The net interest margin was 2 . 42 % for the three months ended June 30 , 2024 compared to 2 . 57 % for the three months ended March 31 , 2024 . The decrease in net interest income and the net interest margin was primarily due to an increase in the average cost of interest - bearing liabilities, which was partially offset by an increase in the average yield on interest - earning assets . ($ in millions)
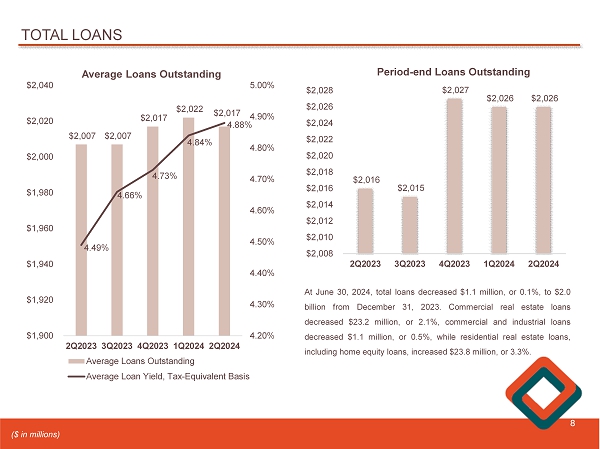
TOTAL LOANS 8 $2,007 $2,007 $2,017 $2,022 $2,017 4.49% 4.66% 4.73% 4.84% 4.88% 4.20% 4.30% 4.40% 4.50% 4.60% 4.70% 4.80% 4.90% 5.00% 2Q2023 3Q2023 4Q2023 1Q2024 2Q2024 $1,900 $1,920 $1,940 $1,960 $1,980 $2,000 $2,020 $2,040 Average Loans Outstanding Average Loans Outstanding Average Loan Yield, Tax-Equivalent Basis $2,016 $2,015 $2,027 $2,026 $2,026 2Q2023 3Q2023 4Q2023 1Q2024 2Q2024 $2,008 $2,010 $2,012 $2,014 $2,016 $2,018 $2,020 $2,022 $2,024 $2,026 $2,028 Period - end Loans Outstanding At June 30 , 2024 , total loans decreased $ 1 . 1 million, or 0 . 1 % , to $ 2 . 0 billion from December 31 , 2023 . C ommercial real estate loans decreased $ 23 . 2 million, or 2 . 1 % , commercial and industrial loans decreased $ 1 . 1 million, or 0 . 5 % , while residential real estate loans, including home equity loans, increased $ 23 . 8 million , or 3 . 3 % . ($ in millions)
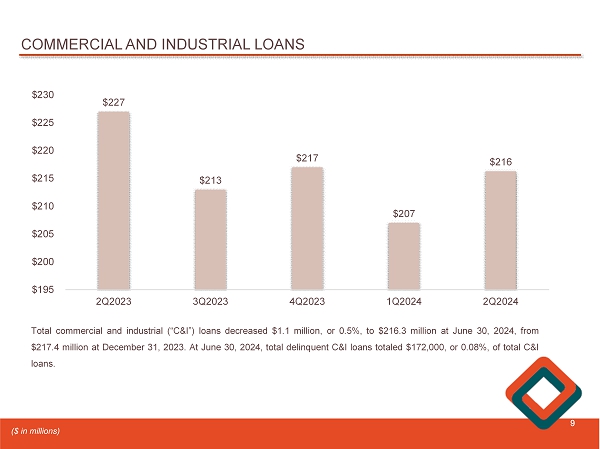
COMMERCIAL AND INDUSTRIAL LOANS 9 $227 $213 $217 $207 $216 2Q2023 3Q2023 4Q2023 1Q2024 2Q2024 $195 $200 $205 $210 $215 $220 $225 $230 Total commercial and industrial (“C&I”) loans decreased $ 1 . 1 million, or 0 . 5 % , to $ 216 . 3 million at June 30 , 2024 , from $ 217 . 4 million at December 31 , 2023 . At June 30 , 2024 , total delinquent C&I loans totaled $ 172 , 000 , or 0 . 08 % , of total C&I loans . ($ in millions)

COMMERCIAL & INDUSTRIAL PORTFOLIO (1) 10 (1) % of total loans as of June 30, 2024 1.6% , Manufacturing 1.6% , Merchant Wholesalers 0.1% , Hotels 1.1% , Construction, Sand and Gravel Mining 4.3% , All other C&I 0.6% , Healthcare 1.4% , Educational Services
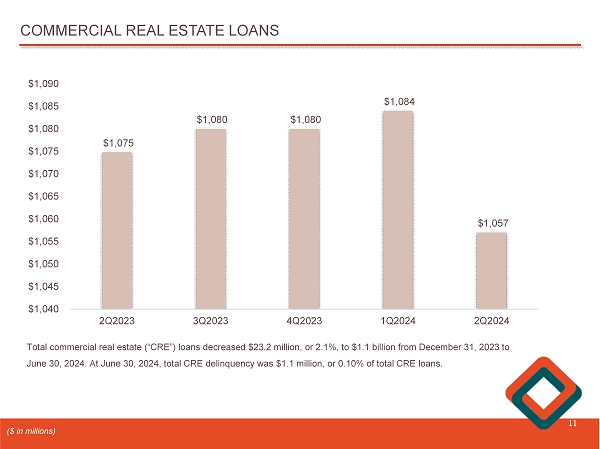
COMMERCIAL REAL ESTATE LOANS 11 $1,075 $1,080 $1,080 $1,084 $1,057 2Q2023 3Q2023 4Q2023 1Q2024 2Q2024 $1,040 $1,045 $1,050 $1,055 $1,060 $1,065 $1,070 $1,075 $1,080 $1,085 $1,090 Total commercial real estate (“CRE”) loans decreased $ 23 . 2 million, or 2 . 1 % , to $ 1 . 1 billion from December 31 , 2023 to June 30 , 2024 . At June 30 , 2024 , total CRE delinquency was $ 1 . 1 million, or 0 . 10 % of total CRE loans . ($ in millions)
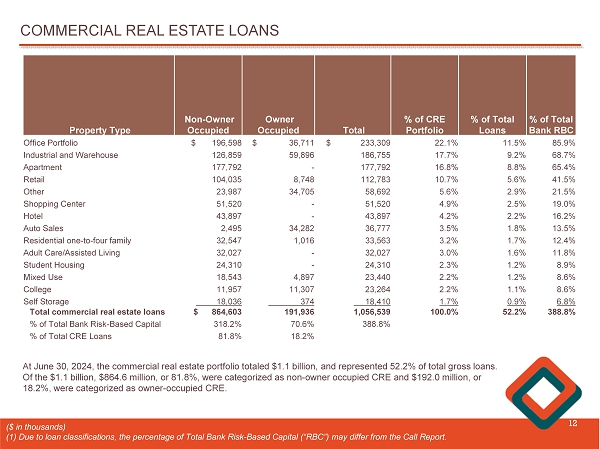
COMMERCIAL REAL ESTATE LOANS 12 ($ in thousands) (1) Due to loan classifications, the percentage of Total Bank Risk - Based Capital (“RBC”) may differ from the Call Report. At June 30, 2024, the commercial real estate portfolio totaled $1.1 billion, and represented 52.2% of total gross loans. Of the $1.1 billion, $864.6 million, or 81.8%, were categorized as non - owner occupied CRE and $ 192.0 million, or 18.2%, were categorized as owner - occupied CRE. % of Total Bank RBC % of Total Loans % of CRE Portfolio Total Owner Occupied Non - Owner Occupied Property Type 85.9% 11.5% 22.1% $ 233,309 $ 36,711 $ 196,598 Office Portfolio 68.7% 9.2% 17.7% 186,755 59,896 126,859 Industrial and Warehouse 65.4% 8.8% 16.8% 177,792 - 177,792 Apartment 41.5% 5.6% 10.7% 112,783 8,748 104,035 Retail 21.5% 2.9% 5.6% 58,692 34,705 23,987 Other 19.0% 2.5% 4.9% 51,520 - 51,520 Shopping Center 16.2% 2.2% 4.2% 43,897 - 43,897 Hotel 13.5% 1.8% 3.5% 36,777 34,282 2,495 Auto Sales 12.4% 1.7% 3.2% 33,563 1,016 32,547 Residential one - to - four family 11.8% 1.6% 3.0% 32,027 - 32,027 Adult Care/Assisted Living 8.9% 1.2% 2.3% 24,310 - 24,310 Student Housing 8.6% 1.2% 2.2% 23,440 4,897 18,543 Mixed Use 8.6% 1.1% 2.2% 23,264 11,307 11,957 College 6.8% 0.9% 1.7% 18,410 374 18,036 Self Storage 388.8% 52.2% 100.0% 1,056,539 191,936 $ 864,603 Total commercial real estate loans 388.8% 70.6% 318.2% % of Total Bank Risk - Based Capital 18.2% 81.8% % of Total CRE Loans

COMMERCIAL REAL ESTATE – NON - OWNER OCCUPIED 13 At June 30, 2024, the non - owner occupied CRE portfolio totaled $864.6 million, or 318.2% of Total Bank RBC. Of the $864.6 millio n, $445.8 million, or 51.6% of non - owner occupied CRE, was concentrated in Massachusetts and $261.3 million, or 30.2% of non - owner occupied CRE, was concentrated in Connecticut. At June 30, 2024, the office portfolio represented the largest concentration of non - owner occupied CRE at 72.3% of Total Bank RBC with a weighted average loan - to - value (“LTV”) of 64.9%. Apartments represented 65.4 % of Total Bank RBC with a weighted average LTV of 55.8%. ($ in thousands) (1) Due to loan classifications, the percentage of Total Bank RBC may differ from the Call Report. (2) Weighted average LTV is based on the original appraisal and the current loan exposure. Weighted Average LTV % of Total Bank RBC Total Other RI NH CT MA Property Type 64.9% 72.3% $ 196,598 $ 13,277 $ - $ 40,841 $ 64,659 $ 77,821 Office Portfolio 55.8% 65.4% 177,792 - 42,093 4,998 35,262 95,439 Apartment 59.8% 46.7% 126,859 4,559 13,076 - 37,039 72,185 Industrial and Warehouse 60.0% 38.3% 104,035 10,988 6,292 2,608 50,044 34,103 Retail 51.4% 19.0% 51,520 - - 11,819 11,594 28,107 Shopping Center 52.5% 16.2% 43,897 - - - 22,732 21,165 Hotel 57.8% 12.0% 32,547 130 - - 1,262 31,155 Residential one - to - four family 55.0% 11.8% 32,027 - - - 16,635 15,392 Adult Care/Assisted Living 68.9% 9.0% 24,310 5,097 - - 15,452 3,761 Student Housing 50.5% 8.8% 23,987 - - - 5,985 18,002 Other 54.8% 6.8% 18,543 - 935 - 626 16,982 Mixed Use 62.3% 6.6% 18,036 - - 790 - 17,246 Self Storage 45.4% 4.4% 11,957 - - - - 11,957 College 47.4% 0.9% 2,495 - - - - 2,495 Auto Sales 58.7% 318.2% $ 864,603 $ 34,051 $ 62,396 $ 61,056 $ 261,290 $ 445,810 Total Non - Owner CRE

COMMERCIAL REAL ESTATE – OFFICE BUILDINGS 14 ($ in thousands) % of Total Bank RBC % of Office Portfolio Total Owner Occupied Non - Owner Occupied By Collateral Type 34.8% 40.6% $ 94,614 $ 13,805 $ 80,809 Office 45.1% 52.6% 122,689 20,795 101,894 Office - Medical 1.5% 1.7% 3,929 - 3,929 Office - Retail 2.1% 2.4% 5,610 2,111 3,499 Office – Mixed 2.4 % 2.7% 6,467 - 6,467 Office – Warehouse 85.9% 100.0% $ 233,309 $ 36,711 $ 196,598 Total Office Portfolio % of Total Bank RBC % of Office Portfolio Total Owner Occupied Non - Owner Occupied By State 40.6% 47.3% $ 110,242 $ 32,421 $ 77,821 Massachusetts 25.4% 29.6% 68,949 4,290 64,659 Connecticut 15.0% 17.5% 40,841 - 40,841 New Hampshire 4.9% 5.6% 13,277 - 13,277 Other 85.9% 100.0% $ 233,309 $ 36,711 $ 196,598 Total Office Portfolio % of Total Bank RBC % of Office Portfolio Total Owner Occupied Non - Owner Occupied By Risk Rating 85.2% 99.2% $ 231,521 $ 35,196 $ 196,325 Pass 0.5% 0.5% 1,165 1,085 80 Special Mention 0.2% 0.3% 623 430 193 Substandard 85.9% 100.0% $ 233,309 $ 36,711 $ 196,598 Total Office Portfolio • As of June 30 , 2024 , the total office CRE portfolio totaled $ 233 . 3 million, or 22 . 1 % of total CRE loans and 85 . 9 % of Total Bank RBC . • Non - owner occupied office totaled $ 196 . 6 million, or 84 . 3 % of the total office portfolio and owner - occupied office totaled $ 36 . 7 million, or 15 . 7 % of the total office portfolio . • Office exposure is concentrated in medical - office, totaling $ 122 . 7 million, or 52 . 6 % , of the office portfolio . • Of the $ 233 . 3 million in total office, 47 . 3 % is concentrated in Massachusetts and 29 . 6 % is concentrated in Connecticut . The Company does not have any exposure in greater Boston or New York . • Of the $ 233 . 3 million in total office, 99 . 2 % of the office portfolio is in the pass - rated category . • There is approximately $ 37 . 4 million, or 16 . 0 % of the total office portfolio, maturing by the end of 2026 .
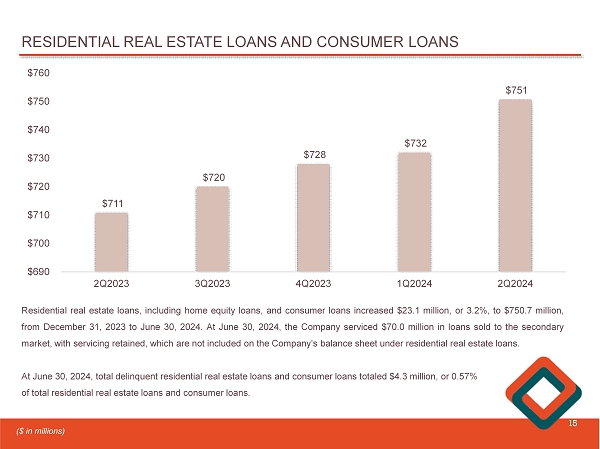
RESIDENTIAL REAL ESTATE LOANS AND CONSUMER LOANS 15 $711 $720 $728 $732 $751 2Q2023 3Q2023 4Q2023 1Q2024 2Q2024 $690 $700 $710 $720 $730 $740 $750 $760 Residential real estate loans , including home equity loans, and consumer loans increased $ 23 . 1 million , or 3 . 2 % , to $ 750 . 7 million, from December 31 , 2023 to June 30 , 2024 . At June 30 , 2024 , the Company serviced $ 70 . 0 million in loans sold to the secondary market, with servicing retained, which are not included on the Company’s balance sheet under residential real estate loans . At June 30 , 2024 , total delinquent residential real estate loans and consumer loans totaled $ 4 . 3 million, or 0 . 57 % of total residential real estate loans and consumer loans . ($ in millions)
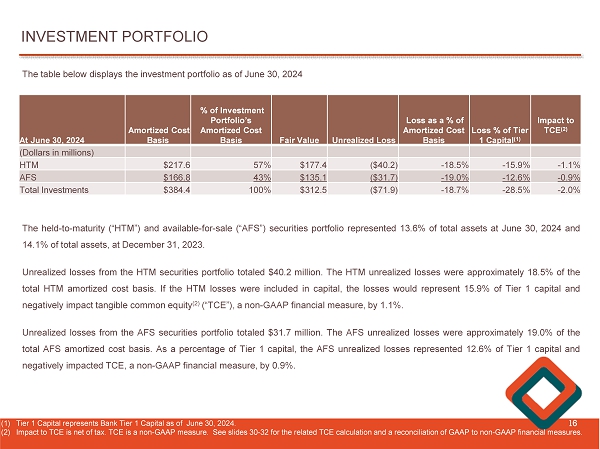
INVESTMENT PORTFOLIO 16 The held - to - maturity (“HTM”) and available - for - sale (“AFS”) securities portfolio represented 13 . 6 % of total assets at June 30 , 2024 and 14 . 1 % of total assets, at December 31 , 2023 . Unrealized losses from the HTM securities portfolio totaled $ 40 . 2 million . The HTM unrealized losses were approximately 18 . 5 % of the total HTM amortized cost basis . If the HTM losses were included in capital, the losses would represent 15 . 9 % of Tier 1 capital and negatively impact tangible common equity ( 2 ) (“TCE”), a non - GAAP financial measure, by 1 . 1 % . Unrealized losses from the AFS securities portfolio totaled $ 31 . 7 million . The AFS unrealized losses were approximately 19 . 0 % of the total AFS amortized cost basis . As a percentage of Tier 1 capital, the AFS unrealized losses represented 12 . 6 % of Tier 1 capital and negatively impacted TCE, a non - GAAP financial measure, by 0 . 9 % . (1) Tier 1 Capital represents Bank Tier 1 Capital as of June 30, 2024. (2) Impact to TCE is net of tax. TCE is a non - GAAP measure. See slides 30 - 32 for the related TCE calculation and a reconciliation of GAAP to non - GAAP financial measures . The table below displays the investment portfolio as of June 30 , 2024 Impact to TCE (2) Loss % of Tier 1 Capital (1) Loss as a % of Amortized Cost Basis Unrealized Loss Fair Value % of Investment Portfolio’s Amortized Cost Basis Amortized Cost Basis At June 30, 2024 (Dollars in millions) - 1.1% - 15.9% - 18.5% ($ 40.2) $ 177.4 57% $217.6 HTM - 0.9% - 12.6% - 19.0% ($31.7) $ 135.1 43% $ 166.8 AFS - 2.0% - 28.5% - 18.7% ($ 71.9) $ 312.5 100% $ 384.4 Total Investments
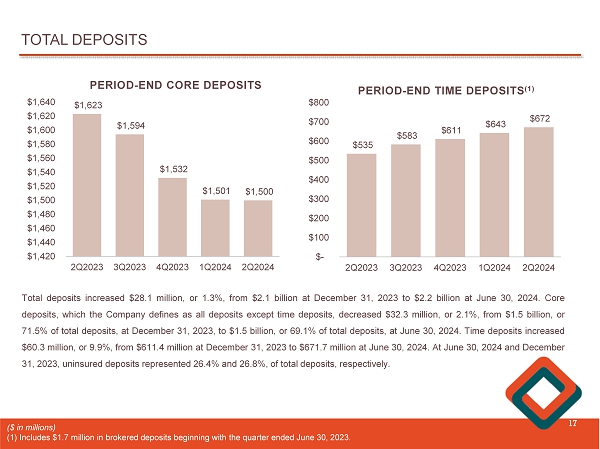
TOTAL DEPOSITS 17 $1,623 $1,594 $1,532 $1,501 $1,500 2Q2023 3Q2023 4Q2023 1Q2024 2Q2024 $1,420 $1,440 $1,460 $1,480 $1,500 $1,520 $1,540 $1,560 $1,580 $1,600 $1,620 $1,640 PERIOD - END CORE DEPOSITS Total deposits increased $ 28 . 1 million, or 1 . 3 % , from $ 2 . 1 billion at December 31 , 2023 to $ 2 . 2 billion at June 30 , 2024 . Core deposits, which the Company defines as all deposits except time deposits, decreased $ 32 . 3 million, or 2 . 1 % , from $ 1 . 5 billion, or 71 . 5 % of total deposits, at December 31 , 2023 , to $ 1 . 5 billion, or 69 . 1 % of total deposits, at June 30 , 2024 . Time deposits increased $ 60 . 3 million, or 9 . 9 % , from $ 611 . 4 million at December 31 , 2023 to $ 671 . 7 million at June 30 , 2024 . At June 30 , 2024 and December 31 , 2023 , uninsured deposits represented 26 . 4 % and 26 . 8 % , of total deposits, respectively . $535 $583 $611 $643 $672 2Q2023 3Q2023 4Q2023 1Q2024 2Q2024 $- $100 $200 $300 $400 $500 $600 $700 $800 PERIOD - END TIME DEPOSITS (1) ($ in millions) (1) Includes $1.7 million in brokered deposits beginning with the quarter ended June 30, 2023.
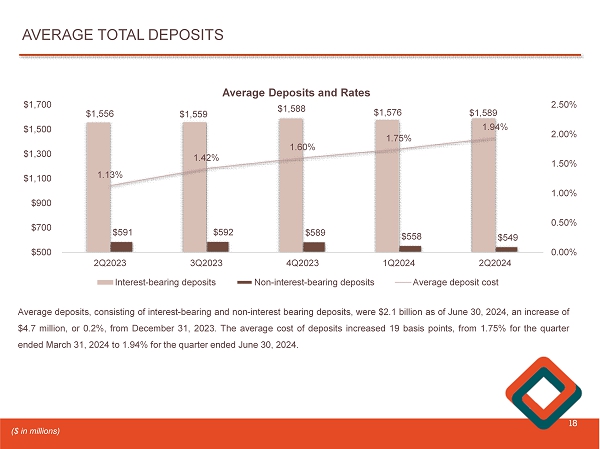
AVERAGE TOTAL DEPOSITS 18 $1,556 $1,559 $1,588 $1,576 $1,589 $591 $592 $589 $558 $549 1.13% 1.42% 1.60% 1.75% 1.94% 0.00% 0.50% 1.00% 1.50% 2.00% 2.50% 2Q2023 3Q2023 4Q2023 1Q2024 2Q2024 $500 $700 $900 $1,100 $1,300 $1,500 $1,700 Average Deposits and Rates Interest-bearing deposits Non-interest-bearing deposits Average deposit cost Average deposits, consisting of interest - bearing and non - interest bearing deposits, were $ 2 . 1 billion as of June 30 , 2024 , an increase of $ 4 . 7 million, or 0 . 2 % , from December 31 , 2023 . The average cost of deposits increased 19 basis points, from 1 . 75 % for the quarter ended March 31 , 2024 to 1 . 94 % for the quarter ended June 30 , 2024 . ($ in millions)
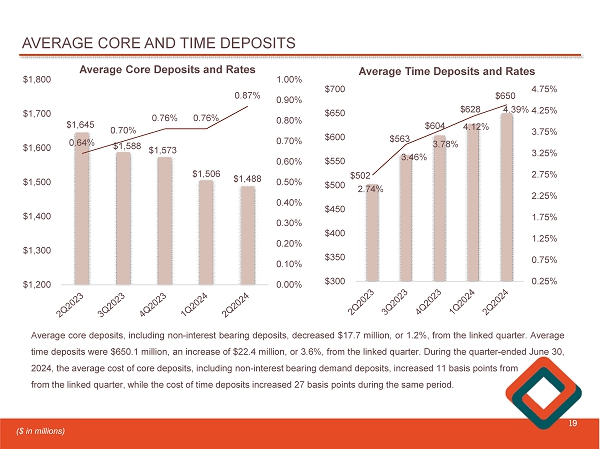
AVERAGE CORE AND TIME DEPOSITS 19 $1,645 $1,588 $1,573 $1,506 $1,488 0.64% 0.70% 0.76% 0.76% 0.87% 0.00% 0.10% 0.20% 0.30% 0.40% 0.50% 0.60% 0.70% 0.80% 0.90% 1.00% $1,200 $1,300 $1,400 $1,500 $1,600 $1,700 $1,800 Average Core Deposits and Rates Average core deposits, including non - interest bearing deposits, decreased $ 17 . 7 million, or 1 . 2 % , from the linked quarter . Average time deposits were $ 650 . 1 million, an increase of $ 22 . 4 million, or 3 . 6 % , from the linked quarter . During the quarter - ended June 30 , 2024 , the average cost of core deposits, including non - interest bearing demand deposits, increased 11 basis points from from the linked quarter, while the cost of time deposits increased 27 basis points during the same period . ($ in millions) $502 $563 $604 $628 $650 2.74% 3.46% 3.78% 4.12% 4.39% 0.25% 0.75% 1.25% 1.75% 2.25% 2.75% 3.25% 3.75% 4.25% 4.75% $300 $350 $400 $450 $500 $550 $600 $650 $700 Average Time Deposits and Rates
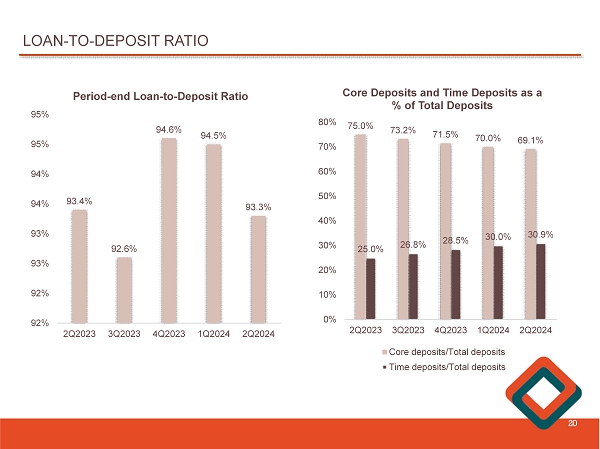
LOAN - TO - DEPOSIT RATIO 20 93.4% 92.6% 94.6% 94.5% 93.3% 2Q2023 3Q2023 4Q2023 1Q2024 2Q2024 92% 92% 93% 93% 94% 94% 95% 95% Period - end Loan - to - Deposit Ratio 75.0% 73.2% 71.5% 70.0% 69.1% 25.0% 26.8% 28.5% 30.0% 30.9% 2Q2023 3Q2023 4Q2023 1Q2024 2Q2024 0% 10% 20% 30% 40% 50% 60% 70% 80% Core Deposits and Time Deposits as a % of Total Deposits Core deposits/Total deposits Time deposits/Total deposits
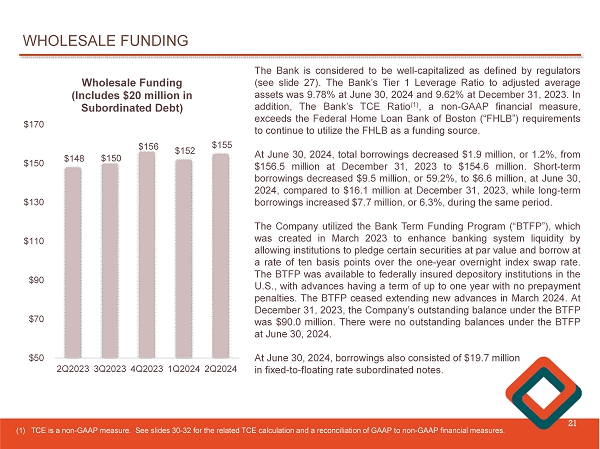
WHOLESALE FUNDING 21 $148 $150 $156 $152 $155 2Q2023 3Q2023 4Q2023 1Q2024 2Q2024 $50 $70 $90 $110 $130 $150 $170 Wholesale Funding (Includes $20 million in Subordinated Debt) The Bank is considered to be well - capitalized as defined by regulators ( see slide 27 ) . The Bank’s Tier 1 Leverage Ratio to adjusted average assets was 9 . 78 % at June 30 , 2024 and 9 . 62 % at December 31 , 2023 . In addition, The Bank’s TCE Ratio ( 1 ) , a non - GAAP financial measure, exceeds the Federal Home Loan Bank of Boston (“FHLB”) requirements to continue to utilize the FHLB as a funding source . At June 30 , 2024 , total borrowings decreased $ 1 . 9 million, or 1 . 2 % , from $ 156 . 5 million at December 31 , 2023 to $ 154 . 6 million . Short - term borrowings decreased $ 9 . 5 million, or 59 . 2 % , to $ 6 . 6 million , at June 30 , 2024 , compared to $ 16 . 1 million at December 31 , 2023 , while long - term borrowings increased $ 7 . 7 million, or 6 . 3 % , during the same period . The Company utilized the Bank Term Funding Program (“BTFP”), which was created in March 2023 to enhance banking system liquidity by allowing institutions to pledge certain securities at par value and borrow at a rate of ten basis points over the one - year overnight index swap rate . The BTFP was available to federally insured depository institutions in the U . S . , with advances having a term of up to one year with no prepayment penalties . The BTFP ceased extending new advances in March 2024 . At December 31 , 2023 , the Company’s outstanding balance under the BTFP was $ 90 . 0 million . There were no outstanding balances under the BTFP at June 30 , 2024 . At June 30 , 2024 , borrowings also consisted of $ 19 . 7 million in fixed - to - floating rate subordinated notes . (1) TCE is a non - GAAP measure. See slides 30 - 32 for the related TCE calculation and a reconciliation of GAAP to non - GAAP financial measures .
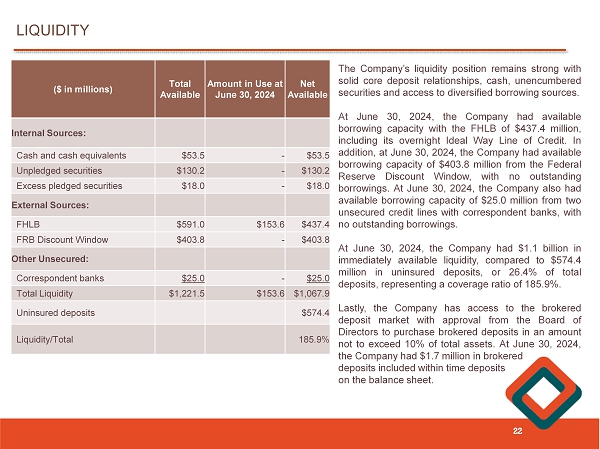
22 The Company’s liquidity position remains strong with solid core deposit relationships, cash, unencumbered securities and access to diversified borrowing sources . At June 30 , 2024 , the Company had available borrowing capacity with the FHLB of $ 437 . 4 million, including its overnight Ideal Way Line of Credit . In addition, at June 30 , 2024 , the Company had available borrowing capacity of $ 403 . 8 million from the Federal Reserve Discount Window, with no outstanding borrowings . At June 30 , 2024 , the Company also had available borrowing capacity of $ 25 . 0 million from two unsecured credit lines with correspondent banks, with no outstanding borrowings . At June 30 , 2024 , the Company had $ 1 . 1 billion in immediately available liquidity, compared to $ 574 . 4 million in uninsured deposits, or 26 . 4 % of total deposits, representing a coverage ratio of 185 . 9 % . Lastly, the Company has access to the brokered deposit market with approval from the Board of Directors to purchase brokered deposits in an amount not to exceed 10 % of total assets . At June 30 , 2024 , the Company had $ 1 . 7 million in brokered deposits included within time deposits on the balance sheet . LIQUIDITY Net Available Amount in Use at June 30, 2024 Total Available ($ in millions) Internal Sources: $53.5 - $53.5 Cash and cash equivalents $130.2 - $130.2 Unpledged securities $18.0 - $18.0 Excess pledged securities External Sources: $437.4 $153.6 $591.0 FHLB $403.8 - $403.8 FRB Discount Window Other Unsecured: $25.0 - $25.0 Correspondent banks $1,067.9 $153.6 $1,221.5 Total Liquidity $574.4 Uninsured deposits 185.9% Liquidity/Total

________ Source: SNL Financial as of June 30, 2023. Note: Total number of Westfield Bank branches shown includes the Big E seasonal branch and online deposit channel. Three Wes tfi eld branches are located in Hampshire County, MA and four Westfield branches are located in Hartford County, CT outside of Springfield MSA. DEPOSIT MARKET SHARE IN HAMPDEN COUNTY, MA AS OF JUNE 30, 2023 23 Total Deposit Rank 2023 Parent Company Name Deposits in Market ($000) Market Share # of Branches 1 PeoplesBank 2,271,591 16.96% 13 1,762,519 13.1% 20 3 Westfield Bank 1,878,809 14.03% 20 2 TD Bank 2,029,147 15.15 % 16 4 M&T Bank 1,143,383 8.54% 14 5 Berkshire Bank 1,142,092 8.53% 11 6 KeyBank 932,631 6.96% 7 7 Citizens Bank 557,490 4.16% 12 8 Monson Savings Bank 526,226 3.93% 4 9 Country Bank 514,307 3.84% 4 10 New Valley Bank & Trust 256,410 1.91% 3

ASSET QUALITY INDICATORS 24 2Q2024 1Q2024 4Q2023 3Q2023 2Q2023 $5.6M $4.7M $6.0M $5.6M $5.4M Total delinquent loans 0.27% 0.23% 0.30% 0.28% 0.27% Delinquent loans as a % of total loans $5.8M $5.8M $6.4M $6.3M $5.8M Nonperforming loans (NPL) 0.29% 0.29% 0.32% 0.31% 0.29% NPL as a % of total loans 0.23% 0.23% 0.25% 0.24% 0.22% NPL as a % of total assets 0.96% 0.98% 1.00% 0.99% 0.97% Allowance for credit losses % of total loans 333% 341% 316% 318% 341% Allowance for credit losses % of NPL $10K ($67K) $136K $78K ($25K) Net charge - offs (recoveries) 0.00% 0.00% 0.01% 0.00% 0.00% Net charge - offs (recoveries) as a % average loans 1Q2024 4Q2023 3Q2023 2Q2023 During the three months ended June 30 , 2024 , the Company recorded net charge - offs of $ 10 , 000 compared to net recoveries of $ 67 , 000 for the three months ended March 31 , 2024 . Nonperforming loans to total loans were 0 . 29 % at June 30 , 2024 compared to 0 . 32 % at December 31 , 2023 .
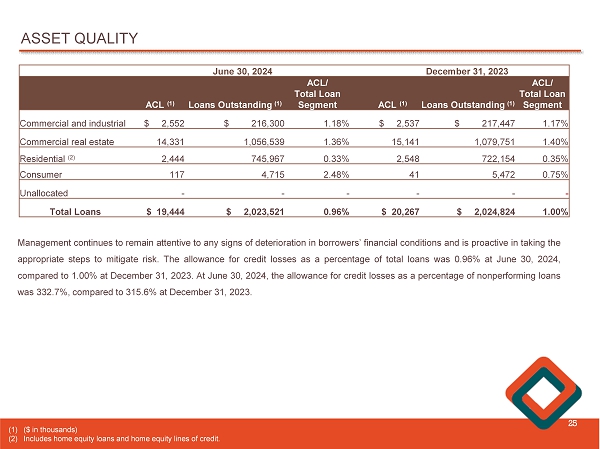
ASSET QUALITY 25 Management continues to remain attentive to any signs of deterioration in borrowers’ financial conditions and is proactive in taking the appropriate steps to mitigate risk . The allowance for credit losses as a percentage of total loans was 0 . 96 % at June 30 , 2024 , compared to 1 . 00 % at December 31 , 2023 . At June 30 , 2024 , the allowance for credit losses as a percentage of nonperforming loans was 332 . 7 % , compared to 315 . 6 % at December 31 , 2023 . December 31, 2023 June 30, 2024 ACL / Total Loan Segment Loans Outstanding (1) ACL (1) ACL / Total Loan Segment Loans Outstanding (1) ACL (1) 1.17% $ 217,447 $ 2,537 1.18% $ 216,300 $ 2,552 Commercial and industrial 1.40% 1,079,751 15,141 1.36% 1,056,539 14,331 Commercial real estate 0.35% 722,154 2,548 0.33% 745,967 2,444 Residential (2) 0.75% 5,472 41 2.48% 4,715 117 Consumer - - - - - - Unallocated 1.00% $ 2,024,824 $ 20,267 0.96% $ 2,023,521 $ 19,444 Total Loans (1) ( $ in thousands) (2) Includes home equity loans and home equity lines of credit .
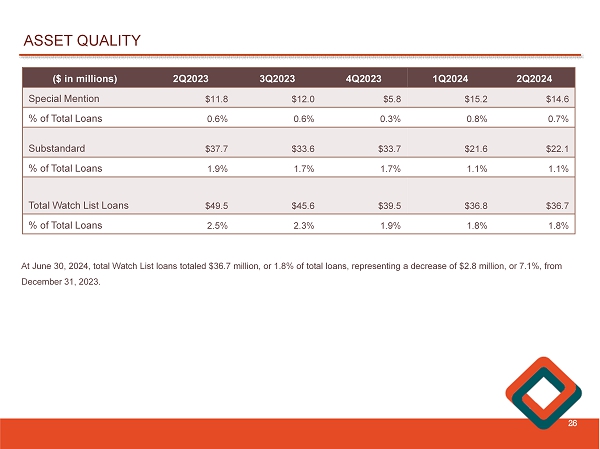
ASSET QUALITY 26 2Q2024 1Q2024 4Q2023 3Q2023 2Q2023 ($ in millions) $14.6 $15.2 $5.8 $12.0 $11.8 Special Mention 0.7% 0.8% 0.3% 0.6% 0.6% % of Total Loans $22.1 $21.6 $33.7 $33.6 $37.7 Substandard 1.1% 1.1% 1.7% 1.7% 1.9% % of Total Loans $36.7 $36.8 $39.5 $45.6 $49.5 Total Watch List Loans 1.8% 1.8% 1.9% 2.3% 2.5% % of Total Loans At June 30 , 2024 , total Watch List loans totaled $ 36 . 7 million, or 1 . 8 % of total loans, representing a decrease of $ 2 . 8 million , or 7 . 1 % , from December 31 , 2023 .
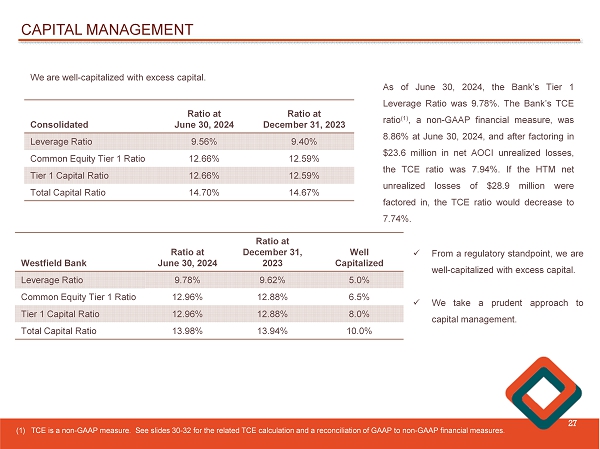
CAPITAL MANAGEMENT 27 We are well - capitalized with excess capital. Ratio at December 31, 2023 Ratio at June 30, 2024 Consolidated 9.40% 9.56% Leverage Ratio 12.59% 12.66% Common Equity Tier 1 Ratio 12.59% 12.66% Tier 1 Capital Ratio 14.67% 14.70% Total Capital Ratio As of June 30 , 2024 , the Bank’s Tier 1 Leverage Ratio was 9 . 78 % . The Bank’s TCE ratio ( 1 ) , a non - GAAP financial measure, was 8 . 86 % at June 30 , 2024 , and after factoring in $ 23 . 6 million in net AOCI unrealized losses, the TCE ratio was 7 . 94 % . If the HTM net unrealized losses of $ 28 . 9 million were factored in, the TCE ratio would decrease to 7 . 74 % . Well Capitalized Ratio at December 31, 2023 Ratio at June 30, 2024 Westfield Bank 5.0% 9.62% 9.78% Leverage Ratio 6.5% 12.88% 12.96% Common Equity Tier 1 Ratio 8.0% 12.88% 12.96% Tier 1 Capital Ratio 10.0% 13.94% 13.98% Total Capital Ratio (1) TCE is a non - GAAP measure. See slides 30 - 32 for the related TCE calculation and a reconciliation of GAAP to non - GAAP financial measures . x From a regulatory standpoint, we are well - capitalized with excess capital . x We take a prudent approach to capital management .
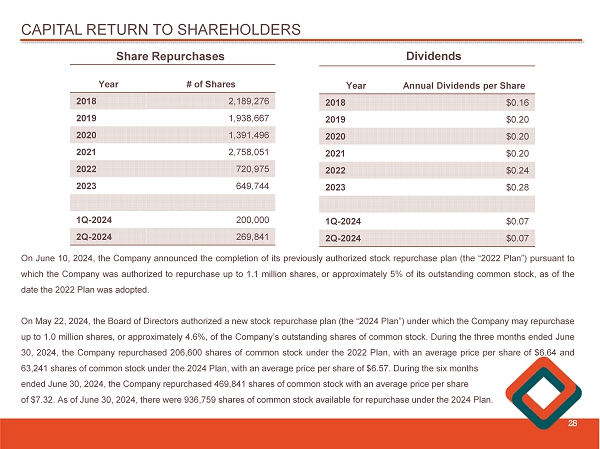
CAPITAL RETURN TO SHAREHOLDERS 28 # of Shares Year 2,189,276 2018 1,938,667 2019 1,391,496 2020 2,758,051 2021 720,975 2022 649,744 2023 200,000 1Q - 2024 269,841 2Q - 2024 Annual Dividends per Share Year $0.16 2018 $0.20 2019 $0.20 2020 $0.20 2021 $0.24 2022 $0.28 2023 $0.07 1Q - 2024 $0.07 2Q - 2024 Share Repurchases Dividends On June 10 , 2024 , the Company announced the completion of its previously authorized stock repurchase plan (the “ 2022 Plan”) pursuant to which the Company was authorized to repurchase up to 1 . 1 million shares, or approximately 5 % of its outstanding common stock, as of the date the 2022 Plan was adopted . On May 22 , 2024 , the Board of Directors authorized a new stock repurchase plan (the “ 2024 Plan”) under which the Company may repurchase up to 1 . 0 million shares, or approximately 4 . 6 % , of the Company’s outstanding shares of common stock . During the three months ended June 30 , 2024 , the Company repurchased 206 , 600 shares of common stock under the 2022 Plan, with an average price per share of $ 6 . 64 and 63 , 241 shares of common stock under the 2024 Plan, with an average price per share of $ 6 . 57 . During the six months ended June 30 , 2024 , the Company repurchased 469 , 841 shares of common stock with an average price per share of $ 7 . 32 . As of June 30 , 2024 , there were 936 , 759 shares of common stock available for repurchase under the 2024 Plan .
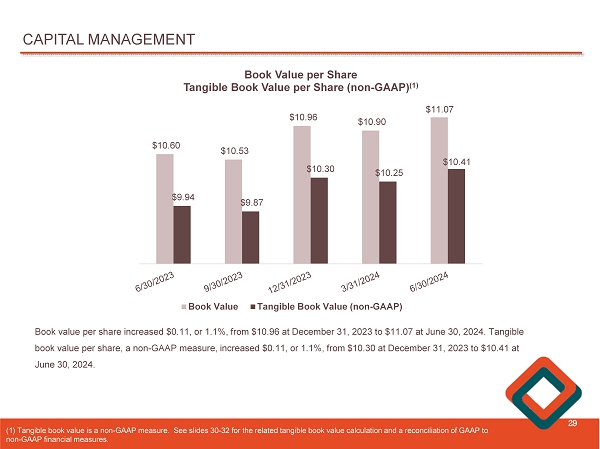
CAPITAL MANAGEMENT 29 $10.60 $10.53 $10.96 $10.90 $11.07 $9.94 $9.87 $10.30 $10.25 $10.41 Book Value per Share Tangible Book Value per Share (non - GAAP) (1) Book Value Tangible Book Value (non-GAAP) Book value per share increased $0.11, or 1.1%, from $10.96 at December 31, 2023 to $11.07 at June 30, 2024. Tangible book value per share, a non - GAAP measure, increased $0.11, or 1.1%, from $10.30 at December 31, 2023 to $10.41 at June 30, 2024. ( 1) Tangible book value is a non - GAAP measure. See slides 30 - 32 for the related tangible book value calculation and a reconcilia tion of GAAP to non - GAAP financial measures.
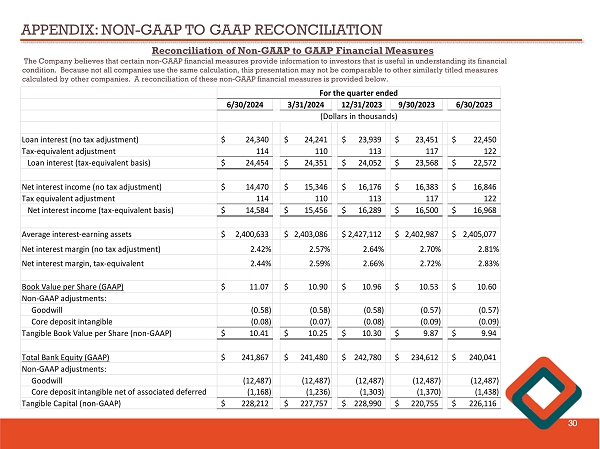
APPENDIX: NON - GAAP TO GAAP RECONCILIATION 30 Reconciliation of Non - GAAP to GAAP Financial Measures The Company believes that certain non - GAAP financial measures provide information to investors that is useful in understanding i ts financial condition. Because not all companies use the same calculation, this presentation may not be comparable to other similarly title d measures calculated by other companies. A reconciliation of these non - GAAP financial measures is provided below. 6/30/2024 3/31/2024 12/31/2023 9/30/2023 6/30/2023 Loan interest (no tax adjustment) 24,340$ 24,241$ 23,939$ 23,451$ 22,450$ Tax-equivalent adjustment 114 110 113 117 122 Loan interest (tax-equivalent basis) 24,454$ 24,351$ 24,052$ 23,568$ 22,572$ Net interest income (no tax adjustment) 14,470$ 15,346$ 16,176$ 16,383$ 16,846$ Tax equivalent adjustment 114 110 113 117 122 Net interest income (tax-equivalent basis) 14,584$ 15,456$ 16,289$ 16,500$ 16,968$ Average interest-earning assets 2,400,633$ 2,403,086$ 2,427,112$ 2,402,987$ 2,405,077$ Net interest margin (no tax adjustment) 2.42% 2.57% 2.64% 2.70% 2.81% Net interest margin, tax-equivalent 2.44% 2.59% 2.66% 2.72% 2.83% Book Value per Share (GAAP) 11.07$ 10.90$ 10.96$ 10.53$ 10.60$ Non-GAAP adjustments: Goodwill (0.58) (0.58) (0.58) (0.57) (0.57) Core deposit intangible (0.08) (0.07) (0.08) (0.09) (0.09) Tangible Book Value per Share (non-GAAP) 10.41$ 10.25$ 10.30$ 9.87$ 9.94$ Total Bank Equity (GAAP) 241,867$ 241,480$ 242,780$ 234,612$ 240,041$ Non-GAAP adjustments: Goodwill (12,487) (12,487) (12,487) (12,487) (12,487) Core deposit intangible net of associated deferred (1,168) (1,236) (1,303) (1,370) (1,438) Tangible Capital (non-GAAP) 228,212$ 227,757$ 228,990$ 220,755$ 226,116$ For the quarter ended (Dollars in thousands)
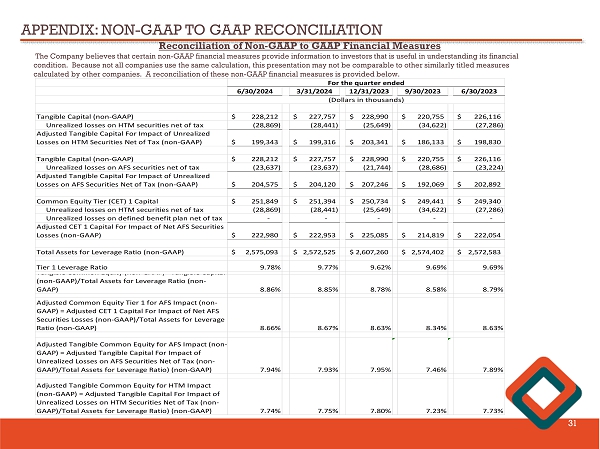
APPENDIX: NON - GAAP TO GAAP RECONCILIATION 31 Reconciliation of Non - GAAP to GAAP Financial Measures The Company believes that certain non - GAAP financial measures provide information to investors that is useful in understanding i ts financial condition. Because not all companies use the same calculation, this presentation may not be comparable to other similarly title d measures calculated by other companies. A reconciliation of these non - GAAP financial measures is provided below. 6/30/2024 3/31/2024 12/31/2023 9/30/2023 6/30/2023 Tangible Capital (non-GAAP) 228,212$ 227,757$ 228,990$ 220,755$ 226,116$ Unrealized losses on HTM securities net of tax (28,869) (28,441) (25,649) (34,622) (27,286) Adjusted Tangible Capital For Impact of Unrealized Losses on HTM Securities Net of Tax (non-GAAP) 199,343$ 199,316$ 203,341$ 186,133$ 198,830$ Tangible Capital (non-GAAP) 228,212$ 227,757$ 228,990$ 220,755$ 226,116$ Unrealized losses on AFS securities net of tax (23,637) (23,637) (21,744) (28,686) (23,224) Adjusted Tangible Capital For Impact of Unrealized Losses on AFS Securities Net of Tax (non-GAAP) 204,575$ 204,120$ 207,246$ 192,069$ 202,892$ Common Equity Tier (CET) 1 Capital 251,849$ 251,394$ 250,734$ 249,441$ 249,340$ Unrealized losses on HTM securities net of tax (28,869) (28,441) (25,649) (34,622) (27,286) Unrealized losses on defined benefit plan net of tax - - - - - Adjusted CET 1 Capital For Impact of Net AFS Securities Losses (non-GAAP) 222,980$ 222,953$ 225,085$ 214,819$ 222,054$ Total Assets for Leverage Ratio (non-GAAP) 2,575,093$ 2,572,525$ 2,607,260$ 2,574,402$ 2,572,583$ Tier 1 Leverage Ratio 9.78% 9.77% 9.62% 9.69% 9.69% Tangible Common Equity (non-GAAP) =Tangible Capital (non-GAAP)/Total Assets for Leverage Ratio (non- GAAP) 8.86% 8.85% 8.78% 8.58% 8.79% Adjusted Common Equity Tier 1 for AFS Impact (non- GAAP) = Adjusted CET 1 Capital For Impact of Net AFS Securities Losses (non-GAAP)/Total Assets for Leverage Ratio (non-GAAP) 8.66% 8.67% 8.63% 8.34% 8.63% Adjusted Tangible Common Equity for AFS Impact (non- GAAP) = Adjusted Tangible Capital For Impact of Unrealized Losses on AFS Securities Net of Tax (non- GAAP)/Total Assets for Leverage Ratio) (non-GAAP) 7.94% 7.93% 7.95% 7.46% 7.89% Adjusted Tangible Common Equity for HTM Impact (non-GAAP) = Adjusted Tangible Capital For Impact of Unrealized Losses on HTM Securities Net of Tax (non- GAAP)/Total Assets for Leverage Ratio) (non-GAAP) 7.74% 7.75% 7.80% 7.23% 7.73% For the quarter ended (Dollars in thousands)
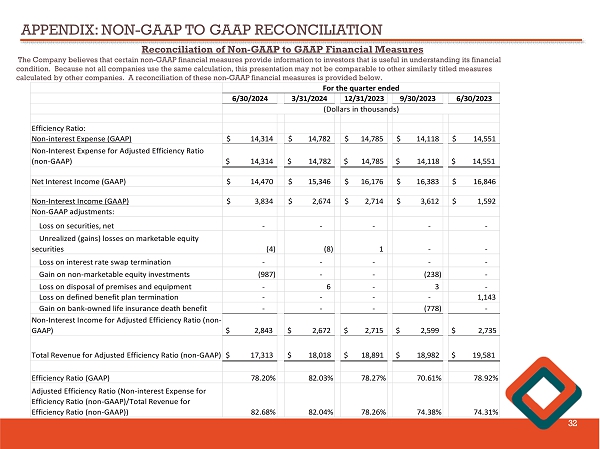
APPENDIX: NON - GAAP TO GAAP RECONCILIATION 32 Reconciliation of Non - GAAP to GAAP Financial Measures The Company believes that certain non - GAAP financial measures provide information to investors that is useful in understanding i ts financial condition. Because not all companies use the same calculation, this presentation may not be comparable to other similarly title d measures calculated by other companies. A reconciliation of these non - GAAP financial measures is provided below. 6/30/2024 3/31/2024 12/31/2023 9/30/2023 6/30/2023 Efficiency Ratio: Non-interest Expense (GAAP) 14,314$ 14,782$ 14,785$ 14,118$ 14,551$ Non-Interest Expense for Adjusted Efficiency Ratio (non-GAAP) $ 14,314 $ 14,782 $ 14,785 $ 14,118 $ 14,551 Net Interest Income (GAAP) 14,470$ 15,346$ 16,176$ 16,383$ 16,846$ Non-Interest Income (GAAP) 3,834$ 2,674$ 2,714$ 3,612$ 1,592$ Non-GAAP adjustments: Loss on securities, net - - - - - Unrealized (gains) losses on marketable equity securities (4) (8) 1 - - Loss on interest rate swap termination - - - - - Gain on non-marketable equity investments (987) - - (238) - Loss on disposal of premises and equipment - 6 - 3 - Loss on defined benefit plan termination - - - - 1,143 Gain on bank-owned life insurance death benefit - - - (778) - Non-Interest Income for Adjusted Efficiency Ratio (non- GAAP) $ 2,843 $ 2,672 $ 2,715 $ 2,599 $ 2,735 Total Revenue for Adjusted Efficiency Ratio (non-GAAP) $ 17,313 $ 18,018 $ 18,891 $ 18,982 $ 19,581 Efficiency Ratio (GAAP) 78.20% 82.03% 78.27% 70.61% 78.92% Adjusted Efficiency Ratio (Non-interest Expense for Efficiency Ratio (non-GAAP)/Total Revenue for Efficiency Ratio (non-GAAP)) 82.68% 82.04% 78.26% 74.38% 74.31% For the quarter ended (Dollars in thousands)

WESTFIELD BANK “WHAT BETTER BANKING’S ALL ABOUT” James C. Hagan , President and Chief Executive Officer Guida R. Sajdak , Executive Vice President and Chief Financial Officer Meghan Hibner , First Vice President and Investor Relations Officer 33 141 Elm Street, Westfield, MA