Filed Pursuant to Rule 424(b)(4)
Reg. No. 333-128744
PROSPECTUS
1,000,000 Shares
CAROLINA NATIONAL CORPORATION
 ™ ™ |
Common Stock
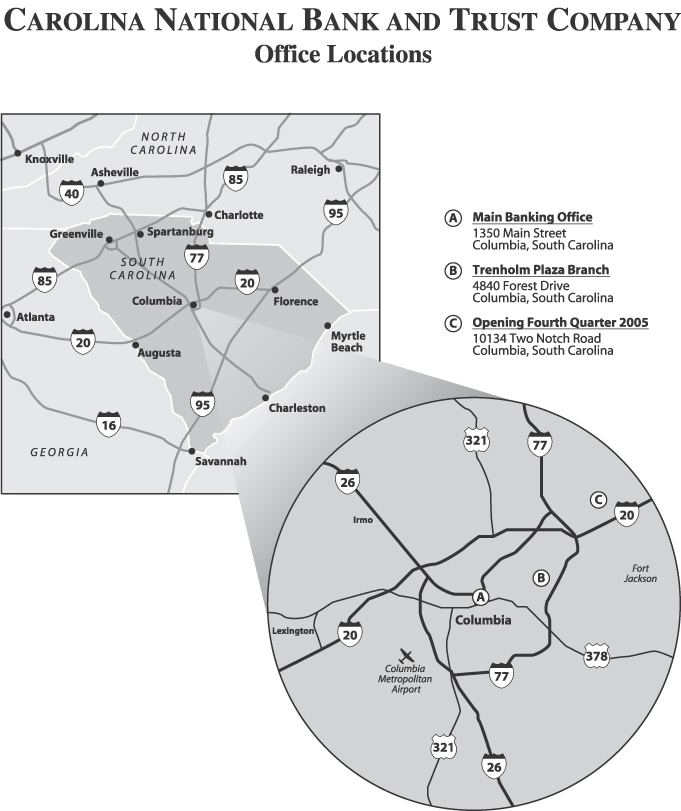
Carolina National Corporation is the holding company for Carolina National Bank and Trust Company, a commercial bank headquartered in Columbia, South Carolina.
We are offering 1,000,000 shares of common stock.
Prior to the offering, there has been only limited trading in our common stock and no established market for our common stock has existed. Following the offering, we anticipate that our common stock will be listed on the Nasdaq Capital Market under the symbol “CNCP.”
Investing in our common stock involves risks. See“Risk Factors” beginning on page 6 to read about factors you should consider before buying shares of our common stock.
Neither the Securities and Exchange Commission nor any state securities commission has approved or disapproved of these securities or passed upon the accuracy or adequacy of this prospectus. Any representation to the contrary is a criminal offense.
The shares of common stock we are offering are not deposits or savings accounts and are not insured or guaranteed by the Federal Deposit Insurance Corporation or any other government agency.
| Per Share | Total | |||||
Price to public | $ | 16.00 | $ | 16,000,000 | ||
Underwriting discount (1) | $ | 1.04 | $ | 952,500 | ||
Proceeds, before expenses, to Carolina National Corporation (1) | $ | 14.96 | $ | 15,047,500 | ||
| (1) | The underwriter has agreed that the underwriting discount will be $0.48 per share for up to 156,250 shares that may be purchased by our directors and executive officers. The total underwriting discount and total proceeds of the offering assume the purchase of 156,250 shares by these persons. |
This is a firm commitment underwriting. We have granted Scott & Stringfellow, Inc. a 30-day option to purchase up to 150,000 additional shares from us at the public offering price, less the underwriter’s discount, to cover over-allotments.
Scott & Stringfellow, Inc. expects to deliver the shares to purchasers on December 20, 2005.
Scott & Stringfellow, Inc.
This prospectus is dated December 15, 2005
In connection with this offering, the underwriter may over-allot or effect transactions which stabilize or maintain the market price of our common stock at levels above those which might otherwise exist in the open market. If the underwriter commences stabilizing activities, it may discontinue them at any time.
This summary highlights selected information about us and the offering that is contained elsewhere in this prospectus. The summary does not contain all the information that you should consider before investing in our common stock. You should read this summary together with the entire prospectus. Except as otherwise indicated by the context, references in this prospectus to the “company” refer to Carolina National Corporation and references to “our bank” or “the bank” refer to the company’s subsidiary, Carolina National Bank and Trust Company. References to “we,” “our” or “us” are to the combined business of the company and the bank.
Carolina National Corporation
Carolina National Corporation is a bank holding company headquartered in Columbia, South Carolina. The company’s wholly owned subsidiary, Carolina National Bank and Trust Company, commenced operations as a national bank on July 15, 2002 and currently operates two full service banking offices and a loan production office serving the Greater Columbia market area. We plan to open an additional full service banking office, which will be located at the corner of Two Notch Road and Sparkleberry Lane in Northeast Columbia, before the end of 2005. Our bank engages in a general commercial banking business with a particular focus on the needs of small to medium-sized businesses, their principals and professionals.
We have experienced significant growth in assets and deposits and an improvement in income during our three years of operation. We experienced our first quarter of positive earnings in the last quarter of 2004 and have had positive earnings for all of the first three quarters of 2005. As of September 30, 2005, we had assets of $151.2 million, representing a 61.9% increase from September 30, 2004. Total loans outstanding as of September 30, 2005 amounted to $128.7 million, an improvement of 60.9% from September 30, 2004. Our deposits were $135.2 million at September 30, 2005, an increase of 65.3% from September 30, 2004. For the nine months ended September 30, 2005, our net income was $399,896, compared to a loss of $454,192 for the nine months ended September 30, 2004. Earnings per basic share for the same period increased to $.28 from a loss of $.32 for the prior nine-month period.
As of December 31, 2004, we had assets of $98.5 million, representing a 56.8% increase from December 31, 2003. Total loans outstanding as of December 31, 2004 amounted to $90.3 million, an improvement of 64.4% from December 31, 2003. Our deposits were $86.1 million at December 31, 2004, an increase of 70.0% from December 31, 2003. For the year ended December 31, 2004, we had a net loss of $432,770, compared to a loss of $1.2 million for the year ended December 31, 2003. Our loss per basic share for the same period decreased to $0.30 from a loss of $0.85 for the prior twelve-month period.
Management Team
Our bank’s senior management team consists of six officers that average over 21 years of experience in the banking industry. These officers received much of their industry training at both large regional financial institutions as well as with community banks and other financial institutions. They have experience managing loan portfolios much larger than Carolina National’s current loan portfolio as well as building out and managing retail branch networks and developing operational infrastructures and asset and liability management policies.
The table below identifies our key managers.
Name | Position | Years Experience | ||
Roger Whaley | Chief Executive Officer | 34 | ||
Rollo Ingram | Chief Financial Officer | 35 | ||
Jack McElveen | Senior Credit Officer | 21 | ||
Beau Long | Commercial Bank Executive | 11 | ||
Mary Ellis Gabriel | Consumer Bank Executive | 11 | ||
Kathy Morales | Vice President - Operations | 19 |
1
The Columbia Market
Columbia is South Carolina’s capital city, the largest city in the state and the county seat of Richland County. Richland County and adjoining Lexington County are our primary target markets for the next few years. South Carolina is located in the southern region of the United States, which is one of the fastest growing areas in the country. From 1998 to 2003, the combined estimated population of Richland and Lexington counties grew 9.5% to 558,275 and continued growth is expected for the foreseeable future. Per capita income in Richland County was $26,144 in 2003, a 13.7% increase from 1998. Per capita income in Lexington County was $30,048 in 2003, a 20.3% increase from 1998. FDIC insured deposits in the combined counties increased by 45.2% to $7.3 billion from 1998 to 2003.
Columbia is geographically positioned in the center of South Carolina and serves as its economic hub. The city is located approximately midway between the industrialized Upstate region of South Carolina and the bustling coastal city of Charleston. Charleston, which is the busiest container shipping port along the Southeast and Gulf coasts, provides ready access to international markets. Columbia’s strategic location and interstate highway networks have contributed greatly to its overall commercial growth, particularly warehousing and distribution. Three major interstate highways serve Columbia (I-20, I-77 and I-26), directly connecting Columbia to Charlotte, Atlanta, Greenville and Charleston and providing access to other important centers of commercial activity.
The Columbia area has a diverse and relatively stable economy. Major employment sectors include health care, finance and insurance, retail, services, public administration and manufacturing. Major private sector employers in the region include Palmetto Health Alliance, Blue Cross and Blue Shield of South Carolina, Wal-Mart, Lexington Medical Center, SCANA Corporation, Providence Hospital and Michelin Tire Corporation At the other end of the employment scale, in 2003 Lexington and Richland counties had a combined total of 14,063 businesses with fewer than 100 employees, which represents our primary targeted market.
Columbia, as the capital city of the state, is the center of government on city, county, state and federal levels. Government exercises a substantial stabilizing influence on the area economy as a purchaser, service provider and employer. Federal, state and local governments are the area’s largest employers. Established in World War I, Fort Jackson is the largest and most active Initial Entry Training Center of the United States Army. Recent decisions of the Federal Base Realignment and Closure Commission may result in an expansion of programs and employment at Fort Jackson. There are eight institutions of higher education in the Columbia area with an aggregate enrollment in excess of 40,000 students, including the University of South Carolina which has the state’s largest number of enrollees in higher education with over 25,000 students. (For more information about the Columbia market and the sources of the information, see “Description of Business – Market Area” beginning on page 37.)
Growth Strategy
We provide personalized banking services to satisfy the needs of our customers, while investing our funds in accordance with sound banking practices and striving to earn the maximum profit for shareholders. Our growth strategy has the following components:
| • | Expand our branch network. We intend to expand our footprint by establishing new branches or acquiring existing branches from other financial institutions that present attractive growth opportunities within the Greater Columbia market. We have received approval from the Office of the Comptroller of the Currency to open a third full service branch by the end of 2005 and plan to open four other new branches over the next two to three years. |
We believe that with the increased demand for banking services arising from steady growth in population and personal income, the banking market will continue to grow in Columbia. Our growth demonstrates that there is a market for a locally owned and managed bank to serve the needs of the community, including individuals and small and medium-sized business enterprises. We concentrate on
2
this hometown market with a professional staff that is responsive to local needs and believe we are well positioned to take full advantage of the demographic and economic characteristics of our market area. Our existing and planned new branches should provide us with the core deposit growth needed to support continued asset and loan growth resulting from our planned hiring of additional loan officers.
| • | Continue our successful recruiting practices. We have taken a two-pronged approach to recruiting our commercial bankers. First, we have hired highly experienced local banking professionals with successful track records and established customer relationships. We currently have four seasoned commercial loan officers with an average of over 20 years of experience in the financial services industry. Our plan calls for the hiring of three additional seasoned in-market commercial bankers by the end of 2006 to support loan growth as we expand our footprint. Second, we have hired five high caliber college graduates and have trained them to be our future leaders. Two of them have become commercial loan producers. Two others have assumed staff support roles and another is being trained to become a branch manager. We plan to hire two college graduates each year as we continue to develop our future banking professionals internally. |
We provide personalized banking services, with emphasis on knowledge of the individual financial needs and objectives of our customers and an appropriate array of services to meet those needs and objectives, coupled with timely response. We seek to promote continuous long-term relationships between officers and customers by minimizing transfers of account officers to different customers, departments or locations. We seek to manage the number of accounts served by each officer in a manner that will permit personal attention to each customer and full development of each customer’s business relationship with us. Because our management is located in Columbia, all credit and related decisions are made locally, which facilitates prompt response.
| • | Capitalize on the continued bank consolidation in our market. A considerable amount of consolidation among financial institutions has occurred in South Carolina over the past decade. Many independent community banks have been acquired by larger regional institutions that are headquartered outside the state. We believe this consolidation creates an opportunity for us to increase our market share of deposits as well as attract disenchanted customers seeking the more personalized service that a local community bank can offer.One of our primary objectives is to provide citizens and small and medium-sized businesses of Greater Columbia with more opportunity to have their banking needs met locally. Our directors live in and are involved extensively in business in the Greater Columbia market area and we have made meeting the credit needs of this area a first priority. We believe that a large number of potential bank customers will prefer our local bank which can make credit decisions locally and quickly, and that this preference should result in a successful and profitable operation for us. |
| • | Expand our lending activities while maintaining excellent asset quality. We are undertaking our branch expansion strategy to build a stable and growing base of “core” deposits to help fund our loan growth. With an increased legal lending limit as a result of this offering and broadened deposit base we plan to aggressively grow our loan portfolio while maintaining superior asset quality through conservative underwriting practices. We do not expect there to be any material changes to the fundamental composition of our loan portfolio or to its overall credit quality. Since inception we have had minimal charge-offs and have never had a loan more than 30 days past due at any reporting period end. While we believe this exceptional record illustrates the quality of our loan portfolio, it is not necessarily indicative of the results that may be expected in the future. Like other lending institutions, we expect to have past due loans and loan charge-offs. |
3
The Offering
Shares Offered | 1,000,000 shares of common stock. | |
Offering Price | $16.00 per share. | |
Shares Outstanding After the Offering | 2,427,303 shares. | |
Use of Proceeds | We intend to use the proceeds of the offering for general corporate purposes, including:
• repayment of indebtedness;
• contribution to our bank’s capital, which will enable it to maintain its status as a “well capitalized” institution as our assets increase;
• pursuit of future growth opportunities through further expansion of our existing lending and investment activities;
• opening of a new branch office in Northeast Columbia during 2005; and further branch expansion in the next few years. See “Use of Proceeds” at page 11. | |
Dividend Policy | To date, we have not paid any cash dividends on our common stock. We do not expect that we will pay cash dividends in the foreseeable future. See “Market for Common Stock and Dividends” at page 11. | |
Nasdaq Capital Market symbol | Following the offering, we anticipate that our common stock will be listed on the Nasdaq Capital Market under the symbol “CNCP.” | |
Risk Factors | Investing in our common stock involves investment risks. You should carefully review the information contained under “Risk Factors” beginning at page 6 before deciding to purchase shares of our common stock. | |
The number of shares of our common stock outstanding after this offering is based on the number of shares outstanding on September 30, 2005, and excludes 300,856 shares of common stock issuable upon exercise of warrants and stock options outstanding on September 30, 2005, of which 251,435 were exercisable.
Except as otherwise indicated, all information in this prospectus assumes no exercise of the underwriter’s over-allotment option.
We were founded as a South Carolina corporation in May 2000 for the sole purpose of becoming a holding company for Carolina National Bank and Trust Company, our wholly owned subsidiary, which began operating as a national bank on July 15, 2002.
Our principal executive offices are located at 1350 Main Street, Columbia, South Carolina 29201. Our telephone number is (803) 779-0411.
4
Summary Consolidated Financial Data
The following table provides summary consolidated financial data for Carolina National Corporation. The financial data for each of the years ended December 31, 2004, 2003 and part of 2002 is derived from our consolidated financial statements. The financial data for the nine months ended September 30, 2005 and 2004 is derived from our unaudited consolidated financial statements. Operating results for the nine months ended September 30, 2005 are not necessarily indicative of the results that may be expected for the year ended December 31, 2005. You should read this summary consolidated financial data in conjunction with “Management’s Discussion and Analysis of Financial Condition and Results of Operations” beginning on page 14, and our financial statements, including the accompanying notes, and other financial data, included elsewhere in this prospectus.
| Nine Months Ended September 30,(1) | Years Ended December 31, | From Inception (July 15, 2002) through December 31, | ||||||||||||||||||
| 2005 | 2004 | 2004 | 2003 | 2002 | ||||||||||||||||
| (Dollars in thousands, except per share data) | ||||||||||||||||||||
Period Ending Balances: | ||||||||||||||||||||
Total assets | $ | 151,150 | $ | 93,339 | $ | 98,505 | $ | 62,810 | $ | 32,810 | ||||||||||
Total loans (2) | 128,725 | 79,982 | 90,304 | 54,931 | 10,145 | |||||||||||||||
Total deposits | 135,207 | 81,798 | 86,094 | 50,646 | 20,152 | |||||||||||||||
Stockholders’ equity | 11,332 | 10,912 | 10,925 | 11,383 | 12,594 | |||||||||||||||
Results of operations: | ||||||||||||||||||||
Total interest income | $ | 5,466 | $ | 2,663 | $ | 3,926 | $ | 1,686 | $ | 316 | ||||||||||
Total interest expense | 1,951 | 832 | 1,206 | 511 | 164 | |||||||||||||||
Net interest income | 3,515 | 1,830 | 2,720 | 1,176 | 152 | |||||||||||||||
Provision for loan losses | 448 | 375 | 506 | 676 | 152 | |||||||||||||||
Net interest income after provision for loan losses | 3,067 | 1,456 | 2,214 | 499 | — | |||||||||||||||
Noninterest income | 271 | 208 | 273 | 305 | 151 | |||||||||||||||
Noninterest expense | 2,722 | 2,358 | 3,148 | 2,631 | 1,503 | |||||||||||||||
Income (loss) before income taxes | 616 | (695 | ) | (661 | ) | (1,827 | ) | (1,352 | ) | |||||||||||
Net income (loss) | 400 | (454 | ) | (433 | ) | (1,211 | ) | (633 | ) | |||||||||||
Per share data: | ||||||||||||||||||||
Net income (loss), basic | $ | 0.28 | $ | (0.32 | ) | $ | (0.30 | ) | $ | (0.85 | ) | $ | (0.91 | ) | ||||||
Net income (loss), diluted (3) | 0.27 | (0.32 | ) | (0.30 | ) | (0.85 | ) | (0.91 | ) | |||||||||||
Book value, basic | 7.94 | 7.65 | 7.65 | 7.98 | 8.82 | |||||||||||||||
Shares outstanding, basic | 1,427 | 1,427 | 1,427 | 1,427 | 1,427 | |||||||||||||||
Shares outstanding, diluted (3) | 1,502 | 1,455 | 1,455 | 1,455 | 1,440 | |||||||||||||||
Asset Quality Ratios: | ||||||||||||||||||||
Allowance for loan losses to loans | 1.38 | % | 1.50 | % | 1.47 | % | 1.50 | % | 1.50 | % | ||||||||||
Nonperforming loans to loans | 0.00 | % | 0.00 | % | 0.00 | % | 0.00 | % | 0.00 | % | ||||||||||
Allowance for loan losses to nonperforming loans | N/A | N/A | N/A | N/A | N/A | |||||||||||||||
Net loan charge offs to average loans | 0.00 | % | 0.00 | % | 0.00 | % | 0.00 | % | 0.00 | % | ||||||||||
Selected Ratios: | ||||||||||||||||||||
Tier 1 risk-based capital ratio (4) | 7.84 | % | 7.82 | % | 7.07 | % | 12.99 | % | 41.93 | % | ||||||||||
Total risk-based capital ratio (4) | 9.06 | % | 10.27 | % | 10.37 | % | 14.24 | % | 42.82 | % | ||||||||||
Tier 1 leverage ratio (4) | 7.81 | % | 8.29 | % | 6.88 | % | 14.33 | % | 23.18 | % | ||||||||||
Efficiency ratio (5) | 71.89 | % | 115.72 | % | 105.21 | % | 177.87 | % | 496.23 | % | ||||||||||
Equity to assets | 7.50 | % | 11.69 | % | 11.09 | % | 18.12 | % | 38.38 | % | ||||||||||
Return on average total assets (6) | 0.43 | % | (0.78 | %) | (0.51 | %) | (2.81 | %) | (2.38 | %) | ||||||||||
Return on average stockholders’ equity (6) | 5.62 | % | (5.43 | %) | (3.98 | %) | (10.19 | %) | (5.35 | %) | ||||||||||
Net interest margin (6) | 3.95 | % | 3.21 | % | 3.34 | % | 2.86 | % | 0.54 | % | ||||||||||
| (1) | Unaudited. |
| (2) | Loans are stated at gross amounts before allowance for loan losses. |
| (3) | Diluted shares outstanding assume that all exercisable options and warrants are exercised at the end of the period and accounted for by the treasury stock method. |
| (4) | Ratios for dates other than September 30, 2005 are for our bank because the Federal Reserve uses subsidiary bank ratios for bank holding companies with less than $150 million in consolidated assets. At September 30, 2005, our consolidated assets exceeded $150 million and the capital ratios at that date are calculated according to the Federal Reserve guidelines. |
| (5) | We compute our efficiency ratio by dividing noninterest expense by the sum of net interest income and noninterest income. Comparison of our efficiency ratio with those of other companies may not be possible, because other companies may calculate the efficiency ratio differently. |
| (6) | Selected ratios for periods less than one year have been annualized. |
5
Investment in our common stock involves a significant degree of risk. Before you decide to purchase our common stock, you should consider the risks and speculative features that are inherent in and affect our business. You should only make an investment after careful consideration of the risk factors set forth below. You should not invest in our stock unless you can afford an investment involving such risks.
Risks Related to Our Business
We have a limited operating history, and as a result our financial performance to date may not be a reliable indicator of whether our business strategy will be successful.
We did not commence operations until July 2002, and therefore have a limited historical basis upon which to rely for gauging our business performance. Our prospects are subject to the risks and uncertainties frequently encountered by companies in their early stages of development, including the risk that we will not be able to successfully implement our business plan. Accordingly, our financial performance to date may not be representative of our long-term future performance or indicative of whether our business strategy will be successful.
Our growth strategy may not be successful.
We have plans to maintain our asset and deposit growth through the opening of additional branch locations and the hiring of additional bankers. We may not be successful in identifying or obtaining suitable new branch locations or receiving regulatory approval for them, or employing and retaining suitable bankers, on terms that we can afford and that are attractive to us. Even if we successfully open additional branch locations and hire additional bankers, we may not achieve the asset and deposit growth that we seek because of competition or poor economic conditions, or for other reasons.
Our growth strategy will reduce our earnings in the near term.
We expect each new office we open to take several years to become profitable and we cannot guarantee that any new office will ever become profitable. We expect that by having a number of new offices our ability to operate at higher levels of profitability will be impeded until most of our offices can operate at substantial levels of profitability.
Our growth strategy will require future increases in capital that we may not be able to accomplish.
We are required by banking regulators to maintain various ratios of capital to assets. As our assets grow we expect our capital ratios to decline unless we can increase our earnings or raise new capital sufficiently to keep pace with asset growth. If we are unable to limit a capital ratio decline by increasing our capital, we will have to restrict our asset growth as we approach the minimum required capital to asset ratios.
We may be unable to successfully manage our sustained growth using the net proceeds from this offering.
We have grown substantially since we began operating. Although we may not continue to grow as fast as we have in the past, we intend to expand our asset base. In particular, we intend to use the funds raised in this offering to support anticipated increases in our loans. Additional capital also would increase our legal lending limit under federal law, which in turn would allow us to compete more actively in our market area for larger loans. Our future profitability will depend in part on our ability to manage growth successfully. Our ability to manage growth successfully will depend on our ability to maintain cost controls and asset quality while attracting
6
additional loans and deposits, as well as on factors beyond our control, such as economic conditions and interest rate trends. If we grow too quickly and are not able to control costs and maintain asset quality, growth could materially adversely affect our financial performance.
We depend on the services of a number of key personnel, and a loss of any of those personnel could disrupt our operations and result in reduced revenues.
We are a relationship-driven organization. Our growth and development to date have depended in large part on the efforts of our senior management team. These senior officers have primary contact with our customers and are extremely important in maintaining personalized relationships with our customer base, which are key aspects of our business strategy, and in increasing our market presence. The unexpected loss of services of one or more of these key employees could have a material adverse effect on our operations and possibly result in reduced revenues if we were unable to find suitable replacements promptly.
If our loan customers do not pay us as they have contracted to, we may experience losses.
Our principal revenue producing business is making loans. If our customers do not repay the loans, we will suffer losses. Even though we maintain an allowance for loan losses, the amount of the allowance may not be adequate to cover the losses we experience. We attempt to mitigate this risk by a thorough review of the creditworthiness of loan customers. Nevertheless, there is risk that our credit evaluations will prove to be inaccurate due to changed circumstances or otherwise.
Our business is concentrated in Greater Columbia, and a downturn in the economy of the Columbia area, a decline in Columbia area real estate values or other events in our market area may adversely affect our business.
Substantially all of our business is located in the Greater Columbia area. As a result, our financial condition and results of operations may be affected by changes in the Columbia economy. A prolonged period of economic recession, a general decline in Columbia area real estate values or other adverse economic conditions in Columbia and South Carolina may result in decreases in demand for our services, increases in nonpayment of loans and decreases in the value of collateral securing loans, which could have a material adverse effect on our business, future prospects, financial condition or results of operations.
We face strong competition from larger, more established competitors which may adversely affect our ability to operate profitably.
We encounter strong competition from financial institutions operating in the Greater Columbia, South Carolina area. In the conduct of our business, we also compete with credit unions, insurance companies, money market mutual funds and other financial institutions, some of which are not subject to the same degree of regulation as we are. Many of these competitors have substantially greater resources and lending abilities than we have and offer services, such as investment banking, trust and international banking services that we do not provide. We believe that we have been able to, and will continue to be able to, compete effectively with these institutions because of our experienced bankers and personalized service, as well as through loan participations and other strategies and techniques. However, we cannot promise that we are correct in our belief. If we are wrong, our ability to operate profitably may be negatively affected.
Risks Related to Our Common Stock
Our common stock has a limited trading market, which may make the prompt execution of sale transactions difficult.
Although our common stock may be traded from time to time on an individual basis, and we anticipate that it will be listed on the Nasdaq Capital Market after this offering, no active trading market has developed and
7
none may develop in the foreseeable future. Our common stock is not traded on any exchange or on the Nasdaq National Market System. Accordingly, if you wish to sell shares you may experience a delay or have to sell them at a lower price in order to sell them promptly, if at all.
We do not plan to pay cash dividends in the foreseeable future.
We do not plan to pay cash dividends in the foreseeable future. We plan to use the funds that might otherwise be available to pay dividends to expand our business.
Declaration and payment of dividends are within the discretion of our board of directors. Our bank will be our most likely source of funds with which to pay cash dividends. Our bank’s declaration and payment of future dividends to us are within the discretion of the bank’s board of directors, and are dependent upon its earnings, financial condition, its need to retain earnings for use in the business and any other pertinent factors. The bank’s payment of dividends is also subject to various regulatory requirements.
Provisions in our articles of incorporation and South Carolina law may discourage or prevent takeover attempts, and these provisions may have the effect of reducing the market price for our stock.
Our articles of incorporation include several provisions that may have the effect of discouraging or preventing hostile takeover attempts, and therefore of making the removal of incumbent management difficult. The provisions include staggered terms for our board of directors and requirements of supermajority votes to approve certain business transactions. In addition, South Carolina law contains several provisions that may make it more difficult for a third party to acquire control of us without the approval of our board of directors, and may make it more difficult or expensive for a third party to acquire a majority of our outstanding common stock. To the extent that these provisions are effective in discouraging or preventing takeover attempts, they may tend to reduce the market price for our stock.
Our directors have significant voting power.
Our present directors beneficially own 31.12% of our stock now and are expected to beneficially own approximately 25.12% after this offering. Because they own over 20%, if they vote together, they will be able to prevent any merger, consolidation, share exchange, sale of substantial assets, dissolution, removal of directors or amendment to the articles of incorporation they do not want. See “Description of Capital Stock.”
We have broad discretion to use the net proceeds of this offering.
We expect to use a substantial portion of the net proceeds to enhance and support the equity capital of our bank and retain the balance of the net proceeds in the holding company. The net proceeds we retain will be used for working capital and other general corporate purposes, including providing additional contributions to the bank’s capital as needed to support future loan production and asset growth, branch expansion in new and existing markets, and potential acquisitions to expand our retail branch network. Accordingly, we will have broad discretion as to the application of such proceeds. You will not have an opportunity to evaluate the economic, financial or other information on which we base our decisions as to how to use these net proceeds. Our failure to use these funds effectively could have an adverse effect on our financial condition and results of operations.
Our common stock is not insured, so you could lose your total investment.
Our common stock is not a deposit or savings account, and will not be insured by the Federal Deposit Insurance Corporation or any other government agency. Should our business fail you could lose your total investment.
8
Risks Related to Our Industry
We are subject to governmental regulation which could change and increase our cost of doing business or have an adverse affect on our business.
We operate in a highly regulated industry and are subject to examination, supervision and comprehensive regulation by various federal and state agencies. Our compliance with the requirements of these agencies is costly and may limit our growth and restrict certain of our activities, including, payment of dividends, mergers and acquisitions, investments, loans and interest rates charged, and locations of offices. We are also subject to capitalization guidelines established by federal authorities and our failure to meet those guidelines could result, in an extreme case, in our bank’s being placed in receivership. Supervision, regulation and examination of banks and bank holding companies by financial institution regulatory agencies are intended for the protection of depositors and our other customers rather than the holders of our common stock. We have also recently been subjected to the extensive and expensive requirements imposed on public companies by the Sarbanes-Oxley Act of 2002 and related regulations.
The laws and regulations applicable to the banking industry could change at any time, and we cannot predict the impact of these changes on our business or profitability. Because government regulation greatly affects the business and financial results of all commercial banks and bank holding companies, our cost of compliance could adversely affect our ability to operate profitably.
We are susceptible to changes in monetary policy and other economic factors which may adversely affect our ability to operate profitably.
Changes in governmental, economic and monetary policies may affect the ability of our bank to attract deposits and make loans. The rates of interest payable on deposits and chargeable on loans are affected by governmental regulation and fiscal policy as well as by national, state and local economic conditions. All of these matters are outside of our control and affect our ability to operate profitably.
9
This prospectus contains “forward-looking statements” within the meaning of the securities laws. All statements that are not historical facts may be “forward-looking statements.” You can identify these forward-looking statements through our use of words such as “may,” “will,” “expect,” “anticipate,” “believe,” “intend, “ “estimate,” “project, “ “continue,” or other similar words. Forward-looking statements include, but are not limited to, statements regarding our future business prospects, revenues, working capital, liquidity, capital needs, interest costs, income, business operations and proposed services.
These forward-looking statements are based on current expectations, estimates and projections about our industry, management’s beliefs, and assumptions made by management. Such information includes, without limitation, discussions as to estimates, expectations, beliefs, plans, strategies, and objectives concerning our future financial and operating performance. These statements are not guarantees of future performance and are subject to risks, uncertainties and assumptions that are difficult to predict, particularly in light of the fact that we are a relatively new company with limited operating history. Therefore, actual results may differ materially from those expressed or forecasted in such forward-looking statements. The risks and uncertainties include, but are not limited to:
| • | our growth and our ability to maintain growth; |
| • | governmental monetary and fiscal policies, as well as legislative and regulatory changes; |
| • | the effect of interest rate changes on our level and composition of deposits, loan demand and the value of our loan collateral and securities; |
| • | the effects of competition from other financial institutions operating in our market area and elsewhere, including institutions operating locally, regionally, nationally and internationally, together with competitors that offer banking products and services by mail, telephone and computer and/or the Internet; |
| • | failure of assumptions underlying the establishment of our allowance for loan losses, including the value of collateral securing loans; |
| • | loss of consumer confidence and economic disruptions resulting from terrorist activities; and |
| • | the factors discussed in “Risk Factors” beginning on page 6 of this prospectus. |
| • | We undertake no obligation to publicly update or revise any forward-looking statements, whether as a result of new information, future events or otherwise. In light of these risks, uncertainties, and assumptions, the forward-looking events discussed in this prospectus might not occur. |
10
We estimate that we will receive $14.9 million in net proceeds from the sale of 1,000,000 shares of our common stock, using the public offering price of $16.00 per share and after deducting the underwriting discount and other estimated offering expenses. We will receive additional net proceeds of up to $2.2 million if the underwriter exercises the option granted to it in connection with this offering to cover over-allotments.
We will use some of the net proceeds of this offering to repay indebtedness of approximately $2.5 million and to increase the capital of our bank by approximately $8.0 million, which will enable it to maintain its status as a “well capitalized” institution as its assets increase, as well as to fund the costs of new branches. Our business plan calls for the addition of four new branches in the next few years and we estimate that each branch will cost approximately $1.5 to $2.0 million. We may also use some of the proceeds for our administrative expenses. Except for payment of such expenses, the remaining net proceeds will be temporarily invested and will be available to further increase the capital of the bank or for other activities in which a bank holding company is permitted to engage.
The following table demonstrates the distribution of our planned use of the net proceeds described above:
(Dollars in thousands) | Approximate Amount | % of Net Proceeds | ||||
Repayment of indebtedness | $ | 2,500 | 16.8 | % | ||
Capital contribution to our bank | 8,000 | 53.8 | % | |||
Administrative expenses and other permitted uses | 4,368 | 29.4 | % | |||
Total | $ | 14,868 | 100.0 | % | ||
The principal reasons for the offering are to acquire additional capital to support our future growth, including the opening of a new banking office in Northeast Columbia during 2005 and further branch expansion in the next few years. See “Business—Management Philosophy and Policy” on page 36.
The following table shows (a) our actual capitalization at September 30, 2005, and (b) our pro forma capitalization as if this offering had been completed on that date. The pro forma capitalization assumes the sale of 1,000,000 shares, our receipt of $14.9 million in estimated net proceeds, after deducting the underwriting discount and our estimated offering expenses and there is no exercise of the underwriter’s over-allotment option.
| September 30, 2005 | ||||||||
| (Unaudited) | ||||||||
| Actual | Pro Forma | |||||||
| (in thousands) | ||||||||
Shareholders’ Equity | ||||||||
Preferred stock (10,000,000 shares authorized), none issued | — | — | ||||||
Common Stock, no par value (20,000,000 shares authorized) | $ | 13,995 | — | |||||
2,427,303 shares issued and outstanding (pro forma) | — | $ | 28,863 | |||||
Retained deficit | (2,645 | ) | (2,645 | ) | ||||
Accumulated Other Comprehensive Loss | (18 | ) | (18 | ) | ||||
Total Shareholders’ Equity | $ | 11,332 | $ | 26,200 | ||||
MARKET FOR COMMON STOCK AND DIVIDENDS
Market for Common Stock. Although our common stock may be traded from time to time on an individual basis, no established trading market has developed. Our stock is not traded on any exchange or on the Nasdaq National Market System, nor are there any present market makers known to management. In two public offerings in 2002, we sold an aggregate of 1,341,303 shares of common stock for $10.00 per share. Since completion of those offerings, trading of our common stock has been limited and sporadic, and management is not aware of the prices at which all shares of stock have been traded. During 2003, management was aware of a few transactions in which our common stock traded for $11.00 per share. In 2004, the trades of which management was aware
11
were in the range of $11.00 to $12.00 per share in the first quarter, at $12.00 per share in the second quarter, in the range of $12.00 to $12.50 per share in the third quarter and in the range of $12.50 to $13.50 per share in the fourth quarter. In 2005, all of the trades of which management is aware were at $13.50 per share. However, management has not ascertained that these transactions are the result of arm’s length negotiations between the parties, and because of the limited number of shares involved, these prices may not be indicative of the market value of our common stock. Upon completion of the offering, we anticipate that our common stock will be listed on the Nasdaq Capital Market under the symbol “CNCP.”
As of September 30, 2005, we had 1,427,303 shares of common stock outstanding held by approximately 1,148 holders of record. As of September 30, 2005, we had outstanding options to purchase 100,301 shares of our common stock and outstanding warrants to purchase 200,555 shares of our common stock.
Dividends. We do not plan to pay cash dividends in the foreseeable future and may never pay cash dividends. We plan to use any funds that might otherwise be available to pay dividends to expand our business.
If we ever pay cash dividends, the most likely source of funds would be cash dividends paid to the company by the bank. The bank is restricted in its ability to pay dividends under the national banking laws and by regulations of the Comptroller of the Currency. A national bank may not pay dividends from its capital. All dividends must be paid out of net profits then on hand, after deducting losses and bad debts. A national bank is further prohibited from declaring a dividend on its shares of common stock until its surplus equals the amount of its capital, unless there has been transferred to surplus not less than 1/10 of the bank’s net profits of the preceding two consecutive half year periods (in the case of an annual dividend). Also, the approval of the Comptroller of the Currency is required if the total of all dividends declared by a national bank in any calendar year will exceed the total of its net income for that year combined with its retained net profits for the preceding two years, less any required transfers to surplus. The Comptroller of the Currency has issued policy statements that indicate that insured banks should generally only pay cash dividends out of current operating earnings. As a practical matter, a national bank cannot pay dividends until sufficient net income has been earned to eliminate any retained deficit. As of September 30, 2005, the bank had a retained deficit of $2.6 million, which means the bank will not be able to pay dividends to the Company until the bank earns cumulative net income of at least $2.6 million.
The payment of cash dividends by the bank may also be affected or limited by other factors, such as the requirements to maintain adequate capital above regulatory guidelines. In addition, if, in the opinion of the applicable regulatory authority, a bank under its jurisdiction is engaged in or is about to engage in an unsafe or unsound practice (which, depending on the financial condition of the bank, could include the payment of cash dividends), such authority may require, after notice and hearing, that such bank cease and desist from such practice. Paying dividends that deplete a bank’s capital base to an inadequate level may constitute an unsafe and unsound banking practice.
12
Selected Consolidated Financial Data
The following table provides summary consolidated financial data for Carolina National Corporation. The financial data for each of the years ended December 31, 2004, 2003 and part of 2002 is derived from our consolidated financial statements. The financial data for the nine months ended September 30, 2005 and 2004 is derived from our unaudited consolidated financial statements. Operating results for the nine months ended September 30, 2005 are not necessarily indicative of the results that may be expected for the year ended December 31, 2005. You should read this summary consolidated financial data in conjunction with “Management’s Discussion and Analysis of Financial Condition and Results of Operations” beginning on page 14, and our financial statements, including the accompanying notes, and other financial data, included elsewhere in this prospectus.
| Nine Months Ended September 30,(1) | Years Ended December 31, | From Inception (July 15, 2002) through December 31, | ||||||||||||||||||
| 2005 | 2004 | 2004 | 2003 | 2002 | ||||||||||||||||
| (Dollars in thousands, except per share data) | ||||||||||||||||||||
Period Ending Balances: | ||||||||||||||||||||
Total assets | $ | 151,150 | $ | 93,339 | $ | 98,505 | $ | 62,810 | $ | 32,810 | ||||||||||
Total loans (2) | 128,725 | 79,982 | 90,304 | 54,931 | 10,145 | |||||||||||||||
Total deposits | 135,207 | 81,798 | 86,094 | 50,646 | 20,152 | |||||||||||||||
Stockholders’ equity | 11,332 | 10,912 | 10,925 | 11,383 | 12,594 | |||||||||||||||
Results of operations: | ||||||||||||||||||||
Total interest income | $ | 5,466 | $ | 2,663 | $ | 3,926 | $ | 1,686 | $ | 316 | ||||||||||
Total interest expense | 1,951 | 832 | 1,206 | 511 | 164 | |||||||||||||||
Net interest income | 3,515 | 1,830 | 2,720 | 1,176 | 152 | |||||||||||||||
Provision for loan losses | 448 | 375 | 506 | 676 | 152 | |||||||||||||||
Net interest income after provision for loan losses | 3,067 | 1,456 | 2,214 | 499 | — | |||||||||||||||
Noninterest income | 271 | 208 | 273 | 305 | 151 | |||||||||||||||
Noninterest expense | 2,722 | 2,358 | 3,148 | 2,631 | 1,503 | |||||||||||||||
Income (loss) before income taxes | 616 | (695 | ) | (661 | ) | (1,827 | ) | (1,352 | ) | |||||||||||
Net income (loss) | 400 | (454 | ) | (433 | ) | (1,211 | ) | (633 | ) | |||||||||||
Per share data: | ||||||||||||||||||||
Net income (loss), basic | $ | 0.28 | $ | (0.32 | ) | $ | (0.30 | ) | $ | (0.85 | ) | $ | (0.91 | ) | ||||||
Net income (loss), diluted (3) | 0.27 | (0.32 | ) | (0.30 | ) | (0.85 | ) | (0.91 | ) | |||||||||||
Book value, basic | 7.94 | 7.65 | 7.65 | 7.98 | 8.82 | |||||||||||||||
Shares outstanding, basic | 1,427 | 1,427 | 1,427 | 1,427 | 1,427 | |||||||||||||||
Shares outstanding, diluted (3) | 1,502 | 1,455 | 1,455 | 1,455 | 1,440 | |||||||||||||||
Asset Quality Ratios: | ||||||||||||||||||||
Allowance for loan losses to loans | 1.38 | % | 1.50 | % | 1.47 | % | 1.50 | % | 1.50 | % | ||||||||||
Nonperforming loans to loans | 0.00 | % | 0.00 | % | 0.00 | % | 0.00 | % | 0.00 | % | ||||||||||
Allowance for loan losses to nonperforming loans | N/A | N/A | N/A | N/A | N/A | |||||||||||||||
Net loan charge offs to average loans | 0.00 | % | 0.00 | % | 0.00 | % | 0.00 | % | 0.00 | % | ||||||||||
Selected Ratios: | ||||||||||||||||||||
Tier 1 risk-based capital ratio (4) | 7.84 | % | 7.82 | % | 7.07 | % | 12.99 | % | 41.93 | % | ||||||||||
Total risk-based capital ratio (4) | 9.06 | % | 10.27 | % | 10.37 | % | 14.24 | % | 42.82 | % | ||||||||||
Tier 1 leverage ratio (4) | 7.81 | % | 8.29 | % | 6.88 | % | 14.33 | % | 23.18 | % | ||||||||||
Efficiency ratio (5) | 71.89 | % | 115.72 | % | 105.21 | % | 177.87 | % | 496.23 | % | ||||||||||
Equity to assets | 7.50 | % | 11.69 | % | 11.09 | % | 18.12 | % | 38.38 | % | ||||||||||
Return on average total assets (6) | 0.43 | % | (0.78 | %) | (0.51 | %) | (2.81 | %) | (2.38 | %) | ||||||||||
Return on average stockholders’ equity (6) | 5.62 | % | (5.43 | %) | (3.98 | %) | (10.19 | %) | (5.35 | %) | ||||||||||
Net interest margin (6) | 3.95 | % | 3.21 | % | 3.34 | % | 2.86 | % | 0.54 | % | ||||||||||
| (1) | Unaudited. |
| (2) | Loans are stated at gross amounts before allowance for loan losses. |
| (3) | Diluted shares outstanding assume that all exercisable options and warrants are exercised at the end of the period and accounted for by the treasury stock method. |
| (4) | Ratios for dates other than September 30, 2005 are for our bank because the Federal Reserve uses subsidiary bank ratios for bank holding companies with less than $150 million in consolidated assets. At September 30, 2005, our consolidated assets exceeded $150 million and the capital ratios at that date are calculated according to the Federal Reserve guidelines. |
| (5) | We compute our efficiency ratio by dividing noninterest expense by the sum of net interest income and noninterest income. Comparison of our efficiency ratio with those of other companies may not be possible, because other companies may calculate the efficiency ratio differently. |
| (6) | Selected ratios for periods less than one year have been annualized. |
13
MANAGEMENT’S DISCUSSION AND ANALYSIS OF FINANCIAL
CONDITION AND RESULTS OF OPERATIONS
The following discussion should be read in conjunction with our financial statements and the notes thereto and the other financial data included elsewhere in this prospectus. The financial information provided below has been rounded in order to simplify its presentation. However, the ratios and percentages provided below are calculated using the detailed financial information contained in the financial statements, the notes thereto and the other financial data included elsewhere in this prospectus.
Overview
For the nine months ended September 30, 2005, our net income was $399,896 compared to a net loss of $454,192 for the same period in 2004. Earnings per share for the first nine months of 2005 were $0.28 per basic share compared to a loss of $0.32 for the comparable period of 2004 This increase primarily resulted from loan growth and an increase in net interest margin. Our net interest margin was 3.95% for the first nine months of 2005 compared to 3.21% for the first nine months of 2004.
For the year ended December 31, 2004, we had a net loss of $432,770 compared to a net loss of $1.2 million for the year ended December 31, 2003, our first full year of operations. Our loss per basic share was $0.30 in 2004 compared to $0.85 in 2003.
During the first nine months of 2005, total loans increased 42.5% from $90.3 million at December 31, 2004 to $128.7 million at September 30, 2005. Total deposits at September 30, 2005 were $135.2 million, a 57.0% increase from $86.1 million at December 31, 2004. During 2004, our total loans grew 64.4% from $54.9 million at year end 2003 to $90.3 million at year end 2004. Our deposits grew by 70.0% from $50.6 million at December 31, 2003 to $86.1 million at December 31, 2004. The growth in our loans and deposits reflects our bank’s acceptance and penetration in its markets.
Our allowance for loan losses was $1.8 million at September 30, 2005 compared to $1.2 million at September 30, 2004. The allowance for loan losses as a percentage of period end loans was 1.38% at September 30, 2005 and 1.51% at September 30, 2004. The provisions for loan losses were $448,462 and $374,607 for the nine months ended September 30, 2005 and 2004, respectively. We had minimal charge-offs and no non-accruing loans or loans 30 days or more past due at any reporting period end.
We intend to make a capital contribution of approximately $8.0 million of the proceeds of this offering to our bank for the purpose of continuing our branch expansion plan and to support the bank’s continued asset growth. Based on current market conditions and our current assessment of opportunities available to us, we expect to acquire, build or lease four new branches over the next two to three years in addition to the branch in Northeast Columbia we plan to open in December, 2005. Approximately $1.5 to $2.0 million will be committed to each branch for land, facility construction and equipment if we own the branch, or, a relatively similar amount of capital lease commitment and equipment costs will be incurred if we lease the branch. We expect that it will take between two and two and a half years for each branch to begin contributing profit to the bank. The effect on our results of operations will be dependent on a number of factors including how quickly the new branches become profitable, the rate at which we implement the expansion program, general economic conditions and competition in the marketplace. It is possible that some of our branch sites may never reach profitability and may have to be abandoned with a loss of a considerable portion of our capital investment. It is also possible that we may deviate significantly from our expansion plan if prudent banking practices, including capital preservation or better wealth building opportunities, so dictate.
14
Year ended December 31, 2004 compared with year ended December 31, 2003
Results of Operations
Net interest income increased $1.5 million, or 131.6% in 2004 from $1.2 million in 2003. The increase in net interest income was due primarily to an increase in average earning assets, which increased $40.5 million, or 98.9%, due to continued growth in the loan portfolio during this second full year of operation. The primary component of interest income was interest on loans, including fees, of $3.8 million.
Our net interest spread and net interest margin were 2.89% and 3.34%, respectively, in 2004 compared to 2.18% and 2.86%, respectively, in 2003. The increase in net interest spread was primarily the result of a higher interest rate environment. Yields on all earning assets increased in 2004. Yields on average earning assets increased from 4.11% in 2003 to 4.82% in 2004. Yields on average interest-bearing liabilities were 1.93% for 2004 and 2003.
The provision for loan losses was $505,607 in 2004 compared to $675,660 in 2003. We continue to maintain the allowance for loan losses at a level we believe to be sufficient to cover known and inherent losses in the loan portfolio.
| • | Noninterest income decreased $31,651, or 10.4%, to $272,876 in 2004 from $304,527 in 2003. The decrease is primarily attributable to a decrease in residential mortgage origination fees, which decreased $131,997, or 57.0%, to $99,502 for the year ended December 31, 2004 due to decreased mortgage loan demand in a rising interest rate environment. Service charges on deposit accounts increased by $82,855 or 165.1% to $133,028 for the year ended December 31, 2004, when compared to 2003 as a result of increased deposit account volume. |
| • | Noninterest expense increased $517,642, or 19.7%, to $3.1 million in 2004 from $2.6 million in 2003. Noninterest expenses increased in all categories as a result of our continued growth during the second full year of operations. Salaries and employee benefits increased $265,605 to $1.8 million for the year ended December 31, 2004. This increase is attributable to normal pay increases and the hiring of additional staff to meet needs associated with our growth. Our efficiency ratio was 105.2% in 2004 compared to 177.9% in 2003. The efficiency ratio is defined as noninterest expense divided by the sum of net interest income and noninterest income, net of gains and losses on sales of assets. |
Net loss was $432,770 in 2004 compared to a net loss of $1.2 million in 2003. The decline in net loss reflects our continued growth, as average earning assets increased from $41.0 million for the year ended December 31, 2003 to $81.5 million for the year ended December 31, 2004. Return on average assets during 2004 was (0.51%) compared to (2.81%) during 2003. Net loss is after the recognition of an income tax benefit of $228,631 and $616,174 for the years 2004 and 2003, respectively. The income tax benefit was based on an effective tax rate of 34%.
Net Interest Income
General. The largest component of our net income is net interest income, which is the difference between the income earned on assets and interest paid on deposits and borrowings used to support such assets. Net interest income is determined by the yields earned on our interest-earning assets and the rates paid on our interest-bearing liabilities, the relative amounts of interest-earning assets and interest-bearing liabilities, and the degree of mismatch and the maturity and repricing characteristics of its interest-earning assets and interest-bearing liabilities. Net interest income divided by average interest-earning assets represents our net interest margin.
15
Average Balances, Income and Expenses, and Rates and Yields. The following table sets forth, for the periods indicated, information related to our average balance sheet and its income and yields on average earning assets and average costs and rates of liabilities. Such yields and rates are derived by dividing income or expense by the average balance of the corresponding assets or liabilities and are then annualized. Average balances have been derived from the daily balances throughout the periods indicated.
| For the Year Ended December 31, 2004 | For the Year Ended December 31, 2003 | |||||||||||||||||||
| (Dollars in thousands) | Average Balance | Income/ Expense | Yield/ Rate | Average Balance | Income/ Expense | Yield/ Rate | ||||||||||||||
Assets: | ||||||||||||||||||||
Earning Assets: | ||||||||||||||||||||
Loans (1) | $ | 71,713 | $ | 3,765 | 5.25 | % | $ | 30,412 | $ | 1,538 | 5.06 | % | ||||||||
Securities, taxable | 2,782 | 56 | 2.01 | 4,294 | 79 | 1.84 | ||||||||||||||
Federal funds sold and other | 7,037 | 105 | 1.49 | 6,281 | 69 | 1.10 | ||||||||||||||
Total earning assets | 81,532 | 3,926 | 4.82 | 40,987 | 1,686 | 4.11 | ||||||||||||||
Cash and due from banks | 1,669 | 982 | ||||||||||||||||||
Premises and equipment | 1,746 | 533 | ||||||||||||||||||
Other assets | 625 | 1,131 | ||||||||||||||||||
Allowance for loan losses | (1,056 | ) | (436 | ) | ||||||||||||||||
Total assets | $ | 84,516 | $ | 43,197 | ||||||||||||||||
Liabilities: | ||||||||||||||||||||
Interest-Bearing Liabilities: | ||||||||||||||||||||
Interest-bearing transaction accounts | $ | 5,202 | $ | 9 | 0.17 | % | $ | 3,887 | $ | 9 | 0.23 | % | ||||||||
Savings deposits | 22,906 | 380 | 1.66 | 9,589 | 133 | 1.39 | ||||||||||||||
Time deposits | 34,512 | 817 | 2.37 | 12,953 | 367 | 2.83 | ||||||||||||||
Federal funds purchased | 7 | — | — | 54 | 1 | 1.85 | ||||||||||||||
Total interest-bearing liabilities | 62,627 | 1,206 | 1.93 | 26,483 | 510 | 1.93 | ||||||||||||||
Demand deposits | 10,551 | 4,719 | ||||||||||||||||||
Accrued interest and other liabilities | 461 | 113 | ||||||||||||||||||
Shareholders’ equity | 10,877 | 11,882 | ||||||||||||||||||
Total liabilities and shareholders’ equity | $ | 84,516 | $ | 43,197 | ||||||||||||||||
Net interest spread | 2.89 | % | 2.18 | % | ||||||||||||||||
Net interest income | $ | 2,720 | $ | 1,176 | ||||||||||||||||
Net interest margin | 3.34 | % | 2.86 | % | ||||||||||||||||
| (1) | There were no loans in nonaccrual status in 2004 or 2003. The effect of fees amortized on loans in 2004 totaling $133,701 increased the annualized yield on loans by .19% from 5.06%. The effect on the annualized yield on earning assets in 2004 was an increase of .17% from 4.65%. The effect on net interest spread and net interest margin in 2004 was an increase of .17% and .17% from 2.72% and 3.17%, respectively. |
16
Analysis of Changes in Net Interest Income. Net interest income can also be analyzed in terms of the impact of changing rates and changing volume. The following table reflects the extent to which changes in interest rates and changes in the volume of earning assets and interest-bearing liabilities have affected our interest income and interest expense during the periods indicated. Information on changes in each category attributable to (i) changes due to volume (change in volume multiplied by prior period rate), (ii) changes due to rates (changes in rates multiplied by prior period volume) and (iii) changes in rate/volume (change in rate multiplied by the change in volume) is as follows:
| 2004 compared to 2003 | ||||||||||||||||
| Due to increase (decrease) in | ||||||||||||||||
| (Dollars in thousands) | Volume(1) | Rate(1) | Volume/ Rate | Total | ||||||||||||
Interest income: | ||||||||||||||||
Loans | $ | 2,089 | $ | 59 | $ | 79 | $ | 2,227 | ||||||||
Securities, taxable | (27 | ) | 8 | (3 | ) | (22 | ) | |||||||||
Federal funds sold and other | 8 | 24 | 3 | 35 | ||||||||||||
Total interest income | 2,070 | 91 | 79 | 2,240 | ||||||||||||
Interest expense: | ||||||||||||||||
Interest-bearing deposits | 798 | (38 | ) | (65 | ) | 695 | ||||||||||
Short-term borrowings | — | — | — | — | ||||||||||||
Total interest expense | 798 | (38 | ) | (65 | ) | 695 | ||||||||||
Net interest income | $ | 1,272 | $ | 129 | $ | 144 | $ | 1,545 | ||||||||
| (1) | Volume-rate changes have been allocated to each category based on a consistent basis between rate and volume. |
Interest Sensitivity. We monitor and manage the pricing and maturity of our assets and liabilities in order to diminish the potential adverse impact that changes in interest rates could have on its net interest income. The principal monitoring technique we employ is the measurement our interest sensitivity “gap”, which is the positive or negative dollar difference between assets and liabilities that are subject to interest rate repricing within a given period of time. Interest rate sensitivity can be managed by repricing assets or liabilities, selling securities available for sale, replacing an asset or liability at maturity, or adjusting the interest rate during the life of an asset or liability. Managing the amount of assets and liabilities repricing in this same time interval helps to hedge the risk and minimize the impact on net interest income of rising or falling interest rates.
17
The following table sets forth our interest rate sensitivity at December 31, 2004.
Interest Sensitivity Analysis
| (Dollars in thousands) | Within Three Months | After Three Through Twelve Months | One Through Five Years | Greater Than Five Years | Total | |||||||||||||||
Assets | ||||||||||||||||||||
Earning Assets: | ||||||||||||||||||||
Federal funds sold | $ | 1,767 | $ | — | $ | — | $ | — | $ | 1,767 | ||||||||||
Loans | 58,077 | 1,600 | 29,557 | 1,281 | 90,515 | |||||||||||||||
Investment securities | — | — | 2,969 | 393 | 3,362 | |||||||||||||||
Total earning assets | 59,844 | 1,600 | 32,526 | 1,674 | 95,644 | |||||||||||||||
Liabilities | ||||||||||||||||||||
Interest-bearing liabilities: | ||||||||||||||||||||
Interest-bearing deposits: | ||||||||||||||||||||
Demand deposits | 6,047 | — | — | — | 6,047 | |||||||||||||||
Savings deposits | 24,763 | — | — | — | 24,763 | |||||||||||||||
Time deposits | 13,181 | 21,181 | 10,547 | — | 44,909 | |||||||||||||||
Note payable | — | — | 900 | — | 900 | |||||||||||||||
Total interest-bearing liabilities | 43,991 | 21,181 | 11,447 | — | 76,619 | |||||||||||||||
Period gap | $ | 15,853 | $ | (19,581 | ) | $ | 21,079 | $ | 1,674 | $ | 19,025 | |||||||||
Cumulative gap | �� | $ | 15,853 | $ | (3,728 | ) | $ | 17,351 | $ | 19,025 | $ | 19,025 | ||||||||
Ratio of cumulative gap to total earning assets | 16.6 | % | (3.9 | )% | 18.1 | % | 19.9 | % | 19.9 | % | ||||||||||
The above table reflects the balances of interest-earning assets and interest-bearing liabilities at the earlier of their repricing or maturity dates. Overnight federal funds are reflected at the earliest pricing interval due to the immediately available nature of the instruments. Debt securities are reflected at each instrument’s ultimate maturity date. Scheduled payment amounts of fixed rate amortizing loans are reflected at each scheduled payment date. Scheduled payment amounts of variable rate amortizing loans are reflected at each scheduled payment date until the loan may be repriced contractually; the unamortized balance is reflected at that point. Interest-bearing liabilities with no contractual maturity, such as savings deposits and interest-bearing transaction accounts, are reflected in the earliest repricing period due to contractual arrangements which give us the opportunity to vary the rates paid on those deposits within a thirty-day or shorter period. Fixed rate time deposits, principally certificates of deposit, are reflected at their contractual maturity date. The note payable is reflected at its contractual maturity date.
We generally would benefit from increasing market rates of interest when our gap position is asset-sensitive and generally would benefit from decreasing market rates of interest when it is liability-sensitive. At December 31, 2004 we were cumulatively asset sensitive over all periods, except for after three through twelve months. However, our gap analysis is not a precise indicator of our interest sensitivity position. The analysis presents only a static view of the timing of maturities and repricing opportunities, without taking into consideration that changes in interest rates do not affect all assets and liabilities equally. Net interest income may be impacted by other significant factors in a given interest rate environment, including changes in the volume and mix of earning assets and interest-bearing liabilities.
18
Provision and Allowance for Loan Losses
General. There are risks inherent in making all loans, including risks with respect to the period of time over which loans may be repaid, risks resulting from changes in economic and industry conditions, risks inherent in dealing with individual borrowers, and, in the case of a collateralized loan, risks resulting from uncertainties about the future value of the collateral. We have developed policies and procedures for evaluating the overall quality of our credit portfolio and the timely identification of potential problem credits. On a quarterly basis, our board of directors reviews and approves the appropriate level for our allowance for loan losses based upon management’s recommendations, the results of the internal monitoring and reporting system, and an analysis of economic conditions in its market. Through December 31, 2004 our objective was to initially fund the allowance for loan losses at approximately 1.50% of total loans outstanding based upon the prior experience of management and other new banks to provide for a risk of loss inherent in the loan portfolio until a history was established. We have subsequently revised our procedure and it is described on page 30.
Additions to the allowance for loan losses, which are expensed as the provision for loan losses on our income statement, are made periodically to maintain the allowance at an appropriate level based on management’s analysis of the estimated losses inherent in the loan portfolio. Loan losses and recoveries are charged or credited directly to the allowance. The amount of the provision is a function of the level of loans outstanding, the level of nonperforming loans, historical loan loss experience, the amount of loan losses actually charged against the reserve during a given period, and current and anticipated economic conditions.
Our allowance for loan losses is based upon judgments and assumptions about risk elements in the portfolio, future economic conditions, and other factors affecting borrowers. The process includes identification and analysis of loss potential in various portfolio segments utilizing a credit risk grading process and specific reviews and evaluations of significant problem credits. In addition, we monitor the overall portfolio quality through observable trends in delinquencies, charge-offs, and general and economic conditions in the service area. The adequacy of the allowance for loan losses and the effectiveness of our monitoring and analysis system are also reviewed periodically by the banking regulators and our independent auditors.
We assign each of our loans a numerical grade of one through nine based on our analysis of the risks of loss for the loan. The loans with a grade of one are those we believe have the least amount of risk of loss, while loans that are charged off are given a grade of nine, representing the highest risk of loss. Criticized loans (risk grade five) are loans that have potential weaknesses that deserve close attention and which could, if uncorrected, result in deterioration of the prospects for repayment or our credit position at a future date. Classified loans (risk grades six, seven and eight) are loans that are inadequately protected by the sound worth and paying capacity of the borrower or any collateral and as to which there is a distinct possibility or probability that we will sustain a loss if the deficiencies are not corrected.
We account for impaired loans in accordance with Statement of Financial Accounting Standards (“SFAS”) No. 114, “Accounting by Creditors for Impairment of a Loan”. This statement requires that all lenders value a loan at the loan’s fair value if it is probable that the lender will be unable to collect all amounts due according to the terms of the loan agreement. Fair value may be determined based upon the present value of expected cash flows, market price of the loan, if available, or value of the underlying collateral. Expected cash flows are required to be discounted at the loan’s effective interest rate. SFAS No. 114 was amended by SFAS No. 118, “Accounting by Creditors for Impairment of a Loan–Income Recognition and Disclosures,” to allow a lender to use existing methods for recognizing interest income on an impaired loan and by requiring additional disclosures about how a creditor recognizes interest income on an impaired loan.
Under SFAS No. 114, as amended by SFAS No. 118, when the ultimate collectibility of an impaired loan’s principal is in doubt, wholly or partially, all cash receipts are applied to principal. Once the reported principal balance has been reduced to zero, future cash receipts are applied to interest income, to the extent that any interest has been foregone. Further cash receipts are recorded as recoveries of any amounts previously charged off. When this doubt does not exist, cash receipts are applied under the contractual terms of the loan agreement first to interest income then to principal.
19
A loan is also considered impaired if its terms are modified in a troubled debt restructuring. For these accruing impaired loans, cash receipts are typically applied to principal and interest receivable in accordance with the terms of the restructured loan agreement. Interest income is recognized on these loans using the accrual method of accounting.
Based on present information and an ongoing evaluation, we consider the allowance for loan losses to be adequate to meet presently known and inherent losses in the loan portfolio. Our judgment about the adequacy of the allowance is based upon a number of assumptions about future events which we believe to be reasonable but which may or may not be accurate. Since we have a limited operating history, we have relied heavily on peer group data in formulating our estimates and assumptions. Thus, there is a risk that chargeoffs in future periods could exceed the allowance for loan losses or that substantial additional increases in the allowance for loan losses could be required. Additions to the allowance for loan losses would result in a decrease of our net income and, possibly, our capital. We do not allocate the allowance for loan losses to specific categories of loans but evaluate the adequacy on an overall portfolio basis utilizing a risk grading system.
The following table sets forth certain information with respect to our allowance for loan losses and the composition of charge-offs and recoveries for the years ended December 31, 2004 and 2003.
Allowance for Loan Losses
| (Dollars in thousands) | 2004 | 2003 | ||||||
Total loans outstanding at end of period | $ | 90,304 | $ | 54,931 | ||||
Average loans outstanding | $ | 71,713 | $ | 30,412 | ||||
Balance of allowance for loan losses at beginning of year | $ | 827 | $ | 152 | ||||
Net loan losses | — | 1 | ||||||
Provision for loan losses | 505 | 676 | ||||||
Balance of allowance for loan losses at end of year | $ | 1,332 | $ | 827 | ||||
Allowance for loan losses to period end loans | 1.47 | % | 1.50 | % | ||||
Nonperforming Assets
Nonperforming Assets. There were no nonaccrual loans, loans past due 90 days or more and still accruing interest, or restructured loans at December 31, 2004 or 2003.
Our policy with respect to nonperforming assets is as follows. Accrual of interest generally will be discontinued on a loan when management believes, after considering economic and business conditions and collection efforts that the borrower’s financial condition is such that the collection of interest is doubtful. A delinquent loan will generally be placed in nonaccrual status when it becomes 90 days or more past due unless the estimated net realizable value of collateral exceeds the principal balance and accrued interest. When a loan is placed in nonaccrual status, all interest which has been accrued on the loan but remains unpaid will be reversed and deducted from current earnings as a reduction of reported interest income. No additional interest will be accrued on the loan balance until the collection of both principal and interest becomes reasonably certain. When a problem loan is finally resolved, there may ultimately be an actual writedown or charge-off of the principal balance of the loan which would necessitate additional charges to earnings.
Potential Problem Loans. Potential problem loans are loans that are not included in impaired loans (nonaccrual loans or loans past due 90 days or more and still accruing), but about which management has become aware of information about possible credit problems of the borrowers that causes doubt about their ability to comply with current repayment terms. At December 31, 2004, we had not identified any potential problem loans
20
through our internal review mechanisms. The results of this internal review process are considered in determining our assessment of the adequacy of the allowance for loan losses.
Noninterest Income and Expense
Noninterest Income. The largest component of noninterest income was service charges on deposit accounts, which totaled $133,028 for the year ended December 31, 2004 and $50,173 for the year ended December 31, 2003. The increase in service charges on deposit accounts is due to an increase in the volume of deposits in 2003. Residential mortgage origination fees decreased from $231,499 for the year ended December 31, 2003 to $99,502 for the year ended December 31, 2004. The decrease was due to fewer mortgage refinancings in the rising interest rate environment.
The following table sets forth the principal components of noninterest income for the year ended December 31, 2004 and 2003.
| (Dollars in thousands) | 2004 | 2003 | ||||
Residential mortgage origination fees | $ | 100 | $ | 232 | ||
Service charges on deposit accounts | 133 | 50 | ||||
Other income | 40 | 23 | ||||
Total noninterest income | $ | 273 | $ | 305 | ||
Noninterest Expense. Salaries and employee benefits comprised the largest component of noninterest expense which totaled $1.8 million and $1.5 million for the years ended December 31, 2004 and 2003, respectively. Salaries and employee benefits increased as a result of new employees hired to assist with our growth in addition to pay raises for existing employees. Net occupancy and furniture and equipment expenses increased by $32,572 and $25,774, respectively, as a result of the new drive-through facility and our overall growth. Other operating expenses totaled $992,631 and $798,940 for the years ended December 31, 2004 and 2003, respectively. Data processing and related fees comprise one of the largest components of other operating expenses. These fees increased from $161,149 for the year ended December 31, 2003 to $226,311 for the year ended December 31, 2004. This increase was directly related to the increase in the volume of accounts over the two periods.
The following table sets forth the primary components of noninterest expense for the years ended December 31, 2004 and 2003.
| (Dollars in thousands) | 2004 | 2003 | ||||
Salaries and employee benefits | $ | 1,753 | $ | 1,487 | ||
Net occupancy expense | 256 | 224 | ||||
Advertising and marketing expense | 70 | 105 | ||||
Office supplies, forms, and stationery | 58 | 43 | ||||
Data processing | 226 | 162 | ||||
Professional fees | 199 | 140 | ||||
Furniture and equipment expense | 147 | 121 | ||||
Telephone | 34 | 29 | ||||
Loan closing expenses | 55 | 64 | ||||
Postage | 13 | 14 | ||||
Other | 337 | 242 | ||||
Total noninterest expense | $ | 3,148 | $ | 2,631 | ||
21
Earning Assets
Loans. Loans are the largest category of earning assets and typically provide higher yields than the other types of earning assets. Loans also entail greater credit and liquidity risks than most of our investment securities and short-term investments, which we attempt to control and counterbalance. Loans averaged $71.7 million in 2004 and $30.4 million in 2003. At December 31, 2004 and 2003, total loans were $90.3 million and $54.9 million, respectively.
The following table sets forth the composition of the loan portfolio by category at December 31, 2004 and 2003 and highlights our general emphasis on mortgage lending.
Composition of Loan Portfolio
| 2004 | 2003 | |||||||||||
| (Dollars in thousands) | Amount | Percent of Total | Amount | Percent of Total | ||||||||
Commercial and industrial | $ | 11,490 | 12.69 | % | $ | 9,680 | 17.59 | % | ||||
Real estate: | ||||||||||||
Mortgage-residential | 32,222 | 35.60 | 28,368 | 51.55 | ||||||||
Mortgage-nonresidential | 43,881 | 48.48 | 15,252 | 27.72 | ||||||||
Consumer | 2,922 | 3.23 | 1,730 | 3.14 | ||||||||
Total loans | 90,515 | 100.00 | % | 55,030 | 100.00 | % | ||||||
Allowance for loan losses | 1,332 | 827 | ||||||||||
Deferred loan fees | 211 | 99 | ||||||||||
Net loans | $ | 88,972 | $ | 54,104 | ||||||||
The largest component of loans in our loan portfolio is real estate mortgage loans. At December 31, 2004, real estate mortgage loans totaled $76.1 million and represented 84.1% of the total loan portfolio. At December 31, 2003 real estate mortgage loans totaled $43.6 million and represented 79.3% of the total loan portfolio.
In the context of this discussion, a “real estate mortgage loan” is defined as any loan secured by real estate, regardless of the purpose of the loan. It is common practice for financial institutions in our market area to obtain a security interest in real estate whenever possible, in addition to any other available collateral. This collateral is taken to reinforce the likelihood of the ultimate repayment of the loan and tends to increase the magnitude of the real estate loan portfolio.
Residential mortgage loans totaled $32.2 and $28.4 million at December 31, 2004 and 2003, respectively. Residential real estate loans consist of first and second mortgages on single or multi-family residential dwellings.
Nonresidential mortgage loans, which include commercial loans and other loans secured by multi-family properties and farmland, totaled $43.9 and $15.3 million at December 31, 2004 and 2003, respectively. The demand for residential and commercial real estate loans in the Columbia market has increased due to the low interest rate environment.
Commercial and industrial loans totaled $11.5 and $9.7 million at December 31, 2004 and 2003, respectively, and comprised 12.7% and 17.6%, respectively, of the total portfolio.
At December 31, 2004, consumer loans totaled $2.9 million and represented 3.2% of the total loan portfolio. Consumer loans totaled $1.7 million at December 31, 2003 and represented 3.1% of the total loan portfolio.
22
Our loan portfolio reflects the diversity of our market. Our offices are located in the Columbia, South Carolina area. The economy of the Columbia metropolitan area is significantly influenced by offices of state and federal government, a major state university, and a United States Army base and training center as well as numerous small and mid-sized businesses. Management expects the area to remain stable with continued growth in the near future. The diversity of the economy creates opportunities for all types of lending. We do not engage in foreign lending.
The repayment of loans in the loan portfolio as they mature is also a source of liquidity for us. The following table sets forth our loans maturing within specified intervals at December 31, 2004.
Loan Maturity Schedule and Sensitivity to Changes in Interest Rates
| (Dollars in thousands) | One Year or Less | Over One Year Through Five Years | Over Five Years | Total | ||||||||||||
Commercial and industrial | $ | 6,963 | $ | 28,163 | $ | 3,749 | $ | 38,875 | ||||||||
Real estate | 23,186 | 25,101 | 432 | 48,719 | ||||||||||||
Consumer and other | 697 | 2,037 | 187 | 2,921 | ||||||||||||
Deferred loan fees | (32 | ) | (127 | ) | (52 | ) | (211 | ) | ||||||||
Total | $ | 30,814 | $ | 55,174 | $ | 4,316 | $ | 90,304 | ||||||||
Loans maturing after one year with: | ||||||||||||||||
Fixed interest rates | $ | 30,240 | ||||||||||||||
Floating interest rates | 29,250 | |||||||||||||||
Total | $ | 59,490 | ||||||||||||||
The information presented in the above table is based on the contractual maturities of the individual loans, including loans which may be subject to renewal at their contractual maturity. Renewal of such loans is subject to review and credit approval as well as modification of terms upon their maturity. Consequently, management believes this treatment presents fairly the maturity and repricing structure of the loan portfolio shown in the above table.
Investment Securities. The investment securities portfolio is also a component of our total earning assets. Total securities averaged $3.2 million in 2004 and $4.0 million in 2003. At December 31, 2004 and 2003, the total securities portfolio was $3.4 million and $3.6 million, respectively. All marketable equity securities were designated as available for sale in 2004 and as held to maturity in 2003, and were recorded at their cost. Nonmarketable securities which totaled $392,400 and $315,500 at December 31, 2004 and 2003, respectively, were recorded at cost.
The following table sets forth the fair value of the securities we held at December 31, 2004 and 2003.
Fair Value of Securities
| (Dollars in thousands) | 2004 | 2003 | ||||
U.S. government agencies | $ | 2,969 | $ | 3,306 | ||
Nonmarketable equity securities | 392 | 316 | ||||
Total investment securities | $ | 3,361 | $ | 3,622 | ||
23
The following table sets forth the scheduled maturities and average yields of securities available for sale at December 31, 2004.
Investment Securities Maturity Distribution and Yields
| One to Five Years | ||||||
| (Dollars in thousands) | Amount | Yield | ||||
U.S. government agencies | $ | 2,969 | 2.00 | % | ||
Nonmarketable equity securities totaled $392,400 and $315,500 and had a yield of 4.68% and 5.59% at December 31, 2004 and 2003, respectively.
Other attributes of the securities portfolio, including yields and maturities, are discussed above in “—Net Interest Income—Interest Sensitivity.”
Short-Term Investments. Short-term investments, which consist primarily of federal funds sold, averaged $6.6 million in 2004 and $6.3 million in 2003. At December 31, 2004, there were $1.8 million in short-term investments. These funds are an important source of our liquidity. Federal funds are generally invested in an earning capacity on an overnight basis.
Deposits and Other Interest-Bearing Liabilities
Average interest-bearing liabilities totaled $62.6 million in 2004 and $26.5 million in 2003.
Deposits. Average total deposits totaled $73.2 million during 2004 and $31.1 million in 2003. At December 31, 2004 and 2003, total deposits were $86.1 million and $50.6 million, respectively.
The following table sets forth our deposits by category as of December 31, 2004 and 2003.
Deposits
| 2004 | 2003 | |||||||||||
| (Dollars in thousands) | Amount | Percent of Deposits | Amount | Percent of Deposits | ||||||||
Demand deposit accounts | $ | 10,375 | 12 | % | $ | 7,498 | 15 | % | ||||
NOW accounts | 6,047 | 7 | 4,829 | 10 | ||||||||
Savings accounts | 24,763 | 29 | 18,100 | 36 | ||||||||
Time deposits less than $100 | 18,008 | 21 | 13,428 | 26 | ||||||||
Time deposits of $100 or over | 26,901 | 31 | 6,791 | 13 | ||||||||
Total deposits | $ | 86,094 | 100 | % | $ | 50,646 | 100 | % | ||||
Core deposits, which exclude certificates of deposit of $100,000 or more, provide a relatively stable funding source for our loan portfolio and other earning assets. Our core deposits were $59.2 million at December 31, 2004 and $43.9 million at December 31, 2003.
24
Deposits, and particularly core deposits, have been a primary source of funding and have enabled us to meet successfully both our short-term and long-term liquidity needs. We anticipate that such deposits will continue to be our primary source of funding in the future. Our loan-to-deposit ratio was 105% at December 31, 2004 and 109% at December 31, 2003. The maturity distribution of our time deposits over $100,000 at December 31, 2004, is set forth in the following table:
Maturities of Certificates of Deposit of $100,000 or More
| (Dollars in thousands) | Within Three Months | After Three Through Six Months | After Six Through Twelve Months | After Twelve Months | Total | ||||||||||
Certificates of deposit of $100 or more | $ | 9,640 | $ | 2,811 | $ | 9,008 | $ | 5,442 | $ | 26,901 | |||||
Approximately 35.8% of our time deposits over $100,000 had scheduled maturities within three months, and 79.8% had maturities within twelve months. Large certificate of deposit customers tend to be extremely sensitive to interest rate levels, making these deposits less reliable sources of funding for liquidity planning purposes than core deposits.
Note Payable. We executed a line of credit with Bank One in 2004 that allows us to borrow up to $7.0 million if certain covenants are met. (See Note 7 to the consolidated financial statements for the years ended December 31, 2004 and 2003.) At December 31, 2004, the line had a balance of $900,000 and a weighted average interest rate of 5.16%. The average balance of this note payable for 2004 was $9,863. The maximum amount of this note payable at any month end was $900,000 in 2004 and the weighted average interest rate was 5.16%. Proceeds from the line are being used to provide additional capital in the form of subordinated debt to the bank.
Capital
We and our bank are subject to various regulatory capital requirements administered by the federal banking agencies. Because we had total assets less than $150 million at December 31, 2004, our capital adequacy was measured by the bank’s capital adequacy. Failure to meet minimum capital requirements can initiate certain mandatory and possibly additional discretionary actions by regulators that, if undertaken, could have a material effect on the bank’s financial position. Under capital adequacy guidelines and the regulatory framework for prompt corrective action, the bank must meet specific capital guidelines that involve quantitative measures of the bank’s assets, liabilities, and certain off-balance-sheet items as calculated under regulatory accounting practices. The bank’s capital amounts and classifications are also subject to qualitative judgments by the regulators about components, risk weightings, and other factors.
Quantitative measures established by regulation to ensure capital adequacy require the bank to maintain minimum ratios of Tier 1 and total capital as a percentage of assets and off-balance-sheet exposures, adjusted for risk weights ranging from 0% to 100%. Tier 1 capital of the bank consists of common shareholders’ equity, excluding the unrealized gain or loss on securities available-for-sale, minus certain intangible assets. The bank’s Tier 2 capital consists of the allowance for loan losses and subordinated debt subject to certain limitations. Total capital for purposes of computing the capital ratios consists of the sum of Tier 1 and Tier 2 capital. The regulatory minimum requirements are 4% for Tier 1 capital and 8% for total risk-based capital.
The bank is also required to maintain capital at a minimum level based on quarterly average assets, which is known as the leverage ratio. Only the strongest banks are allowed to maintain capital at the minimum requirement of 3%. All others are subject to maintaining ratios 1% to 2% above the minimum.
25
The bank exceeded regulatory capital requirements at December 31, 2004 and 2003 as set forth in the following table.
Analysis of Capital and Capital Ratios
| (Dollars in thousands) | 2004 | 2003 | ||||||
Tier 1 capital | $ | 6,558 | $ | 7,314 | ||||
Tier 2 capital | 3,061 | 705 | ||||||
Total qualifying capital | $ | 9,619 | $ | 8,019 | ||||
Risk-adjusted total assets (including off-balance-sheet exposures) | $ | 95,332 | $ | 56,310 | ||||
Tier 1 risk-based capital ratio | 7.07 | % | 12.99 | % | ||||
Total risk-based capital ratio | 10.37 | % | 14.24 | % | ||||
Tier 1 leverage ratio | 6.88 | % | 14.33 | % | ||||
In order to continue to grow, the bank will need to increase its capital in the near future. As discussed above, we have arranged a credit facility with another bank which will allow us to borrow up to $7.0 million, subject to a number of conditions, which we may use to increase the capital of the bank. (See Note 7 to our Consolidated Financial Statements for the years ended December 31, 2004 and 2003.) At December 31, 2004, we had borrowed $900,000 on this line of credit which was added to the bank’s capital in the form of subordinated debt. We may also use other means, such as this and future sales of stock, to raise funds with which to increase the bank’s capital.
Off-Balance Sheet Risk
Through its operations, the bank has made contractual commitments to extend credit in the ordinary course of its business activities. These commitments are legally binding agreements to lend money to the bank’s customers at predetermined interest rates for a specified period of time. At December 31, 2004, the bank had issued commitments to extend credit of $23.5 million through various types of commercial lending arrangements. Approximately $19.9 million of these commitments to extend credit had variable rates.
The following table sets forth the length of time until maturity for unused commitments to extend credit at December 31, 2004.
| (Dollars in thousands) | Within One Month | After One Through Three Months | After Three Through Twelve Months | Within One Year | Greater Than One Year | Total | ||||||||||||
Unused commitments to extend credit | $ | 315 | $ | 830 | $ | 3,664 | $ | 4,809 | $ | 18,100 | $ | 22,908 | ||||||
Standby letters of credit | 20 | 10 | 580 | 610 | — | 610 | ||||||||||||
| $ | 335 | $ | 840 | $ | 4,244 | $ | 5,419 | $ | 18,100 | $ | 23,518 | |||||||
The bank evaluates each customer’s creditworthiness on a case-by-case basis. The amount of collateral obtained, if deemed necessary by the bank upon extension of credit, is based on its credit evaluation of the borrower. Collateral varies but may include accounts receivable, inventory, property, plant and equipment, commercial and residential real estate.
26
Return on Equity and Assets
The following table shows the return on average assets (net income divided by average total assets), return on average equity (net income divided by average daily equity), and equity to assets ratio (average daily equity divided by average total assets) for the period indicated. Since our inception, we have not paid cash dividends.
| 2004 | 2003 | |||
Return on average assets | (0.51%) | (2.81%) | ||
Return on average equity | (3.98%) | (10.19%) | ||
Equity to assets ratio | 12.87% | 27.51% |
Critical Accounting Policies
We have adopted various accounting policies which govern the application of accounting principles generally accepted in the United States in the preparation of our financial statements. Our significant accounting policies are described in the notes to the consolidated financial statements at December 31, 2004, included in this prospectus. Certain accounting policies involve significant judgments and assumptions which have a material impact on the carrying value of certain assets and liabilities. These accounting policies are considered to be critical accounting policies. The judgments and assumptions used are based on historical experience and other factors, which are believed to be reasonable under the circumstances. Because of the nature of the judgments and assumptions, actual results could differ from these judgments and estimates which could have a material impact on the carrying values of assets and liabilities and results of operations.
We believe the allowance for loan losses is a critical accounting policy that requires the most significant judgments and estimates used in preparation of the consolidated financial statements. Refer to the portion of this discussion that addresses the allowance for loan losses for a description of our processes and methodology for determining our allowance for loan losses.
Liquidity Management
Liquidity management involves monitoring our sources and uses of funds in order to meet our day-to-day cash flow requirements while maximizing profits. Liquidity represents our ability to convert assets into cash or cash equivalents without significant loss and to raise additional funds by increasing liabilities. Without proper liquidity management, we would not be able to perform the primary function of a financial intermediary and would, therefore, not be able to meet the needs of the communities we serve.
Liquidity management is made more complex because different balance sheet components are subject to varying degrees of management control. For example, the timing of maturities of the investment portfolio is relatively predictable and subject to control at the time investment decisions are made. However, net deposit inflows and outflows are far less predictable and are not subject to nearly the same degree of control. We also have the ability to obtain funds from various financial institutions should the need arise.
Impact of Inflation
Unlike most industrial companies, the assets and liabilities of financial institutions such as the bank are primarily monetary in nature. Therefore, interest rates have a more significant effect on the bank’s performance than do the effects of changes in the general rate of inflation and change in prices. In addition, interest rates do not necessarily move in the same direction or in the same magnitude as the prices of goods and services. As discussed previously, we seek to manage the relationships between interest sensitive assets and liabilities in order to protect against wide interest rate fluctuations, including those resulting from inflation.
27
Three and Nine Month Periods Ended September 30, 2005 and 2004
A number of the terms and concepts we use in this discussion of our financial condition and results of operations for the quarterly and nine month periods ended September 30, 2005 and 2004 are explained more completely in the foregoing discussion of our financial condition and results of operations for the years ended December 31, 2004 and 2003. Accordingly, you should read the following information for the periods ended September 30, 2005 and 2004 in conjunction with the foregoing discussion for the years ended December 31, 2004 and 2003 and our unaudited consolidated financial statements for the three and nine months ended September 30, 2005 and 2004 included elsewhere in this prospectus.
Net Interest Income
Average Balances, Income and Expenses, and Rates and Yields. The following table sets forth, for the periods indicated, information related to our average balance sheet and its income and yields on average earning assets and average costs and rates of liabilities. Such yields and rates are derived by dividing income or expense by the average balance of the corresponding assets or liabilities and are then annualized. Average balances have been derived from the daily balances throughout the periods indicated.
| For the Nine Months Ended September 30, 2005 | For the Nine Months Ended September 30, 2004 | |||||||||||||||||
| (Dollars in thousands) | Average Balance | Income/ Expense | Yield/ Rate | Average Balance | Income/ Expense | Yield/ Rate | ||||||||||||
Earning Assets: | ||||||||||||||||||
Loans (1) | $ | 108,365 | $ | 5,243 | 6.45 | % | $ | 65,662 | $ | 2,551 | 5.18 | % | ||||||
Securities, taxable | 3,138 | 63 | 2.68 | 3,144 | 53 | 2.25 | ||||||||||||
Federal funds sold and other | 7,272 | 160 | 2.93 | 6,954 | 58 | 1.12 | ||||||||||||
Total earning assets | 118,775 | 5,466 | 6.14 | 75,760 | 2,663 | 4.68 | ||||||||||||
Interest-Bearing Liabilities: | ||||||||||||||||||
Interest-bearing transaction accounts | $ | 8,588 | $ | 6 | 0.09 | % | $ | 15,790 | $ | 6 | 0.05 | % | ||||||
Savings deposits | 25,508 | 411 | 2.15 | 21,737 | 269 | 1.65 | ||||||||||||
Time deposits | 63,550 | 1,463 | 3.07 | 32,108 | 546 | 2.27 | ||||||||||||
FHLB borrowing | 7 | — | 2.25 | — | — | — | ||||||||||||
Other borrowing | 1,421 | 71 | 6.67 | 346 | 11 | 4.24 | ||||||||||||
Total interest-bearing liabilities | 99,074 | 1,951 | 2.63 | 69,981 | 832 | 1.59 | ||||||||||||
Demand deposits | 13,463 | 11,158 | ||||||||||||||||
Net interest spread | 3.51 | % | 3.09 | % | ||||||||||||||
Net interest income | $ | 3,515 | $ | 1,830 | ||||||||||||||
Net interest margin | 3.95 | % | 3.21 | % | ||||||||||||||
| (1) | There were no loans in non-accrual status in the nine months ended September 30, 2005 or 2004. The effect of fees amortized on loans in the nine months ended September 30, 2005 totaling $213,010 increased the annualized yield on loans by 0.26% from 6.19%. The effect on the annualized yield on earning assets in the nine months ended September 30, 2004 was an increase of 0.19% from 4.99%. |
Changes that affect net interest income are changes in the average rate earned on interest earning assets, changes in the average rate paid on interest bearing liabilities, and changes in the volume of interest earning assets and interest bearing liabilities. For the nine months ended September 30, 2005, net interest income, the major component of our net income, was $3.5 million as compared to $1.8 million for the same period in 2004. For the three months ended September 30, 2005, net interest income was $1.4 million compared to $717,042 for the same period in 2004. For the nine months ended September 30, 2005, interest income from loans, including fees, was $5.2 million, compared to $2.6 million for the same period in 2004. For the three months ended
28
September 30, 2005, interest income from loans, including fees, was $2.1 million, compared to $1.0 million for the same period in 2004. The improvement in the 2005 period was primarily attributable to increased volume as we continued to build our loan portfolio, and substantial increases in the rates earned.
Interest expense for the nine months ended September 30, 2005 was $2.0 million, compared to $832,425 for the same period in 2004. Interest expense for the three months ended September 30, 2005 was $750,728, compared to $335,086 for the same period in 2004. Interest expense for the nine month and three month periods in 2005 increased over the same periods in the prior year as a result of the increase in volume of interest-bearing deposits and an increase in the cost of funds.
The average rate realized on interest-earning assets was 6.14% and 4.67%, respectively, for the nine month periods ended September 30, 2005 and 2004. The average rate paid on interest-bearing liabilities was 2.63% and 1.58%, respectively, for the nine month periods ended September 30, 2005 and 2004. For the three month periods ended September 30, 2005 and 2004, the average rate realized on interest-earning assets was 6.54% and 4.64%, respectively, and the average rate paid on interest-bearing liabilities was 2.74% and 2.06%, respectively.
The net interest spread and net interest margin were 3.51% and 3.95%, respectively, for the nine month period ended September 30, 2005. The net interest spread and net interest margin were 3.09% and 3.21%, respectively, for the nine month period ended September 30, 2004. For the three month period ended September 30, 2005 and 2004, the net interest spread was 3.75% and 2.75%, respectively. For the three month period ended September 30, 2005 and 2004, the net interest margin was 4.17% and 3.28%, respectively.
Interest Rate Sensitivity. The following table sets forth our interest rate sensitivity at September 30, 2005.
Interest Sensitivity Analysis
| (Dollars in thousands) | Within Three Months | After Three Through Twelve Months | One Through Five Years | Greater Than Five Years | Total | |||||||||||||||
Assets | ||||||||||||||||||||
Earning Assets: | ||||||||||||||||||||
Federal funds sold | $ | 12,550 | $ | — | $ | — | $ | — | $ | 12,550 | ||||||||||
Loans | 67,895 | 3,564 | 54,417 | 3,492 | 129,368 | |||||||||||||||
Investment securities | — | 2,979 | — | — | 2,979 | |||||||||||||||
Total earning assets | 80,445 | 6,543 | 54,417 | 3,492 | 144,897 | |||||||||||||||
Liabilities | ||||||||||||||||||||
Interest-bearing liabilities: | ||||||||||||||||||||
Interest-bearing deposits: | ||||||||||||||||||||
Savings deposits | 27,075 | — | — | — | 27,075 | |||||||||||||||
Time deposits | 10,764 | 49,442 | 20,646 | — | 80,852 | |||||||||||||||
Other borrowing | — | 2,450 | 1,000 | — | 3,450 | |||||||||||||||
Total interest-bearing liabilities | 37,839 | 51,892 | 21,646 | — | 111,377 | |||||||||||||||
Period gap | $ | 42,606 | $ | (45,349 | ) | $ | 32,771 | $ | 3,492 | $ | 33,520 | |||||||||
Cumulative gap | $ | 42,606 | $ | (2,743 | ) | $ | 30,028 | $ | 33,520 | $ | 33,520 | |||||||||
Ratio of cumulative gap to total earning assets | 29.4 | % | (1.9 | %) | 20.7 | % | 23.1 | % | 23.1 | % | ||||||||||
The table above reflects the balances of interest earning assets and interest-bearing liabilities at the earlier of their repricing or maturity dates. Overnight federal funds are reflected at the earliest pricing interval due to the immediately available nature of the instruments. Debt securities are reflected at each instrument’s ultimate maturity date. Scheduled payment amounts of fixed rate amortizing loans are reflected at each scheduled payment date. Scheduled payment amounts of variable rate amortizing loans are reflected at each scheduled payment date until the loan may be repriced contractually; the unamortized balance is reflected at that point. Interest-bearing liabilities with no contractual maturity, such as savings deposits and interest-bearing transaction
29
accounts, are reflected in the earliest repricing period due to contractual arrangements which give us the opportunity to vary the rates paid on those deposits within a thirty-day or shorter period. Fixed rate time deposits, principally certificates of deposit, are reflected at their contractual maturity date. The note payable is reflected at its contractual maturity date.
We generally would benefit from increasing market rates of interest when our gap position is asset-sensitive and generally would benefit from decreasing market rates of interest when it is liability-sensitive. At September 30, 2005, we were cumulatively asset sensitive over all periods, except for after three through twelve months. However, our gap analysis is not a precise indicator of our interest sensitivity position. The analysis presents only a static view of the timing of maturities and repricing opportunities, without taking into consideration that changes in interest rates do not affect all assets and liabilities equally. Net interest income may be impacted by other significant factors in a given interest rate environment, including changes in the volume and mix of earning assets and interest-bearing liabilities.
Provision and Allowance for Loan Losses
The provision for loan losses charged to operating expenses reflects the amount deemed appropriate by management to establish an adequate reserve to meet the present and foreseeable risk characteristics of the current loan portfolio. Loans that are determined to be uncollectible are charged against the allowance. Provisions for loan losses and recoveries on loans previously charged off are added to the allowance. For the nine months ended September 30, 2005 and 2004, the provision was $448,462 and $374,607, respectively. For the three months ended September 30, 2005 and 2004, the provision for loans losses was $136,562 and $98,367, respectively. The allowance for loan losses represents 1.38% and 1.50% of gross loans at September 30, 2005 and 2004, respectively. There are risks inherent in making all loans, including risks with respect to the period of time over which loans may be repaid, risks resulting from changes in economic and industry conditions, risks inherent in dealing with individual borrowers, and, in the case of a collateralized loan, risks resulting from uncertainties about the future value of the collateral. Our judgment is based on periodic and regular evaluation of individual loans, the overall risk characteristics of the various portfolio segments, and prevailing and anticipated economic conditions. Based on our analysis of such factors we assign specific reserve amounts for any significant classified loans and we use various percentages of the aggregate amounts of groups of other classified loans and the different categories of non-classified loans. The percentages are set based on our assessment of the degree of credit risk in each category after reviewing changes in lending policies and procedures, including underwriting standards and collection, charge-off, and recovery practices; changes in national and local economic and business conditions; changes in the nature and volume of the portfolio; changes in the experience and depth of lending management; changes in the volume and severity of problem loans; the effect of external factors such as competition, legal and regulatory requirements; and, peer comparison. Our judgment about the adequacy of the allowance is based upon a number of estimates and assumptions about present conditions and future events, which we believe to be reasonable, but which may not prove to be accurate. Since we have a limited operating history, we rely heavily on the prior banking experience of our management and peer group data in formulating our estimates and assumptions. Thus, there is a risk that charge-offs in future periods could exceed the allowance for loan losses or that substantial additional increases in the allowance for loan losses could be required. Additions to the allowance for loan losses would result in a decrease of our net income and, possibly, our capital.
Noninterest Income
Noninterest income for the nine month periods ended September 30, 2005 and 2004 was $270,714 and $207,593, respectively. Of this total, $139,583 and $96,174 was generated from service charges on deposit accounts, which includes fees for checks returned due to insufficient funds on deposit. Residential mortgage origination fees totaled $81,708 and $82,076 for the nine months ended September 30, 2005 and 2004, respectively. The increase in service charges was the result of an increase in the volume of deposits between the two periods. For the quarters ended September 30, 2005 and 2004, noninterest income was $107,570 and $65,813, respectively. Of this total, $56,970 and $38,988 was generated from service charges on deposit accounts, and $36,166 and $15,385 was generated from residential mortgage origination fees.
30
Noninterest Expense
Total noninterest expense for the nine months ended September 30, 2005 and 2004 was $2.7 million and $2.4 million, respectively. This represents an increase of $363,780, or 15.4% over the comparable period of 2004. The largest increase, salaries and employee benefits, increased from $1.3 million for the nine months ended September 30, 2004 to $1.6 million for the nine months ended September 30, 2005. The increase is primarily attributable to the hiring of additional staff to meet the growing needs of our bank. Net occupancy expense for the nine month period ended September 30, 2005 was $245,740 as compared to $189,838 for the same period a year earlier. For the quarter ended September 30, 2005, noninterest expense was $985,472, as compared to $806,431 for the same period in 2004. Salaries and benefits and other operating expenses were the largest noninterest expenses during the 2005 quarter, totaling $590,692 and $271,799, respectively. Salaries and benefits and other operating expenses for the 2004 quarter totaled $438,449 and $206,706, respectively. The increase from 2004 to 2005 is attributable to the overall growth of our bank.
Income Taxes
An income tax expense of $215,771 and $126,485 was recorded for the nine and three month periods ending September 30, 2005, respectively. This compares to an income tax benefit of $240,838 and $43,794 for the nine and three month periods in 2004. This represents an effective tax rate of 35.0% and 34.7% for the nine month periods ending September 30, 2005 and 2004, respectively.
Net Income (loss)
The combination of the above factors resulted in a net income of $399,896 for the nine months ended September 30, 2005 as compared to a net loss of $454,192 for the same period in 2004. The net income for 2005 is primarily the result of our increased earning asset base and the increase in net interest margin. The loss in 2004 was primarily a result of noninterest expenses associated with operating two full service branches and funding our provision for loan losses. The net income before taxes of $615,667 was partially offset by income tax expenses of $215,771 for the nine months ended September 30, 2005. The net loss before taxes of $695,030 was partially offset by the income tax benefit of $240,838 for the nine months ended September 30, 2004. The net income for the three months ended September 30, 2005 was $247,201, as compared to a net loss of $78,149 for the same period in 2004.
Financial Condition
Assets and Liabilities. During the nine months ended September 30, 2005, as we continued to build our business, total assets increased $52.6 million, or 53.4%, when compared to December 31, 2004. Federal funds sold increased to $12.6 million at September 30, 2005 as a result of strong deposit growth. Total loans increased $38.4 million, or 42.5%, during the nine months ended September 30, 2005. Total deposits also increased by $49.1 million, or 57.0% from the December 31, 2004 amount of $86.1 million. Time deposits increased $35.9 million, or 80.0%, during the nine months ended September 30, 2005. Savings and money market deposits increased $2.3 million, or 9.3%, during the same period. Transaction accounts increased $10.9 million, or 66.1% during the nine months ended September 30, 2005.
Investment Securities. Investment securities increased from $3.4 million at December 31, 2004 to $3.5 million at September 30, 2005. All of our marketable investment securities were designated as available-for-sale at September 30, 2005 and 2004.
31
Loans. We experienced significant loan growth during the nine months ended September 30, 2005 as we continued to work to establish our presence in the marketplace. Gross loans, net of unearned income, increased $38.4 million, or 42.5%, during the period. As shown below, the largest category of the loan portfolio was mortgage loans for commercial properties, which increased 62.5%, or $17.9 million, from December 31, 2004 to September 30, 2005. Balances within the major loans receivable categories as of September 30, 2005 and December 31, 2004 are as follows:
| (Dollars in thousands) | September 30, 2005 | December 31, 2004 | ||||
Mortgage loans on real estate: | ||||||
Residential 1-4 Family | $ | 16,803 | $ | 12,419 | ||
Multifamily | 218 | 223 | ||||
Commercial | 46,447 | 28,587 | ||||
Construction | 22,994 | 15,064 | ||||
Second Mortgage loans | 1,672 | 1,369 | ||||
Equity Lines of Credit | 23,616 | 18,230 | ||||
| 111,750 | 75,892 | |||||
Commercial and industrial | 14,793 | 11,490 | ||||
Consumer | 2,164 | 2,918 | ||||
Other | 18 | 5 | ||||
Total loans, net of unearned income | $ | 128,725 | $ | 90,305 | ||
Allowance for Loan Losses
Activity in the allowance for loan losses for the nine months ended September 30, 2005 and 2004 is as follows:
| Nine Months Ended September 30, | ||||||||
| (Dollars in thousands) | 2005 | 2004 | ||||||
Balance, January 1, | $ | 1,332 | $ | 827 | ||||
Provision for loan losses for the period | $ | 448 | $ | 375 | ||||
Net loans (charged-off) recovered for the period | — | — | ||||||
Balance, end of period | $ | 1,780 | $ | 1,202 | ||||
Gross loans outstanding, end of period | $ | 128,725 | $ | 79,982 | ||||
Allowance for loan losses to loans outstanding, end of period | 1.38 | % | 1.50 | % | ||||
We do not allocate the allowance for loan losses to specific categories of loans. Instead, we evaluate the adequacy of the allowance for loan losses on an overall portfolio basis utilizing our credit grading system which we apply to each loan. We assign each of our loans a numerical grade of one through nine based on our analysis of the risks of loss for the loan. The loans with a grade of one are those we believe have the least amount of risk of loss, while loans that are charged off are given a grade of nine, representing the highest risk of loss. We have an independent credit review officer who reviews loan files and determines the grading of each loan. Also, on a quarterly basis, management reviews the size and composition of the loan portfolio in light of current and anticipated economic conditions in an effort to evaluate risks associated with the portfolio. This evaluation takes into consideration information about specific borrower situations and estimated collateral values, economic conditions, and other factors. At September 30, 2005, we had one criticized loan (risk grade five) in the amount of $1.3 million. The loan is collateralized by real estate and at December 31, 2004 the balance was $1.3 million. We did not have any classified loans (risk grades six, seven and eight) or any loans in nonaccrual status or loans past due for more than 90 days as of September 30, 2005, or December 31, 2004. We did not have any impaired loans as of September 30, 2005, or December 31, 2004. At September 30, 2005 we had assigned a grade of one, two or three to loans representing 87.8% of the dollar amount of our loan portfolio.
32
Deposits
At September 30, 2005, total deposits had increased by $49.1 million, or 57.0%, from December 31, 2004. The largest increase was in time deposits, which increased $35.9 million, or 80.0%, from December 31, 2004 to September 30, 2005. This increase was attributable to the opening of new accounts during the nine months ended September 30, 2005. Expressed in percentages, noninterest-bearing deposits increased 30.8% and interest-bearing demand deposits increased 126.7%. At September 30, 2005, brokered deposits totaled $29.3 million which represents a 52.5% increase over the December 31, 2004 brokered deposits total of $19.2 million.
Balances within the major deposit categories as of September 30, 2005 and December 31, 2004 are as follows:
| (Dollars in thousands) | September 30, 2005 | December 31, 2004 | ||||
Noninterest-bearing demand deposits | $ | 13,573 | $ | 10,375 | ||
Interest-bearing demand deposits | 13,708 | 6,047 | ||||
Savings and money market | 27,075 | 24,763 | ||||
Time deposits $100,000 and over | 45,945 | 26,901 | ||||
Other time deposits | 34,907 | 18,008 | ||||
Total Deposits | $ | 135,208 | $ | 86,094 | ||
Notes Payable
��
We have a $7.0 million line of credit with Chase Bank with a variable interest rate based on the 30 day LIBOR plus 275 basis points. As of September 30, 2005, we had drawn $2.5 million of this line. The line of credit matures in March, 2006. In addition, we have credit available at Federal Home Loan Bank of Atlanta up to an amount equal to 10% of our bank’s total assets reported at the end of each previous quarter. As of September 30, 2005, we had drawn $1.0 million on this line at a fixed rate of 4.51% with a maturity date of March 26, 2007.
Off-Balance Sheet Risk
We have made contractual commitments to extend credit in the ordinary course of our business activities. These commitments are legally binding agreements to lend money to our customers at predetermined interest rates for a specified period of time. At September 30, 2005, we had issued commitments to extend credit of $32.2 million and standby letters of credit of $448,352 through various types of commercial lending arrangements. Approximately $28.0 million of these commitments to extend credit had variable rates.
The following table sets forth the length of time until maturity for unused commitments to extend credit and standby letters of credit at September 30, 2005.
| (Dollars in thousands) | Within One Month | After One Through Three Months | After Three Through Twelve Months | Within One Year | Greater Than One Year | Total | ||||||||||||
Unused commitments to extend credit | $ | 269 | $ | 859 | $ | 6,861 | $ | 7,989 | $ | 24,163 | $ | 32,152 | ||||||
Standby letters of credit | 250 | 80 | 118 | 448 | — | 448 | ||||||||||||
Totals | $ | 519 | $ | 939 | $ | 6,979 | $ | 8,437 | $ | 24,163 | $ | 32,600 | ||||||
Based on historical experience in the banking industry, we expect that many of the commitments and letters of credit will expire unused or not fully funded. Accordingly, the amounts in the table above do not necessarily reflect our need for funds in the periods shown.
33
We evaluate each customer’s credit worthiness on a case-by-case basis. The amount of collateral obtained, if we deem it necessary upon extension of credit, is based on our credit evaluation of the borrower. Collateral varies but may include accounts receivable, inventory, property, plant and equipment, and commercial and residential real estate.
Liquidity
We meet our liquidity needs by structuring aggregate maturity terms of loans and investments to coincide with aggregate maturity terms of funding sources while maintaining sufficient excess funds for unplanned contingencies. One measure of liquidity is the loan-to-total borrowed funds (which includes deposits) ratio, which was at 92.8% at September 30, 2005 and 103.8% at December 31, 2004.
Securities available-for-sale, which totaled $3.0 million at September 30, 2005, and federal funds sold which totaled $12.6 million at September 30, 2005, are a ready source of liquidity. We also have a short term line of credit available with a correspondent bank to purchase federal funds for periods from one to fourteen days. At September 30, 2005, the unused federal funds borrowing line of credit totaled $2.7 million. We also have a line of credit to borrow funds from the Federal Home Loan Bank of Atlanta up to an amount equal to 10% of our bank’s total assets reported at the end of each previous quarter, which gave us the ability to borrow up to $13.5 million at September 30, 2005. At September 30, 2005, we had borrowed $1.0 million from the Federal Home Loan Bank. We also have the line of credit to borrow funds from Chase Bank up to $7.0 million. As of September 30, 2005, we had borrowed $2.5 million under this line.
Capital Resources
Our capital base increased by $406,702 for the nine months ended September 30, 2005, due to operating income and by unrealized gains on available for sale securities. Our Tier 1 capital to risk-weighted asset ratio was 7.81% as of September 30, 2005.
The Federal Deposit Insurance Corporation has established risk-based capital requirements for banks and the Federal Reserve has established similar requirements for bank holding companies that are applied to bank holding companies with more than $150 million in assets. As of September 30, 2005, we exceeded the adequately capitalized requirements of the Federal Reserve, and our bank exceeded the well capitalized and adequately capitalized requirements as shown in the table below. Our bank relies on “brokered” certificates of deposit as an important funding source for its loan portfolio. To be able to obtain “brokered” deposits without receiving prior approval of the FDIC, the bank must meet or exceed the ratios to be considered “well-capitalized.” As of September 30, 2005, the bank slightly exceeded the required ratios. However, we could borrow an additional $4.6 million under a pre-existing line of credit with Chase Bank, and inject it into the bank as Tier 1 or Tier 2 capital as needed to maintain the bank’s “well-capitalized” status for a period of time.
Capital Ratios
| Actual | Well Capitalized Requirement | Adequately Capitalized Requirement | ||||||||||||||||
| (Dollars in thousands) | Amount | Ratio | Amount | Ratio | Amount | Ratio | ||||||||||||
The Bank | ||||||||||||||||||
Total capital (to risk-weighted assets) | $ | 13,439 | 10.05 | % | $ | 13,371 | 10.00 | % | $ | 10,697 | 8.00 | % | ||||||
Tier 1 capital (to risk-weighted assets) | 8,816 | 6.59 | 8,023 | 6.00 | % | 5,348 | 4.00 | |||||||||||
Tier 1 capital (to average assets) | 8,816 | 6.68 | 6,594 | 5.00 | % | 5,275 | 4.00 | |||||||||||
The Company | ||||||||||||||||||
Total capital (to risk-weighted assets) | $ | 12,174 | 9.06 | % | N/A | N/A | $ | 10,754 | 8.00 | % | ||||||||
Tier 1 capital (to risk-weighted assets) | 10,493 | 7.81 | N/A | N/A | 5,377 | 4.00 | ||||||||||||
Tier 1 capital (to average assets) | 10,493 | 7.84 | N/A | N/A | 5,354 | 4.00 | ||||||||||||
34
Background
Carolina National Corporation was incorporated under the laws of South Carolina in May 2000 for the purpose of becoming the holding company for Carolina National Bank and Trust Company. We acquired our bank on July 12, 2002.
At the time of our incorporation, we had only a few organizers whose immediate goal was to assemble a group of organizers and directors that would be recognized as a strong board of successful people with strong ties to the community, and to find the right locations for our bank’s offices in order to file an application for a national bank charter. A chief executive officer was employed at the outset and given primary responsibility for finding appropriate locations for our bank’s main office and branch as well as helping assemble the board of directors. Locating and negotiating leases of the right locations for our bank’s offices proved to be a lengthy process. Similarly, it took a considerable amount of time to assemble the desired board of directors because several of the desired directors had prior commitments that had to be reconciled before they could commit to join us.
As a result of the time expended in choosing our locations and directors, we took a somewhat longer period of time in the phase between our inception and filing of our national bank charter application and incurred higher organizational expenses than is typical to new bank and holding company organization in South Carolina. Higher organizational expenses resulted primarily from having a highly compensated chief executive officer employed from the outset of the extended organizational process. The chief executive officer subsequently terminated his relationship with us and was paid a severance package which also increased the expenses. See “Management—Certain Relationships and Related Transactions.”
Because of the desirability of the locations obtained and the strength of our director team, our management believes that the resulting delay in filing the charter application and increase in organizational expenses was in our long term best interest.
For the foreseeable future, we expect that our primary business activity will be ownership and operation of our bank. At some point in the future, if our directors determine that it is appropriate to do so and any necessary regulatory approvals can be obtained, we may engage in other activities permitted for bank holding companies and may organize or acquire additional banks.
Organization of Carolina National Bank and Trust Company
On December 3, 2001, the organizers of our bank filed an application to obtain a national bank charter with the Comptroller of the Currency. The Comptroller of the Currency approved the application and our bank opened on July 15, 2002. The organizers also submitted an application to the FDIC for the insurance of our bank’s deposit accounts which was also approved. Accordingly our bank’s deposits are insured by FDIC up to the limits provided by law.
Management Team
Roger B. Whaley and Rollo F. Ingram are our only executive officers. Information about Mr. Whaley and Mr. Ingram is set forth under “Management—Executive Officers.” In addition to Mr. Whaley and Mr. Ingram, our bank’s senior management team consists of William Jack McElveen, Sr., John W. Long II, Mary Ellis Gabriel and Kathy Morales.
Mr. McElveen, age 42, is our senior credit officer. He is a graduate of Clemson University and has 21 years of banking experience with Bankers Trust of South Carolina, NCNB, First Union, First National Bank and our bank.
35
Mr. Long, age 34, is our commercial bank executive. He is a graduate of Clemson University and has 11 years of banking experience with South Carolina National Bank, Bank of Firstland, First Community Bank, Southtrust Bank and our bank.
Ms. Gabriel, age 36, is our consumer bank executive. She has a bachelor’s degree from Clemson University and a Master of Business Administration from the University of South Carolina and has 11 years of banking experience with NationsBank, Bank of America and our bank.
Ms. Morales, age 35, is our vice president—operations. She attended Georgia State University and has 19 years of banking experience with Bank South, N.A., NationsBank, First Virgin Islands FSB, First Citizens Bank and our bank.
Management Philosophy and Policy
We believe that, with the increased demand for banking services arising from steady growth in population and personal income, the banking market will continue to grow in the Greater Columbia area. Our growth demonstrates that there is a market for a locally owned and managed bank to serve the needs of the community, including individuals and small and medium-sized business enterprises. We concentrate on this hometown market with a professional staff that is sensitive to local needs.
We provide personalized banking services to satisfy the needs of our customers, while investing our funds in accordance with sound banking practices and striving to earn the maximum profit for shareholders. Our growth strategy has the following components:
| • | Expand our branch network. We intend to expand our footprint by establishing new branches or acquiring existing branches from other financial institutions that present attractive growth opportunities within the Greater Columbia market. We have received approval from the Office of the Comptroller of the Currency to open a third full service branch by the end of 2005 and plan to open four other new branches over the next two to three years. |
We believe that with the increased demand for banking services arising from steady growth in population and personal income, the banking market will continue to grow in Columbia. Our growth demonstrates that there is a market for a locally owned and managed bank to serve the needs of the community, including individuals and small and medium-sized business enterprises. We concentrate on this hometown market with a professional staff that is responsive to local needs and believe we are well positioned to take full advantage of the demographic and economic characteristics of our market area. Our existing and planned new branches should provide us with the core deposit growth needed to support continued asset and loan growth resulting from our planned hiring of additional loan officers.
| • | Continue our successful recruiting practices. We have taken a two-pronged approach to recruiting our commercial bankers. First, we have hired highly experienced local banking professionals with successful track records and established customer relationships. We currently have four seasoned commercial loan officers with an average of over 20 years of experience in the financial services industry. Our plan calls for the hiring of three additional seasoned in-market commercial bankers by the end of 2006 to support loan growth as we expand our footprint. Second, we have hired five high caliber college graduates and have trained them to be our future leaders. Two of them have become commercial loan producers. Two others have assumed staff support roles and another is training to become a branch manager. We plan to hire two college graduates each year as we continue to develop our future banking professionals internally. |
We provide personalized banking services, with emphasis on knowledge of the individual financial needs and objectives of our customers and an appropriate array of services to meet those needs and objectives, coupled with timely response. We seek to promote continuous long-term relationships between officers and customers by minimizing transfers of account officers to different customers,
36
departments or locations. We seek to manage the number of accounts served by each officer in a manner that will permit personal attention to each customer and full development of each customer’s business relationship with us. Because our management is located in Columbia, all credit and related decisions are made locally, which facilitates prompt response.
| • | Capitalize on the continued bank consolidation in our market. A considerable amount of consolidation among financial institutions has occurred in South Carolina over the past decade. Many independent community banks have been acquired by larger regional institutions that are headquartered outside the state. We believe this consolidation creates an opportunity for us to increase our market share of deposits as well as attract disenchanted customers seeking the more personalized service that a local community bank can offer.One of our primary objectives is to provide citizens and small and medium-sized businesses of Greater Columbia with more opportunity to have their banking needs met locally. Our directors live in and are involved extensively in business in the Greater Columbia market area and we have made meeting the credit needs of this area a first priority. We believe that a large number of potential bank customers will prefer our local bank which can make credit decisions locally and quickly, and that this preference should result in a successful and profitable operation for us. |
| • | Expand our lending activities while maintaining excellent asset quality. We are undertaking our branch expansion strategy to build a stable and growing base of “core” deposits to help fund our loan growth. With an increased legal lending limit as a result of this offering and broadened deposit base we plan to aggressively grow our loan portfolio while maintaining superior asset quality through conservative underwriting practices. We do not expect there to be any material changes to the fundamental composition of our loan portfolio or to its overall credit quality. Since inception we have had minimal charge-offs and have never had a loan more than 30 days past due at any reporting period end. While we believe this exceptional record illustrates the quality of our loan portfolio, it is not necessarily indicative of the results that may be expected in the future. Like other lending institutions, we expect to have past due loans and loan charge-offs. |
Market Area
Columbia is South Carolina’s capital city, the largest city in the state and the county seat of Richland County. Richland County and adjoining Lexington County are our primary target markets for the next few years. South Carolina is located in the southern region of the United States, which is one of the fastest growing areas in the country. From 1998 to 2003, the combined population of Richland and Lexington counties grew 9.5% to 538,275 and continued growth is expected for the foreseeable future. Per capita income in Richland County was $26,144 in 2003, a 13.7% increase from 1998. Per capita income in Lexington County was $30,048 in 2003, a 20.3% increase from 1998. FDIC insured deposits in the combined counties increased by 45.2% to $7.3 billion from 1998 to 2003.
Columbia is geographically positioned in the center of South Carolina and serves as its economic hub. The city is located approximately midway between the industrialized Upstate region of South Carolina and the bustling coastal city of Charleston. Charleston, which is the busiest container shipping port along the Southeast and Gulf coasts, provides ready access to international markets. Columbia’s strategic location and interstate highway networks have contributed greatly to its overall commercial growth, particularly warehousing and distribution. Three major interstate highways serve Columbia (I-20, I-77 and I-26), directly connecting Columbia to Charlotte, Atlanta, Greenville and Charleston and providing access to other important centers of commercial activity.
Columbia, as the capital city of the state, is the center of government on city, county, state and federal levels. Government exercises a substantial stabilizing influence on the area economy as a purchaser, service provider and employer. Federal, state and local governments are the area’s largest employers. Established in World War I, Fort Jackson is the largest and most active Initial Entry Training Center of the United States Army. Recent decisions of the Federal Base Realignment and Closure Commission may result in an expansion of
37
programs and employment at Fort Jackson. There are eight institutions of higher education in the Columbia area with an aggregate enrollment in excess of 40,000 students, including the University of South Carolina which has the state’s largest number of enrollees in higher education with over 25,000 students.
Business and Employers. Major employment sectors include health care, finance and insurance, retail, services, public administration and manufacturing. Major private sector employers in the region include Palmetto Health Alliance, Blue Cross and Blue Shield of South Carolina, Wal-Mart, Lexington Medical Center, SCANA Corporation, Providence Hospital and Michelin Tire Corporation. At the other end of the employment scale, in 2003 Lexington and Richland counties had a combined total of 14,063 businesses with fewer than 100 employees, which represents our primary target market.
Transportation. Columbia’s strategic location and interstate highway networks have stimulated its overall commercial and industrial growth, particularly warehousing and distribution. Three major interstate highways serve Columbia (I-20, I-77 and I-26), directly connecting it to the commerce centers referred to above and providing important access other important centers of commerce. The Southeastern Beltway linking I-77 to I-26 has significantly enhanced the accessibility and development potential of Forest Acres, Arcadia Lakes and the rest of Columbia’s east side.
The Columbia Metropolitan airport is located 6.5 miles southwest of Columbia and provides service by Continental Airlines, Delta Air Lines and Delta Connection, Independence Air, Northwest Airlines, United Express and US Airways Express. The major air cargo companies serving the airport include Airborne Express, Emery Worldwide, Federal Express, and United Parcel Service. United Parcel Service has a regional air hub at the airport, which allows local firms to ship more quickly and is drawing new distribution firms to the area. The UPS hub is a magnet for new industries and jobs, particularly for catalog operations, light manufacturing and businesses with time-sensitive shipments.
Rail transportation in the region is provided by Norfolk-Southern and CSX Systems. Amtrak Silver Star serves the Columbia area with passenger rail service from its downtown station. Port services are available from Charleston (two hour drive) or Savannah, Georgia (three hour drive). The city is well located to expedite shipping, transportation, and distribution processes.
Medical and Health Services. The Columbia area is a regional health center with five primary acute care hospitals: Palmetto Health Richland, Palmetto Health Baptist, Providence Hospital and Providence Hospital North East located in Columbia and Lexington Medical Center, a major medical facility located within Lexington County. Palmetto Health Baptist, which was founded in 1914, has approximately 1,850 employees and 800 physicians. Established more than a century ago, Palmetto Health Richland is a regional community teaching medical center. Some 3,324 employees and a medical and dental staff of approximately 900 provide a wide range of primary and specialty healthcare. In addition, Palmetto Health Richland has a Neonatal Intensive Care Unit. Palmetto Health offers a total of 12 medical residency programs at its two teaching hospitals, Palmetto Health Richland and Palmetto Health Baptist Columbia with more than 180 residents on staff.
38
Higher Education. There are eight institutions of higher education in the Columbia area, the largest being the main campus of the University of South Carolina, which is South Carolina’s largest university. The table below lists these institutions and their Fall 2004 enrollment.
College/University | Enrollment | |
University of South Carolina (Columbia Campus) | 25,596 | |
Midlands Technical College | 10,710 | |
Benedict College | 2,769 | |
Columbia College | 1,453 | |
Columbia International University | 1,016 | |
Allen University | 567 | |
South University | 351 | |
Lutheran Theological Southern Seminary | 192 |
Midlands Technical College (“MTC”) is one of 16 technical colleges and technical education centers that make up the South Carolina Technical Education System. There are three campuses located within the Columbia area. MTC has opened their first building—theCenter of Excellence for Technology—on the college’s new 150-acre campus called Campus for Enterprise Development. This campus is located in Northeast Columbia.
Military. Fort Jackson was established in 1917 and designated as a permanent post of the United States Army in 1940. The fort is the largest and most active Initial Entry Training Center in the United States Army, providing training to almost 50% of the men and women who enter the service each year. Fort Jackson, annexed into the City of Columbia in October, 1968, has a significant economic impact on the Midlands area. Annually, expenditures by Fort Jackson are in excess of $500 million for salaries, utilities, contracts and other services. The Fort encompasses more than 52,000 acres of land including over 50 ranges and field training sites and 1,000 buildings.
Soldiers, civilians, retirees and family members make up the Fort Jackson community with approximately 1,266 family housing units located on the post. The installation instructs an average of 35,000 soldiers in basic training and advanced individual training each year. The Fort employs 3,900 civilians and provides services for more than 100,000 retirees and their family members. Recent decisions of the Federal Base Realignment and Closure Commission may result in an expansion of programs and employment at Fort Jackson.
Other Government and Related Influence. Columbia, as the capital city of the state, is the center of government on city, county, state and federal levels. Many services are performed as joint ventures between city and county government such as water and sanitary sewer service, fire protection and emergency medical treatment. The city’s public water and sewer systems are quite good and are believed to provide for adequate capacity for expansion. Government exercises a substantial stabilizing influence on the area economy as a purchaser, service provider and employer. Federal, state and local governments are the area’s largest employers.
(Statistical and rank data in “Description of Business—Market Area” and in “Summary—The Columbia Market” was obtained from data published by the U. S. Census Bureau; the South Carolina Budget and Control Board, Office of Research and Statistics; the Central SC Alliance; South Carolina Commission on Higher Education; the Greater Columbia Chamber of Commerce, the City of Columbia, the South Carolina State Ports Authority and the Columbia Metropolitan Airport.)
Competition
Competition among commercial banks, thrift institutions (savings and loan associations) and credit unions has intensified significantly as a result of the elimination of many previous distinctions among the various types of financial institutions, and the expanded powers and increased activity of thrift institutions in areas of banking that previously had been the sole domain of commercial banks. Legislation, together with regulatory changes by
39
the primary regulators of the various financial institutions, has resulted in the elimination of many of the historic distinctions between a commercial bank and thrift institution. Consequently, competition among financial institutions of all types is virtually unlimited with respect to legal authority to provide most financial services.
We principally compete in Columbia, South Carolina, for which the most recent market share data available from the FDIC is as of June 30, 2005. At that time, 15 banks and savings banks with 91 branch locations competed in Columbia for aggregate deposits of approximately $7.2 billion. In Columbia, our bank had a deposit market share of 1.68% and a market share rank of seven. This was an improvement from a deposit market share of 0.59% and a market share rank of 13 at June 30, 2003. We do not presently have any market share as reported by the FDIC for Richland County outside of Columbia, or for Lexington County. At June 30, 2005, 16 banks and savings banks with 97 branch locations competed in Richland County for $7.3 billion in aggregate deposits, and 12 banks and savings banks with 57 branch locations competed in Lexington County for $2.6 million in aggregate deposits.
Since interstate banking was first permitted, an overwhelming number of Columbia’s locally based commercial banks have been acquired, mostly by large regional out-of-state banks. Of the 14 commercial banks and savings banks with branch offices in Columbia, six are owned and controlled out of state, and only five (one of which is our bank) of the remaining eight are headquartered in Richland or Lexington County.
We encounter strong competition from most of these financial institutions. In the conduct of certain areas of our business, we also compete with credit unions, insurance companies, money market mutual funds and other financial institutions, some of which are not subject to the same degree of regulation and restrictions under which we operate. Most of these competitors have substantially greater resources and lending abilities than we have and offer certain services, such as international banking, investment banking, and trust services, that we do not currently provide.
The principal areas and methods of competition in the banking industry are the services offered, pricing of those services, the convenience and availability of the services, and the degree of expertise and personal manner with which those services are offered. As discussed above under “—Management Philosophy and Policy”, our directors believe that we will be able to continue to exploit opportunities available for a locally-owned community bank so that our bank can compete effectively in those areas, but no assurance can be given that we will be able to do so.
Deposits
We offer a full range of deposit services typically available in most banks and savings and loan associations, including checking accounts, NOW accounts, and savings and other time deposits of various types, ranging from daily money market accounts to longer-term certificates of deposit. The transaction accounts and time certificates are tailored to the principal market area at rates competitive with those offered in the area. In addition, retirement accounts such as Individual Retirement Accounts are available. All deposit accounts are insured by the FDIC up to the maximum amount permitted by law. We solicit these accounts from individuals, businesses, associations and organizations, and government authorities.
Lending Activities
We emphasize a range of lending services, including real estate, commercial and consumer loans.
To address the risks inherent in making loans, our management maintains an allowance for loan losses based on, among other things, an evaluation of loan loss experience, management’s experience at other financial institutions in the market area, the amount of past due and nonperforming loans, current and anticipated economic changes and the values of certain loan collateral. Based upon such factors, management makes various assumptions and judgments about the ultimate collectibility of the loan portfolio and provides an allowance for
40
loan losses to cover the estimated losses inherent in the loan portfolio. However, because there are certain risks that cannot be precisely quantified, management’s judgment of the allowance is necessarily approximate and imprecise. The adequacy and methodology of the allowance for loan losses is subject to regulatory examination and compared to a peer group of financial institutions identified by the regulatory agencies.
Real Estate Loans. One of the primary components of our loan portfolio is loans secured by first or second mortgages on residential and commercial real estate. These loans generally consist of commercial real estate loans, construction and development loans and residential real estate loans (including home equity and second mortgage loans). Interest rates may be fixed or adjustable and we generally charge an origination fee. Fixed rate residential loans are originated for the secondary market and not held in the portfolio. These loans are funded by the investor and we earn a fee but avoid the interest rate risk of holding long-term, fixed-rate loans. We seek to manage credit risk in the commercial real estate portfolio by emphasizing loans on owner-occupied office and retail buildings where the loan-to-value ratio, established by independent appraisals, does not exceed 85 to 90%. The loan-to-value ratio for first and second mortgage loans and for construction loans does not exceed 80 to 90%. In addition, we may require personal guarantees of the principal owners of the property.
The principal economic risk associated with all loans, including real estate loans, is the creditworthiness of our borrowers. The ability of a borrower to repay a real estate loan depends upon a number of economic factors, including employment levels and fluctuations in the value of real estate. In the case of a real estate construction loan, there is generally no income from the underlying property during the construction period. Each of these factors increases the risk of nonpayment by the borrower. In the case of a real estate purchase loan, the borrower may be unable to repay the loan at the end of the loan term and may thus be forced to refinance the loan at a higher interest rate, or, in certain cases, the borrower may default as a result of its inability to refinance the loan. In either case, the risk of nonpayment by the borrower is increased.
We face additional credit risks to the extent that we engage in making adjustable rate mortgage loans (“ARMs”). In the case of an ARM, as interest rates increase, the borrower’s required payments increase, thus increasing the potential for default. The marketability of all real estate loans, including ARMs, is also generally affected by the prevailing level of interest rates.
Commercial Loans. We make loans for commercial purposes in various lines of business. The commercial loans include both secured and unsecured loans for working capital (including inventory and receivables), loans for business expansion (including acquisition of real estate and improvements), Small Business Administration (“SBA”) loans for new businesses (as well as other governmentally guaranteed business loans), and loans for purchases of equipment and machinery. Equipment loans are typically made for a term of five years or less at either fixed or variable rates, with the loan fully amortized over the term and secured by the financed equipment. Working capital loans will typically have terms not exceeding one year and will usually be secured by accounts receivable, inventory or personal guarantees of the principals of the business. Commercial loans will vary greatly depending upon the circumstances and loan terms will be structured on a case-by-case basis to better serve customer needs.
The risks associated with commercial loans vary with many economic factors, including the economy in our market area. The well-established banks in our market area will make proportionately more loans to medium- to large-sized businesses than we make. Many of our anticipated commercial loans are likely be made to small- to medium-sized businesses, which typically have shorter operating histories, and less sophisticated record keeping systems than larger entities. As a result, these smaller entities may be less able to withstand adverse competitive, economic and financial conditions than larger borrowers. In addition, because payments on loans secured by commercial property generally depend to a large degree on the results of operations and management of the properties, repayment of such loans may be subject, to a greater extent than other loans, to adverse conditions in the real estate market or the economy.
41
Consumer Loans. We make a variety of loans to individuals for personal and household purposes, including secured and unsecured installment and term loans, home equity loans and lines of credit and unsecured revolving lines of credit such as credit cards. The secured installment and term loans to consumers generally consist of loans to purchase automobiles, boats, recreational vehicles, mobile homes and household furnishings, with the collateral for each loan being the purchased property. The underwriting criteria for home equity loans and lines of credit will generally be the same as applied when we make a first mortgage loan, as described above, and home equity lines of credit will typically expire 15 years or less after origination, unless renewed or extended.
Consumer loans generally involve more credit risks than other loans because of the type and nature of the underlying collateral or because of the absence of any collateral. Consumer loan repayments are dependent on the borrower’s continuing financial stability and are likely to be adversely affected by job loss, divorce and illness. Furthermore, the application of various federal and state laws, including federal and state bankruptcy and insolvency laws, may limit the amount which can be recovered on such loans in the case of default. In most cases, any repossessed collateral will not provide an adequate source of repayment of the outstanding loan balance. Although the underwriting process for consumer loans includes a comparison of the value of the security, if any, to the proposed loan amount, we cannot predict the extent to which the borrower’s ability to pay, and the value of the security, will be affected by prevailing economic and other conditions.
Loan Approval and Review. Our loan approval policies provide for various levels of officer lending authority. When the amount of aggregate loans to a single borrower exceeds an individual officer’s lending authority, the loan request will be considered and approved by our senior credit officer, (an officer with a higher lending limit or by the loan committee of the board of directors). The loan committee sets the lending limits for the chief executive officer and the senior credit officer and they set the limits for our other loan officers. Any loan in excess of the officers’ lending limits must be approved by the loan committee. We will not make any loans to any director, officer or employee of the bank unless the loan is approved by the bank’s board of directors, or a committee thereof, and is made on terms not more favorable to such person than would be available to a person not affiliated with the bank.
Other Services
We participate in a regional network of automated teller machines that may be used by our customers in major cities throughout the Southeast. We offer both VISA and MasterCard brands of bank cards together with related lines of credit. The lines of credit may be used for overdraft protection as well as pre-authorized credit for personal purchases and expenses.
We provide safe deposit boxes, travelers checks, direct deposit of payroll and social security checks, banking by mail, and automatic drafts for various accounts, but will not provide international or trust banking services in the near future.
Asset and Liability Management
Our primary earning assets consist of the loan portfolio and investment portfolio. Efforts are made generally to match maturities and rates of loans and the investment portfolio with those of deposits, although exact matching is usually not possible. The majority of our securities investments are in marketable obligations of the United States government, federal agencies and state and municipal governments, with varied maturities.
Long-term loans are priced primarily to be interest-rate sensitive. Long-term fixed rate loans are not generally held in the portfolio, but, rather, are usually originated for and funded by investors in the secondary market.
Deposit accounts represent the majority of our liabilities. These include transaction accounts, time deposits and certificates of deposit. The maturities of the majority of interest-sensitive accounts are generally 12 months or less.
42
Properties
Our main offices are located at 1350 Main Street, on the corner of Main and Washington Streets, in downtown Columbia. The space, which comprises approximately 9,718 square feet on three floors, was previously used as a bank. We have a branch office at 4840 Forest Drive in an approximately 2,600 square foot building that also was previously used as a bank branch. This branch facility has ample parking and four drive-through teller stations. We also lease a parcel of land one block from our main office on which we operate a drive-up facility, and office space in the St. Andrews area of western Richland County from which we operate a loan production office. We have recently leased a building that was previously used as a bank at the corner of Two Notch Road and Sparkleberry Lane in Northeast Columbia in which we intend to open a new branch office during 2005. All these properties have been leased under long term leases. We intend to open other offices in the Columbia area within the next few years. We believe that all of our facilities are well suited for their purposes.
Employees
We have 30 full-time equivalent employees. We seek to provide our employees with competitive benefits, which should enable us to attract and retain quality employees.
Legal Proceedings
We are not involved in any pending legal proceedings other than legal proceedings occurring in the ordinary course of business. Our management does not believe that such legal proceedings, individually or in the aggregate, are likely to have a material adverse effect on our results of operations or financial condition.
43
Directors
The directors of the company are also the directors of the bank. Directors of the company serve three-year terms and are divided into three classes, with approximately one-third of the board elected each year at the annual meeting of the shareholders.
Set forth below is information about the recent business experience and community activities of our directors. Each director has been a director since 2001.
Directors whose terms of office continue until the Annual Meeting of Shareholders in 2008
Kirkman Finlay, III, age 35, is an officer or an owner of a number of companies involved in the real estate business, farming or investment. Since 1996, he has been the chief executive officer and an owner of Rising High Natural Bread Co., a bakery and restaurant. He is also board chairman of Quickfarm, Inc., an internet service developer for agricultural businesses. Mr. Finlay serves on the board of the Central Carolina Community Fund, the Palmetto Health Foundation and the Indian Waters Council of the Boy Scouts of America. He is co-chairman and co-founder of the Gray Horton Scholarship at the University of Virginia. Mr. Finlay is a graduate of the University of Virginia.
R. C. McEntire, Jr., age 62, has been president and operator of each of McEntire Produce, Inc. (produce processing and sales), Lands Inn, Inc. (hotels) and Long Branch Farm, Inc. (landscape tree farm) since before 1996. Mr. McEntire is founder and a current and former member of the board of the International Fresh Cut Produce Association; a former president and member of the board of the South Carolina Fresh Fruit and Vegetable Association; and a former member of the board of W. B. Guimarin & Co., Inc. (mechanical contractor). Mr. McEntire has previously served as a member of the board of Heathwood Hall Episcopal School, and is a lifetime member of the Coastal Conservation Association. Mr. McEntire is a graduate of the University of South Carolina with a B.S. degree.
Joel A. Smith, III, age 60, has been dean of the Darla Moore School of Business since October of 2000. From June of 1998 until August of 2000, Mr. Smith was president of the East Region of Bank of America. Prior to that time, from 1991 through June of 1998, Mr. Smith was president of NationsBank Carolinas. Mr. Smith serves on the following boards: South Carolina Business Center for Excellence in Education; and South Carolina ETV Endowment. He is a member of the Board of Regents for the University of the South, Sewanee, Tennessee. He is also a member of the board of Spoleto Festival USA and co-chaired the 25th Anniversary Campaign. Additionally he serves on the board of Avanex Corporation, and the board of directors for NETBANK, Inc., chairing the compensation committee. In May 2001, Mr. Smith was inducted into the South Carolina Business Hall of Fame and for 2000, Mr. Smith was named Humanitarian of the Year by the United Way. During 1997 he was named the South Carolina Economic Development Volunteer of the Year by the Central Carolina Midlands Economic Development Alliance, Committee of 100. He received the “Tree of Life” award from the National Jewish Fund, and was awarded Honorary Degrees from South Carolina State University, Fayetteville State University and the University of South Carolina, Aiken. In 1994, he received the Businessman of the Year award from the South Carolina Chamber of Commerce. Mr. Smith is a graduate of the University of the South, the National Commercial School of Lending at the University of Oklahoma and the School of Banking of the South of Louisiana State University.
Robert E. Staton, Sr., age 59, has been president of the United Way of South Carolina since 2002. He was chairman, president and chief executive officer of Colonial Life & Accident Insurance Company from 1994 until his retirement in July of 2001. He also currently serves on the board of New South, Inc., based in Conway, South Carolina. Mr. Staton is Chair of the South Carolina Education Oversight Committee. Mr. Staton is a member of the board of trustees of Presbyterian College, serves on the executive committee of the board of directors and
44
chairs the college’s capital campaign. Mr. Staton has previously served as chairman of each of: the Palmetto Business Forum; Alliance for Excellence in Education; the Greater Columbia Chamber of Commerce; the South Carolina Chamber of Commerce Education Council; United Way of the Midlands; the Cultural Council of Lexington and Richland Counties; and the Columbia Urban League. Mr. Staton has also served as an elder and clerk of session at Saxe Gotha Presbyterian Church. In 2001, Mr. Staton received the Humanitarian of the Year award from United Way of the Midlands, and in 2000, he received the Ambassador of the Year award from the Greater Columbia Chamber of Commerce, and the Outstanding Volunteer Fundraiser award from the National Society of Fund Raising Executives. In 1998, Mr. Staton was named South Carolina Business Leader of the Year by the South Carolina Chamber of Commerce. Mr. Staton graduated from Presbyterian College with a B.A. in economics and from the University of South Carolina School of Law with a Juris Doctor.
Directors whose terms of office continue until the Annual Meeting of Shareholders in 2007
William P. Cate, age 61, was general manager of South Carolina operations for Snider Tire, Inc., Greensboro, North Carolina, from 2000 until his retirement January 1, 2002. From 1968 until sale of the company to Snider Tire in 2000, Mr. Cate was chairman, chief executive officer and an owner of Cate-McLaurin Co., Inc., a commercial tire sales and retreading business. Mr. Cate presently represents Milliken Forestry Co. in timberland and farm land sales. Mr. Cate is also a farmer and is a past chairman of the South Carolina Forestry Association. Mr. Cate has served on the Clemson University board of visitors and the Clemson University Forestry School advisory board, the board of directors of the Richland County Cattleman’s Association, and the Congaree Land Trust. Mr. Cate is a graduate of Clemson University with a B.S. in Agricultural Economics.
Angus B. Lafaye,age 60, has been president of Milliken Forestry Co., Inc., a forestry consulting business, since 1998. Mr. Lafaye was vice president and treasurer of Milliken Forestry Co. from 1985 to 1998. Mr. Lafaye is also a licensed realtor and a registered forester. Mr. Lafaye is a director of the South Carolina Forestry Association. Mr. Lafaye is also a member of the Society of American Foresters and is chairman of the insurance committee of the Association of Consulting Foresters. He is also a member of the Rural Appraiser and Farm Managers Association, the Congaree Land Trust, and the Forest Land Owners Association. Mr. Lafaye is a graduate of Clemson University with a B.S. in Forest Management.
Leon Joseph Pinner, Jr., age 70, has been in radio and television since 1950 and has been with WIS-TV since 1963. In January 2001, he semi-retired from WIS and became a free lance broadcaster. Mr. Pinner serves on the board of South Carolina Safe Kids Coalition, the Juvenile Diabetes Research Foundation—Palmetto Chapter, Cultural Connections with ties to Japan, and is a member of the Friday the 13th Club, the Media Club, Columbia Community Relations Council Luncheon Club and the Trinity UMC Choir in Blythewood. Mr. Pinner continues to be actively involved in events around the state and nation, primarily as an emcee, speaker and promoter of many causes, and has been the recipient of numerous honors in recognition of his achievements including: the 1967 Peabody Award for Excellence in Broadcasting, the Order of the Palmetto for service to the state, the 1997 United Way of the Midlands Humanitarian of the Year Award, the 1993 South Carolina Broadcasters Masters Award and 2001 Honorary Lifetime Member Award, the Cultural Council 2001 Kirkman Finlay Award, and the Cooperative Ministry 2002 Outstanding Community Service Award. He is also a Rotary Club Paul Harris Fellow, a 1998 South Carolina Entertainment Hall of Fame Inductee, a 1998 USC School of Journalism and Mass Communication “Diamond Circle” inductee, Emperor of Little Mountain, and Honorary Colonel of Fort Jackson. Since 1965, he has served as emcee/narrator for the South Carolina Philharmonic Orchestra Youth concerts. Mr. Pinner attended the University of North Carolina, Chapel Hill to major in radio and television.
Joe E. Taylor, Jr. age 47, is a private investor. He was the founder, president and owner of Southland Log Homes, Inc. from 1980 until its sale in February 2005. Mr. Taylor is currently a member of the board of Southland Log Homes, Inc., Champion Concrete, Park and Washington, LLC and Airoom Inc. He also serves on the board of Business Carolina, Inc., a not-for-profit SBA lending firm, and as the chairman of the South Carolina Jobs—Economic Development Authority. Mr. Taylor has previously served as a member of the board
45
of each of the Columbia Museum of Art, the Cultural Council of Richland and Lexington Counties, the Central Carolina Community Foundation, and the President’s Advisory Board of Wofford College. Mr. Taylor is also a member of the board of advisors of the Indian Waters Council of the Boy Scouts of America. Mr. Taylor is a past chairman of the Building Systems Council, Washington, D.C., and a past member of the executive committee of the National Association of Home Builders. He is also past president of the Log Home Council. Mr. Taylor was educated at Wofford College.
Roger B. Whaley, age 59, has served as president and chief executive officer of the company and the bank since November 2001. Mr. Whaley was chief operating officer of Southern Financial Group, an investment firm, from November of 2000 until November, 2001. From 1971 until his retirement in August of 2000, Mr. Whaley was with Bank of America, where for the last four years of employment he served as president of Bank of America, Oklahoma, and, in 1999, also assumed responsibilities as small business banking executive for the Midwest (Arkansas, Illinois, Iowa, Kansas, Missouri and Oklahoma). Prior to employment in Oklahoma, Mr. Whaley was with Bank of America and its predecessors in South Carolina for 25 years, where he held progressive positions from branch manager to executive vice president and Consumer and Community Banking Division executive for South Carolina. Mr. Whaley has served as a director of the South Carolina Chamber of Commerce, the South Carolina State Museum, Coker College and the South Carolina Bankers Association (vice chairman and treasurer). Mr. Whaley is former chairman of the River Alliance, former campaign chairman of the United Way of the Midlands, and former chairman of the South Carolina Business in Partnership Political Education Committee. Mr. Whaley is a recipient of the Order of the Palmetto. Mr. Whaley currently serves as Chairman of the Advisory Board of Allen University; Board Member of The River Alliance; Board Member, Executive Committee Member and Treasurer for City Center Partnership; Board Member and Chairman of the Audit Committee for the American Red Cross and is a member of the South Carolina Bankers Association. Mr. Whaley is a graduate of the University of South Carolina with a B.S. in Banking, Finance and Insurance. Mr. Whaley also graduated from undergraduate and graduate Commercial Lending School at the University of Oklahoma as a certified commercial lender.
Directors whose terms of office continue until the Annual Meeting of Shareholders in 2006
Charlotte J. Berry, age 74, is active in numerous local and national charitable organizations. She is presently serving as Founding chairman of the American Red Cross National Museum Committee (History and Education Center), and has previously served in many capacities with the American Red Cross, including among others, vice-chairman of the board of governors; chairman, disaster and community services; national chairman, volunteer American Red Cross; chairman, eastern operation headquarters; chairman SEFO advisory council; financial development committee; regional blood services committee; chapter chairman; vice chairman, building fund steering committee; executive committee; and long range planning committee. Mrs. Berry was recently a member of the South Carolina regional advisory board of Wachovia Bank, and a member of the board of directors of each of: the Central Carolina Community Foundation; United Way of the Midlands; Cultural Council of Lexington and Richland Counties; South Carolina Independent Colleges and Universities; South Carolina State Museum Foundation; Columbia Museum of Art; and the Capital Senior Center. She also serves as a member of: the advisory board of the Nurturing Center; the board of trustees of Mary Baldwin College; the board of trustees of College of Charleston; the national leadership council, Alexis de Tocqueville society, United Way of America; advisory board of Benedict College; and national board of directors, Volunteers of America. Mrs. Berry has previously served as chair of United Way of South Carolina and chair of United Way of the Midlands. Mrs. Berry is the recipient of numerous awards, including: Greater Columbia Chamber of Commerce Ambassador of the Year; National Society of Fund Raising Executives Philanthropy Award; Columbia Urban League Humanitarian Award; Sertoma Service to Mankind Award (local and district); Leadership Award, American Red Cross-Central South Carolina Chapter; Harriman Award, American National Red Cross; and BellSouth “Neighbor to Neighbor” Award. Mrs. Berry is a graduate of Mary Baldwin College with a B.A. in psychology.
46
I. S. Leevy Johnson, age 62, has been an attorney with Johnson, Toal & Battiste, P.A. since 1976. Mr. Johnson is also an owner of Leevy Johnson Funeral Home, Inc. Mr. Johnson is a recipient of the Durant Award from the South Carolina Bar, the Compleat Lawyer Award from the University of South Carolina School of Law, the John W. Williams Award from the Richland County Bar, and the Matthew J. Perry Medallion from the Columbia Lawyers Association. Mr. Johnson was one of the first three African-Americans elected to the South Carolina General Assembly since reconstruction, and the first African-American elected president of the South Carolina Bar. Mr. Johnson has been inducted as a fellow of the American Bar Association and as a member of The American College of Trial Lawyers. Mr. Johnson is a former chairman of the board of trustees of South Carolina State College. Mr. Johnson is a recipient of the Order of the Palmetto award, and has been recognized for Outstanding Leadership as a Director of the Columbia Development Corporation and has been recognized by the Committee of 100 for enhancing economic development. Mr. Johnson has served as a director of First Union Bank of the Carolinas, First Union National Bank of South Carolina, Southern Bank & Trust Company and Victory Savings Bank. Mr. Johnson has also served as a member of the executive committee of the board of directors of First Union National Bank of South Carolina. Mr. Johnson is a graduate of Benedict College with a B.S. and a graduate of the University of South Carolina School of Law with a Juris Doctor. Mr. Johnson also has an Associate Degree in Mortuary Science from the University of Minnesota.
C. Whitaker Moore,age 58, has been a real estate broker with Coldwell Banker Tom Jenkins Realty since 1970. Mr. Moore was also an owner of the firm from 1994 to 1999. Mr. Moore was recognized as the number one producer in the nation for The Gallery of Homes franchise in 1977, and has been recognized as top producer in the Southeastern United States for Coldwell Banker for three consecutive years, and as top producer in Columbia for the past 25 years. Mr. Moore is currently the president of the University of South Carolina Associates, vice-president of the Palmetto Club, and on the board of the Salvation Army. He is a former director of each of Heathwood Hall Episcopal School, the Central Carolina Community Foundation, the Columbia YMCA and the Columbia Museum of Art and former president of the Columbia Kiwanis Club. Mr. Moore has also served on the vestry of Trinity Episcopal Cathedral. Mr. Moore is a graduate of the University of South Carolina with a B. S. degree.
William H. Stern, age 48, has been president of Stern & Stern and Associates, a commercial real estate development company, since 1984. Mr. Stern is the Vice Chairman of the South Carolina State Ports Authority, has served as a commissioner on the South Carolina Commission on Higher Education, and is a past chairman and current member of the board of the South Carolina Council on the Holocaust. Mr. Stern is a member of Beth Shalom Synagogue. Mr. Stern attended the University of Miami and the University of South Carolina.
Executive Officers
Roger B. Whaley and Rollo F. Ingram are our only executive officers. Information about Mr. Whaley is set forth above under “—Directors.”
Mr. Ingram, age 59, has served as our executive vice president and chief financial officer since June 2005. From August, 2004 until June, 2005, Mr. Ingram was senior vice president and chief financial officer of the Bank of Hiawasee, Hiawasee, Georgia. From June, 2000 to August, 2004 he was president of Atlantic Capital Corporation, a Stone Mountain, Georgia investment consulting firm. Mr. Ingram is a graduate of the University of Arkansas with a bachelor’s degree in mathematics and physics and holds a master’s degree in systems management from George Washington University. He is also a certified public accountant.
47
Executive Compensation
The following table sets forth information about our chief executive officer’s compensation for the year ended December 31, 2004. No other persons who were executive officers during 2004 earned $100,000 or more during the year ended December 31, 2004.
Summary Compensation Table
| Long Term Compensation Awards | ||||||||||||||||
Name and Principal Position | Year | Annual Compensation | Other Annual Compensation(1) | Number of Securities Underlying Options Awarded | All Other Compensation(2) | |||||||||||
| Salary | Bonus | |||||||||||||||
Roger B. Whaley | 2004 | $ | 150,000 | $ | 25,000 | $ | 19,211 | -0- | $ | 4,238 | ||||||
President and Chief | 2003 | $ | 135,000 | -0- | $ | 45,415 | -0- | $ | 4,516 | |||||||
Executive Officer | 2002 | $ | 135,000 | -0- | $ | 37,250 | 64,701 | -0- | ||||||||
| (1) | Includes for each of 2004, 2003 and 2002 an automobile allowance of $9,000; in 2003 and 2002, respectively, a relocation allowance of $26,329 and $23,671; in 2004 and 2003, respectively, club dues of $3,000 and $2,875; and in 2004, 2003 and 2002, respectively, medical insurance reimbursements of $7,211, $7,211 and $4,579. Mr. Whaley also participates in a group life insurance program that is available to all employees. |
| (2) | Amounts in this column represent our matching contributions to the 401(K) plan on Mr. Whaley’s behalf. |
Option Grants in Last Fiscal Year
No options were granted to our chief executive officer in 2004.
Option Exercises and Year End Options Outstanding and Values
No options were exercised by our chief executive officer during 2004. The following table sets forth information about options held by our chief executive officer at December 31, 2004.
| Number of Securities Underlying Unexercised Options 12/31/04 | Value of Unexercised In-the-Money Options 12/31/04(1) | |||||||||
Name | Exercisable | Unexercisable | Exercisable | Unexercisable | ||||||
Roger B. Whaley | 38,821 | 25,880 | $ | 135,874 | $ | 90,580 | ||||
| (1) | Based on a price of $13.50 per share, based on trades in 2004 of which the company is aware. Our common Stock is not, however, widely traded and such price may not be indicative of market value. |
Employment Agreements
Roger B. Whaley. We have entered into an employment agreement with Mr. Whaley, which provides for his employment as president and chief executive officer of the company and our bank. The agreement commenced on the date of opening of our bank, July 15, 2002, and was for an initial term of two years. Beginning on the first anniversary of opening of our bank, and on each day thereafter, the term of the agreement is automatically extended for an additional day unless, prior to such extension, Mr. Whaley, the company or the bank gives written notice to the other parties that the agreement will not be extended.
The agreement provides for payment to Mr. Whaley of an initial base salary of $135,000 per year, which our board of directors of the bank periodically reviews and may (but is not required to) increase. Mr. Whaley is also
48
entitled to receive an annual cash bonus if we achieve certain performance levels established by our board of directors from time to time. We have also provided Mr. Whaley with stock options for a number of shares of the company’s common stock equal to 5% of our common stock subscribed for in the company’s initial public offering (which equals options to purchase 64,701 shares). The options provide for an exercise price of $10.00 per share, termination ten years after the date of grant, and vesting one-fifth at the time of grant and one-fifth on each anniversary thereafter. If Mr. Whaley terminates his employment without good reason (as defined in the agreement) or is terminated by us with cause (as defined in the agreement) the options will terminate 30 days after the date of termination of employment. We also provide Mr. Whaley with group medical, dental, disability and life insurance; an automobile allowance; dining club dues and country club dues; and such other benefits as we provide to our employees generally.
If we terminate Mr. Whaley’s employment for cause during the term of the agreement or if Mr. Whaley terminates his employment other than for good reason or if his employment is terminated as a result of death, disability or retirement, we will pay Mr. Whaley his base salary through the last day of the month in which termination occurs at the annual rate then in effect, together with any bonus that has been awarded prior to the date of termination, any benefits to which he may be entitled as a result of the termination under terms and conditions of plans or arrangements then in effect, and any automobile expenses or club dues due to him as of the date of termination of the agreement. If Mr. Whaley’s employment is terminated during the term of the agreement other than by death, disability or retirement, and (i) by action of Mr. Whaley for good reason, or (ii) by our action other than for cause, we will pay Mr. Whaley all of the foregoing compensation. In addition, for a period of two years after the date of termination, we will continue to pay Mr. Whaley his base salary in effect at the date of termination; we will continue to provide Mr. Whaley with insurance coverage; and all unexercised stock options granted to Mr. Whaley will immediately vest and become exercisable.
The provisions of the agreement are subject to certain limitations if required by the provisions of the Federal Deposit Insurance Act. Mr. Whaley agrees to abide by our rules and procedures designed to protect our confidential information (as defined in the agreement) and to preserve and maintain such information in strict confidence during his employment and as long thereafter as the confidential information remains, in our sole opinion, proprietary and confidential.
Mr. Whaley agrees that (i) for a period of 12 months after termination of the agreement by him other than for good reason, or (ii) during the continuation of any base salary payments to him, whichever is later, he will not manage, operate or be employed by, participate in, or be connected in any manner with the management, operation, or control of any banking business conducted within a 25 mile radius of any of our operating offices. Mr. Whaley further agrees that for a period of 12 months after termination of his employment by him other than for good reason or the completion of base salary payments, whichever is later, he will not solicit the business of, or patronage from, any of our customers, and he will not seek to, or assist others to, persuade any of our employees to discontinue employment with us or seek employment or engage in any business in which we engage. Any controversies or claims arising out of or relating to the employment agreement are required to be settled by binding arbitration.
The foregoing is merely a summary of certain provisions of the employment agreement, and is qualified in its entirety by reference to such agreement. In addition to the foregoing employment contract, we paid Mr. Whaley $50,000.00 to cover costs and expenses associated with his relocating from Charleston, South Carolina to Columbia, South Carolina.
Rollo F. Ingram. On June 6, 2005, Rollo F. Ingram was appointed as our executive vice president and chief financial officer. Mr. Ingram serves at the pleasure of our board of directors. His annual salary is $135,000 and he received a $20,000 bonus. Mr. Ingram was also awarded stock options for 10,000 shares of common stock and we have agreed to reimburse his moving expenses.
49
Director Compensation and Stock Warrants
Our directors are not presently compensated for their service as directors, though they may be reimbursed for reasonable expenses. We have granted stock warrants for the company’s common stock to the directors to compensate them for: (a) their time and efforts as organizers and directors; (b) their purchase of and subscription to purchase our common stock to fund the operating expenses during the organizational period of our bank and to provide capital for our bank; and (c) their continued service as directors. Directors received two stock warrants for every three shares they purchased prior to the opening of our bank. One-third of the warrants vested and became exercisable on each of the first three anniversaries of the opening of our bank. Accordingly, all of the warrants are now vested. Vested warrants expire on the earlier of 90 days after termination of the director’s status as a director (one year after death or disability) or ten years after opening of the bank and have an exercise price of $10.00 per share. We may, in the future and by act of our board of directors, compensate directors with cash payments, grants of stock or stock options.
Upon completion of this offering, assuming all of the warrants issued to the directors were exercised and the directors do not purchase additional shares in the offering, the directors would beneficially own an aggregate of 468,113 shares, or 17.87% of the company’s outstanding common stock assuming there is no exercise of the over-allotment option.
Stock Option Plan
We have a stock option plan approved by our shareholders at our 2003 annual meeting. The plan reserves 129,402 shares of our common stock for issuance pursuant to the exercise of options which may be granted pursuant to the plan. The plan is administered by our board of directors or a committee appointed by the board of directors. Options awarded under the plan may be “incentive stock options” within the meaning of the Internal Revenue Code or non-qualified options. Options may be granted pursuant to the plan to persons who are our directors, officers or key employees (including officers who are employees) at the time of grant. Our board of directors or the committee selects the persons to receive grants under the plan and determines the number of shares covered by options granted under the plan. All stock options will have such exercise prices as may be determined by the board of directors or the committee at the time of grant, but in the case of incentive stock options, such prices may not be less than the fair market value of our common stock (as determined in accordance with the plan) at the date of grant. The board of directors or the committee may set other terms for the exercise of the options but may not grant to any one holder more than $100,000 of incentive stock options (based on the fair market value of the optioned shares on the date of the grant of the option) which first become exercisable in any calendar year. No options may be exercised after ten years from the date of grant, and options may not be transferred except by will or the laws of descent and distribution. Incentive stock options may be exercised only while the optionee is our employee, within three months after the date of termination of employment, or within twelve months of death or disability, but only to the extent the option has not expired.
The number of shares reserved for issuance under the plan, the number of shares covered by outstanding options and the exercise price of options will be adjusted in the event of changes in the number of outstanding shares of common stock effected without our receipt of consideration. All outstanding options will become immediately exercisable in the event of a change of control, or imminent change of control, (both as defined in the plan). In the event of an extraordinary corporate action (as described in the plan), subject to any required shareholder approval, the board of directors or the committee, in its sole discretion, may also cancel and pay for outstanding options. The board or committee also has the power to accelerate the exercise date of outstanding options at any time. The board of directors may alter, suspend or discontinue the plan, but may not increase (except as discussed above) the maximum number of shares reserved for issuance under the plan, materially increase benefits to participants under the plan, or materially modify the eligibility requirements under the plan without shareholder approval or ratification. The plan will terminate on February 26, 2013, and no options will be granted under the plan after that date.
50
Certain Relationships and Related Transactions
Our bank, in the ordinary course of its business, makes loans to and has other transactions with directors, officers, principal shareholders, and their associates. Loans are made on substantially the same terms, including rates and collateral, as those prevailing at the time for comparable transactions with other persons and do not involve more than the normal risk of collectibility or present other unfavorable features. We expect to continue to enter into transactions in the ordinary course of business on similar terms with directors, officers, principal stockholders, and their associates. The aggregate dollar amount of such loans outstanding at December 31, 2004 was $2,591,200. During 2004, $391,202 of new advances were made and repayments totaled $186,438.
During our bank’s organizational period, we entered into an agreement with Leon Joseph Pinner, Jr., one of our directors and an organizer of our bank, pursuant to which Mr. Pinner was available to market, serve as spokesperson for, and make promotional appearances on behalf of, our bank. For his services, Mr. Pinner was paid $200.00 per month for the first four months, and $1,500 per month thereafter for the following 20 months, and was reimbursed for his expenses. We issued Mr. Pinner 1,500 shares of our common stock in lieu of the first $15,000 of payments due under the agreement.
We granted stock warrants to purchase 6,666 and 2,222 shares of the company’s common stock to David A. Ward and Harold Hunt, respectively. Both of Messrs. Ward and Hunt were organizers of the bank and Mr. Hunt was a director of the company. These warrants were granted to Messrs. Ward and Hunt to compensate them for: (a) their time and efforts as organizers; and (b) their purchase of and subscription to purchase the company’s common stock to fund the operating expenses during the organizational period of the bank and to provide capital for the bank. The warrants expire ten years after opening of the bank and have an exercise price of $10.00 per share.
On November 5, 2001, James A Gunter, who had served as our first chief executive officer, resigned as an officer and director. We entered into a severance agreement with Mr. Gunter pursuant to which we paid his salary and benefits, which payments totaled approximately $145,000. We also redeemed 5,000 shares of the company’s common stock from Mr. Gunter for an aggregate of $50,000, which is the amount Mr. Gunter paid for the shares.
We lease office space, on a month to month basis, from an entity with which William H. Stern, one of our directors, is affiliated. Monthly lease payments are $437.50.
51
SECURITY OWNERSHIP OF MANAGEMENT
The table below sets forth information about the shares of our common stock beneficially owned by the directors and members of their immediate families at September 30, 2005 and the pro forma number and percentage of shares expected to be owned by each of them after this offering. The directors are not obligated to purchase any shares in this offering and each of them may decide to purchase more or fewer shares. Addresses are also shown for the only persons known to management to beneficially own 5% or more of our common stock.
| Actual | Pro Forma | ||||||||
Name | Number of Shares Beneficially Owned(1) | % of Common Stock Outstanding | Number of Shares Beneficially Owned | % of Common Stock if 1,000,000 shares sold(16) | |||||
Charlotte J. Berry | 17,500 | (2) | 1.22 | 20,800 | * | ||||
William P. Cate | 24,999 | (3) | 1.74 | 28,299 | 1.20 | ||||
Kirkman Finlay, III P.O. Box 11684, Columbia, SC 29211 | 83,331 | (4) | 5.71 | 118,331 | 4.81 | ||||
Rollo F. Ingram | — | — | — | — | |||||
I. S. Leevy Johnson | 16,666 | (5) | 1.16 | 19,166 | * | ||||
Angus B. Lafaye | 16,666 | (6) | 1.16 | 19,666 | * | ||||
R. C. McEntire, Jr. | 44,999 | (7) | 3.11 | 54,999 | 2.32 | ||||
C. Whitaker Moore | 24,999 | (8) | 1.74 | 30,999 | 1.31 | ||||
Leon Joseph Pinner, Jr. | 5,667 | (9) | * | 6,667 | * | ||||
Joel A. Smith, III | 24,999 | (10) | 1.74 | 27,999 | 1.19 | ||||
Robert E. Staton, Sr. | 20,833 | (11) | 1.45 | 25,833 | 1.09 | ||||
William H. Stern 8910 Two Notch Road, Columbia, SC 29223 | 83,331 | (12) | 5.71 | 118,331 | 4.81 | ||||
Joe E. Taylor, Jr. 928 Washington Street, Columbia, SC 29201 | 83,331 | (13) | 5.71 | 118,331 | 4.81 | ||||
Roger B. Whaley | 72,553 | (14) | 4.86 | 81,553 | 3.37 | ||||
All directors and executive officers | 519,874 | (15) | 31.12 | 670,974 | 25.12 | ||||
| * | less than 1% |
| (1) | Includes for each director warrants to purchase two shares for every three shares purchased in our prior stock offerings, one third of which vested in each of July 2003, July 2004, and July 2005. See “Management—Director Compensation and Stock Warrants.” |
| (2) | Includes 500 shares held by Mrs. Berry as custodian for her grandchildren, and 7,000 vested warrants. |
| (3) | Includes 10,000 vested warrants. |
| (4) | Includes 33,333 vested warrants. |
| (5) | Includes 2,000 shares owned by Mr. Johnson’s wife, and 6,666 vested warrants. |
| (6) | Includes 6,666 vested warrants. |
| (7) | Includes 4,208 shares owned in an IRA for the benefit of Mr. McEntire’s wife and 1,000 shares owned by each of Mr. McEntire’s daughters, and 18,000 vested warrants. |
| (8) | Includes 10,000 vested warrants. |
| (9) | Includes 1,000 shares owned jointly with Mr. Pinner’s wife, and 1,667 vested warrants. |
| (10) | Includes 10,000 vested warrants. |
| (11) | Includes 2,500 shares owned jointly with Mr. Staton’s wife, and 8,334 vested warrants. |
| (12) | Includes 7,500 shares held by Mr. Stern as custodian for his sons, and 33,333 vested warrants. |
| (13) | Includes 33,333 vested warrants. |
| (14) | Includes currently exercisable options to purchase 51,671 shares; 13,333 vested warrants; and 650 shares owned by family members over which shares Mr. Whaley holds a power of attorney. |
| (15) | Includes 51,761 currently exercisable options and 191,665 vested warrants. |
| (16) | Assumes no exercise of over-allotment option. |
52
Bank holding companies and banks are extensively regulated under federal and state law. To the extent that the following information describes statutory and regulatory provisions, it is qualified in its entirety by reference to such statutes and regulations. Any change in applicable law or regulation may have a material effect on our business.
General
As a bank holding company registered under the Bank Holding Company Act (“BHCA”), Carolina National Corporation is subject to the regulations of the Federal Reserve. Under the BHCA, Carolina National Corporation’s activities and those of its subsidiaries are limited to banking, managing or controlling banks, furnishing services to or performing services for its subsidiaries or engaging in any other activity which the Federal Reserve determines to be so closely related to banking or managing or controlling banks as to be a proper incident thereto. The BHCA prohibits Carolina National Corporation from acquiring direct or indirect control of more than 5% of the outstanding voting stock or substantially all of the assets of any bank or from merging or consolidating with another bank holding company without prior approval of the Federal Reserve. The BHCA also prohibits Carolina National Corporation from acquiring control of any bank operating outside the State of South Carolina unless such action is specifically authorized by the statutes of the state where the bank to be acquired is located.
Additionally, the BHCA prohibits Carolina National Corporation from engaging in or from acquiring ownership or control of more than 5% of the outstanding voting stock of any company engaged in a non-banking business unless such business is determined by the Federal Reserve to be so closely related to banking as to be properly incident thereto. The BHCA generally does not place territorial restrictions on the activities of such non-banking related activities.
Carolina National Corporation is also subject to regulation and supervision by the State Board of Financial Institutions.
Obligations of the Company to its Subsidiary Bank
A number of obligations and restrictions are imposed on bank holding companies and their depository institution subsidiaries by Federal law and regulatory policy that are designed to reduce potential loss exposure to the depositors of such depository institutions and to the FDIC insurance funds in the event the depository institution is in danger of becoming insolvent or is insolvent. For example, under the policy of the Federal Reserve, a bank holding company is required to serve as a source of financial strength to its subsidiary depository institutions and to commit resources to support such institutions in circumstances where it might not do so absent such policy. In addition, the “cross-guarantee” provisions of the Federal Deposit Insurance Act, as amended (“FDIA”), require insured depository institutions under common control to reimburse the FDIC for any loss suffered or reasonably anticipated by either the Savings Association Insurance Fund (“SAIF”) or the Bank Insurance Fund (“BIF”) of the FDIC as a result of the default of a commonly controlled insured depository institution or for any assistance provided by the FDIC to a commonly controlled insured depository institution in danger of default. The FDIC may decline to enforce the cross-guarantee provisions if it determines that a waiver is in the best interest of the SAIF or the BIF or both. The FDIC’s claim for damages is superior to claims of shareholders of the insured depository institution or its holding company but is subordinate to claims of depositors, secured creditors and holders of subordinated debt (other than affiliates) of our commonly controlled insured depository institutions.
The FDIA also provides that amounts received from the liquidation or other resolution of any insured depository institution by any receiver must be distributed (after payment of secured claims) to pay the deposit liabilities of the institution prior to payment of any other general or unsecured senior liability, subordinated
53
liability, general creditor or shareholder. This provision would give depositors a preference over general and subordinated creditors and shareholders in the event a receiver is appointed to distribute the assets of our bank.
Any capital loans by a bank holding company to any of its subsidiary banks are subordinate in right of payment to deposits and to certain other indebtedness of such subsidiary bank. In the event of a bank holding company’s bankruptcy, any commitment by the bank holding company to a federal bank regulatory agency to maintain the capital of a subsidiary bank will be assumed by the bankruptcy trustee and entitled to a priority of payment.
Capital Adequacy Guidelines for Bank Holding Companies and National Banks
The Federal Reserve has adopted risk-based and leverage capital adequacy guidelines for bank holding companies that are generally the same as the capital requirements for national banks. For bank holding companies with consolidated assets of less than $150 million, as Carolina National Corporation is currently, compliance is measured on a bank only basis. The Comptroller of the Currency’s regulations establish two capital standards for national banks: a leverage requirement and a risk-based capital requirement. In addition, the Comptroller of the Currency may establish individual minimum capital requirements for a national bank that are different from the general requirements.
Failure to meet capital requirements could subject our bank to a variety of enforcement remedies, including the termination of deposit insurance by the FDIC and a prohibition on the taking of brokered deposits.
The risk-based capital standards of both the Federal Reserve and the Comptroller of the Currency explicitly identify concentrations of credit risk and the risk arising from non-traditional activities, as well as an institution’s ability to manage these risks, as important factors to be taken into account by the agencies in assessing an institution’s overall capital adequacy. The capital guidelines also provide that an institution’s exposure to a decline in the economic value of its capital due to changes in interest rates should be considered by the agencies as a factor in evaluating a bank’s capital adequacy. The Federal Reserve also has recently issued additional capital guidelines for bank holding companies that engage in certain trading activities.
Carolina National Corporation and our bank exceeded all applicable capital requirements on December 31, 2004 and September 30, 2005.
Payment of Dividends
Carolina National Corporation is a legal entity separate and distinct from our bank subsidiary. Most of the revenues of Carolina National Corporation are expected to result from dividends paid to it by our bank. There are statutory and regulatory requirements applicable to the payment of dividends by subsidiary banks as well as by Carolina National Corporation to its shareholders. It is not anticipated that Carolina National Corporation will pay cash dividends in the near future. See “Description of Capital Stock – Dividends” and “Market for Common Stock and Dividends.”
Certain Transactions by the Company with its Affiliates
Federal law regulates transactions among Carolina National Corporation and its affiliates, including the amount of bank loans to or investments in nonbank affiliates and the amount of advances to third parties collateralized by securities of an affiliate. Further, a bank holding company and its affiliates are prohibited from engaging in certain tie-in arrangements in connection with any extension of credit, lease or sale of property or furnishing of services.
54
FDIC Insurance Assessments
Because our bank’s deposits are insured by the BIF, our bank is subject to insurance assessments imposed by the FDIC. Currently, the assessments imposed on all FDIC deposits for deposit insurance have an effective rate ranging from 0 to 27 basis points per $100 of insured deposits, depending on the institution’s capital position and other supervisory factors. In addition, our bank is subject to an assessment to pay a pro rata portion of the interest due on the obligations issued by the Financing Corporation (“FICO”). The FICO assessment is adjusted quarterly to reflect changes in the assessment bases of the respective funds based on quarterly Call Report and Thrift Financial Report submissions.
Regulation of Our Bank
Our bank is subject to the National Bank Act and the regulations of the Comptroller of the Currency as well as to examination by the Comptroller of the Currency. Our bank is also subject to various other state and federal laws and regulations, including state usury laws, laws relating to fiduciaries, consumer credit laws, and laws relating to branch banking. Our bank’s loan operations are subject to certain federal consumer credit laws and regulations promulgated thereunder, including, but not limited to: the federal Truth-In-Lending Act, governing disclosures of credit terms to consumer borrowers; the Home Mortgage Disclosure Act, requiring financial institutions to provide certain information concerning their mortgage lending; the Equal Credit Opportunity Act and the Fair Housing Act, prohibiting discrimination on the basis of certain prohibited factors in extending credit; and the Fair Debt Collection Act, governing the manner in which consumer debts may be collected by collection agencies. The deposit operations of our bank are subject to the Truth in Savings Act, requiring certain disclosures about rates paid on deposit accounts; the Expedited Funds Availability Act, which deals with disclosure of the availability of funds deposited in accounts and the collection and return of checks by banks; the Right to Financial Privacy Act, which imposes a duty to maintain certain confidentiality of consumer financial records and the Electronic Funds Transfer Act and regulations promulgated thereunder, which govern automatic deposits to and withdrawals from deposit accounts and customers’ rights and liabilities arising from the use of automated teller machines and other electronic banking services. In addition, our bank is subject to the Fair Credit Reporting Act, governing the use and provision of information to credit reporting agencies; the bank Secrecy Act, dealing with, among other things, the reporting of certain currency transactions; and the USA Patriot Act, dealing with, among other things, standards for verifying customer information at account opening.
Our bank is also subject to the requirements of the Community Reinvestment Act (the “CRA”). The CRA imposes on financial institutions an affirmative and ongoing obligation to meet the credit needs of their local communities, including low- and moderate-income neighborhoods, consistent with the safe and sound operation of those institutions. Each financial institution’s actual performance in meeting community credit needs is evaluated as part of the examination process, and also is considered in evaluating mergers, acquisitions and applications to open a branch or facility.
Other Safety and Soundness Regulations
Prompt Corrective Action. The federal banking agencies have broad powers under current federal law to take prompt corrective action to resolve problems of insured depository institutions. The extent of these powers depends upon whether the institutions in question are “well capitalized,” “adequately capitalized,” “undercapitalized,” “significantly undercapitalized” or “critically undercapitalized.”
A bank that is “undercapitalized” becomes subject to provisions of the FDIA: restricting payment of capital distributions and management fees; requiring the FDIC to monitor the condition of the bank; requiring submission by the bank of a capital restoration plan; restricting the growth of the bank’s assets and requiring prior approval of certain expansion proposals. A bank that is “significantly undercapitalized” is also subject to restrictions on compensation paid to senior management of the bank, and a bank that is “critically undercapitalized” is further subject to restrictions on the activities of the bank and restrictions on payments of
55
subordinated debt of the bank. The purpose of these provisions is to require banks with less than adequate capital to act quickly to restore their capital and to have the FDIC move promptly to take over banks that are unwilling or unable to take such steps.
Brokered Deposits. Under current FDIC regulations, “well capitalized” banks may accept brokered deposits without restriction, “adequately capitalized” banks may accept brokered deposits with a waiver from the FDIC (subject to certain restrictions on payment of rates), while “undercapitalized” banks may not accept brokered deposits. Management does not believe that these regulations will have a material adverse effect on the operations of our bank.
Interstate Banking
Under the Riegle-Neal Interstate Banking and Branching Efficiency Act of 1994, Carolina National Corporation and any other adequately capitalized bank holding company located in South Carolina can acquire a bank located in any other state, and a bank holding company located outside South Carolina can acquire any South Carolina-based bank, in either case subject to certain deposit percentage and other restrictions. Unless prohibited by state law, adequately capitalized and managed bank holding companies are permitted to consolidate their multistate bank operations into a single bank subsidiary and to branch interstate through acquisitions. De novo branching by an out-of-state bank is permitted only if the laws of the host state expressly permit it. The authority of a bank to establish and operate branches within a state continue to be subject to applicable state branching laws. South Carolina law permits such interstate branching but not de novo branching by an out-of-state bank.
Gramm-Leach-Bliley Act
The Gramm-Leach-Bliley Act (“GLBA”), which makes it easier for affiliations between banks, securities firms and insurance companies to take place, removes Depression-era barriers that had separated banks and securities firms, and seeks to protect the privacy of consumers’ financial information.
Under provisions of the act and regulations adopted by the applicable regulators, banks, securities firms and insurance companies are able to structure new affiliations through a holding company structure or through a financial subsidiary. The legislation creates a new type of bank holding company called a “financial holding company” which has powers much more extensive than those of standard holding companies. These expanded powers include authority to engage in “financial activities,” which are activities that are (1) financial in nature; (2) incidental to activities that are financial in nature; or (3) complementary to a financial activity and that do not impose a safety and soundness risk. Significantly, the permitted financial activities for financial holding companies include authority to engage in merchant banking and insurance activities, including insurance portfolio investing. A bank holding company can qualify as a financial holding company and expand the services it offers only if all of its subsidiary depository institutions are well managed, well capitalized and have received a rating of “satisfactory” on their last CRA examination.
The legislation also creates another new type of entity called a “financial subsidiary.” A financial subsidiary may be used by a national bank or a group of national banks to engage in many of the same activities permitted for a financial holding company, though several of these activities, including real estate development or investment, insurance or annuity underwriting, insurance portfolio investing and merchant banking, are reserved for financial holding companies. A bank’s investment in a financial subsidiary affects the way in which the bank calculates its regulatory capital, and the assets and liabilities of financial subsidiaries may not be consolidated with those of the bank. The bank must also be certain that its risk management procedures are adequate to protect it from financial and operational risks created both by itself and by any financial subsidiary. Further, the bank must establish policies to maintain the separate corporate identities of the bank and its financial subsidiary and to prevent each from becoming liable for the obligations of the other.
56
The GLBA also establishes the concept of “functional supervision,” meaning that similar activities should be regulated by the same regulator. Accordingly, the GLBA spells out the regulatory authority of the bank regulatory agencies, the Securities and Exchange Commission and state insurance regulators so that each type of activity is supervised by a regulator with corresponding expertise. The Federal Reserve Board is intended to be an umbrella supervisor with the authority to require a bank holding company or financial holding company or any subsidiary of either to file reports as to its financial condition, risk management systems, transactions with depository institution subsidiaries and affiliates, and compliance with any federal law that it has authority to enforce.
Although the GLBA reaffirms that states are the regulators for insurance activities of all persons, including federally chartered banks, the GLBA prohibits states from preventing depository institutions and their affiliates from conducting insurance activities.
The GLBA also establishes a minimum federal standard of privacy to protect the confidentiality of a consumer’s personal financial information and gives the consumer the power to choose how personal financial information may be used by financial institutions. The privacy provisions of the Act have been implemented by adoption of regulations by various Federal agencies.
The GLBA and the regulations adopted pursuant to the GLBA create new opportunities for us to offer expanded services to customers in the future, though we have not yet determined what the nature of the expanded services might be or when we might find it feasible to offer them. The GLBA has increased competition from larger financial institutions that are currently more capable than we are of taking advantage of the opportunity to provide a broader range of services. However, we continue to believe that our commitment to providing high quality, personalized service to customers will permit us to remain competitive in our market area.
Sarbanes-Oxley Act of 2002
The Sarbanes-Oxley Act of 2002 mandated extensive reforms and requirements for public companies. The SEC has adopted extensive new regulations pursuant to the requirements of the Sarbanes-Oxley Act. The Sarbanes-Oxley Act and the SEC’s new regulations have increased our cost of doing business, particularly our fees for internal and external audit services and legal services, and the law and regulations are expected to continue to do so. However, we do not believe that we will be affected by Sarbanes-Oxley and the new SEC regulations in ways that are materially different or more onerous than those of other public companies of similar size and in similar businesses.
Legislative Proposals
Other proposed legislation and regulations, which could significantly affect the business of banking, has been introduced or may be introduced in Congress and by regulators from time to time. We cannot predict the future course of such legislative or regulatory proposals or their impact on us should they be adopted.
Fiscal and Monetary Policy
Banking is a business which depends largely on interest rate differentials. In general, the difference between the interest paid by a bank on its deposits and its other borrowings, and the interest received by a bank on its loans and securities holdings, constitutes the major portion of a bank’s earnings. Thus, our earnings and growth are subject to the influence of economic conditions generally, both domestic and foreign, and also to the monetary and fiscal policies of the United States and its agencies, particularly the Federal Reserve. The Federal Reserve regulates the supply of money through various means, including open-market dealings in United States government securities, the discount rate at which banks may borrow from the Federal Reserve, and the reserve requirements on deposits. The nature and timing of any changes in such policies and their impact on Carolina National Corporation and our bank cannot be predicted.
57
Carolina National Corporation is a South Carolina corporation. As such, South Carolina law controls the rights of shareholders and other matters relating to the stock of the company. This section contains important information about shareholder rights and prospective subscribers should review it carefully before making a decision to invest. The following summarizes certain provisions of our articles of incorporation and state law, but is not complete and is qualified in its entirety by reference to our articles of incorporation and by the applicable statutory provisions.
Capitalization
We are authorized to issue 20,000,000 shares of common stock (no par value). We may also issue options or warrant to purchase some of these authorized shares of common stock, including the warrants issued to directors and organizers of the corporation. See “Management—Director Compensation and Stock Warrants.”
Our common stock has unlimited voting rights and is entitled to receive our net assets upon dissolution. We are also authorized to issue up to 10,000,000 shares of preferred stock in one or more series having the preferences, limitations and relative rights determined by our board of directors.
Quorum
A majority of the shares entitled to vote constitutes a quorum at any meeting of shareholders.
Voting Rights; No Cumulative Voting
In general, each holder of our common stock is entitled to one vote per share and to the same and identical voting rights as other holders of our common stock. In the election of directors, each shareholder has the right to vote the number of shares owned by him on the record date for as many persons as there are directors to be elected. Cumulative voting is not permitted. Absence of cumulative voting makes it more difficult to effect a change in the board of directors.
Mergers, Consolidations, Exchanges, Sales of Assets or Dissolution
Our articles of incorporation provide that, with respect to any plan of merger, consolidation or exchange or any plan for the sale of all, or substantially all, our property and assets, with or without the good will, or any resolution to dissolve us, which plan or resolution shall not have been adopted by the affirmative vote of at least two-thirds of our full board of directors, such plan or resolution must be approved by the affirmative vote of holders of 80% of our outstanding shares of the company. If at least two-thirds of the full board of directors approves any such plan or resolution, the plan or resolution need only be approved by the affirmative vote of holders of two-thirds of our outstanding shares. Consequently, unless two-thirds of our directors favor such a plan or resolution, it may be very difficult to effect any such transaction.
Classified Board of Directors
Our articles of incorporation provide that our board of directors shall have the power to set the number of directors from time to time at two or more directors. The articles provide further that, when the number of directors is set at six or more, the board of directors shall be divided into three classes, each class to be as nearly equal in number as possible. Our board of directors is currently so classified. At each annual shareholders’ meeting, directors are chosen for a term of three years to succeed those directors whose terms expire. Existence of a classified board makes it more difficult to effect a change in control because it would normally require at least two elections to gain a majority representation on the board, and three elections to change the entire board.
58
Nomination of Directors
Our articles of incorporation provide that no person shall be eligible to be elected a director at a meeting of shareholders unless that person has been nominated by a shareholder entitled to vote at such meeting by giving written notice of such nomination to our corporate secretary at least 90 days prior to the date of the meeting. The notice is required to include any information required by our bylaws.
Removal of Directors
Our articles of incorporation provide that an affirmative vote of 80% of our outstanding shares shall be required to remove any or all of our directors without cause.
Duty of Directors
Our articles of incorporation provide that when evaluating any proposed plan of merger, consolidation, exchange or sale of all, or substantially all, of our assets, the board of directors shall consider the interests of our employees and the community or communities in which we do business in addition to the interests of our shareholders. Absent this provision, under existing common law, directors would be required to give paramount consideration with respect to such matters to the best interests of shareholders.
Limitation of Director Liability
Our articles of incorporation provide that, to the extent permitted by the South Carolina Business Corporation Act, our directors will not be personally liable to us or our shareholders for monetary damages for breaches of their fiduciary duties. This provision does not, however, eliminate or limit the liability of any director (i) for any breach of the director’s duty of loyalty to us or our shareholders, (ii) for acts or omissions not in good faith or which involve gross negligence, intentional misconduct or a knowing violation of law, (iii) imposed for unlawful distributions as set forth in the South Carolina Business Corporation Act, or (iv) for any transaction from which the director derived an improper personal benefit.
No Preemptive Rights
Our shareholders do not have preemptive rights with respect to the issuance of additional shares, options or rights of any class of our stock. As a result, the directors may sell additional authorized shares of common stock without first offering them to existing shareholders and giving them the opportunity to purchase sufficient additional shares to prevent dilution of their ownership interests.
Resolution of Disputes
Our articles of incorporation provide that our bylaws may require binding arbitration of disputes arising out of or related to share ownership. Our bylaws do contain a provision requiring that any dispute between a shareholder and (a) us, (b) any of our officers, or (c) any of our other shareholders that arises out of the aggrieved shareholder’s status as a shareholder, shall be resolved by binding arbitration held in Columbia, South Carolina, pursuant to the rules of the American Arbitration Association. This provision of the articles precludes shareholders from seeking resolution of any disputes involving us, our officers or other shareholders in front of a judge or a jury. Furthermore, the decision of arbitrators in a binding arbitration may ordinarily not be appealed. We believe that arbitration is usually significantly less expensive and more efficient than trial by a judge or jury and, therefore, more likely to be in our best interests under most circumstances.
Amendment to Articles of Incorporation
Unless such amendment shall have been approved by the affirmative vote of at least two-thirds of the full board of directors, no amendment to our articles of incorporation which amends, alters, repeals or is inconsistent
59
with any of provisions of the articles described in this paragraph or in the nine paragraphs above, or in the provisions relating to business combinations set forth under “Statutory Matters” below, shall be effective unless it is approved by the affirmative vote of 80% of our outstanding shares. If two-thirds of the full board of directors approves such an amendment, the amendment need only be approved by holders of two-thirds of our outstanding shares. Amendments to change the number and classes of shares authorized to be issued and to change our name only require the approval of a majority of the outstanding shares. Other amendments requiring shareholder approval must be approved by two-thirds of the outstanding shares.
Dividends
Our common stock will be entitled, pro rata, to dividends paid by us when, if and as declared by the board of directors from funds legally available, whether in cash or in stock, but common stockholders have no specific right to dividends. The determination and declaration of dividends is within the discretion of the board of directors and will take into account our financial condition, results of operations and other relevant factors. No assurances can be given that any future dividends will be declared or, if declared, what the amount of such dividends will be or whether such dividends will continue for future periods. We may not declare or pay a cash dividend on any of our stock if we are insolvent or if the payment of the dividend would render us insolvent. If we issue preferred stock, the terms of the preferred stock may require us to pay dividends to holders of preferred stock under some circumstances. The payment of dividends to holders of preferred stock will not entitle our common stockholders to the payment of dividends.
Conversion; Redemption; Sinking Fund
None of our common stock is convertible, has any redemption rights or is entitled to any sinking fund.
Statutory Matters
Business Combination Statute. The South Carolina business combinations statute provides that a 10% or greater shareholder of a resident domestic corporation cannot engage in a “business combination” (as defined in the statute) with such corporation for a period of two years following the date on which the 10% shareholder became such, unless the business combination or the acquisition of shares is approved by a majority of the disinterested members of such corporation’s board of directors before the 10% shareholder’s share acquisition date. This statute further provides that at no time (even after the two-year period subsequent to such share acquisition date) may the 10% shareholder engage in a business combination with the relevant corporation unless certain approvals of the board of directors or disinterested shareholders are obtained or unless the consideration given in the combination meets certain minimum standards set forth in the statute. The law is very broad in its scope and is designed to inhibit unfriendly acquisitions but it does not apply to corporations whose articles of incorporation contain a provision electing not to be covered by the law. Our articles of incorporation do not contain such a provision. An amendment of the articles of incorporation to that effect will, however, permit a business combination with an interested shareholder although that status was obtained prior to the amendment. Such an amendment would have to be approved by our shareholders.
Control Share Acquisitions. The South Carolina corporations law also contains provisions that, under certain circumstances, would preclude an acquiror of the shares of a South Carolina corporation who crosses one of three voting thresholds (20%, 33-1/3% or 50%) from obtaining voting control with respect to such shares unless a majority in interest of the disinterested shareholders of the corporation votes to accord voting power to such shares.
The legislation provides that, if authorized by the articles of incorporation or bylaws prior to the occurrence of a control share acquisition, the corporation may redeem the control shares if the acquiring person has not complied with certain procedural requirements (including the filing of an “acquiring person statement” with the corporation within 60 days after the control share acquisition) or if the control shares are not accorded full voting rights by the shareholders. We are not authorized by our articles of incorporation or bylaws to redeem control shares.
60
Indemnification of Directors and Officers. Under South Carolina law, a corporation has the power to indemnify directors and officers who meet the standards of good faith and reasonable belief that their conduct was lawful and in the corporate interest (or not opposed thereto) set forth by statute. A corporation may also provide insurance for directors and officers against liability arising out of their positions although the insurance coverage is broader than the power of the corporation to indemnify. Unless limited by its articles of incorporation, a corporation must indemnify a director or officer who is wholly successful, on the merits or otherwise, in the defense of any proceeding to which he was a party because he is or was a director against reasonable expenses incurred by him in connection with the proceeding. Our articles of incorporation do not limit such indemnification.
Insofar as indemnification for liabilities arising under the Securities Act of 1933 (the “Act”) may be permitted to directors, officers and controlling persons of the Company pursuant to the foregoing provisions, or otherwise, we have been advised that in the opinion of the Securities and Exchange Commission such indemnification is against public policy as expressed in the Act and is, therefore, unenforceable.
General
Taken together, the foregoing provisions of the proposed articles of incorporation and South Carolina law favor maintenance of the status quo and may make it more difficult to change current management, and may impede a change of control of the company even if desired by a majority of its shareholders.
61
We have entered into an underwriting agreement with respect to the shares being offered with Scott & Stringfellow, Inc. Subject to the terms and conditions contained in the underwriting agreement, Scott & Stringfellow has agreed to purchase from us all of the shares of common stock in this offering.
Scott & Stringfellow proposes to offer the shares of common stock directly to the public at the public offering price set forth on the cover of this prospectus and to certain securities dealers at that price less a concession not to exceed $0.62 per share. Scott & Stringfellow may allow, and these dealers may re-allow, a discount of not more than $0.10 per share on sales to other brokers or dealers.
We have granted to Scott & Stringfellow an option, exercisable for 30 days after the date of this prospectus, to purchase up to 150,000 additional shares of our common stock at the public offering price less the underwriting discount set forth on the cover page of this prospectus. Scott & Stringfellow may exercise this option only to cover over-allotments, if any, made in connection with this offering. We will be obligated, pursuant to the option, to sell these additional shares of common stock to Scott & Stringfellow to the extent the option is exercised. If any additional shares of common stock are purchased, Scott & Stringfellow will offer the additional shares on the same terms as those on which the 1,000,000 shares are being offered.
Of the 1,000,000 shares of common stock to be sold pursuant to the offering, Scott & Stringfellow has accepted our request to sell up to 156,250 shares, to our directors and executive officers at the public offering price set forth on the cover and an underwriting discount of $0.48 per share. Although such persons are not legally bound to make such purchases, it is expected that our directors and executive officers will purchase all or substantially all of such shares. Accordingly, assuming that the directors and executive officers purchase such shares, and otherwise purchase shares as expected in the offering, such persons would beneficially own an aggregate of 670,974 shares of common stock, or 25.12% of the outstanding common stock following the offering (assuming no exercise of the underwriter’s over-allotment option).
The underwriting agreement provides that the obligations of Scott & Stringfellow are conditional and may be terminated at its discretion based on its assessment of the state of the financial markets. The obligations of Scott & Stringfellow may also be terminated upon the occurrence of the events specified in the underwriting agreement. The underwriting agreement provides that Scott & Stringfellow is obligated to purchase all of the shares of common stock in this offering if any are purchased, other than those shares covered by the over-allotment option described above.
The shares of common stock are being offered by Scott & Stringfellow, subject to prior sale, when, as and if issued to and accepted by it, subject to approval of certain legal matters by counsel for Scott & Stringfellow and other conditions specified in the underwriting agreement. Scott & Stringfellow reserves the right to withdraw, cancel or modify this offer and to reject orders in whole or in part.
The following table shows the per share and total underwriting discount we will pay to Scott & Stringfellow. These amounts are shown assuming both no exercise and full exercise of Scott & Stringfellow’s over-allotment option to purchase additional shares.
| Without Over-Allotment | With Over-Allotment | |||||
Discounts per share | $ | 1.04 | $ | 1.04 | ||
Discounts, total | $ | 952,500 | $ | 1,108,500 | ||
Total offering proceeds to us | $ | 15,047,500 | $ | 17,291,500 | ||
As stated above, Scott and Stringfellow has agreed that the underwriting discounts will be $0.48 per share for up to 156,250 shares which may be purchased by our directors and executive officers. The total discounts and total offering proceeds shown in the above table assume the purchase of 156,250 shares by such persons.
62
We estimate that the total expenses of the offering, excluding underwriting discounts, will be approximately $180,000 and are payable by us.
We, and our executive officers and directors, have agreed, for a period of 90 days after the date of this prospectus, not to sell, offer, agree to sell, contract to sell, hypothecate, pledge, grant any option to sell, make any short sale or otherwise dispose of or hedge, directly or indirectly, any shares of our common stock or securities convertible into, exchangeable or exercisable for any shares of our common stock or warrants or other rights to purchase shares of our common stock or other similar securities, without, in each case, the prior written consent of Scott & Stringfellow. This consent may be given at any time without public notice. These restrictions are expressly agreed to preclude us, and our executive officers and directors, from engaging in any hedging or other transaction or arrangement that is designed to, or which reasonably could be expected to, lead to or result in a sale, disposition or transfer, in whole or in part, of any of the economic consequences of ownership of our common stock, whether such transaction would be settled by delivery of common stock or other securities, in cash or otherwise.
To date, trading of our common stock has been limited and sporadic. The public offering price of the shares was determined by negotiation between Scott & Stringfellow and us, taking into consideration the market price of our common stock, prevailing market conditions generally and bank stocks specifically. Following the offering , we anticipate that our common stock will be quoted on the Nasdaq Capital Market under the symbol “CNCP.”
In connection with this offering, Scott & Stringfellow may over-allot or effect transactions that stabilize, maintain or otherwise affect the market price of the common stock at levels above those that might otherwise prevail in the open market, including by entering stabilizing bids, effecting syndicate covering transactions, or imposing penalty bids. A stabilizing bid means the placing of any bid or effecting of any purchase, for the purpose of pegging, fixing or maintaining the price of the common stock. A syndicate covering transaction means the placing of any bid by the underwriter or the effecting of any purchase by the underwriter to reduce a short position created in connection with the offering. A penalty bid means an arrangement that permits the underwriter to reclaim a selling concession allowed to a dealer in connection with the offering when shares of common stock sold by the dealer are purchased in syndicate covering transactions. These transactions may be effected on the Nasdaq Capital Market or otherwise, and if Scott & Stringfellow commences such activities, it may discontinue them at any time.
In connection with this offering, Scott & Stringfellow and selected dealers, if any, who are qualified market makers on the Nasdaq Capital Market, may engage in passive market making transactions in our common stock on the Nasdaq Capital Market in accordance with Rule 103 of Regulation M under the Securities Exchange Act of 1934. In general, a passive market maker must display its bid at a price not in excess of the highest independent bid of such security. If all independent bids are lowered below the passive market maker’s bid, however, such bid must then be lowered when certain purchase limits are exceeded.
We have agreed to indemnify Scott & Stringfellow against specified liabilities, including liabilities under the Securities Act of 1933, and to contribute to payments that Scott & Stringfellow may be required to make in respect thereof.
From time to time, Scott & Stringfellow may continue to provide investment banking services to us in the ordinary course of our and their respective businesses.
63
The validity of our common stock offered by this prospectus will be passed upon for us by Haynsworth Sinkler Boyd, P.A., Columbia, South Carolina. Certain matters relating to this offering will be passed upon for Scott & Stringfellow, Inc. by LeClair Ryan, A Professional Corporation, Richmond, Virginia.
Our financial statements at December 31, 2004 and 2003, and for the years then ended, have been audited by Elliott Davis, LLC, an independent registered public accounting firm, as stated in their report appearing elsewhere herein, and have been so included in reliance on the report of such firm given upon their authority as an independent registered public accounting firm.
We are required to file annual, quarterly and other reports with the Securities and Exchange Commission (the “SEC”). You may read or obtain copies of reports filed by us with the SEC at the SEC’s Public Reference Room at 100 F Street, N.E., Room 1580, Washington, D.C. 20549. You may obtain information about the operation of the Public Reference Room by calling the SEC at 1-800-SEC-0330. Our filings with the SEC are made electronically. The SEC maintains an internet site that contains the reports and other information filed by us with the SEC. The address of the SEC’s internet site ishttp://www.sec.gov.
We have filed a registration statement on Form SB-2 with the SEC that relates to this offering of common stock. This prospectus does not contain all of the information set forth in the registration statement and the exhibits thereto. For further information about us and our common stock, you should read the entire registration statement and its exhibits. Copies of the registration statement may be obtained from the SEC’s Public Reference Room or internet site at the addresses provided in the preceding paragraph.
64
INDEX TO CONSOLIDATED FINANCIAL STATEMENTS
F-1
REPORT OF INDEPENDENT REGISTERED PUBLIC ACCOUNTING FIRM
The Board of Directors
Carolina National Corporation
Columbia, South Carolina
We have audited the accompanying consolidated balance sheets of Carolina National Corporation as of December 31, 2004 and 2003 and the related consolidated statements of operations, changes in shareholders’ equity and comprehensive income, and cash flows for each of the years then ended. These financial statements are the responsibility of the Company’s management. Our responsibility is to express an opinion on these financial statements based on our audits.
We conducted our audits in accordance with standards of the Public Company Accounting Oversight Board (United States). Those standards require that we plan and perform the audit to obtain reasonable assurance about whether the financial statements are free of material misstatement. An audit includes examining, on a test basis, evidence supporting the amounts and disclosures in the financial statements. An audit also includes assessing the accounting principles used and significant estimates made by management, as well as evaluating the overall financial statement presentation. We believe that our audits provide a reasonable basis for our opinion.
In our opinion, the financial statements referred to above present fairly, in all material respects, the financial position of Carolina National Corporation, as of December 31, 2004 and 2003 and the results of its operations and cash flows for each of the years then ended, in conformity with accounting principles generally accepted in the United States of America.
Elliott Davis, LLC
Columbia, South Carolina
February 18, 2005, except for Note 22,
as to which the date is September 26, 2005
F-2
Consolidated Balance Sheets
| December 31, | ||||||||
| 2004 | 2003 | |||||||
Assets: | ||||||||
Cash and cash equivalents: | ||||||||
Cash and due from banks | $ | 1,614,863 | $ | 2,459,441 | ||||
Federal funds sold | 1,767,000 | — | ||||||
Total cash and cash equivalents | 3,381,863 | 2,459,441 | ||||||
Investment securities: | ||||||||
Securities available for sale | 2,969,063 | — | ||||||
Securities held to maturity (fair value of $3,306,188 at December 31, 2003) | — | 3,302,131 | ||||||
Nonmarketable equity securities | 392,400 | 315,500 | ||||||
Total investment securities | 3,361,463 | 3,617,631 | ||||||
Loans receivable | 90,303,749 | 54,930,865 | ||||||
Less allowance for loan losses | 1,332,200 | 826,593 | ||||||
Loans, net | 88,971,549 | 54,104,272 | ||||||
Premises, furniture and equipment, net | 710,511 | 497,442 | ||||||
Accrued interest receivable | 372,527 | 217,064 | ||||||
Deferred tax asset | 1,581,010 | 1,341,864 | ||||||
Other assets | 126,113 | 571,863 | ||||||
Total assets | $ | 98,505,036 | $ | 62,809,577 | ||||
Liabilities: | ||||||||
Deposits: | ||||||||
Noninterest-bearing transaction accounts | $ | 10,374,841 | $ | 7,498,008 | ||||
Interest-bearing transaction accounts | 6,046,689 | 4,829,484 | ||||||
Savings and money market | 24,762,926 | 18,099,415 | ||||||
Time deposits $100,000 and over | 26,901,355 | 6,790,565 | ||||||
Other time deposits | 18,008,113 | 13,428,184 | ||||||
Total deposits | 86,093,924 | 50,645,656 | ||||||
Federal funds purchased | — | 533,000 | ||||||
Note payable | 900,000 | — | ||||||
Accrued interest payable | 289,089 | 97,181 | ||||||
Other liabilities | 296,909 | 150,975 | ||||||
Total liabilities | 87,579,922 | 51,426,812 | ||||||
Commitments and contingencies (Notes 10 and 12) | ||||||||
Shareholders’ equity: | ||||||||
Preferred stock, 10,000,000 shares authorized, none issued | — | — | ||||||
Common stock, no par value, 20,000,000 shares authorized; 1,427,303 shares issued | 13,994,796 | 13,994,796 | ||||||
Retained deficit | (3,044,801 | ) | (2,612,031 | ) | ||||
Accumulated other comprehensive loss | (24,881 | ) | — | |||||
Total shareholders’ equity | 10,925,114 | 11,382,765 | ||||||
Total liabilities and shareholders’ equity | $ | 98,505,036 | $ | 62,809,577 | ||||
The accompanying notes are an integral part of the consolidated financial statements.
F-3
Consolidated Statements of Operations
For the years ended December 31, 2004 and 2003
| 2004 | 2003 | |||||||
Interest income: | ||||||||
Loans, including fees | $ | 3,764,903 | $ | 1,538,196 | ||||
Investment securities: | ||||||||
Taxable | 55,706 | 61,469 | ||||||
Nonmarketable equity securities | 20,777 | 17,078 | ||||||
Federal funds sold | 84,337 | 68,845 | ||||||
Total | 3,925,723 | 1,685,588 | ||||||
Interest expense: | ||||||||
Time deposits $100,000 and over | 223,513 | 131,289 | ||||||
Other deposits | 982,055 | 379,118 | ||||||
Federal funds purchased | 129 | 792 | ||||||
Note payable | 512 | — | ||||||
Total | 1,206,209 | 511,199 | ||||||
Net interest income | 2,719,514 | 1,174,389 | ||||||
Provision for loan losses | 505,607 | 675,660 | ||||||
Net interest income after provision for loan losses | 2,213,907 | 498,729 | ||||||
Noninterest income: | ||||||||
Service charges on deposit accounts | 133,028 | 50,173 | ||||||
Residential mortgage origination fees | 99,502 | 231,499 | ||||||
Other | 40,346 | 22,855 | ||||||
Total noninterest income | 272,876 | 304,527 | ||||||
Noninterest expenses: | ||||||||
Salaries and employee benefits | 1,752,657 | 1,487,052 | ||||||
Net occupancy | 256,306 | 223,734 | ||||||
Furniture and equipment | 146,590 | 120,816 | ||||||
Other operating | 992,631 | 798,940 | ||||||
Total noninterest expense | 3,148,184 | 2,630,542 | ||||||
Loss before income taxes | (661,401 | ) | (1,827,286 | ) | ||||
Income tax benefit | (228,631 | ) | (616,174 | ) | ||||
Net loss | $ | (432,770 | ) | $ | (1,211,112 | ) | ||
Earnings per share | ||||||||
Basic loss per share | $ | (0.30 | ) | $ | (0.85 | ) | ||
Average shares outstanding | 1,427,303 | 1,427,303 | ||||||
The accompanying notes are an integral part of the consolidated financial statements.
F-4
Consolidated Statements of Changes in Shareholders’ Equity and Comprehensive Loss
For the years ended December 31, 2004 and 2003
| Common Stock | Retained Deficit | Accumulated Other Comprehensive Loss | Total | ||||||||||||||
| Shares | Amount | ||||||||||||||||
Balance, December 31, 2002 | 1,427,303 | $ | 13,994,796 | $ | (1,400,919 | ) | $ | — | $ | 12,593,877 | |||||||
Net loss | — | — | (1,211,112 | ) | — | (1,211,112 | ) | ||||||||||
Balance, December 31, 2003 | 1,427,303 | 13,994,796 | (2,612,031 | ) | — | 11,382,765 | |||||||||||
Net loss | — | — | (432,770 | ) | — | (432,770 | ) | ||||||||||
Other comprehensive loss, net of tax benefit | — | — | — | (24,881 | ) | (24,881 | ) | ||||||||||
Balance, December 31, 2004 | 1,427,303 | $ | 13,994,796 | $ | (3,044,801 | ) | $ | (24,881 | ) | $ | 10,925,114 | ||||||
The accompanying notes are an integral part of the consolidated financial statements.
F-5
Consolidated Statements of Cash Flows
For the years ended December 31, 2004 and 2003
| 2004 | 2003 | |||||||
Cash flows from operating activities: | ||||||||
Net loss | $ | (432,770 | ) | $ | (1,211,112 | ) | ||
Adjustments to reconcile net loss to net cash used by operating activities: | ||||||||
Provision for loan losses | 505,607 | 675,660 | ||||||
Depreciation and amortization expense | 132,759 | 109,751 | ||||||
Discount accretion and premium amortization | 2,131 | 70,790 | ||||||
Deferred income tax benefit | (233,090 | ) | (616,174 | ) | ||||
Increase in accrued interest receivable | (155,463 | ) | (114,041 | ) | ||||
Increase in accrued interest payable | 191,908 | 77,289 | ||||||
Decrease (increase) in other assets | 445,750 | (502,971 | ) | |||||
Increase in other liabilities | 145,934 | 82,083 | ||||||
Net cash provided (used) by operating activities | 602,766 | (1,428,725 | ) | |||||
Cash flows from investing activities: | ||||||||
Purchases of securities available for sale | (3,000,000 | ) | — | |||||
Purchases of nonmarketable equity securities | (76,900 | ) | (45,000 | ) | ||||
Calls or maturities of securities held to maturity | 3,300,000 | 2,000,000 | ||||||
Net increase in loans | (35,372,884 | ) | (44,769,382 | ) | ||||
Purchase of premises, furniture and equipment | (345,828 | ) | (92,807 | ) | ||||
Net cash used by investing activities | (35,495,612 | ) | (42,907,189 | ) | ||||
Cash flows from financing activities: | ||||||||
Net increase in demand deposits, interest-bearing transaction accounts and savings accounts | 10,757,549 | 21,408,833 | ||||||
Net increase in certificates of deposit and other time deposits | 24,690,719 | 9,085,196 | ||||||
Increase (decrease) in federal funds purchased | (533,000 | ) | 533,000 | |||||
Proceeds from notes payable | 900,000 | — | ||||||
Net cash provided by financing activities | 35,815,268 | 31,027,029 | ||||||
Net increase (decrease) in cash and cash equivalents | 922,422 | (13,308,885 | ) | |||||
Cash and cash equivalents, beginning of year | 2,459,441 | 15,768,326 | ||||||
Cash and cash equivalents, end of year | $ | 3,381,863 | $ | 2,459,441 | ||||
The accompanying notes are an integral part of the consolidated financial statements.
F-6
Notes to Consolidated Financial Statements
NOTE 1—SUMMARY OF SIGNIFICANT ACCOUNTING POLICIES
Organization—Carolina National Corporation (the “Company”) was incorporated on February 14, 2000, to be a bank holding company for Carolina National Bank & Trust Company (the “bank”). Carolina National Bank & Trust Company commenced business on July 15, 2002. The principal business activity of the bank is to provide banking services to domestic markets, principally in Richland County, South Carolina. The bank is chartered under the National Bank Act, and its deposits are insured by the Federal Deposit Insurance Corporation up to applicable limits. The consolidated financial statements include the accounts of the parent company and its wholly-owned subsidiary after elimination of all significant intercompany balances and transactions.
Management’s Estimates—The preparation of consolidated financial statements in conformity with generally accepted accounting principles requires management to make estimates and assumptions that affect the reported amounts of assets and liabilities and disclosure of contingent assets and liabilities at the date of the financial statements and the reported amounts of income and expenses during the reporting period. Actual results could differ from those estimates.
Material estimates that are particularly susceptible to significant change relate to the determination of the allowance for losses on loans, including valuation allowances for impaired loans, and the valuation of real estate acquired in connection with foreclosures or in satisfaction of loans. In connection with the determination of the allowances for losses on loans and valuation of foreclosed real estate, management obtains independent appraisals for significant properties. Management must also make estimates in determining the estimated useful lives and methods for depreciating premises and equipment.
While management uses available information to recognize losses on loans and foreclosed real estate, future additions to the allowances may be necessary based on changes in local economic conditions. In addition, regulatory agencies, as an integral part of their examination process, periodically review the Company’s allowances for losses on loans and foreclosed real estate. Such agencies may require the Company to recognize additions to the allowances based on their judgments about information available to them at the time of their examination. Because of these factors, it is reasonably possible that the allowances for losses on loans and foreclosed real estate may change materially in the near term.
Significant Group Concentrations of Credit Risk—Most of the Company’s activities are with customers located within the Columbia, South Carolina metropolitan area. The types of securities in which the Company invests are discussed in Note 3. The types of lending in which the Company engages are discussed in Note 4. The Company does not have any significant concentrations to any one industry or customer.
Securities Available-for-Sale—Securities available-for-sale are carried at amortized cost and adjusted to estimated market value by recognizing the aggregate unrealized gains or losses in a valuation account. Aggregate market valuation adjustments are recorded in stockholders’ equity net of deferred income taxes. Reductions in market value considered by management to be other than temporary are reported as a realized loss and a reduction in the cost basis of the security. The adjusted cost basis of investments available-for-sale is determined by specific identification and is used in computing the gain or loss upon sale.
Securities Held-to-Maturity—Investment securities are stated at cost, adjusted for amortization of premium and accretion of discount computed by the straight-line method which approximates the interest method. The Company has the ability and management has the intent to hold investment securities to maturity. Reductions in market value considered by management to be other than temporary are reported as a realized loss and a reduction in the cost basis of the security.
F-7
CAROLINA NATIONAL CORPORATION
Notes to Consolidated Financial Statements—(Continued)
Nonmarketable Equity Securities—Nonmarketable equity securities include the cost of the Company’s investment in the stock of the Federal Reserve Bank of Richmond and the Federal Home Loan Bank of Atlanta. The stocks have no quoted market value and no ready market exists. Investment in the Federal Home Loan Bank is a condition of borrowing from the Federal Home Loan Bank, and the stock is pledged to collateralize such borrowings. At December 31, 2004 and 2003, the Company’s investment in Federal Home Loan Bank stock was $122,400 and $45,500, respectively. The investment in Federal Reserve Bank stock totaled $270,000 at December 31, 2004 and 2003. Dividends received on these stocks are included as a separate component of interest income.
Loans receivable—Loans are stated at their unpaid principal balance. Interest income is computed using the simple interest method and is recorded in the period earned. Fees earned on loans are amortized over the life of the loan.
When serious doubt exists as to the collectibility of a loan or when a loan becomes contractually 90 days past due as to principal or interest, interest income is generally discontinued unless the estimated net realizable value of collateral exceeds the principal balance and accrued interest. When interest accruals are discontinued, income earned but not collected is reversed.
The Company identifies impaired loans through its normal internal loan review process. Loans on the Company’s problem loan watch list are considered potentially impaired loans. These loans are evaluated in determining whether all outstanding principal and interest are expected to be collected in accordance with the contractual terms. Loans are not considered impaired if a minimal payment delay occurs and all amounts due, including accrued interest at the contractual interest rate for the period of delay, are expected to be collected. At December 31, 2004, management has determined that the Company had no impaired loans.
Allowance for Loan Losses—The provision for loan losses charged to operating expenses reflects the amount deemed appropriate by management to establish an adequate reserve to meet the present and foreseeable risk characteristics of the current loan portfolio. Management’s judgment is based on periodic and regular evaluation of individual loans, the overall risk characteristics of the various portfolio segments, and prevailing and anticipated economic conditions. Loans that are determined to be uncollectible are charged against the allowance. Provisions for loan losses and recoveries on loans previously charged off are added to the allowance.
Impaired Loans—The bank accounts for impaired loans in accordance with Financial Accounting Standards Board (“FASB”) Statement of Financial Accounting Standards (“SFAS”) No. 114,“Accounting by Creditors for Impairment of a Loan.” This statement requires that all lenders value a loan at the loan’s fair value if it is probable that the lender will be unable to collect all amounts due according to the terms of the loan agreement. Fair value may be determined based upon the present value of expected cash flows, market price of the loan, if available, or value of the underlying collateral. Expected cash flows are required to be discounted at the loan’s effective interest rate. SFAS No. 114 was amended by SFAS No. 118,“Accounting by Creditors for Impairment of a Loan—Income Recognition and Disclosures” to allow a lender to use existing methods for recognizing interest income on an impaired loan and by requiring additional disclosures about how a creditor recognizes interest income on an impaired loan.
Under SFAS No. 114, as amended by SFAS No. 118, when the ultimate collectibility of an impaired loan’s principal is in doubt, wholly or partially, all cash receipts are applied to principal. Once the reported principal balance has been reduced to zero, future cash receipts are applied to interest income, to the extent that any interest has been foregone. Further cash receipts are recorded as recoveries of any amounts previously charged
F-8
CAROLINA NATIONAL CORPORATION
Notes to Consolidated Financial Statements—(Continued)
off. When this doubt does not exist, cash receipts are applied under the contractual terms of the loan agreement first to interest income then to principal.
A loan is also considered impaired if its terms are modified in a troubled debt restructuring. For these accruing impaired loans, cash receipts are typically applied to principal and interest receivable in accordance with the terms of the restructured loan agreement. Interest income is recognized on these loans using the accrual method of accounting.
Premises, Furniture and Equipment—Premises, furniture and equipment are stated at cost, less accumulated depreciation. The provision for depreciation is computed by the straight-line method, based on the estimated useful lives for buildings of 40 years and for furniture and equipment of 5 to 10 years. Leasehold improvements are amortized over the life of the lease. The cost of assets sold or otherwise disposed of and the related allowance for depreciation are eliminated from the accounts and the resulting gains or losses are reflected in the income statement when incurred. Maintenance and repairs are charged to current expense. The costs of major renewals and improvements are capitalized.
Residential Loan Origination Fees—The Company offers residential loan origination services to its customers in its immediate market area. The loans are offered on terms and prices offered by the Company’s correspondents and are closed in the name of the correspondents. The Company receives fees for services it provides in conjunction with the origination services it provides. The fees are recognized at the time the loans are closed by the Company’s correspondent.
Income Taxes—Income taxes are the sum of amounts currently payable to taxing authorities and the net changes in income taxes payable or refundable in future years. Income taxes deferred to future years are determined utilizing a liability approach. This method gives consideration to the future tax consequences associated with differences between financial accounting and tax bases of certain assets and liabilities which are principally the allowance for loan losses, depreciable premises and equipment, and net operating loss carryforwards.
Advertising Expense—Advertising and public relations costs are generally expensed as incurred. External costs incurred in producing media advertising are expensed the first time the advertising takes place. External costs relating to direct mailing costs are expended in the period in which the direct mailings are sent. Advertising and public relations costs of $69,505 and $104,548 were included in the Company’s results of operations for 2004 and 2003, respectively.
Retirement Benefits—The Company has a 401(k) Plan in place for the benefit of all eligible employees. The Company contributes to the Plan annually upon approval by the Board of Directors. The amount of the contributions made is at the discretion of the Board. Contributions made to the Plan in 2004 and 2003 amounted to $24,706 and $28,554, respectively.
Stock-Based Compensation—The Company has a stock-based employee compensation plan which is further described in Note 14. The Company accounts for the plan under the recognition and measurement principles of Accounting Principles Board (“APB”) Opinion No. 25,Accounting for Stock Issued to Employees, and related Interpretations. No stock-based employee compensation cost is reflected in net income, as all stock options granted had an exercise price equal to the market value of the underlying common stock on the date of grant. In addition, the Company has outstanding stock warrants which were issued to directors of the bank in connection with the organization of the bank as described in Note 13. The following table illustrates the effect on net income (loss) and earnings (losses) per share if the Company had applied the fair value recognition
F-9
CAROLINA NATIONAL CORPORATION
Notes to Consolidated Financial Statements—(Continued)
provisions of SFAS No. 123,Accounting for Stock-Based Compensation, to stock-based employee compensation for both the stock options and stock warrants.
| Year Ended December 31, | ||||||||
| 2004 | 2003 | |||||||
Net loss, as reported | $ | (432,770 | ) | $ | (1,211,112 | ) | ||
Deduct: Total stock-based employee compensation expense determined under fair value based method for all awards, net of related tax effects | (121,991 | ) | (296,988 | ) | ||||
Pro forma net loss | $ | (554,761 | ) | $ | (1,508,100 | ) | ||
Loss per share: | ||||||||
Basic—as reported | $ | (0.30 | ) | $ | (0.85 | ) | ||
Basic—pro forma | $ | (0.39 | ) | $ | (1.06 | ) | ||
In calculating the pro forma disclosures, the fair value of options and warrants granted is estimated as of the date granted using the Black-Scholes option pricing model with the following weighted-average assumptions used for grants in 2004; dividend yield of 0 percent; expected volatility of 10.61 percent; risk-free interest rate of 4.05 percent; and expected life of 7 years. The Company did not issue any options or warrants during 2003.
Loss Per Share—Basic loss per share represents income available to shareholders divided by the weighted-average number of common shares outstanding during the period. Dilutive loss per share reflects additional common shares that would have been outstanding if dilutive potential common shares had been issued. Potential common shares that may be issued by the Company relate to both outstanding warrants and stock options, and are determined using the treasury stock method. Due to the net loss, the outstanding warrants and stock options are not considered common stock equivalents and therefore, dilutive loss per share is not presented.
Comprehensive Income—Accounting principles generally require that recognized revenue, expenses, gains and losses be included in net income. Although certain changes in assets and liabilities, such as unrealized gains and losses on available-for-sale securities, are reported as a separate component of the equity section of the balance sheet, such items, along with net income, are components of comprehensive income (loss).
The components of other comprehensive loss and related tax effects for the year ended December 31, 2004 are as follows:
| 2004 | ||||
Unrealized holding losses on securities available-for-sale | $ | (30,937 | ) | |
Reclassification adjustment for losses realized in net income | — | |||
Net unrealized losses on securities available-for-sale | (30,937 | ) | ||
Tax effect | 6,056 | |||
Net-of-tax amount | $ | (24,881 | ) | |
Statement of Cash Flows—For purposes of reporting cash flows in the financial statements, the Company considers certain highly liquid debt instruments purchased with a maturity of three months or less to be cash equivalents. Cash equivalents include amounts due from banks and federal funds sold. Generally, federal funds are sold for one-day periods.
F-10
CAROLINA NATIONAL CORPORATION
Notes to Consolidated Financial Statements—(Continued)
Interest paid on deposits and other borrowings totaled $1,014,301 and $433,910 for the years ended December 31, 2004 and 2003, respectively.
Income taxes paid for the years ended December 31, 2004 and 2003 totaled $5,346 and $5,558, respectively.
Changes in the valuation account of securities available-for-sale, including the deferred tax effects, are considered noncash transactions for purposes of the statement of cash flows and are presented in detail in the notes to the financials.
Off-Balance-Sheet Financial Instruments—In the ordinary course of business, the Company enters into off-balance-sheet financial instruments consisting of commitments to extend credit and letters of credit. These financial instruments are recorded in the financial statements when they become payable by the customer.
Recent Accounting Pronouncements—In April 2003, FASB issued SFAS No. 149,“Amendment of Statement 133 on Derivative Instruments and Hedging Activities”, which amends and clarifies accounting and reporting for derivative instruments, including certain derivative instruments embedded in other contracts (collectively referred to as derivatives) and loan commitments that relate to the origination of mortgage loans held for sale, and for hedging activities under SFAS No. 133,“Accounting for Derivative Instruments and Hedging Activities”. SFAS No. 149 clarifies under what circumstances a contract with an initial net investment meets the characteristics of a derivative, clarifies when a derivative contains a financing component, amends the definition of an underlying to conform it to language used in FASB Interpretation (“FIN”) No. 45, and amends certain other existing pronouncements. The pronouncement was generally effective for contracts entered into or modified after June 30, 2003. The adoption of SFAS No. 149 did not have any impact on the financial condition or operating results of the Company.
In May 2003, the FASB issued SFAS No. 150,“Accounting for Certain Financial Instruments with Characteristics of both Liabilities and Equity”, which establishes standards for how an issuer classifies and measures certain financial instruments with characteristics of both liabilities and equity. SFAS No. 150 requires an issuer to classify certain financial instruments that include certain obligations, such as mandatory redemption, repurchase of the issuer’s equity, or settlement by issuing equity, previously classified as equity, as liabilities or assets in some circumstances. SFAS No. 150 was generally effective for financial instruments entered into or modified after May 31, 2003, and otherwise was effective at the beginning of the first interim period beginning after June 15, 2003, except for mandatorily redeemable financial instruments of nonpublic entities which are subject to the provisions of SFAS No. 150 for the first fiscal period beginning after December 15, 2003. The adoption of SFAS No. 150 did not have any impact on the financial condition or operating results of the Company.
In December 2004, the FASB issued SFAS No. 153,“Exchanges of Nonmonetary Assets, an amendment of APB Opinion No. 29, Accounting for Nonmonetary Transactions.” The amendments made by SFAS No. 153 are based on the principle that exchanges of nonmonetary assets should be measured based on the fair value of the assets exchanged. Further, the amendments eliminate the narrow exception for nonmonetary exchanges of similar productive assets and replace it with a broader exception for exchanges of nonmonetary assets that do not have commercial substance. Previously, Accounting Principles Board (“APB”) Opinion No. 29 required that the accounting for an exchange of a productive asset for a similar productive asset or an equivalent interest in the same or similar productive asset should be based on the recorded amount of the asset relinquished. APB Opinion No. 29 provided an exception to its basic measurement principle (fair value) for exchanges of similar productive assets. SFAS No. 153 is effective for nonmonetary asset exchanges occurring in fiscal periods beginning after June 15, 2005. Earlier application is permitted for nonmonetary asset exchanges occurring in fiscal periods
F-11
CAROLINA NATIONAL CORPORATION
Notes to Consolidated Financial Statements—(Continued)
beginning after the date of issuance. The provisions of this statement shall be applied prospectively. The adoption of this statement is not expected to have a material impact on the financial condition or operating results of the Company.
In December 2004, the FASB issued SFAS No. 123 (revised 2004),“Share-Based Payment” (“SFAS No. 123(R)”). SFAS No. 123(R) will require companies to measure all employee stock-based compensation awards using a fair value method and record such expense in its financial statements. In addition, the adoption of SFAS No. 123(R) requires additional accounting and disclosure related to the income tax and cash flow effects resulting from share-based payment arrangements. SFAS No. 123(R) is effective beginning as of the first interim or annual reporting period beginning after December 15, 2005. The Company is currently evaluating the impact that the adoption of SFAS No. 123(R) will have on its financial position, results of operations and cash flows.
In November 2002, the FASB issued FIN No. 45,“Guarantor’s Accounting and Disclosure Requirements for Guarantees, Including Indirect Guarantees of Indebtedness of Others”. FIN No. 45 elaborates on the disclosure to be made by a guarantor in its interim and annual financial statements about its obligations under certain guarantees and warranties that it has issued. FIN 45 requires a company, at the time it issues a guarantee, to recognize an initial liability for the fair value of obligations assumed under the guarantee. The initial recognition requirements of FIN No. 45 were effective for guarantees issued or modified after December 31, 2002. The disclosure requirements were effective for financial statements for periods ending after December 15, 2002. The adoption of FIN No. 45 did not have a material impact on the Company’s financial position or results of operations.
In December 2003, the FASB issued FIN No. 46 (revised),“Consolidation of Variable Interest Entities” (“FIN No. 46(R)”), which addresses consolidation by business enterprises of variable interest entities. FIN No. 46(R) requires a variable interest entity to be consolidated by a company if that company is subject to a majority of the risk of loss from the variable interest entity’s activities or entitled to receive a majority of the entity’s residual returns, or both. FIN No. 46(R) also requires disclosures about variable interest entities that a company is not required to consolidate, but in which it has a significant variable interest. FIN No. 46(R) provides guidance for determining whether an entity qualifies as a variable interest entity by considering, among other considerations, whether the entity lacks sufficient equity or its equity holders lack adequate decision-making ability. The consolidation requirements of FIN No. 46(R) applied immediately to variable interest entities created after January 31, 2003. The consolidation requirements applied to the Company’s existing variable interest entities in the first reporting period ending after December 15, 2004.Certain of the disclosure requirements applied to all financial statements issued after December 31, 2003, regardless of when the variable interest entity was established. The adoption of FIN No. 46(R) did not have any impact on the Company’s financial position or results of operations.
In November 2003, the Emerging Issues Task Force (“EITF”) reached a consensus that certain quantitative and qualitative disclosures should be required for debt and marketable equity securities classified as available-for-sale or held-to-maturity under SFAS No. 115 and SFAS No. 124 that are impaired at the balance sheet date but for which other-than-temporary impairment has not been recognized. Accordingly the EITF issued EITF No. 03-1, “The Meaning of Other-Than-Temporary Impairment and Its Application to Certain Investments.” This issue addresses the meaning of other-than-temporary impairment and its application to investments classified as either available-for-sale or held-to-maturity under SFAS No. 115 and provides guidance on quantitative and qualitative disclosures. The disclosure requirements of EITF No. 03-1 are effective for annual financial statements for fiscal years ending after June 15, 2004. The effective date for the measurement and recognition guidance of EITF No. 03-1 has been delayed. The FASB staff has issued a proposed Board-directed FASB Staff Position (“FSP”), FSP EITF 03-1-a,“Implementation Guidance for the Application of Paragraph 16
F-12
CAROLINA NATIONAL CORPORATION
Notes to Consolidated Financial Statements—(Continued)
of Issue No. 03-1”. The proposed FSP would provide implementation guidance with respect to debt securities that are impaired solely due to interest rates and/or sector spreads and analyzed for other-than-temporary impairment under the measurement and recognition requirements of EITF No. 03-1. The delay of the effective date for the measurement and recognition requirements of EITF No. 03-1 will be superseded concurrent with the final issuance of FSP EITF 03-1-a. Adopting the disclosure provisions of EITF No. 03-1 did not have any impact on the Company’s financial position or results of operations.
In March 2004, the Securities and Exchange Commission (“SEC”) issued Staff Accounting Bulletin (“SAB”) No. 105,“Application of Accounting Principles to Loan Commitments”, to inform registrants of the Staff’s view that the fair value of the recorded loan commitments should not consider the expected future cash flows related to the associated servicing of the future loan. The provisions of SAB No. 105 must be applied to loan commitments accounted for as derivatives that are entered into after March 31, 2004. The Staff will not object to the application of existing accounting practices to loan commitments accounted for as derivatives that are entered into on or before March 31, 2004, with appropriate disclosures. The Company adopted the provisions of SAB No. 105 on April 1, 2004. The adoption of SAB No. 105 did not have any impact on the Company’s financial condition or results of operations.
Other accounting standards that have been issued or proposed by the FASB or other standards-setting bodies that do not require adoption until a future date are not expected to have a material impact on the consolidated financial statements upon adoption.
Risks and Uncertainties—In the normal course of its business, the Company encounters two significant types of risks: economic and regulatory. There are three main components of economic risk: interest rate risk, credit risk and market risk. The Company is subject to interest rate risk to the degree that its interest-bearing liabilities mature or reprice at different speeds, or on different basis, than its interest-earning assets. Credit risk is the risk of default on the Company’s loan portfolio that results from borrowers’ inability or unwillingness to make contractually required payments. Market risk reflects changes in the value of collateral underlying loans receivable and the valuation of real estate held by the Company.
The Company is subject to the regulations of various governmental agencies. These regulations can and do change significantly from period to period. The Company also undergoes periodic examinations by the regulatory agencies, which may subject it to further changes with respect to asset valuations, amounts of required loss allowances and operating restrictions from the regulators’ judgments based on information available to them at the time of their examination.
Reclassifications—Certain captions and amounts in the 2003 financial statements were reclassified to conform with the 2004 presentation.
NOTE 2—CASH AND DUE FROM BANKS
The Company is required to maintain cash balances with The Bankers Bank to cover all cash letter transactions. At December 31, 2004 and 2003, the requirement was met by the cash balance in the account.
F-13
CAROLINA NATIONAL CORPORATION
Notes to Consolidated Financial Statements—(Continued)
NOTE 3—INVESTMENT SECURITIES
Securities available-for-sale consisted of the following:
Amortized Cost | Gross Unrealized | Estimated Fair Value | ||||||||||
| Gains | Losses | |||||||||||
December 31, 2004 | ||||||||||||
Securities of U.S. government agencies and corporations | $ | 3,000,000 | $ | — | $ | 30,937 | $ | 2,969,063 | ||||
The amortized cost and estimated fair values of securities held-to-maturity were: | ||||||||||||
December 31, 2003 | ||||||||||||
U.S. government agencies and corporations | $ | 3,302,131 | $ | 4,057 | $ | — | $ | 3,306,188 | ||||
The following is a summary of maturities of securities available-for-sale at December 31, 2004. The amortized cost and estimated fair values are based on the contractual maturity dates. Actual maturities may differ from the contractual maturities because borrowers may have the right to prepay obligations with or without penalty.
| December 31, 2004 | ||||||
| Amortized Cost | Estimated Fair Value | |||||
Due after one year but within five years | $ | 3,000,000 | $ | 2,969,063 | ||
Total | $ | 3,000,000 | $ | 2,969,063 | ||
The following table shows gross unrealized losses and fair value, aggregated by investment category, and length of time that individual securities have been in a continuous unrealized loss position, at December 31, 2004.
Securities Available for Sale
| Less than twelve months | Twelve months or more | Total | ||||||||||||||||
| Fair value | Unrealized losses | Fair value | Unrealized losses | Fair value | Unrealized losses | |||||||||||||
Securities of other U.S. government agencies and corporations | $ | 2,969,063 | $ | 30,937 | $ | — | $ | — | $ | 2,969,063 | $ | 30,937 | ||||||
There were no securities with unrealized losses for more than twelve months at December 31, 2004.
At December 31, 2004 and 2003, no investment securities were pledged as collateral to secure public deposits or for other purposes as required or permitted by law.
F-14
CAROLINA NATIONAL CORPORATION
Notes to Consolidated Financial Statements—(Continued)
NOTE 4—LOANS RECEIVABLE
Major classifications of loans receivable at December 31 are summarized as follows:
| December 31, | ||||||||
| 2004 | 2003 | |||||||
Real estate—construction | $ | 15,063,632 | $ | 6,444,887 | ||||
Real estate—mortgage | 61,038,890 | 37,175,462 | ||||||
Commercial and industrial | 11,490,226 | 9,680,099 | ||||||
Consumer and other | 2,922,302 | 1,730,025 | ||||||
| 90,515,050 | 55,030,473 | |||||||
Less: deferred loan fees | (211,301 | ) | (99,608 | ) | ||||
Total gross loans | $ | 90,303,749 | $ | 54,930,865 | ||||
Transactions in the allowance for loan losses during 2004 and 2003 are summarized below:
| 2004 | 2003 | ||||||
Balance, beginning of year | $ | 826,593 | $ | 152,000 | |||
Provision charged to operations | 505,607 | 675,660 | |||||
Chargeoffs | — | (1,067 | ) | ||||
Balance, end of year | $ | 1,332,200 | $ | 826,593 | |||
At December 31, 2004 and 2003, the bank had no loans in nonaccrual status, no loans past due ninety days or more and still accruing interest, and no restructured loans.
Management is not aware of any significant concentrations of loans to classes of borrowers or industries that would be affected similarly by economic conditions. Although the Company’s loan portfolio is diversified, a substantial portion of its borrowers’ ability to honor the terms of their loans is dependent on the economic conditions in the Columbia, South Carolina metropolitan area.
NOTE 5—PREMISES, FURNITURE AND EQUIPMENT
Premises, furniture and equipment consisted of the following:
| December 31, | ||||||
| 2004 | 2003 | |||||
Buildings | $ | 210,140 | $ | — | ||
Leasehold improvements | 92,562 | 82,870 | ||||
Furniture and equipment | 691,022 | 565,027 | ||||
Total | 993,724 | 647,897 | ||||
Less, accumulated depreciation | 283,213 | 150,455 | ||||
Premises, furniture and equipment, net | $ | 710,511 | $ | 497,442 | ||
Depreciation and amortization expense was $132,759 and $109,751 for the years ended December 31, 2004 and 2003, respectively.
F-15
CAROLINA NATIONAL CORPORATION
Notes to Consolidated Financial Statements—(Continued)
NOTE 6—DEPOSITS
At December 31, 2004, the scheduled maturities of certificates of deposit were as follows:
Maturing In: | Amount | ||
2005 | $ | 34,534,448 | |
2006 | 9,206,095 | ||
2007 | 1,161,425 | ||
2008 | 7,500 | ||
Total | $ | 44,909,468 | |
NOTE 7—NOTE PAYABLE
On August 12, 2004, the Company executed a line of credit with Bank One to borrow up to $3,000,000. The borrowable amount increases to $5,000,000 and $7,000,000 after the receipt of the March 31, 2005, and June 30, 2005 Call Reports, which are financial reports filed with the Federal Deposit Insurance Corporation, respectively. The entire principal balance of the note is due September 30, 2006, with interest payments due monthly. The interest rate on the note is 2.75% above the 30 day LIBOR rate. At December 31, 2004, the rate was 5.16%. The note is secured by 100% of the bank stock owned by the Company. Proceeds from the note were used to provide capital to the bank for regulatory purposes. On December 28, 2004, the Company borrowed $900,000 on this line of credit.
NOTE 8—OTHER OPERATING EXPENSES
Other operating expenses for the years ended December 31, 2004 and 2003 are summarized below:
| 2004 | 2003 | |||||
Professional fees | $ | 199,392 | $ | 140,058 | ||
Telephone expenses | 34,048 | 28,995 | ||||
Office supplies, stationery, and printing | 57,802 | 43,307 | ||||
Data Processing and related expenses | 226,311 | 161,533 | ||||
Advertising and public relations | 69,505 | 104,548 | ||||
Postage | 13,142 | 14,004 | ||||
Other legal expenses | 55,485 | 64,431 | ||||
Other | 336,946 | 242,064 | ||||
Total | $ | 992,631 | $ | 798,940 | ||
NOTE 9—INCOME TAXES
Income tax expense for 2004 and 2003 is summarized as follows:
| 2004 | 2003 | |||||||
Current portion | ||||||||
Federal | $ | — | $ | — | ||||
State | 787 | 922 | ||||||
Total current | 787 | 922 | ||||||
Deferred | (229,418 | ) | (617,096 | ) | ||||
Income tax benefit | $ | (228,631 | ) | $ | (616,174 | ) | ||
F-16
CAROLINA NATIONAL CORPORATION
Notes to Consolidated Financial Statements—(Continued)
The gross amounts of deferred tax assets and deferred tax liabilities are as follows:
| December 31, | ||||||
| 2004 | 2003 | |||||
Deferred tax assets: | ||||||
Allowance for loan losses | $ | 444,340 | $ | 275,627 | ||
Net operating loss carryforward | 924,361 | 797,824 | ||||
Organization and start-up costs | 206,125 | 288,575 | ||||
Loan origination costs | 67,809 | 33,867 | ||||
Other | 1,761 | — | ||||
Total deferred tax assets | 1,644,396 | 1,395,893 | ||||
Deferred tax liabilities: | ||||||
Accumulated depreciation | 72,325 | 59,296 | ||||
Available for sale securities | 6,056 | — | ||||
Total deferred tax liabilities | 78,381 | 59,296 | ||||
Net deferred tax asset | $ | 1,566,015 | $ | 1,336,597 | ||
Deferred tax assets represent the future tax benefit of deductible differences and, if it is more likely than not that a tax asset will not be realized, a valuation allowance is required to reduce the recorded deferred tax assets to net realizable value. As of December 31, 2004, management believes it will fully realize 100% of the Company’s deferred tax asset.
The Company has a net operating loss for income tax purposes of $1,792,952 as of December 31, 2004. This net operating loss expires in the years 2021 through 2024.
A reconciliation between the income tax expense and the amount computed by applying the Federal statutory rate of 34% for 2004 and 2003 to income before income taxes follows:
| 2004 | 2003 | |||||||
Tax expense (benefit) at statutory rate | $ | (224,876 | ) | $ | (616,177 | ) | ||
State income tax, net of federal income tax effect | (7,525 | ) | (35,936 | ) | ||||
Other | 3,770 | 35,939 | ||||||
Income tax benefit | $ | (228,631 | ) | $ | (616,174 | ) | ||
NOTE 10—LEASES
The Company leases facilities for all of its banking locations. Most of the leases have renewal provisions at the Company’s option. Certain leases also contain rent escalation clauses that require additional rental amounts in the later years of the term. Rent expense is recognized on a straight line basis over the life of the minimum lease term.
The Company leases part of a building as its main branch location and its center of operations.The operating lease has an initial five-year term, which expires January 31, 2007, and is renewable, at the Company’s option, for five five-year terms at a 10% increased monthly rental. The lease required monthly payments of $7,289 for years 1 and 2 of the initial lease period, and requires $8,098 a month for the three years thereafter. The monthly payment upon the first renewal will be $8,098.
F-17
CAROLINA NATIONAL CORPORATION
Notes to Consolidated Financial Statements—(Continued)
Additionally, the Company leases another building as a branch location where. The operating lease has an initial ten-year, two-month term, which expires January 31, 2012. The lease requires monthly payments of $4,000 for the first five years of the initial lease period, and $4,400 a month for the remainder of the lease.
The Company also leases a plot of land one block from its main branch location where the Company has built a drive up teller facility. The operating lease has an initial seven-year term, which expires January 31, 2010, and is renewable, at the Company’s option, for three additional five-year terms at a 15% increased monthly rental for each successive lease term. The lease requires monthly payments of $2,500 for the first five years of the initial term, followed by monthly payments of $2,875 for the last two years of the term.
Rental expense under these operating lease agreements was $175,180 and $165,468 for the years ended December 31, 2004 and 2003, respectively.
Minimal future rental payments under non-cancelable operating leases having remaining terms in excess of one year, for each of the next five years in the aggregate are:
2005 | $ | 175,180 | |
2006 | 175,580 | ||
2007 | 90,898 | ||
2008 | 87,300 | ||
2009 | 87,300 | ||
Thereafter | 112,875 | ||
Total minimum future rental payments | $ | 729,133 | |
NOTE 11—RELATED PARTY TRANSACTIONS
Certain parties (principally certain directors and executive officers of the Company, their immediate families and business interests) were loan customers of and had other transactions in the normal course of business with the bank. Related party loans are made on substantially the same terms, including interest rates and collateral, as those prevailing at the time for comparable transactions with unrelated persons and do not involve more than the normal risk of collectibility. As of December 31, 2004 and 2003, the bank had related party loans totaling $2,591,200 and $2,386,436, respectively. During 2004, advances on related party loans totaled $391,202, and repayments were $186,438.
NOTE 12—COMMITMENTS AND CONTINGENCIES
The Company may from time to time be subject to claims and lawsuits which arise primarily in the ordinary course of business. Management is not aware of any legal proceedings which would have a material adverse effect on the financial position or operating results of the Company.
NOTE 13—STOCK WARRANTS
The directors of the Company received stock warrants giving them the right to purchase two shares for every three shares they purchased in the initial offerings of the Company’s common stock at a price of $10 per share. The warrants vest one-third on July 15 of each of 2003, 2004 and 2005 and expire on July 15, 2012. Warrants held by directors of the Company will expire 90 days after the director ceases to be a director or officer of the Company (365 days if due to death or disability). At December 31, 2004 and 2003, 200,555 warrants had been granted. At December 31, 2004, 133,703 of the warrants were exercisable.
F-18
CAROLINA NATIONAL CORPORATION
Notes to Consolidated Financial Statements—(Continued)
NOTE 14—STOCK COMPENSATION PLAN
Under the terms of an employment agreement with the Company’s Chief Executive Officer (CEO), stock options were granted to him as part of his compensation and benefits package. Under the agreement, the CEO was granted 64,701 stock options on July 15, 2002. These options vest at a rate of 20% per year for five years, beginning with the grant date. The options have an exercise price of $10.00 per share and terminate ten years after the date of grant.
The Company has also granted a total of 44,000 stock options to its employees. Of these, 40,200 were granted on July 15, 2002, 100 were granted on July 17, 2002, 200 were granted on September 6, 2002, 2,000 were granted on January 21, 2004, and 1,500 were granted on January 31, 2004. These options will vest 30% at the end of three years, 30% at the end of four years, and 40% at the end of five years. Years will be measured from the grant dates. The options issued in 2004 have an exercise price of $11.00 per share and terminate ten years after the date of grant. The weighted average grant date fair value was $11.00 in 2004.
A summary of the status of the Company’s stock options as of December 31, 2004 and 2003, and changes during each year is presented below:
| 2004 | 2003 | ||||||||||
| Shares | Weighted Average Exercise Price | Shares | Weighted Average Exercise Price | ||||||||
Outstanding at beginning of year | 105,201 | $ | 10.00 | 105,201 | $ | 10.00 | |||||
Granted | 3,500 | 11.00 | — | ||||||||
Exercised | — | — | |||||||||
Forfeited | (18,400 | ) | 10.01 | — | 10.00 | ||||||
Outstanding at end of year | 90,301 | 105,201 | |||||||||
Options exercisable at December 31, 2004 and 2003 were 38,821 and 25,880, respectively. The weighted average exercise price of these options was $10.00 and $10.00 in 2004 and 2003, respectively.
The following table summarizes information about stock options outstanding under the Company’s plan at December 31, 2004:
| Outstanding | Exercisable | |||||
Number of options | 90,301 | 38,821 | ||||
Weighted average remaining life | 7.79 years | 7.54 years | ||||
Weighted average exercise price | $ | 10.01 | $ | 10.00 | ||
High exercise price | $ | 11.00 | $ | 10.00 | ||
Low exercise price | $ | 10.00 | $ | 10.00 | ||
F-19
CAROLINA NATIONAL CORPORATION
Notes to Consolidated Financial Statements—(Continued)
NOTE 15—LOSS PER SHARE
Basic loss per share is computed by dividing net income (loss) by the weighted-average number of common shares outstanding. Diluted loss per share is computed by dividing net income (loss) by the weighted-average number of common shares outstanding and dilutive common share equivalents using the treasury stock method. Dilutive common share equivalents include common shares issuable upon exercise of outstanding stock warrants and stock options. However, due to the net loss in 2004 and 2003, the outstanding options and warrants are not considered common stock equivalents in these years; therefore, basic loss per share and diluted loss per share were the same.
| 2004 | 2003 | |||||||
Net loss per share—basic computation: | ||||||||
Net loss to common shareholders | $ | (432,770 | ) | $ | (1,211,112 | ) | ||
Average common shares outstanding—basic | 1,427,303 | 1,427,303 | ||||||
Basic loss per share | $ | (0.30 | ) | $ | (0.85 | ) | ||
The number of shares that could potentially dilute basic earnings per share in the future that were not included in the computation because to do so would have been antidilutive for 2004 and 2003 totaled 27,485 shares and 27,796 shares.
NOTE 16—REGULATORY MATTERS
The bank is subject to various regulatory capital requirements administered by the federal banking agencies. Failure to meet minimum capital requirements can initiate certain mandatory, and possibly additional discretionary actions by regulators that, if undertaken, could have a direct adverse material effect on the bank’s financial condition. Under capital adequacy guidelines and the regulatory framework for prompt corrective action, the bank must meet specific capital guidelines that involve quantitative measures of the bank’s assets, liabilities, and certain off-balance-sheet items as calculated under regulatory accounting practices. The bank’s capital amounts and classification are also subject to qualitative judgments by the regulators about components, risk weightings, and other factors.
Quantitative measures established by regulation to ensure capital adequacy require the bank to maintain minimum ratios of Tier 1 and total capital as a percentage of assets and off-balance-sheet exposures, adjusted for risk weights ranging from 0% to 100%. For the bank, Tier 1 capital consists of common shareholders’ equity, excluding the unrealized gain or loss on securities available-for-sale, minus certain intangible assets. For the bank, Tier 2 capital consists of the allowance for loan losses and subordinated debt subject to certain limitations. Total capital for purposes of computing the capital ratios consists of the sum of Tier 1 and Tier 2 capital. The regulatory minimum requirements are 4% for Tier 1 and 8% for total risk-based capital.
The bank is also required to maintain capital at a minimum level based on total assets, which is known as the leverage ratio. Only the strongest banks are allowed to maintain capital at the minimum requirement of 3%. All others are subject to maintaining ratios 1% to 2% above the minimum.
As of December 31, 2004, the most recent notification from the bank’s primary regulator categorized it as well-capitalized under the regulatory framework for prompt corrective action. There are no conditions or events that management believes have changed the bank’s category.
F-20
CAROLINA NATIONAL CORPORATION
Notes to Consolidated Financial Statements—(Continued)
The following table summarizes the capital amounts and ratios of the bank and the regulatory minimum requirements at December 31, 2004 and 2003.
| Actual | For Capital Adequacy Purposes | To Be Well- Capitalized Under Prompt Corrective Action Provisions | ||||||||||||||||
| Amount | Ratio | Amount | Ratio | Amount | Ratio | |||||||||||||
December 31, 2004 | ||||||||||||||||||
Total capital (to risk-weighted assets) | $ | 9,619,000 | 10.37 | % | $ | 7,419,390 | 8.00 | % | $ | 9,274,238 | 10.00 | % | ||||||
Tier 1 capital (to risk-weighted assets) | 6,558,000 | 7.07 | 3,709,695 | 4.00 | 5,564,543 | 6.00 | ||||||||||||
Tier 1 capital (to average assets) | 6,558,000 | 6.88 | 3,813,280 | 4.00 | 4,766,600 | 5.00 | ||||||||||||
December 31, 2003 | ||||||||||||||||||
Total capital (to risk-weighted assets) | $ | 8,019,000 | 14.24 | % | $ | 4,504,800 | 8.00 | % | $ | 5,631,000 | 10.00 | % | ||||||
Tier 1 capital (to risk-weighted assets) | 7,314,000 | 12.99 | 2,252,400 | 4.00 | 3,378,600 | 6.00 | ||||||||||||
Tier 1 capital (to average assets) | 7,314,000 | 14.33 | 2,041,000 | 4.00 | 2,551,300 | 5.00 | ||||||||||||
The Federal Reserve has similar requirements for bank holding companies. The Company is not currently subject to these requirements because the Federal Reserve applies its guidelines on a bank-only basis for bank holding companies with less than $150,000,000 in consolidated assets.
NOTE 17—UNUSED LINES OF CREDIT
As of December 31, 2004, the Company had unused lines of credit to purchase federal funds from unrelated banks totaling $5,550,000. These lines of credit are available on a one to fourteen day basis for general corporate purposes. As of December 31, 2004, we had not drawn on these lines of credit. The Company has a line of credit to borrow funds from the Federal Home Loan Bank up to 10% of the bank’s total assets, which meant $9,800,000 was available as of December 31, 2004. As of December 31, 2004, the bank had not drawn any advances on this line. The Company also had a line of credit to borrow funds from Bank One up to $3,000,000 as of December 31, 2004. As of December 31, 2004, the Company had borrowed $900,000 on this line.
NOTE 18—RESTRICTIONS ON SUBSIDIARY DIVIDENDS, LOANS, OR ADVANCES
The ability of the Company to pay cash dividends is dependent upon receiving cash in the form of dividends from the bank. However, there are restrictions on the ability of the bank to transfer funds to the Company in the form of cash dividends, loans, or advances. The approval of the Office of the Comptroller of the Currency is required to pay dividends in excess of the bank’s net profits (as defined) for the current year plus retained net profits (as defined) for the preceding two years, less any required transfers to surplus. As of December 31, 2004 and 2003, the bank had no retained earnings available for dividends.
NOTE 19—FINANCIAL INSTRUMENTS WITH OFF-BALANCE-SHEET RISK
The Company is a party to financial instruments with off-balance-sheet risk in the normal course of business to meet the financing needs of its customers. These financial instruments consist of commitments to extend credit and standby letters of credit. Commitments to extend credit are agreements to lend to a customer as long as there is no violation of any condition established in the contract. Commitments generally have fixed expiration dates or other termination clauses and may require payment of a fee. A commitment involves, to varying degrees, elements of credit and interest rate risk in excess of the amount recognized in the balance sheet. The Company’s exposure to credit loss in the event of nonperformance by the other party to the instrument is represented by the
F-21
CAROLINA NATIONAL CORPORATION
Notes to Consolidated Financial Statements—(Continued)
contractual notional amount of the instrument. Since certain commitments are expected to expire without being drawn upon, the total commitment amounts do not necessarily represent future cash requirements. The Company uses the same credit policies in making commitments to extend credit as it does for on-balance-sheet instruments. Standby letters of credit are conditional commitments issued to guarantee a customer’s performance to a third party and have essentially the same credit risk as other lending facilities.
Collateral held for commitments to extend credit and standby letters of credit varies but may include accounts receivable, inventory, property, plant, equipment and income-producing commercial properties.
The following table summarizes the Company’s off-balance-sheet financial instruments whose contract amounts represent credit risk:
| December 31, | ||||||
| 2004 | 2003 | |||||
Commitments to extend credit | $ | 22,908,305 | $ | 16,768,802 | ||
Standby letters of credit | $ | 610,000 | $ | 10,000 | ||
NOTE 20—FAIR VALUE OF FINANCIAL INSTRUMENTS
The fair value of a financial instrument is the amount at which the asset or obligation could be exchanged in a current transaction between willing parties, other than in a forced or liquidation sale. Fair value estimates are made at a specific point in time based on relevant market information and information about the financial instruments. Because no market value exists for a significant portion of the financial instruments, fair value estimates are based on judgments regarding future expected loss experience, current economic conditions, risk characteristics of various financial instruments, and other factors.
The following methods and assumptions were used to estimate the fair value of significant financial instruments:
Cash and Due from Banks—The carrying amount is a reasonable estimate of fair value.
Federal Funds Sold—Federal funds sold are for a term of one day, and the carrying amount approximates the fair value.
Investment Securities—For securities available-for-sale, fair value equals the carrying amount which is the quoted market price. The fair values of securities held to maturity are based on quoted market prices or dealer quotes. If quoted market prices are not available, fair values are based on quoted market prices of comparable securities. The carrying value of nonmarketable equity securities approximates the fair value since no ready market exists for the stocks.
Loans receivable—For certain categories of loans, such as variable rate loans which are repriced frequently and have no significant change in credit risk, fair values are based on the carrying amounts. The fair value of other types of loans is estimated by discounting the future cash flows using the current rates at which similar loans would be made to borrowers with similar credit ratings and for the same remaining maturities.
Deposits—The fair value of demand deposits, savings, and money market accounts is the amount payable on demand at the reporting date. The fair values of certificates of deposit are estimated using a discounted cash flow calculation that applies current interest rates to a schedule of aggregated expected maturities.
F-22
CAROLINA NATIONAL CORPORATION
Notes to Consolidated Financial Statements—(Continued)
Federal Funds Purchased—Federal funds purchased are for a term of one day, and the carrying amount approximates the fair value.
Note Payable—The fair value of the note payable approximates its carrying value because it reprices periodically.
Accrued Interest Receivable and Payable—The carrying value of these instruments is a reasonable estimate of fair value.
Off-Balance-Sheet Financial Instruments—The carrying amount for loan commitments and standby letters of credit which are off-balance-sheet financial instruments approximates the fair value since the obligations are typically based on current market rates.
The carrying values and estimated fair values of the Company’s financial instruments are as follows:
| December 31, | ||||||||||||
| 2004 | 2003 | |||||||||||
| Carrying Amount | Estimated Fair Value | Carrying Amount | Estimated Fair Value | |||||||||
Financial Assets: | ||||||||||||
Cash and due from banks | $ | 1,614,863 | $ | 1,614,863 | $ | 2,459,441 | $ | 2,459,441 | ||||
Federal funds sold | 1,767,000 | 1,767,000 | — | — | ||||||||
Securities held to maturity | — | — | 3,302,131 | 3,306,188 | ||||||||
Nonmarketable equity securities | 392,400 | 392,400 | 315,500 | 315,500 | ||||||||
Securities available for sale | 2,969,063 | 2,969,063 | — | — | ||||||||
Loans receivable | 90,515,050 | 90,234,148 | 55,030,473 | 55,098,669 | ||||||||
Accrued interest receivable | 372,527 | 372,527 | 217,064 | 217,064 | ||||||||
Financial Liabilities: | ||||||||||||
Demand deposit, interest-bearing transaction, and savings accounts | $ | 41,184,456 | $ | 41,184,456 | $ | 30,426,907 | $ | 30,426,907 | ||||
Certificates of deposit and other time deposits | 44,909,468 | 45,007,388 | 20,218,749 | 20,273,043 | ||||||||
Federal funds purchased | — | — | 533,000 | 533,000 | ||||||||
Note payable | 900,000 | 900,000 | — | — | ||||||||
Accrued interest payable | 289,089 | 289,089 | 97,181 | 97,181 | ||||||||
| Notional Amount | Estimated Fair Value | Notional Amount | Estimated Fair Value | |||||||||
Off-Balance Sheet Financial Instruments: | ||||||||||||
Commitments to extend credit | $ | 22,908,305 | $— | $ | 16,768,802 | $— | ||||||
Standby letters of credit | $ | 610,000 | $— | $ | 10,000 | $— | ||||||
F-23
CAROLINA NATIONAL CORPORATION
Notes to Consolidated Financial Statements—(Continued)
NOTE 21—CAROLINA NATIONAL CORPORATION (PARENT COMPANY ONLY)
Presented below are the condensed financial statements for Carolina National Corporation (Parent Company Only).
Condensed Balance Sheets
| December 31, | ||||||
| 2004 | 2003 | |||||
Assets | ||||||
Cash | $ | 1,143,098 | $ | 1,003,256 | ||
Investment in banking subsidiary | 8,140,318 | 8,657,062 | ||||
Loans receivable | 2,542,810 | 1,747,109 | ||||
Less allowance for loan losses | 11,000 | 27,718 | ||||
Loans, net | 2,531,810 | 1,719,391 | ||||
Other assets | 37,815 | 4,011 | ||||
Total assets | $ | 11,853,041 | $ | 11,383,720 | ||
Liabilities and shareholders’ equity | ||||||
Other liabilities | $ | 27,927 | $ | 955 | ||
Note payable | 900,000 | — | ||||
Shareholders’ equity | 10,925,114 | 11,382,765 | ||||
Total liabilities and shareholders’ equity | $ | 11,853,041 | $ | 11,383,720 | ||
Condensed Statements of Operations
For the years ended December 31, 2004 and 2003
| 2004 | 2003 | |||||||
Income | $ | 73,446 | $ | 48,736 | ||||
Expenses | ||||||||
Other expenses | 14,353 | 34,869 | ||||||
Income before income taxes and equity in undistributed losses of banking subsidiary | 59,093 | 13,867 | ||||||
Income tax | — | — | ||||||
Equity in undistributed losses of banking subsidiary | (491,863 | ) | (1,224,979 | ) | ||||
Net loss | $ | (432,770 | ) | $ | (1,211,112 | ) | ||
F-24
CAROLINA NATIONAL CORPORATION
Notes to Consolidated Financial Statements—(Continued)
Condensed Statements of Cash Flows
For the years ended December 31, 2004 and 2003
| 2004 | 2003 | |||||||
Cash flows from operating activities: | ||||||||
Net loss | $ | (432,770 | ) | $ | (1,211,112 | ) | ||
Adjustments to reconcile net loss to net cash provided by operating activities: | ||||||||
Provision for loan losses | (16,718 | ) | 27,718 | |||||
Increase (decrease) in other assets | (33,805 | ) | (4,011 | ) | ||||
Equity in undistributed losses of banking subsidiary | 491,863 | 1,224,979 | ||||||
(Decrease) increase in other liabilities | 26,972 | (33,045 | ) | |||||
Net cash provided by operating activities | 35,542 | 4,529 | ||||||
Cash flows from investing activities: | ||||||||
Purchase of Bank stock | — | (2,000,000 | ) | |||||
Net increase in loans | (795,700 | ) | (1,747,109 | ) | ||||
Net cash used by operating activities | (795,700 | ) | (3,747,109 | ) | ||||
Cash flows from financing activities: | ||||||||
Proceeds from notes payable | 900,000 | — | ||||||
Net cash provided by financing activities | 900,000 | — | ||||||
Net (decrease) increase in cash and cash equivalents | 139,842 | (3,742,580 | ) | |||||
Cash and cash equivalents, beginning of year | 1,003,256 | 4,745,836 | ||||||
Cash and cash equivalents, end of year | $ | 1,143,098 | $ | 1,003,256 | ||||
NOTE 22—RECLASSIFICATIONS
Certain deferred loan fees were reclassified in the December 31, 2004 and 2003 consolidated balance sheets from other liabilities to loans receivable.
F-25
CAROLINA NATIONAL CORPORATION
Condensed Consolidated Balance Sheets
| September 30, 2005 | December 31, 2004 | |||||||
| (Unaudited) | (Audited) | |||||||
Assets | ||||||||
Cash and cash equivalents | ||||||||
Cash and due from banks | $ | 5,334,521 | $ | 1,614,863 | ||||
Federal funds sold | 12,550,000 | 1,767,000 | ||||||
Total cash and cash equivalents | 17,884,521 | 3,381,863 | ||||||
Investment securities | ||||||||
Securities available for sale | 2,979,375 | 2,969,063 | ||||||
Nonmarketable equity securities | 511,200 | 392,400 | ||||||
Total investment securities | 3,490,575 | 3,361,463 | ||||||
Loans receivable, net of unearned income | 128,725,216 | 90,303,749 | ||||||
Less allowance for loan losses | 1,780,200 | 1,332,200 | ||||||
Loans, net | 126,945,016 | 88,971,549 | ||||||
Premises, furniture and equipment, net | 685,725 | 710,511 | ||||||
Accrued interest receivable | 530,149 | 372,527 | ||||||
Deferred tax asset | 1,367,255 | 1,581,010 | ||||||
Other assets | 247,188 | 126,113 | ||||||
Total assets | $ | 151,150,429 | $ | 98,505,036 | ||||
Liabilities | ||||||||
Deposits | ||||||||
Noninterest-bearing transaction accounts | $ | 13,572,784 | $ | 10,374,841 | ||||
Interest-bearing transaction accounts | 13,707,744 | 6,046,689 | ||||||
Savings and money market | 27,074,738 | 24,762,926 | ||||||
Time deposits $100,000 and over | 45,945,374 | 26,901,355 | ||||||
Other time deposits | 34,906,853 | 18,008,113 | ||||||
Total deposits | 135,207,493 | 86,093,924 | ||||||
Notes payable | 3,450,000 | 900,000 | ||||||
Accrued interest payable | 655,889 | 289,089 | ||||||
Other liabilities | 505,231 | 296,909 | ||||||
Total liabilities | 139,818,613 | 87,579,922 | ||||||
Shareholders’ equity | ||||||||
Preferred stock, 10,000,000 shares authorized, none issued | — | — | ||||||
Common stock, no par value, 20,000,000 shares authorized; and 1,427,303 shares issued and outstanding | 13,994,796 | 13,994,796 | ||||||
Retained deficit | (2,644,905 | ) | (3,044,801 | ) | ||||
Accumulated other comprehensive loss | (18,075 | ) | (24,881 | ) | ||||
Total shareholders’ equity | 11,331,816 | 10,925,114 | ||||||
Total liabilities and shareholders’ equity | $ | 151,150,429 | $ | 98,505,036 | ||||
See notes to condensed consolidated financial statements
F-26
CAROLINA NATIONAL CORPORATION
Condensed Consolidated Statements of Operations
(Unaudited)
| Nine Months Ended September 30, | Three Months Ended September 30, | |||||||||||||
| 2005 | 2004 | 2005 | 2004 | |||||||||||
Interest income | ||||||||||||||
Loans, including fees | $ | 5,243,136 | $ | 2,550,903 | $ | 2,059,710 | $ | 1,001,803 | ||||||
Investment securities: | ||||||||||||||
Taxable | 45,000 | 40,706 | 15,000 | 15,000 | ||||||||||
Nonmarketable equity securities | 18,476 | 12,606 | 8,952 | 4,050 | ||||||||||
Federal funds sold | 159,576 | 58,365 | 55,216 | 31,275 | ||||||||||
Total | 5,466,188 | 2,662,580 | 2,138,878 | 1,052,128 | ||||||||||
Interest expense | ||||||||||||||
Time deposits $100,000 and over | 820,282 | 278,077 | 291,844 | 123,743 | ||||||||||
Other deposits | 1,059,477 | 554,348 | 419,426 | 211,343 | ||||||||||
Notes Payable | 71,063 | — | 39,458 | — | ||||||||||
Total | 1,950,822 | 832,425 | 750,728 | 335,086 | ||||||||||
Net interest income | 3,515,366 | 1,830,155 | 1,388,150 | 717,042 | ||||||||||
Provision for loan losses | 448,462 | 374,607 | 136,562 | 98,367 | ||||||||||
Net interest income after provision for loan losses | 3,066,904 | 1,455,548 | 1,251,588 | 618,675 | ||||||||||
Noninterest income | ||||||||||||||
Service charges on deposit accounts | 139,583 | 96,174 | 56,970 | 38,988 | ||||||||||
Residential mortgage origination fees | 81,708 | 82,076 | 36,166 | 15,385 | ||||||||||
Other | 49,423 | 29,343 | 14,434 | 11,440 | ||||||||||
Total noninterest income | 270,714 | 207,593 | 107,570 | 65,813 | ||||||||||
Noninterest expenses | ||||||||||||||
Salaries and employee benefits | 1,614,375 | 1,299,633 | 590,692 | 438,449 | ||||||||||
Net occupancy | 245,740 | 189,838 | 90,689 | 69,487 | ||||||||||
Furniture and equipment | 98,796 | 109,423 | 32,292 | 37,789 | ||||||||||
Other operating | 763,040 | 759,277 | 271,799 | 260,706 | ||||||||||
Total noninterest expense | 2,721,951 | 2,358,171 | 985,472 | 806,431 | ||||||||||
Income (loss) before income taxes | 615,667 | (695,030 | ) | 373,686 | (121,943 | ) | ||||||||
Income tax expense (benefit) | 215,771 | (240,838 | ) | 126,485 | (43,794 | ) | ||||||||
Net income (loss) | $ | 399,896 | $ | (454,192 | ) | $ | 247,201 | $ | (78,149 | ) | ||||
Earnings per share | ||||||||||||||
Basic earnings (loss) per share | $ | .28 | $ | (.32 | ) | $ | .17 | $ | (.05 | ) | ||||
Diluted earnings (loss) per share | $ | .27 | $ | (.32 | ) | $ | .16 | $ | (.05 | ) | ||||
Average shares outstanding—basic | 1,427,303 | 1,427,303 | 1,427,303 | 1,427,303 | ||||||||||
Average shares outstanding—diluted | 1,502,321 | 1,427,303 | 1,502,321 | 1,427,303 | ||||||||||
See notes to condensed consolidated financial statements
F-27
CAROLINA NATIONAL CORPORATION
Condensed Consolidated Statements of Changes in Shareholders’ Equity
For the Nine months ended September 30, 2005 and 2004
(Unaudited)
| Common Stock | Retained Deficit | Accumulated Other Comprehensive Loss | Total | ||||||||||||||
| Shares | Amount | ||||||||||||||||
Balance, December 31, 2003 | 1,427,303 | $ | 13,994,796 | $ | (2,612,031 | ) | $ | — | $ | 11,382,765 | |||||||
Net loss | — | — | (454,192 | ) | (454,192 | ) | |||||||||||
Other comprehensive loss, net of tax benefit | (16,218 | ) | (16,218 | ) | |||||||||||||
Comprehensive loss | — | — | (470,410 | ) | |||||||||||||
Balance, September 30, 2004 | 1,427,303 | $ | 13,994,796 | $ | (3,066,223 | ) | $ | (16,218 | ) | $ | 10,912,355 | ||||||
Balance, December 31, 2004 | 1,427,303 | $ | 13,994,796 | $ | (3,044,801 | ) | $ | (24,881 | ) | $ | 10,925,114 | ||||||
Net income | 399,896 | 399,896 | |||||||||||||||
Other comprehensive loss, net of tax benefit | 6,806 | 6,806 | |||||||||||||||
Comprehensive income | 406,702 | ||||||||||||||||
Balance, September 30, 2005 | 1,427,303 | $ | 13,994,796 | $ | (2,644,905 | ) | $ | (18,075 | ) | $ | 11,331,816 | ||||||
See notes to condensed consolidated financial statements
F-28
CAROLINA NATIONAL CORPORATION
Condensed Consolidated Statements of Cash Flows
(Unaudited)
| Nine Months Ended September 30, | ||||||||
| 2005 | 2004 | |||||||
Cash flows from operating activities | ||||||||
Adjustments to reconcile net loss to net cash used by operating activities | ||||||||
Net income (loss) | $ | 399,896 | $ | (454,192 | ) | |||
Provision for loan losses | 448,462 | 374,607 | ||||||
Depreciation and amortization expense | 126,649 | 97,457 | ||||||
Discount accretion and premium amortization | — | 2,131 | ||||||
Deferred income tax expense (benefit) | 210,249 | (245,295 | ) | |||||
Increase in accrued interest receivable | (157,622 | ) | (43,906 | ) | ||||
Increase in accrued interest payable | 366,800 | 102,129 | ||||||
Decrease (increase) in other assets | (121,075 | ) | 419,060 | |||||
Increase in other liabilities | 208,322 | 178,586 | ||||||
Net cash provided by operating activities | 1,481,681 | 430,577 | ||||||
Cash flows from investing activities | ||||||||
Purchase of marketable equity securities | — | (3,000,000 | ) | |||||
Purchases of non-marketable equity securities | (118,800 | ) | (171,600 | ) | ||||
Securities called or redeemed | — | 3,300,000 | ||||||
Net increase in loans | (38,421,929 | ) | (24,951,496 | ) | ||||
Purchase of premises, furniture and equipment | (101,863 | ) | (309,471 | ) | ||||
Net cash used by investing activities | (38,642,592 | ) | (25,132,567 | ) | ||||
Cash flows from financing activities | ||||||||
Net decrease in federal funds purchased | — | (533,000 | ) | |||||
Net increase in demand deposits, interest-bearing transaction accounts and savings accounts | 13,170,810 | 18,124,269 | ||||||
Net increase in certificates of deposit and other time deposits | 35,942,759 | 13,028,277 | ||||||
Net increase in notes payable | 2,550,000 | — | ||||||
Net cash provided by financing activities | 51,663,569 | 30,619,546 | ||||||
Net increase in cash and cash equivalents | 14,502,658 | 5,917,556 | ||||||
Cash and cash equivalents, beginning of period | 3,381,863 | 2,459,441 | ||||||
Cash and cash equivalents, end of period | $ | 17,884,521 | $ | 8,376,997 | ||||
Cash paid during the period for: | ||||||||
Income taxes | $ | 6,422 | $ | — | ||||
Interest | $ | 1,584,022 | $ | 730,306 | ||||
See notes to condensed consolidated financial statements
F-29
Notes to Condensed Consolidated Financial Statements
(Unaudited)
Note 1—Basis of Presentation
The accompanying financial statements have been prepared in accordance with the requirements for interim financial statements and, accordingly, they are condensed and omit disclosures, which would substantially duplicate those contained in the most recent annual report on Form 10-KSB. The financial statements as of September 30, 2005 and 2004 are unaudited and, in the opinion of management, include all adjustments (consisting of normal recurring adjustments) considered necessary for a fair presentation. The financial information as of December 31, 2004 has been derived from the audited financial statements as of that date. For further information, refer to the financial statements and the notes included in Carolina National Corporation’s 2004 Annual Report on Form 10-KSB.
Note 2—Recently Issued Accounting Pronouncements
The following is a summary of recent authoritative pronouncements that affect accounting, reporting, and disclosure of financial information by the Company:
In December 2004, the Financial Accounting Standards Board (FASB) issued Statement of Financial Accounting Standards (SFAS) No. 123 (revised 2004), “Share-Based Payment” (“SFAS No. 123(R)”). SFAS No. 123(R) covers a wide range of share-based compensation arrangements including share options, restricted share plans, performance-based awards, share appreciation rights, and employee share purchase plans. SFAS No. 123(R) will require companies to measure all employee stock-based compensation awards using a fair value method and record such expense in their financial statements. In addition, the adoption of SFAS No. 123(R) requires additional accounting and disclosure related to the income tax and cash flow effects resulting from share-based payment arrangements. SFAS No. 123(R) is effective beginning as of the Company’s next fiscal year that begins after December 15, 2005. The Company is currently evaluating the impact that the adoption of SFAS No. 123(R) will have on its financial position, results of operations and cash flows. The cumulative effect of adoption, if any, will be measured and recognized in the statement of operations on the date of adoption.
In April 2005, the Securities and Exchange Commission’s Office of the Chief Accountant and its Division of Corporation Finance released Staff Accounting Bulletin (SAB) No. 107 to provide guidance regarding the application of SFAS No. 123(R). SAB 107 provides interpretive guidance related to the interaction between SFAS No. 123(R) and certain SEC rules and regulations, as well as the staff’s views regarding the valuation of share-based payment arrangements for public companies. SAB 107 also reminds public companies of the importance of including disclosures within filings made with the SEC relating to the accounting for share-based payment transactions, particularly during the transition to SFAS No. 123(R).
In November 2003, the Emerging Issues Task Force (“EITF”) reached a consensus that certain quantitative and qualitative disclosures should be required for debt and marketable equity securities classified as available for sale or held to maturity under SFAS No. 115 and SFAS No. 124 that are impaired at the balance sheet date but for which other-than-temporary impairment has not been recognized. Accordingly the EITF issued EITF No. 03-1, “The Meaning of Other-Than-Temporary Impairment and Its Application to Certain Investments.” This issue addresses the meaning of other-than-temporary impairment and its application to investments classified as either available for sale or held to maturity under SFAS No. 115 and provides guidance on quantitative and qualitative disclosures. The disclosure requirements of EITF No. 03-1 are effective for annual financial statements for fiscal years ending after June 15, 2004. The effective date for the measurement and recognition guidance of EITF No. 03-1 has been delayed. The FASB staff has issued a proposed Board-directed FASB Staff Position (“FSP”), FSP EITF 03-1-a, “Implementation Guidance for the Application of Paragraph 16 of Issue No. 03-1.” The proposed FSP would provide implementation guidance with respect to debt securities that are impaired solely due to interest rates and/or sector spreads and analyzed for other-than-temporary impairment
F-30
CAROLINA NATIONAL CORPORATION
Notes to Condensed Consolidated Financial Statements—(Continued)
(Unaudited)
under the measurement and recognition requirements of EITF No. 03-1. The delay of the effective date for the measurement and recognition requirements of EITF No. 03-1 will be superseded concurrent with the final issuance of FSP EITF 03-1-a. Adopting the disclosure provisions of EITF No. 03-1 did not have any impact on the Company’s financial position or results of operations.
Other accounting standards that have been issued or proposed by the FASB or other standards-setting bodies that do not require adoption until a future date are not expected to have a material impact on the consolidated financial statements upon adoption.
Note 3—Stock-Based Compensation
The Company has a stock-based employee compensation plan which is further described in our Annual Report on Form 10-KSB. The Company accounts for the plan under the recognition and measurement principles of Accounting Principles Board Opinion No. 25,Accounting for Stock Issued to Employees, and related Interpretations. No stock-based employee compensation cost is reflected in net income, as all stock options granted under the plan had an exercise price equal to the market value of the underlying common stock on the date of grant. In addition, the Company has stock warrants which were issued to organizers of the bank in connection with the initial offering. The following table illustrates the effect on net income (loss) and earnings (losses) per share if the Company had applied the fair value recognition provisions of SFAS No. 123,Accounting for Stock-Based Compensation, to stock-based employee compensation for the stock options and warrants.
During the fourth quarter of 2004, we evaluated the expected life of all options and warrants outstanding. When originally calculating the pro forma cost of these options and warrants, we used an expected life of 10 years, which is the legal life of all options and warrants. We reevaluated this estimate and concluded that it was not realistic. We reviewed the vesting periods and expiration dates and the financial circumstances of the holders of the options and warrants and determined that an average of 7 years was more appropriate. The issuance of options and warrants was new to our Company and we had not carefully evaluated this estimate initially. Therefore, we have revised the expected life for all options and warrants to seven years. We changed no other assumptions in our revised calculation. This has affected our total pro forma compensation cost for all future periods. In accordance with APB 20, this change will be accounted for prospectively over the remaining vesting periods for each of the option and warrant issuances.
| Nine Months Ended September 30, | ||||||||
| 2005 | 2004 | |||||||
Net income (loss), as reported | $ | 399,896 | $ | (454,192 | ) | |||
Deduct: Total stock-based compensation expense determined under fair value based method for all awards, net of related tax effects | (41,019 | ) | (140,327 | ) | ||||
Pro forma net income (loss) | $ | 358,877 | $ | (594,519 | ) | |||
Earnings (loss) per share: | ||||||||
Basic—as reported | $ | .28 | $ | (.32 | ) | |||
Basic—pro forma | $ | .25 | $ | (.42 | ) | |||
Diluted—as reported | $ | .27 | $ | (.32 | ) | |||
Diluted—pro forma | $ | .24 | $ | (.42 | ) | |||
F-31
CAROLINA NATIONAL CORPORATION
Notes to Condensed Consolidated Financial Statements—(Continued)
(Unaudited)
| Three Months Ended September 30, | ||||||||
| 2005 | 2004 | |||||||
Net income (loss), as reported | $ | 247,201 | $ | (78,149 | ) | |||
Deduct: Total stock-based compensation expense determined under fair value based method for all awards, net of related tax effects | (13,673 | ) | (46,776 | ) | ||||
Pro forma net income (loss) | $ | 233,528 | $ | (124,925 | ) | |||
Earnings (loss) per share: | ||||||||
Basic—as reported | $ | .17 | $ | (.05 | ) | |||
Basic—pro forma | $ | .16 | $ | (.09 | ) | |||
Diluted—as reported | $ | .16 | $ | (.05 | ) | |||
Diluted—pro forma | $ | .16 | $ | (.09 | ) | |||
Note 4—Basic Earnings (Loss) Per Share
Basic earnings (loss) per share is computed by dividing net income (loss) by the weighted-average number of common shares outstanding. Diluted earnings (loss) per share is computed by dividing net income (loss) by the weighted-average number of common shares outstanding and dilutive common share equivalents using the treasury stock method. Dilutive common share equivalents include common shares issuable upon exercise of outstanding stock warrants and stock options. There were no dilutive common share equivalents outstanding during the nine months ended September 30, 2004 due to the net loss; therefore, basic loss per share and diluted earnings per share were the same for 2004.
| Nine Months Ended September 30, | |||||||
| 2005 | 2004 | ||||||
Net income (loss) per share—basic computation: | |||||||
Net income (loss) to common shareholders | $ | 399,896 | $ | (454,192 | ) | ||
Average common shares outstanding—basic | 1,427,303 | 1,427,303 | |||||
Basic income (loss) per share | $ | .28 | $ | (.32 | ) | ||
Net income (loss) per share—dilutive computation: | |||||||
Net income (loss) to common shareholders | $ | 399,896 | $ | (454,192 | ) | ||
Average common shares outstanding—dilutive | 1,502,321 | 1,427,303 | |||||
Diluted income (loss) per share | $ | .27 | $ | (.32 | ) | ||
F-32
CAROLINA NATIONAL CORPORATION
Notes to Condensed Consolidated Financial Statements—(Continued)
(Unaudited)
| Three Months Ended September 30, | |||||||
| 2005 | 2004 | ||||||
Net income (loss) per share—basic computation: | |||||||
Net income (loss) to common shareholders | $ | 247,201 | $ | (78,149 | ) | ||
Average common shares outstanding—basic | 1,427,303 | 1,427,303 | |||||
Basic income (loss) per share | $ | .17 | $ | (.05 | ) | ||
Net income (loss) per share—dilutive computation: | |||||||
Net income (loss) to common shareholders | $ | 247,201 | $ | (78,149 | ) | ||
Average common shares outstanding—dilutive | 1,502,321 | 1,427,303 | |||||
Diluted income (loss) per share | $ | .16 | $ | (.05 | ) | ||
Options that had a dilutive effect on the earnings per share calculation totaled 75,018 for the nine and three months ending September 30, 2005. Options that could have had a dilutive effect but which were excluded from the earnings per share calculation totaled 27,934 for the nine and three months ending September 30, 2004.
Note 5—Leases
The bank entered into a lease agreement on August 15, 2005 for a branch location in the northeast area of Richland County, South Carolina. The operating lease has an initial ten-year term and expires January 31, 2015. The Bank has renewal options for two additional ten year periods. The lease requires annual payments of $36,000 for the initial lease term. Rent expense and any additional improvements will be amortized on a straight line basis over the minimum lease term. Rent expense associated with this lease for the nine months ended September 30, 2005 was $8,410.
F-33
No dealer, salesperson or other person has been authorized to give any information or to make any representation not contained in this prospectus. You must not rely on any unauthorized information or representations. This prospectus is an offer to sell only the shares offered hereby, but only under circumstances and in jurisdictions where it is lawful to do so. The information contained in this prospectus is current only as of its date.
TABLE OF CONTENTS
| Page | ||
| 1 | ||
| 5 | ||
| 6 | ||
| 10 | ||
| 11 | ||
| 11 | ||
| 11 | ||
| 13 | ||
Management’s Discussion and Analysis of Financial Condition and Results of Operations | 14 | |
| 35 | ||
| 44 | ||
| 52 | ||
| 53 | ||
| 58 | ||
| 62 | ||
| 64 | ||
| 64 | ||
| 64 | ||
| F-1 |
1,000,000 Shares
CAROLINA NATIONAL CORPORATION
| ™ |
Common Stock
PROSPECTUS
Scott & Stringfellow, Inc.
December 15, 2005