
Q4 & Financial Year 2018 Earnings Slides FEBRUARY 28, 2019
Cautionary Note • This presentation contains forward-looking statements within the meaning of the Private Securities Litigation Reform Act of 1995 and other federal and state securities laws. Forward-looking statements are those which are not historical facts and include, without limitation, comments about our expectations, forecasts, plans and opinions, including with respect to financial and operational performance. These and other statements that relate to future results and events are based on our expectations as of today, February 28, 2019. Our actual results in future periods may differ materially from those currently expected because of a number of risks and uncertainties. These risks and uncertainties include those described in our most recent 10-K and 10-Q filings, which you can find on ir.comscore.com or www.sec.gov. Please review these documents for a more complete understanding of these risks and uncertainties. • Investors are cautioned not to place undue reliance on forward-looking statements, which speak only as of the date of this presentation. We disclaim any duty or obligation to update or revise any forward-looking statements, whether as a result of new information, future events or otherwise. • This presentation contains information regarding adjusted EBITDA, adjusted EBITDA margin, and non-GAAP operating expense, which are non-GAAP financial measures used by our management to understand and evaluate our core operating performance and trends. We believe that these non-GAAP measures provide useful information to investors and others in understanding and evaluating our operating results, as they permit investors to view our core business performance using the same metrics that management uses. • Our use of these non-GAAP measures has limitations as an analytical tool, and investors should not consider these measures in isolation or as a substitute for analysis of our results as reported under GAAP. Instead, you should consider these measures alongside GAAP-based financial performance measures, net income (loss), various cash flow metrics, and our other GAAP financial results. See the appendix to this presentation for additional information regarding our use of non-GAAP financial measures. 2
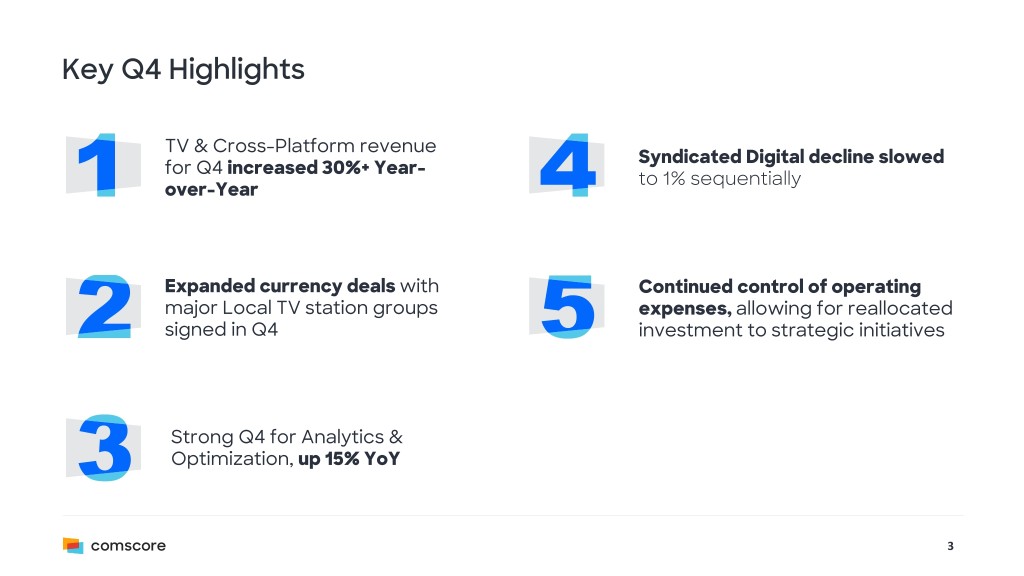
Key Q4 Highlights TV & Cross-Platform revenue Syndicated Digital decline slowed for Q4 increased 30%+ Year- to 1% sequentially over-Year Expanded currency deals with Continued control of operating major Local TV station groups expenses, allowing for reallocated signed in Q4 investment to strategic initiatives Strong Q4 for Analytics & Optimization, up 15% YoY 3
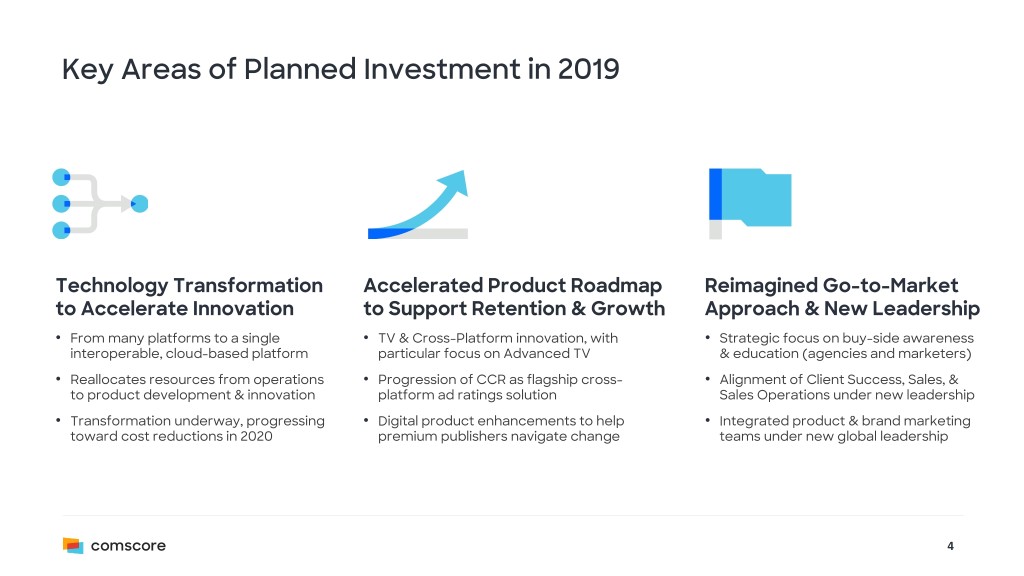
Key Areas of Planned Investment in 2019 Technology Transformation Accelerated Product Roadmap Reimagined Go-to-Market to Accelerate Innovation to Support Retention & Growth Approach & New Leadership • From many platforms to a single • TV & Cross-Platform innovation, with • Strategic focus on buy-side awareness interoperable, cloud-based platform particular focus on Advanced TV & education (agencies and marketers) • Reallocates resources from operations • Progression of CCR as flagship cross- • Alignment of Client Success, Sales, & to product development & innovation platform ad ratings solution Sales Operations under new leadership • Transformation underway, progressing • Digital product enhancements to help • Integrated product & brand marketing toward cost reductions in 2020 premium publishers navigate change teams under new global leadership 4
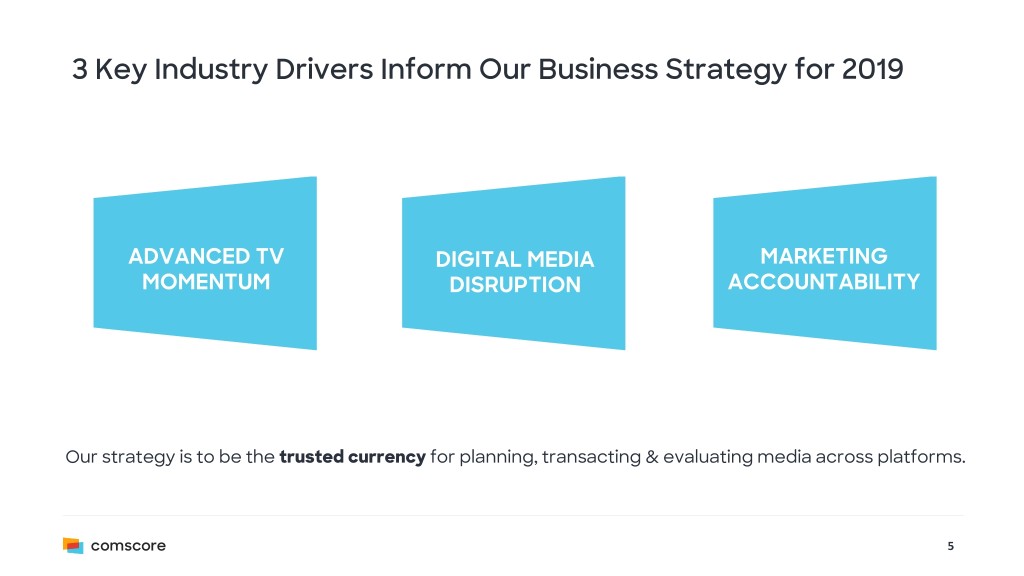
3 Key Industry Drivers Inform Our Business Strategy for 2019 ADVANCED TV DIGITAL MEDIA MARKETING MOMENTUM DISRUPTION ACCOUNTABILITY Our strategy is to be the trusted currency for planning, transacting & evaluating media across platforms. 5
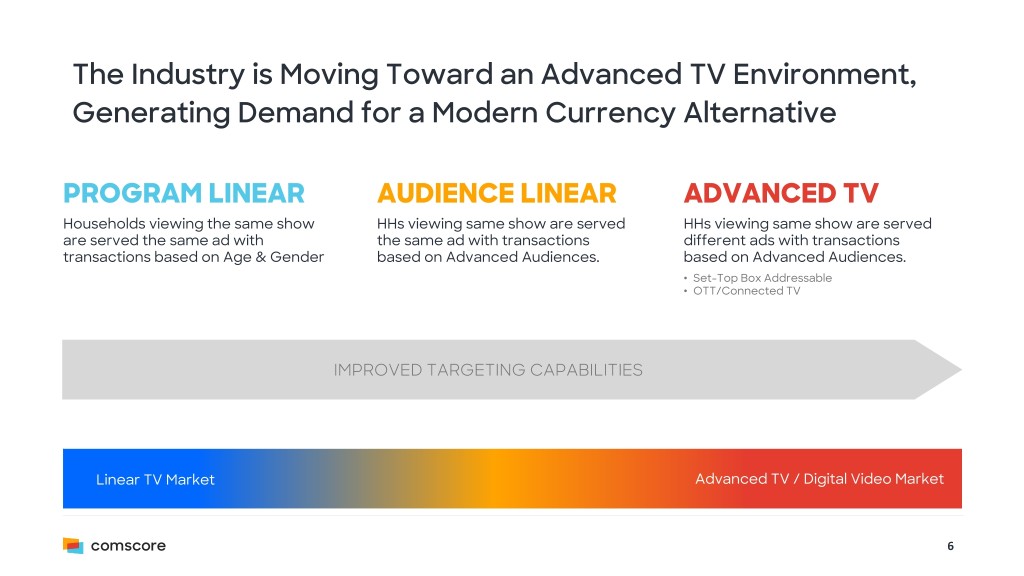
The Industry is Moving Toward an Advanced TV Environment, Generating Demand for a Modern Currency Alternative PROGRAM LINEAR AUDIENCE LINEAR ADVANCED TV Households viewing the same show HHs viewing same show are served HHs viewing same show are served are served the same ad with the same ad with transactions different ads with transactions transactions based on Age & Gender based on Advanced Audiences. based on Advanced Audiences. • Set-Top Box Addressable • OTT/Connected TV IMPROVED TARGETING CAPABILITIES Linear TV Market Advanced TV / Digital Video Market 6
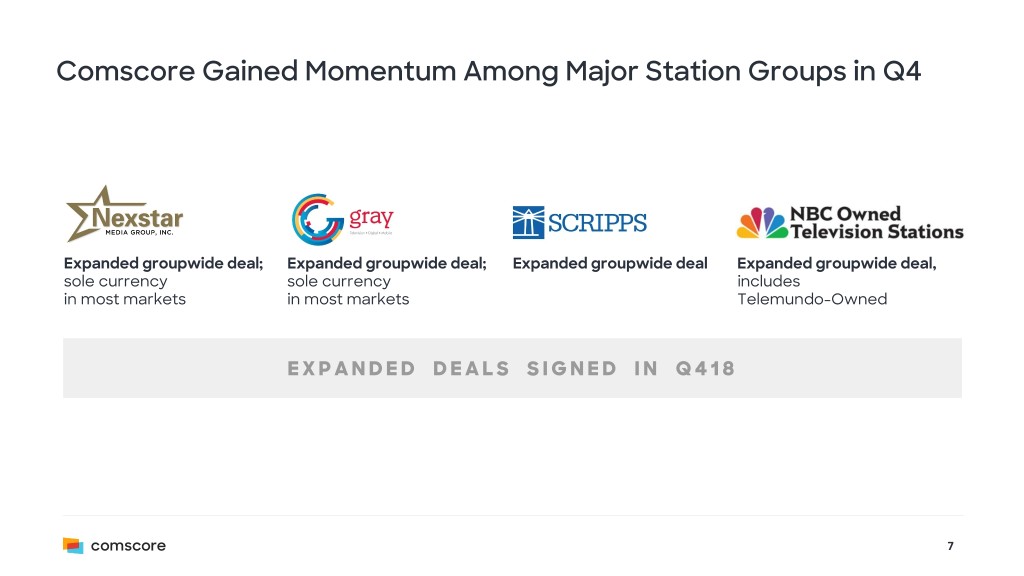
Comscore Gained Momentum Among Major Station Groups in Q4 Expanded groupwide deal; Expanded groupwide deal; Expanded groupwide deal Expanded groupwide deal, sole currency sole currency includes in most markets in most markets Telemundo-Owned EXPANDED DEALS SIGNED IN Q418 7
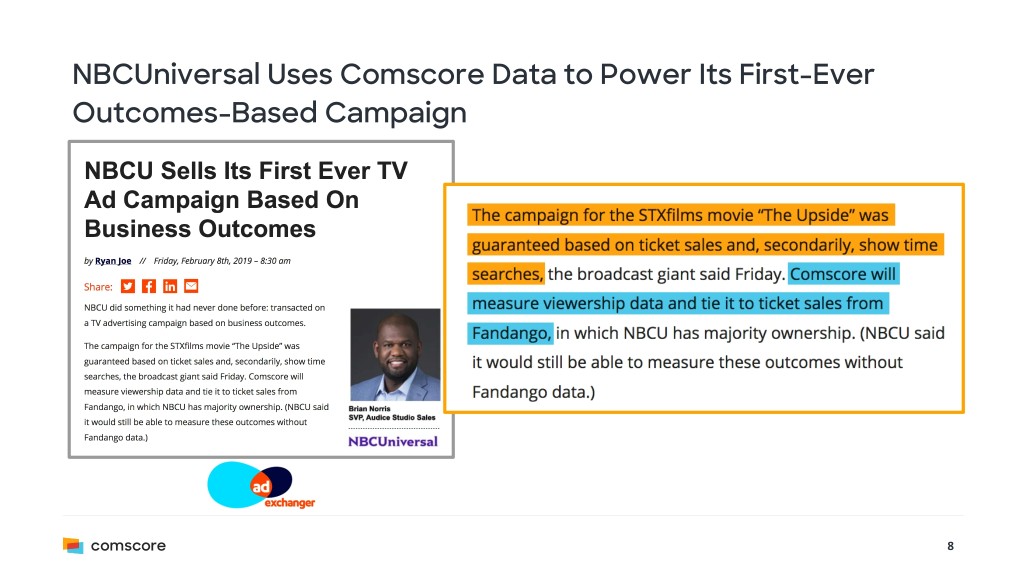
NBCUniversal Uses Comscore Data to Power Its First-Ever Outcomes-Based Campaign 8
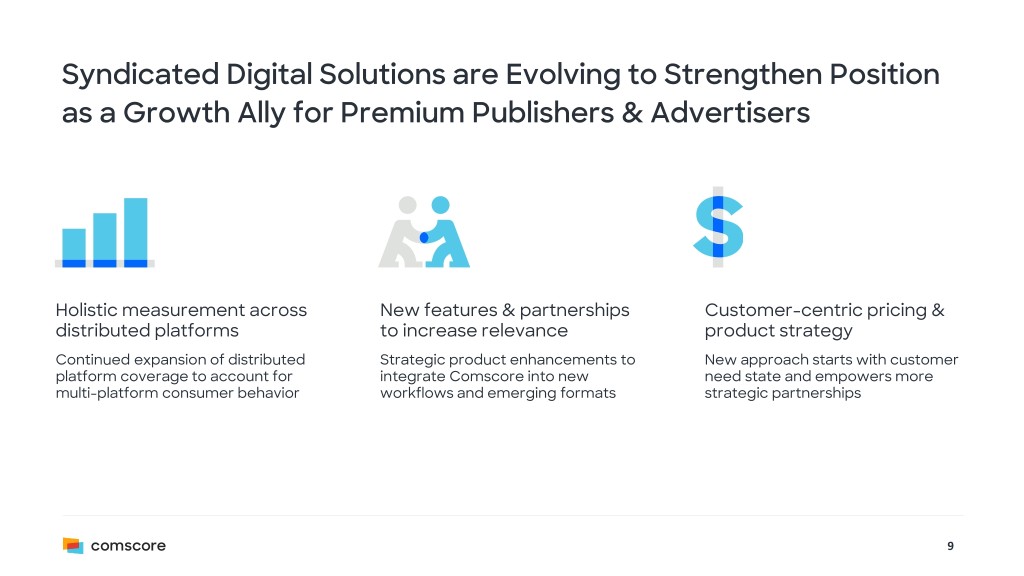
Syndicated Digital Solutions are Evolving to Strengthen Position as a Growth Ally for Premium Publishers & Advertisers Holistic measurement across New features & partnerships Customer-centric pricing & distributed platforms to increase relevance product strategy Continued expansion of distributed Strategic product enhancements to New approach starts with customer platform coverage to account for integrate Comscore into new need state and empowers more multi-platform consumer behavior workflows and emerging formats strategic partnerships 9
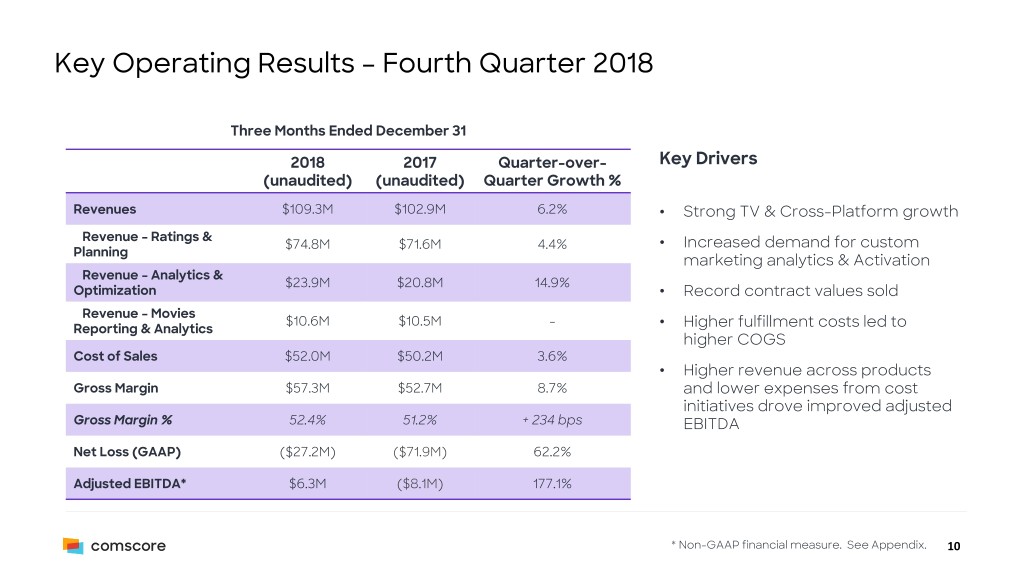
Key Operating Results – Fourth Quarter 2018 Three Months Ended December 31 2018 2017 Quarter-over- Key Drivers (unaudited) (unaudited) Quarter Growth % Revenues $109.3M $102.9M 6.2% • Strong TV & Cross-Platform growth Revenue – Ratings & $74.8M $71.6M 4.4% • Increased demand for custom Planning marketing analytics & Activation Revenue – Analytics & $23.9M $20.8M 14.9% Optimization • Record contract values sold Revenue – Movies $10.6M $10.5M - Reporting & Analytics • Higher fulfillment costs led to higher COGS Cost of Sales $52.0M $50.2M 3.6% • Higher revenue across products Gross Margin $57.3M $52.7M 8.7% and lower expenses from cost initiatives drove improved adjusted Gross Margin % 52.4% 51.2% + 234 bps EBITDA Net Loss (GAAP) ($27.2M) ($71.9M) 62.2% Adjusted EBITDA* $6.3M ($8.1M) 177.1% * Non-GAAP financial measure. See Appendix. 10
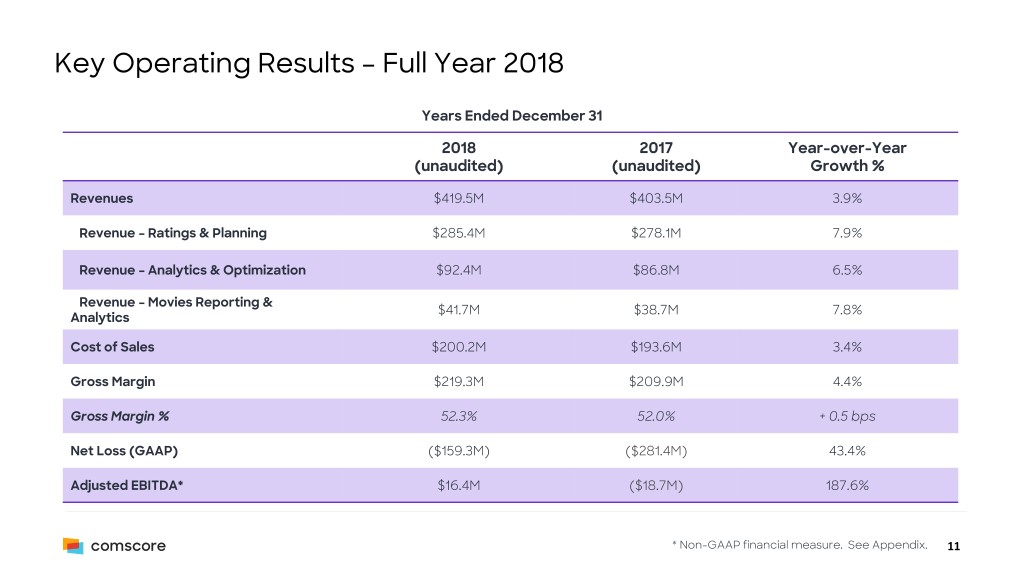
Key Operating Results – Full Year 2018 Years Ended December 31 2018 2017 Year-over-Year (unaudited) (unaudited) Growth % Revenues $419.5M $403.5M 3.9% Revenue – Ratings & Planning $285.4M $278.1M 7.9% Revenue – Analytics & Optimization $92.4M $86.8M 6.5% Revenue – Movies Reporting & $41.7M $38.7M 7.8% Analytics Cost of Sales $200.2M $193.6M 3.4% Gross Margin $219.3M $209.9M 4.4% Gross Margin % 52.3% 52.0% + 0.5 bps Net Loss (GAAP) ($159.3M) ($281.4M) 43.4% Adjusted EBITDA* $16.4M ($18.7M) 187.6% * Non-GAAP financial measure. See Appendix. 11
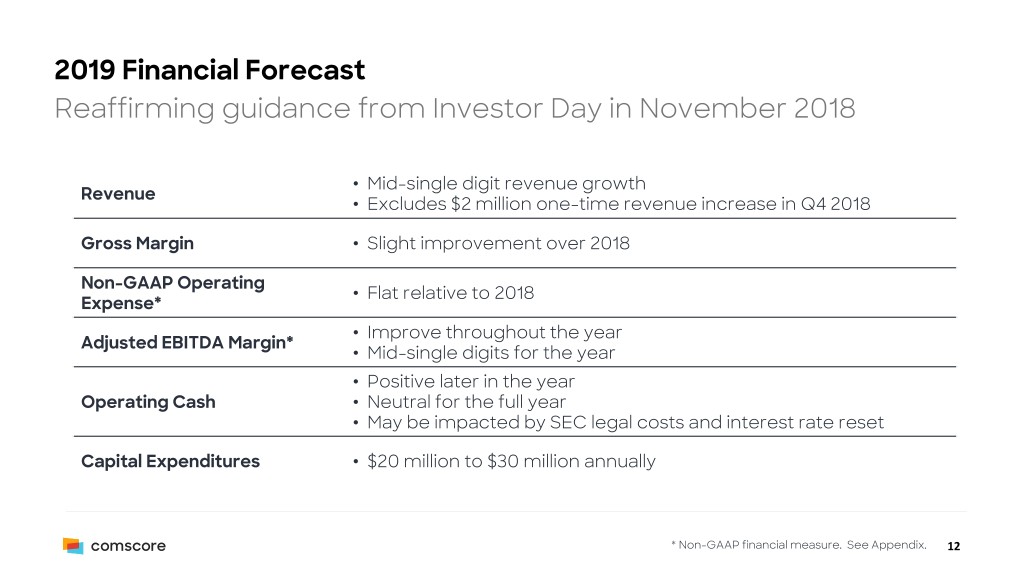
2019 Financial Forecast Reaffirming guidance from Investor Day in November 2018 • Mid-single digit revenue growth Revenue • Excludes $2 million one-time revenue increase in Q4 2018 Gross Margin • Slight improvement over 2018 Non-GAAP Operating • Flat relative to 2018 Expense* • Improve throughout the year Adjusted EBITDA Margin* • Mid-single digits for the year • Positive later in the year Operating Cash • Neutral for the full year • May be impacted by SEC legal costs and interest rate reset Capital Expenditures • $20 million to $30 million annually * Non-GAAP financial measure. See Appendix. 12

Appendix: Non-GAAP Financial Measures
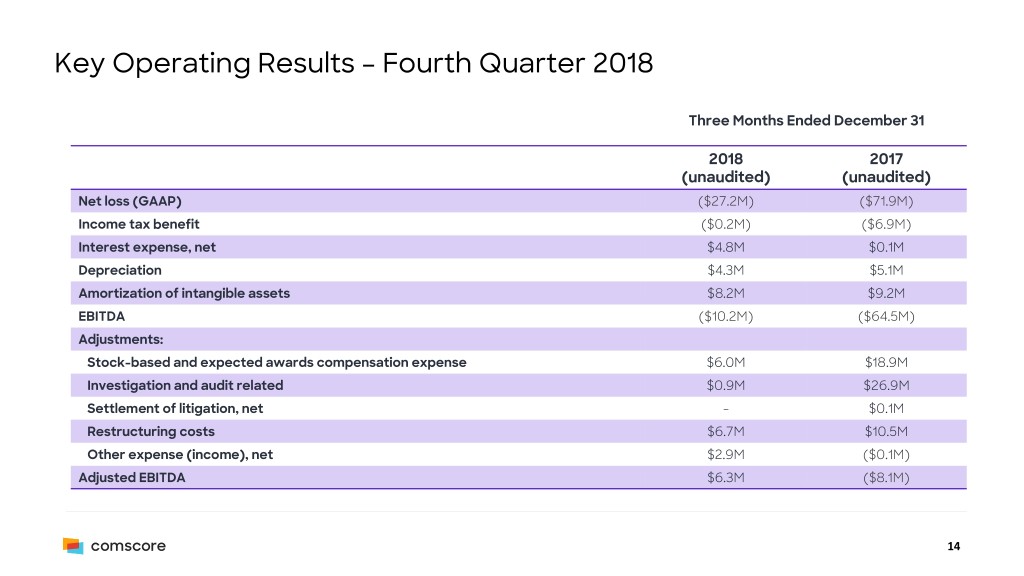
Key Operating Results – Fourth Quarter 2018 Three Months Ended December 31 2018 2017 (unaudited) (unaudited) Net loss (GAAP) ($27.2M) ($71.9M) Income tax benefit ($0.2M) ($6.9M) Interest expense, net $4.8M $0.1M Depreciation $4.3M $5.1M Amortization of intangible assets $8.2M $9.2M EBITDA ($10.2M) ($64.5M) Adjustments: Stock-based and expected awards compensation expense $6.0M $18.9M Investigation and audit related $0.9M $26.9M Settlement of litigation, net - $0.1M Restructuring costs $6.7M $10.5M Other expense (income), net $2.9M ($0.1M) Adjusted EBITDA $6.3M ($8.1M) 14
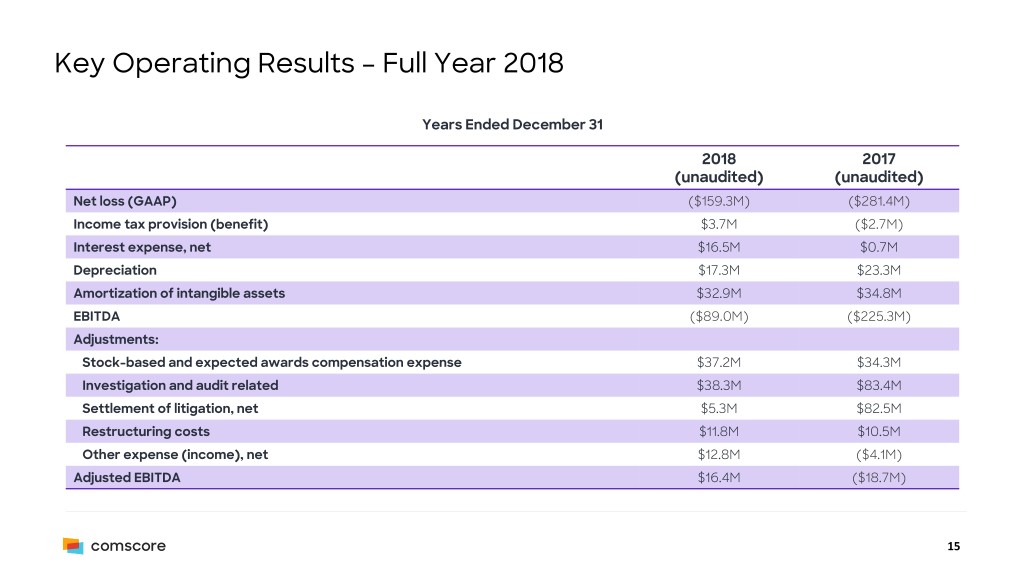
Key Operating Results – Full Year 2018 Years Ended December 31 2018 2017 (unaudited) (unaudited) Net loss (GAAP) ($159.3M) ($281.4M) Income tax provision (benefit) $3.7M ($2.7M) Interest expense, net $16.5M $0.7M Depreciation $17.3M $23.3M Amortization of intangible assets $32.9M $34.8M EBITDA ($89.0M) ($225.3M) Adjustments: Stock-based and expected awards compensation expense $37.2M $34.3M Investigation and audit related $38.3M $83.4M Settlement of litigation, net $5.3M $82.5M Restructuring costs $11.8M $10.5M Other expense (income), net $12.8M ($4.1M) Adjusted EBITDA $16.4M ($18.7M) 15

Adjusted EBITDA and Adjusted EBITDA Margin • EBITDA is defined as GAAP net income (loss) plus or minus interest, taxes, depreciation and amortization of intangible assets. We define adjusted EBITDA as EBITDA plus or minus stock-based compensation expense as well as other items and amounts that we view as not indicative of our core operating performance, specifically: • Charges for matters relating to the Audit Committee investigation described in our 2017 Annual Report on Form 10-K, including litigation and investigation-related costs, costs associated with tax projects, prior-year audits, consulting and other professional fees, other legal proceedings specified in our senior secured convertible notes; • Settlement of certain litigation; • Restructuring costs; and • Non-cash changes in the fair value of financing derivatives and investments in equity securities. • We define adjusted EBITDA margin as adjusted EBITDA divided by revenue. • We do not provide GAAP net income (loss) on a forward-looking basis because we are unable to predict with reasonable certainty our future stock-based compensation expense, investigation, audit-related and litigation expense, fair value adjustments for financing derivatives, and any unusual gains and losses without unreasonable effort. These items are uncertain, depend on various factors, and could be material to results computed in accordance with GAAP. For this reason, we are unable without unreasonable effort to provide a reconciliation of adjusted EBITDA to the most directly comparable GAAP financial measure, GAAP net income (loss), on a forward-looking basis. 16
Non-GAAP Operating Expense • We define non-GAAP operating expense as cost of revenues, selling and marketing, research and development, and general and administrative expense (each as reported on a GAAP basis) plus or minus stock-based compensation expense. • We do not provide GAAP cost of revenues, selling and marketing, research and development, and general and administrative expense on a forward-looking basis because we are unable to predict with reasonable certainty our future stock-based compensation expense without unreasonable effort. Stock-based compensation expense is uncertain, depends on various factors, and could be material to results computed in accordance with GAAP. For this reason, we are unable without unreasonable effort to provide a reconciliation of non-GAAP operating expense to the most directly comparable GAAP financial measure on a forward-looking basis. 17


