
3Q 2019 EARNINGS PRESENTATION OCTOBER 22, 2019 1

SAFE HARBOR Statements in this presentation (or otherwise made by JetBlue or on JetBlue’s behalf) contain various forward-looking statements within the meaning of Section 27A of the Securities Act of 1933, as amended, or the Securities Act, and Section 21E of the Securities Exchange Act of 1934, as amended, or the Exchange Act, which represent our management’s beliefs and assumptions concerning future events. When used in this document and in documents incorporated herein by reference, the words “expects,” “plans,” “anticipates,” “indicates,” “believes,” “forecast,” “guidance,” “outlook,” “may,” “will,” “should,” “seeks,” “targets” and similar expressions are intended to identify forward-looking statements. Forward-looking statements involve risks, uncertainties and assumptions, and are based on information currently available to us. Actual results may differ materially from those expressed in the forward-looking statements due to many factors, including, without limitation, our extremely competitive industry; volatility in financial and credit markets which could affect our ability to obtain debt and/or lease financing or to raise funds through debt or equity issuances; our significant fixed obligations and substantial indebtedness; volatility in fuel prices, maintenance costs and interest rates; our reliance on high daily aircraft utilization; our ability to implement our growth strategy; our ability to attract and retain qualified personnel and maintain our culture as we grow; our reliance on a limited number of suppliers, including for aircraft, aircraft engines and parts and vulnerability to delays by those suppliers; our dependence on the New York and Boston metropolitan markets and the effect of increased congestion in these markets; our reliance on automated systems and technology; our being subject to potential unionization, work stoppages, slowdowns or increased labor costs; our presence in some international emerging markets that may experience political or economic instability or may subject us to legal risk; reputational and business risk from information security breaches or cyber- attacks; changes in or additional domestic or foreign government regulation, including new or increased tariffs; changes in our industry due to other airlines' financial condition; acts of war or terrorism; global economic conditions or an economic downturn leading to a continuing or accelerated decrease in demand for air travel; the spread of infectious diseases; adverse weather conditions or natural disasters; and external geopolitical events and conditions. It is routine for our internal projections and expectations to change as the year or each quarter in the year progresses, and therefore it should be clearly understood that the internal projections, beliefs and assumptions upon which we base our expectations may change prior to the end of each quarter or year. Given the risks and uncertainties surrounding forward-looking statements, you should not place undue reliance on these statements. Further information concerning these and other factors is contained in the Company's Securities and Exchange Commission filings, including but not limited to, the Company's 2018 Annual Report on Form 10-K and its Quarterly Reports on Form 10-Q. In light of these risks and uncertainties, the forward-looking events discussed in this presentation might not occur. Our forward-looking statements speak only as of the date of this presentation. Other than as required by law, we undertake no obligation to update or revise forward-looking statements, whether as a result of new information, future events, or otherwise. This presentation also includes certain “non-GAAP financial measures” as defined under the Exchange Act and in accordance with Regulation G. We have included reconciliations of these non-GAAP financial measures to the most directly comparable financial measures calculated and provided in accordance with U.S. GAAP within the Appendix A section of this presentation. 32

3Q 2019 EARNINGS UPDATE ROBIN HAYES CHIEF EXECUTIVE OFFICER

EXECUTING PLAN TO ACHIEVE $2.50 - $3.00 EPS BY 2020 PRE-TAX MARGINS JBLU VS PEERS* HIGHLIGHTS / KEY DEVELOPMENTS 3Q 2018 3Q 2019 • Full year 2019 capacity growth expected between 6 and 7% driven by disciplined network expansion, solid operational improvements and GAAP Non-GAAP** Non-GAAP additional seats from cabin restyling program 12.9% 12.2% 11.9% GROWTH 11.4% • Second A321neo delivered; continue to expect A321neo delays reducing 2020 planned capacity growth by ~2 pts 9.0% • Near-term RASM headwinds in Latin/Caribbean region; steady demand trends in domestic markets 3.4% • Network reallocation and ancillary ‘Building Blocks’ ramping; on track COMMERCIAL to deliver Fare Options 2.0 by year-end 2019 Peers • Structural Cost Program benefits compounding through 2019 and 2020, largely driving CASM ex-Fuel beat in 3Q *Average of Non-GAAP pre-tax margins for peer set (AAL, ALK, DAL, LUV, SAVE, UAL), consensus, • On track to beat mid-point of original 2019 CASM ex-Fuel growth guidance and reported results, as discussed in peers’ 3Q 2019 1934 Act reports COSTS guidance; on track to deliver 0-1% CASM ex-Fuel growth CAGR **JetBlue’s Non-GAAP figures exclude special items and gain on equity method investments. Refer to reconciliations in Appendix A through 2020 44

COMMERCIAL UPDATE & OUTLOOK JOANNA GERAGHTY PRESIDENT & CHIEF OPERATING OFFICER

CAPACITY GROWTH: BENEFITED FROM AN IMPROVING OPERATION ASM YOY GROWTH − Deepening relevance with added transcon frequency − Adding new VFR/leisure markets from JFK: San José, Costa Rica; NYC 3Q capacity at high end of Guayaquil, Ecuador; and Georgetown, Guyana 3 – 5% guidance range, driven Raising 4Q / annual capacity by solid operation, despite guidance due to expected impact from Hurricane Dorian completion factor trends − Business markets performance showing solid trends BOS 6.0 – 7.0% − Continuing to see benefits of network reallocation efforts 4.5 – 6.5% − RASM pressure from challenges in Latin/Caribbean region 4.8% FLL − Making critical investments in infrastructure to enhance customer experience in partnership with Broward County − Transcon showing solid performance during 3Q and into 4Q − Mint RASM growth continues to outperform system MINT / TCON / MINT 3Q 2019 4Q 2019E 2019E − Taking action to manage impact of events in region LATIN − Markets continuing to digest elevated industry capacity growth Note: dotted lines denote guidance 66
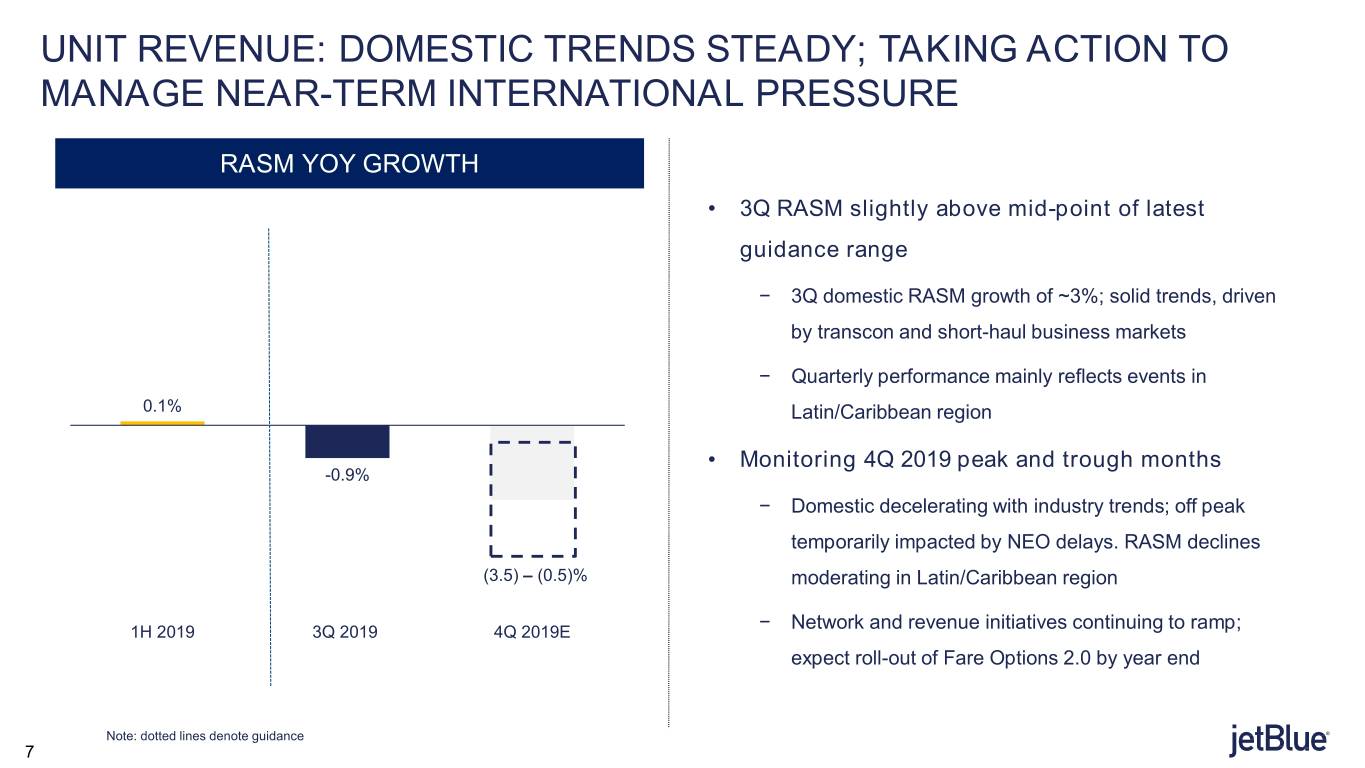
UNIT REVENUE: DOMESTIC TRENDS STEADY; TAKING ACTION TO MANAGE NEAR-TERM INTERNATIONAL PRESSURE RASM YOY GROWTH • 3Q RASM slightly above mid-point of latest guidance range − 3Q domestic RASM growth of ~3%; solid trends, driven by transcon and short-haul business markets − Quarterly performance mainly reflects events in 0.1% Latin/Caribbean region • Monitoring 4Q 2019 peak and trough months -0.9% − Domestic decelerating with industry trends; off peak temporarily impacted by NEO delays. RASM declines (3.5) – (0.5)% moderating in Latin/Caribbean region 1H 2019 3Q 2019 4Q 2019E − Network and revenue initiatives continuing to ramp; expect roll-out of Fare Options 2.0 by year end Note: dotted lines denote guidance 77

FINANCIAL UPDATE & OUTLOOK STEVE PRIEST CHIEF FINANCIAL OFFICER

PRE-TAX MARGIN GAINING TRACTION FROM COST EXECUTION RASM CASM & CASM EX-FUEL* PRE-TAX MARGIN* EARNINGS PER SHARE* (US$ cents) (US$ cents) (US$ cents) 3Q 3Q 3Q 3Q 12.91 12.80 0.63 12.41 12.2% 11.4% 0.59 11.29 9.0% 0.42 8.31 8.33 3.4% 0.16 CASM CASM (GAAP) (GAAP) (Non- (Non- CASM CASM (Non- (Non- Ex-Fuel Ex-Fuel GAAP) GAAP) (GAAP) (GAAP) GAAP) GAAP) 2018 2019 2018 2019 2018 2019 2018 2019 2018 2019 2018 2019 2018 2019 (GAAP) • RASM YoY change impacted • CASM progression driven by • Adjusted pre-tax margin • (GAAP)Non-GAAP Earnings per by pressure from favorable timing of expenses increase of 2.4 points year Share growth of 40% year Latin/Caribbean region and continued progress in over year, outperforming over year non-fuel cost control industry average increase initiatives *Refer to reconciliations of GAAP vs non- GAAP in Appendix A 99
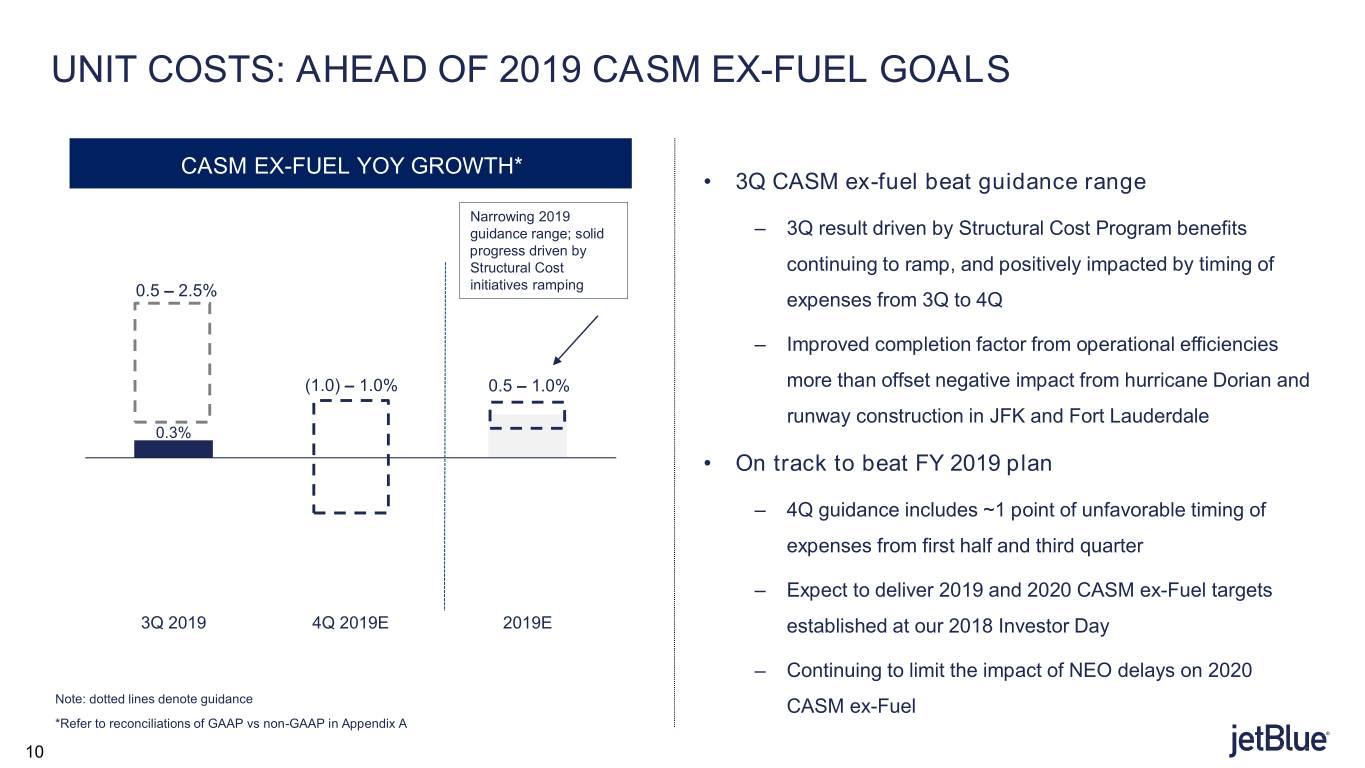
UNIT COSTS: AHEAD OF 2019 CASM EX-FUEL GOALS CASM EX-FUEL YOY GROWTH* • 3Q CASM ex-fuel beat guidance range Narrowing 2019 guidance range; solid ‒ 3Q result driven by Structural Cost Program benefits progress driven by Structural Cost continuing to ramp, and positively impacted by timing of initiatives ramping 0.5 – 2.5% expenses from 3Q to 4Q ‒ Improved completion factor from operational efficiencies (1.0) – 1.0% 0.5 – 1.0% more than offset negative impact from hurricane Dorian and runway construction in JFK and Fort Lauderdale 0.3% • On track to beat FY 2019 plan ‒ 4Q guidance includes ~1 point of unfavorable timing of expenses from first half and third quarter ‒ Expect to deliver 2019 and 2020 CASM ex-Fuel targets 3Q 2019 4Q 2019E 2019E established at our 2018 Investor Day ‒ Continuing to limit the impact of NEO delays on 2020 Note: dotted lines denote guidance CASM ex-Fuel *Refer to reconciliations of GAAP vs non-GAAP in Appendix A 10
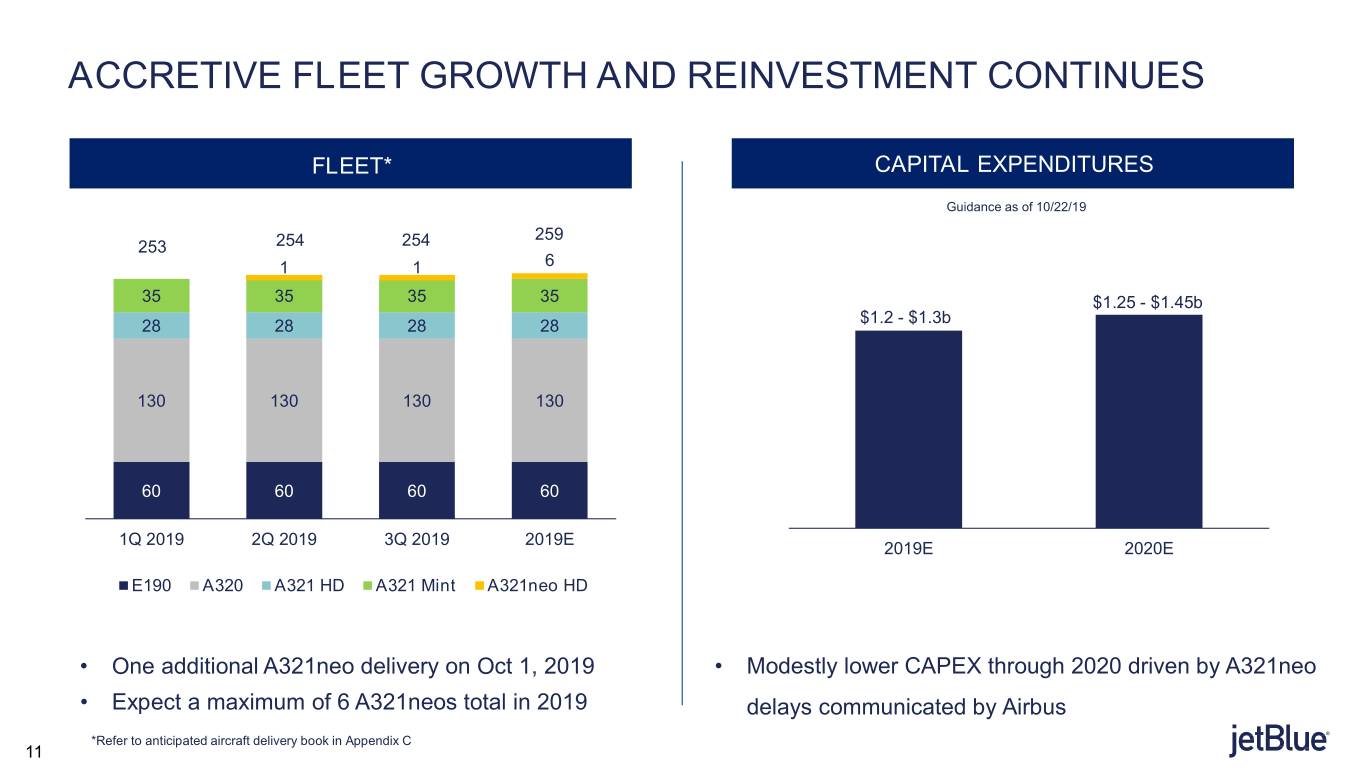
ACCRETIVE FLEET GROWTH AND REINVESTMENT CONTINUES FLEET* CAPITAL EXPENDITURES Guidance as of 10/22/19 259 253 254 254 1 1 6 35 35 35 35 $1.25 - $1.45b $1.2 - $1.3b 28 28 28 28 130 130 130 130 60 60 60 60 1Q 2019 2Q 2019 3Q 2019 2019E 2019E 2020E E190 A320 A321 HD A321 Mint A321neo HD • One additional A321neo delivery on Oct 1, 2019 • Modestly lower CAPEX through 2020 driven by A321neo • Expect a maximum of 6 A321neos total in 2019 delays communicated by Airbus *Refer to anticipated aircraft delivery book in Appendix C 11
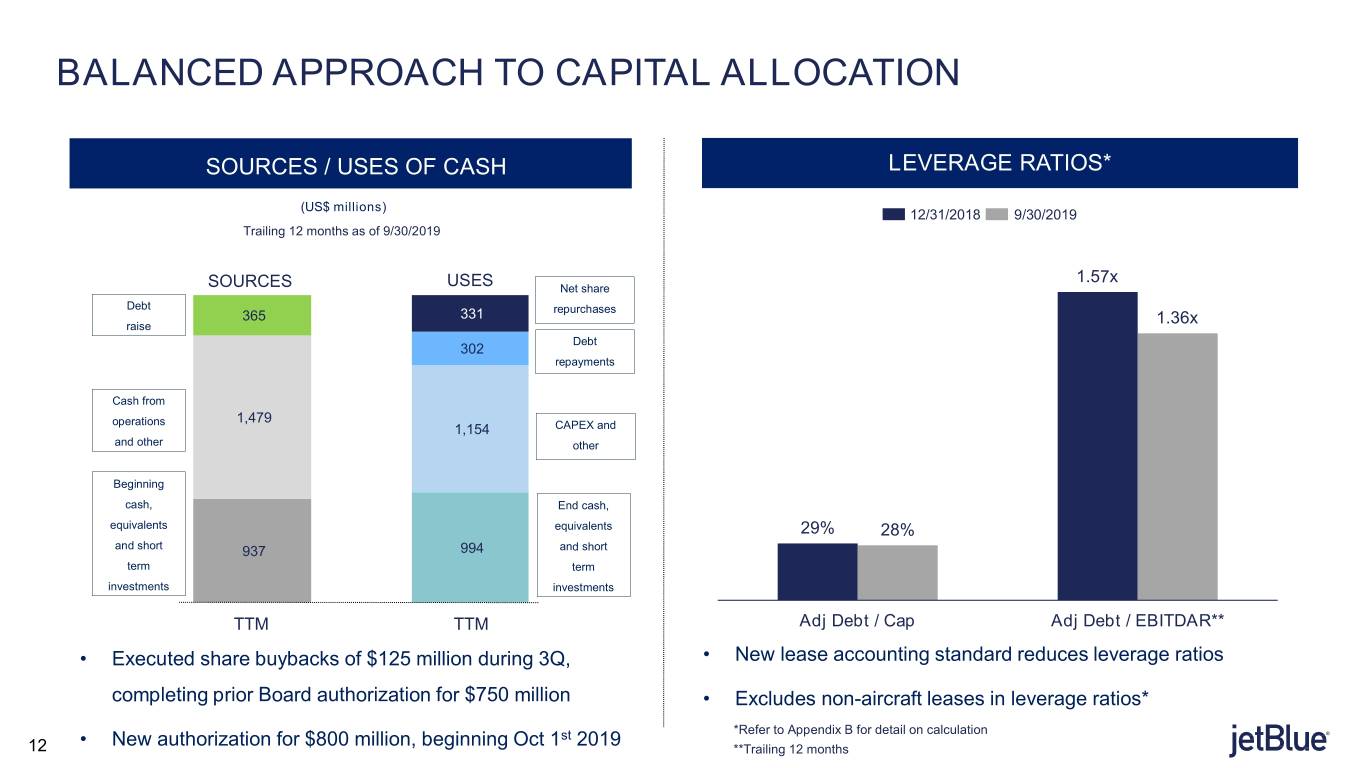
BALANCED APPROACH TO CAPITAL ALLOCATION SOURCES / USES OF CASH LEVERAGE RATIOS* (US$ millions) 12/31/2018 9/30/2019 Trailing 12 months as of 9/30/2019 1.57x SOURCES USES Net share Debt 365 331 repurchases raise 1.36x Debt 302 repayments Cash from operations 1,479 1,154 CAPEX and and other other Beginning cash, End cash, equivalents equivalents 29% 28% and short 937 994 and short term term investments investments TTM TTM Adj Debt / Cap Adj Debt / EBITDAR** • Executed share buybacks of $125 million during 3Q, • New lease accounting standard reduces leverage ratios completing prior Board authorization for $750 million • Excludes non-aircraft leases in leverage ratios* • New authorization for $800 million, beginning Oct 1st 2019 *Refer to Appendix B for detail on calculation 1212 **Trailing 12 months

2019 GUIDE SUMMARY CAPACITY RASM CASM EX-FUEL* ALL-IN FUEL PRICE 4Q 2019 FY 2019 4Q 2019 FY 2019 4Q 2019 FY 2019 4Q 2019 FY 2019 4.5 – 6.5% 6.0 – 7.0% (3.5) – (0.5)% N/A (1.0) – 1.0% 0.5 – 1.0% $2.07/gal N/A CAPEX AIRCRAFT CAPEX NON-AIRCRAFT OTHER INCOME / (EXPENSE) JTP / JTV (EXPENSES) 4Q 2019 FY 2019 4Q 2019 FY 2019 4Q 2019 FY 2019** 4Q 2019 FY 2019 $450 – 550m $1.0b – 1.1b $40 – 60m $150 – 200m ($13) – (18)m ($53) – (58)m ($11) – (15)m ($40) – (50)m *CASM Ex-Fuel excludes fuel and related taxes, special items and operating expenses related to non-airline businesses. With respect to JetBlue’s CASM Ex-Fuel and guidance, JetBlue is not able to provide a reconciliation of the non-GAAP financial measure to GAAP because the excluded items have not yet occurred and cannot be reasonably predicted. The reconciling information that is unavailable would include a forward-looking range of financial performance measures beyond our control, such as fuel costs, which are subject to many economic and political factors beyond our control. Beginning with the first quarter 2018, Operating Expenses Related to other Non-Airline businesses include JetBlue Travel Products and equivalent prior period costs. Full year 2018 CASM Ex-Fuel excludes the non-cash impairment charge related to the Embraer E190 Fleet review, as well as other E190 exit costs and certain costs associated with our pilots’ collective bargaining agreement. We believe these special items distort our overall trends **Full year 2019 guidance excludes the $15 million gain that was recorded during the third quarter. 13

QUESTIONS?
APPENDIX A Non-GAAP Financial Measures JetBlue sometimes uses non-GAAP measures that are derived from the consolidated financial statements, but that are not presented in accordance with generally accepted accounting principles in the U.S., or GAAP. We believe these non-GAAP measures provide a meaningful comparison of our results to others in the airline industry and our prior year results. Investors should consider these non-GAAP financial measures in addition to, and not as a substitute for, our financial performance measures prepared in accordance with GAAP. Further, our non-GAAP information may be different from the non-GAAP information provided by other companies. We believe certain charges included in our operating expenses on a GAAP basis make it difficult to compare our current period results to prior periods as well as future periods and guidance. The tables in Appendices A and B show a reconciliation of non-GAAP financial measures used in this presentation to the most directly comparable GAAP financial measures. 15
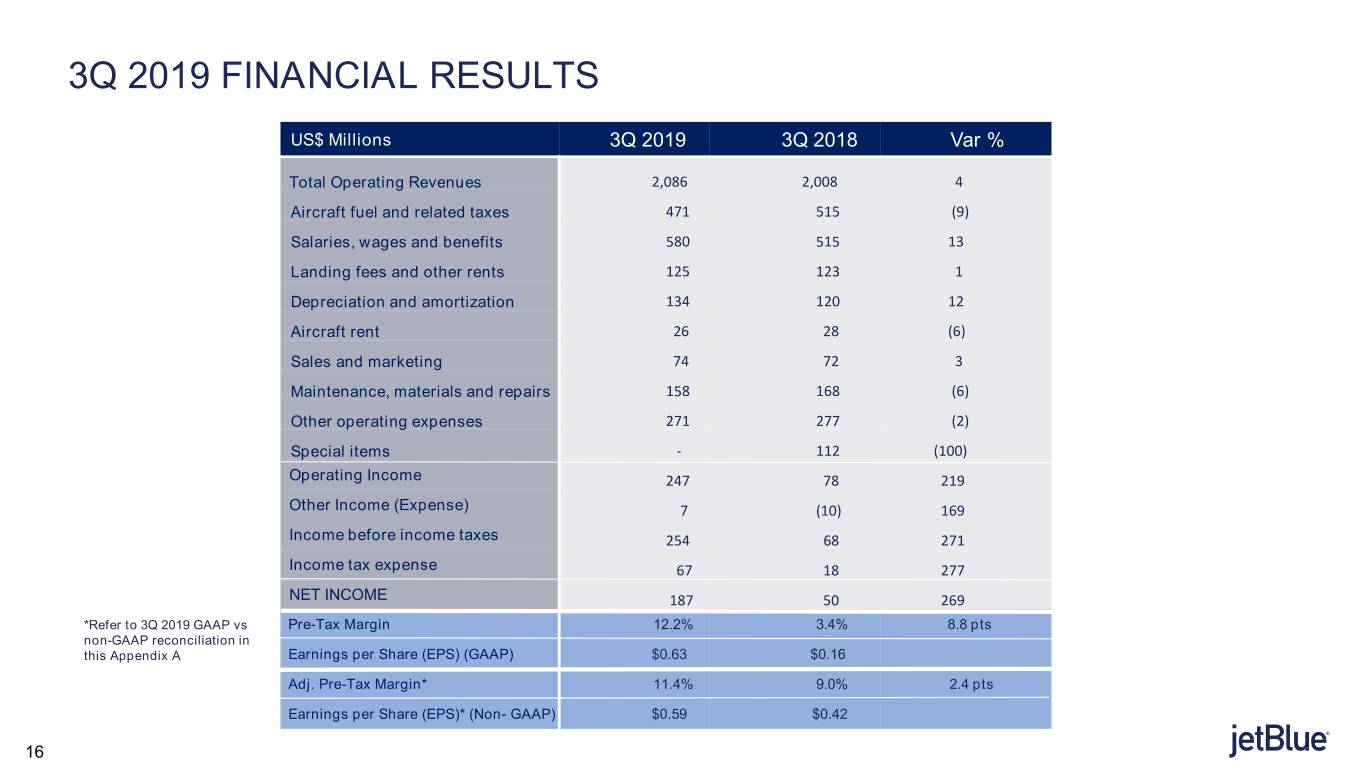
3Q 2019 FINANCIAL RESULTS US$ Millions 3Q 2019 3Q 2018 Var % Total Operating Revenues 2,086 2,008 4 Aircraft fuel and related taxes 471 515 (9) Salaries, wages and benefits 580 515 13 Landing fees and other rents 125 123 1 Depreciation and amortization 134 120 12 Aircraft rent 26 28 (6) Sales and marketing 74 72 3 Maintenance, materials and repairs 158 168 (6) Other operating expenses 271 277 (2) Special items - 112 (100) Operating Income 247 78 219 Other Income (Expense) 7 (10) 169 Income before income taxes 254 68 271 Income tax expense 67 18 277 NET INCOME 187 50 269 *Refer to 3Q 2019 GAAP vs Pre-Tax Margin 12.2% 3.4% 8.8 pts non-GAAP reconciliation in this Appendix A Earnings per Share (EPS) (GAAP) $0.63 $0.16 Adj. Pre-Tax Margin* 11.4% 9.0% 2.4 pts Earnings per Share (EPS)* (Non- GAAP) $0.59 $0.42 16
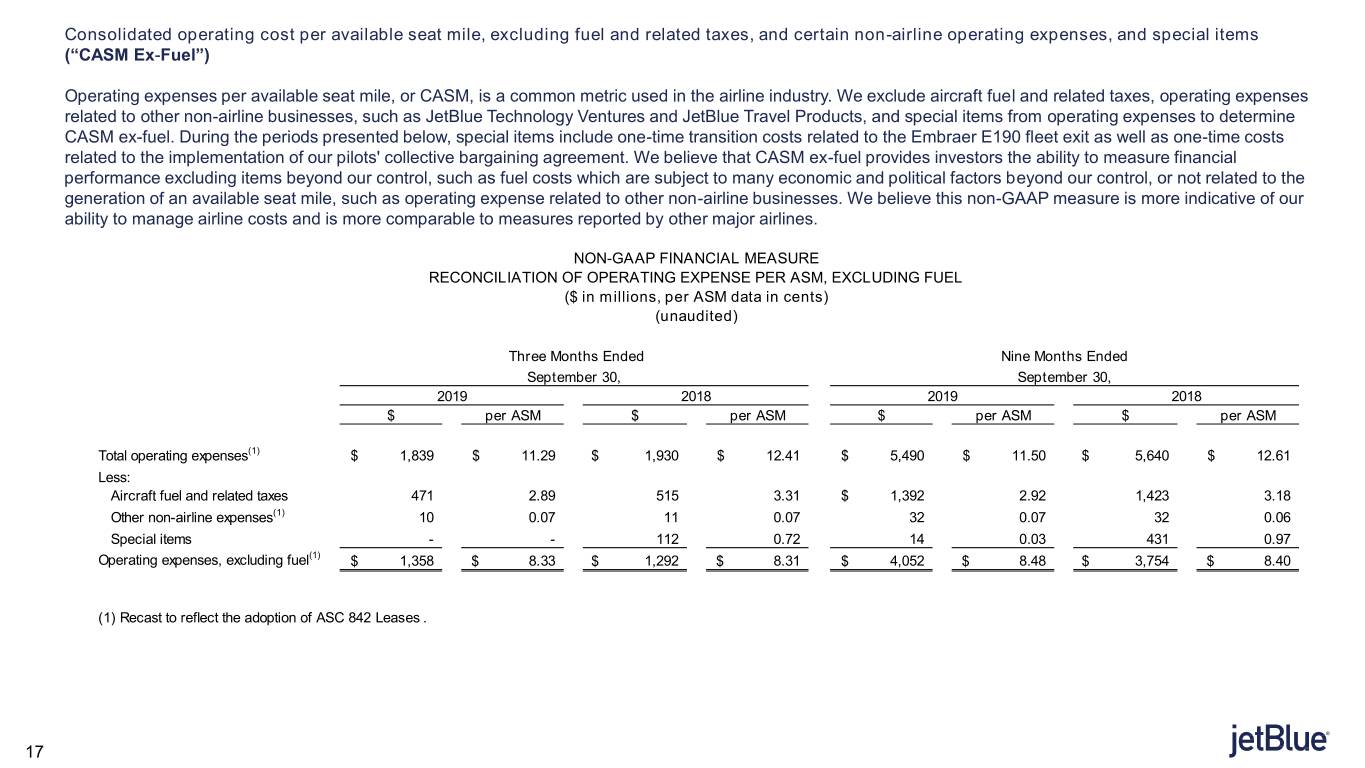
Consolidated operating cost per available seat mile, excluding fuel and related taxes, and certain non-airline operating expenses, and special items (“CASM Ex-Fuel”) Operating expenses per available seat mile, or CASM, is a common metric used in the airline industry. We exclude aircraft fuel and related taxes, operating expenses related to other non-airline businesses, such as JetBlue Technology Ventures and JetBlue Travel Products, and special items from operating expenses to determine CASM ex-fuel. During the periods presented below, special items include one-time transition costs related to the Embraer E190 fleet exit as well as one-time costs related to the implementation of our pilots' collective bargaining agreement. We believe that CASM ex-fuel provides investors the ability to measure financial performance excluding items beyond our control, such as fuel costs which are subject to many economic and political factors beyond our control, or not related to the generation of an available seat mile, such as operating expense related to other non-airline businesses. We believe this non-GAAP measure is more indicative of our ability to manage airline costs and is more comparable to measures reported by other major airlines. LOCATION NON-GAAP FINANCIAL MEASURE RECONCILIATION OF OPERATING EXPENSE PER ASM, EXCLUDING FUEL ($ in millions, per ASM data in cents) (unaudited) Three Months Ended Nine Months Ended September 30, September 30, 2019 2018 2019 2018 $ per ASM $ per ASM $ per ASM $ per ASM Total operating expenses(1) $ 1,839 $ 11.29 $ 1,930 $ 12.41 $ 5,490 $ 11.50 $ 5,640 $ 12.61 Less: Aircraft fuel and related taxes 471 2.89 515 3.31 $ 1,392 2.92 1,423 3.18 Other non-airline expenses(1) 10 0.07 11 0.07 32 0.07 32 0.06 Special items - - 112 0.72 14 0.03 431 0.97 Operating expenses, excluding fuel(1) $ 1,358 $ 8.33 $ 1,292 $ 8.31 $ 4,052 $ 8.48 $ 3,754 $ 8.40 (1) Recast to reflect the adoption of ASC 842 Leases . 17
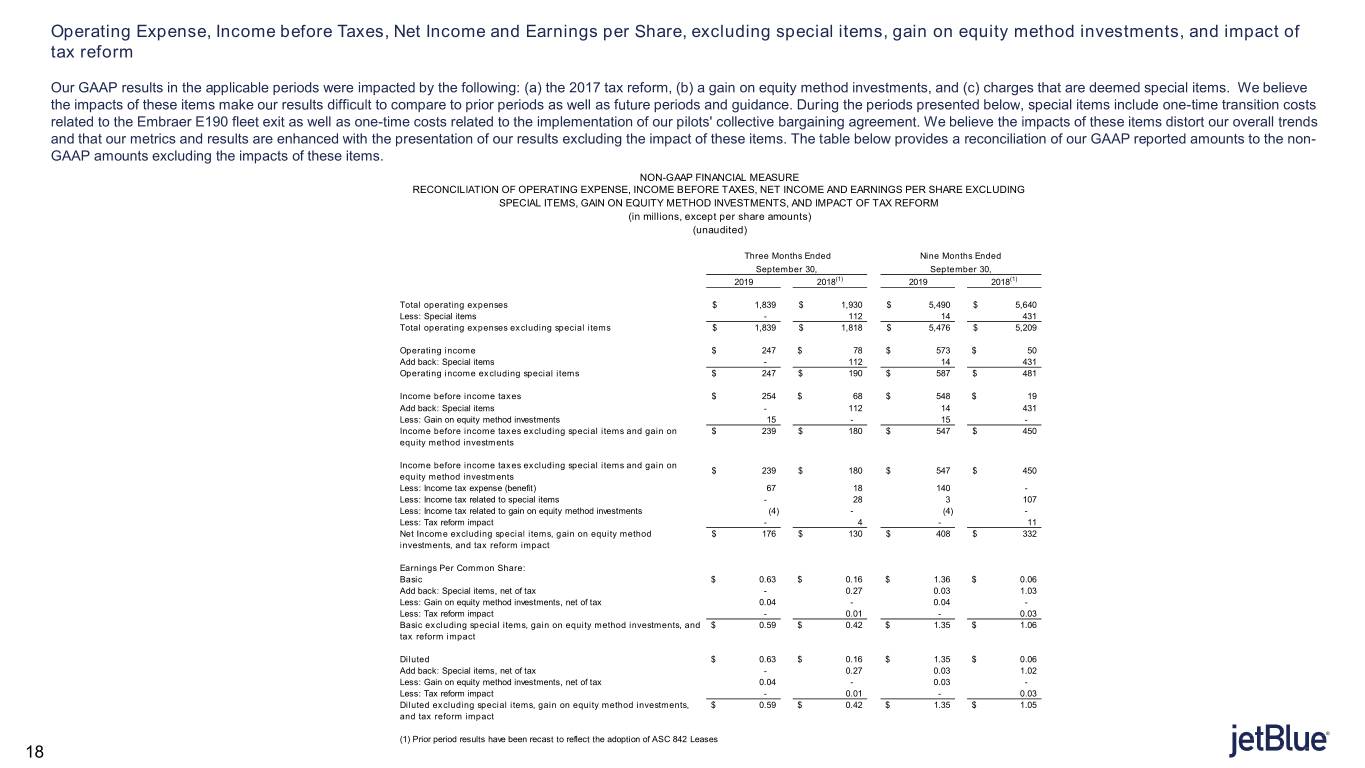
Operating Expense, Income before Taxes, Net Income and Earnings per Share, excluding special items, gain on equity method investments, and impact of tax reform Our GAAP results in the applicable periods were impacted by the following: (a) the 2017 tax reform, (b) a gain on equity method investments, and (c) charges that are deemed special items. We believe the impacts of these items make our results difficult to compare to prior periods as well as future periods and guidance. During the periods presented below, special items include one-time transition costs related to the Embraer E190 fleet exit as well as one-time costs related to the implementation of our pilots' collective bargaining agreement. We believe the impacts of these items distort our overall trends and that our metrics and results are enhanced with the presentation of our results excluding the impact of these items. The table below provides a reconciliation of our GAAP reported amounts to the non- GAAP amounts excluding the impacts of these items. NON-GAAP FINANCIAL MEASURE RECONCILIATION OF OPERATING EXPENSE, INCOME BEFORE TAXES, NET INCOME AND EARNINGS PER SHARE EXCLUDING SPECIAL ITEMS, GAIN ON EQUITY METHOD INVESTMENTS, AND IMPACT OF TAX REFORM (in millions, except per share amounts) LOCATION(unaudited) Three Months Ended Nine Months Ended September 30, September 30, 2019 2018(1) 2019 2018(1) Total operating expenses $ 1,839 $ 1,930 $ 5,490 $ 5,640 Less: Special items - 112 14 431 Total operating expenses excluding special items $ 1,839 $ 1,818 $ 5,476 $ 5,209 Operating income $ 247 $ 78 $ 573 $ 50 Add back: Special items - 112 14 431 Operating income excluding special items $ 247 $ 190 $ 587 $ 481 Income before income taxes $ 254 $ 68 $ 548 $ 19 Add back: Special items - 112 14 431 Less: Gain on equity method investments 15 - 15 - Income before income taxes excluding special items and gain on $ 239 $ 180 $ 547 $ 450 equity method investments Income before income taxes excluding special items and gain on $ 239 $ 180 $ 547 $ 450 equity method investments Less: Income tax expense (benefit) 67 18 140 - Less: Income tax related to special items - 28 3 107 Less: Income tax related to gain on equity method investments (4) - (4) - Less: Tax reform impact - 4 - 11 Net Income excluding special items, gain on equity method $ 176 $ 130 $ 408 $ 332 investments, and tax reform impact Earnings Per Common Share: Basic $ 0.63 $ 0.16 $ 1.36 $ 0.06 Add back: Special items, net of tax - 0.27 0.03 1.03 Less: Gain on equity method investments, net of tax 0.04 - 0.04 - Less: Tax reform impact - 0.01 - 0.03 Basic excluding special items, gain on equity method investments, and $ 0.59 $ 0.42 $ 1.35 $ 1.06 tax reform impact Diluted $ 0.63 $ 0.16 $ 1.35 $ 0.06 Add back: Special items, net of tax - 0.27 0.03 1.02 Less: Gain on equity method investments, net of tax 0.04 - 0.03 - Less: Tax reform impact - 0.01 - 0.03 Diluted excluding special items, gain on equity method investments, $ 0.59 $ 0.42 $ 1.35 $ 1.05 and tax reform impact (1) Prior period results have been recast to reflect the adoption of ASC 842 Leases 18

APPENDIX B: CALCULATION OF LEVERAGE RATIOS NON-GAAP FINANCIAL MEASURE ADJUSTED DEBT TO CAPITALIZATION RATIO (in millions) (unaudited) LOCATION September 30, 2019 December 31, 2018 Long-term debt and finance lease obligations $ 1,320 $ 1,361 Current maturities of long-term debt and finance leases 316 309 Operating lease liabilities - aircraft(1) 226 256 Adjusted debt(1) 1,862 1,926 Long-term debt and finance lease obligations 1,320 1,361 Current maturities of long-term debt and finance leases 316 309 Operating lease liabilities - aircraft(1) 226 256 Stockholders' equity(1) 4,764 4,685 Adjusted capitalization(1) 6,626 6,611 Adjusted debt to capitalization ratio(1) 28% 29% (1) Prior period results have been recast to reflect the adoption of ASC 842 Leases 19

NON-GAAP FINANCIAL MEASURE ADJUSTED DEBT TO EBITDAR RATIO (in millions) (unaudited) Trailing Twelve Months Trailing Twelve Months September 30, 2019 December 31, 2018 DOCUMENT Long-term debt and finance lease obligations LOCATION$ 1,320 $ 1,361 Current maturities of long-term debt and finance leases 316 309 Operating lease liabilities - aircraft(1) 226 256 Adjusted debt(1) 1,862 1,926 Operating income(1) 789 266 Depreciation and amortization(1) 509 469 Special items(2) 18 435 Current operating lease liabilities - aircraft(1) 52 54 EBITDAR(1)(2) 1,368 1,224 Adjusted debt to EBITDAR ratio(1)(2) 1.36x 1.57x (1) Prior period results have been recast to reflect the adoption of ASC 842 Leases (2) Special items include the impairment and one-time transition costs related to the Embraer E190 fleet exit as well as one-time costs related to the implementation of our pilots' collective bargaining agreement 20
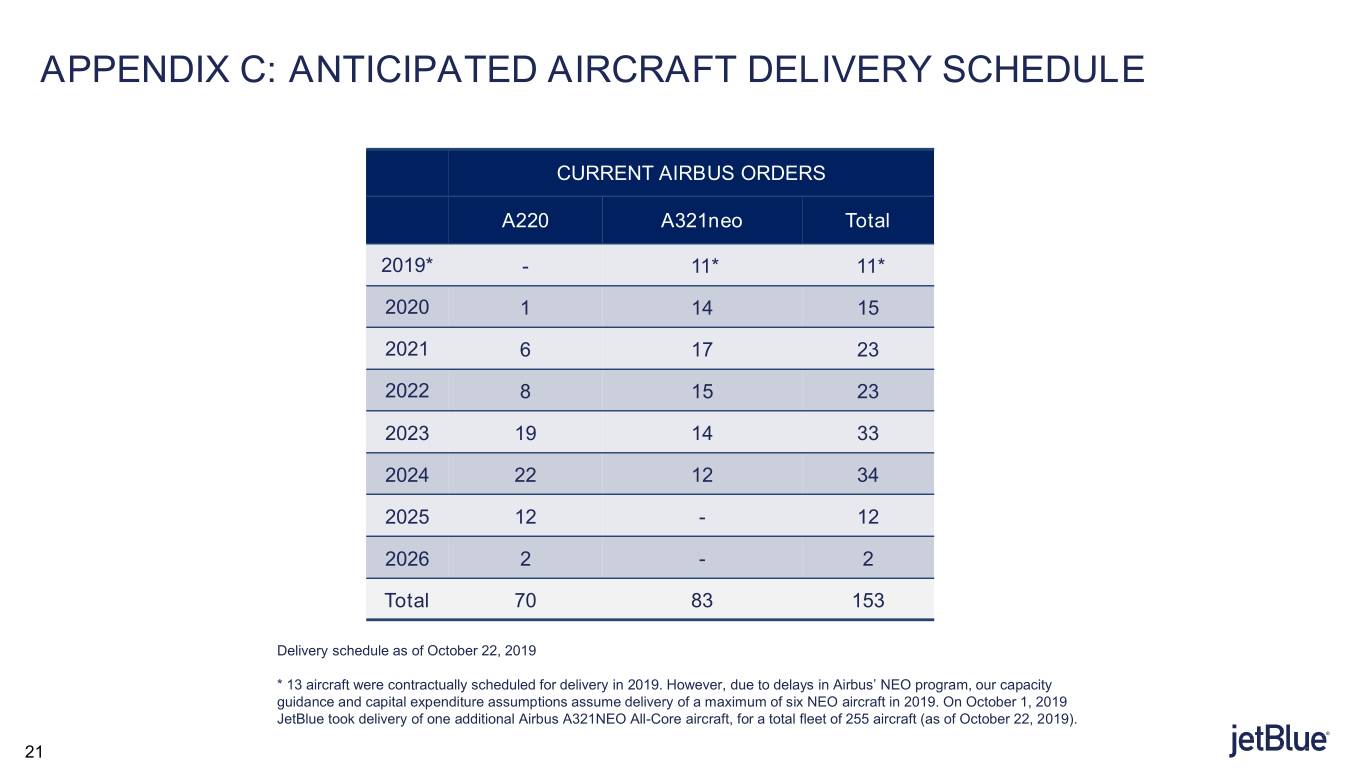
APPENDIX C: ANTICIPATED AIRCRAFT DELIVERY SCHEDULE CURRENT AIRBUS ORDERS A220 A321neo Total 2019* - 11* 11* 2020 1 14 15 2021 6 17 23 2022 8 15 23 2023 19 14 33 2024 22 12 34 2025 12 - 12 2026 2 - 2 Total 70 83 153 Delivery schedule as of October 22, 2019 * 13 aircraft were contractually scheduled for delivery in 2019. However, due to delays in Airbus’ NEO program, our capacity guidance and capital expenditure assumptions assume delivery of a maximum of six NEO aircraft in 2019. On October 1, 2019 JetBlue took delivery of one additional Airbus A321NEO All-Core aircraft, for a total fleet of 255 aircraft (as of October 22, 2019). 21

APPENDIX D: RELEVANT JETBLUE MATERIALS www.investor.jetblue.com/investor-relations DOCUMENT LOCATION Investor Presentations http://blueir.investproductions.com/investor-relations/events-and-presentations/presentations Earnings Releases http://blueir.investproductions.com/investor-relations/financial-information/quarterly-results Annual Reports http://blueir.investproductions.com/investor-relations/financial-information/reports/annual-reports SEC Filings http://blueir.investproductions.com/investor-relations/financial-information/sec-filings Proxy Statements http://blueir.investproductions.com/investor-relations/financial-information/reports/proxy-statements Investor Updates http://blueir.investproductions.com/investor-relations/financial-information/investor-updates Traffic Reports http://blueir.investproductions.com/investor-relations/financial-information/traffic-releases ESG Reports* http://blueir.investproductions.com/investor-relations/financial-information/reports/sustainable-accounting-standards-board-reports * Environmental, Social, and Governance Reports 22


