As filed with the Securities and Exchange Commission on June 28, 2004
SECURITIES AND EXCHANGE COMMISSION
Washington, D.C. 20549
FORM 20-F
| | ¨ | REGISTRATION STATEMENT PURSUANT TO SECTION 12(b) OR 12(g) OF THE SECURITIES EXCHANGE ACT OF 1934 |
OR
| | x | ANNUAL REPORT PURSUANT TO SECTION 13 OR 15(d) OF THE SECURITIES EXCHANGE ACT OF 1934 |
For the fiscal year ended December 31, 2003
OR
| | ¨ | TRANSITION REPORT PURSUANT TO SECTION 13 OR 15(d) OF THE SECURITIES EXCHANGE ACT OF 1934 |
For the transition period from to
Commission file number: 1-15232
SUEZ
(Exact name of Registrant as specified in its charter)
| | |
| SUEZ | | The Republic of France |
(Translation of Registrant’s name into English) | | (Jurisdiction of incorporation or organization) |
16, rue de la Ville l’Evêque, 75008 Paris, France
(Address of principal executive offices)
Securities registered or to be registered pursuant to Section 12(b) of the Act:
| | |
Title of each class
| | Name of each exchange on which registered
|
| Shares of nominal value €2 each represented by American Depositary Shares | | The New York Stock Exchange |
Securities registered or to be registered pursuant to Section 12(g) of the Act: None
Securities for which there is a reporting obligation pursuant to Section 15(d) of the Act: None
Indicate the number of outstanding shares of each of the issuer’s classes of capital or common stock as of the close of the period covered by the annual report.
| | |
The number of outstanding shares of SUEZ on December 31, 2003 was | | 1,007,679,806 |
Indicate by check mark whether the registrant: (1) has filed all reports required to be filed by Section 13 or 15(d) of the Securities Exchange Act of 1934 during the preceding 12 months (or for such shorter period that the registrant was required to file such reports), and (2) has been subject to such filing requirements for the past 90 days.
Yes x No ¨
Indicate by check mark which financial statement item the registrant has elected to follow.
Item 17 ¨ Item 18 x
TABLE OF CONTENTS
i
ii
INTRODUCTION
Forward-Looking Statements
This annual report contains certain statements that are forward-looking within the meaning of Section 21E of the Securities Exchange Act of 1934 (the “Exchange Act”), including statements with respect to management’s business strategies, expansion and growth of operations, trends in our business, competitive advantage, and technological and regulatory changes, information on exchange rate risk and generally all statements preceded by, followed by or that include the words “believe”, “expect”, “project”, “anticipate”, “seek”, “estimate” or similar expressions. Such forward-looking statements are not guarantees of future performance and involve risks and uncertainties, and actual results may differ materially from those in the forward-looking statements as a result of various factors. The accompanying information contained in this annual report on Form 20-F, including, without limitation, the information under “Risk Factors”, “Information on the Company”, “Operating and Financial Review and Prospects” and “Financial Information”, identifies important factors that could cause such differences. Readers are cautioned not to place undue reliance on those forward-looking statements, which speak only as of the date hereof.
Financial and Certain Other Information
SUEZ is incorporated as a joint stock company (société anonyme) under the laws of France. As used in this annual report, “SUEZ”, “we” or the “Group” refers to the parent company and its consolidated subsidiaries unless the context otherwise requires. Our annual general meeting of shareholders of May 4, 2001, authorized the change of our name from SUEZ Lyonnaise des Eaux to SUEZ. Our legal life expires on December 31, 2040, unless we are dissolved prior to that date or it is extended. Our statutory documents may be consulted at our administrative office, 16, rue de la Ville l’Evêque, 75008 Paris, France, telephone (33-1) 40-06-64-00.
Our annual general meeting of shareholders of May 4, 2001 authorized a split of our shares whereby one share of common stock converted to five shares of common stock effective May 15, 2001. Unless otherwise indicated, all share amounts and related figures in this annual report have been restated to take into account the stock split.
In this annual report, references to “United States”, “US”, or “USA” are to the United States of America, references to “U.S. dollars” or “$” are to United States dollars and references to “euro” or “€”are to euros. References to the “Euronext Paris” are to the integrated national dealing system through which trading of all listed French securities occurs. References to kWh are to kilowatt hours, references to MW are to megawatts, references to GWh are to gigawatt hours, references to MWe are to megawatts of electricity, and references to MWth are to megawatts of thermal energy. References to EONIA are to Euro OverNight Index Average and to EURIBOR are to Euro Inter Bank Offering Rate.
Various amounts and percentages set out in this annual report have been rounded and accordingly may not total.
Exchange Rates
Unless otherwise indicated, U.S. dollar amounts herein have been translated from euro at the rate of €1.00 = $1.2597, the noon buying rate in New York City for cable transfers in euro as announced by the Federal Reserve Bank for customs purposes on December 31, 2003 on its website www.federalreserve.gov. The exchange rate in effect on June 21, 2004 was €1.00 = $1.2110.
1
PART I
ITEM 1. IDENTITY OF DIRECTORS, SENIOR MANAGEMENT AND ADVISERS
Not applicable.
ITEM 2. OFFER STATISTICS AND EXPECTED TIMETABLE
Not applicable.
ITEM 3. KEY INFORMATION
A. Selected Consolidated Financial Data
The selected consolidated financial data at December 31, 2003, 2002 and 2001 and for the years ended December 31, 2003, 2002 and 2001 have been derived from our Consolidated Financial Statements included in this annual report. The selected consolidated financial data at year-end 1999 and 2000 and for the years ended December 31, 1999 and 2000 have been derived from our Consolidated Financial Statements that are not included in this annual report. Our Consolidated Financial Statements for the years ended December 31, 2003, 2002 and 2001 were audited by Barbier Frinault & Autres – Ernst and Young and Deloitte Touche Tohmatsu – Audit.
Our Consolidated Financial Statements have been prepared in accordance with French GAAP, which differs in certain significant respects from U.S. GAAP. Notes 26 to 28 to our Consolidated Financial Statements describe the principal differences between French GAAP and U.S. GAAP as they relate to us, and reconcile our net income and shareholders’ equity to U.S. GAAP.
You should read the following data together with the section entitled “Item 5. Operating and Financial Review and Prospects” and our Consolidated Financial Statements.
| | | | | | | | | | | | | | | | | | |
| | | As of and for the year ended December 31,
| |
| | | 2003
| | | 2003 (1)
| | | 2002
| | | 2001
| | | 2000
| | | 1999
| |
| | | € | | | $ | | | € | | | € | | | € | | | € | |
| |
| | | (in millions, except per share amounts) | |
Income statement data: | | | | | | | | | | | | | | | | | | |
| | | | | | |
Amounts in accordance with French GAAP | | | | | | | | | | | | | | | | | | |
Revenues (2) | | 39,622 | | | 49,912 | | | 46,090 | | | 42,359 | | | 34,617 | | | 31,462 | |
Other income (3) | | 1,489 | | | 1,876 | | | 2,074 | | | 1,774 | | | 1,766 | | | 2,350 | |
Operating expenses | | (35,383 | ) | | (44,572 | ) | | (41,385 | ) | | (36,971 | ) | | (29,579 | ) | | (28,399 | ) |
Operating income before depreciation, amortization and provisions | | 5,727 | | | 7,214 | | | 6,779 | | | 7,163 | | | 6,804 | | | 5,413 | |
Depreciation, amortization and provisions | | (2,522 | ) | | (3,177 | ) | | (3,071 | ) | | (3,098 | ) | | (3,026 | ) | | (2,481 | ) |
Operating income | | 3,205 | | | 4,037 | | | 3,708 | | | 4,064 | | | 3,778 | | | 2,932 | |
Financial income (loss) | | (880 | ) | | (1,109 | ) | | (976 | ) | | (1,258 | ) | | (972 | ) | | (390 | ) |
Exceptional income (loss) | | (2,757 | ) | | (3,473 | ) | | (1,784 | ) | | 826 | | | 569 | | | 725 | |
Income tax | | (721 | ) | | (908 | ) | | (657 | ) | | (722 | ) | | (663 | ) | | (753 | ) |
Share in income of companies accounted for under the equity method | | 166 | | | 209 | | | 51 | | | 334 | | | 512 | | | 385 | |
Amortization of goodwill | | (267 | ) | | (336 | ) | | (383 | ) | | (423 | ) | | (368 | ) | | (198 | ) |
Minority interests | | (911 | ) | | (1,148 | ) | | (822 | ) | | (734 | ) | | (936 | ) | | (1,248 | ) |
Net income (loss) | | (2,165 | ) | | (2,727 | ) | | (863 | ) | | 2,087 | | | 1,919 | | | 1,453 | |
| | | | | | |
Basic earnings (loss) per share | | (2.18 | ) | | (2.75 | ) | | (0.87 | ) | | 2.12 | | | 2.01 | | | 1.89 | |
Diluted earnings (loss) per share | | (2.18 | ) | | (2.75 | ) | | (0.87 | ) | | 2.08 | | | 1.94 | | | 1.81 | |
2
| | | | | | | | | | | | | | | | |
| | | As of and for the year ended December 31,
|
| | | 2003
| | | 2003 (1)
| | | 2002
| | | 2001
| | | 2000
| | 1999
|
| | | € | | | $ | | | € | | | € | | | € | | € |
| |
| | | (in millions, except per share amounts) |
Amounts in accordance with U.S. GAAP | | | | | | | | | | | | | | | | |
Total revenue | | 35,644 | | | 44,901 | | | 27,387 | | | 25,606 | | | 24,775 | | 23,181 |
Operating income | | 765 | | | 964 | | | (76 | ) | | 967 | | | 1,126 | | 1,474 |
Income (loss) from continuing operations (4) | | (1,565 | ) | | (1,971 | ) | | (3,250 | ) | | 1,083 | | | | | |
Cumulative effect of adopting SFAS 143 | | (26 | ) | | (33 | ) | | | | | | | | | | |
Cumulative effect of adopting SFAS 133 | | | | | | | | | | | (132 | ) | | | | |
Income (loss) from discontinued operations (4) | | (712 | ) | | (897 | ) | | 81 | | | (55 | ) | | | | |
Net income (loss) | | (2,303 | ) | | (2,901 | ) | | (3,169 | ) | | 896 | | | 741 | | 1,020 |
Basic per share information | | | | | | | | | | | | | | | | |
Income (loss) from continuing operations (4) | | (1.57 | ) | | (1.98 | ) | | (3.28 | ) | | 1.10 | | | | | |
Cumulative effect of adopting SFAS 143 | | (0.03 | ) | | (0.04 | ) | | | | | | | | | | |
Cumulative effect of adopting SFAS 133 | | | | | | | | | | | (0.13 | ) | | | | |
Income (loss) from discontinued operations (4) | | (0.72 | ) | | (0.90 | ) | | 0.08 | | | (0.06 | ) | | | | |
Net income (loss) per share | | (2.32 | ) | | (2.92 | ) | | (3.20 | ) | | 0.91 | | | 0.77 | | 1.33 |
Diluted per share information | | | | | | | | | | | | | | | | |
Income (loss) from continuing operations (4) | | (1.57 | ) | | (1.98 | ) | | (3.28 | ) | | 1.08 | | | | | |
Cumulative effect of adopting SFAS 143 | | (0.03 | ) | | (0.04 | ) | | | | | | | | | | |
Cumulative effect of adopting SFAS 133 | | | | | | | | | | | (0.13 | ) | | | | |
Income (loss) from discontinued operations (4) | | (0.72 | ) | | (0.90 | ) | | 0.08 | | | (0.05 | ) | | | | |
Net income (loss) per share | | (2.32 | ) | | (2.92 | ) | | (3.20 | ) | | 0.90 | | | 0.76 | | 1.28 |
| | | | | | |
Balance sheet data: | | | | | | | | | | | | | | | | |
| | | | | | |
Amounts in accordance with French GAAP | | | | | | | | | | | | | | | | |
Tangible assets | | 27,127 | | | 34,172 | | | 33,276 | | | 37,992 | | | 37,003 | | 28,922 |
Borrowings and long-term debt | | 26,694 | | | 33,626 | | | 34,545 | | | 33,761 | | | 32,192 | | 25,623 |
Cash and cash equivalents | | 6,688 | | | 8,425 | | | 5,963 | | | 4,629 | | | 4,489 | | 4,812 |
Shareholders’ equity | | 6,896 | | | 8,687 | | | 10,578 | | | 14,397 | | | 13,134 | | 11,271 |
Minority interests | | 4,847 | | | 6,106 | | | 5,191 | | | 6,447 | | | 7,089 | | 6,418 |
Total assets | | 69,950 | | | 88,116 | | | 84,151 | | | 89,481 | | | 85,498 | | 76,897 |
| | | | | | |
Amounts in accordance with U.S. GAAP | | | | | | | | | | | | | | | | |
Borrowings and long-term debt | | 24,998 | | | 31,490 | | | 34,436 | | | 31,717 | | | 30,109 | | 22,948 |
Shareholders’ equity | | 14,520 | | | 18,291 | | | 18,397 | | | 25,100 | | | 25,112 | | 24,218 |
Minority interests | | 3,915 | | | 4,932 | | | 936 | | | 1,754 | | | 2,295 | | 2,929 |
Total assets | | 68,593 | | | 86,407 | | | 72,725 | | | 79,396 | | | 77,683 | | 71,296 |
| | | | | | |
Other data: | | | | | | | | | | | | | | | | |
Dividends per share | | 0.71 | | | 0.89 | | | 0.71 | | | 0.71 | | | 0.66 | | 0.60 |
| (1) | Translated for convenience into US dollars at the noon buying rate for euros in New York on December 31, 2003 as reported by the Federal Reserve Bank on its website www.federalreserve.gov. |
| (2) | For change in treatment in energy trading activities, see note 1-O to the consolidated financial statements. |
| (3) | Consists of income from mixed inter-municipal companies and joint operations, and other operating income. The mixed inter-municipal companies, which are located in Belgium, are jointly held by Belgian municipalities and by Electrabel. They service the end user for electricity, gas and cable television and do not have any employees. We provide all the services for the consumer and bill the companies for these services. |
| (4) | The Group sold Ondeo Nalco, Coditel and Codenet in 2003. The Results of operations from January 1, 2003 to the respective date of disposal of Ondeo Nalco, Coditel and Codenet has been eliminated from the |
3
| | Group’s ongoing operations, then the related results of operations for the current and prior periods (through 2001), including any related impairments, are reflected as Discontinued Operations in the U.S. GAAP Consolidated Income Statement. Presentation of amounts related to these discontinued operations for 2000 and 1999 is not included as the Group is unable to ascertain the related amounts. |
Exchange Rates
The following tables set forth, for the periods and dates indicated, information concerning the noon buying rate in U.S. dollars for euro for 1999, 2000, 2001, 2002, 2003 and 2004 (through June 21), based on rates reported by the Federal Reserve Bank of New York on its website www.federalreserve.gov. No representation is made that euro amounts have been, could have been or could be converted into U.S. dollars at the noon buying rates indicated for any given date.
| | | | | | | | |
Year ended December 31,
| | At end of
period
| | Average rate
(1)
| | High
| | Low
|
1999 | | 1.0070 | | 1.0588 | | 1.1812 | | 1.0016 |
2000 | | 0.9388 | | 0.9207 | | 1.0335 | | 0.8270 |
2001 | | 0.8901 | | 0.8909 | | 0.9535 | | 0.8370 |
2002 | | 1.0485 | | 0.9496 | | 1.0485 | | 0.8594 |
2003 | | 1.2597 | | 1.1411 | | 1.2597 | | 1.0361 |
2004 (through June 21, 2004) | | 1.2110 | | 1.2248 | | 1.2853 | | 1.1801 |
| | | | |
| Monthly | | | | | | | | |
December 31, 2003 | | 1.2597 | | — | | 1.2597 | | 1.1956 |
January 31, 2004 | | 1.2452 | | — | | 1.2853 | | 1.2389 |
February 29, 2004 | | 1.2441 | | — | | 1.2848 | | 1.2426 |
March 31, 2004 | | 1.2292 | | — | | 1.2431 | | 1.2088 |
April 30, 2004 | | 1.1975 | | — | | 1.2358 | | 1.1802 |
May 31, 2004 | | 1.2217 | | — | | 1.2274 | | 1.1801 |
through June 21, 2004 | | 1.2110 | | — | | 1.2320 | | 1.2006 |
| (1) | The average of the noon buying rates on the last day of each month during the relevant period. The “Noon Buying Rate” is the noon buying rate in New York City for cable transfers in foreign currencies as certified for customs purposes by the Federal Reserve Bank of New York. |
A substantial proportion of our assets, liabilities, revenues and expenses are denominated in currencies other than the euro. Accordingly, fluctuations in the value of the euro relative to other currencies can have an effect on the translation into euro of our assets, liabilities, revenues and expenses. For information with respect to the impact of fluctuations in exchange rates on our operations, see “Item 5. Operating and Financial Review and Prospects” and “Item 11. Quantitative and Qualitative Disclosures About Market Risk”.
B. Capitalization and Indebtedness
Not applicable.
C. Reasons for the Offer and Use of Proceeds
Not applicable.
D. Risk Factors
Changes in laws and government regulations could significantly impact our business
Many aspects of our business are subject to strict European, national and local regulations (e.g. licenses, permits, authorizations). This is particularly true in electricity transmission and distribution, transport and
4
distribution of natural gas and liquefied natural gas, water management, nuclear plant operation and maintenance, and waste collection and treatment. Regulatory changes can affect our pricing, margins, operations, strategy, financial condition and profitability.
Our businesses are also subject to many laws and regulations related to respect for the environment, health protection and safety standards. These relate particularly to air quality, water pollution, drinking water quality, the treatment of hazardous and non-hazardous waste, nuclear plant management, and soil contamination. A change or toughening of regulations can lead to additional costs or investments for us that we cannot guarantee will be covered by sufficient revenues. In such cases, we may have to close down an operation without any assurance of being able to offset the costs related to such a shutdown. Furthermore, to engage in these activities, we must obtain or renew various permits and authorizations from regulatory authorities – an often long, unpredictable and costly process. Despite the substantial expense of applying for such permits or authorizations, they may in the end not be granted, or be granted too late.
Finally, regulations require investments and operational outlays not just by us, but also by our customers, particularly concession-granting municipalities, to upgrade their facilities to regulatory standards. If the customer does not meet these obligations, the operator’s reputation may be damaged and its development capacity impaired.
We operate in increasingly competitive and evolving markets, which has increased pressure on our market share and may have a negative effect on our financial results
Most of our services are subject to strong competition both from large international competitors and, in a number of markets, also from small niche players. Electricity or gas industry deregulation in the European Union and in the United States has opened most markets to new competitors, which could have a significant negative effect on our sales prices, margins and our market share, particularly in Belgium. In the field of Environment, our various Water and Waste activities are also subject to strong competitive pressure both from international and local players, the effect of which may be lower prices for our services to industrial or municipal customers or both. Such decreases in prices could have a negative effect on our business, results of operations and financial condition.
We may be negatively affected by the decision of our local and municipal partners to terminate or modify partnership agreements
We develop many of our local operations in partnership with municipal governments or private local entities. These partnerships are one of the ways in which we share the economic and financial risks associated with certain large projects by limiting the capital we commit and enhancing our ability to adapt to specific local-market conditions. Such partnerships may also be required by local regulations.
Changes in project plans, local political and economic conditions, or a partner’s financial condition may result in the termination of a partnership, i.e. partners request dissolution of the joint venture or exercise a preemptive right. As a result, we may be required to increase our financial commitment on certain projects to maintain our interests in such projects or, in the event of conflict with a partner, to seek resolution in litigation or arbitration. Such events may have a material adverse effect on our business, results of operations or financial condition.
Failure by significant customers and suppliers to meet their contractual obligations could significantly impact our business
In our energy and environment operations, our subsidiaries frequently enter into contracts with municipal authorities or private local entities, the performance of which can depend on a few or even a single customer. This is the case, for example, in delegated water-management contracts, certain electricity production and sales operations involving medium and long-term power purchase agreements, and in the management of non-hazardous waste incinerators.
5
A customer’s refusal or inability to uphold its contractual obligations, particularly regarding rate adjustments, can compromise the economic equilibrium of the contracts and the profitability of investments we or our subsidiaries may have made. Although we usually negotiate contractual provisions requiring compensation for non-performance, full compensation is not always recoverable, which can materially adversely affect our gross revenue and net income. We are currently facing such situations in Argentina, the Philippines and Indonesia.
Likewise, in managing our sanitation plants, certain power plants and waste treatment units, we frequently depend on a limited number of suppliers for water, non-hazardous waste, various types of fuel and equipment. Any supply interruption or delay, even in breach of contract, can materially adversely affect a project’s profitability.
Our energy trading activity (including fuel procurement and power marketing) exposes us to risks associated with the fluctuation of energy prices, the participation in evolving markets, exposures to our counterparties and other factors that may have a negative effect on our financial results
We trade natural gas, electricity, crude oil and other petroleum products on the spot market and other competitive power markets. We also enter into derivative contracts and a variety of other instruments to purchase and sell natural gas, electricity, petroleum products and coal as part of our energy trading operations or for our own use. With respect to such transactions, our revenues and results of operations are likely to depend, in large part, upon prevailing market prices for power in our regional markets and other competitive markets. These market prices may fluctuate substantially over relatively short periods of time. As a result, our energy trading (including fuel procurement and power marketing) activities expose us to risks of commodity price movements. We attempt to manage our exposure through enforcement of established risk limits and risk management activities. These risk limits and risk management activities may not always be followed or may not work as planned and cannot always eliminate the risks associated with these activities. As a result, we cannot predict the impact our energy trading and risk management decisions may have on our business, results of operations or financial position.
Authorities that have jurisdiction over wholesale power rates in the United Sates, Europe and elsewhere, as well as independent system operators that oversee some of these markets, may impose price limitations, bidding rules and other mechanisms which may adversely impact or otherwise limit trading margins and lead to diminished opportunities for gain.
We are also exposed to the risk that counterparties to our energy trading contracts owing us money or energy will breach their obligations. Should the counterparties to these arrangements fail to perform, we may be forced to enter into alternative hedging arrangements or honor underlying commitments at then-current market prices that may exceed our contractual prices, which would adversely affect our results of operations and might result in losses. Although our estimates take into account the expected probability of default by a counterparty, we cannot predict our actual exposure to default by counterparties to these arrangements.
Revenues from markets outside North America and Europe represent a significant portion of our total revenues and our capital employed
Revenues from markets outside North America and Europe represented approximately 10% of our revenues and 25% of our capital employed in 2003. Our activities in these countries entail a higher degree of risks than in developed countries. In particular, these include GDP volatility, economic and governmental instability, changing regulations, nationalization or expropriation of private assets, collection difficulties, social unrest, significant fluctuations in interest and exchange rates, income and other taxes levied by foreign governments and local authorities, exchange control measures, and other unfavorable interventions and restrictions imposed by foreign governments. We have faced such difficulties in Argentina, the Philippines and Indonesia (see Item 4.B.).
6
Currency exchange rate fluctuations may negatively affect our results of operations
We hold significant assets and liabilities, earn income and pay expenses of our subsidiaries in US dollars and a variety of foreign currencies. Our Consolidated Financial Statements are presented in euro. Therefore, when we prepare our Consolidated Financial Statements, we must translate our assets, liabilities, income and expenses in currencies other than the euro into euros at applicable exchange rates. Significant currency fluctuations, such as those experienced in Argentina and Brazil in 2002 and with respect to the US dollar in 2003 may have an adverse effect on our results of operations and financial condition. For example, increases and decreases in the value of the euro will affect the value of these items in our Consolidated Financial Statements, even if their value has not changed in their original currency. For example, an increase in the value of the euro may result in a decline in the reported value, in euros, of our interests held in foreign currencies and a corresponding negative effect on our financial condition as presented in our Consolidated Financial Statements. Similarly, many of the commodities and other goods that we purchase as part of our operations are indexed in currencies other than euro, particularly in US dollars. Decreases in the value of the euro against other currencies, particularly the US dollar, can effectively increase the price we have to pay for these commodities, even if their price in the index currency does not change, which could have a negative effect on our financial condition.
Our business may be negatively affected by changes in interest rates
As of December 31, 2003, approximately 40% of our gross debt was under a variable rate and 60% under a fixed rate, after taking into account derivative instruments to hedge underlying exposures to changes in interest rates. We may have exposure to interest-rate variations in the future as any rise in interest rates increases the cost of our debt.
A decline in the market price of the shares of our non-consolidated companies could adversely affect our financial condition
We hold a portfolio of securities in non-consolidated public companies, the market value of which is dependent on stock market prices. It is not our policy to resort systematically to hedging to limit the economic risk arising from fluctuations in the price of these securities. Hedging is not always an option depending on the quantities of securities held and the liquidity of the hedging instruments. Some securities have been used to back bonds exchangeable into shares so that we could benefit from the attractive terms of such financings. A consistent drop of 10% in the price of the companies held would result in an exceptional charge of approximately € 32 million, and an increase of 10% would result in a write-back of provisions of approximately € 41 million.
Exposure to specific environmental regulations, environmental risks generally and malicious acts may negatively affect our financial situation
Facilities that we own or manage for local industrial and municipal third parties pose risks to the natural environment – air, water, soil – as well as risks to the health of consumers, employees and subcontractors. These health and environmental risks are subject to strict and precise national and international regulations and regular audits by government authorities. Six of our sites in the European Union are Seveso “High Tier” sites, whose activities include chlorine solvent incineration, hazardous industrial waste treatment and underground natural gas storage.
In the course of our business, we handle or generate dangerous products or by-products, such as fissile materials, fuels, and certain chemical byproducts of water treatment. Some of our waste facilities have industrial and medical waste treatment operations that may be potentially toxic. A waste treatment permit for any given facility would be at risk in case of reception and treatment of a waste that is non-compliant with regulations applicable to that facility.
Evolving regulations covering environmental responsibility make it difficult to assess risks related to our past activities, particularly in the case of closed landfills. Even where past activities complied with regulations in
7
force when they were in operation, the conditions created by such past activities may nonetheless be a source of pollution to the natural environment in the future, and may be subject to retroactive regulation or litigation.
In waste management, the gaseous emissions of concern are greenhouse gases, precursors of acid rain, noxious gases, and dust. In the water business, the primary potential air pollutants are chlorine and gaseous by-products resulting from accidental releases of water treatment by-products. In addition, waste treatment and sewage treatment operations can create odor problems.
Potential impacts of activities on water in the natural environment include leachates from poorly controlled landfills, the release of heavy metals into the environment, and aqueous effluent discharges from systems for treating the fumes from incineration facilities. These various emissions can pollute groundwater and waterways.
Sewage treatment plants discharge treated water into the natural environment. It is possible that this water may not meet discharge standards in terms of its organic, nitrogen and phosphorus content. Also, some of the facilities we manage are not equipped to treat rainwater. In case of heavy rains, the water collected is entirely or partially discharged into the natural environment without being treated. This can degrade the quality of water used for swimming and recreation or shellfish farming. The operator cannot be held liable for such pollution, except insofar as it demonstrably failed to properly manage the facilities under its management.
Soil pollution issues include the storage of hazardous products and liquids, leaks during processes that use hazardous liquids, and sludge storage and surface spreading.
We also face external risks such as lightning, drought, flooding, earthquakes and land slides that could damage or destroy our installations and result in damage to the environment. In addition our production and distribution installations in the areas of energy and water could be the targets of terrorist or other malicious acts. The occurrence of any of these or similar events would negatively affect our business, results of operations and financial condition.
Our activities are likely to be covered by stricter national and international standards relating to climate change and related costs may negatively affect our financial position
Particularly in electrical power generation and waste treatment and waste recycling, we are engaged in activities that come under national, international and European Union climate change programs established pursuant to the Kyoto Protocol. Since none of the elements that would enter into quantifying the impact of the “carbon constraint” can be estimated with sufficient accuracy, the risk it represents cannot yet be quantified either. This uncertainty, however, should disappear once rules on how the “carbon market” will operate are formalized. Once formalized, we may have to incur significant costs to comply with these rules which could have a negative impact on our business, results of operations and financial condition.
We may incur substantial liability from our ownership and operation of nuclear facilities
We own and operate nuclear power facilities in Belgium for the production of electric power. Risks of substantial liability arise from the ownership and operation of nuclear facilities, including mechanical or structural problems at a nuclear facility, the storage, handling and disposal of radioactive materials, and uncertainties with respect to the technological and financial aspects of decommissioning nuclear facilities at the end of their useful lives. In addition, if the Belgian government were to discontinue the use of nuclear power facilities for the production of energy, that decision would also adversely affect our business, results of operations and financial condition.
8
ITEM 4. INFORMATION ON THE COMPANY
A. History and development of SUEZ
SUEZ was formed in June 1997 by the merger of Compagnie de Suez and Lyonnaise des Eaux. At that time Compagnie de Suez, which had built and operated the Suez Canal in Egypt until its nationalization in 1956, was a highly diversified holding company with operating units in financial services and energy, largely in Belgium and France. Lyonnaise des Eaux was a diversified company, with water, waste services, construction, communications, and on-site technical management services, largely in France, but with significant international activities.
We are a société anonyme, a joint stock company, established under French law until December 31, 2040. We are governed by the French Business Code and décret no. 67-236 of March 23, 1967. We are registered in the Registre du Commerce et des Sociétés de Paris, the Commercial and Companies’ Register of Paris, under reference number SIREN 542 062 559 R.C.S. Paris. Our registered office is at 16, rue de la Ville l’Evêque, 75008 Paris, France, telephone 33-1 40 06 64 00. Our agent for U.S. federal securities law purposes is Tim Dunne, General Counsel, Tractebel North America, Inc., 1990 Post Oak Boulevard, Suite 1900, Houston, Texas 77056.
B. Business overview
VISION AND STRATEGY
We provide services that meet the essential needs of a diversified clientele. In keeping with our announced intentions at the time of the merger in 1997, SUEZ has evolved from a conglomerate to a global industrial group promoting sustainable development and offering a comprehensive range of solutions in the energy and environment sector, water and waste services, for companies, individuals and municipalities.
We develop, design, implement, and operate systems and networks in each of these areas to meet the needs of our customers, whether they are companies, municipalities, or individual customers. We aim to provide our customers with the customized and innovative solutions they expect.
Our development is sustained by the diversity of our services, which benefit from our expertise, our long experience and extensive client base, our financial flexibility resulting from recurrent cash flow, and by our international network.
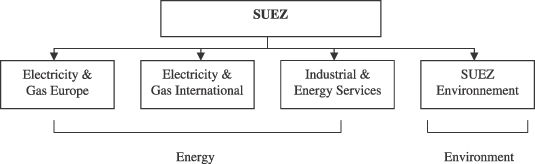
In each of our two major business areas, Energy and Environment, we enjoy leading positions:
| • | In Energy, we are a leading energy player with expertise in every phase of the value chain, whether electricity generation and supply, energy trading as a support activity, transmission, distribution and sale of electricity and natural gas, or related services such as cogeneration plant construction, on-site technical maintenance, complex systems management, and project engineering. |
| • | In Environment, we are one of the world’s leading companies in water-related services. We design and manage production and distribution systems for drinking water and sanitation, engineer sanitation facilities, and provide a broad range of industrial water-related services. We are also among the world’s leaders in waste services, serving municipal and business customers. We are experienced in every facet of the business, from waste collection and sorting to recycling, incineration and landfill disposal, and can handle most categories of both non-hazardous and hazardous waste. The merger of our water and waste services activities in 2002 led to the formation of SUEZ Environnement in May 2003. Following the sale of Ondeo Nalco, a world leader in industrial water treatment services, in September 2003, the activities of its subsidiary, Ondeo Industrial Solutions, which specialized in onsite operations and maintenance of industrial process water treatment, will be integrated into SUEZ Environnement in 2004 to supplement its range of services. |
9
We believe that our diversified clientele provides a constant source of business, with an organic growth potential greater than the rate of growth in GDP, depending on economic conditions. We target two main customer segments:
a) Municipal and individual customers
The use of the private sector is growing in three significant ways: partly at the pace of market deregulation, partly because public authorities are becoming increasingly aware of the limited nature of their resources and specialized expertise, and partly because of stricter environmental regulations in the case of waste services. This reliance on private operators can take the form of privatization, concessions, or operation and maintenance contracts. For numerous municipalities and international institutions, reliance on private sector providers is synonymous with greater efficiency, in the form of prices which better reflect economic reality, higher quality service, and the ability to serve a greater number of people.
Management believes there is strong long-term development potential for this market. In the energy sector, continuing deregulation in Europe will give us access to all residential customers from January 1, 2007. In the environmental sector, the scope of delegation of water-related services to the private sector is currently limited and we expect it to grow. Our presence in Europe and internationally places us in a sound position to meet the major long-term needs of our municipal and individual customers. The business model we offer is based on a partnership between us and the public authority, with a clear distribution of responsibilities. In this public/private partnership model, we are not the owner of the water resource, but are entrusted for the term of the contract with responsibility for the infrastructure, maintenance and, frequently, development of the water source for the benefit of the whole population. If ways can be found to avoid having the private operator take too great a share of the risk and to ensure that public authorities are in a position to honor their contractual commitments, particularly with respect to rates, the private sector can potentially play an increasingly important role in the management of public water resources. Because these conditions are not currently completely met, private operators, such as ourselves, have been forced to reduce levels of investment in order to limit our risk.
b) Business customers
The sale of Ondeo Nalco in September of 2003 does not diminish the importance of business customers to our current activities. The deregulation of the energy market potentially offers new opportunities. Industrial and service sector companies often seek custom-tailored solutions in areas of our expertise.
We offer:
| • | basic products and services (electricity, natural gas, water, waste management); |
| • | a wide array of specialized services, including hazardous industrial waste treatment, design and installation of sanitation plants and electrical and mechanical installations, and climate engineering; and |
| • | industrial on-site management services, from maintenance to complex outsourcing operations involving transfers of human resources and capital assets. |
We expect that the company services market will continue to grow in the coming years. The pace of growth will be determined by the strength of national economies. Strong trends in outsourcing include a gradual move from simple, maintenance-type services to more complex ones, such as facilities management, full water cycle management, and waste management. In addition, there is a growing expectation for service providers such as us to make commitments on results, not just on means, as well as the sharing or transfer of all or part of the industrial risk. Our international presence permits us to offer multi-site, mono-service, or even multi-service contracts, in accordance with customer needs. Such contracts could include, for example, ultra-pure water supply (Ondeo), electricity, natural gas and heating (EGI and EGE), incineration and waste treatment (SITA), and facilities management and management of on-site cogeneration facilities (Elyo).
10
In 2003, we streamlined our cross-business structures servicing industrial customers. We maintained a specific coordinating structure focusing on industrial customers, while making organizational changes to increase the involvement of our operating units.
Implementation of the 2003-2004 action plan
The period between 1997 and 2001 was characterized by sustained international expansion in our Energy and Environment activities and by the establishment of a platform for the future development of our businesses. Still, this growth was accompanied by an increase in our gross borrowings less marketable securities and cash and cash equivalents (“net debt”) which by the end of 2001 had reached €28 billion. Anticipating a weakened and uncertain economic climate for the period 2003-2004, we focused our strategic priorities on strengthening our financial position and consolidating our Energy and Environment businesses.
These priorities led to the development of an action plan for 2003-2004 which was announced on January 9, 2003 and whose objectives were:
| • | Enhanced and strengthened profitability resulting in improvements in return on capital employed (ROCE) and both cash flow and free cash flow1 generation of energy and environment activities, and by a reduction in exposure to emerging countries. |
| • | A one-third reduction in our debt by the end of the plan, and complete self-financing of each operating unit of its investments and dividend payments by 2004. |
To achieve these objectives, our action plan included five components:
(1) Continued debt reduction
Our asset disposal program was intended to reduce debt and enhance profitability, and focused not only on non-strategic assets but also on certain Energy and Environment assets in favor of activities offering a better risk/return ratio as well as improved cash flow generation. See Item 8.B. “Significant Changes”.
Our sale of Ondeo Nalco, which was completed on November 4, 2003 for $4.35 billion helped improve our financial structure and we expect it to help improve our return on capital employed, as we do our decision to gradually dispose of all of our Communication assets as part of our policy to focus on Energy and Environment.
The goal to reduce net debt by a third was exceeded in the year as a result of implementing the disposal plan. In 2003, we sold €7.8 billion of financial assets and the deconsolidation of entities sold reduced debt by €2.1 billion. The sales involved assets in the Environment sector (75% of Northumbrian, 100% of Ondeo Nalco and CESPA), certain non-strategic holdings (Fortis, Axa, Total, Vinci), and several assets in the Communications sector in Belgium (Coditel and Codenet). As a result, our net debt was reduced from €26 billion as of December 31, 2002 to €15 billion as of December 31, 2003. See Note 16 to our Consolidated Financial Statements. This debt reduction policy resulted in the recognition of losses, which explain a significant portion of our exceptional loss for the year (€2.8 billion). In addition, the sale of certain assets changed the scope of consolidation and had an impact on our income from operations.
(2) Improved profitability
We seek to reduce overhead and operating expenses though our “Optimax” program. Our objective was to save approximately €500 million in 2003. The savings actually achieved through our Optimax program in 2003 totaled €585 million, exceeding the target of €500 million for the full year set in January 2003.
1 Cash flow minus maintenance capital expenditures, plus or minus changes in working capital needs.
11
(3) Establishment of a more integrated organizational structure
Our corporate structure was simplified with the merger on October 31, 2003 of Société Générale de Belgique and Tractebel, which formed SUEZ-TRACTEBEL, and with the creation of a single headquarters (in Paris and Brussels). Continuing uncertainties regarding the legislative and regulatory environment for gas activities in Belgium and Europe, rapid changes in international gas markets where we nonetheless gained strong positions, and progress achieved in generating synergies within the Group led to the decision not to pursue the study, begun in 2002, to transfer the service and gas entities of SUEZ-TRACTEBEL to Electrabel. Moreover, the disposal of Ondeo Nalco and the plans to integrate Ondeo Industrial Solutions (OIS) in SUEZ Environnement have resulted in an organization centered around our two business segments of Energy and Environment, carried on by four operating divisions.
(4) Slowing the pace of investments
We seek to reduce our investment and place our business branches in a position to self-finance their development. To achieve these objectives, more demanding cash flow requirements and risk limitation standards, particularly in the area of foreign exchange, were added to the existing criteria for the selection of capital expenditures.
Consistent with the action plan target of reducing investment to an average of €4 billion per year for 2003-2005 period, our total expenditure on tangible, intangible and financial investments was €4.3 billion for 2003 (see our Consolidated Statements of Cash Flows).
(5) Reduce risk exposure
We seek to reduce our exposure to the risks of operating in developing countries and to focus our activities on more stable core markets (European Union and North America).
Our exposure to the risks of developing countries has been reduced. At December 31, 2003, the capital employed in these countries was €6.2 billion compared with €7.9 billion at the end of the previous fiscal year.
12
Business activity growth despite a depressed international economic climate
Despite the year’s difficult economic picture, we continued to grow organically in 2003, with an organic growth rate in revenues of 6.1%,2 slightly higher than the increase achieved in 2002. Group revenues were €39.6 billion in 2003, of which Energy represented 67%, and Environment 31%.
| | | | | | | | | | | | | | | |
| | | 2003
| | | 2002(*)
| | | 2001(*)
| |
| | | (in € millions, except percentages) | |
Energy | | 26,635 | | 67 | % | | 24,242 | | 59 | % | | 26,374 | | 62 | % |
Environment | | 12,310 | | 31 | % | | 15,897 | | 39 | % | | 15,374 | | 36 | % |
Other | | 677 | | 2 | % | | 644 | | 2 | % | | 611 | | 2 | % |
| | |
| |
|
| |
| |
|
| |
| |
|
|
Group total | | 39,622 | | 100.0 | % | | 40,784 | | 100.0 | % | | 42,359 | | 100.0 | % |
| (*) | Fiscal year 2002 revenues are presented to reflect the change in presentation of energy trading activities. By contrast, the revenues for fiscal year 2001 are presented according to the method applicable prior to January 1, 2003 (see Note 1-O to our Consolidated Financial Statements). |
Organic growth for Energy activities was 7.3%3, while organic growth for Environment activities was 3.7%3. In Energy, Europe (EGE), which remains our most important market, recorded organic revenue growth at approximately 4%3 in 2003, due primarily to the optimization of production equipment, an increase in our contract portfolio and growth in electricity and gas sales outside Belgium. We believe the modest rate of growth was due primarily to the slowdown in the European economy, as Euro Zone countries experienced an average rate of growth of only 0.4% in 2003. In 2003 activities outside of Europe (EGI) recorded particularly strong organic growth at 39.7%3, due primarily to the commissioning of new plants and the increase in liquefied natural gas (LNG) sales in the United States. In Environment, organic growth was due primarily to the success of European operations in the water sector, mainly in France, due to exceptionally hot weather conditions during the summer.
While our activity is worldwide, Europe remains our largest market. In 2003, 80% of the our revenues were generated in Europe, to which the major contributors were France and Belgium with 54%. The proportion of revenues generated in Europe and North America continues to increase, and was 90% of total Group revenues in 2003 compared to 88% in 2002.
The table below summarizes consolidated revenue and profitability trends for the past three years.
| | | | | | | | | |
| | | 2003
| | | 2002
| | | 2001
| |
| | | (in € millions) | |
Revenues | | 39,622 | | | 40,784 | (*) | | 42,359 | (*) |
Net income (loss), Group share | | (2,165 | ) | | (863 | ) | | 2,087 | |
Gross Cash flow (1) | | 3,727 | | | 4,857 | | | 4,817 | |
Net debt (2) | | 14,991 | | | 26,006 | | | 28,009 | |
| (*) | Fiscal year 2002 revenues are presented to reflect the change in presentation of energy trading activities. By contrast, the revenues for fiscal year 2001 are presented according to the method applicable prior to January 1, 2003 (see Note 1-O to our Consolidated Financial Statements). |
| (1) | See “Item 5.B. Operating and Financial Review and Prospects – Liquidity and Capital Resources” |
| (2) | Gross borrowings less marketable securities and cash and cash equivalents. |
2,3 Revenue or gross operating income (“GOI” or “segment profitability”) organic growth is a non-GAAP measure which excludes the effects of acquisitions and disposals, exchange rate variations, gas price variations and Puerto Rico, the withdrawal from which was announced on January 13, 2004. For further discussion of this non-GAAP measure see “Item 5. Operating and Financial Review Prospects – Results of Operations – 2003 to 2002” for a reconciliation of organic growth.
13
We had a net loss of €2,165 million in 2003, which reflects non-recurring expenses resulting in part from the disposal of assets under the action plan (described above) and write-downs on certain assets in the Communications, Water and Waste Services sectors, as well as costs related to restructuring and the termination of unprofitable contracts.
However, the operating profitability of our activities has resisted this subdued economic context. Organic growth in Energy gross operating income was particularly strong at 8.3%,1 primarily attributable to the performance of EGE gas activities, the start-up of new facilities abroad, and the performance of our liquefied natural gas (LNG) operations. In Environment, organic growth in gross operating income was equally significant (up 3.8%1 for SUEZ Environnement), due primarily to Water and Waste Services in Europe, especially in France.
2004-2006 strategic priorities
2003 was a year of transition that allowed us to improve our results from financial investments and to redefine the scope of our activities. We are now refocused on our two businesses of Energy and Environment. The sale of our holdings in the Communications sector, initiated in 2003, continued, with the February 2004 sale of 29.2% of M6, with the signing of an agreement with United Global Com (UGC) for the sale of Noos in March 2004 and with the conclusion of the sale of Paris Première to M6 in May 2004.
In this context, the strategic business priorities for the period 2004-2006 are to continue our efforts to increase our operating profitability and generate cash in our two core businesses of Energy and Environment by implementing a strategy that primarily focuses on organic growth.
Our primary objectives are to achieve:
| | • | Average organic growth in revenue and gross operating income of between 4% and 7% per year. |
| | • | Growth in results and profitability with the return to positive net income in 2004 and a target of 11% ROCE (Return On Capital Employed) in 2006. |
| | • | Continued improvement in cash generation, with the objective of self financing all capital expenditure and dividends by 2005. |
In this context the main strategic objectives of our four operating business lines for 2004-2006 are as follows:
a) Electricity & Gas Europe (EGE)
| | • | Maintain a leading position and defend margins in the Benelux countries by giving priority to customer relations and reinforcing the competitiveness of the production facilities. |
| | • | Develop gas/electricity convergence. |
| | • | Continue commercial growth and targeted investments in priority markets such as France, Italy, and the Iberian Peninsula. |
b) Electricity & Gas International (EGI)
| | • | Give priority to organic growth in the four key EGI positions (the United States, Brazil, Thailand, and LNG) and in countries in which the growth in energy demand should be strong. |
14
| | • | Concentrate on sales activities with commercial and industrial customers. |
| | • | Continue the policy of rotating capital expenditure around EGI strong points. |
| | • | Maintain a balanced portfolio management plan to achieve optimum risk/profitability performance. |
c) Industrial & Energy Services (SEI)
| | • | Give priority to the consolidation of positions, organic growth, and the profitability of Tractebel Energy Services by developing commercial synergies with EGE. |
| | • | Reorganize Fabricom to restore profitability. |
| | • | Focus the activities of Tractebel Engineering on support for Energy and Services. |
d) SUEZ Environnement
| | • | Give priority to targeted profitable organic growth in Europe, developing the Group’s technical and commercial strengths in the context of stricter environmental legislation. |
| | • | Outside Europe, maintain strict selectivity in capital expenditure and improve profitability and financial results for less high-performance assets. |
Organizational Structure
The following is a simplified list of our major subsidiaries and our percentage of ownership interest as of December 31, 2003.
| | | | | | | | | | | |
Segment
| | Division
| | Activity
| | Subsidiary
| | Country
| | Ownership
| |
Energy | | | | | | SUEZ-TRACTEBEL | | Belgium | | 100.00 | % |
| | | Electricity & Gas Europe | | Electricity and gas in Europe | | Compagnie Nationale du Rhône | | France | | 24.00 | % |
| | | | | | | Energie du Rhône | | France | | 34.29 | % |
| | | | | | | Distrigas | | Belgium | | 46.83 | % |
| | | | | | | Dunamenti | | Hungary | | 37.50 | % |
| | | | | | | Electrabel | | Belgium | | 50.12 | % |
| | | | | | | Electrabel Customer Solutions | | Belgium | | 48.02 | % |
| | | | | | | Electrabel Nederland NV | | Netherlands | | 50.12 | % |
| | | | | | | Elia/Elia System Operator | | Belgium | | 32.10 | % |
| | | | | | | Fluxys | | Belgium | | 46.83 | % |
| | | | | | | Polaniec | | Poland | | 50.12 | % |
| | | | | | | Rosen | | Italy | | 49.87 | % |
| | | | | | | ACEA Electrabel SPA | | Italy | | 20.35 | % |
| | | | | | | ACEA Electrabel Produzione SPA | | Italy | | 35.24 | % |
| | | | | | | ACEA Electrabel Trading SPA | | Italy | | 25.06 | % |
| | | | | | | ACEA Electrabel Energia SPA | | Italy | | 20.35 | % |
| | | | | | | ACEA Electrabel Elettricita | | Italy | | 20.35 | % |
| | | Electricity & Gas International | | Electricity and gas outside Europe | | Glow SPP Public Cy Ltd | | Thailand | | 99.01 | % |
| | | | | | | Glow IPP Co Ltd | | Thailand | | 94.04 | % |
15
| | | | | | | | | | | |
Segment
| | Division
| | Activity
| | Subsidiary
| | Country
| | Ownership
| |
| | | | | | | Hanjin City Gas Co Ltd | | South Korea | | 75.00 | % |
| | | | | | | Tractebel North America Inc. | | USA | | 100.00 | % |
| | | | | | | Tractebel LNG NA | | USA | | 100.00 | % |
| | | | | | | Tractebel LNG Ltd | | United Kingdom | | 100.00 | % |
| | | | | | | Tractebel Energia SA | | Brazil | | 78.32 | % |
| | | | | | | Colbun SA | | Chile | | 29.21 | % |
| | | | | | | ElectroAndina SA | | Chile | | 33.25 | % |
| | | | | | | Edelnor SA | | Chile | | 27.38 | % |
| | | | | | | Gulf Total Tractebel Power Co | | UAE | | 20.00 | % |
| | | | | | | Baymina Enerji AS | | Turkey | | 95.00 | % |
| | | Industrial & Energy Services | | Industrial and energy services | | Axima Contracting & Refrigeration | | Belgium | | 100.00 | % |
| | | | | | | Endel | | France | | 99.99 | % |
| | | | | | | Fabricom GTI | | Belgium | | 100.00 | % |
| | | | | | | GTI | | Netherlands | | 100.00 | % |
| | | | | | | Ineo | | France | | 99.99 | % |
| | | | | | | Axima Services | | Belgium | | 100.00 | % |
| | | | | | | Elyo | | France | | 99.99 | % |
| | | | | | | Tractebel Engineering | | Belgium | | 100.00 | % |
Environment | | SUEZ Environnement | | Water | | Agbar | | Spain | | 25.79 | % |
| | | | | | | Aguas Andinas | | Chile | | 32.12 | % |
| | | | | | | Aguas Argentinas | | Argentina | | 46.30 | % |
| | | | | | | Aguas do Amazonas | | Brazil | | 100.00 | % |
| | | | | | | ASIM (LISCO) | | Mexico | | 50.00 | % |
| | | | | | | Bogotana de Aguas | | Colombia | | 100.00 | % |
| | | | | | | Eurawasser | | Germany | | 100.00 | % |
| | | | | | | Lydec | | Morocco | | 60.27 | % |
| | | | | | | Lyonnaise des Eaux France | | France | | 100.00 | % |
| | | | | | | Northumbrian Water | | United Kingdom | | 25.00 | % |
| | | | | | | Ondeo Degrémont | | France | | 100.00 | % |
| | | | | | | Ondeo de Puerto Rico | | Puerto Rico | | 100.00 | % |
| | | | | | | PALYJA | | Indonesia | | 95.00 | % |
| | | | | | | Macao Water (SAAM) | | Macao | | 42.50 | % |
| | | | | | | United Water (UWR) | | United States | | 100.00 | % |
| | | | | | | WSSA | | South Africa | | 50.00 | % |
| | | | | Waste services | | Ate-Geoclean | | France | | 100.00 | % |
| | | | | | | CLIBA | | Argentina | | 45.00 | % |
| | | | | | | Novergie | | France | | 98.68 | % |
| | | | | | | Scori | | France | | 65.98 | % |
16
| | | | | | | | | | | |
Segment
| | Division
| | Activity
| | Subsidiary
| | Country
| | Ownership
| |
| | | | | | | SITA Australia | | Australia | | 60.00 | % |
| | | | | | | SITA Belgium | | Belgium | | 100.00 | % |
| | | | | | | SITA Canada | | Canada | | 100.00 | % |
| | | | | | | SITA Deutschland | | Germany | | 100.00 | % |
| | | | | | | SITA Finland | | Finland | | 75.00 | % |
| | | | | | | SITA France | | France | | 99.90 | % |
| | | | | | | SITA Nederland | | Netherlands | | 100.00 | % |
| | | | | | | SITA Polska | | Poland | | 100.00 | % |
| | | | | | | SITA Sverige | | Sweden | | 75.00 | % |
| | | | | | | SITA UK | | United Kingdom | | 100.00 | % |
| | | | | | | Swire SITA | | Hong Kong | | 50.00 | % |
| | | | | | | Teris | | France | | 100.00 | % |
| | | | | | | Teris LLC | | United States | | 100.00 | % |
| | | | | | | VEGA (VEA) | | Brazil | | 100.00 | % |
| | | | | | | Wasteman | | South Africa | | 29.95 | % |
| | | | | Industrial services | | Ondeo Industrial Solutions (*) | | France | | 100.00 | % |
Other Interests | | Communications | | TV media | | M6 | | France | | 34.64 | % |
| | | | | | | Paris Première | | France | | 93.03 | % |
| | | | | High-output distribution | | Noos | | France | | 50.10 | % |
| | | Finance | | Fund Management | | SI Finance | | France | | 100.00 | % |
| (*) | Integration in SUEZ Environnement planned for 2004. |
ENERGY
Organization and key figures
In the following table, gross operating income represents our measure of segment profitability. For a reconciliation to our consolidated operating income, see Note 22 to our Consolidated Financial Statements. Capital employed represents our measure of segment assets. It is reconciled to total assets in Note 22 to our Consolidated Financial Statements.
| | | | | | | |
| | | Year ended
|
| | | Dec. 31, 2003
| | Dec. 31, 2002
| | | Dec. 31, 2001
|
| | | (in € millions, except employee data) |
Revenues | | 26,635 | | 24,242 | (*) | | 26,374 |
Gross operating income | | 4,001 | | 4,125 | | | 4,331 |
Capital employed | | 15,890 | | 17,513 | | | 21,382 |
Number of employees | | 89,000 | | 88,800 | | | 84,400 |
| (*) | The 2002 revenue figure is published after offsetting energy trading revenues of €5,306 million. See Note 1-O to our Consolidated Financial Statements. |
17
We are present throughout the world in the energy and services markets. Our core Energy activities are electricity and natural gas, which include production of electric power, energy trading, the management of transmission and distribution networks, as well as sale of electricity and natural gas. The complementary nature of our activities enables us to offer our customers other directly related services which include technical installations, energy and industrial services and engineering.
Our operations in the electric power and natural gas markets and the services sector are conducted through the following three operation divisions:
a) Electricity & Gas Europe:
Electricity & Gas Europe (EGE) conducts its electric power and natural gas related activities through subsidiaries and affiliates. The most important are:
| • | Electrabel (50.12%-owned at December 31, 2003) for electricity production, trading, sales and distribution networks and Elia (32.1%-owned at December 31, 2003) for electricity distribution. |
| • | Distrigas and Fluxys, created as a result of the separation of Distrigas’ distribution and gas trading operations (our ownership in these companies totaled 46.83% at December 31, 2003). |
| • | Electrabel, Distrigas and Fluxys are listed on Euronext Brussels. |
The activities of EGE represented approximately €12.7 billion in revenue in 2003 and employed approximately 16,600 people.
b) Electricity & Gas International:
Electricity & Gas International (EGI) is responsible for the worldwide energy and services activity outside of Europe.
EGI’s principal subsidiaries are:
| • | Tractebel North America (TNA), a wholly-owned subsidiary in Houston, which operates all of EGI’s energy activities in the USA, Canada and Mexico, including the facilities for the regasification of LNG. |
| • | Tractebel Energia, a listed company owned 78.32% by us as of 31 December 2003, is responsible for EGI’s electric power production activities in Brazil. |
| • | Glow and Coco, owned respectively 94.04% and 99.01% by us as of December 31, 2003, manage EGI’s interests in electricity generation in Thailand. |
Tractebel LNG, a wholly-owned subsidiary located in London and Luxembourg, is responsible for short-term LNG operations, the coordination of transport and supplies and the management of EGI’s interest in liquefaction projects worldwide.
EGI’s operations represented approximately €4.5 billion in sales in 2003 and employed approximately 4,300 people.
c) Industrial & Energy Services:
ThroughIndustrial & Energy Services (IES), we offer integrated energy services and products to our customers and are a leading provider of industrial installation and maintenance services as well as in energy-related services.
18
IES provides these services through three entities:
| • | Fabricom, which generally provides short-term electrical and mechanical facility services for large projects, intended primarily for industrial companies, consists of Fabricom GTI in Belgium (with operations in Norway, England, Spain, and certain eastern European countries), GTI in the Netherlands, Ineo and Endel in France and Axima Contracting & Refrigeration which is primarily active in Belgium, France, Germany, Austria, Switzerland, Spain and England. |
| • | Tractebel Energy Services (TES) covers all of the management/maintenances services, management of heating and cogeneration facilities, management of local energy distribution networks and facilities management, intended for both the industrial and services sectors, local municipalities, and the residential sector. These services are generally covered by long-term contracts. TES offers a continuum of services and solutions that range from managing local energy networks (distribution of electricity and urban heating) to managing utilities on industrial sites, including the management and maintenance of technical and heating equipment and facilities management. The entities involved are Elyo and Axima Services. |
| • | Tractebel Engineering is responsible for engineering activities throughout the world, but a large proportion of its services are performed in Europe. |
IES activities represented approximately €9.4 billion in revenue in 2003 and employed approximately 68,100 people.
19
Strategy
We have established a strategy that aims to benefit from our competitive advantages rather than seeking merely to develop in size. Our principal advantages are:
| • | cost-competitiveness in production, on account of our flexible and efficient generating facilities; |
| • | ability to profit from synergies through electric power and natural gas convergence; |
| • | global dimension with operations in more than 100 countries; |
| • | expertise in trading and marketing electric power and natural gas, backed by significant production capacities (more than 50 GW worldwide, excluding capacities under development but including contracted capacity and plants under construction); |
| • | experience and manifold customer references in the energy and industry services sectors (through Fabricom, TES and Tractebel Engineering). |
This business strategy aims to exploit these advantages to a maximum within the following framework:
In Europe:
| • | defend EGE’s leadership position in the Benelux area; |
| • | consolidate the position of Distrigas in the European Union by maintaining a market share of at least 5% in the expanding European market, despite faster deregulation and slower growth in demand in Belgium; and |
| • | develop business in France, Italy and the Iberian peninsula. |
Outside Europe:
| • | extend electric power and natural gas synergies in regions as well as between regions, including by developing LNG activity; |
| • | develop activities around existing positions to take advantage of local expertise and maximize synergies with current operations; |
| • | balance positions taking into account developing countries risks as well as commercial risks; and |
| • | concentrate on sales to commercial and industrial customers. |
To achieve these goals, EGI, EGE and IES are working within the framework of a business model which seeks to achieve the best balance between physical assets such as electric power stations or liquified natural gas terminals and sales positions. Residual or possible temporary imbalances are managed by access to the market through our portfolio management and trading functions.
Significant Events
Electricity & Gas Europe
| | |
January 2003 | | • Launch of Berge Boston, a 138,000m3 methane tanker for shipping LNG (liquefied natural gas), owned jointly by the Norwegian ship-owner Bergesen (51%) and Distrigas S.A (49%). The ship is chartered by Tractebel LNG North America LLC. |
20
| | |
February 2003 | | Belgium |
| |
| | | • On February 28, 2003, Electrabel and the public producer SPE terminated by mutual agreement their industrial partnership for CPTE, creating an independent producer on the Belgian Market with a capacity of 1,600 MW. |
| |
March to October 2003 | | Italy |
| |
| | | • Electrabel strengthened its holdings in Acea, a leading company in the Italian electricity and water market, majority controlled by the City of Rome (51%), to bring the Group’s total stake to 2.6%. This stake consolidates the strategic cooperation agreement signed in 2002 in the electricity trading, marketing, and production segments. |
| |
May 2003 | | France |
| |
| | | • Since May 1, Electrabel has purchased all of the electricity output (773 MW produced by 49 hydroelectric plants) of Société Hydroélectrique du Midi (SHEM) as well as managing its generation operations. SHEM’s peak capacity is a valuable supplement to the energy that Electrabel sells within Energie du Rhône. |
| |
June 2003 | | Belgium |
| |
| | | • In June 2003, Electrabel inaugurated its first wind facility in Wallonia. This is the company’s largest wind facility in Belgium in terms of installed power (8 MW). |
| |
July 2003 | | Belgium |
| |
| | | • Between July 4, 2003 and January 16, 2004, within the framework of the electricity distribution operations and the separation of network management activities from sales to eligible customers, the Competition Board approved Electrabel’s acquisition of the sales operations to eligible customers in the mixed inter-municipal entities in Wallonia and Flanders. These activities are performed within an ad hoc legal vehicle controlled by Electrabel: Electrabel Customer Solutions. |
| |
| | | • The first mixed inter-municipal entities were officially designated as Distribution Network Managers (GRD) for their respective territories. |
| |
August 2003 | | Poland |
| |
| | | • Electrabel increased its interest in the Polaniec electric plant by 38.96% at the end of December 2002, and further increased its interest to 100% at the end of August 2003. |
| |
| | | Belgium |
| |
| | | • Fluxys LNG began negotiations with shippers interested in obtaining capacity at the LNG terminal in Zeebrugge after 2006. As a result, it may be necessary to double the terminal’s capacity. |
| |
November 2003 | | • Fluxys and GTS (the transport branch of Gasunie) reached an agreement for the industrial participation of Fluxys in the project to construct a gas pipeline that would connect Balgzand (Netherlands) to Bacton (United Kingdom) and be in service in 2006-2007. |
21
| | |
| | | Portugal |
| |
| | | • Generg, Electrabel’s Portuguese subsidiary (42.5% owned by the Group) commissioned a wind farm with a total capacity of 13MW in Vergao (northeast of Lisbon). This project is part of a general development plan in Portugal for 450 MW. |
| |
December 2003 | | Belgium |
| |
| | | • Electrabel, which had agreed to make available the equivalent of 1,200 MW of production capacities on the Belgian market for potential buyers, organized the first capacity auctions for 250 MW. |
| |
| | | France |
| |
| | | • Electrabel finalized the acquisition of shares in the Compagnie Nationale du Rhône (CNR) held by EDF, and acquired the CNR shares held by the Chamber of Commerce and Industry for Villefranche and Beaujolais. Following these transactions, Electrabel holds 47.88% of the capital of CNR. All these operations give Electrabel the resources to continue to develop on the French market and strengthen the strategic cooperation agreement between Electrabel and CNR. |
|
| Electricity & Gas International |
| |
January 2003 | | Thailand |
| |
| | | • The Bowin electrical power plant began commercial operation to provide a total capacity of 713 MW to EGAT (Electricity Generating Authority of Thailand). |
| |
February 2003 | | Mexico |
| |
| | | • Tractebel Mexico inaugurated a new power plant for the cogeneration of 245 MW in the city of Monterrey. Energy will be provided to 38 industrial facilities under 15-year supply contracts. |
| |
May 2003 | | Abu Dhabi |
| |
| | | • Inauguration of the power production and water desalination plant in Al Taweelah, which totals 1,360 MW of electrical capacity and 385,000 m3 of water per day. The facility represents approximately 25% of the total production of electricity and water for the Emirate. |
| |
June 2003 | | United States |
| |
| | | • Tractebel LNG North America LLC, operator of the first LNG import terminal in the United States, in Everett, Massachusetts, and the ship-owner Bergesen announced the launching of Berge Everett, a new liquefied natural gas 138,000 m3 tanker, chartered by the Group. |
| |
September 2003 | | • Contract signed with Statoil to supply 36 million MMBtu/year of LNG to Statoil Natural Gas LLC at the LNG terminal in Cove Point, Maryland (USA). |
22
| | |
| | | Peru |
| |
| | | • Tractebel LNG and Peru LNG signed a Memorandum of Understanding, which provides for the annual supply of 2.7 million metric tons of LNG over a period of 18 years; EGI will ship LNG from Melchorita, Peru to Mexico. |
| |
November 2003 | | United States |
| |
| | | • Tractebel North America commissioned the Chehalis 520 MW electrical plant. |
| |
December 2003 | | Singapore |
| |
| | | • EGI finalized the sale of its minority interests in three Singaporean joint ventures to its partner SembCorp Utilities Pte Ltd for approximately €93 million. This operation generated a capital gain of €40 million. |
|
| Industrial & Energy Services |
| |
January 2003 | | France |
| |
| | | • Naturfruit, a subsidiary of Danone and the Italian group San Benetto, signed a contract with Elyo to provide utilities for its new industrial site. The €11.5 million contract is for 10 years. |
| |
| | | France |
| |
| | | • BP France and Elyo signed a 5-year facilities management contract for €11.3 million for its 12,000 m2 corporate headquarters in Cergy-Pontoise. |
| |
| | | Belgium |
| |
| | | • Axima Services begins a 10-year contract for more the €20 million for the technical management of the Sidmar site in Zelzaete (Belgium). |
| |
| | | Spain |
| |
| | | • Tractebel Gas Engineering signed an engineering procurement construction (EPC) contract with Regonasa for the construction of an LNG terminal in La Coruña, Spain, including two 150,000 m3 storage reservoirs and unloading and distribution facilities. |
| |
March 2003 | | India |
| |
| | | • CORYS T.E.S.S. (the French subsidiary of Tractebel Engineering specializing in simulation) signed a contract with Indian Railways for the turnkey supply of train-performance simulators. |
| |
April 2003 | | French Polynesia |
| |
| | | • Electricité de Tahiti (EDT), a subsidiary of Elyo, equipped the Punaruu electrical plant with two new units of 17 MWe each. |
23
| | |
May 2003 | | France |
| |
| | | • Elyo won a contract to manage energy and utilities for a period of 10 years with COOP D’OR STL for a total amount of €21 million. |
| |
| | | Norway |
| |
| | | • Fabricom S.A. won a contract (approximately 800,000 man-hours of work) to supply 56 modules to the Statoil liquefaction plant to be built on Melkøya Island, near Hammerfest, the northernmost city of Norway. |
| |
June 2003 | | France |
| |
| | | • Elyo supplied energy fluids and multi-technical services to the Philips cathode tube production site in Dreux. |
| |
September 2003 | | Belgium |
| |
| | | • Belgatom, a subsidiary of SUEZ-TRACTEBEL, and Belgonucleaire, provide acceptance and start-up of a facility (Building 280) designed for the recovery, treatment, and conditioning of ‘historical’ radioactive waste stored at Site 2 of Belgoprocess, after providing the final radiological specifications. |
| |
| | | United Kingdom |
| |
| | | • Lehman Brothers extended the initial technical maintenance management of its headquarters in London with Elyo Services. This contract represents revenues of €14.4 million over 9 years. |
| |
| | | China |
| |
| | | • Coyne et Bellier, a French subsidiary of Tractebel Engineering, specializing in dams, was awarded the contract to supervise the dam and hydroelectric plant work in Zhongliang, China. |
| |
October 2003 | | Italy |
| |
| | | • Elyo Italia and Rockwood, Italia, the second-largest European manufacturer of natural pigments for industry, signed a 15-year contract for €91 million to provide maintenance management and thermal and electrical energy at its site in Turin. |
| |
November 2003 | | France |
| |
| | | • Elyo opened the technical center for the Airbus site in Toulouse (France) after 15 months’ work. |
| |
December 2003 | | Portugal |
| |
| | | • The Sines terminal with a capacity of 5.2 billion m3 began operations agreed between Transgas Atlantica and the consortium led by Tractebel Gas Engineering. |
24
| | |
| Events Since Year-End |
| |
January 2004 | | United States |
| |
| | | • In California, Tractebel North America, Inc. (TNA) sold two cogeneration facilities to Lightyear Capital, LLC and Rockland Capital Energy Investments for a total of approximately $80 million. |
| |
February 2004 | | Belgium-France |
| |
| | | • Electrabel and EDF adapted their nuclear contracts allowing each to exploit value from their respective stakes; Electrical now holds an encumbered share of the electricity produced in Tricastin on the French network. |
| |
| | | Peru |
| |
| | | • The government awarded Enersur a 30-year concession for the operation of the Yuncan hydroelectric plant (130 MW) and for the associated transmission facilities. |
| |
| | | Algeria |
| |
| | | • Fabricom GTI won the contract for renovate 20 Sonatrach gas compression stations for €103 million. |
| |
May 2004 | | United States |
| |
| | | • Tractebel North America signed an agreement with Thermal North America, Inc. for the sale of ten District Heating and Cooling Systems (DHCS), representing a total capacity of 238 MW of electricity generation, 10 million pounds per hour of steam and 72,800 tons of chilled water. |
Production Capacity
Our generating capacity installed and under construction at December 31, 2003 amounted to approximately 50,400 MW4 (not including capacities under development). SUEZ-TRACTEBEL is currently active in electricity and natural gas projects in some 30 countries.
Natural gas is the fuel most widely used by our generating plants with 34% of installed capacity fired by natural gas, compared with 13% fired with fuel oil and 11% fired with coal. Nuclear facilities account for 13%, hydroelectric 26%, and other sources 3% of the fuel used by our generating plants.
Installed capacity and under construction at December 31, 2003

4 MW refers to net power unless specified otherwise. Net power is total power less power consumed by the power plant itself.
25
Capacity breakdown by type of fuel, at December 31, 2003
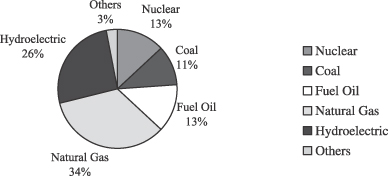
We believe that this capacity structure assures our cost competitiveness. Operating costs (particularly fuel) for nuclear plants are relatively low and the high proportion of natural gas-fired plants confers a second competitive advantage, since natural gas is efficient and less polluting than other fossil fuels such as coal. For this reason, we continue to give priority to natural gas plants in our development efforts.
The aggregate output capacity of projects under construction at December 31, 2003 was 4,611.7 MW. Based on projected timetables for putting these units into service, we expect our installed capacity to increase by 1,765.6 MW in 2004, by 2,100.2 MW in 2005 and by 746 MW in 2006.
Projects under construction by region at December 31, 2003
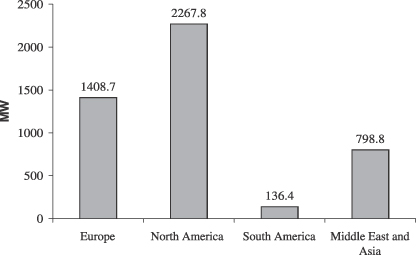
Business Activities and the Regulatory Environment
Electricity & Gas Europe
Electricity production, transmission and distribution
Regulatory environment
A European Union electricity directive passed in 1996 requires member states to open the electricity market to competition. The directive calls for the following:
| • | opening to competition of new generating capacity; |
| • | unbundling and separate accounting for different segments (production, transport and distribution) by integrated companies; |
26
| • | designation of a distribution network operator responsible for the operation, maintenance and, where appropriate, development of the distribution network in specific areas and for its interconnections with other networks; |
| • | introduction of a system of third-party access to the network under which companies wishing to enter into power supply contracts must negotiate the transmission and/or the distribution of the quantities purchased with the network operators. |
In Belgium, in accordance with this directive, the institutional and regulatory framework is now relatively complete. In 2002, transmission activities were provided by CPTE within a different structure. 30% of this company was sold to the corporation Publi-T. Various corporate governance measures have been taken to ensure the independence of the transmission network operator, Elia, which was officially appointed in September 2002, provided that, within two years, among other things, the producers SPE (a public sector company) and Electrabel limit their collective ownership interests in Elia to 30%, and that 40% of Elia’s capital is to be listed for trading in 2004.
In 2003, various measures were taken by Electrabel to improve the liquidity of the electricity production market in Belgium. The principal measures include :
| | • | dissolution of CPTE as of January 1, 2003, which resulted in a completely independent producer – SPE – which has 1,600 MW of installed power in Belgium, which is nearly 10% of total capacity; |
| | • | the organization of auctions for virtual capacity (virtual power plant – VPP) with maximum capacity of 1,200 MW. As of February 25, 2004, 495 MW had been provided to third parties; |
| | • | the adaptation of nuclear agreements with EDF that give EDF 480 MW of installed power on Belgian territory (Electrabel acquired reciprocal rights on French territory). |
In November 2002, the EU Council of Ministers approved a second directive, which was adopted on June 26, 2003, opening the non-residential market in July 2004 and the residential market in July 2007. This also requires separation of the transmission network operator function in 2004 and of the distribution network operator function in 2007. On June 4, 2003, the European Parliament adopted the proposal for full opening of the energy markets.
Each of the Belgian regions sets its own deregulation schedule completely independently, in accordance with the directive of June 26, 2003. The Flemish electricity and natural gas market has, in effect, been completely open since July 1, 2003, which raises the level of deregulation of the Belgian market to 80% for electricity and 83% for gas. In the Flemish market, six months after complete deregulation, more than one in five customers used their eligibility, either by changing supplier, or by confirming the choice of their historical supplier. The schedule for opening the two other regions has not yet been finalized. Based on this second directive of June 26, 2003 and projects known to date, it is estimated that the Walloon market will be completely open by July 1, 2005 (all high-voltage customers become eligible on July 1, 2004) and the Brussels market on January 1, 2007 (business customers become eligible on July 1, 2004).
In 2003, all mixed electricity and gas intermunicipal companies were officially named as distribution network operators while the Belgian Competition Board allowed the Electrabel group to take over supplying eligible customers from the intermunicipal companies in the Walloon and Flemish region. Agreement for Brussels was obtained on March 8, 2004. This appointment is formal recognition of the constructive role played by Electrabel in establishing the market.
Electrabel has actively participated in the deregulation of the Belgian electricity and gas markets by creating the subsidiary “Electrabel Netten Vlaanderen” to be active on behalf of the intermunicipal companies in the network’s activities (technical operations, maintenance and development of networks) in the Flemish region, and the subsidiary “Electrabel Customer Solutions” to supply eligible customers. In 2003, Electrabel also agreed to gradually reduce its level of participation in network management activities in the coming years, by selling to the partner municipalities an average of 30% of its capital in the intermunicipal companies that it held.
27
With the entry into force of directive 2003/54/EC of June 26, 2003, July 1, 2004 will be a crucial stage for deregulation of the European electricity market, in which Electrabel continued to expand in 2003.
In the Netherlands, the European directive is being implemented step by step. After initially extending the date for full market deregulation to July 1, 2004, the authorities are currently considering a further extension.
In Belgium, the Committee for the Control of Electricity and Gas (CCEG) recommended that starting in 1998 rate reductions be implemented for all customer categories. The amount of these reductions was initially estimated at €74 million per year. Subsequently, other measures were taken to align rates in Belgium with the average of rates in comparable countries (the Netherlands, France, Germany, United Kingdom and Luxembourg). In 2002, electricity rates were reduced by €205 million.
Laws and regulations in Belgium limit the liability of companies that operate nuclear power stations - such as Electrabel - in the event of a nuclear accident. Belgian law caps the operator’s financial responsibility by site in case of a dispute arising from a nuclear accident. This exposure is covered by an insurance program in strict conformity with legal obligations. Signatory countries of the Paris and Brussels conventions are responsible for compensating for losses in excess of this ceiling.
In general, the regulatory environment in Europe is one of accelerating deregulation.
Business activity
Electrabel produces and markets electricity; it also engages in trading on energy markets in Europe. In Belgium, it operates electricity and natural gas networks at the request of distribution network operators.
Electrabel is one of the founding members of the Amsterdam Power Exchange and Powernext, operator of the French power exchange. It engages in trading activities within this framework. Electrabel has also been present in the Spanish pool since 1998 and engages in trading (spot and day-ahead) in Germany, Switzerland and Austria.
Belgium
Belgium remains our principal market as the Group sells electricity, gas and energy products and services, generates electricity, trades in electricity and natural gas and manages electricity and natural gas networks on behalf of distribution system operators in different areas of the country. In 2003, Electrabel accounted for 86% of the electricity produced in Belgium. Electrabel sells power to deregulated customers and to inter-municipal companies. These companies are made up by a group of municipalities, generally with a private-sector partner. In 2003, Electrabel was that partner for about 440 municipalities grouped into some 26 intermunicipal entities which ensure distribution, including supplying customers not yet deregulated.
The transmission networks were transferred to Elia, a company set up to become the operator of the Belgian grid. Electrabel has separate marketing, sales, and customer service departments (in particular call centers) for direct industrial customers on the one hand and for inter-municipal customers on the other. In furtherance of deregulation, Electrabel must reduce its equity holdings in the inter-municipal companies to a minority shareholder level.
Until January 1, 2003, Electrabel’s electricity production activities in Belgium were conducted by its subsidiary CPTE. Electrabel controlled 91.5% of the share capital of CPTE, and SPE, a public-sector company, controlled 8.5%. A 30% interest in CPTE was sold to Publi-T, the corporation representing the interests of Belgian municipalities in 2003. The two parties terminated their relationship and took control of their respective production capacities with retroactive effect on January 1, 2003.
The fuel used by Electrabel’s nuclear power stations is primarily enriched uranium, although in certain cases a mixture of uranium oxide and plutonium oxide is used. All the fuel requirements of each power station are supplied by Synatom, a company owned by Electrabel and Tractebel in which the Belgian government holds a “golden share”. This golden share gives the government veto power over any decision deemed to be contrary to
28
national interests. It also gives the government representation on Synatom’s board, where the Belgian state holds two seats. Synatom procures fuel under long-term contracts with several foreign suppliers and receives plutonium derived from reprocessed spent fuel.
In conformity with the government’s plan of 1999, a law was adopted in January 2003 dealing with the progressive withdrawal of nuclear energy from electricity production. This plan essentially calls for the deactivation of nuclear stations 40 years after their introduction into service as well as prohibiting the creation or putting into operation of new units. Nevertheless, in the case of an act of god related to the security of supplies, the government is authorized to make certain exceptions. Within the framework of this law, the first decommissioning would take place in 2015. See “– Environmental Aspects – nuclear power.”
In Belgium, primarily through Electrabel, we construct and operate cogeneration units on the premises of our industrial customers, enabling them to optimize their energy cost and improve observance of environmental standards. These units offer great energy efficiency – up to an 85% increase for simultaneous production of heat and electric power – and lower emissions of carbon dioxide. Cogeneration units enable us to establish long-term commercial relationships with industrial customers and to improve the energy efficiency of urban heating and cooling plants.
Rest of Europe
In Europe, our strategy consists of maintaining our leading position in the Benelux market and enhancing our positions in France, Italy and the Iberian peninsula by taking advantage of development opportunities created by energy market deregulation. Electrabel is also developing business on a smaller scale in Germany and in a few central European countries which are due to join the European Union as part of the enlargement process currently underway.
In the Netherlands, Electrabel is currently the largest electricity producer, through its subsidiary Electrabel Nederland, representing over 20% of the electricity market.
In France, Electrabel continued preparations for the July 1, 2004 deadline. It has, however, a very extensive set of production facilities, combining nuclear (1,100 MW), hydraulic (2,937 MW of base hydro power via the CNR, in which Electrabel was the largest shareholder at 31 December with 47.88%), and 773 MW of peak hydro power (via SHEM, for which Electrabel has marketed output and provided operating services since May 1, 2003).
In Italy, Electrabel is basing its growth on a structural partnership with Acea. This partnership resulted in the acquisition from Enel of Interpower (fourth-largest Italian producer), which has since been renamed Tirreno Power. As a result, the company also has installed power of 2,030 MW, both thermal and hydro. This production capacity will be supplemented in years to come. Along with Acea, the company also holds a portfolio of combined-cycle plant projects, and is in the process of applying for permits. As of year-end 2004, the Voghera plant (combined-cycle, gas vapor plant of 385 MW in Lombardy) will be operational.
In an Iberian market that is theoretically 100% deregulated, but where the import capacity situation requires local production resources, 2003 marks a significant stage for Electrabel. The construction of a gas-steam combined-cycle power plant of 760 MW at Castelnou (Aragon) was initiated; commissioning is contractually scheduled for year-end 2005. Other ambitious projects to strengthen the company’s local presence are being considered. They benefit from Electrabel’s expertise in gas technologies for electricity production. The Portuguese firm Generg, in which Electrabel holds 42.5%, also brought a 13-MW wind facility on line, the first stage of a larger, 450 MW project.
Finally, Electrabel is also engaging in selective development in North-East Europe. In Germany, the Group’s sales, generally concentrated in the regions of Saarbrücken and Gera, total 6.2 TWh. In Poland, the company increased its stake in the Polaniec plant (1,654 MW) to 100%. Total sales in this country currently exceed 9 TWh. In Hungary, where Group sales total 5.1 TWh, Electrabel is pursuing its program to restructure the Dunamenti plant, which represents almost one-quarter of national production.
29
The table below gives the breakdown of installed capacity and sales in Europe.
Installed capacity5 and sales in Europe, excluding energy trading
| | | | | | | | | | | | |
| | | 2003 sales
| | Installed capacity
| | Capacity under
Construction
|
| | | GWh
| | %
| | MW Net
| | %
| | MW Net
| | %
|
Belgium | | 71,379.5 | | 54.1 | | 12,968.0 | | 48.2 | | 218.7 | | 15.5 |
Rest of Europe | | 60,632.9 | | 45.9 | | 13,928.0 | | 51.8 | | 1,190.0 | | 84.5 |
| | |
| |
| |
| |
| |
| |
|
Total | | 132,012.4 | | 100.0 | | 26,896.0 | | 100.0 | | 1,408.7 | | 100.0 |
Natural gas transmission and distribution
Regulatory environment
The European Union directive 98/30 on common rules for the internal natural gas market, issued June 22, 1998, was an important step in the deregulation of that market in Europe. The main objective of this directive is to ensure that the market gradually opens to competition. To this end, certain buyers are to be offered the possibility of entering into supply contracts with the producers or suppliers of their choice and gaining access to the transmission infrastructure of other operators for this purpose. EU regulations require that beginning August 10, 2000, at least 20-30% of the market must be eligible for such access. This minimum is to be raised to 28-38% in 2003 and to 33-43% by 2008.
The directive was implemented into Belgian law in 1999 by an overhaul of the 1965 act that previously governed the natural gas market. In the new legislative environment, it is expected that a code of conduct, to be promulgated by royal decree, will govern third-party access to the transmission network. The code of conduct is to establish minimum conditions that must be met in regard to administrative and operational separation of integrated natural gas companies’ transmission and trading activities.
A new 2003/55 EC gas directive was adopted on June 26, 2003. This directive repeals the 1998 directive. It accelerates deregulation by providing that member States must ensure the eligibility of all non-residential customers by July 1, 2004 and of all customers by July 1, 2007.
It defines certain obligations for firms designated as operators of the transportation or distribution network in terms of legal, functional, and accounting separation. The directive promotes minimum regulations for network access (and also provides for an optional special regime for network access for new infrastructures). It must be implemented into domestic law before July 2004.
In Belgium, the Walloon Government order of October 16, 2003 relating to gas supply licenses was published in theMoniteur belge on November 14, 2003. Under a ministry order dated December 17, 2003, Distrigas obtained a temporary gas supply license.
A royal order of December 15, 2003 implemented special pricing for new infrastructures of national or European interest, including the project to expand the capacity of the LNG Terminal at Zeebrugge. Negotiations with users interested in subscribing to long-term capacity are currently being finalized. An investment decision may be made in the first half of 2004.
5 The installed capacities correspond to 100% of the power produced by plants included within the consolidation structure only (equity method, proportional consolidation and global consolidation). Therefore, installed capacities do not include the capacities of SHEM, Chooz or Triscatin.
30
As of January 1, 2003, the Flemish legislature opened the public natural gas market distribution network in Flanders to free competition for sites using at least 1 million m3 (12 GWh) of natural gas per year. As of July 1, 2003, any consumer on the public distribution network in Flanders is eligible regardless of the level of gas consumption. In Wallonia, the decree of December 19, 2002 on the organization of the regional natural gas market was published in theMoniteur belge on February 11, 2003. This decree gives the possibility of granting immediate eligibility to consumers on the public distribution network in Wallonia who use at least 1 million m3 (12 GWh) of natural gas per year. In its decree of October 15, 2003, the Walloon Government set the effective date for eligibility at January 5, 2004. In practice, these regulatory changes further opened up the Belgian market, which expanded from being approximately 65% deregulated on January 1, 2003 to approximately 83% by July 1, 2003.
In France, since August 10, 2003, the natural gas consumption threshold for eligibility to freely choose natural gas providers was lowered from 237 GWh to 83 GWh per year per site. Following an agreement between Distrigas and Énergie du Rhône (the joint marketing subsidiary of CNR and Electrabel), Distrigas began marketing natural gas in this segment.
Business activity
Through Distrigas and Electrabel’s holdings in the intermunicipal companies, EGE is Belgium’s largest supplier of natural gas. Belgium’s natural gas transmission network, operated by Fluxys, consists of 3,731 kilometers of pipeline, 86% of which now operate at high pressure (between 14.7 and 80 bars).
As with electricity, the regional governments would like Electrabel to reduce to a minority interest its stakes in the inter-municipal natural gas distribution companies.
In Belgium, since the end of 2001 EGE has been handling our natural gas activities (excluding distribution) through two separate legal entities:
| • | Fluxys is a transmission company, whose principal activity is the operation, maintenance and development of the integrated natural gas transmission infrastructure and the LNG terminal in Zeebrugge and storage facilities in Loenhout. Within the framework of regulated access to its infrastructure, it markets transmission capacity and related services needed by third parties to supply natural gas to consumers in Belgium. The company also provides hub services in Zeebrugge for spot market transactions in natural gas. Natural gas transiting through the Belgian network is carried by pipeline to the Netherlands, Germany, France, Spain, Italy and the United Kingdom. Fluxys’s network is ideally situated at the center of the continent and is well interconnected, so that it provides access to the main sources of natural gas production in Northern Europe (UK, Norway and Holland) and to the main natural gas consuming countries in northwestern Europe. In Belgium, within its LNG terminal operations, Fluxys LNG (a subsidiary of Fluxys SA) also uses cogeneration to increase the rational use of energy in power production units: it uses residual heat to reheat and regasify liquefied natural gas. This combination forms a system that generates cost savings compared with separate steam and electricity production. |
| • | Distrigas is an energy trading company whose principal activity is buying and selling natural gas in Europe. Distrigas also markets the international transmission capacity that it owns or for which it has contracted (transit contracts, Interconnector capacity, the undersea natural gas pipeline between Belgium and the United Kingdom, and LNG shipping capacity). Building on the strength of its natural gas supply portfolio, its business includes the following: sale of natural gas in Belgium and elsewhere in Europe (as well as LNG in other markets), arbitrage trading in natural gas spot markets, management of natural gas transit contracts in Belgium (border to border capacity), marketing of transmission and storage capacity outside Belgium, and LNG shipping. Distrigas has signed master agreements with several counterparties for the purchase and sale of LNG cargoes in the Atlantic basin, and executed a significant number of transactions within this framework in 2003. |
31
In 2003, Distrigas sold 272 TWh of natural gas, which is approximately 5% of the volume of natural gas consumed in Western Europe. Approximately 63% of this volume was sold in Belgium and 37% was sold on spot markets or to international customers, mainly in Europe.
The Belgian customer profile is presented in the table below:
Sales of natural gas
| | | | | | | | | | |
| | | Breakdown of sales
| |
| | | 2003
| | 2002
| | 2003/2002
| | | 2003
| |
| | | (in 1,000 MWh) | | | | | | |
Public distribution | | 75,977 | | 78,052 | | (2.66 | )% | | 28 | % |
Direct sales to industrial clients | | 50,962 | | 54,100 | | (5.80 | )% | | 19 | % |
Electricity production | | 44,382 | | 38,733 | | 14.58 | % | | 16 | % |
Sales excluding Belgium and trading | | 101,206 | | 95,224 | | 6.28 | % | | 37 | % |
| | |
| |
| |
|
| |
|
|
Total | | 272,527 | | 266,109 | | 2.41 | % | | 100 | % |
| | |
| |
| |
|
| |
|
|
Total in billion m3 (1 Nm3 = 0.01163 MWh) | | 23.4 | | 22.9 | | | | | | |
| | |
| |
| | | | | | |
Electricity & Gas International
Electricity — installed capacity and sales
| | | | | | | | | | | | |
| | | Sales 2003
| | Installed capacity
in MW at
December 31, 2003
| | Capacity under construction at
December 31, 2003
|
| | | TWh
| | %
| | MW Net
| | %
| | MW Net
| | %
|
North America | | 18.9 | | 23.2 | | 3,626.7 | | 21.1 | | 2,267.8 | | 70.8 |
South America | | 41.6 | | 51.2 | | 10,070.7 | | 58.7 | | 136.4 | | 4.3 |
Middle East and Asia | | 20.8 | | 25.6 | | 3,454.8 | | 20.2 | | 798.8 | | 24.9 |
| | |
| |
| |
| |
| |
| |
|
Total | | 81.3 | | 100.0 | | 17,152.2 | | 100 | | 3,203.0 | | 100.0 |
Gas — installed capacity and sales
| | | | | | | | |
| | | Sales 2003
| | Customer portfolio
|
| | | Gm3
| | %
| | Number
| | %
|
North America | | 7.324 | | 44.1 | | 88,484 | | 7.5 |
South America | | 4.180 | | 25.2 | | 462,801 | | 39.2 |
Middle East and Asia | | 4.158 | | 25.1 | | 628,118 | | 53.3 |
LNG Region | | 0.932 | | 5.6 | | — | | — |
| | |
| |
| | | | |
Total | | 16.594 | | 100.0 | | 1,179,403 | | 100.0 |
North America
In North America, Tractebel North America (TNA) incorporates EGI activities carried out through several energy subsidiaries operating with an integrated value chain, ranging from fuels (natural gas, oil and coal) to direct sales of electricity for commercial and industrial customers, including the production of electricity and wholesale electricity activities. These subsidiaries are Tractebel LNG North America (TLNGNA), Tractebel Power Incorporated (TPI), Tractebel Project Development Incorporated (TPDI), Tractebel Energy Marketing Incorporated (TEMI), Tractebel Energy Services Incorporated (TESI) and Tractebel de Mexico (TMEX).
32
TLNGNA operates the LNG regasification terminal at Everett (Massachusetts) and holds all its capacity and related rights. TLNGNA also holds capacity rights for the Cove Point (Maryland) terminal, which was reactivated and resumed its commercial supplies of LNG in August 2003. Through these two terminals, TLNGNA imports natural gas into North America for resale to electricity producers, wholesalers and local distributors.
TPI operates 53 electricity plants, the production from which is sold to distribution companies or industrial and commercial customers under bilateral contracts or on the wholesale market.
TPDI develops projects which are financed on a long-term basis and that are transferred to TPI or TLNGNA for operation, depending upon the nature of the investment. TPDI’s most significant current activities include the completion of power plants with total net capacity of 2,268 MW, as well as the development of LNG regasification terminals.
TEMI consolidates the management of all raw material and credit risks and provides risk hedging services to all TNA operating entities.
TESI sells electricity to commercial and industrial customers in four states (Texas, New Jersey, Massachusetts and New York) and holds license to operate in two more states (Maine and Maryland).
Through its activities, TESI offers an additional sales channel for the electricity produced by merchant plants. As of December 31, 2003, the company held contracts with a total estimated value of $633 million, corresponding to a sales volume equal to 11.3 TWh.
TMEX, in Mexico, operates three local regulated natural gas distribution companies, as well as a limited number of electricity production projects.
TNA is able to operate under equitable competition conditions in the natural gas sector in North America, because wholesale markets have been deregulated for some time now. In the electricity sector, the regulatory differences are much greater from one region to another. In regions such as Pennsylvania, New Jersey and Maryland (PJM), New York (NYPP) and Texas (ERCOT), the deregulation of wholesale and retail electricity sales is advanced and is continuing. These are regions where TPI and TESI are active and well positioned. In other regions, such as the Western and Southeastern United States, the rate of deregulation is considerably slower, or even stagnant.
South America
In South America, the regulatory environment and status of market deregulation varies by country. In this region, EGI’s main positions are concentrated in Brazil, with some facilities in Chile, Peru and Argentina.
In Brazil, privatization has come to a standstill, with 80% of production still in the hands of the State. The bases for a new model for the electricity market were published in December 2003 and implemented into law in March 2004. Although the implementation details are still under discussion, it appears that this model will, on the one hand, strengthen the federal government’s presence at all levels of the system but, on the other hand, provide for the establishment of two transparent and competitive markets; one for new long-term contracts with distribution companies, and the other for eligible industrial customers.
Tractebel Energia, of which EGI owns 78.32%, is the largest private power producer in Brazil, with 6,726 MW of installed capacity. The company sells its electricity primarily through long-term contracts (between 2 and 15 years) to distributors and industrial customers.
EGI also maintains a significant presence in the Chilean market, where (in association with its local partners) it is one of the largest operators through Colbun (29.21% interest), the third-largest electricity producer
33
in the SIC network (center of Chile) with 1,526 installed MW, Electroandina (33.25% interest), the largest producer in the SING network (northern Chile) with 915 installed MW, and Edelnor (27.38% interest), the third-largest producer in the SING network with 658 MW.
The company Gasoducto Norandino, which is 84.7% owned by EGI, also owns and operates a gas pipeline designed to import 3.22 billion m3 of natural gas per year, primarily intended for electricity production, from Argentina to northern Chile. EGI also has a small distribution company called Distrinor, supported by Norandino and focused on industrial demand.
The Chilean regulatory environment has remained relatively stable since its implementation in 1982. The electricity sector has been completely privatized.
In Argentina, EGI is present through its control of Litoral Gas, one of the country’s four largest gas distribution companies, in which it owns a 64.16% interest and its interest in Energy Consulting Services, an energy consulting and sales company of which it owns 46.67%.
In Peru, Enersur, which is 78.95% owned by EGI, was the fourth-largest electricity producer in 2003, with 338 MW in operation. The company operates two thermal plants and holds exclusive usage rights for the Yuncan hydro plant (130 MW) under construction.
Middle East and Asia
In the Middle East and Asia, EGI’s main presence is in Thailand, South Korea, the Persian Gulf and Turkey.
In Thailand, the organization of the electricity industry has been subject to critical analysis since the problems encountered in California and the recent blackouts in the United States and Europe. Thailand decided to abandon the plan to create a deregulated wholesale market (pool system) and has confirmed the status of its regulated monopolies in electricity production, transport, distribution and sales, as well as its desire to maintain the single purchaser model. Existing private electricity producers continue to sell their production to industrial customers and the Electricity Generating Authority of Thailand (EGAT), a state-owned company.
Through Glow IPP (94.04% owned, with 713 MW of capacity) and Glow SPP (99.01% owned, with 828 MW), EGI produces and supplies electricity, steam and treated water to approximately thirty large industrial customers in Map Ta Phut region. Moreover, the majority of electricity produced is sold under a long-term contract to EGAT. EGI also owns 69.80% of the Houay Ho project, a 152.5 MW hydro plant in Laos that also sells its production under a long-term contract to EGAT.
EGI also holds a 40% interest in PTTNGD (following the sale of 9% of its capital to PTT, the Thai national oil company, in January of 2004), which distributes natural gas to industrial customers in greater Bangkok.
In South Korea, deregulation of the electricity and gas sector changed little in 2003. In this country, EGI holds a 75% stake in Hanjin City Gas, a natural gas distribution company that operates in the northern metropolitan districts of Seoul and the province of Kyunggi (its concession region).
EGI is also present in the Persian Gulf countries with a 32.81% interest in UPC, a 288 MW plant in Oman, and a 20% interest in Taweelah A1, a desalinization plant that produces 1,360 MW of electricity and 385,000 m3/day of desalinated water, EGI also holds a 95% interest in a 763 MW combined-cycle plant at Baymina, Turkey.
LNG
LNG operations consist of transporting natural gas from producing countries to importing countries, using an infrastructure and ships designed for this purpose. This international trading is not subject to national regulation until it touches land.
34
Tractebel LNG Ltd., a wholly-owned subsidiary of EGI based in Luxembourg and London, is responsible for the following:
| | • | Executing all of EGI’s short-term LNG trading activities through the world; |
| | • | Coordinating EGI’s fleet of LNG ships; |
| | • | Promoting the development of new long-term LNG ventures; and |
| | • | Holding all EGI interests in liquefaction projects. |
LNG regasification projects, as well as their respective long-term LNG supply agreements, come under the EGI regional entities. For example, the Everett regasification plant, near Boston, belongs to Tractebel North America.
As of December 31, 2003, EGI operates six LNG ships, with total capacity of 764,000m3.
In Trinidad and Tobago, Tractebel holds a 10% interest in Atlantic LNG 1, which owns and operates a large natural gas liquefaction train, with a production capacity of 3.3 million tons of LNG per year. Atlantic LNG 1 shareholders also own the rights and related privileges to future expansions of liquefaction trains, but only up to a possible sixth train, EGI is not a co-investor in trains 2, 3 and 4.
Industrial & Energy Services
Fabricom
Fabricom services the industry, public infrastructure and services sectors, and is the largest European supplier of industrial services.
Fabricom provides on-site services in technical facilities and maintenance. Fabricom’s scope of activity covers a broad range of technical skills that can be divided into three principal categories:
| | • | Electricity and communications systems; |
| | • | Mechanical, industrial, and pipeline system maintenance; and |
| | • | Climate control and refrigeration. |
Fabricom’s range of services also includes a number of specialties, particularly systems, water filtering and the construction of pylons. On-site services are required for the installation of new products and maintenance services.
Fabricom operates in the industrial, infrastructure and construction sectors, but also provides some services to small residential buildings. Fabricom relies upon a network of subsidiaries and local agencies in the countries where it operates.
Fabricom has also developed specific know-how to meet the very specific requirements of certain industrial customers, such as a major project management.
Project pricing is an essential element of Fabricom’s activities. Once a project has been priced and the contract is underway, day-to-day project management, strict cost control and the management of any unexpected events or complexity will determine the project’s final profitability.
35
Energy Services
Elyo specializes in energy services, based on the concept of delegated management or outsourcing, and offers a wide range of customers (including business, local authorities and residential site managers) innovative solutions.
Elyo designs and operates solutions that contribute to environmental protection;
| | • | management of local energy networks |
| | • | management of energy and utilities needed for industrial processes |
| | • | maintenance management for thermal and technical equipment |
Elyo also manages energy services for over 1.2 million housing units. Installed thermal power is 11.6 GWth, through urban heating and cooling networks.
In recent years, Elyo has developed a number of cogeneration projects in France and Europe, and operates gas turbines, gas engines and steam turbines at 153 sites in industry, hospitals or heating networks, for a total of 1,282 MW of electricity.
Elyo also has a presence in power production and distribution in the Pacific and in Africa.
Axima Services includes companies focused on long-term technical management and maintenance of technological facilities and facilities management.
In addition to standard technologies, Axima has expanded its services, particularly to technologies which are specific to airports, as well as sports, leisure and health care facilities.
Engineering
We also offer engineering services. Tractebel Engineering has approximately 3,000 employees and is one of the European leaders in the sector, recognized for its experience and international presence in more than 70 countries in 2003. Tractebel Engineering has four main fields of activity: electrical power plants, gas storage and processing facilities, information technology and infrastructure. Tractebel Engineering offers a broad range of services running from feasibility studies to construction contracts and operating assistance.
Energy Trading
Our energy trading operations are part of our business model, which is designed to manage the balance between assets and sales through a centralized portfolio management department. In Europe, we are developing a proprietary energy trading activity and also trade on behalf of customers. In the United States, EGI made the decision to halt proprietary trading in 2003. In the United States, energy trading activities by EGI companies are now focused on asset-based trading, which involves commodity price risk management activities (including fuel procurement and power marketing) directly related to assets owned by EGI and are intended to maximize the returns on the operation of those assets.
EGI runs its trading activities in the United States through TEMI while in Europe EGE’s operations in this sector are run by Electrabel. Electrabel is one of the founding members of the Amsterdam Power Exchange and of Powernext, which administers the French energy exchange that began operations in the second half of 2001. Moreover, we have been trading in the Spanish pool since 1998 and are also making spot and day-ahead trades in Germany, Switzerland and Austria.
36
Markets and Competition
Production and marketing of electric power and marketing of natural gas are highly competitive sectors in Europe and the United States. In contrast, activities that constitute natural monopolies, such as the transmission of electricity and natural gas, are tightly regulated. Elsewhere in the world, with only a few exceptions, markets are less open to competition and the international players operate in more regulated environments or in a system of long-term contracts.
In Europe, Electrabel’s and Distrigas’ principal competitors in markets open to competition are: in electricity, the German firms E.ON and RWE, France’s EDF and Italy’s ENEL; in natural gas, energy firms such as Ruhrgas, Gasunie and Gaz de France. As competition becomes more widespread, new competitors have arrived on the market such as the large European natural gas producers or specialized marketing companies such as Britain’s Centrica (which has taken a position on the Belgian market). SUEZ-TRACTEBEL believes that when the deregulation process is over, the competitive marketing business will extend to residential customers as well and is actively preparing for this possibility. Moreover, in 1999 Fluxys lost its exclusive right to transport natural gas in Belgium and competitors can already begin constructing their own networks.
We are also engaged in a policy to develop LNG activities. With Tractebel LNG North America and Fluxys, we are the only Group to have LNG terminals on both sides of the Atlantic, plus an interest in liquefaction in Trinidad, which gives us good arbitrage capacity. We believe that this gas segment is destined to grow quickly, particularly because of the depletion of the gas resources in the United States and ongoing improvements in LNG technologies.
In the United States, the electricity markets currently suffer from excess supply. The current gas-electricity differentials (spark spreads) are too small in most regions for combined cycle merchant plants to be able to make profit from the spot market. Capacity surpluses are not expected to be rapidly absorbed by market demand and the closing of obsolete plants.
High natural gas prices reflect a structural change in the market, due to the decline in North American production capacity. We believe that the United States’ dependence on imports of natural gas will increase between now and the end of the decade, thereby opening the way for the development of LNG.
After a series of major events (the electricity and financial markets crisis) that produced a decrease in electricity demand, total electricity demand in Brazil, Argentina, Chile and Peru increased, according to our estimates, by approximately 6% in 2003. Globally, market prices are below the long-term marginal price, but the rapid increase in demand is absorbing excess capacity. Higher prices and significant volatility have been seen recently in Peru and in Chile.
In Asia and the Middle East, most countries do not have deregulated energy markets. Consequently, there are few indicators available that would allow us to comment on changes. Although the increase in energy demand in this region is generally high, investment opportunities remain limited in the short term for foreign investors, except in the Middle East.
Since EGI is diversified and active in many countries and segments of the electricity and natural gas value chain, its competitors are as numerous as they are varied, and often include local public enterprises and domestic operators. International operators such as AES, Endesa, International Power and EDF are certainly competitors in several countries, but they are fewer in number in recent years, as many have filed for bankruptcy or refocused on their respective historical markets, often as a result of problems relating to residential electricity distribution, a segment on which EGI is not focusing.
Oil and gas companies such as Exxon, Shell, BP, Total and British Gas have become important LNG competitors in the Atlantic basin.
37
In the energy services sector, our principal competitors are Dalkia, which is a subsidiary of Veolia and EDF and Cofathec (a subsidiary of Gaz de France).
In the cogeneration sector, Dalkia and RWE Solutions are among the most active companies.
The major markets for Fabricom’s activity are France, Belgium, the Netherlands, with a presence also in Great Britain, Italy, Spain, Norway, Germany, Switzerland, Austria and Luxembourg.
Because of the broad spread and extreme diversification of customers in these markets, each type of service demanded by customers in each country is a market with a unique growth dynamic and a specific competitive environment.
However, two general trends place the markets for the Fabricom operating entities outside the general economic environment:
| | • | Maintenance: a growing trend toward outsourcing and the focus of customers on core activities and demands for value-added services. |
| | • | Facilities: fewer new industrial infrastructure projects in the mature economies of France and the Benelux countries. |
Environmental Aspects
We have taken measures to reduce direct impacts of electricity generation, energy services and gas activities on the environment. We implement sustainability management that aims, among other objectives, at reducing the financial risk related to environment management and at taking advantage of potential financial returns related to environmental strategy. Furthermore, compliance with the national and European legislation is a constant objective.
Climate change
Regarding climate change, the risks and opportunities faced by the industry are directly linked to the instruments that governments would chose to adopt to tackle it. We believe that our core business will be faced with CO2 constraints at some point in the future. The impact of such constraints can be partially set off by realizing opportunities that arise as a result. The inclusion of sustainable development in our strategy is an essential element for the Group’s long-term growth and wealth.
Although a formal emission reduction program is not yet in place, we anticipated the upcoming emission reduction requirements arising from ratification of the Kyoto protocol. Aiming at achieving higher efficiency and security of supply, we have been steadily reducing greenhouse gas emissions (GHG) by combining various approaches: better use of natural resources by improving the conversion efficiency of its power plants, new power plants based on the CCGT (combined cycle gas turbine) concept, an increase of the combined heat and power capacity, development of renewable energy, especially wind energy onshore and offshore, and biomass.
Electrabel Netherlands has signed two voluntary agreements (“covenants”) with the Dutch government. One imposes on Electrabel Nederland S.A (as an operator of a coal-fired power plant) an annual absolute reduction target of 0.466 million tons between 2008-2012 and the other imposes on all Dutch electricity producers to be among the 10% top global performers in terms of energy-efficiency by 2012.
At Electrabel Deutschland, in addition to improvements that already occurred in 1996, opportunities are being examined for replacing a coal-fired CHP by a CCGT-CHP.
In Poland and Hungary several projects (CHP, biomass, fuel substitution, energy efficiency) are currently under examination to reduce the emissions of our power plants.
38
Although we have not taken part in specific GHG deals up to now, we are active both in the development of related legislation and in the “learning by doing” process. Among other things, Electrabel actively participated in emissions trading simulations and in the European Commission’s expert group on emissions trading. Electrabel invested $5 million in the Prototype Carbon Fund and its holding company - Tractebel - is a member of the International Emissions Trading Association.
Electrabel has a well-diversified portfolio of instruments to further reduce emissions of its plants and already has a high efficiency rate of production due to its nuclear, gas and CHP assets.
With the exception of Canada, EGI is only active in countries not included in Schedule 1 of the Kyoto Protocol, or the Schedule 1 countries that have refused to ratify the Protocol and which are not, therefore, required to gradually reduce their greenhouse gas emissions. Therefore, EGI subsidiaries will not face regulatory constraints relating to reductions in greenhouse gas emissions in the foreseeable future (with the exception of the West Windsor plant in Canada, which is a 112 MW gas cogeneration facility).
Nuclear power
In Belgium, we own and operate two nuclear electric power plants, Doel and Tihange, which provide more than 55.5% of electricity production in Belgium. There has never been any incident at either site, which have been in operation for 18 and 28 years respectively, that has exposed employees, subcontractors or the public to ionization risks. One indicator of the safety of these sites is their load factor, which was 89.3% in 2003.
The personnel in charge of operations at these sites are specially qualified after completing a specific theoretical and practical training program that in particular includes control-room simulation exercises. Belgian operators exchange experiences and submit to peer reviews within the World Association of Nuclear Operators (WANO) to maintain the highest level of operational standards. All of the nuclear sites are ISO 14001 and EMAS certified.
The Group tries to limit the risk related to the ownership and operation of nuclear facilities by constantly endeavoring to reduce the volume of low- and medium-level radioactive waste produced during operation. Their storage and final evacuation are overseen by the Belgian Agency for Management of Radioactive Waste and Enriched Fissile Materials, known by the French/Dutch acronym ONDRAF/NIRAS. Highly radioactive nuclear fuels are temporarily stored at the electrical power plants until a political decision is taken on whether the spent fuel is to be recycled or not. The volumes of radioactive waste of low and average activity have shown a significant reduction in spite of an increase in production over the last seven years. In fact, related to produced kWh, their volume in 2003 represents about half of what it was in 1995. This result was obtained by constant technical and organizational efforts. Downstream nuclear fuel treatment costs are included in nuclear electricity production costs.
This generation makes it possible to avoid production of CO2 from fossil fuel installations and to contribute toward reducing greenhouse gas emissions. The related liquid and gas emissions remain well below authorized limits.
To the extent substitute solutions could be found, the Belgian government decided to decommission these power stations after 40 years of operation (starting in 2015). Also, reserves have been set aside for the dismantling of these plants (See Note 15 to our Consolidated Financial Statements). A new regulation being drafted in Belgium will more precisely define the rules for use and control of these reserves, which, to the Group’s knowledge, will not involve any additional short-term costs.
The downstream segment of the nuclear fuel cycle represents all operations related to the fuel (primarily enriched uranium, although in certain cases, a mixture of uranium oxide and plutonium oxide) after its use in a nuclear reactor. The costs involved in this portion of the cycle are and will be covered by provisions funded
39
within Synatom (a company owned by Electrabel and Tractebel). These provisions, which totaled approximately €2.5 billion at year-end 2003, are governed by the law of April 11, 2003, as published in theMoniteur belge on July 15, 2003.
Within six months after this publication, the nuclear operators and Synatom were to submit a proposal to change the reserve method “using discounting and capitalization rates corresponding to established financial analysis techniques” (for dismantling provisions and the provisions for handling radioactive materials, respectively), for validation by an Oversight Committee.
Since the Oversight Committee had not yet been established as of December 31, 2003, Electrabel informed the Minister of Economic Affairs that a dossier was available.
Synatom, to which these provisions were transferred, manages the funds collected from Electrabel for the dismantling obligations and the downstream fuel cycle. The full equivalent value of the provisions was loaned to Electrabel on the understanding that, in two years, Synatom will be able to loan only the equivalent of 75% of the value of the provisions, at the market rate for industrial loans, and this prorated amount will be adjusted according to Electrabel’s rating.
Access to renewable energy sources
We continue to develop our access to renewable energy sources. Efforts during the year 2003 were focused on exploration and analysis of several wind capacity projects and adaptation of certain traditional plants to production based on biomass.
Electrabel is making a special effort to adapt traditional plants to production based on biomass. Some projects are being studied or are already in the construction phase. Wind projects are also increasing in number with projects in France (in partnership with CNR), Spain and Italy (in partnership with Gamesa), Portugal and Belgium. In addition, EGI operates 16 biomass plants (wood, biogas and black liquor) in the United States with a total capacity of 208 MW. Tractebel Energia also recently commissioned the Lages biomass plant (22.9 MW) in Brazil.
On the other hand, the development of a wind farm in the North Sea, although authorized by the previous government, is currently delayed because of various political and administrative obstacles.
Finally, Electrabel recently proposed that the public invest with it in various wind projects, by issuing a bond issue designed primarily for residents of the municipalities in question. This issue was quickly subscribed.
Currently feasibility studies for renewable energy projects are conducted in a changing legal context: the quotas of green certificates and their value based on avoided penalties are likely to evolve and differ from one region to the other. Furthermore, sometimes there is a lack of legal certainty due to contradicting laws and directives. This legal situation requires a dialogue with the respective authorities.
In any case, we intend only to develop renewable energy projects with proven economic viability.
Acid emissions
In 1991, Electrabel entered into a voluntary agreement with Belgian authorities to reduce acid emissions from its generating plants. In 2003, this reduction (compared to 1980, the reference year) for SO2 and NOX was approximately 93.2% and 66.0%, respectively. This agreement terminates in 2003. Discussions are ongoing with the authorities to extend these reductions to 2010.
Pathogenic organisms
Certain parts of our installation cooling systems are fed with river water. During certain periods of the year, pathogenic organisms can develop in it, stimulated by a favorable temperature. To avoid or at least control this
40
phenomenon, analysis and studies were carried out during several years and methods were developed to fight these organisms. The operational phase, with targeted monitoring and preventive injection of quantities calculated to minimize the environmental impact, is starting now. The first results meet the objectives. Electrabel’s Belgian laboratory Laborelec assures the scientific follow-up and manages the various phases of application.
PCB
In the 1980’s, several authorities and insurance companies gave the advice to install askarel transformers to reduce the risks of fire hazards within the company’s installations. Later, it was announced that the major chemical element constituting this product, namely the “PCB”, was dangerous for the environment and that its use would be prohibited by 2010. To comply with the international agreement and its implementation at the European and Belgian levels, agreements with the Belgian authorities were adopted to identify the installations concerned and to program their final elimination through authorized circuits. This elimination must be done in a linear way and Electrabel is ahead of the agreed calendar.
ISO 14001 - EMAS
Several generating plants - among them the 2 nuclear sites - received their ISO 14001 certification and/or were registered in the EMAS system. Procedures aimed at improving environmental performances continue and certification processes are ongoing.
41
ENVIRONMENT
The sale of Ondeo Nalco in 2003 and plans for the transfer of shares of Ondeo Industrial Solutions (OIS) to SUEZ Environnement led to the closure of the SUEZ Environnement Industrial Services (SEIS) division. In the Environment businesses, our operations are now carried out only by SUEZ Environnement.
SUEZ Environnement provides equipment and services essential to life and to the protection of the environment in the water and waste service sectors: production and distribution of drinking water, collection and treatment of waste water, recycling and waste treatment. It performs 75% of its operations in the European Union, which remains the primary target of its business activity and its development.
SUEZ Environnement sells its services and equipment under the International brands Ondeo, Degrémont and SITA, and seeks to create synergies (particularly commercial) among its core businesses to improve service effectiveness, using a decentralized, customer-based organization.
Ondeo is active through the entire water cycle:
| | • | Production, treatment and distribution of drinking water; |
| | • | Purification of waste water and sludge recycling; |
| | • | Collection and treatment of rainwater; |
| | • | Management of water resources; |
| | • | Management of customer relations. |
Ondeo combines the skills of its personnel and technical resources in water services, and relies on an advanced research center that allows it to offer long-term partnerships and solutions adapted to the needs of its customers.
Degrémont is the water treatment station specialist within SUEZ Environnement.
As designer, builder and operator, Degrémont offers local municipalities expertise in drinking water production facilities, desalination plants, purification stations and sludge treatment facilities. With over 10,000 water treatment facilities constructed around the world, Degrémont is a global specialist in water treatment.
SITA offers services in all waste segments:
| | • | Waste collection, sorting, treatment and recycling for local municipalities, consumers and manufacturers |
| | • | Material, energy and agricultural waste recycling |
| | • | Urban cleanup and sanitation |
| | • | Industrial waste services. |
According to internal estimates based on data published by our competitors, SITA is ranked third worldwide and first in Europe in revenues.
Water and Waste Services were consolidated in 2003. This year also saw the implementation of the 2003-2004 action plan designed to improve operating profitability, reduce risks, particularly emerging country risk, and reduce debt.
42
SUEZ Environnement
Organization and key figures
The following table presents comparable key figures for the Environment business, excluding Ondeo Nalco and OIS, for the last three fiscal years.
| | | | | | |
| | | Year ended
|
| | | Dec. 31, 2003
| | Dec. 31, 2002
| | Dec. 31, 2001
|
| | | (in € millions, except employee data) |
Revenues | | 12,142 | | 12,939 | | 12,348 |
Gross operating income(1) | | 1,950 | | 2,380 | | 2,575 |
Capital employed(2) | | 8,639 | | 14,454 | | 16,349 |
Number of employees | | 82,500 | | 97,040 | | 91,500 |
| (1) | Gross operating income represents our measure of segment profitability. For a reconciliation to our consolidated operating income, see Note 22 to our Consolidated Financial Statements. |
| (2) | Capital employed represents our measure of segment assets. It is reconciled to total assets in Note 22 to our Consolidated Financial Statements. |
Organization
The consolidation of the water and waste services was initiated in June 2002 and resulted in the absorption of SITA by Ondeo Services. Since May 1, 2003, effective retroactively to January 1, 2003, the company resulting from this operation was renamed SUEZ Environnement.
SUEZ Environnement is involved in delegated water and sanitation management, water treatment engineering and waste collection and treatment.
The various operations of SUEZ Environnement come under the following four operating divisions:
| | • | Water and Waste Services International |
These divisions are supported by central and joint operating departments that were restructured after the merger. This restructuring, which was submitted to an information and consultation procedure among the corporate partners, will reduce the total work force from 725 in 2002 to approximately 490 in 2004.
Water Europe
Europe in the main market for SUEZ Environnement in the water segment.
Lyonnaise des Eaux France represents 69% of our revenues earned in Europe, with the balance primarily generated in Spain through our partnership with Agbar.
After the sale of 75% of the Northumbrian Group (United Kingdom) in May 2003, this company is now consolidated under the equity method (with no impact on revenue), but remains a pillar of our European organization to the extent that SUEZ Environnement remains the largest shareholder and the only industrial shareholder.
43
SUEZ Environnement is also present in Germany (Eurawasser) and Italy (Acque Toscane and Nuove Acque), two markets that have interesting development prospects.
Waste Services Europe
Since the sale of its activities in Spain, SUEZ Environnement has focused on the following subsidiaries: SITA France and TERIS for hazardous waste in France, SITA UK, SITA Deutschland, SITA Nederland, SITA Sverige in Scandinavia and SITA Belgium.
SUEZ Environnement is pursuing a profitable development strategy in France (sorting, recycling, composting and industrial services) as well as in Sweden (collection) and other European countries. The subsidiaries in Germany, the United Kingdom and Belgium have been restructured to improve organization and to take into account the transnational nature of the activity.
Water and Waste Services International
Outside the European Union, SUEZ Environnement is active in 27 countries, but is primarily focused on Central Europe and six countries, the United States, Argentina, Chile, Brazil, Morocco and China.
The combined organization of Water and Waste Services activities allows it to generate cost synergies in the field, offer joint products and, depending on the country, to build on the commercial development already achieved by each business.
Degrémont
Degrémont, a wholly-owned subsidiary of SUEZ Environnement, is the water treatment plant specialist.
Degrémont is structured to reflect the organization of its markets. The Europe business line (sub-divided into Southern Europe and Northern Europe) and the International business line are organized as profit centers and have their own funding on the commercial and production sides. The pooling of engineering resources and experts, the establishment of a network of local correspondents (technical directors, executive directors, etc.) and a worldwide network or research offices (India, China, Chile, Europe) allow them to overcome geographic boundaries, and to mobilize all of our resources based on the needs of the businesses. Degrémont’s restructuring in 2003 allowed it to consolidate its achievements, by successfully completing current projects and winning new contracts.
Strategy and Commercial Development
Within the framework of our action plan, SUEZ Environnement’s strategy is targeted at reducing debt and consolidating its positions while pursuing a policy of profitable organic growth.
This strategy has led to two significant changes in the SUEZ Environnement portfolio:
| • | in May 2003, the sale of 75% of the Northumbrian Group, which reduced our net debt by €3.1 billion. This sale also allowed it to refocus on less cash-intensive activities (NWL, Northumbrian’s regulated activity and its principal asset, will continue to require very high levels of investment in the years to come, which was not consistent with the goal of improving our free cash flow). |
| • | in November 2003, the sale of all shares in CESPA, the Spanish waste services management operator. In Spain, SUEZ Environnement maintains operations in the hazardous waste field through ECOCAT, which is 50% held by TERIS. |
44
Also in 2003, SUEZ Environnement continued to try to resolve difficulties relating to certain contracts, particularly in Argentina, Jakarta, Manila and Puerto Rico.
In Argentina, although the macro-economic environment has stabilized, it continues to suffer from the peso devaluation. Negotiations between the water concession holders and the concession granting authorities have neither resulted in the implementation of rate increases nor defined new guidelines to permanently restore a financial and economic equilibrium for the Argentine contracts. However, an interim agreement (Acta Acuerdo) relating solely to the year 2004 was signed on May 11, 2004. This agreement allows Aguas Argentinas to continue its operations and to complete its investment program aimed at providing service to 11 million customers in the Buenos Aires region. It also lays down the main principles for renegotiating the Buenos Aires concession contract. Similar interim agreements are currently under discussion for the Santa Fe and Cordoba concessions. Pursuant to the Franco-Argentine Bilateral Investment Protection Treaty, the concession holders and their shareholders launched arbitration procedures in April 2003, before the International Center for Settlement of Investment Disputes (ICSID). Assuring continued operations, as favored by us, these procedures would seek to implement measures to restore the financial and economic equilibrium of the Argentine concessions and obtain a reasonable indemnity from the Argentine government. In the event of an alternative termination scenario, the procedure would seek an indemnity to compensate us and the other shareholders for their investments and the losses incurred since the devaluation’s onset. The arbitration tribunal was recently set up, but the proceedings have not formally begun. At the same time, discussions with multilateral organizations (BID, IFC) have been held regularly since the beginning of the crisis in 2002, in order to determine a debt restructuring plan that would reduce the debt servicing requirements of concession holders as part of a global renegotiation of the concession contracts. The multilateral organizations are regularly informed of the progress of negotiations with the Argentine government.
In Jakarta, negotiations were held with the concession-granting authority and resulted in authorization to increase prices significantly. These increases are currently being contested by consumer associations. Legal proceedings are currently underway at the appeal stage before the Indonesian courts. Uncertainties remain over the outcome of the negotiations to enable the contract to meet profitability expectations and guarantee its long-term future. The provisions recorded in 2002 to cover all of our commitments were maintained in 2003.
In Manila, the attempt to withdraw from the concession contract using the termination notice, filed before the Appeals panel, was rejected on February 7, 2003. On November 7, 2003, the arbitration tribunal ruled that the concession contract could not be terminated and that the concession fee owed by Maynilad (Philippines) had to be paid. Since that date, negotiations have continued between MWSS (concession-granting authority), the lending banks and the company’s two shareholders (SUEZ Environnement, 40% and Benpres, 60%), in order to reorganize the company and ensure its long-term viability. In 2002, we fully provisioned our exposure under this contract. As a result of these negotiations, we now intend to reduce our stake in and corresponding exposure to the company.
In Puerto Rico, in the face of economic conditions considerably different from initial projections and in the context of our 2003-2004 action plan (to negotiate or terminate contracts if their long-term viability cannot be maintained), Ondeo de Puerto Rico reached an agreement with the Puerto Rico Aqueduct Sewer Authority (PRASA) on January 13, 2004 to terminate our agreement signed in May 2002. This Operations and Maintenance contract, signed in May 2002, covered the management of water and sanitation services for the entire island. Despite what we consider to be significant improvements in the quality of water service on the island, parties were unable to agree on a way to continue the contract in its current form. As from April 1, 2004, the island’s government will resume the management of water and sanitation services on the island with the assistance of Ondeo de Puerto Rico. All the costs incurred in pulling out of the contract identified before approval of the 2003 accounts were provisioned in 2003.
As confirmed by the list of events marking the fiscal year, the development strategy is based on profitable organic growth, with priority given to Europe, through an increase in more modest-sized contracts. Demand for
45
environmental services is growing, particularly in European countries, where environmental standards encourage increasingly sophisticated and reliable services. The pressure applied on all sides on public expenditures and the prices of public services also encourages greater efficiency and, therefore, promotes new markets for private companies in these sectors, particularly within the framework of public-private partnership agreements.
Given its No. 2 position in the Environmental Services sector in Europe, the Group believes that its recognized experience, competitive positioning, and size are factors that will allow it to take advantage of this growth, while obtaining the best outside financing available for its infrastructure (European funds, bilateral aid, etc.) and/or partnership agreements with local companies.
Outside Europe, SUEZ Environnement is active in 27 countries, but is primarily structured around a strong presence in Central Europe and six key countries: the United States, Argentina, Chile, Brazil, China and Morocco. The challenge for SUEZ Environnement in these countries is to consolidate its positions and optimize profitability before planning new growth.
In the rest of the world, highly selective new projects may be planned with the assistance of international financial institutions so long as they meet the Group’s requirements for profitability and risk reduction, particularly in emerging countries.
2003 Significant events
January 2003
| • | Under an international bid tender, ACEA S.p.A. and Ondeo Italy won the concession for the Pisa region in Tuscany, in partnership with Banque Monte dei Paschi di Siena and the Caltagirone Group. This contract represents prospective revenues of €1,200 million over 20 years, serving 800,000 residents. |
| • | SITA Sverige (Sweden) acquired ENISTA (Norrköpping), a industrial and municipal collection company in Sweden (€15 million in annual revenues). |
| • | SUEZ Environnement completed the sale of SITA Ireland Limited for €6 million. |
February 2003
| • | Degrémont implemented contracts in Tours (upgrade of the purification station, revenues €13 million), Tripoli and Chekka in Lebanon (construction and operation of purification stations, revenues €38 million), and Chembarrabakan at Chennai, India (construction of a drinking water plant, revenues of €21 million). |
March 2003
| • | Degrémont modernized the drinking water production plant at Lamaload (UK) (revenues of €8 million). |
| • | The mutual termination agreement between United Water and the City of Atlanta became effective March 26, 2003. Under this agreement, United Water transferred operations to the city on April 28, 2003. |
April 2003
| • | On April 4, 2003, Lyonnaise des Eaux France and Ondeo Industrial Solutions won the Ascométal industrial water contract at Fos-sur-Mer for a period of 16 years, with prospective revenues of €16 million. |
| • | TERIS purchased from DuPont the toxic waste incinerator of Loon Plage (revolving furnace). After restoration, the furnace was started up in September. |
46
May 2003
| • | Initiated in June 2002, and approved by the Shareholders’ Meetings of SITA and Ondeo Services on April 30, 2003, the takeover and merger of SITA by Ondeo Services became effective May 1. Ondeo Services adopted the new name “SUEZ Environnement.” |
| • | On May 23, 2003, SUEZ Environnement sold 75% of the Northumbrian Group to a consortium of institutional investors. This sale, which generated a loss of €360 million, allowed a significant reduction in our debt of €3.1 billion and a significant improvement in cash flow. With an ownership interest of 25%, SUEZ Environnement remains the largest and only industrial shareholder in the Northumbrian Group, which was listed for trading on the London Stock Exchange on September 23, 2003. |
| • | SITA Deutschland won two contracts for the treatment of household waste by incineration in the Leipzig region as of June 2005, for a period of 15 years (annual revenues of around €15 million). |
June 2003
| • | SITA UK won the contract for the collection of household waste in Newcastle (208,000 residents), for 5 years, with total prospective revenues of €12 million. |
| • | Degrémont won the construction contract for the Saint-Cloud drinking water plant, for a total of €13 million, on behalf of Sagep (Société Anonyme de Gestion des Eaux de Paris). |
| • | In October 2002, the Ondeo Halifax Regional Environmental Partnership (HREP) joint venture signed an agreement in principle with the Halifax Regional Municipality (HRM), Nova Scotia, Canada to build and operate a waste treatment network and three new plants to clean up Halifax Bay. During negotiations, disputes arose that resulted in the abandonment of the project in its initial form. Negotiations started again at the end of the year 2003. These negotiations were successfully completed in June 2004 with the signature by Degrémont of a wastewater treatment contract valued at €80 million with the HRM. |
July 2003
| • | The Castres contracts (water and sanitation services) were terminated by the city on July 1, 2003. On July 31, 2003, Lyonnaise des Eaux France filed an application to set this resolution aside. In October, the Mayor was informed of a request for payment of a penalty. |
| • | On July 1, 2003, Ondeo Industrial Solutions and Surca signed a 10-year agreement to construct and operate the purification station of the BSN bottle manufacturing plant, and to manage the industrial waste (contract of €5 million for operation and €0.6 million for construction). |
| • | SUEZ Environnement sold its Danish waste treatment operations for €10 million. |
August 2003
| • | Degrémont began a contract to construct the Valenton (Seine-Amont) sledge treatment unit for a total of €61 million. The plant currently under construction for SIAAP (Syndicat Interdépartemental de l’Assainissement de l’Agglomération Parisienne), will produce 200 tons of dry waste per day, and will be the largest facility of this type in Europe. |
| • | Degrémont signed a contract to build four drinking water production plants with Nopswad (National Organization for Potable Water and Sanitary Drainage) in Egypt, representing total prospective revenues of €15 million. |
47
September 2003
| • | On September 18, a new communications / prevention tool was deployed by Lyonnaise des Eaux France and its subsidiaries, providing real-time information to consumers in the event of health risk. This service is offered to all municipalities managed by Lyonnaise des Eaux France and its subsidiaries, which represents 14 million individuals. |
| • | Degrémont won the construction contract for a drinking water production plant by sea water desalination in Curaçao (Dutch Antilles) for €21 million. |
| • | Degrémont began the contract to design, build and operate a drinking water production plant through brackish water desalination at Wadi Ma In (Amman) in Jordan (revenues of €33 million). This plant will increase the quantity of drinking water available to Amman residents by 40%. |
October 2003
| • | The Béthune Regional Court (Tribunal de Grande Instance) engaged SITA France to acquire the Metaleurop Nord site at Noyelles-Godault (Pas-de-Calais). The project will allow very rapid cleanup and conversion of the 37 hectares of the former smelter, which is among the most heavily polluted industrial sites in France. |
| • | Built by Degrémont, the wastewater treatment station at La Farfana, the largest in Latin America, was inaugurated on October 29. The La Farfana plant, managed by Aguas Andinas (a joint subsidiary of SUEZ Environnement and Agbar), will treat the waste water of 3.3 million inhabitants of Santiago. Combined with the El Trebal station, which is also managed by Aguas Andinas, this facility will purify 75% of Greater Santiago’s waste water. |
November 2003
| • | On November 5, Agbar and SUEZ Environnement sold Ferrovial their ownership interests in CESPA which held their waste service operations in Spain and Portugal. The price set for the entire transaction was €519 million. |
| • | Lyonnaise des Eaux France won the public service delegation contract for the city of Toul in Meurthe and Moselle (17,000 inhabitants) for a period of 12 years (accumulated total revenues of €10 million). |
| • | SITA UK obtained an extension on the 7-year waste treatment contract for North Lincolnshire (total revenues of €34 million). |
| • | Degrémont won the Mexicali (Mexico) contract to supply drinking water to a portion of Mexico City (revenues of €17 million and began the Tiebas and Pineda contracts in Spain (revenues of €6 million and €7 million, respectively) as well as Yiangiu in Korea (€13 million). |
December 2003
| • | Lyonnaise des Eaux France won the contract to provide services for the Vendee Département Syndicate (12,000 inhabitants) for 12 years, with cumulative sales revenues of €12 million. |
| • | The Paris City Council approved an amendment providing for Lyonnaise des Eaux France to take over customer and meter management activities on the Left Bank, which had previously been performed by an economic interest group managed by Companies des Eaux de Paris. |
| • | Eurawasser was selected to acquire a stake of 28.9% in LWG (Lausitzer Wasser GmbH), which manages water and sanitation services for a portion of the city of Coltbus (140,000 inhabitants in Germany, near the Polish border). |
48
| • | Degrémont implemented a contract for all sanitation operations for Greater Amman in Jordan for 25 years ($78 million in construction for Degrémont and the Group’s share of annual revenues of $8 million); the contract includes the design, construction of the wastewater treatment plant of Khirbet As Samra, operation of the Ain Ghazal pre-treatment station, and operation of the entire plant, as well as the pumping stations for the governorship of Zarqa. The new plant will cleanse water for the 2.5 million inhabitants of the city of Amman. |
January 2004
| • | On January 12, the district of Bogotá notified the company Bogotana de Aguas (a company jointly held by SUEZ Environnement and Degrémont, which owns and operates the Salitre wastewater treatment station under the BOT contract with the district of Bogotá) of unilateral termination for reasons of public interest. |
Business Activities
Although the Group is in the process of integrating all of its industrial processes, the description of SUEZ Environnement’s activities is provided on a business-by-business basis.
Water Management
SUEZ Environnement provides water and/or sanitation services to consumers in 24 countries in Europe, Asia, North and South America and Australia, and is the second-largest water management service provider in Europe,6 serving 35 million drinking water customers and 20 million waste service customers. It manages reservoirs, aqueducts, distribution networks (water mains and connection pipes), wastewater networks, and treatment plants for municipalities, other local government entities and industry.
Its activities also include meter reading and collecting payments from end users. Operations vary depending on the country and customers served. The Group generally operates under the following types of contracts:
| • | Operation and maintenance contracts: these contracts are signed with a local government that has financed and built its own facilities. They appoint a Group subsidiary as operator for a period generally ranging from 5 to 20 years, and the subsidiary bills the local government for its services. |
| • | Concession contracts: these contracts cover the management of water and/or waste management services as well as renovation and extension of services. These contracts may also cover the construction and financing of new facilities. Under this type of contract, we usually bill consumers for our services. When a Group subsidiary builds sanitation and management facilities, it generally operates them for periods ranging from 20 to 30 years, after which ownership is transferred to the local authorities. In some cases, the Group also owns the assets. |
France
In France, local governments are responsible for the management and distribution of drinking water, and for collection and treatment of wastewater. They may delegate these activities, in whole or in part, to private companies through concession or operations and management contracts. The industry estimates that private companies provide drinking water distribution services (thus billing the consumer for the entire water and sanitation service) for approximately 80% of the population7, although their revenues represent only about 35% of the water market in France8, compared with the local governments’ portion (approximately 45% of the market) and the taxes and fees collected on behalf of the Water Agencies and the State (approximately 20%).
6 Source: Masons Water Yearbook 2003-2004.
7 Source: Information report on water management in France, prepared on behalf of the Territorial and Sustainable Development Delegation by Mr. Jean Lounay, recorded in the National Assembly on November 3, 2003.
8 Source: “The status of eco-enterprises” – Economic Studies and Environmental Evaluation Office – Ministry of Ecology and Sustainable Development, December 18, 2003.
49
Lyonnaise des Eaux France, a subsidiary of SUEZ Environnement, is the second largest private company in the French drinking water market.
In the wastewater collection and treatment market, approximately 53% of the population is served by private companies and 47% by municipalities.
The Group’s contracts in France, both for water distribution and wastewater services, are generally for periods ranging from 10 to 20 years.
European Union
In the European Union outside France, SUEZ Environnement operates through ownership interests in publicly traded companies in Spain and Great Britain, as well as through contracts, particularly in Italy and Germany.
Northumbrian Water Group, in which the Group retains a stake of 25% after the sale of 75% of the company in May 2003, builds and operates water and wastewater installations primarily in the U.K., but also in Ireland and Gibraltar.
In Spain, we have a 25.8% interest in Aguas de Barcelona (Agbar), which holds the concession agreement for Barcelona, and is the private sector market leader in Spain for water distribution. Agbar has developed a strong presence in Latin America, in particular in Argentina, Chile, Colombia, and Uruguay. Most of our operations in Latin America are undertaken in partnership with Agbar.
In Italy, the Group (which is already present in Tuscany, particularly Arezzo) won several bids in 2003 in joint ventures with ACEA and other partners.
In Germany, the Group (which was already present in Rostock) won the 2003 bid for the partial acquisition of the Cottbus Water management company.
International
Outside the European Union, SUEZ Environnement provides drinking water and wastewater services in partnership with local financial investors or municipalities, or through subsidiaries or companies majority-owned by local interests. In the water management sector, the Group’s revenues outside the European Union represent about 34% of total revenues (28% excluding Puerto Rico). The Group’s concession contracts outside France are generally for periods ranging from 25 to 30 years.
SUEZ Environnement has been active for many years in some of the 10 countries which recently joined the European Union: the Group provides drinking water and sanitation services to several regions in the Czech Republic, where it has been present since 1993, and drinking water services to Budapest, Hungary (in partnership with RWE). It has also been active since 1994 in two other cities of Hungary and, since 1999, in Trencin, Slovakia. It manages a contract for the construction and operation of the Maribor purification station in Slovenia.
In Morocco, the Group won a 30-year concession contract in 1997 with the city of Casablanca to provide drinking water, electricity, and wastewater collection services to approximately 4 million people. The group also has an operation and maintenance contract in Amman, Jordan and in late 2002 obtained similar contract in Tripoli, Lybia.
In the United States, over 80% of water services are supplied by municipal or government agencies9, which are increasingly seeking partnerships with private operators for the supply of drinking water and wastewater services. United Water Resources (UWR), a Group subsidiary, is the second-largest company in the municipal,
9 Source: Masons Water Yearbook 2003-2004.
50
rate-regulated market (through 83 subsidiaries). Its principal business is providing water and sanitation services for consumers in areas where its regulated utility subsidiaries have franchises or other rights to provide these services (rate-regulated market). UWR is present in 18 states, mainly in the eastern United States. In the deregulated market, United Water Services provides water distribution services under operating and management contracts with municipal governments. See Item 8.B. “Significant Changes”.
In South America, we are the leading international company for water, serving 22 million people. Argentina was the first Latin American country to deregulate water services. We have been active there through Aguas Argentinas since 1993, when we obtained the Buenos Aires concession for water and wastewater services (7.8 million people served) for 30 years. Despite the difficulties encountered as a result of the devaluation of the Argentine peso and the failure of the Argentine authorities to approve contractual rate increases, we have maintained our operating presence in Argentina. We also have 30-year concession agreements for Santa Fe and Cordoba, Argentina, and for La Paz, Bolivia. In addition, we supply water services to Santiago, Chile (more than 5 million consumers), to a part of Mexico City and to Limeira and Manaus, Brazil.
In Asia, we have a 25-year water management concession contract for Macao. In China, we are present through 17 joint ventures with municipal authorities for the production of drinking water. In Malaysia, we have water distribution contracts with three states to serve 1.8 million consumers.
In Manila, negotiations are currently under way to modify the Group’s operations. In Jakarta, uncertainty exists regarding the outcome of negotiations that would allow the Group to continue operating under acceptable conditions.
Water treatment stations
SUEZ Environnement is one of the world’s leading companies in urban water treatment engineering through Ondeo Degrémont, its wholly owned subsidiary. The Group designs, builds, and sometimes operates:
| • | drinking water production plants, |
| • | waste water treatment plants, |
| • | desalination plants, and |
| • | sludge treatment plants. |
Ondeo Degrémont provides all turnkey construction services, including engineering, construction, site management, and start-up services. At December 31, 2003, Ondeo Degrémont had built more than 10,000 sanitation facilities around the world. As urban populations increase throughout the world, the growing importance of water quality and sanitation as well as wastewater treatment have resulted in increased demand for sanitation infrastructures. In addition, the development of this business in emerging markets such as China, Egypt, Argentina, Chile, and South Africa has been facilitated by the recent policy of the World Bank, the Inter-American Development Bank, and other multilateral financial institutions which have given priority to basic infrastructures and set up financing solutions which have allowed Degrémont to grow without increasing the Group’s exposure in these countries.
Waste Services
The range of SITA Waste Services business activities has grown with regulatory, technical, and economic changes, and with the increasingly specific demands of its customers: in Europe, the development of re-use, recycling, materials recovery, and waste-to-energy conversion; in the Asia-Pacific region, improvements in the reliability of treatment plants and the development of urban services; in Latin America, the adoption of environmental standards.
51
The Group is active not only in waste collection but also in waste recycling and treatment in all of its forms: materials recovery and waste-to-energy conversion, stabilization, storage and others. During the 1990s, SITA was a pioneer in selective domestic waste collection. It owns a fleet of 12,700 heavy trucks equipped for selective collection of packaging, large objects, and medical and industrial waste. The Group also carries out onboard, computerized identification and weighing for diverse applications: optimization of collection runs, invoicing based on weight, etc. In 2003, the Group collected 27.7 million tons of domestic, non-hazardous industrial and medical waste.
Prior to any form of treatment, the waste is processed through 223 sorting and conditioning centers to facilitate the supply of “ready to recover” materials to various treatment channels. Sorting centers, specialized in recycling domestic waste and industrial packaging, are the cornerstone of the recycling industry. They provide a regular flow of quality materials to the recyclers and, for the waste producers themselves, constitute an approved, long-term resource for disposal. In 2003, these centers received 9.4 million tons of waste, of which 5.5 million tons have been recycled.
SUEZ Environnement’s 111 composting platforms reproduce natural biological decomposition and oxygenation of organic matter on an industrial scale. These platforms are more or less sophisticated, depending upon whether they handle green waste or sludge. In the latter case, additional technical investments are necessary to ensure an odorless process and a sanitized product. In 2003, the Group composted 1.4 million tons of organic waste.
In its 51 installations worldwide, nearly 46 of which have waste-to-energy capabilities, SUEZ Environnement offers the best available expertise in urban waste incineration technologies in France and, through Novergie, in Belgium, the United Kingdom, and Taiwan. This activity is subject to numerous regulatory controls aimed at minimizing environmental impacts (smoke, ash) and converting the energy produced by waste combustion into heat or electricity. In 2003, 5.6 million tons of domestic, non-hazardous industrial, and medical waste were incinerated.
Storage is the predominant way of treating waste in many countries. SUEZ Environnement rigorously adheres to all regulatory, technical, and environmental requirements that apply to its 223 open landfills. Upstream, landfill site selection must satisfy strict specifications concerning, among others, soil quality, absence of contact with ground water, and minimum distance from residential areas. Downstream, in the operational phase, all filling is planned and controlled; effluents (biogas and leachates) are captured, recovered, or eliminated, and all environmental parameters are regularly assessed according to a strict schedule. Once closed, these landfill sites continue to be monitored for a period of thirty years, and are bonded by a bank guarantee. SUEZ Environnement operates landfills throughout the world: in 2003, 29 million tons of domestic and non-hazardous industrial waste were processed at its landfills.
Expertise in hazardous industrial waste treatment is provided by Teris and Teris North America, wholly owned by subsidiaries of SUEZ Environnement, for Class I storage in France, by SITA France Déchets (100% owned by SUEZ Environnement) and in Brazil by Essensis. SUEZ Environnement can thus offer its customers solutions adapted to every type of hazardous industrial waste, conditioning quantities as small as 100 grams (particularly for hazardous domestic waste or laboratory waste) up to several hundred of tons. In 2003, SUEZ Environnement treated 3.7 million tons of hazardous industrial waste through pre-treatment processing on ad hoc platforms, stabilization in Class I storage centers, incineration of highly chlorinated or high sulfur-content waste, and co-incineration in cement kilns. The latter specialty led to a fossil fuel savings of 287,900 tons of petroleum equivalent.
Teris North America provides incineration of hazardous industrial waste in the United States through on-site sales teams and services (100 employees) and a logistical organization with 13 hubs that covers the entire country, offering materials recovery services for waste containing sulfur or chlorine and waste-to-energy conversion.
52
Through its sanitation and industrial maintenance activities, SUEZ Environnement provides local governments, individuals, and industrial customers sanitation, industrial cleaning (during plant shutdowns, for example), industrial hazardous waste collection services, and more specific services such as oil work, system monitoring, and even water reservoir cleaning.
Urban sanitation is an urban lifestyle issue as well as a public health necessity. The Group’s municipal cleaning services include manual and mechanized street sweeping, street furniture maintenance, poster and graffiti removal, dog litter clean-up, snow removal, beach cleaning, trash receptacle maintenance, organization of civic awareness campaigns, and so on. Other services are offered according to local needs, such as in Spain, where SUEZ Environnement provides municipal parks and gardens maintenance services.
The Regulatory Environment
Water
The environmental laws and regulations governing the Group’s water businesses in Europe arise primarily from four European Union directives:
| • | The Urban Wastewater Treatment Directive of May 21, 1991, which establishes minimum quality standards for wastewater and sludge treatment in urban areas with populations of 2,000 or more. This directive will be applied progressively until full application in 2005. |
| • | The Nitrates Directive of December 12, 1991, concerning the protection of ground water against pollution by nitrates used in agriculture. |
| • | The Drinking Water Quality Directive of November 3, 1998, revised from the 1980 directive to improve water quality standards. The new regulatory standards must be met by December 2003 at the latest, with the exception of requirements relating to lead, whose deadline for compliance has been postponed until 2013. |
| • | The Water Framework Directive of December 22, 2000, establishing a regulatory framework for Community action in the area of water policy to protect inland surface waters, coastal beaches, and ground water supplies, with a view to preventing their pollution, promoting their sustainable use, and protecting their environments. It establishes a “good ecological status” objective and calls for a transition from a resource-based to an objectives-based approach. It also introduces a requirement for Member States to establish rate policies encouraging consumers to conserve resources starting in 2010. |
There is also a draft European Union directive on sludge, sanitation and bio-waste, which favors the recycling of bio-waste by encouraging the spreading of sludge and compost on the soil.
The primary effect of these strengthened directives will be an increase in capital expenditures on infrastructure and the increased cost of water analysis and monitoring by operators. The Group’s contracts generally protect it from the effects of regulatory changes by providing a corresponding amendment to contract rates. Furthermore, we expect such changes to create additional development opportunities for Ondeo Degrémont, as customers may need to build new plants, replace or upgrade existing facilities, and tap into cutting edge technologies. These are all services Ondeo Degrémont can provide.
European directives have been implemented into national law in the main European countries in which the Group operates, often with additional legislative provisions specific to each country.
In France, water management is regulated primarily by the Sapin law of 1993, which defines the public bidding procedure for government contracts with the State, municipalities, and public institutions. Local governments, usually municipalities or regional groupings, have the option of managing drinking water
53
distribution and sanitation themselves, or delegating these activities, in whole or in part, to private companies through concession contracts. Such concession contracts establish the respective obligations of each party, particularly regarding rates. They do not transfer the ownership of existing assets to the management company. Under the Mazeaud law of 1995, management companies are required to publish an annual financial report. A bill introduced before the French Parliament in 2001 that might have reduced the term of water service contracts was withdrawn in 2002. Governmental efforts are currently being made to develop a new bill.
In England and Wales, where water services are fully privatized, asset ownership is transferred to the management company. The supervisory authority consists of several regulatory agencies, including OFWAT (Office of Water Services), which establishes applicable standards, promotes competition among water companies, and grants long-term licenses for exclusive operation in a geographical area. OFWAT has the authority to determine rates and investments for five-year periods.
The Group’s activities in the United States are also subject to environmental, health, and safety regulations by local, state, and federal authorities.
In the United States, water management is regulated at the national level primarily by the Clean Water Act of 1972 and the Safe Drinking Water Act of 1987, developed by the Environmental Protection Agency. The federal government plays a major role in regulating the water industry but the States retain power over investment planning and the management and operation of facilities. In the regulated sector, each state has a Public Utilities Commission that sets rates for water and sanitation services and determines utility companies’ rate of return on their equity. Municipal water agencies need only justify their rates before the city council, however. In the deregulated sector, each municipality is free to set the terms and rules of attribution of its public-private partnership contracts. Contracts are generally awarded subject to competitive bidding procedures.
Waste Services
SUEZ Environnement operates in a strictly controlled regulatory framework. Contract awards by public sector entities are subject to the public procurement code in France and, more broadly, to European Directives requiring calls for tender for contract awards. Waste storage and treatment sites must obtain operating permits and are regularly inspected. Finally, customers themselves are required to respect environmental standards.
As a general rule, European Union directives establish priorities among waste treatment methods: reduction at source of waste produced, re-use, recycling, biological recovery, waste-to-energy conversion and, finally, as a last resort, disposal. The “producer-polluter pays” principle is also a major element of European legislation, particularly for some solid waste streams such as end-of-life vehicles, waste packaging, waste electrical and electronic equipment, batteries, and tires.
The primary European directives that apply to the Group’s waste activities are:
| • | The Waste Framework Directive of July 15, 1975, which is the first European directive governing waste treatment and disposal. This directive promotes prevention and reduction of waste production by requiring the use of cleaner technologies to protect the natural environment. It also introduced the “producer-polluter pays” principle. It was amended by the Directive of March 18, 1991, which sets objectives for the reduction of waste at the source and lists the various ways of treating waste (recycling, composting, incineration with waste-to-energy conversion, disposal). |
| • | The Packaging Directive of December 20, 1994, concerning packaging waste, addressing reduction at source and other methods aimed at reducing the impact of packaging waste on the environment. It sets recycling and recovery objectives, with specific figures, for packaging released onto the European market. The directive is currently undergoing revision with a new version expected to come into effect in 2003. |
54
| • | The Landfill Directive of April 26, 1999, which establishes new standards for landfill site management, dealing with issues such as containment as well as control and monitoring obligations. This directive has been transposed into French law and establishes landfill operator obligations for a period of thirty years after site closing. We estimate the impact of these measures on the cost of land filling to be between €3 and 20 per ton, the amount varying substantially with local conditions. |
| • | The Waste Incineration Directive of December 4, 2000, which relates to all hazardous and non-hazardous waste categories and sets strict emission limits for all incineration equipment in order to protect health, air, water, and land quality. |
| • | Other existing or planned directives address specific waste streams from the perspective of “producer-polluter” responsibility (end-of-life vehicles, waste electronic and electrical equipment, batteries, tires, etc.). |
The Group’s objective is to systematically meet or exceed all qualitative and quantitative requirements that apply to it. An action plan has been established for this purpose in each of its major business areas:
| • | In waste collection, the Group’s aim is to reduce greenhouse gas emissions by using “green” vehicles (electric-powered, natural gas, or low-sulfur-emitting diesel run engines) under acceptable economic conditions and optimizing collection itineraries to reduce fuel consumption, noise pollution, and carbon dioxide emissions. |
| • | In non-hazardous waste treatment, the Group’s policy is to develop recycling, produce high-quality compost, and generate green energy from its incineration plants and technical landfills. For its technical landfills, SITA has initiated a methane capture program whereby the captured gas is burned in order to reduce the greenhouse effect and, where economically feasible, produce electricity. |
| • | SUEZ Environnement, in partnership with cement-makers, is developing high-temperature incineration of hazardous waste using specialized furnaces. Hazardous waste recycling is also being carried out through reconditioning of used oil and solvents. |
| • | SUEZ Environnement is also actively engaged in soil restoration and clean-up, either through on-site operations at contaminated sites or by extracting materials for treatment in its specialized facilities network. |
Markets And Competition
Markets
The water industry has greatly evolved since the late 1980s, from being largely dominated and operated by public entities to a market in which the role of the private sector is growing and consolidating.
We believe that our public-private partnerships have major long-term development potential, particularly in Europe. As of December 31, 2003, only 4 of the 15 member countries of the European Union complied fully with current European environmental standards. The 10 member countries newly admitted to the European Union in 2004 must upgrade to be in compliance with European environmental standards. Additionally, the pressure on government budgets and greater consumer demand for efficiency in public utilities is pushing many European countries to develop public-private partnerships.
The action plan developed by the Earth Summit on Sustainable Development emphasizes the fact that healthy drinking water supplies and adequate sanitation services are necessary to protect human health and the environment. In this regard, the Millennium Declaration calls upon nations to commit themselves to reducing the proportion of people without access to safe drinking water, or who are unable to afford it, by half by 2015. The
55
56
World Bank estimates that $26710 billion in investment will be necessary to meet this objective. While this presents significant growth opportunities for water management services, these opportunities are associated with potentially high risks, including currency exchange risks and insufficient legal security. We intend to carefully consider and try to hedge such risks before commencing operations in such countries.
Although municipalities are turning increasingly to private sector companies, however, the latter still serve only approximately 8% of the world’s population. Local situations vary greatly. In France, most municipal water systems are run by private companies. In England, all customers are served by private companies, ever since the privatization of the water sector in 1989. In the United States, however, the private sector serves less than 20% of the population.
The waste management market has significant growth potential, especially in Europe, which is developing its own environmental model, distinct from the American one. Europe is becoming stricter (raising recycling targets, increasing pressure on landfill operations, etc.), which suggests opportunity for sustained organic growth.
| • | In municipal services markets, domestic waste volumes are increasing steadily in most European countries – by between 1 and 3% per year – along with the trend toward recourse to private partners by public entities. |
| • | In industrial services markets, volumes are more or less stable or are even declining slightly, due in particular to the slowdown of the economy. Nevertheless, industrial customers are under pressure from increasingly strict environmental standards (raising of recycling and packaging re-use targets, directives concerning end-of-life vehicles and waste electrical and electronic equipment, etc.). |
Competition
In the water and sanitation sector, the competitive trend in 2003 continued toward consolidation among a small number of major players. The Group’s main international competitors in the water management and sanitation sector are the French companies Veolia Water, a subsidiary of Veolia Environnement, and SAUR, a subsidiary of the Bouygues Group, as well as the British company Thames Water (now a subsidiary of RWE).
The departure of several players from the water sector continued: E.on’s sale of Gelsenwasser, and Anglian Water’s withdrawal from a major portion of their international operations. On the other hand, a new form of competition appeared when public companies acquired strategic positions : Gelsenwasser was bought out by companies owned by local governments (Dortmund, Bochum). In Italy, groups majority-owned by local governments became active in the market (HERA and ACEA in particular). Moreover, in France, new competitors emerged at a regional level with very aggressive economic offers.
In waste services, SUEZ Environnement has become the leading European operator in the processing and management of domestic and non-toxic waste. In 2003, SUEZ Environnement generated revenues of €5.5 billion in waste services, ranking it as the third-largest waste services operator in the world, behind Waste Management – which is primarily active in the U.S. – and the French company Onyx, a subsidiary of the Veolia Environnement group. The European market is dominated by two leaders, SUEZ Environnement (SITA) and Onyx, followed by smaller players such as the waste division of the German company RWE and the British-Australian company Cleanaway, a subsidiary of Brambles Industries.
Environmental Aspects
The heart of SUEZ Environnement’s water business is improving quality to make water potable, and filtering it so that it may be returned to the natural water cycle. For waste, it consists in managing both municipal
10 Source: 2000-2015 – Global Water Partnership/WB Estimates.
and industrial waste through recovery or other treatment processes that safeguard quality of life and protect the environment. In both cases, the focus of SUEZ Environnement’s actions is on restoring natural resources and minimizing the ecological impact of its activities. Concern for the environment is a motivating force for SUEZ Environnement employees, one that drives them on a daily basis. It is integral to every aspect of the Group’s know-how.
This environment-conscious culture, inherent to the nature of the Group’s activities, is a true asset for SUEZ Environnement, which for several years now has been engaged in serious reflection leading to the development of a carefully prepared action plan for the environment.
This plan aims to answer two questions:
| • | How to limit the negative impact on the environment of its operations to the maximum possible extent? |
| • | How to make its operations, which by their very nature serve the environment, serve it even better? |
SUEZ Environnement places particular emphasis on integrating its environmental policy upstream in its research and development programs. These programs develop innovative solutions for waste recycling or the reuse of waste water, energy recovery from waste, reduction of waste production at source, reduction of water leakage in water systems, and control of greenhouse gases.
Due to the nature of SUEZ Environnement’s operations, environmental reporting is intimately related to operating performance and, therefore, becomes a management tool. Indicators that measure and improve performance are monitored. They show the progress made and enable benchmarking between the various comparable business entities within the Group.
This ambition to make environmental concern an integral part of the management of SUEZ Environnement is driven by the Group’s senior management and is implemented in the field by the operating teams. On-site environmental audits are conducted by corporate teams to verify compliance with environmental regulations.
57
OTHER SUBSIDIARIES AND AFFILIATES
Communications
Business strategy
In September 2003, we made the decision to sell all of our holdings in the Communications sector. In fiscal year 2003, this strategy resulted in the sale of Coditel and Codenet and, in 2004, resulted in the sale of 89% of the Paris Première channel and the sale of our equity stake in M6. In March 2004, we also signed an agreement with United Global Com for the sale of Noos.
M6
At December 31, 2003, we held 34.6% of the capital stock of M6 (Métropole Télévision Group), a company listed on the Paris Stock Exchange. In accordance with our strategy of gradual withdrawal from businesses in the Communications sector, M6 signed an addendum to the agreement with the National Audiovisual Board (Conseil Supérieur de l’Audiovisuel) on February 2, 2004, which allowed us to sell below the threshold of 33 1/3 of the capital stock of M6. As a result of this agreement, we sold 29.2% of the capital stock of M6 in a market transaction combined with a sale to institutional shareholders. We will retain a residual equity stake of 5% in M6 for three years under the commitments signed with the National Audiovisual Board (Conseil Supérieur de l’Audiovisuel).
NOOS
In March 2004, we signed a share purchase agreement with United Global Com (UGC) for the sale of Noos to Médiareseaux, a holding company of the UGC Group in France. The sales price will be based on a multiple of 7.25 times annualized 2004 gross operating income as of the closing date, capped at €660 million. Following the transaction, we will temporarily retain a stake of less than 20% in Médiaréseaux.
Other equity investments
The Group also holds significant equity interests in the following companies:
| | • | A 16.7% interest was acquired by the Group in LDCOM (renamed “Neuf Telecom”) in 2002 through the transfer of Firstmark Communications France (FMCF) equity and a shareholder-restricted rights issue. Following the acquisition of four other companies in 2002, this integrated operator now ranks as France’s 3rd largest telecommunications company. |
| | • | A 50% financial interest in Worldcom SA in Belgium, through our 79.5%-owned subsidiary Blomhof. We signed a share purchase agreement with the MCI Group on May 25, 2004, pursuant to which they agreed to purchase Blomhof’s entire stake in Worldcom SA, subject to certain conditions precedent. |
Fortis
In April 2003, we sold our equity stake in Fortis, which has been deconsolidated since December 17, 2001. This sale took place in two stages: 50 million shares were sold for cash in a firm price transaction for subsequent sale to institutional investors, and 70 million shares were included in an issue of Fortis Convertible Bonds (ORAs), guaranteeing us a final price of between €17 and €20 per share at the 3-year maturity. From these two transactions combined, the Group realized € 1.8 billion in cash, and the same amount in debt reduction.
58
Since December, the Group has gradually sold off shares. As of December 31, 2003, the Fortis line consisted of 88.6 million shares, which represented €1,482.5 million in net book value, 70 million shares of which were allocated for redemption of the aforementioned Fortis Convertible Bonds. Since the beginning of 2004, a further 14 million shares have been sold. These sales are part of the continued implementation of our 2003-2004 action plan.
S.I. Finance
S.I. Finance, a wholly-owned Group subsidiary, continues to sell off the Group’s former private equity investment portfolio. In 2003, disposals amounted to €28 million. The directly-held assets are expected to be sold in 2004, while assets held through investment funds are expected to continue to be sold through 2007.
59
ENVIRONMENTAL POLICY
By the nature of our businesses – energy, water and waste services – we play a vital role in the challenges of the environment and sustainable development: climate change, pressure on water and energy resources, and protection of the natural environment and human heritage. While the Group’s activities can enhance the environment, they also impact the natural world and natural resources. These impacts must be measured, controlled and minimized through a process of continuous improvement. Potential pollution or damage to the environment exposes the Group to various risks that can increase costs and also adversely affect the Group’s image and reputation. Risk is managed day-to-day through a growing number of certified environmental management systems in place within the Group. Employee training, innovation, and research programs all contribute to the reliability of our facilities and to operational risk control.
A network of Environmental officers deployed to coordinate environmental policy implementation
The reorganization carried out in 2003 under the Optimax plan resulted in the assignment of the Environment and Innovation Department to the Operational Assistance Division. The Group continued to strengthen its environment organization through a network of Environmental Officers appointed for that purpose.
As relayed through the network of Environmental officers, the Group encourages subsidiaries to implement an environmental policy specific to their particular business and as a function of local economic conditions and the expectations of customers, manufacturers and local governments. By the close of fiscal year 2003, a total of 80.7% of Group revenue was generated by Group entities having begun this process by publishing a declaration of environmental commitment. These policies are leading to deployment of certifiable environmental management systems (EMS) aimed at implementing our policies in an economically efficient manner. These systems are based on documentation and written procedures as well as objectives defined in the context of continuous operational improvement. The economics and value of such EMS can be certified by outside parties. As of December 31, 2003, 42.7% of revenue was covered by certified EMS (ISO 14001 certifications, EMAS registrations, certifications with environmental elements under the 2000 version of ISO 9001, and local certifications). Consequently, the Group has been actively promoting employee training in environment-quality-safety issues as evidenced by the percentage of training devoted to this area (19.8% of all training in 2003) and the sums invested (€13.2 million in 2003).
Environmental risk management policy
Risk management is an essential part of the Group’s environmental policy. Environmental risks come under precise and strict national and international regulations and are regularly monitored by public authorities.
Within the European Union, the “Seveso Directives” regulate sites that present a risk of accidents involving hazardous materials and impose specific plans and procedures, particularly for the storage of such materials (“High Tier” Seveso sites). The Group operates 6 such sites in the European Union. For the Environment division, Teris, SUEZ Environnement’s hazardous industrial waste treatment subsidiary, operates the sites at Pont de Claix (incineration of chlorine solvents) and Loon-Plage (incineration of hazardous industrial waste) in France, and its subsidiary SITA Remediation in Germany operates the Herne plant (treatment of hazardous industrial waste). For the Energy division, Fluxys and Fluxys LNG operate at three Seveso sites: the Loenhout underground storage site, the Dudzele natural gas liquefaction unit, and the Zeebrugge LNG terminal.
The Teris Pont de Claix site is a facility classified as Seveso “High Tier”, due to its storage of hazardous industrial waste that can include highly toxic categories of waste. This facility is located at the center of a chemical platform that includes other Seveso “High Tier” facilities with which it shares intervention resources within an economic interest group and an environmental health and safety charter that is common to all operators of the platform. In particular, there is an internal fire department with 35 employees. The major accident prevention policies are based on a risk assessment methodology, an occupational health and safety policy, an
60
environmental protection policy which is reflected by ISO 9001 and ISO 14001 certification, an annual environmental quality and safety progress plan, an inspection policy that minimizes the risks related to the operation of equipment, which relies on the chemical platform inspection office recognized by the government. The safety management system is audited by a third party at least every 3 years. This system complies with the Decree of May 10, 2000 and the environmental health and safety charter of the chemical platform. A hazards study conducted internally at the Teris site assesses the risks of potential accidents as well as protective measures to reduce the seriousness or probability of accidents. Since 2000, the rate of frequency and the rate of gravity of work accidents has been zero. No environmental accidents or external complaints have been recorded.
The Teris Loon Plage facility is classified as Seveso “High Tier” due to its storage of hazardous industrial waste that may be classified as toxic. This facility was purchased from the Du Pont Company at the beginning of 2003. The major accident prevention policies are based on a risk assessment methodology, an occupational health and safety policy, an environmental protection policy, and an annual environmental quality and safety progress plan. ISO 9001 and ISO 14001 certifications are currently being renewed, certifications previously obtained by Du Pont. Its safety management system complies with the Decree of May 10, 2000. A hazards study conducted by Fairtec/Veritas was submitted for critical analysis by a third party expert (Technip) at the government’s request when the application for an operating permit was submitted. This permit was granted on April 23, 2003. An assessment of potential accident risks as well as the protective measures to reduce the gravity or probability of accidents was conducted using Du Pont’s Hazop methodology. Since Teris took over the site, the rate of frequency and the rate of gravity of work accidents has been zero.
The Herne site operated by SITA Remediation, a Teris subsidiary, uses pyrolysis to treat 30,000 tons of earth a year polluted with mercury, pyralene, and PAH (polycyclical aromatic hydrocarbons). The site is a Seveso “High Tier” facility due to the potential stock of PAH contained in the earth, which exceeds 200 tons, the German threshold limit. The site meets regulatory requirements. A special impact study was performed in 2003. An Environment manager and a Seveso manager were appointed by the company to ensure proper implementation of the regulations. An annual 3-day audit is conducted by the German government’s environment and labor departments. An information document for residents is currently being finalized, in compliance with regulatory deadlines. This site was audited in 2003 by the SUEZ Environnement environmental audit team. No major non-compliance or major environment risk was found. Moreover, the site is certified “Entsorgungsfachbetrieb”, a German environmental certification, subject to an annual government audit before renewal.
Each of the Seveso sites has an internal operations plan, providing for a “crisis unit” that is filed with the government. The plan is tested every year during exercises conducted jointly with the government and Civil Defense. The Teris Pont de Claix site is included in the internal operations plan for the chemical platform. Each of these three facilities has a mandatory system with a crisis procedure incumbent upon the management of Teris and SUEZ Environnement.
For its part, Fluxys operates a major accident prevention policy that ensures a high level of protection for the personnel and environment of its facilities. The primary focus of this policy is to prevent a major accident from occurring. Fluxys therefore ensures the integrity, safety, and reliability of its system throughout its life cycle, i.e. from initial design until decommissioning of its facilities. The second element is based on the establishment of an organization and response resource plan to minimize the consequences of leaks or other accidents, given that the occurrence of a major accident cannot be ruled out despite all the prevention measures in force. Fluxys conducts a safety management system that ensures this is applied policy to the management and operation of facilities classified as Seveso “High Tier”, specifically the LNG Terminal in Zeebrugge, the liquefied natural gas storage unit in Dudzele, and the underground natural gas storage facility in Loenhout, but also all the associated pipelines and facilities (holding stations, compressors, metering stations, valve junctions, etc.) necessary to perform its operations. The third element of this policy is the incorporation of the safety management system into an integrated “Health, Safety, Environment & Quality” management system, since major accidents are inseparably linked to the well-being of employees and the environment on which its operations have an impact.
61
Fluxys notifies the competent authorities as to the facilities subject to applicable legislation as well as any significant changes to the facilities in question, and it has established an organization that is capable of managing major accident dangers. The major accident hazards that could occur under normal or abnormal operations have been systematically identified, and the related risks have also been assessed. Fluxys thereby ensures that it operates its facilities with complete safety under all circumstances (both during normal operation and during a temporary shutdown or maintenance). Prevention of major accidents is integrated in the design of new facilities and in the planning and construction of modifications to existing facilities. Foreseeable emergency situations are identified and Fluxys prepares, tests, and reviews emergency plans in a systematic way. Compliance with established major accident prevention objectives is monitored and any necessary corrective actions are implemented in the event that defects or discrepancies are found. Thus, Fluxys periodically and systematically reviews its major accident prevention policy and assesses the effectiveness and adequacy of the safety management system. Fluxys has established competent internal teams to manage and control crisis situations resulting from serious incidents and major accidents of the SEVESO type occurring at a facility operated by Fluxys or Fluxys LNG. The members of these teams have undergone special training in crisis management, and practical exercises are organized. An internal procedure as well as various instructions on crisis management have been prepared by Fluxys. In addition, operational headquarters have emergency plans that describe the local measures to be taken in the event of serious incidents or major accidents.
Active prevention of environmental risks
Operating business line units are encouraged to implement a program of environmental audits at their sites.
In the Energy businesses, specific internal procedures are applied at most sites to establish environmental management responsibilities and ensure effective execution of environmental audits carried out at the request of EGE and EGI management to evaluate the facilities’ level of environmental compliance. Particular attention is paid to operating permits with respect to impacts on the air, water, waste, and noise. Moreover, the compliance of subcontractor practices, the prevention of accidental discharge, the temporary storage of hazardous waste on site, and the existence of serious event management procedures are specifically evaluated. These procedures are set up to reduce to a minimum the risk of noncompliance with regulations or the operating permit, and to demonstrate the Group’s commitment to contributing to protection of the environment and human populations. These audits are conducted at the request of the management of EGE and EGI, for the purpose of verifying the compliance of the procedures deployed with directives and related manuals.
Environmental risks within SUEZ Environnement are methodically assessed: each sanitation site has undergone at least one environmental audit during the last three years. These audits make it possible to identify possible instances of non-compliance with current regulations, detect specific risks, and establish corrective action plans. Instances of non-compliance can be due to regular changes in the regulations which require operational upgrades, the result of acquisitions of facilities for which investments are planned, or simply the ageing of the facilities operated. The use of private operators is often justified by the problems in operating facilities subject to increasingly strict regulations. When we assume responsibility for the management of facilities, some of them do not necessarily meet regulatory requirements. It is clear that, given the magnitude of the infrastructures, the investments and work necessary to overhaul a system often require several years in a given country. When an instance of non-compliance arises, our response may consist of improvement in the operational management of a site or investments to upgrade or replace equipment. Under service contracts, such decisions must be made with the consent of clients, local governments, or manufacturers. Certain investments remain their complete responsibility. Nevertheless, the Group makes an effort to warn its clients so that they can anticipate future regulations and standards. SUEZ Environnement has launched an extensive program to increase awareness by local governments that have assigned the Group responsibility for management of their garbage incinerators, in order to anticipate the European environmental regulations in this area in December 2005, which require a decrease in authorized emission thresholds.
In some cases, when the customer has not made the investments necessary to bring its facility up to standard, the Group has withdrawn from managing it. The audit program conducted by the Operations, Research,
62
and Environment Department is regularly presented to the senior management committee and is the subject of regular reporting. In the water sector, each subsidiary is responsible for its own environmental risk management unit. A centralized audit and inspection process, similar to the one established for waste, will be initiated in the near future. Audits will be performed with priority given to sanitation facilities, water treatment product storage facilities, and purification station sludge processing facilities. Risk prevention plans accompany or precede the establishment of an environmental management system.
There were 94 complaints and 22 judgments related to environmental damage, for a total of €1.5 million in damages. This is low in relation to the size of the Group, the industrial nature of its operations, and its direct expenditures for the environment. In 2003, environmental expenditures (investments and current operating expenses related to protection of the environment) totaled nearly €174 million for energy operations and more than €2,114 million for water and waste operations.
Crisis management to maintain uninterrupted operation
Operating entities are encouraged to establish crisis management plans involving two types of intervention: a stand-by system for immediate mobilization of crisis management resources and an actual crisis system for effective management throughout the duration of a crisis. This arrangement provides in particular for the establishment of a crisis unit able to assess internal and external impacts implicating technology, personnel, safety, economics and the company’s reputation. The focus is thus on crisis management team awareness and training, particularly through simulations and development of a culture of exchange between local teams and their outside contacts.
The “crisis stand-by” procedure is designed to inform Group Executive Management of any serious incident. This 24/7 system particularly applies to Water and Waste Services operations. It is also designed to provide feedback that can improve the Group’s crisis management and risk control procedures.
Strengthening performance measurement and control systems
To guide implementation of its environmental policy, manage environmental risks and promote communication of its environmental performance to stakeholders, we began implementing an environmental reporting system back in 1999. It was developed based on work conducted through international organizations for dialogue, such as the Global Reporting Initiative and the World Business Council for Sustainable Development (WBCSD). Group practices and experience gleaned from reporting year 2003 have helped refine procedures for collecting and disseminating environmental information, which includes publication of the SUEZ Activities and Sustainable Development Report.
Day-to-day environmental management
The environmental policy is also aimed at promoting operational initiatives that address key sustainable development concerns, such as climate change, natural resource preservation, and impact management. The Energy and Environment Divisions have developed specific action plans that address these issues.
Climate change
In 2003, the Group emitted 79.6 million tons of CO2 eq. in greenhouse gas (GHG) emissions: 72.1 million tons of CO2 eq. from Energy operations and 7.5 million tons from Environment operations. We are helping to fight climate change in several ways:
| • | Promoting rational energy use based on optimal utilization of available plants to achieve a mix of energy sources with varying carbon levels. The diversity of our facilities makes possible an energy mix that meets national restrictions to combat the greenhouse effect and also highlights the cost of different energy sources in terms of carbon restrictions. |
63
| • | Actively participating in development and promotion of renewable energies. In 2003, these accounted for over 6 GW of installed power. |
| • | Through Electrabel’s $5 million contribution to the Prototype Carbon Fund established by the World Bank in 2000, we are helping to promote and finance projects that lead to a reduction in GHG emissions and the establishment of a single knowledge platform for technology transfers to developing countries. Experience gained from the development of climate change projects enables us to launch our own projects and identify investment opportunities. |
| • | Leveraging these experiences strengthens the Group’s ability to react quickly to future changes in the carbon market. |
SUEZ Environnement also has a greenhouse gas emission management program underway for various emission sources.
| • | Emissions from waste collection operations are reduced by increasing the use of clean vehicles fueled by electricity or natural gas (69% in 2003 and 2002 compared to 44% in 2001) and by computer optimizing collection routes. Such optimization also reduces fuel consumption and noise pollution. |
The institutional framework governing carbon limitation is provided by the Kyoto Protocol and the European Directive on greenhouse gas emission (GHG) quotas. However, the Kyoto protocol will not become effective as long as Russia or the United States do not ratify. The European directive adopted in October 2003 established a multilateral market for GHG emissions for the first time, through constricting objectives mandating the reduction of GHG. A tight schedule required the incorporation of the directive into domestic law by December 31, 2003, as well as the adoption of national allocation plans by March 31, 2004. The time deadlines have not and could not be met by all member States. However, these two steps are essential: particularly for the issuance of GHG emission permits to the entities concerned, establishing GHG reporting and monitoring rules, and allocating the quotas for each facility for the first commitment period running from January 1, 2005 through December 31, 2007. Within this framework, all of our operations have made a constant effort to improve awareness of GHG. Computerized annual environmental reporting systems covering CO2 emissions have been established. Beginning on January 1, 2005, European operations covered by the quota directive must report their emissions and have them audited annually.
Institutional monitoring of international, European, and domestic developments should enable us to be ready for the effective date of the quotas directive on January 1, 2005 and to take advantage of the opportunities that may arise in the GHG market. It is the items which are left to the judgment of member States that will determine the actual impact of the quotas directive on European industry. Thus, the framework established by Europe leaves open questions such as the reduction objective to be achieved, which will be determined in national allocation plans, rules for monitoring emissions, the financial accounting rules for emissions rights, and the legal nature of such rights. Once adopted, the draft directive which amends the quotas directive will determine the limits within which companies will be able to utilize the emission reductions generated abroad in Clean Development Mechanism (CDM) and Joint Implementation (JI) projects in order to meet their GHG reduction objectives.
Management and preservation of natural resources
The increasing scarcity of water and the degradation of water quality in certain countries where the Group operates are also leading us to sensitize our plant personnel to the need for integrated water resource management. This approach looks at all issues related to water services and sanitation (preservation of the resource, agriculture, regional planning) and the resolution of potential conflicts through negotiation with all stakeholders. It enables the Group to better identify and thus manage related risks, establish its legitimacy as a water management player and partner with government entities, and also to anticipate future trends and markets.
64
Finally, natural resources are also preserved through the recovery of hazardous and non-hazardous industrial waste. Already 44.6% of all waste produced is recovered (non-hazardous and hazardous waste, fly ash, combustion residues, desulfurization by-products).
The Group believes that sewage waste recovery (27.3% in 2003) in the form of agricultural fertilizers is also a promising market. Thus, in 2003, we developed a sludge compostability test that guarantees the quality of the finished products, particularly with respect to spreading conditions.
Group companies continuously focus on controlling their various impacts on the environment, as evidenced by us now being listed on the Dow Jones Sustainability Index (DJSI World 04) in the second half of 2003 and by our performance summarized in the following table.
| | |
| Heading | | 2003 data |
Environmental Commitment Statement | | 80.7%of relevant revenues |
Environmental management program | | 62.8% of relevant revenues |
Certified environmental management system | | 42.7% of relevant revenues |
Certified environmental management system – ISO 14001 | | 262 |
Certified environmental management system – EMAS | | 7 |
Certified environmental management system – ISO 9000v.2000 with environmental aspects | | 233 |
Certified environmental management system – ISO 14001 | | 82 |
Environmental analyses | | 55.7% of relevant revenues |
Risk prevention plan | | 49.6% of relevant revenues |
Crisis management plan | | 78.6% of relevant revenues |
Environment-related complaints | | 94 |
Environment-related judgments | | 22 |
Total compensation paid | | €1.5 mn. |
Environmental expenses (Energy) | | €173.5 mn. |
Environmental expenses (Environment) | | €2,114.1 mn. |
Environmental reserves (See Note 15 to our Consolidated Financial Statements) | | €4,412 mn. |
Total primary energy consumption – Electricity production | | 276,392.6 GWh |
Total electricity consumption – Pump storage | | 1,313 GWhc |
Total electricity consumption – Gas transported & distributed | | 1,323 GWh |
Total electricity consumption – Waste treatment | | 3,457 GWh |
Total electricity consumption – Waste treatment | | 867 GWhe |
Total electricity consumption – Sanitation | | 2,111 GWhe |
Total electricity consumption – Drinking water delivery | | 1,939 GWh |
Greenhouse Gas Emissions | | 79.6 Mt CO2 eq. |
CO2 emissions – Electricity production | | 71.1 Mtons |
CO2 emissions – Gas transport and distribution | | 0.3 Mtons |
CH4 emissions – Gas transport and distribution | | 25,300 Mtons |
GHG emissions – Landfill | | 4.2 Mtons CO2 eq. |
CO2 emissions – Incineration | | 2.5 Mtons |
CO2 emissions – Vehicles & boat fleet | | 0.9 Mtons |
CO2 emissions – Sanitation | | 139,100 tons CO2 eq. |
CO2 emissions avoided – Energy and materials valorization | | 13.1 Mtons |
NOx emissions | | 117,076 tons |
SO2 emissions | | 192,339 tons |
Dust emissions | | 13,508 tons |
Power generated from renewable energy sources | | 6.3 GW eq. |
Vehicle fleet: % “green” vehicles in the household waste collection fleet | | 52% |
Water consumption for industrial process – Surface water removal | | 17.3 Mm3 |
65
| | |
| Heading | | 2003 data |
Water consumption for industrial process – Ground water removal | | 6.6 Mm3 |
Water consumption for industrial process – Public network water removal | | 23.4 Mm3 |
Water consumption for cooling process – Surface water removal (evaporated water) | | 436.3 Mm3 |
Water consumption for cooling process – Ground water removal | | 7.8 Mm3 |
Water consumption for cooling process – Public network water removal | | 5.6 Mm3 |
Non-hazardous industrial waste production | | 1.9 mn. tons |
Hazardous industrial waste production | | 0.2 mn. tons |
Nuclear waste production | | 177.9 m3 |
Fly ash waste production | | 3.6 mn. tons |
Waste production: combustion residues | | 2.4 K tons |
Waste production: desulfurization by-products | | 0.2 K tons |
Sludge production | | 0.8 K tons |
Waste recovery (% total production of NHW, HW, fly ash, combustion residue and desulfurization by-products) | | 44.6% |
Sewage sludge recovery | | 27.3% |
Conversion: waste to energy (electricity) | | 1.8 GWh el. eq. |
Leachates | | 461,450 inhab. Eq. |
Pollution load (BOD) extracted from sanitation networks | | 1,033,000 tons/year |
Drinking water mains technical efficiency | | 81% |
66
INNOVATION POLICY
The purpose of our innovation strategy is to anticipate the future needs of our customers. In 2003, we defined three key objectives:
| • | meet the increasingly exacting demand for sustainable development; |
| • | develop new services for municipal and industrial customers. |
Our innovation policy relies on a number of innovative projects or initiatives, primarily in the technical and managerial areas, but also in the commercial segment. In the technical area, in 2003, we devoted a total of €79 million to research and development in Energy and Environment. In 2002 and 2001, the Group spent, respectively, €126 million (which includes €27 million for Ondeo Nalco, a company sold in 2003) and €130 million (which includes €30 million for Ondeo Nalco). These investments were primarily made in technical or expertise centers.
Energy
In 2003, we spent €53 million on research and development (€66 million in 2002). In the production and distribution of electricity, efforts were mainly devoted to operating efficiency. In service businesses, our efforts were primarily devoted to rational energy use and to monitoring performance and impacts on health and the environment. A special effort was made by all energy businesses in studying the impact of decentralized production.
Energy has two technical centers :
| • | Laborelec (150 employees), based near Brussels, has expertise in electricity and related energy production, distribution, and utilization operations, and advanced capabilities in energy quality control and management. |
| • | Elyo Cylergie (15 employees), based near Lyon, whose expertise is employed in energy service operations, with an emphasis on monitoring performance commitments and environmental impact management. |
Environment
In 2003, we spent €26 million on Research and Development (€33 million in 2002, excluding Ondeo Nalco) in the field of Water and Waste services: most of the efforts were devoted to the objectives of improving the performance of our operations and anticipating environmental and health-related risks. This work covered the whole water cycle (including resource protection, processing and distribution of drinking water, recovery and treatment of waste water, as well as control of these operations) and waste services (collection of household, and hospital waste, hazardous industrial waste, and treatment). A special effort was made to improve the reuse and recycling of waste.
Environment has four technical centers:
| • | CIRSEE in Le Pecq (140 employees), based in the Paris region, which works on the entire water cycle. It is particularly advanced in the use of molecular biology technologies to analyze water as well as in the modeling and simulation of water treatment facilities. It also works with the Northumbrian Water Technology Center in Newcastle in the field of system assets. CIRSEE collaborates with numerous universities and is a member of foundations such as AWWARF, WERF, etc. |
| • | Cerdeg (50 employees), based in the Paris region, is focused on water treatment processes and has many pilot projects. Its particular specialty is the use of membranes and sludge reduction and treatment. |
67
| • | Denard (10 employees) based in Richmond in the United States, has special expertise in disinfection, membrane technologies, and rapid decanting. |
| • | Ondeo IS (15 employees) is a European network dedicated to the industrial market, specializing in its principal markets (petroleum and energy, pharmaceuticals, microelectronics, agribusiness, etc.). |
Ondeo Nalco specializes in water conditioning, and its presence in the Group for several years enabled our technical centers to conduct exchanges in the field of power plant water conditioning, sludge treatment, use of membrane technologies, and Legionella problems. These exchanges further strengthened the level of excellence of the personnel in their respective fields and opened new prospects for our service contracts.
We use various tools to promote and manage innovation:
| • | Innovation Initiative Trophies reward employees or teams for operational achievements in four categories: technology, sales, management, or interdisciplinary achievements. |
The launch of a new campaign at the end of 2003 resulted in 137 projects, which are currently being reviewed. The Trophies and Grand Prizes will be awarded on June 21, 2004.
| • | The Value Creation Label is given to projects that received an Innovation Initiative Trophy four to five years ago and have been particularly successfully implemented. |
In 2003, the 1999 and 2000 Trophy recipients were reviewed.
| • | Laborelec Vibration Monitoring System (2000 trophy): this system permits continuous remote data access to better assist operators in interpreting the vibration behavior of turbine systems. The data from Belgian, Dutch, Thai, and Italian power plants is automatically transmitted. This tool has made it possible to extend the service life of turbine shafts and prevent untimely shutdowns of power plants related to breakdowns, which result in very costly non-production. |
| • | MaxiSource (1999 trophy) is a second-generation product produced by a reformulation of the use of ultrafiltration of drinking water. This reformulation is based on a larger module, with more economical connections and a revised and corrected process. MaxiSource has given Aquasource leadership in the market for large scale membrane clarification-disinfection facilities. |
One “management” award was approved:
| • | Fiabilis (1999 trophy) is an original methodology that systemizes risk analysis, facilities criticality analysis, and takes into consideration customer needs and requirements, both in the sales phase and during the contract. The summary reports generated by these analyses, as well as the assessment and prioritization of services, offer the customer and the operators a precise vision of the service to be delivered. This methodology, which is initially planned for the French ELYO market, was developed internationally (Great Britain, Spain, Germany, Singapore). |
| • | The Group’s e-business program, launched in 2002 and designed to promote and optimize the use of Internet technologies in the various businesses and functions. The principal results in 2003 were: |
| | • | a web solution shared at Group level, for the promotion of internal job mobility and control of hiring costs; |
| | • | the deployment of web portals, an extranet, and e-accounting solutions (electronic entry of customer invoices) for company customers; |
68
| | • | widespread use of SUEZwebex (more than 2,800 web meetings organized in 2003), which generated savings of at least €1.1 million in travel costs; |
| | • | the deployment of mobile solutions for maintenance technicians in businesses other than energy services. |
INSURANCE
The Insurance Department relies on the “SWIN” network (SUEZ Worldwide Insurance Network), which operates as an expertise center for the branches and head office in this specialized field in which the pooling of experience contributes to improved effectiveness and cost reduction.
The policy of prevention and transfer of hazardous risks to the insurance market, as conducted by the SUEZ Group, has a threefold objective: safety of operations, increased awareness in the business divisions, and optimized financing.
| • | Safety of operations proceeds from a realistic prevention policy designed to reduce the frequency risks and medium severity risks, such as traffic accidents and work accidents. Evolution in practices and the results achieved are part of the responsibilities assigned to members of the “Safety Management” group, which reports directly to the Group Executive Committee. |
| • | Increased awareness of risks is provided through the structuring of insurance programs by type of business. This classification – within a diversified group – enables the apprehension of risk families that are homogeneous in nature. The implementation of these programs rely on dedicated teams at the business division level, their actions are extended by the operational networks. |
| • | The financing of hazardous risks is optimized mainly through self-insurance programs, either directly by applying deductibles and retentions, or indirectly, through captive mechanisms. Those retention techniques of financial liability applicable to low (or medium range) risks are now favored within the Group and are in compliance with the requirements of the OPTIMAX Plan. |
The transfer of catastrophic risks to the insurance market continues to be operated as often as possible by developing transversal programs in areas considered to be strategic, such as Third Party Liability.
Third party liability coverages
The approach adopted by the Group – through its risk transfer policy – must also take into account constraints imposed by the insurance market and the reinsurance market in particular.
Nevertheless, despite a general trend toward a contraction in suppliers and available capacity, in 2003, the Group managed to maintain the capacity level that it had reached in 2002.
The third party liability insurance subscribed by the Group basically falls into the following classifications:
General liability
In excess of the underlying primary layers subscribed by each business division, the Group has set up a worldwide insurance program that offers a total capacity of €500 million, all losses combined (subject to certain exclusions and coverage sub-limits imposed by the market).
It was necessary to adjust the scope of this program to the Group’s new configuration during the fiscal year 2003, in order to take into account the asset sales carried out under the January 2003 action plan. Special mechanisms were established in each instance to match the period of insurance and the provisions of the Purchase Agreements.
69
Negotiations with insurers regarding these particular adjustments were significantly difficult because of the constraints imposed by the new French legislation in force since November 2, 2003 regarding the occurrence reported period mechanism.
“Marine” insurance
The Group’s worldwide “General” Liability program is placed on the “ non-marine” market, which scope excludes specific branches of insurance such as marine risks, which are covered on specialized markets.
However, a significant proportion of the businesses in which the Group operates, particularly in the energy field, require ships to transport liquefied natural gas (LNG) and sometimes coal.
Appropriate coverage for potential marine liability as a charterer or ship owner is contracted with P&I Clubs.
“Nuclear” Insurance
As an operator of nuclear plants at the Doel and Tihange sites, Electrabel’s nuclear liability is governed by the Paris and Brussels conventions that has set up a unique system that differs from Common Law. It is aimed at ensuring victim compensation and creating solidarity among European countries.
The operator whose facility is at the origin of a nuclear accident is solely liable. In order to balance this strict liability principle, the total amount of indemnification for each nuclear accident is capped per occurrence and limited by a 10-year statute of limitations. The States members of the conventions have established a complementary compensation mechanism for amounts beyond the cap.
The Belgian law ratifying these conventions requires the operator to subscribe a third party liability insurance. The insurance program subscribed by Electrabel meets this requirement.
Environmental damage risk insurance
The Group is covered for environmental damage risks under its worldwide Liability Insurance program.
These risks are, however, subject to special treatment due to conditions imposed by international reinsurance, which generally limits its coverage to sudden and accidental damage.
As an exception to this principle, the Environment business division uses coverages from a specialized pool under a reinsurance scheme. This pool has a structure which capacities are limited in amount and in geographical scope , but provides coverage extensions for items such as decontamination costs and coverage of events of slow and gradual origin.
Waste management operations in the USA and Canada, however, face very restrictive coverage conditions due to the scarcity of available capacity on the market. In other countries, such as in Eastern Europe, it is often impossible to buy this type of coverage.
Coverage for property damage and business interruption
Group assets are protected under the generally accepted principles of property damage and business interruption insurance. This insurance covers property that the Group owns, leases or holds (particularly under concession contracts). As a general rule, however, covered assets do not include underground networks, except in certain countries and up to certain limits.
Business Interruption insurance is subscribed on a one-time basis as a function of each risk analysis performed at the relevant level (which may be the production unit itself or all units belonging to the same business division located in the same geographic area).
70
The Environment business division favors covering its assets with a structure consisting of two successive layers, one covering sites of average size, and another which capacity is dedicated to the largest operating sites. The total capacity of the coverage is €200 million.
The Energy business division, whose power plants constitute a major asset, have favored a regional approach that benefits from the capacities available on markets specialized by type of equipment. Besides conventional fire and explosion coverage, power plants can subscribe a coverage extension for risks such as machinery breakdown when the type of equipment operated (e.g. gas turbines, boilers, etc.) is prone to such risk.
The nuclear power plants operated by Electrabel are covered in direct damage through the American mutual insurance company, Nuclear Electric Insurance Limited (NEIL).
Employee benefits
In accordance with legislation currently in force and with company agreements, programs for personnel accident and health insurance are established within the operating entities.
These programs may either be financed through retention based on the capacity of the company or transferred to the insurance market.
C. Organizational Structure
For a list of our major subsidiaries and our ownership interest in them, please see Item 4.B “Business Overview – Organizational Structure”.
D. Property, Plants and Equipment
Properties and Facilities
We own or lease various properties and facilities around the world, primarily in Europe. We lease with an option to buy our new executive offices at 16, rue de la Ville l’Evêque, 75008 Paris. Many of our activities involve the operation of large facilities which we do not own. We believe that our existing facilities are in good condition and that they are adequate to meet our current requirements.
71
Energy
As of December 31, 2003, we were operating approximately 200 power stations in 27 countries. The table below provides certain information about some of the main plants and facilities we own.
| | | | |
Country
| | City/Region/State
| | Activity
|
Belgium | | Doel | | Nuclear power station |
| | | Tihange | | Nuclear power station |
| | | Belgium (nationwide) | | Gas transportation network |
| | | Belgium (nationwide) | | Electric transmission grid |
| | | Zeebrugge | | LNG regas terminal |
Brazil | | Salto Santiago | | Hydro plant |
| | | Salto Osorio | | Hydro plant |
| | | Cana Brava | | Hydro plant |
| | | Jorge Lacerda | | Thermal power plant |
United States | | Everett, Massachusetts | | LNG regas terminal |
| | | Red Hills, Mississippi | | Thermal power plant |
| | | Chehalis | | Gas fired power plant |
Hungary | | Dunamenti | | Thermal power plant, cogeneration and CCGT |
Poland | | Polaniec | | Thermal power plant |
Netherlands | | Eems | | Thermal power plant |
Thailand | | Map ta Phut, Rayong | | Cogeneration plant and CCGT |
| | | Bowin, Chonburi | | Thermal power plant |
Turkey | | Baymina | | Gas fired power plant |
Environment
We own, operate and maintain various water treatment plants, waste water treatment plants, storage reservoirs, purification stations and water distribution networks. We operated 46 incineration plants in France, the U.K. and the Benelux countries at December 31, 2003. We also operated 223 landfills, located primarily in France, the U.K. and Spain, of which we own more than 100.
The following tables set forth certain information regarding some of the main installations or properties used by SUEZ Environnement (as of December 31, 2003):
SUEZ Environnement
| | | | |
Country
| | City/Region/State
| | Activity
|
France | | Bègles | | Solid waste incineration plant |
| | | Toulon | | Solid waste incineration plant |
| | | Créteil | | Solid waste incineration plant |
| | | Morsang | | Drinking water treatment plant |
| | | Bordeaux | | Sanitation |
| | | Nice | | Wastewater treatment plant |
USA | | Haworth (NJ) | | Drinking water treatment plant |
| | | DeForest (NY) | | Drinking water treatment plant |
Australia | | Sydney | | Drinking water treatment plant |
72
ITEM 5. OPERATING AND FINANCIAL REVIEW AND PROSPECTS
You should read the discussion below together with our Consolidated Financial Statements. The financial information that follows is prepared in accordance with French GAAP, which differs in certain material respects from U.S. GAAP. Notes 26 to 28 to our Consolidated Financial Statements describe the principal differences between French GAAP and U.S. GAAP as they relate to the Group, and reconcile our net income and shareholders’ equity to U.S. GAAP.
Critical Accounting Policies
The preparation of financial statements in conformity with generally accepted accounting principles requires that management apply accounting policies and make estimates and assumptions that affect results of operations and the reported amounts of assets and liabilities in the financial statements. Our significant accounting policies are in accordance with French GAAP and are described in Note 1 to our Consolidated Financial Statements, Summary of Significant Accounting Policies. The following areas represent those that management believes are particularly important to the financial statements and that require the use of estimates and assumptions to describe matters that are inherently uncertain:
Useful Lives of Long-Lived Assets and Impairment
Long-lived tangible and intangible assets are recorded at cost and depreciated based on management’s estimates/determinations of their economically useful lives. When management identifies that actual useful lives differ materially from the estimates used to calculate depreciation, that difference is adjusted prospectively. Due to the significance of fixed asset investment to the Group, variations between actual and estimated useful lives could significantly impact operating results both positively and negatively.
Long-lived assets are impaired if there are changes in circumstances indicating that the carrying value of the assets are not recoverable. The Group uses the best information available to estimate fair value of its long-lived assets and may use more than one source. In estimating the future cash flows of long-lived assets, judgment is exercised based on management intent to use the asset.
A change in Group’s plans regarding, or probability assessments of, holding or selling an asset could have a significant impact on the estimated future cash flows.
Goodwill
Goodwill is amortized over the expected useful life of the underlying business and is tested for impairment when certain indicators are present. If a potential impairment is indicated, we compare the fair value of the business to its recorded value including goodwill. We use market prices when possible but primarily rely on discounted cash flow models to determine the fair value of our businesses. While we believe that the assumptions and input used to determine those fair values are appropriate, they are subject to judgment. The most significant input is extracted from our 3 year business plans. Assumptions regarding market multiples and appropriate discount rates have been made on the basis of performance indicators for comparable companies, publicly available analyst data, and market prices.
If the carrying value exceeds the fair value of the business, an impairment charge for the difference is recorded in the income statement.
Reserves
We maintain reserves related to the dismantling of nuclear power stations, the reprocessing and storage of nuclear fuel, environmental remediation, and the renewal of facilities under long-term concession contracts. The
73
assumptions underlying our estimates of these reserves are discussed in more detail in Note 15 to our Consolidated Financial Statements. We believe those assumptions are appropriate; however, actual costs incurred related to those exposures could differ significantly due to changes in the timing and amount of estimated payments, changes in the time value of money, changes in technology and changes in the legal and regulatory environments in which we operate.
Pension and Postretirement Obligations.
The Group has obligations in terms of pension liabilities, early retirement, retirement indemnities and other benefit plans. Some of these obligations apply to most employees of the Group.
Costs of defined contribution plans and multi-employer defined benefit plans are expensed as contributions are made. The amount of pension plan and similar benefit commitments for defined benefits are valued based on actuarial assessments. These calculations incorporate assumptions relating to mortality, turnover of personnel and salary projections and consider the economic conditions specific to each country in which the Group operates. Additionally, pension cost is influenced by the weighted expected return on plan assets which was 6.1% and 6.7% in 2003 and 2002, respectively.
The discount rates used are calculated in accordance with the yield, as of the date of valuation, of the bonds issued by highly rated companies (or by the local government if there is no representative market for private borrowings) in the related geographical area. The weighted discount rates used for 2003 and 2002 were 5.3% and 5.7%, respectively. The valuation methods currently used by the Group for pension plan and similar benefit commitments are presented in Notes 19 and 28 to our consolidated Financial Statements.
Gains and losses resulting from changes in actuarial assumptions concerning pension liabilities are only recognized where such amounts exceed 10% of the higher of commitments and fund assets. The amount exceeding 10% is spread over the average residual activity period of employees.
Trading
Until December 31, 2002, energy trading activities that required net cash settlement were presented net in “Revenues”. Trading activities that required physical delivery were presented gross in both “Revenues” and “Purchases and changes in inventories” in the consolidated statement of income.
As of January 1, 2003, energy trading transactions for the Group’s own account (proprietary trading) are recorded for the net amount of sales and purchases in “Revenues”. The contribution of operational energy trading activities relating to assets, with the aim of optimizing production assets and fuel purchase and energy sale portfolios, is recorded at the gross amount in both “Revenues” and “Purchases and changes in inventories”.
This change in presentation method did not have any impact on operating income.
We mark to market energy trading contracts with gains and losses included in operating income. Valuations for these contracts are readily obtainable from market exchanges and over the counter quotations. The valuations also include adjustments to account for counter party credit risk and liquidity of the market, which is based on the bid-ask price. We have consistently applied this valuation methodology for each reporting period presented. The fair values of these contracts and a more detailed discussion of credit risk are reflected in Note 18 to our Consolidated Financial Statements. Market valuations, in particular those without readily available market prices, include an inherent element of uncertainty and can vary significantly from the actual consideration exchanged upon ultimate settlement of a contract. This uncertainty increases with the duration of the underlying contract and may also be higher in markets where volumes limit the liquidity of the market. Any changes to the facts and circumstances regarding trading and underlying assumptions could significantly affect the Group’s operating results.
74
See also Item 11 for a detailed discussion of quantitative and qualitative market risk factors.
U.S. GAAP Critical Accounting Policies
In addition to the Critical Accounting Policies discussed above, certain Critical Accounting Policies apply only to the U.S. GAAP results.
Long Term Supply and Purchase Contracts
We enter into many long term supply and purchase contracts for gas and electricity. Several of these contracts do not presently qualify as derivatives under SFAS 133 because of limitations on the possibility for cash settlement or prohibitive costs to cash settle due to illiquidity in the related markets. If the markets were to expand to allow greater volumes to be traded and/or the costs of selling the commodity through other markets was reduced, these contracts would qualify as derivatives and depending on the market price of the commodity at that time could result in a significant asset or liability. Since the prices in illiquid markets can differ significantly from prices in liquid markets and these contracts would only be considered derivatives in a liquid market, a calculation of the potential impact of accounting for these contracts as derivatives using current prices from an illiquid market would not be particularly relevant.
In addition, certain contracts that the Group has entered into in the ordinary course of business meet all of the required criteria for a derivative as defined under SFAS 133. However, many of these contracts qualify and are designated as normal purchase and normal sales contracts and thus are accounted for at the lower of cost or market. As a result, any price volatility inherent in these contracts is not reflected in the operating results of the Group. If this exemption is disallowed through future interpretations or actions of the Financial Accounting Standards Board (“FASB”), the impact on future operating results could be significant.
A. Results of Operations
The Group uses organic “Gross Operating Income” (“GOI”) growth as our measure of segment profit which is a non-GAAP financial measure and closely related to consolidated operating income (see Note 22 to our Consolidated Financial Statement for a reconciliation of GOI to consolidated operating income). When comparing performance between 2003 and 2002, the Group also discusses non-GAAP organic revenue growth. Both of these non-GAAP financial measures take account of the impact that foreign currency changes, natural gas prices changes, acquisitions and dispositions have on the reported results. Management believes that discussing organic growth in both revenues and GOI, taking into account the items above, provides a better understanding of the Group’s revenue and operating performance and trends than the related reported amounts compared to the prior period.
The 2003-2004 action plan, the objective of which is the improvement of the Group’s financial soundness and profitability has been implemented since January 2003 with the following priorities and current achievements:
| | • | Debt reduction and streamlining of the organization. Based on a review of Group assets in terms of their strategic interest, profitability, ability to generate free cash flows and inherent risks, a divestment program has enabled SUEZ to reduce net debt (from €26 billion at the end of 2002 to €15 billion as of December 31, 2003, (see the net debt disclosures in Note 16.2 to our Consolidated Financial Statements) and to refocus on Energy and Environment. The program continued in early 2004 with the stock market sale of 29% of M6 and the signing of a memorandum of understanding for the sale of Noos, thus nearly completing the withdrawal of SUEZ from Communication activities. |
| | • | Cost reduction focusing on business segment profitability. A plan focused on improving efficiency, the “Optimax” plan was launched Group-wide to: |
| | – | Improve operating performance (review insufficiently profitable contracts, reduce operating costs, optimize purchases); |
75
| | – | reduce general expenses and overheads; and |
| | – | optimize capital employed (reduce investments and working capital requirements). |
| | • | Reduction of risk exposure to emerging countries. In 2003, SUEZ has continued to reduce its presence in emerging countries and has withdrawn from contracts (particularly Puerto Rico) whose terms and conditions did not meet profitability expectations. SUEZ has also reduced its exposure in Thailand and Chile by restructuring the financing of its subsidiaries. |
The cost of implementing the action plan translates into an exceptional loss of €2.8 billion, due to capital losses on disposals (mainly Ondeo Nalco and Northumbrian), write-downs, particularly following the decision to accelerate the disposal of the remaining Communication assets, and restructuring costs.
The following results were achieved in 2003 as a result of the implementation of the action plan:
| | • | The Optimax measures had a positive impact of €449 million on gross operating income (GOI) during 2003 compared to 2002 and €585 million on operating income. The performance was thus sustained, with organic growth in GOI of 8.3 % for the Energy segment and 2.4% for the Environment segment, despite a weak European economy. |
| | • | Our 2003 cash flows included the effects of: |
| | – | operating working capital of €856.8 million and |
| | – | purchases of tangible and intangible assets net of disposals of tangible and intangible assets. |
2003 Compared to 2002
Revenues
Our revenues by business segment for the periods indicated set forth in the following table are reconciled to identify the effects of acquisitions and dispositions and changes in foreign currency rates and natural gas prices. Revenues amounted to €39.6 billion and €40.8 billion in 2003 and 2002, respectively.
| | | | | | | | | | | | | | | | | | | | | | | |
| | | 2002
| | 2003
| | 2002 vs. 2003
|
(€ millions)
| | Actual
2002(1)
| | Foreign
exchange
effects
| | | Gas prices
| | Disposals
| | | On a
comparable
basis
| | Actual
2003
| | Acquisitions
| | On a
comparable
basis
| | % Gross
change
Actual
| | | % Organic
growth(2)
on a
comparable
basis
|
| | | (a)
| | (b)
| | | (c)
| | (d)
| | | (e) =
(a+b+c+d)
| | (f)
| | (g)
| | (h)=(f-g)
| | (f-a)/(a)
| | | (h-e)/(e)
|
Revenues | | | | | | | | | | | | | | | | | | | | | | | |
Energy | | 24,242 | | (697 | ) | | 375 | | (731 | ) | | 23,189 | | 26,634 | | 1,757 | | 24,877 | | 9.9 | | | 7.3 |
Environment excl. Ondeo Nalco & Puerto Rico | | 12,838 | | (386 | ) | | — | | (1,249 | ) | | 11,203 | | 11,862 | | 240 | | 11,622 | | (7.6 | ) | | 3.7 |
Ondeo Nalco(3) | | 2,819 | | — | | | — | | (2,819 | ) | | — | | — | | — | | — | | — | | | — |
Other | | 644 | | — | | | — | | (54 | ) | | 590 | | 677 | | 50 | | 627 | | 5.2 | | | 6.3 |
Group Total excl. Puerto Rico | | 40,543 | | (1,083 | ) | | 375 | | (4,853 | ) | | 34,982 | | 39,173 | | 2,047 | | 37,126 | | (3.4 | ) | | 6.1 |
Puerto Rico(4) | | 241 | | (40 | ) | | — | | — | | | 201 | | 449 | | — | | 449 | | na | | | na |
Group Total | | 40,784 | | (1,123 | ) | | 375 | | (4,853 | ) | | 35,183 | | 39,622 | | 2,047 | | 37,575 | | (2.8 | ) | | 6.8 |
76
| (1) | Published in 2002, after netting a portion of energy trading purchases and sales in the amount of €5,306 million. See Note 1-0 to our Consolidated Financial Statements. |
| (2) | Excluding the effect of acquisitions and disposals, exchange rate and gas price variations. |
| (3) | Ondeo Nalco was sold on November 4, 2003. The company was consolidated under the equity method from January 1, 2003 to the date of disposal and did not contribute to consolidated revenues for fiscal 2003. |
| (4) | Contract whose cancellation was announced January 13, 2004. |
The satisfactory level of organic revenue growth within the Group structure resulting from the 2003-2004 action plan, paved the way for nearly stable revenues (down 2.8%), despite the impact of disposals and unfavorable exchange rate movements.
| | • | Acquisitions and disposals had a negative impact of €2,806 million: These mainly include the disposals of Ondeo Nalco (€2,819 million), Northumbrian (€798 million) and Cespa (€134 million) partially offset by the consolidation of Acea Electrabel SpA and Tirrenopower in Italy and Polaniec in Poland (€723 million for the three entities), and by the consequence of deregulation in Belgium: particularly the separation of transport activities, ELIA, the creation of Electrabel Customer Solutions and the dissolution of the Electrabel joint venture with SPE (€503 million overall). See “Item 4B. Business Overview – Energy”. |
| | • | Foreign exchange fluctuations had a negative impact of €1,123 million, mainly involving the US dollar (€510 million), the Brazilian real (€195 million) and the pound sterling (€111 million). |
| | • | Gas price changes had a positive impact of €375 million. |
| | • | Organic revenue growth therefore stood at 6.1%. This organic growth stems from Energy (7.3%) and Environment (3.7%). In Energy, growth is exceptionally strong at EGI, due to the start of operations of five new power stations (€480 million) and the increase in LNG sales in the United States (€426 million). At EGE, growth is principally attributable to the optimization of both production assets and the contracts portfolio (€250 million) and increases in gas and electricity sales outside of Belgium (€267 million). Environment growth is mainly due to the Water activity in Europe, which contributed €312 million. |
Revenue breakdown by geographical area
The share of revenues generated outside France and Belgium decreased to €18,399 million in 2003 from €20,726 million in 2002, or to 46.4% of our total revenues in 2003 from 50.8% in 2002. The tables below present trading activities net for 2003 and for 2002.
| | | | | | | | | | | | |
| | | 2003
| | 2002
|
| | | France
| | Belgium
| | International
| | France
| | Belgium
| | International
|
| | | (in € millions) |
Energy | | 4,221 | | 11,010 | | 11,403 | | 4,216 | | 9,989 | | 10,037 |
Environment | | 4,962 | | 375 | | 6,974 | | 4,802 | | 427 | | 10,668 |
Other | | 567 | | 88 | | 22 | | 524 | | 99 | | 22 |
| | |
| |
| |
| |
| |
| |
|
Group Total | | 9,750 | | 11,473 | | 18,399 | | 9,542 | | 10,515 | | 20,727 |
| | |
| |
| |
| |
| |
| |
|
77
Revenues by geographical area can be broken down as follows:
| | | | | | | |
| | | 2003
| | 2002
| | Change in %
| |
| | | (in € millions) | |
France | | 9,750 | | 9,542 | | 2.2 | |
Belgium | | 11,473 | | 10,515 | | 9.1 | |
France-Belgium sub-total | | 21,223 | | 20,057 | | 5.8 | |
| | |
| |
| |
|
|
Other European Union countries | | 9,006 | | 10,146 | | (11.2 | ) |
Other European countries | | 1,378 | | 1,020 | | 35.0 | |
North America | | 3,885 | | 4,660 | | (16.6 | ) |
Europe and North America sub-total | | 35,492 | | 35,883 | | (1.1 | ) |
| | |
| |
| |
|
|
South America | | 1,702 | | 2,098 | | (18.9 | ) |
Asia/Middle East and Oceania | | 1,867 | | 2,109 | | (11.5 | ) |
Africa | | 561 | | 694 | | (19.2 | ) |
| | |
| |
| |
|
|
Group Total | | 39,622 | | 40,784 | | (2.8 | ) |
| | |
| |
| |
|
|
Growth was sustained in France and Belgium, which now represent more than 50% of total revenues as a result of growth in all Group activities.
The decrease in our revenues generated in Other European Union countries resulted from the Northumbrian and Ondeo Nalco disposals, despite the consolidation of Acea Electrabel and Tirrenopower .
The sharp decrease in our revenues generated in North America, South America, Asia /Middle East and Oceania is primarily due to the Ondeo Nalco disposal and fluctuations in the €/$ exchange rate.
Segment profit
Gross operating income (GOI) represents our measure of segment profitability. For a reconciliation to our consolidated operating income, see Note 22 to our Consolidated Financial Statements.
Our GOI by business segment for the periods indicated are set forth in the following table.
| | | | | | | | | | | | | | | | | | | | | | |
| | | 2002
| | 2003
| | 2002 vs. 2003
|
(€ millions)
| | Actual
2002
| | Foreign
exchange
effects
| | | Disposals
| | | On a
comparable
basis
| | Actual
2003
| | Acquisitions
| | | On a
comparable
basis
| | % Gross
change
Actual
| | | % Organic
growth on a
comparable
basis
|
| | | (a)
| | (b)
| | | (c)
| | | (e) = (a+b+c)
| | (f)
| | (g)
| | | (h) = (f-g)
| | (i) = (f -a)/(a)
| | | (j) = (h-e)/(e)
|
GOI | | | | | | | | | | | | | | | | | | | | | | |
Energy | | 4,125 | | (226 | ) | | (302 | ) | | 3,597 | | 4,001 | | 106 | | | 3,895 | | (3.0 | ) | | 8.3 |
Environment | | 2,916 | | (116 | ) | | (877 | ) | | 1,923 | | 1,957 | | (12 | ) | | 1,969 | | (32.9 | ) | | 2.4 |
Other | | 213 | | — | | | (106 | ) | | 107 | | 53 | | 15 | | | 38 | | na | | | na |
78
Energy
| | | | | | | | | | | | | | | | | | | | | | | | |
| | | 2002
| | 2003
| | 2002 vs. 2003
| |
(€ millions)
| | Actual
2002
| | Foreign
exchange
effects
| | | Gas
prices
| | Disposals
| | | On a
comparable
basis
| | Actual 2003
| | Acquisitions
| | On a
comparable
basis
| | % Gross
change
Actual
| | | % Organic
growth on a
comparable
basis
| |
| | | (a)
| | (b)
| | | (c)
| | (d)
| | | (e) =
(a+b+c+d)
| | (f)
| | (g)
| | (h) = (f-g)
| | (f -a)/(a)
| | | (h-e)/(e)
| |
EGE: | | | | | | | | | | | | | | | | | | | | | | | | |
Revenues | | 10,935 | | (29 | ) | | 163 | | (307 | ) | | 10,762 | | 12,747 | | 1,559 | | 11,188 | | 16.5 | | | 4.0 | |
GOI | | 2,375 | | (4 | ) | | — | | (253 | ) | | 2,118 | | 2,370 | | 92 | | 2,278 | | (0.2 | ) | | 7.6 | |
Margin rate (in %) | | 21.7 | | | | | | | | | | | | 18.6 | | | | | | | | | | |
EGI : | | | | | | | | | | | | | | | | | | | | | | | | |
Revenues | | 3,732 | | (612 | ) | | 185 | | (107 | ) | | 3,198 | | 4,491 | | 24 | | 4,467 | | 20.3 | | | 39.7 | |
GOI | | 1,203 | | (222 | ) | | — | | (39 | ) | | 942 | | 1,124 | | 3 | | 1,121 | | (6.6 | ) | | 19.0 | |
Margin rate (in %) | | 32.2 | | | | | | | | | | | | 25.0 | | | | | | | | | | |
EIS : | | | | | | | | | | | | | | | | | | | | | | | | |
Revenues | | 9,575 | | (56 | ) | | 27 | | (317 | ) | | 9,229 | | 9,396 | | 174 | | 9,222 | | (1.8 | ) | | (0.1 | ) |
GOI | | 547 | | — | | | — | | (10 | ) | | 537 | | 507 | | 11 | | 496 | | (7.4 | ) | | (7.7 | ) |
Margin rate (in %) | | 5.7 | | | | | | | | | | | | 5.4 | | | | | | | | | | |
| | |
| |
|
| |
| |
|
| |
| |
| |
| |
| |
|
| |
|
|
ENERGY | | | | | | | | | | | | | | | | | | | | | | | | |
Total: | | | | | | | | | | | | | | | | | | | | | | | | |
Revenues | | 24,242 | | (697 | ) | | 375 | | (731 | ) | | 23,189 | | 26,634 | | 1,757 | | 24,877 | | 9.9 | | | 7.3 | |
GOI | | 4,125 | | (226 | ) | | — | | (302 | ) | | 3,597 | | 4,001 | | 106 | | 3,895 | | (3.0 | ) | | 8.3 | |
Margin rate (in %) | | 17.0 | | | | | | | | | | | | 15.0 | | | | | | | | | | |
Energy revenues rose 9.9% in 2003 compared to 2002. Foreign exchange losses amounted to €697 million affecting mainly EGI for the US dollar and Brazilian real. Changes in Group structure amounted to €1,026 million, primarily affecting EGE as a result of the consolidation of Polaniec, Acea and Tirrenopower, as well as the creation of Electrabel Customer Solutions. Price increases in natural gas amounted to €375 million, including €163 million for EGE, €185 million for EGI and €27 million for EIS). As a result, organic revenue growth of energy activities rose 7.3%.
Energy GOI for 2003 declined slightly (€124 million, or 3%) compared to 2002 due to unfavorable foreign exchange fluctuations (€226 million) and changes in Group structure (€196 million: the impacts of the newly consolidated entities did not offset the impact of the equity accounting for Elia, the Belgian power transmission network). GOI organic growth increased 8.3%, driven by organic growth in revenue of EGE and EGI (despite the non-recurrence or rationing compensation paid by the Brazilian government to Tractebel Energia in 2002) which largely offset the low demand for installation activities.
Changes in Group structure and foreign exchange fluctuations, the impact of a higher gas price on sales and the non-recurrence of Brazilian rationing compensation resulted in a slight decline in the margin rate (15% in 2003 compared to 17% in 2002).
79
Electricity & Gas Europe (EGE)
Electricity & Gas Europe sales increased 16.5% in 2003. Organic revenue growth reached €426 million, or 4.0%.
| | • | Outside of Belgium, electricity sales increased by €810 million mainly due to changes in group structure. In 2003, these sales represent approximately 40% of the total EGE electricity sales volume compared to 31% in 2002. |
| | • | In Belgium, sales to all captive and deregulated customers decreased slightly, as the second half of 2003 was marked by further deregulation as a result of the opening of the market in Flanders. |
| | • | Electrabel and Distrigaz gas sales to Belgian distributors decreased slightly subsequent to deregulation in Flanders during the 2nd half of 2003. This followed the favorable impacts of a harsh winter in the first quarter. |
| | • | Exports outside of Belgium rose sharply (€120 million), resulting from a combination of non-recurring sales in Spain and new supply contracts in France. |
| | • | Sales of electricity, gas and other fuels made as a result of the optimization of both production assets and the contracts portfolio amounted to €1,495 million, an increase of €250 million, mainly related to gas sales. |
EGE’s GOI stood at €2,370 million, stable when compared to 2002 (€2,375 million). GOI was affected by changes in Group structure (equity accounting of Elia beginning in October 2002, partially offset by the new contributions of Acea, Tirrenopower and Polaniec ). Organic GOI growth rose sharply by 7.6% (€160 million) compared to 2002, primarily due to increased sales by Distrigaz (favorable weather conditions in the first half of 2003, LNG export sales, waiver of the application of certain Belgian regulatory measures) and the implementation of Optimax measures (reduction of payroll and costs related to information systems, outsourcing of maintenance services), which offset the impact of rate reductions imposed by the Belgian regulator for Electrabel (negative €100 million), Elia and Fluxys.
The EGE margin rate thus stood at 18.6% in 2003, compared to 21.7% in 2002.
Electricity & Gas International (EGI):
Electricity & Gas International revenues increased 20.3% in 2003. Organic revenue growth was €1,269 million or 39.7%.
The exceptional organic growth is explained primarily by the commissioning of new power stations in 2002 and 2003 and the pursuit of liquid natural gas (LNG) development, in particular the 2003 organic growth stems primarily from:
| | • | North America(€983 million) with |
| | • | Sales growth for Tractebel LNG North America (€426 million or 68% in volume) due primarily to the doubling of gas vaporization capacity at the Everett terminal and increased transport capacity, |
80
| | • | Start-up of four new power stations (€332 million): Red Hills (440MW) in Mississippi, Ennis (350MW) in Texas, Monterrey (245MW) in Mexico and Chehalis (520MW) in the state of Washington, |
| | • | Commercial success of direct energy sales to industrial and tertiary customers through the start-up of Tractebel Energy Services Inc. (TESI: € 144 million), |
| | • | Impact of a harsh 2002-2003 winter for Trigen (€30 million). |
| | • | Asia, with the start up of the Bowin power station (740MW) in Thailand (€148 million) at the end of January 2003; |
| | • | TheLNG activity outside of North America (€132 million). |
Latin Americarevenues were virtually stable (negative €30 million): the non-recurrence of the rationing indemnity recorded in Brazil in 2002 was largely offset by contractual price adjustments and the signing of new bilateral contracts with distributors and industrial customers as part of the deregulation of the Brazilian energy market.
Electricity & Gas International GOI was €1,124 million in 2003, compared to €1,203 million in 2002, down 6.6% due to currency fluctuations against the euro (negative €222 million, including €105 million for the US dollar and €79 million for the Brazilian real). Organic GOI growth increased by €179 million, or 19%. This performance was achieved despite the non-recurrence of rationing in Brazil in 2002 (decrease of €97 million). This organic growth results from the start up of new power stations in the United States, Mexico, Thailand and Brazil (combined impact of approximately €79 million), development of the LNG activities of TLNG North America and Tractebel Ltd London (€61 million), one-time generated revenues in the Middle-East (€31 million), trading activities now dedicated solely to the optimization of production assets (€21 million), the renegotiation of initial contracts at more advantageous rates and the reduction of operating costs in Brazil (€63 million excluding rationing).
The decrease in EGI margin rates (25% in 2003 compared to 32.2% in 2002) is essentially due to the development of less capital-intensive activities (TESI retail activity in the United States) with structurally lower margin rates, development of the LNG activity as well as unfavorable gas-electricity differentials (spark spreads) currently faced by merchant plants operating in the United States. The decrease in the Brazil margin, due to the non-recurrence of the benefit resulting from the 2002 rationing, was entirely offset by higher margins on bilateral contracts.
Energy and Industry Services (EIS)
EIS revenues decreased slightly as a result of a decline in installation activities subsequent to client postponements of investment projects, particularly in the Netherlands and Belgium, partially offset by growth in service activities.
GOI of EIS was down sharply as a result of an economic slow-down for Fabricom (negative €80 million, particularly in Belgium and for GTI in the Netherlands and Inéo in France), which led to vigorous cost-cutting measures (closing of the Axima Winterthur head office and restructuring of GTI), offset partially by the strong resilience of Elyo (€7 million) and the increased contribution of engineering activities (€31 million).
The Fabricom difficulties influenced the EIS margin rate, which declined from 5.7% in 2002 to 5.4% in 2003.
81
Environment
| | | | | | | | | | | | | | | | | | | | | | |
| | | 2002
| | 2003
| | 2002 vs. 2003
|
(€ millions)
| | Actual
2002
| | Foreign
exchange
effects
| | | Disposals
| | | On a
comparable
basis
| | Actual
2003
| | Acquisitions
| | | On a
comparable
basis
| | % Gross
change
Actual
| | | % Organic
growth on
a
comparable
basis
|
| | | (a)
| | (b)
| | | (d)
| | | (e) =
(a+b+c+d)
| | (f)
| | (g)
| | | (h) = (f-g)
| | (f -a)/(a)
| | | (h-e)/(e)
|
SELS : | | | | | | | | | | | | | | | | | | | | | | |
Revenues excl. Puerto Rico | | 12,698 | | (386 | ) | | (1,251 | ) | | 11,061 | | 11,693 | | 240 | | | 11,453 | | (7.9 | ) | | 3.5 |
Revenues | | 12,939 | | (426 | ) | | (1,251 | ) | | 11,262 | | 12,142 | | 240 | | | 11,902 | | (6.2 | ) | | 5.7 |
GOI | | 2,380 | | (106 | ) | | (381 | ) | | 1,893 | | 1,950 | | (15 | ) | | 1,965 | | (18.1 | ) | | 3.8 |
Margin rate (in %) | | 18.4 | | | | | | | | | | 16.1 | | | | | | | | | | |
SEIS : | | | | | | | | | | | | | | | | | | | | | | |
Revenues | | 2,959 | | (1 | ) | | (2,817 | ) | | 141 | | 168 | | — | | | 168 | | na | | | 19.1 |
GOI | | 536 | | (10 | ) | | (496 | ) | | 30 | | 7 | | 3 | | | 4 | | na | | | na |
Margin rate (in %) | | 18.1 | | | | | | | | | | ns | | | | | | | | | | |
| | |
| |
|
| |
|
| |
| |
| |
|
| |
| |
|
| |
|
| ENVIRONMENT Total: | | | | | | | | | | | | | | | | | | | | | | |
Revenues excl. Puerto Rico | | 15,657 | | (386 | ) | | (4,068 | ) | | 11,203 | | 11,861 | | 240 | | | 11,621 | | (24.2 | ) | | 3.7 |
Revenues | | 15,897 | | (426 | ) | | (4,068 | ) | | 11,403 | | 12,310 | | 240 | | | 12,070 | | (22.6 | ) | | 5.8 |
GOI | | 2,916 | | (116 | ) | | (877 | ) | | 1,923 | | 1,957 | | (12 | ) | | 1,969 | | (32.9 | ) | | 2.4 |
Margin rate (in %) | | 18.3 | | | | | | | | | | 15.9 | | | | | | | | | | |
SUEZ Environnement (formerly SELS):
SUEZ Environnement generated revenues of €12.1 billion in 2003, including Puerto Rico, down 6.2% from 2002 because of changes in Group structure (negative €1,011 million, due to the partial sale of Northumbrian, the remaining 25% interest of which is accounted for under the equity method as of January 1, 2003, and the sale of Cespa in the last quarter), and foreign exchange fluctuations (negative €425 million, including €162 million related to the US dollar, €74 million related to the pound sterling and €105 million related to South American currencies) . Organic revenue (excluding Puerto Rico) was up 3.5%, or €391 million, mainly because of the performance of:
| | • | Water in Europe (up 9.2%, or €312 million) and particularly in France (up 7.1%) due to satisfactory commercial performance (new industrial contracts, amendments to existing lead regulation) and hot summer weather conditions; |
| | • | Waste Services in France (organic growth up 3.3% resulting from an increase in rates combined with a increased demand) offsetting the cost of termination of low margin contracts in certain European countries, namely the United Kingdom and Germany and lower demand resulting from a sluggish economy in Europe; |
| | • | International activity, mainly in Latin America (€56 million), stemming in particular from growth in Chile and Brazil; |
| | • | Growth of 3.1% for Degrémont, with a slight drop at the year-end, when the major Fujairah and Gabal contracts entered the erection phase. |
82
SUEZ Environnement GOI declined by €430 million in 2003 compared to 2002 because of the sales of Northumbrian and Cespa (€385 million), less favorable exchange rates (negative €106 million, including €33 million on the US dollar, €24 million on the Chilean peso and €13 million on the pound sterling). Organic GOI growth was up €72 million, or 3.8%. This stems from both the solid performance of Water and Waste Services in France (GOI up by €47 million), the reduction of head office costs (€40 million), and higher GOI from international operations (higher rates obtained in Chile, activity growth in Morocco) offset by a decline in GOI at Degrémont (major international contracts entering the construction phase and one-time difficulties in Great Britain) and in Water and Waste Services in the US and Waste Services in Germany (decrease in non-hazardous industrial waste activities).
Removals from Group structure (Northumbrian, a particularly capital-intensive company, as demonstrated by a GOI / revenue margin that exceeded the SUEZ Environnement division average) and foreign exchange impacts modified the SUEZ Environnement margin rate which was 16.1 % in 2003 compared to 18.4% in 2002.
SUEZ Environnement Industrial Services (SEIS):
SEIS revenue was affected by Group structure changes related to the disposal of Ondeo Nalco (€2,819 million). Ondeo Industrial Solutions (OIS), now the sole contributor to this segment, posted organic growth of 19.1%, due to the signing of significant contracts in 2003.
The GOI of this segment was not significant (low contribution of Ondeo Nalco, accounted for under the equity method from January 1 to October 31, 2003, and the marked growth in OIS activity).
Communication, Capital investment and Other
| | | | | | | | | | | | | | | | | |
| | | 2002
| | 2003
| | 2002 vs. 2003
|
(€ millions)
| | Actual
2002
| | Disposals
| | | On a
comparable
basis
| | Actual
2003
| | Acquisitions
| | On a
comparable
basis
| | % Gross
change
Actual
| | % Organic
growth on a
comparable
basis
|
| | | (a)
| | (d)
| | | (e) =
(a+b+c+d)
| | (f)
| | (g)
| | (h) = (f-g)
| | (f -a)/(a)
| | (h-e)/(e)
|
Sales | | 644 | | (54 | ) | | 590 | | 677 | | 50 | | 627 | | 5.2 | | 6.3 |
GOI | | 213 | | (106 | ) | | 107 | | 53 | | 15 | | 38 | | na | | na |
The Communication activity was the sole contributor to revenues of this segment. These revenues were mainly realized by Métropole Télévision (M6) and Noos, proportionally consolidated at 34.6% and 50.1%, respectively, as of December 31, 2003.
Communication revenues rose by 5.2% (€33 million), and organic growth increased by 6.3%, due to the solid performance of M6 in particular.
The segment’s GOI comprises:
| | • | increase in GOI for the Communication subsidiaries (€43 million), particularly because of the cost-cutting efforts at Noos |
| | • | €118 million decrease in dividends on listed securities (primarily Fortis, Axa, and Total), following the disposal program |
| | • | the non-recurring disposal proceeds received in 2002 by SI Finance (capital development) for €51 million. |
83
Other Income statement items
Other income
Other income decreased by 28% or €585 million to €1,488 million in 2003 from €2,074 in 2002 primarily due to :
| | • | a decrease in income resulting from disposals of construction site equipment and assets under concession, as well as income from the non-recurrence of income from the sale of venture capital companies in 2002 for €188 million, and |
| | • | a decrease in internal costs allocated to capitalized assets by €191 million. |
Operating expenses
Our operating expenses decreased by 2% or €695 million to €35,384 million in 2003, from €36,079 million in 2002 after netting energy purchases and sales. The decrease is primarily due to the sale of Northumbrian and Ondeo Nalco which contributed €2,694 million to the decrease, offset substantially by increases in operating expenses due to increased business activities.
Depreciation, amortization and provisions
Depreciation, amortization and provisions declined (€549 million or 18%) because of the combined impact of the sale of Northumbrian and Ondeo Nalco (total depreciation charges of €358 million in 2002), the deceleration of depreciation charges for the Belgian nuclear facilities, for which the useful life was extended to 40 years in 2003 in connection with the changes in the regulations, and a favorable foreign exchange impact for North and South American power stations, which was partially offset by charges for newly commissioned power stations (primarily in the US and Asia).
Operating income
Operating income stood at €3,205 million in 2003 compared to €3,708 million in 2002, a decrease of €503 million or 13.5% due to the sale of Northumbrian and Ondeo Nalco (respectively €270 million and €343 million in 2002), and Elia (€149 million until it was accounted for under the equity method in October 2002) and the exchange rate fluctuations mentioned at the GOI level. These negative impacts were partially offset by organic growth (GOI) mainly resulting from the implementation of the Optimax cost-cutting program.
Financial Income (Loss)
Financial loss amounted to €880 million compared to €976 million in 2002, a 9.9% improvement (€96 million) despite a €145 million decrease in dividends from non-consolidated companies following the sales of Fortis, Total, Axa, Iberdrola and Scottish Power shares in the second half of 2002 and the beginning of 2003. The improvement results from lower financial expenses (€288 million) arising from the significant reduction in net debt, resulting from the 2003-2004 action plan.
Exceptional Income (Loss)
Net exceptional loss impact amounted to €2,758 million in 2003, compared to €1,784 million in 2002.
The exceptional losses for 2003 was mainly attributable to:
| | • | Capital losses recognized on the disposals of Ondeo Nalco (€752 million), Northumbrian (€360 million) and the residual portfolio of listed securities (€54 million), partially offset by the disposal of Cespa (Waste Services subsidiary in Spain) which generated a capital gain of €226 million; |
84
| | • | Write-down provisions recorded as part of the Communication disposals program (€904 million, of which €754 million for Noos and €150 million for LDCom) and for the projected withdrawal from certain activities (€120 million). |
| | • | Impairments for certain operating subsidiaries, the development potential of which has been revised (€400 million, primarily for Water in the United States and Waste Services in Germany, where the disappointing commercial outlook resulted in adjusted mid-term plans). |
| | • | Restructuring costs (€198 million), essentially as part of the Optimax plan and for the termination of loss-making contracts (€73 million). |
Income Tax
Income tax charge was €721 million in 2003 compared to €657 million in 2002, despite the de-consolidation of Northumbrian and Ondeo Nalco, which contributed €143 million in 2002. In 2003, the effective tax rate on current income was 29% compared to 26.4% in 2002, due to the existence of non-deductible losses in certain countries (France and the Netherlands in particular). The exceptional loss benefits only marginally from tax deductibility (non-deductible capital losses or write-downs and non-recognition of deferred tax assets in a loss-making period).
Share in income of Companies Accounted for under the Equity Method
Income of companies accounted for under the equity method increased from €51 million in 2002 to €166 million in 2003 because of the equity accounting of Elia over a full year as opposed to three months in 2002 (an impact of €31 million), one-time revenues related to the commissioning of a power station in the Middle-East (€34 million), and the non-recurrence of losses recognized in 2002 by the Argentine subsidiaries (impact of €31 million). Northumbrian (for the 25% retained) and Ondeo Nalco (accounted for under the equity method from January 1 to the date of sale, October 31, 2003) did not contribute significantly to the item due to the financial expenses borne by Northumbrian following releverage by the purchasers and restructuring costs borne by Ondeo Nalco in preparation for the change in ownership.
Goodwill amortization
Goodwill amortization amounted to €267 million in 2003, compared to €383 million in 2002. The decrease resulted from the equity accounting of Ondeo Nalco in 2003. Ondeo Nalco had contributed €111 million to the item in 2002.
Minority Interests
Minority interest share amounted to €910 million in 2003, compared to €822 million in 2002. This increase is primarily due to the non - -recurrence of losses reported by the South American subsidiaries in 2002 on the one hand and the Elia capital gain recorded by Electrabel in 2002 on the other hand, as well as income growth for Distrigaz in 2003.
Net Income (Loss)
As a result of the factors discussed above, net loss amounted to €2,165.2 million in 2003, compared to €862.5 million in 2002.
85
2002 Compared to 2001
Revenues
Our revenues by business segment for the periods indicated are set forth in the following table.
| | | | | | |
| | | 2002
| | 2001
| | % Gross change
|
| | | (in € millions) | | |
Energy | | 29,548 | | 26,374 | | 12.0 |
Of which energy trading activities | | 5,872 | | 3,869 | | 51.8 |
Environment | | 15,897 | | 15,374 | | 3.4 |
Global businesses | | 45,445 | | 41,748 | | 8.9 |
Other | | 644 | | 611 | | 5.4 |
| | |
| |
| |
|
Group Total | | 46,089 | | 42,359 | | 8.8 |
| | |
| |
| |
|
The revenue analysis for 2002 compared to 2001 includes energy trading activities recorded gross in the energy segment to be consistent with the historical information. The total amount of trading activities had no impact on GOI or net income.
Revenues increased by 8.8% to €46,089 million in 2002 compared to €42,359 million in 2001 reflecting mainly the following factors:
| | • | External growth was 4.0% (€1,698 million), and primarily resulted from our acquisitions during 2001 in Energy and Industrial Services for €1,355 million (primarily GTI, Axima Winterthur), and during 2002 in Waste Services for €138 million (Teris and Teris LLC). |
| | • | Foreign exchange fluctuations had a negative net effect of €1,526 million, or 3.6%. This is explained by the devaluation of the Argentine peso (€834 million), as well as devaluation of the Brazilian real (€305 million) and the US dollar (€267 million). |
| | • | Declining gas prices had an overall negative effect of €643 million, or 1.5%, although the effect on operating margins was limited. |
| | • | Revenues from energy trading activities amounted to €5,872 million in 2002, compared to €3,869 million in 2001. |
| | • | Organic growth of the Group’s businesses despite a challenging environment. |
Geographical breakdown
The share of revenues generated outside France and Belgium increased to €25,270 million in 2002 from €23,136 million in 2001, or to 54.8% of our total revenues in 2002 from 54.6% in 2001.
| | | | | | | | | | | | |
| | | 2002
| | 2001
|
| | | France
| | Belgium
| | International
| | France
| | Belgium
| | International
|
| | | (in € millions) |
Energy | | 4,644 | | 10,323 | | 14,581 | | 4,266 | | 9,725 | | 12,384 |
Environment | | 4,802 | | 427 | | 10,668 | | 4,212 | | 421 | | 10,741 |
| | | | | | |
Global businesses | | 9,446 | | 10,750 | | 25,249 | | 8,478 | | 10,146 | | 23,125 |
Other | | 524 | | 99 | | 21 | | 508 | | 91 | | 11 |
| | |
| |
| |
| |
| |
| |
|
Group Total | | 9,970 | | 10,849 | | 25,270 | | 8,986 | | 10,237 | | 23,136 |
| | |
| |
| |
| |
| |
| |
|
86
Revenues by geographical area, including energy trading activities, can be broken down as follows:
| | | | | | | |
| | | 2002
| | 2001
| | Change in %
| |
| | | (in € millions) | | | |
France | | 9,970 | | 8,986 | | 11.0 | |
Belgium | | 10,849 | | 10,238 | | 6.0 | |
France-Belgium sub-total | | 20,819 | | 19,224 | | 8.3 | |
Other European Union countries | | 14,629 | | 12,123 | | 20.7 | |
Other European countries | | 1,081 | | 911 | | 18.7 | |
North America | | 4,659 | | 4,300 | | 8.3 | |
Europe and North America sub-total | | 41,188 | | 36,558 | | 12.7 | |
South America | | 2,098 | | 3,056 | | (31.3 | ) |
Asia and Oceania | | 2,109 | | 2,093 | | 0.8 | |
Africa | | 694 | | 652 | | 6.4 | |
| | |
| |
| |
|
|
Total | | 46,089 | | 42,359 | | 8.8 | |
| | |
| |
| |
|
|
The increase in our revenues from the European Union zone was due primarily to the entry of Axima Winterthur and GTI into the Group structure.
The increase in our revenues generated in North America resulted from the impact of the new water contract in Puerto Rico, partially offset by the decrease in gas prices (Trigen and Tractebel LNG NA) and the US dollar.
The decline in our revenues from the South American zone was related to the depreciation of the Brazilian and Argentine currencies.
Revenues realized in Europe and North America grew by 12.7% and represented 89% of total revenues in 2002, compared to 86% in 2001.
Segment profit
GOI represents our measure of segment profitability. For a reconciliation to our consolidated operating income, see Note 22 to our Consolidated Financial Statements.
Energy
| | | | | | | | | | | | | | | |
| | | 2002
| | 2001
|
| | | Revenues
| | 2002/2001
change in
revenues
(%)
| | | GOI(1)
| | GOI
margin in
%
| | Revenues
| | GOI(1)
| | GOI margin
(%)
|
| | | (in € millions, except percentages) |
EGE | | 16,253 | | 12.7 | | | 2,375 | | 14.6 | | 14,424 | | 2,600 | | 18.0 |
EGI | | 3,732 | | (6.0 | ) | | 1,203 | | 32.2 | | 3,970 | | 1,135 | | 28.6 |
EIS | | 9,562 | | 19.8 | | | 547 | | 5.7 | | 7,980 | | 596 | | 7.5 |
| | |
| |
|
| |
| |
| |
| |
| |
|
Energy Total | | 29,548 | | 12.0 | | | 4,125 | | 14.0 | | 26,374 | | 4,331 | | 16.4 |
| | |
| |
|
| |
| |
| |
| |
| |
|
| (1) | GOI represents our measure of segment profitability. For a reconciliation to our consolidated operating income, see Note 22 to the Financial Statements. |
Energy revenues totaled €29.6 billion, including the trading activities of Tractebel Electricity & Gas Europe of €5.9 billion (compared to €3.9 billion in 2001).
Energy GOI declined by €206 million in 2002 compared to 2001. The decline in GOI was the result of changes in Group structure (primarily the change to accounting under the equity method for Elia starting in
87
October 1, 2002) of negative €64 million and of unfavorable foreign exchange fluctuations of €200 million mainly involving the Brazilian real (€120 million) and to a lesser extent the Argentine peso and the US dollar.
The GOI margin rate was 14.0% down from 16.4%, due to changes in group structure of EIS which the GOI margin rate is structurally lower, and which suffered declining performances in 2002. In addition, the effects of lower prices in Belgium, equity accounting for Elia (the Belgian power transmission network) were not totally offset by the positive impact of rationing measures in Brazil.
Electricity & Gas Europe (EGE)
The increase in Electricity & Gas Europe revenues (up 12.7%) is mainly due to increased trading revenues of €2 billion and changes in Group structure and foreign exchange impacts representing €35 million.
GOI decreased by €225 million, including €57.5 million due to Group structure change. There were no significant foreign exchange impacts. Other factors that decreased GOI included lower prices in Belgium in connection with deregulation and, to a lesser extent, adverse weather conditions (a warmer winter) (2001/2002 winter), and the non-recurrence of positive elements in 2001 for Distrigaz and Electrabel NL. These elements were partially offset by the start-up of a new plant in Luxembourg and productivity gains at Electrabel in connection with the Transform 2003 project that was approved in 2001 and which, in accordance with the plan, has not yet generated all the expected cost savings.
Electricity & Gas International (EGI)
The decline in Electricity & Gas International revenues (6%) results from both the negative foreign exchange impacts (€529 million or 13%) and gas price variations (€95 million, or 2.4%) offset by the positive effect of changes in Group structure of €21 million and organic growth. Electricity & Gas International organic growth primarily stemmed from the start-up of two new power stations in the United States (Red Hills, Mississippi, on April 1 and Ennis, Texas on May 2), higher volumes in Asia and solid performances in Latin America. Latin America benefited in particular from price supplements granted by the Brazilian authorities in connection with the energy rationing program set up following the 2001 drought and from the start-up of production units.
EGI GOI rose by €68 million, in spite of a foreign exchange impact of negative €204 million due to unfavorable fluctuations relating to the Brazilian real, the Argentine peso and the US dollar. The effect of changes in Group structure amounted to €26 million, following the acquisition of Houay Ho in Laos in late 2001 and the sale of two plants in Thailand in late 2002.
The Brazilian subsidiary played a significant role in this organic growth due to the favorable indexation of a portion of its contracts, the start-up of the Cana Brava plant during the first half of 2002 and the full-year contribution of the Itasa plant. The rationing program income valued in the first half of 2002 by the local regulatory authorities (MAE), net of payments to distributors imposed in the second half of 2002, contributed €122 million to 2002 GOI.
Thailand contributed €42 million to GOI growth, due to the combined impact of a marked improvement in operating performance of plants commissioned in 2001 and increased revenues following the start-up of a unit.
North America contributed €20 million to GOI growth, mainly because of the commissioning of the Ennis and Red Hills power stations in the Spring of 2002 and sustained LNG sales activity.
Energy and Industry Services (EIS)
Revenues from Energy and Industry Services totaled €9.6 billion, in 2002, an increase of 19.8%, from 2001, of which €1.2 billion (14.7%) resulted from changes in Group structure following the GTI, Axima Winterthur, Treg and Restiani acquisitions in 2001 and the transfer of 50% of Novergie to SITA.
88
The Services and Installations and Maintenance subsidiaries experienced contrasting trends in 2002:
| | • | The Services activity experienced sustained growth in revenues, as well as in GOI (€54 million), resulting from Elyo’s growth in maintenance, facilities management and industrial outsourcing, along with urban heating and cooling with the start-up of the new Vitry cogeneration plant. This was achieved despite the completion by Axima of certain unprofitable contracts in Germany and the transfer of 50% of Novergie to SITA. |
| | • | The Installations and Maintenance activities recorded organic revenue growth, but GOI declined due to the weak performances turned in by Dutch and German subsidiaries in a difficult economic environment. |
Finally, the Engineering activity posted a €112 million increase in revenues (24%) compared to 2001, while GOI was down by €26 million due to losses on turnkey contracts for which reserves had previously been recorded.
Environment
| | | | | | | | | | | | | | | | | |
| | | 2002
| | | 2001
| |
| | | Revenues
| | 2002/2001 change in %
| | | GOI(1)
| | GOI margin
| | | Revenues
| | GOI(1)
| | GOI margin
| |
| | | (in € millions, except percentages) | |
SELS | | 12,938.5 | | 4.8 | % | | 2,379.9 | | 18.4 | % | | 12,348.1 | | 2,575.1 | | 20.9 | % |
SEIS | | 2,958.9 | | (2.2 | %) | | 535.9 | | 18.1 | % | | 3,026.2 | | 548.8 | | 18.1 | % |
| | |
| |
|
| |
| |
|
| |
| |
| |
|
|
Environment Total | | 15,897.4 | | 3.4 | % | | 2,915.8 | | 18.3 | % | | 15,374.3 | | 3,123.9 | | 20.3 | % |
| | |
| |
|
| |
| |
|
| |
| |
| |
|
|
| (1) | GOI represents our measure of segment profitability. For a reconciliation to our consolidated operating income, see Note 22 to the Financial Statements. |
The Environment GOI margin rate decreased from 20.3% to 18.3% due to foreign exchange fluctuations and the Argentine crisis, start-up of the Puerto Rico contract and changes in Group structure.
SUEZ Environnement Local Services (SELS)
Local Services generated revenues of €12.9 billion, a 4.8% increase compared to 2001. Exchange rate fluctuations had a negative impact of €822 million, of which €643 million was related to the devaluation of the Argentine peso.
Changes in Group structure had a positive impact of €450 million mainly attributable to the industrial hazardous waste treatment activities (buyout of Rhodia’s investment in Teris and Teris LLC), the transfer of 50% of Novergie from the Energy divisions to SITA (SELS division) and the acquisition of an additional 50% of Eurawasser.
Revenue growth of 4.8% was primarily due to the new Puerto Rico contract which started up on July 1, 2002 (€241 million), sustained Waste Services activity (€228 million, notably in France, the UK, and Northern Europe and in industrial hazardous waste treatment activity), Water activities in Europe (€227 million essentially in France and Spain) and finally Ondeo Degrémont (€105 million, whose activity was sustained by major contracts in Egypt and the United Arab Emirates, the start-up of Mexican BOT contracts and new contracts obtained in France, Spain and Italy).
SELS GOI totaled €2.4 billion in 2002, down €195 million or 7.6% compared to 2001. This decline was mainly due to negative exchange rate fluctuations (€333 million, of which €273 related to the Argentine peso), whereas the effect of changes in Group structure was positive €80 million.
89
SUEZ Environnement Industrial Services (SEIS)
This business line was made up of two operating entities, Ondeo Nalco and Ondeo Industrial Services in 2002 and 2001. It generated revenues of €3.0 billion, a decrease of 2.2% versus 2001 mainly due to the depreciation of the US dollar against the euro (negative foreign exchange fluctuations of €189 million). The sustained efforts of the Specialties and Services activity in the oil industry compensated for the decline experienced by the Industry and Pulp & Paper divisions in North America.
SEIS GOI was €536 million, down 2.4% compared to 2001. The effect of changes in Group structure and foreign exchange fluctuations negatively impacted GOI by €41.7 million. mainly offset by the continued reductions in procurement costs at Ondeo Nalco.
Communication, Capital investment and Other
| | | | | | | | | | |
| | | 2002
| | 2001
|
| | | Revenues
| | 2002/2001 change in%
| | GOI(1)
| | Revenues
| | GOI(1)
|
| | | (in € millions, except percentages) |
Other (Communication, Capital investment and Other) | | 644.2 | | 5.4 | | 212.5 | | 611.0 | | 283.0 |
| | |
| |
| |
| |
| |
|
| (1) | GOI represents our measure of segment profitability. For a reconciliation to our consolidated operating income, see Note 22 to the Financial Statements. |
The Communication business was the sole contributor to revenues of this segment in 2002 and 2001. Revenues in communication were mainly realized by Métropole Télévision and NOOS, two proportionally consolidated subsidiaries (38.1% and 50.1% owned respectively). Capital investment businesses and holding companies (primarily SUEZ and Société Générale de Belgique) contribute to this segment GOI.
Communication revenues rose by 5.4% between 2001 and 2002. The growth of the Communication business resulted from the combined impact of an increase in cable subscriber numbers (NOOS) and 33% growth in the diversification activities of M6.
The sale of Fortis and Vinci shares in 2001, which had no effect on revenues, led to a €172.5 million decrease in GOI.
Venture Capital GOI stood at €44 million, up €45 million due particularly to the sale of Labeyrie.
GOI of the communication business was up €41 million due primarily to the improvement in Métropole Télévision and TPS contributions and to cost cutting policies launched in the cable business.
Other Income statement items
Other income
Other income increased by 17% or €300 million to €2,074 million in 2002 from €1,774 million in 2001. The increase was primarily due to an increase in income from disposals realized by venture capital companies of €186 million.
Operating expenses
Our operating expenses increased by 12% or €4,414 million to €41,385 million in 2002, from €36,971 million in 2001. The increase was due primarily to:
| | • | an increase of 9% or €1,381 million in purchases and changes in inventories mainly due to the development of trading activities for the Energy division; and |
90
| | • | an increase of €900 million due to changes in group structure, mainly due to the full year consolidation of GTI and Axima Winterthur (formerly Sulzer Infra), and minority interest buyout in Teris and Teris LLC. |
Depreciation, Amortization and Provisions
Depreciation, amortization, and provisions remained stable compared to 2001, decreasing by €28 million or 1% to €3,071 million in 2002 from €3,099 million in 2001.
Operating income
As a result of the revenues and expenses mentioned above, operating income decreased by 8.8% to €3,708 million in 2002 from €4,064 million in 2001.
Financial Income (Loss)
Financial loss decreased by 22.4% or €282 million to €976 million in 2002 from €1,258 million in 2001. This decrease in financial loss was primarily due to:
| | • | an increase in dividends from unconsolidated companies of €180 million mainly due to a dividend of €119 million paid by Fortis (accounted for under the equity method until December 2001); and |
| | • | a decrease in interest expenses by €260 million due to the combined impact of lower interest rates (the average cost of debt fell by 70 basis points in 2002) and a reduced level of net debt starting in the second half of 2002. |
Exceptional Income (Loss)
In 2002, exceptional loss was €1,784 million compared to an exceptional income of €826 million in 2001. Capital gains amounted to €601 million and related primarily to the sale of TPS (€170 million), Scottish Power (€112 million or €34 million Group share), Chateau d’eau (€90 million), Arcelor (€51 million), Iberdrola (€104 million, or €71 million Group share), Acesa (€109 million, or €99 million Group share), Adeslas (€83 million, or 42 million Group share) and the partial sale of Elia (€539 million, or €167 million Group share) securities. Capital gains also related to the sale of various real-estate assets (€188 million) that were leased back by us, the impact of the sale of, and allocations to reversals of provisions against Axa (€225 million) and Fortis (€245 million) securities, and finally provisions against the portfolio of miscellaneous listed and unlisted securities (€353 million, or €286 million Group share).
Net other exceptional expenses totaled €2,384 million in 2002 and primarily include the impact of the South-American crisis (€826 million, or €612 million Group share, including €500 million related to Argentina (see Note 2.4 to our Consolidated Financial Statements) and €112 million resulting from the deterioration in the Brazilian real/US dollar exchange rate). These exceptional expenses also include various charges and provisions relating to the discontinuation of activities (€299 million, or €244 million Group share, primarily concerning the Jakarta, Manila and Atlanta contracts) and an expense of €786.6 million related to value adjustments to certain assets (€564 million Group share, including €162 million for the write-down of goodwill balances of German subsidiaries in the Waste Services sector, €175 million for the write-down of securities and other assets in the Communication sector, €90 million for the write-down of goodwill balances of Chilean water subsidiaries and €107 million for the write-down of Dutch energy subsidiaries). Finally, this line item includes various restructuring costs and provisions (€168 million, or €147 million Group share).
Income Tax
Income tax decreased to €657 million in 2002, from €722 million in 2001. Our effective tax rate was 69% in 2002 compared to 20% in 2001 mainly due to the high level of exceptional losses related to Argentina and
91
discontinuation of activities and value adjustments of certain assets, which did not give rise to the recording of deferred tax assets, whereas 2001 net income included substantial non-taxable capital gains (€1,784 million exceptional loss in 2002 compared to an exceptional gain of €826 million in 2001). As of December 31, 2002, we had €5,386 million in tax loss carry forwards, 57% of which expire in 2008 and thereafter.
Share in Income of Companies Accounted for under the Equity Method
Income of companies accounted for under the equity method decreased by 85% in 2002 to €51 million from €334 million in 2001, primarily due to the removal of Fortis from the scope of consolidation as of December 2001 and Vinci as of May 2001.
Goodwill Amortization
Goodwill amortization decreased by 9% or €40 million to €383 million in 2002, from €423 million in 2001, principally in the Environment business (decrease by €32.5 million).
Minority Interests
Minority interests increased €87 million to €822 million in 2002 from €735 million in 2001, representing more than 100% of total net income before minority interests in 2002 compared to 26% in 2001. This increase is mainly due to the capital gains realized on the sale of 30% of Elia recorded by Electrabel in 2002, partially offset by losses borne by minority interests in Argentine water companies.
Net Income (Loss)
As a result of the factors discussed above, net loss amounted to €863 million in 2002 compared to a net income of €2,087 million in 2001.
B. Liquidity and Capital Resources
The following table sets forth certain cash flow items for 2001 through 2003:
| | | | | | | | | |
| | | Year ended December 31,
| |
| | | 2003
| | | 2002
| | | 2001
| |
| | | (in € millions) | |
Cash flow from operating activities | | 4,495 | | | 4,827 | | | 5,403 | |
Cash flow used in (from) investing activities | | 3,608 | | | (3,201 | ) | | (4,332 | ) |
Cash flow (used in) from financing activities | | (6,190 | ) | | 1,720 | | | (889 | ) |
Effect of changes in group structure & exchange rates | | 15 | | | (357 | ) | | (18 | ) |
| | |
|
| |
|
| |
|
|
Net increase (decrease) in cash | | 1,928 | | | 2,989 | | | 164 | |
| | |
|
| |
|
| |
|
|
We believe that our cash flow from operating activities (€4,495 million in 2003), authorized credit facilities and commercial paper backup lines (€8,708 million as of December 31, 2003) and our cash and marketable securities positions (€11,703 million as of December 31, 2003) will be sufficient to cover our current and anticipated liquidity requirements for the next 12 months. However, we may decide to borrow additional amounts from banks or to issue new debt securities to investors to maintain our level of unused available credit lines.
Cash Flow from Operating Activities
Our cash flows from operating activities decreased 6.9% from €4,827 million in 2002 to €4,495 million in 2003, after decreasing from €5,403 million in 2001 to €4,827 million in 2002. Cash flow from operating activities includes gross cash flow which amounted to €3,727 million in 2003.
92
Pursuant to recent rules adopted by the SEC, the Group has provided a reconciliation of gross cash flow to net income for the financial year ended December 31, 2003 and 2002. Gross cash flow results from the addition of the net income and non cash items, the reconciliation is disclosed in the consolidated statement of cash flows in our Consolidated Financial Statements. Although gross cash flow is permitted under French GAAP, this measure is a non-GAAP measure under U.S. GAAP. The Group believes that net income is the most directly comparable financial measure presented in accordance with generally accepted accounting principles.
The Group believes that this measure is useful to investors and management in determination of our operating performance. However, gross cash flows should not be considered as a measure of financial performance under U.S. GAAP and thus should be evaluated together with other financial measures calculated in accordance with French and U.S. GAAP. In addition, this definition of gross cash flow may not be comparable to similarly titled financial measures used by other companies.
The contribution of the different businesses to gross cash flow is as follows:
| | | | | | | | | |
| | | Year ended December 31,
| | | Change in %
| |
| | | 2003
| | | 2002
| | |
| | | (in € millions) | | | | |
Energy | | 2,983 | | | 3,193 | | | (6.6 | ) |
Environment | | 1,194 | | | 1,856 | | | (35.7 | ) |
Other | | (450 | ) | | (192 | ) | | na | |
| | |
|
| |
|
| |
|
|
Group total | | 3,727 | | | 4,857 | | | (23.3 | ) |
| | |
|
| |
|
| |
|
|
2003 operating cash flow was €4,495.6 million compared to €4,826.5 in 2002 and can be broken down into:
| | • | Gross cash flow of €3,727 million was negatively impacted by €650 million in restructuring costs (particularly EIS, SUEZ Environnement and the parent company), disposal costs and the termination of certain loss-making contracts in Environment. |
| | • | Operating working capital requirements of €856.8 million in 2003 compared to a negative €123.5 million in 2002. This decrease results primarily from changes in both Energy (€350 million, particularly because of decreases in inventories and a milder early winter that decreased accounts receivable at the end of 2003 at Distrigaz) and SUEZ Environnement (€440 million, largely due to efforts to accelerate payment of invoices from Water and Waste Services in Europe). Extension of the securitization program contributed €123 million to this change. |
Cash Flow from Investing Activities
Our cash flows from net divestments were €3,608 million in 2003, whereas 2002 posted a net investing cash flow of €3,201 million and 2001 €4,332 million.
Fiscal 2003 was impacted by :
| | • | Financial investments totaling €1.5 billion in 2003, dedicated to strengthen the Group’s Electricity position in Europe including an increased stake in Electrabel, now 50.12% held by the Group, for €0.6 billion, and extension of the Group presence in France (CNR), Italy and Poland. |
| | • | Major subsidiary and portfolio disposals totaling €7.8 billion. Proceeds from disposals amounted to €3.5 billion for Ondeo Nalco, €1.3 billion for 75% of Northumbrian, €0.4 billion for Cespa, €0.8 billion for 51.6 million Fortis shares and €0.7 billion for Total shares, in addition to proceeds from disposals of various other listed securities for €0.7 billion. |
| | • | Purchases of tangible and intangible investments amounted to €2,804 million in 2003 down from €4,158 million in 2002. The net cost of purchases of tangible and intangible investments less disposals of |
93
| | tangible and intangible assets related to Energy for 55% (primarily in Belgium, Spain and Italy for Electricity & Gas Europe, and the United States and Turkey for Electricity & Gas International), while 33% of these expenditures related to Water and Waste Services in Europe and the United States. |
Cash Flow from Financing Activities
Financing activities accounted for negative cash flows of €6,190 million in 2003, positive cash flows of €1,720 million in 2002, and negative cash flows of €889 million in 2001. Dividends paid in 2003 and associated tax credits generated a total cash outflow of €1,593 million in 2003, compared to €1,646 million in 2002 and €1,569 million in 2001. Loan repayments and new loans secured generated a net cash outflow of €4,489 million in 2003, compared to cash inflows of €3,383 million in 2002 and €549 million in 2001. Net purchases of treasury stock were nil in 2003, compared with net disposals of €145.2 million in 2002, and net purchases of €53.1 million in 2001.
Our main debt issuances in 2003 were:
| | • | In May 2003, SUEZ launched a €1,190.0 million bond issue redeemable for Fortis shares, maturing in 2006, and paying interest of 4.5%, and repaid dividends on Fortis securities. This bond issue covers 70 million Fortis shares, guaranteeing SUEZ a unit selling price of between €17 and €20 with a term of 3 years. |
| | • | In June 2003, GIE SUEZ Alliance launched a €3,000 million bond issue which breaks down into three tranches: |
— 7-year tranche for €1,250 million at 4.25%, maturing on June 24, 2010,
— a 12-year tranche for €750 million at 5.125%, maturing on June 24, 2015,
— a 20-year tranche for €1,000 million at 5.75%, maturing on June 24, 2023.
| Our | main debt repayments in 2003 were: |
| | • | In June 2003, SUEZ repaid a €500 million variable rate bond issued in June 2001. |
| | • | In November 2003, SUEZ repaid the €231 million bond exchangeable for Vinci shares issued on May 22, 2001. |
| | • | In October 2003, GIE SUEZ Alliance repaid an €800 million variable rate bond issued on April 26, 2002. |
Net debt as of December 31, 2003 and 2002
Our outstanding borrowing and long-term debt decreased by 22.7% to €26,694 million in 2003 compared to an increase by 2.3% to €34,545 million in 2002 and included mainly bonds amounting to €15,018 million in 2003 (€14,801 million in 2002), and bank loans amounting to €7,343 million in 2003 (€12,707 million in 2002). It increased by 2.3% to €34,545 million in 2002 from €33,761 million in 2001. Short-term debt represented 36.2% of our total debt in 2003 and 38.8% in 2002.
Net debt amounted to €14,991 million at the end of 2003, compared to €26,006 million at the end of 2002. In 2003, changes in consolidation scope and methods led to a decrease in net debt of €2,007 million and exchange rate fluctuations generated a reduction of €1,322 million, primarily due to US dollar fluctuations.
The debt-reduction plan implemented during 2003 decreased the debt/equity ratio to 128% as of December 31, 2003 (from 165% as of December 31, 2002), despite the impact of further negative exchange rate fluctuations on shareholders’ equity (mostly related to the US dollar’s depreciation) and the year’s losses.
Taking into account financial instruments, net debt was denominated 43% in euros, 38% in US dollars, and 6% in pounds sterling, compared to 49%, 34% and 13% respectively at the end of 2002. The change is due to the
94
Northumbrian sale for the pound sterling and the reduction in the euro denominated net debt subsequent to the disposal program for the euro/dollar breakdown.
Taking into account financial instruments, 60% of gross debt is subject to fixed rates, and the average annual cost was 4.8%. On June 5, 2003, the Group signed a confirmed multi-currency credit facility agreement for €2.5 billion, maturing in April 2008. As of December 31, 2003, the Group had available authorized credit facilities and treasury note back-up lines totaling €8.7 billion (compared to €6.9 billion as of December 31, 2002).
Because of a significant cash balance as of December 31, 2003 and a Group policy of setting rates in periods when they are historically low, net debt is temporarily fixed in its entirety. The average maturity is now 7 years (compared to 4.5 years at the end of 2002).
Liquidity and Contractual Commitments
The following table represents an estimate of our contractual obligations as of December 31, 2003 impacting future cash outflows of the Group. This estimate encompasses Group gross borrowings and, among the off-balance sheet commitments described in Note 20, operating leases, irrevocable commitments under which the Group has undertaken to purchase tangible assets, and other long-term commitments.
| | | | | | | | | | |
| | | Payments in
|
| | | < 1 year
| | 1 to 3 years
| | 3 to 5 years
| | > 5 years
| | Total
|
| | | (in € millions) |
Gross debt(1) | | 9,569 | | 3,558 | | 2,699 | | 9,615 | | 25,441 |
Capital leases | | 88 | | 173 | | 187 | | 805 | | 1,253 |
Operating leases | | 206 | | 335 | | 217 | | 579 | | 1,337 |
Irrevocable purchase commitments | | 1,040 | | 1,318 | | 544 | | 588 | | 3,490 |
Other long-term commitments | | 271 | | 366 | | 172 | | 646 | | 1,455 |
| | |
| |
| |
| |
| |
|
| (1) | The Group also considers net debt in assessing its liquidity. Net debt of the Group was €14,991 million and represented debt net of marketable securities and cash and cash equivalents. |
The off-balance sheet items described in Note 20 to our Consolidated Financial Statements could significantly impact the operating results, liquidity and capital resources of the Group based on changes in the specific facts and circumstances of the specific arrangements.
The table above does not include obligations related our pension and other employee benefit plans. At December 31,2003 the Group projected benefit obligation related to these plans exceeded assets of the plan by ��2,225 million. We also have additional customary procurement contracts. For other off balance sheet commitments see Note 20.3 to our Consolidated Financial Statements.
Included in the table above at December 31, 2003, are commitments for capital expenditures of approximately €3,073 million. These commitments related mainly to the construction of various power generation facilities and purchase of equipment including turbines, natural gas power stations, cogeneration installations and incinerators (€1,832 million) and capital expenditures under certain concession contracts (€1,241 million). We review on a regular basis our liquidity needs for the next 12 months. We anticipate that any liquidity needs will be covered by our operating cash-flows, sales of marketable securities and new credit facilities. We expect to enter into new credit facilities and divest some marketable securities in order to meet our future liquidity requirements, including the planned redemption of any outstanding notes.
At the end of 2003, we had available authorized credit facilities and treasury note back-up lines totaling €8,708 million (€6,855 million as of December 31, 2002).
95
The Group is called on primarily to finance technical installations or production capacity, but also to finance or refinance its development, to organize numerous bank facilities, the availability and withdrawals of which are sometimes contingent on compliance with financial ratios. These ratios are generally adapted to the repayment schedule of such facilities and, as such, can cover a wide range of account headings. The most common ratios generally concern the coverage of financial costs by gross operating income (segment profit) or EBIT of the borrowing entity or coverage of borrowings (or its servicing) by shareholders’ equity, cash flow or gross operating income (segment profit) of the borrowing entity. The level and definition of these ratios, also known as financial covenants, are set in conjunction with lenders in a prospective manner, and can be readjusted during the life of these facilities in order to maintain, at all times, current withdrawals and more generally their full availability.
As of December 31, 2003 no event of default has been declared on any Group financial indebtedness and Group companies comply with the covenants and representations included in their finance documents, except for some financings in Latin America for which Group representatives are currently in negotiation with the lenders (see Note 2.5 for the description of the Argentine situation), or some guarantees and project financings for which the existing technical defaults do not materially affect the ability of the obligor to perform their payment obligations.
SUEZ’s financial policy does not subordinate the availability of bank lines to the credit ratings awarded by rating agencies, other than in the highly specific case of securitization programs (see notes 1-J and 11.2 Trade accounts and notes receivable). Similarly, the terms and conditions of bonds issued by SUEZ on the capital markets are not linked to financial ratios.
SUEZ’s and certain subsidiaries’ senior secured or unsecured debt securities are currently rated by Standard and Poor’s Investor Services or Moody’s Rating Services. On January 24, 2002 S&P, and on February 1, 2002, Moody’s respectively assigned A- and A2 ratings to GIE SUEZ Alliance, our financing subsidiary. On June 1, 2004, the S&P has confirmed the Group’s A- rating and upgraded the outlook perspective to stable.
Currency Fluctuations
Although we derive the majority of our revenues and incur most of our expenses in countries that are members of the Euro zone, the net impact of currency fluctuations in 2003 on sales was a decrease of €1,123 million, mainly due to the decline in the average exchange rate of the US dollar, the Brazilian real and the Pound sterling against the Euro.
Our foreign exchange risk related to long-term assets and cash flows denominated in non-euro currencies is hedged, if possible, through the provision of financing in the same currency. As a result, we maintain a portion of our financing in U.S. dollars reflecting our business in this currency. At December 31, 2003, our consolidated U.S. dollar denominated debt amounted to 22% of our total consolidated gross debt. We can adjust the amount of U.S. dollar denominated debt as needed using our available long-term multi-currency revolving credit lines.
With respect to the foreign exchange risk in markets outside North America and Europe, we reduce our risks when possible through contractual price adjustments negotiated in concession contracts, U.S. dollar denominated contracts, and increasing the local portion of our costs. We may also use derivative instruments such as foreign currency swaps, forward contracts or collars. We may also hedge our exposure related to firm commitments either by entering into specific insurance policies, such as contracts withCompagnie Française d’Assurance pour le Commerce Extérieur, an insurance company that caters to the needs of French companies investing in or doing business outside of France or by using forward contracts. In addition, we hedge estimated cash flows related to forecasted investments and divestments using firm or option contracts. We do not enter into forward foreign currency exchange contracts for trading purposes.
Our main protection against currency fluctuations is also the inclusion, when possible, in our international contracts of clauses that link the prices to the U.S. dollar rate in order to minimize our exposure to local currency
96
fluctuations as our related debt obligations are generally denominated in U.S. dollars. As a consequence, we may be affected by fluctuations in the U.S. dollar/euro exchange rate or by adverse changes in foreign currency exchange rates, such as the devaluation of the Argentine peso in 2002 when the contractual clauses above mentioned are not enforceable or when financial instruments were not implemented.
The Argentine subsidiaries of the group recorded an exceptional charge of €500 million at December 31, 2002 (Group share) due to the impact of the Argentine peso devaluation primarily on the debt denominated in US dollars on the basis of an Argentine peso to USD exchange rate of 3.37 to 1. Our exposure to the carrying devaluation will depend on the outcome of negotiations with lenders in order to seek a remedy to the default situation under the loans. See “Item 3. Risk Factors” and Note 2.5 to our consolidated Financial Statements.
Inflation
We operate in, and receive payments in the currencies of certain countries with historically high levels of inflation, such as Latin America and Asian countries. This risk is generally covered by contractual clauses that enable us to revise our prices, on negotiated dates, to take inflation into account. Inflation has not had a material effect on our results of operations during the periods presented.
With the devaluation of the Argentine peso, inflation has increased in Argentina. Although this country has not been classified as a hyper inflationary economy, this may affect our operations in this country, depending on the results of the renegotiation of our concession agreements. The impact on our future results remains uncertain.
U.S. GAAP
We prepare our Consolidated Financial Statements in accordance with French GAAP, which differs in certain important respects from U.S. GAAP as discussed in Note 26 to our Consolidated Financial Statements. The individual differences discussed in Note 26 describe the main adjustments to the French GAAP Consolidated Financial Statements. In 2003, the Group increased its interest in Electrabel, a publicly traded company in Belgium, to 50.12%. Accordingly, Electrabel has been consolidated since January 1, 2003 for U.S. GAAP purposes. Although the Group consolidated their investment in Electrabel during the year ended 2003, their investment in prior years was accounting for as an equity method investment. The Group owned 45.3% of the capital stock of Electrabel as of December 31, 2002, a publicly traded company in Belgium, and exercised a majority of the votes at the last three annual shareholders’ meetings, which demonstrates effective control and allows for consolidation under French GAAP, those circumstances were not sufficient to consolidate under U.S. GAAP. The effects of accounting for Electrabel under the equity method prior to 2003 as well as the effects of other U.S. GAAP adjustments were included in the condensed U.S. GAAP data presented in Note 27 to our Consolidated Financial Statements. Equity method investee disclosures for Electrabel including condensed financial data for the period prior to 2003 are provided in Note 28.
The following paragraphs describe the impact on income from continuing operations of accounting for Electrabel under the equity method prior to 2003, reclassifications between French and U.S. GAAP, and adjustments between French and U.S. GAAP. For a more detailed description of the impact on net income and shareholders’ equity, see Notes 26 and 27 to our Consolidated Financial Statements.
2003
Our U.S. GAAP operating income totaled €765 million (€2,440 million lower than under French GAAP) for the year ended December 31, 2003.
Proportionately Consolidated Joint Venture. Operating income from proportionately consolidated joint ventures has been reclassified as income from equity method investments under U.S. GAAP, which has decreased U.S. GAAP operating income by €459 million in 2003.
97
Reclassification between French GAAP and U.S. GAAP.
Under French GAAP, as disclosed in Note 1-G to our Consolidated Financial Statements, Electrabel’s share in the pre-tax income of the mixed inter-municipal companies is presented in operating income. Under U.S. GAAP, this income amounting to €437 million has been reclassified as share in income of companies accounted for under the equity method.
Additionally, all transactions classified as exceptional income under French GAAP have been classified as operating income under U.S. GAAP, except the following transactions which have been classified as non-operating income or discontinued operations under U.S. GAAP:
| | • | Losses from disposals and provisions related to decrease in value of financial assets such as marketable securities and equity method investments amounting to €746 million in 2003. |
| | • | Exceptional foreign currency exchange losses related primarily to debt held in emerging countries of €45 million in 2003. |
| | • | The French GAAP losses of €760 million associated with activities classified as discontinued operations have been presented under U.S GAAP on the separate line item “Net income/(loss) from discontinued operations”. |
Adjustments between French and U.S. GAAP
| | • | A decrease of €288 million in 2003 due to additional goodwill impairment charges recorded under U.S. GAAP. |
| | • | A decrease of €147 million due to differences is accounting related to derivative contracts. |
2002
Our U.S. GAAP operating income for continuing operations totaled €(76) million (€3,784 million lower than under French GAAP) for the year ended December 31, 2002.
Electrabel. If Electrabel were accounted for under the equity method in our French GAAP financial statements, we would have reported revenues of €33,458 million (€12,632 million less than under French GAAP) for the year ended December 31, 2002. Our operating income with Electrabel as an equity method investee would have been €2,534 million (€1,174 million less than under French GAAP) for the year ended December 31, 2002.
Proportionately Consolidated Joint Venture. Operating income from proportionately consolidated joint ventures has been reclassified as income from equity method investments under U.S. GAAP, which has decreased U.S. GAAP operating income by €426 million in 2002.
Reclassification between French GAAP and U.S. GAAP. All transactions classified as exceptional income under French GAAP have been classified as operating income under U.S. GAAP, except the following transactions which have been classified as non-operating income or discontinued operations under U.S. GAAP:
| | • | Gains and losses from disposals and provisions related to decrease in value of financial assets such as marketable securities and equity method investments amounting to (€793) million in 2002. |
| | • | Exceptional foreign currency exchange losses related primarily to debt held in emerging countries of €442 million in 2002. |
| | • | The French GAAP net gain of €312 million associated with activities classified as discontinued operations in 2002 have been presented under U.S GAAP on the separate line “Net income/(loss) from discontinued operations”. |
98
Adjustments between French and U.S. GAAP
| | • | A decrease of €599 million in 2002 due to additional goodwill impairment charges recorded under U.S. GAAP. |
| | • | A decrease of €188 million due to the elimination under U.S. GAAP of the gains associated with the sale and lease-back arrangements of buildings. |
Adoption of SFAS 142, Goodwill and Other Intangible Assets. Beginning in 2002 goodwill and assets with indefinite lives are no longer amortized under U.S. GAAP. Rather they are tested annually for impairment. Upon adoption, we ceased amortizing pre-existing goodwill with a net book value of €12,345 million at December 31, 2001, reclassified €127 million of intangible assets to goodwill, identified reporting units as defined by SFAS 142, allocated all assets (including goodwill) and liabilities to those reporting units, established procedures for impairment testing of the goodwill balances and performed transitional impairment testing on the goodwill as of January 1, 2002. Goodwill was, and will be for future acquisitions, allocated to the reporting units whose assets and liabilities were acquired in the business combination that resulted in the goodwill and to reporting units that will benefit from the acquisition.
If the carrying value exceeds the fair value of a reporting unit, thus indicating a possible impairment, we perform the second step of the impairment test, which requires us to allocate the fair value to the assets and liabilities of the reporting unit using a methodology consistent with the application of the purchase method. Any excess of fair value over the fair value of net assets is compared to the allocated goodwill. If the allocated goodwill exceeds the residual fair value, an impairment charge equal to the difference is recognized.
We will perform our annual impairment test during the last quarter of the year which allows the group to utilize the most current information possible in its analysis. The transitional impairment test did not result in any impairment; however, during the second half of the year we recorded impairment charges of €242 million and €488 million in the SELS and other sectors (communication subsidiaries) in addition to goodwill impairments already recorded under French GAAP due to differences in carrying values.
2001
Our U.S. GAAP operating income totaled €1,008 million (€2,633 million lower than under French GAAP) for the year ended December 31, 2001.
Electrabel. If Electrabel were accounted for under the equity method in our French GAAP financial statements, we would have reported revenues of €31,921 million (€10,438 million less than under French GAAP) for the year ended December 31, 2001. Our operating income with Electrabel as an equity method investee would have been €2,925 million (€1,139 million less than under French GAAP) for the year ended December 31, 2001.
Proportionately Consolidated Joint Ventures. Operating income from proportionately consolidated joint ventures has been reclassified as income from equity method investments under U.S. GAAP, which has decreased U.S. GAAP operating income by €458 million in 2001.
Consolidation of FirstMark Communication France under U.S. GAAP decreased operating income of €57.3 million in 2001.
Reclassification between French GAAP and U.S. GAAP. All transactions classified as exceptional income under French GAAP have been classified as operating income under U.S. GAAP, except the following transactions which have been classified as non-operating income under U.S. GAAP:
| | • | Gains and losses from disposals of marketable securities (available for sale) amounting to €762 million in 2001 have been recorded as other income under U.S. GAAP. |
99
| | • | Gains and losses from sales of a partial interest in investments accounted for using the equity method amounting to €504 million have been recorded as other income under U.S. GAAP. |
| | • | Exceptional foreign currency exchange losses related primarily to debt held in emerging countries of €336 million in 2001. |
In addition, the following reclassifications have been made:
| | • | Amortization of goodwill that are not components of operating income under French GAAP have been reclassified as operating income under U.S. GAAP for €423 million in 2001. |
Adjustments between French and U.S. GAAP.
| | • | A decrease of €232 million in 2001 primarily due to the elimination of the gain on the dilution of our interest in SUEZ Lyonnaise Telecom. |
| | • | Additional amortization expense of goodwill has been recorded under U.S. GAAP for an amount of €109 million in 2001. |
| | • | A decrease of €381 million related to the elimination of certain releases of provisions primarily related to emerging countries risk recorded under U.S. GAAP. |
Recent U.S. Accounting Pronouncements
EITF No. 01-08.EITF Issue No. 01-08, “Determining Whether an Arrangement Contains a Lease.” In May 2003, the EITF reached consensus in EITF Issue No. 01-08 to clarify the requirements of identifying whether an arrangement should be accounted for as a lease at its inception. The guidance in the consensus is designed to mandate reporting revenue as rental or leasing income that otherwise would be reported as part of product sales or service revenue. EITF Issue No. 01-08 requires both parties to an arrangement to determine whether a service contract or similar arrangement is, or includes, a lease within the scope of SFAS No. 13, “Accounting for Leases.” Upon application of EITF Issue No. 01-08, the accounting requirements under the consensus could affect the timing of revenue and expense recognition, and revenues reported as transportation and storage services may be required to be reported as rental or lease income. Should capital-lease treatment be necessary, purchasers of transportation and storage services in the arrangements would be required to recognize assets on their balance sheets. The consensus is being applied prospectively to arrangements agreed to, modified, or acquired in business combinations on or after January 1, 2004. Previous arrangements that would be leases or would contain a lease according to the consensus will continue to be accounted for as transportation and storage purchases or sales arrangements. The Group in the process of determining the impact of the adoption of EITF Issue No. 01-08 effects on its consolidated results of operations, cash flows or financial position.
FIN 46. The Financial Accounting Standards Board (FASB) issued Interpretation No. 46 (“FIN 46”), “Consolidation of Variable Interest Entities,” in January 2003 and revised the Interpretation in December 2003 (“FIN 46R”). FIN 46 requires an investor with a majority of the variable interests (primary beneficiary) in a variable interest entity (VIE) to consolidate the entity and also requires majority and significant variable interest investors to provide certain disclosures. A VIE is an entity in which the voting equity investors do not have a controlling financial interest or the equity investment at risk is insufficient to finance the entity’s activities without receiving additional subordinated financial support from the other parties. FIN 46 was effective immediately for variable interest entities created after January 31, 2003. We will apply FIN 46 to entities created prior to February 1,2003 in 2004. With respect to entities created after January 31, 2003, the adoption of FIN 46 did not have a significant impact on our Consolidated Financial Statements. We are in the process of evaluating the impact of the application of this Interpretation on our Consolidated Financial Statements for entities created prior to February 1, 2003.
100
EITF No. 00-21. In November 2002, the EITF reached a consensus on issue No. 00-21 “Accounting for Revenue Arrangements with Multiple Deliverables” (“EITF 00-21”) on a model to be used to determine when a revenue arrangement involving the delivery or performance of multiple products, services and/or rights to use assets should be divided into separate units of accounting. Additionally, EITF 00-21 addresses if separation is appropriate, how the arrangements consideration should be allocated to the identified accounting units. EITF 00-21 will be applicable beginning in 2004. We will adopt EITF 00-21 as of January 1, 2004 and are currently assessing its impact on our Consolidated Financial Statements.
Recent IFRS Guidance
European Regulation requires that the Group adopt International Financial Reporting Standards (IFRS) as its primary GAAP by 2005. Currently, all of the IFRS accounting standards have not been finalized, nor is it clear whether all such standards will have been released and endorsed by the European Commission by the 2005 deadline. The eventual transition from French GAAP to IFRS will be made in compliance with IFRS 1, First-Time-Adoption of IFRS which provides guidance on retroactive application and outlines certain exemptions and exceptions. Based on proposed SEC regulations regarding the applicable periods to be presented under a comprehensive set of GAAP, we currently anticipate adopting January 1, 2004 as our transition date to IFRS, and thus to present restated 2004, and 2005 IFRS financial statements in our 2005 Form 20-F. However, based on current SEC regulations, we would be required to adopt January 1, 2003 as our transition date. In the meantime, we will continue to use French GAAP for our primary financial statements. We are currently assessing the impact, which could be significant, that the application of IFRS will have on our financial statements. Once all IFRS have been issued and endorsed by the European Commission and the transition date to IFRS is definitive, we will disclose as soon as practicable the impact of such application. Upon adoption of IFRS, we will disclose in our primary financial statements a reconciliation between French GAAP and IFRS (including narrative and net income and shareholders’ equity reconciliation for the applicable periods presented), as well as additional reconciliation disclosures between IFRS and U.S. GAAP.
C. Research and Development, Patents and Licenses
Research and Development
In 2003, we spent approximately €79 million in Energy and Environment. In 2002 and 2001, we spent, respectively, €126 million (which includes €27 million for Ondeo Nalco, a company sold in 2003) and €130 million (which includes €30 million for Ondeo Nalco), on research and development. These investments were primarily made in technical or expertise centers.
See also “Item 4.B Innovation Policy”.
Patents and Licenses
In 2002, the Group filed 58 patents (39 of which were filed by Ondeo Nalco). When Ondeo Nalco was sold in 2003, it retained all of its intellectual property rights. In 2003, the Group (excluding Ondeo Nalco) filed 13 patents.
D. Trend Information
See “Item 8.B. Significant Changes”.
E. Off-Balance Sheet Arrangements
In addition to the contingent liabilities and commitments described in Item 5.B. – Liquidity and Contractual Commitments above, we had other transactions which, pursuant to current legislation, are not reflected in our
101
Consolidated Financial Statements. Operating subsidiaries of the Group have entered into various long-term contracts and “take-or-pay” contracts for the purchase or sale of specified quantities of commodities for firm purchases (essentially gas) and electricity or gas for firm sales and related services. Principal future commitments under the EGE, EGI and Elyo contracts are presented below. They are valued at the closing spot rate or the price provided in the contract if this is not exclusively based on market conditions and according to their maturity are discounted based on the issued bond rates of leading companies. The Group is also committed to purchasing and selling future services in the completion of long-term contracts.
In the normal course of activities, certain Group subsidiaries have also entered into contracts for the purchase of technical installations with a total value of €1,832 million as of December 31, 2003. These commitments primarily concern the construction of energy production units and the acquisition of equipment comprising turbines, gas power stations and cogeneration plants and incinerators.
| | | | | | |
| | | Firm commodity, combustibles
and electricity purchases
| | Firm electricity, gas,
steam and oil sales
| | Firm PP&E purchases
|
| | | (in € millions) |
2004 | | 4,095.9 | | 7,210.9 | | 486.4 |
2005 | | 3,023.2 | | 4,013.4 | | 412.2 |
2006 | | 2,335.6 | | 2,942.3 | | 72.0 |
2007 | | 1,913.5 | | 1,921.7 | | 474.3 |
2008 | | 1,701.9 | | 1,574.3 | | 2.1 |
Thereafter | | 12,614.1 | | 9,761.8 | | 385.0 |
| | |
| |
| |
|
TOTAL | | 25,684.2 | | 27,424.4 | | 1,832.0 |
Finally, the Group also made investments in certain concession contracts and, as such, incurred capital expenditures totaling €1,240.5 million as of December 31, 2003.
Operating leases which may not be terminated
The Group is committed to operating leases, which may not be terminated, relating to premises, facilities, ships (LNG tankers) and vehicles which expire on various dates during the next few years. The Group considers that, in the normal course of business, contracts expiring will be renewed or replaced. Lease charges are presented in Note 3 to our Consolidated Financial Statements.
The present value of minimum future payments in respect of these leases are as follows:
| | |
| | | Operating leases which may not be terminated
|
| | | (in € millions) |
2004 | | 206.2 |
2005 | | 189.8 |
2006 | | 145.4 |
2007 | | 114.6 |
2008 | | 102.2 |
Thereafter | | 579.0 |
| | |
|
TOTAL | | 1,337.2 |
102
Other commitments
| | | | | | | | | | |
| | | Maturing
within Dec. 31
| | 1 year
| | 1 to 5 years
| | More than 5
years
| | 31 Dec. 2002
|
| | | (in € millions) |
Commitments given: | | | | | | | | | | |
Commitments given on contracts | | 2,637.2 | | 1,055.7 | | 509.0 | | 1,072.5 | | 2,373.8 |
Performance bonds and similar | | 1,838.9 | | 788.5 | | 397.6 | | 652.8 | | 1,685.3 |
Other guarantees given on contracts | | 798.3 | | 267.2 | | 111.4 | | 419.7 | | 688.5 |
Financing commitments: | | 5,655.4 | | 2,421.8 | | 1,067.0 | | 2,166.6 | | 4,067.0 |
Personal collateral given | | 1,042.7 | | 536.8 | | 289.0 | | 216.9 | | 1,194.3 |
Assets pledged and other collateral given | | 4,398.8 | | 1,839.1 | | 737.6 | | 1,822.1 | | 2,750.9 |
Other financing commitments given | | 213.9 | | 45.9 | | 40.4 | | 127.6 | | 121.8 |
Other commitments given: | | 4,635.1 | | 1,848.0 | | 1,244.2 | | 1,542.9 | | 4,297.8 |
Commitments given on energy trading activities | | 877.8 | | 823.6 | | 4.1 | | 50.1 | | 759.4 |
Other commitments given | | 3,757.3 | | 1,024.4 | | 1,240.1 | | 1,492.8 | | 3,538.5 |
Total | | 12,927.7 | | 5,325.5 | | 2,820.2 | | 4,782.0 | | 10,738.6 |
| | |
| |
| |
| |
| |
|
Commitments received: | | | | | | | | | | |
Guarantees received on contracts | | 595.2 | | 265.4 | | 232.8 | | 97.0 | | 353.2 |
Financing commitments received: | | 10,806.1 | | 4,392.1 | | 6,033.8 | | 380.2 | | 9,118.3 |
Credit facilities authorized and available and commercial paper back-up lines | | 8,708.3 | | 2,445.6 | | 5,923.5 | | 339.2 | | 6,854.6 |
Securtization | | 99.0 | | — | | 99.0 | | — | | 445.7 |
Other financing commitments received | | 1,998.8 | | 1,946.5 | | 11.3 | | 41.0 | | 1,818.0 |
Other commitments received: | | 1,356.6 | | 88.1 | | 54.3 | | 1,214.2 | | 756.6 |
Commitments received on energy trading activities | | 1,149.3 | | — | | — | | 1,149.3 | | 421.9 |
Other commitments received | | 207.3 | | 88.1 | | 54.3 | | 64.9 | | 334.7 |
| | |
| |
| |
| |
| |
|
Total | | 12,757.9 | | 4,745.6 | | 6,320.9 | | 1,691.4 | | 10,228.1 |
| | |
| |
| |
| |
| |
|
Commitments given on contracts primarily comprise performance bonds guaranteeing customers the completion of contract services, guarantees of which certain may have been issued by SUEZ. In terms of the performance bonds, 58% relate to the Environment business and 41% to the Energy business. The percentage of the contract covered by the guarantee depends on the location of the contract (10 to 15% of the contract value for normal performance bonds and up to 70% for certain performance bonds).
Other contract guarantees include advance repayment deposits, retention deposits, bid deposits and to a lesser extent guarantees covering advance payments made to sub-contractors.
Financing commitments given comprise personal security granted primarily to creditors of Group equity investees in the amount of €1,043 million, collateral of €4,399 million and other financing commitments given mainly to proportionally consolidated companies of €214 million. In the case of collateral, the assets allocated to guarantee the liabilities are primarily tangible assets (power stations and other installations and equipment) and to a lesser extent consolidated investments (€530 million) which represent approximately 20% of collateral. The Group has received financing commitments in the amount of €10,806.1 million, corresponding primarily to available approved credit facilities and commercial paper back-up lines.
The Group has also given and received commitments (letters of credit, parent company guarantees) in the context of its activities with energy trading counterparties in the amount of €877.8 million and €1,149.3 million respectively.
Other commitments given include principally the following transactions:
- As part of its European activity expansion, Electrabel is progressively increasing its presence in France via investments in Shem and CNR. The share purchase commitments in respect of these investments totaled approximately €1.1 billion, to be spread over 2004 and 2006.
103
- Furthermore, Electrabel entered into a contract to purchase the entire electricity production of Société Hydroélectrique du Midi (SHEM) and pay an annual fixed amount, net of tax, of between €78 million and €80 million.
- In addition, Energie du Rhône (joint subsidiary of Electrabel, 44%, and CNR, 51%) signed electricity purchase/sale contracts with Compagnie Nationale du Rhône.
- The Group granted the purchaser of a 30% interest in Elia System Operator an option for the resale of this interest, eligible for exercise until February 29, 2004. This option, with a strike price equal to the initial consideration paid for the investment, also covers a receivable transferred to the purchaser at the same time. The total amount of this commitment as of December 31, 2003 totaled €202.7 million. As indicated in Note 2.4 to our Consolidated Financial Statements, this option matured after the year-end without being exercised by the purchaser.
In other respects, SUEZ companies are committed by vendor warranties resulting from the sale of activities, and subject to reserves where their exercise is considered probable. Potential liabilities in respect of vendor warranties totaled €1,735 million as of December 31, 2003, compared to €663 million at the 2002 year-end. The increase is due to divestments made in 2003 (Northumbrian, Ondeo Nalco).
Finally, SUEZ remains (through one of its American subsidiary) holder of the operating lease contract relating to the headquarter occupied by Ondeo Nalco in Naperville and sub-rented to the latter. SUEZ has received a counter-guarantee from Ondeo Nalco, who remains responsible of all the commitments relating to the operating lease towards SUEZ as well as the lessor. In case of default of Ondeo Nalco, the Group would notably be liable for lease payments to be incurred over the operating lease contract life (for €200.8 million).
Trade receivable securitization program
In January 2002, the Group launched a 5-year European trade receivable securitization program, covering maximum of €470.0 million in receivables (total securitized receivables net of deposit accounts). Trade receivables of the different entities concerned (SITA Group, Elyo Group, Fabricom Group) are sold to a special-purpose securitized debt fund which secures refinancing on the commercial paper market. The debtors of the trade receivables concerned are primarily local authorities and companies.
SUEZ guarantees the securitized debt fund against initial losses on receivables and their concentration on a single counterparty. SUEZ deposits amounts with the securitized debt fund in respect of this guarantee, the level of which is determined by the level of receivables outstanding and their performance. Payments overdue more than 180 days are refinanced by the transferor via a draw-down by the securitized debt fund on the deposit account.
As of December 31, 2003, securitized debt outstanding totaled €476.8 million and the securitized debt fund deposit totaled €99.5 million. As of December 31, 2003, this deposit was covered by an immaterial reserve.
The program provides for certain cases of early resolution; in particular, the transfer of new receivables to the securitized debt fund would no longer be possible if the credit rating of GIE SUEZ Alliance by Moody’s Investor Services fell below Baa1.
The summary balance sheet of the European securitized debt fund as of December 31, 2003 is as follows (in € millions):
| | | | | | |
Assets
| | | | Liabilities
| | |
Securitized debt | | 476.8 | | Ordinary shares | | 377.8 |
Miscellaneous receivables | | 0.5 | | Liabilities | | 99.5 |
| | |
| | | |
|
TOTAL | | 477.3 | | TOTAL | | 477.3 |
The sale of Ondeo Nalco in 2003 marked the end of the Group’s U.S. securitization program.
104
F. Tabular Disclosure of Contractual Obligations
See “Item 5.B. – Liquidity and Contractual Commitments”.
ITEM 6. DIRECTORS, SENIOR MANAGEMENT AND EMPLOYEES
A. Directors and Senior Management
The following sets forth the names of the current members of the Board of Directors as elected at the Annual Shareholders’ Meeting of April 27, 2004, their position, age, dates of appointment and the expiration of their current term.
| | | | | | | | | | |
| | | Age
| | First appointment
| | Most recent
appointment
| | Expiration of
current term
| | Address
|
| Gérard Mestrallet Chairman and Chief Executive Officer | | 55 | | June 15, 1994 | | 2001 | | 2005 | | SUEZ, 16 rue de la Ville l’Evêque, 75008 Paris |
Jean Gandois Vice-Chairman | | 74 | | June 25, 1986 | | 2001 | | 2005 | | SUEZ, 16 rue de la Ville l’Evêque, 75008 Paris |
Albert Frère Vice-Chairman | | 78 | | June 19, 1997 | | 2004 | | 2008 | | Groupe Bruxelles Lambert, avenue Marnix 24, B-1000 Brussels |
| Edmond Alphandéry* Director | | 60 | | April 27, 2004 | | 2004 | | 2008 | | CNP Assurances, 4 place Raoul Dautry, 75015 Paris |
Antonio Brufau* Director | | 56 | | April 25, 2003 | | 2003 | | 2007 | | Caixa, Avenida Diagonal 621/629 E–08028 Barcelona |
René Carron Director | | 62 | | April 27, 2004 | | 2004 | | 2008 | | Crédit Agricole SA, 91-93 boulevard Pasteur, 75015 Paris |
Gerhard Cromme* Director | | 61 | | June 14, 1995 | | 2004 | | 2008 | | ThyssenKrupp AG, August-Thyssen Strasse 1, D-40211 Düsseldorf |
Etienne Davignon Director | | 71 | | August 3, 1989 | | 2004 | | 2008 | | SUEZ-TRACTEBEL, 1 place du Trône, B-1000 Brussels |
Paul Desmarais Jr Director | | 49 | | April 14, 1998 | | 2001 | | 2005 | | Power Corporation of Canada, 751 Square,Victoria, Montreal Quebec H2Y 2J3 |
Lucien Douroux* Director | | 70 | | September 7, 1993 | | 2001 | | 2005 | | Banque de Gestion Privée Indosuez 20 rue de la Baume, 75008 Paris |
Jacques Lagarde* Director | | 66 | | June 14, 1995 | | 2003 | | 2007 | | 1314 Arch Street, Berkeley CA 94708, USA |
Anne Lauvergeon* Director | | 44 | | May 5, 2000 | | 2003 | | 2007 | | Areva, 27/29 rue Le Peletier, 75009 Paris |
Jean Peyrelevade* Director | | 64 | | June 22, 1983 | | 2004 | | 2008 | | Crédit Lyonnais, 19 Boulevard des Italiens, 75002 Paris |
Thierry de Rudder Director | | 54 | | April 27, 2004 | | 2004 | | 2008 | | Groupe Bruxelles Lambert, Avenue Marnix 24, B-1000 Brussels |
Jean-Jacques Salane Director | | 52 | | April 26, 2002 | | 2002 | | 2006 | | Lyonnaise des Eaux Pays Basque 15, avenue Charles Floquet BP 87 64202 Biarritz Cedex |
Lord Simon of Highbury* Director | | 64 | | May 4, 2001 | | 2001 | | 2005 | | 53 Davies Street London W1K 5JH, UK |
Secretary of the Board of Directors: Patrick Billioud
| * | Non-Executive Directors, as defined in the Bouton Report of 2003 on Corporate Governance: “A director is considered “non-executive” when he/she has no relations of any kind with the Group or its management, which could impede the free exercise of his/her judgment”. Based on the criteria of the Bouton report, the Board of Directors designated its non-executive directors as of March 3, 2004. |
105
BIOGRAPHICAL INFORMATION CONCERNING DIRECTORS
Gérard Mestrallet,French national.
A graduate of the French engineering school, Polytechnique, and the National School of Administration (ENA), Gérard Mestrallet joined Compagnie de Suez in 1984 as Vice-President, Special Projects. In 1986 he was appointed Executive Vice-President Industry and then in February 1991, Executive Director and Chairman of the Management Committee of Société Générale de Belgique. In 1995, he became Chairman and Chief Executive Officer of Compagnie de Suez and then, in June 1997, Chairman of the SUEZ Lyonnaise des Eaux Executive Board. On May 4, 2001, Gérard Mestrallet was appointed Chairman and Chief Executive Officer of SUEZ. He is also Chairman of the Association Paris Europlace and a member of the Board of the Institut Français des Administrateurs.
Certain other directorships and positions: Chairman of SUEZ-TRACTEBEL (Belgium) and Hisusa (Spain), Chairman of the Board of Directors of SUEZ Environnement, Vice-Chairman of Aguas de Barcelona, Director of Crédit Agricole SA, Saint-Gobain (France), Pargesa Holding SA (Switzerland) and Electrabel (Belgium), Member of the Supervisory Board of Axa and Taittinger (France).
Mr. Gérard Mestrallet holds 28,135 SUEZ shares. He attends, as Chairman of the Board of Directors, meetings of the Compensation and Nomination Committee (except for matters concerning him personally).
Jean Gandois,French national.
A graduate of the French engineering schools, Polytechnique and Ponts et Chaussées, Jean Gandois has occupied the positions of Chief Executive Officer of Société des Aciéries de Lorraine and Wendel-Sidelor and Chairman of Sollac, Rhône-Poulenc, Péchiney, Cockerill Sambre and Conseil National du Patronat Français (CNPF), now MEDEF. Vice-Chairman of the SUEZ Lyonnaise des Eaux Supervisory Board since June 19, 1997, he was appointed Chairman on June 1, 2000. On May 4, 2001, Jean Gandois was appointed Vice-Chairman of the SUEZ Board of Directors.
Certain other directorships and positions: Director of Danone, Eurazeo, Institut Curie, Vigeo (France), SUEZ-TRACTEBEL (Belgium), Air Liquide Italie, Member of the International Advisory Board of Textron (USA).
Mr. Jean Gandois holds 5,005 SUEZ shares. He is Chairman of the Compensation and Nomination Committee.
Albert Frère,Belgian national.
After holding a number of positions in his family company and acquiring in-depth knowledge of the iron and steel industry in the Charleroi basin, Albert Frère founded the company Pargesa Holding in 1981 in Geneva, in association with several other businessmen. In 1982, this company acquired an interest in Groupe Bruxelles Lambert.
Certain other directorships and positions:Honorary manager of Banque Nationale de Belgique, Chairman of the Board of Directors and Executive Director of Groupe Bruxelles Lambert (Belgium), Chairman of the Board of Directors of Frère-Bourgeois, ERBE and Financière de la Sambre (Belgium), Vice-Chairman, Executive Director and member of the Management Committee of Pargesa Holding SA (Switzerland), Chairman of the Supervisory Board of Metropole Television M6 (France), Honorary Chairman of the Chamber of Commerce and Industry of Charleroi (Belgium), Director of LVMH and Château Cheval Blanc (France), Member of the
106
International Advisory Board of Power Corporation of Canada and Member of the International Committee of Assicurazioni Generali S.p.A. (Italy).
Mr. Albert Frère holds 2,000 SUEZ shares.
Edmond Alphandéry,French national.
Mr. Alphandéry is a graduate of the Paris Institute of Political Studies and has a PHD in economics. He has held a chair in economics at the Université de Paris II since 1974. He was mayor of Longué-Jumelles and departmental councilor of Maine and Loire. He was Minister of the Economy from March 1993 to May 1995. He chaired the Supervisory Board of CNP Assurances from 1988 to 1993 and was Chairman of Electricité de France from 1995 to 1998. Since July 1998, he has once again served as Chairman of the CNP Supervisory Board. He has also been Chairman of the Centre National des Professions Financières since June 2003.
Certain other directorships and positions: Chairman of the Supervisory Board of CNP Assurances (France), Chairman of CNP International, Chairman of the Centre National des Professions Financières (France), Director of Crédit Agricole Indosuez and Affiches Parisiennes (France).
Mr. Edmond Alphandéry holds 2,000 shares. He is a member of the Ethics, Environment and Sustainable Development Committee.
Antonio Brufau,Spanish national.
Mr. Brufau holds an economics degree from the University of Barcelona, and is a chartered accountant and graduate of the IESE. After having exercised various functions at Arthur Andersen, he became a member of the Arthur Andersen Worldwide Advisory Council in 1986. As of 1988, he was Senior Executive Vice President of Caja de Ahorros y Pensiones de Barcelona “la Caixa”. In January 1999, he was appointed President & Chief Executive Officer of the “la Caixa” Group.
Certain other directorships and positions: Chairman & Chief Executive Officer of the “la Caixa” Group (Spain), Chairman of Gas Natural SGD S.A., Chairman of Hodefi (France), Chairman of Fundació Barcelona Digital (Spain), Director of Repsol-YPF, Enagas, CaixaHolding (Spain), CaixaBank France, CaixaBank Andorra.
Mr. Antonio Brufau holds 2,000 SUEZ shares. He is a member of the Audit Committee.
René Carron,French national.
Mr. René Carron operates a farm in Yenne. He is a Knight of the Legion of Honor and the National Order of Merit and a Commander of the Order of Agricultural Merit. He carried out a variety of elected mandates in Savoie. In 1981, he joined the Crédit Agricole group. Since 1994, he has been Chairman of Caisse Régionale de Savoie, formed as a result of the merger that year of Caisse Régionale de la Savoie and Caisse de Haute Savoie. In 1995, he joined the Fédération Nationale du Crédit Agricole, where he was Chairman from July 2000 to April 2003, and subsequently appointed Vice-Chairman. In December 2002, he was appointed Chairman of the Board of Directors of Crédit Agricole SA.
Certain other directorships and positions: Chairman of the Board of Directors of Crédit Agricole SA, Chairman of Caisse Régionale de Crédit Agricole des Savoie, Caisse Locale de Crédit Agricole de Yenne and GECAM (GIE) (France), Vice-Chairman of Fédération Nationale du Crédit Agricole (France), Director of Crédit Agricole Solidarité et Développement, Fondation du Crédit Agricole Pays de France, Rue Impériale, Sacam, Sapacam (France), and Banca Intesa (Italy), Member of the Management Committee of ADICAM (France).
Mr. René Carron holds 3,500 SUEZ shares.
107
Gerhard Cromme,German national.
Mr. Gerhard Cromme has a doctorate in Law and several diplomas in economics (Münster, Lausanne, Paris and Harvard Universities). He joined the Saint-Gobain Group in Germany in 1971 before joining the Krupp Group in 1986. Mr. Cromme is a Commander of the Legion of Honor.
Certain other directorships and positions:Chairman of the Supervisory Board of ThyssenKrupp AG (Germany), Member of the Supervisory Board of Allianz AG, Axel Springer Verlag AG, E.ON AG, Ruhrgas AG, Siemens AG and Volkswagen AG (Germany), Director of Deutsche Lufthansa AG (Germany) and BNP Paribas (France).
Mr. Gerhard Cromme holds 2,000 SUEZ shares. He is a member of the Compensation and Nomination Committee.
Etienne Davignon,Belgian national.
Mr. Etienne Davignon successively occupied the functions in Belgium of Principal Private Secretary to the Foreign Minister (1964-1969), Chairman of the International Energy Agency Management Committee (1974-1977), Vice-Chairman of the European Community Commission (1981-1985) and Chairman of the Royal Institute of International Relations. In 1985, he joined Société Générale de Belgique, where he was Chairman from April 1988 to February 2001 and Vice-Chairman until the merger of Société Générale de Belgique and Tractebel on October 31, 2003 at which time he became Vice-Chairman of SUEZ-TRACTEBEL.
Certain other directorships and positions:Chairman of Compagnie Maritime Belge, Compagnie des Wagons-Lits, Sibeka, SN Airholding and Palais des Beaux-Arts (Belgium), Vice-Chairman of Umicore, Fortis, Recticel (Belgium) and Accor (France), Director of Sofina SA, SN Brussels Airlines, BIAC (Belgium) and Gilead (USA).
Mr. Etienne Davignon holds 10,000 SUEZ shares. He is Chairman of the Ethics, Environment and Sustainable Development Committee and a member of the Compensation and Nomination Committee.
Paul Desmarais Jr,Canadian national.
Mr. Paul Desmarais Jr studied at McGill University in Montreal and then at INSEAD in Fontainebleau. He has a Masters in Business Administration. In 1984 he was named Vice-Chairman of Power Financial Corporation, a company that he helped set up. He became Chairman of that company in 1990. Mr. Desmarais was named Chairman of the Board and Co-Chief Executive Officer of Power Corporation of Canada in 1996.
Certain other directorships and positions: Chairman of the Board of Directors and Co-Chief Executive Officer of Power Corporation of Canada, Chairman of the Board of Directors of Power Financial Corporation (Canada), Vice-Chairman of the Supervisory Board and member of the Strategy Committee of Imérys (France), Director and member of the Management Committee of Great-West Life Insurance Company, Great-West Lifeco Inc. (Canada), Great-West Life and Annuity Insurance Company (USA), London Life Insurance Company, London Insurance Group Inc., Investors Group Inc. (Canada), Groupe Bruxelles Lambert (Belgium), Pargesa Holding SA (Switzerland) and Power Corporation of Canada, Director of Power Financial Corporation, Gesca Ltée, La Presse Ltée, Les Journaux Trans-Canada Inc.(Canada) and Total (France), Member of the International Committee, Board of Directors and the Verification Committee of INSEAD, Chairman of the International Advisory Board of HEC Business School (Canada), Chairman of the Advisory Committee of Sagard Private Equity Partners Europe (France).
Mr. Paul Desmarais Jr holds 2,000 SUEZ shares. He is a member of the Compensation and Nomination Committee.
108
Lucien Douroux,French national.
Mr. Lucien Douroux studied at the National School of Engineering and Technology (Conservatoire National des Arts et Métiers). He is an Officer of the Legion of Honor and Commander of the National Office of Agricultural Merit. He has previously held positions as Director General of the Caisse Nationale de Crédit Agricole (1993-1999) and as Chairman of the Supervisory Board of Crédit Agricole Indosuez (1999-2001). He is Chairman of the Banque de Gestion Privée Indosuez since 1991.
Certain other directorships and positions:Chairman of Banque de Gestion Privée Indosuez, Chairman of the Supervisory Board of Fonds de Garantie des Dépôts, Vice-Chairman of Wafabank (Morocco), Director of Bouygues and Euris.
Mr. Lucien Douroux holds 3,220 SUEZ shares. He is a member of the Audit Committee.
Jacques Lagarde,French-U.S. dual national.
Mr. Jacques Lagarde is a graduate of the French business school, HEC, and of the Harvard University Advanced Management Program. He has been Director of the Lyon Business School, Chief Executive Officer of Gillette France, President of Oral-B Laboratories (USA), Chairman of the Management Board of Braun AG (Germany) and Executive Vice-President of The Gillette Company (USA).
Certain other directorships and positions: Director of Eukarion Inc. (USA).
Mr. Jacques Lagarde holds 5,500 SUEZ shares. He is Chairman of the Audit Committee.
Anne Lauvergeon, French national.
A graduate of the French engineering school Mines and Ecole Normale Supérieure, Mrs. Lauvergeon is a qualified science teacher. After starting her career in the iron and steel industry, Anne Lauvergeon joined CEA in 1984 and then took over responsibility for the administration of the Greater Paris area sub-stratum (1985-1988). In 1990, she joined the office of the French President and the following year was appointed Deputy General Secretary. Appointed Partner-Manager of Lazard Frères et Cie in 1995, she joined the Alcatel Group two years later before being appointed Chair of Cogema in June 1999. On July 3, 2001 she was appointed Chair of the Areva Group Executive Board.
Certain other directorships and positions:Chair of the Areva Group Executive Board, Chair of the Board of Directors of Cogema, Vice-Chair of the Supervisory Board of Sagem SA, Director of Total.
Mrs. Anne Lauvergeon holds 3,050 SUEZ shares. She is a member of the Ethics, Environment and Sustainable Development Committee and the Compensation and Nomination Committee.
Jean Peyrelevade, French national.
A graduate of the French engineering school, Polytechnique, and the Paris Institut of Political Studies (IEP), Mr. Jean Peyrelevade successively occupied the positions of Chairman of Compagnie de Suez, Banque Stern, UAP and then Crédit Lyonnais. He resigned as Chairman of Crédit Lyonnais in October 2003.
Certain other directorships and positions: Director of Bouygues (France) and Société Monégasque de l’Electricité et du Gaz (Monaco), Member of the Supervisory Board of L’Express (France).
Mr. Jean Peyrelevade holds 3,115 SUEZ shares.
109
Thierry de Rudder, Belgian-French dual national.
Thierry de Rudder has a degree in mathematics from the University of Geneva and the Free University of Brussels, and an MBA from the Wharton School of Business in Philadelphia. He began his career in the United States, joining Citibank in 1975 and carrying out various functions in New York and Europe. He joined Group Bruxelles Lambert in 1986 and is now Executive Director.
Certain other directorships and positions: Executive Director of Groupe Bruxelles Lambert (Belgium), Director of Imerys (France), Total (France), Compagnie Nationale à Portefeuille (France) and SUEZ-TRACTEBEL (Belgium).
Mr. Thierry de Rudder holds 2,000 SUEZ shares.
Jean-Jacques Salane, French national.
After having trained as an accountant, Mr. Jean-Jacques Salane joined Lyonnaise des Eaux in March 1972. From 1990-1996, he was a member of the Board of Directors of Lyonnaise des Eaux, where he represented the Workers’ Council.
Certain other directorships and positions:CGT union representative, Union representative on the Lyonnaise des Eaux France Pays Basque Workers’ Council since 1996, Union representative on the Lyonnaise des Eaux Central Workers’ Council since 1996, Union representatives on the SUEZ Workers’ Council since 1996, President of the Spring Funds French Supervisory Board.
Mr. Jean-Jacques Salane holds 2,000 SUEZ shares.
Lord Simon of Highbury, British national.
Lord Simon of Highbury has an MA from Cambridge and an MBA from INSEAD, Fontainebleau. He joined British Petroleum in 1961 where he occupied a number of management positions before being appointed Chairman in 1995. After exercising several ministerial positions from 1997, he became advisor to the British Prime Minister for the modernization of government. He was also appointed advisor to President Prodi for the reform of the European Union. Lord Simon of Highbury entered the House of Lords in 1997.
Certain other directorships and positions:Member of Advisory Board of L.E.K. Consulting, Member of European Advisory Board of Morgan Stanley Dean Witter (Europe), Advisory Director of Unilever plc, Director of Britain in Europe, Member of the Supervisory Board of Volkswagen Group (Germany), Member of the International Advisory Council of Fitch and Fortis (Belgium), Chairman of the Board of Trustees of the Cambridge Foundation, Trustee of the Hertie Foundation, Member of the Advisory Council of The Prince’s Trust.
Lord Simon of Highbury holds 2,000 SUEZ shares. He is a member of the Compensation and Nomination Committee.
110
B. Compensation
The following table presents the total compensation received by members of the Board of Directors, excluding the Chairman and Chief Executive Officer and Executive Directors and the total compensation received by the members of the Executive Committee, including the Chairman and Chief Executive Officer and Executive Directors. For 2003, it shows the situation of the Executive Committee in terms of the total number of members, given the changes in the composition of this body during 2003, and the total compensation, including any termination payments, received by members. Then, it shows the Committee’s extrapolated compensation as of December 31, 2003.
| | | | | | | | |
| | | 2003
| | 2002
|
| | | Number of
members
| | Total
compensation
| | Number of
members
| | Total
compensation
|
| | | (in € millions, except number of members) |
Board of Directors | | 14 | | 1.9 | | 16 | | 1.9 |
Executive Committee | | 18 | | 16.3 | | 13 | | 9.1 |
Executive Committee (not including the seven members who left in 2003) (*) | | 11 | | 9.9 | | | | |
| (*) | Individuals who left this committee in 2003: Christine Morin-Postel, Philippe de Margerie, Thierry Chambolle, François Jaclot, Philippe Brongniart, Gérard Payen and Christian Maurin (entered and left in 2003). Individuals who joined: Gérard Lamarche, Dirk Beeuwsaert, Willy Bosmans and Emmanuel van Innis. |
Executive compensation
As of December 31, 2003, executive management comprised the 11 members of the Executive Committee.
These individuals receive both fixed and variable compensation. Changes in the fixed salary portion are linked to changes in specific situations: significant increase or change in responsibilities, adjustments necessary for reasons of internal equity or clear discrepancy with regard to the external market. The variable salary portion seeks to compensate management’s contribution to the results of the Company and the Group. The variable salary portion paid in 2003 in respect of fiscal year 2002, was linked in whole or in part to changes in gross operating income of the global businesses and Group net earnings per share.
For fiscal year 2003, the variable salary portion paid in 2004 for Gérard Mestrallet, Jean-Pierre Hansen and Gérard Lamarche was mainly based on criteria related to the success of the action plan (debt reduction, cash flows prior to asset disposals, cost cutting) and partly on the gross operating income and net earnings per share of the global businesses. In agreement with the parties concerned, the figures were substantially reduced (50% in the case of Gérard Mestrallet) to take into account the significant amount of the exceptional negative results for the financial year.
For Executive Committee members who are responsible for a Group operating activity, the variable portion is 60% based on quantitative criteria (gross operating income by division, Group net earnings per share) and 40% based on qualitative criteria.
For Executive Committee members who are not responsible for an operating activity, the variable portion is determined in the same manner, except for the quantitative criteria, which are exclusively Group-level criteria (gross operating income, net earnings per share).
111
The following table presents total compensation effectively paid to Executive Committee members during the fiscal year; variable compensation is paid by way of an installment system, with the balance settled the following year. For 2003, the situation presented is stabilized as of December 31, 2003, as the comparison with actual elements related to Committee changes during the year was deemed not pertinent.
| | | | | | | |
Gross compensation including fringe benefits
| | 2003
| | 2002
| | 2003/2002
| |
| | | (in € millions, except percentages) | |
Fixed | | 6.3 | | 5.8 | | +8.6 | % |
Variable | | 3.6 | | 3.3 | | +9.1 | % |
Total | | 9.9 | | 9.1 | | +8.8 | % |
Number of Executive Committee members | | 11 | | 13 | | | |
The variable compensation portion represented 36% of total compensation in 2003, compared to an identical percentage in 2002 and compared to 45% in 2001.
Total average compensation paid to members of the Executive Committee increased from €0.70 million in 2002 to €0.90 million in 2003. This increase is due to the fact that the Executive Committee now includes all division Chief Operating Officers, and that Belgium is the market reference for some of them.
Executive officer compensation
The compensation amounts presented below do not include directors’ fees.
Gérard Mestrallet, Chairman and Chief Executive Officer, received total compensation of €1,773,565 in 2003, of which €1,028,029 was fixed compensation, including a vehicle fringe benefit. The variable portion of €745,536 represents 42% of total compensation (compared to 55% in 2002), a decrease of 40% compared to 2002. Pursuant to the recommendation of the Compensation and Nomination Committee, as approved by the Board of Directors, the variable portion for 2003 amounts to €795,000.
Jean Gandois, Vice Chairman of the Board of Directors and Group Company Special Projects Vice-President, received total compensation of €1,150,484.86.
François Jaclot, who resigned from the Board in February 2003, received total compensation of €100,605, and Philippe Brongniart, who resigned from the Board in April 2003, received total compensation of €201,209.
Directors’ fees
See “— Board Practices”.
Employee profit-sharing and incentive plans
Each year, SUEZ employees benefit from profit-sharing plans. In accordance with French law, the amounts paid do not give rise to an additional contribution by the employer. Amounts paid during the last six years were as follows:
| | | | |
1998 | | € | 3,602,432 | |
1999 | | € | 4,258,249 | |
2000 | | € | 5,083,977 | |
2001 | | € | 552,420 | * |
2002 | | € | 112,051 | |
2003 | | € | 0 | ** |
112
An incentive agreement was signed on June 30, 1997. In accordance with French law, the amounts paid do not give rise to an additional contribution by the employer. Amounts paid during the last six years were as follows:
| | | | |
1998 | | € | 726,427 | |
1999 | | € | 658,173 | |
2000 | | € | 4,516,119 | |
2001 | | € | 642,670 | * |
2002 | | € | 598,455 | |
2003 | | € | 0 | ** |
| * | The marked decrease in figures starting in 2001 is due to the creation of a separate Water subsidiary and the resulting decrease in the number of parent company employees. |
| ** | Pursuant to the application of derogatory formulae or applicable French ordinary general rules of law clauses, profit sharing and incentives equal zero because of the 2003 loss. |
C. Board Practices
Article 15 of our bylaws defines the powers of the Board of Directors:
“The Board of Directors determines the strategic direction of the Company’s activities and ensures its implementation. It considers all issues concerning the proper functioning of the Company and settles all matters relating thereto, within the scope of the corporate purpose and subject to those powers expressly granted by law to shareholder meetings.
The Board of Directors performs all controls and verifications it considers appropriate. Each Director receives all information necessary to the performance of his duties and may request any documents he or she considers necessary.”
Reaffirming its commitment to rules of corporate governance, the Board of Directors adopted internal regulations in May 2001, which were amended on July 9, 2003, and a Director’s Charter in January 2002. These documents provide the Board with the channels and means necessary to operate efficiently, while serving the interests of the Group and its shareholders, and set with full transparency the rights and obligations of Directors. These documents are available at our registered office and on our web site: www.suez.com.
In addition, our Ethics Charter and related documents, notably the “Confidentiality and Privileged Information” guide, are applicable to our Directors. As stipulated in these documents, Directors, in particular, are prohibited from trading in our securities or the securities of any of our listed subsidiaries during financial statement preparation and approval periods, defined as commencing the month preceding the date of the Board of Directors meeting held to approve the annual and half-year financial statements and terminating two days after this meeting. This limitation is complemented for Directors by Article 8 of the Directors’ Charter, which requires Directors to seek and obtain the advice of our General Counsel (Secrétaire Général) before transacting or having a transaction carried out by a third party in the securities of Group companies.
Article 5 of the Director’s Charter provides for regular evaluations of the Board of Directors’ performance by a non-executive Director. The Board of Directors asked Jacques Lagarde to evaluate the performance of the Board of Directors and its sub-committees for the year ended December 31, 2002. Jacques Lagarde reported to the Board of Directors on his evaluation on January 8, 2003.
Jacques Lagarde was asked to perform a new evaluation for the year ended December 31, 2003. It began on December 9, 2003, based on a questionnaire completed by each Director. The second evaluation included the
113
main issues of the previous year and the implementation of recommendations made during the previous year. Jacques Lagarde submitted his evaluation to the Board of Directors on March 3, 2004. The recommendations for improving the functioning of the Board of Directors will be implemented.
Pursuant to Article 11 of our bylaws, all Directors must hold at least 2,000 SUEZ shares throughout their term of office.
The Board of Directors meets as often as our interests require and at least four times a year. It met eight times during fiscal year 2003 and the overall attendance rate was 88%.
Directors receive directors’ fees based on attendance, which were set during the General Meeting of April 26, 2002 at an aggregate of €800,000 per annum for fiscal year 2002 and all subsequent fiscal years until a new decision is taken. Pursuant to the recommendation of the Compensation and Nomination Committee, the Board of Directors meeting of the same day set the following levels of compensation:
Director
| | | | |
• Fixed portion | | € 35,000 | | per year |
| | |
• Variable attendance-related portion | | € 2,000 | | per meeting |
Sub-Committee Chairman
| | | | |
• Fixed portion | | € 15,000 | | per year |
| | | | |
| |
• Variable attendance-related portion | | None, since the Board considers that a sub-committee meeting cannot be held in the absence of its Chairman |
Sub-Committee Members
| | | | |
• Fixed portion | | € 7,000 | | per year |
| | |
• Variable attendance-related portion | | € 1,000 | | per meeting |
Gérard Mestrallet, the Chairman and Jean-Jacques Salane, Group employee, do not receive any directors’ fees.
On this basis, the following directors’ fees were paid for the fiscal year 2003:
| | | | | | |
Jean Gandois | | : | | € 68,500 | | |
Albert Frère | | : | | € 50,500 (*) | | |
Antonio Brufau | | : | | € 34,000 (*) | | Appointed by the General Meeting of April 25, 2003. |
Gerhard Cromme | | : | | € 67,000 (*) | | |
Etienne Davignon | | : | | € 68,000 (*) | | |
Paul Desmarais Jr | | : | | € 54,000 (*) | | |
Lucien Douroux | | : | | € 62,500 | | |
Jacques Lagarde | | : | | € 68,500 (*) | | |
Anne Lauvergeon | | : | | € 57,500 | | |
Jean Peyrelevade | | : | | € 68,500 | | |
Felix G. Rohatyn | | : | | € 53,834 (*) | | |
Lord Simon of Highbury | | : | | € 50,667 (*) | | |
José Vilarasau | | : | | € 17,667 (*) | | Director until the General Meeting of April 25, 2003. |
| (*) | before deduction of 25% withholding tax due in respect of directors’ fees paid to directors not resident in France. |
114
Total directors’ fees distributed in fiscal year 2003 amounted to €721,168, compared to €709,667 in fiscal year 2002.
Directors service contracts
Under certain circumstances, our internal regulations (accord d’entreprise interne) allow generally that we grant our executive officers (cadres dirigeants supérieurs), including executive officers who are members of the Board of Directors, a departure bonus (prime de départ) in an amount up to 18 months of salary.
Corporate Governance
We have securities publicly listed and traded on markets in France (Euronext Paris) and in the United States (NYSE). As a result of our activity in two different stock exchanges, our corporate governance structure includes the mandatory provisions of French corporate governance law and the securities laws and regulations of both France and the U.S., as well as the rules that are promulgated by both public markets.
Our Board of Directors comprises 16 members. Contrary to the laws applicable to U.S. companies, at the present time, the term “independent director” does not have a legal definition in French law. However, the Bouton Report of 2003 on Corporate Governance defines a non-executive directors as a director who “has no relations of any kind with the Group or its management, which could impede the free exercise of his/her judgment.” Based on the criteria of the Bouton report, the Board of Directors designated 8 of its 16 members as non-executive directors as of March 3, 2004.
We have several specialized committees to support the decision-making process of the Board of Directors, including a Compensation and Nomination Committee consisting of six members and an Audit Committee consisting of three members, all of whom are non-executive directors as defined in the Bouton Report. Under French law, Board committees are advisory only, while under the NYSE rules, specific committees are vested with certain powers that in France remain with the Board. Under French corporate law, shareholders must appoint the Group’s auditors at annual shareholder meetings. Our shareholders receive the proposals for such appointments from the Board of Directors, who in turn receive recommendations from the Audit Committee. We believe that the requirements of French law, including the requirement that two statutory auditors must be appointed by the shareholders, achieve the NYSE’s objectives for auditor independence.
In order to emphasize the Group’s commitment to promoting transparency and compliance with rules and regulations, and in line with the NYSE Listed Company Manual, we have adopted a written Code of Ethics applicable to our Chief Executive Officer, Chief Financial Officer, Executive Vice-Presidents and other Group financial officers.
Sub-Committees of the Board of Directors
In 2003, we had Strategy, Audit, Ethics, Environment and Sustainable Development, and Compensation and Nomination Committees.
The Strategy Committee was chaired by Gérard Mestrallet. Members were Jean Gandois (Vice-Chairman), Lucien Douroux, Albert Frère, Jacques Lagarde, Anne Lauvergeon and Jean Peyrelevade. Its role was to analyze and discuss our strategic objectives as submitted for the Board of Directors’ approval. In its meeting on July 9, 2003, the Board of Directors decided to eliminate the Strategy Committee, as a result of the Board’s decision to broaden the strategic focus to include all Directors.
The Audit Committee had four members, Jean Peyrelevade (Chairman), Gerhard Cromme, Lucien Douroux and Antonio Brufau, the new Director appointed by the General Meeting of April 25, 2003, as a replacement for Felix G. Rohatyn.
115
Article 4 of the Board of Directors’ new Internal Regulations defines the rules and operating procedures of this Committee. It has two key roles. The first is to examine in detail the annual and half-year financial statements in order to inform the Board of Directors on their content and their presentation to the public. The second role is to gain an understanding of internal and external control procedures in order to ensure that such procedures provide appropriate coverage of all risk areas. In addition, the Audit Committee can examine specific problems on an ad hoc basis. The Committee met four times during 2003 and the overall attendance rate was 93%.
After the Board of Directors meeting of April 27, 2004, the audit committee consisted of Jacques Lagarde (Chairman), Lucien Douroux and Antonio Brufau.
The Ethics, Environment and Sustainable Development Committee had three members in 2003: Jacques Lagarde (Chairman), Etienne Davignon and Anne Lauvergeon.
Article 5 of the Board of Directors’ new Internal Regulations defines the rules and operating procedures of this Committee. It ensures compliance with individual and collective values on which the Group bases its actions and the rules of conduct that must be adhered to by each employee. It also examines the channels and resources available to achieve the Group’s objectives with respect to the environment and sustainable development. The Committee met twice during 2003 and the overall attendance rate was 86%.
After the Board of Directors meeting of April 27, 2004, the committee consisted of Etienne Davignon (Chairman), Edmond Alphandéry and Anne Lauvergeon.
The Compensation and Nomination Committee had six members, Jean Gandois (Chairman), Gerhard Cromme, Etienne Davignon, Paul Desmarais Jr., Felix G. Rohatyn, and Lord Simon of Highbury (since April 25, 2003). Gérard Mestrallet, as Chairman of the Board of Directors, attends Committee meetings (except for matters concerning him personally). After the Board of Directors meeting of April 27, 2004, Felix G. Rohatyn was replaced by Anne Lauvergeon.
Article 6 of the Board of Directors’ new Internal Regulations defines the rules and operating procedures of this Committee. It makes recommendations to the Board of Directors regarding the nomination and compensation of Board members. It is consulted with for nominations to Group Executive Management positions and compensation proposals for executive officers of the Group’s leading companies. The Committee met three times during 2003 and the overall attendance rate was 86%.
Executive Committee
The Chairman has established an Executive Committee. The Executive Committee examines, at the request of the Chairman and Chief Executive Officer, strategic, development and organizational issues concerning the Group.
116
As of March 5, 2004, members of the Executive Committee are as follows:
| | |
| Gérard Mestrallet | | Chairman and Chief Executive Officer |
| |
| Jean-Pierre Hansen | | Executive Vice President of the Executive Committee, Chief Operating Officer |
| |
| Gérard Lamarche | | Executive Vice-President, Finance (CFO) |
| |
| Yves-Thibault de Silguy | | Executive Vice-President in charge of International Affairs and Institutional Relations |
| |
| Patrick Buffet | | Executive Vice-President in charge of Business Strategy and Development |
| |
Dirk Beeuwsaert | | Executive Vice-President in charge of Electricity and Gas International (EGI) |
| |
Willy Bosmans | | Executive Vice-President in charge of Electricity and Gas Europe (EGE) |
| |
Jean-Louis Chaussade | | Executive Vice-President in charge of SUEZ Environnement |
| |
Jérôme Tolot | | Executive Vice-President in charge of Energy and Industrial Services and Operational Assistance |
| |
Valérie Bernis | | Executive Vice-President in charge of Communications |
| |
Emmanuel van Innis | | Executive Vice-President, Human Resources |
In addition to these 11 members, the following have the right to attend Executive Committee meetings:
| | |
Patrick Ouart | | General Secretary |
| |
Henry Masson | | Group Senior Vice President for Risk, Organization and Central Services |
The following is a summary of the business experience of the members of our Executive Committee, who are not also members of our Board of Directors.
Jean-Pierre Hansenwas named Chief Executive Officer of Electrabel in 1992. Since 1999, he held the positions of Chief Executive Officer of Tractebel as well as of a Director and Member of the Executive Committee of Société Générale de Belgique; he served in those capacities until these two companies merged on 31 October 2003, whereupon he became CEO of the new entity SUEZ-TRACTEBEL. He was appointed Chief Operating Officer of SUEZ in January 2003. He is Vice-Chairman of the SUEZ Executive Committee.
Certain other directorships and positions: Chairman of the Board of Directors and of the Executive Committee of Electrabel SA and Distrigas SA, Chairman of the Board of Directors of Distrihold SA, Fabricom SA and Fluxhold SA, Regent of the National Bank of Belgium, Vice-Chairman of Federation of Enterprises in Belgium, Director of Acea SpA, AceaElectrabel SpA, Agbar SA, Arcelor SA, Fluxys SA, SUEZ Environnement SA, Tractebel España SA, Tractebel Inc. and Member of the Supervisory Board of the Banking, Finance and Insurance Commission.
Gérard Lamarcheserved as consultant and then senior accountant with Deloitte Haskins & Sells in the mid-eighties. He joined Société Générale de Belgique in 1988 as controller and in 1992 became a member of the
117
Corporate Strategy Group. In 1995, he joined Compagnie de Suez and in 1997, M. Lamarche served first as chief of staff for the Chairman and CEO and eventually assumed the duties of Senior Vice President and Controller of SUEZ Lyonnaise des Eaux. He accepted an assignment in the U.S. as Executive Vice President for Ondeo Nalco, then a Group subsidiary, returning to Group headquarters in 2003 to become CFO. He presently serves as Senior Executive Vice President of SUEZ.
Certain other directorships and positions: Director of SUEZ-TRACTEBEL, Electrabel and SUEZ Environnement
Yves-Thibault de Silguy, former European Commissioner, joined the Executive Board of SUEZ Lyonnaise des Eaux in May 2000. In May 2001 he was appointed Senior Executive Vice President of SUEZ. In February 2002 his responsibilities for International Affairs and Corporate Relations were extended to European Affairs and development of Group businesses in China. Since March 2003, he is Senior Executive Vice-President in charge of International Affairs and Institutional Relations. Since December 2003 he is Chairman of Aguas Argentinas.
Certain other directorships and positions: Chairman of the Board of Directors of Sino French Holdings, President of Société Polynésienne d’Eau et d’Assainissement, Calédonienne des Eaux and of Sadet, Director of Ondeo, Degrémont, SUEZ Environnement, Elyo, Vinci, SUEZ-TRACTEBEL, Electricité et Eau de Calédonie, Socif 4, Electricité de Tahiti, Marama Nui and Unelco Vanuatu, Member of the Supervisory Board of Métropole Télévision M6 and Sofisport.
Patrick Buffetjoined the Group in 1994 as a member of the management committee and director of industrial holdings and strategy of Société Générale de Belgique. Since February 1998, he is Senior Executive Vice President in charge of Business Strategy and Development.
Certain other directorships and positions: Director of SUEZ-TRACTEBEL and Electrabel, Louis Dreyfus Communications, Commissariat à l’Energie Atomique “CEA” and SUEZ Lyonnaise Telecom, Member of the Supervisory Board of Areva, CDC-IXIS and Astorg Partners.
Dirk Beeuwsaert has spent his career until 2000 within the Electrabel group, after joining Intercom in 1971. In May 2000, he became a member of the former General Management Committee of Tractebel in charge of Electricity and Gas International and Chief Executive Officer of Tractebel Electricity and Gas International. In January 2003, he was appointed Executive Vice President of SUEZ, in charge of the Electricity and Gas International business line.
Certain other directorships and positions: Chairman, President and CEO of Tractebel Inc., Vice-Chairman of Tractebel Bahamas LNG Ltd, Director of Glow IPP Company Ltd, Glow SPP Public Company Ltd, Glow Company Ltd, Glow Demin Water Company Ltd, Glow SPP 1 Company Ltd, Glow SPP 2 Company Ltd, Glow SPP 3 Company Ltd and Director and member of the Strategic Committee of Tractebel Energia SA.
Willy Bosmans started his career in 1972 with Ebes, which later became Electrabel. In March 1999, he became a member of the former General Management Committee of Tractebel, in charge of Electricity and Gas Europe and in that capacity was appointed Chief Executive Officer of Electrabel (in March 1999) and of Distrigas (in January 2001). In January 2003, he was appointed Executive Vice President of SUEZ, in charge of the Electricity and Gas Europe business line.
Certain other directorships and positions: Chairman of Electrabel Nordic AS, Director of AceaElectrabel SpA, Distrihold SA, Distri Re SA, Electrabel France SA, Electrabel Italia SpA, Elia Asset SA, Elia System Operator SA, Fluxys SA and Cedegel SA, Member of the Supervisory Board of Electrabel Deutschland AG, Electrabel Nederland Holding BV and Electrabel Nederland NV.
Jean-Louis Chaussade joined Degrémont in 1978. In 1989, he became Chief Executive Officer of Degrémont Spain, then in 1992 Special Adviser of Dumez Copisa (Spain). In 1997, he was appointed Group
118
Delegate for the Southern Cone of South America and became Chief Operating Officer of Lyonnaise des Eaux America Latina in May 2000. Chairman of Degrémont since March 2002, he was appointed Executive Vice-President of SUEZ in charge of SUEZ Environnement in March 2004.
Certain other directorships and positions: Director and chief Executive Officer of SUEZ Environnement, Chairman of the Management Board of Ondeo Degrémont North America, Director of Lyonnaise des Eaux France, Aguas de Barcelona, Lyonnaise Europe.
Jérôme Tolotjoined the SUEZ Lyonnaise des Eaux Group which later became SUEZ in 1982. In 2000, he was appointed Director and Senior Executive Vice President for the central functions of the Vinci group. In February 2002, he was named Chairman and Chief Executive Officer of Sita and became Executive Vice President of SUEZ. Since January 2003, he is Executive Vice President, Operational Assistance of SUEZ and has been appointed Chief Executive Officer of Fabricom in September 2003.
Certain other directorships and positions: Director of Degrémont, Elyo, Sita France, SUEZ Environnement and SUEZ University.
Valérie Bernis was Special Press Advisor in the French Ministry of Economics, Finance and Privatization from 1986 until 1988. In 1988 she took up the position of Senior Vice President Communications at Cerus. From 1993 until 1995 she was in charge of communications and press for the Prime Minister. In December 1995 she was appointed Senior Vice President of Communications of Compagnie de Suez. In June 1997 she became Senior Vice President Communication and Special Advisor to the President of the Executive Board of SUEZ Lyonnaise des Eaux. Since May 2001 she is Executive Vice President in charge of Communications of SUEZ, Member of the Executive Committee.
Certain other directorships and positions: Director of SUEZ-TRACTEBEL, Permanent Representative of SUEZ Nov Invest on the Board of Directors of SAIP (Libération).
Emmanuel van Innis had several key functions in his career, starting at Intercom in 1971 and then with Electrabel when the former merged to form Electrabel in 1990. He became a member of Tractebel’s General Management Committee in 1996, where he was General Manager Corporate Administration, Finance and Controlling. He became a Director of Tractebel in 1997 and of Société Générale de Belgique in 2001 and served in those capacities until those companies merged on 31 October 2003, whereupon he became Director of the new entity, SUEZ-TRACTEBEL. In March 2003, he was appointed Executive Vice President of SUEZ, in charge of Human Resources.
Certain other directorships and positions: Chairman of the Board of Directors of Aquinter SA, Cocetrel SA, Contassur SA, Insutrel SA and Telfin SA, Chairman and Chief Executive Officer of CEF SA,Vice-Chairman of the Board of Directors of Electrabel SA, Fabricom SA, Reva SA, SN Airholding II SA, and Tractebel Espana SA, Director of AceaElectrabel Produzione SpA, Distrigas SA, Distrihold SA, Inec SA, Lithobeton SA, Niesa SA, Nobema SA, Pensiobel ASBL, SN Brussels Airlines (DAT) SA, Seinsa SA, SUEZ University SA, Tractebel Inc., Neil and Federation of Entreprises in Belgium, Member of the Supervisory Board of Elyo SA and GTI SA, Member of the Remuneration Committee of Electrabel SA.
Central Management Committee
Its members are, with the exception of Dirk Beeuwsaert, Willy Bosmans and Jean-Louis Chaussade, Executive Committee members. Additional Members are Patrick Ouart, Henry Masson, Christelle Martin (Senior Vice President for Strategic Planning, Control and Accounting) and Michel Sirat (Senior Vice President for Financial Operations, Tax and Treasury). The committee is consulted on matters submitted to the Chairman and Chief Executive officer or Board of Directors for decision.
119
Reports of the Board of Directors Sub-committees
Strategy Committee
The Strategy Committee met on January 7, 2003 to review the Group’s 2003-2004 action plan. The Board subsequently decided to eliminate the Strategy Committee as a result of its decision to broaden the strategic focus to include all Directors.
Audit Committee
The Audit Committee met four times during 2003 and twice at the beginning of 2004. Jean Peyrelevade, the Chairman of the Audit Committee, and Director during that period, and the Auditors attended all meetings.
The Audit Committee concentrated particularly on the following issues:
| | 1. | Financial statement review |
In addition to the half-year and annual financial statements and due to the listing of SUEZ shares on the New York Stock Exchange since September 18, 2001, the Committee examined the reconciliation of the Group financial adjusted statements adjusted in accordance with U.S. GAAP and the financial statements presented in accordance with French GAAP.
| | 2. | Group off-balance sheet commitments |
The Committee examined the Group off-balance sheet commitments, totaling €95 billion as of December 31, 2002.
The significance of the amount is due to the specific nature of the Group businesses, and particularly the need to secure fuel supplies. Nearly three-quarters of the amount represents reciprocal commitments essentially concerning Energy.
The Committee noted improvements in the information published by SUEZ following the COB recommendations at the end of 2002 and the ongoing improvement of reporting procedures.
| | 3. | Analysis of risks related to off-balance sheet commitments for raw materials |
In addition to gross data, the Committee expressed its desire for a regular assessment, both qualitative and quantitative, of the risk related to raw material commitments, and particularly the price risk between firm purchases and firm sales.
The analysis of off-balance sheet commitments confirmed the major trends in Group businesses: a long-term position in the electricity businesses (with a tendency to focus on the shorter term because of deregulation) and a structurally short-term position for gas activities.
| | 4. | Pre-approval procedures for engagements performed by the Statutory Auditors |
In accordance with US regulations, the Committee set up a system to verify the independence of Statutory Auditors, in particular with regard to the pre-approval of authorized engagements.
According to their nature, some engagements are subject, within certain limits, to a general pre-approval, while others are subject to specific pre-approval.
| | 5. | Assessment of Group entities |
The Committee noted the assessments of the main Group entities.
120
These assessments determined the asset write-downs for the 2003 year-end closing and whether there existed any significant unrealized gains on some of the major portfolio segments of the Group (Electrabel, EGI Brazil, SITA France, and Lyonnaise des Eaux France).
| | 6. | Progress of the IAS project |
The Committee noted the progress of work which should enable the Group to present its financial statements in accordance with IAS as of January 1, 2005.
The Committee was informed of the principal measures contemplated by the Group in connection with the adoption of these new standards and those to be taken when all the standards are harmonized, which is not yet the case.
| | 7. | Internal Audit activity report |
The Audit Committee listened to a presentation by the head of Group Internal Audit on the Internal Audit reorganization, so as to reflect Group changes in 2003 and the set-up of a new functional link with Electrabel Audit.
The Committee was informed of past assignments and the program for 2004.
| | 8. | Internal control regulations |
The Audit Committee took note of the Codis (Control and Disclosure) Program, developed under the impetus of Financial Management, which is intended to reinforce accounting and financial internal control and improve reporting. The Program is part of the Group implementation of the French Financial Security Act and the US Sarbanes-Oxley Act.
Ethics, Environment and Sustainable Development Committee Report
The Ethics, Environment and Sustainable Development Committee met on January 8 and July 9, 2003. A report on these meetings was presented by the Chairman to the Board of Directors.
In general, the Committee monitored the development of ethical measures within the Group in order to ensure their correct implementation and their contribution to maintaining the high standards and reputation of the Group, its subsidiaries and affiliated companies.
As is the case each year, a report was submitted to the Committee on the results of the compliance letter procedure, which requires the Chairmen of the Group’s principal subsidiaries to confirm their entity’s compliance with the Group’s Ethical Charter during the last year.
In 2003, the Committee spent a substantial part of its meetings reviewing our sustainable development positions and the measures the Group has undertaken. It also focused on the impact of Group activities on environmental issues and health and occupational safety.
The Committee Chairman, Jacques Lagarde, presided over a two-day “SUEZ Annual Managerial Conference on Ethics” on June 12 and 13, 2003. Held in Paris, this conference brought together many managers and executives of Group companies to ensure that the structures and procedures defined in our Ethical Charter and other policies were implemented within the Group and widely distributed, particularly with respect to stricter legal and regulatory measures in France and the United States. Following the conference, a code of professional conduct for financial managers was adopted to comply with our conduct obligations pursuant to the Sarbanes-Oxley Act.
121
Report of the Compensation and Nomination Committee
The Compensation and Nomination Committee met three times during 2003.
The Committee was presented with the proposal to renew the terms of office of Anne Lauvergeon and Jacques Lagarde and to appoint Antonio Brufau to the Board of Directors. With regard to the composition of the Board sub-committees, the Committee reviewed the proposal made to the Board of Directors with respect to the appointment of Antonio Brufau to the Audit Committee. In addition, a recommendation was presented to and adopted by the Board of Directors to increase the number of members of the Compensation and Nomination Committee from 4 to 6 with the proposed appointment of Felix G. Rohatyn and Lord Simon of Highbury.
The Committee also proposed to the Board the 2003 fixed/variable compensation terms for executive officers, the Chief Operating Officer and the Executive Vice-President, Finance. It was informed by the Chairman and Chief Executive Officer of the proposed compensation terms for other members of the Executive Committee.
Finally, it proposed the terms of the 2003 stock option plan to the Board and determined the options to be allotted to Gérard Mestrallet, the Chief Operating Officer, and Gérard Lamarche, the Executive Vice-President, Finance.
D. Employees
The total number of employees of the Group was 172,300 at December 31, 2003, compared to 198,750 at December 31, 2002.
The breakdown of the number of employees of the Group at December 31, 2003, 2002 and 2001 is as follows:
| | | | | | |
| | | Employees at December 31,
|
By Sector
| | 2003
| | 2002
| | 2001
|
Energy | | 89,000 | | 88,800 | | 84,400 |
Environment | | 83,150 | | 108,950 | | 102,500 |
Others | | 150 | | 1,000 | | 1,150 |
| | |
| |
| |
|
Total | | 172,300 | | 198,750 | | 188,050 |
| | |
| |
| |
|
| | | | | | |
| | | Employees at December 31,
|
By Geographical Area
| | 2003
| | 2002
| | 2001
|
France | | 60,850 | | 60,550 | | 59,300 |
Belgium | | 27,800 | | 29,900 | | 31,600 |
Other European Union countries | | 35,850 | | 52,550 | | 52,000 |
Other European countries | | 6,900 | | 6,800 | | 3,550 |
North America | | 11,800 | | 17,850 | | 9,400 |
South America | | 20,250 | | 20,500 | | 21,000 |
Asia and Oceania | | 4,750 | | 6,000 | | 6,750 |
Africa and Middle East | | 4,100 | | 4,600 | | 4,450 |
| | |
| |
| |
|
Total | | 172,300 | | 198,750 | | 188,050 |
| | |
| |
| |
|
According to the current regulations in different countries, especially in France and Belgium, various committees which represent employees meet on a regular basis. These committees are informed about and consulted on pertinent employee matters. Salaries, development of employment and working conditions are negotiated with trade unions every year.
122
We have not experienced any significant work disruptions or conflicts in the last few years and we consider our relationship with our employees to be satisfactory.
Human Resources Policy
In 2003, the Human Resources Departments were mainly involved in monitoring and overseeing the organizational changes that were made as a result of the restructuring measures announced by us at the beginning of the year. These actions consisted primarily of: 1) an ongoing corporate dialogue to explain the issues behind the 2003-2004 action plan; 2) an analysis of corporate and individual positions; and 3) special attention to seeking both internal solutions (job mobility, early retirement) and external solutions (outplacement) for persons directly affected by the reorganization. The work of Human Resources primarily involved head office personnel of the 13 major Group entities. The asset sale plan, which resulted in the departure of 28,000 persons from the Group, was the subject of regular briefings for employee representatives and was continually monitored by our Human Resources Departments.
Within the operating entities, and during this transition period, the Human Resources Departments continued policies to develop and reward expertise, in order to ensure the professional development of the Group’s 172,300 employees. Occupational health and safety continued to receive special attention, in accordance with the commitments made in the Health and Safety charter signed in October 2002.
Finally, following the formalization of Human Resources commitments and principles in the “HR Guidelines” and Group charters, an additional phase was initiated in October 2003 by defining six priorities for our Human Resources policy.
Human Resources Management Planning
We aim to fill key job positions in the Group and implement, in coordination with the operational business line, to engage in specific processes (Career Management Committees, Succession Planning) to prepare for the demographic transition in 2006-2007 under the best possible conditions. The year 2004 will be devoted to standardization and harmonization of key positions, methodologies for evaluation of the performance of persons holding those positions (and employees in general), and compensation and benefits. This work will rely in part on the Leaders For the Future (LFF) program, the purpose of which is to provide replacements for senior management and executives, the “SUEZ Center for Development”, SUEZ University special programs and the Training & Development Committee. Formalization of LFF development plans and the mobility of LLFs are the priorities for 2004. To continue the development of key operational management personnel, the “Executive Career Management Program”, which is based on the “Annual Performance Appraisal” and the “SUEZ Center for Development” have been made available to executives. Further, to attract, develop, and ensure the professional growth of quality employees, the divisions may use Recruitsoft, an electronic tool launched last year that is used throughout the Group for recruitment and job mobility, as well as the SUEZ Campus, which is aimed at young graduates in Europe. Internally, training plans are determined by the local entities, with the exception of SUEZ University programs that are intended for all Group managers.
Group cohesion and dissemination of values
During a transition period, like the period we experienced in 2003, it is important to ensure the cohesion of the Group and adherence to its values, in order to ensure the quality of service.
One of the functions of the Human Resources Departments, working with internal communications, is to disseminate these values, especially during employment interviews and annual evaluations. The Human Resources Departments, in conjunction with the European Instance of Dialogue (EID), also monitors the commitments formalized in the charters (International Social Charter and Health and Safety Charter). Monitoring compliance with those commitments relies, in particular, on corporate indicators and alerts. For this reason, 2004 will be specifically devoted to continuing the deployment of our reporting and monitoring tools.
123
Support for change management
Technological changes, particularly in the energy business, and the operation of public-private partnerships or on-site outsourcing contracts result in permanent changes in the operation of our businesses. The Human Resources Departments facilitate the management of these changes, specifically through training, skills updating, and corporate dialogue policies.
In order to manage the change brought about by our competitive and economic environment, the “Community of Practice of Change Management” will be created in order to increase awareness of these issues. The Human Resources Departments will play a greater role in formalizing the organizational structure and will be fully supported to bring about change.
Simplification and Pooling of Resources
In 2003, we paid particular attention to simplifying the management of the Human Resources Departments by deploying common tools and using common performance standards. The result was, for example, the establishment of a common platform for job mobility and recruitment on the Group Intranet (Recruitsoft). It also involved optimizing relationships with our outside partners, by establishing a list of “preferred suppliers” and by enhancing certain benefits programs (retirement, death, etc.).
In 2004, our Human Resources Departments will develop the use of benchmarks, so that they will be able to select the most appropriate available service offering from among the various available solutions, both internal and external. In addition, the administrative management of expatriates is being simplified, in order to ensure greater consistency and take advantage of economies of scale.
Consolidation and Management of Social Data and Information
The extension of Topaz as a social reporting tool in 1998 now makes it possible to provide corporate information coverage for 80% of the Group’s consolidated companies (100% for personnel issues). Improvements in the use of the tool was a priority goal in 2003 and will continue in 2004.
Furthermore, in 2004, we will obtain additional tools to measure Human Resources performance and analyze the Group’s corporate costs as well as the costs associated with human resources management.
Social Responsibility and Management of Social Issues
Our social responsibility is affirmed through a dialogue of trust with personnel representatives in the countries where we have facilities, as well as with all the economic and social players involved in our operations. To take account of the Group’s diversity and the number of countries in which it operates, information feedback systems will be adapted and adjusted to anticipate and prevent the occurrence of risks related to social relationships. In addition, a network of social experts will gradually be established in Europe to provide legal and management support for distant entities. Finally, through the International Social Observatory (Observatoire Social International), we continue to work with partners in Europe, Morocco, Argentina, and the United States on issues related to Corporate Social Responsibility, such as social performance indicators, lifelong education and training, or social standards.
124
Indicators
The following table shows the indicators used by the Group to track implementation of its human resources and social policies. The indicator reporting scope is provided in parentheses.
| | | | | | | | | | | | |
| | | EGE
| | | EGI
| |
| | | 2002
| | | 2003
| | | 2002
| | | 2003
| |
SUEZ personnel by geographic zone | | | | | | | | | | | | |
Europe | | 16,873 | | | 15,570 | | | 154 | | | 135 | |
Rest of Europe | | 547 | | | 998 | | | 42 | | | 48 | |
North America | | | | | | | | 1,767 | | | 1,518 | |
South America | | | | | | | | 1,416 | | | 1,414 | |
Africa. Middle East | | | | | | | | 89 | | | 83 | |
Asia – Oceania | | | | | | | | 1,034 | | | 1,103 | |
TOTAL | | 17,420 | | | 16,568 | | | 4,502 | | | 4,301 | |
| | | (100.0 | %) | | (100.0 | %) | | (100.0 | %) | | (100.0 | %) |
Distribution of personnel by Categories of Employees | | | | | | | | | | | | |
Managers | | 2,714 | | | 2,800 | | | 697 | | | 851 | |
Technicians and Supervisors | | 2,742 | | | 2,074 | | | 1,204 | | | 1,042 | |
Operators | | 11,964 | | | 11,694 | | | 2,601 | | | 2,408 | |
TOTAL | | 17,420 | | | 16,568 | | | 4,502 | | | 4,301 | |
| | | (100.0 | %) | | (100.0 | %) | | (100.0 | %) | | (100.0 | %) |
Proportion of women in the group | | | | | | | | | | | | |
Proportion of women in staff positions | | 19.6 | % | | 20.9 | % | | 16.9 | % | | 17.6 | % |
| | | (100.0 | %) | | (99.54 | %) | | (100.0 | %) | | (99.91 | %) |
| | | | |
Proportion of women in management positions | | 13.1 | % | | 13.8 | % | | 12.5 | % | | 19.0 | % |
| | | (100.0 | %) | | (99.4 | %) | | (100.0 | %) | | (80.13 | %) |
Distribution of personnel by type of contract | | | | | | | | | | | | |
Open-ended contracts | | 92.9 | % | | 93.0 | % | | 97.0 | % | | 94.7 | % |
Other | | 7.1 | % | | 7.0 | % | | 3.0 | % | | 5.3 | % |
| | | (100.0 | %) | | (99.8 | %) | | (100.0 | %) | | (100.0 | %) |
Age distribution | | | | | | | | | | | | |
- to 25 | | 2.7 | % | | 3.1 | % | | 5.5 | % | | 4.2 | % |
25 – 29 | | 6.5 | % | | 6.9 | % | | 13.8 | % | | 13.8 | % |
30 – 34 | | 10.8 | % | | 11.3 | % | | 19.7 | % | | 18.7 | % |
35 – 39 | | 12.2 | % | | 12.7 | % | | 17.8 | % | | 18.0 | % |
40 – 44 | | 13.6 | % | | 14.6 | % | | 16.7 | % | | 17.0 | % |
45 – 49 | | 14.9 | % | | 16.0 | % | | 13.2 | % | | 14.2 | % |
50 – 54 | | 17.4 | % | | 17.0 | % | | 8.2 | % | | 8.1 | % |
55 – 59 | | 21.1 | % | | 17.5 | % | | 3.6 | % | | 4.2 | % |
60 – 64 | | 0.9 | % | | 0.9 | % | | 1.3 | % | | 1.5 | % |
65 and + | | 0.01 | % | | 0.0 | % | | 0.2 | % | | 0.3 | % |
| | | (100.0 | %) | | (100.0 | %) | | (98.5 | %) | | (100.0 | %) |
| | | | |
Turnover (per half-year) | | 2002 H2 | | | 2003 H2 | | | 2002 H2 | | | 2003 H2 | |
Turnover = number of employees leaving per half-year (excluding end of contract) / average personnel for half-year | | 3.4 | % | | 14.4 | % | | 10.5 | % | | 15.8 | % |
| | | (91.4 | %) | | (95.7 | %) | | (91.5 | %) | | (86.2 | %) |
125
| | | | | | | | | | | | |
| | | EGE
| | | EGI
| |
| | | 2002
| | | 2003
| | | 2002
| | | 2003
| |
Compensation | | | | | | | | | | | | |
Gross average worker’s salary / Gross local minimum salary | | 6.0 | | | 3.1 | | | 9.0 | | | 9.2 | |
(Minimum value of worker’s salary/Gross local minimum salary) | | 1.7 | | | 1.5 | | | 2.0 | | | 4.4 | |
| | | (8.3 | %) | | (72.3 | %) | | (77.7 | %) | | (93.1 | %) |
Gross average salary / Gross average salary for sector | | | | | | | | | | | | |
Managers | | 1.9 | | | 1.8 | | | 3.2 | | | 1.6 | |
| | | (88.5 | %) | | (91.9 | %) | | (63.4 | %) | | (97.6 | %) |
Technicians and Supervisors | | 1.1 | | | 2.0 | | | 3.1 | | | 2.9 | |
| | | (8.0 | %) | | (81.5 | %) | | (68.9 | %) | | (91.4 | %) |
Operators | | 1.9 | | | 2.0 | | | 2.3 | | | 2.1 | |
| | | (8.3 | %) | | (72.3 | %) | | (57.6 | %) | | (93.1 | %) |
Gross average worker’s salary / local cost of living | | 3.6 | | | 3.0 | | | 5.2 | | | 4.6 | |
| | | (8.3 | %) | | (72.3 | %) | | (80.8 | %) | | (93.1 | %) |
Occupational safety | | | | | | | | | | | | |
Number of fatal accidents (employees) | | 1 | | | 1 | | | 1 | | | 0 | |
Frequency Rate | | 5.68 | | | 5.95 | | | 5.96 | | | 5.06 | |
Severity Rate | | 0.12 | | | 0.15 | | | 0.06 | | | 0.11 | |
| | | (87.6 | %) | | (93.5 | %) | | (31.0 | %) | | (100.0 | %) |
Training | | | | | | | | | | | | |
Percentage of personnel who received training | | 69.0 | | | 74.0 | | | 58.1 | | | 59.1 | |
| | | (89.5 | %) | | (85.5 | %) | | (81.3 | %) | | (92.5 | %) |
% of managers and non managers among personnel trained | | | | | | | | | | | | |
| | | | |
Managers | | 13.6 | % | | 14.6 | % | | 8.5 | % | | 13.2 | % |
Supervisors + Operators | | 86.4 | % | | 85.4 | % | | 91.5 | % | | 86.8 | % |
| | | (89.5 | %) | | (88.0 | %) | | (81.3 | %) | | (94.5 | %) |
| | | | |
Cost of training per person (€/ pers) | | 1,237.4 | | | 1,505.2 | | | 640.5 | | | 877.5 | |
| | | (89.5 | %) | | (85.5 | %) | | (51.7 | %) | | (86.7 | %) |
| | | | |
Number of training hours per person (hr / pers) | | 37.2 | | | 38.8 | | | 84.5 | | | 90.0 | |
| | | (89.5 | %) | | (84.9 | %) | | (72.5 | %) | | (91.6 | %) |
Cost of training per hour of training (€/ hr) | | 33.2 | | | 40.2 | | | 28.5 | | | 68.8 | |
| | | (89.5 | %) | | (84.9 | %) | | (81.3 | %) | | (86.7 | %) |
Distribution of training hours by theme | | | | | | | | | | | | |
Technical training for business segment | | 7.8 | % | | 28.2 | % | | 57.7 | % | | 66.6 | % |
Quality. Environment. Safety | | 2.1 | % | | 13.5 | % | | 5.1 | % | | 10.6 | % |
Languages | | 1.6 | % | | 2.6 | % | | 6.4 | % | | 6.3 | % |
Other | | 88.5 | % | | 55.6 | % | | 30.8 | % | | 16.6 | % |
| | | (89.5 | %) | | (82.8 | %) | | (81.3 | %) | | (100.0 | %) |
126
| | | | | | | | | | | | |
| | | Services
| | | Environment
| |
| | | 2002
| | | 2003
| | | 2002
| | | 2003
| |
Personnel by Geographic Zone | | | | | | | | | | | | |
European Union | | 60,237 | | | 62,768 | | | 61,268 | | | 45,917 | |
Rest of Europe | | 4,808 | | | 2,965 | | | 1,282 | | | 2,873 | |
North America | | 90 | | | 32 | | | 10,726 | | | 10,233 | |
South America | | | | | 501 | | | 18,158 | | | 18,319 | |
Africa. Middle East | | 753 | | | 780 | | | 3,295 | | | 3,261 | |
Asia – Oceania | | 1,001 | | | 1,106 | | | 2,311 | | | 2,566 | |
TOTAL | | 66,889 | | | 68,152 | | | 97,040 | | | 83,169 | |
| | |
|
| |
|
| |
|
| |
|
|
| | | (100.0 | %) | | (100.0 | %) | | (100.0 | %) | | (100.0 | %) |
Distribution of Personnel by Categories of Employees | | | | | | | | | | | | |
Management | | 7,940 | | | 7,860 | | | 7,318 | | | 5,965 | |
Technicians and Supervisors | | 13,289 | | | 15,312 | | | 11,068 | | | 10,117 | |
Operators | | 45,134 | | | 44,765 | | | 77,807 | | | 58,077 | |
TOTAL | | 66,363 | | | 67,937 | | | 96,193 | | | 74,159 | |
| | | | | | | | |
|
| |
|
|
| | | (99.2 | %) | | (99.7 | %) | | (99.1 | %) | | (89.2 | %) |
Proportion of Women in the Group | | | | | | | | | | | | |
Proportion of women in staff positions | | 10.7 | % | | 10.4 | % | | 17.2 | % | | 13.6 | % |
| | | (78.5 | %) | | (98.35 | %) | | (91.8 | %) | | (97.5 | %) |
| | | | |
Proportion of women in management positions | | 11.6 | % | | 11.0 | % | | 21.3 | % | | 16.8 | % |
| | | (85.8 | %) | | (98.1 | %) | | (86.7 | %) | | (73.9 | %) |
Distribution of Personnel by Type of Contract | | | | | | | | | | | | |
Open-ended contracts | | 95.4 | % | | 95.4 | % | | 92.5 | % | | 95.6 | % |
Other | | 4.6 | % | | 4.6 | % | | 7.5 | % | | 4.4 | % |
| | | (83.6 | %) | | (97.3 | %) | | (95.4 | %) | | (76.1 | %) |
Age Distribution | | | | | | | | | | | | |
- to 25 | | 6.9 | % | | 6.4 | % | | 5.8 | % | | 5.6 | % |
25 – 29 | | 10.5 | % | | 10.3 | % | | 11.0 | % | | 11.9 | % |
30 – 34 | | 14.7 | % | | 13.6 | % | | 15.2 | % | | 16.2 | % |
35 – 39 | | 16.2 | % | | 16.0 | % | | 16.7 | % | | 17.2 | % |
40 – 44 | | 14.3 | % | | 15.0 | % | | 15.8 | % | | 15.6 | % |
45 – 49 | | 13.4 | % | | 14.0 | % | | 14.1 | % | | 13.3 | % |
50 – 54 | | 13.2 | % | | 13.7 | % | | 11.5 | % | | 11.0 | % |
55 – 59 | | 9.2 | % | | 9.4 | % | | 7.2 | % | | 7.3 | % |
60 – 64 | | 1.5 | % | | 1.5 | % | | 2.3 | % | | 1.6 | % |
65 and + | | 0.1 | % | | 0.1 | % | | 0.4 | % | | 0.3 | % |
| | | (82.4 | %) | | (97.5 | %) | | (76.1 | %) | | (96.4 | %) |
| | | | |
Turnover (Per Half-Year) | | 2002 H2 | | | 2003 H2 | | | 2002 H2 | | | 2003 H2 | |
Turnover = number of employees leaving per half-year (excluding end of contract) / average personnel for half-year | | 6.7 | % | | 15.2 | % | | 6.8 | % | | 11.5 | % |
| | | (77.1 | %) | | (72.6 | %) | | (88.4 | %) | | (63.3 | %) |
127
| | | | | | | | | | | | |
| | | Services
| | | Environment
| |
| | | 2002
| | | 2003
| | | 2002
| | | 2003
| |
Compensation | | | | | | | | | | | | |
Gross average worker’s salary / Gross local minimum salary | | 1.6 | | | 1.8 | | | 2.4 | | | 3.3 | |
(Minimum value of worker’s salary/Gross local minimum salary) | | 1.0 | | | 1.0 | | | 1.0 | | | 1.0 | |
| | | (34.9 | %) | | (75.1 | %) | | (80.7 | %) | | (70.4 | %) |
| | | | |
Gross average salary / Gross average salary for sector | | | | | | | | | | | | |
Management | | 1.0 | | | 0.8 | | | 1.4 | | | 1.3 | |
| | | (69.5 | %) | | (83.6 | %) | | (59.8 | %) | | (61.2 | %) |
Technicians and Supervisors | | 0.9 | | | 0.8 | | | 1.5 | | | 1.7 | |
| | | (61.0 | %) | | (85.1 | %) | | (74.0 | %) | | (62.8 | %) |
Operators | | 1.1 | | | 1.0 | | | 1.4 | | | 1.8 | |
| | | (35.2 | %) | | (73.1 | %) | | (89.2 | %) | | (70.3 | %) |
Gross average worker’s salary / local cost of living | | 1.6 | | | 1.8 | | | 1.9 | | | 2.0 | |
| | | (35.1 | %) | | (75.1 | %) | | (82.7 | %) | | (70.4 | %) |
Occupational Safety | | | | | | | | | | | | |
Number of fatal accidents (employees) | | 1 | | | 3 | | | 15 | | | 7 | |
Frequency Rate | | 27.25 | | | 25.58 | | | 46.42 | | | 28.45 | |
Severity Rate | | 0.74 | | | 0.78 | | | 1.28 | | | 1.04 | |
| | | (72.2 | %) | | (79.9 | %) | | (82.8 | %) | | (79.4 | %) |
Training | | | | | | | | | | | | |
Percentage of personnel who received training | | 64.8 | | | 43.9 | | | 36.4 | | | 65.1 | |
| | | (46.1 | %) | | (69.1 | %) | | (79.5 | %) | | (77.8 | %) |
| | | | |
% of managers and non managers among personnel trained | | | | | | | | | | | | |
Managers | | 17.0 | % | | 16.3 | % | | 9.5 | % | | 9.6 | % |
Supervisors + Operators | | 83.0 | % | | 83.7 | % | | 90.5 | % | | 90.4 | % |
| | | (46.1 | %) | | (72.5 | %) | | (80.0 | %) | | (69.2 | %) |
Cost of training per person (€/ pers) | | 584.1 | | | 625.4 | | | 442.0 | | | 522.9 | |
| | | (41.5 | %) | | (62.9 | %) | | (79.5 | %) | | (75.4 | %) |
Number of training hours per person (hr / pers) | | 24.0 | | | 24.6 | | | 23.4 | | | 22.5 | |
| | | (41.5 | %) | | (59.5 | %) | | (79.5 | %) | | (75.1 | %) |
Cost of training per hour of training (€/ hr) | | 26.7 | | | 27.6 | | | 24.5 | | | 22.5 | |
| | | (41.5 | %) | | (59.0 | %) | | (79.5 | %) | | (75.1 | %) |
Distribution of training hours by theme | | | | | | | | | | | | |
Technical training for business segment | | 51.4 | % | | 54.1 | % | | 30.4 | % | | 28.0 | % |
Quality. Environment. Safety | | 28.6 | % | | 24.4 | % | | 30.1 | % | | 34.9 | % |
Languages | | 3.6 | % | | 5.3 | % | | 7.3 | % | | 4.7 | % |
Other | | 16.4 | % | | 16.2 | % | | 32.3 | % | | 32.3 | % |
| | | (46.1 | %) | | (67.6 | %) | | (80.0 | %) | | (75.2 | %) |
Methodology
The quantitative human resources data in this report were generated primarily by the Human Resources Department database Topaz, the Group’s data consolidation tool, and the specific safety reporting of certain entities. After being collected, the data are processed and consolidated in accordance with clearly defined criteria and procedures.
(1) Topaz/Carat, a data consolidation software program, is used to collect, process, and report the data gathered by local legal entities of the Group.
128
Each of these entities, including during the Human Resources Department phase, is assigned a financial consolidation method: full consolidation, proportional consolidation, or equity method. The social analyses made in this report concern full consolidation entities only, that is, companies controlled by us through ownership or management. As soon as a company is listed in our accounts as a fully consolidated company, its social data are integrated 100%, no matter what percentage of that company is owned.
(2) Human resources data, which are collected for all of the full consolidation companies, are defined in such a way as to establish uniform information types so that data may be tracked in a consistent manner.
(3) Parameter of reporting. Each indicator is assigned a parameter of reporting representing the percent of relevant personnel covered by the indicator (this applies to entities listed as full consolidation companies in our accounts). The reason for this is that some companies may not have relayed their data, or the information relayed may be erroneous, leading to the removal such companies from the reporting scope.
(4) Two indicator consolidation methods are used:
Aggregation, for personnel structure, staff turnover, and safety data
Weighting by personnel category, for wages and training.
(5) Data controls are established, based on analyses of variations from one period to the next and on consistency and relevancy studies within a single country or activity.
(6) External data used to calculate the indicators are provided by the DREE (French government Office of Foreign Economic Relations) in connection with a country data gathering contract involving its network of local foreign trade information offices. These data are supplemented, when needed, by World Bank and UNESCO statistics. DREE procedures are ISO 9000 certified.
E. Share Ownership
Stock Options
Stock subscription options granted by the Group during fiscal year 2003 tomandataires sociaux (company agents) in office at December 31, 2003.
| | | | | | | | | | |
| | | Number of options
granted
| | | Exercise price
| | Plan
| | Expiration date
|
Gérard Mestrallet | | 350,000 | * | | € | 13.93 | | 11/19/2003 | | 11/18/2011 |
| * | These options can only be exercised: |
| - | if the trend in our share price equals or exceeds that of the Eurostoxx Utilities index over the period from November 19, 2003 to November 19, 2007, plus 1% annually, |
| - | if our share price equals or exceeds €20. |
Stock options exercised during fiscal year 2003 bymandataires sociaux (company agents) in office at December 31, 2003
| | | | | | | | |
| | | Number of options
exercised
| | Exercise price
| | Plan
| | Expiration date
|
Gérard Mestrallet | | 0 | | — | | — | | — |
129
Stock Options held by members of our Board of Directors as of December 31, 2003
As of December 31, 2003, members of our Board of Directors held the following options in our shares:
| | | | | | | | |
Name
| | Number of options
| | Exercise Price
| | Plan
| | Expiration Date
|
Gérard Mestrallet | | 63,065
180,000
250,000
300,000
300,000
500,000
350,000
350,000 | | € 9.79 € 17.47 € 29.82 € 30.22 € 36.41 € 34.51 € 17.67 € 13.93 | | 10/15/1996
11/17/1997
11/16/1998
11/15/1999
11/28/2000
11/28/2001
11/20/2002
11/19/2003 | | 10/15/2004
11/17/2005
11/16/2006
11/15/2007
11/28/2010
11/27/2011
11/19/2012
11/18/2011 |
| | | | |
Etienne Davignon | | 15,135
22,500
30,000
30,000
30,000 | | € 9.79 € 17.47 € 32.36 € 30.13 € 37.84 | | 10/15/1996
11/17/1997
06/30/1999
01/31/2000
12/21/2000 | | 10/15/2004
11/17/2005
06/30/2007
01/31/2008
12/20/2010 |
| | | | |
Total Amount of Options | | 2,420,700 | | | | | | |
Employee share ownership
SUEZ has a voluntary share ownership policy.
As of December 31, 2003, employees held 3.9% of the share capital acquired through a Group Savings Plan offering standard subscription formulae and leveraged formulae in connection with the Spring 1999, 2000 and 2002 programs. Employees benefited from a 20% discount (15% for the United States) on the share price.
Since 1999, the year SUEZ launched the first employee share ownership plan with an international leveraged formula, the participation of foreign subsidiary employees has increasingly grown to reach nearly 50% of subscriptions (excluding France and Belgique) at the time of the last Spring program in 2002. Currently, there are approximately 105,000 SUEZ employee shareholders in 30 countries.
Resolution 16 adopted at our Combined Shareholders Meeting of April 27, 2004 authorized the Board of Directors to increase our share capital through share issues reserved for Group employees, up to a maximum total number of shares issued not exceeding 3% of the share capital. The subscription price was set at 80% of the average opening listed price of one of our shares on the Paris Bourse during the 20 stock market sessions preceding the date of the decision setting the subscription period. Shareholders also authorized the Board of Directors to issue shares reserved for the Spring Multiple 2004 SCA program via the issue of a maximum of 15 million new shares with a par value of €2 each. The share issue price shall be equal to that offered to employees who subscribed in connection with resolution 16 of the General Meeting of April 27, 2004.
Spring Multiple 2004 SCA is a partnership limited by shares incorporated under Luxembourg law whose shares may be offered to employees of Group foreign subsidiaries located in certain countries who, because of local regulatory and tax reasons, cannot subscribe to SUEZ shares in connection with the resolution 16 of the General Meeting of April 27, 2004.
130
Stock subscription options granted by SUEZ and by all companies included in the option allotment scope during fiscal year 2003, to the 10 employees (not executive officers) of the issuer or these companies holding the greatest number of options
| | | | | | |
Number of options granted
| | Strike price
| | Plan
| | Expiration date
|
875,000 | | €13.93 | | 11/19/2003 | | 11/18/2011 |
Stock options exercised during fiscal year 2003 by the 10 Group employees (not executive officers) having exercised the greatest number of options
| | | | | | |
Number of options exercised
| | Strike or purchase price
| | Plan
| | Expiration date
|
164,500 | | €15.03 | | 06/14/1995 * | | 06/13/2003 |
55,500 | | €13.90 | | 07/24/1996 * | | 07/23/2004 |
14,155 | | € 9.79 | | 10/15/1996 ** | | 10/14/2004 |
| ** | stock subscription options |
ITEM 7. MAJOR SHAREHOLDERS AND RELATED PARTY TRANSACTIONS
A. Major Shareholders
The table below sets forth certain information with respect to shareholders known to us to own a significant percentage of our shares as of December 31, 2003.
| | | | | | | | | |
Identity of person or group
| | Amount of
shares owned
| | Percent of
class
| | Voting rights (percentage)
| | Percentage
of change in
ownership
since
December 31,
2001 (1)
| |
Groupe Bruxelles Lambert (GBL) | | 72,457,485 | | 7.19 | | 12.45 | | 1.85 | |
Employee shareholders | | 39,129,959 | | 3.88 | | 4.49 | | 43.75 | |
Crédit Agricole Group | | 34,236,401 | | 3.40 | | 5.76 | | 5.36 | |
CDC Group | | 31,719,141 | | 3.15 | | 3.74 | | 22.25 | |
Cogema | | 22,795,000 | | 2.26 | | 2.79 | | 1.85 | |
CNP Assurances | | 16,693,551 | | 1.66 | | 1.48 | | 4.46 | |
Caixa | | 15,500,000 | | 1.54 | | 1.37 | | 1.85 | |
Treasury stock | | 13,548,300 | | 1.34 | | — | | (63.99 | ) |
Sofina | | 11,958,325 | | 1.19 | | 1.06 | | 22.30 | |
| (1) | Calculation based on change in the percentage ownership of the total outstanding shares of SUEZ. |
Each holder of shares is entitled to one vote per share at any shareholders’ meeting of SUEZ, except that a double voting right is granted to holders of fully paid up registered shares when such shares have been registered for more than two years in the name of the same shareholder.
To the best of our knowledge, as of December 31, 2003, U.S. shareholders held approximately 9% of our outstanding shares. This figure may not be entirely accurate because we can obtain only limited information regarding the current holding of our shares in the United States.
We are not directly or indirectly owned or controlled by another corporation or by any government or other natural or legal person.
131
B. Related Party Transactions
Rohatyn Associates LLC
In connection with the Ondeo Nalco sale in the United States, we deemed it necessary to hire consultants with an in-depth understanding of the US market and its business practices. We thus called upon Rohatyn Associates LLC, the consulting entity of Felix G. Rohatyn, our Director and a former partner of Lazard Bank, in order to evaluate the transaction and provide assistance in negotiations, in collaboration with other Group consultants (investment banks, lawyers, chartered accountants, etc.).
A related agreement was signed between us and Rohatyn Associates LLC. It was approved during our Board of Directors’ meeting held on July 9, 2003. The amount paid by us to Rohatyn Associates LLC with respect to this service amounted to $5 million.
Electrabel
Certain of the Group’s subsidiaries sell gas and other services to Electrabel and its subsidiaries (collectively, “Electrabel”). In relation to these activities prior to 2003 (when the Group began to consolidate Electrabel, see Note 26 to our Consolidated Financial Statements), the revenues recorded by the Group and subsidiaries totaled € 2,021.0 million and € 2,206.8 million for the years ended December 31, 2002 and 2001, respectively. Amounts due to the Group and its subsidiaries from Electrabel related to the sales of gas and other services were € 317.5 million and € 356.4 million as of December 31, 2002 and 2001, respectively. In 2002, Electrabel also purchased € 381.9 million of gas from a Group subsidiary for its energy trading business. In addition, the Group and its subsidiaries recorded payables to Electrabel of € 100.8 million and € 157.4 million as of December 31, 2002 and 2001, respectively.
Tractebel (a subsidiary of the Group) performs daily cash management services on behalf of Electrabel. The balance of the current account corresponds to the net position of the amounts advanced to or received from the Group by Electrabel at the period end. As of December 31, 2002 and 2001, the net balance payable to Electrabel of these accounts was € 1,710.8 million and € 1,295.7 million, respectively.
Cocetrel (a subsidiary of Electrabel) provided long-term operating loans to Group subsidiaries totaling € 1,058.2 million and € 1,081.7 million as of December 31, 2002 and 2001 respectively. Interest expense on these loans amounted to € 69 million and € 79.4 million during to 2002 and 2001 respectively.
Electrabel borrows money from another of the Group’s subsidiaries, Belgelec Finance, in order to finance its acquisitions. As of December 31, 2002 and 2001, the Group had notes receivable due from Electrabel of € 2,028.6 million and € 779.5 million, respectively, related to these activities. The receivables bear interest at market rates, and are due in the year 2004.
Fortis
Fortis B is one of the two parent companies of Fortis, which performs banking and insurance activities primarily in Belgium and the Netherlands. Since the unification of the Fortis security in 2001 and the launch of its listing on December 17, 2001, Fortis B is deconsolidated (see Note 26 to our Consolidated Financial Statements). The Group had entered into various long-term debt agreements with certain subsidiaries of Fortis. The debt agreements were at variable interest rates, ranging from 2.9% to 8.5%, and had varying due dates up to the year 2012. The balance outstanding under these agreements was €405.9 million as of December 31, 2001. In addition, €14.6 million, in borrowings under one of the above debt agreements was collateralized by a security interest in assets of one of the Group’s subsidiaries as of December 31, 2001.
The Group had also entered into various lines of credit agreements with certain Fortis subsidiaries and a group of banks owned up to 25% by Fortis. The lines of credit were at commercial terms and conditions and were
132
renewable at various dates through the year 2003. The balance outstanding under the agreements was €803.6 million as of December 31, 2001. Certain lines of credit contain covenants, including minimum equity requirements, significant changes in ownership, and other financial requirements. The Group was in compliance with all debt covenants as of December 31, 2001.
Net interest expense incurred related to the above borrowings was € 36.0 million for the year ended December 31, 2001.
The Group had time deposits with various subsidiaries of Fortis, which totaled €104.2 million as of December 31, 2001 . Interest income related to these deposits totaled €1.4 million for the year ended December 31, 2001.
Agbar
Agbar (a subsidiary of Hisusa) has given guarantees on the debt of three of the Group’s Argentine subsidiaries. The guarantees totaled €119.4 million, €135.0 million and €171.2 million as of December 31, 2003, 2002 and 2001, respectively, and related mainly to the company Aguas Argentinas (€96.5 million, €117.0 million and €138.4 million as of December 31, 2003, 2002 and 2001 respectively).
Tiru
One of the Group’s subsidiaries has entered into a purchase contract with Tiru, an equity method investee of Elyo (a subsidiary of Tractebel). The contract gives the subsidiaries the right to purchase from Tiru, the steam (energy) resulting from the incineration of household waste by Tiru. Although there are no minimum purchase requirements under this contract, the subsidiaries must first purchase steam from Tiru before purchasing from any other supplier. The prices under the contract are determined using an index that is based mainly on the current prices of coal. Purchases under the contract for the years ended December 31, 2003, 2002 and 2001 totaled €27.5 million, €35.4 million and €44.3 million, respectively. Payables due to Tiru were €4.7 million, €11.2 million and €7.0 million as of December 31, 2003, 2002 and 2001, respectively.
Umicore
The Group has offered options to purchase 768,000 shares of Umicore (a subsidiary of Tractebel) to certain Umicore managers. The options can be exercised between January 1, 2002 and November 21, 2005 at prices ranging from €40.20 to €41.8. In 2003, Umicore managers exercised 69,700 options and 695,300 stock options were outstanding as of December 31, 2003.
ITASA
ITASA, an equity method investee of the Group, sold €41.7 million, €84.1 million and €45.0 million as of December 31, 2003, 2002 and 2001 respectively, of electricity to Gerasul (a subsidiary of Tractebel energia) under a long term supply agreement. Payables due to ITASA were €18.5 million and €32.9 million as of December 31, 2003 and 2002, respectively. The Group has a receivable with ITASA of €16.0 million as of December 31, 2003.
Electroandina
Gazoducto (a subsidiary of Tractebel Andino) sold gas under long term gas supply contracts to Electroandina, an equity method investee of the Group, for €43.6 million, €43.9 million and €54.5 million in December 31, 2003, 2002 and 2001 respectively.
Elia System Operator (ESO)/Elia
Elia, a subsidiary of Elia System Operator (ESO), was created in June 21, 2001 to manage the high-voltage electricity transmission network in Belgium. The Belgian Federal Council of Ministers’ appointment to manage
133
the transmission network was finalized on September 13, 2002. ESO and Elia are accounted for under the equity method. From the date of appointment, the official transmission system operator pricing are controlled by government regulation (CREG).
Electrabel paid to ESO/Elia, electricity transmission fees amounted to €449.7 million in 2003. Payables due to ESO/Elia were €126.6 million as of December 31, 2003. The Group sold €122.8 million of services to ESO/Elia Receivables by ESO/Elia were €8.2 million as of December 31, 2003.
Compagnie Nationale du Rhône (CNR)
During 2003, Energie du Rhône (joint subsidiary of Electrabel, 44%, and CNR, 51%) signed electricity purchase/sale contracts with CNR. The Group purchased €109.6 million and sold €33.6 million of electricity from/to CNR, as of December 31,2003. Payables due to CNR were €20.4 million and receivables due from CNR were €5.8 million as of December 31, 2003.
Inter-municipal companies
The Inter-municipal companies, equity method investee of the group, distribute gas and electricity produced by Electrabel and Distrigaz to Belgian non-industrial customers which do not qualify for deregulation. As of December 31, 2003, Electrabel sold €1,814.7 million of electricity and gas to Inter-municipal companies. Electrabel and Electrabel Customer Solutions paid Inter-municipal companies €944.2 million for electricity and gas distribution.
The Inter-municipal companies do not have staff of their own. In accordance with the by-law, Electrabel contributes the provision of its services, its skills and its experience in terms of distribution with a view to ensuring the daily running of the mixed Inter-municipal companies. All work, supplies and services required for the purpose of the mixed Inter-municipal companies are therefore performed by Electrabel and its staff and billed to the Inter-municipal companies. The expenditures billed in 2003 to the mixed Inter-municipal companies amounted to €1,788.2 million.
All receivables from the Inter-municipal companies for electricity, gas and services amounted to €361.5 million as of December 31, 2003.
As of December 31, 2003, Electrabel lends €438 million to the Inter-municipal companies through cash advances.
Suez Lyonnaise Télécom (SLT)
SLT, equity method investee of the Group, has entered into a credit agreement with SUEZ, for a maximum amount of €700 million. As of December 31, 2003, 2002 and 2001, the balance outstanding under this agreement was €619.9 million, €548.0 million and €290.9 million, respectively. Interest income related to this facility totaled €57.5 million, €36.9 million and €7.9 million for the years ended December 31,2003, 2002 and 2001, respectively.
Loans made by the group
Before the merger of Compagnie de Suez and Lyonnaise des Eaux in 1997, Compagnie de Suez, as a bank holding company, had a long standing policy of granting loans on favorable terms to employees solely for the purpose of acquiring real estate. These mortgage loans were granted irrespective of the position of the employee and approximately 110 loans are still outstanding, of which six are held by current or former members of key management of the group.
134
The interest rates were as follows, with slight variations over time:
| | |
Amount in euro(1)
| | Interest Rate
|
– from 1 to 70,127: | | 4% |
– from 70,128 to 134,155: | | from 6.5% to 7% |
– over 134,155: | | from 7.5% to 8.5% |
| (1) | Converted from French francs into euros using the exchange rate as of January 1, 1999 (€1=FF 6.55957) |
The following chart indicates real estate loans to executive officers outstanding as of May 31, 2004, the amount of the loans at the time they were granted, the applicable interest rate and the amounts outstanding for the last three fiscal years:
| | | | | | | | | | | | | | | | |
Name
| | Title
| | Date of inception
| | Initial amount in euro(1)
| | Interest Rates
| | Amount outstanding in euro as of
| |
| |
| |
|
| | | | | | | | | | | May 31, 2004
| | December 31, 2003
| | December 31, 2002
| | December 31, 2001
|
| | | | | | | | | | | (in euro) | | | | | | |
| Valérie Bernis | | Executive Vice President in charge of Communications | | 1996 | | 134,155 | | 70,127 – 4% 64,029 – 6.6% | | 41,040 | | 42,931 | | 47,342 | | 100,992 |
| Patrick Billioud | | Secretary of the Board of Directors | | 1995 | | 228,673
< | | 70,127 – 4% 64,029 – 6.5% 94,518 – 8.5% | | 79,457 | | 89,294 | | 111,830 | | 132,935 |
| Christophe Cros | | Senior Executive Vice President of SUEZ Environnement | | 1992 | | 128,057
< | | 64,029 – 4% 64,029 – 7% | | 38,190 | | 42,483 | | 52,390 | | 61,766 |
| Jean-Michel Théron | | Senior Executive Vice President of Lyonnaise des Eaux France | | 1992 | | 121,959
< | | 64,029 – 4% 57,931 – 7% | | 36,214 | | 40,280 | | 49,668 | | 58,560 |
| (1) | Converted from French francs into euro using the exchange rate as of January 1, 1999 (€1=FF 6.55957) |
Electrabel
Cocetrel, one of our subsidiaries in 1999 and 1998 and a subsidiary of Electrabel in 2001 and 2000, provided long-term operating loans to Electrabel which totaled €929.2 million as of December 31, 1999. The loans are renewable on a continuous basis. Interest income on these loans totaled €32.9 million for the year ended December 31, 1999. Cocetrel provided long-term operating loans to our subsidiaries totaling €1,382.8 million and €1,081.7 million as of December 31, 2000 and 2001, respectively. Interest expense on these loans amounted to €102.3 million and €79.4 million as of December 31, 2000 and 2001, respectively.
Electrabel borrows money from another of our subsidiaries, Belgelec Finance, in order to finance its acquisitions. As of December 31, 2001 and 2000, we had notes receivable due from Electrabel of €779.5 million and €775.5 million, respectively, related to these activities. The receivables bear interest at market rates and are due in 2004.
We believe that the loans described in this section were on terms no more favorable than those that would have been agreed upon by third parties on an arms length basis.
135
C. Interests of Experts and Counsel
Not applicable.
ITEM 8. FINANCIAL INFORMATION
A. Consolidated Statements and Other Financial Information
Consolidated Financial Statements
Listed in Item 19.
Legal and Arbitration Proceedings
We are involved in a number of legal proceedings incidental to the normal conduct of our business.
The offices of the Belgian Special Tax Inspection Department are claiming the amount of €157 million from Tractebel and have indicated their intention to claim an additional amount of €31 million for its investments in Kazakhstan. Tractebel has filed an administrative law appeal against those claims. We continue to believe, based on the opinion of our legal counsel, that the aforementioned claims are without merit.
In Argentina, although the macro-economic environment has stabilized, it continues to suffer from the peso devaluation. Negotiations between the water concession holders and the concession granting authorities have neither resulted in the implementation of rate increases nor defined new guidelines to permanently restore a financial and economic equilibrium for the Argentine contracts. However, an interim agreement (Acta Acuerdo) relating solely to the year 2004 was signed on May 11, 2004. This agreement allows Aguas Argentinas to continue its operations and to complete its investment program aimed at providing service to 11 million customers in the Buenos Aires region. It also lays down the main principles for renegotiating the Buenos Aires concession contract. Similar interim agreements are currently under discussion for the Santa Fe and Cordoba concessions. Pursuant to the Franco-Argentine Bilateral Investment Protection Treaty, the concession holders and their shareholders launched arbitration procedures in April 2003, before the International Center for Settlement of Investment Disputes (ICSID). Assuring continued operations, as favored by us, these procedures would seek to implement measures to restore the financial and economic equilibrium of the Argentine concessions and obtain a reasonable indemnity from the Argentine government. In the event of an alternative termination scenario, the procedure would seek an indemnity to compensate us and the other shareholders for their investments and the losses incurred since the devaluation’s onset. The arbitration tribunal was recently set up, but the proceedings have not formally begun. At the same time, discussions with multilateral organizations (BID, IFC) have been held regularly since the beginning of the crisis in 2002, in order to determine a debt restructuring plan that would reduce the debt servicing requirements of concession holders as part of a global renegotiation of the concession contracts. The multilateral organizations are regularly informed of the progress of negotiations with the Argentine government.
In Jakarta, negotiations were held with the concession-granting authority and resulted in authorization to increase prices significantly. These increases are currently being contested by consumer associations. Legal proceedings are currently underway at the appeal stage before the Indonesian courts. Uncertainties remain over the outcome of the negotiations to enable the contract to meet profitability expectations and guarantee its long-term future. The provisions recorded in 2002 to cover all of our commitments were maintained in 2003.
In Manila, the attempt to withdraw from the concession contract using the termination notice, filed before the Appeals panel, was rejected on February 7, 2003. On November 7, 2003, the arbitration tribunal ruled that the concession contract could not be terminated and that the concession fee owed by Maynilad (Philippines) had to be paid. Since that date, negotiations have continued between MWSS (concession-granting authority), the lending banks and the company’s two shareholders (SUEZ Environnement, 40% and Benpres, 60%), in order to
136
reorganize the company and ensure its long-term viability. In 2002, we fully provisioned our exposure under this contract. As a result of these negotiations, we now intend to reduce our stake in and corresponding exposure to the company.
Aguas do Amazonas has a concession contract for a term of 30 years to distribute water and provide wastewater management services for the city of Manaus in Brazil. Three legal disputes are currently pending against the company and relate to: 1) the discharge of untreated waste water, 2) the invoicing process, and 3) the price increase obtained in December 2003.
For these and other types of litigation, we set aside reserves to cover the eventual estimated costs based on the analysis of our legal counsel. The total amount of provisions established as of December 31, 2003 amounted to €442.1 million, which were for litigation, claims, and tax risks. Our Consolidated Financial Statements have adequate provisions to cover the risks relating to pending disputes. However, since litigations and similar proceedings are subject to numerous uncertainties, their outcome cannot be predicted.
Management believes that there is no other litigation or arbitration that has had or the outcome of which is reasonably likely to have, a material adverse effect on our financial condition, results, operations or assets.
Competition and combinations
Energy
In Belgium, Electrabel operates in partnership with municipalities, through mixed inter-municipal companies, to distribute gas, electricity and distribution signals. Electrabel and the municipalities have signed agreements for the supply of electricity to eligible customers who have not expressly chosen another supplier. These agreements, comprised of vertical integrations, have been examined by the Belgian competition authorities and were approved subject to certain commitments by Electrabel, and for the supply of Gas, Distrigaz (subsidiary of SUEZ-TRACTEBEL SA), with the main purpose of improving the liquidity of wholesale markets, as well as facilitating entry into the Belgian market for competitor suppliers.
Environment
In France, the Anti-Trust Council (“Conseil de la Concurrence”) ruled that the subsidiary companies of CGE and Lyonnaise des Eaux with equal stakes in water distribution created a collective dominant position between the two groups. Nevertheless, the council did not impose sanctions but requested that the Minister of the Economy order the two companies to modify or terminate the agreements that combine their resources within joint subsidiaries. The Paris Court of Appeal (on February 18, 2003) confirmed this decision and emphasized that the Minister should determine the actions to be taken, both in terms of their principle and application. Prior to stating his position on this matter, the Minister appears to be waiting for the outcome of the appeal lodged by CGE before the Court of Cassation.
Dividends
We have paid dividends in each year since our merger in 1997. The payment and amount of dividends depend on our earnings and financial condition and other factors that our Board of Directors deems relevant. Dividends are recommended by our Board of Directors and are then voted on by the shareholders at the annual general meeting. Dividends are paid in euro. Dividends declared in respect of a given year are paid in the following year.
Dividends paid to holders of ADSs or shares who are not residents of France generally will be subject to French withholding tax at a rate of 25%. Holders who qualify for benefits under an applicable tax treaty and who comply with the procedures for claiming treaty benefits may be entitled to a reduced rate of withholding tax and, in certain circumstances, an additional payment (net of withholding tax) representing all or part of the French
137
avoir fiscal,or tax credit, under conditions provided for in the relevant treaty and under French law. Investors in our ADSs or shares should consult their own tax advisers with respect to the tax consequences of an investment in ADSs or shares.
The table below sets forth, in respect of the years indicated, the amount of dividends paid per share excluding the French tax credit (avoir fiscal) and the amount of dividends per share including the French tax credit (avoir fiscal) (before deduction of applicable French withholding tax). Dividends per share reflect the five to one stock split effective May 15, 2001.
| | | | | | | | | | |
Year (1)
| | Dividend per share excluding tax credit (2)
| | Dividend per
share including
tax credit (2)
| | Total
dividend paid
|
| | | € | | $ | | € | | $ | | (in € millions) |
2001 | | 0.71 | | 0.63 | | 1.065 | | 0.94 | | 728 |
2002 | | 0.71 | | 0.80 | | 1.065 | | 1.19 | | 715 |
2003 | | 0.71 | | 0.85 | | 1.065 | | 1.27 | | 715 |
| (1) | According to French law, payment of dividends must be made within nine months following the end of the fiscal year to which they relate. The dividends relating to 2003 were paid on May 3, 2004. |
| (2) | U.S. dollar amounts are translated at the noon buying rate on the date the dividend was paid: for 2001, €1 = $0.8848; for 2002, €1 = $1.1200; and for 2003, €1 = $1.1937. |
As we will make any dividend payments in euro, exchange rate fluctuations will affect the U.S. dollar amounts received by holders of ADSs upon conversion into U.S. dollars by the Depositary of such cash dividends. See “Item 3. Key Information – Exchange Rates”.
B. Significant Changes
First quarter 2004 Revenues
On April 29, 2004 we released unaudited first quarter 2004 revenue figures as follows:
| | • | Revenues increased by 1.7% despite the significant impact of asset disposals and adverse exchange rate fluctuations. |
| | • | Changes in Group structure (negative impact of €156 million) were mainly the 2003 disposals of Northumbrian (negative impact of € 192 million) and Cespa (negative impact of €142 million), plus the Puerto Rico contract cancellation (negative impact of €114 million); they were partially offset by the consequences of deregulation in Belgium, linked in particular to the creation of Electrabel Customer Solutions (€428 million). |
| | • | Exchange rate fluctuations (negative impact of €187 million), related mainly to the U.S. dollar (negative impact of €126 million). |
| | • | Natural gas price movements (negative impact of €57 million). |
First quarter organic growth rose 6.2% to €10.3 billion at March 31, 2004 compared to €10.1 billion at March 31, 2003 (1).
138
Revenue Contribution By Business Activity
| | | | | | | | | | | | |
| | | March 31, 2004
| | March 31, 2003 pro forma(1)
| | March 31, 2003
| | % Gross change(2)
| | | % Organic growth(3)
| |
| | | (in € millions, except percentages) | |
Energy | | 7,518.1 | | 6,794.1 | | 6,794.1 | | 10.7 | % | | | |
Environment | | 2,738.9 | | 3,152.3 | | 3,772.2 | | (13.1 | )% | | | |
Other businesses (4) | | 55.2 | | 190.2 | | 190.2 | | (71.0 | )% | | | |
| | |
| |
| |
| |
|
| |
|
|
Total Group | | 10,312.2 | | 10,136.6 | | 10,756.5 | | 1.7 | % | | 6.2 | % |
| | |
| |
| |
| |
|
| |
|
|
| (1) | Restated to eliminate Ondeo Nalco revenues. Ondeo Nalco was sold during the fourth quarter of 2003 and is accounted for under the equity method in the 2003 Consolidated Financial Statements. The company was still fully consolidated when 2003 first quarter revenues were reported. See reconciliation of the pro forma results in the following quarterly revenue break down. |
| (2) | Calculated on the basis of March 2003 pro forma revenues. |
| (3) | On a constant structural accounting method and exchange rate basis, excluding energy trading and gas price variations, and excluding Puerto Rico, the withdrawal from which was announced on January 13, 2004. For the methodology of the calculation of organic growth see “Item 5.A. Operating and Financial Review and Prospects – Operating Results”. See below the reconciliation of the first quarter organic growth. |
| (4) | The strong decrease in revenues contribution from other businesses is explained mainly by the sale of M6 shares in early 2004 (M6 contributed to €108 million as for the first quarter 2003) |
Organic Revenue Growth On A Comparable Basis
Organic growth in revenues on a comparable basis is as follows:
| | | | | | | | | |
| | | March 31, 2004
| | | March 31, 2003
| | | % Organic growth
| |
| | | (in € millions, except percentages) | |
Reported revenues | | 10,312.2 | | | 10,756.5 | | | | |
Ondeo Nalco revenues (1) | | | | | (619.9 | ) | | | |
| | |
|
| |
|
| |
|
|
Pro forma revenues | | 10,312.2 | | | 10,136.6 | | | | |
Changes in Group structure (2) | | (508.2 | ) | | (549.9 | ) | | | |
Cancellation of the Puerto Rico contract | | | | | (113.9 | ) | | | |
Exchange rate movements | | | | | (186.5 | ) | | | |
Natural gas prices | | | | | (57.3 | ) | | | |
| | |
|
| |
|
| |
|
|
Comparable | | 9,804.0 | | | 9,229.0 | | | 6.2 | % |
| | |
|
| |
|
| |
|
|
| (1) | Restated to eliminate Ondeo Nalco revenues. Ondeo Nalco was sold during the fourth quarter of 2003 and is accounted for under the equity method in the 2003 Consolidated Financial Statements. The company was still fully consolidated when 2003 first quarter revenues were reported. |
| (2) | Respectively, 2004 revenues of companies consolidated for the first time, and 2003 revenues of companies withdrawn from consolidation. |
Quarterly Revenue Breakdown
| | | | | | | | | | | |
| | | 1st Quarter
| | | 2nd Quarter
| | 3rd Quarter
| | 4th Quarter
| | Cumulative
|
| | | (in € millions, except percentages) |
2003, including Ondeo Nalco | | 10,756.5 | | | 9,927.5 | | 9,854.6 | | na | | na |
2003, pro forma, excluding Ondeo Nalco (1) | | 10,136.6 | | | 9,316.3 | | 9,221.2 | | 10,947.7 | | 39,621.8 |
| | |
|
| |
| |
| |
| |
|
2004 | | 10,312.2 | | | | | | | | | |
| | |
|
| |
| |
| |
| |
|
Gross change in % | | 1.7 | % | | | | | | | | |
139
| (1) | Restated to eliminate Ondeo Nalco revenues. Ondeo Nalco was sold during the fourth quarter of 2003 and is accounted for under the equity method in the 2003 Consolidated Financial Statements. The company was still fully consolidated when 2003 first quarter revenues were reported. |
Revenue by Business Activity
Energy
Energy revenues grew by 10.7%. The positive impact of changes in Group structure ( €410 million) were partially offset by natural gas price decreases (negative impact of €57 million) and the unfavorable impact of foreign exchange fluctuations (negative impact of €152 million).
| | | | | | | |
| | | Three Months
Ended March 31, 2004
| | Three Months
Ended March 31, 2003
| | % Gross change
| |
| | | (in € millions, except percentages) | |
Electricity & Gas Europe | | 3,778.0 | | 3,389.5 | | 11.5 | % |
Electricity & Gas International | | 1,325.2 | | 1,088.1 | | 21.8 | % |
Energy & Industrial Services | | 2,414.9 | | 2,316.5 | | 4.2 | % |
| | |
| |
| |
|
|
Total | | 7,518.1 | | 6,794.1 | | 10.7 | % |
| | |
| |
| |
|
|
Electricity & Gas in Europe (EGE).Revenues increased by 11.5% at the end of March 2004.
Electricity
| | • | Sales increased during the first quarter of 2004 mainly due to: |
| | • | Changes in group structure €410 million, in particular the creation of Electrabel Customer Solutions now servicing deregulated customers in Belgium in substitution of intermunicipal companies. |
| | • | The sales of electricity realized within the framework of the optimization of both generation facilities and Electrabel contracts portfolio on a European basis. Electricity sales optimization reached €285 million as of March 31st 2004, versus €169 million as of March 31st 2003. |
| | • | In Belgium, revenues and sales volumes remained steady despite the full opening of the electricity market in Flanders. |
| | • | Outside Belgium, electricity sales were down slightly, due in particular to the cancellation of low profitable contracts in the Netherlands, to the transfer of sales from Netherlands distributors to wholesale sales, and to the scheduled shutdown of a power plant in Italy for repowering, despite increased sales volumes in Germany and France. |
Natural gas
| | • | Sales within the framework of the portfolio contract optimization (€169 million in 2004) rose slightly between 2003 and 2004. |
| | • | Electrabel and Distrigaz sales to distributors in Belgium decreased following the July 1, 2003 deregulation in Flanders and in Wallonia (partial deregulation as from January 1, 2004). |
| | • | Sales outside Belgium were down as a result of very large, non-recurring LNG sales in Spain during the first half of 2003. |
Electricity & Gas International (EGI).Revenue increased by 21.8% (or €237 million). This strong growth is explained mainly by the startup of new electric power plants in 2003 and early 2004 and by continued LNG expansion partially offset by the negative impact of exchange rate fluctuations.
140
This growth stemmed mainly from:
| | • | North America (€262 million) with: |
| | • | increased sales by Tractebel LNG North America (€77 million), or a volume increase of 35%, mainly due to new supply contracts, a doubled Everett terminal capacity, and increased transport capacity, |
| | • | the addition of two new power stations which entered service in 2003 (€97 million): Monterrey, Mexico in April 2003 (245 MW) and Chehalis, Washington State in October 2003 (520 MW), |
| | • | the commercial success of the direct energy sales activity to industrial and service clients of Tractebel Energy Services Inc. (TESI €68 million). |
| | • | Asia (€71 million), of which €56 million are a result of the startup of the Bowin power station (740 MW) in Thailand at the end of January 2003 and the Baymina power plant (770 MW) in Turkey, February 2004. |
| | • | Latin America ( €62 million) where sales rose mainly following the replacement in Brazil of initial contract volumes by new bilateral contracts with distributors and industrial customers. This transition was accompanied both by higher volumes and increased prices. |
Energy & Industrial Services. Revenues from Energy and Industrial Services increased by 4.2% (€98 million) which stemmed from:
| | • | Fabricom businesses (€62 million), the result of a slight upturn in French and Belgian activity; activity which remains weak in the Netherlands, particularly in the industrial and infrastructure project areas. |
| | • | Elyo businesses (€28 million), strong growth at the beginning of 2003, thanks to the particularly favourable climatic conditions. |
| | • | Engineering businesses (€27 million), mainly thanks to expanded activity in natural gas installation. |
| | | | | | | | | |
| | | March 31, 2004
| | March 31, 2003 Pro forma
| | March 31, 2003
| | % Gross
change (1)
| |
| | | (in € millions, except percentages) | |
SELS Water Europe (2) | | 970.0 | | 1,047.7 | | 1047.7 | | (7.4 | )% |
SELS Waste Services Europe | | 1,083.1 | | 1,261.8 | | 1261.8 | | (14.2 | )% |
Degrémont | | 181.4 | | 191.1 | | 191.1 | | (5.1 | )% |
Others / International | | 504.4 | | 627.4 | | 627.4 | | (19.6 | )% |
SEIS | | | | 24.3 | | 644.2 | | | |
| | |
| |
| |
| |
|
|
Total | | 2,738.9 | | 3,152.3 | | 3,772.2 | | (13.1 | )% |
| | |
| |
| |
| |
|
|
| (1) | Calculated on the basis of pro forma March 2003 revenues as previously reconciled. |
| (2) | Including Ondeo Industrial Solutions revenues recorded under SEIS in 2003, for €24.3 million. |
SUEZ Environnement generated revenues of €2.7 billion, a decline from €3.2 billion for the first quarter 2003, as a result of changes in Group structure (negative impact of €441 million, mainly due to the Northumbrian and Cespa disposals, as well as the Puerto Rico contract cancellation), and to exchange rate fluctuations (negative impact of €35 million). Starting with the first quarter 2004, Ondeo Industrial Solutions contributes to the Water Europe segment.
141
Moreover Europe waste services revenues recorded growth for the activities in France, effects of an unfavorable economic situation, mainly in Germany and Benelux, and the cancellation of insufficiently profitable contracts.
Revenue Breakdown By Geographic Area
The revenue breakdown by geographic area was as follows:
| | | | | | | |
| | | March 31, 2004
| | March 31, 2003 Pro forma
| | % Gross change
| |
| | | (in € millions, except percentages) | |
France (1) | | 2,417.0 | | 2,432.4 | | (0.6 | )% |
Belgium | | 3,473.4 | | 2,988.6 | | 16.2 | % |
Subtotal, France-Belgium | | 5,890.4 | | 5,421.0 | | 8.7 | % |
| | |
| |
| |
|
|
Other European Union | | 2,047.6 | | 2,450.3 | | (16.4 | )% |
Other European countries | | 342.4 | | 335.7 | | 2.1 | % |
North America | | 933.8 | | 918.4 | | 1.7 | % |
Subtotal Europe and North America | | 9,214.2 | | 9,125.4 | | 1.0 | % |
| | |
| |
| |
|
|
South America | | 452.8 | | 382.0 | | 18.5 | % |
Asia and Oceania | | 505.1 | | 505.5 | | (0.1 | )% |
Africa | | 140.1 | | 123.7 | | 13.2 | % |
| | |
| |
| |
|
|
Total | | 10,312.2 | | 10,136.6 | | 1.7 | % |
| | |
| |
| |
|
|
| (1) | The change in revenues in France is 4% excluding the change in Group structure due to the sale of M6. |
France and Belgium recorded sustained growth, mainly due to the mechanical effects of deregulation (ECS) in Belgium, and despite the impact of the M6 sale in France (which contributed 108 million euros for the first quarter of 2003). The contribution of other European Union countries decreased with the disposals of Northumbrian and Cespa. In North America, the cancellation of the Puerto Rico contract and the impact of negative exchange rates, were offset by the growth of Tractebel North America.
Developments in 2004
In addition to subsequent events disclosed in Note 24 to our Consolidated Financial Statements, other main developments for the year 2004 are presented below.
New Credit Facility
On May 28, 2004, we entered into a syndicated credit facility in the amount of €4.5 billion. The new facility has a term of five years with two one-year extension options, exercisable at the end of the first and second years of the facility, respectively. The new credit facility is guaranteed by GIE SUEZ Alliance and is intended to replace and extend the term of existing and undrawn credit facilities of the Group. The new credit facility, which does not contain any financial covenant, also significantly improves on the terms and conditions of our current credit facilities.
ITEM 9. LISTING
A. Listing Details
The principal trading market for our ordinary shares is Euronext Paris. Our shares are also listed on other stock exchanges in Brussels, Zurich and Luxembourg, and are also traded as options on the MONEP, the Paris
142
options market. On Euronext Paris, our shares have been listed on thePremier Marché since the creation of the market. Our shares are included in the major European indexes, including the CAC 40, an index of the largest French companies in which our weighting was 2.72% on June 18, 2004, the Dow Jones Euro Stoxx 50, the FTSE Euro Top 100, and the MSCI Euro Index.
In addition, our ADSs have been listed on the New York Stock Exchange since September 18, 2001 under the symbol “SZE”.
The tables below set forth, for the periods indicated, the reported high and low prices for our outstanding shares on Euronext Paris. In accordance with the relevant European Union regulations, since January 1, 1999, all shares listed on Euronext Paris have traded in euro.
| | | | |
| | | Ordinary Shares
|
| | | High
| | Low
|
| | | € | | € |
Annually | | | | |
1999 | | 39.30 | | 29.10 |
2000 | | 40.06 | | 27.36 |
2001 | | 39.28 | | 29.46 |
2002 | | 34.90 | | 13.18 |
2003 | | 19.80 | | 8.76 |
| | |
Quarterly | | | | |
2002 | | | | |
First Quarter | | 34.90 | | 30.80 |
Second Quarter | | 33.80 | | 23.20 |
Third Quarter | | 27.30 | | 14.50 |
Fourth Quarter | | 20.10 | | 13.18 |
2003 | | | | |
First Quarter | | 19.80 | | 8.76 |
Second Quarter | | 16.16 | | 10.50 |
Third Quarter | | 15.78 | | 13.17 |
Fourth Quarter | | 16.00 | | 13.34 |
2004 | | | | |
First Quarter | | 18.57 | | 15.35 |
| | |
Monthly | | | | |
2004 | | | | |
January | | 17.64 | | 15.35 |
February | | 18.40 | | 16.41 |
March | | 18.57 | | 15.57 |
April | | 17.67 | | 16.50 |
May | | 16.36 | | 15.23 |
June (through June 21) | | 16.90 | | 15.61 |
Source: Fininfo.
Trading in the United States
Citibank serves as the Depositary with respect to our ADSs traded on The New York Stock Exchange. Each ADS represents one ordinary share.
143
The following table sets forth, for the periods indicated, the high and low prices on The New York Stock Exchange for our ADSs.
| | | | |
| | | American Depositary
Share Price U.S. dollars
|
| | | High
| | Low
|
Annually | | | | |
2001 (from September 18) | | 35.30 | | 31.00 |
2002 | | 30.85 | | 13.18 |
2003 | | 20.85 | | 9.49 |
| | |
Quarterly | | | | |
2001 | | | | |
Third Quarter (from September 18) | | 35.30 | | 31.00 |
Fourth Quarter | | 34.20 | | 28.40 |
2002 | | | | |
First Quarter | | 30.85 | | 27.27 |
Second Quarter | | 30.30 | | 24.01 |
Third Quarter | | 26.50 | | 15.00 |
Fourth Quarter | | 19.97 | | 13.18 |
2003 | | | | |
First Quarter | | 20.85 | | 9.49 |
Second Quarter | | 18.86 | | 11.45 |
Third Quarter | | 17.18 | | 15.00 |
Fourth Quarter | | 20.24 | | 15.80 |
2004 | | | | |
First Quarter | | 23.21 | | 19.13 |
| | |
Monthly | | | | |
2004 | | | | |
January | | 21.92 | | 19.55 |
February | | 23.21 | | 20.70 |
March | | 22.95 | | 19.13 |
April | | 21.22 | | 19.00 |
May | | 20.04 | | 18.15 |
June (through June 21) | | 20.53 | | 18.86 |
Source: Fininfo.
B. Plan of Distribution
Not applicable.
C. Markets
Euronext Paris
On September 22, 2000, upon successful completion of an exchange offer, the ParisBourseSBF S.A. or the “SBF,” the Amsterdam Exchanges and the Brussels Stock Exchanges merged to create Euronext, the first pan-European exchange. Through the exchange offer, all the shareholders of SBF, the Brussels Exchanges and the Amsterdam Exchanges contributed their shares to Euronext N.V., a Dutch holding company. Euronext is comprised of Euronext Paris, Euronext Amsterdam and Euronext Brussels. Following the creation of Euronext, the SBF changed its name to Euronext Paris S.A. (“Euronext Paris”). Securities quoted on exchanges participating in Euronext will be traded over a common Euronext platform, with central clearinghouse, settlement
144
and custody structures. However, these securities will remain listed on their local exchanges. As part of Euronext, Euronext Paris retains responsibility for the admission of shares to Euronext Paris’s trading markets as well as the regulation of those markets.
Securities approved for listing on Euronext Paris are traded in one of three markets. The securities of most large public companies are listed on the Premier Marché, with the Second Marché available for small- and medium-sized companies. Trading on the Nouveau Marché was introduced in March 1996 to allow companies seeking development capital to access the stock market. In addition, securities of certain other companies are traded on a non-regulated market, the Marché Libre OTC.
The Premier Marché
The Premier Marché is a market regulated by theAutorités des Marchés Financiers and managed and operated by Euronext Paris. Admission to the Premier Marché is subject to certain capital adequacy and liquidity requirements determined by Euronext Paris. In addition, companies applying for listing on the Premier Marché are required to publish comprehensive information regularly and to keep the public informed of events likely to affect the market price of their securities.
Securities listed on thePremier Marché are officially traded through authorized financial institutions that are members of Euronext Paris. Trading takes place continuously on each business day from 9:00 a.m. to 5:25 p.m. (Paris time), with a pre-opening session from 7:15 a.m. to 9:00 a.m. (Paris time) and a pre-closing session from 5:25 p.m. to 5:30 p.m. (Paris time) during which transactions are recorded but not executed and a closing auction at 5:30 p.m (Paris time). Any trade of securities that occurs after a stock exchange session closes is recorded on the next business day at the previous session’s closing price for that security. Euronext Paris publishes a daily official price list that includes, among things, price information on listed securities.
Euronext Paris has announced new regulations under which, beginning in April 2001, Euronext Paris places securities listed on thePremier Marché in one of two categories,Continu orFixing, depending on their trading volume. Our ordinary shares are placed in the category known asContinu, which includes the most actively traded securities.
Euronext Paris may reserve trading in a security listed on thePremier Marché if the quoted price of the security exceeds certain price limits defined by the regulations of Euronext Paris. In particular, if the quoted price of aContinu security varies by more than 10% from the previous day’s closing price, Euronext Paris may reserve trading in that security for four minutes. Once trading has recommenced, further reservations of four minutes are also possible if the price again varies by more than 10% from the threshold at which the reservation was initiated. It may again reserve trading in that security for four minutes if the price varies by more than 2% from the last quoted price. Euronext Paris also may reserve trading of a security listed on thePremier Marché in certain other limited circumstances, including, for example, where there is unusual trading activity in the security. In addition, in certain exceptional cases, market authorities may also suspend trading.
Since September 25, 2000, trades of securities listed on thePremier Marché are settled on a cash basis. However, market intermediaries are also permitted to offer investors a deferred settlement service (Service de Réglement Différé or “SRD”) for a fee. The deferred settlement service is only available for trades in securities which either (1) are a component of the Index SBF 120 or (2) have both a total market capitalization of at least €1 billion and a daily average volume of trades of at least €1 million. Investors in shares eligible to the SRD can elect on the determination date (date de liquidation), which is the fifth trading day before the end of the month, either to settle by the last trading day of the month or to pay an additional fee and postpone the settlement to the determination date of the following month. SUEZ shares are eligible for the SRD.
Under French law and pursuant to a resolution of the shareholders meeting held on April 27, 2004, the Board of Directors is authorized to acquire up to 10% of our share capital for a maximum amount of €3.6 billion
145
for cancellation, financial operations, employee share purchase plans or market share price adjustments. As of December 31, 2003, we held 13.5 million of our shares, or 1.3% of total share capital, pursuant to prior authorizations.
D. Selling Shareholders
Not applicable.
E. Dilution
Not applicable.
F. Expenses of the Issue
Not applicable.
ITEM 10. ADDITIONAL INFORMATION
A. Share Capital
Not applicable.
B. Articles of Association
The following summary contains a description of the material provisions of our Articles of Association (statuts), which does not purport to be complete and is qualified in its entirety by reference to ourstatuts, an English translation of which is attached hereto as an exhibit, and French company law.
Registration and Corporate Purpose
SUEZ is asociété anonyme à Conseil d’Administration, a form of limited liability company established under French law. We are registered in theRegistre du Commerce et des Sociétés de Paris (Paris trade and companies register) under reference number SIREN 542 062 559 R.C.S. Paris.
Our objects and purposes are set out in Article 3 of thestatuts. These include the management and development of our present and future assets in all countries, and in particular:
| • | obtaining, purchasing, leasing and operating any and all concessions and companies involved in supplying towns with drinking or industrial water, the evacuation and treatment of waste water, drying and draining operations, irrigation and the development of all water transport, protection and storage structures; |
| • | obtaining, purchasing, leasing and operating any and all selling and service activities to local public authorities and private individuals with respect to urban development and management of the environment; |
| • | the design, development and performance of any and all projects and any and all public or private works on behalf of local public authorities and private individuals; the preparation and signing of any and all treaties, contracts and agreements relating to the performance of these projects and procedures; |
| • | the acquisition of any and all investments through the subscription, purchase, transfer, exchange or by any other means, of shares, interests, bonds and any and all other securities in companies already in existence or to be created; |
146
| • | obtaining, purchasing, assigning, conceding and operating of all patents, licenses and processes; |
| • | and, more generally, any and all industrial, commercial, financial, personal or real-estate transactions relating directly or indirectly to our corporate purpose or which are likely to favor and develop our business. |
Directors
We are managed by a Board of Directors. The Board of Directors’ powers were modified at our shareholders’ meeting of April 26, 2002 in compliance with the New Economic Regulation Law of May 15, 2001. Article 15 of ourstatuts, as amended, provides that the Board of Directors determines the strategic direction of Company activities and ensures its implementation. It considers all issues concerning the proper functioning of the Company and settles all matters relating thereto, within the scope of the corporate purpose and subject to those powers expressly granted by law to shareholder meetings.
The Board of Directors performs all controls and verifications it considers appropriate. Each Director receives all information necessary to the performance of his duties and may request any documents he or she considers necessary.
The Executive Committee reviews, at the request of the Chairman and Chief Executive Officer, strategic, development and organizational issues concerning the Group.
The Directors’ term of office is four years. A director appointed to replace another Director whose term of office has expired can only remain in office for the remaining period of the term of office of his predecessor. Except in the event of termination of the employment contract, if the Director is a salaried employee, or in the event of resignation, removal or death, the term of office of a Director expires at the end of the annual general meeting held during the year in which the Director’s term of office expires.
Chairman. The Board of Directors elects a Chairman from among its members and may elect one or more Vice Chairmen. The Chairman ceases to perform his duties no later than the end of the annual general meeting of shareholders held in the year during which the Chairman reaches 65 years of age. The Board of Directors may, during the next annual general meeting, on one or more occasions, extend this age limit by up to five years. The Chairman represents the Board of Directors. He organizes and directs the activities of the Board and reports thereon to shareholder meetings. He ensures the proper functioning of Company bodies and, in particular, that all directors are in a position to fulfill their duties.
Decisions of the Board of Directors. Directors are convened to meetings of the Board by the Chairman, or if he is unable to do so, by a Vice-Chairman. Where a meeting has not been called in over two months, a minimum of one-third of Directors may ask the Chairman to call a meeting to discuss a specific agenda. The Chief Executive Officer may also ask the Chairman to call a meeting of the Board of Directors to discuss a specific agenda. Decisions are made in accordance with the quorum and majority requirements provided for by applicable law. In the event of a split vote, the meeting chairman has the power to cast the final deciding vote.
Transactions between Us and Our Directors. Any agreement between us and any one of the members of the Board of Directors that is not in the ordinary course of our business is subject to the prior authorization of the Board of Directors. The same applies to agreements between us and another company if one of the members of the Board of Directors is the owner, general partner, manager, director, general manager or member of the executive or supervisory board of the other company. Moreover, any agreement entered into between us and any shareholder holding more than 10% of the voting rights, or in case of a corporation, the company controlling the latter according to Article L. 233-3 of the French Commercial Code, is subject to the same procedure. The director, executive officer or the company concerned must (i) inform the Board of Directors of the agreement and (ii) obtain its approval. The director must inform the Board of Directors of the agreement and obtain its approval.
147
The Chairman of the Board of Directors must inform the statutory auditors of the existence of the agreement and the shareholders’ general meeting must then vote on a special report prepared by the statutory auditors concerning the agreement. If the shareholders’ meeting refuses to approve the agreement, third parties may still rely on it, but the director may be held liable to the Company for any loss the Company may incur under the agreement. The party to the agreement may not participate either in the vote of the Board of Directors, nor in the vote of the shareholders’ meeting. In addition, the shares of the party to the agreement are not counted for the quorum and majority.
Directors’ Compensation. The aggregate compensation of the Board of Directors is determined at the general meeting of the shareholders. The Board of Directors then allocates this compensation among its members. It may allocate exceptional compensation to some of its members for assignments or mandates entrusted to them.
Directors’ Age Limits. The number of Directors having reached age 70 may not at any time exceed one third of the total number of Directors in office. When the number of Directors cannot be divided exactly by three, the result is rounded up.
Directors’ Share-Ownership Requirements. Each member of the Board of Directors must own at least two thousand of our shares.
Rights, Preferences and Restrictions relating to Shares
We currently have one class of shares, consisting of ordinary shares with a nominal value of €2 per share. Thestatuts provide that fully paid shares may be held in registered or bearer form. Shares not fully paid may be held in registered form only. The rights, preferences and restrictions attaching to the shares are as follows:
Dividend Rights. We may distribute dividends to our shareholders from net income in each fiscal year (after deductions for depreciation and provisions), as increased or reduced by any profit or loss carried forward from prior years and as reduced by the legal reserve fund allocation described below, and after payment of the initial dividend described below. These distributions are subject to the requirements of French law.
Under French law, we are required to contribute a minimum of 5% of our annual net income in each fiscal year, after reduction for losses carried forward from previous years, if any, to a legal reserve fund. This minimum contribution is no longer required if and so long as we maintain a legal reserve equal to 10% of the aggregate nominal value of our issued share capital. The legal reserve is distributable only upon our liquidation. The remaining net income, increased by any profits carried forward, constitutes the distributable profits.
From this distributable profits, we are required to pay an initial dividend equal to 5% of the nominal value of shares fully paid-up and not redeemed.
On the recommendation of the Board of Directors, the shareholders may decide to allocate all or part of any distributable profits remaining after payment of the initial dividend to carry them forward to the next fiscal year as retained earnings, or to allocate them to the creation of reserves, to contingency funds for the purpose of total or partial redemption of SUEZ shares, or to the shareholders as additional dividends. The Board of Directors may propose a dividend for approval by the shareholders at the annual general meeting.
We must distribute dividends to our stockholderspro rata according to their shareholdings. Dividends are payable to holders of shares outstanding on the date of the shareholders’ meeting approving the distribution of dividends, or, in case of interim dividend, on the date the Board of Directors meets and approves the distribution of interim dividends. The actual dividend payment date is decided by the shareholders at an ordinary general meeting or by the Board of Directors, if no decision is taken by the shareholders. We must pay any dividends within nine months of the end of the fiscal year unless otherwise authorized by court order. Under French law, dividends not claimed within five years of the date of payment are forfeited.
148
The general meeting ruling on the accounts of the financial year may grant each shareholder a choice between payment of the dividend in cash or in shares, for all or for part of the dividend, according to the procedures set out under French law.
Voting Rights. Subject to the limitations on voting rights described below under “Shareholders’ Meetings” and “Disclosure of Shareholdings”, each holder of shares is entitled to one vote per share at any general meeting of our shareholders. A double voting right is granted to holders of fully paid-up registered shares when those shares have been registered for more than two years in the name of one and the same shareholder. Any share the ownership of which is transferred (certain intra-family transactions excepted), or converted into a bearer share, loses the right to a double vote. Votes can be cast by proxy or by mail. Proxies can only be exercised by the shareholder’s spouse or by another shareholder.
Rights in the Event of Liquidation. In the event that we are liquidated, our assets remaining after payment of our debts, liquidation expenses and all of our remaining obligations will be distributed to repay in full the nominal value of our shares. Any surplus will then be distributedpro rataamong our shareholders.
Preferential Right of Subscription. Under French law, shareholders have preemptive rights to subscribe for cash issuances of new shares or other securities giving rights, directly or indirectly, to acquire additional shares on apro ratabasis. Preemptive rights in connection with specific offerings can be waived by individual shareholders, or can be suppressed by a decision of an extraordinary general meeting of shareholders. Preemptive subscription rights, if not previously waived, are transferable during the subscription period relating to a particular offering of shares and may be listed on Euronext. In the event of an increase in our share capital by capitalization of profits, reserves or additional paid-in capital, double voting rights are conferred from issuance on registered shares allotted for no consideration to shareholders in respect of existing shares which benefited from double voting rights.
Liability to further Capital Calls. Shareholders are liable for corporate liabilities only up to the nominal amount of the shares they hold.
Changes to Shareholders’ Rights
A two-thirds majority vote of the extraordinary shareholders’ meeting is required to change ourstatuts, which set out the rights attaching to our shares. The extraordinary shareholders’ meeting may not increase shareholders’ obligations, except in the event that different classes of shares are merged. However, any decision involving a change in the rights attaching to a class of shares shall be final only following its ratification by a two-thirds majority of a special meeting of the shareholders of the class concerned.
Shareholders’ Meetings
In accordance with French law, there are two types of shareholders’ general meetings: ordinary and extraordinary. Ordinary general meetings are required for matters such as the election of directors, the appointment of statutory auditors, the approval of annual accounts, the declaration of dividends, the issuance of debt and the authorization for the issuer to trade in its own shares. Extraordinary general meetings are required for the approval of matters such as amendments to ourstatuts, approval of mergers, increases or decreases in share capital, the creation of a new class of equity securities and the authorization of the issuance of investment certificates or securities convertible or exchangeable into equity securities.
Convocation of Meetings. The Board of Directors is required to convene an annual ordinary general meeting of shareholders, which must be held within six months of the end of our fiscal year, to approve our Consolidated Financial Statements for the fiscal year. This period may be extended by the President of theTribunal de Commerce. Other ordinary or extraordinary general meetings may be convened at any time during the year. Meetings of shareholders may be convened by the Board of Directors or, if the Board of Directors fails
149
to call such a meeting, by our statutory auditors or by a court-appointed agent. The court may be requested to appoint an agent (i) by one or more Shareholders holding in the aggregate at least 5% of the share capital of the Company, (ii) by any interested party in cases of emergency, (iii) by certain duly qualified associations of shareholders who have held their Shares in registered form for at least two years and who together hold at least 5% of the voting rights of the Company, or (iv) by the workers’ committee in cases of emergency. The notice calling such meeting must state the matter to be considered at such meeting.
At least 30 days prior to the date set for any general meeting of shareholders, a preliminary notice must be sent to theAutorité des Marchés Financiers(the French financial market authority) (the “AMF”), the administrative agency responsible for overseeing the French securities markets, and published in France in theBulletin des Annonces Légales Obligatoires(bulletin of obligatory legal announcements) (the “BALO”). The AMF also recommends that the preliminary notice be published in a newspaper of national circulation in France. This preliminary notice must contain the agenda of the meeting and a draft of the resolutions to be considered. Within 10 days of the notice, one or several shareholders holding a specified percentage of shares (determined on the basis of a formula relating to capitalization), the workers committee in cases of emergency or a duly qualified association of shareholders holding a specified percentage of voting rights may propose additional resolutions to be voted on at the meeting. At least 15 days prior to the date set for a general meeting on first call, and at least six days before any second call, a final notice must be sent by mail to all holders of registered shares who have held such shares for more than one month prior to the issuance of the preliminary notice. Notice of the meeting shall also be given in a journal authorized to publish legal announcements in the administrative district (département) in which we are registered, as well as in theBALO, with prior notice to the AMF. The notice must state, among other things, the type, agenda, place, date and time of the meeting. No action may be taken at a meeting on any matter not listed on the agenda for that meeting, subject to exceptions relating to the dismissal of directors under certain circumstances and to certain miscellaneous matters.
Attendance of and Voting at Meetings. Attendance and the exercise of voting rights at general meetings of shareholders are subject to certain conditions. A holder of registered shares must have his shares registered in his own name in a shareholder account maintained by us or on our behalf at least one day prior to the meeting. A holder of shares in bearer form must obtain from the financial intermediary with whom the shares have been deposited a certificate indicating the number of bearer shares owned and attesting that the shares are not transferable until the time fixed for the meeting.
All shareholders who have properly registered their shares have the right to participate in general meetings, either in person or by proxy, and to vote either by proxy or by mail according to the number of shares they hold. Proxies will be sent to any shareholder on request, but can only be exercised by the shareholder’s spouse or another shareholder. Shareholders may submit a proxy or correspondence voting form on paper or, subject to a decision by the Board of Directors published in the notice of meeting, by remote transmission, in accordance with the terms and conditions set by law and regulations.
Under French company law, treasury stock and/or shares of a company held by entities controlled directly or indirectly by that company are not entitled to voting rights, are not counted for quorum or majority purposes, and do not receive dividends.
Under French law, the presence in person or by proxy of shareholders holding an aggregate of not less than 25% (in the case of an ordinary general meeting or an extraordinary general meeting deciding upon any capital increase by incorporation of reserves) or 331/3 % (in the case of any other extraordinary general meeting) of the voting shares is necessary for a quorum. If a quorum is not reached at any meeting, that meeting is adjourned. There is no quorum requirement upon recommencement of an adjourned ordinary general meeting. Upon recommencement of an extraordinary general meeting, the presence in person or by proxy of shareholders having not less than 25% of the eligible voting rights is necessary for a quorum, except when an increase in our share capital is proposed through the incorporation of reserves, profits or a share premium, in which case the quorum requirements are those applicable to ordinary general meetings.
150
At an ordinary general meeting or at an extraordinary general meeting deciding upon any capital increase by incorporation of reserves, a simple majority of the votes cast is required to pass a resolution. At any other extraordinary general meeting, a two-thirds majority of the votes cast is required. However, a unanimous vote is required to increase the liabilities of shareholders. Abstention from voting by those present or represented by proxy but not voting is deemed to be a vote against the resolution submitted to a vote.
Limitation on Security Ownership and Holding of Shares
There is no limitation, under French law or in ourstatuts, on the right of non-French residents or non-French security holders to own, or where applicable, to vote our securities.
In accordance with French law concerning dematerialization (dématérialisation) of securities, shareholders’ ownership rights are not represented by physical certificates but by book entries in equity securities accounts.
The Company maintains an account with Euroclear France S.A., the French clearing house system, with respect to each class of equity securities in registered form (the “Company Account”), which is administered by Crédit Agricole Indosuez acting on our behalf as our agent. Equity securities held in registered form are registered in a separate account for each holder (the “Holder Account”), either directly, or, at the holder’s request, through such holder’s accredited intermediary. Each Holder Account shows the name of the holder and its holdings and, in the case of equity securities registered through an accredited intermediary, shows that they are so held. We issue confirmations as to holdings of equity securities registered in the Holder Account to the persons in whose names the holdings are registered, but these confirmations do not constitute documents of title.
In the case of shares held in bearer form, the shares are held on the shareholder’s behalf by an accredited intermediary and are registered in an account maintained by the accredited intermediary with Euroclear France S.A., separate from the Company Account. Shares held in this manner are referred to as being in bearer form. Each accredited intermediary maintains a record of shares held through it and will issue certificates of registration in respect thereof. Transfers of shares held in bearer form may only be effected through accredited intermediaries and Euroclear France S.A.
According to the French Commercial Code, shares owned by any non-French resident may be held on the shareholder’s behalf in a collective account or in several individual accounts by an intermediary. The intermediary must declare that it is acting as an intermediary and may be requested by the Company to provide the identity of the shareholders on whose behalf it is acting. Failure to declare that it is acting as an intermediary or the provision of inaccurate or incomplete information about the beneficial owner can result in the deprivation of the right to vote and the right to receive dividends.
Our by-laws permit, in accordance with the applicable legislation, the use of the procedure known astitres au porteur identifiables, according to which Euroclear France S.A. will, upon the Company’s request, disclose a shareholder’s name, date of birth (or, in the case of a legal person, name and date of organization), nationality, address and the amount of securities (including ADSs) held by the shareholder which have, or may in the future acquire, voting rights, and, as the case may be, the restrictions that might apply to these securities.
Pursuant to applicable law, the accredited intermediary which holds shares in bearer form on behalf of a Shareholder must transmit the above requested information to Euroclear France within a specific timeframe as provided in the relevant regulation. Within 5 days after such transmission, the information is provided by Euroclear France to us.
If the accredited intermediary does not transmit the requested information in due time or transmits incomplete or inaccurate information pertaining to its status or to the holders of the securities, the voting rights of the securities giving immediate or future access to the share capital of the Company for which the accredited intermediary is registered cannot be exercised until such date as the identity of the relevant security holder has been disclosed or rectified, and the payment of the corresponding dividend is postponed until such date.
151
In addition, if the accredited intermediary knowingly fails to comply with the obligation to disclose the identity of the relevant security holder, a court may, at our request or one or several shareholders representing at least 5% of our share capital, deprive the shares held by the security holder whose identity was not disclosed from any voting rights and dividends, for a period not to exceed 5 years.
Change in Control
There are no provisions in thestatuts that would have the effect of delaying, deferring or preventing a change in our control and that would operate only with respect to a merger, acquisition or corporate restructuring involving us, or any of our subsidiaries.
Disclosure of Share Holdings
French law provides that if any individual or entity, acting alone or in concert with others, acquires, directly or indirectly, more than 5%, 10%, 20%, 33 1/3%, 50% or 66 2/3% of our outstanding share capital (including ADSs, or of the voting rights attached thereto (unless such individual or entity holds the total number of voting rights in the Company)), or if an individual or entity’s holdings fall below any such level, then the individual or entity must notify us within 15 calendar days of the date such threshold has been crossed, of the number of Shares (and the voting rights attached thereto) and the number of ADSs which it holds, individually or in concert with others. Such individual or entity must also notify theAutorité des Marchés Financiers (“AMF”) within five Euronext Paris trading days of the date such threshold has been crossed. Those requirements also apply to registered intermediaries which hold Shares on behalf of Shareholders who are not French residents.
Additional reporting requirements are imposed on acquirors of more than 10% or 20% of the share capital of the Company, or of our voting rights at the Shareholders’ Meetings, under French law and COB Regulation n°88-02. An acquiror must file a report (déclaration) within 15 days of the date it crosses the threshold with the Company, the AMF (which will publish the report) specifying its intentions for the 12-month period following acquisition of its stake, including whether or not it intends (i) to continue its purchases, (ii) to acquire control of the company in question or (iii) to seek nomination to the Board of Directors. The acquiror may amend its stated intentions, provided that it does so on the basis of significant changes in its own situation or shareholding. Upon any change of intention, it must file a new report.
These requirements also apply to registered intermediaries which hold Shares on behalf of Shareholders who are not French residents. Under AMF regulations, and subject to limited exemptions granted by the AMF, any person or persons acting in concert owning in excess of 33 1/3% of the share capital or voting rights of a French company listed on thePremier Marchémust immediately inform the AMF and initiate a public tender offer for the balance of the Shares and other securities giving access to the share capital or to voting rights of such company which conforms with the requirements of the AMF.
In addition, the our by-laws provide that any person acting alone or in concert with others who becomes the owner of at least 1%, or any multiple thereof, of our outstanding share capital or voting rights (including ADSs) must notify us by registered mail, return receipt requested, within 15 calendar days of the date such threshold has been crossed of the number of Shares and ADSs or voting rights it holds. The same notification requirement applies if any person acting alone or in concert with others falls below such 0.5% threshold, or passes or falls below any multiple thereof. Those requirements also apply to registered intermediaries which hold shares on behalf of shareholders who are not French residents.
In order to permit holders or intermediaries to give the required notice, we must publish in the BALO, not later than 15 calendar days after the annual Ordinary General Meeting of Shareholders, information with respect to the total number of voting rights outstanding as of the date of such meeting. In addition, if the number of outstanding voting rights changes by 5% or more between two annual ordinary general meetings, we must publish in the BALO, within 15 calendar days of such change, the number of voting rights outstanding and transmit such information to the AMF.
152
In order to facilitate compliance with the above-mentioned notification requirements imposed by law or by the Company’s by-laws, a holder of ADSs may deliver any such notification to our Depositary and the Depositary shall, as soon as practicable, forward such notification to us and, if necessary, to the AMF.
In the event of failure to comply with the legal notification requirements, the shares or voting rights in excess of the relevant threshold will be deprived of voting rights for all shareholders’ meetings until the end of a two-year period following the date on which the owner thereof complies with the notification requirements. In addition, any shareholder who fails to comply with these requirements may have all or part of its voting rights suspended by the Commercial Court at the request of our Chairman, any shareholder or the AMF for a maximum period of 5 years, and may be subject to a €18,000 fine.
In the event of failure to comply with the notification requirements provided by our by-laws, one or more shareholders holding 5% or more of our share capital or voting rights may require a meeting of the shareholders to deprive the shares in excess of the relevant threshold of voting rights for all shareholders’ meetings for two years following the date on which the owner complies with such notification requirements.
If the accredited intermediary which holds shares on behalf of a shareholder who is not a French resident does not comply with the above mentioned legal notification requirement, the voting rights of the shares for which the accredited intermediary is registered cannot be exercised until such date as the notification requirement has been met and the payment of the corresponding dividend is postponed until such date.
In addition, if the accredited intermediary knowingly fails to comply with such notification requirement, a court located in the jurisdiction of our headquarters may, at our request or one or several shareholders representing at least 5% of our share capital, deprive the shares in excess of the relevant threshold of voting rights, and possibly dividends, for a period not to exceed 5 years.
Prior to any transfer on Euronext Paris of shares held in registered form, such shares must be registered in an account maintained by an accredited intermediary. Dealings in shares are initiated by the owner giving instructions (through an agent, if appropriate) to the relevant accredited intermediary. For dealings on Euronext Paris, animpôt sur les opérations de Bourse, or tax assessed on the price at which the securities were traded, is payable by French residents, at a rate of 0,3% on transactions up to €153,000 and at a rate of 0,15% thereafter, subject to a rebate of €23 per transaction and maximum assessment of €610 per transaction. Non-residents of France are generally not subject to the payment of suchimpôt sur les opérations de Bourse. In addition, a fee or commission is payable to the French broker, accredited intermediary or other agent involved in the transaction (whether within or outside France). No registration duty is normally payable in France, unless a transfer instrument has been executed in France.
An owner of shares who resides outside of France may trade shares on Euronext Paris. If the owner, or the broker or other agent through whom a sale is effected, requires assistance in this connection, an accredited intermediary should be contacted.
Changes in Capital
Pursuant to French law, our share capital may be increased only with the approval of the shareholders at an extraordinary general meeting upon the recommendation of the Board of Directors. Our share capital may be increased by the issuance of additional shares, by the issuance of a new class of equity securities or by an increase in the nominal value of existing shares. The shareholders may delegate to the Board of Directors the powers required to effect in one or more stages (subject to the limitations provided by French law) any increase in share capital previously authorized by the shareholders.
Our share capital may be decreased only with the approval of the shareholders at an extraordinary general meeting. A reduction in our share capital can be accomplished either by decreasing the nominal value of the shares or by reducing the number of outstanding shares. The number of outstanding shares may be reduced either by an exchange of shares or by our repurchase and cancellation of shares.
153
Each time the shareholders decide a capital increase or decide to delegate to the Board of Directors the right to carry out a capital increase, they must also decide whether or not to proceed with a capital increase reserved for our employees and our subsidiaries and whether or not to delegate to the Board of Directors the right to carry out such reserved capital increase.
C. Material Contracts
By resolution, our Board of Directors has set its executive officer (mandataires sociaux) compensation for 2003 at the same level as in 2002 and has provided that variable compensation will be based on the gross operating income, net current results and certain debt and cost reduction and cash flow criteria of our three global businesses. The resolution related to these compensation terms is attached hereto as Exhibit 4.5.
D. Exchange Controls
Under French foreign exchange control regulations, there are no limitations on the import or export of capital or on the amount of payments that may be remitted by us to non-residents. French laws and regulations concerning foreign exchange control do require, however, that all payments or transfers of funds (including payments of dividends to foreign shareholders) made by a French resident to a non-resident be handled by an accredited intermediary. In France, all registered banks and substantially all credit establishments are accredited intermediaries.
E. Taxation
French Taxation of Non-U.S. Holders
The following is a general summary of the material French tax consequences of purchasing, owning and disposing of shares or ADSs to a beneficial owner thereof that is neither a resident of France under French tax law nor a U.S. Holder (as defined below). The summary relating to French tax laws set out below is based on the laws in force as of the date hereof, and is subject to any changes in applicable French tax laws or in any applicable double taxation conventions or treaties with France occurring after such date.
This discussion is intended only as a descriptive summary and does not purport to be a complete analysis or list of all potential tax effects of the purchase or ownership of the shares and of the ADSs or a comprehensive description of all of the tax considerations that may be important for your decision to purchase shares or ADSs.
There is currently no direct simplified procedure available for holders of ADSs who are not U.S. Holders to claim or receive from the French tax authorities any tax treaty benefits in respect of dividends that the holder may be entitled to receive pursuant to a treaty between France and the holder’s country of residence.
The following summary does not discuss the treatment of shares or ADSs that are held in connection with a permanent establishment or fixed base through which a holder carries on business or performs personal services in France.
As a general matter, we encourage you to consult your own tax advisers as to the tax consequences of the purchase, ownership and disposition of shares or ADSs arising from your particular circumstances and the specific laws applicable to you, including the availability and terms of any applicable tax treaty.
Taxation on Sale or Disposal of Shares or ADSs
Persons who are not French residents for the purpose of French taxation (as well as, under certain conditions, foreign states, international organizations and certain foreign public bodies) and who – in the case of natural persons alone or with their parents – have held not more than 25%, directly or indirectly, of our dividend rights (bénéfices sociaux) at any time during the preceding five years, are not subject to any French income tax or capital gains tax on any sale or disposal of shares or ADSs.
154
If a share transfer is evidenced by a written agreement, such share transfer or ADS transfer agreement is, in principle, subject to registration formalities and therefore to a 1% registration duty assessed on the higher of the purchase price and the market value of the shares or ADSs, as the case may be, (subject to a maximum assessment of €3,049 per transfer) provided that no duty is due if such written share transfer or ADS transfer agreement is executed outside France.
Taxation of Dividends
In France, dividends are voted by the annual shareholders’ general meeting and paid out after tax income. French residents are entitled to a tax credit, known as theavoir fiscal, equal to 50% of the dividend paid for individuals and for certain entities or, for other entities, to 10% of the dividend paid. In general, a French resident using anavoir fiscal amount at a 10% rate may be entitled, under specified circumstances, to an additionalavoir fiscal amount of up to that shareholder’s allocable portion of an amount equal to 80% of theprécompte, as defined below (if any).
Please note that the Finance Bill of 2004 significantly reforms the French distribution regime. In brief, theavoir fiscal would be abolished for dividends paid as from January 1st, 2005. For dividends paid in 2004, restrictions to the transfer of theavoir fiscal would apply to certain categories of shareholders.
In this discussion, any references toavoir fiscal will include a reference to additionalavoir fiscal amounts (if any).
Under French domestic law, dividends paid to non-residents are normally subject to a 25% withholding tax and non-residents are generally not eligible for the benefit of theavoir fiscal.
However, the following countries and territories (including Overseas Territories) have entered into income tax treaties with France whereby tax residents of such countries and territories may, as provided in the relevant treaty, obtain from the French tax authorities a reduction (generally to 15%) of all or part of such withholding tax and a refund of theavoir fiscal(net of applicable withholding tax).
| | | | | | |
Australia | | Iceland | | Mauritius | | Sweden |
Austria | | India | | Mexico | | Switzerland |
Belgium | | Israel | | Namibia | | Togo |
Bolivia | | Italy | | Netherlands | | Turkey |
Brazil | | Ivory Coast | | New Zealand | | Ukraine |
Burkina Faso | | Japan | | Niger | | United Kingdom |
Cameroon | | Latvia | | Norway | | United States of America |
Canada | | Lithuania | | Pakistan | | Venezuela |
Estonia | | Luxembourg | | Senegal | | |
Finland | | Malaysia | | Singapore | | |
Gabon | | Mali | | South Korea | | |
Ghana | | Malta | | Spain | | |
Overseas Territories and Other
New Caledonia
Saint-Pierre et Miquelon
Mayotte
Treaties with some of the countries and territories listed above contain specific limitations applicable to corporate entities entitled to benefit from theavoir fiscal, or limit the rights to theavoir fiscal strictly to individual residents (as opposed to corporate entities). Except for the United States, none of the countries or
155
territories listed above has a treaty granting benefits to holders of ADSs, as opposed to shares. Accordingly, this discussion of treaty benefits does not apply to ADS holders. Certain countries, other than those listed above, have entered into income tax treaties with France that provide for a reduction of withholding tax without a refund of theavoir fiscal.
Dividends paid to non-residents of France benefiting from theavoir fiscal in accordance with a tax treaty will be subject, on the date of payment, to the withholding tax at the reduced rate provided for by such treaty rather than to the French withholding tax at the rate of 25% to be later reduced to the treaty rate,provided that they establish, before the date of payment of the dividend, their entitlement to such reduced rate.
Amounts distributed as dividends by French companies out of profits which have not been taxed at the ordinary corporate income tax rate, or which have been earned and taxed more than five years before the distribution, are subject to aprécompte(or prepayment) by such companies. Theprécompteis paid by the distributing company to the French tax authorities and is equal to a maximum of 50% of the net dividend before withholding tax. When the distribution is deducted from the Special Reserve for long-term capital gains (“Réserve Spéciale des Plus-Value à Long Terme”), theprécompte due is capped; it is equal to the difference between 33.33% and the reduced corporate income tax rate initially used to tax the capital gains object of the Reserve.
When a tax treaty in force does not provide for a refund of theavoir fiscalor when the nonresident investor is not entitled to such refund but is otherwise entitled to the benefits of a tax treaty, such investor may generally obtain from the French tax authorities a refund of its allocable portion of suchprécompteactually paid in cash by us, if any (net of applicable withholding tax). When the distribution is deducted from the Special Reserve for long-term capital gains, this refund is however disallowed. In such a case, no additionalavoir fiscal amount is attributable to the shareholders entitled to the standardavoir fiscal.
Since the dividend distributed by SUEZ in 2004 is entirely deducted out of its Special Reserve for long-term capital gains, theprécompte paid in 2004 will not be refundable nor will any additionalavoir fiscal be transferred.
Please note that the Finance Bill of 2004 abolishes theprécompte for distribution paid as from January 2005 but introduces a one-off levy of 25% of the net amount of distributions made in 2005 out of untaxed profits. This levy would be creditable against the corporate income tax of the distributing company or refunded by third for each of the three following years. Therefore, the dividends distributed by SUEZ in 2004 should be the last one subject to the payment of theprécompte. In addition, we believe that we will be subject to the payment of the 25% levy on our distribution in 2005, but should have this sum reimbursed by the end of 2008.
Payments to shareholders which do not qualify as a dividend under French company law, such as liquidation surpluses, payments resulting from a share buy-back procedure and exceptional distributions corresponding to a partial allocation of assets, do not give rise to anavoir fiscal or to the transfer of theavoir fiscal even if provided by an income tax treaty.
Estate and Gift Tax
France imposes estate and gift tax on certain real and personal property acquired by inheritance or gift from a nonresident of France if such property is deemed to be situated in France. France has entered into estate and gift tax treaties with a number of countries pursuant to which, assuming certain conditions are met, residents of the treaty countries may be exempted from such tax or obtain a tax credit. Prospective investors in shares or ADSs should consult their own advisers concerning the applicability of French estate and gift tax to their shareholding and the availability of, and the conditions for claiming exemption under, such a treaty.
Wealth Tax
In the absence of a more favorable tax treaty, the French wealth tax (impôt de solidarité sur la fortune) does not apply to non-French resident individual investors owning directly or indirectly less than 10% of our capital stock.
156
U.S. Federal Income Taxation and French Taxation of U.S. Holders
The following discussion describes the material U.S. federal income tax and French tax consequences of the acquisition, ownership and disposition of ADSs or shares by a U.S. Holder (as defined below).
This discussion is based in part on representations of the depositary and assumes that each obligation provided for in or otherwise contemplated by the deposit agreement or any other related document will be performed in accordance with its terms. In general, for U.S. federal income tax purposes, a U.S. Holder of ADRs evidencing ADSs will be treated as the holder of the shares represented by the ADSs. The U.S. Treasury has expressed concerns that parties to whom ADSs are pre-released may be taking actions that are inconsistent with the claiming of foreign tax credits by U.S. Holders of ADSs. Such actions would also be inconsistent with the claiming of the reduced rate of tax applicable to dividends received by certain non-corporate U.S. holders, as described below. Accordingly, the analysis of the creditability, for U.S. federal income tax purposes, of French taxes described below, and the availability of the reduced tax rate for dividends received by certain non-corporate U.S. Holders, could be affected by future actions that may be taken by the parties to whom the ADSs are released.
This discussion assumes that we were not a passive foreign investment company for 2003, as described below. This discussion is not a complete analysis or description of all potential tax consequences to a U.S. Holder of owning ADSs or shares. It deals only with ADSs or shares held as capital assets by persons who own less than 10% of our capital and does not discuss the tax consequences applicable to all categories of investors, some of which (such as dealers in securities and investors whose functional currency is not the U.S. dollar) may be subject to special rules. In addition, this discussion does not address U.S. federal income tax consequences to U.S. Holders that are exempt from U.S. federal income taxation.
Prospective investors are advised to consult their own tax advisers concerning the application of the federal income tax laws, French tax laws and the Treaty, as defined below, to their particular situations as well as any tax consequences arising under the laws of any state, local or foreign taxing jurisdiction.
The discussion of United States and French tax laws set forth herein is based on the laws in force as of the date hereof, including the U.S. Internal Revenue Code of 1986, as amended, the FrenchCode Général des Impôtsand the regulations enacted thereunder, the Convention between the Government of the United States of America and the Government of the French Republic for the Avoidance of Double Taxation and the Prevention of Fiscal Evasion with Respect to Taxes on Income and Capital of August 31, 1994, referred to as the Treaty, and anInstructiondated May 13, 1994 and released on June 7, 1994 by the French tax authorities relating to the withholding tax on dividends in favor of non-residents entitled to theavoir fiscalpursuant to a tax treaty, referred to as the “June 1994 Regulations”. The June 1994 Regulations change the French withholding tax rules applicable to dividends to which anavoir fiscal is associated and may affect the timing of payments to non-residents of France that are entitled to treaty benefits. Changes to applicable laws may affect the tax consequences described herein, possibly with retroactive effect.
As used herein, the term “U.S. Holder” means a beneficial owner of ADSs or shares who or that is entitled to Treaty benefits under the “limitation on benefits” provisions contained in the Treaty and is, for U.S. federal income tax purposes:
| | • | a citizen or resident of the United States; |
| | • | a corporation, or other entity taxable as a corporation, created or organized under the laws of the United States or any political subdivision thereof; or |
| | • | an estate or trust, the income of which is subject to U.S. federal income taxation regardless of its source. |
If a partnership holds ADSs or shares, the tax treatment of a partner generally will depend upon the status of the partner and the activities of the partnership. A partner in a partnership that holds ADSs or shares is urged to consult its own tax advisor regarding the specific tax consequences of owning and disposing of the shares.
157
Holders of ADSs or shares that are not U.S. Holders, but that would be U.S. Holders in the absence of the “limitations on benefits” provisions contained in the Treaty, are urged to consult their own tax advisors concerning the U.S. federal income tax, French tax and other tax consequences of the acquisition, ownership and disposition of ADSs or shares.
Taxation of Dividends
Withholding tax/avoir fiscal. In France, dividends are voted by the annual shareholders’ general meeting and paid out of after tax income. French residents are entitled to a tax credit, known as theavoir fiscal, equal to 50% of the dividend paid for individuals and for certain entities or, for other entities, to 10% of the dividend paid. In general, a French resident using anavoir fiscal amount at a 10% rate may be entitled, under specified circumstances, to an additionalavoir fiscal amount of up to that shareholder’s allocable portion of an amount equal to 80% of theprécompte(if any) that we have paid. In this discussion, any references to avoir fiscalincludes a reference to additionalavoir fiscal amounts (if any).
By application of the Finance bill of 2004, the dividend distributed in 2004 to:
| | • | individuals would continue to benefit from anavoir fiscal equal to 50%; |
| | • | legal entities with a participation lower than 5% would no longer benefit from anyavoir fiscal; |
| | • | legal entities with a participation of at least 5% should still be entitled to anavoir fiscal; |
| | • | pension funds would most probably lose their right to theavoir fiscal. |
Under French domestic law, dividends paid to non-residents are normally subject to a 25% withholding tax and non-residents are generally not eligible for the benefit of theavoir fiscal.
Under the Treaty, the rate of French withholding tax on dividends paid to a U.S. Holder whose ownership of ADSs or shares is not effectively connected with a permanent establishment or a fixed base in France is reduced to 15%. Dividends paid to an Eligible U.S. Holder and an Eligible Tax Exempt Holder, each as defined below, will be subject to the reduced rate of 15% at the time of payment, provided that such holder establishes before the date of payment that such holder is a resident of the United States under the Treaty in accordance with the procedures described below. An Eligible U.S. Holder would also be entitled to a payment equal to theavoir fiscal, less a 15% withholding tax. As noted below, such payment will not be made to an Eligible U.S. Holder until after the close of the calendar year in which the dividend was paid, and only upon receipt by the French tax authorities of a claim made by the Eligible U.S. Holder for such payment in accordance with the procedures set forth below.
An Eligible U.S. Holder is a U.S. Holder whose ownership of ADSs or shares is not effectively connected with a permanent establishment or fixed base in France and who is (1) an individual (other than an Individual Holding Shares in a Retirement Plan, as defined below) or other noncorporate holder that is a resident of the United States as defined pursuant to the provisions of the Treaty, (2) a United States corporation, other than a regulated investment company, or (3) a United States corporation which is a regulated investment company, provided that less than 20% of its shares are beneficially owned by persons who are neither citizens nor residents of the United States. In addition, a reference to an Eligible U.S. Holder includes a partnership or trust which is treated as a resident of the United States as defined pursuant to paragraph 2(b)(iv) of Article 4 of the Treaty and for which the ownership of ADSs or shares is not effectively connected with a permanent establishment or fixed base in France, but only to the extent that its partners, beneficiaries or grantors would qualify under clause (1) or (2) of the preceding sentence.
Payment of theavoir fiscalis made by the French Treasury not earlier than the January 15 following the close of the calendar year in which the related dividend is paid, and only after receipt by the French tax administration of a claim for such payment in accordance with the procedures described below. However, there
158
are certain limitations on the availability of theavoir fiscal under the Treaty. First, the avoir fiscalis generally only granted if the Eligible U.S. Holder is subject to U.S. federal income tax on both the dividend and theavoir fiscal. Second, a partnership or a trust (other than a pension trust, a real estate investment trust or a real estate mortgage investment conduit) in its capacity as an Eligible U.S. Holder is entitled to theavoir fiscalonly to the extent that its partners, beneficiaries or grantors, as applicable, are themselves Eligible U.S. Holders and are themselves subject to U.S. federal income tax on their respective shares of both the dividend and theavoir fiscal. Third, the Eligible U.S. Holder, where required by the French tax administration, must show that it is the beneficial owner of the ADSs or shares and that the holding of such ADSs or shares does not have as one of its principal purposes to allow another person to take advantage of the grant of theavoir fiscal under the Treaty.
A sample computation of theavoir fiscal and of the withholding tax for qualifying Eligible U.S. Holders that are individuals is the following:
| | | | |
| | | Eligible U.S. Holder that is
an individual
| |
Company’s dividend per ADS | | $ | 100 | |
Withholding rate under Treaty | | | 15 | % |
Amount withheld | | | (15 | ) |
Company’s dividend received for 2004 | | | 85 | |
Avoir fiscal | | | 50 | |
Withholding rate under Treaty | | | 15 | % |
Amount withheld on avoir fiscal | | | (7.5 | ) |
Avoir fiscal payable by French Government after January 15, 2005 | | | 42.5 | |
Net dividend before U.S. tax | | | 127.5 | |
Under the Treaty, special rules apply to (1) any “Eligible Pension Fund”, which is a tax-exempt entity established in, and sponsored or established by a resident of, the United States (pursuant to the provisions of the Treaty), the exclusive purpose of which is to provide retirement or employee benefits, (2) any “Eligible Not-For-Profit Organization”, which is a tax-exempt entity organized in the United States, the use of whose assets is limited under U.S. federal or state laws, both currently and upon liquidation, to the accomplishment of the purposes that serve as the basis of its exemption from income taxation in the United States, and (3) any “Individual Holding Shares in a Retirement Plan”, meaning an individual who is a resident of the United States under the Treaty and who owns ADSs or shares through an individual retirement account, a Keogh plan or any similar arrangement. (“Eligible Pension Funds”, “Eligible Not-For-Profit Organizations” and “Individuals Holding Shares in a Retirement Plan” are referred to collectively as “Eligible Tax-Exempt Holders.”)
Provided they are entitled to Treaty benefits under the limitation on benefits provisions in Article 30 of the Treaty, Eligible Tax-Exempt Holders are entitled to receive from the French Treasury a payment equal to 30/85ths of theavoir fiscal(the “partial avoir fiscal”), less a 15% dividend withholding tax on such amount, notwithstanding the general requirement described above that the holder be subject to U.S. tax on both the dividend and theavoir fiscal.
However, by application of the new distribution regime, this right will no longer exist for dividends distributed after January 1st, 2004.
Dividends paid to an Eligible U.S. Holder will be subject to the reduced withholding tax rate of 15% at the time the dividend is paid if (i) such holder duly completes and provides the paying agent with French Treasury Form RF1 A EU-No. 5052 (the “Form”) before the date of payment of the relevant dividend, or (ii) if completion of the Form is not possible prior to the payment of dividends, such holder duly completes and provides the institution in charge of the management of the stock account (établissement gestionnaire du compte-titres) with a simplified certificate (the “Certificate”) stating that:
| • | such holder is a U.S. resident as defined pursuant to the provisions of the Treaty, |
159
| • | such holder’s ownership of the ADSs or shares is not effectively connected with a permanent establishment or fixed base in France, |
| • | such holder owns all of the rights attached to the full ownership of the ADSs or shares, including but not limited to dividend rights, and |
| • | such holder meets all the requirements of the Treaty for obtaining the benefit of the reduced rate of withholding tax and the right to payment of the French avoir fiscal. |
In addition to the procedure described above, when completion of the Form is not possible prior to the payment of a dividend, please note that there are specific requirements regarding:
| • | Eligible U.S. Holders and Eligible Tax-Exempt Holders (other than Eligible Pension Funds and other than regulated investment companies that are described in clause (3) of the definition of Eligible U.S. Holders), to which paragraph 25 of the June 1994 Regulations may apply. |
| • | Eligible Pension Funds, to which paragraphs 26 and 27 of the June 1994 Regulations may apply, and |
| • | regulated investment companies that are described in clause (3) of the definition of Eligible U.S. Holders, to which paragraph 28 of the June 1994 Regulations may apply. |
Dividends paid to a U.S. Holder that is entitled to the reduced withholding tax rate of 15% but that is not entitled to the avoir fiscal (i.e., one that is not an Eligible U.S. Holder) will be subject to the reduced withholding tax rate of 15% at the time the dividend is paid if such holder duly completes and provides the paying agent with French Treasury Form RF1 B EU-No. 5053 (the “Treasury Form”) before the date of payment of the relevant dividend.
Dividends paid to any U.S. Holder that has not filed the relevant completed forms or Certificate before the dividend payment date will be subject to French withholding tax at the rate of 25%. Such holder may claim a refund of the excess withholding tax by completing and providing the French tax authorities with the relevant forms before December 31 of the year following the year during which the dividend is paid.
Theavoir fiscalorpartial avoir fiscal is generally expected to be paid to Eligible U.S. Holders and Eligible Tax-Exempt Holders within 12 months of filing the Form or the Certificate, as appropriate, but not before January 15 following the end of the calendar year in which the related dividend is paid. Similarly, any French withholding tax refund is generally expected to be paid to U.S. Holders within 12 months of filing the Form or the Certificate, but not before January 15 following the end of the calendar year in which the related dividend is paid.
The relevant forms or the Certificate, together with their respective instructions, are available from the United States Internal Revenue Service and at theCentre des Impôts des Non-Résidents(9, rue d’Uzès, 75094 Paris Cedex 2, France). The depositary will provide to all U.S. Holders of ADRs the forms or Certificate, together with the respective instructions, and will arrange for the filing with the French tax authorities of all forms and Certificates completed by U.S. Holders of ADRs and returned to the Depositary within sufficient time.
Précompte. Amounts distributed as dividends, by decision of the Annual Shareholders’ Meeting, by French companies out of profits which have not been taxed at the ordinary corporate income tax rate, or which have been earned and taxed more than five years before the distribution, are subject to a “précompte” (or prepayment) by such companies. Theprécompte is paid by the distributing company to the French tax authorities and is equal to a maximum of 50% of the dividend distributed before withholding tax. Since the dividend distributed by us in 2004 is entirely deducted out of our Special Reserve long-term capital gains, theprécompte paid in 2004 is capped and not refundable.
160
A U.S. Holder not entitled to the fullavoir fiscal may generally obtain, under specified circumstances, a refund from the French tax authorities of that holder’s allocable portion ofprécomptepaid by us with respect to the dividends paid to the holder. Pursuant to the Treaty, the amount of theprécompterefunded to U.S. residents is reduced by the 15% withholding tax applicable to dividends. A U.S. Holder is only entitled to a refund ofprécompteactually paid in cash by us.
A U.S. Holder entitled to the refund of theprécomptemust apply for such refund by filing the Treasury Form before the end of the year following the year in which the dividend was paid. The Treasury Form and its instructions are available from the United States Internal Revenue Service or at theCentre des Impôts des Non-Résidents (9, rue d’Uzès, 75094 Paris Cedex 2, France). The depositary will, upon request, provide to U.S. Holders of ADRs the Treasury Forms, together with the respective instructions, and will arrange for the filing with the French tax authorities of all Treasury Forms completed by U.S. Holders of ADRs and returned to the Depositary within sufficient time.
The gross amount of a dividend (other than certainpro rata distributions of shares or rights to acquire shares to all shareholders) and the amount of theavoir fiscal and/or précompte(if any) paid to a U.S. Holder, including any French withholding tax thereon, will be included in income as ordinary dividend income in the year each such payment is received (which, in the case of a U.S. Holder of ADSs, will be the year of receipt by the depositary) to the extent paid out of our current or accumulated earnings and profits as calculated for United States federal income tax purposes. No dividends received deduction will be allowed with respect to dividends paid by us. The amount of any dividend,avoir fiscal orprécompte paid in euros, including the amount of any French taxes withheld therefrom, will be equal to the dollar value of the euros on the date such dividend oravoir fiscal orprécompte amount is included in income (which, in the case of a U.S. Holder of ADSs, will be the date of receipt by the depositary), regardless of whether the payment is in fact converted into dollars at that time. If the dividend is converted into dollars on the date of receipt by the depositary, in the case of ADSs, or by the U.S. Holder, in the case of shares, a U.S. Holder generally should not be required to recognize foreign currency gain or loss in respect of the dividend income. A U.S. Holder may have foreign currency gain or loss if the euros are not converted U.S. dollars on the date of receipt. Moreover, a U.S. Holder may be required to recognize foreign currency gain or loss, which will generally be U.S. source ordinary income or loss, upon the receipt of a refund of amounts, if any, withheld from dividends in excess of the Treaty rate of 15%.
Subject to applicable limitations, dividends paid to non-corporate U.S. Holders in taxable years beginning before January 1, 2009 will be taxable at a maximum tax rate of 15%. Non-corporate U.S. Holders should consult their own tax advisers to determine the implications of the rules regarding this favorable rate in their particular circumstances.
French withholding tax imposed at the Treaty rate of 15% on dividends paid by us and on any related payment of theavoir fiscal is treated as payment of a foreign income tax and, subject to certain conditions and limitations, may be taken as a credit against the U.S. Holder’s United States federal income tax liability. French taxes withheld in excess of the Treaty rate of 15% will not be eligible for credit against a U.S. Holder’s United States federal income tax liability. For foreign tax credit purposes, dividends (and relatedavoir fiscal amount) will generally constitute foreign source “passive” income, or in the case of certain holders, “financial services” income.
Taxation of Capital Gains
Under the Treaty, no French tax is levied on any capital gain derived from the sale, exchange or other disposition of ADSs or shares by a U.S. Holder who (1) is a resident of the United States under the Treaty, and (2) does not have a permanent establishment or fixed base in France to which the ADSs or shares are effectively connected. Special rules apply to individuals who are residents of more than one country.
In general, for United States federal income tax purposes, a U.S. Holder will recognize capital gain or loss on the sale, exchange or other disposition of ADSs or shares in the same manner as on the sale, exchange or other
161
disposition of any other shares held as capital assets. Any gain or loss will generally be United States source gain or loss. The deposit or withdrawal under the deposit agreement of shares by a U.S. Holder in exchange for ADSs will not be subject to U.S. federal income tax.
Passive Foreign Investment Company Considerations
Based upon certain management estimates and the nature of the business activities of our corporate group, we do not believe we were a “passive foreign investment company”, or “PFIC”, for our 2003 taxable year. However, because the determination of whether or not we are a PFIC is based upon the composition of our corporate group’s income and assets from time to time and because of uncertainties in the application of U.S. federal income tax rules to certain businesses conducted by our corporate group (which may be viewed as commodities businesses for purposes of such tax rules), there can be no assurance that we will not be considered a PFIC for any taxable year.
Special U.S. federal income tax rules apply to U.S. Holders of stock in a PFIC. A company will be classified as a PFIC if, after the application of certain “look through” rules, either (1) 75% or more of the gross income of the company in a taxable year is “passive income”, or (2) the average percentage of assets by value of the company in a taxable year which produce or are held for the production of “passive income” is at least 50%. Passive income for this purpose generally includes dividends, interest, certain rents and royalties and certain gains from commodities transactions and from securities transactions.
If we were a PFIC for any taxable year during which a U.S. Holder held ADSs or shares, such U.S. Holder would generally be subject to special rules with respect to (a) any “excess distribution” by us to the U.S. Holder (very generally, any distributions received by the U.S. Holder in a taxable year that are greater than 125% of the average annual distributions received by the U.S. Holder in the three preceding taxable years, or the U.S. Holder’s holding period for the ADSs or shares, if shorter), and (b) any gain realized on the sale, exchange or other disposition (including a pledge) of the ADSs or shares. Under these special rules, (1) the excess distribution or gain would be allocated ratable over the U.S. Holder’s holding period for the ADSs or shares, (2) the amount allocated to the current taxable year or to any taxable year prior to the first taxable year in which we are a PFIC would be taxed as ordinary income and (3) the amount allocated to each of the other taxable years would be subject to tax at the highest rate of tax in effect for the applicable class of taxpayer for that taxable year and an interest charge generally applicable to underpayments of tax would be imposed with respect to the resulting tax attributable to each such taxable year. Under certain circumstances, a mark to market election may be available to U.S. Holders, which could result in different tax consequences to such holders.
If the ADSs or shares constitute stock in a PFIC, a U.S. Holder would be required to make an annual return on United States Internal Revenue Service Form 8621 regarding distributions received on such securities and any gain realized on the sale, exchange or other disposition of such securities.
French Estate and Gift Taxes
Under the Convention Between the United States of America and the French Republic for the Avoidance of Double Taxation and the Prevention of Fiscal Evasion with Respect to Taxes on Estates, Inheritance and Gifts of November 24, 1978, a transfer of ADSs or shares by gift or by reason of the death of a U.S. Holder that would otherwise be subject to French gift or inheritance tax will generally not be subject to French tax unless (1) the donor or the transferor is domiciled in France at the time of making the gift, or at the time of his or her death, or (2) the ADSs or shares were used in, or held for use in, the conduct of a business through or pertaining to a permanent establishment or fixed base in France.
Prospective investors in shares or ADSs should consult their own tax advisers as to the applicability of the November 24, 1978 Convention mentioned above.
162
French Wealth Tax
The French wealth tax does not apply to any U.S. Holder that is not an individual or, in the case of natural persons, to a holder who owns, alone or with their parents, directly or indirectly, ADSs or shares representing the right to less than 25% of our profits.
U.S. Information Reporting and Backup Withholding
Dividends paid on ADSs or shares to a U.S. Holder, or proceeds from a U.S. Holder’s sale, exchange or other disposition of ADSs or shares, may be subject to U.S. information reporting requirements and backup withholding unless the U.S. Holder:
| • | is a corporation or come within certain other exempt categories, and, when required, demonstrates this fact, or |
| • | in the case of back-up withholding, provides a correct taxpayer identification number on a properly completed United States Internal Revenue Service Form W-9 or substitute form, certifies that the U.S. Holder is not subject to backup withholding and otherwise complies with applicable requirements of the backup withholding rules. |
Any amount withheld under these rules will be creditable against the U.S. Holder’s U.S. federal income tax liability if the U.S. Holder provides the required information to the United States Internal Revenue Service. If a U.S. Holder is required to and does not provide a correct taxpayer identification number, the U.S. Holder may be subject to penalties imposed by the United States Internal Revenue Service.
F. Dividends and Paying Agents
Not applicable
G. Statement by Experts
Not applicable.
H. Documents on Display
The documents concerning the Group which are referred to herein may be inspected at the Securities and Exchange Commission, or at the offices of SUEZ, at 16, rue de la Ville l’Evêque, 75008 Paris, France. You may read and copy any documents filed or furnished by us at the Securities and Exchange Commission’s public reference rooms in Washington D.C., New York, New York, and Chicago, Illinois. Please call the Securities and Exchange Commission at 1-800-SEC-0330 for further information on the reference rooms.
I. Subsidiary Information
Not applicable.
163
ITEM 11. QUANTITATIVE AND QUALITATIVE DISCLOSURES ABOUT MARKET RISK
The following discussion includes forward-looking statements that involve risks and undertakings. Our actual results could differ materially from those projected.
Our major market risk exposures are changing interest rates, currency fluctuations, equity investments, commodities and trading risk. We use derivative financial instruments primarily to manage these market risks exposures. Except for commodities and certain equity investments, which involve trading strategies, these financial instruments are generally designated as hedges of underlying exposures associated with specific assets, liabilities or commitments. Fair value calculations are presented in Note 18 to our Consolidated Financial Statements.
Cash Management
Cash management surpluses are pooled within dedicated Group financial entities, including SUEZ Finance S.A., SUEZ Finance LP and Tractebel Cash Management Services – TCMS, before being redistributed to borrower entities. An intermediate pooling is performed either at the business level or by geographical area.
Our cash surpluses are almost entirely denominated in euro and do not therefore generate a foreign exchange risk. They are invested in short-term instruments to ensure maximum liquidity at a minimum risk.
Debt Management
We aim to maintain a well balanced maturity profile and to diversify our sources of debt in terms of markets (such as bank debt, bonds and commercial paper), maturities and counterparties. Of our borrowings and long-term debt as of December 31, 2003, €9,657 million had a maturity of under one year, €7,173 million had a maturity between one and five years and €10,420 million had a maturity greater than five years.
Depending on their nature, our financing arrangements are made and/or guaranteed by SUEZ, the GIE SUEZ Alliance, SUEZ Finance S.A., SUEZ Finance LP, or directly by the subsidiaries.
Financing is generally denominated in the same currency as the cash flows generated by the assets financed, and primarily the euro, U.S. dollar and pound sterling.
As of December 31, 2003, we maintained a portfolio of confirmed, undrawn credit lines and treasury note back-up lines amounting to €8,708.3 million. These credit lines amounted to €6,854.6 million as of December 31, 2002.
164
On-balance sheet information for long-term debt arrangements and investments in marketable securities for the years ended December 31, 2003 and 2002 are as follows:
| | | | | | | | | | | | | | | | | | | |
On Balance-Sheet Financial Instruments
| | Average
Debt Rate
| | | Maturities of notional contract values as of December 31, 2003
| | >5 years
| | Total
| | Fair
Value
|
| | | | | | 2004
| | 2005
| | 2006
| | 2007
| | 2008
| | | | |
| | | | | | | | (in € millions, except percentages) | | | | | | | | |
Assets | | | | | | | | | | | | | | | | | | | |
Equity Securities | | — | | | 2,203.9 | | — | | — | | — | | — | | — | | 2,203.9 | | 2,484.5 |
Marketable Securities | | — | | | 3,825.0 | | — | | 1,190.0 | | — | | — | | — | | 5,015.0 | | 5,022.4 |
Liabilities | | | | | | | | | | | | | | | | | | | |
Borrowings and long-term debt | | 4.2 | % | | 9,657.1 | | 1,226.5 | | 2,503.6 | | 2,093.7 | | 792.9 | | 10,420.3 | | 26,694.1 | | 27,250.4 |
| | | | | |
On Balance-Sheet Financial Instruments
| | Average
Debt Rate
| | | Maturities of notional contract values as of December 31, 2002
| | >5 years
| | Total
| | Fair
Value
|
| | | | | | 2003
| | 2004
| | 2005
| | 2006
| | 2007
| | | | |
| | | | | | | | (in € millions, except percentages) | | | | | | | | |
Assets | | | | | | | | | | | | | | | | | | | |
Equity Securities | | — | | | 5,733.6 | | — | | — | | — | | — | | — | | 5,733.6 | | 5,734.5 |
Marketable Securities | | — | | | 2,575.8 | | — | | — | | — | | — | | — | | 2,575.8 | | 2,583.0 |
Liabilities | | | | | | | | | | | | | | | | | | | |
Borrowings and long-term debt | | 4.7 | % | | 13,396.1 | | 5,473.4 | | 1,610.4 | | 1,619.3 | | 2,358.1 | | 10,087.2 | | 34,544.5 | | 35,488.2 |
We consider the fair value of all other current assets and liabilities (Other assets, Accounts receivable and Accounts payable, Cash and cash equivalents) to be equivalent to the carrying amounts due to the short maturity of these items.
The fair value of Equity Securities and Marketable Securities is based on quoted market prices, when available, prices observed for recent transactions or estimated values. When quoted prices are not available, management reviews comparable transactions and the price to earnings ratio of comparable businesses to determine the amount expected to be received in a current sale.
Valuations for long-term debt are determined based on borrowing rates currently available to us for loans with similar terms and maturities.
Currency Risk
Our foreign exchange risk related to long-term assets and cash flows denominated in non-euro currencies is hedged, if possible, through the provision of financing in the same currency. As a result, we maintain a portion of our financing in U.S. dollars and pounds sterling, reflecting our business in these currencies. At December 31, 2003, our consolidated U.S. dollar denominated debt amounted to 22% of our total consolidated gross debt, while our pound sterling denominated debt amounted to 3% of our consolidated gross debt (compared to 28% and 10%, respectively, as of December 31, 2002). We can adjust the amount of U.S. dollar denominated debt as needed using our available long-term multi-currency revolving credit lines.
With respect to our foreign exchange risk in emerging markets, we reduce when possible our risks by negotiating contractual price adjustments in concession contracts, entering into U.S. dollar denominated contracts, and increasing the local portion of our costs. We may also use derivative instruments such as foreign currency swaps, forward contracts or collars. We may also hedge our exposure related to firm commitments
165
either by entering into specific insurance policies, such as contracts with “Compagnie Française d’Assurance pour le Commerce Extérieur”, an insurance company that caters to the needs of French companies investing in or doing business outside of France or by using forward contracts.
In addition, we hedge estimated cash flows related to forecasted investments and divestments using firm or option contracts.
We do not enter into forward foreign currency exchange contracts for trading purposes.
Interest Rate Risk
We are a net borrower. The interest rate risk to which we are exposed is a function of our long-term and short-term debt. In view of the stable nature of many of the prices in our businesses, we are exposed to interest rate increases. An increase in interest rates would lead to an increase in our interest charges and would have a negative impact on our results. Consequently, our policy is to maintain a substantial part of our debt at fixed rates. As of December 31, 2003, fixed rate interest debt amounted to 60% of our total debt after hedging (compared to 52% as of December 31, 2002). The remaining portion of our debt is subject to floating interest rates.
Off-balance sheet financial instruments held to manage interest rate risk and foreign currency risk are as follows:
| | | | | | | | | | | | | | | | | | | |
| | | As of December 31, 2003
| |
| | | Notional contract value maturing in year ending December 31,
| |
| | | Average
Rate
(%)
| | 2004
| | 2005
| | 2006
| | 2007
| | 2008
| | > 5
years
| | Total
| | Fair
value
| |
| | | (in € millions, except percentages) | |
Interest rate swaps – Pay fixed rate | | | | 1,838.1 | | 1,120.1 | | 737.7 | | 427.6 | | 340.0 | | 705.6 | | 5,169.1 | | (166.4 | ) |
€ | | 4.4 | | 1,229.1 | | 571.8 | | 99.1 | | 118.6 | | 168.5 | | 393.6 | | 2,580.7 | | (50.3 | ) |
£ | | 5.6 | | 1.0 | | 1.2 | | 1.3 | | 1.4 | | 21.3 | | 23.6 | | 49.8 | | (0.2 | ) |
US$ | | 4.1 | | 579.1 | | 532.0 | | 625.7 | | 299.6 | | 141.2 | | 215.8 | | 2,393.4 | | (107.4 | ) |
Other currencies | | 6.5 | | 28.9 | | 15.1 | | 11.6 | | 8.0 | | 9.0 | | 72.6 | | 145.2 | | (8.5 | ) |
| | | | | | | | | |
Interest rate swaps – Receive fixed rate | | | | 769.4 | | 124.2 | | 72.6 | | 17.0 | | 7.0 | | 4,838.5 | | 5,828.7 | | 169.4 | |
€ | | 4.5 | | 757.9 | | 56.1 | | 67.1 | | 11.5 | | 1.5 | | 4,445.3 | | 5,339.4 | | 81.5 | |
£ | | 6.8 | | — | | — | | — | | — | | — | | 386.4 | | 386.4 | | 80.7 | |
US$ | | 5.4 | | 5.5 | | 68.1 | | 5.5 | | 5.5 | | 5.5 | | 6.8 | | 96.9 | | 7.1 | |
Other currencies | | 7.5 | | 6.0 | | — | | — | | — | | — | | — | | 6.0 | | 0.1 | |
| | | | | | | | | |
Interest rate swaps – Floating/Floating | | | | 797.1 | | 18.1 | | 24.1 | | 146.8 | | 45.3 | | 168.9 | | 1,200.3 | | (3.6 | ) |
€ | | — | | 5.3 | | 14.1 | | 24.1 | | 146.8 | | 45.3 | | 168.9 | | 404.5 | | 0.8 | |
US$ | | — | | 791.8 | | 4.0 | | — | | — | | — | | — | | 795.8 | | (4.2 | ) |
| | | | | | | | | |
FRA (Forward Rate Agreement) –Purchased | | | | | | | | | | | | | | | | | | | |
€ | | 4.8 | | 158.7 | | 158.7 | | 106.0 | | — | | — | | — | | 423.4 | | (1.6 | ) |
| | | | | | | | | |
Caps – Purchased | | | | 145.5 | | 161.9 | | 14.5 | | 106.7 | | 14.7 | | 34.9 | | 478.2 | | 7.0 | |
€ | | 6.8 | | 141.6 | | 74.4 | | 9.9 | | 103.1 | | 9.9 | | 24.1 | | 363.0 | | 7.0 | |
US$ | | 8.3 | | 3.9 | | 87.5 | | 4.6 | | 3.6 | | 4.8 | | 10.8 | | 115.2 | | — | |
| | | | | | | | | |
Caps – Sold | | | | 39.7 | | 95.1 | | — | | — | | — | | — | | 134.8 | | — | |
€ | | 6.1 | | 39.7 | | 39.7 | | — | | — | | — | | — | | 79.4 | | — | |
US$ | | 7.8 | | — | | 55.4 | | — | | — | | — | | — | | 55.4 | | — | |
| | | | | | | | | |
Floors – Purchased | | | | | | | | | | | | | | | | | | | |
€ | | 3.2 | | 30.0 | | 50.0 | | 10.0 | | — | | — | | — | | 90.0 | | 0.5 | |
| | | | | | | | | |
Collars | | | | 19.4 | | 136.2 | | 7.0 | | 8.4 | | 8.1 | | 32.1 | | 211.2 | | (24.4 | ) |
€ | | 2.0-3.0 | | 2.8 | | 3.2 | | 3.7 | | 4.2 | | 4.8 | | 5.5 | | 24.2 | | (0.1 | ) |
£ | | 5.6-8.0 | | 15.0 | | — | | — | | — | | — | | — | | 15.0 | | (0.1 | ) |
US$ | | 4.7-6.4 | | 1.6 | | 133.0 | | 3.3 | | 4.2 | | 3.3 | | 26.6 | | 172.0 | | (24.2 | ) |
166
| | | | | | | | | | | | | | | | | |
| | | As of December 31, 2003
| |
| | | Notional contract value maturing in year ending December 31,
| |
| | | 2004
| | 2005
| | 2006
| | 2007
| | 2008
| | > 5
years
| | Total
| | Fair
value
| |
| | | (in € millions, except percentages) | |
Currency swaps – By currency borrowed | | | | | | | | | | | | | | | | | |
US$ | | 219.5 | | 167.9 | | 159.1 | | 204.4 | | 199.1 | | 905.5 | | 1,855.5 | | 552.0 | |
| | | | | | | | |
Currency swaps – By currency lent | | 226.0 | | 49.6 | | 114.7 | | — | | — | | 220.8 | | 611.1 | | 54.7 | |
€ | | — | | 49.6 | | — | | — | | — | | 150.0 | | 199.6 | | 28.8 | |
US$ | | — | | — | | — | | — | | — | | 55.4 | | 55.4 | | 25.5 | |
Other currencies | | 226.0 | | — | | 114.7 | | — | | — | | 15.4 | | 356.1 | | 0.4 | |
| | | | | | | | |
Foreign exchange swaps – By currency borrowed | | 1,757.3 | | 63.4 | | 0.8 | | 0.8 | | 20.7 | | 3.6 | | 1,846.6 | | 15.7 | |
€ | | 0.9 | | — | | — | | — | | — | | — | | 0.9 | | — | |
£ | | 646.4 | | — | | — | | — | | 19.9 | | — | | 666.3 | | 0.5 | |
US$ | | 906.0 | | 0.8 | | 0.8 | | 0.8 | | 0.8 | | 3.6 | | 912.8 | | 18.6 | |
Other currencies | | 204.0 | | 62.6 | | — | | — | | — | | — | | 266.6 | | (3.4 | ) |
| | | | | | | | |
Foreign exchange swaps – By currency lent | | 252.7 | | 37.1 | | 10.1 | | 11.3 | | — | | — | | 311.2 | | (21.3 | ) |
£ | | 24.1 | | — | | — | | — | | — | | — | | 24.1 | | 0.1 | |
US$ | | 213.9 | | 37.1 | | 10.1 | | — | | — | | — | | 261.1 | | (20.4 | ) |
Other currencies | | 14.7 | | — | | — | | 11.3 | | — | | — | | 26.0 | | (1.0 | ) |
| | | | | | | | |
Forward contracts – Purchased | | 348.0 | | 166.3 | | 107.0 | | 10.2 | | 0.1 | | — | | 631.6 | | (0.9 | ) |
€ | | 3.9 | | — | | — | | — | | — | | — | | 3.9 | | 2.7 | |
£ | | 46.4 | | 55.2 | | 22.7 | | 1.8 | | — | | — | | 126.1 | | (0.7 | ) |
US$ | | 296.9 | | 111.1 | | 84.3 | | 8.4 | | 0.1 | | — | | 500.8 | | (2.4 | ) |
Other currencies | | 0.8 | | — | | 0.1 | | — | | — | | — | | 0.8 | | (0.5 | ) |
| | | | | | | | |
Forward contracts – Sold | | 349.4 | | 32.1 | | 9.8 | | 7.2 | | 7.2 | | 82.7 | | 488.4 | | 159.3 | |
£ | | 66.6 | | 14.3 | | 1.1 | | — | | — | | — | | 82.0 | | 17.0 | |
US$ | | 159.5 | | 12.1 | | 7.5 | | 7.2 | | 7.2 | | 82.7 | | 276.2 | | 43.0 | |
Other currencies | | 123.3 | | 5.7 | | 1.2 | | — | | — | | — | | 130.2 | | 99.3 | |
| | | | | | | | |
Insurance contracts (COFACE) | | | | | | | | | | | | | | | | | |
US$ | | 16.2 | | — | | — | | — | | — | | — | | 16.2 | | 5.2 | |
| | |
| |
| |
| |
| |
| |
| |
| |
|
|
Total | | 6,967.0 | | 2,380.7 | | 1,373.4 | | 940.4 | | 642.2 | | 6,992.6 | | 19,296.3 | | 745.6 | |
| | |
| |
| |
| |
| |
| |
| |
| |
|
|
The fair value of foreign currency and interest rate instruments has been estimated by discounting future cash flow differentials, or by obtaining a market price from third-party banks.
167
Equity Risk
The Group has optimized the management of its securities portfolio through derivatives, including derivatives embedded in exchangeable bonds. The Group hedges certain securities sales transactions, where appropriate, through the purchase of call options. Furthermore, the Group may sell call options to optimize the risk management of its securities portfolio. Off-balance sheet financial instruments held to manage equity risk are as follows (excluding call options incorporated with the options exchangeable issued):
| | | | | | | | | | | | | | | | | |
| | | As of December 31, 2003
| |
| | | Notional contract value maturing in year ended December 31,
| |
| | | 2004
| | 2005
| | 2006
| | 2007
| | 2008
| | Thereafter
| | Total
| | Fair value
| |
| | | (in € millions) | |
Equity instruments | | | | | | | | | | | | | | | | | |
| | | | | | | | |
Equity options | | | | | | | | | | | | | | | | | |
Call – sold (a) | | 312.8 | | — | | — | | — | | — | | — | | 312.8 | | 3.8 | |
Call – purchased (b) | | 661.7 | | — | | — | | — | | — | | — | | 661.7 | | (0.2 | ) |
| | |
| |
| |
| |
| |
| |
| |
| |
|
|
Total | | 974.5 | | — | | — | | — | | — | | — | | 974.5 | | 3.6 | |
| | |
| |
| |
| |
| |
| |
| |
| |
|
|
| (a) | the calls sold related to our strategy concerning our current holdings of 19,999,936 Fortis shares. |
| (b) | the calls purchased to hedge bonds exchangeable for Total shares issued by us. |
Counterparty Risk
Transactions involving foreign exchange hedging, interest rate management, equity derivatives or short-term investments are carried out exclusively using highly-rated counterparties. These counterparties are chosen according to the ratings assigned by the credit rating agencies and are generally major international banks. We are not exposed to any material concentration of our credit risk and do not anticipate any third party default that might have a significant negative impact on our financial position and results.
At the end of 2003, we held substantial amounts of cash. Although these surpluses were invested with well-diversified, major investment grade banks using liquid and riskless products, the failure of one of these counterparties to repay at maturity would have a negative impact on our financial position.
Commodity Risk
Commodity Price Hedging Activities
The energy sector is exposed to market risk arising from variation of the prices of raw materials and commodities such as natural gas or Brent crude oil.
Since 2000, we have chosen to enter into commodity forwards, swaps and options in order to monitor such exposure. These contracts have either been negotiated OTC (over-the-counter) or traded on organized markets.
We use derivatives as hedges to limit price fluctuations resulting from our operating businesses. Brent swaps have been traded in order to hedge price volatility generated by optionality clauses in pricing formulas of long-term supply contracts. We have also entered into gas forwards and options in order to offset exposure to changes in the fair value of sales contracts.
The cumulative market value of these commodity hedging transactions amounted to a negative €219 million as of December 31, 2003 (negative €55 million as of December 31, 2002).
168
Off-balance sheet financial instruments held with a view to managing exposure to fluctuations in commodity prices are presented below in their nominal amount expressed in MMBTU (millions of British Thermal Units, the standard conversion unit for energy contracts):
| | | | | | | | | | | | | | | | | | | | | |
| | | Notional amount in thousands of MMBTU
| | | Fair value
in €
millions
| |
| | | As of December 31, 2003
| | | | |
| | | 2004
| | | 2005
| | | 2006
| | | 2007
| | 2008
| | Thereafter
| | Total
| | | | |
Commodity instruments | | | | | | | | | | | | | | | | | | | | | |
| | | | | | | | |
Natural gas and electricity | | (127,850.0 | ) | | (117,061.0 | ) | | 16,732.0 | | | 40,150.0 | | 40,260.0 | | 0.0 | | (147,769.0 | ) | | (291.4 | ) |
Swaps | | (115,873.0 | ) | | (110,698.0 | ) | | 18,468.0 | | | 40,150.0 | | 40,260.0 | | — | | (127,684.0 | ) | | (267.3 | ) |
Options | | 10,234.0 | | | (904.0 | ) | | — | | | — | | — | | — | | 9,330.0 | | | (7.1 | ) |
Forwards/futures | | (22,211.0 | ) | | (5,468.0 | ) | | (1,736.0 | ) | | — | | — | | — | | (29,415.0 | ) | | (17.0 | ) |
| | | | | | | | |
Fuel, Gas oil & Heating oil | | (52,598.0 | ) | | (47,073.0 | ) | | — | | | — | | — | | — | | (99,671.0 | ) | | 71.2 | |
Swaps | | (57,364.0 | ) | | (47,073.0 | ) | | — | | | — | | — | | — | | (104,437.0 | ) | | 70.4 | |
Options | | 4,766.0 | | | — | | | — | | | — | | — | | — | | 4,766.0 | | | 0.9 | |
Forwards/futures | | — | | | — | | | — | | | — | | — | | — | | — | | | (0.1 | ) |
| | | | | | | | |
Crude oil | | 55,464.0 | | | 55,464.0 | | | 40,211.0 | | | — | | — | | — | | 151,139.0 | | | 1.0 | |
Swaps | | 55,464.0 | | | 55,464.0 | | | 40,211.0 | | | — | | — | | — | | 151,139.0 | | | 1.7 | |
Forwards/futures | | — | | | — | | | — | | | — | | — | | — | | — | | | (0.7 | ) |
| | |
|
| |
|
| |
|
| |
| |
| |
| |
|
| |
|
|
Total | | (124,984.0 | ) | | (108,670.0 | ) | | 56,943.0 | | | 40,150.0 | | 40,260.0 | | — | | (96,301.0 | ) | | (219.2 | ) |
| | |
|
| |
|
| |
|
| |
| |
| |
| |
|
| |
|
|
Trading activities in commodities
The Group enters into spot and forward contracts for natural gas, electricity and various petroleum products on organized and over-the-counter markets. The Group offers its customers price risk management services. These transactions are performed using a variety of intermediary instruments traded in Europe and the United States. These products are traded through a variety of instruments including forward contracts, which may involve physical delivery of an energy commodity, swap agreements, which may require payments to, or receipt of payments from, counterparties based on the differential between a fixed and variable price for the commodity, options and other contractual agreements. We use commodity derivatives in order to optimize prices proposed to industrial and commercial customers in the energy sector, as well as for positions taken on our own behalf.
In accordance with internal risk control procedures, risk control departments, independent of the trading departments which initiate and actively manage the positions, are responsible for performing fair value calculations and managing market and credit risks. Fair value and risk exposure calculations are performed daily. Information potentially impacting the credit rating of Group trading activity counterparties is collected and assessed daily and credit limits are adjusted immediately as new financial data concerning the counterparties becomes available.
Market risks are monitored by risk control groups operating independently from the units that create or actively manage these risk exposures to ensure compliance with the stated risk management policies.
We maintain credit policies with regard to our counterparties that management believes significantly minimize overall credit risk. These policies include an evaluation of potential counterparties’ financial condition (including credit rating), collateral requirements under certain circumstances and the use, if possible, of standardized agreements which allow for the netting of positive and negative exposures associated with a single counterparty.
169
Notional Amounts and Terms
The notional amounts and terms of these instruments are shown hereafter (notional amounts in thousands of MMBTU, millions of British Thermal Units, standard on version unit for energy contracts):
| | | | | | | | | | |
| | | As of December 31, 2003
| | As of December 31, 2002
|
| | | Notional Amount in
thousands of
MMBTU (Net*)
| | | Maximum maturity
in years
| | Notional Amount in
thousands of
MMBTU (Net*)
| | | Maximum maturity
in years
|
Commodities | | | | | | | | | | |
| | | | |
Electricity | | 3,409.5 | | | | | (4,165.7 | ) | | |
Swaps | | 12,731.0 | | | 8 | | (556.3 | ) | | 9 |
Options | | 8,210.0 | | | 2 | | 1,984.4 | | | 2 |
Futures / Forwards | | (17,531.5 | ) | | 4 | | (5,593.8 | ) | | 5 |
| | | | |
Natural gas | | 68,455.3 | | | | | (7,332.5 | ) | | |
Swaps | | 5,704.5 | | | 4 | | (422.7 | ) | | 4 |
Options | | 23,699.0 | | | 4 | | (910.7 | ) | | 3 |
Futures / Forwards | | 39,051.8 | | | 4 | | (5,999.1 | ) | | 9 |
| | | | |
Crude oil | | 521.0 | | | | | 1,377.5 | | | |
Swaps | | 4,118.6 | | | 3 | | 0.7 | | | 4 |
Options | | (3,597.6 | ) | | 1 | | 634.8 | | | 2 |
Futures / Forwards | | — | | | — | | 742.0 | | | 1 |
| | | | |
Fuel, Gas oil and Heating oil | | 131.9 | | | | | 5,320.4 | | | |
Swaps | | 131.9 | | | 1 | | 5,320.4 | | | 1 |
Options | | — | | | — | | — | | | — |
Futures / Forwards | | — | | | — | | — | | | — |
| | |
|
| |
| |
|
| |
|
Total | | 75,517.7 | | | | | (4,800.3 | ) | | |
| | |
|
| |
| |
|
| |
|
| (*) | purchase position/(selling position) |
Notional amounts reflect the volume of open transactions and not the actual amounts exchanged by the parties to the financial instruments. Accordingly, notional amounts are not an exact measure of the Group’s exposure to market or credit risks. The maximum maturities indicated above and the related notional amounts are not indicative of probable future cash flows, to the extent that price risk management could lead to netting of these positions on the market at any time within the limit of the Group’s available funds.
Average maturity, weighted by volume, of the Group’s commitment portfolio as of December 31, 2003 and 2002 was approximately 4.2 and 4.5 years, respectively.
170
Fair Value
The fair value as of December 31, 2003 and 2002 and the average fair value of instruments used in commodity trading activities is set forth below:
| | | | | | | | | | | |
| | | Fair value as of
December 31, 2003
| | Average fair value for
the year ended
December 31, 2003 (1)
| | | Fair value as of
December 31, 2002
| | | Average fair value for
the year ended
December 31, 2002 (1)
| |
| | | (in € millions) | |
Natural gas and electricity | | 19.1 | | (6.2 | ) | | (8.6 | ) | | 4.5 | |
Crude oil | | — | | 2.2 | | | 0.5 | | | 0.3 | |
Fuel, Gas oil and Heating oil | | 0.5 | | (0.8 | ) | | (4.4 | ) | | (2.9 | ) |
| | |
| |
|
| |
|
| |
|
|
Total | | 19.6 | | (4.8 | ) | | (12.4 | ) | | 1.9 | |
| | |
| |
|
| |
|
| |
|
|
These fair values are not representative of probable future cash flows insofar as the underlying positions are sensitive to price movements and can be modified by new transactions.
The following table presents the fair value of financial instruments held by the Group as of December 31, 2003, as part of its energy trading activities, analyzed by valuation method and maturity.
| | | | | | | | | | |
| | | Contract fair value as of December 31, 2003
|
| | | <1 year
| | 1 to 5 years
| | | > 5 years
| | | Total fair value
|
| | | (in € millions) |
Listed price on an active market (1) | | 1.8 | | (0.2 | ) | | — | | | 1.6 |
Price provided by other external sources (2) | | 3.0 | | 7.2 | | | — | | | 10.2 |
Price based on calculation models or other valuation methods (3) | | 7.4 | | 1.9 | | | (1.5 | ) | | 7.8 |
| | |
| |
|
| |
|
| |
|
Total | | 12.2 | | 8.9 | | | (1.5 | ) | | 19.6 |
| | |
| |
|
| |
|
| |
|
| (1) | Listed prices on an organized market: for contracts traded on organized markets, the Group uses the prices published by these markets. Prices are available at the end of each trade day. |
| (2) | Prices provided by other external sources: for contracts traded over-the-counter, the Group uses prices communicated by brokers. Listed prices on organized markets are directly available to value long-term contracts and swap contracts on commodity and energy markets in which the Group trades. Prices reflect current economic and regulatory conditions on these markets and are subject to short-term modifications reflecting changes in market conditions. The availability of listed prices on organized markets varies depending on the period and commodity. During these periods and in reduced liquidity areas, the Group estimates the price based on organized market prices, prices available on less liquid markets and other fundamental market analyses. The price of transactions performed by the Group is also used to validate the transactions obtained and the prices received from brokers. |
| (3) | Models and other valuation methods: the Group estimates the fair value of less-standard instruments using models and other valuation techniques which reflect the most relevant available information. Valuation techniques include the valuation of options, statistical analyses and simulations and discounted value concepts including estimation risk and cash flow scheduling measurement and reflecting specific contractual clauses. Assumptions include commodity market prices, or an estimate thereof in the absence of market prices, nil risk discounting rates, volatility factors underlying positions, the estimated correlation of commodity and energy prices, contractual volumes, estimated values, the liquidity of the market on which the contract is traded and the risk premium taken into account by market players when determining fair value. While listed market prices are not available for these derivative contracts themselves, the market price of the underlying commodity is a significant component in the valuation of these contracts. |
171
Changes In Fair Value During 2003
The following table reflects the changes in fair value between December 31, 2002 and 2003.
| | | |
| | | (in € millions)
| |
Fair Value as of December 31, 2002 | | (12.4 | ) |
Contracts unwound or settled in 2003 | | (48.5 | ) |
Initial fair value recorded for new contracts in 2003 (1) | | — | |
Fair value movements due to changes in appraisal techniques (2) | | (0.2 | ) |
Other changes in fair values (3) | | 80.7 | |
Fair value as of December 31, 2003 | | 19.6 | |
| (1) | Energy trading contracts presenting unrealized gains or losses from initiation. |
| (2) | Includes fair value movements resulting from changes in valuation techniques, changes in the method of calculating correlations, volatilities and volume forecasts, changes in the market and historical data characteristics used to calculate correlations, volatilities and historical forecasts and also changes in sources or types of assumptions. |
| (3) | Represent fair value changes due to market fluctuations (price fluctuations, volatility, etc.). |
Value at risk
In accordance with internal risk management procedures, market risk is managed by risk control departments independent of the trading departments which initiate and actively manage the positions.
Trading activities expose the Group to market risk resulting from negative movements in commodity and electricity prices. This price risk is generated by the trading activities which manage the positions resulting from the range of products offered to our customers and our production units and positions taken on the Group’s own behalf.
The Group assesses, measures and manages the market risk in respect of commodity and electricity positions, on a daily basis, using the value at risk method, together with other market risk limits. The quantification of the market risk using the value at risk approach provides a transversal measure of risk, taking all markets and products into account. The use of these methods requires the determination of key assumptions, and notably the selection of a confidence interval and a holding period.
| | | | | | | | | | |
| | | December 31, 2003
| | 2003 Average (1)
| | 2002 Average (1)
| | 2003 High (2)
| | 2003 Low (2)
|
| | | (in € millions) |
Value at risk | | 3.2 | | 4.4 | | 4.6 | | 10.1 | | 2.2 |
| (1) | average daily values (100%). |
| (2) | month-end highs and lows observed in 2003. |
Value at risk (VAR) represents the maximum potential loss in value in an asset portfolio, based on a given investment period and confidence interval. The value at risk is not necessarily an indication of potential future results. The Group assumes an investment period of 1 day and a confidence interval of 95%.
Credit Risk
In conjunction with the valuation of its financial instruments, the Group provides reserves for risks associated with its trading activity, including credit risk. Credit risk reflects the loss, calculated at market value, that the Group would incur as a result of nonperformance by counterparties of their contractual obligations. The Group has implemented credit procedures with regard to its counterparties and a risk management policy in order
172
to minimize this risk (evaluation of potential counterparties’ financial condition, including credit rating, security requests, use where possible of standardized agreements which allow for the netting of positive and negative exposures associated with a single counterparty, and collateral requirements).
As of December 31, 2003, 78% of counterparties were “investment grade”.
| | | | | | | | |
| | | 2003
| | 2002
|
| | | Investment Grade (1)
| | Total
| | Investment Grade (1)
| | Total
|
| | | (in € millions) |
Oil and gas producers | | 28.8 | | 31.7 | | 7.3 | | 9.8 |
Energy marketers | | 153.2 | | 182.0 | | 164.1 | | 191.2 |
Gas and electric utilities | | 70.9 | | 132.0 | | 168.9 | | 215.4 |
Financial institutions | | 68.8 | | 68.8 | | 39.5 | | 41.1 |
Industrials | | 0.6 | | 2.7 | | 7.4 | | 9.0 |
Organized markets | | 14.2 | | 14.8 | | — | | 0.9 |
| | |
| |
| |
| |
|
Total | | 336.5 | | 432.0 | | 387.3 | | 467.4 |
| | |
| |
| |
| |
|
| (1) | The “Investment Grade” column includes transactions with counterparties with a minimum Standard & Poor’s or Moody’s rating of BBB- or Baa3 respectively, or an equivalent Dun & Bradstreet rating. Exceptionally, “Investment Grade” status is also determined using publicly available credit ratings, along with consideration of pledged assets, letters of credit and parent company guarantees. |
ITEM 12. DESCRIPTION OF SECURITIES OTHER THAN EQUITY SECURITIES
Not applicable
173
PART II
ITEM 13. DEFAULTS, DIVIDEND ARREARAGES AND DELINQUENCIES
Not applicable.
ITEM 14. ��MATERIAL MODIFICATIONS TO THE RIGHTS OF SECURITY HOLDERS AND USE OF PROCEEDS
Not applicable.
ITEM 15. CONTROLS AND PROCEDURES
As of December 31, 2003, the Company, under the supervision and with the participation of the Company’s management, including the Chief Executive Officer and the Chief Financial Officer, performed an evaluation of the effectiveness of the Company’s disclosure controls and procedures. The Company’s management necessarily applied its judgment in assessing the costs and benefits of such controls and procedures, which by their nature can provide only reasonable assurance regarding management’s control objectives. Based on this evaluation, the Company’s Chief Executive Officer and Chief Financial Officer concluded that the Company’s disclosure controls and procedures are effective at the reasonable assurance level for gathering, analyzing and disclosing the information the Company is required to disclose in the reports it files under the Securities Exchange Act of 1934, within the time periods specified in the SEC’s rules and forms.
There has been no change in the Company’s control over financial reporting that occurred during the period covered by this annual report that has materially affected, or is reasonably likely to materially affect, the Company’s internal control over financial reporting.
ITEM 16A. AUDIT COMMITTEE FINANCIAL EXPERT
Our board of directors has determined that all three members of our audit committee qualify as financial experts.
ITEM 16B. CODE OF ETHICS
We have adopted a written Code of Ethics applicable to our Chief Executive Officer, Chief Financial Officer, Executive Vice-Presidents and other Group financial officers. It can be accessed on our website (www.suez.com) under the heading “Ethics”.
ITEM 16C. PRINCIPAL ACCOUNTANT FEES AND SERVICES
Ernst & Young and Deloitte Touche Tohmatsu-Audit have served as our independent public accountants for each of the financial years in the three-year period ended December 31, 2003, for which audited Consolidated Financial Statements appear in this annual report on Form 20-F.
174
The following table sets forth audit and other fees paid to members of audit firms by us in 2003 and 2002:
| | | | | | | | | | | | | | | | |
| | | Ernst & Young
| | Deloitte Touche Tohmatsu –
Audit
|
| | | Jan. 1,
2003 to
Dec. 31,
2003
Amount
| | Jan. 1,
2002 to
Dec. 31,
2002
Amount
| | % 2003
| | % 2002
| | Jan. 1,
2003 to
Dec. 31,
2003
Amount
| | Jan. 1,
2002 to
Dec. 31,
2002
Amount
| | % 2003
| | % 2002
|
| | | (in € thousands, except percentages) |
Audit | | | | | | | | | | | | | | | | |
Audit fees (statutory audit, certification, review of individual and Consolidated Financial Statements) | | 9,142 | | 12,032 | | 67 | | 92 | | 15,167 | | 14,624 | | 55 | | 77 |
Audit-related fees | | 3,353 | | 214 | | 25 | | 2 | | 9,697 | | 539 | | 35 | | 3 |
| | |
| |
| |
| |
| |
| |
| |
| |
|
Sub-total | | 12,495 | | 12,246 | | 92 | | 94 | | 24,864 | | 15,163 | | 90 | | 80 |
| | |
| |
| |
| |
| |
| |
| |
| |
|
Other services: | | | | | | | | | | | | | | | | |
Tax fees | | 430 | | 265 | | 3 | | 2 | | 418 | | 1,091 | | 2 | | 6 |
All other fees | | 732 | | 504 | | 5 | | 4 | | 2,115 | | 2,780 | | 8 | | 14 |
| | |
| |
| |
| |
| |
| |
| |
| |
|
Sub-total | | 1,162 | | 769 | | 8 | | 6 | | 2,533 | | 3,871 | | 10 | | 20 |
| | |
| |
| |
| |
| |
| |
| |
| |
|
TOTAL | | 13,657 | | 13,015 | | 100 | | 100 | | 27,397 | | 19,034 | | 100 | | 100 |
| | |
| |
| |
| |
| |
| |
| |
| |
|
“Audit Fees” are the aggregate fees billed by the Group’s external auditors for the audit of the Group’s individual and consolidated annual financial statements, reviews of interim financial statements and attestation services that are provided in connection with statutory and regulatory filings or engagements.
“Audit-related fees”, are fees generally related to due diligence investigations, audits of combined financial statements prepared for purposes of the contemplated disposal of certain of our activities or of combined financial statements of companies that we acquired, review of prospectuses issued by us, and to other assignments relating to internal accounting functions and procedures.
“Tax fees”, are fees for professional services rendered by our auditors for tax compliance and tax advice on actual or contemplated transactions.
“All other fees” are principally fees related to information technology and training and support services.
Audit Committee Pre-Approval Policies and Procedures
Below is a summary of the current audit pre-approval policies and procedures.
Our Audit Committee organizes the procedure for selecting the external auditors, approves the services to be performed by them and sets their terms of compensation. The Audit Committee also examines auditor independence principles and rules relating to auditor services within the Group, and periodically studies the scope of the audit and services performed by the external auditors.
All audit and non-audit services provided by external auditors must be pre-approved by the Audit Committee. Fees for non-audit services must not exceed 50% of total audit fees. The pre-approved audit and non-audit services, as well as the maximum fees for each such service, have been established and are subject to periodic review by the Audit Committee. All audit and non-audit services not falling within the generally pre-approved categories or exceeding pre-approved fee levels require specific pre-approval by the Audit Committee.
175
ITEM 16E. PURCHASES OF EQUITY SECURITIES BY THE ISSUER AND AFFILIATED PURCHASERS
Not applicable
PART III
ITEM 17. FINANCIAL STATEMENTS
Not applicable.
ITEM 18. FINANCIAL STATEMENTS AND INDEX TO FINANCIAL STATEMENTS
See pages F-4 through F-123 for the Consolidated Financial Statements of SUEZ.
| | |
Index to Consolidated Financial Statements | | F-1 |
| |
Independent Auditors’ Report – SUEZ | | F-2 |
| |
Report of Independent Accountants – Fortis | | F-3 |
| |
Consolidated Balance Sheets – Assets as of December 31, 2003, 2002 and 2001 | | F-4 |
| |
Consolidated Balance Sheets – Liabilities and Shareholders’ Equity as of December 31, 2003, 2002 and 2001 | | F-5 |
| |
Consolidated Statements of Income for the years ended December 31, 2003, 2002 and 2001 | | F-6 |
| |
Consolidated Statements of Cash Flows for the years ended December 31, 2003, 2002 and 2001 | | F-7 |
| |
Consolidated Statements of Changes in Shareholders’ Equity as of December 31, 2003, 2002 and 2001 | | F-8 |
| |
Notes to the Consolidated Financial Statements | | F-9 |
176
ITEM 19. EXHIBITS
Exhibit Number
1.1 Articles of Association of SUEZ as amended to date.12
2.1 Depositary Agreement.13
2.2 The total amount of our long-term debt securities authorized under any instrument does not exceed 10% of the total assets of the group on a consolidated basis. We hereby agree to furnish to the Commission, upon its request, a copy of any instrument defining the rights of holders of our long-term debt or that of our subsidiaries for which consolidated or Unconsolidated Financial Statements are required to be filed.
4.1 Mortgage loan contract between Compagnie de Suez and Ms. Bernis dated November 20, 1996 and English translation.13
4.2 Mortgage loan contract between Compagnie de Suez and Mr. Billioud dated August 29, 1995 and English translation.13
4.3 Mortgage loan contract between Credisuez and Mr. Cros dated August 25, 1992 and English translation.13
4.4 Mortgage loan contract between Compagnie de Suez and Mr. Théron dated February 3, 1992 and English translation.13
4.5 Extract of the Minutes of the Board of Directors Meeting of March 5, 2003.
8. For a list of our significant subsidiaries, see “Item 4. Information on the Company – Organizational Structure”.
12.1 Certification of Chief Executive Officer pursuant to Rule 13a-14(a)
12.2 Certification of Chief Financial Officer pursuant to Rule 13a-14(a)
13. Certification of Chief Executive Officer and Chief Financial Officer pursuant to Section 906 of the Sarbanes-Oxley Act of 2002 (18USC 1350)
14. Consents of Barbier Frinault & Autres – Ernst and Young and Deloitte Touche Tohmatsu – Audit
12 Incorporated by reference to Exhibit 1.1 to the Company’s Registration Statement on Form 20-F filed with the Securities and Exchange Commission on June 26, 2003.
13 Incorporated by reference to Exhibits 2.1 and 4(c)1 through 4, respectively, to the Company’s Registration Statement on Form 20-F filed with the Securities and Exchange Commission on August 29, 2001.
177
SIGNATURES
The Registrant hereby certifies that it meets all of the requirements for filing on Form 20-F and that it has duly caused and authorized the undersigned to sign this Annual Report on its behalf.
| | |
SUEZ |
| |
By: | | /s/ GÉRARD MESTRALLET
|
| | | Gérard Mestrallet |
| | | Chief Executive Officer |
Dated: June 28, 2004
Index to Consolidated Financial Statements
| | |
| | | Page |
| Independent Auditors’ Report – SUEZ | | F-2 |
| |
| Report of Independent Accountants – Fortis | | F-3 |
| |
| Consolidated Balance Sheets – Assets as of December 31, 2003, 2002 and 2001 | | F-4 |
| |
| Consolidated Balance Sheets – Liabilities and Shareholders’ Equity for the years ended December 31, 2003, 2002 and 2001 | | F-5 |
| |
| Consolidated Statements of Income for the years ended December 31, 2003, 2002 and 2001 | | F-6 |
| |
| Consolidated Statements of Cash Flows for the years ended December 31, 2003, 2002 and 2001 | | F-7 |
| |
| Consolidated Statements of Changes in Shareholders’ Equity as of December 31, 2003, 2002 and 2001 | | F-8 |
| |
| Notes to the Consolidated Financial Statements | | F-9 |
F-1
Independent Auditors’ Report
| | |
BARBIER FRINAULT & AUTRES ERNST & YOUNG Commissaire aux Comptes Membre de la Compagnie de Versailles 41, rue Ybry 92576 Neuilly-sur-Seine Cedex | | DELOITTE TOUCHE TOHMATSU – AUDIT Commissaire aux Comptes Membre de la Compagnie de Versailles 185, avenue Charles de Gaulle BP 136 92203 Neuilly-sur-Seine Cedex |
To the Shareholders of SUEZ S.A.:
We have audited the accompanying consolidated balance sheets of SUEZ S.A. and its subsidiaries (“the Group”) as of December 31, 2003, 2002, and 2001, and the related consolidated statements of income, changes in shareholders’ equity and cash flows for each of the three years in the period ended December 31, 2003, all expressed in Euros. These financial statements are the responsibility of the Group’s management. Our responsibility is to express an opinion on these financial statements based on our audits. We did not audit the financial statements of Fortis Group (“Fortis”), the investment in which is reflected in the accompanying financial statements using the equity method of accounting until December 17, 2001. The equity in Fortis’ net income represents 14.0 percent of consolidated net income for the year ended December 31, 2001. The financial statements of Fortis were audited by other auditors whose report has been furnished to us, and our opinion, insofar as it relates to the amounts included for Fortis, is based solely on the report of the other auditors. Our audits also included the adjustments necessary for the inclusion of Fortis’ results of operations in the Consolidated Financial Statements of the Group.
We conducted our audits in accordance with the standards of the Public Company Accounting Oversight Board (United States). Those standards require that we plan and perform the audit to obtain reasonable assurance about whether the financial statements are free of material misstatement. An audit includes examining, on a test basis, evidence supporting the amounts and disclosures in the financial statements. An audit also includes assessing the accounting principles used and significant estimates made by management, as well as evaluating the overall financial statement presentation. We believe that our audits and the report of the other auditors provide a reasonable basis for our opinion.
In our opinion, based on our audits and the report of other auditors, the Consolidated Financial Statements referred to above present fairly, in all material respects, the financial position of the Group as of December 31, 2003, 2002 and 2001, and the results of its operations and its cash flows for each of the three years in the period ended December 31, 2003 in conformity with accounting principles generally accepted in France.
Notes 1, 13, and 15 to the Consolidated Financial Statements explain the change in the accounting method linked to the initial application of the provisions of Regulation No. 2000-06 of the French Accounting Regulation Committee. Note 1 to the Consolidated Financial Statements explains the change in accounting method linked to the presentation of energy trading transactions.
Accounting principles generally accepted in France vary in certain significant respects from accounting principles generally accepted in the United States of America. Information relating to the nature and effect of such differences is presented in Notes 26 to 28 of the Consolidated Financial Statements.
Neuilly-sur-Seine, June 22, 2004
| | |
| | | The Auditors |
BARBIER FRINAULT & AUTRES ERNST & YOUNG /s/ Christian CHOCHON | | DELOITTE TOUCHE TOHMATSU – AUDIT /s/ Jean-Paul PICARD |
F-2
Report of Independent Accountants
20 June 2002
The Board of Directors
Fortis SA/NV and Fortis NV
Report of Independent Accountants
We have audited the consolidated balance sheets of the Fortis Group as of 31 December 2001, 2000 and 1999 showing a net equity of respectively Euro 13,844.5 million, Euro 15,196.8 million and Euro 13,507.9 million and the related consolidated profit and loss accounts and consolidated statements of comprehensive income and cash flows for each of the three years ended 31 December 2001. These consolidated financial statements, which are not separately presented herein, are the responsibility of Fortis management. Our responsibility is to express an opinion on these consolidated financial statements based on our audits.
We conducted our audits in accordance with auditing standards generally accepted in the United States of America. Those standards require that we plan and perform the audit to obtain reasonable assurance about whether the consolidated financial statements are free of material misstatement. An audit includes examining, on a test basis, evidence supporting the amounts and disclosures in the consolidated financial statements. An audit also includes assessing the accounting principles used and significant estimates made by management, as well as evaluating the overall presentation of the consolidated financial statements. We believe that our audits provide a reasonable basis for our opinion.
In our opinion, the consolidated financial statements referred to above present fairly, in all material respects, the consolidated financial position of Fortis as of 31 December 2001, 2000 and 1999 and the consolidated results of its operations and cash flows for the three years ended 31 December 2001, in accordance with accounting principles generally accepted in Belgium.
The accounting principles used in the preparation of the consolidated financial statements vary in certain respects from accounting principles generally accepted in the United States of America. Application of accounting principles generally accepted in the United States of America would have affected the results of operations for each of the years ended 31 December 2001, 2000 and 1999 and shareholders’ equity as of 31 December 2001, 2000 and 1999 to the extent summarized in the notes to the consolidated financial statements.
PricewaterhouseCoopers | KPMG Accountants N.V. |
F-3
CONSOLIDATED BALANCE SHEETS — ASSETS
| | | | | | | | | | | | |
| | | Note
| | Dec. 31, 2003
| | Dec. 31, 2002
| | Dec. 31, 2001
|
(in millions of €)
| | | | Gross
| | Dep. &
Amort.
| | Net
| | Net
| | Net
|
INTANGIBLE ASSETS | | 9.1 | | 3,242.2 | | 1,609.4 | | 1,632.8 | | 3,903.0 | | 4,234.9 |
GOODWILL | | 8 | | 8,214.4 | | 2,362.9 | | 5,851.5 | | 8,710.9 | | 10,319.3 |
TANGIBLE ASSETS | | 9.1 | | | | | | | | | | |
Owned outright | | | | 42,062.9 | | 22,913.5 | | 19,149.4 | | 24,682.3 | | 28,662.9 |
Under concession | | | | 8,469.9 | | 2,869.0 | | 5,600.9 | | 5,604.0 | | 5,532.5 |
Construction in progress and down- payments | | | | 2,383.5 | | 6.5 | | 2,377.0 | | 2,989.5 | | 3,796.2 |
FINANCIAL ASSETS | | | | | | | | | | | | |
Equity securities | | 10.1 | | 3,551.8 | | 1,347.9 | | 2,203.9 | | 5,733.6 | | 6,653.1 |
Companies accounted for under the equity method | | 7 | | 3,396.4 | | 62.9 | | 3,333.5 | | 3,270.4 | | 3,254.0 |
Other financial assets | | | | 2,379.5 | | 899.0 | | 1,480.5 | | 2,095.8 | | 1,256.2 |
TOTAL NON-CURRENT ASSETS | | | | 73,700.6 | | 32,071.1 | | 41,629.5 | | 56,989.5 | | 63,709.1 |
INVENTORIES & WORK-IN-PROGRESS | | 11.1 | | 1,955.7 | | 105.6 | | 1,850.1 | | 2,652.6 | | 4,203.3 |
ACCOUNTS RECEIVABLE | | | | | | | | | | | | |
Trade accounts and notes receivable | | | | 9,541.2 | | 557.2 | | 8,984.0 | | 9,967.1 | | 10,212.6 |
Other receivables | | | | 3,564.7 | | 135.8 | | 3,428.9 | | 3,702.7 | | 3,377.4 |
MARKETABLE SECURITIES AND CASH AND CASH EQUIVALENTS | | | | | | | | | | | | |
Marketable securities | | 10.4 | | 5,123.8 | | 108.8 | | 5,015.0 | | 2,575.7 | | 1,122.6 |
Cash and cash equivalents | | | | 6,688.0 | | — | | 6,688.0 | | 5,963.2 | | 4,628.6 |
PREPAID EXPENSES | | 12 | | 2,354.7 | | — | | 2,354.7 | | 2,300.5 | | 2,227.8 |
TOTAL CURRENT ASSETS | | | | 29,228.1 | | 907.4 | | 28,320.7 | | 27,161.8 | | 25,772.3 |
| | | | |
| |
| |
| |
| |
|
TOTAL ASSETS | | | | 102,928.7 | | 32,978.5 | | 69,950.2 | | 84,151.3 | | 89,481.4 |
| | | | |
| |
| |
| |
| |
|
The accompanying notes are an integral part of these consolidated statements.
F-4
CONSOLIDATED BALANCE SHEETS LIABILITIES AND SHAREHOLDERS’ EQUITY
| | | | | | | | | | | |
(in millions of €)
| | Note
| | Dec. 31,
2003
| | | Dec. 31,
2002
| | | Dec. 31,
2001
| |
Share capital | | | | 2,015.3 | | | 2,014.8 | | | 2,052.6 | |
Additional paid-in capital | | | | 6,470.1 | | | 6,439.8 | | | 6,843.3 | |
Consolidated reserves | | | | 3,186.9 | | | 5,048.9 | | | 4,132.8 | |
Cumulative translation adjustment | | 13.3 | | (2,238.8 | ) | | (1,691.0 | ) | | 112.3 | |
Net income/(loss) for the year | | | | (2,165.2 | ) | | (862.5 | ) | | 2,086.7 | |
Treasury stock | | 13.4 | | (372.6 | ) | | (372.6 | ) | | (830.5 | ) |
SHAREHOLDERS’ EQUITY | | | | 6,895.7 | | | 10,577.5 | | | 14,397.2 | |
MINORITY INTERESTS | | 14 | | 4,847.2 | | | 5,190.7 | | | 6,447.0 | |
SHAREHOLDERS’ EQUITY & MINORITY INTERESTS | | | | 11,742.9 | | | 15,768.2 | | | 20,844.2 | |
SPECIAL CONCESSION ACCOUNTS | | | | 4,847.4 | | | 4,849.2 | | | 4,668.6 | |
RESERVES FOR CONTINGENCIES AND LOSSES | | 15 | | 10,440.4 | | | 10,208.1 | | | 9,437.1 | |
BORROWINGS & LONG-TERM DEBT | | 16.2 | | 26,694.1 | | | 34,544.5 | | | 33,760.6 | |
ACCOUNTS PAYABLE | | | | | | | | | | | |
Advances and down-payments received on orders | | | | 942.7 | | | 1,543.9 | | | 3,071.6 | |
Trade payables | | | | 6,617.6 | | | 6,643.2 | | | 6,343.3 | |
Other accounts payable | | | | 5,880.6 | | | 6,558.6 | | | 6,854.5 | |
DEFERRED INCOME | | 12 | | 2,784.5 | | | 4,035.5 | | | 4,501.5 | |
| | | | |
|
| |
|
| |
|
|
TOTAL LIABILITIES AND SHAREHOLDERS’ EQUITY | | | | 69,950.2 | | | 84,151.3 | | | 89,481.4 | |
| | | | |
|
| |
|
| |
|
|
The accompanying notes are an integral part of these consolidated statements.
F-5
CONSOLIDATED STATEMENTS OF INCOME
| | | | | | | | | | | | | | |
(in millions of €)
| | Note
| | Dec. 31, 2003
| | | Dec. 31, 2002 pro forma*
| | | Dec. 31, 2002
| | | Dec. 31, 2001
| |
REVENUES | | | | 39,621.8 | | | 40,783.9 | | | 46,089.8 | | | 42,359.2 | |
OTHER INCOME | | | | 1,488.4 | | | 2,073.6 | | | 2,073.6 | | | 1,774.1 | |
Other operating income | | 3.1 | | 1,044.9 | | | 1,606.3 | | | 1,606.3 | | | 1,350.3 | |
Income from mixed inter-municipal companies and partnerships | | 3.2 | | 443.5 | | | 467.3 | | | 467.3 | | | 423.8 | |
OPERATING EXPENSES | | | | 35,383.1 | | | 36,079.0 | | | 41,384.9 | | | 36,970.8 | |
Purchases and changes in inventories | | | | 12,912.1 | | | 11,821.4 | | | 17,127.3 | | | 15,746.0 | |
Receipts on behalf of local authorities | | | | 1,035.4 | | | 1,081.2 | | | 1,081.2 | | | 894.7 | |
Taxes and related payments | | | | 820.5 | | | 852.7 | | | 852.7 | | | 828.0 | |
Salaries, wages and social security charges | | | | 8,236.3 | | | 9,295.0 | | | 9,295.0 | | | 8,426.6 | |
Other operating expenses | | | | 12,378.8 | | | 13,028.7 | | | 13,028.7 | | | 11,075.5 | |
OPERATING INCOME BEFORE DEPRECIATION, AMORTIZATION AND PROVISIONS | | | | 5,727.1 | | | 6,778.5 | | | 6,778.5 | | | 7,162.5 | |
Depreciation, amortization and provisions | | | | 2,522.2 | | | 3,070.9 | | | 3,070.9 | | | 3,098.7 | |
OPERATING INCOME | | | | 3,204.9 | | | 3,707.6 | | | 3,707.6 | | | 4,063.8 | |
FINANCIAL LOSS | | 4 | | (880.1 | ) | | (976.0 | ) | | (976.0 | ) | | (1,257.7 | ) |
CURRENT INCOME OF CONSOLIDATED COMPANIES | | | | 2,324.8 | | | 2,731.6 | | | 2,731.6 | | | 2,806.1 | |
EXCEPTIONAL INCOME/(LOSS) | | 5 | | (2,757.4 | ) | | (1,783.7 | ) | | (1,783.7 | ) | | 826.2 | |
Income tax | | 6 | | (721.0 | ) | | (657.1 | ) | | (657.1 | ) | | (722.0 | ) |
Share in income of companies accounted for under the equity method | | 7 | | 165.7 | | | 51.4 | | | 51.4 | | | 333.7 | |
INCOME/(LOSS) BEFORE AMORTIZATION OF GOODWILL | | | | (987.9 | ) | | 342.2 | | | 342.2 | | | 3,244.0 | |
Amortization of goodwill | | | | (266.8 | ) | | (382.6 | ) | | (382.6 | ) | | (422.7 | ) |
Group share of goodwill amortization | | | | (236.2 | ) | | (350.1 | ) | | (350.1 | ) | | (376.6 | ) |
NET INCOME/(LOSS) BEFORE MINORITY INTERESTS | | | | (1,254.7 | ) | | (40.4 | ) | | (40.4 | ) | | 2,821.3 | |
Minority interests | | | | 910.5 | | | 822.1 | | | 822.1 | | | 734.6 | |
NET INCOME/(LOSS) | | | | (2,165.2 | ) | | (862.5 | ) | | (862.5 | ) | | 2,086.7 | |
EARNINGS/(LOSS) PER SHARE (in €) | | | | (2.18 | ) | | (0.87 | ) | | (0.87 | ) | | 2.12 | |
DILUTED EARNINGS/(LOSS) PER SHARE (in €) | | | | (2.18 | ) | | (0.87 | ) | | (0.87 | ) | | 2.08 | |
* See Note 1.0 § Energy Trading.
The accompanying notes are an integral part of these consolidated statements.
F-6
CONSOLIDATED STATEMENTS OF CASH FLOWS
| | | | | | | | | |
(in millions of €)
| | Dec. 31,
2003
| | | Dec. 31,
2002
| | | Dec. 31,
2001
| |
Net income/(loss) | | (2,165.2 | ) | | (862.5 | ) | | 2,086.7 | |
Share in net income of companies accounted for under the equity method (net of dividends received) | | 4.6 | | | (19.0 | ) | | (220.5 | ) |
Net depreciation, amortization and provisions | | 3,785.6 | | | 5,659.4 | | | 3,553.2 | |
Net capital gains on disposals of assets | | 1,310.3 | | | (1,362.1 | ) | | (1,880.3 | ) |
Minority interests | | 910.5 | | | 822.1 | | | 734.6 | |
Other | | (118.9 | ) | | 618.8 | | | 543.0 | |
Gross Cash Flow | | 3,726.9 | | | 4,856.7 | | | 4,816.7 | |
Changes in: | | | | | | | | | |
- Inventory | | 51.9 | | | 62.6 | | | 45.2 | |
- Receivables | | 292.7 | | | (806.5 | ) | | (144.2 | ) |
- Payables | | 512.2 | | | 620.4 | | | 485.2 | |
Total operating working capital cash flows | | 856.8 | | | (123.5 | ) | | 386.2 | |
- Other | | (88.1 | ) | | 93.3 | | | 199.6 | |
CASH FLOW FROM OPERATING ACTIVITIES | | 4,495.6 | | | 4,826.5 | | | 5,402.5 | |
Purchases of tangible and intangible investments | | (2,804.4 | ) | | (4,157.8 | ) | | (4,391.1 | ) |
Purchase of financial investments | | (1,501.7 | ) | | (4,174.0 | ) | | (3,432.1 | ) |
Disposals of tangible and intangible assets | | 230.2 | | | 878.9 | | | 422.8 | |
Disposals of financial assets | | 7,806.7 | | | 4,154.7 | | | 3,128.4 | |
Cash acquired from acquisitions net of cash disposed of in divestitures (1) | | (61.8 | ) | | (34.0 | ) | | 271.6 | |
Decrease/(increase) in other assets | | 20.0 | | | 186.3 | | | (267.2 | ) |
Other cash requirements | | (81.1 | ) | | (55.0 | ) | | (64.4 | ) |
CASH FLOW FROM (USED IN) INVESTING ACTIVITIES | | 3,607.9 | | | (3,200.9 | ) | | (4,332.0 | ) |
Dividends distributed | | (1,592.5 | ) | | (1,646.0 | ) | | (1,569.2 | ) |
Repayment of long-term debt | | (11,831.5 | ) | | (14,738.1 | ) | | (8,398.6 | ) |
Increase in long-term debt | | 7,342.1 | | | 18,121.0 | | | 8,947.4 | |
Treasury stock movements | | 0.0 | | | (145.2 | ) | | 53.1 | |
Increase in total shareholders’ equity | | (108.1 | ) | | 128.1 | | | 78.0 | |
CASH FLOW FROM (USED IN) FINANCING ACTIVITIES | | (6,190.0 | ) | | 1,719.8 | | | (889.3 | ) |
Effect of changes in consolidation method & exchange rates | | 14.6 | | | (356.8 | ) | | (18.2 | ) |
TOTAL CASH FLOW FOR THE YEAR | | 1,928.1 | | | 2,988.6 | | | 163.0 | |
CASH AT BEGINNING OF YEAR | | 7,875.0 | | | 4,886.4 | | | 4,723.4 | |
| | |
|
| |
|
| |
|
|
CASH AT YEAR-END (2) | | 9,803.1 | | | 7,875.0 | | | 4,886.4 | |
| | |
|
| |
|
| |
|
|
| (1) | Cash balances of companies acquired or over which the Group has gained control less the cash balances of consolidated companies sold. |
| (2) | Cash balances comprise the following: |
| | | | | | |
(in millions of €)
| | Dec. 31,
2003
| | Dec. 31,
2002
| | Dec. 31,
2001
|
Cash and cash equivalents | | 6,688.0 | | 5,963.1 | | 4,628.6 |
Marketable securities (3) | | 3,115.1 | | 1,911.9 | | 257.8 |
| | |
| |
| |
|
TOTAL | | 9,803.1 | | 7,875.0 | | 4,886.4 |
| | |
| |
| |
|
| (3) | The Fortis shares reclassified in marketable securities in 2003 are not included in this item. Marketable securities with maturities of less than 90 days only. The consolidated reconciliation with balance sheet marketable securities is as follows: |
| | | | | | |
(in millions of €)
| | Dec. 31,
2003
| | Dec. 31,
2002
| | Dec. 31,
2001
|
Marketable securities with maturities of less than 90 days only | | 3,115.1 | | 1,911.9 | | 257.8 |
Other marketable securities | | 1,899.9 | | 663.8 | | 864.8 |
| | |
| |
| |
|
TOTAL BALANCE SHEET MARKETABLE SECURITIES | | 5,015.0 | | 2,575.7 | | 1,122.6 |
| | |
| |
| |
|
The accompanying notes are an integral part of these consolidated statements.
F-7
CONSOLIDATED STATEMENTS OF CHANGES IN SHAREHOLDERS’ EQUITY
| | | | | | | | | | | | | | | | | | | | |
| | | | | Share capital
| | | Additional paid-in capital
| | | Consolidated reserves
| | | Cumulative translation adjustment
| | | Treasury stock
| | | Shareholders’ equity
| |
| | | Note | | 13.1 | | | | | | 13.2 | | | 13.3 | | | 13.4 | | | | |
Shareholders’ equity as of December 31, 2000 | | | | 2,042.7 | | | 6,690.7 | | | 4,979.0 | | | 231.7 | | | (810.0 | ) | | 13,134.1 | |
Shares issued for employees | | | | 2.2 | | | 12.9 | | | 0.2 | | | — | | | — | | | 15.3 | |
Conversion of debenture loans and exercise of equity warrants attached to Northumbrian shares | | | | 7.7 | | | 59.3 | | | 0.8 | | | — | | | — | | | 67.8 | |
Change in value of treasury shares | | | | — | | | — | | | 15.8 | | | — | | | (20.5 | ) | | (4.7 | ) |
Dividends distributed | | | | — | | | — | | | (921.0 | ) | | — | | | 4.0 | | | (917.0 | ) |
Changes in cumulative translation adjustment | | | | — | | | — | | | — | | | (119.4 | ) | | — | | | (119.4 | ) |
Change in accounting principle related to loan issue costs | | 13.6 | | — | | | — | | | 50.5 | | | — | | | — | | | 50.5 | |
Change in accounting principle related to transaction gains and losses | | 13.6 | | — | | | — | | | 3.1 | | | — | | | — | | | 3.1 | |
Reversal of goodwill | | 13.5 | | — | | | 77.3 | | | — | | | — | | | — | | | 77.3 | |
Miscellaneous | | | | — | | | 3.1 | | | 0.4 | | | — | | | — | | | 3.5 | |
Net income for the year | | | | — | | | — | | | 2,090.7 | | | — | | | (4.0 | ) | | 2,086.7 | |
Shareholders’ equity as of December 31, 2001 | | | | 2,052.6 | | | 6,843.3 | | | 6,219.5 | | | 112.3 | | | (830.5 | ) | | 14,397.2 | |
Shares issued for employees | | | | 25.4 | | | 225.1 | | | 2.6 | | | — | | | — | | | 253.1 | |
Conversion of debenture loans | | | | 1.5 | | | 10.8 | | | 0.2 | | | — | | | — | | | 12.5 | |
Cancellation of treasury shares | | | | (64.7 | ) | | (767.6 | ) | | (120.9 | ) | | — | | | 953.2 | | | 0.0 | |
Change in value of treasury shares | | | | — | | | — | | | — | | | — | | | (146.7 | ) | | (146.7 | ) |
Reclassification of treasury shares | | | | — | | | — | | | — | | | — | | | (348.6 | ) | | (348.6 | ) |
Dividends distributed | | | | — | | | — | | | (1,006.6 | ) | | — | | | 2.5 | | | (1,004.1 | ) |
Changes in cumulative translation adjustment | | | | — | | | — | | | — | | | (1,803.3 | ) | | — | | | (1,803.3 | ) |
Application of CRC Regulation 2000.06 on liabilities | | 13.5 | | — | | | — | | | (48.3 | ) | | — | | | — | | | (48.3 | ) |
Reversal of goodwill | | 13.5 | | — | | | 128.2 | | | — | | | — | | | — | | | 128.2 | |
Net income for the year | | | | — | | | — | | | (860.0 | ) | | — | | | (2.5 | ) | | (862.5 | ) |
Shareholders’ equity as of December 31, 2002 | | | | 2,014.8 | | | 6,439.8 | | | 4,186.5 | | | (1,691.0 | ) | | (372.6 | ) | | 10,577.5 | |
Conversion of debenture loans | | | | 0.5 | | | 3.3 | | | — | | | — | | | — | | | 3.8 | |
Dividends distributed | | | | — | | | — | | | (1,001.6 | ) | | — | | | 2.0 | | | (999.6 | ) |
Changes in cumulative translation adjustment | | | | — | | | — | | | — | | | (547.8 | ) | | — | | | (547.8 | ) |
Reversal of goodwill | | | | — | | | 27.0 | | | — | | | — | | | — | | | 27.0 | |
Net income for the year | | | | — | | | — | | | (2,163.2 | ) | | — | | | (2.0 | ) | | (2,165.2 | ) |
Shareholders’ equity as of December 31, 2003 | | | | 2,015.3 | | | 6,470.1 | | | 1,021.7 | | | (2,238.8 | ) | | (372.6 | ) | | 6,895.7 | |
The accompanying notes are an integral part of these consolidated statements.
F-8
NOTES TO THE CONSOLIDATED FINANCIAL STATEMENTS
NOTE 1- SUMMARY OF SIGNIFICANT ACCOUNTING POLICIES
Basis used
The consolidated financial statements are prepared in accordance with accounting principles generally accepted in France (“French GAAP”) and the provisions of French laws and regulations and in particular the consolidated financial statement regulations (Regulation No. 99-02 of the Accounting Regulation Committee —“Comité de la Réglementation Comptable”).
Since January 1, 2002, SUEZ has applied Regulation No. 2000-06 concerning liabilities, adopted by the French Accounting Regulation Committee. Application of this regulation from January 1, 2002 did not have a material impact on shareholder’s equity of the Group (see note 13.6).
The Group did not opt for early application of CRC Regulation No. 2002-10 with respect to the amortization and depreciation of assets.
Use of estimates
The preparation of financial statements in accordance with French GAAP requires the use of estimates and assumptions to determine the reported amounts of assets and liabilities, the disclosure of contingent assets and liabilities at the date of the financial statements, and revenues and expenses reported during the period.
The preparation of the Group’s consolidated financial statements requires estimates to be made concerning the percentage of completion of long-term contracts, the value in use of long-lived assets as indicated in Note 1-F, reserves (particularly for nuclear waste reprocessing and storage and for dismantling of facilities as specified in Note 15) as well as pension and similar commitments (See Note 1-R) and financial instruments (See Note 1-S).
Due to uncertainties inherent in the estimation process, the Group regularly revises its estimates using currently available information. Actual results could differ from those estimates.
Consolidated financial statement presentation currency
The figures in the financial statements are presented in million of euro (€), unless indicated otherwise.
Five-for-one share split
A five-for-one share split was approved by the Annual General Meeting of May 4, 2001 and took effect May 15, 2001. All per share data has been adjusted to enable comparative analysis.
A. CONSOLIDATION PRINCIPLES
Scope and method of consolidation
The consolidation methods followed by the Group consist of the full consolidation method, the equity method and the proportional consolidation method.
The accounts of all significant subsidiaries over which the Group directly or indirectly exercises exclusive legal orde facto control are fully consolidated.De facto control may result from contractual agreements or from the ability to exercise the majority of the voting rights at the subsidiary’s shareholders meetings. Exclusive control may be deemed to exist where the direct or indirect shareholding exceeds 40% of voting rights, provided no third-party holds, directly or indirectly, a greater share in voting rights, particularly in the case of listed subsidiaries.
F-9
The Group proportionately consolidates companies which are jointly controlled by two or more shareholders based upon the Group’s percentage of control.
Companies over which the Group exercises significant influence, which is presumed where the shareholding exceeds 20% of the capital, are accounted for under the equity method. Under the equity method of accounting, the Group recognizes as income its proportionate share of the investee’s net income or loss in the accompanying consolidated statements of income as “Share in income of companies accounted for under the equity method”, except in the case of mixed inter-municipal companies treated as described in Note 1-G below.
Sales and results of operations of subsidiaries acquired or disposed of during the year are recognized in the consolidated statements of income from the date of acquisition or up to the date of disposal, respectively. However, for major disposals, and pursuant to paragraph 23.100 of CRC Regulation No. 99-02, the Group reserves the option to present the contribution of entities sold during the year in the consolidated statements of income under “Share in income of companies accounted for under the equity method”.
All material inter-company balances and transactions have been eliminated on consolidation.
A list of significant consolidated subsidiaries, investments accounted for under the equity method and companies proportionately consolidated is presented in Note 25.
Treasury stock
SUEZ common shares held by the parent company or by fully or proportionately consolidated companies are:
| | • | recorded as marketable securities in the accompanying consolidated balance sheets, where such treasury stock is explicitly earmarked for distribution to employees or is intended to regularize stock exchange prices, |
| | • | deducted from consolidated shareholders’ equity in all other situations. |
The accounting treatment of income generated by the sale of treasury stock and of write-down reserves depends on the intended purpose of holding the stock. Only sales and reserves relating to securities classified as marketable securities are recorded in the accompanying consolidated statements of income. Other income generated by such sales, as well as the corresponding tax impact, is recognized in the consolidated statements of changes in shareholders’ equity.
B. FOREIGN CURRENCY TRANSLATION METHODS
1. Foreign currency transactions
Foreign currency transactions are recorded at the exchange rate prevailing on the date of the transaction. Monetary assets and liabilities denominated in foreign currencies are remeasured at year-end exchange rates. As of January 1, 2001, in accordance with the preferred method laid down in CRC Regulation No. 99-02, transaction gains and losses related to monetary assets and liabilities denominated in foreign currencies are recorded in the consolidated statement of income in the period to which they relate.
2. Translation of the financial statements of foreign companies
The financial statements of foreign companies are prepared in local currency or in the operating currency of each subsidiary.
F-10
Balance sheet items are translated into euro at official year-end exchange rates. Differences resulting from changes in exchange rates compared with the previous year-end are included in cumulative translation adjustment in the consolidated statements of changes in shareholders’ equity.
Weighted average annual rates are applied to income statement accounts and the statement of cash flows.
With respect to the Argentine crisis, for the 2002 and 2001 year-ends, the Group translated the assets and liabilities and the unrealized exchange losses on debt denominated in strong currencies of Argentine companies at the closing exchange rate of ARS 1 to € 0.2832 on December 31, 2002 (ARS 1 to € 0.7008 on December 31, 2001).
C. INTANGIBLE ASSETS
Intangible assets primarily include:
| | • | fees and amounts paid or payable in return for rights as a concession holder or to operate public sector facilities, amortized over the contract period; |
| | • | purchased goodwill, leasehold rights, customer lists, trademarks, patents and licenses, amortized over periods not exceeding their useful lives. |
Amortization is provided on a straight-line basis over the following estimated useful lives (in years):
| | | | |
| | | Minimum
| | Maximum
|
Concession rights: | | | | |
Water | | 7 | | 25 |
Infrastructures | | 10 | | 65 |
Purchased goodwill | | 10 | | 25 |
Trademarks | | 5 | | 28 |
Patents | | 1 | | 20 |
Other intangible assets (a) | | 1 | | 30 |
| (a) | As an exception to the rule, the intangible assets relating to surface and underground water drawing rights held by Aguas Andinas are not amortized on a straight-line basis, since there is no limit to their rights, their useful life is deemed indefinite. The gross value of these intangible assets amounted to € 171.5 million as of December 31, 2003. |
The costs of raising capital are deducted from shareholders’ equity.
Research and Development activities primarily relate to various studies regarding technological innovation, improvements to plant efficiency, reliability, safety, environmental protection, service quality and the use of energy resources.
Research and Development costs with no specific contractual right of recovery are expensed as incurred. They amounted, excluding technical assistance costs, to € 79 million, € 126 million and € 130 million for the years ended December 31, 2003, 2002 and 2001 respectively.
D. GOODWILL
Goodwill in the accompanying consolidated balance sheets represents the excess of the purchase price over the fair value of all assets and liabilities acquired in business combinations. If the purchase price is less than the fair value of assets and liabilities acquired, negative goodwill is recorded as a liability in the accompanying
F-11
consolidated balance sheets as “Other reserves for contingencies and losses”. Initial estimates of fair value are finalized by the end of the next full year following the date of the acquisition. In the event of significant adverse changes in the elements used to calculate the amortization schedules, an exceptional amortization charge is recorded.
The assets and liabilities of fully consolidated subsidiaries are not revalued in the event the Group acquires additional shares in that entity. Instead, goodwill is recorded corresponding to the difference between the acquisition price of the additional securities and the relevant share in minority interests as of the date of the new acquisition.
Goodwill is amortized using the straight-line method over periods based on the Group’s initial assumptions and objectives at the time of the acquisition. When the Group acquires an entity within distinct geographical or business segments, the goodwill is allocated to those segments and the corresponding charge is either amortized or reversed into income according to the specific characteristics of the goodwill.
Negative goodwill is reversed into income according to the plan set up at the time of the acquisition, based on initial objectives and estimates of forecasted losses for the related acquired business.
| | |
Group business
| | Amortization periods
applied (in years)
|
Energy | | 20-40 |
SE (formerly SELS) (a) | | 20-40 |
SEIS | | 30 |
Other (Communication) | | 10-20 |
| (a) | The goodwill recorded in September 2000 following the Group’s public offer of exchange for UWR (United Water Resources) was amortized over 75 years, in accordance with the regulated water distribution industry in the United States. |
Prior to January 1, 2000, goodwill resulting from a business combination financed by an exchange of the parent company shares was directly offset against paid-in capital. Those goodwill balances are amortized in memo accounts over the expected lives of the underlying businesses. The fair value of this goodwill is monitored using an identical approach to that adopted for long-lived assets and described in Note 1-F, and a definitive, exceptional impairment of the goodwill is recorded where appropriate.
On disposal of all or part of these businesses, the theoretical net value of goodwill is taken into account in determining the consolidated basis in the securities or business sold. As such, the sale of the Fortis B and Elia securities in 2001 and 2002 and the Cespa securities in 2003 led to the deduction, from capital gains, of a portion of the goodwill initially offset against additional paid-in capital and merger premiums, in the amount of € 77.3 million, € 128.2 million and € 27 million respectively.
E. TANGIBLE ASSETS
Tangible assets are stated at cost or, in the case of items which are subject to legal revaluation, at their revalued amount, after deduction of accumulated depreciation. Expenditures for repairs and maintenance, that do not improve or extend the lives of the respective assets are expensed as incurred.
F-12
Depreciation is provided over the estimated useful lives in years as follows:
| | | | |
Main depreciation periods (years)
| | Minimum
| | Maximum
|
Machinery and equipment: | | | | |
Energy Production — Transport (a) | | 5 | | 50 |
Installation — Maintenance | | 3 | | 10 |
Environment | | 2 | | 100 |
Communication | | 2 | | 10 |
Infrastructure and networks | | 5 | | 100 |
Vehicles | | 3 | | 10 |
Other tangible assets | | 2 | | 33 |
| (a) | The law of January 31, 2003 adopted by the Belgian Chamber of Representatives, with respect to the gradual phase-out of nuclear energy for the industrial production of electricity, stipulated that nuclear power stations will be decommissioned forty years from the date of their commissioning. Consequently, the depreciation period for the respective assets was reviewed and adjusted prospectively to 40 years as of January 1, 2003 (i.e., depreciation reduced by € 71 million for fiscal 2003). |
The range of useful lives is due to the diversity of the assets in each category. The minimum periods relate to smaller equipment and furniture, while the maximum periods concern network infrastructures.
Other than construction in progress, tangible assets include:
Assets owned outright:
These are assets owned directly by the Group that are valued and depreciated according to the current practices in each business.
Interest recorded during the construction phase of a self-constructed asset is systematically capitalized.
Assets Under Concession, which include:
| | • | assets acquired by the Group as required for operations under the concession contract. Such assets are part of the concession assets and become the property of the grantor of the concession at the end of the concession contract. Depreciation of these assets is charged to income over the shorter of their estimated useful lives or the remaining concession period. |
| | • | assets provided by the grantor of the concession at the inception of the contract for which the concession holder has the obligation to make capital renewals and replacements. As a result of this obligation, a corresponding concession liability has been recorded for the amount of the assets provided as “special concession accounts”. Depreciation of these assets is charged to this liability using the methods and lives described above, with no effect on the consolidated statements of income (see Note 1.L). |
Further discussion of accounting policies for concessions is set forth in Note 1.L.
Capital leases
The Group capitalizes assets acquired either under capital leases or similar contracts. The present value of the remaining lease payments for these assets is recognized as a financial liability. If there is reasonable assurance that the lessee will obtain ownership of the asset upon expiration of the contract, the related asset is depreciated over its useful life. Otherwise, the capitalized asset is depreciated over the shorter of the life of the lease agreement or the useful life of the asset.
F-13
The main criteria used by the Group to determine whether a lease agreement is a capital or operating lease are as follows: existence of an automatic transfer or transfer of ownership option clause, the conditions for exercising this clause, comparison between the lease term and the estimated useful life of the asset, and a comparison of the present value of future lease payments with the asset’s fair value.
F. IMPAIRMENT OF TANGIBLE AND INTANGIBLE FIXED ASSETS
Tangible fixed assets are written down to value in use when changes in circumstances indicate that the carrying amount of an asset may not be recoverable. Impairment is determined for each group of assets by considering management’s expectations of future economic and operating conditions of the respective assets to be held for use. Should this determination indicate that an asset is impaired, a write-down is recognized which is equivalent to the difference between carrying value and fair value. Value in use is determined on the basis of market prices, discounted cash flows and by reference to replacement cost for used equipment, cost of alternative technologies and recent transactions for similar businesses.
Intangible assets and goodwill are written down (through revision of amortization plans or accelerated amortization) to the greater of value in use or market value (or solely to market value for assets which the Group has decided to sell) when negative conditions are identified, notably compared to items used to define original amortization plans.
The value in use is determined based on an estimation of the value and future benefits of the related assets. In these valuation models, future cash flows are taken from business plans approved by management and specific to each entity. Financial assumptions are adjusted to reflect the specific characteristics of the assets concerned at prevailing market conditions.
The market value is the amount which could be obtained, at the period-end, from the sale of the assets concerned on an arm’s length basis, net of disposal costs. This amount is estimated with reference to the stock market price, where one exists, or comparable transactions in similar business sectors or on comparable stock markets.
Application to fiscal year 2003:
The Group reviewed its main goodwill balances as of December 31, 2003.
Where material negative movements were identified, the approach adopted primarily consisted in comparing the value in use or market value of the main operating entities to their corresponding net assets (including goodwill).
In terms of the operating entities which the Group intends to operate on a going concern basis, the Group applied the usual valuation methods for asset impairments subsequent to the reviews, based on the following main economic data:
| | • | discount rates of between 5.2% and 11.6%, depending on the specific characteristics of the operating entities concerned, |
| | • | revenue growth not exceeding 2% excluding inflation and terminal value growth rates in line with available market data specific to the operating segments concerned. |
These reviews performed in December 2003 led to an exceptional write-down of € 309.1 million (see Note 8), due to a number of adverse changes during the year, specifically related to commercial expectations in the water distribution sector in the United States (€ 146.9 million) and Waste Services in Germany (€ 100 million).
F-14
For the operating entities the Group has decided to sell, the book value of the related assets was adjusted to the estimated market value if the latter was inferior. Where negotiations are ongoing, this was determined by using the best estimate that could be made as to the outcome at the accounts closing date. Accordingly, there were write-downs in the Communication segment (intangible and financial assets, goodwill) for a total of € 904 million. Likewise, exceptional charges in the amount of € 84.6 million were recorded in the international water distribution sector and € 39.9 million in the US energy sector, including € 50.3 million for the write-down of goodwill.
G. COMPANIES ACCOUNTED FOR UNDER THE EQUITY METHOD
Financial statements of companies accounted for under the equity method are adjusted, as necessary, to comply with Group accounting policies. The Group’s share in the reclassified net assets of these subsidiaries is included in assets on the consolidated balance sheets while its share of income is included on a specific line of the consolidated statement of income.
However, the mixed inter-municipal Belgian electricity and gas distribution companies are subject to the following exceptional treatment:
| • | These companies are consolidated under the equity method by Electrabel. Ownership of the mixed inter-municipal companies is held by local authorities, in partnership with Electrabel. The mixed inter-municipal companies distribute gas and electricity produced by Electrabel and Distrigaz to non-industrial customers and industrial customers which do not qualify for deregulation (and which do not exceed a given consumption threshold), hereinafter referred to as “the distribution customers”, in Belgium. |
| • | The municipalities hold a monopoly over distribution to this customer segment, primarily under the specific provisions of the Law of March 10, 1925. Mixed inter-municipal bylaws and Belgian law ensure that the local authorities, in partnership with Electrabel, maintain control of the management of the mixed inter-municipal companies, irrespective of the ownership percentages of the shareholders. In order to convey the importance and economic reality of this activity, Electrabel’s share in the pre-tax income of the mixed inter-municipal companies is presented in operating income under the heading “Income from mixed inter-municipal companies and joint operations” in the consolidated statements of income. |
| • | For the customer segment eligible for deregulation in Belgium, electricity is supplied either directly by Electrabel, or by Electrabel Customer Solutions for residential customers, with the inter-municipal companies receiving a fee for use of the distribution network. |
H. OTHER FINANCIAL ASSETS
These include:
Unconsolidated investments in equity securities
These comprise long-term investments enabling the development of business relations with the issuing company, or providing the Group with control or significant influence over the issuing company, but which are not consolidated. The companies under exclusive or joint control, or over which the Group exercises significant influence, excluded from the scope of consolidation due to their immaterial nature, represent in aggregate less than 5% of the following SUEZ consolidated key figures: revenues, net income, borrowings, shareholders’ equity.
F-15
These investments are recorded at acquisition cost. When appropriate, write-down reserves are recorded to reduce the carrying value to the market value based on the average stock market price of the month preceding the closing or their value in use based upon the estimated intrinsic value and expected financial return of these investments.
Other investments
These assets comprise investments held on a long or medium-term basis, but which do not satisfy the necessary criteria to qualify as investments in equity securities.
These investments are recorded at acquisition cost. When appropriate, write-down reserves are recorded to reduce the carrying value to their value in use based upon the estimated intrinsic value and expected financial return of these investments.
Dividends from investments in unconsolidated subsidiaries and affiliates and in financial sector investments are recorded as income in the period in which the distribution decision is made by the investee.
Other fixed assets primarily comprise amounts due from investees and advances granted to partners. These receivables are recorded at nominal value and written down to the value in use where lower. Value in use is determined taking into account, where applicable, the market value of assets paid upon settlement pursuant to contractual agreements between the Group and its partners or of pledged collateral.
I. INVENTORIES AND WORK-IN-PROGRESS
Inventories of raw materials and supplies held for resale are recorded at the lower of average cost or market value. Work-in-progress is recorded at production cost which includes costs associated with material, labor and allocated overhead costs. Reserves for excess and obsolete inventory totaled € 105.6 million, € 137.6 million and € 124.1 million as of December 31, 2003, 2002 and 2001 respectively.
Nuclear fuel purchased is consumed in the process of producing electricity over a number of years. The nuclear fuel inventory is expensed as consumed based on estimates of the quantity of electricity produced per unit of fuel.
J. ACCOUNTS RECEIVABLE
Accounts receivable are stated at nominal value. Write-down reserves are recorded based on the estimated risk of non-recovery.
In regard to sales of trade receivables (see Note 20.5), transfers of financial assets are recorded as sales by the Group where the assets sold are out of reach of the Group and any potential Group creditors, there are no restrictions on the exchange or pledging of the assets sold by the transferee and the Group retains no legal control over the assets sold.
The reserve for uncollectible accounts amounted to € 557.2 million, € 603.2 million and €718.5 million as of December 31, 2003, 2002 and 2001 respectively.
“Trade accounts and notes receivable” also includes Notes receivable of € 118.6 million, € 79.6 million, and € 87.7 million as of December 31, 2003, 2002 and 2001 respectively.
“Other receivables” in the Group’s accompanying consolidated balance sheets consists primarily of tax receivables and current account advances to investees.
F-16
The Group’s accounts receivable are generated largely by sales to customers who are economically and geographically dispersed. In addition, the accounts receivable are generally short-term in duration. As a result, the Group believes that there is no significant concentration of credit risk.
K. MARKETABLE SECURITIES
Marketable securities are recorded in the accompanying consolidated balance sheets at their acquisition cost and are adjusted to the lower of cost or market value. In the case of listed securities, market value is determined based on the average stock market price for the month prior to the year-end. Unrealized gains are not recognized in the Group’s consolidated financial statements. All gains and losses realized on the disposal of these securities are recognized in the accompanying consolidated statement of income in the period of transaction. Realized gains and losses and reserves for unrealized losses are recorded in “Financial income/ (loss)” in the accompanying consolidated statements of income.
L. SPECIAL CONCESSION ACCOUNTS
These liabilities include (see Note 9.3):
| | • | The net liabilities of the Group for the return of fixed assets received from grantors of concessions, recorded in “Tangible Assets” in the accompanying consolidated balance sheets. Depreciation calculated on these assets is charged to the special concession account in liabilities of the accompanying consolidated balance sheets. There is no impact on net income in the accompanying consolidated statements of income related to these amounts. |
| | • | Financing provided by third parties for capital expenditures that the Group is responsible for under the terms of concession contracts, notwithstanding that the assets are owned by the grantor. |
| | • | Additional amortization recorded to reduce the carrying value of the concession assets financed by the Group to zero by the end of the concession agreement whenever the remaining life of the concession agreement is less than the estimated useful life of the concession assets. This amortization is deducted from income over the residual life of the contract. |
M. RESERVES FOR CONTINGENCIES AND LOSSES
A breakdown of reserves for contingencies and losses is presented in Note 15, together with details of the calculation principles applied.
Initial application, as of January 1, 2002, of CRC Regulation No. 2000-06 led the Group to amend the accounting method adopted for reserves covering the dismantling of installations. Until December 31, 2001, the Group recorded dismantling reserves, primarily for electricity power plants, where a legal, contractual or implicit obligation to carry out the work existed. These reserves, detailed in Note 15, were accrued over the period commencing with the commissioning of the installations concerned and terminating with the initiation of dismantling operations. In accordance with the provisions of CRC Regulation No. 2000-06, the present value of these commitments is now recorded in reserves for contingencies and losses from the commissioning of the installation, with recognition of an asset incidental to the installation concerned, depreciated over its useful life. The reserve recorded is adjusted at each period-end in accordance with the principles detailed in Note 15. The impact of this change in accounting method is detailed in Note 13.6.
In accordance with the transitional measures set forth in CRC Regulation No. 2002-10 of December 12, 2002, the Group maintained the previous accounting treatments for the reserves for major repairs in 2003.
F-17
N. BONDS AND BOND DISCOUNTS
Bonds issued with discounts are recorded in liabilities at their face value. The related unamortized discounts are recorded in prepaid expenses in the accompanying consolidated balance sheets.
These discounts are amortized over the term of the related bond in proportion to accrued interest.
As of January 1, 2001, in accordance with the preferred method laid down in CRC Regulation 99-02, loan issue costs are amortized on a straight-line basis over the term of the relevant contracts. These issue costs primarily comprise advertising costs (for public issues) and financial broker commissions.
O. REVENUES
Revenues for services rendered are recognized when the service is provided to the customer. Revenues for goods provided to customers are recognized when the goods are delivered to the customer.
Additionally, revenue recognition and inventory and work-in-progress valuation methods follow the rules applicable to the different activity sectors within the Group.
The methods adopted by the companies are, therefore, retained on consolidation.
Electricity and Gas Production, Transport and Distribution:
In Belgium, these activities are primarily carried out by Tractebel’s subsidiaries (Electrabel, ECS, Elia, Distrigaz and Fluxys). Electricity and gas are distributed indirectly by mixed inter-municipal companies (owned by municipalities and Electrabel and accounted for under the equity method) and directly by Electrabel and Distrigaz to industrial customers and by Electrabel Customer Solutions to deregulated individual customers. Transmission services are provided by Elia for high-voltage electricity, by mixed inter-municipal companies for low-voltage electricity and by Fluxys for gas.
For individual and industrial customers which do not qualify for deregulation in Belgium, the rates that apply to the distribution customers, as well as the investments related to these activities, are subject to recommendations and approval by the Belgian Regulatory Commission of Electricity and Gas, which reports to the Federal Minister. Power is supplied to the distribution customers through mixed inter-municipal companies in which Electrabel generally holds an investment.
The mixed inter-municipal companies do not have staff of their own. In accordance with the by-laws, Electrabel contributes, in particular, “the provision of its services, its skills and its experience in terms of distribution with a view to ensuring the daily running of the mixed inter-municipal company”. All work, supplies and services required for the purposes of the mixed inter-municipal company are therefore, with the exception of duly justified and authorized services of third parties, performed by Electrabel and its staff, with all expenditures being billed to the mixed inter-municipal companies. Thus, wages and salaries that are cross-charged by Electrabel include all charges, actually paid for the benefit of staff assigned, directly or indirectly, to run the mixed inter-municipal company. Similarly, expenditures related to the retirement of officers assigned to the distribution activity are borne by the mixed inter-municipal companies.
Energy Trading:
Until December 31, 2002, energy trading activities that required net cash settlement were presented net in “Revenues”. Trading activities that required physical delivery were presented gross in both “Revenues” and “Purchases and changes in inventories”.
F-18
As of January 1, 2003, energy trading transactions for its own account are recorded within “Revenues” net of sales and purchases. The contribution of operational energy trading activities relating to assets, with the aim of optimizing production assets and fuel purchase and energy sale portfolios, is recorded at the gross amount in both “Revenues” and “Purchases and changes in inventories”.
The impacts of this change in presentation method on the 2002 income statement are as follows:
| | | | |
(in millions of €)
| | Dec. 31,
2002
adjusted
for change in
presentation
| | Dec. 31,
2002
published
|
Revenues | | 40,783.9 | | 46,089.8 |
Purchases and changes in inventories | | 11,821.4 | | 17,127.3 |
This change in presentation method did not have any impact on operating income.
The summary above reports prior period comparisons on the basis of 2002 data adjusted for the change in method.
Water Distribution:
Water revenues include amounts billed to customers excluding value-added tax, but including surtaxes and amounts collected on behalf of third parties. The surtaxes collected on behalf of local authorities totaled € 1,035.4 million € 1,081.2 million and € 894.7 million for 2003, 2002 and 2001 respectively, and are recorded on a separate line under “Receipts on behalf of local authorities” in the accompanying consolidated statements of income. Commission fees received from the grantor of the concession are recorded as revenues.
Water delivered but un-metered at the year-end is recognized at the estimated selling price.
Turnkey Engineering/Energy Services/Construction:
The Group recognizes revenue using the percentage of completion method. A reserve is provided for projects which are expected to result in a loss on completion as soon as the loss is known. In estimating this loss, a percentage of potential, positive factors, notably additional invoicing and possible claims, may be taken into account. Assessment of such positive factors is based upon prior experience. All costs incurred for tenders are capitalized and fully reserved.
P. DISTINCTION BETWEEN CURRENT INCOME AND EXCEPTIONAL INCOME
Exceptional income and losses in the accompanying consolidated statements of income include non-recurring items resulting from ordinary activities and extraordinary items. The exceptional items resulting from ordinary activities are those which do not occur as a result of the general day-to-day operations of the business, either because their amount or their impact is unusual or because they rarely occur.
In order to ensure that the financial income/(loss) in the accompanying consolidated statements of income relates to current operations, the Group has adopted an exception to the French General Chart of Accounts of 1982 whereby all capital transactions related to investments carried on the cost basis are included as components of exceptional income/(loss).
These primarily consist of allocations and reversals of reserves for investments and amounts due on investments in subsidiaries and, where applicable, losses on these same receivables. For the sake of uniformity in presenting the consolidated statements of income, these items are classified as exceptional income/ (loss), where
F-19
gains and losses on disposals of securities are normally recorded. These items totaled € 51.3 million in 2003 (net allocation), € 958.6 million in 2002 (net allocation) and € 446.6 million in 2001 (net allocation).
However, for 2002 and prior fiscal years, the financial transactions of venture capital companies related to investments and amounts due from investees were recorded in current income, due to the corporate purpose of these companies. As of January 1, 2003, since the portfolio of venture capital companies was no longer material, the related transactions were no longer subject to this alternative treatment under Group standards.
Similarly, in order to maintain consistency in the presentation of financial income, and to isolate within a single income statement line item all impacts of the South-American crisis, and given the extent of the deterioration in the Argentine peso and Brazilian real exchange rates, the exchange losses recorded by subsidiaries operating in Argentina and Brazil on their liabilities denominated in strong currencies are presented in exceptional items, in the amount of € 180.6 million in 2003 (net gain), € -483.9 million in 2002 (net loss) and € - -335.8 million in 2001 (loss net of the utilization of reserves for emerging country risks).
Q. TAX
The Group computes income tax in accordance with prevailing tax legislation in the countries in the various locations where income is earned.
The Group provides for deferred income tax on temporary differences between financial and tax reporting, including tax losses and tax credits available for carry-forward. Net balances of deferred tax are calculated based on the tax position of each company or on the total income of companies included within consolidated tax returns. Tax assets are only recognized if there is reasonable assurance of recovering them in subsequent years.
As provided in CRC Regulation No. 99-02, the Group discounts deferred tax balances to present value (relating to timing differences incurred by transactions recorded at their undiscounted value) where, for a tax entity, the impact of discounting is material and a reliable reversal schedule can be produced;
Discount rates are determined individually for each entity, by reference to State bond rates and based on reversal maturities. Gains and losses resulting from changes in actuarial assumptions are recognized to the extent they exceed 10% of the discounted deferred tax asset or liability balance. The fraction exceeding this 10% threshold is spread over the average residual useful life of the assets concerned. As of December 31, 2003, unrecognized actuarial losses were not material, whereas they totaled € 13 million as of December 31, 2002.
Discounting deferred tax balances (in 2002 mainly concerning Ondeo Services UK, which was sold and accounted for under the equity method in the first half of 2003) led to a reduction in net deferred tax liabilities of € 16.5 million as of December 31, 2003 (€ 569.3 million as of December 31, 2002).
R. LIABILITIES FOR PENSION PLANS AND RELATED BENEFITS
The Group has obligations in terms of pension liabilities, early retirement, retirement indemnities and other benefit plans. Such obligations generally apply to most employees of the Group.
Costs of defined contribution plans and multi-employer defined benefit plans are expensed as contributions are made.
The amount of pension plan and similar benefit commitments for defined benefits are valued based on actuarial assessments. These calculations incorporate assumptions relating to mortality, turnover of personnel and salary projections and consider the economic conditions specific to each country or subsidiary of the Group. The discount rates are calculated in accordance with the yield, as of the date of valuation, of the bonds issued by highly rated companies (or by the local government if there is no representative market for private borrowings) in the related geographical area.
F-20
The valuation methods currently used by the Group for pension plan and similar benefit commitments, as presented in Note 19, are similar to those stipulated in IAS 19, Employee Benefits.
Amounts relating to pension plans whose commitments are greater than plan assets are included in the accompanying consolidated balance sheets as “Other reserves for contingencies and losses”. Where the value of the pension assets is greater than the commitments, the excess is recorded as an asset in “Prepaid expenses”.
Gains and losses resulting from changes in actuarial assumptions concerning pension liabilities are only recognized where such amounts exceed 10% of the higher of commitments and fund assets. The amount exceeding 10% is spread over the average residual activity period of employees.
S. FINANCIAL INSTRUMENTS
The Group uses financial instruments to manage and reduce its exposure to fluctuations in interest rates, foreign currency exchange rates and commodity prices.
Gains and losses on financial instruments qualifying as hedges are recognized in income in the same way as gains and losses on the items hedged. Gains and losses on foreign exchange instruments used to hedge net assets representing the Group’s investment in foreign subsidiaries are recorded under cumulative translation adjustments in shareholders’ equity and reclassified to income solely on the sale of the investment.
Certain foreign exchange, interest rate or equity instruments do not qualify as hedging transactions.
Uncompleted transactions are valued at market value at year-end and accounted for as follows:
| | • | Unrealized losses on interest rate and equity instruments are generally provided for, and unrealized gains are not recognized in income. |
| | • | Changes in value for foreign exchange instruments contracted on liquid currencies are recorded as an income or expense. Otherwise, the accounting treatment for foreign exchange instruments is identical to that for interest rate or equity instruments. |
The notional and market values are presented in Note 18.1. for uncompleted foreign exchange and interest rate instruments and in Note 18.2 for equity instruments.
The Group engages in energy trading activities on its own behalf and on the behalf of clients. The instruments (with or without physical delivery at maturity) are valued at market value, taking into account the liquidity positions. Unrealized gains and losses are recognized in income in the period during which the change in value occurs, except for positions deemed illiquid, for which only the unrealized losses are recorded.
The notional and market values for commodity instruments are presented in Note 18.3
T. CONSOLIDATED STATEMENTS OF CASH FLOWS
For the purposes of the accompanying consolidated statements of cash flows, the cash category includes cash and cash equivalents and marketable securities. Items in the cash category are short-term, highly liquid investments with an initial maturity of less than three months that are readily convertible into known amounts of cash.
The accompanying consolidated statements of cash flows show the transactions of companies included in the scope of consolidation at the year-end. The impact on cash balances of foreign exchange fluctuations (year-end rate versus opening rate and average rate for the period) and changes in Group structure resulting from
F-21
transactions which did not incur any cash flow movements (for example, a public exchange offer) are identified at the bottom of the table. Cash acquired from acquisitions net of cash disposed of in divestitures is included within Investing cash flows (in a separate subheading, “Cash acquired from acquisitions net of cash disposed of in divestitures”), which also contains the cash flows to impact the related acquisition or disposal.
Certain movements impacting the balance sheet are not considered cash flows: reclassifications, mergers and partial asset transfers, and changes in accounting method.
Net income is adjusted for non-cash items to arrive at gross cash flow. Current asset write-downs are treated as immediate realized losses and, as such, impact gross cash flow and cash flow from operating activities based on current asset movements net of write-downs.
Supplemental disclosure of cash flow information is as follows:
| | | | | | | | | |
(in millions of €)
| | 2003
| | | 2002
| | | 2001
| |
Cash paid: interest | | 1,058.7 | | | 1,441.0 | | | 1,329.0 | |
Cash paid: income tax | | 632.3 | | | 573.2 | | | 529.0 | |
Cash paid for acquisitions accounted for as purchases: | | | | | | | | | |
Fair value of assets acquired (including goodwill) | | 2,465.0 | | | 4,662.0 | | | 5,774.0 | |
Less liabilities assumed | | (963.0 | ) | | (488.0 | ) | | (2,343.0 | ) |
Less share capital issued to sellers | | | | | — | | | — | |
Less cash acquired | | (92.0 | ) | | (50.0 | ) | | (302.0 | ) |
| | |
|
| |
|
| |
|
|
Net cash paid | | 1,410.0 | | | 4,124.0 | | | 3,129.0 | |
| | |
|
| |
|
| |
|
|
U. EARNINGS PER SHARE
Earnings per share is calculated based on the Group’s net income divided by the weighted average number of the parent company shares outstanding during the year. In accordance with international practice, shares outstanding are shares issued less treasury stock shares held by SUEZ or subsidiaries under its control (also on a weighted average basis), irrespective of whether such shares are recorded in marketable securities or deducted from shareholders’ equity.
All per share data presented in the five-year financial summary and at the foot of the accompanying consolidated statements of income is calculated based on the weighted average number of shares outstanding during the reporting period detailed in Note 13.8.
The weighted average number of shares and earnings per share is also analyzed for any dilution caused by stock options, equity warrants and convertible bonds. The calculation of diluted earnings per share presented on the statement of income is detailed in Note 13.8.
V. US GAAP RECONCILED FINANCIAL STATEMENTS
As part of its ADR program, SUEZ files a 20-F report each year with the Securities and Exchange Commission (SEC) in the USA, comprising a reconciliation with Net income and Shareholders’ equity determined in accordance with US GAAP. US GAAP key figures can vary significantly compared with their French GAAP counterparts due to differences in Group structure (in particular, in 2002 and 2001, Electrabel and its subsidiaries are accounted for under the equity method under US GAAP as control criteria are not satisfied) and accounting standards, primarily as regards acquisition accounting (SUEZ-Lyonnaise des Eaux merger, minority interest buy-outs in Société Générale de Belgique, Tractebel, Sita, etc.), financial instruments, reserves, stock options and employee savings schemes.
F-22
Once filed, by June 30 at the latest, a copy of the 20-F report can be obtained from the Company’s corporate headquarters and the Internet sitewww.suez.com.
NOTE 2- MAJOR TRANSACTIONS AND PRO FORMA INFORMATION
2.1 Major acquisitions impacting the comparability of 2003 and 2002 figures
The Group did not make any major acquisitions in fiscal 2003 and 2002 that could impact the comparability of the corresponding figures.
2.2 Partial sale of Northumbrian
On May 16, 2003, the Group sold its interest in Ondeo Service UK (Northumbrian) to a consortium of institutional investors (Acquavit PLC), and maintained 25% of this company after refinancing. This company was listed on the London Stock Exchange.
Northumbrian has been consolidated under the equity method since January 1, 2003.
The transaction resulted in a € 360 million loss, including the recording of a write-down, based on the sale price, for the 25% retained share. The equity accounting value, net of the write-down, totaled € 197 million as of December 31, 2003.
2.3 Sale of Ondeo Nalco
On September 3, 2003, the Group announced the sale of Ondeo Nalco to a consortium comprising The Blackstone Group, Apollo Management L.P. and Goldman Sachs Capital Partners. The sale was arranged through a competitive private bidding process in the first half of the year and generated a capital loss of € 752 million.
For its annual financial statements, the Group used the alternative treatment method permitted by CRC Regulation No. 99-02, allowing the Ondeo Nalco results to be shown on one line in the income statement as of January 1, 2003 until the date of transfer of control. Similarly, had the results of Ondeo Nalco been included in the 2002 financial statements, the financial statements would have been presented as follows:
| | | |
Income statement (in millions of €)
| | 2002
| |
Revenues* | | 37,964.8 | |
Operating income before depreciation, amortization and provisions | | 6,205.5 | |
Operating income | | 3,365.1 | |
Financial loss | | (929.5 | ) |
Exceptional loss | | (1,832.0 | ) |
Income tax | | (524.0 | ) |
Share in companies accounted for under the equity method** | | 152.0 | |
Amortization of goodwill | | (272.0 | ) |
Minority interests | | 822.1 | |
| | |
|
|
Net loss, Group share | | (862.5 | ) |
| | |
|
|
| * | Adjusted for the change in accounting method for trading activity (cf. note 1-O). |
| ** | Including share in net income of Ondeo Nalco. |
F-23
| | |
Balance sheet—Assets (in millions of € and in net value)
| | 2002
|
Intangible assets | | 1,654.1 |
Goodwill | | 6,176.1 |
Tangible assets | | 32,634.1 |
Financial assets | | 15,496.3 |
Inventories and accounts receivable | | 17,911.9 |
Marketable securities and cash and cash equivalents | | 8,421.5 |
| | |
|
Total | | 82,294.0 |
| | |
|
| | |
Balance sheet—Liabilities & Shareholders’ Equity (in millions of €)
| | 2002
|
Total shareholders’ equity | | 15,768.2 |
Special concession accounts | | 4,849.2 |
Reserves for contingencies and losses | | 9,995.2 |
Borrowings and long-term debt | | 34,470.9 |
Other accounts payable | | 17,210.5 |
| | |
|
Total | | 82,294.0 |
| | |
|
Ondeo Nalco revenues and operating income for the first ten months of 2003 amounted to € 2.1 billion and € 0.2 billion respectively.
2.4 Partial sale of Elia in 2002
Elia, a subsidiary of Elia System Operator (ESO), was created to manage the high-voltage electricity transmission network in Belgium. On May 31, 2002, the Group sold 30% of ESO to PubliT, a company owned by several Belgian local authorities. Following this transaction, the Group held 70% of both companies. This percentage fell to 64% in 2003 following the break-up of CPTE (ESO’s parent company) in respect of the termination of the partnership between Electrabel and SPE.
The Belgian Federal Council of Ministers’ appointment of ESO to manage the transmission network was finalized on September 13, 2002. ESO and Elia, fully consolidated up until the appointment, have since been accounted for under the equity method, resulting notably from the entry into office of the new ESO non-executive directors, leading to the Group’s loss of control over this company.
This sale generated a net capital gain, Group share, of € 166.9 million and was accompanied by a resale option granted to the purchaser (the main terms and conditions of which are presented in Note 20.3 Other Commitments). The resale option, which was not exercised, expired on February 29, 2004.
2.5 Situation in Argentina
In Argentina, although the macro-economic environment has stabilized, it continues to suffer from the peso devaluation. Negotiations between the water concession holders and the concession granting authorities have neither resulted in the implementation of rate increases nor defined new guidelines to permanently restore a financial and economic equilibrium for the Argentine contracts. As a result, uncertainties remain concerning the continuation of operations and future cash flows.
An interim agreement relating solely to the year 2004 and laying down the main principles for renegotiating the Buenos Aires concession contract is currently underway. When it will have been signed, similar interim agreements could also be signed for the Santa Fe and Cordoba concessions.
F-24
Pursuant to the Franco-Argentine Bilateral Investment Protection Treaty, the concession holders and their shareholders launched arbitration procedures in April 2003 before the International Center for Settlement of Investment Disputes (ICSID). Assuming continued operations, as favored by SUEZ, these procedures would seek to implement measures to restore the financial and economic equilibrium of the Argentine concessions and obtain a reasonable indemnity from the Argentine government. In the event of an alternative termination scenario, the procedure would seek an indemnity to compensate SUEZ and the other shareholders for their investments and the losses incurred since the devaluation’s onset. The arbitration tribunal was recently set up, but the proceedings have not formally begun.
At the same time, discussions with multilateral organizations (BID, IFC) have been held regularly since the beginning of the crisis in 2002, in order to determine a debt restructuring plan that would reduce the debt servicing requirements of concession holders as part of a global renegotiation of the concession contracts. The multilateral organizations are regularly informed of the progress of negotiations with the Argentine government.
The exceptional charges recorded for Argentina over the last financial years are presented in Note 5.
NOTE 3- OPERATING INCOME
3.1 Other operating income:
| | | | | | |
(in millions of €)
| | 2003
| | 2002
| | 2001
|
Internal costs allocated to capitalized assets (a) | | 396.2 | | 587.4 | | 524.0 |
Expense transfers (b) | | 131.5 | | 130.8 | | 206.6 |
Income from disposals and sales (c) | | 51.7 | | 362.8 | | 46.4 |
Other current income | | 465.5 | | 525.3 | | 573.3 |
| | |
| |
| |
|
Total | | 1,044.9 | | 1,606.3 | | 1,350.3 |
| | |
| |
| |
|
| (a) | Costs incurred in respect of tangible assets produced and used internally by the Company. |
| (b) | Includes capital increase costs offset against Group additional paid-in capital of € 3.3 million in 2003, € 14.7 million in 2002 (amount immaterial in 2001). |
| (c) | Notably includes income from disposals of construction site equipment and assets under concession, as well as income from the sale of venture capital companies in 2002 and 2001 for € 188.1 million and € 2.1 million. |
3.2 Income from mixed inter-municipal companies and partnerships
| | | | | | | |
(in millions of €)
| | 2003
| | 2002
| | 2001
| |
Share in mixed inter-municipal companies’ income | | 436.3 | | 460.9 | | 434.0 | |
Partnerships | | 7.2 | | 6.4 | | (10.2 | ) |
| | |
| |
| |
|
|
Total | | 443.5 | | 467.3 | | 423.8 | |
| | |
| |
| |
|
|
The income of inter-municipal companies corresponds to the share held by Electrabel, a Tractebel subsidiary, in the results of mixed gas and electricity inter-municipal companies, through which Electrabel is in partnership with several Belgian municipalities.
F-25
3.3 Other operating expenses consist of the following:
| | | | | | |
(in millions of €)
| | 2003
| | 2002
| | 2001
|
Supplies and utility costs | | 2,443.6 | | 1,849.7 | | 1,662.7 |
Subcontracting | | 2,479.7 | | 2,432.8 | | 1,956.9 |
Rental and joint ownership expenses | | 578.1 | | 527.1 | | 460.9 |
External personnel | | 634.6 | | 605.2 | | 565.1 |
Repairs and maintenance | | 720.2 | | 772.0 | | 698.5 |
Professional fees | | 426.6 | | 542.0 | | 410.5 |
Other | | 5,096.0 | | 6,299.9 | | 5,320.9 |
| | |
| |
| |
|
TOTAL (a) | | 12,378.8 | | 13,028.7 | | 11,075.5 |
| | |
| |
| |
|
| (a) | The decrease in other operating expenses primarily results from the equity accounting of Northumbrian (€ -204.3 million) and the sale of Nalco (€ -246.4 million). |
3.4 Depreciation, amortization and provisions
| | | | | | | | |
(in millions of €)
| | 2003
| | | 2002
| | 2001
| |
Depreciation and amortization | | 1,982.7 | | | 2,613.8 | | 2,701.5 | |
Intangible assets | | 252.5 | | | 303.2 | | 284.2 | |
Tangible assets (a) | | 1,660.8 | | | 2,238.4 | | 2,350.3 | |
Assets under concession | | 69.4 | | | 72.2 | | 67.0 | |
Provisions | | 539.5 | | | 457.1 | | 397.2 | |
Renewal of fixed assets | | 95.9 | | | 93.1 | | 70.7 | |
Inventories, accounts receivable and marketable securities | | 86.3 | | | 54.9 | | 215.2 | |
Contingencies and losses | | 369.1 | | | 277.8 | | 127.2 | |
Other | | (11.8 | ) | | 31.3 | | (15.9 | ) |
| | |
|
| |
| |
|
|
Total | | 2,522.2 | | | 3,070.9 | | 3,098.7 | |
| | |
|
| |
| |
|
|
| (a) | Including depreciation relating to assets held under capital lease contracts of € 96.2 million in 2003, € 98.1 million in 2002 and € 69.5 million in 2001. The decrease in tangible asset depreciation is primarily due to the equity accounting of Northumbrian (€ -129 million), the disposal of Nalco (€ -117 million), and the extension of the depreciation period for nuclear power stations (€ -71 million, see Note 1.E). |
NOTE 4- FINANCIAL INCOME
| | | | | | | | | |
(in millions of €)
| | 2003
| | | 2002
| | | 2001
| |
Dividends from investments (a) | | 118.3 | | | 338.3 | | | 158.7 | |
Net interest and similar expenses | | (1,097.8 | ) | | (1,385.4 | ) | | (1,628.2 | ) |
Net allocations to provisions for losses on marketable securities | | (128.5 | ) | | (122.7 | ) | | (35.5 | ) |
Other financial income | | 227.9 | | | 193.8 | | | 247.3 | |
| | |
|
| |
|
| |
|
|
Financial loss | | (880.1 | ) | | (976.0 | ) | | (1,257.7 | ) |
| (a) | The decrease in Dividends from investments is explained by non-consolidated securities sold in 2002, for which dividends were no longer received in 2003. |
NOTE 5- EXCEPTIONAL INCOME
| | | | | | | | | |
(in millions of €)
| | 2003
| | | 2002
| | | 2001
| |
Capital gains or losses on disposal, net | | (953.8 | ) | | 600.6 | | | 1,645.8 | |
Other exceptional expenses, net | | (1,803.6 | ) | | (2,384.3 | ) | | (819.6 | ) |
| | |
|
| |
|
| |
|
|
Exceptional income/(loss) | | (2,757.4 | ) | | (1,783.7 | ) | | 826.2 | |
F-26
5.1 Capital gains or losses on disposal, net
In 2003, net capital losses were comprised of capital losses on disposal of Nalco (€ -752 million) and Northumbrian (€ -360 million), and losses relating to various listed securities (Axa, Total, Fortis, SES, Iberdrola, etc.) for € -54 million, offset by a capital gain of € 226 million on the sale of the Cespa shares.
In 2002, capital gains primarily concerned the sale of securities of TPS (€ 169.8 million), Scottish Power (€ 112.1 million), Château d’Eau (€ 90.2 million), Arcelor (€ 51.4 million), Iberdrola (€ 103.6 million), Acesa (€ 108.5 million), Adeslas (€ 82.8 million) and the partial sale of Elia (see Note 2.4, € 538.9 million). The line item also included capital gains realized on the sale of various real-estate assets (€ 188.3 million) leased back by the Group (see Note 20.2), and the impact of the sale of and allocations to / reversals of provisions against Axa (€ -225.4 million) and Fortis (€ -244.6 million) securities. Finally, there were provisions against the portfolio of miscellaneous listed and unlisted securities (€ -353 million).
In 2001, net capital gains primarily comprised the € 310.3 million dilution gain recognized on the regrouping of SUEZ and France Télécom cable activities, the sale of Vinci securities in the amount of € 298 million and Fortis securities in the amount of € 100 million, sales of Total securities (€ 164.6 million) and SES exchange capital gains (€ 137.8 million). This line item also included the impact of the conversion of the AXA bonds into securities on January 1, 2001 (treated as an exchange transaction) and write-down provisions against this line for a net amount of € 256.1 million. Some of these disposals were accompanied by financial instruments (collars or equity swaps), under which SUEZ temporarily retained the risks and benefits associated with fluctuations in the market value of the securities. These instruments matured in 2002.
5.2 Other exceptional expenses, net
In 2003, other net exceptional expenses were comprised of various charges and provisions for restructuring (€ -198 million), and asset write-downs or provisions for losses on planned disposals for € -1,070 million (including € -754 million for Noos, and € -150 million for LDCOM). In addition, this line item includes a charge of € -466 million for impairments or write-down of certain assets (major items included: € -73 million for listed securities, € -147 million in regard to goodwill balances for the Water distribution US affiliates, € -100 million regarding the exceptional goodwill amortization for the Waste Services German subsidiaries, and € -47 million for the write-down of goodwill for other Waste Services subsidiaries). Finally, other exceptional expenses include a € -73 million adjustment related to various charges and provisions resulting from the withdrawal from contracts, particularly Puerto Rico.
In 2002, other net exceptional expenses included the impact of the South-American crisis in the amount of € -826.1 million. These exceptional expenses also included various charges and provisions relating to the discontinuation of activities (€ -299.1 million, primarily concerning the Jakarta, Manila and Atlanta contracts) and an expense of € -786.6 million related to value adjustments to certain assets (including € -162 million for the write-down of goodwill balances of German subsidiaries in the Waste Services sector, € -175 million for the write-down of securities and other assets in the Communication sector, € -143 million for the write-down of goodwill balances of Chilean water subsidiaries and € -242 million for the write-down of Dutch energy subsidiaries). Finally, this account includes various restructuring costs and provisions (€ -168.3 million).
In 2001, other net exceptional expenses primarily comprised restructuring costs (€ 198.9 million, including € 103.4 million related to the 2003 Transform program launched by Electrabel and supply chain integration and restructuring costs of € 91.0 million incurred by Ondeo Nalco), asset write-downs (€ 360.9 million, primarily in the Communication and Waste Services sectors) and exceptional capital losses net of reversals of provisions for emerging country risk (€ 335.8 million, including € 314.4 million related to the devaluation of the Argentine peso).
F-27
NOTE 6- INCOME TAX
6.1 Income Tax
Income before income tax and goodwill amortization of consolidated companies breaks down as follows:
| | | | | | | | |
(in millions of €)
| | 2003
| | | 2002
| | | 2001
|
Current income | | 2,324.8 | | | 2,731.6 | | | 2,806.1 |
Exceptional income/(loss) | | (2,757.4 | ) | | (1,783.7 | ) | | 826.2 |
Income before income tax and goodwill amortization | | (432.6 | ) | | 947.9 | | | 3,632.3 |
French companies | | (1,048.0 | ) | | (694.1 | ) | | 746.6 |
Foreign companies | | 615.4 | | | 1,642.0 | | | 2,885.7 |
Income before income tax and goodwill amortization | | (432.6 | ) | | 947.9 | | | 3,632.3 |
A reconciliation of the French statutory income tax rate (35.43% since 2002, and 36.43% in 2001) with the Group’s effective income tax charge for the years ended December 31 is presented below:
| | | | | | | | | |
(in millions of €)
| | 2003
| | | 2002
| | | 2001
| |
Income before income tax and goodwill amortization multiplied by statutory rate | | 153.3 | | | (335.9 | ) | | (1,323.2 | ) |
Impact of: | | | | | | | | | |
Taxation in jurisdictions outside of France | | 63.4 | | | (20.3 | ) | | 21.7 | |
Permanent differences | | (45.3 | ) | | 249.6 | | | 437.6 | |
Capital gains and other income taxed at a reduced rate or nil (a) | | 211.1 | | | 84.0 | | | 247.1 | |
Additional tax expense (b) | | (79.4 | ) | | (53.4 | ) | | (70.0 | ) |
Discounting of deferred tax balances | | (0.9 | ) | | 52.4 | | | 13.4 | |
Unrecorded deferred tax assets on timing differences and tax loss carrry-forwards (c) | | (1,048.2 | ) | | (732.9 | ) | | 27.7 | |
Change in tax rates of deferred tax liabilities or assets | | (5.7 | ) | | (23.8 | ) | | (12.5 | ) |
Tax credits | | 19.1 | | | 66.3 | | | 11.9 | |
Other | | 11.6 | | | 56.9 | | | (75.7 | ) |
Actual income tax charge | | (721.0 | ) | | (657.1 | ) | | (722.0 | ) |
Effective tax rate (actual income tax charge divided by income before income tax and goodwill amortization) | | nm | | | 69.3 | % | | 19.9 | % |
| (a) | Including non-deductible capital gains in Belgium, reduced taxation rate for the capital gain on the Cespa disposal and the impact of special tax regimes applied to Belgian coordination centers. |
| (b) | Including the 5% tax payable on dividends in Belgium. |
| (c) | The change in 2003 is primarily due to the non-recognition of deferred tax assets for net operating loss carry-forwards generated by the tax consolidation group created around SUEZ, and the indefinite loss carry-forward that arose in 2003 for the parent company of the US tax consolidation group following the Nalco disposal. |
F-28
The income tax charge for the years ended December 31 breaks down as follows:
| | | | | | | | | | | | | | | | | | | | | | | | | | | |
(in millions of €)
| | Income tax on current income
| | | Income tax on exceptional income
| | | Total
| |
| | | 2003
| | | 2002
| | | 2001
| | | 2003
| | | 2002
| | | 2001
| | | 2003
| | | 2002
| | | 2001
| |
Current income tax: | | | | | | | | | | | | | | | | | | | | | | | | | | | |
French companies | | (82.4 | ) | | (3.6 | ) | | 56.8 | | | 9.8 | | | (54.0 | ) | | (127.4 | ) | | (72.6 | ) | | (57.6 | ) | | (70.6 | ) |
Foreign companies | | (535.8 | ) | | (558.1 | ) | | (557.4 | ) | | (74.3 | ) | | 150.6 | | | (3.8 | ) | | (610.1 | ) | | (407.5 | ) | | (561.2 | ) |
| | |
|
| |
|
| |
|
| |
|
| |
|
| |
|
| |
|
| |
|
| |
|
|
Total | | (618.2 | ) | | (561.7 | ) | | (500.6 | ) | | (64.5 | ) | | 96.6 | | | (131.2 | ) | | (682.7 | ) | | (465.1 | ) | | (631.8 | ) |
| | |
|
| |
|
| |
|
| |
|
| |
|
| |
|
| |
|
| |
|
| |
|
|
Deferred income tax: | | | | | | | | | | | | | | | | | | | | | | | | | | | |
French companies | | (4.4 | ) | | (19.9 | ) | | (16.8 | ) | | 8.2 | | | 5.7 | | | (12.1 | ) | | 3.8 | | | (14.2 | ) | | (28.9 | ) |
Foreign companies | | (51.9 | ) | | (139.9 | ) | | (168.3 | ) | | 9.8 | | | (37.9 | ) | | 107.0 | | | (42.1 | ) | | (177.8 | ) | | (61.3 | ) |
| | |
|
| |
|
| |
|
| |
|
| |
|
| |
|
| |
|
| |
|
| |
|
|
Total | | (56.3 | ) | | (159.8 | ) | | (185.1 | ) | | 18.0 | | | (32.2 | ) | | 94.9 | | | (38.3 | ) | | (192.0 | ) | | (90.2 | ) |
| | |
|
| |
|
| |
|
| |
|
| |
|
| |
|
| |
|
| |
|
| |
|
|
Total income tax charge | | (674.5 | ) | | (721.5 | ) | | (685.7 | ) | | (46.5 | ) | | 64.4 | | | (36.3 | ) | | (721.0 | ) | | (657.1 | ) | | (722.0 | ) |
| | |
|
| |
|
| |
|
| |
|
| |
|
| |
|
| |
|
| |
|
| |
|
|
In 2003, SUEZ was the parent company of a tax consolidation group comprised of 191 companies. Other tax groups are formed in France where possible.
As of December 31, 2003, the Group had net operating loss carry-forwards (NOLs) and tax credits carried forward of € 10,126.4 million, which will expire as follows:
| | |
(in millions of €)
| | NOLs and tax credits carried forward
|
2004 | | 61.6 |
2005 | | 60.1 |
2006 | | 130.1 |
2007 | | 414.6 |
2008 | | 230.5 |
2009 and thereafter | | 9,229.5 |
| | |
|
Total (a) | | 10,126.4 |
| | |
|
| (a) | Among the aforementioned tax loss carry-forwards, those generated by French entities may be carried forward indefinitely as from 2004. |
F-29
6.2 Deferred tax
Net deferred tax liabilities, before netting of deferred tax assets and liabilities by tax entity, are detailed hereafter:
| | | | | | | | | |
(in millions of €)
| | 2003
| | | 2002
| | | 2001
| |
Deferred tax assets: | | | | | | | | | |
Net operating loss carry-forwards | | 2,831.9 | | | 1,570.9 | | | 963.6 | |
Pension commitments | | 622.3 | | | 652.5 | | | 816.1 | |
Accrued liabilities | | 1,068.8 | | | 886.8 | | | 887.8 | |
Unrecorded deferred tax assets (a) | | (2,408.1 | ) | | (1,484.4 | ) | | (957.0 | ) |
Other | | 642.0 | | | 866.2 | | | 708.3 | |
| | |
|
| |
|
| |
|
|
Total | | 2,756.9 | | | 2,492.0 | | | 2,418.8 | |
Deferred tax liabilities: | | | | | | | | | |
Intangible asset fair value adjustments (b) | | (154.7 | ) | | (1,078.2 | ) | | (1,342.6 | ) |
Differences between tax and accounting values of fixed assets (c) | | (595.9 | ) | | (1,394.9 | ) | | (1,364.4 | ) |
Tax-driven reserves | | (225.7 | ) | | (236.1 | ) | | (219.6 | ) |
Discounting of deferred tax liabilities (c) | | 16.5 | | | 569.3 | | | 564.4 | |
Other | | (1,789.4 | ) | | (1,410.0 | ) | | (1,184.8 | ) |
| | |
|
| |
|
| |
|
|
Total | | (2,749.2 | ) | | (3,549.9 | ) | | (3,547.0 | ) |
| | |
|
| |
|
| |
|
|
Net deferred tax liabilities | | 7.7 | | | (1,057.9 | ) | | (1,128.2 | ) |
| (a) | Unrecorded deferred tax assets. |
| | Unrecorded deferred tax assets in respect of the SUEZ tax consolidation group alone amounted to € 885.0 million at the end of 2003 (€ 627.4 million as of December 31, 2002). The increase in 2003 was primarily due to the non-recognition of deferred tax assets relating to loss carry-forwards generated over the period. |
| (b) | The decrease in this line item is due to the Nalco disposal. |
| (c) | The decrease is attributable to the equity accounting of Northumbrian. |
The most distant date for utilizing net deferred tax assets not recorded in the consolidated balance sheet must be considered to be infinite, since most losses may be carried forward indefinitely.
Movements in net deferred tax liabilities recorded in the consolidated balance sheet, after netting of deferred tax assets and liabilities by tax entity, break down as follows:
| | | | | | | | | |
(in millions of €)
| | Assets
| | | Liabilities
| | | Net positions
| |
As of December 31, 2002 | | 839.1 | | | (1,897.0 | ) | | (1,057.9 | ) |
Net income for the period | | 379.0 | | | (417.3 | ) | | (38.3 | ) |
Other (in particular changes in scope of consolidation) | | (111.1 | ) | | 1,215.0 | | | 1,103.9 | |
Impact of netting by tax entity | | (211.3 | ) | | 211.3 | | | 0.0 | |
As of December 31, 2003 | | 895.7 | | | (888.0 | ) | | 7.7 | |
F-30
NOTE 7- COMPANIES ACCOUNTED FOR UNDER THE EQUITY METHOD
| | | | | | | | | | | | | | | |
(in millions of €)
| | 2003
| | | 2002
| | | 2001
| |
| | | Equity
| | | Net income/ (loss)
| | | Equity
| | | Net income/ (loss)
| | | Net income/ (loss)
| |
Belgian mixed inter-municipal companies (a) | | 2,233.1 | | | 0.8 | | | 2,345.2 | | | 2.6 | | | 21.7 | |
Compagnie Nationale du Rhône (CNR) (b) | | 326.6 | | | 0.7 | | | — | | | — | | | — | |
Northumbrian group (c) | | 197.2 | | | (6.6 | ) | | 5.7 | | | 1.3 | | | (1.0 | ) |
Elia (d) | | 154.4 | | | 58.1 | | | 145.1 | | | 27.6 | | | — | |
United Power Company | | 32.6 | | | 2.1 | | | — | | | — | | | — | |
Malaysian water companies | | 23.8 | | | 3.6 | | | 28.6 | | | 3.1 | | | 5.9 | |
Belgonucléaire | | 10.6 | | | 3.7 | | | 19.6 | | | 6.9 | | | 6.9 | |
Ormas Ambiental (Waste Services, Argentina) | | (13.9 | ) | | 5.9 | | | (22.1 | ) | | (24.7 | ) | | (12.1 | ) |
Maynilad Water Services | | (38.6 | ) | | (6.7 | ) | | (45.3 | ) | | (10.3 | ) | | (43.8 | ) |
Polaniec (e) | | — | | | — | | | 99.8 | | | 5.0 | | | 5.4 | |
Cem (Macau electricity company) | | — | | | — | | | — | | | — | | | 14.0 | |
Nalco (f) | | — | | | 13.0 | | | — | | | — | | | — | |
Umicore (non-ferrous metals) (g) | | — | | | 17.1 | | | 283.1 | | | 15.1 | | | 34.5 | |
Télévision par Satellite (TPS) | | — | | | — | | | — | | | (5.5 | ) | | (34.2 | ) |
Other (h) | | 407.7 | | | 74.0 | | | 410.7 | | | 30.3 | | | 336.4 | |
| | |
|
| |
|
| |
|
| |
|
| |
|
|
Total | | 3,333.5 | | | 165.7 | | | 3,270.4 | | | 51.4 | | | 333.7 | |
| | |
|
| |
|
| |
|
| |
|
| |
|
|
| (a) | Electrabel’s share in the income of mixed inter-municipal companies is included in operating income (see Note 3.2 for further details). |
| (b) | Following the acquisitions in June 2003 from various municipalities and in December 2003 from EDF, Electrabel holds 47.88% of the CNR share capital as of December 31, 2003. |
| (c) | Accounted for under the equity method as of January 1, 2003 following the partial sale (see Note 2.2). |
| (d) | Following the appointment of ESO to manage the transmission network by the Belgian Federal Council of Ministers on September 13, 2002 and the entry into office of the new ESO independent directors, ESO and Elia are accounted for under the equity method. |
| (e) | Fully consolidated in 2003 after the 100% buy-out of the company. |
| (f) | Net income/(loss) prior to disposal (accounted for under the equity method from January 1 to October 31, 2003, see Note 2.3). |
| (g) | Following the partial disposals and the Group dilution in Umicore as a result of the 2003 share capital increase, the company was accounted for under the equity method until December 31, 2003 and deconsolidated as of this date. |
| (h) | Including since 2001, Fortis for € 292.6 million. |
The Group received dividends from companies accounted for under the equity method of € 606.5 million, € 492.7 million and € 529.2 million in 2003, 2002, and 2001, respectively.
Goodwill related to companies accounted for under the equity method are not included in “Companies accounted for under the equity method” but rather in “Goodwill” and totaled € 128.4 million as of December 31, 2003, compared to € 50.6 million as of December 31, 2002 and € 168.7 million as of December 31, 2001. (see Note 8).
F-31
Combined summarized financial information, prepared in accordance with Belgian GAAP, with respect to the main affiliates accounted for under the equity method, namely the Belgian mixed inter-municipal companies, is presented below as of December 31, 2003 and 2002:
| | | | |
(in millions of €)
| | 2003
| | 2002
|
Balance sheet information | | | | |
Total current assets | | 3,544 | | 3,988 |
Total assets | | 10,917 | | 9,936 |
Total current liabilities | | 3,241 | | 3,928 |
Total liabilities | | 3,900 | | 4,373 |
Shareholders’ equity | | 7,017 | | 5,562 |
Total liabilities and shareholders’ equity | | 10,917 | | 9,936 |
Income statement information | | | | |
Revenues | | 4,928 | | 5,204 |
Other operating income | | 146 | | 154 |
Operating expenses | | 4,007 | | 4,329 |
Net income | | 1,070 | | 1,567 |
NOTE 8- GOODWILL
| | | | | | |
(in millions of € and in net book value)
| | Positive
| | | Negative
| |
Balance sheet as of December 31, 2001 | | 10,319.3 | | | (217.0 | ) |
Goodwill recorded in 2002 | | 487.0 | | | (141.9 | ) |
Significant changes include: | | — | | | — | |
Acquisition of an additional stake in Tractebel | | 140.0 | | | — | |
Acquisition of Electrabel securities by Tractebel | | 91.4 | | | — | |
Téris (acquisition of 50% from Rhodia) | | 37.2 | | | — | |
Changes in consolidation scope and unrealized foreign exchange gains and losses (a) | | (1,033.8 | ) | | (5.5 | ) |
Amortization expense | | (413.0 | ) | | 30.4 | |
Exceptional amortization (b) | | (648.6 | ) | | — | |
Balance sheet as of December 31, 2002 | | 8710.9 | | | (334.0 | ) |
Goodwill recorded in 2003 | | 712.6 | | | (6.5 | ) |
Significant changes include: | | — | | | — | |
Electrabel (from 45.32% to 50.12%) | | 359.5 | | | — | |
Compagnie Nationale du Rhône (CNR) | | 96.1 | | | — | |
Tirreno Power | | 81.0 | | | — | |
ACEA group | | 38.4 | | | — | |
Changes in consolidation scope and unrealized foreign exchange gains and losses (c) | | (2,885.7 | ) | | 74.1 | |
Amortization expense | | (287.3 | ) | | 20.5 | |
Exceptional amortization (d) | | (399.0 | ) | | — | |
Balance sheet as of December 31, 2003 | | 5,851.5 | | | (245.9 | ) |
| (a) | Notably the impact of exchange rate fluctuations in the amount of € -662.4 million and sales in the amount of € -275.8 million (mainly Thai power plants, Coficem, Château d’eau and TPS). |
| (b) | Included in the Statement of income in Other net exceptional expenses. Primarily concerns in 2002, the write-down of goodwill balances of certain subsidiaries operating in the Waste Services business in Germany (€ 162.3 million), the Water business in Chile (€ 143.4 million) and Argentina (€ 74.6 million) and the Energy business in Holland (€ 242.0 million). |
| (c) | Comprises the impact of exchange rate fluctuations in the amount of € -175.4 million and sales in the amount of € -2,752.2 million (particularly Nalco for € -2,584.4 million, Cespa for € -32.4 million, and Northumbrian for € -46.0 million). |
F-32
| (d) | In 2003, comprised primarily of the € 309.1 million sale of operating units as part of the Group’s continuing operation strategy, specifically the write-down of goodwill for the US subsidiaries in Water distribution (€ -146,9 million), and an additional write-down in the Waste Services business line in Germany (€ -100.0 million). As necessitated by revised profit forecasts of the entities concerned, these write-downs brought the value of these entities on consolidation into line with their fair value (see Note 1-F). |
The breakdown by segment is as follows (based on the related segment of parent companies):
| | | | |
(in millions of € and in net book value)
| | 2003
| | 2002
|
Positive goodwill | | | | |
ENERGY | | 3,268.3 | | 2,900.9 |
SEIS | | 8.3 | | 2,593.8 |
SUEZ ENVIRONNEMENT (SE, formerly SELS) | | 1,866.7 | | 2,366.7 |
Other (a) | | 708.2 | | 849.5 |
Total | | 5,851.5 | | 8,710.9 |
Negative goodwill | | | | |
ENERGY | | 206.3 | | 215.6 |
SEIS | | 0.1 | | 0.1 |
SUEZ ENVIRONNEMENT (SE, formerly SELS) | | 39.5 | | 115.1 |
Other | | — | | 3.2 |
| | |
| |
|
Total | | 245.9 | | 334.0 |
| | |
| |
|
| (a) | For 2003 and 2002, the goodwill from companies in the Other segment concerns subsidiaries in Energy (€ 320.7 million and € 348.7 million respectively), SE (€ 194.9 million and € 223.7 million respectively) and Communication (€ 192.7 million and € 277.1 million respectively). |
NOTE 9- TANGIBLE AND INTANGIBLE ASSETS, DEPRECIATION AND AMORTIZATION
9.1 Tangible and intangible assets
| | | | | | | | | | | | |
| | | Movements during the year
|
(in millions of €)
| | As of December 31, 2002
| | Consolidation scope and foreign exchange gains/ (losses) (a)
| | | Additions (b)
| | Other movements (c)
| | | As of December 31, 2003
|
Intangible assets | | 5,423.6 | | (2,594.2 | ) | | 216.9 | | 195.9 | | | 3,242.2 |
Assets owned outright | | 52,200.0 | | (8,816.3 | ) | | 2,400.6 | | (1,337.9 | ) | | 44,446.4 |
Assets under concession | | 8,249.7 | | (64.8 | ) | | 178.2 | | 106.8 | | | 8,469.9 |
Tangible assets | | 60,449.7 | | (8,881.1 | ) | | 2,578.8 | | (1,231.1 | ) | | 52,916.3 |
| (a) | Decrease in scope mainly results from the impact of the Northumbrian disposal (€ -5,120.5 million) following its accounting under the equity method, the disposal of Nalco (€ -4,217.3 million), Cespa (€ -450.5 million), the partial disposal of CPTE for € -829.2 million, offset by the full consolidation of Polaniec (€ 673.8 million), and the entry into the scope of consolidation of Tirreno Power for € 530.7 million. Also includes the negative impact of foreign exchange fluctuations following the depreciation of the US dollar and the pound sterling for € -1,514.3 million and € -76.7 million respectively. |
| (b) | Additions mainly result from Tractebel Power Inc. (€ 399.1 million), Electrabel (€ 200.0 million) and Baymina (€ 100.0 million). |
| (c) | Includes the impact of disposals and eliminations (€ -898.8 million) and, among assets under concession, capital expenditure financed or contributed by third parties (local authorities, water authorities) for € 123.2 million. |
F-33
| | | | | | | | | | | | |
| Depreciation and amortization: | | Movements during the year
|
(in millions of €)
| | As of December 31,
2002
| | Consolidation scope and foreign exchange gains/ (losses) (a)
| | | Allocations (b)
| | Other movements (c)
| | | As of December 31,
2003
|
Accumulated amortization, intangible assets | | 1,520.6 | | (347.9 | ) | | 434.2 | | 2.5 | | | 1,609.4 |
Assets owned outright | | 24,528.2 | | (2,566.9 | ) | | 1,682.5 | | (723.8 | ) | | 22,920.0 |
Assets under concession | | 2,645.7 | | (21.9 | ) | | 50.3 | | 194.9 | | | 2,869.0 |
Accumulated amortization, tangible assets | | 27,173.9 | | (2,588.8 | ) | | 1,732.8 | | (528.9 | ) | | 25,789.0 |
| (a) | Decrease in scope mainly results from the impact of the Nalco disposal for € -1,326.7 million, the equity accounting of Northumbrian for € -980.0 million, the disposal of Cespa for € -204.6 million and the partial disposal of CPTE for € -402.8 million. Increase in scope results from the full consolidation of Polaniec for € 416.5 million and Tirreno Power for € 247.0 million. Includes the impact of the depreciation of the US dollar and pound sterling for € -285.6 million and € -34.1 million. |
| (b) | Includes the impact of the NOOS network impairment for € -150.0 million. |
| (c) | Includes the impact of disposals and eliminations (€ -595.5 million) and, among assets under concession, depreciation recorded on behalf of concession grantors paid out of the special contra account for fixed assets received, included in liabilities in the balance sheet (€ 189.5 million). |
9.2 Tangible assets owned outright
| | | | | | |
(in millions of €)
| | 2003
| | 2002
| | 2001
|
Land | | 1,282.0 | | 817.2 | | 1,031.5 |
Buildings | | 3,405.4 | | 4,731.8 | | 5,971.9 |
Machinery and equipment | | 11,290.2 | | 15,783.2 | | 17,753.6 |
Capitalized dismantling and asset retirement costs (a) | | 161.9 | | 163.8 | | — |
Vehicles | | 584.7 | | 623.9 | | 666.1 |
Fixed assets under capital lease | | 1,202.8 | | 908.0 | | 1,058.8 |
Construction in progress and down-payments | | 2,377.0 | | 2,989.5 | | 3,796.2 |
Other fixed assets | | 1,222.4 | | 1,654.4 | | 2,181.0 |
| | |
| |
| |
|
Total net value | | 21,526.4 | | 27,671.8 | | 32,459.1 |
| | |
| |
| |
|
Fixed assets under capital lease as of December 31, 2003, 2002 and 2001 break down as follows:
| | | | | | | | | |
(in millions of €)
| | 2003
| | | 2002
| | | 2001
| |
Buildings | | 270.3 | | | 270.0 | | | 380.9 | |
Machinery and equipment | | 1,321.4 | | | 921.5 | | | 837.1 | |
Vehicles and other tangible fixed assets | | 104.7 | | | 217.7 | | | 272.0 | |
Gross fixed assets under capital lease | | 1,696.4 | | | 1,409.2 | | | 1,490.0 | |
Accumulated depreciation | | (493.6 | ) | | (501.2 | ) | | (431.2 | ) |
Net fixed assets under capital lease | | 1,202.8 | | | 908.0 | | | 1,058.8 | |
The decrease in 2003 of buildings and machinery and equipment is primarily the result of the equity accounting of Northumbrian (€ -486.1 million and € -3,124.7 million, respectively) and the disposal of Nalco (€ -76.0 million and € -382.0 million, respectively).
The decrease in 2002 in tangible fixed assets owned outright or under capital lease is due to sales of real-estate assets during the period (see Note 5).
F-34
Depreciation of and provisions against tangible fixed assets owned outright (€ 1,682.5 million, € 2,331.4 million and € 2,381.8 million for 2003, 2002 and 2001 respectively) are primarily included in “Depreciation, amortization and provisions” in the accompanying consolidated statements of income.
9.3 Tangible assets under concession
| | | | | | |
(in millions of €)
| | 2003
| | 2002
| | 2001
|
Placed under concession by the concession holder | | 2,058.1 | | 1,949.4 | | 1,966.6 |
Placed under concession by the concession grantor | | 3,542.8 | | 3,654.6 | | 3,565.9 |
Net value-assets | | 5,600.9 | | 5,604.0 | | 5,532.5 |
Financing by third parties | | 277.1 | | 292.9 | | 295.9 |
Counterpart of fixed assets received | | 3,542.8 | | 3,654.6 | | 3,565.9 |
Additional amortization due to asset lives greater than concession duration | | 1,027.5 | | 901.7 | | 806.8 |
Concession accounts-liabilities | | 4,847.4 | | 4,849.2 | | 4,668.6 |
| | |
| |
| |
|
Total net book value | | 753.5 | | 754.8 | | 863.9 |
| | |
| |
| |
|
9.4 Intangible assets
| | | | | | |
(in millions of €)
| | 2003
| | 2002
| | 2001
|
Intangible assets resulting from the acquisition of SEIS and SE companies (a) | | 169.7 | | 2,191.9 | | 2,671.5 |
Purchased goodwill | | 129.6 | | 296.8 | | 107.5 |
Software | | 163.0 | | 192.2 | | 189.0 |
Intangible rights related to concession contracts (b) | | 533.3 | | 481.2 | | 484.5 |
Other intangibles (c) | | 637.2 | | 740.9 | | 782.4 |
| | |
| |
| |
|
Total net value | | 1,632.8 | | 3,903.0 | | 4,234.9 |
| | |
| |
| |
|
| (a) | At the end of 2003, this mainly concerns the Water rights of Aguas Andinas (total net value = € 169.7 million; see Note 1-C). |
At the end of 2002, this also included intangibles (customer portfolio, brands, patents and licenses, amortized over their useful life which does not exceed 30 years) of Nalco, sold in 2003, for a total net value of € 2,024.8 million.
| (b) | Intangible assets relating to concession contracts are costs paid or payable in return for concession rights. These costs are amortized on a straight-line basis over the term of the contract to which they relate. |
| (c) | The decrease in 2003 results from the write-down recorded by Noos for the civil engineering user right granted by France Telecom (€ 150 million) and from its amortization over its legally protected term of 20 years. |
Amortization of and provisions against intangible assets (€ 434.2 million, € 327.8 million, and € 321.5 million for 2003, 2002 and 2001 respectively) are primarily included in “Depreciation, amortization and provisions” in the accompanying consolidated statements of income.
F-35
NOTE 10- INVESTMENTS AND MARKETABLE SECURITIES
10.1 Equity securities and other investments
The main equity securities and other investments are as follows:
| | | | | | | | | | | | |
| | | As of December 31, 2003
| | As of December 31, 2002
| | As of December 31, 2001
|
(in millions of €)
| | Market or estimated value
| | Net book value
| | Market or estimated value
| | Net book value
| | Market or estimated value
| | Net book value
|
Fortis (a) | | 297.6 | | 292.5 | | 1,669.3 | | 1,669.3 | | 3,978.0 | | 2,278.9 |
Total | | 14.8 | | 14.2 | | 527.4 | | 527.4 | | 1,211.4 | | 953.9 |
Union Fenosa | | 90.2 | | 86.5 | | 76.0 | | 77.7 | | — | | — |
Iberdrola | | — | | — | | — | | — | | 605.2 | | 467.8 |
Axa | | — | | — | | — | | — | | 542.2 | | 542.2 |
SES Global | | — | | — | | 106.4 | | 106.4 | | 199.6 | | 197.2 |
Acesa | | — | | — | | — | | — | | 166.5 | | 61.9 |
Arcelor | | — | | — | | — | | — | | 70.0 | | 32.8 |
Ora Galilée/Marignan (b) | | — | | — | | — | | — | | 195.1 | | 195.1 |
LDCOM (b) | | 235.0 | | 235.0 | | 389.9 | | 389.9 | | — | | — |
Gas Natural | | 211.8 | | 203.2 | | 209.7 | | 208.8 | | — | | — |
Repurchase agreements (c) | | — | | — | | 1,107.4 | | 1,107.4 | | — | | — |
Umicore (d) | | 181.3 | | 181.3 | | — | | — | | — | | — |
Other | | 1,453.8 | | 1,191.2 | | 1,648.4 | | 1,646.7 | | 2,250.0 | | 1,923.3 |
| | |
| |
| |
| |
| |
| |
|
Total | | 2,484.5 | | 2,203.9 | | 5,734.5 | | 5,733.6 | | 9,218.0 | | 6,653.1 |
| | |
| |
| |
| |
| |
| |
|
| (a) | During 2003, the 70 million Fortis shares backed by the share redeemable bond issued during the period were reclassified in marketable securities (See Note 10.4) |
| (b) | During the first half of 2002, SUEZ purchased the entire share capital of Galilée Développement and Marignan Investissements, which in turn hold 47.7% of the share capital of FirstMark Communications France (FMCF) for € 0.1 million. All FMCF shares held by the Group were then contributed to LDCOM, SUEZ having subscribed to two LDCOM share capital issues in the amount of € 200 million. As of December 31, 2003, SUEZ’s stake in LDCOM, after impairment, is € 235.0 million, representing 16.65% of the share capital. |
| (c) | Within the context of the active management of these equity securities, the Group entered into a number of share repurchase agreements and equivalents in 2002, the securities concerned being retained in the consolidated balance sheet. These corresponded to investments in Axa (11.3 million shares, for a net book value of € 157.1 million), Fortis (38.7 million shares, for a net book value of € 636.2 million), Total (1.5 million shares for a net book value of € 204.4 million) and Vinci (2 million shares for a net book value of € 109.7 million). All the securities concerned were sold in 2003. |
| (d) | Following the partial disposals and the Group dilution in Umicore as a result of the 2003 share capital increase, the company was accounted for under the equity method until December 31, 2003 and deconsolidated after that date. |
F-36
The movements break down as follows:
| | | |
(in millions of €)
| | | |
As of December 31, 2001 | | 6,653.1 | |
Acquisitions (a) | | 3,184.3 | |
Disposals, net book value (b) | | (2,961.2 | ) |
Net allocations to reserves | | (807.1 | ) |
Changes in consolidation scope, exchange rate fluctuations and other changes (c) | | (335.5 | ) |
As of December 31, 2002 | | 5,733.6 | |
Acquisitions (a) | | 115.5 | |
Disposals, net book value (b) | | (2,097.8 | ) |
Net allocations to reserves | | (161.4 | ) |
Changes in consolidation scope, exchange rate fluctuations and other changes (c) | | (1,386.0 | ) |
As of December 31, 2003 | | 2,203.9 | |
| (a) | In 2002, the main acquisitions concerned the securities of Total (€ 1,075.9 million), Fortis (€ 579 million), LDCOM and Gas Natural. In 2003, the main acquisitions involved Seanergie (€ 19.6 million) and LGAI (€ 11.0 million) securities. |
| (b) | In 2002, the main disposals concerned the securities of Total (€ 1,061.9 million), Fortis (€ 322.2 million), Arcelor and Labeyrie. In 2003, the main disposals involved Fortis (€ 837.8 million), Total (€ 718.9 million), AXA (€ 157.1 million), SES Global (€ 106.4 million) and Vinci (€ 109.7 million). |
| (c) | In 2002, this line item comprised the impact of the contribution of the FirstMark Communications France (FMCF) shares to LDCOM, the first consolidation of the NTL subsidiaries in France and goodwill. In 2003, changes primarily included the impact of the reclassification into marketable securities of the € -1,190 million in Fortis shares backed by the share redeemable bond, the first consolidation of Acea Electrabel (€ 200.2 million) and the deconsolidation of Umicore (€ 181.3 million). |
Gains and losses realized by the Group on the disposal of equity securities totaled € -786 million, € 556.6 million, € 933.8 million (before reversal of provisions) in 2003, 2002 and 2001 respectively, and are included in the accompanying consolidated statements of income as “Exceptional income”.
10.2 Companies accounted for under the equity method (See NOTE - 7)
10.3 Other assets:
Other assets are primarily comprised of the Group loan to Elia in the net amount of € 642.5 million. In 2002, the line item was also comprised of loans granted by SUEZ as part of its Cable activities (SUEZ Lyonnaise Telecom, 50.1% proportionally consolidated company), maturing within one year and accompanied by clauses for some loans enabling their repayment in SUEZ Lyonnaise Telecom shares (these items, for a net amount of € 487.7 million in 2002, were fully written down as of December 31, 2003).
10.4 Marketable securities
The estimated fair value of the Group’s marketable securities as of December 31, 2003 was € 5,022.4 million (€ 2,583 million at the end of 2002) with an unrealized capital gain of € 7.4 million (€ 7.3 million in 2002).
As of December 31, 2003, marketable securities mainly included treasury notes, mutual fund shares and the Fortis shares backed by the share redeemable bond (€ 1,190 million).
The net reversal provisions against marketable securities are recorded in financial income and amounted to € 3.7 million in 2003, compared to net allocations of € 6.7 million in 2002 and € 5.1 million in 2001.
F-37
Net gains and losses from sales of marketable securities, included in other net financial income as total income from marketable securities (see Note 4), consisted of the following:
| | | | | | | |
(in millions of €)
| | Gains
| | Losses
| | | Total
|
2003 | | 112.4 | | (81.0 | ) | | 31.4 |
2002 | | 67.8 | | (60.4 | ) | | 7.4 |
2001 | | 37.2 | | (5.5 | ) | | 31.7 |
NOTE 11- CURRENT ASSETS
11.1 Inventories and work-in-progress
| | | | | | | | | | | | | | | | | | |
| | | As of December 31, 2003
| | As of December 31, 2002
| | As of December 31, 2000
|
(in millions of €)
| | Gross
| | Reserves
| | Net
| | Gross
| | Reserves
| | Net
| | Gross
| | Reserves
| | Net
|
Raw materials (a) | | 884.1 | | 70.6 | | 813.5 | | 1,063.5 | | 75.2 | | 988.3 | | 1,052.6 | | 74.2 | | 978.4 |
Work in-progress (a) | | 764.2 | | 30.1 | | 734.1 | | 1,220.3 | | 53.7 | | 1,166.6 | | 2,659.3 | | 35.8 | | 2,623.5 |
Finished products and goods | | 307.4 | | 4.9 | | 302.5 | | 506.4 | | 8.7 | | 497.7 | | 615.5 | | 14.1 | | 601.4 |
| | |
| |
| |
| |
| |
| |
| |
| |
| |
|
Total | | 1,955.7 | | 105.6 | | 1,850.1 | | 2,790.2 | | 137.6 | | 2,652.6 | | 4,327.4 | | 124.1 | | 4,203.3 |
| | |
| |
| |
| |
| |
| |
| |
| |
| |
|
| (a) | The change in 2003 for raw materials and finished products is due to the disposal of Nalco (€ -64.1 million and € -170.3 million respectively). The change in work-in-progress in 2002 is related to deduction of advances and down-payments received by the Energy companies acquired in 2001. The movement must be considered in conjunction with the movement in advances and down-payments received on orders recorded in liabilities. |
11.2 Trade accounts and notes receivable
The Group implemented a debt securitization program in 2002 and pursued it in 2003. The principal characteristics are described in Note 20.5.
NOTE 12- PREPAID EXPENSES AND DEFERRED INCOME
| | | | | | | | | | | | |
| | | 2003
| | 2002
| | 2001
|
(in millions of €)
| | Prepaid Expenses
| | Deferred Income
| | Prepaid Expenses
| | Deferred Income
| | Prepaid Expenses
| | Deferred Income
|
Prepaid expenses on pensions (a) | | 140.1 | | — | | 329.7 | | — | | 199.0 | | — |
Deferred tax (b) | | 895.7 | | 888.0 | | 839.1 | | 1,897.0 | | 999.3 | | 2,127.5 |
Bond discounts | | 157.2 | | — | | 91.5 | | — | | 110.1 | | — |
Expenses to be amortized | | 317.2 | | — | | 265.0 | | — | | 281.5 | | — |
Advance billing | | — | | 214.5 | | — | | 201.8 | | — | | 180.0 |
Other prepayments and accruals | | 844.5 | | 1,682.0 | | 775.2 | | 1,936.7 | | 637.9 | | 2,194.0 |
| | |
| |
| |
| |
| |
| |
|
Total | | 2,354.7 | | 2,784.5 | | 2,300.5 | | 4,035.5 | | 2,227.8 | | 4,501.5 |
| | |
| |
| |
| |
| |
| |
|
| (a) | See Note 19 for the breakdown of pension plan commitments. |
| (b) | See Note 6 for changes in deferred tax. |
F-38
NOTE 13- SHAREHOLDERS’ EQUITY
13.1 Share capital
The Group’s share capital consisted of:
| | | | | | |
As of
| | Number of shares making up the share capital
| | Par value (in €)
| | Share capital (in millions of €)
|
December 31, 2003 | | 1,007,679,806 | | 2 | | 2,015.3 |
December 31, 2002 | | 1,007,422,403 | | 2 | | 2,014.8 |
December 31, 2001 | | 1,026,280,965 | | 2 | | 2,052.6 |
Generally, each holder of shares is entitled to one vote per share at any shareholder’s meeting of the Group. A double voting right is, however, granted to holders of fully paid up registered shares when such shares have been registered for more than two years in the name of the same shareholder.
13.2 Consolidated reserves
Under French law, 5% of net income must be transferred to the legal reserve until the legal reserve reaches 10% of the share capital par value. This reserve cannot be distributed to shareholders other than in liquidation.
Not all consolidated reserves may be appropriated for distribution of dividends, due primarily to the impact of consolidation adjustments. The distributable reserves of SUEZ, the parent company, totaled € 16,147.4 million as of December 31, 2003, € 18,994.0 million as of December 31, 2002, and € 19,795.3 million as of December 31, 2001.
13.3 Cumulative translation adjustments
| | | | | | | | | | | | |
(in millions of €)
| | As of December 31,
2003
| | | Change
| | | As of December 31,
2002
| | | As of December 31,
2001
| |
Euro zone | | (51.8 | ) | | 38.3 | | | (90.1 | ) | | (88.0 | ) |
Dollar zone (US$ and CA$) | | (690.0 | ) | | (553.2 | ) | | (136.8 | ) | | 431.0 | |
Pounds sterling | | (35.8 | ) | | (63.8 | ) | | 28.0 | | | 190.9 | |
Brazilian real | | (953.0 | ) | | 35.1 | | | (988.1 | ) | | (338.0 | ) |
Argentine peso | | (220.4 | ) | | 39.1 | | | (259.5 | ) | | (92.9 | ) |
Other currencies (a) | | (287.8 | ) | | (43.3 | ) | | (244.5 | ) | | 9.3 | |
| | |
|
| |
|
| |
|
| |
|
|
Total | | (2,238.8 | ) | | (547.8 | ) | | (1,691.0 | ) | | 112.3 | |
| | |
|
| |
|
| |
|
| |
|
|
| (a) | The change observed includes, in 2003, the impact of the deterioration in exchange rates for the Thai baht (€ -109.4 million) and, in 2002, the Chilean peso (€ -140.8 million). |
13.4 Treasury stock and stock repurchase program
The Group has a stock repurchase program authorized by the shareholders’ annual general meetings held on April 25, 2003. This program provides for the purchase of a maximum of 10% of the share capital as of the Annual General Meeting date. It also requires that the accrued amount of acquisitions net of charges must not exceed the sum of € 3.6 billion, the maximum purchase price must not exceed € 36 per share and the minimum selling price may not be less than € 12 per share.
Under this program, 1,452,909 shares were purchased in 2003 for a total of € 15.7 million and 1,219,175 shares were sold for € 17.8 million.
F-39
Treasury stock (see Note 1.A) deducted from consolidated shareholders’ equity as of December 31, 2003 comprised 13,656,943 shares (compared to 13,658,943 shares as of December 31, 2002 and 25,922,892 shares as of December 31, 2001) for a total value of € 372.6 million (€ 372.6 million as of December 31, 2002 and € 830.5 million as of December 31, 2001).
Of these, Group shares owned by fully or proportionally consolidated subsidiaries and deducted from shareholders’ equity totaled € 3.6 million as of December 31, 2003 compared to € 72.5 million as of December 31, 2002 and December 31, 2001, SUEZ having purchased the treasury stock previously held by its subsidiary, Société Générale de Belgique, in 2003.
| | | | | | | | | | | | | | | | | |
| | | in millions of €
| | | Number shares
| |
| | | Deducted from SH’s equity
| | Marketable securities
| | | Total
| | | Deducted from SH’s equity
| | | Marketable securities
| | | Total
| |
December 31, 2002 | | 372.6 | | 2.0 | | | 374.6 | | | 13,658,943 | | | 208,596 | | | 13,867,539 | |
| | |
| |
|
| |
|
| |
|
| |
|
| |
|
|
Purchases by the parent company | | — | | 15.7 | | | 15.7 | | | — | | | 1,452,909 | | | 1,452,909 | |
Sales by the parent company | | — | | (12.3 | ) | | (12.3 | ) | | — | | | (1,217,175 | ) | | (1,217,175 | ) |
Write-downs by the parent company | | — | | 0.5 | | | 0.5 | | | — | | | — | | | — | |
Sales by other Group companies | | ns | | — | | | ns | | | (2,000 | ) | | — | | | (2,000 | ) |
December 31, 2003 | | 372.6 | | 5.9 | | | 378.5 | | | 13,656,943 | | | 444,330 | | | 14,101,273 | |
| | |
| |
|
| |
|
| |
|
| |
|
| |
|
|
The Board of Directors meeting of November 20, 2002 decided to reclassify in Other financial assets, 12,625,000 treasury shares initially recorded in marketable securities and held to cover stock purchase options granted to employees. As a result of recent stock market movements, the exercise conditions of these options are, in the Group’s opinion, no longer attractive to employees. In accordance with the transitional measures provided in opinion 2002-D of December 18, 2002 issued by the French Accounting Regulation Committee Urgent Issues Taskforce, this reclassification was performed at net book value as of June 30, 2002, or € 348.6 million.
13.5 Transactions resulting in goodwill being charged against net equity
Merger of Lyonnaise des Eaux and Compagnie de SUEZ in 1997
The goodwill relating to this transaction (€ 712.3 million) was charged directly against associated paid-in capital, in accordance with the option offered by accounting policies applicable to consolidated financial statements prior to January 1, 2000 (see Note 1-D). The goodwill balance was analyzed for allocation to the underlying businesses and is monitored to ensure its correct treatment, in particular in the event of disposal.
The goodwill amortization is calculated in memo accounts over the expected lives of the underlying businesses as detailed in note 1-D. The corresponding goodwill amortization expense would have amounted to € 6 million in 2003.
The sale of Fortis B and Elia securities in 2001 and 2002 resulted in part of the goodwill initially charged against paid-in capital being deducted from the capital gains recognized on disposal, in the amount of € 77.3 million and € 128.2 million respectively. These amounts take account of similar effects relating to the public offer of exchange for SGB and Tractebel described below.
In 2002, the exceptional write-down of Fortis and Coditel goodwill, calculated in memo accounts in accordance with the accounting method detailed in Note 1-D, totaled € 992.0 million. This amount takes account of similar effects relating to the public offer of exchange for SGB and Tractebel described below.
Public offer of exchange for Société Générale de Belgique (SGB) in 1998
The goodwill relating to this transaction (€ 2,494.7 million) was charged directly against associated paid-in capital, in accordance with the option offered by accounting policies applicable to consolidated financial
F-40
statements prior to January 1, 2000 (see Note 1-D). The goodwill amortization is calculated in memo accounts, not included in the financial statements, over the expected lives of the underlying businesses, that is 40 years for Energy activities and 20 years for all other activities. The corresponding recurring goodwill amortization expense would have amounted to € 34.4 million in 2003.
In 2003, the exceptional write-down of goodwill, calculated in memo accounts in accordance with the accounting method detailed in Note 1-D, totaled € 400 million. This amount takes account of similar effects relating to the public offer of exchange for Tractebel described below.
Public offer of exchange for Tractebel in 1999
The goodwill relating to this transaction (€ 5,695.5 million) was charged directly against associated paid-in capital and allocated to the principal Tractebel subsidiaries. It is subject to an accounting treatment comparable to that described above, based on an amortization period of 40 years (theoretical recurring charge in 2003: € 140 million).
Public offer of exchange for SITA in 1999
The goodwill relating to this transaction (€ 565.6 million) was charged directly against associated paid-in capital and is monitored in a similar way to that described above, based on a theoretical amortization period of 20 years (theoretical recurring charge in 2003: € 20 million).
The sale of Cespa securities in 2003 resulted in part of the goodwill initially charged against paid-in capital being deducted from the capital gains recognized on disposal, in the amount of € 27 million.
13.6 Changes in accounting policy
Impact of the application of CRC Regulation 2000-06 regarding liabilities as of January 1, 2002
| | | |
(in millions of €)
| | Value as of January 1, 2002
| |
Capitalization of the net present value of dismantling costs on the commissioning date | | 335.2 | |
Depreciation of this incidental asset from the commissioning date | | (162.8 | ) |
Impact of the above changes in method on reserves for contingencies and losses | | (280.2 | ) |
Deferred tax | | 20.3 | |
Impact on total shareholders’ equity | | (87.5 | ) |
Impact, Group share | | (48.3 | ) |
Impact, Minority interests | | (39.2 | ) |
Impact of the application of the new consolidated financial statement regulation on net deferred tax liabilities as of January 1, 2000
The impact of the change in accounting method as of January 1, 2000 introduced by the new consolidated financial statement regulation breaks down as follows:
| | | |
(in millions of €)
| | Value as of January 1, 2000
| |
Recording of deferred tax liabilities on UK water companies (nominal value) | | (510.4 | ) |
Discounting of deferred tax (a) | | 507.0 | |
Other | | (46.1 | ) |
Total | | (49.5 | ) |
Impact on investments accounted for under the equity method | | 6.6 | |
Impact on total shareholders’ equity | | (42.9 | ) |
Impact, Group share | | (24.7 | ) |
Impact, Minority interests | | (18.2 | ) |
F-41
| (a) | The discount rates used were determined individually by reference to government bond rates and reversal schedules. Essentially, only two Group companies are affected by the discounting measures (Northumbrian and Aguas Argentinas), which concern specific tax regimes applicable to fixed asset depreciation practices. |
In accordance with this change in accounting method, the deferred tax asset or liability position is now presented net for each tax entity.
Capitalization of interim interest during the construction phase of a self-constructed asset as of January 1, 2000
The impact of the change in accounting method as of January 1, 2000 resulting in the systematic capitalization of interim interest during the construction phase of self-constructed assets breaks down as follows:
| | | |
(in millions of €)
| | Value as of January 1, 2000
| |
Gross value of tangible fixed assets | | 206.5 | |
Accumulated depreciation | | (21.8 | ) |
Total net value | | 184.7 | |
Corresponding deferred tax | | (51.7 | ) |
Impact on total shareholders’ equity | | 133.0 | |
Impact, Group share | | 80.5 | |
Impact, Minority interests | | 52.5 | |
13.7 Dilutive instruments
Convertible bonds
In February 1996, the Group issued 6,634,616 convertible bonds bearing interest at 4% and with a nominal value of € 79.27. These bonds are redeemable in full on January 1, 2006 at a price of € 96.04, corresponding to 121.15% of the issue price. Each bond can be converted at any time at the rate of five Group shares for one bond. Given the conversion of 457,320 bonds in 2001, 156,217 bonds in 2002, and 460 bonds in 2003, the 2,593,928 convertible bonds outstanding as of December 31, 2003, confer entitlement to 12,969,640 SUEZ shares.
13.8 Calculation of basic and diluted earnings/(loss) per share
| | | | | | | | |
Numerator (in millions of €)
| | 2003
| | | 2002
| | | 2001
|
Net income/(loss), Group share (a) | | (2,165.2 | ) | | (862.5 | ) | | 2,086.7 |
Impact of dilutive instruments: | | | | | | | | |
Elimination of the remuneration and amortization of bond issue premiums | | 14.1 | | | 9.3 | | | 7.3 |
Diluted net income/(loss), Group share (b) | | (2,151.1 | ) | | (853.2 | ) | | 2,094.0 |
Denominator | | | | | | | | |
Average number of shares outstanding, (in millions) (c) | | 993.5 | | | 991.3 | | | 985.1 |
Impact of dilutive instruments: | | | | | | | | |
Bonds | | 13.0 | | | 13.3 | | | 15.4 |
Stock subscription and purchase option plans reserved for employees | | 0.3 | | | 5.0 | | | 5.3 |
Diluted average number of shares outstanding (d) | | 1,006.8 | | | 1,009.6 | | | 1,005.8 |
Earnings/(loss) per share in € (a)/(c) | | (2.18 | ) | | (0.87 | ) | | 2.12 |
Diluted earnings/(loss) per share in € (b)/(d) (see 1) | | (2.14 | ) | | (0.85 | ) | | 2.08 |
Adjusted to (see 1) | | (2.18 | ) | | (0.87 | ) | | na |
| (1) | The method used to determine diluted earnings/(loss) per share automatically leads to the recognition of a positive impact because of the losses recognized for 2003 and 2002. Pursuant to Opinion N° 27 of theConseil Supérieurof theOrdre des Experts Comptables, diluted earnings/(loss) per share amount to respectively € -2.18 and € -0.87, in 2003 and 2002, which is identical to earnings/(loss) per share. |
F-42
NOTE 14- MINORITY INTERESTS
Changes in minority interests for the years ended December 31 are as follows:
| | | | | | |
(in millions of €)
| | 2003
| | | 2002
| |
Minority interests as of January 1 | | 5,190.7 | | | 6,447.0 | |
Dividends distributed | | (592.9 | ) | | (641.0 | ) |
Change in unrealized foreign exchange gains and losses (a) | | (45.0 | ) | | (622.5 | ) |
Income for the year | | 910.5 | | | 822.1 | |
Changes in the consolidation scope (b) | | (616.1 | ) | | (775.7 | ) |
Impact of the change in method of accounting for reserves for dismantling installations (see Note 13.6) | | — | | | (39.2 | ) |
| | |
|
| |
|
|
Minority interests as of December 31 | | 4,847.2 | | | 5,190.7 | |
| | |
|
| |
|
|
| (a) | In 2002, this heading primarily comprised the impact of the deterioration in the Argentine peso (€ -141.7 million), Brazilian real (€ -170.2 million) and Chilean peso (€ -255.0 million) exchange rates and, in 2003, the impact of depreciations for the US dollar (€ -17.2 million), Polish zloty (€ -16.5 million) and the Oman rial (€ -16.6 million). |
| (b) | In 2002, this heading primarily comprised the impact of the buyout of Lyonnaise Europe//Northumbrian minority interests in the amount of € -333.0 million, the strengthening of the Group’s interest in Aguas Andinas for € -31.0 million and in Tractebel Energia for € -43.0 million, the equity accounting of Elia for € -224.0 million, the entry into the scope of consolidation of HHPC for € 22.0 million, and the strengthening of the Group’s interest in Electrabel for € -71.0 million and in Tractebel for € -74.0 million. |
In 2003, this heading primarily comprised the impact of the strengthening of the Group’s interest in Electrabel (€ -567.6 million), the equity accounting of UPC (€ -63.1 million), the sale of Cespa (€ -53.3 million) and the partial common stock redemption for Aguas Andinas (€ -159.2 million). These changes were partially offset by the full consolidation of Polaniec (€ 66.0 million), and the entries into the scope of consolidation of CNR (€ 99.7 million) and the Italian subsidiaries Acea Electrabel and Tirreno Power (€ 46.6 million).
NOTE 15- RESERVES FOR CONTINGENCIES AND LOSSES
| | | | | | | | | | | | | | | | | | |
(in millions of €)
| | 2002
| | Allocation
| | Reversal
for
utilization
| | | Reversal
for
excess
| | | Change
in consol.
scope
| | | Other
| | | 2003
|
Pension liabilities (see note 19) | | 2,243.0 | | 215.9 | | (163.2 | ) | | (9.4 | ) | | (167.5 | ) | | 18.7 | | | 2,137.5 |
Reprocessing and storage of nuclear fuels (a) | | 2,350.9 | | 297.7 | | (21.6 | ) | | (0.1 | ) | | — | | | — | | | 2,626.9 |
Renewals and major repairs (b) | | 1,291.5 | | 343.3 | | (219.6 | ) | | (30.3 | ) | | (30.4 | ) | | (122.6 | ) | | 1,231.9 |
Sector-related risks (c) | | 322.0 | | 72.9 | | (142.8 | ) | | (8.3 | ) | | 0.7 | | | 0.8 | | | 245.3 |
Dismantling of installations (d) | | 1,276.7 | | 106.9 | | (40.5 | ) | | (0.2 | ) | | 30.7 | | | 0.8 | | | 1,374.4 |
Losses on completion and contractual commitments (e)/(f) | | 830.1 | | 286.4 | | (350.4 | ) | | (12.9 | ) | | 19.1 | | | (34.5 | ) | | 737.8 |
Disputes, claims and tax risks (see Note 21) | | 404.3 | | 213.7 | | (100.2 | ) | | (14.0 | ) | | (11.3 | ) | | (50.4 | ) | | 442.1 |
Site rehabilitation (g) | | 432.6 | | 64.0 | | (64.0 | ) | | (0.6 | ) | | (27.8 | ) | | 7.0 | | | 411.2 |
Restructuring costs | | 296.0 | | 173.6 | | (116.9 | ) | | (35.8 | ) | | (11.5 | ) | | 28.4 | | | 333.8 |
Other contingencies and losses (h) | | 427.0 | | 289.5 | | (163.9 | ) | | (7.3 | ) | | 90.3 | | | 18.0 | | | 653.6 |
Negative goodwill, net of amortization (see note 8) | | 334.0 | | | | (74.2 | ) | | — | | | 0.5 | | | (14.4 | ) | | 245.9 |
| | |
| |
| |
|
| |
|
| |
|
| |
|
| |
|
Total reserves for contingencies and losses | | 10,208.1 | | 2,063.9 | | (1,457.3 | ) | | (118.9 | ) | | (107.2 | ) | | (148.2 | ) | | 10,440.4 |
| | |
| |
| |
|
| |
|
| |
|
| |
|
| |
|
F-43
The above cross-references are on the following pages.
| | | | | | | |
Impact
| | Allocation
| | Release
| | | Net
allocation
|
Operating income (a) | | 1,418.4 | | (1,027.6 | ) | | 390.8 |
Financial income | | 49.7 | | (18.0 | ) | | 31.7 |
Exceptional income | | 595.8 | | (530.6 | ) | | 65.2 |
| | |
| |
|
| |
|
Total | | 2,063.9 | | (1,576.2 | ) | | 487.7 |
| | |
| |
|
| |
|
| (a) | Including reversal of negative goodwill in the amount of €-74.2 million. |
Net allocations for the year primarily concern reserves recorded for the sale of loss-making contracts and activity in the amount of € 190.0 million and allocations for nuclear waste reprocessing and storage (€ 276.1 million).
Changes in the scope of consolidation (€ -107.2 million) principally reflect the disposal of Nalco, while the impact of exchange rate fluctuations (€ -104.0 million) included in the Other column is primarily due to the Group’s UK, Argentine and North American subsidiaries in the Environment sector.
(a)Reprocessing and storage of nuclear fuels:when nuclear fuel is removed from a reactor, it remains radioactive and must be treated. This reserve covers all the costs related to the treatment of the spent nuclear fuel produced to the end of the period. As such, the reserve incorporates all costs incurred in the fuel reprocessing cycle: internal costs incurred through the removal of the fuel from the reactor and initial on-site storage; costs paid to third parties for the transportation of the fuel to a reprocessing center and for the storage, fuel reprocessing by an approved body, transportation of the reprocessed waste to a disposal site and finally disposal of the waste fuel.
The reserve for spent fuel is based on the real internal costs incurred and external costs on the basis of signed contracts with third parties, being independent transportation, reprocessing and storage companies, or detailed proposals on tariffs received from independent bodies. The estimates are based upon current technical reprocessing capabilities, and actual costs incurred in the future may vary compared to the estimates used. Over the period from 1979 to date, the costs of reprocessing nuclear fuel have tended generally to reduce over time with improvements in technology and increases in reprocessing capacity. However, this is no indication as to the likely future evolution in these costs.
The reserve has been calculated based upon the used nuclear fuel being reprocessed. Spent fuel produced subsequent to 1989 is currently stored on-site and has not yet been reprocessed. A second option would be for the nuclear fuel to be disposed of after storage and appropriate conditioning, in an underground facility. The Belgian government has, to date, not definitively prescribed this option and it is not, as yet, clear when such a final decision will be taken. It is extremely difficult to estimate the potential costs of this option given that the process, timetable and location for storage are not yet known. Based upon currently available information, it is unlikely that the costs to be accrued if the nuclear fuel was permanently stored would have a material impact on the valuation of the reserve.
The reserve is calculated to incorporate all procedures required by European, State and regional environmental regulations either currently or planned for implementation. The Group is not aware of additional planned legislation, which would materially impact the value of the reserve. If additional legislation were to be introduced in the future, the cost estimates used as a basis for the calculation could vary significantly.
Based upon current forecasts for the operating lives of the nuclear power stations, nuclear reprocessing and storage costs will be incurred through approximately 2060. The reserve has been calculated using a discount rate of 8.6% p.a.
F-44
The Monitoring Committee created in 2004, in connection with the Belgian law of April 11, 2003 with respect to “provisions raised for the dismantling of nuclear power stations and the management of radioactive and fissile materials”, will now be responsible for controlling the provisioning process for commitments. It will analyze the recording methods for these provisions for 2004/2005.
(b)Renewals and major repairs: includes the obligation of the Group entities under concessions to renew concession assets and to return them in good working condition. These reserves are determined by estimating the cost of replacing installations, discounted each year at rates reflecting inflation factors. The useful life of fixed assets other than water pipes and mains may be shorter than the life of the contract. Accordingly, the reserve is recorded over the useful life of the asset and is calculated asset-by-asset, based on the respective replacement value. For water pipe systems, annual reserves are calculated contract-by-contract, with foreseeable partial renewal costs being allocated over the life of each contract.
Reserves for major repairs are intended to cover major repairs to and servicing of both conventional and nuclear power stations, as well as gas production and transportation facilities.
Other routine maintenance and repair costs are expensed as incurred.
(c)Sector-related risks: includes reserves for specific risks related to a business sector, reserves for contingencies relating to unconsolidated subsidiaries, as well as those covering warranties given within the context of disposals and which are likely to be called. For the real estate sector, these reserves correspond to losses on sales of real estate programs the Group is obliged to settle or estimated losses on sales of remaining real estate programs. The estimated losses are valued based on the fair value of each individual real estate program to be sold, net of sales expenses. Fair value is either measured by the current market value or the current market price or by discounting future cash flows. Market value or market prices are valued based on recent transactions for similar buildings or on independent appraisals.
(d)Dismantling installations: Installations, and principally conventional and nuclear power stations, must be dismantled at the end of their operational life. This obligation may be the result of prevailing environmental regulations in the countries concerned, contracts, or an implicit Group commitment.
In 2002, the Group applied CRC Regulation No. 2000-06 on liabilities with retroactive effect to January 1, 2002. A reserve is thus recorded when installations are commissioned for the discounted present value of estimated dismantling costs, and an offsetting asset is recognized. The discounted present value is calculated using a discount rate that reflects the risk-free long-term interest rate (life of the installation), adjusted for the credit risk of the company.
After commissioning and throughout the life of the installation, the reversal is adjusted to reflect the passage of time, and the offsetting asset is depreciated on a straight-line basis. The impact of the change in accounting method is recorded directly in shareholders’ equity.
The main installations concerned are nuclear power stations, for which the reserve covers all dismantling-related costs, including:
| | • | removal of the spent nuclear fuel, drainage of the liquid systems, disconnection of the operating systems, |
| | • | dismantling of the reactor core and biological shielding, |
| | • | complete dismantling of the reactor and removal of all radioactive material. |
In accordance with an agreement with the Belgian Government, the costs of nuclear power station dismantling are estimated every 5 years on the basis of a detailed study carried out by an independent third-party expert. The most recent study was performed in 2000.
F-45
At the end of 2003, the reserve for dismantling nuclear power stations is based on the cost estimate presented in this study and is consistent with the work schedule used therein.
The Monitoring Committee created In 2004, in connection with the Belgian law of April 11, 2003 with respect to “provisions raised for the dismantling of nuclear power stations and the management of radioactive and fissile materials”, will now be responsible for controlling the provisioning process for commitments. It will analyze the recording methods for these provisions for 2004/2005.
For conventional power stations, the dismantling reserve takes into account, in accordance with the new accounting standard, all legal and/or implicit obligations.
The company is not aware of additional planned legislation, which would materially impact the value of the reserve. If additional legislation were to be introduced in the future, the costs estimates used as a basis for the calculation could vary significantly.
(e)Losses on completion — Project completion — Warranties: represents reserves for long-term contracts partially completed at year-end, but for which a loss on completion is expected, reserves to cover costs to be borne following completion of a project (cost of withdrawing equipment and staff, possible redundancy payments, site rehabilitation, disputes with sub-contractors, etc.), and reserves for warranties which primarily concern companies in the Energy sector that have a contractual commitment to maintain in serviceable condition or replace equipment forming part of installations covered by a “total warranty” clause.
(f)Contractual commitments:reserves recognized on the acquisition of subsidiaries and taken into account in purchase price allocation, in respect of contractual obligations inherent to their business (contractual commitments principally relate to maximum price commitments of limited duration, in regard to the initial contracts of Tracetebel Energia in Brazil, and are amortized pro rata to the volumes concerned).
(g)Site rehabilitation:includes reserves relating to legal, regulatory and contractual landfill site rehabilitation commitments in the Waste Services sector. These reserves cover, in addition, the long-term monitoring of the landfill sites. They are calculated individually by site, based on coverage costs, pro rata to site utilization and net of work already carried out and are provided over the period of operation. Costs arising following site closure or during the long-term monitoring period (30 years within the European Community) are discounted to present value.
(h)Other contingencies and losses:this item mainly includes reserves for miscellaneous employee-related litigation, environmental risks and various business risks.
NOTE 16- BORROWINGS AND LONG-TERM DEBT
16.1 Management of financial contingencies
Cash surpluses are pooled within special-purpose Group financial vehicles (SUEZ Finance S.A., SUEZ Finance LP, Tractebel Cash Management Services — TCMS, Cocetrel coordination center) and redistributed to borrowing subsidiaries.
An intermediate pooling is performed either within each business activity (Tractebel, Ondeo Nalco, Ondeo Degrémont, Sita, etc.) or by geographical area (SUEZ Finance LP for the US dollar, SUEZ Finance SA in France and TCMS in Belgium for the euro, etc.).
Any residual balance after utilization within the Group is invested to ensure maximum liquidity at minimum risk with leading counterparties selected based on their rating and the Group’s knowledge of such counterparties.
As of December 31, 2003, no single counterparty represented more than 14% of cash surplus investments.
F-46
16.2 Borrowings and long-term debt by category
| | | | | | |
(in millions of €)
| | December 31,
2003
| | | December 31,
2002
| |
Bond issue | | 15,018.3 | | | 14,800.8 | |
Commercial paper | | 1,562.9 | | | 3,254.8 | |
Withdrawals on credit facilities | | 1,101.4 | | | 3,389.4 | |
Capital lease contracts (a) | | 1,252.7 | | | 1,421.8 | |
Other bank borrowings | | 6,241.5 | | | 9,317.1 | |
Other borrowings | | 430.1 | | | 942.7 | |
Total long-term borrowings | | 25,606.9 | | | 33,126.6 | |
Bank overdrafts and cash current accounts | | 1,087.2 | | | 1,417.9 | |
Total gross borrowings | | 26,694.1 | | | 34,544.5 | |
Marketable securities and cash and cash equivalents | | (11,703.0 | ) | | (8,538.9 | ) |
| | |
|
| |
|
|
Total borrowings less marketable securities and cash and cash equivalents (b) | | 14,991.1 | | | 26,005.6 | |
| | |
|
| |
|
|
| (a) | In addition to this capital lease liability, corresponding to outstanding lease payments on current contracts, the Group is committed under these contracts to pay the lessor corresponding interest. This commitment, as of December 31, 2003 is € 738.1 million, including € 70.3 million in respect of 2004, € 65.1 million in respect of 2005, € 60.7 million in respect of 2006, € 56.1 million in respect of 2007, € 51.8 million in respect of 2008, and € 434.1 million in respect of subsequent years. |
| (b) | In 2003, changes in consolidation scope and methods led to a decrease in net debt of € 2,011.4 million, including a reduction of € 1,964 million following the disposal of 75% of Northumbrian and the accounting of the residual 25% under the equity method, a reduction of € 171.0 million following the disposal of Nalco, a reduction of € 250.0 million following the disposal of Cespa and an increase of € 190.5 million resulting from the consolidation of Tirreno Power. Exchange rate fluctuations generated a reduction of € 1,251.8 million, primarily due to US dollar fluctuations. |
| • | Principal movements in 2003 |
The main operations during the period were as follows:
SUEZ issue
In May 2003, SUEZ launched a € 1,190.0 million bond issue redeemable for Fortis shares, maturing in 2006, and paying interest of 4.5%, and repaid dividends on Fortis securities. This bond issue covers 70 million Fortis shares, guaranteeing SUEZ a unit selling price of between € 17 and € 20 with a term of 3 years. These bonds are officially listed on the Luxembourg Stock Exchange under code FR0000474298.
GIE SUEZ Alliance issues
In June 2003, GIE SUEZ Alliance launched a € 3,000 million bond issue which breaks down into three tranches:
| | • | a 7-year tranche for € 1,250 million at 4.25%, maturing on June 24, 2010, |
| | • | a 12-year tranche for € 750 million at 5.125%, maturing on June 24, 2015, |
| | • | a 20-year tranche for € 1,000 million at 5.75%, maturing on June 24, 2023. |
These bonds are officially listed on the Luxembourg Stock Exchange under codes FR0000475733, FR0000475741 and FR0000475758 respectively.
F-47
In 2002, SUEZ Finance SA launched several issues under the € 2,000 million Euro Medium Term Notes program. As of December 31, 2003, amounts outstanding under this program with respect to SUEZ Finance SA and GIE SUEZ Alliance totaled € 1,191.2 million.
Repayments
In June 2003, SUEZ repaid a € 500 million variable rate bond issued in June 2001.
In November 2003, SUEZ repaid the € 231 million bond exchangeable for Vinci shares issued on May 22, 2001.
In October 2003, GIE SUEZ Alliance repaid an € 800 million variable rate bond issued on April 26, 2002.
Amounts outstanding under principal bond issues related to SUEZ for € 5,373.4 million (€ 4,977.9 million as of December 31, 2002), GIE SUEZ Alliance for € 4,550.0 million (€ 2,350.0 million as of December 31, 2002), SUEZ Finance SA for € 882.3 million (€ 1,155.9 million as of December 31, 2002), Tractebel and its subsidiaries for € 2,951.8 million (€ 3,361.7 million as of December 31, 2002). Northumbrian contributed with a Eurobond issue outstanding of € 1,711.1 million as of December 31, 2002.
Group bond issues also include:
| | • | a loan convertible into SUEZ shares, issued in February 1996 and maturing February 2006, bearing interest at 4% and with a balance as of December 31, 2003 of € 205.6 million (see note 13.7). |
| | • | bond issues exchangeable or redeemable for shares in listed companies held in the Group security portfolio (see Note 10). |
The characteristics of these exchangeable bonds are presented below:
| | | | | | | | | | | | |
| | | Bonds
exchangeable for
AXA shares
| | Bonds
exchangeable for
TotalFinaElf
shares
| | Bonds
exchangeable
for Fortis
shares (a)
| | Bonds exchangeable for Umicore shares
| | Bonds
redeemable for
Fortis shares
(b)
| | TOTAL
|
ISSUER | | SUEZ | | TRACTEBEL / ELECTRABEL (Belgelec Finance) | | SUEZ / SGB | | SUEZ / SGB | | SUEZ | | |
ISIN CODE | | FR0000492266 | | X50099147497 | | FR0000481129 | | FR0000484891 | | FR0000474298 | | |
STOCK EXCHANGE | | Luxembourg Stock Exchange | | Luxembourg Stock Exchange | | Luxembourg Stock Exchange | | Luxembourg Stock Exchange | | Luxembourg Stock Exchange | | |
UNDERLYING | | AXA shares | | TotalFinaElf shares | | Fortis shares | | Umicore shares | | Fortis shares | | |
ISSUE DATE | | April 7, 1999 | | August 4, 1999 | | July 12, 2000 | | January 15, 2001 | | May 21, 2003 | | |
ISSUE AMOUNT (NOMINAL) | | € 787 million | | € 1,266 million | | € 975 million | | € 247 million | | € 1,190 million | | |
STRIKE PRICE AND ISSUE PREMIUM | | € 144 21.2% of the issue reference price (as of February 28, 1999) | | € 167.64 28% of the issue reference price (as of June 21, 1999) | | € 1,000 20% of the issue reference price (as of June 13, 2000) | | € 44.955 - 20% of the closing price on December 6, 2000, or - 7% during the first year, 11% during the second year, 15% during the third year | | € 17.00 20% of the issue reference (as of May 19, 2003) | | |
F-48
| | | | | | | | | | | | |
| | | Bonds
exchangeable
for AXA shares
| | Bonds
exchangeable
for TotalFinaElf
shares
| | Bonds
exchangeable
for Fortis
shares (a)
| | Bonds exchangeable for Umicore shares
| | Bonds
redeemable for
Fortis shares (b)
| | TOTAL
|
MATURITY | | January 1, 2004 | | August 4, 2004 | | January 12, 2004 | | January 14, 2005 | | May 22, 2006 | | |
NOMINAL COUPON | | 0% | | 1.50% | | 2.875% | | 2.50% | | 4.5% plus repayment of dividends on Fortis shares | | |
EXCHANGE PARITY / REDEMPTION | | 4 AXA shares for 1 bond at the holder’s initiative | | 1 TFE share for 1 bond | | 28.7059 FORTIS shares for 1 bond | | 23.076 shares for 1 bond in 2001 22.2445 shares for 1 bond in 2002 21.4707 shares for 1 bond in 2003 20.5761 shares for 1 bond in 2004 At the investor’s initiative at the end of the second year with an actuarial yield of 3.5% | | 0.85 shares for 1 bond as of July 1, 2003 adjustable | | |
EXCHANGE PERIOD/EARLY REDEMPTION | | At the issuer’s initiative - up to 50% of the issue from 12/31/2001 — the remaining balance from 12/31/2002 — at a price equal to the nominal amount plus an amount resulting from the application of the yield to maturity where the bonds are not exchanged | | At the issuer’s initiative — from August 4, 2002 | | At the issuer’s initiative — from July 12, 2003 with a call trigger threshold of 110% of the issue price | | At SUEZ’s initiative — after 2 years, with a trigger of 120% of the conversion price at the time | | At the issuer’s initiative with a call trigger threshold of 120% | | |
PRINCIPAL OUTSTANDING AS OF DECEMBER 31, 2003 in millions of € | | 787.0 | | 1,265.7 | | 975.4 | | 209.6 | | 1,190.0 | | 4,427.7 |
| (a) | Bond exchangeable for Fortis shares repaid in January 2004 in the amount of € 975 million. |
| (b) | Fortis shares backed by the share redeemable bond were reclassified in marketable securities (See Note 10). |
On January 1, 2004, the bond exchangeable for Axa shares matured. As the Axa share price had fallen below the exercise price, the holders opted for repayment at par. The Group thus repaid € 864.5 million.
On January 2, 2004, SUEZ notified the holders of bonds exchangeable for Umicore shares of an advance payment on February 20, 2004 for all outstanding bonds. Subsequently, the Umicore shares backed by the share exchangeable bond (i.e. 3,278,997 shares) were remitted as payment, the balance being settled in cash.
F-49
16.3 Borrowings and long-term debt by maturity date
Borrowings and long-term debt break down by maturity as follows:
| | | | | | | | | | | | | | | | | |
As of December 31, 2003
| | TOTAL
| | | 2004
| | | 2005
| | 2006
| | | 2007
| | 2008
| | Beyond 5
years
|
Bond issue | | 15,018.3 | | | 4,178.1 | | | 518.5 | | 1,744.4 | | | 745.9 | | 256.4 | | 7,575.0 |
Commercial paper | | 1,562.9 | | | 1,562.9 | | | — | | — | | | — | | — | | — |
Withdrawals on credit facilities | | 1,101.4 | | | 1,101.4 | | | — | | — | | | — | | — | | — |
Capital lease contracts (a) | | 1,252.7 | | | 88.3 | | | 86.5 | | 86.1 | | | 94.4 | | 92.8 | | 804.6 |
Other bank borrowings | | 6,241.5 | | | 1,506.7 | | | 598.2 | | 658.2 | | | 1,170.4 | | 427.4 | | 1,880.6 |
Other borrowings | | 430.1 | | | 132.5 | | | 23.3 | | 14.9 | | | 83.0 | | 16.3 | | 160.1 |
Total long-term borrowings | | 25,606.9 | | | 8,569.9 | | | 1,226.5 | | 2,503.6 | | | 2,093.7 | | 792.9 | | 10,420.3 |
Bank overdrafts and cash current accounts | | 1,087.2 | | | 1,087.2 | | | — | | — | | | — | | — | | — |
Total gross borrowings | | 26,694.1 | | | 9,657.1 | | | 1,226.5 | | 2,503.6 | | | 2,093.7 | | 792.9 | | 10,420.3 |
Marketable securities and cash and cash equivalents (b) | | (11,703.0 | ) | | (10,513.0 | ) | | — | | (1,190.0 | ) | | — | | — | | — |
| | |
|
| |
|
| |
| |
|
| |
| |
| |
|
Total borrowings less marketable securities and cash and cash equivalents | | 14,991.1 | | | (855.9 | ) | | 1,226.5 | | 1,313.6 | | | 2,093.7 | | 792.9 | | 10,420.3 |
| | |
|
| |
|
| |
| |
|
| |
| |
| |
|
| | | | | | | | | | | | | | | | |
As of December 31, 2002
| | TOTAL
| | | 2003
| | | 2004
| | 2005
| | 2006
| | 2007
| | Beyond 5
years
|
Gross borrowings | | 34,544.5 | | | 13,396.1 | | | 5,473.4 | | 1,610.4 | | 1,619.3 | | 2,358.1 | | 10,087.2 |
Marketable securities and cash and cash equivalents | | (8,538.9 | ) | | (8,538.9 | ) | | — | | — | | — | | — | | — |
| | |
|
| |
|
| |
| |
| |
| |
| |
|
Total borrowings less marketable securities and cash and cash equivalents | | 26,005.6 | | | 4,857.2 | | | 5,473.4 | | 1,610.4 | | 1,619.3 | | 2,358.1 | | 10,087.2 |
| | |
|
| |
|
| |
| |
| |
| |
| |
|
| (a) | Including program credit facilities maturing in less than one year (€ 589.3 million) and within more than one year (€ 512.1 million). |
| (b) | Cash and cash equivalents and marketable securities maturing in 2006 correspond to the Fortis shares backed by the share redeemable bond. |
The Group is called on, primarily to finance technical installations or production capacity, but also to finance or refinance its development, to organize numerous bank facilities, the availability and withdrawals of which are sometimes contingent on compliance with financial ratios. These ratios are generally adapted to the repayment schedule of such facilities and, as such, can cover a wide range of account headings. The most common ratios generally concern the coverage of financial costs by gross operating income (segment profit) or EBIT of the borrowing entity or coverage of net borrowings (or its servicing) by shareholders’ equity and minority interests, cash flow or gross operating income (segment profit) of the borrowing entity. The level and definition of these ratios, also known as financial covenants, are set in conjunction with lenders in a prospective manner, and can be readjusted during the life of these facilities in order to maintain, at all times, current withdrawals and more generally their full availability.
As of December 31, 2003 no event of default has been declared on any Group financial indebtedness and Group companies comply with the covenants and representations included in their finance documents, except for some financings in Latin America for which Group representatives are currently in negotiation with the lenders (see Note 2.5 for the description of the Argentine situation), or some guarantees and project financings for which the existing technical defaults do not materially affect the ability of the obligor to perform their payment obligations.
F-50
SUEZ’s financial policy does not subordinate the availability of bank lines to the credit ratings awarded by rating agencies, other than in the highly specific case of securitization programs (see notes 1-J and 11.2 Trade accounts and notes receivable). Similarly, the terms and conditions of bonds issued by SUEZ on the capital markets are not linked to financial ratios.
As of December 31, 2003, confirmed available credit facility programs were as follows:
| | |
| | | Confirmed
available credit
facility programs
|
2004 | | 2,445.6 |
2005 | | 2,587.2 |
2006 | | 429.4 |
2007 | | 400.4 |
2008 | | 2,506.5 |
2009 | | 59.0 |
Thereafter | | 280.2 |
| | |
|
Total | | 8,708.3 |
| | |
|
Of these available programs, an amount of € 1,562.9 million covers commercial paper note issues.
The three main SUEZ confirmed and available credit facilities are:
| | • | a € 2,500 million syndicated credit line available for GIE SUEZ Alliance or SUEZ and SUEZ Finance SA, underwritten by GIE SUEZ Alliance, maturing on April 25, 2008; |
| | • | a € 1,125 million multi-currency line set up by SUEZ, maturing on November 19, 2006 by straight-line amortization; |
| | • | a US$1,000 line set up by SUEZ Finance LP and underwritten by SUEZ, maturing in full on July, 1, 2005. |
All three programs are subordinate to compliance with ratios concerning the coverage of the net interest expense by gross operating income (segment profit), the coverage of net borrowings by Group shareholders’ equity and minority interests and the coverage of net borrowings by gross operating income for the € 2,500 million syndicated credit line.
Borrowings less marketable securities and cash and cash equivalents / Group shareholders’ equity and minority interests :
| | | | | | |
(in millions of €)
| | 2003
| | | 2002
| |
Long-term debt | | 25,606.9 | | | 33,126.6 | |
Bank overdrafts and cash current accounts | | 1,087.2 | | | 1,417.9 | |
Marketable securities | | (5,015.0 | ) | | (2,575.8 | ) |
Cash and cash equivalents | | (6,688.0 | ) | | (5,963.1 | ) |
Borrowings less marketable securities and cash and cash equivalents | | 14,991.1 | | | 26,005.6 | |
Shareholders’ equity and minority interests | | 11,742.9 | | | 15,768.2 | |
Debt/equity ratio | | 127.7 | % | | 164.9 | % |
As of December 31, 2003, no single counterparty represented more than 15% of the confirmed and available credit facilities.
F-51
16.4 Borrowings and long-term debt by business segment
The breakdown by contracting business segment is as follows:
| | | | | | | | | |
(in millions of €)
| | December 31, 2003
| | | December 31, 2002
|
| | | Gross
| | Net (b)
| | | Gross
| | Net (b)
|
ENERGY | | 9,421.3 | | 3,428.3 | | | 11,618.0 | | 7,407.4 |
SE (formerly SELS) | | 4,574.1 | | 3,672.4 | | | 9,250.4 | | 8,062.9 |
SEIS | | 9.7 | | (5.1 | ) | | 188.4 | | 27.8 |
OTHER (a) | | 12,689.0 | | 7,895.5 | | | 13,487.7 | | 10,507.5 |
| | |
| |
|
| |
| |
|
Total | | 26,694.1 | | 14,991.1 | | | 34,544.5 | | 26,005.6 |
| | |
| |
|
| |
| |
|
| (a) | The debts of SUEZ SA, SUEZ Finance SA, and GIE SUEZ Alliance are included on this line. |
| (b) | Net of marketable securities, cash and cash equivalents. |
The breakdown by business segment using borrowings less marketable securities and cash and cash equivalents is as follows:
| | | | |
(in millions of €)
| | December 31,
2003
| | December 31,
2002
|
ENERGY | | 5,095.1 | | 6,456.9 |
SE (formerly SELS) | | 4,508.8 | | 9,385.5 |
SEIS | | 48.9 | | 1,279.7 |
OTHER | | 5,338.3 | | 8,883.5 |
| | |
| |
|
Total | | 14,991.1 | | 26,005.6 |
| | |
| |
|
16.5 Borrowings and long-term debt by currency
The main currencies in which the Group’s debts were denominated are as follows:
| | | | | | | | | | | | | | | | | | | | |
Gross debt
| | After adjustment for financial
instruments
| | | Before adjustment for financial
instruments
| |
| (in millions of €) | | 2003
| | %
| | | 2002
| | %
| | | 2003
| | %
| | | 2002
| | %
| |
€ Zone | | 17,072.5 | | 64 | % | | 19,266.0 | | 56 | % | | 19,699.1 | | 74 | % | | 21,769.1 | | 63 | % |
$ Zone | | 5,992.9 | | 22 | % | | 9,790.5 | | 28 | % | | 4,277.0 | | 16 | % | | 7,076.5 | | 20 | % |
£ Zone | | 877.4 | | 3 | % | | 3,508.7 | | 10 | % | | 282.8 | | 1 | % | | 3,381.3 | | 10 | % |
Other currencies | | 2,751.3 | | 11 | % | | 1,979.3 | | 6 | % | | 2,435.2 | | 9 | % | | 2,317.6 | | 7 | % |
| | |
| |
|
| |
| |
|
| |
| |
|
| |
| |
|
|
Total | | 26,694.1 | | 100 | % | | 34,544.5 | | 100 | % | | 26,694.1 | | 100 | % | | 34,544.5 | | 100 | % |
| | |
| |
|
| |
| |
|
| |
| |
|
| |
| |
|
|
| | | | | | | | | | | | | | | | | | | | |
Borrowings less marketable securities and
cash and cash equivalents
| | After adjustment for financial
instruments
| | | Before adjustment for financial
instruments
| |
| (in millions of €) | | 2003
| | %
| | | 2002
| | %
| | | 2003
| | %
| | | 2002
| | %
| |
€ Zone | | 6,399.1 | | 43 | % | | 12,709.8 | | 49 | % | | 9,375.1 | | 63 | % | | 15,213.0 | | 58 | % |
$ Zone | | 5,648.2 | | 38 | % | | 8,786.8 | | 34 | % | | 3,582.9 | | 24 | % | | 6,072.7 | | 23 | % |
£ Zone | | 846.9 | | 6 | % | | 3,298.2 | | 13 | % | | 252.3 | | 2 | % | | 3,170.9 | | 12 | % |
Other currencies | | 2,096.9 | | 13 | % | | 1,210.8 | | 4 | % | | 1,780.8 | | 11 | % | | 1,549.0 | | 7 | % |
| | |
| |
|
| |
| |
|
| |
| |
|
| |
| |
|
|
Total | | 14,991.1 | | 100 | % | | 26,005.6 | | 100 | % | | 14,991.1 | | 100 | % | | 26,005.6 | | 100 | % |
| | |
| |
|
| |
| |
|
| |
| |
|
| |
| |
|
|
F-52
16.6 Borrowings and long-term debt by interest rate
| | | | | | | | |
(in millions of €)
| | After adjustment of
financial instruments
| | Before adjustment of
financial instruments
|
| | | 2003
| | 2002
| | 2003
| | 2002
|
Floating-rate | | 10,734.0 | | 16,450.1 | | 9,072.9 | | 15,532.1 |
Highest | | 27.3% | | 48.0% | | 21.2% | | 48.0% |
Lowest | | 0.1% | | 0.1% | | 0.0% | | 0.1% |
Weighted average as of December 31 | | 3.9% | | 3.9% | | 3.4% | | 3.7% |
Fixed-rate | | 15,960.1 | | 18,094.4 | | 17,621.2 | | 19,012.4 |
Highest | | 16.9% | | 40.0% | | 16.9% | | 40.0% |
Lowest | | 0.0% | | 0.0% | | 0.1% | | 0.0% |
Weighted average as of December 31 | | 4.5% | | 5.1% | | 4.6% | | 5.1% |
Floating interest rates are generally linked to inter-bank offered rates in the relevant currency zones. The weighted average interest rate applied to bank overdrafts was 2.6% at the end of 2003 and 3.2% at the end of 2002. The weighted average interest rate applied to long-term debt was 4.2% and 4.7% at the end of 2003 and 2002, respectively.
16.7 Market value of borrowings
The market value of borrowings and long-term debt as of December 31, 2003 is € 27,250.4 million (net book value of € 26,694.1 million), compared to € 35,488.2 million as of December 31, 2002 (net book value of € 34,544.5 million). The market value of gross debt after taking into account financial instruments totals € 27,265 million. This market value, which includes accrued interest receivable, was calculated based on the interest rate which the Group could obtain for loans with comparable terms, conditions and maturities, when available.
NOTE 17- OTHER ACCOUNTS PAYABLE
Other accounts payable break down as follows:
| | | | |
(in millions of €)
| | December 31,
2003
| | December 31,
2002
|
Employee profit sharing | | 128.9 | | 150.5 |
Liabilities on capitalized concession user rights | | 108.0 | | 92.5 |
Tax liabilities (corporate income tax) | | 943.0 | | 904.6 |
Advances from subsidiaries | | 112.5 | | 236.3 |
Other operating liabilities | | 4,588.2 | | 5,174.7 |
| | |
| |
|
Total | | 5,880.6 | | 6,558.6 |
| | |
| |
|
NOTE 18- DERIVATIVE INSTRUMENTS AND MARKET-RELATED EXPOSURES
Purpose of derivative instruments
The Group uses derivative financial instruments primarily to manage its exposure to fluctuations in interest rates, foreign exchange rates, commodities and equity investments. Except for commodities which involve specific trading transactions and certain issues regarding the optimization of the listed securities portfolio, these financial instruments are generally designated as hedges of underlying exposures associated with specific assets, liabilities or cash flows.
Counterparty risk
Cash surpluses are invested and financial instruments traded with major international banks. Group counterparties are highly diversified, in order to avoid excessive concentration of this risk. They are selected based on ratings awarded by rating agencies and Group knowledge. As of December 31, 2003, no single counterparty represented over 18% of the notional amount of financial instruments used.
F-53
Credit limits are also set for commodity trading based on counterparty ratings. Letters of credit and guarantees are requested, where necessary, to limit counterparty risk.
Notional amounts and fair value
In the tables presented in Notes 18.1 and 18.2, the notional amounts represent the face values of financial instruments. They do not represent the discounted value of amounts actually exchanged by the parties and thus are not a measure of the Group’s exposure as a result of its use of instruments.
Notional amounts expressed in foreign currencies are translated into euro at year-end exchange rates.
The fair value of foreign exchange and interest rate instruments is estimated for the following:
| | • | For instruments traded on an organized market based on year-end market prices. |
| | • | For over-the-counter instruments by discounting future cash flow differentials, or by obtaining a market price from third-party banks. |
The fair value amounts, whether estimated internally or by third-party banks, have been determined using available market information or other appropriate valuation methodologies. Therefore, the estimates are not necessarily indicative of the amounts that could be realized or would be paid in a current market exchange. The effect of using different market assumptions and/or estimation methodologies may be material to the estimated fair value amounts.
18.1 Foreign currency and interest rate risk
Foreign currency risk
In the course of its operations, the Group is exposed to currency risk arising from firm commitments under which revenues are denominated in foreign currency. The Group hedges these risks either by entering into specific insurance policies (such as Coface contracts in France) or by using forward contracts. The purpose of this hedging activity is to protect the Group against any adverse currency movements which may affect contract revenues. The Group also hedges estimated cash flows related to forecasted investments and divestments using, in this case, firm or option contracts.
With respect to net investments in non-euro currencies, the Group generally hedges the associated currency exposure by using financing in the same currency. With regards to net investments in emerging markets, the foreign currency exposure is reduced through (i) contractual price adjustments negotiated in the concession contracts, (ii) US$-denominated contracts and (iii) increased costs and expenses in the local currency. Occasionally, derivative instruments such as foreign currency swaps, forward contracts or collars can also be used. None of the collars set up by the Group can be considered to be written options (no net premium is received either at inception or over the life of the contracts).
Group foreign currency instruments are primarily denominated in U.S. dollars.
Interest rate risk
In order to optimize borrowing costs and protect against an increase in interest rates, the Group uses hedging instruments (interest rate swaps, FRA, Caps, Floors, etc.) which alter the fixed rate/floating rate structure of its debt. None of the collars set up by the Group can be considered to be written options (no net premium is received either at inception or over the life of the contracts). Floating-rate debt is predominantly linked to the European Interbank Offered Rate (“EURIBOR”), as determined at 1, 2, 3 or 6 month intervals, and the Libor Interbank Offered Rate (“LIBOR”), as determined at 1, 2, 3 or 6-month intervals.
F-54
Off-balance sheet financial instruments held to manage foreign exchange and interest rate risk are as follows:
| | | | | | | | | | | | | | | | | | | |
(in millions of €)
| | Average
Rate
| | Notional contract value maturing in year ending December 31
As of December 31, 2003
| | Fair
Value
| |
| | | | | 2004
| | 2005
| | 2006
| | 2007
| | 2008
| | > 5 years
| | Total
| | | |
Interest rate swaps — Pay fixed rate | | | | 1,838.1 | | 1,120.1 | | 737.7 | | 427.6 | | 340.0 | | 705.6 | | 5,169.1 | | (166.4 | ) |
€ | | 4.4% | | 1,229.1 | | 571.8 | | 99.1 | | 118.6 | | 168.5 | | 393.6 | | 2,580.7 | | (50.3 | ) |
£ | | 5.6% | | 1.0 | | 1.2 | | 1.3 | | 1.4 | | 21.3 | | 23.6 | | 49.8 | | (0.2 | ) |
US$ | | 4.1% | | 579.1 | | 532.0 | | 625.7 | | 299.6 | | 141.2 | | 215.8 | | 2,393.4 | | (107.4 | ) |
Other currencies | | 6.5% | | 28.9 | | 15.1 | | 11.6 | | 8.0 | | 9.0 | | 72.6 | | 145.2 | | (8.5 | ) |
Interest rate swaps — Receive fixed rate | | | | 769.4 | | 124.2 | | 72.6 | | 17.0 | | 7.0 | | 4,838.5 | | 5,828.7 | | 169.4 | |
€ | | 4.5% | | 757.9 | | 56.1 | | 67.1 | | 11.5 | | 1.5 | | 4,445.3 | | 5,339.4 | | 81.5 | |
£ | | 6.8% | | — | | — | | — | | — | | — | | 386.4 | | 386.4 | | 80.7 | |
US$ | | 5.4% | | 5.5 | | 68.1 | | 5.5 | | 5.5 | | 5.5 | | 6.8 | | 96.9 | | 7.1 | |
Other currencies | | 7.5% | | 6.0 | | — | | — | | — | | — | | — | | 6.0 | | 0.1 | |
Interest rate swaps — Floating/Floating | | | | 797.1 | | 18.1 | | 24.1 | | 146.8 | | 45.3 | | 168.9 | | 1,200.3 | | (3.6 | ) |
€ | | — | | 5.3 | | 14.1 | | 24.1 | | 146.8 | | 45.3 | | 168.9 | | 404.5 | | 0.8 | |
US$ | | — | | 791.8 | | 4.0 | | — | | — | | — | | — | | 795.8 | | (4.2 | ) |
FRA (Forward Rate Agreement) — Purchased | | | | | | | | | | | | | | | | | | | |
€ | | 4.8% | | 158.7 | | 158.7 | | 106.0 | | — | | — | | — | | 423.4 | | (1.6 | ) |
Caps — Purchased | | | | 145.5 | | 161.9 | | 14.5 | | 106.7 | | 14.7 | | 34.9 | | 478.2 | | 7.0 | |
€ | | 6.8% | | 141.6 | | 74.4 | | 9.9 | | 103.1 | | 9.9 | | 24.1 | | 363.0 | | 7.0 | |
US$ | | 8.3% | | 3.9 | | 87.5 | | 4.6 | | 3.6 | | 4.8 | | 10.8 | | 115.2 | | — | |
Caps — Sold | | | | 39.7 | | 95.1 | | — | | — | | — | | — | | 134.8 | | — | |
€ | | 6.1% | | 39.7 | | 39.7 | | — | | — | | — | | — | | 79.4 | | — | |
US$ | | 7.8% | | — | | 55.4 | | — | | — | | — | | — | | 55.4 | | (—) | |
Floors — Purchased | | | | | | | | | | | | | | | | | | | |
€ | | 3.2% | | 30.0 | | 50.0 | | 10.0 | | — | | — | | — | | 90.0 | | 0.5 | |
Collars | | | | 19.4 | | 136.2 | | 7.0 | | 8.4 | | 8.1 | | 32.1 | | 211.2 | | (24.4 | ) |
€ | | 2.0%- 3.0% | | 2.8 | | 3.2 | | 3.7 | | 4.2 | | 4.8 | | 5.5 | | 24.2 | | (0.1 | ) |
£ | | 5.6%- 8.0% | | 15.0 | | — | | — | | — | | — | | — | | 15.0 | | (0.1 | ) |
US$ | | 4.7%-6.4% | | 1.6 | | 133.0 | | 3.3 | | 4.2 | | 3.3 | | 26.6 | | 172.0 | | (24.2 | ) |
Currency swaps — By currency borrowed | | | | | | | | | | | | | | | | | | | |
US$ | | | | 219.5 | | 167.9 | | 159.1 | | 204.4 | | 199.1 | | 905.5 | | 1,855.5 | | 552.0 | |
Currency swaps — By currency lent | | | | 226.0 | | 49.6 | | 114.7 | | — | | — | | 220.8 | | 611.1 | | 54.7 | |
€ | | | | — | | 49.6 | | — | | — | | — | | 150.0 | | 199.6 | | 28.8 | |
US$ | | | | — | | — | | — | | — | | — | | 55.4 | | 55.4 | | 25.5 | |
Other currencies | | | | 226.0 | | — | | 114.7 | | — | | — | | 15.4 | | 356.1 | | 0.4 | |
Foreign exchange swaps — By currency borrowed | | | | 1,757.3 | | 63.4 | | 0.8 | | 0.8 | | 20.7 | | 3.6 | | 1,846.6 | | 15.7 | |
€ | | | | 0.9 | | — | | — | | — | | — | | — | | 0.9 | | (—) | |
£ | | | | 646.4 | | — | | — | | — | | 19.9 | | — | | 666.3 | | 0.5 | |
US$ | | | | 906.0 | | 0.8 | | 0.8 | | 0.8 | | 0.8 | | 3.6 | | 912.8 | | 18.6 | |
Other currencies | | | | 204.0 | | 62.6 | | — | | — | | — | | — | | 266.6 | | (3.4 | ) |
Foreign exchange swaps — By currency lent | | | | 252.7 | | 37.1 | | 10.1 | | 11.3 | | — | | — | | 311.2 | | (21.3 | ) |
£ | | | | 24.1 | | — | | — | | — | | — | | — | | 24.1 | | 0.1 | |
US$ | | | | 213.9 | | 37.1 | | 10.1 | | — | | — | | — | | 261.1 | | (20.4 | ) |
Other currencies | | | | 14.7 | | — | | — | | 11.3 | | — | | — | | 26.0 | | (1.0 | ) |
F-55
| | | | | | | | | | | | | | | | | | | |
(in millions of €)
| | Average
Rate
| | Notional contract value maturing in year ending December 31
As of December 31, 2003
| | Fair
Value
| |
| | | | | 2004
| | 2005
| | 2006
| | 2007
| | 2008
| | > 5 years
| | Total
| | | |
Forward contracts — Purchased | | | | 348.0 | | 166.3 | | 107.0 | | 10.2 | | 0.1 | | — | | 631.6 | | (0.9 | ) |
€ | | | | 3.9 | | — | | — | | — | | — | | — | | 3.9 | | 2.7 | |
£ | | | | 46.4 | | 55.2 | | 22.7 | | 1.8 | | — | | — | | 126.1 | | (0.7 | ) |
US$ | | | | 296.9 | | 111.1 | | 84.3 | | 8.4 | | 0.1 | | — | | 500.8 | | (2.4 | ) |
Other currencies | | | | 0.8 | | — | | 0.1 | | — | | — | | — | | 0.8 | | (0.5 | ) |
Forward contracts — Sold | | | | 349.4 | | 32.1 | | 9.8 | | 7.2 | | 7.2 | | 82.7 | | 488.4 | | 159.3 | |
£ | | | | 66.6 | | 14.3 | | 1.1 | | — | | — | | — | | 82.0 | | 17.0 | |
US$ | | | | 159.5 | | 12.1 | | 7.5 | | 7.2 | | 7.2 | | 82.7 | | 276.2 | | 43.0 | |
Other currencies | | | | 123.3 | | 5.7 | | 1.2 | | — | | — | | — | | 130.2 | | 99.3 | |
Insurance contracts (COFACE) | | | | | | | | | | | | | | | | | | | |
US$ | | | | 16.2 | | — | | — | | — | | — | | — | | 16.2 | | 5.2 | |
| | | | |
| |
| |
| |
| |
| |
| |
| |
|
|
Total | | | | 6,967.0 | | 2,380.7 | | 1,373.4 | | 940.4 | | 642.2 | | 6,992.6 | | 19,296.3 | | 745.6 | |
| | | | |
| |
| |
| |
| |
| |
| |
| |
|
|
| | | |
(in millions of €)
| | Average
rate
| | Notional contract value maturing in year ending December 31 As of December 31, 2002
| | Fair
value
| |
| | | | | 2003
| | 2004
| | 2005
| | 2006
| | 2007
| | > 5 years
| | Total
| | | |
Interest rate swaps — Pay fixed rate | | | | 780.7 | | 1,840.5 | | 1,469.3 | | 194.3 | | 489.8 | | 622.1 | | 5,396.7 | | (308.9 | ) |
€ | | 4.0% | | 369.9 | | 785.6 | | 558.2 | | 65.8 | | 24.3 | | 255.8 | | 2,059.6 | | (106.9 | ) |
£ | | 6.5% | | 38.9 | | 1.1 | | 185.8 | | 1.4 | | 1.5 | | 11.0 | | 239.7 | | (15.3 | ) |
US$ | | 5.5% | | 342.8 | | 1,023.7 | | 676.8 | | 121.0 | | 457.4 | | 311.3 | | 2,933.0 | | (171.1 | ) |
Other currencies | | 6.6% | | 29.1 | | 30.1 | | 48.5 | | 6.1 | | 6.6 | | 44.0 | | 164.4 | | (15.6 | ) |
Interest rate swaps — Receive fixed rate | | | | 1,695.6 | | 103.5 | | 172.0 | | 52.6 | | 42.9 | | 2,582.1 | | 4,648.7 | | 299.1 | |
€ | | 4.5% | | 1,672.8 | | 66.7 | | 30.0 | | 50.7 | | 16.1 | | 2,078.1 | | 3,914.4 | | 187.0 | |
£ | | 6.2% | | 16.9 | | 23.1 | | — | | — | | — | | 504.0 | | 544.0 | | 100.6 | |
US$ | | 3.7% | | 5.9 | | 6.5 | | 142.0 | | 1.9 | | 26.8 | | — | | 183.1 | | 11.0 | |
Other currencies | | 7.5% | | — | | 7.2 | | — | | — | | — | | — | | 7.2 | | 0.5 | |
Interest rate swaps — Floating/Floating | | | | 77.2 | | 953.6 | | 4.9 | | — | | 106.1 | | — | | 1,141.8 | | (7.0 | ) |
€ | | | | 20.0 | | — | | — | | — | | 106.1 | | — | | 126.1 | | 1.4 | |
US$ | | | | 57.2 | | 953.6 | | 4.9 | | — | | — | | — | | 1,015.7 | | (8.4 | ) |
FRA (Forward Rate Agreement) — Purchased | | | | 251.3 | | 158.7 | | 158.7 | | 119.0 | | — | | — | | 687.7 | | (1.7 | ) |
€ | | 4.5% | | 188.7 | | 158.7 | | 158.7 | | 119.0 | | — | | — | | 625.1 | | (1.7 | ) |
Other currencies | | 4.1% | | 62.6 | | — | | — | | — | | — | | — | | 62.6 | | — | |
Caps — Purchased | | | | 159.0 | | 155.5 | | 148.5 | | 63.2 | | 111.2 | | 35.0 | | 672.4 | | 2.5 | |
€ | | 6.5% | | 59.9 | | 147.0 | | 39.3 | | 53.9 | | 106.8 | | 16.1 | | 423.0 | | 0.4 | |
US$ | | 7.7% | | 99.1 | | 8.5 | | 109.2 | | 9.3 | | 4.4 | | 18.9 | | 249.4 | | 2.1 | |
Caps — Sold | | | | 48.3 | | — | | 106.4 | | 39.7 | | — | | — | | 194.4 | | — | |
€ | | 6.1% | | — | | — | | 39.7 | | 39.7 | | — | | — | | 79.4 | | 0.1 | |
US$ | | 7.8% | | 48.3 | | — | | 66.7 | | — | | — | | — | | 115.0 | | (0.1 | ) |
Floors — Purchased | | | | | | | | | | | | | | | | | | | |
€ | | 4.3% | | 35.0 | | 30.0 | | — | | — | | — | | — | | 65.0 | | 0.8 | |
Collars | | | | 3.5 | | 18.6 | | 66.4 | | 100.7 | | 4.6 | | 39.6 | | 233.4 | | (23.5 | ) |
US$ | | 4.8%-6.5% | | 3.1 | | 2.3 | | 66.4 | | 100.7 | | 4.6 | | 39.6 | | 216.7 | | (23.1 | ) |
£ | | 5.6%-8.0% | | 0.4 | | 16.3 | | — | | — | | — | | — | | 16.7 | | (0.4 | ) |
Currency swaps — By currency borrowed | | | | 148.8 | | 174.4 | | 194.7 | | 208.8 | | 346.0 | | 1,182.8 | | 2,255.5 | | 192.4 | |
US$ | | | | 144.0 | | 157.6 | | 182.2 | | 191.6 | | 330.6 | | 1,182.8 | | 2,188.8 | | 188.9 | |
Other currencies | | | | 4.8 | | 16.8 | | 12.5 | | 17.2 | | 15.4 | | — | | 66.7 | | 3.5 | |
Currency swaps — By currency lent | | | | 16.1 | | 247.3 | | 49.6 | | 122.3 | | — | | — | | 435.3 | | 0.7 | |
€ | | | | — | | — | | 49.6 | | — | | — | | — | | 49.6 | | (16.1 | ) |
F-56
| | | | | | | | | | | | | | | | | | | |
(in millions of €)
| | Average
rate
| | Notional contract value maturing in year ending December 31 As of December 31, 2002
| | Fair
value
| |
| | | | | 2003
| | 2004
| | 2005
| | 2006
| | 2007
| | > 5 years
| | Total
| | | |
Other currencies | | | | 16.1 | | 247.3 | | 0.0 | | 122.3 | | — | | — | | 385.7 | | 16.8 | |
Foreign exchange swaps — By currency borrowed | | | | 2,893.2 | | 22.3 | | 63.4 | | 0.8 | | 0.8 | | 7.3 | | 2,987.8 | | 69.8 | |
US$ | | | | 2,374.9 | | 0.8 | | 0.8 | | 0.8 | | 0.8 | | 7.3 | | 2,385.4 | | 55.9 | |
£ | | | | 286.8 | | — | | — | | — | | — | | — | | 286.8 | | 1.8 | |
Other currencies | | | | 231.5 | | 21.5 | | 62.6 | | — | | — | | — | | 315.6 | | 12.1 | |
Foreign exchange swaps — By currency lent | | | | 105.7 | | — | | 53.2 | | 14.5 | | 12.2 | | — | | 185.6 | | (8.7 | ) |
US$ | | | | 4.7 | | — | | 53.2 | | 14.5 | | — | | — | | 72.4 | | (11.1 | ) |
£ | | | | 101.0 | | — | | — | | — | | — | | — | | 101.0 | | 2.4 | |
Other currencies | | | | — | | — | | — | | — | | 12.2 | | — | | 12.2 | | — | |
Forward contracts — Purchased | | | | 47.7 | | 1.3 | | — | | — | | 89.7 | | — | | 138.7 | | (3.7 | ) |
€ | | | | 15.0 | | 1.3 | | — | | — | | — | | — | | 16.3 | | 1.5 | |
US$ | | | | 19.9 | | — | | — | | — | | 89.7 | | — | | 109.6 | | (5.5 | ) |
£ | | | | 5.9 | | — | | — | | — | | — | | — | | 5.9 | | — | |
Other currencies | | | | 6.9 | | — | | — | | — | | — | | — | | 6.9 | | 0.3 | |
Forward contracts — Sold | | | | 194.3 | | 34.6 | | 16.5 | | 5.5 | | 5.5 | | 81.5 | | 337.9 | | 36.9 | |
€ | | | | — | | — | | 10.3 | | — | | — | | — | | 10.3 | | 0.6 | |
£ | | | | 26.9 | | — | | — | | — | | — | | — | | 26.9 | | — | |
US$ | | | | 153.1 | | 31.7 | | 5.5 | | 5.5 | | 5.5 | | 81.5 | | 282.8 | | 29.7 | |
Other currencies | | | | 14.3 | | 2.9 | | 0.7 | | — | | — | | — | | 17.9 | | 6.6 | |
Foreign exchange options | | | | | | | | | | | | | | | | | | | |
Call — Purchased | | | | | | | | | | | | | | | | | | | |
US$ | | | | 9.7 | | — | | — | | — | | — | | — | | 9.7 | | (0.1 | ) |
Put — Purchased | | | | | | | | | | | | | | | | | | | |
US$ | | | | 9.7 | | — | | — | | — | | — | | — | | 9.7 | | 0.6 | |
Put — Sold | | | | | | | | | | | | | | | | | | | |
US$ | | | | 9.5 | | — | | — | | — | | — | | — | | 9.5 | | (0.3 | ) |
Insurance contracts (COFACE) | | | | | | | | | | | | | | | | | | | |
US$ | | | | 29.8 | | 19.5 | | — | | — | | — | | — | | 49.3 | | 4.4 | |
| | |
| |
| |
| |
| |
| |
| |
| |
| |
|
|
Total | | | | 6,515.1 | | 3,759.8 | | 2,503.6 | | 921.4 | | 1,208.8 | | 4,550.4 | | 19,459.1 | | 253.3 | |
| | |
| |
| |
| |
| |
| |
| |
| |
| |
|
|
18.2 Equity risk
The Group has optimized the management of its security portfolio through the sale of call options, incorporated in particular with the issue of bonds exchangeable for portfolio securities (see Note 16.2). If these portfolio securities are sold, the Group hedges these transactions, where necessary, through the purchase of call options.
Furthermore, the Group may sell call options to optimize the risk management of its security portfolio.
Off-balance sheet financial instruments held to manage equity risk are as follows (excluding call options incorporated with the options exchangeable issued):
| | | | | | | | | | | | | | | | | |
Equity instruments
| | Notional contract value maturing in year ended December 31
| | Fair
value
| |
| | | As of December 31, 2003
| |
(in millions of €)
| | 2004
| | 2005
| | 2006
| | 2007
| | 2008
| | > 5 years
| | Total
| | | |
Equity options | | | | | | | | | | | | | | | | | |
Call—sold (a) | | 312.8 | | — | | — | | — | | — | | — | | 312.8 | | 3.8 | |
Call—purchased (b) | | 661.7 | | — | | — | | — | | — | | — | | 661.7 | | (0.2 | ) |
| | |
| |
| |
| |
| |
| |
| |
| |
|
|
Total | | 974.5 | | — | | — | | — | | — | | — | | 974.5 | | 3.6 | |
| | |
| |
| |
| |
| |
| |
| |
| |
|
|
| (a) | the calls sold concern 19,999,936 Fortis shares held in the securities portfolio as part of this line’s sales strategy |
| (b) | the calls purchased hedge any bonds issued by the Group exchangeable for Total shares |
F-57
| | | | | | | | | | | | | | | | | |
Equity instruments
| | Notional contract value maturing in year ended December 31
| | Fair
value
| |
| | | As of December 31, 2002
| |
(in millions of €)
| | 2003
| | 2004
| | 2005
| | 2006
| | 2007
| | > 5 years
| | Total
| | | |
Equity options | | | | | | | | | | | | | | | | | |
Call—sold | | 30.7 | | — | | — | | — | | — | | — | | 30.7 | | (0.7 | ) |
Call—purchased | | 16.2 | | — | | — | | — | | — | | — | | 16.2 | | — | |
| | |
| |
| |
| |
| |
| |
| |
| |
|
|
Total | | 46.9 | | — | | — | | — | | — | | — | | 46.9 | | (0.7 | ) |
| | |
| |
| |
| |
| |
| |
| |
| |
|
|
18.3 Commodity risk
18.3.1 Hedging transactions
In the course of its operating activities, the Group is exposed to fluctuations in commodity prices, in particular in the gas and electricity markets.
The increasing liquidity of these markets enabled the Group in 2003 to enter into transactions hedging these risks using derivative instruments, both firm and optional, available on organized markets and over-the-counter. The Group’s aim is to protect against unfavorable movements in market prices which could effect supply costs or sales contract margins.
Off-balance sheet financial instruments held with a view to managing exposure to fluctuations in commodity prices are presented below in their notional amount expressed in MMBTU (millions of British Thermal Units, the standard conversion unit for energy contracts):
| | | | | | | | | | | | | | | | | | | | | |
Commodity instruments
| | Notional amount
| | | Fair value
| |
| | | (in thousands of MMBTU) As of December 31, 2003
| | | (in
millions of €)
| |
| | | 2004
| | | 2005
| | | 2006
| | | 2007
| | 2008
| | > 5 years
| | Total
| | | | |
Natural gas and electricity | | (127,850.0 | ) | | (117,061.0 | ) | | 16,732.0 | | | 40,150.0 | | 40,260.0 | | 0.0 | | (147,769.0 | ) | | (291.4 | ) |
Swaps | | (115,873.0 | ) | | (110,689.0 | ) | | 18,468.0 | | | 40,150.0 | | 40,260.0 | | | | (127,684.0 | ) | | (267.3 | ) |
Options | | 10,234.0 | | | (904.0 | ) | | — | | | | | | | | | 9,330.0 | | | (7.1 | ) |
Forwards/futures | | (22,211.0 | ) | | (5,468.0 | ) | | (1,736.0 | ) | | | | | | | | (29,415.0 | ) | | (17.0 | ) |
Fuel, Gas oil and Heating oil | | (52,598.0 | ) | | (47,073.0 | ) | | 0.0 | | | 0.0 | | 0.0 | | 0.0 | | (99,671.0 | ) | | 71.2 | |
Swaps | | (57,364.0 | ) | | (47,073.0 | ) | | | | | | | | | | | (104,437.0 | ) | | 70.4 | |
Options | | 4,766.0 | | | — | | | | | | | | | | | | 4,766.0 | | | 0.9 | |
Forwards/futures | | — | | | — | | | | | | | | | | | | 0.0 | | | (0.1 | ) |
Crude oil | | 55,464.0 | | | 55,464.0 | | | 40,211.0 | | | 0.0 | | 0.0 | | 0.0 | | 151,139.0 | | | 1.0 | |
Swaps | | 55,464.0 | | | 55,464.0 | | | 40,211.0 | | | | | | | | | 151,139.0 | | | 1.7 | |
Forwards/futures | | — | | | — | | | — | | | — | | — | | — | | 0.0 | | | (0.7 | ) |
| | |
|
| |
|
| |
|
| |
| |
| |
| |
|
| |
|
|
Total | | (124,984.0 | ) | | (108,670.0 | ) | | 56,943.0 | | | 40,150.0 | | 40,260.0 | | 0.0 | | (96,301.0 | ) | | (219.2 | ) |
| | |
|
| |
|
| |
|
| |
| |
| |
| |
|
| |
|
|
F-58
18.3.2 Trading activities in commodities
The Group enters into spot and forward contracts for natural gas, electricity and various petroleum products on organized and over-the-counter markets. The Group offers its customers price risk management services. These transactions are performed using a variety of intermediary instruments traded in Europe and the United States.
Derivative instruments used include: (a) forward contracts involving physical delivery of an energy commodity, (b) swap agreements, which require payments to (or receipt of payments from) counterparties based on the differential between a fixed and variable price for the commodity, and (c) options and other contractual arrangements. The Group uses commodity derivatives in order to optimize prices proposed to industrial and commercial customers in the energy sector, as well as for positions taken on its own behalf.
In accordance with internal risk control procedures, risk control departments, independent of the trading departments which initiate and actively manage the positions, are responsible for performing fair value calculations and managing market and credit risks. Fair value and risk exposure calculations are performed daily. Information potentially impacting the credit rating of Group trading activity counterparties is collected and assessed daily and credit limits are automatically adjusted based on the financial data of counterparties.
Net income generated by Group trading activities, defined as net margin after brokerage fees and net allocations to reserves, amounted to € 70 million in 2003 (compared to € 37 million in 2002).
Notional Amounts and Terms
The notional amounts and terms of these instruments are shown hereafter (notional amounts in MMBTU, millions of British Thermal Units, the standard conversion unit for energy contracts):
| | | | | | | | | | |
Commodities
| | As of December 31, 2003
| | As of December 31, 2002
|
| | | Notional
Amount
(Net*) In thousands
of MMBTU
| | | Maximum
maturity
(in years)
| | Notional
Amount
(Net*) In thousands
of MMBTU
| | | Maximum
maturity
(in years)
|
Electricity | | 3,409.5 | | | | | (4,165.7 | ) | | |
Swaps | | 12,731.0 | | | 8 | | (556.3 | ) | | 9 |
Options | | 8,210.0 | | | 2 | | 1,984.4 | | | 2 |
Futures/Forwards | | (17,531.5 | ) | | 4 | | (5,593.8 | ) | | 5 |
Natural gas | | 68,455.3 | | | | | (7,332.5 | ) | | |
Swaps | | 5,704.5 | | | 4 | | (422.7 | ) | | 4 |
Options | | 23,699.0 | | | 4 | | (910.7 | ) | | 3 |
Futures/Forwards | | 39,051.8 | | | 4 | | (5,999.1 | ) | | 9 |
Crude oil | | 521.0 | | | | | 1,377.5 | | | |
Swaps | | 4,118.6 | | | 3 | | 0.7 | | | 4 |
Options | | (3,597.6 | ) | | 1 | | 634.8 | | | 2 |
Futures/Forwards | | — | | | — | | 742.0 | | | 1 |
Fuel, Gas oil and Heating oil | | 131.9 | | | | | 5,320.4 | | | |
Swaps | | 131.9 | | | 1 | | 5,320.4 | | | 1 |
Options | | — | | | — | | — | | | — |
Futures/Forwards | | — | | | — | | — | | | — |
| | |
|
| | | |
|
| | |
Total | | 72,517.7 | | | | | (4,800.3 | ) | | |
| | |
|
| | | |
|
| | |
| * | purchase position/(selling position) |
F-59
Notional amounts reflect the volume of open transactions and not the amounts exchanged by the parties relating to the financial instruments. Accordingly, notional amounts are not an exact measure of the Group’s exposure to market or credit risks. The maximum maturities indicated above and the related notional amounts are not indicative of probable future cash flows, to the extent that price risk management could lead to netting of these positions on the market at any time within the limit of the Group’s available funds.
Average maturity, weighted by volume, of the Group’s commitment portfolio as of December 31, 2003 and 2002 was approximately 4.2 and 4.5 years, respectively.
Fair value
The fair value as of December 31, 2003 and 2002 and the average fair value of instruments used in commodity trading activities are set forth below:
| | | | | | | | | | | |
(in millions of €)
| | Fair value as
of December 31,
2003
| | Average fair
value for the
year ended
December 31,
2003 (a)
| | | Fair value as
of December 31,
2002
| | | Average fair
value for the
year ended
December 31,
2002 (a)
| |
Natural gas and electricity | | 19.1 | | (6.2 | ) | | (8.6 | ) | | 4.5 | |
Crude oil | | 0.0 | | 2.2 | | | 0.5 | | | 0.3 | |
Fuel, Gas oil and Heating oil | | 0.5 | | (0.8 | ) | | (4.4 | ) | | (2.9 | ) |
| | |
| |
|
| |
|
| |
|
|
Total | | 19.6 | | (4.8 | ) | | (12.4 | ) | | 1.9 | |
| | |
| |
|
| |
|
| |
|
|
These fair values are not representative of probable future cash flows insofar as the underlying positions are sensitive to price movements and can be modified by new transactions.
The following table presents the fair value of financial instruments held by the Group as of December 31, 2003, as part of its energy trading activities, analyzed by valuation method and maturity.
Fair value calculation method
| | | | | | | | | | |
| | | Contract fair value as of December 31, 2002
| | | Total fair
value
|
(in millions of €)
| | <1 year
| | 1 to 5 years
| | | > 5 years
| | | |
Listed price on an active market (a) | | 1.8 | | (0.2 | ) | | — | | | 1.6 |
Price provided by other external sources (b) | | 3.0 | | 7.2 | | | — | | | 10.2 |
Price based on calculation models or other valuation methods (c) | | 7.4 | | 1.9 | | | (1.5 | ) | | 7.8 |
| | |
| |
|
| |
|
| |
|
Total | | 12.2 | | 8.9 | | | (1.5 | ) | | 19.6 |
| | |
| |
|
| |
|
| |
|
| (a) | Listed prices on an organized market: for contracts traded on organized markets, the Group uses the prices published by these markets. Prices are available at the end of each trade day. |
| (b) | Prices provided by other external sources: for contracts traded over-the-counter, the Group uses prices communicated by brokers. Listed prices on organized markets are directly available to value long-term contracts and swap contracts on commodity and energy markets in which the Group trades. Prices reflect current economic and regulatory conditions on these markets and are subject to short-term modifications reflecting changes in market conditions. The availability of listed prices on organized markets varies depending on the period and commodity. During these periods and in reduced liquidity areas, the Group estimates the price based on organized market prices, prices available on less liquid markets and other fundamental market analyses. The price of transactions performed by the Group is also used to validate the transactions obtained and the prices received from brokers. |
F-60
| (c) | Models and other valuation methods: the Group estimates the fair value of less-standard instruments using models and other valuation techniques which reflect the most relevant available information. Valuation techniques include the valuation of options, statistical analyses and simulations and discounted value concepts including estimation risk and cash flow scheduling measurement and reflecting specific contractual clauses. Assumptions include commodity market prices, or an estimate thereof in the absence of market prices, nil risk discounting rates, volatility factors underlying positions, the estimated correlation of commodity and energy prices, contractual volumes, estimated values, the liquidity of the market on which the contract is traded and the risk premium taken into account by market players when determining fair value. While listed market prices are not available for these derivative contracts themselves, the market price of the underlying commodity is a significant component in the valuation of these contracts. |
Changes in fair value
| | | |
(in millions of €)
| | | |
Fair value as of December 31, 2002 | | (12.4 | ) |
Contracts unwound or settled in 2003 | | (48.5 | ) |
Initial fair value recorded for new contracts in 2003 (a) | | — | |
Fair value movements due to changes in appraisal techniques (b) | | (0.2 | ) |
Other changes in fair value (c) | | 80.7 | |
| | |
|
|
Fair value as of December 31, 2003 | | 19.6 | |
| | |
|
|
| (a) | Energy trading contracts presenting unrealized gains or losses from initiation. |
| (b) | Includes fair value movements resulting from changes in valuation techniques, changes in the method of calculating correlations, volatilities and volume forecasts, changes in the market and historical data characteristics used to calculate correlations, volatilities and historical forecasts and also changes in sources or types of assumptions. |
| (c) | Represent fair value changes due to market fluctuations (price fluctuations, volatility, etc.). |
Counterparty risk
In conjunction with the valuation of its financial instruments, the Group provides reserves for risks associated with its trading activity, including credit risk. Credit risk reflects the loss that the Group would incur as a result of nonperformance by counterparties of their contractual obligations. The Group has implemented credit procedures with regard to its counterparties and a risk management policy in order to minimize this risk (evaluation of potential counterparties’ financial condition, including credit rating, security requests, use where possible of standardized agreements which allow for the netting of positive and negative exposures associated with a single counterparty, and collateral requirements).
As of December 31, 2002, 78% of credit exposure was due to “investment grade” counterparties.
| | | | | | | | |
| | | 2003
| | 2002
|
(in millions of €)
| | Investment
Grade (a)
| | Total
| | Investment
Grade (a)
| | Total
|
Oil and gas producers | | 28.8 | | 31.7 | | 7.3 | | 9.8 |
Energy marketers | | 153.2 | | 182.0 | | 164.1 | | 191.2 |
Gas and electric utilities | | 70.9 | | 132.0 | | 168.9 | | 215.4 |
Financial institutions | | 68.8 | | 68.8 | | 39.5 | | 41.1 |
Industrials | | 0.6 | | 2.7 | | 7.4 | | 9.0 |
Organized markets | | 14.2 | | 14.8 | | — | | 0.9 |
| | |
| |
| |
| |
|
Total | | 336.5 | | 432.0 | | 387.2 | | 467.4 |
| | |
| |
| |
| |
|
F-61
| (a) | The “Investment Grade” column includes transactions with counterparties with a minimum Standard & Poor’s or Moody’s rating of BBB- or Baa3 respectively, or an equivalent Dun & Bradstreet rating. “Investment Grade” status is also determined using publicly available credit ratings, along with consideration of pledged assets, letters of credit and parent company guarantees. |
Market risk: Value at risk
In accordance with internal risk management procedures, market risk is managed by risk control departments independent of the trading departments which initiate and actively manage the positions. Trading activities expose the Group to market risk resulting from negative movements in commodity and electricity prices. This price risk is generated by the trading activities which manage the positions resulting from the range of products offered to our customers and our production units and positions taken on the Group’s own behalf. The Group assesses, measures and manages the market risk in respect of commodity and electricity positions, on a daily basis, using the value at risk method, together with other market risk limits. The quantification of the market risk using the value at risk approach provides a transversal measure of risk, taking all markets and products into account. The use of these methods requires the determination of key assumptions, and notably the selection of a confidence interval and a holding period.
| | | | | | | | | | |
(in millions of €)
| | Dec. 31,
2003
| | 2003
Average
(a)
| | 2002
Average
(a)
| | High 2003
(b)
| | Low 2003
(b)
|
Value at risk | | 3.2 | | 4.4 | | 4.6 | | 10.1 | | 2.2 |
| (a) | Average daily values (100%). |
| (b) | Month-end highs and lows observed in 2003. |
Value at risk (VAR) represents the maximum potential loss in value in an asset portfolio, based on a given investment period and confidence interval. The value at risk is not an indication of expected future results. The Group assumes an investment period of 1 day and a confidence interval of 95%.
NOTE 19- PENSION LIABILITIES AND RELATED COMMITMENTS
Description of the main pension plans and related benefits
Companies belonging to the Electricity and Gas sector in Belgium
In Belgium, the rights of employees in Electricity and Gas sector companies, namely Electrabel, ECS, Distrigaz, Fluxys and Laborelec, and certain SUEZ-TRACTEBEL S.A employee categories, are governed by collective bargaining agreements.
These agreements, applicable to “waged-rated” employees recruited prior to June 1, 2002 and managerial staff recruited prior to May 1, 1999, specify the benefits entitling employees to a supplementary pension equivalent to 75% of the most recent annual income, for a full career and in addition to the statutory pension. These supplements for defined benefit plans are partly transferable to beneficiaries.
Most of the commitments resulting from these pension plans are financed by several pension funds established for the Electricity and Gas sector and certain insurance companies.
Pre-funded pension plans are funded by employer and employee contributions. Employer contributions are calculated annually based on actuarial assessments, in order to verify that the minimum legal financing commitments are met and benefits will be financed in the long-term.
“Wage-rated” employees recruited prior to June 1, 2002 and managerial staff recruited prior to May 1, 1999 are covered under defined benefit plans.
F-62
The Electricity and Gas sector companies also grant other post-retirement benefits such as the reimbursement of medical expenses, electricity and gas price reductions, jubilee benefits and early retirement schemes. These benefits are not pre-funded.
The calculation of commitments takes into account, within the current regulatory and collective bargaining agreement context, the methods used by the electricity and gas supply sector in Belgium (see note 1.O). With regard to the separation of production and distribution activities, the breakdown of commitments could be reviewed.
The benefit obligation relating to these plans represents around 40% of the total benefit cost and similar as of December 31, 2003.
Companies belonging to the Electricity and Gas Industries sector in France
The pension plan for the statutory agents of companies belonging to the Electricity and Gas Industries sector in France is a component of the legislation governing mandatory state pension plans within the meaning of French Social Security Code. The Group companies involved in this plan are CPCU, SMEG and CNR.
The pension plan for Electricity and Gas Industries sector companies is a defined benefit contributory pension plan. The companies are obliged to pay the benefits corresponding to the pensions of former employees via an amortization payment.
Changes to the plan have been under discussion since 2002 and an agreement has yet to be signed. The Group companies have provided for the commitments for which they consider themselves presently responsible and which will be reviewed at the end of the negotiations.
Other companies
Most other Group companies also grant their employees post-employment benefits (pension and early retirement plans, retirement termination benefits, medical coverage, benefits in kind, etc.) and other long-term employment benefits (jubilee and other long-service benefits, etc.).
The benefits covered by defined benefit pension plans are allocated in the form of a lump sum paid upon the employee’s retirement or annuities, both of which are generally based on the pre-retirement salary and length of service.
In France, retirement termination benefits are paid to employees, and the amount, set by the applicable collective bargaining agreement, is defined by the number of months of service acquired at the time of retirement. Certain French subsidiaries also propose supplementary defined benefit pension plans that guarantee a level of annuity upon retirement.
In the United States and England in particular, the annuities paid upon retirement are generally determined by a percentage of the pre-retirement salary.
Defined benefit pension plans can be fully or partly pre-funded by employer contributions to a pension fund (UK, US) or a restricted fund managed by an insurance company (France). With the exception of the United States, other post-employment benefit plans and other long-term benefits are generally not pre-funded.
Certain companies, particularly in the Netherlands, contribute to multi-employer pension plans, which are treated as defined contribution plans.
F-63
SUEZ commitments in respect of pension plans are as follows:
| | | | | | | | | | | | | | | | | | |
| | | December 31, 2003
| | | December 31, 2002
| |
(in millions of €)
| | Pension
benefits
(a)
| | | Other
benefits
(b)
| | | Total
| | | Pension
benefits
(a)
| | | Other benefits
(b)
| | | Total
| |
Change in benefit obligation | | | | | | | | | | | | | | | | | | |
Projected benefit obligation, as of January 1 | | (4,734.9 | ) | | (755.5 | ) | | (5,490.4 | ) | | (4,869.3 | ) | | (903.1 | ) | | (5,772.4 | ) |
Service cost | | (90.5 | ) | | (20.1 | ) | | (110.6 | ) | | (143.4 | ) | | (27.3 | ) | | (170.7 | ) |
Interest cost | | (174.8 | ) | | (31.5 | ) | | (206.3 | ) | | (265.4 | ) | | (44.6 | ) | | (310.0 | ) |
Plan participant contributions paid | | (10.7 | ) | | — | | | (10.7 | ) | | (22.3 | ) | | (1.9 | ) | | (24.2 | ) |
Amendments | | (4.8 | ) | | 14.9 | | | 10.1 | | | 6.4 | | | 59.9 | | | 66.3 | |
Acquisition/Disposal | | 1,267.4 | | | 145.8 | | | 1,413.2 | | | 193.0 | | | 61.9 | | | 254.9 | |
Curtailment/Settlements | | (130.8 | ) | | (32.0 | ) | | (162.8 | ) | | 9.0 | | | (0.3 | ) | | 8.7 | |
Special Termination | | (13.8 | ) | | (17.1 | ) | | (30.9 | ) | | (16.8 | ) | | 10.6 | | | (6.2 | ) |
Actuarial gains/(losses) | | 12.0 | | | 32.5 | | | 44.5 | | | (273.7 | ) | | (19.4 | ) | | (293.1 | ) |
Benefits paid | | 247.2 | | | 50.0 | | | 297.2 | | | 296.4 | | | 59.5 | | | 355.9 | |
Other (foreign currency translation) | | 68.3 | | | 19.0 | | | 87.3 | | | 351.2 | | | 49.2 | | | 400.4 | |
Projected benefit obligation, as of December 31 A | | (3,565.4 | ) | | (594.0 | ) | | (4,159.4 | ) | | (4,734.9 | ) | | (755.5 | ) | | (5,490.4 | ) |
Change in fair value of plan assets | | | | | | | | | | | | | | | | | | |
Fair value of plan assets, as of January 1 | | 2,720.0 | | | 29.3 | | | 2,749.3 | | | 3,219.3 | | | 35.9 | | | 3,255.2 | |
Actual return on plan assets | | 133.1 | | | 4.3 | | | 137.4 | | | (234.5 | ) | | (2.9 | ) | | (237.4 | ) |
Company and Plan participant contributions | | 213.0 | | | 51.2 | | | 264.2 | | | 341.5 | | | 57.5 | | | 399.0 | |
Acquisition/Disposal | | (941.5 | ) | | — | | | (941.5 | ) | | (67.3 | ) | | — | | | (67.3 | ) |
Curtailment/Settlements | | 72.1 | | | 4.6 | | | 76.7 | | | (4.5 | ) | | — | | | (4.5 | ) |
Benefits paid | | (247.2 | ) | | (50.0 | ) | | (297.2 | ) | | (293.9 | ) | | (55.7 | ) | | (349.6 | ) |
Other (foreign currency translation) | | (49.5 | ) | | (5.3 | ) | | (54.8 | ) | | (240.6 | ) | | (5.5 | ) | | (246.1 | ) |
Fair value of plan assets, as of December 31 B | | 1,900.0 | | | 34.1 | | | 1,934.1 | | | 2,720.0 | | | 29.3 | | | 2,749.3 | |
Funded status A+B | | (1,665.4 | ) | | (559.9 | ) | | (2,225.3 | ) | | (2,014.9 | ) | | (726.2 | ) | | (2,741.1 | ) |
Unrecognized actuarial loss | | 268.4 | | | (19.4 | ) | | 249.0 | | | 826.7 | | | 84.3 | | | 911.0 | |
Unrecognized actuarial prior service cost | | 1.7 | | | (13.4 | ) | | (11.7 | ) | | (21.8 | ) | | (48.9 | ) | | (70.7 | ) |
Unrecognized actuarial transition obligation | | — | | | — | | | — | | | (0.8 | ) | | — | | | (0.8 | ) |
Asset ceiling | | (9.4 | ) | | — | | | (9.4 | ) | | (11.6 | ) | | — | | | (11.6 | ) |
Accrued (prepaid) benefit cost | | (1,404.7 | ) | | (592.7 | ) | | (1,997.4 | ) | | (1,222.4 | ) | | (690.8 | ) | | (1,913.2 | ) |
Accrued benefit liability | | (1,544.8 | ) | | (592.7 | ) | | (2,137.5 | ) | | (1,518.3 | ) | | (724.6 | ) | | (2,242.9 | ) |
Prepaid benefit cost | | 140.1 | | | 0.0 | | | 140.1 | | | 295.9 | | | 33.8 | | | 329.7 | |
| (a) | Retirement pensions and obligations. |
| (b) | Long-service medals, health care and other post employment benefits. |
The Emergency Committee of the French National Accounting Council issued its opinion No. 2004-A on January 21, 2004 on the “Accounting treatment of modifications to retirement termination payments pursuant to the application of Act No. 2003-775 dated August 21, 2003 (on pension reforms)”. Applying the Fillon Act will not have a significant impact on Group commitments.
F-64
Hedging of obligations as of December 31, 2003 and 2002 consists of the following :
| | | | | | | | | | | | | | | | | | |
| | | As of December 31, 2003
| | | As of December 31, 2002
| |
(in millions of €)
| | Benefits
exceed
assets
| | | Assets
exceed
benefits
| | | Total
| | | Benefits
exceed
assets
| | | Assets
exceed
benefits
| | | Total
| |
Projected benefit obligation | | (3,646.0 | ) | | (513.4 | ) | | (4,159.4 | ) | | (5,244.9 | ) | | (245.5 | ) | | (5,490.4 | ) |
Plan assets at fair value | | 1,496.0 | | | 438.1 | | | 1,934.1 | | | 2,468.8 | | | 280.5 | | | 2,749.3 | |
Unrecognized actuarial loss | | 148.3 | | | 100.7 | | | 249.0 | | | 824.4 | | | 86.6 | | | 911.0 | |
Unrecognized actuarial prior service cost & transition obligation | | (11.7 | ) | | — | | | (11.7 | ) | | (71.5 | ) | | — | | | (71.5 | ) |
Asset ceiling | | (9.4 | ) | | — | | | (9.4 | ) | | (11.6 | ) | | — | | | (11.6 | ) |
| | |
|
| |
|
| |
|
| |
|
| |
|
| |
|
|
Total net commitments | | (2,022.8 | ) | | 25.4 | | | (1,997.4 | ) | | (2,034.8 | ) | | 121.6 | | | (1,913.2 | ) |
| | |
|
| |
|
| |
|
| |
|
| |
|
| |
|
|
Changes in pension and other benefits liability and changes in prepaid benefit cost recorded in the accompanying consolidated balance sheets are as follows:
| | | | | | |
(in millions of €)
| | Accrued
benefit
liability
| | | Prepaid
benefit
cost
| |
Balance recognized as of December 31, 2002 | | (2,242.9 | ) | | 329.7 | |
Foreign currency translation | | 22.7 | | | (18.1 | ) |
Changes in the scope and miscellaneous | | 134.2 | | | (168.2 | ) |
Period expense net of contributions | | (273.4 | ) | | (35.3 | ) |
Employer contributions | | 221.9 | | | 32.0 | |
Balance recognized as of December 31, 2003 | | (2,137.5 | ) | | 140.1 | |
The net periodic cost recognized in respect of pensions and other benefits for the years ended December 31, 2003 and 2002 consisted of the following:
| | | | | | |
(in millions of €)
| | 2003
| | | 2002
| |
Service cost | | 110.6 | | | 170.7 | |
Interest cost | | 206.4 | | | 310.0 | |
Expected return on plan assets | | (113.9 | ) | | (212.6 | ) |
Amortization of actuarial net loss / (gain) | | (18.3 | ) | | 2.1 | |
Amortization of unrecognized prior service cost | | 7.6 | | | 4.3 | |
Gains or losses on pension plan curtailment, termination and settlement (a) | | 92.1 | | | (55.2 | ) |
Special termination (b) | | 23.7 | | | (5.8 | ) |
Asset ceiling | | 0.5 | | | (0.8 | ) |
Net period benefit cost | | 308.7 | | | 212.7 | |
| (a) | The cost in 2003 is mainly due to the transfer of employees (therefore pension commitments) of Belgian inter-municipal companies (equity investees) to Electrabel Customers Solutions (a fully consolidated company), as part of the deregulation of the electricity sector. |
| (b) | In 2003, exceptional events generated additional expenses due to the early retirement settlements, while in 2002, such events generated a reduction in charges following the renegotiation of pension-related employee benefits. |
F-65
Actuarial assumptions
Actuarial assumptions are determined individually for each country and for each company in association with independent actuaries. Weighted discounting rates are presented below:
| | | | | | | | | | | | |
| | | Pension Benefits
| | Other Benefits
| | Total benefits
|
| | | 2003
| | 2002
| | 2003
| | 2002
| | 2003
| | 2002
|
Discount rate | | 5.4% | | 5.7% | | 5.0% | | 5.8% | | 5.3% | | 5.7% |
Rate of compensation increase | | 3.7% | | 3.7% | | 3.3% | | 3.6% | | 3.6% | | 3.7% |
Expected return on plan assets | | 6.1% | | 6.7% | | 7.0% | | 8.5% | | 6.1% | | 6.7% |
Residual service period | | 13 years | | 14 years | | 14 years | | 14 years | | 13 years | | 14 years |
Healthcare costs are assumed to increase by 3.7% in 2004 and 3.6% in 2005 and thereafter.
A one percentage point change in assumed healthcare cost trend rates would have the following effect on the other benefit plans for retirees:
| | | | | |
(in millions of €)
| | Percentage
point
increase
| | Percentage
point
decrease
| |
Impact on costs | | 2.4 | | (1.8 | ) |
Impact on post retirement benefit obligations | | 19.7 | | (15.4 | ) |
In 2003, the geographical breakdown of the main commitments and the related actuarial assumptions (including inflation) are as follows:
| | | | | | | | | | | | | | | | | | |
| | | Euro zone
| | | USA
| | | Rest of the World
| |
| | | Pension
benefits
| | | Other
benefits
| | | Pension
benefits
| | | Other
benefits
| | | Pension
benefits
| | | Other
benefits
| |
Net benefits | | (1,128.4 | ) | | (499.5 | ) | | 52.0 | | | (41.2 | ) | | (328.3 | ) | | (52.0 | ) |
Discount rate | | 4.8 | % | | 4.8 | % | | 6.1 | % | | 6.4 | % | | 7.2 | % | | 5.2 | % |
Rate of compensation increase | | 3.2 | % | | 3.1 | % | | 3.7 | % | | 3.7 | % | | 5.1 | % | | 4.6 | % |
Expected return on plan assets | | 5.3 | % | | 5.3 | % | | 8.5 | % | | 8.5 | % | | 7.8 | % | | na | |
Residual service period | | 13 years | | | 13 years | | | 14 years | | | 17 years | | | 14 years | | | 15 years | |
Hedging assets
The hedging assets used are as follows:
| | | | | | |
| | | 2003
| | | 2002
| |
Share investments | | 33 | % | | 47 | % |
Bond investments | | 53 | % | | 40 | % |
Real Estate | | 5 | % | | 5 | % |
Other (including monetary investments) | | 9 | % | | 8 | % |
| | |
|
| |
|
|
| | | 100 | % | | 100 | % |
| | |
|
| |
|
|
F-66
NOTE 20- OFF-BALANCE SHEET COMMITMENTS
20.1 Bilateral commitments to purchase
Operating subsidiaries of the Group have entered into various long-term contracts and “take-or-pay” contracts for the purchase or sale of specified quantities of commodities for firm purchases (essentially gas) and electricity or gas for firm sales and related services. Principal future commitments under the EGE, EGI and Elyo contracts are presented below. They are valued at the closing spot rate or the price provided in the contract if this is not exclusively based on market conditions and according to their maturity are discounted based on the issued bond rates of leading companies. The Group is also committed to purchasing and selling future services in the completion of long-term contracts.
In the normal course of activities, certain Group companies have also entered into contracts for the purchase of technical installations with a total value of € 1,832 million as of December 31, 2003. These commitments primarily concern the construction of energy production units and the acquisition of equipment comprising turbines, gas power stations and cogeneration plants and incinerators.
| | | | | | |
(in millions of €)
| | Firm
commodity,
combustibles
and
electricity
purchases
| | Firm
electricity,
gas,
steam and oil
sales
| | Firm PP&E
purchases
|
2004 | | 4,095.9 | | 7,210.9 | | 486.4 |
2005 | | 3,023.2 | | 4,013.4 | | 412.2 |
2006 | | 2,335.6 | | 2,942.3 | | 72.0 |
2007 | | 1,913.5 | | 1,921.7 | | 474.3 |
2008 | | 1,701.9 | | 1,574.3 | | 2.1 |
Thereafter | | 12,614.1 | | 9,761.8 | | 385.0 |
| | |
| |
| |
|
Total | | 25,684.2 | | 27,424.4 | | 1,832.0 |
| | |
| |
| |
|
Finally, the Group also made investments in certain concession contracts and, as such, incurred capital expenditures totaling € 1,240.5 million as of December 31, 2003.
20.2 Operating leases which may not be terminated
The Group is committed to operating leases, which may not be terminated, relating to premises, facilities, ships (LNG tankers) and vehicles which expire on various dates during the next few years. The Group considers that, in the normal course of business, contracts expiring will be renewed or replaced.
Lease charges are presented in Note 3.
The present value of minimum future payments in respect of these leases is as follows:
| | |
(in millions of €)
| | Operating
leases which
may not be
terminated
|
2004 | | 206.2 |
2005 | | 189.8 |
2006 | | 145.4 |
2007 | | 114.6 |
2008 | | 102.2 |
Thereafter | | 579.0 |
| | |
|
Total | | 1,337.2 |
| | |
|
F-67
20.3 Other commitments
| | | | | | | | | | |
(in millions of €)
| | Maturing
within
Dec. 31
| | 1 year
| | 1 to 5 years
| | More than 5
years
| | 31 Dec.
2002
|
Commitments given: | | | | | | | | | | |
Commitments given on contracts | | 2,637.2 | | 1,055.7 | | 509.0 | | 1,072.5 | | 2,373.8 |
Performance bonds and similar | | 1,838.9 | | 788.5 | | 397.6 | | 652.8 | | 1,685.3 |
Other guarantees given on contracts | | 798.3 | | 267.2 | | 111.4 | | 419.7 | | 688.5 |
Financing commitments: | | 5,655.4 | | 2,421.8 | | 1,067.0 | | 2,166.6 | | 4,067.0 |
Personal collateral given | | 1,042.7 | | 536.8 | | 289.0 | | 216.9 | | 1,194.3 |
Assets pledged and other collateral given | | 4,398.8 | | 1,839.1 | | 737.6 | | 1,822.1 | | 2,750.9 |
Other financing commitments given | | 213.9 | | 45.9 | | 40.4 | | 127.6 | | 121.8 |
Other commitments given: | | 4,635.1 | | 1,848.0 | | 1,244.2 | | 1,542.9 | | 4,297.8 |
Commitments given on energy trading activities | | 877.8 | | 823.6 | | 4.1 | | 50.1 | | 759.4 |
Other commitments given | | 3,757.3 | | 1,024.4 | | 1,240.1 | | 1,492.8 | | 3,538.5 |
Total | | 12,927.7 | | 5,325.5 | | 2,820.2 | | 4,782.0 | | 10,738.6 |
Commitments received: | | | | | | | | | | |
Guarantees received on contracts | | 595.2 | | 265.4 | | 232.8 | | 97.0 | | 353.2 |
Financing commitments received: | | 10,806.1 | | 4,392.1 | | 6,033.8 | | 380.2 | | 9,118.3 |
Credit facilities authorized and available and commercial paper back-up lines | | 8,708.3 | | 2,445.6 | | 5,923.5 | | 339.2 | | 6,854.6 |
Securtization | | 99.0 | | — | | 99.0 | | — | | 445.7 |
Other financing commitments received | | 1,998.8 | | 1,946.5 | | 11.3 | | 41.0 | | 1,818.0 |
Other commitments received: | | 1,356.6 | | 88.1 | | 54.3 | | 1,214.2 | | 756.6 |
Commitments received on energy trading activities | | 1,149.3 | | — | | — | | 1,149.3 | | 421.9 |
Other commitments received | | 207.3 | | 88.1 | | 54.3 | | 64.9 | | 334.7 |
| | |
| |
| |
| |
| |
|
Total | | 12,757.9 | | 4,745.6 | | 6,320.9 | | 1,691.4 | | 10,228.1 |
| | |
| |
| |
| |
| |
|
Commitments given on contracts primarily comprise performance bonds guaranteeing customers the completion of contract services, guarantees of which certain may have been issued by SUEZ SA and described in the notes to the parent company financial statements. In terms of the performance bonds, 58% relate to the Environment business line and 41% to the Energy business line. The percentage of the contract covered by the guarantee depends on the location of the contract (10 to 15% of the contract value for normal performance bonds and up to 70% for certain performance bonds).
Other contract guarantees include advance repayment deposits, retention deposits, bid deposits and to a lesser extent guarantees covering advance payments made to sub-contractors.
Financing commitments given comprise personal security granted primarily to creditors of Group equity investees in the amount of € 1,043 million, collateral of € 4,399 million and other financing commitments given mainly to proportionally consolidated companies of € 214 million In the case of collateral, the assets allocated to guarantee the liabilities are primarily tangible assets (power stations and other installations and equipment) and to a lesser extent consolidated investments (€ 530 million) which represent approximately 20% of collateral. The Group has received financing commitments in the amount of € 10,806.1 million, corresponding primarily to available approved credit facilities and commercial paper back-up lines.
The Group has also given and received commitments (letters of credit, parent company guarantees) in the context of its activities with energy trading counterparties in the amount of € 877.8 million and € 1,149.3 million respectively.
F-68
Other commitments given include principally the following transactions:
| | • | As part of its European activity expansion, Electrabel is progressively increasing its presence in France via investments in Shem and CNR. The share purchase commitments in respect of these investments totaled approximately € 1.1 billion, to be spread over 2004 and 2006. |
| | • | Furthermore, Electrabel entered into a contract to purchase the entire electricity production of Société Hydroélectrique du Midi (SHEM) and pay an annual fixed amount, net of tax, of between € 78 million and € 80 million. |
| | • | In addition, Energie du Rhône (joint subsidiary of Electrabel, 44%, and CNR, 51%) signed electricity purchase/sale contracts with Compagnie Nationale du Rhône. |
| | • | The Group granted the purchaser of a 30% interest in Elia System Operator an option for the resale of this interest, eligible for exercise until February 29, 2004. This option, with a strike price equal to the initial consideration paid for the investment, also covers a receivable transferred to the purchaser at the same time. The total amount of this commitment as of December 31, 2003 totaled € 202.7 million. As indicated in Note 2.4, this option matured after the year-end without being exercised by the purchaser. |
In other respects, SUEZ companies are committed by vendor warranties resulting from the sale of activities, and subject to reserves where their exercise is considered probable. Potential liabilities in respect of vendor warranties totaled € 1,735 million as of December 31, 2003, compared to € 663 million at the 2002 year-end. The increase is due to divestments made in 2003 (Northumbrian, Ondeo Nalco).
Finally, SUEZ remains (through one of its American subsidiary) holder of the operating lease contract relating to the headquarter occupied by Ondeo Nalco in Naperville and sub-rented to the latter. SUEZ has received a counter-guarantee from Ondeo Nalco, who remains responsible of all the commitments relating to the operating lease towards SUEZ as well as the lessor. In case of default of Ondeo Nalco, the Group would notably be liable for lease payments to be incurred over the operating lease contract life (for € 200.8 million).
20.4 Contractual obligations impacting future outflows
The following table presents an estimate of contractual obligations as of December 31, 2003 impacting future cash outflows of the Group. This estimate encompasses Group gross borrowings and, among the off-balance sheet commitments described in Note 20, operating leases, irrevocable commitments under which the Group has undertaken to purchase tangible assets, and other long-term commitments.
| | | | | | | | | |
| | | Payments in
|
(in millions of €)
| | Less than
1 year
| | | 1 to 5 years
| | More than
5 years
| | Total
|
Borrowings less marketable securities and cash and cash equivalents (including capital leases) | | (855.9 | ) | | 5,426.7 | | 10,420.3 | | 14,991.1 |
Operating leases | | 206.2 | | | 552.0 | | 579.0 | | 1,337.2 |
Irrevocable purchase commitments | | 1,039.5 | | | 1,861.6 | | 588.4 | | 3,489.5 |
Other long-term commitments | | 270.8 | | | 538.0 | | 645.7 | | 1,454.5 |
20.5 Trade receivable securitization program
In January 2002, the Group launched a 5-year European trade receivable securitization program, covering maximum of € 470.0 million in receivables (total securitized receivables net of deposit accounts). Trade receivables of the different entities concerned (SITA Group, Elyo Group, Fabricom Group) are sold to a special-purpose securitized debt fund which secures refinancing on the commercial paper market. The debtors of the trade receivables concerned are primarily local authorities and companies.
F-69
SUEZ guarantees the securitized debt fund against initial losses on receivables and their concentration on a single counterparty. SUEZ deposits amounts with the securitized debt fund in respect of this guarantee, the level of which is determined by the level of receivables outstanding and their performance. Payments overdue more than 180 days are refinanced by the transferor via a draw-down by the securitized debt fund on the deposit account.
As of December 31, 2003, securitized debt outstanding totaled € 476.8 million and the securitized debt fund deposit totaled € 99.5 million. As of December 31, 2003, this deposit was covered by an immaterial reserve.
The program provides for certain cases of early resolution; in particular, the transfer of new receivables to the securitized debt fund would no longer be possible if the credit rating of GIE SUEZ Alliance by Moody’s Investor Services fell below Baa1.
The summary balance sheet of the European securitized debt fund as of December 31, 2003 is as follows (in millions of €):
| | | | | | |
Assets
| | | | Liabilities
| | |
Securitized debt | | 476.8 | | Ordinary shares | | 377.8 |
Miscellaneous receivables | | 0.5 | | Liabilities | | 99.5 |
| | |
| | | |
|
Total | | 477.3 | | Total | | 477.3 |
| | |
| | | |
|
The sale of Nalco in 2003 marked the end of the Group’s US securitization program.
NOTE 21- DISPUTES AND OTHER EXCEPTIONAL EVENTS
Energy
In Belgium, Electrabel operates in partnership with municipalities, through mixed inter-municipal companies, to distribute gas, electricity and distribution signals. Electrabel and the municipalities have signed agreements for the supply of electricity to eligible customers who have not expressly chosen another supplier. These agreements, comprised of vertical integrations, have been examined by the Belgian competition authorities and were approved subject to certain commitments by Electrabel, and for the supply of Gas, Distrigaz (subsidiary of SUEZ-TRACTEBEL SA), with the main purpose of improving the liquidity of wholesale markets, as well as facilitating entry into the Belgian market for competitor suppliers.
Environment
In France, the Anti-Trust Council (“Conseil de la Concurrence”) ruled that the subsidiary companies of CGE and Lyonnaise des Eaux with equal stakes in water distribution created a collective dominant position between the two groups. Nevertheless, the council did not impose sanctions but requested that the Minister of the Economy order the two companies to modify or terminate the agreements that combine their resources within joint subsidiaries.
The Paris Court of Appeal (on February 18, 2003) confirmed this decision and emphasized that the Minister should determine the actions to be taken, both in terms of their principle and application.
Prior to stating his position on this matter, the Minister appears to be waiting for the outcome of the appeal lodged by CGE before the Court of Cassation.
F-70
Disputes and arbitration
The Group is involved with various claims and disputes with third parties or tax authorities in certain countries that arise in the ordinary course of business. Provisions are recorded for these claims and disputes when there is an obligation (legal, contractual, or implicit) to a third party, if it is probable that there shall be a cash outflow at the year-end with no consideration expected from a third party, and that the estimate of this outflow is sufficiently reliable. The provisions recorded in respect of these claims, disputes and tax risks as of December 31, 2003 totaled € 442.1 million, and none were deemed individually material.
In Manila, the attempt to withdraw from the concession contract using the termination notice, filed before the Appeals panel, was rejected on February 7, 2003. On November 7, 2003, the arbitration tribunal ruled that the concession contract could not be terminated and that the concession fee owed by Maynilad (Philippines) had to be paid. Since that date, negotiations have continued between MWSS (concession-granting authority), the lending banks and the company’s two shareholders (SUEZ Environment, 40% and Benpres, 60%), in order to reorganize the company and ensure its long-term viability. As a result of these negotiations, SUEZ, whose commitments were fully provided for in 2002, intends to reduce its stake and hence its corresponding exposure in the company.
In Jakarta, negotiations were held with the concession-granting authority and resulted in authorization to increase prices significantly. These increases are currently being contested by consumer associations. Legal proceedings are currently underway at the appeal stage before the Indonesian courts. Uncertainties remain over the outcome of the negotiations to enable the contract to meet profitability expectations and guarantee its long-term future. The provisions recorded in 2002 to cover all of the Group’s commitments were maintained in 2003.
Aguas do Amazonas has a concession contract for a term of 30 years to distribute and water and provide wastewater management services for the city of Manaus in Brazil. Three legal disputes are currently pending against the company and relate to: 1) the discharge of untreated waste water, 2) the invoicing process, and 3) the price increase obtained in December 2003. The Group’s financial statements have adequate provisions to cover the risks relating to pending disputes.
Regarding the situation in Argentina, please see Note 2.5.
The Belgian tax authorities have assessed Tractebel SA for an amount of € 157 million and have made known their intention to issue a further assessment in the amount of € 31 million, in respect of Tractebel’s investments in gas transportation and electricity distribution networks in Kazakhstan. Tractebel has appealed this assessment and, based on its analysis and the advice of legal counsel, the Group considers that these claims are without foundation.
Finally, vendor warranties were granted in connection with asset disposals and have been used for certain claims by purchasers. The Group considers that such claims are unjustified and all legal means have been implemented to challenge them (see note 20.3).
SUEZ is not aware of any other dispute or arbitration which is likely to have, or have recently had, a material impact on the financial condition, results of operations, business or assets of the company or Group.
F-71
NOTE 22- SEGMENT INFORMATION
The Group primarily operates and manages three business segments (Energy, Environment-Local Services, Environment Industrial Services). Each of these business segments is managed separately because each business develops, manufactures and sells distinct products and services, or targets specific customer segments. The activities of the different business segments are as follows:
| | • | Energy— The subsidiaries operating in this business segment may be involved in the production, transmission and distribution of electricity or gas, the operation of cogeneration and waste-to-energy facilities, and the provision of facility management services. |
| | • | SUEZ Environment - Local Services (SE, formerly SELS)— The subsidiaries operating in this business segment provide private individuals and local authorities (i) water management and water treatment services under concession contracts (Water management), (ii) water purification facility design and construction (Turnkey engineering) and (iii) waste collection and treatment services including sorting, recycling, composting, landfilling and hazardous waste treatment. |
| | • | SUEZ Environment - Industrial Services (SEIS)— The subsidiaries operating in this business segment provide industrial process facility services (Water treatment) to industrial customers. The main subsidiary in this business segment, Ondeo Nalco, was sold on November 4, 2003 and is consolidated under the equity method as from January 1, 2003. |
A reconciliation of segment information to consolidated figures is provided below.
Segment profit/(loss) is operating income before depreciation, amortization and provisions plus financial income/(loss) other than interest paid and received, plus income of companies accounted for under the equity method (gross operating income).
Segment net assets correspond to resources committed to the development of each of the Group’s business segments (capital employed) and represent total assets adjusted primarily for special concession accounts, other reserves for contingencies and losses, accounts payable, deferred income, exceptional amortization charge, cash and cash equivalents and marketable securities.
The accounting policies applied to segment information are identical to those adopted in the consolidated financial statements.
Employee numbers presented are year-end figures for fully consolidated companies (employees of all categories with permanent, fixed-term or training contracts).
F-72
Information by business segment
| | | | | | | | | | | |
(in millions of €)
| | Energy
| | SELS
| | | SEIS
| | Other
| | TOTAL
|
| 2003 | | | | | | | | | | | |
Segment revenues | | 26,634.6 | | 12,141.7 | | | 168.0 | | 677.5 | | 39,621.8 |
Income from companies accounted for under the equity method | | 123.3 | | 15.6 | | | 13.4 | | 13.4 | | 165.7 |
Segment profit (GOI) | | 4,000.8 | | 1,949.9 | | | 7.3 | | 52.9 | | 6,010.9 |
Segment net assets | | 15,890.1 | | 8,639.0 | | | 45.9 | | 2,394.1 | | 26,969.0 |
Capital expenditure | | 1,533.6 | | 1,177.5 | | | 32.3 | | 61.0 | | 2,804.4 |
Employees | | 88,712 | | 82,076 | | | 714 | | 789 | | 172,291 |
| | | | | |
(in millions of €)
| | Energy
| | SELS
| | | SEIS
| | Other
| | TOTAL
|
| 2002 | | | | | | | | | | | |
Segment revenues pro forma (a) | | 24,242.3 | | 12,938.5 | | | 2,958.9 | | 644.2 | | 40,783.9 |
Income from companies accounted for under the equity method | | 60.7 | | (21.7 | ) | | 1.1 | | 11.3 | | 51.4 |
Segment profit (GOI) | | 4,125.4 | | 2,379.9 | | | 535.9 | | 212.5 | | 7,253.7 |
Segment net assets | | 17,513.0 | | 14,454.1 | | | 5,250.2 | | 5,523.4 | | 42,740.7 |
Capital expenditure | | 2,204.6 | | 1,647.4 | | | 143.0 | | 162.8 | | 4,157.8 |
Employees | | 88,811 | | 97,040 | | | 11,912 | | 987 | | 198,750 |
| | | | | |
(in millions of €)
| | Energy
| | SELS
| | | SEIS
| | Other
| | TOTAL
|
| 2001 | | | | | | | | | | | |
Segment revenues (a) | | 26,373.9 | | 12,348.2 | | | 3,026.1 | | 611.0 | | 42,359.2 |
Income from companies accounted for under the equity method | | 57.4 | | (17.6 | ) | | — | | 293.9 | | 333.7 |
Segment profit (GOI) | | 4,331.0 | | 2,575.1 | | | 548.8 | | 283.0 | | 7,737.9 |
Segment net assets | | 21,382.3 | | 16,348.5 | | | 6,399.9 | | 5,857.7 | | 49,988.4 |
Capital expenditure | | 2,062.9 | | 1,915.3 | | | 170.1 | | 242.8 | | 4,391.1 |
Employees | | 84,400 | | 91,500 | | | 11,000 | | 1,150 | | 188,050 |
| (a) | 2002 revenues are adjusted for the change in presentation method applicable to energy trading on its own behalf explained in note 1-O. However, 2001 revenues are presented in accordance with the method applicable prior to January 1, 2003, as described in note 1-O. |
Information by geographical area
| | | | | | | | | | | | | | | | | | | | |
(in millions of €)
| | France
| | Belgium
| | UK
| | Other EU
Countries
| | Other
European
countries
| | North
America
| | South
America
| | Asia
and
Oceania
| | Africa
and
Middle
East
| | Total
|
2003 | | | | | | | | | | | | | | | | | | | | |
Revenues | | 9,750.5 | | 11,472.7 | | 1,232.5 | | 7,773.0 | | 1,377.6 | | 3,885.4 | | 1,702.1 | | 1,774.2 | | 653.7 | | 39,621.8 |
Net assets | | 4,355.2 | | 2,583.1 | | 1,090.3 | | 6,045.5 | | 1,074.1 | | 5,409.8 | | 4,235.2 | | 2,158.2 | | 17.6 | | 26,969.0 |
Employees | | 60,846 | | 27,812 | | 7,544 | | 28,289 | | 6,884 | | 11,783 | | 20,234 | | 4,775 | | 4,124 | | 172,291 |
2002 | | | | | | | | | | | | | | | | | | | | |
Pro forma revenues | | 9,542.4 | | 10,513.4 | | 2,390.6 | | 7,496.2 | | 1,280.0 | | 4,659.9 | | 2,098.1 | | 1,872.5 | | 930.8 | | 40,783.9 |
Net assets | | 5,787.0 | | 4,564.4 | | 5,224.2 | | 7,265.9 | | 1,001.6 | | 11,410.2 | | 4,857.1 | | 2,460.8 | | 169.5 | | 42,740.7 |
Employees | | 60,550 | | 29,900 | | 12,650 | | 39,900 | | 6,800 | | 17,850 | | 20,500 | | 6,000 | | 4,600 | | 198,750 |
2001 | | | | | | | | | | | | | | | | | | | | |
Revenues | | 8,985.7 | | 10,237.5 | | 5,202.2 | | 6,920.4 | | 910.9 | | 4,301.7 | | 3,055.5 | | 2,093.1 | | 652.2 | | 42,359.2 |
Net assets | | 6,546.3 | | 8,045.0 | | 4,999.8 | | 7,068.4 | | 519.6 | | 11,767.6 | | 7,642.7 | | 3,222.9 | | 176.2 | | 49,988.5 |
Employees | | 59,300 | | 31,600 | | 12,100 | | 39,900 | | 3,550 | | 9,400 | | 21,000 | | 6,750 | | 4,450 | | 188,050 |
F-73
Reconciliation of gross operating income with operating income
| | | | | | | | | |
(in millions of €)
| | 2003
| | | 2002
| | | 2001
| |
Segment profit (GOI) | | 6,010.9 | | | 7,253.7 | | | 7,737.9 | |
Less: | | | | | | | | | |
Depreciation, amortization and provisions | | (2,522.2 | ) | | (3,070.8 | ) | | (3,098.7 | ) |
Share in income of companies accounted for under the equity method | | (165.7 | ) | | (51.4 | ) | | (333.7 | ) |
Other financial income/(loss) | | (91.2 | ) | | (358.9 | ) | | (198.4 | ) |
Other operating items | | (26.9 | ) | | (65.0 | ) | | (43.3 | ) |
Group consolidated operating income | | 3,204.9 | | | 3,707.6 | | | 4,063.8 | |
Reconciliation of capital employed with total assets
| | | | | | | | | |
(in millions of €)
| | 2003
| | | 2002
| | | 2001
| |
Capital employed | | 26,969.0 | | | 42,740.7 | | | 49,988.5 | |
Plus: | | | | | | | | | |
Goodwill amortization excluding exceptional | | (1,456.9 | ) | | (2,283.6 | ) | | (1,500.7 | ) |
Loans and receivables related to affiliates | | 1,215.5 | | | 1,736.4 | | | 645.5 | |
Special concession accounts | | 4,847.4 | | | 4,849.2 | | | 4,668.6 | |
Reserves for contingencies and losses | | 10,440.4 | | | 10,208.1 | | | 9,437.1 | |
Accounts payable | | 13,439.6 | | | 14,745.7 | | | 16,269.4 | |
Deferred income excluding deferred tax | | 2,792.2 | | | 2,977.6 | | | 3,373.3 | |
Marketable securities, cash and cash equivalents | | 11,703.0 | | | 8,538.9 | | | 5,751.2 | |
Adjustments to intangible fair value (a) | | | | | 638.3 | | | 848.5 | |
Group consolidated total assets | | 69,950.2 | | | 84,151.3 | | | 89,481.4 | |
| (a) | Adjustment enabling the adoption, for goodwill and fair value adjustments to intangible assets, of an identical treatment in the segment net asset calculation (inclusion of their gross value only, excluding deferred tax impact). |
NOTE 23- MANAGEMENT COMPENSATION
The following table presents the total compensation received by members of the Board of Directors, excluding the Chairman and Chief Executive Officer and Executive Directors and the total compensation received by all of the members of the Executive Committee, including the Chairman and Chief Executive Officer and Executive Directors following the Board changes in 2003 and any termination payments received by its members:
| | | | | | | | |
(in millions of €)
| | 2003
| | 2002
|
| | | Headcount
| | Total
compensation
| | Headcount
| | Total
compensation
|
Board of Directors | | 14 | | 1.9 | | 16 | | 1.9 |
Members of the Executive Committee | | 18 | | 16.3 | | 13 | | 9.1 |
NOTE 24- SUBSEQUENT EVENTS
24.1 Puerto Rico Contract
In the face of economic conditions considerably different to initial projections and in the context of SUEZ’s action plan (to renegotiate or terminate contracts if their long-term viability cannot be maintained), Ondeo de Puerto Rico reached an amicable resolution with Puerto Rico Aqueduct Sewer Authority (PRASA) on January 13, 2004. This Operations and Maintenance contract, signed in May 2002, covered the management of water and sanitation services for the entire island. Despite obtaining significant improvements in the quality of Puerto Rico’s water service, both parties were unable to agree on a way to continue the contract in its current form. As
F-74
from April 1, 2004, the island’s government will resume the management of water and sanitation services on the island with assistance of Ondeo de Puerto Rico.
The impact of the termination of this contract is provided for in the financial statements for the year ended December 31, 2003.
24.2 Sale of 29.2% of M6
On February 3, 2004, SUEZ, a founding shareholder of M6, disposed of 29.2% of the television channel’s equity capital in a combined market and institutional investor placement.
This transaction will allow the Group to record first-half 2004 proceeds of € 1 billion and net capital gains of approximately € 750 million
The Group will keep a residual 5% equity position in M6 for a three-year period, during which it will retain a seat on the channel’s Supervisory Board.
The disposal is consistent with the contract amendment signed February 2, 2004 between M6 and the French Audio Visual Higher Council (CSA).
24.3 Sale of Noos
The Group and UnitedGlobalCom (UGC) announced on March 15, 2004, that they signed a protocol of agreement for the sale of Noos to Médiaréseaux, UGC’s holding company in France. As indicated in note 1-F, provisions for exceptional events were recorded in the 2003 financial statements in the amount of the estimated capital loss, i.e. € -754 million.
24.4 New Credit Facility
On May 28, 2004, we entered into a syndicated credit facility in the amount of €4.5 billion. The new facility has a term of five years with two one-year extension options, exercisable at the end of the first and second years of the facility, respectively. The new credit facility is guaranteed by GIE SUEZ Alliance and is intended to replace and extend the term of existing and undrawn credit facilities of the Group. The new credit facility, which does not contain any financial covenant, also significantly improves on the terms and conditions of our current credit facilities.
24.5 Finalization of interim agreement in Argentina
The interim agreement mentioned in Note 2.5 to the Consolidated Financial Statements was signed on May 11, 2004. This agreement allows Aguas Argentinas to continue its operations and to complete its investment program aimed at providing service to 11 million customers in the Buenos Aires region. It also lays down the main principles for renegotiating the Buenos Aires concession contract.
NOTE 25- LIST OF THE MAIN CONSOLIDATED COMPANIES AS OF DECEMBER 31, 2003
The list of main consolidated companies below includes significant operating entities and the holding companies of operating sub-groups comprising individually insignificant subsidiaries
| | | | | | | | | | | | | | |
| | | | | % interest
| | % control
| | Consolidation
method
|
Company Name
| | Corporate headquarters
| | Dec. 2003
| | Dec. 2002
| | Dec. 2003
| | Dec. 2002
| | Dec. 2003
| | Dec. 2002
|
ENERGIE | | | | | | | | | | | | | | |
SUEZ-TRACTEBEL | | Place du Trône, 1 —1000 — Brussels — Belgium | | 100 | | 100 | | 100 | | 100 | | FC | | FC |
ELECTRABEL | | Boulevard du Regent, 8 — 1000 Brussels - Belgium | | 50 | | 45 | | 50 | | 45 | | FC | | FC |
ELIA/ELIA SYSTEM OPERATOR | | Boulevard de l’Empereur 20 — 1000 Brussels - Belgium | | 32 | | 29 | | 64 | | 70 | | EM | | EM |
ELECTRABEL CUSTOMER SOLUTIONS | | Boulevard du Regent, 8 — 1000 Brussels - Belgium | | 48 | | 45 | | 96 | | 100 | | FC | | FC |
F-75
| | | | | | | | | | | | | | |
| | | | | % interest
| | % control
| | Consolidation
method
|
Company Name
| | Corporate headquarters
| | Dec. 2003
| | Dec. 2002
| | Dec. 2003
| | Dec. 2002
| | Dec. 2003
| | Dec. 2002
|
ELECTRABEL NETTEN VLAANDEREN (a) | | Guldensporenpark 52-56 — 9820 Merelbeke - Belgium | | 50 | | — | | 100 | | — | | FC | | — |
DUNAMENTI | | Eronu Ut2 2440 Szazhalombatta, PF 28, Hungary | | 38 | | 34 | | 75 | | 75 | | FC | | FC |
ELECTRABEL NEDERLAND NV | | Dr. Stolteweg 92, postbus 10087, 8000GB Zwolle, The Nerderlands | | 50 | | 45 | | 100 | | 100 | | FC | | FC |
ENERGIE SAARLORLUX Gmbh | | Richard Wagner Strasse 14 — 16, 66111 Saarbrücken — Germany | | 26 | | 23 | | 51 | | 51 | | FC | | FC |
POLANIEC | | Elektrownia im. Tadeusza Kosciuski — Spolka Akcyjna w Polancu — Poland | | 50 | | 18 | | 100 | | 39 | | FC | | EM |
ROSIGNANO ENERGIA SPA | | Via Piave N° 6 Rosignano Maritimo, Italy | | 50 | | 45 | | 100 | | 100 | | FC | | FC |
ACEA ELECTRABEL SPA (c) | | P. le Ostiense, 2, Roma, Italy | | 20 | | — | | 41 | | — | | PC | | — |
ACEA ELECTRABEL PRODUZIONE SPA (c) | | Contrada Selva, 496, Altino, Italy | | 35 | | — | | 71 | | — | | PC | | — |
ACEA ELECTRABEL TRADING SPA (c) | | Via Flaminia, 133/137, Roma, Italy | | 25 | | — | | 50 | | — | | PC | | — |
ACEA ELECTRABEL ENERGIA SPA (c) | | Via Flaminia, 133/137, Roma, Italy | | 20 | | — | | 41 | | — | | PC | | — |
ACEA ELECTRABEL ELETTRICITA (c) | | P. le Ostiense, 2, Roma, Italy | | 20 | | — | | 41 | | — | | PC | | — |
TIRRENO POWER SPA (c) | | Largo Lamberto Loria, 3 Roma, Italy | | 18 | | — | | 35 | | — | | PC | | — |
ELECTRABEL POLSKA | | 5, Duleby, 40-833 Katowice — Poland | | 50 | | 45 | | 100 | | 100 | | FC | | FC |
CNR | | 2, rue André Bonin 69 316 Lyon cedex 04 — France | | 24 | | — | | 48 | | — | | EM | | — |
DISTRIGAZ | | Rue de l’Industrie, 10 — 1040 Brussels — Belgium | | 47 | | 47 | | 55 | | 55 | | FC | | FC |
FLUXYS | | Avenue des Arts, 31 — 1040 Brussels — Belgium | | 47 | | 47 | | 55 | | 55 | | FC | | FC |
TRACTEBEL ENERGIA (ex GERASUL) | | Rua Deputado A. Edu Vieira 999 Pantanal, Florianopolis SC, Brazil | | 78 | | 78 | | 78 | | 78 | | FC | | FC |
ITASA | | 986, Bela Cintra, 12e Andar, Sao Paulo, Brazil | | 38 | | 38 | | 49 | | 49 | | PC | | PC |
TRACTEBEL THAILAND | | 26th Floor, M. Thai Power 87, Wireless Road, Phatum Wan, Bangkok 10330, Thailand | | 100 | | 100 | | 100 | | 100 | | FC | | FC |
HHPC (LAOS) | | P.O Box 5464, Nong Bone Road, Vientaine, LAOS | | 70 | | 70 | | 80 | | 80 | | FC | | FC |
TESI (b) | | 1990 Post Oak Boulevard, Suite 1900 Houston, TX 77056-4499 | | 100 | | 100 | | 100 | | 100 | | FC | | FC |
TEMI (b) | | 1990 Post Oak Boulevard, Suite 1900 Houston, TX 77056-4499 | | 100 | | 100 | | 100 | | 100 | | FC | | FC |
TBL POWER INC (b) | | 1990 Post Oak Boulevard, Suite 1900 Houston, TX 77056-4499 | | 100 | | 100 | | 100 | | 100 | | FC | | FC |
TRIGEN | | 1177 West Loop South, 77027 Houston — USA | | 100 | | 100 | | 100 | | 100 | | FC | | FC |
TBL PROJECT DEV INC (b) | | 1990 Post Oak Boulevard, Suite 1900 Houston, TX 77056-4499 | | 100 | | 100 | | 100 | | 100 | | FC | | FC |
F-76
| | | | | | | | | | | | | | |
Company Name
| | Corporate headquarters
| | % interest
| | % control
| | Consolidation
method
|
| | | Dec.
2003
| | Dec.
2002
| | Dec.
2003
| | Dec.
2002
| | Dec.
2003
| | Dec.
2002
|
| COLBUN USD | | 2355 Av 11 de Septiembre, Santiago — Chile | | 29 | | 29 | | 47 | | 47 | | PC | | PC |
TRACTEBEL LNG NORTH AMERICA | | 1990 Post Oak Boulevard, Suite 1900 Houston, TX 77056-4499 | | 100 | | 100 | | 100 | | 100 | | FC | | FC |
| HANJIN CITY GAS | | 711 Sang-Gye-6-Dong 139-206 Seoul — Corea | | 75 | | 75 | | 75 | | 75 | | FC | | FC |
| AXIMA France | | 46, Bld de la prairie au Duc, 44200 Nantes — France | | 100 | | 100 | | 100 | | 100 | | FC | | FC |
| BAYMINA | | Ankara Dogal Gaz Santrali, 06900 Ankara — Turkey | | 95 | | 95 | | 95 | | 95 | | FC | | FC |
| ENERSUR | | 960 Avenida Javier Prado Oeste — Lima — Perou | | 100 | | 100 | | 100 | | 100 | | FC | | FC |
COMPANHIA ENERGETICA MERIDIONAL | | 366 Rua Antônio Dib Mussi — Florianopolis — Brazil | | 78 | | 78 | | 100 | | 100 | | FC | | FC |
| ELYO | | 235, av. Georges Clémenceau 92000 Nanterre — France | | 100 | | 100 | | 100 | | 100 | | FC | | FC |
| AXIMA HOLDING AG | | 12, Zürcherstrasse — 8400 Winterthur — Switzerland | | 100 | | 100 | | 100 | | 100 | | FC | | FC |
| AXIMA GMBH | | 51, Hessbrühlstrasse — 70565 Stuttgart — Germany | | 100 | | 100 | | 100 | | 100 | | FC | | FC |
| AXIMA CONTRACTING | | Rue de Monténégro, 138-144 , 1190 Brussels — Belgium | | 100 | | 100 | | 100 | | 100 | | FC | | FC |
| AXIMA AG | | Zürcherstrasse 12 — P.O. Box 414 — 8401 Winterthur — Switzerland | | 100 | | 100 | | 100 | | 100 | | FC | | FC |
| AXISI | | Passeo, Castellene 163 - 28046 Madrid — Spain | | 100 | | 100 | | 100 | | 100 | | FC | | FC |
| ENDEL | | 15, rue Saint-Denis 93125 La Courneuve Cedex — France | | 100 | | 100 | | 100 | | 100 | | FC | | FC |
| FABRICOM | | Rue de Gatti de Gamond 254 — 1180 Brussels — Belgium | | 100 | | 100 | | 100 | | 100 | | FC | | FC |
| GTI | | Kosterijland 50, 3981 AJ Bunnik, The Nerderlands | | 100 | | 100 | | 100 | | 100 | | FC | | FC |
| INEO | | 2 allée Jacques Brel 92247 Malakoff Cedex — France | | 100 | | 100 | | 100 | | 100 | | FC | | FC |
| CPCU | | 185, Rue de Bercy, 75012 Paris — France | | 64 | | 64 | | 64 | | 64 | | FC | | FC |
| AXIMA SERVICES Belgique | | 30, Blvd du Roi Albert II — Box 28 , 1000 Brussels — Belgium | | 100 | | 100 | | 100 | | 100 | | FC | | FC |
| ELECTRICITE DE TAHITI | | BP802, 98703 Puurai-Faaa-Tahiti — French Polynesia | | 83 | | 83 | | 91 | | 91 | | FC | | FC |
| SPARK ENERGIE | | 19-45 De Schans, 8231KA Lelystad — The Nederlands | | 50 | | 45 | | 100 | | 100 | | FC | | FC |
| GROUPE FABRICOM | | 254 Rue de Gatti de Gamond — 1180 Brussels — Belgium | | 100 | | 100 | | 100 | | 100 | | FC | | FC |
F-77
| | | | | | | | | | | | | | |
Company Name
| | Corporate headquarters
| | % interest
| | % control
| | Consolidation
method
|
| | | Dec.
2003
| | Dec.
2002
| | Dec.
2003
| | Dec.
2002
| | Dec.
2003
| | Dec.
2002
|
ENVIRONNEMENT — Services locaux (SE) | | | | | | | | | | | | | | |
| SUEZ ENVIRONNEMENT | | 18, Square Edouard VII, 75009 Paris — France | | 100 | | 100 | | 100 | | 100 | | FC | | FC |
| ONDEO DE PUERTO RICO | | Ave. Barbosa, #604, Hato Rey — Puerto Rico 00917 — 4310 P.O. Box 7066, San Juan, Puerto Rico 00916 — 7066 | | 100 | | 100 | | 100 | | 100 | | FC | | FC |
| LYONNAISE DES EAUX | | 18, Square Edouard VII, 75009 Paris — France | | 100 | | 100 | | 100 | | 100 | | FC | | FC |
| ONDEO DEGREMONT | | 183, avenue du 18 juin 1940 92500 Rueil Malmaison — France | | 100 | | 100 | | 100 | | 100 | | FC | | FC |
| HISUSA | | Paseo de San Juan, 39, 08009 Barcelona — Spain | | 51 | | 51 | | 51 | | 51 | | PC | | PC |
| AGBAR | | Paseo de San Juan, 39, 08009 Barcelona — Spain | | 26 | | 26 | | 49 | | 49 | | PC | | PC |
| AGUAS ANDINAS | | Avenida Presidente Balmaceda 1398, Piso — 4, Santiago Chile | | 32 | | 32 | | 52 | | 52 | | FC | | FC |
| AGUAS ARGENTINAS | | Reconquista 823, 1003 Buenos Aires — Argentina | | 46 | | 46 | | 40 | | 40 | | FC | | FC |
| AGUAS CORDOBESAS | | Rivadavia 126 Ciudad de Cordoba 5000 — Cordoba, Argentina | | 44 | | 44 | | 39 | | 39 | | FC | | FC |
AGUAS PROVINCIALES DE SANTE FE | | Cordoba 844, piso 5 Rosario 2000 — Argentina | | 58 | | 58 | | 52 | | 52 | | FC | | FC |
| EAU ET FORCE | | 300, rue Paul Vaillant Couturier — BP 712—92007 Nanterre — France | | 100 | | 100 | | 100 | | 100 | | FC | | FC |
| EURAWASSER | | Carl-Hopp-Strasse 1, D-18069 Rostock — Germany | | 100 | | 100 | | 100 | | 100 | | FC | | FC |
| LYDEC | | 20, boulevard Rachidi, Casablanca — Marocco | | 60 | | 60 | | 59 | | 59 | | FC | | FC |
| NORTHUMBRIAN WATER | | Regent Centre, Gosforth, Newcastle upon Tyne NE3 3PX — United Kingdom | | 25 | | 100 | | 25 | | 100 | | EM | | FC |
SINO FRENCH HOLDING (SFH) | | New Worl Tower 29/f 16-18 Queensroad Central Hong Kong | | 50 | | 30 | | 50 | | 50 | | PC | | PC |
S.A.A.M. (Sociedad de Abstecimiento de Aguas de Macau) | | 82, avenue do Conselheiro Borja PO BOX 115 Macao | | 43 | | 26 | | 50 | | 50 | | PC | | PC |
UNITED WATER RESOURCES | | 200 Old Hook Road, Harrington Park New Jersey — United States | | 100 | | 100 | | 100 | | 100 | | FC | | FC |
INVERSIONES AGUAS METROPOLITANAS (IAM) | | Avda. Presidente Balmaceda 1398 — Piso 14 — Santiago — Chile | | 63 | | 63 | | 50 | | 50 | | FC | | FC |
F-78
| | | | | | | | | | | | | | |
Company Name
| | Corporate headquarters
| | % interest
| | % control
| | Consolidation
method
|
| | | Dec.
2003
| | Dec.
2002
| | Dec.
2003
| | Dec.
2002
| | Dec.
2003
| | Dec.
2002
|
| SDEI | | 988, Chemin Pierre Drevet — 69140 Rilleux-La-Pape — France | | 100 | | 100 | | 100 | | 100 | | FC | | FC |
| SITA HOLDINGS UK LTD | | Grenfell road, Maidenhead, Berkshire SL6 1ES, United Kingdom | | 100 | | 100 | | 100 | | 100 | | FC | | FC |
| SITA DEUTSCHLAND GmbH | | Industriestrasse 161 D-50999, Köln, Germany | | 100 | | 100 | | 100 | | 100 | | FC | | FC |
| SITA NEDERLAND | | Mr. E.N. van Kleffensstraat 6, Postbis 7009, NL — 6801 HA Amhem, Pays-Bas | | 100 | | 100 | | 100 | | 100 | | FC | | FC |
| CESPA (d) | | Henao, 20 entreplanta — Bilbao — Spain | | — | | 63 | | — | | 50 | | NC | | FC |
| SITA SVERIGE AB. | | Kungsgardsleden — 26271 Angelholm — Suede | | 75 | | 91 | | 75 | | 91 | | FC | | FC |
SITA France | | 123 rue des 3 Fontanot 92000 Nanterre — France | | 100 | | 100 | | 100 | | 100 | | FC | | FC |
SITA AUSTRALIA (EX : SEMBSITA AUSTRALIA) | | PO Box 160, Kemps Creek NSW 2171 — Australia | | 60 | | 60 | | 100 | | 100 | | FC | | FC |
ENVIRONNEMENT — Services industriels (SEIS) | | | | | | | | | | | | | | |
ONDEO NALCO (d) | | Nalco Chemical Company — One Nalco Center — Naperville IL 60563 — 1198 — United States | | — | | 100 | | — | | 100 | | NC | | FC |
ONDEO INDUSTRIAL SOLUTIONS | | 23-27, rue du professeur Victor Pauchet — 92420—Vaucresson — France | | 100 | | 100 | | 100 | | 100 | | FC | | FC |
COMMUNICATION | | | | | | | | | | | | | | |
CODITEL (d) | | Rue des Deux Eglises 26, 1000 Brussels — Belgium | | — | | 79 | | — | | 79 | | NC | | FC |
SUEZ LYONNAISE TELECOM (NOOS) | | 20 Place des Vins de France — 75614 Paris cedex 12 — France | | 50 | | 50 | | 50 | | 50 | | PC | | PC |
METROPOLE TV | | 89, avenue Ch. De Gaulle, 92200 Neuilly s/Seine — France | | 35 | | 38 | | 35 | | 34 | | PC | | PC |
AUTRES | | | | | | | | | | | | | | |
SUEZ SA | | 16 Rue de la Ville L’Evêque — 75008 Paris—France | | 100 | | 100 | | 100 | | 100 | | FC | | FC |
SI FINANCES | | 68, Rue du Faubourg Saint-Honoré —75008 Paris — France | | 100 | | 100 | | 100 | | 100 | | FC | | FC |
GIE — SUEZ ALLIANCE | | 16, rue de la Ville l’Evêque — 75383 Paris Cedex 08 — France | | 100 | | 100 | | 100 | | 100 | | FC | | FC |
UMICORE (e) | | Rue du Marais, 31 — 1000 Bruxelles — Belgique | | — | | 31 | | — | | 31 | | NC | | EM |
GENFINA | | 1 Place du trône — 1000 Brussels — Belgium | | 100 | | 100 | | 100 | | 100 | | FC | | FC |
| | |
Notes : (a) Entity responsible for the management of the distribution network in Flanders (hive-off in 2003) | | |
| |
(b) Consolidated in 2001 and 2002 as part of Tractebel INC | | FC: Full consolidation |
| |
(c) Consolidation in 2003 | | PC: Proportional consolidation |
| |
(d) Disposal in 2003 | | EM: Accounted for under the equity method |
(e) Partial sale and deconsolidation in 2003 | |
F-79
NOTE 26- Summary of differences between accounting principles followed by the Group and U.S. GAAP
The accompanying consolidated financial statements have been prepared in accordance with accounting principles generally accepted in France (“French GAAP ”), which differ in certain significant respects from those used in the United States of America (“U.S. GAAP ”). These differences are described below and the effects are presented net of minority interests in the reconciliation in Note 27.
26.1 Differences in accounting for business combinations under French GAAP and U.S. GAAP
The following presents the adjustments related to business combinations on a transaction by transaction basis. For the purposes of allocating purchase price under U.S. GAAP, the assets and liabilities of the acquired business are first adjusted to U.S. GAAP. These adjustments are recorded in various reconciling items, as required by the nature of the U.S. GAAP adjustment. The impact on goodwill of these basis differences is presented under the business combination caption of the reconciliation.
The amortization periods of goodwill (for 2001) and allocations of fair value to assets and liabilities resulting from U.S. GAAP accounting for the following business combinations are in accordance with those described in Note 1 C to Note 1E. Where purchase price is allocated to equity method investments, it is classified within the equity method investment balance in a U.S. GAAP balance sheet (included in “financial assets” in the summarized U.S. GAAP balance sheets in Note 27). The related amortization is included in “share in income of companies accounted for under the equity method” in the condensed U.S. GAAP consolidated income statement data in Note 27.
On January 1, 2002, the Group adopted Statement of Financial Accounting Standards No. 142, “Goodwill and Other Intangible Assets” (SFAS 142). Subsequent to the date of adoption, goodwill, including goodwill on equity method investments, is no longer subject to amortization for U.S. GAAP purposes but is instead tested at least annually for impairment. The Group’s annual impairment test is performed in November. French GAAP goodwill amortization has been eliminated under U.S. GAAP. Upon adoption of SFAS 142 the Group reclassified € 127.3 million of intangible assets to goodwill in 2002.
F-80
The changes during 2003 and 2002 in the carrying value of goodwill by segment are presented below:
| | | | | | | | | | | | | | | |
(in millions of €)
| | Energy
| | | SELS
| | | SEIS
| | | COM
| | | Total
| |
Balance as of January 1, 2002 | | 3,491.9 | | | 4,758.8 | | | 3,036.9 | | | 1,057.8 | | | 12,345.4 | |
Goodwill Acquired During the Year | | 103.4 | | | 118.5 | | | 12.3 | | | 9.0 | | | 243.2 | |
Impairment Losses | | — | | | (453.4 | ) | | — | | | (488.1 | ) | | (941.5 | ) |
Goodwill Disposals | | (134.7 | ) | | (11.0 | ) | | (37.7 | ) | | (326.4 | ) | | (509.8 | ) |
Currency Translation Adjustment & Other | | 124.6 | | | (250.8 | ) | | (371.6 | ) | | — | | | (497.8 | ) |
Balance as of December 31, 2002 | | 3,585.3 | | | 4,162.1 | | | 2,639.9 | | | 252.3 | | | 10,639.6 | |
Consolidation of Electrabel | | 2,792.4 | | | | | | | | | | | | 2,792.4 | |
Goodwill Acquired During the Year | | 95.2 | | | 59.4 | | | | | | 4.4 | | | 159.0 | |
Impairment Losses | | (41.8 | ) | | (564.0 | ) | | | | | (59.5 | ) | | (665.3 | ) |
Goodwill Disposals | | (61.8 | ) | | (276.9 | ) | | (2,639.9 | ) | | (34.9 | ) | | (3,013.5 | ) |
Currency Translation Adjustment & Other | | (84.7 | ) | | 3.1 | | | | | | 16.5 | | | (65.1 | ) |
| | |
|
| |
|
| |
|
| |
|
| |
|
|
Balance as of December 31, 2003 | | 6,284.6 | | | 3,383.7 | | | 0.0 | | | 178.8 | | | 9,847.1 | |
| | |
|
| |
|
| |
|
| |
|
| |
|
|
On January 1, 2002, the Group performed the transitional impairment test under SFAS 142 and compared the carrying value for each reporting unit to its fair value, which was determined based on market prices when possible but primarily using discounted expected future cash flows. Assumptions regarding market multiples and appropriate discount rates have been rationalized with comparable companies, publicly available analyst data, and market prices. Upon completion of the transitional impairment test, the Group determined that there was no impairment as of January 1, 2002, as the fair value of each reporting unit exceeded its carrying amount.
During the later half of 2002, certain of the Group’s reporting units were affected by significant downturns in certain economies. Of the € 941.5 million impairment charge recorded under U.S. GAAP in 2002, € 211.0 million related to the SELS segment was also recorded under French GAAP. Impairment charges of € 65.0 million and € 454.0 million in the SELS and other segments (Communication subsidiaries) mainly related to goodwill recorded under U.S. GAAP that was not included in the financial statements for the French GAAP.
During 2003, the Group performed annual impairment test based on a consistent valuation methodology. The main economic assumptions used in 2003 are presented in Note 1F. Due to a number of adverse changes during the year, primarily related to commercial expectations in the water distribution sector in the United State and Waste Services in Germany, an impairment charge of € 665.3 million has been recorded under U.S. GAAP. Of this amount, € 288.0 million was also recorded under French GAAP, on the Environment segment. The additional charge, for this segment recorded for U.S. GAAP amounted to € 276.0 million, and is related to goodwill specifically recorded under U.S. GAAP. The Communication segment had additional U.S. GAAP impairments of € 59.5 million, primarily due to additional goodwill recorded under U.S. GAAP. In addition, to the Energy segment goodwill impairment of € 41.8 million recorded under French GAAP and U.S. GAAP, an additional impairment under U.S. GAAP was recorded for other intangible assets of € 33.8 million based on lower than expected future cash flows. The impairment of goodwill and other intangible assets were recorded in operating income.
In 2002 and 2003, the differences have been recorded through the applicable individual business combination reconciling line items.
F-81
The following table summarizes U.S. GAAP net income/(loss) assuming that SFAS 142 was adopted in January 1, 2001:
| | | | | | | | |
| | | For the Years Ended December 31,
|
(in millions of € except for per share data)
| | 2003
| | | 2002
| | | 2001
|
U.S. GAAP Net Income/(Loss) | | (2,302.60 | ) | | (3,168.70 | ) | | 896.30 |
Goodwill Amortization | | — | | | — | | | 656.50 |
Adjusted U.S. GAAP Net Income/(Loss) | | (2,302.60 | ) | | (3,168.70 | ) | | 1,552.80 |
| | | |
Basic earnings per share | | | | | | | | |
Reported U.S. GAAP Net Income/(Loss) | | (2.32 | ) | | (3.20 | ) | | 0.91 |
Goodwill amortization | | — | | | — | | | 0.67 |
Adjusted U.S. GAAP Net Income/(Loss) | | (2.32 | ) | | (3.20 | ) | | 1.58 |
| | | |
Diluted earnings per share | | | | | | | | |
Reported U.S. GAAP Net Income/(Loss) | | (2.32 | ) | | (3.20 | ) | | 0.90 |
Goodwill amortization | | — | | | — | | | 0.65 |
Adjusted U.S. GAAP Net Income/(Loss) | | (2.32 | ) | | (3.20 | ) | | 1.55 |
The estimated U.S. GAAP amortization expense of definite-life intangible assets for each of the next five years is € 202.1 million.
26.1.1 Merger Between Lyonnaise des Eaux (Lyonnaise) and Compagnie de Suez (Suez)
Description of the combination
Suez was acquired by Lyonnaise by means of a share-for-share exchange in June 1997. 331,133,665 shares were issued by Lyonnaise as a result of this merger. Under French law, Lyonnaise was identified as the legal acquirer of Suez. Therefore, for French GAAP purposes, Lyonnaise was considered the accounting acquirer of Suez.
Under U.S. GAAP, the acquiring enterprise in combinations effected by an exchange of stock is generally the common stockholder that receives the larger portion of the voting rights in the new enterprise. Accordingly, the legal acquirer (the entity issuing shares) may not be the acquiring enterprise for accounting purposes. When the legal acquirer is different from the accounting acquirer the transaction is described as a “reverse acquisition.”
Immediately following the merger between Lyonnaise and Suez, the former Suez shareholders held approximately 62% of the equity of the combined entity and the former Lyonnaise shareholders held approximately 38%. As a result, for U.S. GAAP purposes, this transaction is a reverse acquisition with Suez as the accounting acquirer, which has been accounted as follows:
| | • | The value of the shares of the legal acquirer, Lyonnaise, issued to effect the merger has been considered as the basis to determine the purchase price. Shares issued by Lyonnaise have been valued at € 17.53 per share, which was the average market price within a reasonable period before and after the date of the announcement of the merger. |
| | • | Suez had an existing 18.15% investment in Lyonnaise. The reverse acquisition has been reflected as if Suez had acquired the remaining 81.85% of the shares (242,747,615 shares) of Lyonnaise. |
| | • | The historical financial statements presented prior to the date of acquisition are those of the accounting acquirer, Suez. Therefore, French GAAP purchase accounting entries related to the merger have been reversed to reflect Suez assets and liabilities at historical cost. |
| | • | The acquired portion of the identifiable assets and liabilities of Lyonnaise were adjusted to their fair value at the date of acquisition. |
| | • | Minority interests in subsidiaries as reflected in the Lyonnaise financial statements have been maintained at underlying historical cost. |
F-82
The difference between the purchase price and the fair value of the net assets acquired was recorded as goodwill, as follows:
| | | |
(in millions of €)
| | | |
Value of new common shares issued | | 4,254.7 | |
Acquisition costs | | 35.5 | |
Total | | 4,290.2 | |
| |
Fair value of net assets acquired | | (2,941.6 | ) |
Goodwill | | 1,348.6 | |
Description of the purchase price allocation
The effective date of the merger was June 19, 1997. The accounting for the reverse acquisition was determined as of June 30, 1997.
The principal adjustments to the book value of assets acquired were related to intangible assets for € 746.5 million and tangible assets for € 496 million mainly to reflect evaluation of concession contracts and facilities in water and energy divisions, as well as allocation of purchase price in equity investments for € 904 million. The impact on total assets is offset by the write-off of preexisting goodwill for € 815.4 million (net of minority interests).
Adjustments were recorded to decrease the value of total liabilities acquired primarily related to adjustments of the market value of financial debt at the Group level for € 212 million. Deferred tax liabilities amounted to € 689 million.
Under French GAAP, goodwill arising from acquisitions financed by share issuances was charged directly to equity in the year of acquisition. This goodwill is tracked in memo accounts not included in the financial statements where it is allocated to the underlying businesses and amortized over the expected life of those businesses. If one of those businesses is subsequently sold, the net value of any unrecorded goodwill is recognized as a reduction of the gain. As a result, the accounting basis used to compute gains and losses on businesses subsequently sold differs in French and U.S. GAAP. Sales of Fortis B shares in 2002 and 2001 increased U.S. GAAP net income due to this difference by € 15.8 million in 2002 and € 12.1 million in 2001.
The impacts of the reverse acquisition on net income and shareholders’ equity as reported under U.S. GAAP in 2003, 2002 and 2001 are presented in Note 27.
26.1.2 SGB Minority Interest Acquisition — 1998
In July 1998 the Group purchased an additional 36.03% of SGB through the issuance of 126,981,790 shares (€ 30.92 per share) and guaranteed value certificates (“GVCs”). The additional interest in earnings of SGB was included from July 1, 1998.
Under French GAAP, the purchase price did not include the GVCs since they were considered off balance sheet commitments until payments would be required. In 2000 and 1999, the Group repurchased GVCs for € 199.3 million and € 45.7 million, respectively, and recorded corresponding amounts of goodwill. Under U.S. GAAP, the GVCs are included in the purchase price at their fair market value at the acquisition date (€ 298 million) and recorded as a liability. Subsequent adjustments to their fair values are included in the income statement at each subsequent reporting date. The GVC’s listing was suspended on December 29, 2000.
Additionally, the per share amount used to calculate the purchase price under French GAAP was as of the announcement date rather than the average price for a reasonable period surrounding the date of announcement as required under U.S. GAAP.
F-83
Under French GAAP as described in Note 1 D, the carrying values used for the acquired portion of the assets and liabilities are the same as those used before the minority interest acquisition. Under U.S. GAAP, the acquisition of minority interests is recorded at the current fair value at the date an incremental interest is purchased.
Under French GAAP, the excess of the purchase price over the historical carrying value of the net assets acquired, € 2,495 million, was written off directly to equity upon acquisition, except for the 2000 and 1999 French GAAP increases to goodwill from the repurchase of GVC. Under U.S. GAAP, the allocation of purchase price to the individual assets and liabilities purchased resulted in a step up, primarily to equity method investments and investments in marketable securities of € 1,638 million and fixed assets of € 53 million, and created goodwill of € 901 million. The purchase price allocated to equity method investments primarily related to marketable securities, industrial assets and goodwill. The amount related to marketable securities, which corresponds to unrealized gains recorded in other comprehensive income by the equity method investees, is written-off when the securities are sold or was amortized over the expected turnover of those securities (36 months) in order to adjust the gain recorded by the Group when such unrealized gains become realized.
The impact on net income of this transaction is primarily (i) the amortization or impairment of goodwill and (ii) the amortization of the fair value adjustments on underlying assets of equity method investments.
Under French GAAP, goodwill arising from acquisitions financed by share issuances can be charged directly to equity in the year of acquisition. The goodwill is tracked in memo accounts not included in the financial statements where it is allocated to the underlying businesses and amortized over the expected life of those businesses. If one of those companies is subsequently sold, the net value of the unrecorded goodwill is recognized as a reduction of the gain. Therefore, as the accounting basis used to compute gains and losses on businesses subsequently sold differs in French and U.S. GAAP, sales of Fortis B shares in 2002 and 2001 increased U.S. GAAP net income by € 85.3 million and € 65.2 million respectively.
26.1.3 Tractebel Minority Interest Acquisition — 1999
The Group purchased the majority of the outstanding minority interests in Tractebel during 1999, which led to the issuance of 197,084,640 shares of Suez (€ 32.6 per share) common stock and the payment in cash of € 630.7 million in exchange for the 39,416,928 Tractebel shares contributed (based on five Suez shares and a balancing cash adjustment of € 16 for one Tractebel share). During the second part of the offer, between November 10 and December 1, 1999, the Group issued additional shares, which resulted in the additional contribution of 1,857,543 Tractebel shares (€ 163 per share), in exchange for 9,287,715 Suez shares and cash of € 29.7 million. A total of 41,274,471 Tractebel shares were contributed. Following the offer, the Group owns 97.9% of Tractebel shares. The additional interests in earnings of Tractebel were included in income from November 1, 1999.
The per share amount used to calculate the purchase price under French GAAP was as of the announcement date rather than the average price for a reasonable period surrounding the date of announcement as required under U.S. GAAP.
Under French GAAP as described in Note 1 D, the carrying values used for the acquired portion of the assets and liabilities are the same as those used before the minority interest acquisition. Whereas, under U.S. GAAP, the acquisition of minority interests is recorded at the current fair value at the date an incremental interest is purchased.
Under French GAAP, the excess of the purchase price over the carrying value of the net assets acquired, € 5,695 million, was written off directly to equity upon acquisition. Under U.S. GAAP, the allocation of purchase price to the individual assets and liabilities purchased resulted in a step up, primarily to equity method investments and investments in marketable securities of € 2,257 million and fixed assets of € 568 million, and
F-84
created goodwill of € 2,110 million. The purchase price allocated to equity method investments primarily related to marketable securities, industrial assets and goodwill.
The impact on net income of this transaction is primarily (i) the amortization or impairment of goodwill and (ii) the amortization of the fair value adjustments on underlying assets of equity method investments.
26.1.4 Other Business Combinations
| | | | | | | | | | | | | | | | | |
| | | Impact on
| |
| | | Income/(Loss) for the year ended
December 31,
| | | Equity as of December 31,
| |
(in millions of €)
| | 2003
| | | 2002
| | | 2001
| | | 2003
| | 2002
| | | 2001
| |
SITA minority interests acquisition (a) | | (16.8 | ) | | (2.8 | ) | | (25.0 | ) | | 355.1 | | 435.9 | | | 438.7 | |
BFI acquisition (b) | | (27.0 | ) | | (52.0 | ) | | (10.4 | ) | | 82.2 | | 112.5 | | | 169.3 | |
Powerfin merger - 1997 (c) | | (11.6 | ) | | (31.3 | ) | | (12.0 | ) | | 498.2 | | 509.7 | | | 479.3 | |
Acquisition of Tractebel - 1996 (d) | | (5.3 | ) | | (24.1 | ) | | 9.0 | | | 33.3 | | 42.4 | | | 82.0 | |
Impairment charges & elimination of French GAAP Goodwill amortization (e) | | 129.1 | | | 230.0 | | | 8.5 | | | 134.5 | | 228.3 | | | 8.5 | |
Other (f) | | (1.3 | ) | | (30.8 | ) | | (96.7 | ) | | 314.8 | | (82.6 | ) | | (217.4 | ) |
| | |
|
| |
|
| |
|
| |
| |
|
| |
|
|
Total | | 67.1 | | | 89.0 | | | (126.6 | ) | | 1,418.1 | | 1,246.2 | | | 960.4 | |
| | |
|
| |
|
| |
|
| |
| |
|
| |
|
|
a) SITA Minority Interest Acquisition
In 1999 the Group offered its shares in exchange for all outstanding SITA shares not held by the Group.
Under French GAAP as described in Note 1 D, the carrying values used for the acquired portion of the assets and liabilities are the same as those used before the minority interest acquisition. Whereas, under U.S. GAAP, the acquisition of minority interests is recorded at the current fair value at the date an incremental interest is purchased.
Under French GAAP, the excess of purchase price over the carrying values used for the net assets acquired was written off directly to equity upon acquisition. Under U.S. GAAP, the allocation of the purchase price to assets and liabilities acquired resulted in a step up of € 91.5 million, primarily to fixed assets for € 41.5 million, and created goodwill of € 432.6 million.
The reconciliation mainly reflects in 2003 the impairment loss recognized under U.S. GAAP and, in 2001, the amortization of the goodwill recorded under U.S. GAAP.
b) BFI Acquisition
In 1998, SITA purchased for cash and stock the non-U.S. activities of Browning Ferris Industries (“BFI”).
As a result of the acquisition and the issuance of new shares by SITA, the Group’s ownership in SITA decreased from 63.7% to 51.5%. Under French GAAP, the Group recognized a gain on the dilution of € 109.2 million. The gain was then written-off against goodwill in the Group’s financial statements.
Under U.S. GAAP, a company may decide to record gains on a dilution of its interest in a subsidiary through the statements of income or directly to equity. Once the decision has been made it is permanent. The Group has elected to record these gains through the income statement.
The reconciliation reflects in 2003 and 2002, the impairment loss recognized under U.S. GAAP and, in 2001, the amortization of the goodwill recorded under U.S. GAAP.
F-85
c) Powerfin Merger — 1997
On July 1, 1997, Tractebel purchased 36.95% of Powerfin (the remaining outstanding interest not held by the Group), a Belgian energy company, through issuance of 2,963,088 common shares issued at € 385 per share (€ 1,140 million). This transaction reduced SGB’s ownership of Tractebel from 59.2% to 48.6%. Concurrently, Powerfin was merged into Tractebel. Under French GAAP, Tractebel accounted for this purchase at historical cost by increasing equity for the issuance of its additional shares by the carrying value of the minority interest that was acquired. Under French GAAP there was no impact from the dilution of the Tractebel interest held by SGB due to the elimination of goodwill as part of the Lyonnaise acquisition of Suez. Under U.S. GAAP, the transaction has been accounted for as a purchase. The dilution resulted in a gain of € 115 million on the sale of subsidiary stock that has been recorded to 1998 opening equity. The purchase price has been calculated as the number of shares issued multiplied by the average share price for a reasonable period surrounding the announcement date of the transaction. The allocation of purchase price to the individual assets and liabilities purchased and assumed resulted in an increase in asset values, primarily to equity method investments of € 556 million.
d) Acquisition of Tractebel — 1996
On October 1, 1996, SGB purchased an additional 25.24% of Tractebel (previously accounted for under the equity method), for € 1,230 million paid in cash, increasing its ownership interest to 59.2%. Under French GAAP the difference between the purchase price and the underlying carrying value of net assets was allocated to assets acquired based on their fair values at the time of acquisition. The remaining goodwill was amortized over 40 years until the acquisition of Suez by Lyonnaise in 1997. In that transaction, the goodwill previously recorded by Suez was eliminated in order to calculate a new excess purchase price to be allocated to the assets of Suez based on the fair values of those assets at the date of acquisition. The remaining goodwill, after that allocation, was written-off against equity.
Under U.S. GAAP, as discussed in Note 26.1.1, Suez was identified as the accounting acquirer of Lyonnaise; therefore, this transaction, which was previously accounted for as part of the Lyonnaise acquisition of Suez under French GAAP, must be accounted for as a purchase by Suez under U.S. GAAP. Under U.S. GAAP, the allocation of purchase price to the individual assets and liabilities purchased and assumed resulted in an increase in asset values, primarily to equity method investments and investments in marketable securities of € 370 million, and to fixed assets of € 77 million and created goodwill of € 126 million. The purchase price allocated to equity method investments primarily related to marketable securities, industrial assets and goodwill.
e) Impairment charges & elimination of French GAAP Goodwill amortization
As described in Note 26.1, in accordance with the adoption of SFAS 142, the goodwill amortization recorded under French GAAP is eliminated under U.S. GAAP. This amount also includes the impact from the annual impairment test under SFAS 142 related to the other business combinations. The impact in 2001 relates to the elimination of goodwill amortization on business combinations made after July 1, 2001.
f) Other
The other differences in accounting principles for business combinations between French GAAP and U.S. GAAP include the following:
| | • | As described in Note 1 D, under French GAAP, assets and liabilities of fully consolidated subsidiaries are not revalued in the event the Group acquires additional shares in that entity. Whereas, under U.S. GAAP, the acquisition of additional shares of a consolidated subsidiary is recorded at the current fair value at the date an incremental interest is purchased. |
F-86
| | • | Under French GAAP, the allocation of the purchase price may extend from the date of acquisition to the end of the fiscal year following the year of acquisition. Under U.S. GAAP, such allocation period ends when the acquiring company has finalized its purchase accounting and may not normally extend beyond one year from the date of acquisition. |
| | • | Under French GAAP intangible assets and goodwill may be amortized over their useful lives without any limit. Under U.S. GAAP, the maximum allowable period for amortization was 40 years for 2001. |
26.2 Items impacting net income/(loss) and shareholders’ equity under U.S. GAAP other than business combinations
26.2.1 Income Taxes
Under French GAAP, since January 1, 2000 the Group has applied the new consolidation regulations as detailed in Note 13.6, and records deferred tax liabilities on the balance sheet that had been presented previously as off-balance sheet commitments. This new policy is in accordance with U.S. GAAP. At the same time the Group also began discounting deferred tax balances to present value where, for a tax entity, the impact of discounting is material and a reliable reversal schedule can be produced. The impact of adopting these policies was recorded directly to shareholders’ equity.
Under U.S. GAAP discounting of deferred tax liabilities is not permitted. The reversal of the amounts recorded under French GAAP decreased shareholders’ equity by € 7.8 million, € 560.2 million and € 459.9 million at December 31, 2003, 2002 and 2001, respectively and increased net income in 2003 by € 0.1 million and decreased net income by € 45.0 million and € 22.6 million in 2002 and 2001 respectively. The decrease of the impact on shareholders’ equity and net income between 2003 and 2002 is due to the partial disposal of Northumbrian (described in Note 2.2), which is accounted for under the equity method in 2003.
Under French GAAP, the Belgian subsidiaries of the Group have a potential tax liability relating to the tax-free reserve component of their equity. These tax-free reserves become taxable upon liquidation, distribution, transfer to another account or the decision to reverse the reserve and utilize it against current year losses or loss carryforwards about to expire. Under U.S. GAAP, a deferred tax liability should be recorded for the entire balance of the tax-free reserves since the timing of the reversal of the temporary difference does not affect the decision to record a related deferred tax item. These differences resulted in the recognition of additional deferred tax liabilities, reducing shareholders’ equity under U.S. GAAP by € 95.5 million, € 86.2 million and € 98.4 million in 2003, 2002 and 2001, respectively. The increase in U.S. GAAP to net income resulting from the utilization of the tax free reserves was € 15.7 million in 2002. There was no impact on net income in 2003 and 2001.
Under French GAAP, tax credits related to certain investments are recognized over the useful life of the underlying investments. Under U.S. GAAP, the tax credits are recognized when granted to the extent that their realization is more “likely than not”. These differences result in an increase to shareholders’ equity of € 16.2 million, € 21.5 million and € 41.4 million in 2003, 2002 and 2001, respectively. The reversal of deferred tax assets results in an increase in tax expense under U.S. GAAP and a decrease to net income of € 8.6 million, € 7.6 million and € 18.5 million in 2003, 2002 and 2001, respectively.
The income tax effects resulting from all other U.S. GAAP adjustments are reported on a separate line in the reconciliation.
Disclosures in accordance with SFAS 109 are presented in Note 28.
F-87
26.2.2 Pension Obligations
Prior to 1999, the Group primarily accounted for pension and similar obligations on a pay as you go basis for French GAAP purposes. In 1999 a new accounting policy was adopted for French GAAP under which pension and similar obligations are accrued using the projected unit credit valuation method. Accrued and prepaid pension obligations have been recorded as an adjustment directly to shareholders’ equity.
Under U.S. GAAP, transition obligations have been calculated as of January 1, 1998 as permitted for companies outside the United States and have been amortized from the initial implementation date of SFAS 87 in 1989 for pensions and of SFAS 106 in 1995 for other post retirement benefits. In addition, a minimum liability adjustment has been recorded for pension plans.
26.2.3 Reserves
| | | | | | | | | | | | | | | | |
| | | Impact on
|
| | | Income/(Loss) for the year ended
December 31,
| | | Equity as of December 31,
|
(in millions of €)
| | 2003
| | | 2002
| | | 2001
| | | 2003
| | | 2002
| | 2001
|
Emerging Countries Risks (a) | | — | | | — | | | (161.3 | ) | | — | | | — | | — |
Maintenance (b) | | (40.0 | ) | | (44.1 | ) | | (63.5 | ) | | 484.6 | | | 446.3 | | 496.6 |
Restructuring Costs (c) | | 6.6 | | | (49.7 | ) | | (121.8 | ) | | 47.3 | | | 117.7 | | 139.9 |
Negative Goodwill (d) | | (57.0 | ) | | (65.7 | ) | | (66.7 | ) | | (53.3 | ) | | 11.0 | | 39.4 |
Other Reserves (e) | | 30.8 | | | (31.5 | ) | | (217.4 | ) | | 272.6 | | | 355.4 | | 225.1 |
| | |
|
| |
|
| |
|
| |
|
| |
| |
|
Total | | (59.6 | ) | | (191.0 | ) | | (630.7 | ) | | 751.2 | | | 930.4 | | 901.0 |
| | |
|
| |
|
| |
|
| |
|
| |
| |
|
(a) Emerging Countries Risks
Before 2002, the Group recorded reserves for potential losses arising from political and economic risks based on management’s appraisals of the level of risks for its net long term investments in emerging markets.
Under U.S. GAAP, these reserves were not recorded, as they did not meet the criteria for recognition of a liability at the balance sheet date. As a consequence, the subsequent changes in the reserves recorded under French GAAP are eliminated under U.S. GAAP.
(b) Maintenance
Under French GAAP, the Group records reserves for future major maintenance of certain of its facilities in order to match costs against revenues earned from use of the facilities. Under U.S. GAAP, these costs are expensed as incurred.
Additionally, under French GAAP, the Group records “Total Warranty” reserves related to commitments to maintain equipment in serviceable condition or to replace equipment and facilities covered by warranty clauses. Under U.S. GAAP these costs are expensed as incurred, and as a result, these reserves have been reversed.
(c) Restructuring Costs
Under French GAAP, the Group records the projected effects of restructuring and special termination benefits plans when such plans have been approved by the appropriate level of management, when announced and when their effects may be estimated.
Under U.S. GAAP, for plans initiated before December 31, 2002, a reserve for restructuring can only be recorded during the period when certain conditions are satisfied, including the specific identification and
F-88
approval by the appropriate level of management of the operations and activities to be restructured and notification to the employees affected (or formal acceptance by the employees for special termination benefits plans).
For plans initiated after December 31, 2002, the Group has adopted the provisions of SFAS 146 for restructuring activities and exit activities. SFAS 146 requires that the liability for costs associated with an exit or disposal activity be recognized when the liability is incurred. SFAS 146 also establishes that the liability should initially be measured and recorded at fair value. Accordingly, SFAS 146 will affect the timing of recognizing future restructuring costs as well as the amounts recognized as liabilities.
As a result of the U.S. GAAP differences described above, certain reserves have been reversed in accordance with U.S. GAAP and the expense recorded under French GAAP and U.S. GAAP may occur in different periods.
Disclosures in accordance with EITF 94-3 and SFAS 146 are provided in Note 28.
(d) Negative Goodwill
In November 1998, the Group acquired Tractebel Energia, a Brazilian energy company. Under French GAAP, the Group included the gains on a USD option (purchased to hedge against the risk of the effect of the devaluation of the Brazilian Real on its net investment) in the Tractebel Energia purchase price. Under French GAAP, the option, which was considered a hedge of the net investment, adjusted negative goodwill, which is amortized over 20 years. In 1999 the option was exercised with a significant gain (decrease in negative goodwill) due to the devaluation of the Real. Under U.S. GAAP, currency options are considered speculative and marked to market through the income statement unless they are effective as hedges and designated as hedges. The aforementioned option was neither effective, since it was denominated in USD rather the functional currency (Belgian Franc), nor designated as a hedge. As a result this option is considered speculative under U.S. GAAP with a gain of € 106.6 million, due to the devaluation of the Real, recorded as “other financial income” consistent with the Group’s classification policies in the U.S. GAAP income statement in 1999. At the date the currency option matured, the Group owned a 49% economic interest in Tractebel and Tractebel owned 69% of Tractebel Energia so approximately 30% of the total gain had an impact on net income. In November of 1999, the Group purchased an additional 49% interest in Tractebel eliminating the minority interest and increasing the impact of the gain on equity. The effects of purchasing minority interests on individual U.S. GAAP adjustments have been reflected in the individual line items of the adjustments, in this case provisions/negative goodwill, rather than in total in the business combinations line item.
Under French GAAP, the Group recorded exchange rate losses in 1999 as an adjustment to purchase price decreasing negative goodwill by € 38 million. Under U.S. GAAP this amount reduces net income. Therefore under French GAAP, the net effect (€ 68.6 million) of the currency option gain and the exchange rate loss increased negative goodwill. Under U.S. GAAP both the currency option and the exchange rate losses did not impact the purchase price, but rather were recorded in the income statement when incurred.
Additionally, under French GAAP, the Group allocated negative goodwill to reserves for contractual commitments, entered through 2005, in which obligations exist to sell at a price, which is less than the market prices at the date of acquisition. Under U.S. GAAP, sales contracts where the price is lower than market value but higher than the company’s production cost are not considered onerous contracts. As a result, under U.S. GAAP, the reserves were not included as part of the net assets acquired. A reconciling item is required for the difference in the net amortization and depreciation charges under French GAAP and the depreciation over the useful lives of the assets under U.S. GAAP. The related net impact to net income was € (58.5) million, € (67.8) million, and € (68.8) million in 2003, 2002 and 2001, respectively.
In 1995, under French GAAP, the Group recorded reserves for negative goodwill in connection with the acquisition of Auxipar, a group of companies that own cable TV networks. The reserves were used to offset net
F-89
losses in the periods following acquisition. Under U.S. GAAP, negative goodwill has been recorded as a decrease in the fair value of long-lived assets acquired. The related impact to net income was € 1. 5 million, € 2.1 million and € 2.1 million in 2003, 2002 and 2001, respectively.
(e) Other Reserves
Under French GAAP, the Group records reserves based on management’s estimates of other potential risks, such as tax litigation, employee claims, general claims reserves in insurance subsidiaries, and indemnifications for companies sold.
Under U.S. GAAP, these reserves have been reversed to the extent that they do not meet specific criteria for accrual under U.S. GAAP at the balance sheet date.
26.2.4 Derivative Financial Instruments
Under French GAAP, the Group accounts for its derivative instruments off-balance-sheet until the underlying transaction is realized as described in Notes 1 S and 18.
Beginning January 1, 2001, for purpose of the U.S. GAAP reconciliation, the Group adopted Statement of Financial Accounting Standards No. 133, “Accounting for Derivative Instruments and Hedging Activities” (SFAS 133) and the corresponding amendments (FAS 137, FAS 138 and FAS 149). Under SFAS 133, all derivatives (including certain derivative instruments embedded in other contracts), whether designated in hedging relationships, as detailed below, or not, are recorded in the balance sheet at fair value and changes in fair value are recognized immediately in earnings, unless the derivatives qualify as hedges of future cash flows or net investments. For derivatives qualifying as hedges of future cash flows, the effective portion of changes in fair value is recorded temporarily in equity (Other Comprehensive Income), then recognized in earnings along with the related effects of the hedged items. Any ineffective portion of hedges is reported in earnings as it occurs. For derivatives qualifying as fair value hedges, changes in fair value of both the derivative and the hedged item are recognized in earnings. For derivative instruments designated as a hedge of a foreign currency risk in a net investment in a foreign operation, gains and losses due to the fluctuations in market rates are recorded in Other Comprehensive Income. Several of these contracts do not presently qualify as derivatives under SFAS 133 because of limitations on the possibility for cash settlement or prohibitive costs to cash settle due to illiquidity in the related markets. In addition, certain commodity contracts that would otherwise have been considered derivatives, qualify for the normal purchases and sales exception and therefore are not accounted for as derivatives. The Group formally designates derivatives in one of those categories on the date the transaction is entered into. On a quarterly basis, the Group assesses the effectiveness of each hedging relationship retrospectively and prospectively to ensure that hedge accounting was appropriate for the prior period and continues to be appropriate for future periods.
The fair value of all quoted financial instruments is based on the quoted market price on the last trading day of the year. Fair values for non-quoted financial instruments have been estimated using one or more models, which indicate a value, based on estimates of quantifiable “market” characteristics. The highly judgmental nature of such an undertaking, and the limitations of estimation techniques, make it necessary to caution the users of these financial statements that the values presented for non-quoted financial instruments may differ from those that could have been realized at year end. Fair values given are indicative of the market parameters prevailing as at year end and it should be noted that minor changes in assumptions concerning both these rates and future cash flows and/or methodologies can have a material effect on the estimated values.
Adoption of SFAS 133 as of January 1, 2001 and reported as the cumulative effect of adoption of a new accounting principle, decreased OCI and net income net of tax by € 116.3 million and € 131.8 million, respectively. Recognition of derivatives in accordance with the description above resulted in increases to net income and OCI of € 83.4 million and € 109.9 million in 2001, respectively. Adoption and application of SFAS 133 in 2001 reduced shareholders’ equity by € 132.8 million.
F-90
Application of SFAS 133 resulted in a decrease to income of € 120.2 million in 2003 and in an increase to income of € 69.5 million in 2002, a decrease to OCI of € 80.8 million in 2003 and of € 174.2 million in 2002, and a reduction to shareholders’ equity of € 383.7 million in 2003 and of € 237.5 million in 2002.
Cash Flow Hedges
The ineffective portion of changes in fair values of cash flow hedging instruments reported as of December 31, 2003, 2002 and 2001 amounted to respectively € (7.0) million, € 1.6 million and to € (1.5) million before income taxes. These amounts were recorded as “financial gains (losses).” At December 31, 2003, no gain or loss on derivative instruments accumulated in OCI (€ (70.6) million and € (13.6) million as of December 31, 2002 and 2001 respectively) are expected to be reclassified to earnings over the next 12 months as hedged transactions occur. The actual amounts that will be reclassified to earnings over the next twelve months will vary from this amount as a result of changes in market conditions. At December 31, 2003, the maximum term of derivative instruments that hedge forecasted transactions, except those related to payment of variable interest on existing financial instruments, was 17 years (15 and 21 years as of December 31, 2002 and 2001, respectively).
Fair Value Hedges
The ineffective portion of changes in fair values of fair value hedge positions reported as of December 31 2003 amounted to € 2.1 million (€ 1.8 million and € (3.4) million as of December 31, 2002 and 2001, respectively). These amounts were recorded as “financial gains (losses)”.
Hedges of net investments in foreign subsidiaries
At December 31, 2003, the gains on derivative instruments designated and effective as net investment hedges, accumulated in OCI in compliance with hedge accounting principles described above, amounted to € 345.0 million (€ 394.8 million as of December 31, 2002). These gains are attributable to firm foreign currency derivatives hedging the group net investments in foreign entities, essentially, in US dollars.
In addition, at December 31, 2003, amounts excluded from the measure of effectiveness on these net investment hedges amounted to € (12.8) million (€ 1.8 million and € (17.5) million as of December 31, 2002 and 2001, respectively), and was recorded as “financial gains (losses)”.
26.2.5 Stock Based Compensation and Treasury Stock
Stock based compensation
Under French GAAP, no compensation cost is recognized for stock options and stock purchase plans. Gains and losses on sales of treasury shares to employees to settle stock option plans are recorded in income.
For U.S. GAAP purposes, the stock based compensation and employee stock purchase plans qualify as fixed plans.
Under U.S. GAAP, compensation cost is recorded based on the intrinsic value method under APB 25 equal to the excess, if any, of the market price over the exercise price of the underlying shares at the date of grant. The cost is recognized as compensation expense over the vesting period. The resulting increase in compensation expense, net of the reversal of gains or losses on sales of treasury shares used to settle stock option plans resulted in a decrease to net income of € 9.4 million in 2003, € 41.1 million in 2002, € 17.3 million in 2001, net of minority interests.
F-91
Additional disclosures in accordance with APB 25, SFAS 123 and SFAS 148 are presented in Note 28.
| | | | | | | | | |
| | | For the years ended
| |
(in millions of €, except per share data)
| | December 31,
2003
| | | December 31,
2002
| | | December 31,
2001
| |
Reported Net Income/(Loss), U.S. GAAP | | (2,302.6 | ) | | (3,168.7 | ) | | 896.3 | |
Stock-based employee compensation expense included in reported net income, net of related tax effects | | 7.4 | | | 41.7 | | | 15.7 | |
Total stock-based employee compensation expense determined under fair value based method for all awards, net of related tax effects | | (47.0 | ) | | (76.3 | ) | | (36.2 | ) |
Pro forma Net Income/(Loss), U.S. GAAP | | (2,342.2 | ) | | (3,203.3 | ) | | 875.8 | |
| | | |
Earning per share | | | | | | | | | |
| | | |
Basic — as reported | | (2.32 | ) | | (3.20 | ) | | 0.91 | |
Basic — pro forma | | (2.36 | ) | | (3.23 | ) | | 0.89 | |
Diluted — as reported | | (2.32 | ) | | (3.20 | ) | | 0.90 | |
Diluted — pro forma | | (2.36 | ) | | (3.23 | ) | | 0.88 | |
Treasury stock
Treasury stock purchased to settle the Group’s plans is recorded as marketable securities under French GAAP and has been recorded as treasury shares under U.S. GAAP. This results in a decrease to shareholders’ equity of € 8.1 million in 2003, € 10.2 million in 2002, € 384.8 million in 2001. These amounts are computed as being the treasury stock held by the Group, net of minority interests.
The Group cancelled almost all outstanding treasury shares in 2002 as described in Note 13.4.
26.2.6 Marketable Securities
In accordance with French GAAP, the Group’s policy is to value marketable securities and other equity securities at the lower of cost or market value with any resulting unrealized losses recorded in the income statement. Unrealized gains are not recognized. There is also a difference in how market value is determined under U.S. GAAP.
U.S. GAAP requires actually that investments in marketable securities be divided into three categories: trading (securities which are bought and sold as part of cash management activities), held to maturity (securities which the Group has a positive intent and ability to hold to maturity), and securities available for sale (all other securities).
Available for sale and trading investments are recorded at fair value with unrealized gains and losses related to available for sales investments as a component of equity in accumulated other comprehensive income/loss. Unrealized gains and losses on trading investments are recognized currently in earnings.
Unrealized losses on available for sale investments that are other than temporary are charged to income and result in a new cost basis as the write-down is considered permanent.
Under U.S. GAAP, for available for sale investments the Group recorded an adjustment (decreasing) increasing shareholders’ equity by € (43.8) million, € (15.7) million, and € 544.7 million, in 2003, 2002, and 2001, respectively. For U.S. GAAP purposes, the Group recorded an other than temporary impairment charge of € 48.1 million, and 145.1 million in 2003 and 2002 respectively.
Some securities held by the parent company and most securities held by SI Finance, an investment company, are classified as securities held for trading and recorded at fair value with unrealized gains and losses
F-92
recognized in earnings. Trading securities and the portfolio of the investment company (reduced) increased income by € (20.4) million, € (976.8) million and € 933.0 million in 2003, 2002 and 2001 respectively, under U.S. GAAP. The resulting increases to shareholders’ equity are € 52.4 million, € 76.1 million and € 1,108.5 million as of December 31, 2003, 2002, and 2001, respectively.
Investment in debt securities with a stated interest rate of 4.5% that were redeemable in AXA shares and matured on January 1, 2001 were recorded at cost under French GAAP. Under U.S. GAAP, such securities were classified as “held to maturity” and interest income each year was adjusted for changes in the value of AXA shares using the “retrospective interest method” as described in EITF 96-12 “Recognition of Interest Income and Balance Sheet Classification of structured Notes”. Upon conversion in 2001, a gain was recognized under French GAAP for the difference between the carrying value of the bonds and the market value of the AXA shares obtained while under U.S. GAAP, the gain had been recognized as interest income in prior years. This difference, taking into account the reversal of the allowance recorded in 2001 resulted in a decrease to 2001 net income of € 223.2 million. Upon conversion, the AXA shares were classified as available for sale under U.S. GAAP.
As allowed under paragraph 55 of SFAS 133, the Group elected to transfer certain securities classified as available for sale to the trading category as of January 1, 2001 resulting in an increase to net income of € 47.2 million.
In addition, as a result of the Share Unification Program, the Group ceased to account for its investment in Fortis B under the equity method on December 17, 2001 for both French and U.S. GAAP purposes. The shares of the Fortis Group (the unified shares) have been classified as trading and available for sale and the related impacts on net income and shareholders’ equity are included in the trading and available for sale adjustment amounts disclosed in this reconciling item.
Under French GAAP, a gain is recognized when a quoted company in which the Group holds an equity investment merges with another company for the difference between the quoted market price of the merged company and the carrying value of the historical investment. Under U.S. GAAP, such a gain is only recognized if the Group held shares in the acquired company prior to the transaction. The elimination of this gain resulted in a decrease to 2001 net income under U.S. GAAP of € 124.2 million.
U.S. GAAP required disclosures are presented in Note 28.
26.2.7 Concession Contracts
Under French GAAP, assets provided by the grantor of a concession at the inception of the concession (for which the concessionaire has the obligation to make capital renewals and replacements) are capitalized and, since the grantor retains legal title to such assets, the Group recognizes a related liability which is recorded as “special concession liabilities” and is amortized in with the manner as the depreciation of the assets, without any income statement effect. In addition, the Group estimates the costs of the replacement of assets and accrues in advance such costs.
Under U.S. GAAP, assets provided by the grantor and related “special concession liabilities” are not recorded. In addition, accruals in advance to replace assets are reversed and capital improvements to concession facilities are capitalized when made and depreciated over their estimated useful life. When contractual obligations exist for renewals, the estimated book value of such renewals at the date of expiration of the concession is considered to be a cost of the concession, since the assets are retained by the grantor of the concession, and are amortized on a straight-line basis over the term of the concession agreement.
26.2.8 Equity Method Investments
The Group has accounted for several of its investments on the equity method, using the net income as determined under the investees’ local GAAP adjusted as necessary to be acceptable by the Autorité des Marchés Financiers for French GAAP purposes.
F-93
Under U.S. GAAP, the results of operations and financial position of these investees must be recast into U.S. GAAP prior to the Group’s recognition of its share in income of companies accounted for under equity method. The adjustments to present investees under U.S. GAAP relate primarily to accounting for business combinations, income taxes, marketable securities, pensions, general banking reserves, maintenance and other reserves, and fixed asset reevaluations. For U.S. GAAP purposes, the Group has restated equity method investments, specifically Northumbrian, Fortis B, the mixed inter-municipal companies and Vinci. As a result of the Share Unification Program, the Group ceased to account for its investment in Fortis B under the equity method on December 17, 2001 for both French and U.S. GAAP purposes. The primary adjustments to present equity method investees under U.S. GAAP are as follows:
Business combinations
Fortis writes off goodwill recorded on purchase acquisitions directly to equity under French Gaap. Under U.S. GAAP the excess of the purchase price over the historical cost of the assets acquired and liabilities assumed should first be allocated to those assets based on their fair values, which is Fortis’ policy as well since 1999, and subsequently to goodwill. Goodwill should be amortized over the life of the business acquired, which should not exceed 40 years.
Real estate
Fortis revalues real estate (land and buildings) to estimated market values. If the market value of the property is lower than the purchase price, the difference is recognized in the income statement. Any recovery in value up to the purchase price is also recognized in the income statement.
Under U.S. GAAP properties held for use are generally carried at historical cost less accumulated depreciation. The carrying value is adjusted if a decline in value is deemed other than temporary. Depreciation is provided over the estimated economic life of the property. Properties held for investment are generally carried at the lower of amortized cost or net realizable value, and are adjusted for declines in value deemed impaired. Depreciation is provided over the estimated economic life of the property.
Marketable Securities
In accordance with French GAAP, marketable securities are valued at the lower of cost or market value with any resulting unrealized losses recorded in the income statement.
Under U.S. GAAP, SFAS 115 (“Accounting for Certain Investments in Debt and Equity Securities”), requires that investments in marketable securities be divided into three categories: trading (securities which are bought and sold as part of cash management activities), held to maturity (securities which there is a positive intent and ability to hold maturity), and securities available for sale (all other securities). Most of the marketable securities and investments securities held by equity method investees are available for sale and, accordingly, unrealized gains and losses that are temporary are recorded as a separate component of shareholders’ equity in U.S. GAAP. Unrealized losses, which are other than temporary are charged to income and any write-down is considered permanent. Remaining securities are classified as trading and recorded at market value with changes in unrealized gains and losses included currently in earnings in U.S. GAAP.
Derivative financial instruments
Under French GAAP derivative financial instruments, which are used to manage and reduce the exposure to fluctuation in interest rate, foreign exchange and equity price risk are accounted for in the same period as the item being hedged.
Many derivative financial instruments used by some equity investees do not meet the criteria for hedge accounting under U.S. GAAP. Accordingly, an adjustment is recorded to earnings to account for these derivative financial instruments at fair value. Equity method investees adopted SFAS 133 as described in 26.2.4 as of January 1, 2001.
F-94
Reserves
In accordance with current regulations for European Union countries, certain banking equity method investees have set up reserves for general banking. Under U.S. GAAP, provisions can only be recorded for specific existing risks, the outcome of which are probable and for which the related costs are estimable. These general banking reserves do not meet those criteria.
Additionally certain equity method investees have accrued for other provisions, which do not qualify for accrual under U.S. GAAP. Furthermore, certain equity method investees have discounted deferred tax liabilities, which is not permitted under U.S. GAAP.
26.2.9 Scope of Consolidation
Electrabel
In 2002, the Group’s 45.32% owned subsidiary, Electrabel, was consolidated under French GAAP because the Group exercised effective control by casting the majority of the votes at the three shareholders meetings prior to December 31, 2002. This indicator of effective control was not sufficient to allow consolidation under U.S. GAAP, so Electrabel was accounted for under the equity method under U.S. GAAP in 2002 and 2001. As a result of this difference in method, the profit component of certain inter-company transactions between Electrabel and the Group that had been completely eliminated using full consolidation under French GAAP were recognized in part under the equity method for U.S. GAAP. This adjustment also reduced U.S. GAAP net income in the years when the total income was recognized through an external sale in French GAAP for the portion of that income previously recognized under the equity method in U.S. GAAP.
In 2003, the Group increased its voting interest in Electrabel to 50.12%. Accordingly, Electrabel has been fully consolidated since January 1, 2003 for U.S. GAAP purposes.
The individual differences discussed in Note 26 describe the main adjustments to the French GAAP Consolidated Financial Statements that include Electrabel as a consolidated subsidiary in 2002 and 2001. See Notes 27 and 28 for the impact of changes in scope of consolidation, which primarily relate to Electrabel and additional disclosures for Electrabel.
If Electrabel were accounted for under the equity method in the French GAAP financial statements, revenues would have been € 33,458 million (€ 12,632 million less than under French GAAP) for the year ended December 31, 2002 and € 31,921 million (€ 10,438 million less than under French GAAP) for the year ended December 31, 2001. Operating income with Electrabel as an equity method investee would have been € 2,534 million (€ 1,174 million less than under French GAAP) for the year ended December 31, 2002 and € 2,925 million (€ 1,139 million less than under French GAAP) for the year ended December 31, 2001.
Pursuant contractual arrangements to fund a portion of its pension liability, Electrabel is obliged to pay premiums collected plus the Belgian statutory guaranteed rate of return (3.25% at December 31, 2003). The premiums are calculated to fund, over the years until retirement, a lump sum payment upon retirement based on compensation levels and Belgian mortality tables.
Accounting for Joint Venture Investments and Use of Proportionate Consolidation Method
For U.S. GAAP purposes, investments in corporate joint venture and companies, which the Group accounts for using the proportionate consolidation method under French GAAP, are accounted for under the equity method. Additionally, “income from partnerships” presented within operating income under French GAAP is presented as income from equity investees under U.S. GAAP for those partnerships that are accounted for using the equity method under U.S. GAAP.
F-95
These differences in accounting policy have no effect on net income or shareholders’ equity. However, application of the equity method would decrease net sales by € 3,947.2 million, € 3,235.0 million and € 3,322.6 million for 2003, 2002 and 2001, respectively, and operating income for € 459.5 million, € 425.8 million, and € 458.0 million for 2003, 2002 and 2001, respectively.
FirstMark
Under French GAAP, the 19% investment in First Mark Communication France (FMCF) was accounted for at cost in 2001. Additional financing in the form of bonds was provided through two entities, in which the Group had no equity interest. Under French GAAP, those entities could not be consolidated and the bonds were reported as investments in debt securities.
Under U.S. GAAP, the Group consolidated the two entities that issued the bonds as in substance it controlled them; as a consequence, their 44.7% interest as well as the 19% interest of the Group in FMCF were also consolidated.
In 2002, the Group acquired 100% of the two entities and the remaining shares of FMCF. The Group then contributed all of its FMCF shares to LD Com, and now has a 16.65% interest in this company. LD Com is accounted for at cost both under French and U.S. GAAP.
Consolidation of FMCF under U.S. GAAP increased net sales of € 1.3 million in 2001, decreased operating income of € 57.3 million in 2001, and increased (decreased) net income of € 15.3 million and € (15.3) million in 2002 and 2001, respectively.
26.2.10 Adjustments to Capital Gains
Under French GAAP the basis in securities held by the Group of consolidated subsidiaries and equity method investments (i.e., the basis in the investment) is determined by adding or deducting the accumulated earnings or losses, as determined under French GAAP, less any dividends. In the same calculation under U.S. GAAP, the accumulated earnings would be measured using U.S. GAAP and therefore the basis in securities could differ from the basis of the investment determined under French GAAP. Because the basis in the investment can be different under French and U.S. GAAP, any capital gains realized when a portion of the investment is sold could likewise differ. The adjustment to capital gains represents the elimination of those U.S. GAAP adjustments, described by type throughout Note 26, when the securities are sold.
The most significant sales were sale of Northumbrian (partial), Cespa and Nalco in 2003, TPS in 2002, Fortis B (partial) and Vinci in 2001.
As explained in Note 5.1 under French GAAP, the Group recorded a gain of € 310.3 million in 2001 when the Group’s interest in Suez Lyonnaise Telecom decreased from 100% to 50.1% through the issuance of shares to France Telecom in exchange for the contribution of its cable networks.
Since all the conditions expressed in SAB 51 and 84 were not met, the Group concluded that such gain could not be recorded and reported such amounts as an equity transaction.
As explained in Note 2.4, the Group recorded under French GAAP a net capital gain of € 166.9 million group share, when 30% of ESO was sold to PUBLIT on May 31, 2002. Under U.S. GAAP, the existence of a resale option granted to the purchaser, despite the low probability that it would be exercised, precluded recognition of the sale.
F-96
26.2.11 Sale and leaseback arrangements
In 2002, the Group entered into five sale-leaseback arrangements of buildings and leaseholds with a combined net book value of € 225.0 million with various financial institutions. The combined sales price was € 491.0 million.
Under French GAAP, the Group recognized the gains associated with these transactions. Under U.S. GAAP, the gain cannot be recognized on these transactions and is being amortized over the terms of the respective lease agreements, which range from 9 to 25 years.
In 2003, the Group did not enter into new sale-leaseback transaction.
26.2.12 Other Items
Other differences between accounting principles followed by the Group and U.S. GAAP primarily relate to start-up costs and capitalized interest, and revenue recognition prior to 2002. The most significant item relates to application of the percentage of completion method for long term contracts, which decreased U.S. GAAP income by € 21.6 million in 2001. The other differences are not individually significant.
26.2.13 Asset Retirement Obligations
In 2002, under French GAAP, the Group applied regulations CR0006 with respect to costs associated with dismantling installations, relating primarily to conventional and nuclear power stations. In accordance with this regulation, the Group recorded the discounted value of the dismantling obligation and a corresponding offsetting asset for any obligation with a retroactive effect to January 1, 2002. The assets recorded are depreciated on a straight-line basis over the asset’s useful life. The impact of the change in accounting method was recorded directly in shareholders’ equity.
In 2003, the Group adopted the provisions of SFAS 143 which requires the group to record the fair value of the liability associated with legal obligation to retire tangible long-lived assets, such liability should be recorded when incurred. When a new liability is recorded the Group will capitalize the costs of the liability by increasing the carrying amount of the related long-lived asset. The liability is accreted to its present value each period and the capitalized cost is depreciated over the useful life of the related asset. Upon settlement of the liability, the Group settles the obligation for its recorded amount or incurs a gain or loss upon settlement. The adoption of this statement is recorded as a cumulative effect adjustment in the U.S. GAAP accounts. See note 28 for additional disclosures required under SFAS 143.
26.2.14 Other Reclassifications to Operating Income
In addition to the adjustments between French and U.S. GAAP and the scope of consolidation reclassifications described in this footnote, the following classification differences between French and U.S. GAAP must be considered to calculate U.S. GAAP operating income.
Under French GAAP, as disclosed in note 1.G, Electrabel’s share in the pre-tax income of the mixed inter-municipal companies is presented in operating income. Under US GAAP, this income, amounting to € 437 million in 2003, has been reclassified as share in income of companies accounted for under the equity method.
Additionally, all transactions classified as exceptional income under French GAAP (as disclosed in Note 5), have been classified as operating income under U.S. GAAP, except the following transactions which have been classified as non-operating income or discontinued operations under U.S. GAAP:
| | • | Gains (losses) on sales of marketable securities of € (216.1) million, € (550.0) million and € 762.0 million in 2003, 2002 and 2001 respectively. |
F-97
| | • | Gains on sales of shares of equity method investees of € (529.4) million, € 180.6 million and € 504.0 million in 2003, 2002 and 2001 respectively. |
| | • | Exceptional foreign currency exchange losses related primarily to debt held in emerging countries of € (44.6) million, € 448.6 million, and € 335.8 million in 2003, 2002 and 2001, respectively. |
| | • | The French GAAP gains (losses) associated with activities classified as discontinued operations have been presented under U.S. GAAP on the separate line item “Net income/(loss) from discontinued operations”, amounting to € (760) million, € 312 million and € (79) million in 2003, 2002 and 2001, respectively. |
Goodwill amortization
Goodwill amortization that is not a component of operating income under French GAAP has been reclassified as operating income under U.S. GAAP for € 422.7 million in 2001.
Discontinued operations
Operating results relating to discontinued operations have been presented separately under U.S. GAAP.
26.2.15 Reclassification of Bonds and Related Discounts
As described in Note 1 N, under French GAAP, bonds issued with discounts are recorded at their face value. The related unamortized discounts are recorded as prepaid expenses. Under U.S. GAAP, the unamortized portion of a debt discount is reflected as an adjustment of the related debt.
As a result, the amount of prepaid expenses related to unamortized bond discounts has been reclassified as an adjustment of the related debt, decreasing the carrying value of the bonds by € 157.2 million in 2003, € 91.5 million in 2002 and € 110.1 million in 2001.
F-98
NOTE 27- Reconciliation of French GAAP to U.S. GAAP and presentation of condensed financial statements
27.1 Reconciliation of Net Income/(Loss), net of minority interests
| | | | | | | | | |
| | | For the years ended December 31,
| |
(in millions of €)
| | 2003
| | | 2002
| | | 2001
| |
Net Income/(Loss) as Reported in the Consolidated Statements of Income | | (2,165.2 | ) | | (862.5 | ) | | 2,086.7 | |
| | | |
Reference indicates section of Note 26 where adjustment is discussed. | | | | | | | | | |
| | | |
1.1 Merger Between Lyonnaise des Eaux and Compagnie de Suez | | (110.0 | ) | | (49.0 | ) | | (192.1 | ) |
1.2 SGB Minority Interest Acquisition — 1998 | | (21.1 | ) | | (262.4 | ) | | (195.2 | ) |
1.3 Tractebel Minority Interest Acquisition — 1999 | | (151.6 | ) | | (508.1 | ) | | (306.6 | ) |
1.4 Other Business Combinations | | 67.1 | | | 89.0 | | | (126.6 | ) |
2.1 Income Taxes | | (8.5 | ) | | (36.9 | ) | | (41.1 | ) |
2.2 Pension Obligations | | 13.7 | | | (8.1 | ) | | (39.2 | ) |
2.3 Reserves | | (59.6 | ) | | (191.0 | ) | | (630.7 | ) |
2.4 Derivative Financial Instruments | | (120.2 | ) | | 69.5 | | | 83.4 | |
2.5 Stock Based Compensation and Treasury Stock | | (9.4 | ) | | (41.1 | ) | | (17.3 | ) |
2.6 Marketable Securities | | (31.0 | ) | | (1,121.9 | ) | | 585.6 | |
2.7 Concession Contracts | | (22.3 | ) | | 16.6 | | | (47.6 | ) |
2.8 Equity Method Investments | | 65.9 | | | (77.3 | ) | | (191.2 | ) |
2.9 Scope of Consolidation | | 50.3 | | | (24.7 | ) | | 109.3 | |
2.10 Adjustment to Capital Gains | | 137.6 | | | (144.6 | ) | | (226.2 | ) |
2.11 Sale and leaseback arrangements | | 9.2 | | | (188.3 | ) | | — | |
2.12 Other Items | | (28.6 | ) | | (24.7 | ) | | (67.3 | ) |
Total U.S. GAAP Adjustments Before Tax Effect | | (218.5 | ) | | (2,503.0 | ) | | (1,302.8 | ) |
Tax effect of The Above Adjustments | | 107.2 | | | 196.8 | | | 244.2 | |
U.S. GAAP income/(loss) before cumulative effect of adopting SFAS 133 & SFAS 143 (net of tax) | | (2,276.5 | ) | | (3,168.7 | ) | | 1,028.1 | |
Cumulative effect of adopting SFAS 133 (net of tax) | | — | | | — | | | (131.8 | ) |
Cumulative effect of adopting SFAS 143 (net of tax) | | (26.1 | ) | | — | | | — | |
U.S. GAAP net income/(loss) | | (2,302.6 | ) | | (3,168.7 | ) | | 896.3 | |
Summarized U.S. GAAP Consolidated Income Statement Data
| | | | | | | | | |
| | | For the years ended December 31,
| |
(in millions of €)
| | 2003
| | | 2002
| | | 2001
| |
Revenues | | 35,643.6 | | | 27,386.9 | | | 25,606.7 | |
Operating Income/(Loss) | | 764.6 | | | (76.3 | ) | | 966.5 | |
Share in income/(loss) of companies accounted for under the equity method | | 473.7 | | | 298.1 | | | 331.1 | |
Minority interests share in income | | 833.2 | | | (91.7 | ) | | 40.9 | |
| | | |
Net Income/(Loss) from continuing operations | | (1,564.6 | ) | | (3,249.8 | ) | | 1,083.4 | |
| | | |
Net Income/(Loss) from discontinued operations (1) | | (711.9 | ) | | 81.1 | | | (55.3 | ) |
Cumulative effect of adopting SFAS 133 (net of tax) | | — | | | — | | | (131.8 | ) |
Cumulative effect of adopting SFAS 143 (net of tax) | | (26.1 | ) | | — | | | | |
Net Income/(Loss) | | (2,302.6 | ) | | (3,168.7 | ) | | 896.3 | |
| (1) | The Group disposed in 2003 of Nalco, Codenet & Coditel. In accordance with SFAS 144 these disposals have been presented as discontinued operations. The loss recognized on these disposals amounted to € 787.7 million. |
F-99
27.2 U.S. GAAP Earnings per Share
In accordance with SFAS 128, “Earnings per Share”, basic earnings per share is computed by dividing income available to common shareholders by the weighted average number of common shares outstanding. The computation of diluted earnings per share is adjusted to include any potential common shares. Potential common shares include stock options, warrants, and convertible securities issued by the company on its own stock.
The computation and reconciliation of basic and diluted earnings per share for the years ended December 31, 2003, 2002 and 2001 prepared in accordance with U.S. GAAP are as follows:
| | | | | | | | | |
(in millions of €, except share and per share amounts)
| | 2003 (1)
| | | 2002 (2)
| | | 2001
| |
Numerator for diluted earnings per share: | | | | | | | | | |
Effect of dilutive securities: | | | | | | | | | |
Convertible bonds | | — | | | — | | | 7.3 | |
Numerator for diluted earnings per share-income/(loss) available to common stockholders after considering conversions — Continuing operations | | (1,564.6 | ) | | (3,249.8 | ) | | 1,090.7 | |
Numerator for diluted earnings per share-income/(loss) available to common stockholders after considering conversions — Discontinued operations | | (711.9 | ) | | 81.1 | | | (55.3 | ) |
Cumulative effect of adopting SFAS 133 (net of tax) | | — | | | — | | | (131.8 | ) |
Cumulative effect of adopting SFAS 143 (net of tax) | | (26.1 | ) | | — | | | — | |
Numerator for diluted earnings per share-income/(loss) available to common stockholders after considering conversions | | (2,302.6 | ) | | (3,168.7 | ) | | 903.6 | |
| | | |
Denominator (share amounts): | | | | | | | | | |
Denominator for basic earnings per share-weighted average shares | | 993,508,578 | | | 991,270,887 | | | 985,089,012 | |
Effect of dilutive securities | | | | | | | | | |
Stock options | | — | | | — | | | 5,060,525 | |
Stock warrants | | — | | | — | | | 57.425 | |
Convertible bonds | | — | | | — | | | 15,377,089 | |
Dilutive potential common shares | | — | | | — | | | 20,495,039 | |
Denominator for diluted earnings per share-adjusted weighted-average shares and assumed conversions | | 993,508,578 | | | 991,270,887 | | | 1,005,584,051 | |
| | | |
Earnings per share: | | | | | | | | | |
Basic | | | | | | | | | |
Income/(loss) from continuing operations | | (1.57 | ) | | (3.28 | ) | | 1.10 | |
Cumulative effect of adopting SFAS 133 (net of tax) | | — | | | — | | | (0.13 | ) |
Cumulative effect of adopting SFAS 143 (net of tax) | | (0.03 | ) | | — | | | — | |
Net income/(loss) from discontinued operations | | (0.72 | ) | | 0.08 | | | (0.06 | ) |
Net income/(loss) | | (2.32 | ) | | (3.20 | ) | | 0.91 | |
Diluted | | | | | | | | | |
Income/(loss) from continuing operations | | (1.57 | ) | | (3.28 | ) | | 1.08 | |
Cumulative effect of adopting SFAS 133 (net of tax) | | — | | | — | | | (0.13 | ) |
Cumulative effect of adopting SFAS 143 (net of tax) | | (0.03 | ) | | — | | | — | |
Net income/(loss) from discontinued operations | | (0.72 | ) | | 0.08 | | | (0.05 | ) |
Net income/(loss) | | (0.72 | ) | | (3.20 | ) | | 0.90 | |
| (1) | In 2003, the effect of the 13.3 million potentially dilutive securities is not included because they are antidilutive. |
| (2) | In 2002, the effect of the 18.2 million potentially dilutive securities is not included because they are antidilutive. |
F-100
27.3 Shareholders’ Equity net of minority interests
| | | | | | | | | |
| | | As of December 31,
| |
(in millions of €)
| | 2003
| | | 2002
| | | 2001
| |
Shareholders’ Equity as Reported in The Consolidated Balance Sheets | | 6,895.7 | | | 10,577.5 | | | 14,397.2 | |
| | | |
Reference refers to section of Note 26 where the reconciling item is discussed. | | | | | | | | | |
| | | |
1.1 Merger Between Lyonnaise des Eaux and Companie de Suez | | 2,124.6 | | | 2,629.9 | | | 2,888.4 | |
1.2 SGB Minority Interest Acquisition — 1998 | | 871.3 | | | 909.2 | | | 1,575.1 | |
1.3 Tractebel Minority Interest Acquisition — 1999 | | 3,669.2 | | | 3,871.2 | | | 4,552.4 | |
1.4 Other Business Combinations | | 1,418.1 | | | 1,246.2 | | | 960.4 | |
2.1 Income Taxes | | (87.1 | ) | | (624.9 | ) | | (516.9 | ) |
2.2 Pension Obligations | | 10.9 | | | (51.9 | ) | | 136.2 | |
2.3 Reserves | | 751.2 | | | 930.4 | | | 901.0 | |
2.4 Derivative Financial Instruments | | (383.7 | ) | | (237.5 | ) | | 209.4 | |
2.5 Stock Based Compensation and Treasury Stock | | (8.1 | ) | | (10.2 | ) | | (384.8 | ) |
2.6 Marketable Securities | | 8.7 | | | 60.4 | | | 1,653.2 | |
2.7 Concession Contracts | | 297.2 | | | 319.6 | | | 304.5 | |
2.8 Equity Method Investments | | (99.8 | ) | | (17.8 | ) | | 42.9 | |
2.9 Scope of Consolidation | | 143.1 | | | 93.6 | | | 109.3 | |
2.10 Adjustment to Capital Gains | | (183.0 | ) | | (163.4 | ) | | — | |
2.11 Sale and leaseback arrangements | | (112.7 | ) | | (178.5 | ) | | — | |
2.12 Other Items | | (104.4 | ) | | (134.2 | ) | | (110.8 | ) |
Total U.S. GAAP Adjustments Before Tax Effect | | 8,315.5 | | | 8,642.1 | | | 12,320.1 | |
Tax effect of The Above Adjustments | | (691.1 | ) | | (822.6 | ) | | (1,369.2 | ) |
U.S. GAAP shareholders’ Equity before cumulative effect of adopting SFAS 133 | | 14,520.1 | | | 18,397.0 | | | 25,348.1 | |
Cumulative effect of adopting SFAS 143 (net of tax) | | — | | | — | | | (248.1 | ) |
U.S. GAAP shareholders’ Equity | | 14,520.1 | | | 18,397.0 | | | 25,100.0 | |
F-101
27.4 Summarized Balance Sheets
Summarized U.S. GAAP Consolidated Balance Sheets
| | | | | | | | | | |
| | | As of December 31, 2003
|
(in millions of €)
| | French
GAAP
| | Effect for Scope
of consolidation (a)
| | | Effect of U.S. GAAP
Adjustments (b)
| | | U.S. GAAP
|
Intangible assets, net | | 1,632.8 | | (928.8 | ) | | 297.5 | | | 1,001.5 |
Goodwill, net | | 5,851.5 | | (358.0 | ) | | 4,353.6 | | | 9,847.1 |
Tangible assets, net | | 27,127.3 | | (4,343.1 | ) | | (1,971.3 | ) | | 20,812.9 |
Financial assets | | 7,017.9 | | 2,448.3 | | | 1,481.2 | | | 10,947.4 |
Inventories and work in progress | | 1,850.1 | | (149.6 | ) | | (31.3 | ) | | 1,669.2 |
Accounts receivable | | 12,412.9 | | (1,186.4 | ) | | (305.6 | ) | | 10,920.9 |
Marketable securities | | 5,015.0 | | (284.9 | ) | | (46.2 | ) | | 4,683.9 |
Cash and cash equivalents | | 6,688.0 | | (372.0 | ) | | (4.7 | ) | | 6,311.3 |
Prepaid expenses | | 2,354.7 | | (416.0 | ) | | 459.9 | | | 2,398.6 |
Total assets | | 69,950.2 | | (5,590.5 | ) | | 4,233.1 | | | 68,592.8 |
| | | | |
Shareholders’ equity | | 6,895.7 | | 143.1 | | | 7,481.3 | | | 14,520.1 |
Minority interests | | 4,847.2 | | (835.2 | ) | | (97.1 | ) | | 3,914.9 |
Special concession accounts | | 4,847.4 | | (283.5 | ) | | (4,445.9 | ) | | 118.0 |
Other reserves for contingencies and losses | | 10,440.4 | | (262.7 | ) | | (1,703.7 | ) | | 8,474.0 |
Borrowings and long-term debt | | 26,694.1 | | (2,371.9 | ) | | 675.6 | | | 24,997.8 |
Accounts payable | | 13,440.9 | | (1,527.4 | ) | | (422.5 | ) | | 11,491.0 |
Deferred income | | 2,784.5 | | (452.9 | ) | | 2,745.4 | | | 5,077.0 |
Total liabilities and shareholders’ equity | | 69,950.2 | | (5,590.5 | ) | | 4,233.1 | | | 68,592.8 |
| (a) | To present effect of changes in scope of consolidation, (see Note 26.2.9). |
| (b) | To present adjustments between French and U.S. GAAP. |
F-102
Summarized U.S. GAAP Consolidated Balance Sheets
| | | | | | | | | | |
| | | As of December 31, 2002
|
(in millions of €)
| | French
GAAP
| | Effect for Scope of consolidation
(a)
| | | Effect of U.S. GAAP
Adjustments (b)
| | | U.S. GAAP
|
Intangible assets, net | | 3,903.0 | | (849.0 | ) | | 298.1 | | | 3,352.1 |
Goodwill, net | | 8,710.9 | | (1,795.3 | ) | | 3,724.0 | | | 10,639.6 |
Tangible assets, net | | 33,275.8 | | (8,655.4 | ) | | (4,241.3 | ) | | 20,379.1 |
Financial assets | | 11,099.8 | | 4,290.7 | | | 3,690.4 | | | 19,080.9 |
Inventories and work in progress | | 2,652.6 | | (688.9 | ) | | (10.6 | ) | | 1,953.1 |
Accounts receivable | | 13,669.8 | | (3,718.9 | ) | | (337.7 | ) | | 9,613.2 |
Marketable securities | | 2,575.7 | | (375.2 | ) | | 4.6 | | | 2,205.1 |
Cash and cash equivalents | | 5,963.2 | | (2,142.2 | ) | | (15.9 | ) | | 3,805.1 |
Prepaid expenses | | 2,300.5 | | (902.5 | ) | | 298.8 | | | 1,696.8 |
Total assets | | 84,151.3 | | (14,836.7 | ) | | 3,410.4 | | | 72,725.0 |
| | | | |
Shareholders’ equity | | 10,577.5 | | 93.6 | | | 7,725.8 | | | 18,397.0 |
Minority interests | | 5,190.7 | | (4,270.3 | ) | | 15.7 | | | 936.1 |
Special concession accounts | | 4,849.2 | | (253.2 | ) | | (4,472.0 | ) | | 124.0 |
Other reserves for contingencies and losses | | 10,208.1 | | (5,633.6 | ) | | (1,384.6 | ) | | 3,189.9 |
Borrowings and long-term debt | | 34,544.5 | | (137.9 | ) | | 29.0 | | | 34,435.6 |
Accounts payable | | 14,745.7 | | (3,780.4 | ) | | (460.9 | ) | | 10,504.4 |
Deferred income | | 4,035.5 | | (854.9 | ) | | 1,957.4 | | | 5,138.0 |
Total liabilities and shareholders’ equity | | 84,151.3 | | (14,836.7 | ) | | 3,410.4 | | | 72,725.0 |
| (a) | To present effect of changes in scope of consolidation (mainly Electrabel, see Note 26.2.9). |
| (b) | To present adjustments between French and U.S. GAAP. |
F-103
Summarized U.S. GAAP Consolidated Balance Sheets
| | | | | | | | | | |
| | | As of December 31, 2001
|
(in millions of €)
| | French
GAAP
| | Effect for Scope of consolidation
(a)
| | | Effect of U.S. GAAP
Adjustments (b)
| | | U.S. GAAP
|
Intangible assets, net | | 4,234.9 | | (948.3 | ) | | 670.3 | | | 3,956.9 |
Goodwill, net | | 10,319.3 | | (1,957.2 | ) | | 3,983.3 | | | 12,345.4 |
Tangible assets, net | | 37,991.6 | | (11,082.9 | ) | | (4,013.7 | ) | | 22,895.0 |
Financial assets | | 11,163.3 | | 3,087.9 | | | 6,014.2 | | | 20,265.4 |
Inventories and work in progress | | 4,203.3 | | (726.6 | ) | | (8.2 | ) | | 3,468.5 |
Accounts receivable | | 13,590.0 | | (3,335.7 | ) | | (116.4 | ) | | 10,137.9 |
Marketable securities | | 1,122.6 | | (314.2 | ) | | (349.2 | ) | | 459.2 |
Cash and cash equivalents | | 4,628.6 | | (443.7 | ) | | (56.8 | ) | | 4,128.1 |
Prepaid expenses | | 2,227.8 | | (744.8 | ) | | 256.1 | | | 1,739.1 |
Total assets | | 89,481.4 | | (16,465.5 | ) | | 6,379.6 | | | 79,395.5 |
| | | | |
Shareholders’ equity | | 14,397.2 | | 109.3 | | | 10,593.5 | | | 25,100.0 |
Minority interests | | 6,447.0 | | (4,651.8 | ) | | (41.2 | ) | | 1,754.0 |
Special concession accounts | | 4,668.6 | | (208.4 | ) | | (4,329.6 | ) | | 130.6 |
Other reserves for contingencies and losses | | 9,437.1 | | (5,347.3 | ) | | (1,385.5 | ) | | 2,704.3 |
Borrowings and long-term debt | | 33,760.6 | | (1,911.4 | ) | | (132.7 | ) | | 31,716.5 |
Accounts payable | | 16,269.4 | | (3,559.9 | ) | | (111.4 | ) | | 12,598.1 |
Deferred income | | 4,501.5 | | (896.0 | ) | | 1,786.5 | | | 5,392.0 |
Total liabilities and shareholders’ equity | | 89,481.4 | | (16,465.5 | ) | | 6,379.6 | | | 79,395.5 |
| (a) | To present effect of changes in scope of consolidation (mainly Electrabel, see Note 26.2.9). |
| (b) | To present adjustments between French and U.S. GAAP. |
NOTE 28- Additional U.S. GAAP disclosure information
28.1 Marketable Securities (SFAS 115)
The Group holds various corporate securities, which are classified on the balance sheets as of December 31, 2003, 2002 and 2001 as marketable securities. These investments are carried at the lower of cost or fair market value. French GAAP does not permit upward adjustments in the value of these securities to reflect their fair market value.
Fair value is determined based on quoted market prices or, when quoted market prices are not available, management reviews comparable transactions and the price to earnings ratio of comparable businesses to determine the amount expected to be received in a current sale.
The Group has classified its investments as trading, available-for-sale and held-to-maturity securities. Adjustments to recognize differences in accounting for marketable securities under French GAAP and U.S. GAAP are discussed in Note 26. The following information presents additional disclosure information on a French GAAP basis.
F-104
Available-for-Sale Securities
As of December 31, 2003, 2002 and 2001, the Group’s amortized cost, gross unrealized gains, gross unrealized losses and fair value of the available-for-sale investment securities by major security type are as follows:
| | | | | | | | | |
(in millions of €)
| | Amortized
Cost
| | Gross
Unrealized
Gains
| | Gross
Unrealized
Losses
| | | Fair
Value
|
2003 | | | | | | | | | |
Equity Securities | | 1,558.8 | | 31.5 | | (61.7 | ) | | 1,528.6 |
Debt Securities | | 34.0 | | 2.0 | | — | | | 36.0 |
Total | | 1,592.8 | | 33.5 | | (61.7 | ) | | 1,564.6 |
2002 | | | | | | | | | |
Equity Securities | | 2,497.0 | | 149.6 | | (31.6 | ) | | 2,615.0 |
Debt Securities | | 50.2 | | — | | — | | | 50.2 |
Total | | 2,547.2 | | 149.6 | | (31.6 | ) | | 2,665.2 |
2001 | | | | | | | | | |
Equity Securities | | 3,055.3 | | 1,326.0 | | (22.1 | ) | | 4,359.2 |
Debt Securities | | 95.8 | | 19.7 | | — | | | 115.5 |
Total | | 3,151.1 | | 1,345.7 | | (22.1 | ) | | 4,474.7 |
The change in the net unrealized gains on available for sale securities amounts to respectively € (146.2) million, € (1,205.6) million, € 113.5 million in 2003, 2002 and 2001.
Gross realized gains and losses on marketable securities classified as available-for-sale are included in other net exceptional income as total revenue from marketable securities in the Group’s consolidated statement of operations. Realized gains and losses for securities held by the Group’s companies are determined using the first in, first out or the average cost method. Gross realized gains and losses for the years ended December 31, 2003, 2002 and 2001 are as follows:
| | | | | | | | |
(in millions of €)
| | Proceeds
| | Book
Value
| | Gross
Realized
Gains
| | Gross
Realized
Losses
|
2003 | | 1,184.6 | | 1,225.4 | | 63.4 | | 104.2 |
2002 | | 2,562.9 | | 1,980.2 | | 628.5 | | 45.8 |
2001 | | 1,787.3 | | 1,250.9 | | 536.4 | | — |
As of December 31, 2003, contractual maturities of available-for-sale debt-securities by major security type are as follows:
| | | | | | | | | | |
(in millions of €)
| | Less Than
One Year
| | One To
Five Years
| | Five To
Ten
Years
| | After
Ten
Years
| | Total
|
Securities issued by Governments other than the U.S | | 7.0 | | 27.0 | | — | | — | | 34.0 |
Other debt securities | | — | | — | | — | | — | | — |
Total | | 7.0 | | 27.0 | | — | | — | | 34.0 |
Held-to-Maturity Securities
The Group’s securities classified as held-to-maturity are primarily held by the Group’s financial sector companies. Held-to-maturity securities, which are securities that the Group has the ability and the intent to hold until maturity, are recorded at amortized cost and adjusted for amortization or accretion of premiums or discounts.
F-105
As of December 31, 2003, the Group’s amortized cost, gross unrealized gains, gross unrealized losses and fair value of investment securities classified as held-to-maturity are as follows:
| | | | | | | | | |
(in millions of €)
| | Amortized
Cost
| | Gross
Unrealized
Gains
| | Gross
Unrealized
Losses
| | | Fair Value
|
Debt securities issued by other governments | | 90.5 | | — | | (8.0 | ) | | 82.5 |
Total | | 90.5 | | — | | (8.0 | ) | | 82.5 |
As of December 31, 2002, the Group’s amortized cost, gross unrealized gains, gross unrealized losses and fair value of investment securities classified as held-to-maturity are as follows:
| | | | | | | | |
(in millions of €)
| | Amortized
Cost
| | Gross
Unrealized
Gains
| | Gross
Unrealized
Losses
| | Fair Value
|
Debt securities issued by other governments | | 81.3 | | — | | — | | 81.3 |
Total | | 81.3 | | — | | — | | 81.3 |
As of December 31, 2001, the Group’s amortized cost, gross unrealized gains, gross unrealized losses and fair value of investment securities classified as held-to-maturity are as follows:
| | | | | | | | | |
(in millions of €)
| | Amortized
Cost
| | Gross
Unrealized
Gains
| | Gross
Unrealized
Losses
| | | Fair
Value
|
Debt securities issued by other governments | | 58.0 | | — | | — | | | 58.0 |
Corporate debt securities | | 195.2 | | — | | (0.2 | ) | | 195.0 |
Other debt securities | | 47.2 | | 0.1 | | — | | | 47.3 |
Total | | 300.4 | | 0.1 | | (0.2 | ) | | 300.3 |
As of December 31, 2003, the contractual maturities for held to maturity securities by major security type are as follows:
| | | | | | | | | | |
(in millions of €)
| | Less Than
One Year
| | One To
Five Years
| | Five To
Ten Years
| | After Ten
Years
| | Total
|
Debt securities issued by other governments | | 67.0 | | 23.5 | | — | | — | | 90.5 |
Total | | 67.0 | | 23.5 | | — | | — | | 90.5 |
Trading Securities
The parent company held securities classified as trading. The fair value of these securities totaled € 906.8 million, € 1,503.9 million and € 3,032.3 million as of December 31, 2003, 2002 and 2001, respectively. The change in net unrealized gains and losses on these securities totaled € (24.1) million, € (1,003.2) million and € (981.4) million for the years ended December 31, 2003, 2002 and 2001, respectively.
Investment Company
The fair value of the investments held by the investment company totaled € 228.5 million, € 275.9 million and € 452.3 million as of December 31, 2003, 2002 and 2001, respectively. The change in net unrealized gains and losses on investments held by the consolidated investment company totaled € (9.6) million, € (88.7) million and € (0.7) million for the years ended December 31, 2003, 2002 and 2001, respectively.
28.2 Equity Method Investee Disclosures - Electrabel
In 2003, the Group increased its interest in Electrabel to 50.12%. Accordingly, Electrabel has been fully consolidated since January 1, 2003 for U.S. GAAP purposes.
F-106
Although the Group consolidated its investment in Electrabel during the year ended 2003, its investment in prior years was accounted for as an equity method investment and required the following additional disclosure for the years ended 2002 and 2001.
The Group received dividends from Electrabel amounting to € 334.4 million and € 306 million in 2002 and 2001, respectively.
The excess of the carrying value of the investment over the underlying equity in the net assets of Electrabel at the date of acquisition amounted to € 2,964.6 million and € 3,090.1 million as of December 31, 2002 and 2001 respectively. The difference is amortized over the useful lives of the underlying assets, excluding goodwill in 2002, over an average of 14 years.
The Group owned 24,791,164 and 23,594,400 shares of Electrabel as of December 31, 2002 and 2001, respectively. The market value of the investment was € 5,739.2 million, as of December 31, 2002.
Electrabel Consolidated Financial Data
The information provided below is in Belgian GAAP, as published by Electrabel. The principal adjustments required to conform these financial statements with French GAAP are the elimination of revaluation reserves related to fixed assets of the mixed inter-municipal companies, and the reclassification of Electrabel’s share in the result from the mixed inter-municipal companies to operating income.
| | | | |
| | | As of December 31
|
(in millions of €)
| | 2002
| | 2001
|
Consolidated Balance Sheets-Assets | | | | |
| | |
Formation expenses & other intangible assets | | 35 | | 58 |
Goodwill | | 1,295 | | 1,642 |
Tangible assets | | 4,277 | | 6,412 |
Financial assets | | 6,672 | | 4,874 |
| | |
| |
|
Total fixed assets | | 12,279 | | 12,986 |
| | |
| |
|
Other receivables after more than one year | | 454 | | 621 |
Stock | | 547 | | 587 |
Trade and other amounts receivable due within one year | | 2,759 | | 2,139 |
Short term investments | | 3,643 | | 1,438 |
Cash and cash equivalents | | 170 | | 229 |
Prepayments and accrued income | | 297 | | 178 |
Total other assets | | 7,870 | | 5,192 |
| | |
| |
|
Total assets | | 20,149 | | 18,178 |
| | |
| |
|
F-107
| | | | | | |
| | | For the years ended
December 31,
| |
(in millions of €)
| | 2002
| | | 2001
| |
Consolidated balance sheets-liabilities and shareholders’ equity | | | | | | |
| | |
Issued share capital | | 2,066 | | | 2,063 | |
Share premiums | | 902 | | | 891 | |
Reserves | | 2,142 | | | 1,811 | |
Shareholders’ equity | | 5,110 | | | 4,765 | |
Minority interests | | 1,954 | | | 2,066 | |
| | |
|
| |
|
|
Total shareholders’ equity | | 7,064 | | | 6,831 | |
| | |
|
| |
|
|
| | |
Provisions for liabilities and charges | | 5,053 | | | 4,883 | |
| | |
|
| |
|
|
| | |
Amounts payable after more than one year | | | | | | |
Financial debts | | 2,123 | | | 2,237 | |
Other amounts payable | | 358 | | | 368 | |
Amounts payable within one year | | | | | | |
Financial debts | | 138 | | | 80 | |
Current portion of amounts payable after one year | | 444 | | | 304 | |
Trade payables | | 1,822 | | | 1,470 | |
Taxes, payroll and social security | | 341 | | | 324 | |
Other amounts payable | | 1,107 | | | 1,067 | |
Accruals and deferred income | | 1,699 | | | 614 | |
| | |
|
| |
|
|
Total liabilities | | 13,085 | | | 11,347 | |
| | |
|
| |
|
|
Total shareholders’ equity and liabilities | | 20,149 | | | 18,178 | |
| | |
|
| |
|
|
| |
| | | For the years ended
December 31,
| |
(in millions of €)
| | 2002
| | | 2001
| |
Consolidated income statements | | | | | | |
Revenues | | 14,853 | | | 12,580 | |
Other operating revenues | | 237 | | | 136 | |
| | |
|
| |
|
|
Total revenues | | 15,090 | | | 12,716 | |
| | |
|
| |
|
|
Operating charges | | | | | | |
Purchases and changes in inventory | | 9,935 | | | 7,880 | |
Services and other goods | | 2,004 | | | 1,581 | |
Payroll, social security costs and pensions | | 1,557 | | | 1,514 | |
Net depreciation allowances and other provisions | | 717 | | | 804 | |
Provisions for liabilities and charges | | 172 | | | 256 | |
Other operating charges | | 123 | | | 106 | |
| | |
|
| |
|
|
Total operating charges | | 14,508 | | | 12,141 | |
| | |
|
| |
|
|
Operating income | | 582 | | | 576 | |
| | |
|
| |
|
|
Share in the result of Inter-municipal companies | | 447 | | | 434 | |
Other financial income | | 403 | | | 323 | |
Financial charges | | (299 | ) | | (254 | ) |
Total financial income | | 551 | | | 503 | |
| | |
|
| |
|
|
Share in pre-tax operating income of companies accounted for under the equity method | | 74 | | | 22 | |
Exceptional income | | 365 | | | — | |
Tax on profit | | (291 | ) | | (190 | ) |
| | |
|
| |
|
|
Consolidated income for the year | | 1,281 | | | 910 | |
Minority interests in income for the year | | 181 | | | 112 | |
Net income | | 1,100 | | | 798 | |
| | |
|
| |
|
|
F-108
| | | | | | |
| | | For the years ended
December 31,
| |
(in millions of €)
| | 2002
| | | 2001
| |
Cash flow statements | | | | | | |
| | |
Cash flows from operations | | 871 | | | 1,499 | |
Cash used in investing activities | | 499 | | | (270 | ) |
Cash from (used in) financing activities | | (6 | ) | | (217 | ) |
Changes in scope and translation adjustments | | 724 | | | 119 | |
| | |
|
| |
|
|
Total cash flows for the year | | 2,088 | | | 1,131 | |
| | |
|
| |
|
|
Less change in short-term investments and cash | | (2,146 | ) | | (834 | ) |
Change in short-term financial debts | | (58 | ) | | 297 | |
| | |
|
| |
|
|
28.3 Pension plans and other than pension benefits plans
In accordance with the laws and practices of each country, the Group participates in employee benefits pension plans offering death and disability, retirement and special termination benefits. Those plans provide benefits of various types from flat currency amounts per year of service to final pay plans integrated with social security and multi-employer plans.
For defined contribution plans, expenses correspond to the contributions paid. For defined benefit pension plans, accruals and prepaid expenses are determined using the projected unit credit method. Accruals and prepaid expenses are recorded in accordance with the prevailing accounting practice in each country. In some cases, adjustments to comply with Company’s rules have been made.
Special termination benefits are recorded on an accrual basis at the time the offer is accepted by the employees or their representatives.
The net accruals accounted for as December 31, 2003, 2002 and 2001 in the accompanying consolidated balance sheets can be compared with balances determined under U.S. GAAP as follows:
| | | | | | | | | | | | | | | | | | |
(in millions of €)
| | Pension benefits
| | | Other Benefits
| |
| | | 2003
| | | 2002
| | | 2001
| | | 2003
| | | 2002
| | | 2001
| |
Net amount accrued for under U.S. GAAP | | (1,490.8 | ) | | (689.0 | ) | | (613.3 | ) | | (498.3 | ) | | (361.0 | ) | | (466.4 | ) |
Impacts of transition obligation, of prior service cost and of actuarial gains recognized with a different timing under local regulations | | (95.1 | ) | | (150.8 | ) | | (121.6 | ) | | (87.2 | ) | | (44.4 | ) | | (61.8 | ) |
Minimum liability adjustments (MLA) | | 196.8 | | | 271.9 | | | 95.6 | | | — | | | — | | | — | |
Change in scope of consolidation | | (15.0 | ) | | (691.0 | ) | | (903.6 | ) | | (6.6 | ) | | (285.5 | ) | | (312.7 | ) |
Reclassification | | (0.6 | ) | | 36.5 | | | 30.4 | | | (0.6 | ) | | — | | | — | |
Net amount accrued for in consolidated financial statements | | (1,404.7 | ) | | (1,222.4 | ) | | (1,512.5 | ) | | (592.7 | ) | | (690.8 | ) | | (840.9 | ) |
Accrued | | (1,544.8 | ) | | (1,518.3 | ) | | (1,711.5 | ) | | (592.7 | ) | | (724.6 | ) | | (840.9 | ) |
Prepaid | | 140.1 | | | 295.9 | | | 199.0 | | | | | | 33.8 | | | | |
F-109
Amounts recognized in the statement of financial position:
| | | | | | | | | | | | | | | | | | |
| | | Pension Benefits
| | | Other Benefits
| |
(in millions of €)
| | 2003
| | | 2002
| | | 2001
| | | 2003
| | | 2002
| | | 2001
| |
Accrued benefit liability (including minimum liability adjustment) | | (1,611.1 | ) | | (983.8 | ) | | (883.7 | ) | | (498.3 | ) | | (394.8 | ) | | (466.4 | ) |
Prepaid benefit cost | | 120.3 | | | 294.8 | | | 270.4 | | | — | | | 33.8 | | | — | |
Net amount accrued for under U.S. GAAP | | (1,490.8 | ) | | (689.0 | ) | | (613.3 | ) | | (498.3 | ) | | (361.0 | ) | | (466.4 | ) |
Intangible assets | | 61.1 | | | 64.0 | | | 60.9 | | | N/A | | | N/A | | | N/A | |
Accumulated other comprehensive income | | 135.7 | | | 207.9 | | | 34.7 | | | N/A | | | N/A | | | N/A | |
Net amount recognized | | (1,294.0 | ) | | (417.1 | ) | | (517.7 | ) | | (498.3 | ) | | (361.0 | ) | | (466.4 | ) |
The projected benefit obligation, accumulated benefit obligation (ABO) and fair value of plan assets for the pension plan with accumulated benefit obligation in excess of plan assets were as follows:
| | | | | | | | | |
| | | 2003
| | | 2002
| | | 2001
| |
Projected Benefit Obligation | | (2,033.3 | ) | | (2,713.3 | ) | | (1,566.5 | ) |
Accumulated Benefit Obligation | | (1,742.4 | ) | | (2,121.0 | ) | | (1,407.7 | ) |
Fair Value of Plan Assets with ABO In excess of plan assets | | 996.1 | | | 1,485.9 | | | 632.6 | |
As for the new disclosure requirements of SFAS 132, the following information are for French plans only
| | | | | | |
| | | 2003
| | | 2002
| |
Projected Benefit Obligation | | (583.2 | ) | | (568.4 | ) |
Accumulated Benefit Obligation | | (490.8 | ) | | (504.3 | ) |
The estimated contributions to be paid to the plans during the next year is about € 11 million.
Pension plans & other postretirement benefit plans investment policies and strategies
When defined benefit plans are funded, the assets are invested through pension funds and/or insurance companies. The split between those two allocations are different for each plan depending on countries practices and investment risk. The investment strategy of the benefit plans seeks to maximize the return on investment while minimizing risk. The plans seek to achieve the following investment objectives:
| | • | Maintain sufficient income and liquidity to pay retirement benefits and other lump sum payments; and |
| | • | Achieve a long-term rate of return in excess of the required future returns. |
When the assets are invested through pension funds, the target allocation and the investment behavior are mostly imposed to the pension funds. For plans in France, when assets are invested through insurance companies, the insurance company manage the investment portfolio and generally guarantee a return rate on the assets. In these cases, the insurance company’s sole obligation is a fixed rate of return.
As for December 31, 2003 the overall target allocation for each major category of domestic plan assets is:
| | | |
Equity securities | | 10 | % |
Debt securities | | 75 | % |
Real estate | | 2 | % |
Other | | 13 | % |
F-110
Overall expected long-term rate of return on assets assumption determination
The rate of return have been based on the market conditions. For domestic plans, the expected rates return for the main categories of assets were determined as follows:
The debt securities rate is the 10-year government bond rate of return which was consistent with the actual rate of return for bonds indexed onto inflation at that time.
The equity securities rate includes a 3.3% risk premium over the debt securities rate.
The risk premium included in the real estate rate of return states for a medium risk premium between the equity securities and the debt securities rates, i.e. 1.8%.
See Note 19 for the overall rate of return and for the actual overall allocation percentages for each major category of plan asset.
28.4 Income taxes (SFAS 109)
The net deferred tax liabilities under U.S. GAAP are as follows:
| | | | | | | | | |
| | | As of December 31,
| |
(in millions of €)
| | 2003
| | | 2002
| | | 2001
| |
Deferred Tax Assets | | | | | | | | | |
Net operating losses and tax credit carryforwards | | 2,477.4 | | | 1,158.4 | | | 743.8 | |
Accrued liabilities | | 872.2 | | | 678.8 | | | 663.9 | |
Depreciation of property, plant and equipment | | 100.4 | | | 148.3 | | | 230.9 | |
Employee benefit commitments | | 579.3 | | | 409.0 | | | 384.6 | |
Other | | 961.9 | | | 1,046.4 | | | 773.2 | |
| | |
|
| |
|
| |
|
|
Total deferred tax assets | | 4,991.2 | | | 3,440.9 | | | 2,796.4 | |
| | |
|
| |
|
| |
|
|
Less valuation allowance | | (2,068.9 | ) | | (1,139.0 | ) | | (741.9 | ) |
Total net deferred tax assets under U.S. GAAP | | 2,922.3 | | | 2,301.9 | | | 2,054.5 | |
| | |
|
| |
|
| |
|
|
Deferred Tax Liabilities | | | | | | | | | |
Intangible assets | | (422.6 | ) | | (1,094.9 | ) | | (1,252.0 | ) |
Difference between tax and accounting values of fixed assets | | (662.3 | ) | | (1,618.2 | ) | | (1,821.7 | ) |
Accrued liabilities | | (443.1 | ) | | (414.1 | ) | | (491.0 | ) |
Tax-free reserves | | (430.9 | ) | | (126.8 | ) | | (73.3 | ) |
| | | |
Other | | (1,737.7 | ) | | (1,179.0 | ) | | (860.7 | ) |
Total deferred tax liabilities under U.S. GAAP | | (3,696.6 | ) | | (4,433.0 | ) | | (4,498.7 | ) |
| | |
|
| |
|
| |
|
|
Net deferred tax liabilities under U.S. GAAP | | (774.3 | ) | | (2,131.1 | ) | | (2,444.2 | ) |
| | |
|
| |
|
| |
|
|
Deferred income taxes under U.S. GAAP are summarized as follows:
| | | | | | | | | |
| | | As of December 31,
| |
(in millions of €)
| | 2003
| | | 2002
| | | 2001
| |
Current deferred tax assets | | 116.8 | | | 121.2 | | | 131.3 | |
Non-current deferred tax assets | | 780.6 | | | 519.0 | | | 519.8 | |
Current deferred tax liabilities | | (38.3 | ) | | (10.8 | ) | | (67.3 | ) |
Non-current deferred tax liabilities | | (1,633.4 | ) | | (2,760.5 | ) | | (3,028.0 | ) |
| | |
|
| |
|
| |
|
|
Net deferred tax liability | | (774.3 | ) | | (2,131.1 | ) | | (2,444.2 | ) |
| | |
|
| |
|
| |
|
|
F-111
The unrecognized deferred tax on undistributed earnings of certain French subsidiaries generated during or before December 31, 1992, which, under existing tax law, will not be subject to French income tax until distributed are not significant as of December 31, 2003, 2002 and 2001. Because those earnings have been or are intended to be indefinitely reinvested, no provision has been made for any taxes that may be applicable. It is not practicable to estimate the amount of unrecognized deferred income taxes on undistributed earnings of foreign subsidiaries.
28.5 Restructuring and Voluntary Terminations
Voluntary Termination Plans
As of December 31, 2003, the Group had € 102.8 million accrued for benefits to be paid as part of different voluntary termination benefit plans. This accrual relates to approximately 1,300 employees, primarily located in Belgium.
As of December 31, 2002, the Group had € 39.4 million accrued for benefits to be paid as part of different voluntary termination benefit plans. This accrual relates to approximately 600 employees, primarily in Puerto Rico and France.
As of December 31, 2001, the Group had € 50.5 million accrued for benefits to be paid as part of different voluntary termination benefit plans. This accrual relates to approximately 400 employees, primarily in France.
Other Restructuring Plans
As of December 31, 2003, the Group accrued € 115.8 million for various other restructuring plans within the Group. This accrual relates to approximately 1,100 employees. These other plans do not exceed individually € 17.1 million.
As of December 31, 2002, the Group had € 39.9 million accrued for other restructuring plans through the Group. These other plans do not exceed individually € 4 million.
Nalco plan
In connection with the 1999 acquisitions of Calgon Corporation and Nalco Chemical, the Group committed to a plan to close five Calgon facilities and six Nalco facilities, sever approximately 290 Calgon employees and 50 Nalco employees and terminate certain relationships with distributors and suppliers. The estimated total cost for these actions was € 46.2 million and was recorded as part of purchase accounting. The majority of the restructuring activities were completed in the year ended December 31, 2000. As of December 31, 2001, € 1.9 million remained in the reserve. This accrual has been wholly utilized in the year ended December 31, 2002.
Due to the consolidation of Electrabel in 2003, several additional plans are included in the Group’s restructuring reserve.
Changes in reserves for restructuring in 2003, 2002 and 2001 are as follows:
| | | | | | | | | |
(in millions of €)
| | 2003
| | | 2002
| | | 2001
| |
Restructuring reserves as of January 1, | | 79.3 | | | 77.2 | | | 105.7 | |
| | | |
Change in scope | | 136.0 | | | — | | | 15.9 | |
Additions | | 80.6 | | | 66.4 | | | 26.1 | |
Utilizations | | (70.5 | ) | | (52.2 | ) | | (45.0 | ) |
Reversal | | (27.2 | ) | | (3.8 | ) | | (1.0 | ) |
Other | | 20.4 | | | (8.3 | ) | | (24.5 | ) |
| | |
|
| |
|
| |
|
|
Restructuring reserves as of December 31, | | 218.6 | | | 79.3 | | | 77.2 | |
| | |
|
| |
|
| |
|
|
F-112
Additional disclosures regarding restructuring costs required for plans newly initiated during 2003 are summarized by major category of restructuring costs for December 31, 2003.
| | | | | | | | | | | | |
| | | Involuntary
Termination
Benefits
| | | Voluntary
Termination
Benefits
| | | Other
| | | Total
| |
Restructuring reserves as of January 1, 2003 | | — | | | — | | | — | | | — | |
Additions | | 33.9 | | | 17.6 | | | 11.5 | | | 63.0 | |
Utilizations | | (2.6 | ) | | (3.5 | ) | | (1.4 | ) | | (7.5 | ) |
Reversal | | — | | | — | | | — | | | — | |
Restructuring reserves as of December 31, 2003 | | 31.3 | | | 14.1 | | | 10.1 | | | 55.5 | |
| | |
|
| |
|
| |
|
| |
|
|
During December 31, 2003, the Group initiated an involuntary restructuring plan at certain businesses located in the Netherlands. The total cost accrued at December 31, 2003 was € 16.4 million and relates to the termination of 280 employees. This plan is expected to be completed in the second half of 2004 and relates to the energy segment.
Additionally, during 2003, the environment segment initiated a restructuring plan which concerns employees (lay-off’s, voluntary resignation), early retirement programs, and a notice of departure from a business premises. The total number of employee’s concerned is 171 (including 86 voluntary terminations) of which 86 remain to be terminated at December 31, 2003. The total cost of the restructuring plan is € 31 million. As of December 31, 2003 the remaining cost accrued was € 23.7 million.
The remaining plans represent other restructuring plans for the Group and individually do not exceed € 5.0 million.
28.6 Stock based compensation and employee stock plans
The stock incentive plans of the Group and its subsidiaries provide for the granting of stock options to officers and key employees and stock based compensation for all employees through stock purchase plans.
Under French GAAP, no compensation expense is recognized for the difference between the exercise price and market price at the date of grant for stock option plans, or for the discount on the shares issued under the stock purchase plans. The exercise price is recorded as an increase in paid in capital upon issuance of shares under stock option or stock purchase plans.
The following is a description of the stock option and stock purchase plans for the Group and certain of its subsidiaries:
The 2003 issued plans are as followed:
| | | | |
Group
| | Date of 2003 Grant
| | Comments
|
Suez | | November 2003 | | Stock option plan |
The company approved the granting of 7,831,970 stock options, for key employees with an exercise price of € 13.93 (the stock price at grant date was € 13.72). The vesting period is 4 years and options are thereafter exercisable over a period of 4 years.
F-113
Information relating to stock options granted/exercised/cancelled during 2003, 2002, and 2001 is summarized as follows:
(Prices in €)
| | | | | | | | | | | | | | | | |
| | | Suez
| | Elyo
| | Degrémont
| |
| | | Options
| | | Wtd. Avg
Exercise Price
| | Options
| | | Wtd. Avg
Exercise Price
| | Options
| | | Wtd. Avg
Exercise Price
| |
Balance, January 1, 2001 | | 28.958.760 | | | 28.84 | | 51,550 | | | 25.9 | | 36,550 | | | 67.6 | |
| | |
|
| |
| |
|
| |
| |
|
| |
|
|
Granted | | 13,795,800 | | | 34.81 | | | | | | | | | | | |
Exercised | | (1,182,397 | ) | | 14.28 | | (26,050 | ) | | 25.9 | | (36,050 | ) | | (67.6 | ) |
Cancelled | | (358,350 | ) | | 29.89 | | | | | | | | | | | |
| | |
|
| |
| |
|
| |
| |
|
| |
|
|
Balance, December 31, 2001 | | 41,213,813 | | | 31.25 | | 25,500 | | | 25.9 | | | | | | |
| | |
|
| |
| |
|
| |
| |
|
| |
|
|
Granted | | 8,991,847 | | | 17.67 | | | | | | | | | | | |
Exercised | | (362,032 | ) | | 14.69 | | (24,200 | ) | | 25.9 | | | | | | |
Canceled | | (395,950 | ) | | 31.56 | | (1,300 | ) | | 25.9 | | | | | | |
| | |
|
| |
| |
|
| |
| |
|
| |
|
|
Balance, December 31, 2002 | | 49,447,678 | | | 28.90 | | — | | | — | | — | | | — | |
| | |
|
| |
| |
|
| |
| |
|
| |
|
|
Granted | | 7,831,970 | | | 13.93 | | — | | | — | | — | | | — | |
Exercised | | (272,278 | ) | | 14.47 | | — | | | — | | — | | | — | |
Canceled | | (363,505 | ) | | 19.30 | | — | | | — | | — | | | — | |
| | |
|
| |
| |
|
| |
| |
|
| |
|
|
Balance, December 31, 2003 | | 56,643,865 | | | 26.96 | | — | | | — | | — | | | — | |
| | |
|
| |
| |
|
| |
| |
|
| |
|
|
Degremont and Elyo are subsidiaries of Suez, formerly listed and having granted, while listed, stock option to their employees. Since the minority interests buy out by Suez in 1997 the employees of Degremont and Elyo are no longer granted stock option of the subsidiaries but are eligible under certain conditions to Suez stock option plans.
The following table summarizes information for options outstanding and exercisable as of December 31, 2003:
| | | | | | | | |
Options Outstanding
| | Options Exercisable
|
Plan date
| | Exercise Price
| | Number
| | Remaining life
| | Number
|
Suez | | | | | | | | |
07/24/1996 | | 13.9 | | 656,907 | | 0.6 | | |
10/15/1996 | | 9.79 | | 205,796 | | 0.8 | | 656,907 |
11/16/1997 | | 17.5 | | 4,734,000 | | 1.9 | | 205,796 |
11/19/1998 | | 29.8 | | 4,745,250 | | 2.9 | | 4,734,000 |
06/30/1999 | | 32.4 | | 240,500 | | 3.5 | | 4,745,250 |
11/15/1999 | | 30.2 | | 4,944,000 | | 3.9 | | — |
01/31/2000 | | 30.1 | | 868,750 | | 4.1 | | — |
11/28/2000 | | 36.4 | | 6,343,250 | | 6.9 | | — |
12/21/2000 | | 37.8 | | 2,901,500 | | 7.0 | | — |
11/28/2001 | | 34.5 | | 12,815,250 | | 7.9 | | — |
11/20/2002 | | 17.67 | | 8,943,092 | | 8.9 | | — |
11/19/2003 | | 13.93 | | 7,831,970 | | 7.9 | | — |
| | | | |
Ex- Sita | | | | | | | | |
06/09/1998 (1) | | 25.21 | | 581,600 | | 2.4 | | |
05/26/1999 (1) | | 24.86 | | 832,000 | | 2.4 | | 581,600 |
| | | | | | | | | 832,000 |
| (1) | the exercise period has been extended when Sita merged with Ondeo during 2002. |
F-114
Compensation costs for each plan for each year are as follows:
| | • | Stock option plans ended December 31, 2003, December 31, 2002 and 2001 |
| | | | | | | | |
(in millions of €)
| | Date of grant
| | Compensation cost
2003
| | Compensation cost
2002
| | Compensation cost
2001
|
Suez | | 11/16/97 | | — | | 0.4 | | 6.3 |
Suez | | 11/16/98 | | 2.0 | | 4.1 | | 4.3 |
Suez | | 06/30/99 | | 0.1 | | 0.1 | | 0.1 |
Suez | | 11/15/99 | | 2.5 | | 2.5 | | 2.5 |
Suez | | 01/31/00 | | 0.1 | | 0.1 | | 0.1 |
Suez | | 11/28/00 | | 1.9 | | 1.9 | | 1.9 |
Suez | | 11/20/02 | | 0.6 | | 0.1 | | — |
| | |
| |
| |
| |
|
TOTAL Suez | | | | 7.2 | | 9.2 | | 15.2 |
Ex-Sita | | 06/09/98 | | — | | — | | — |
Ex-Sita | | 05/26/99 | | 0.2 | | 0.5 | | 0.5 |
TOTAL Ex-Sita | | | | 0.2 | | 0.5 | | 0.5 |
| | | | |
| |
| |
|
Total | | | | 7.4 | | 9.7 | | 15.7 |
| | | | |
| |
| |
|
On a bi-annual basis, the Group offers employees the opportunity to purchase shares at up to a 20% discount. The last grant of shares to employees occurred in 2002 and compensation cost related to this grant was recorded when the shares were purchased by employees.
| | | | |
(in millions of €)
| | Date of grant
| | Compensation cost
2002
|
Suez | | 07/10/02 | | 32.0 |
| | |
| |
|
TOTAL | | | | 32.0 |
| | |
| |
|
Information relating to Suez’ stock purchase plans are as follows:
| | |
| | | 2002
|
Number of shares | | 12,487,034 |
Weighted-average fair value at grant date (in Euros) | | 23.7 |
Had compensation expense for the Group’s stock options been recognized based on the fair value at the grant date under the methodology prescribed by SFAS 123, the Group’s net income and earnings per share for the year ended December 31, 2003, December 31, 2002 and 2001 would have been impacted as shown in the following table:
| | | | | | | | | |
| | | For the years ended
| |
(in millions of €, except per share data)
| | December 31,
2003
| | | December 31,
2002
| | | December 31,
2001
| |
Reported Net Income/(Loss), U.S. GAAP | | (2,302,6 | ) | | (3,168.7 | ) | | 896.3 | |
Stock-based employee compensation expense included in reported net income, net of related tax effects | | 7.4 | | | 41.7 | | | 15.7 | |
Total stock-based employee compensation expense determined under fair value based method for all awards, net of related tax effects | | (47.0 | ) | | (76.3 | ) | | (36.2 | ) |
Pro forma Net Income/(Loss), U.S. GAAP | | (2,342.2 | ) | | (3,203.3 | ) | | 875.8 | |
| | | |
Earning per share | | | | | | | | | |
| | | |
Basic — as reported | | (2.32 | ) | | (3.20 | ) | | 0.91 | |
Basic — pro forma | | (2.36 | ) | | (3.23 | ) | | 0.89 | |
Diluted — as reported | | (2.32 | ) | | (3.20 | ) | | 0.90 | |
Diluted — pro forma | | (2.36 | ) | | (3.23 | ) | | 0.88 | |
| | |
|
| |
|
| |
|
|
F-115
The fair value of options granted, which is amortized to expense over the option vesting period in determining the pro forma impact, is estimated on the date of grant using the Black&Scholes option-pricing model with the following assumptions:
| | | | | | | | | | | | | | | | |
2003
| | | 2002
| | | 2001
| |
Volatility
| | | Dividend
yield
| | | Volatility
| | | Dividend
yield
| | | Volatility
| | | Dividend
yield
| |
| 30.0 | % | | 6.27 | % | | 25.0 | % | | 4.4 | % | | 20.1 | % | | 2.11 | % |
|
| |
|
| |
|
| |
|
| |
|
| |
|
|
Risk free interest rates used are as follows:
| | | |
| | | Average interest rate
| |
2001 | | 4.78 | % |
2002 | | 4.47 | % |
2003 | | 4.17 | % |
| | • | Weighted average fair value of options granted during 2003, 2002 and 2001. |
In 2003, 2002 and 2001, the weighted average fair value at grant date of options granted during these periods were as follows:
| | | | | | |
Weighted average fair value/per share (in €)
| | 2003
| | 2002
| | 2001
|
Suez | | 2.22 | | 3.81 | | 4.78 |
| | |
| |
| |
|
28.7 Related party transactions
Rohatyn Associates LLC
In connection with the Ondeo Nalco sale in the United States, we deemed it necessary to hire consultants with an in-depth understanding of the US market and its business practices. We thus called upon Rohatyn Associates LLC, the consulting entity of Felix G. Rohatyn, our Director and a former partner of Lazard Bank, in order to evaluate the transaction and provide assistance in negotiations, in collaboration with other Group consultants (investment banks, lawyers, chartered accountants, etc.).
A related agreement was signed between us and Rohatyn Associates LLC. It was approved during our Board of Directors’ meeting held on July 9, 2003. The amount paid by us to Rohatyn Associates LLC with respect to this service amounted to $5 million.
Electrabel
Certain of the Group’s subsidiaries sell gas and other services to Electrabel and its subsidiaries (collectively, “Electrabel”). In relation to these activities prior to 2003 (when the Group began to consolidate Electrabel, see Note 26), the revenues recorded by the Group and subsidiaries totaled € 2,021.0 million and € 2,206.8 million for the years ended December 31, 2002 and 2001, respectively. Amounts due to the Group and its subsidiaries from Electrabel related to the sales of gas and other services were € 317.5 million and € 356.4 million as of December 31, 2002 and 2001, respectively. In 2002, Electrabel also purchased € 381.9 million of gas from a Group subsidiary for its energy trading business. In addition, the Group and its subsidiaries recorded payables to Electrabel of € 100.8 million and € 157.4 million as of December 31, 2002 and 2001, respectively.
Tractebel (a subsidiary of the Group) performs daily cash management services on behalf of Electrabel. The balance of the current account corresponds to the net position of the amounts advanced to or received from the Group by Electrabel at the period end. As of December 31, 2002 and 2001, the net balance payable to Electrabel of these accounts was € 1,710.8 million and € 1,295.7 million, respectively.
Cocetrel (a subsidiary of Electrabel) provided long-term operating loans to Group subsidiaries totaling € 1,058.2 million and € 1,081.7 million as of December 31, 2002 and 2001 respectively. Interest expense on these loans amounted to € 69 million and € 79.4 million during to 2002 and 2001 respectively.
F-116
Electrabel borrows money from another of the Group’s subsidiaries, Belgelec Finance, in order to finance its acquisitions. As of December 31, 2002 and 2001, the Group had notes receivable due from Electrabel of € 2,028.6 million and € 779.5 million, respectively, related to these activities. The receivables bear interest at market rates, and are due in the year 2004.
Fortis
Fortis B is one of the two parent companies of Fortis, which performs banking and insurance activities primarily in Belgium and the Netherlands. Since the unification of the Fortis security in 2001 and the launch of its listing on December 17, 2001, Fortis B is deconsolidated (see Note 26). The Group had entered into various long-term debt agreements with certain subsidiaries of Fortis. The debt agreements were at variable interest rates, ranging from 2.9% to 8.5%, and had varying due dates up to the year 2012. The balance outstanding under these agreements was € 405.9 million as of December 31, 2001. In addition, € 14.6 million, in borrowings under one of the above debt agreements was collateralized by a security interest in assets of one of the Group’s subsidiaries as of December 31, 2001.
The Group had also entered into various lines of credit agreements with certain Fortis subsidiaries and a group of banks owned up to 25% by Fortis. The lines of credit were at commercial terms and conditions and were renewable at various dates through the year 2003. The balance outstanding under the agreements was € 803.6 million as of December 31, 2001. Certain lines of credit contain covenants, including minimum equity requirements, significant changes in ownership, and other financial requirements. The Group was in compliance with all debt covenants as of December 31, 2001.
Net interest expense incurred related to the above borrowings was € 36.0 million for the year ended December 31, 2001.
The Group had time deposits with various subsidiaries of Fortis, which totaled € 104.2 million as of December 31, 2001 . Interest income related to these deposits totaled € 1.4 million for the year ended December 31, 2001.
Agbar
Agbar (a subsidiary of Hisusa) has given guarantees on the debt of three of the Group’s Argentine subsidiaries. The guarantees totaled € 119.4 million, € 135.0 million and € 171.2 million as of December 31, 2003, 2002 and 2001, respectively, and related mainly to the company Aguas Argentinas (€ 96.5 million, € 117.0 million and € 138.4 million as of December 31, 2003, 2002 and 2001 respectively).
Tiru
One of the Group’s subsidiaries has entered into a purchase contract with Tiru, an equity method investee of Elyo (a subsidiary of Tractebel). The contract gives the subsidiaries the right to purchase from Tiru, the steam (energy) resulting from the incineration of household waste by Tiru. Although there are no minimum purchase requirements under this contract, the subsidiaries must first purchase steam from Tiru before purchasing from any other supplier. The prices under the contract are determined using an index that is based mainly on the current prices of coal. Purchases under the contract for the years ended December 31, 2003, 2002 and 2001 totaled € 27.5 million, € 35.4 million and € 44.3 million, respectively. Payables due to Tiru were € 4.7 million, € 11.2 million and € 7.0 million as of December 31, 2003, 2002 and 2001, respectively.
Umicore
The Group has offered options to purchase 768,000 shares of Umicore (a subsidiary of Tractebel) to certain Umicore managers. The options can be exercised between January 1, 2002 and November 21, 2005 at prices ranging from € 40.20 to € 41.8. In 2003, Umicore managers excercised 69,700 options and 695,300 stock options were outstanding as of December 31, 2003.
F-117
ITASA
ITASA, an equity method investee of the Group, sold € 41.7 million, € 84.1 million and € 45.0 million as of December 31, 2003, 2002 and 2001 respectively, of electricity to Gerasul (a subsidiary of Tractebel energia) under a long term supply agreement. Payables due to ITASA were € 18.5 million and € 32.9 million as of December 31, 2003 and 2002, respectively. The Group has a receivable with ITASA of € 16.0 million as of December 31, 2003.
Electroandina
Gazoducto (a subsidiary of Tractebel Andino) sold gas under long term gas supply contracts to Electroandina, an equity method investee of the Group, for € 43.6 million, € 43.9 million and € 54.5 million in December 31, 2003, 2002 and 2001 respectively.
Elia System Operator (ESO) / Elia
Elia, a subsidiary of Elia System Operator (ESO), was created in June 21, 2001 to manage the high-voltage electricity transmission network in Belgium. The Belgian Federal Council of Ministers’ appointment to manage the transmission network was finalized on September 13, 2002. ESO and Elia are accounted for under the equity method. From the date of appointment, the official transmission system operator pricing are controlled by government regulation (CREG).
Electrabel paid to ESO/Elia, electricity transmission fees amounted to € 449.7 million in 2003. Payables due to ESO/Elia were € 126.6 million as of December 31, 2003. The Group sold € 122.8 million of services to ESO/Elia Receivables by ESO/Elia were € 8.2 million as of December 31, 2003.
Compagnie Nationale du Rhône (CNR)
During 2003, Energie du Rhône (joint subsidiary of Electrabel, 44%, and CNR, 51%) signed electricity purchase/sale contracts with CNR. The Group purchased € 109.6 million and sold € 33.6 million of electricity from/to CNR, as of December 31,2003. Payables due to CNR were € 20.4 million and receivables due from CNR were € 5.8 million as of December 31, 2003.
Inter-municipal companies
The Inter-municipal companies, equity method investee of the group, distribute gas and electricity produced by Electrabel and Distrigaz to Belgian non-industrial customers which do not qualify for deregulation. As of December 31, 2003, Electrabel sold € 1,814.7 million of electricity and gas to Inter-municipal companies. Electrabel and Electrabel Customer Solutions paid Inter-municipal companies € 944.2 million for electricity and gas distribution.
The Inter-municipal companies do not have staff of their own. In accordance with the by-law, Electrabel contributes the provision of its services, its skills and its experience in terms of distribution with a view to ensuring the daily running of the mixed Inter-municipal companies. All work, supplies and services required for the purpose of the mixed Inter-municipal companies are therefore performed by Electrabel and its staff and billed to the Inter-municipal companies. The expenditures billed in 2003 to the mixed Inter-municipal companies amounted to € 1,788.2 million.
All receivables from the Inter-municipal companies for electricity, gas and services amounted to € 361.5 million as of December 31, 2003.
As of December 31, 2003, Electrabel lends € 438 million to the Inter-municipal companies through cash advances.
F-118
Suez Lyonnaise Télécom (SLT)
SLT, equity method investee of the Group, has entered into a credit agreement with Suez, for a maximum amount of € 700 million. As of December 31, 2003, 2002 and 2001, the balance outstanding under this agreement was € 619.9 million, € 548.0 million and € 290.9 million, respectively. Interest income related to this facility totaled € 57.5 million, € 36.9 million and € 7.9 million for the years ended December 31,2003, 2002 and 2001, respectively.
28.8 Impairment of long-lived assets
Due to the situation in Argentina described in note 2.5, the Group in 2003 recognized impairment charge of € 30.4 million. This has been recorded in continuing operations.
As disclosed in note 24.1, the Group signed an agreement with its client, the Puerto Rico Aqueduct Sewer Authority (PRASA), on January 13, 2004 to terminate the Porto Rico contract as from April 2004. The group recorded an impairment of long-lived assets for € 26.7 million. Additionally, the Group also recorded certain other charges of € 58.3 million related to costs to be incurred in the context of the termination of this contract.
Furthermore, in January 2003, the Group announced the termination of the Atlanta contract during the first half of 2003. Hence as at December 31, 2002, the Group recorded an impairment of € 6.2 million related to a water Treatment Plant. Additionally, the Group also recorded certain other charges of € 58.8 million related to the discontinuation of activities under these contracts. As of December 31, 2003, the contract is terminated, and all the cost accrued in 2002 have been incurred.
Furthermore in January 2003, the Group announced its intention to terminate the activities under the Jakarta Contract in Indonesia. The Group has been experiencing losses under this contract and determined that the assets “held for use” related to the contract were impaired. In 2002, the Group recorded an impairment of € 53.2 million related to a water treatment plant and an accrual for other charges of € 9 million related to the discontinuation of activities under this contract. In 2003, as described in note 21, uncertainties remain over the negotiations outcome to enable the contract to meet sufficient profitability to recover current investment.
Under U.S. GAAP, these impairments are included in operating expenses.
28.9 Comprehensive Income
The following information is presented under French GAAP.
| | | | | | | | | |
| | | For the years ended December 31,
| |
(in millions of €)
| | 2003
| | | 2002
| | | 2001
| |
| | | |
Net income/(loss) | | (2,165.2 | ) | | (862.5 | ) | | 2,086.7 | |
| | |
|
| |
|
| |
|
|
Other comprehensive income, net of tax: | | | | | | | | | |
Changes in cumulative translation adjustment | | (547.8 | ) | | (1,803.3 | ) | | (119.4 | ) |
Goodwill | | 27.0 | | | 128.2 | | | 77.3 | |
Changes in accounting principles | | | | | (48.3 | ) | | 53.6 | |
| | |
|
| |
|
| |
|
|
Total | | (520.8 | ) | | (1,723.4 | ) | | 11.5 | |
| | |
|
| |
|
| |
|
|
| | | |
Total Comprehensive income/(loss) | | (2,686.0 | ) | | (2,585.9 | ) | | 2,098.2 | |
| | |
|
| |
|
| |
|
|
| | | |
Accumulated other comprehensive income, end of year: | | | | | | | | | |
Cumulative translation adjustment | | (2,238.8 | ) | | (1,691.0 | ) | | 112.3 | |
Goodwill | | (8,866.0 | ) | | (8,893.0 | ) | | (9,021.2 | ) |
Changes in accounting principles | | (482.8 | ) | | (482.8 | ) | | (434.5 | ) |
Accumulated other comprehensive income | | (11,587.6 | ) | | (11,066.8 | ) | | (9,343.4 | ) |
| | |
|
| |
|
| |
|
|
Deferred taxes are not calculated on cumulative translation adjustments and goodwill under French GAAP. The deferred tax impacts of the changes in accounting principles are disclosed in Notes 6 and 13.6.
F-119
28.10 Valuation and Qualifying Accounts
| | | | | | | | | | | | |
| | | As of beginning
of the year
| | Changes during year
| | | As of end of
the year
|
(in millions of €)
| | | | Additions
| | Utilizations
| | | Other
changes (*)
| | | |
For the year ended December 31, 2003 | | | | | | | | | | | | |
Accounts receivable | | 750.2 | | 226.5 | | (154.3 | ) | | (129.4 | ) | | 693.0 |
Inventories and work in-progress | | 137.6 | | 37.0 | | (22.2 | ) | | (46.8 | ) | | 105.6 |
| | |
| |
| |
|
| |
|
| |
|
For the year ended December 31, 2002 | | | | | | | | | | | | |
Accounts receivable | | 831.6 | | 250.3 | | (176.2 | ) | | (155.4 | ) | | 750.2 |
Inventories and work in-progress | | 124.1 | | 54.1 | | (60.4 | ) | | 19.9 | | | 137.6 |
| | |
| |
| |
|
| |
|
| |
|
For the year ended December 31, 2001 | | | | | | | | | | | | |
Accounts receivable | | 708.2 | | 332.4 | | (136.3 | ) | | (72.7 | ) | | 831.6 |
Inventories and work in-progress | | 86.5 | | 53.1 | | (41.4 | ) | | 25.9 | | | 124.1 |
| | |
| |
| |
|
| |
|
| |
|
| (*) | Other adjustments reflect changes in the scope of consolidation and translation adjustments. |
28.11 Statement of Cash Flows
Scope of Consolidation
As mentioned in Note 26.2.9, the consolidation method of Electrabel for years prior to 2003 and the use of proportionate consolidation for the joint ventures under French GAAP are adjusted under U.S. GAAP, for which Electrabel and the joint ventures are accounted for using the equity method. This difference would impact the consolidated statements of cash flows on a U.S. GAAP basis.
Electrabel (for 2002 and 2001) and the joint ventures accounted for using the proportionate method have the following contribution to the Group’s consolidated cash flows from operating, investing and financing activities, taking into account the above mentioned reclassifications:
| | | | | | | | | |
| | | For the years ended December 31,
| |
(in millions of €)
| | 2003
| | | 2002
| | | 2001
| |
Cash flows from operating activities | | 588.0 | | | 2,280.8 | | | 2,986.8 | |
Cash flows from investing activities | | (328.9 | ) | | (492.4 | ) | | (1,005.4 | ) |
Cash flows from financing activities | | (130.8 | ) | | 540.8 | | | (1,301.7 | ) |
28.12 Immaterial acquisitions
In 2003, the Group acquired 26 entities for a total cash cost of € 478 million. The significant acquisition included Acea Group and CNR. Goodwill recognized in those transactions amounted to € 215 million.
In 2002, the Group acquired 28 entities for a total cost of € 329 million, which was paid primarily in cash. US Water, Teris and Teris LLC were the most significant acquisitions.
Goodwill recognized in those transactions amounted to € 126 million.
28.13 Asset Retirement Obligations
The Group’s asset retirement obligations covered by SFAS 143 relate primarily to the removal or dismantlement of installations, primarily conventional and nuclear power stations, and contractual landfill rehabilitation commitments. On January 1, 2003, for U.S. GAAP reporting purposes, the Group adopted SFAS 143, Asset Retirement Obligation. SFAS 143 requires the Group to record the fair value of a legal liability
F-120
for an asset retirement obligation in the period in which it is incurred. Under French GAAP, the Group applied regulations CR0006 as of January 1, 2002, with respect to costs associated with dismantling installations, relating primarily to conventional and nuclear power stations. In accordance with this regulation, the Group records the discontinued value of the removal obligation. Under U.S. GAAP at December 31, 2003, 2002 and 2001, the Group had recorded liabilities of € 1,771.8 million € 415.1 million and € 403.9 million, respectively, related to asset retirement obligations. There are no assets that are legally restricted for purposes of settling the Group’s asset retirement obligations. Upon adoption of SFAS 143 on January 1, 2003, the Group recorded an additional liability of approximately € 247.7 million, a net asset of approximately € 163.8 million, and a cumulative effect of a change in accounting principle of approximately € (26.1) million, after income taxes. Amounts recorded related to asset retirement obligations during the years ended December 31, 2003 were as follows:
| | |
(in millions of €)
| | |
Balance at December 31, 2002 | | 415.1 |
Change in scope | | 1,035.1 |
Additional liability recorded from cummulative effect of accounting change | | 247.7 |
Accretion expense | | 62.9 |
Others | | 11.0 |
Balance at December 31, 2003 | | 1,771.8 |
Proforma net income/(loss), earnings/(loss) per share and liability for assets retirement obligations have not been presented for the years ended December 31, 2002 and 2001 because the proforma application of SFAS 143 to prior periods would result in proforma net income/(loss), earnings/loss per share and liability for assets retirement obligations not materially different from the actual amounts reported for those periods in the accompanying consolidated financial statements of operations.
28.14 Discontinued Operations
As described in note 2.3, the Group sold Ondeo Nalco in November 2003, which is included in the Suez Environment Industrial Services (SEIS) division. This division was included in the environment segment of the Group. In October 2003, the Group also sold Coditel and Codenet in the communications sector, which is included in other subsidiaries and affiliate segment. The results of operations from January 1, 2003 to the respective date of disposal of Ondeo Nalco, Coditel and Codenet have been eliminated from the Group’s ongoing operations, then the related results of operations for the current and prior periods, including any related impairments, are reflected as Discontinued Operations in the U.S. GAAP Consolidated Income Statement.
The amounts of revenue, pre-tax net (loss) revenue and net (loss) revenue from ONDEO Nalco, Coditel and Codenet included in discontinued operations are described below by segment :
Segment impact of discontinued operations
| | | | | | | | | | | | | | | | | | | | | | | | | |
| | | Environment (Nalco) As of December 31
| | | Other (Coditel, Codenet)
As of December 31
| | | Total As of December 31,
| |
| | | 2003
| | | 2002
| | 2001
| | | 2003
| | | 2002
| | | 2001
| | | 2003
| | | 2002
| | 2001
| |
Revenue | | 2 020,0 | | | 2 798,0 | | 2 946,1 | | | 52,1 | | | 61,4 | | | 57,9 | | | 2 072,1 | | | 2 859,4 | | 3 004,0 | |
Pretax (loss) income from discontinued operations(1) | | (601,9 | ) | | 272,8 | | (5,9 | ) | | (49,4 | ) | | (72,5 | ) | | (62,1 | ) | | (651,3 | ) | | 200,3 | | (68,0 | ) |
Net (loss) income from discontinued operations | | (662,7 | ) | | 151,1 | | 5,7 | | | (49,2 | ) | | (70,0 | ) | | (61,0 | ) | | (711,9 | ) | | 81,1 | | (55,3 | ) |
| (1) | includes the losses recognized on these disposals which amounted to € 742,7 million for Nalco and € 45 million for Coditel and Codenet. |
F-121
28.15 Guarantees
In accordance with FASB Interpretation N° 45 (FIN 45) “Guarantor’s Accounting and Disclosure Requirements for Guarantees, Including Indirect Guarantees of Indebtness of Others”, upon issuance or modification of a guarantee on or after January 1, 2003, the Group should recognize a liability at the time of issuance or material modification for the estimated fair value of the obligation it assumes under that guarantee. Refer to Note 20.1, 20.2 and 20.3 for disclosures related to off-balance sheet guarantees.
The Group records a liability for product warranty obligations at the time of the sale to a customer based upon historical warranty experience. The Group also records a liability for specific matters when they become known and reasonably estimable. The Group’s product warranty obligations are included in “Other reserves for contingencies and losses” in the consolidated balance sheet.
| | | | |
Balance, December 31, 2001 (in millions) | | € | 46,5 | |
Warranties issued during the period | | | 41,4 | |
Settlements made during the period | | | (32,5 | ) |
Changes in liability for pre-existing warranties during the period, including expiration | | | (2,0 | ) |
Change in scope | | | (0,3 | ) |
Other | | | (0,1 | ) |
Balance, December 31, 2002 | | € | 53,0 | |
Warranties issued during the period | | | 31,3 | |
Settlements made during the period | | | (19,3 | ) |
Changes in liability for pre-existing warranties during the period, including expiration | | | (4,6 | ) |
Change in scope | | | (0,2 | ) |
Other | | | 0,2 | |
Balance, December 31, 2003 | | | 60,5 | |
28.16 Recently Issued Accounting Pronouncements
EITF No. 01-08
EITF Issue No. 01-08, “Determining Whether an Arrangement Contains a Lease.” In May 2003, the EITF reached consensus in EITF Issue No. 01-08 to clarify the requirements of identifying whether an arrangement should be accounted for as a lease at its inception. The guidance in the consensus is designed to mandate reporting revenue as rental or leasing income that otherwise would be reported as part of product sales or service revenue. EITF Issue No. 01-08 requires both parties to an arrangement to determine whether a service contract or similar arrangement is, or includes, a lease within the scope of SFAS 13, “Accounting for Leases.” Upon application of EITF Issue No. 01-08, the accounting requirements under the consensus could affect the timing of revenue and expense recognition, and revenues reported as transportation and storage services may be required to be reported as rental or lease income. Should capital-lease treatment be necessary, purchasers of transportation and storage services in the arrangements would be required to recognize assets on their balance sheets. The consensus is being applied prospectively to arrangements agreed to, modified, or acquired in business combinations on or after January 1, 2004. Previous arrangements that would be leases or would contain a lease according to the consensus will continue to be accounted for as transportation and storage purchases or sales arrangements. The Group is in the process of determining the impact of the adoption of EITF Issue No. 01-08 effects on its consolidated results of operations, cash flows or financial position.
F-122
FIN 46
The Financial Accounting Standards Board (FASB) issued Interpretation No. 46 (“FIN 46”), “Consolidation of Variable Interest Entities,” in January 2003 and revised the Interpretation in December 2003 (“FIN 46R”). FIN 46 requires an investor with a majority of the variable interests (primary beneficiary) in a variable interest entity (VIE) to consolidate the entity and also requires majority and significant variable interest investors to provide certain disclosures. A VIE is an entity in which the voting equity investors do not have a controlling financial interest or the equity investment at risk is insufficient to finance the entity’s activities without receiving additional subordinated financial support from the other parties. FIN 46 was effective immediately for variable interest entities created after January 31, 2003. The Group will apply FIN 46 to entities created prior to February 1,2003 in 2004. With respect to entities created after January 31, 2003, the adoption of FIN 46 did not have a significant impact on the Group’s consolidated financial statements. The Group is in the process of evaluating the impact of the application of this Interpretation on the consolidated financial statements for entities created prior to February 1, 2003.
EITF No. 00-21
In November 2002, the EITF reached a consensus on issue No. 00-21 “Accounting for Revenue Arrangements with Multiple Deliverables” (“EITF 00-21”) on a model to be used to determine when a revenue arrangement involving the delivery or performance of multiple products, services and/or rights to use assets should be divided into separate units of accounting. Additionally, EITF 00-21 addresses if separation is appropriate, how the arrangements consideration should be allocated to the identified accounting units. EITF 00-21 will be applicable beginning in 2004. The company will adopt EITF 00-21 as of January 1, 2004 and is currently assessing its impact on its consolidated financial statements.
Recent IFRS Guidance
European Regulation requires that the Group adopt International Financial Reporting Standards (IFRS) as its primary GAAP by 2005. Currently, all of the IFRS accounting standards have not been finalized, nor is it clear whether all such standards will have been released and endorsed by the European Commission by the 2005 deadline. The eventual transition from French GAAP to IFRS will be made in compliance with IFRS 1, First-Time-Adoption of IFRS which provides guidance on retroactive application and outlines certain exemptions and exceptions. Based on proposed SEC regulations regarding the applicable periods to be presented under a comprehensive set of GAAP, the Group currently anticipates adopting January 1, 2004 as its transition date to IFRS, and thus to present restated 2004, and 2005 IFRS financial statements in its 2005 Form 20-F. However, based on current SEC regulations, the Group would be required to adopt January 1, 2003 as its transition date. In the meantime, the Group will continue to use French GAAP for its primary financial statements. the Group is currently assessing the impact, which could be significant, that the application of IFRS will have on its financial statements. Once all IFRS have been issued and endorsed by the European Commission and the transition date to IFRS is definitive, the Group will disclose as soon as practicable the impact of such application. Upon adoption of IFRS, the Group will disclose in its primary financial statements a reconciliation between French GAAP and IFRS (including narrative and net income and shareholders’ equity reconciliation for the applicable periods presented), as well as additional reconciliation disclosures between IFRS and US GAAP.
F-123