
Public Service Enterprise Group
NJ Utility Shareholder Group Meeting
Hasbrouck Heights, NJ
December 9, 2008

Forward-Looking Statement
Readers are cautioned that statements contained in this presentation about our and our subsidiaries’ future performance, including future
revenues, earnings, strategies, prospects and all other statements that are not purely historical, are forward-looking statements for purposes of the
safe harbor provisions under The Private Securities Litigation Reform Act of 1995. Although we believe that our expectations are based on
reasonable assumptions, we can give no assurance they will be achieved. The results or events predicted in these statements may differ
materially from actual results or events. Factors which could cause results or events to differ from current expectations include, but are not limited
to:
Adverse changes in energy industry, policies and regulation, including market rules that may adversely affect our operating results.
Any inability of our energy transmission and distribution businesses to obtain adequate and timely rate relief and/or regulatory approvals from
federal and/or state regulators.
Changes in federal and/or state environmental regulations that could increase our costs or limit operations of our generating units.
Changes in nuclear regulation and/or developments in the nuclear power industry generally, that could limit operations of our nuclear generating
units.
Actions or activities at one of our nuclear units that might adversely affect our ability to continue to operate that unit or other units at the same site.
Any inability to balance successfully our energy obligations, available supply and trading risks.
Any deterioration in our credit quality.
Availability of capital and credit markets at reasonable pricing terms and ability to meet cash needs.
Any inability to realize anticipated tax benefits or retain tax credits.
Increases in the cost of or interruption in the supply of fuel and other commodities necessary to the operation of our generating units.
Delays or cost escalations in our construction and development activities.
Adverse capital market performance of our decommissioning and defined benefit plan trust funds.
Changes in technology and/or increased customer conservation.
For further information, please refer to our Annual Report on Form 10-K, including Item 1A. Risk Factors, and subsequent reports on Form 10-Q
and Form 8-K filed with the Securities and Exchange Commission. These documents address in further detail our business, industry issues and
other factors that could cause actual results to differ materially from those indicated in this presentation. In addition, any forward-looking
statements included herein represent our estimates only as of today and should not be relied upon as representing our estimates as of any
subsequent date. While we may elect to update forward-looking statements from time to time, we specifically disclaim any obligation to do so,
even if our estimates change, unless otherwise required by applicable securities laws.
2

GAAP Disclaimer
PSEG presents Operating Earnings in addition to its Net Income reported
in accordance with accounting principles generally accepted in the United
States (GAAP). Operating Earnings is a non-GAAP financial measure that
differs from Net Income because it excludes the impact of the sale of
certain non-core domestic and international assets and material
impairments and lease-transaction-related charges. PSEG presents
Operating Earnings because management believes that it is appropriate
for investors to consider results excluding these items in addition to the
results reported in accordance with GAAP. PSEG believes that the non-
GAAP financial measure of Operating Earnings provides a consistent and
comparable measure of performance of its businesses to help
shareholders understand performance trends. This information is
not intended to be viewed as an alternative to GAAP information. The last
slide in this presentation includes a list of items excluded from Net Income
to reconcile to Operating Earnings, with a reference to that slide included
on each of the slides where the non-GAAP information appears.
3

PSEG Strategic Overview
Tom O’Flynn
Executive Vice President and Chief Financial Officer

PSEG’s diverse asset mix, operational excellence and strong
balance sheet …
… position it to provide value and benefit from multiple growth
opportunities.
Stable electric and gas
distribution and electric
transmission company
rated top quartile for
reliability, providing
service in mature
service territory in New
Jersey.
Major merchant
generation company with
13,487 MW* of base-
load, intermediate and
load-following capability
operating in attractive
Northeast markets with
operating control of
additional 2,000 MW of
capacity in Texas.
Redeployment of capital
through the sale of
international assets.
Focused on managing
Texas assets, lease
portfolio, modest
domestic PPA capacity
and potential investment
in renewable energy
development.
2007 Operating
Earnings:
$949M**
$115M**
$376M**
2008 Guidance:
$1,010M - $1,110M
$75M – $90M
$350M – $370M
** See page 19 for Items excluded from Net Income to reconcile to Operating Earnings
* Includes recent uprates at Hope Creek (150MW) and Salem 2 (23MW)
5

PSEG is well-positioned …
Regulatory contract for new peaking capacity in CT (in-service date 2012)
Potential to leverage existing brownfield sites
Compressed Air Energy Storage (CAES)
Garden State Offshore Energy exploring development of 350MW offshore wind farm (could be fully operational in 2013)
Capacity
Needs
Significant new transmission capital program to improve reliability
FERC approved request for cost of service formula rates for existing and future transmission investments effective October 1, 2008
Capital investment in coal fleet to meet environmental requirements
maintains critical infrastructure and expands capability
Infrastructure
Requirements
PSEG Power’s base-load nuclear assets well situated in carbon
constrained environment
RGGI auction provides guide for eventual Federal action
NJ releases Energy Master Plan (EMP)
PSE&G pursuing investments in energy efficiency and renewables
Climate
Change
… to capitalize on the challenges of the current business environment.
6

PSEG – 2008 Highlights
$3.35 billion of available liquidity; capital needs funded from internal
cash
Responding to challenging credit markets – capital expenditures for
2009 reduced by $275 - $325 million
Strong balance
sheet
SAESA and Bioenergie sale closed; reserve established for
potential lease liability
Ratings outlook for PSEG, PSE&G, and Holdings moved from
Negative to Stable
Improved risk
profile
NJ releases Energy Master Plan
FERC Transmission rate order effective October 1, 2008
FERC endorses Reliability Pricing Model
RGGI auction in September 2008 – price for carbon at $3.07/ton
Supportive
regulatory
environment
PSE&G honored as America’s Most Reliable Electric Utility
PSEG Power – Nuclear capacity factor at 93% YTD September 30
– Nuclear uprates yield 173MW of new capacity
Strong operating
performance
maintained
Maintaining 2008 guidance of $2.80 - $3.05 per share
Supporting lower half of 2009 earnings of $3.05 - $3.35 per share
Solid earnings
performance
7
Low-cost portfolio
Strong cash generator
Regional focus in competitive,
liquid markets
Assets favorably located
Many units east of PJM constraints
Southern NEPOOL/Connecticut
Near customers/load centers
80% of fossil capacity has dual-fuel
capabilities
Integrated generation and portfolio
management optimizes asset-
based revenues
… with numerous competitive advantages over the long-term.
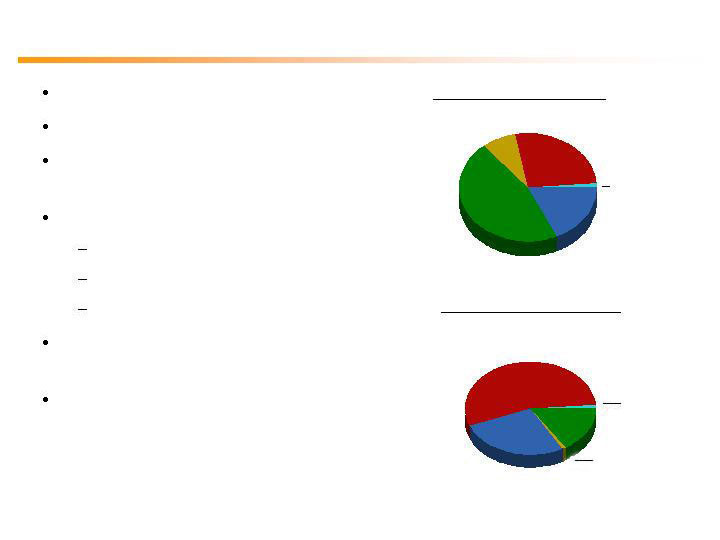
PSEG Power - right set of assets in right markets …
18%
46 %
8 %
27 %
Fuel Diversity – 2008
Coal
Gas
Oil
Nuclear
Pumped
Storage
1%
Energy Produced - 2007
54%
25%
19%
Oil 1%
Pumped
Storage
1%
Nuclear
Coal
Gas
Total GWh: 53,200**
Total MW: 13,487*
* Includes recent uprates at Hope Creek (150MW) and Salem 2 (23MW)
** Excludes 2,000MW of combined cycle generation in Texas under PSEG Power’s operating control.
8

Through its highly skilled workforce and disciplined capital
investments …
2008 National ReliabilityOne Award winner
– Winner in three of the last four years
Solid regulatory relationships on traditional
utility matters
NJ is ranked 2nd nationally in personal
income per capita
(0.2%)
1.6%
Historical Annual
Sales Growth
2003 - 2007
3,397M Therms
44,354 GWh
Electric Sales and Gas Sold
and Transported
LTM 9/30/08
0.2%
1.7 Million
Gas
0.5%
2.1 Million
Electric
Projected Annual
Sales Growth
2008 - 2012
Customers
1.3%
Historical Annual Peak Growth
2003-2007
10,654
Billing Peak (MW)
1,429
Network Circuit
Miles
1.4%*
Projected Annual Peak Growth
2008 - 2012
Electric and Gas Distribution Statistics (9/30/08)
Transmission Statistics (9/30/08)
… PSE&G has become a nationally recognized leader in delivering
safe and reliable service.
* to be updated in December, preliminary estimate of update is ~1.0%
9
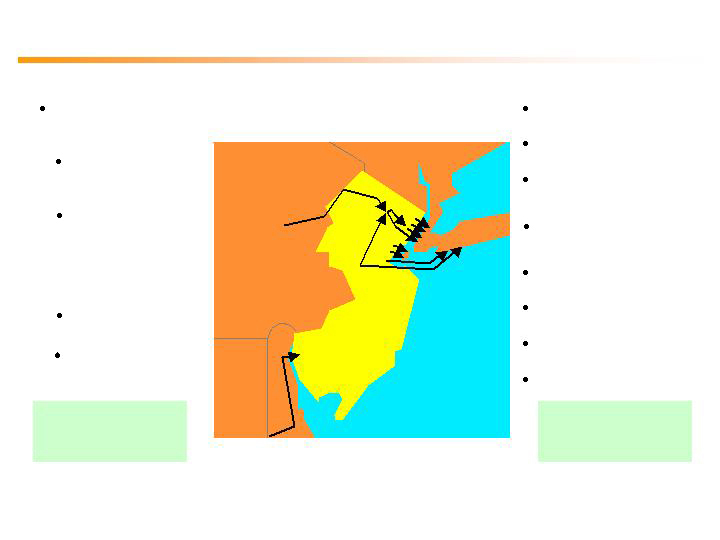
By 2018, NJ’s load is expected to grow by 4,000MW while net import
capability decrease by 1,300MW …
Projects to NY
The Neptune HVDC project (685 MW)
connecting Sayreville to Long Island
The Linden VFT project (330 MW)
connecting Linden to Staten Island
The Bergen O66 project (670 MW)
connecting Bergen to ConEd’s West
49th Street substation
The Bergen Q75 project (1,000 MW)
connecting Bergen to ConEd’s West
49th Street substation
U2-046 project (660MW) originating at
Roseland 500kV
U2-047 project (672) connecting Deans
500kV with Long Island
U2-077 project (300MW) originating at
Linden 230kV
U2-100 project (1,000MW) originating
at Bergen 230kV
Projects to NJ
PSEG’s evaluation of the
proposed backbone
transmission projects:
Northern 500kV route
into Jefferson and
Roseland
Southern 500kV route
into Salem
… indicating the need for additional generation, DSM or transmission
investments.
Total Import
Capability
~ 4,000 MW
Total Export
Capability
~ 5,317 MW
2008-2018 NJ Summer Peak
Annual Growth Rate = 1.8%
Sources: Imports: PSE&G Estimates; Exports: PJM 2008 Regional Transmission Expansion Plan; and Load Growth: PJM 2008 Load Forecast Report
Projects within NJ
Branchburg to
Roseland
Roseland to Hudson
10

FERC’s recent transmission formula rate order grants an 11.68%
ROE and fully-forecasted cost of service …
… creating an attractive investment environment for PSE&G’s
Transmission Capital Program.
Branchburg
Roseland
Jefferson
New Freedom
Smithburg
Deans
MAPP
Hope Creek
Salem
Project
Transmission Growth
Effective October 1, 2008, PSE&G is operating under
fully forecasted transmission formula rates
PJM approval was received for the Susquehanna to
Roseland line in October 2007
Siting and permitting process underway
FERC approved Incentive rate filing:
125 BPS adder to ROE
100% CWIP in Rate Base
Current cost estimate $750 million
FERC approval of Sub-Transmission to Transmission
system reliability investments represents about $375
million through 2012, post-2012 ~$60 million/year
Other approved RTEP projects ~$250 million also
contribute meaningfully to improved reliability and
earnings growth
Backbone projects are in various stages of
consideration/approval, but present real opportunity to
improve reliability throughout the state, with the
potential investment of ~ $1.5B through 2015
Hudson
11
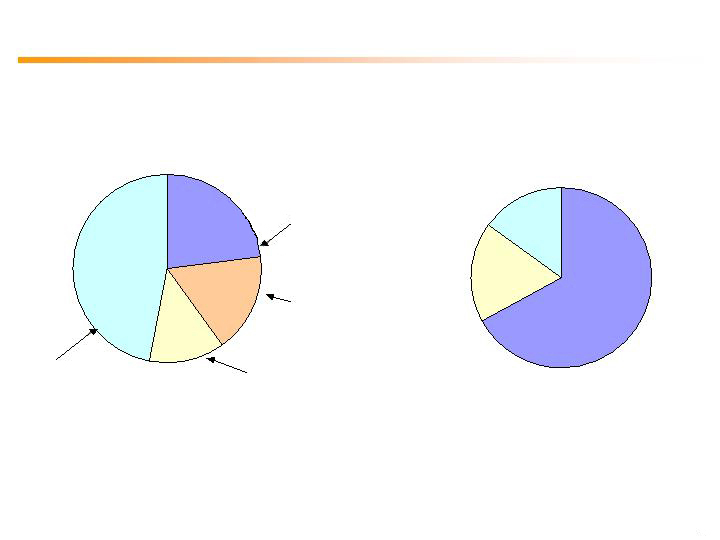
With the sale of international assets, Holdings is now focused …
… on its domestic generation assets, leveraged lease portfolio and
potential renewables development.
PSEG
Resources
47%
Chile & Peru
Distribution
Texas
Merchant
Generation
Other US
Generation
2007 Operating Earnings*
86% of the portfolio is
in energy-related
leveraged leases
2008 Guidance - Operating Earnings
13%
23%
17%
Texas
Merchant
Generation
67%
PSEG
Resources
15%
Other US
Generation
18%
~390MW owned in
CA, HI, NH
fully contracted
$ 115M
$ 75M - $90M
Two companies sold
and SAESA in Disc
Ops. in 2007
Two 1,000 MW CCGTs
1 in Central Texas (South Zone)
1 in West Texas
* See page 19 for Items excluded from Net Income to reconcile to Operating Earnings
12
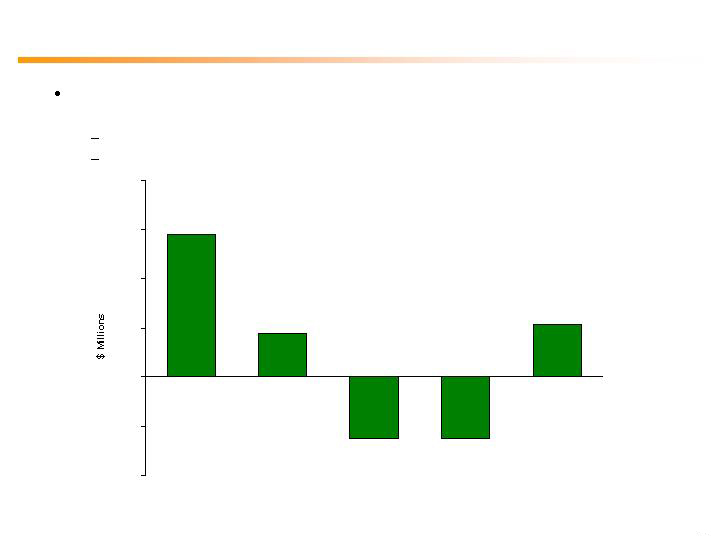
-40
-20
0
20
40
60
80
2007
2008E
2009E
2010E
2011E
PSEG Resources is managing its current investment portfolio …
… and earnings reflect potential resolution of tax matters.
PSEG Resources - Earnings Profile
Most of exposure related to cross border leases dealt with in 2nd quarter
2008.
$355 million charge to reflect potential changes to timing of tax cash flow.
$135 million increase to interest reserve.
$58
$15 -$20
($20) –
($30)
$15 - $25
(Net Income)
($20) –
($30)
13

2007 Operating Earnings*
2008 Guidance
2009 Guidance
$2.71
$2.80 - $3.05
On track to meet 2008 earnings guidance …
* See page 19 for Items excluded from Net Income to reconcile to Operating Earnings
9 Months YTD
Operating
Earnings:
$2.43*
$3.05 - $3.35
… but, potential increases in coal prices and pension / financing
costs may limit growth in 2009 to lower half of forecast range.
14

PSEG Liquidity as of October 31, 2008
Expiration
Total
Primary
Usage at
Available
Company
Facility
Date
Facility
Purpose
10/31/2008
10/31/2008
PSEG
5-year Credit Facility
Dec-12
$1,000
1
CP Support/Funding/LCs
$13
$987
Bilateral Credit Facility
Jun-09
$100
CP Support/Funding
$0
$100
Uncommitted Bilateral Agreement
N/A
N/A
Funding
0
N/A
PSE&G
5-year Credit Facility
Jun-12
600
2
CP Support/Funding/LCs
116
484
Uncommitted Bilateral Agreement
N/A
N/A
Funding
0
N/A
Energy
5-year Credit Facility
Jun-10
136
Funding/LCs
21
115
Holdings
Power
5-Year Credit Facility
Dec-12
1,600
3
Funding/LCs
205
1,395
Bilateral Credit Facility
Jun-09
100
Funding/LCs
0
100
Bilateral Credit Facility
Mar-09
150
Funding/LCs
48
102
Bilateral Credit Facility
Sep-09
50
Funding
50
0
Bilateral Credit Facility
Mar-10
100
Funding/LCs
24
76
Total
$3,836
$3,359
1
PSEG Facility reduces by $47 million in 2012
2
PSE&G Facility reduces by $28 million in 2012
3
Power Facility reduces by $75 million in 2012
($ millions)
15
$1.12
$1.14
$1.29
$1.17
2005
2006
2007
2008
2009E
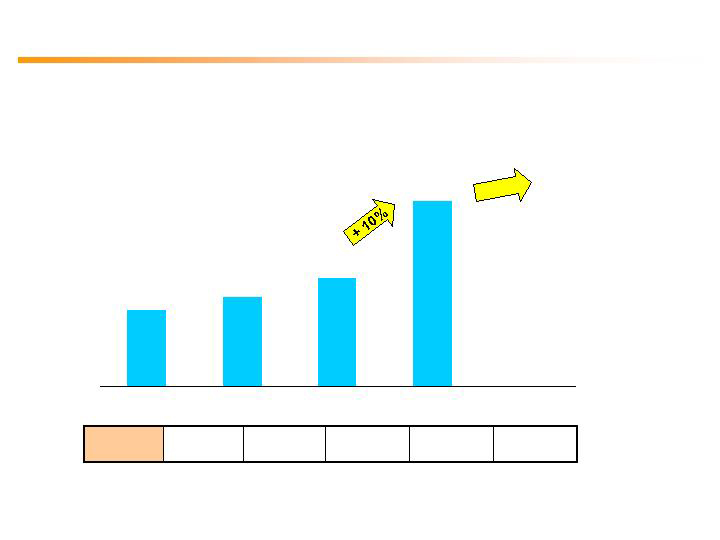
Our recent 10% dividend increase continues 100-year history of
paying common dividends.
A payout objective of 40 – 50% provides opportunity for growth
with earnings.
* Indicated annual dividend rate
*
44%
Payout
Ratio
40 – 50%
43%
66%
63%
?
Dividends per Share
16
Creating shareholder value for the long-term …
PSEG
S&P
Utilities
S&P 500
12.6%
10.1%
-1.4%
PSEG
S&P
Utilities
S&P 500
9.6%
3.2%
-0.9%
5-year Total Return*
10-year Total Return*
*Average monthly returns ending November 30, 2008
… has been and will continue to be our focus.
17

PSEG Value Proposition
PSEG is well-positioned in current business environment
Operational excellence efforts support:
Asset mix provides opportunities in attractive markets
Strengthened balance sheet supports capital investment
$3.35 billion available liquidity to support business
Return of cash to shareholders through dividends and share
repurchase provides discipline to investment process
maintaining reliability
controlling costs
providing value to the customer
18

Items Excluded from Net Income to Reconcile to Operating Earnings
Please see Slide 3 for an explanation of PSEG’s use of Operating Earnings as a non-GAAP financial measure and how
it differs from Net Income.
Nine Months
Nine Months
Ended
Year Ended
Ended
Year Ended
September 30,
September 30,
2008*
2007**
2008*
2007**
Lease Transaction Reserves:
(490)
$
-
$
(0.96)
$
-
$
Impact of Asset Sales:
Chilquinta & Luz Del Sur
(23)
-
(0.05)
Write down of Turboven
(7)
-
(0.01)
Premium on bond redemption
(1)
(28)
-
(0.06)
Total Impact of Asset Sales
(1)
$
(58)
$
-
$
(0.12)
$
Discontinued Operations:
208
$
16
$
0.41
$
0.03
$
*
As stated in Form 10-Q for the quarterly period ended September 30, 2008.
**
As stated in 2007 Form 10-K.
December 31,
December 31,
($ millions)
(EPS)
19