Exhibit 99

Public Service Enterprise Group
44th EEI Financial Conference
Hollywood, Florida
November 1-4, 2009

Forward-Looking Statement
Readers are cautioned that statements contained in this presentation about our and our subsidiaries' future performance, including future
revenues, earnings, strategies, prospects and all other statements that are not purely historical, are forward-looking statements for purposes of
the safe harbor provisions under The Private Securities Litigation Reform Act of 1995. Although we believe that our expectations are based on
reasonable assumptions, we can give no assurance they will be achieved. The results or events predicted in these statements may differ
materially from actual results or events. Factors which could cause results or events to differ from current expectations include, but are not
limited to:
Adverse changes in energy industry, law, policies and regulation, including market structures and rules, and reliability standards.
Any inability of our energy transmission and distribution businesses to obtain adequate and timely rate relief and regulatory approvals from
federal and state regulators.
Changes in federal and/or state environmental requirements that could increase our costs or limit operations of our generating units.
Changes in nuclear regulation and/or developments in the nuclear power industry generally, that could limit operations of our nuclear generating
units.
Actions or activities at one of our nuclear units that might adversely affect our ability to continue to operate that unit or other units at the same
site.
Any inability to balance our energy obligations, available supply and trading risks.
Any deterioration in our credit quality.
Availability of capital and credit at reasonable pricing terms and our ability to meet cash needs.
Any inability to realize anticipated tax benefits or retain tax credits.
Changes in the cost of or interruption in the supply of fuel and other commodities necessary to the operation of our generating units.
Delays or cost escalations in our construction and development activities.
Adverse investment performance of our decommissioning and defined benefit plan trust funds, and changes in discount rates and funding
requirements.
Changes in technology and increased customer conservation.
For further information, please refer to our Annual Report on Form 10-K, including Item 1A. Risk Factors, and subsequent reports on Form 10-Q
and Form 8-K filed with the Securities and Exchange Commission. These documents address in further detail our business, industry issues and
other factors that could cause actual results to differ materially from those indicated in this presentation. In addition, any forward-looking
statements included herein represent our estimates only as of today and should not be relied upon as representing our estimates as of any
subsequent date. While we may elect to update forward-looking statements from time to time, we specifically disclaim any obligation to do so,
even if our internal estimates change, unless otherwise required by applicable securities laws.

GAAP Disclaimer
PSEG presents Operating Earnings in addition to its Net Income reported
in accordance with accounting principles generally accepted in the United
States (GAAP). Operating Earnings is a non-GAAP financial measure that
differs from Net Income because it excludes the impact of the sale of
certain non-core domestic and international assets and material
impairments and lease-transaction-related charges. PSEG presents
Operating Earnings because management believes that it is appropriate
for investors to consider results excluding these items in addition to the
results reported in accordance with GAAP. PSEG believes that the non-
GAAP financial measure of Operating Earnings provides a consistent and
comparable measure of performance of its businesses to help
shareholders understand performance trends. This information is
not intended to be viewed as an alternative to GAAP information. The last
two slides in this presentation include a list of items excluded from Net
Income to reconcile to Operating Earnings, with a reference to that slide
included on each of the slides where the non-GAAP information appears.

PSEG Strategic Overview
Ralph Izzo
Chairman, President and Chief Executive Officer
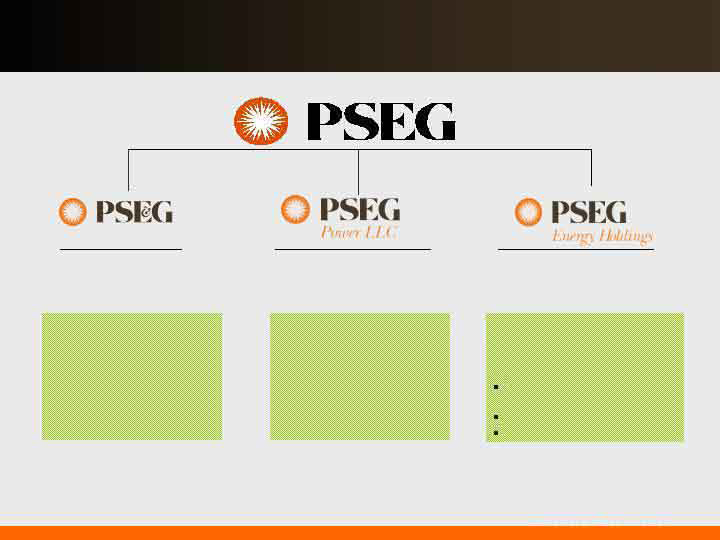
PSEG establishing a policy leadership position …
Electric and Gas
Delivery
Leveraged Leases and
Renewable Investments
Regional
Wholesale Energy
… in promoting a sustainable energy future.
PSE&G positioned to
meet NJ’s energy policy
and economic growth
objectives with $1.7
billion investment
program.
PSEG Power’s low-cost
baseload nuclear fleet
well-positioned in
carbon constrained
environment.
PSEG Energy Holdings
positioned to pursue
attractive renewable
generation opportunities.
Compressed Air Energy
Storage (CAES)
Solar
Offshore wind

Maintaining 2009 earnings guidance range
Operational excellence – focused on enhancing asset
performance and achieving cost efficiencies across the
enterprise
Integrated generation and portfolio management to
optimize asset-based revenues
Core business investments providing attractive returns
Sharpened business focus
Strengthened balance sheet
Attractive dividend yield
Meeting Commitments and Delivering Value
PSEG: Making decisions and achieving results…
… building a record that sets us apart.

A commitment to the future …
Established a new carbon reduction target – to reduce our
2005 carbon footprint by 25% by 2025.
Implementing and expanding our three-pronged strategy for
addressing climate change:
Energy Efficiency
Renewables
Clean central station generation, including nuclear
… building on a strong history of environmental leadership.

We have been active participants in re-shaping the nation’s
energy policy.
PSEG’s commitment is demonstrated by real actions:
Investing over $200 million to deliver energy efficiency
Investing over $600 million to develop solar energy,
reduce carbon and create jobs
Investing over $400 million to improve nuclear facilities
and develop clean power
Committing $100 million for an early site permit to build
new nuclear
Developing a 350 MW wind farm off the coast of southern
NJ
Strong climate policies are essential to support investment.
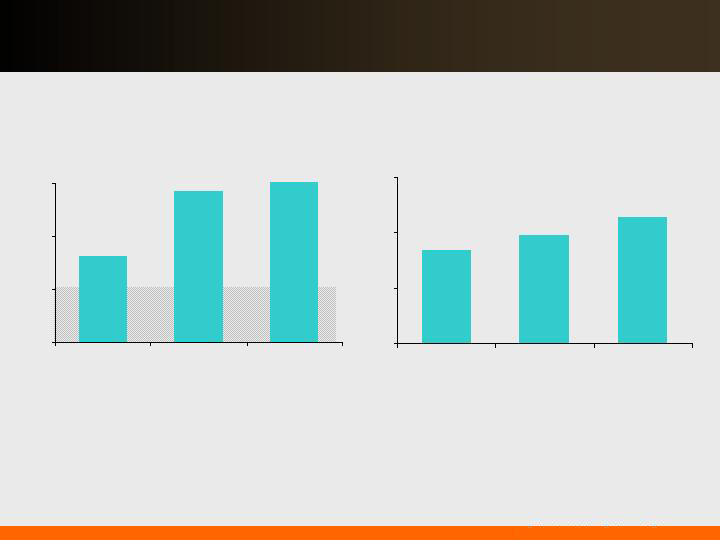
PSEG Power
Funds from Operations / Total Debt
PSE&G
Regulatory Equity Ratio
Improvement in key credit measures …
… provides support for planned investment program.
30%
35%
40%
45%
2007
2008
2009E
40%
45%
50%
55%
2007
2008
2009E

On track to meet 2009 earnings guidance…
… but, it will be difficult to meet upper-end of range.
* See page 62 for Items excluded from Income from Continuing Operations to reconcile to Operating Earnings.
** See page 63 for Items excluded from Income from Continuing Operations to reconcile to Operating Earnings.
$2.68
$3.00 - $3.25
$3.03
YTD 2009
Operating
Earnings*:
$2.50
2007 Operating Earnings**
2008 Operating Earnings**
2009 Guidance
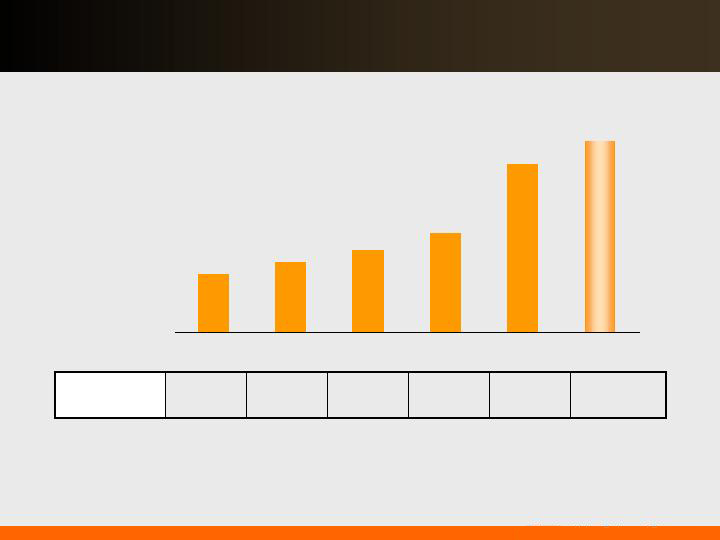
… continues 102-year history of paying common dividends.
70%
44%
Payout
Ratio
41% - 44%
43%
66%
63%
*Indicated annual dividend rate
*
Dividends per Share
Sixth consecutive annual increase in common dividend …
$1.10
$1.12
$1.33
$1.17
$1.29
$1.14
2004
2005
2006
2007
2008
2009E

Operational excellence, financial strength and disciplined investment…
… position us well in today’s market.
Operational excellence efforts support:
Reliability
Cost control
Customer value
Investing in core business initiatives at attractive risk
adjusted returns
Actively managing hedging portfolio in challenging markets
Maintaining strong balance sheet

PSEG Review and Outlook
Caroline Dorsa
Executive Vice President and Chief Financial Officer

Q3 Operating Earnings by Subsidiary
$ 477
(5)
25
97
$ 360
2008
$ 464
20
18
87
$ 339
2009
Operating Earnings
Earnings per Share
(0.01)
0.04
Enterprise
$ 0.94
$ 0.92
Operating Earnings*
0.05
0.04
PSEG Energy Holdings
0.19
0.17
PSE&G
$ 0.71
$ 0.67
PSEG Power
2008
2009
$ millions (except EPS)
Quarter ended September 30,
* See page 62 for Items excluded from Income from Continuing Operations to reconcile to Operating Earnings.

YTD Operating Earnings by Subsidiary
$ 1,229
(14)
104
284
$ 855
2008
$ 1,264
17
58
253
$ 936
2009
Operating Earnings
Earnings per Share
(0.03)
0.03
Enterprise
$ 2.41
$ 2.50
Operating Earnings*
0.20
0.12
PSEG Energy Holdings
0.56
0.50
PSE&G
$ 1.68
$ 1.85
PSEG Power
2008
2009
$ millions (except EPS)
Nine months ended September 30,
* See page 62 for Items excluded from Income from Continuing Operations to reconcile to Operating Earnings.

Low-cost portfolio
Regional focus in competitive, liquid
markets
Assets favorably located near
customers/load centers
Many units east of PJM
constraints
Southern NEPOOL/ Connecticut
Texas assets – low cost combined
cycle
Market knowledge and experience
to maximize the value of our assets
… with low cost plants, in good locations, within solid markets.
Power’s assets support commitments in a dynamic environment…
15%
52%
8%
24%
Fuel Diversity*
Coal
Gas
Oil
Nuclear
Pumped
Storage
1%
Energy Produced*
(Nine months ended September 30, 2009)
51%
15%
34%
Pumped Storage
& Oil <1%
Nuclear
Coal
Gas
Total GWh: 44,400
Total MW: 15,576
* Includes Texas

PSEG Power – Gross Margin Performance
Nine months ended
September 30,
$54
$64
In 2009, PJM total gross margin was sustained by lower costs to serve,
including strong performance of our nuclear fleet, which offset lower overall
demand
Low gas pricing resulted in gas displacing coal-fired generation
Regional Performance
$47
$67
$2,234
Gross
Margin ($M)
YTD 2009 Performance
Region
Low spark spreads, partially offset by
increase in gas-fired generation.
New York
Performance of Bridgeport Harbor
hurt by low energy prices and high
cost of coal.
New
England
Contribution to gross margin ($M) +11% versus year ago; strong nuclear production, higher contracted prices and decline in cost to serve offset 7.8% reduction in volumes and BGS customer migration.
PJM
PSEG Power Gross Margin ($/MWh)
Note: Excludes Texas
$0
$25
$50
$75
2008
2009

PSEG Power – Fuel Costs
159
338
Oil & Gas
80
130
Coal
20.00
32.40
$ / MWh
13,904
15,502
Total Generation
(GWh)
278
502
Total Fuel Cost
39
34
Nuclear
Total Fossil
($ millions)
239
468
2009
2008
Quarter ended
September 30,
PSEG Power – Fuel Costs
451
959
Oil & Gas
221
331
Coal
20.30
32.40
$ / MWh
38,576
42,771
Total Generation
(GWh)
782
1,386
Total Fuel Cost
110
96
Nuclear
Total Fossil
($ millions)
672
1,290
2009
2008
Nine months ended
September 30,
Note: Excludes Texas
Power’s hedging program provides near-term stability from
market volatility…
… while remaining open to long-term market forces.
Estimated EPS impact of
$10/MWh PJM West around
the clock price change*
(~$2/mmbtu gas change)
Contracted Capacity
Price
(right
scale)
* As of October 2009: Assuming normal market commodity correlation and demand
** Excludes Texas – No capacity market
Power has
contracted for a
considerable
percentage of its
future output
over the next two
years at
attractive prices.
The pricing for
most of Power’s
capacity has been
fixed through May
2013, with the
completion of
auctions in PJM
and NE.
% sold
(left
scale)
$0.40 - $0.70
$0.25 - $0.45
$0.10 - $0.20
Contracted Energy
Price
(right
scale)
% sold
(left
scale)
**
0%
25%
50%
75%
100%
2010
2011
2012
$0
$10
$20
$30
$40
$50
$60
$70
$80
$90
0%
25%
50%
75%
100%
2010
2011
2012
$0
$50
$100
$150
Delivering Value: Today and Tomorrow 19

Power’s hedging strategy secures pricing for near term output…
Sell expected nuclear and coal output forward over a two to three year horizon
Contract fuel to balance position
Buy gas as we sell output
Utilize liquid markets to manage risk
BGS annual recontracting opportunity; 3-year term mitigates volatility and
monetizes basis
Source contractual needs from market on opportunistic basis
BGS at maximum tranches is approximately 40-50% of Power’s coal and
nuclear output
Participation in the full requirements auctions supports margin
opportunity commensurate with market risk
Extension of developed skill set supports participation in adjoining
geographies within PJM
… which mitigates the impact of market movements on earnings.
Delivering Value: Today and Tomorrow 20
Hedging our generation assets to increase our gross margin opportunities…
… and reduce variability within market constraints.
PSEG Power's Generation Gross Margin
(Illustrative)
0%
10%
20%
30%
Gross Margin ($ M)
Generation at Market
Generation with Hedges
Increase in Full Requirements
Component Due to:
Increased Congestion (East/West Basis)
Increase in Capacity Markets/RPM
Volatility in Market Increases Risk
Premium
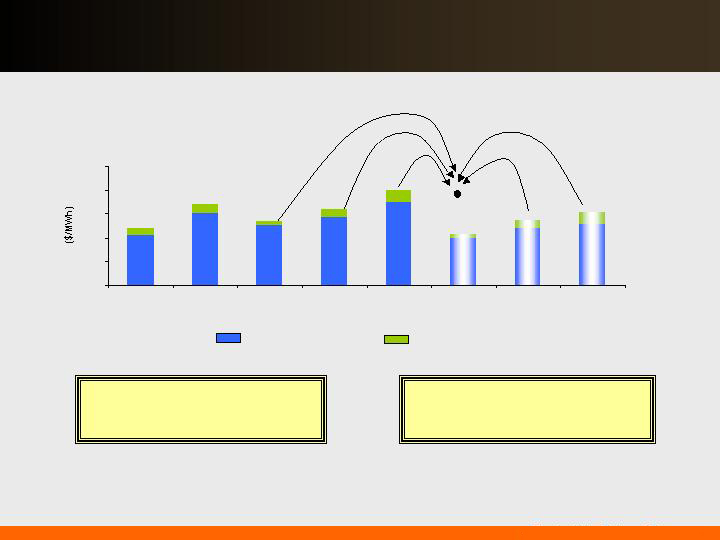
The BGS auction process...
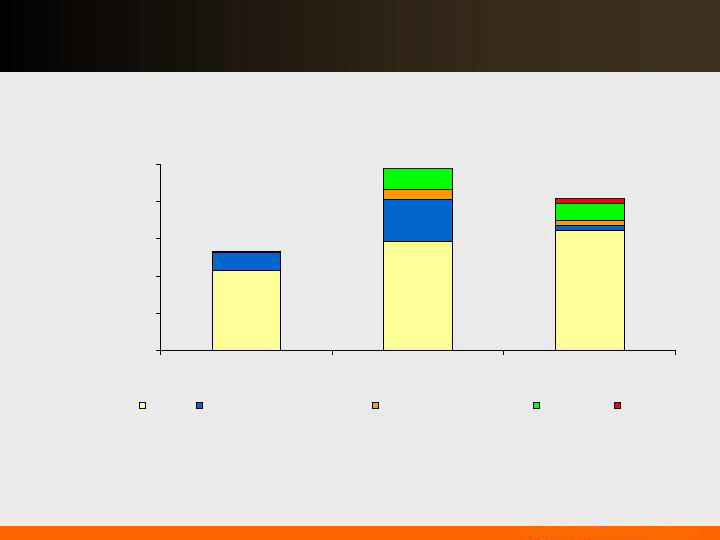
Market Perspective – BGS Auction Results
… cushions the impact of volatile markets on customers.
Note: BGS prices reflect PSE&G Zone
Full Requirements
3 Year Average
Round the Clock
PJM West
Forward Energy
Price
$55.05
$65.41
~ $18
~ $21
$102.51
~ $32
$98.88
~ $41
~ $43
$111.50
~ $47
$103.72
$55.59
~ $21
Capacity
Load shape
Transmission
Congestion
Ancillary services
Risk premium
Green
$33 - $34
$36 - $37
$44 - $46
$67 - $70
$58-$60
$68 - $71
$56 - $58
*2009 RTC price was ~ $50/MWh at time of auction
2003
2004
2005
2006
2007
2008
2009*
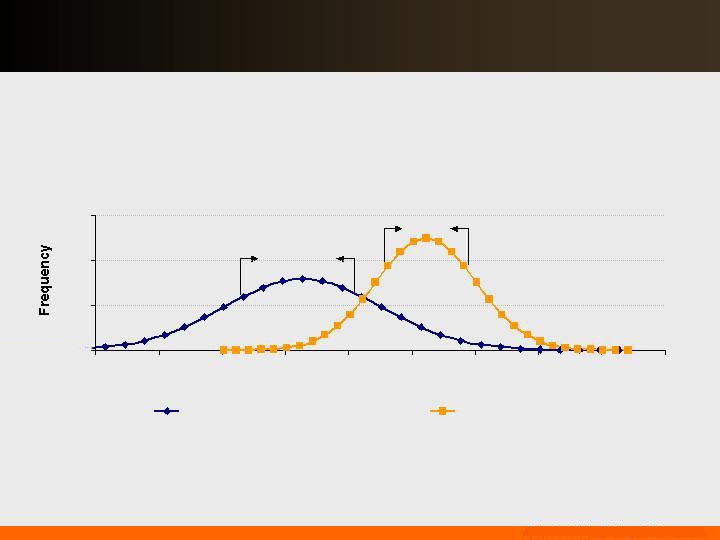
Recent market environment prompts BGS customer migration …
… while mid-term markets and rolling auctions should mitigate this
impact.
Historic high prices in recent past
Recent spot market well below past years’ levels
Creates incentive for customers to migrate
Difference represents loss of a portion of margin
per MWh
$0.04/sh impact to Power in Q3 2009
Short-Term
Medium-Term
Current forward pricing points to recovery
Eliminates incentive to migrate
Smaller loss of margin per MWh
Reduces overall impact to Power
Average BGS Rate
Historical Market Price at Peak
Current Forward Market Cost
Illustrative Forward Market Cost vs. BGS Rate
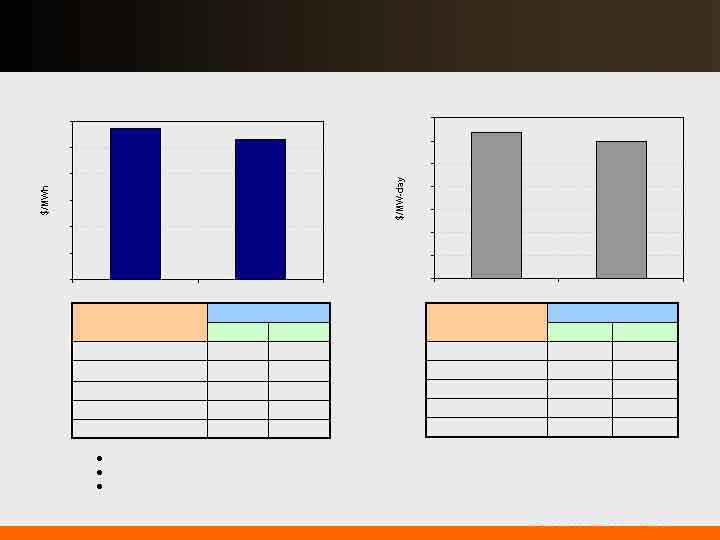
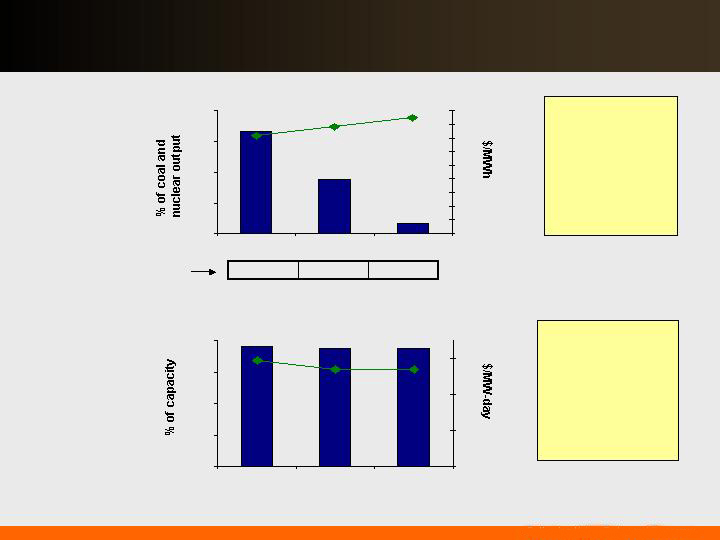
Major elements of BGS pricing have not varied greatly from last auction.
Other elements of BGS could have a moderate effect.
36 month RTC PJM-W Energy
Capacity
Risk premium – Market and capital risk
Market – depressed environment
Congestion
2010
2009
$149
$159
3-year average
$163
2012 / 2013
$110
$110
2011 / 2012
$174
$174
2010 / 2011
$191
2009 / 2010
BGS Auction
PS Zone RPM Prices
($/MW-day)
2010
2009
$53
$57
3-year average
$54
2012 / 2013
$53
$60
2011 / 2012
$51
$58
2010 / 2011
$52
2009 / 2010
BGS Auction
RTC PJM West ($/MWh)
0
10
20
30
40
50
60
2009
2010
0
25
50
75
100
125
150
175
2009
2010
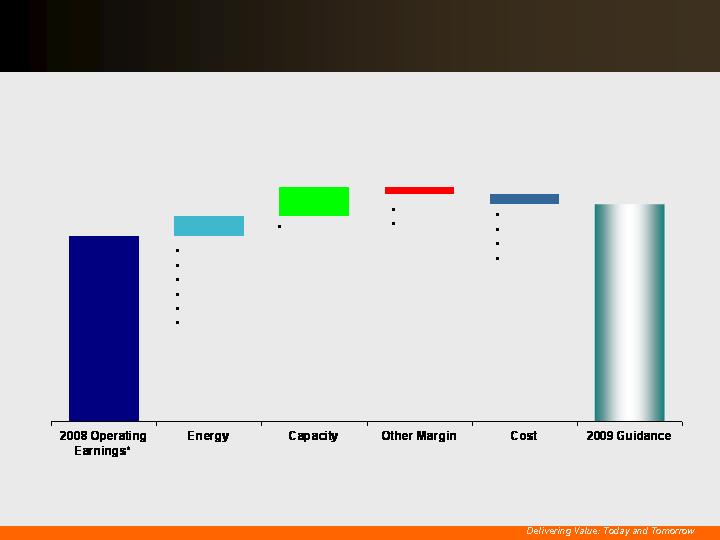
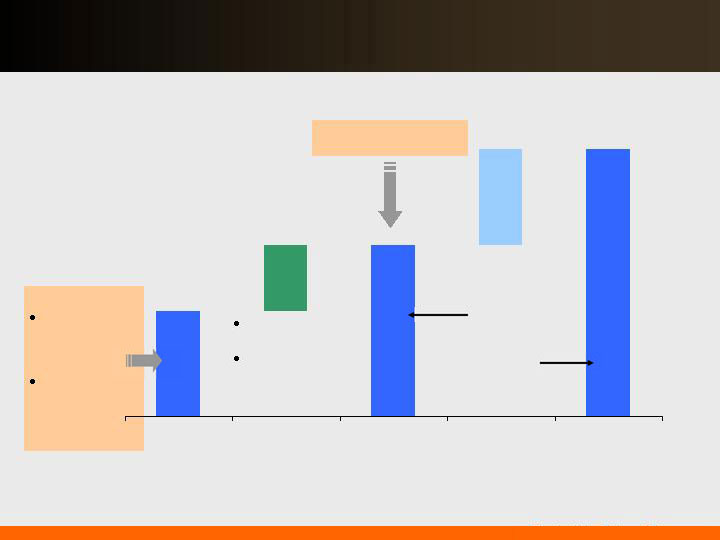
… with visible sources of value to achieve this result.
Power’s commitment in 2009 reflects continued earnings
growth …
$1,107M
$1,170 -
$1,245M
$90 – 95M
($25 – 15M)
$38– 88M
O&M (pension)
Depreciation
Interest
Other
($40 – 30M)
Power’s 2008 Operating Earnings vs 2009 Guidance
Operations
Uprates
BGS
Recontracting
Fuel
Texas
More capacity
open to auction
BGSS
Other
1
* See page 63 for Items excluded from Income from Continuing Operations to reconcile to Operating Earnings.

PSE&G’s current investment plan including the recently
approved NJ stimulus and EMP programs…
… now provides for growth in rate base of 13%.
PSE&G Rate Base
Electric Transmission
Electric Distribution
Gas Distribution
Energy Master Plan
2008
Rate Base $6.6B
Equity Ratio ~ 50%
2009
Rate Base $7.3B
Equity Ratio ~ 51%*
2010
Rate Base $8.6B
Equity Ratio ~ 51%*
2011
Rate Base $9.7B
Equity Ratio ~ 51%*
*Includes Solar Loan II, which is pending regulatory approval
34%
53%
13%
0%
33%
15%
1%
51%
31%
4%
16%
49%
28%
22%
5%
45%
PSE&G Annual Projected Capital Investments
($Millions)
PSE&G capital spending continues to grow through base
Transmission projects…
… and new initiatives developed to meet the State’s employment
and environmental goals.
0
400
800
1,200
1,600
2,000
2009
2010
2011
Base
Capital Infrastructure Stimulus
Energy Efficiency Stimulus
Solar 4 All
Solar II

PSE&G regulatory strategy…
Earn authorized returns
Minimize regulatory lag
Support state energy goals
Maintain/enhance local relationships
… designed to support customer and shareholder requirements.

New Jersey Electric & Gas Rate Case*
Filed:
May 29, 2009
6n6 Update:
September 25, 2009
Test Year:
2009
51.2%
Equity Ratio
11.5%
Return on Equity
*New Jersey BPU decision anticipated within 9-12 months.
$2.4 billion
$3.8 billion
Rate Base
$105.9 million
$147.0 million
Increase
Gas
Electric
Request
Includes tracking mechanisms for capital expenditures and pension costs.
Request as of the 6n6 update

$360M
$5 – 10M
$315 –
$335M
$10 - 15M
… increasing pension, depreciation and interest costs.
($45 - 40M)
($15 - 10M)
In 2009, controlling O&M helps to mitigate the effects of…
*See page 63 for Items excluded from Income from Continuing Operations to reconcile to Operating Earnings
2008 Operating
Earnings*
Weather
Transmission
Pension
Depreciation,
Interest and Other
2009 Guidance

PSEG Global focused on…
Renewables:
Solar:
A 2 MW DC facility was installed during 2009 and have an
additional 27 MW DC under contract for 2010 installation
for a total amount of $100M
Ongoing development and opportunity evaluation is
underway
Compressed Air Energy Storage (CAES) - Energy Storage &
Power joint venture:
Technology to optimize renewable energy sources and
power augmentation technology to improve the capacity of
combined cycle plants
Offshore Wind – Garden State Offshore Wind joint venture:
350 MW wind farm approximately 16 miles off the shore of
southern New Jersey
… identifying opportunities for renewable growth.

Resources is focused on maximizing the value of its current
investment portfolio…
Net Investment in lease portfolio of $0.3B as of
September 30, 2009.
Book investment of $1.7B less deferred taxes of $1.4B.
As of September 30, 2009 the remaining tax exposure
relating to LILO/SILO leases has been reduced to
approximately $780 million including interest.
Cash on deposit with IRS of $320 million.
Recent court decision – positive development in on-going
management of lease exposure.
… while reducing the potential IRS exposure on LILO/SILO leases.
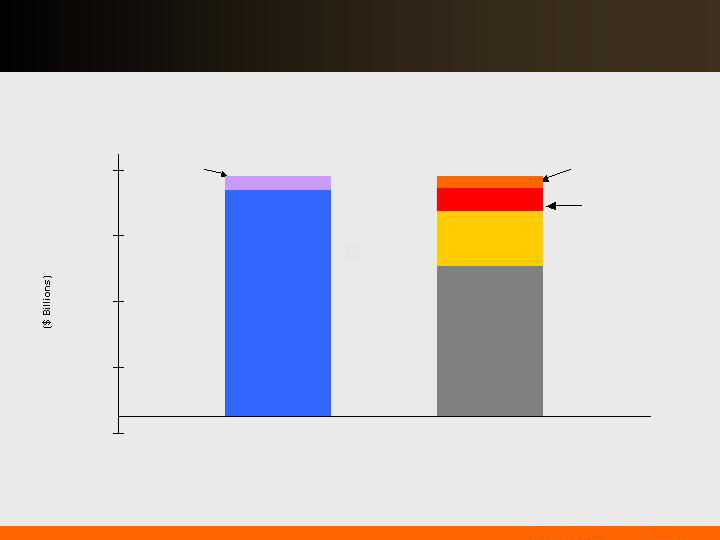
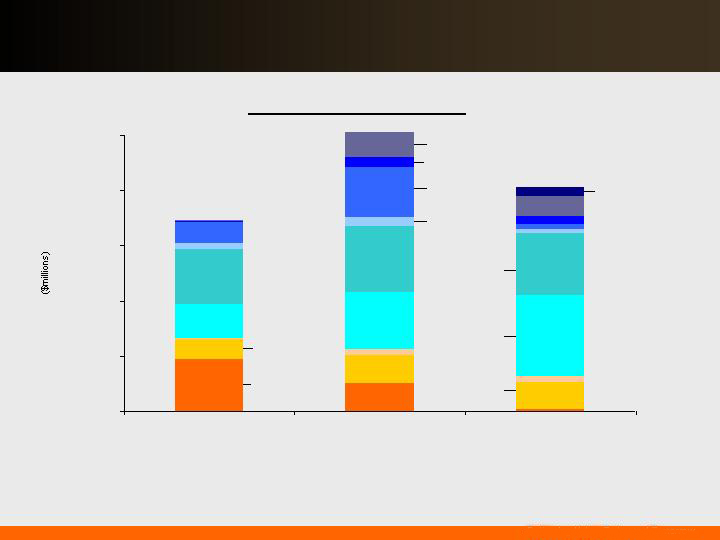
PSEG Consolidated
2009E Sources and Uses
Cash Ops*
(Non-GAAP)
Shareholder
Dividend
Investment
(includes
Nuclear
Fuel)
Net Asset Sales
Internally generated cash in 2009 is expected to exceed
investment needs.
* Cash Ops (Non-GAAP) represents Cash Ops adjusted for securitization principal repayment, taxes associated with asset sales, and IRS deposits.
IRS Deposit
Net Debt
Reduction
-$0.2
$0.6
$1.4
$2.2
$3.0
Sources
Uses

Our balance sheet has been strengthened …
… which provides us substantial financial flexibility.
(A) Long Term Debt (1+2+3+4) / Long Term Debt (1+2+3+4) + Equity (5)
% Long Term Debt (A)
35%
40%
45%
50%
9/30/09
12/31/08
September 30, 2009
December 31, 2008
Long-Term Debt Due
(1)
449
$
559
$
Project level, Non Recourse Debt Due
(2)
5
286
Securitization Debt Due
194
188
Total Long-Term Debt Due Within One Year
648
1,033
Total Commercial Paper and Loans
243
19
Long-Term Debt
(3)
6,326
6,621
Project level, Non Recourse Debt
(4)
39
42
Securitization Debt
1,201
1,342
Total Long-Term Debt
7,566
8,005
Preferred Stock
80
80
Total Common Stockholders' Equity
(5)
8,685
7,771
TOTAL CAPITALIZATION
17,222
$
16,908
$
PSEG Consolidated ($Millions)

Strong operations and risk controls…
… position us to meet challenges of today’s market.
Asset optimization yielding
results
7th successful BGS auction validates
hedging strategy
RPM capacity auction supports asset
values in constrained areas
Power’s dispatch profile provides
operating flexibility
PSE&G focused on reliability and
meeting energy goals
Organization focused on controlling
costs
Challenge to meet the
upper end of our $3.00 -
$3.25 per share operating
earnings guidance.
Investment focus on projects
with attractive risk-adjusted
returns
Infrastructure
Energy Efficiency
Solar

Positioned for the Future
Maintaining 2009 earnings guidance range
Operational excellence – focused on
enhancing asset performance and
achieving cost efficiencies in all
businesses
Integrated generation and portfolio
management optimizing asset-based
revenues
Core business investments providing
attractive returns
Sharpened business focus
Balance sheet strengthened
Attractive dividend yield
Balanced business mix
BGS: A demonstrated mechanism for
meeting customer supply at market prices
for multi-year period
Establishing a leadership position in
energy policy – Federal and State policies
provide opportunities for growth
T&D investments providing growth with
minimal rate impact
Attractive carbon footprint
Strong financial position and cash flow
provide flexibility in volatile markets – No
need to issue equity
Meeting Commitments and
Delivering Value
PSEG – Delivering Value: Today and Tomorrow

Appendix

PSEG Power
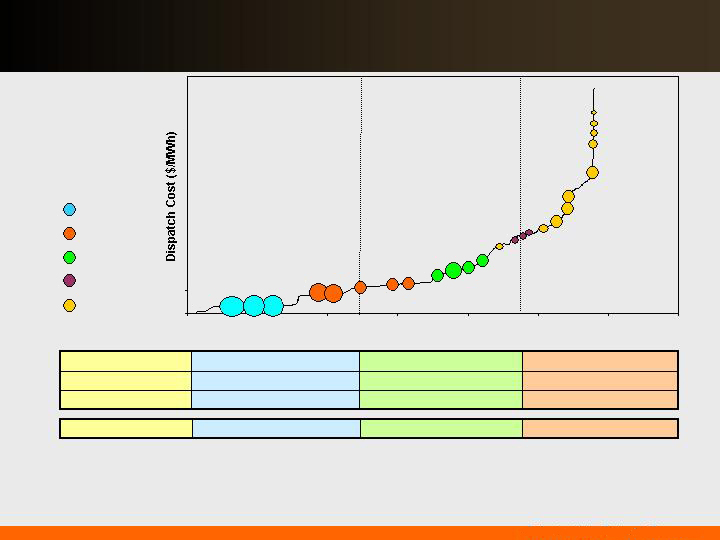
… of serving full requirement load contracts, while maintaining
optionality under a variety of conditions.
Power’s assets along the dispatch curve reduce the risk…
X
X
Ancillary Revenue
X
X
X
X
Capacity Revenue
X
X
Energy Revenue
X
X
Dual Fuel
Baseload units
Load following units
Peaking units
Illustrative
Salem
Hope
Creek
Keystone
Conemaugh
Hudson 2
Linden 1,2
Burlington 8-9-11
Edison 1-2-3
Essex 10-11-12
Bergen 1
Sewaren 1-4
Hudson 1
Mercer1, 2
Bergen 2
Sewaren 6
Mercer 3
Kearny 10-11
Linden 5-8 / Essex 9
Burlington 12 / Kearny 12
Peach
Bottom
Bridgeport
New
Haven
Nuclear
Coal
Combined Cycle
Steam
Peaking
BEC
Yards
Creek
National Park

Operated by PSEG Nuclear
PSEG Ownership: 100%
Technology:
Boiling Water Reactor
Total Capacity: 1,211MW
Owned Capacity: 1,211MW
License Expiration: 2026
Filed for license
extension, August 2009
Operated by PSEG Nuclear
Ownership: PSEG - 57%,
Exelon – 43%
Technology:
Pressurized Water Reactor
Total Capacity: 2,345MW
Owned Capacity: 1,346MW
License Expiration: 2016 and
2020
Filed for license
extension, August 2009
Operated by Exelon
PSEG Ownership: 50%
Technology:
Boiling Water Reactor
Total Capacity: 2,224MW
Owned Capacity: 1,112MW
License Expiration: 2033
and 2034
Hope Creek
Salem Units 1 and 2
Peach Bottom
Units 2 and 3
Our five unit nuclear fleet …
… is a critical element of Power’s success.
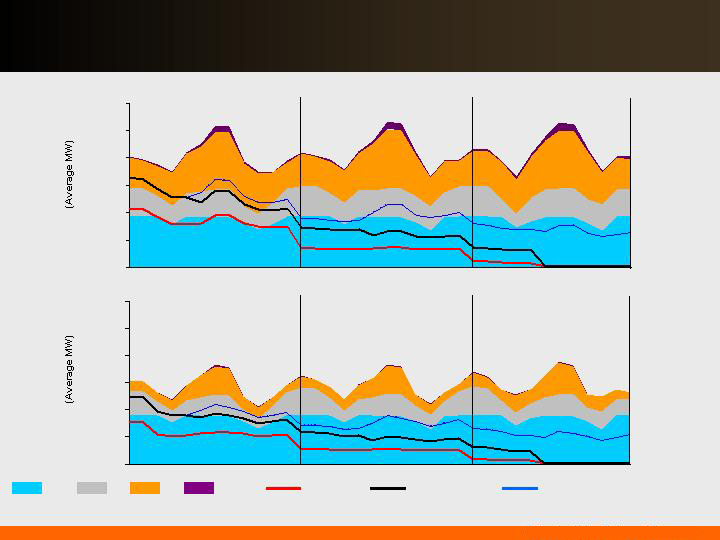
Power’s output is sold forward…
… through full requirement contracts and other hedging transactions.
2010 2011 2012
2010 2011 2012
Nuclear
Coal
CC
Steam / Pk
Existing Hedges
Existing Loads+ Hedges
Existing Loads+ Hedges + Potential Future BGS
Total Fleet On-Peak Average MW*
Total Fleet Off-Peak Average MW*
* Includes Texas
0
2,000
4,000
6,000
8,000
10,000
12,000
0
2,000
4,000
6,000
8,000
10,000
12,000
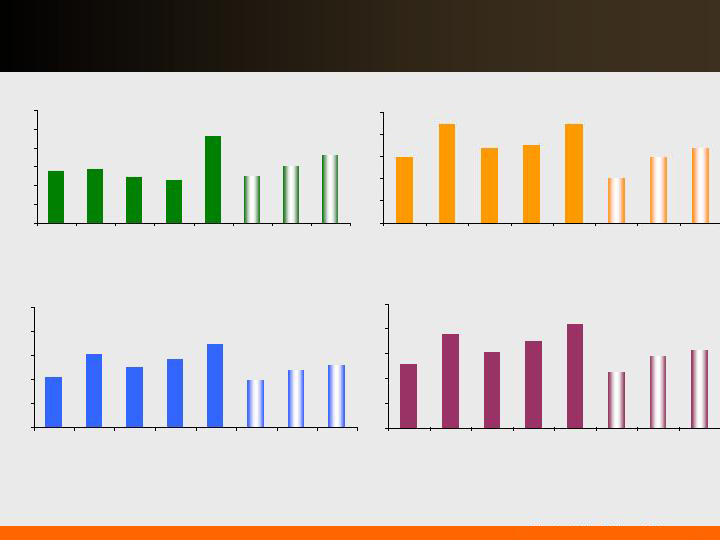
Commodity prices have been volatile…
*Average of 10 historical months and 2 forward months
… but Power’s diverse asset portfolio and hedging strategy has
mitigated the effect of volatility, providing strong results.
Henry Hub NYMEX
($/MMBTU)
Western Hub RTC
($/MWh)
West Hub On Peak
($/MWh)
Central Appalachian Coal
($/Ton)
Note: Forward prices as of October 2009
$0
$20
$40
$60
$80
$100
$120
2004
2005
2006
2007
2008
2009
Fwd*
2010
Fwd
2011
Fwd
$0
$2
$4
$6
$8
$10
2004
2005
2006
2007
2008
2009
Fwd*
2010 Fwd
2011 Fwd
$0
$20
$40
$60
$80
$100
2004
2005
2006
2007
2008
2009
Fwd*
2010
Fwd
2011
Fwd
$0
$20
$40
$60
$80
$100
2004
2005
2006
2007
2008
2009
Fwd*
2010
Fwd
2011
Fwd
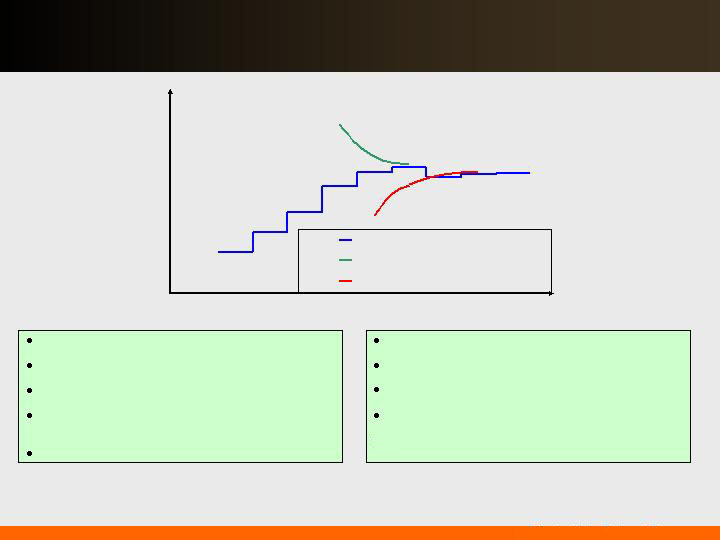
The effect of our hedging/forward sales strategy…
Power’s hedging strategy
secures pricing over a 2 - 3 year
future time horizon.
The 3 year BGS Auction period
has the effect of pulling forward
prices back.
… is to create a realized price that is a blend of prior and future pricing,
moderating volatility.
*PJM West Average of 10 historical months and 2 forward months
PJM West
PS Zone vs PJM West Basis
2009 realized
price
*
$0
$20
$40
$60
$80
$100
2004
2005
2006
2007
2008
2009 Fwd
2010 Fwd
2011 Fwd
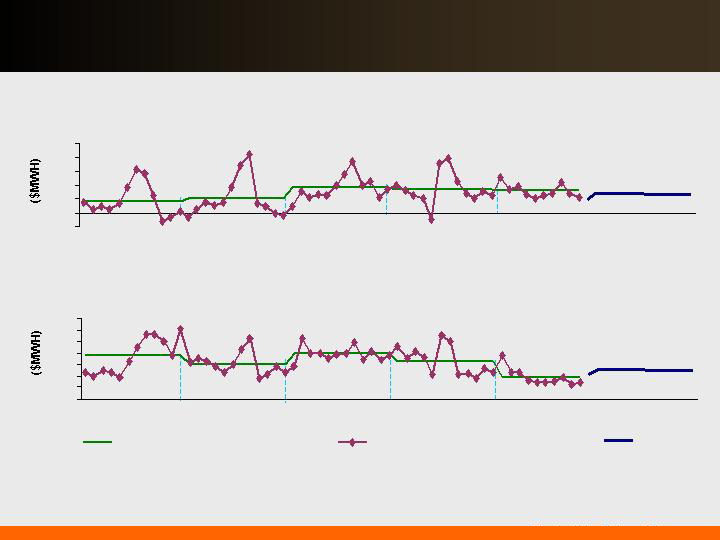
Note: Forward prices as of October 2009
Spark spreads are in line with rising historical averages…
PJM Western Hub Spark Spread (On-Peak – Henry Hub * 7.5 Heat Rate)
PJM Western Hub Dark Spread (RTC – Central Appalachian Coal * 10 Heat Rate)
… but near term dark spreads have declined in response to weak demand.
-$10
$0
$10
$20
$30
$40
$50
2005
2006
2007
2008
2009
2010
2011
$0
$10
$20
$30
$40
$50
$60
$70
2005
2006
2007
2008
2009
2010
2011
Annual Average
Historical Monthly
Forecast
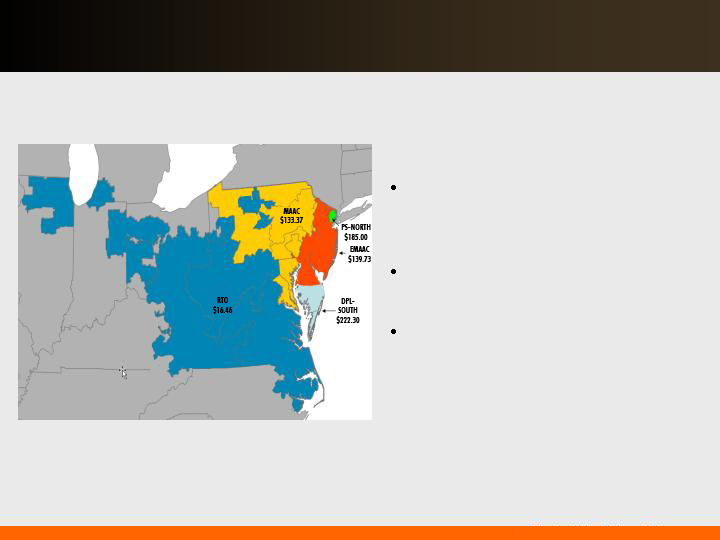
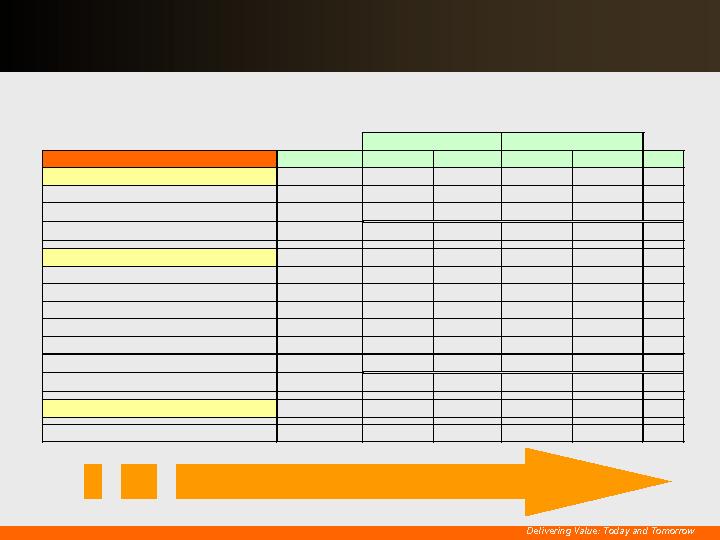
2012 / 2013 RPM Auction Results
PSEG Power’s assets are in
constrained zones, which
cleared at higher prices.
Power’s offer for 178MW of new
capacity was accepted by PJM.
Auction results reflect impact of
new transmission capability.
… Power expects to see continued strong margins from PJM’s
Reliability Pricing Model.
Through the new capacity construct, and pricing at auction
prices…
$185.00
PSEG North Zone
$16.46
$110.00
$174.29
$102.04
$111.92
$40.80
Rest of Pool
$133.37
$110.00
$174.29
191.32
MAAC
$139.73
$110.00
$174.29
$191.32
$148.80
$197.67
Eastern MAAC
2012 / 2013
2011 / 2012
2010 / 2011
2009 / 2010
2008 / 2009
2007 / 2008
PJM Zones
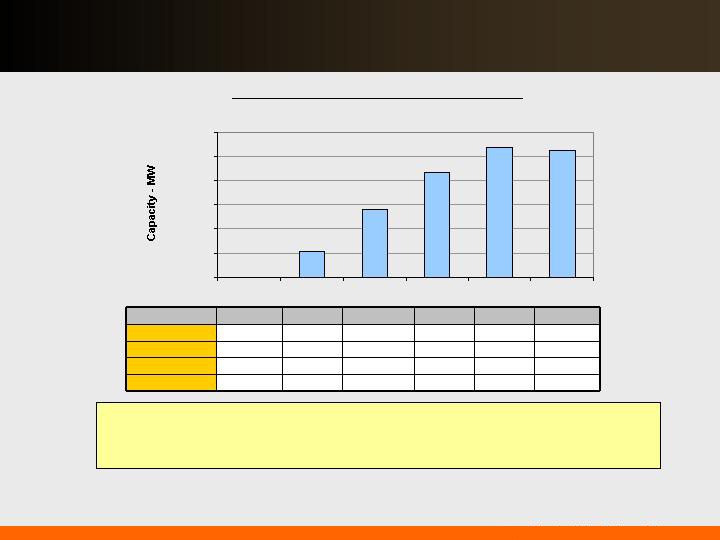
With nearly 1/3 of its capacity in PS North and nearly 2/3 of its capacity in
MAAC and EMAAC, Power’s assets in congested locations received higher
pricing in the 2012/2013 RPM Auction.
PJM Capacity Available to Receive Auction Pricing
0
2,000
4,000
6,000
8,000
10,000
12,000
07/08
08/09
09/10
10/11
11/12
12/13

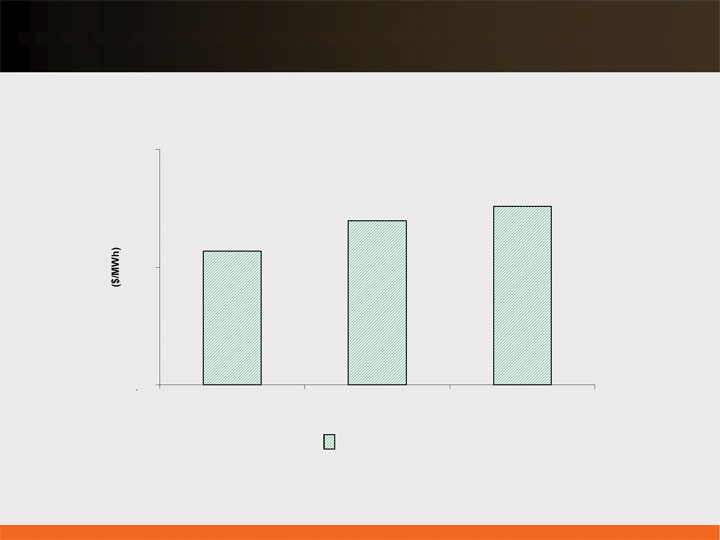
Power’s coal hedging strategy is matched up with generation…
…with hedged coal pricing aligned with coal output sold.
Anticipated Coal Cost
(Cost/MWh)
Hedged
Open
Mid $20’s
Mid $20’s
Low $40’s
Mid $40’s
To
High $30’s
Mid $40’s
Indicative
Pricing
($/MWh)
Prices lower,
moderating
Northern
Appalachian
Conemaugh
Prices lower,
moderating
Northern
Appalachian
Keystone
More limited
segment of
coal market
Metallurgical
Mercer
Flexibility after
BET in 2010
Adaro /
Domestic
Hudson
Higher price,
lower BTU,
enviro coal
Adaro
Bridgeport
Harbor
Comments
Coal Type
Station
$0
$10
$20
$30
$40
$50
2010
2011
2012
Anticipated Nuclear Fuel Cost
(Cost/MWh)
Power has hedged its nuclear fuel needs through 2012…
… with increased pricing over that time horizon.
Hedged
$0
$5
$10
2010
2011
2012

PSEG Texas projected EBITDA reflects …
… higher maintenance costs and market uncertainty.
Strong 2008 performance from favorable market in Spring 2008
For 2009:
Gross margin impact from new wind additions
Operations and maintenance costs approximately $15M higher in 2009 than 2007 as
plants enter periods of major maintenance
Longer-term:
Continued uncertainty from wind
Positive impact from transmission build-up.
45 – 55
40 – 45%
115 – 125
17%
~4.0
2009
PSEG
Market
214
162
$186
Gross
Margin
($M)
147
47.9%
14%
9.0
2008
104
48.7%
15%
6.9
2007
$130
54.4%
16%
$6.7
2006
EBITDA*
($M)
Capacity
Factors
Reserve
Margin
Nat. Gas
Henry Hub Spot
($/mmBtu)
*Excluding Mark-to-Market Accounting effects

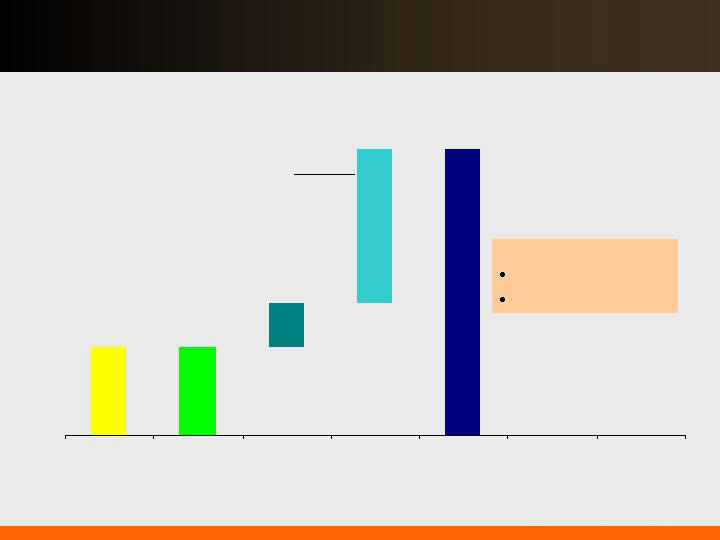
The implementation of carbon legislation will address the critical issue of
global warming…
~$12.00 - ~$14.00
100%
Total
$0.00
$0.00
0%
Nuclear
$4.80 - $3.60
$8.00
60%- 45%
Gas CC
$1.20 - $0.60
$12.00
10% - 5%
CTs
$6.00 - $10.00
$20.00
30% - 50%
Coal
Impact
$/MWh
On margin
(approximate)
Dispatch curve implication @ $20/ton*
By Fuel Type
$12.0
$18.0
$30.0
@$30
$8.0
$12.0
$20.0
@$20
$4.0
$6.0
$10.0
@$10
Price ($/MWh)
0.4
0.6
1.0
Carbon tons/MWh
CC
CTs
Coal
… and activity continues in the direction of a national program.
*For illustration purposes – potential impact of CO2 on power prices with current dispatch – not an indication of net effect on income.
**Includes Texas
PSEG Power Generation
Energy Produced**
(Nine months ended September 30, 2009)
51%
15%
34%
Pumped Storage
& Oil <1%
Nuclear
Coal
Gas
Total GWh: 44,400
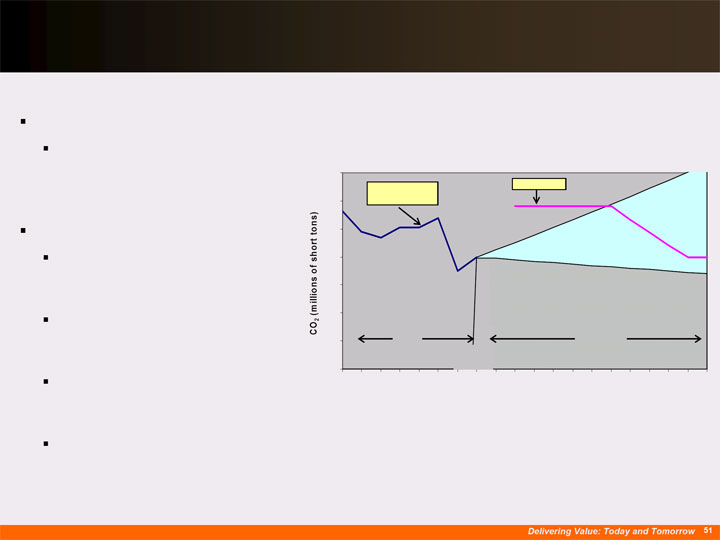
The RGGI cap on CO2 emission shows that headroom exists …
… compared to historical emission levels.
Affected Sources
Fossil-fired electric generating
units with a capacity of 25MW
and larger
Targets and Timing
Three-year compliance periods
with the first running from 2009-
2011
Stabilization of CO2 emissions at
recent levels through 2015
(~188 million tons per year)
Achieve a 10% reduction of CO2
emissions below recent levels by
2019
This translates into ~13%
reduction below 1990 levels or
~35% reduction from Business
as Usual (BAU) levels by 2020
CO
2
Emissions vs. RGGI Cap
(Actuals through 2007)
130
140
150
160
170
180
190
200
2000
2002
2004
2006
2008
2010
2012
2014
2016
2018
RGGI Cap
Projected
Actual &
Forecast CO
2
Actual

PSE&G

Transmission Growth
PJM approved the $750M Susquehanna to
Roseland line in October 2007
Siting and permitting process underway
Incentives approved by FERC:
ROE: 12.93% (125 basis point adder)
100% CWIP in Rate Base
FERC approval of Sub-Transmission to
Transmission system reliability investments
represents about $340M through 2011, post-2011
~$60M per year
Other approved RTEP projects ~$250M also
contribute meaningfully to improved reliability and
earnings growth
PJM approved the Branchburg-Roseland-Hudson
line in November 2008. PSE&G filed with FERC for
incentive ROE adder of 150 bps in this $1.1B
project; estimated in-service date of June 2013
These opportunities will require substantial deployment of capital with siting
and permitting as the major challenges.
Branchburg
Roseland
Jefferson
New Freedom
Smithburg
Deans
MAPP
Hope Creek
Salem
Project
I-765
Interstate
Project
PSE&G implemented fully-forecasted formula rates with an 11.68%
base ROE, which provides attractive current return on investments.
RTEP approved; subject to siting approval
Based on tariff rates in effect in March 2009.
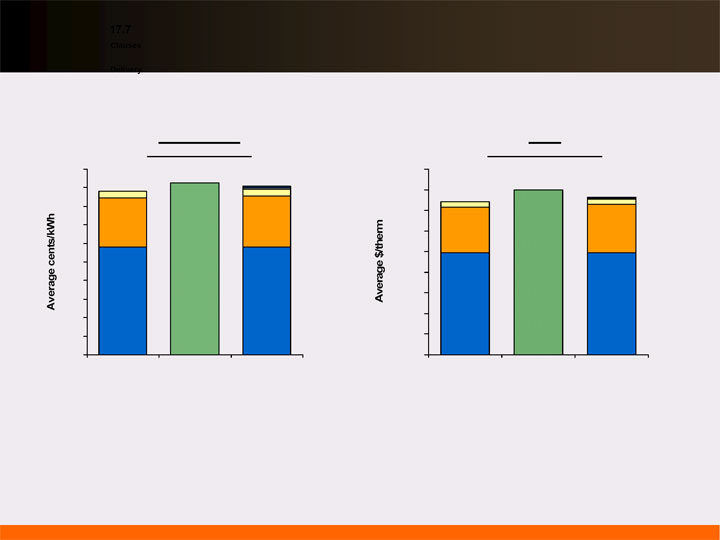
… produces superior value to our electric and gas customers.
Electricity
(500kWh/month bill)
BGS
Delivery
Clauses
17.7
Gas
(100 therm/month bill)
BGSS
Delivery
Clauses
1.48
Source: Rates from PSE&G, NYPSC and PAPUC
1.53
BGSS
Delivery *
Clauses
BGS***
Delivery *
Clauses
Potential
Investments**
18.2
* Includes base rate increases
** Includes NJ stimulus filing (Capital and EEE), Solar 4 All and Solar II
Potential
Investments**
*** Assumes BGS/BGSS pricing remains constant
Combining operational excellence with prices comparable to
regional competitors …
18.5
0
2
4
6
8
10
12
14
16
18
20
PSE&G
Average
2011
1.60
0.00
0.20
0.40
0.60
0.80
1.00
1.20
1.40
1.60
1.80
PSE&G
Average
2011
Energy efficiency investment and savings
Investment Timeline
2009 – 2011 (18 months)
Category
Expenditure
Annual
Lifetime
Annual
Lifetime
Jobs
Residential
($ millions)
Whole House
$10
3,298
52,765
30,125
602,490
51
Multi-Family
19
6,223
99,574
56,848
1,136,960
49
9,521
152,339
86,973
1,739,450
100
Industrial & Commercial
Small Business
20
32,306
484,596
123,077
1,846,154
86
Muni/Local/State Government
25
31,878
478,170
153,846
2,307,692
107
Hospital Efficiency
68
128,640
1,929,600
1,315,337
19,730,061
292
Data Center
10
32,000
480,000
122,699
1,840,491
43
Tech Demo Sub-Program
12
18,947
284,210
192,000
2,880,000
52
Building
2
4,634
69,517
47,387
710,810
9
248,405
3,726,093
1,954,346
29,315,208
589
Admin Sales, Training, Evaluation, IT
24
TOTAL
$190
257,926
3,878,432
2,041,319
31,054,658
689
Savings (MWh)
Savings (Dtherms)

PSE&G Solar 4 All Program
Neighborhood Solar (40 megawatts) - $258.4M investment
Solar panels on utility poles and street lights in neighborhoods throughout
PSE&G’s service territory.
Centralized Solar (40 megawatts) – $256.1M investment
Solar systems on PSE&G land/buildings (25 megawatts).
Solar systems on 3rd Party sites (10 megawatts).
Solar systems on sites in UEZs (5 megawatts).
BPU approved a 10% ROE on its equity capital invested (47.4% common equity in its
capital structure). Return and capital structure will change when a new WACC is
established in a base rate case proceeding. Customer rate impact mitigated by
benefits associated with ITC and the value of electricity and Solar Renewable Energy
Certificates (SRECs) generated by the projects

PSEG
PSEG Power had substantial and growing …
… excess cash due to declining capital expenditures.
~ $525M
Excess Cash Flow
Cash Ops
excluding
changes in
working capital
Less: Investing
including Capex
of $822M and
Nuclear Fuel of
$150M
$800M - $900M
Improving Earnings
& Cash Ops
Declining Capex
Excess Cash Flow =
Potential Dividends
PSEG Power Cash Flow
2009 Capex =
$693M
vs.
Sustainability
Capex =
$200M - $225M
~ $1.3B
2008
2009
Excluding
Non-Recurring
Capex
Excess Cash
at Maintenance
Capex Levels
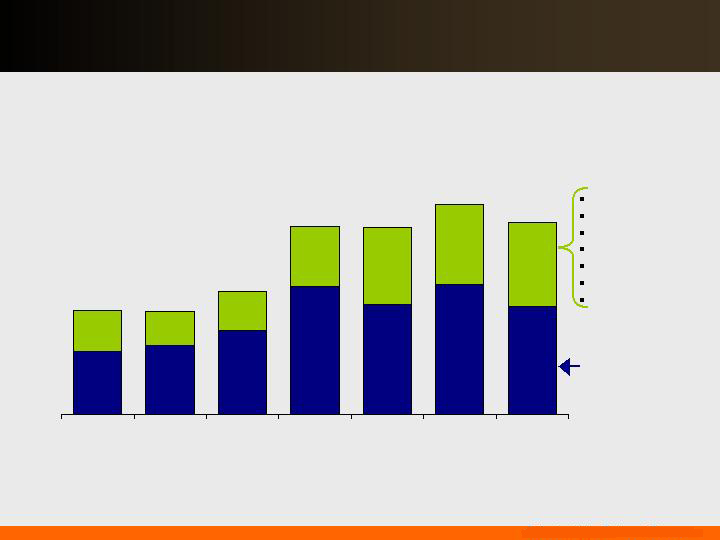
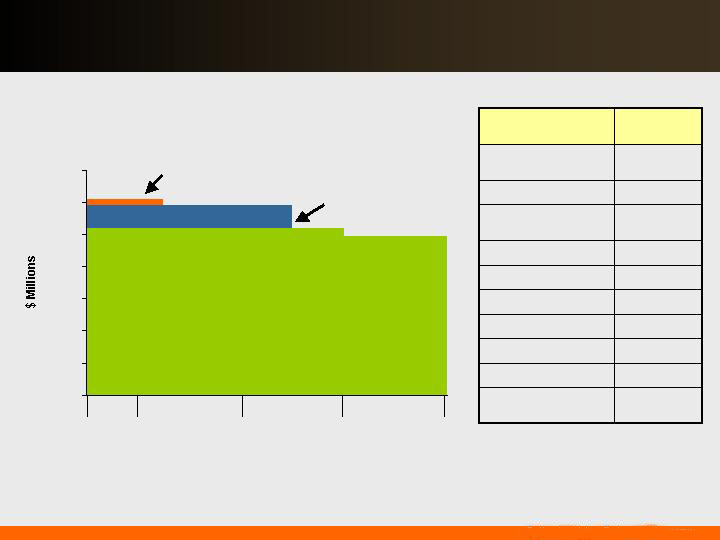
PSE&G’s asset base is growing.
$315M - $335M
Capex
~$1,050
Dividends to the Parent are dependent on capital needs.
PSE&G Cash Flow
Cash Flow Drivers
Capital Spending
Earnings
Cash Flow from
adjustments to NI
including
Depreciation
2009
Guidance
Retained
Earnings
Capex
Financing
Other Cash
Ops
2009
PSE&G’s investments in Energy Efficiency, Stimulus and Solar are
conditioned upon receiving reasonable rate treatment.
Future investments are weighted towards PSE&G and growth.
Power –
Sustainability
PSE&G -
Distribution
Infrastructure
Power – BET
Environmental
PSE&G -
Transmission
PSE&G - Other
Solar 4 All
Energy Efficiency
Solar II
(Pending approval)
Power –
Growth
2009 - 2011 Capital Expenditures
$0
$500
$1,000
$1,500
$2,000
$2,500
2009
2010
2011
Delivering Value: Today and Tomorrow 60
…with most of our credit facilities extending until 2012.
We have substantial liquidity…
4.9%
Union Bank of
California
5.2%
Citibank
5.9%
BNP Paribas
6.2%
BNY Mellon
6.4%
Scotia Bank
6.6%
Wachovia/Wells
6.6%
Barclays
6.9%
Royal Bank of
Scotland
7.0%
JPMorgan Chase
10.7%
Bank of America
Merrill
% of Total
Commitment
Institution
Facility Expirations
Dec11 = $122M
Dec12 = $2.5B
$100M Bilateral expiring March 2010
2009
2010
2011
2012
$350M Syndicated expiring in July 2011
Non-PSE&G Credit Capacity
0
500
1,000
1,500
2,000
2,500
3,000
3,500
Delivering Value: Today and Tomorrow 61

Items Excluded from Income from Continuing Operations to
Reconcile to Operating Earnings
Please see Page 3 for an explanation of PSEG’s use of Operating Earnings as a non-GAAP financial measure and how
it differs from Net Income.
Pro-forma Adjustments, net of tax
2009
2008
2009
2008
Earnings Impact ($ Millions)
Gain (Loss) on Nuclear Decommissioning Trust (NDT) Fund Related Activity
7
$
(12)
$
1
$
(22)
$
Gain (Loss) on Mark-to-Market (MTM)
17
11
(22)
30
Lease Reserves
-
-
-
(490)
Premium on Bond Redemption
-
-
-
(1)
Total Pro-forma adjustments
24
$
(1)
$
(21)
$
(483)
$
Fully Diluted Average Shares Outstanding (in Millions)
507
508
507
509
Per Share Impact (Diluted)
Gain (Loss) on Nuclear Decommissioning Trust (NDT) Fund Related Activity
0.01
$
(0.02)
$
-
$
(0.04)
$
Gain (Loss) on Mark-to-Market (MTM)
0.03
0.02
(0.05)
0.06
Lease Reserves
-
-
-
(0.96)
Premium on Bond Redemption
-
-
-
-
Total Pro-forma adjustments
0.04
$
-
$
(0.05)
$
(0.94)
$
For the Quarters Ended
For the Nine Months Ended
September 30,
PUBLIC SERVICE ENTERPRISE GROUP INCORPORATED
Reconciling Items Excluded from Continuing Operations to Compute Operating Earnings
(Unaudited)
September 30,

Please see Page 3 for an explanation of PSEG’s use of Operating Earnings as a non-GAAP financial measure and how
it differs from Net Income.
Items Excluded from Income from Continuing Operations to
Reconcile to Operating Earnings
Pro-forma Adjustments, net of tax
2008
2007
Earnings Impact (in Millions)
Asset Sales and Impairments:
Impairment of PPN
(9)
$
(2)
$
Impairment of Turboven
(4)
(7)
Loss on Sale of Chilquinta and Luz del Sur
-
(23)
Premium on Bond Redemption
(1)
(28)
Total Asset Sales and Impairments
(14)
(60)
Gain (Loss) on Nuclear Decommissioning Trust (NDT)
Fund Related Activity
(71)
12
Gain on Mark-to-Market (MTM)
16
10
Lease Reserves
(490)
-
Total Pro-forma to Operating Earnings
(559)
$
(38)
$
Fully Diluted Average Shares Outstanding (in Millions)
508
509
Per Share Impact (Diluted)
Asset Sales and Impairments:
Impairment of PPN
(0.02)
$
-
$
Impairment of Turboven
(0.01)
(0.01)
Loss on Sale of Chilquinta and Luz del Sur
-
(0.05)
Premium on Bond Redemption
-
(0.06)
Total Asset Sales and Impairments
(0.03)
(0.12)
Gain (Loss) on Nuclear Decommissioning Trust (NDT)
Fund Related Activity
(0.14)
0.02
Gain on Mark-to-Market (MTM)
0.03
0.02
Lease Reserves
(0.96)
-
Total Pro-forma to Operating Earnings
(1.10)
$
(0.08)
$
For the Twelve Months Ended
December 31,
PUBLIC SERVICE ENTERPRISE GROUP INCORPORATED
Reconciling Items Excluded from Continuing Operations to Compute Operating Earnings
(Unaudited)