 PSEG Public Service Enterprise Group Presentation to the Financial Community New York, New York March 8, 2010 Exhibit 99 |
 2 Forward-Looking Statement Readers are cautioned that statements contained in this presentation about our and our subsidiaries' future performance, including future revenues, earnings, strategies, prospects and all other statements that are not purely historical, are forward-looking statements for purposes of the safe harbor provisions under The Private Securities Litigation Reform Act of 1995. Although we believe that our expectations are based on reasonable assumptions, we can give no assurance they will be achieved. The results or events predicted in these statements may differ materially from actual results or events. Factors which could cause results or events to differ from current expectations include, but are not limited to: • Adverse changes in energy industry, law, policies and regulation, including market structures and rules, and reliability standards. • Any inability of our transmission and distribution businesses to obtain adequate and timely rate relief and regulatory approvals from federal and state regulators. • Changes in federal and state environmental regulations that could increase our costs or limit operations of our generating units. • Changes in nuclear regulation and/or developments in the nuclear power industry generally, that could limit operations of our nuclear generating units. • Actions or activities at one of our nuclear units located on a multi-unit site that might adversely affect our ability to continue to operate that unit or other units at the same site. • Any inability to balance our energy obligations, available supply and trading risks. • Any deterioration in our credit quality. • Availability of capital and credit at commercially reasonable terms and our ability to meet cash needs. • Any inability to realize anticipated tax benefits or retain tax credits. • Changes in the cost of or interruption in the supply of fuel and other commodities necessary to the operation of our generating units. • Delays or unforeseen cost escalations in our construction and development activities. • Increase in competition in energy markets in which we compete. • Adverse performance of our decommissioning and defined benefit plan trust fund investments, and changes in discount rates and funding requirements. • Changes in technology and increased customer conservation. For further information, please refer to our Annual Report on Form 10-K, including Item 1A. Risk Factors, and subsequent reports on Form 10-Q and Form 8-K filed with the Securities and Exchange Commission. These documents address in further detail our business, industry issues and other factors that could cause actual results to differ materially from those indicated in this presentation. In addition, any forward-looking statements included herein represent our estimates only as of today and should not be relied upon as representing our estimates as of any subsequent date. While we may elect to update forward-looking statements from time to time, we specifically disclaim any obligation to do so, even if our internal estimates change, unless otherwise required by applicable securities laws. |
 3 GAAP Disclaimer PSEG presents Operating Earnings in addition to its Net Income reported in accordance with accounting principles generally accepted in the United States (GAAP). Operating Earnings is a non-GAAP financial measure that differs from Net Income because it excludes the impact of the sale of certain non-core domestic and international assets and material impairments and lease-transaction-related charges. PSEG presents Operating Earnings because management believes that it is appropriate for investors to consider results excluding these items in addition to the results reported in accordance with GAAP. PSEG believes that the non-GAAP financial measure of Operating Earnings provides a consistent and comparable measure of performance of its businesses to help shareholders understand performance trends. This information is not intended to be viewed as an alternative to GAAP information. The last two slides in this presentation include a list of items excluded from Net Income to reconcile to Operating Earnings, with a reference to that slide included on each of the slides where the non-GAAP information appears. |
 4 Agenda Ralph Izzo Summary BREAK Anne Hoskins PSEG – Public Affairs and Policy Caroline Dorsa PSEG Financial Review and Outlook Joe Hopf PSEG Power – Market Overview Dan Cregg PSEG Power – Review and Outlook Ralph LaRossa PSE&G – Review and Outlook Ralph Izzo PSEG – Defining the Future Randall Mehrberg PSEG Energy Holdings – Review and Outlook Kathleen Lally Welcome/Introduction Presenter Presentation |
 PSEG – Defining the Future Ralph Izzo Chairman, President and Chief Executive Officer |
 6 PSEG: the right mix for the opportunities of today and tomorrow PSE&G positioned to meet NJ’s energy policy and economic growth objectives with $5.3 billion investment program. Electric & Gas Delivery and Transmission PSEG Power’s low-cost baseload nuclear and coal fleet is geographically well positioned and environmentally responsible. Regional Wholesale Energy PSEG Energy Holdings positioned to pursue attractive renewable generation opportunities: • Solar • Offshore wind • Compressed Air Energy Storage (CAES) Renewable Investments |
 7 A successful track record… … provides the confidence to capitalize on the opportunities of tomorrow. PSEG Power resumed independent control of nuclear fleet, produced record levels of generation and achieved top quartile performance; fossil fleet retrofitted to meet more stringent environmental requirements. PSE&G consistently recognized for reliability; investment programs expanded to meet NJ’s goals for economic growth and clean energy. Business focus improved; balance sheet strengthened; Holdings’ financial risk lessened with sale of international investments, termination of offshore leases Operational and financial focus has allowed PSEG to meet/exceed earnings objectives in each of the past three years. History of returning cash to shareholders through common dividend. 2007 2008 2009 |
 8 Our focus on customers, community and employees… PSE&G named America’s Most Reliable Utility 4 of past 5 years Mid-Atlantic Region winner for the 8 th straight year Carbon Disclosure Leadership Index 2009 Second year in a row One of 139 companies named to DJSI North America and one of only 10 U.S. electric companies included Industry Innovation Award One of the 12 best places to work in NJ, 2009 … has been widely recognized. |
 9 Earnings growth achieved… … through higher energy market pricing, increased production and lower costs. * See page 122 for Items excluded from Income from Continuing Operations to reconcile to Operating Earnings. $2.68 $3.03 $3.12 2007 Operating Earnings* 2008 Operating Earnings* 2009 Operating Earnings* |
   10 Tomorrow’s energy market will reward… …an operationally efficient, environmentally responsible, integrated generation, transmission and distribution business. Higher margins driven by environmentally responsible & operationally flexible energy supply Superior operations = customer satisfaction + higher value Business driven by the need to address environmental issues and stable pricing Infrastructure investment to support reliability + improve performance |
   11 Investment programs, hedge profile and cost control support 2010 outlook $3.12 $3.00 - $3.25 2009 Operating Earnings* 2010 Guidance * See page 122 for Items excluded from Income from Continuing Operations to reconcile to Operating Earnings. |
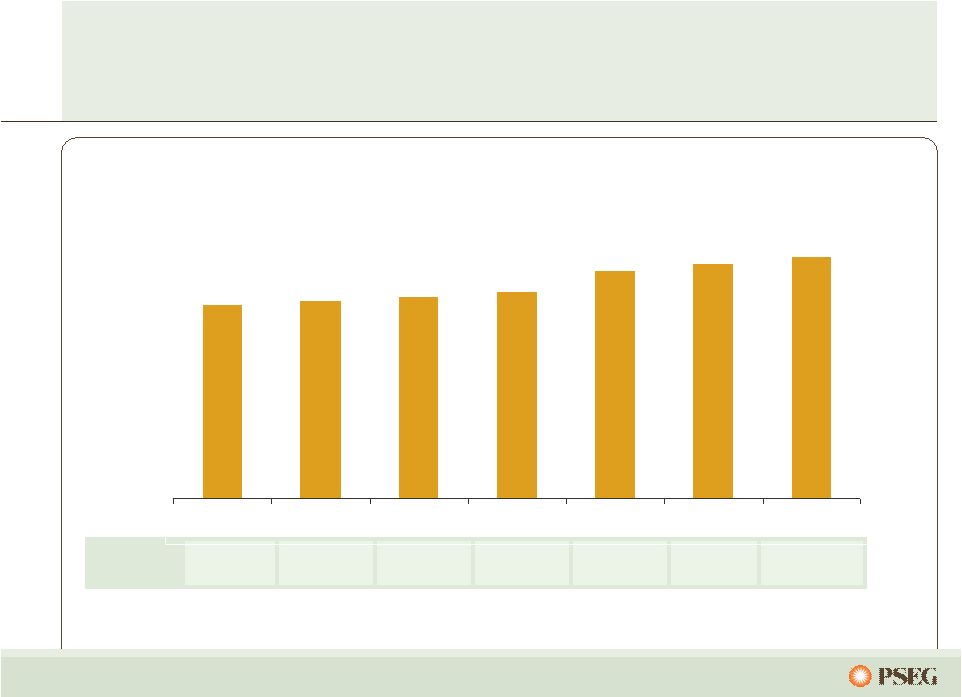 12 *Indicated annual dividend rate Seventh consecutive annual dividend increase is part of a 103-year history of paying common dividends… 43% 70% 44% Payout Ratio 42 – 46% 43% 66% 63% Dividends per Share … and we remain comfortably within our targeted 40-50% payout range. $1.10 $1.12 $1.14 $1.17 $1.29 $1.33 $1.37* 2004 2005 2006 2007 2008 2009 2010 |
     13 Core Investment $2.5B Growth Investments $5.2B A $7.7 billion investment program over 2010 – 2012… … supports long-term growth. |
 14 PSEG is advantaged… … with a strong balance sheet and cash flow to pursue an investment program that seizes the opportunities of tomorrow. Right Assets, Right Markets Operational Flexibility Environmental Infrastructure Improvements 2010 Integrated business model with assets located close to load centers Dispatch flexibility of operating assets and trading capability supports margins in full-requirements markets Environmentally responsible; pursuing investments in renewables; nuclear uprates Investments to improve reliability and functionality of grid |
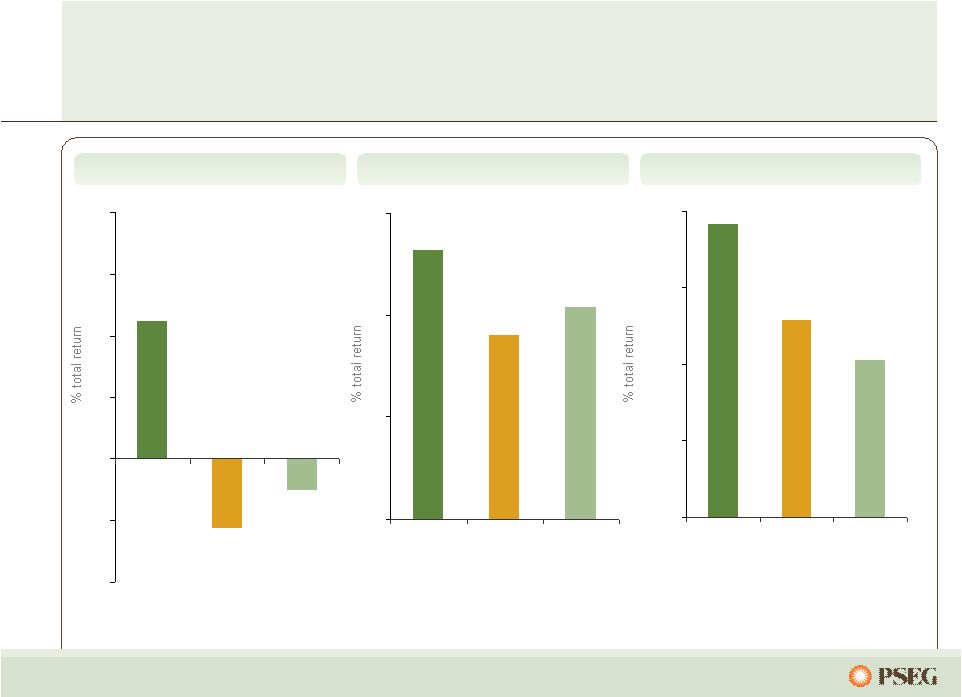 15 PSEG has provided investors with a better than average return… … and we are positioned to deliver value over the long-term. 5 year 10 year 3 year -10 -5 0 5 10 15 20 PSEG S&P 500 Electrics Dow Jones Utility Average 0 20 40 60 PSEG S&P 500 Electrics Dow Jones Utility Average 0 50 100 150 200 PSEG S&P 500 Electrics Dow Jones Utility Average |
 16 PSEG is responding to investors’ questions PSE&G’s capital programs have nominal impact on rates Stable supply costs provide room for regulatory support of capital programs What is the impact on customer from capital programs? Strong cash flow well in excess of PSEG and PSE&G’s equity requirements Do you need equity? Downside risk limited by recent auction results which incorporated lower market energy prices Physical assets provide optionality What is the impact of migration? Modest payout ratio and strong balance sheet provide support – 7 th consecutive annual increase Is dividend secure? Multi-year hedging through participation in full-requirements auctions Asset balance dampens relative fuel price volatility Capacity markets provide stability What’s the impact of commodity volatility? Environmentally advantaged Federal and State Policy initiatives support capital plans How is PSEG affected by policy changes? PSEG Position Investors’ Questions |
 PSEG – Public Affairs and Policy Anne Hoskins Senior Vice President, Public Affairs and Sustainability |
 18 Political and economic factors shape 2010 policy agenda … …and create opportunities for PSEG. Political developments and elections Fiscal and economic pressures 2010 Policy Landscape Environmental protection Job creation Energy security and reliability Regulatory reform |
 19 Political landscape: in the 2009 & 2010 elections… 178 257 Federal – Midterm elections Repeat of 1994 possible? Tea party impact Independent vote Uncertainty in economic and employment recovery Senate’s 60 “filibuster proof” majority lost in January New Jersey New administration, legislative leadership face growing fiscal challenges 2 57 41 R D 178 257 R D Current U.S. Senate Make-up Current U.S. House Make-up ...“change” is central theme and reality. |
 20 Environmental Protection: Climate Change PSEG advocating for carbon legislation and regulation… ...that put a price on carbon and support clean energy investment. U.S. EPA Regulating GHGs under the CAA Senator Murkowski seeking to block implementation Legal challenges to EPA’s intended action anticipated RGGI and other state/ regional regimes Options Economy-wide, cap & trade Utility sector first Carbon tax Senate effort centered on Kerry/Graham/Lieberman approach Regulatory Legislative |
 21 Environmental Protection: Air, Water, Waste PSEG advocating for regulations that protect public health… …and enable operation of sustainable electric generation. EPA’s electric power sector agenda: Air: Mercury and Haz Air Pollutant MACT standards New CAIR rule Tightening of the ozone and PM2.5 NAAQS Water: 316 (b) draft rule anticipated in 2010 Waste: Draft rule for Coal Combustion By-products (CCB) expected soon |
 22 Job Creation Political focus on job creation… Regulatory approvals for utility investment in renewables, energy efficiency and infrastructure upgrades Federal Clean Energy Deployment Administration and state incentives to help finance capital projects Wind and solar – RPS carve-outs and financing New nuclear ITC, PTC to support solar, wind and compressed air storage …is catalyst for government incentives for green investments. |
 23 Energy Security and Reliability Political support for energy security... Transmission/ Distribution Susquehanna-Roseland transmission line Other transmission upgrades in New Jersey Distribution rate case New Power Generation New Haven and Kearny peakers Nuclear Uprates Nuclear early site permit ... provides a foundation for infrastructure investment and economic growth. |
 24 Regulatory Reform PSEG is working to get the rules right… Emission trading Seeking legislative solution to continue trading of NOx and SO 2 Environmental regulation Supporting solutions that protect the environment and reflect economic efficiency and certainty for business investment Financial reform Working to preserve over the counter energy trading for end-users Utility rate regulation Pursuing contemporaneous rate structures that support utility investment … to ensure regulation supports value for customers and opportunities for PSEG growth. |
 25 Regulatory Reform Working in New Jersey to build political and regulatory support for “Utility of the Future”... …to create shareholder and customer value. Smart Grid/PHEV Infrastructure T&D Infrastructure Replacement Transmission Backbone Projects Renewables Development Energy Efficiency Development |
 26 2010 PSEG is advantaged with a clean energy foundation… … as the basis for shaping public policy to seize the opportunities of tomorrow. Right Assets, Right Markets Operational Flexibility Environmental Infrastructure Improvements Public incentives support investment in transmission upgrades, renewables, energy efficiency and nuclear energy. Well situated to meet public demand for renewables, energy efficiency and building from bedrock reliable service. Prepared to comply with more stringent regulations to reduce pollutants and to displace non-compliant generation. Creating jobs and improving energy security through investments in transmission and generation. |
 PSE&G – Review and Outlook Ralph LaRossa President and Chief Operating Officer, PSE&G |
 28 PSE&G is positioned for growth… …through investments in infrastructure, renewables and energy efficiency. Leader in reliability; focused on maintaining position by improving customer responsiveness and efficiency Economically meeting mandates for reliability, service quality and access to renewables Largest provider of electric and gas distribution services and transmission in NJ. Creating renewable and energy efficiency solutions for NJ customers Focused on regulatory mechanisms that provide reasonable and current recovery of and return on capital |
 29 PSE&G is the largest utility in New Jersey providing electric, gas and transmission services,… …and delivering renewable and energy efficiency solutions for customers. * Actual ** Weather normalized = estimated annual growth per year over forecast period *** Lifetime GWh + Lifetime Dtherms converted to GWh 60% 31% Residential 36% 58% Commercial 0.4%** 0.4% - 1.3%** Projected Annual Load Growth (2009 – 2012) Sales Mix 3,500 M Therms 41,961 GWh Electric Sales and Gas Sold and Transported (0.4%)* (0.6%)* Historical Annual Load Growth (2005 - 2009) 4% 11% Industrial 1.7 Million 3.2% Gas 2.1 Million 3.0% Customers Growth (2004 – 2009) Electric 0.5%* Historical Annual Peak Load Growth 2005-2009 1,442 Network Circuit Miles Key Statistics Transmission 2.1%** Projected PJM Peak Load Growth 2009-2012 13,512 GWh 230 GWh Energy Efficiency Initiative (lifetime equivalent)*** 80 MW 1 MW Solar 4 All 11.6 MW 2009 Renewables and Energy Efficiency Solar Loan 81 MW Total |
 30 PSE&G is a nationally recognized leader in delivering safe and reliable service... 2009 ReliabilityOne™ National Reliability Excellence Award winner 8 consecutive ReliabilityOne™ Awards for the Mid-Atlantic Solid regulatory relationships based on delivering service to customers Solar Energy Industries Association (SEIA) Industry Innovation award Solar Electric Power Association (SEPA) Innovation in Solar Program Design award …and an innovator in developing programs to achieve renewable and energy efficiency goals. 2004 CAIDI 2006 Damages per Locate 1,000 Requests 2000 Leak Response Rate 2003 Gas Leak Reports per Mile 2004 MAIFI (Excluding Major Storms) SAIFI (Excluding Major Storms) 2000 Reliability Performance Metrics compared to Peer Panel have been Top Quartile since: National ReliabilityOne Award winner four of the last five years |
 31 …while all other costs have remained flat. PSE&G O&M* * Excludes Regulatory Clauses PSE&G’s O&M growth has been driven by increasing pension expense,… 2007 – 2009 CAGR: 2.4% 0 200 400 600 800 1,000 1,200 2007 2008 2009 |
 32 …which creates superior value to customers. PSE&G provides the highest reliability at below average cost... SAIDI VS O&M $- $1.00 $2.00 $3.00 $4.00 $5.00 $6.00 $7.00 $8.00 $9.00 $10.00 0 50 100 150 200 250 300 350 System Average Interruption Duration Index (SAIDI) PSE&G |
 33 Our 2010 – 2012 capital plan calls for investing $ 5.3 billion… 0 200 400 600 800 1,000 1,200 1,400 1,600 1,800 2,000 2009 2010 2011 2012 NJ Infrastructure Stimulus Solar Energy Efficiency Transmission Core Investment …with contemporaneous recovery mechanisms approved for $3.6 billion. |
 34 2009: Success in meeting State’s energy and economic development goals… …with reasonable contemporaneous returns. 514 180 694 April 2009 NJ Capital Infrastructure Stimulus 30 17 47 December 2008 Carbon Abatement 64 1 65 July 2009 Demand Response 143 - 143 November 2009 Solar Loan II $62 $43 $105 April 2008 Solar Loan I $1,759 $258 $2,017 Total 185 5 190 July 2009 Economic Energy Efficiency Stimulus 761 12 773 July 2009 Solar 4 All Remaining Spending Thru 2009 Total Amount Approval Date ($ Millions) |
 35 Branchburg Branchburg Roseland Roseland Hopatcong Hopatcong Hudson Hudson Transmission investment recovery… Future Transmission project spending will be influenced by PJM evaluation, potentially adding $1.5B in additional projects over 2010 – 2015. Various $300 14 69kV Reliability projects thru 2012 Various $200 20 Approved RTEP projects thru 2012 125 bps 2013 $1,100 Branchburg-Roseland-Hudson 125 bps 2012 $750 Susquehanna-Roseland Incentive In-Service Spending ($ Millions) …is supported by formula rate treatment and CWIP in rate base*. * Approval of CWIP for 500kV backbone projects. Transmission Projects Future Projects |
 36 PSE&G’s investment program provides opportunity for 14% annualized growth in rate base PSE&G Rate Base 0 2,000 4,000 6,000 8,000 10,000 12,000 2009 2010 2011 2012 Gas Distribution Electric Distribution Electric Transmission EMP |
 37 Filed: May 29, 2009 12/09 Update: January 29, 2010 Test Year: 2009 * Modified in February for 11.25% ROE from 11.5% ROE New Jersey Electric & Gas Rate Case 51.2% Equity Ratio Includes tracking mechanisms for capital expenditures and pension costs 11.25%* Return on Equity $74.0 million $148.0 million Increase $2.3 billion $3.9 billion Rate Base Request as of the 12/09 update Electric Request Gas |
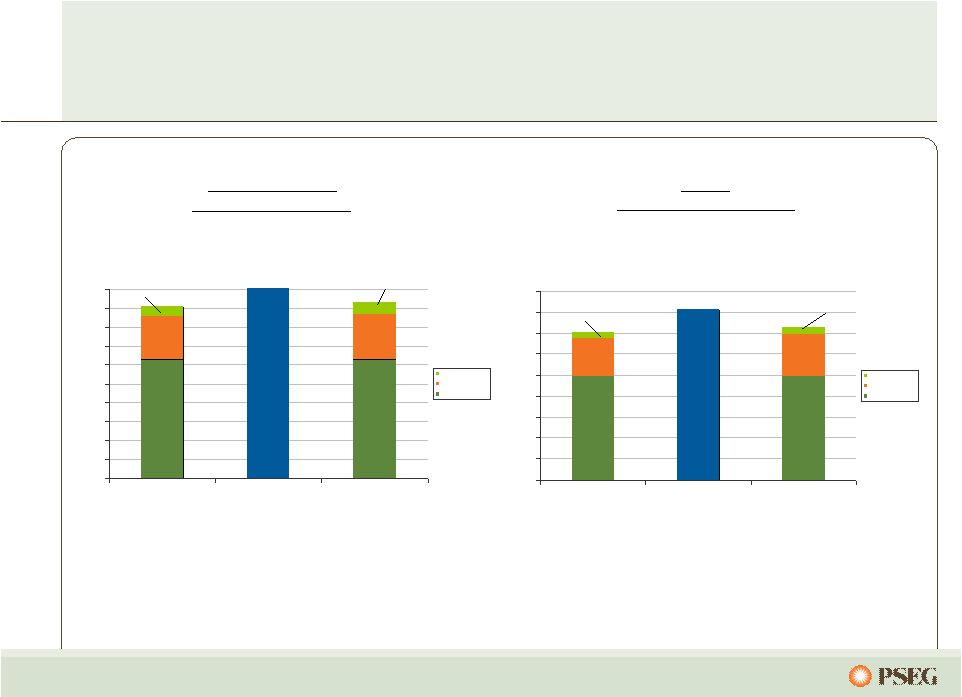 38 0.0 0.2 0.4 0.6 0.8 1.0 1.2 1.4 1.6 1.8 PSE&G 2009 Regional Average PSE&G 2012E Clauses and Other Delivery BGS 0 2 4 6 8 10 12 14 16 18 20 PSE&G 2009 Regional Average PSE&G 2012E Clauses and Other Delivery BGS The national average ratio for electric bills to disposable income is 3.4%*, … Based on tariff rates in effect in June 2009 …while PSE&G’s typical electric bill is 2.6% of disposable income in New Jersey. Electricity (500kWh/month bill) BGS Delivery Clauses and Other 18.1 Gas (100 therm/month bill) 1.45 BGS**** Delivery ** 20.1 * Source Moody’s Industry Outlook – July 2009 ** Includes base rate increases *** Other includes NJ stimulus filing ,Solar 4 All and Solar I & II, EEE, and Demand Response **** Assumes BGS/BGSS pricing remains constant Delivery BGSS BGSS**** Delivery ** Clauses and Other*** 1.62 1.40 18.7 Clauses and Other*** Clauses and Other |
 39 Regulatory Reform Working in New Jersey to build political and regulatory support for “Utility of the Future”... …to create shareholder and customer value. Smart Grid/PHEV Infrastructure T&D Infrastructure Replacement Transmission Backbone Projects Renewables Development Energy Efficiency Development |
 40 PSE&G is advantaged… …as we pursue a path in seizing the opportunities of tomorrow. Right Assets, Right Markets Operational Flexibility Environmental Infrastructure Investment Creating renewable and energy efficiency solutions for NJ and customers Focused on regulatory mechanisms that provide reasonable and current recovery of and return on capital Largest provider of electric and gas distribution services and transmission in NJ Leader in reliability; focused on maintaining position by improving customer responsiveness and efficiency 2010 |
 PSEG Energy Holdings – Review and Outlook Randall E. Mehrberg Executive Vice President, Strategy and Development President and Chief Operating Officer, PSEG Energy Holdings |
 42 PSEG Energy Holdings Simplifying the business and creating sustainable growth opportunities. Maximizing the value of the remaining portfolio Transaction structures and partnerships mitigate financial risk Streamlined business and reduced financial risk Capitalizing on renewable opportunities |
 43 PSEG Energy Holdings… PSEG Global International assets sold* Texas generating assets (2 – 1,000MW CCGTs) transferred to PSEG Power Small remaining investment in domestic traditional generation joint venture assets PSEG Resources Tax exposure reduced by $740 million through fourteen LILO/SILO lease terminations, including Nuon termination in January 2010 Maximizing value and minimizing risk for traditional leases and real estate Long-term debt reduced by $1 billion over 2008 and 2009 Redemption of $642 million of Energy Holdings recourse debt $368 million eliminated through bond exchange $127 million of debt remaining … has streamlined its businesses and reduced its risk. * Nominal investment in Venezuela remaining |
 44 Ongoing portfolio management continues… Global - International Asset Investment 0.0 0.5 1.0 1.5 2.0 2.5 2004 2005 2006 2007 2008 2009 2010 Est Resources - Traditional Leases, Real Estate and Other Investments 0.0 0.5 1.0 1.5 2.0 2.5 2006 2007 2008 2009 2010 Est … with opportunistic asset monetization as appropriate. Global- Domestic Generation Investment 0.0 0.5 1.0 1.5 2.0 2.5 2004 2005 2006 2007 2008 2009 2010 Est Resources - LILO/SILO Exposure * 0.0 0.5 1.0 1.5 2.0 2.5 2006 2007 2008 2009 Feb. 2010 * Does not include IRS deposits of $ 320M |
 45 PSEG Energy Holdings is focused on renewable energy opportunities Complementing PSEG portfolio by increasing earnings base with structured, low risk investments Disciplined evaluation of favorable markets for renewables Transaction structure and partnerships designed to mitigate risk Expand geographic and regulatory diversity Attractive and predictable returns Pursuing renewable strategy through three primary vehicles Solar Source LLC Energy Storage and Power LLC Garden State Offshore Energy LLC |
 46 Long-term off-take agreements with creditworthy counterparties Capitalizing on existing renewable markets Leveraging partnerships and alliances A 2MW solar facility developed and installed in 2009 An additional 27MW in construction for completion in 2010 20-30 year Power Purchase Agreements for energy, capacity and green attributes Low risk Engineering, Procurement & Construction contracts Projects that leverage the Investment Tax Credit ~$100M total investment to date … in the emergent solar industry. PSEG Solar Source is building a portfolio to take advantage of attractive opportunities… |
 47 Solar Source’s first project… …a 2MW Hackettstown, NJ Solar Facility |
 48 Energy Storage and Power LLC (ES&P)… Joint venture focused on licensing second generation compressed air energy storage (CAES) and power augmentation Converting variable renewable resources into firm, dispatchable resources Shifting the power produced by renewables from off-peak to on-peak Providing grid stability Reducing the need for new transmission Two potential ES&P customers were awarded almost $60 million in federal stimulus funds for projects in California and New York Stimulus applications specifically incorporate ES&P technology An additional $30M in state stimulus awarded in California … a resource that improves the utilization of renewables. |
 49 PSEG Energy Holdings Garden State Offshore Energy LLC Joint venture has been awarded a $4M grant to advance the development of a 350MW wind farm Enough energy to power over 110,000 NJ households Approximately 16 miles off the shore of southern New Jersey Geological studies completed enabling engineering for construction of meteorological tower Project dependent on establishing viable state revenue mechanism and reasonable federal permitting timelines/processes Offshore wind offers the opportunity in several markets to provide high capacity factor renewables near load centers |
 50 PSEG Energy Holdings… … creating sustainable growth opportunities for PSEG. Right Assets, Right Markets Operational Flexibility Environmental Investment Monetizing international and domestic generation assets in non-core markets Reducing tax exposure through lease terminations Pursuing investments in renewables Investing at attractive risk-adjusted returns to improve PSEG’s earnings base 2010 |
 PSEG Power – Review and Outlook Dan Cregg Vice President, PSEG Power Finance |
 52 PSEG Power – Right assets in the right markets… Portfolio approach to hedging over multi-year timeframe to derive market premiums Investment program supported by strong cash flow and credit metrics Low-cost, environmentally responsible, operationally flexible supply located in premium markets Focus on operational excellence to maximize asset value … with dispatch flexibility supporting returns in volatile markets. |
 53 Low-cost portfolio Regional focus in competitive, liquid markets Assets favorably located near customers/load centers Many units east of PJM constraints Southern NEPOOL/ Connecticut Texas assets – low cost combined cycle Market knowledge and experience to maximize the value of our assets … with low cost plants, in good locations, within solid markets. Power’s assets drive value in a dynamic environment… 15% 52% 8% Fuel Diversity Coal Gas Oil Nuclear Pumped Storage 1% Energy Produced (Twelve months ended December 31, 2009) Total GWh: 59,808 51% 15% 34% Pumped Storage & Oil <1% Nuclear Coal Gas Total MW: 15,548 24% 8% |
 54 Power’s Northeast assets are located in attractive markets near load centers … ... and the fleet has expanded to include 2,000MW in Texas. |
 55 … while maintaining optionality under a variety of conditions. Power’s PJM assets along the dispatch curve reduce the risk of serving full requirement load contracts… X X Ancillary Revenue X X X X Capacity Revenue X X Energy Revenue X X Dual Fuel Peaking units Baseload units Load following units Illustrative Salem Hope Creek Keystone Conemaugh Hudson 2 Linden 1,2 Burlington 8-9-11 Edison 1-2-3 Essex 10-11-12 Bergen 1 Sewaren 1-4 Hudson 1 Mercer1, 2 Bergen 2 Sewaren 6 Mercer 3 Kearny 10-11 Linden 5-8 / Essex 9 Burlington 12 / Kearny 12 Peach Bottom Nuclear Coal Combined Cycle Steam Peaking Yards Creek National Park Salem 3 Bergen 3 |
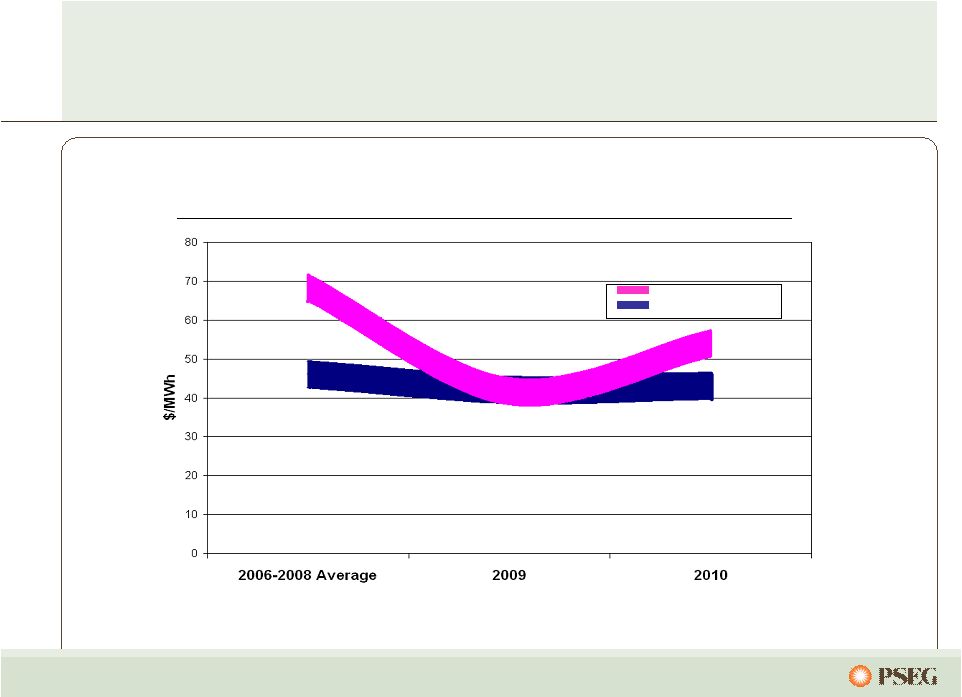 56 Gas Combined Cycle Coal Note: Forward prices as of 12/2009 Gas competed favorably with coal in 2009, with operational flexibility favoring gas… … but forward markets indicate a return to historical norms. Illustrative dispatch cost for Northeast coal and combined cycle units |
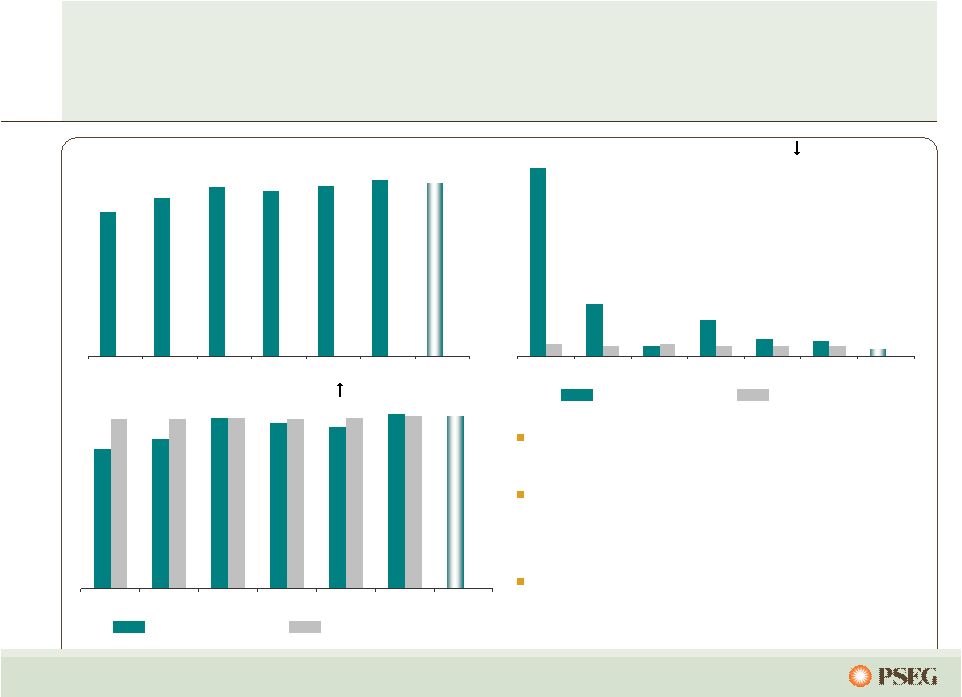 57 Our nuclear performance has improved… 11.1 3.1 0.6 2.1 1.0 0.9 0.4 0.7 0.6 0.7 0.6 0.6 0.6 2004 2005 2006 2007 2008 2009 2010 Target 25 27 29 28 29 30 30 2004 2005 2006 2007 2008 2009 2010 Target 79.0 85.0 97.0 94.0 91.7 99.0 98.0 96 96 97 96 97 98 2004 2005 2006 2007 2008 2009 2010 Target Salem station set a new generation record. Highest combined Salem and Hope Creek Nuclear site output in Power’s history Top quartile INPO Index … as we maintain our drive for excellence. Nuclear Generation Output* (000’s GWh) Forced Loss Rate ( ) (%) INPO Index ( ) NJ Units 1st Quartile NJ Units 1st Quartile * Total PS share nuclear generation |
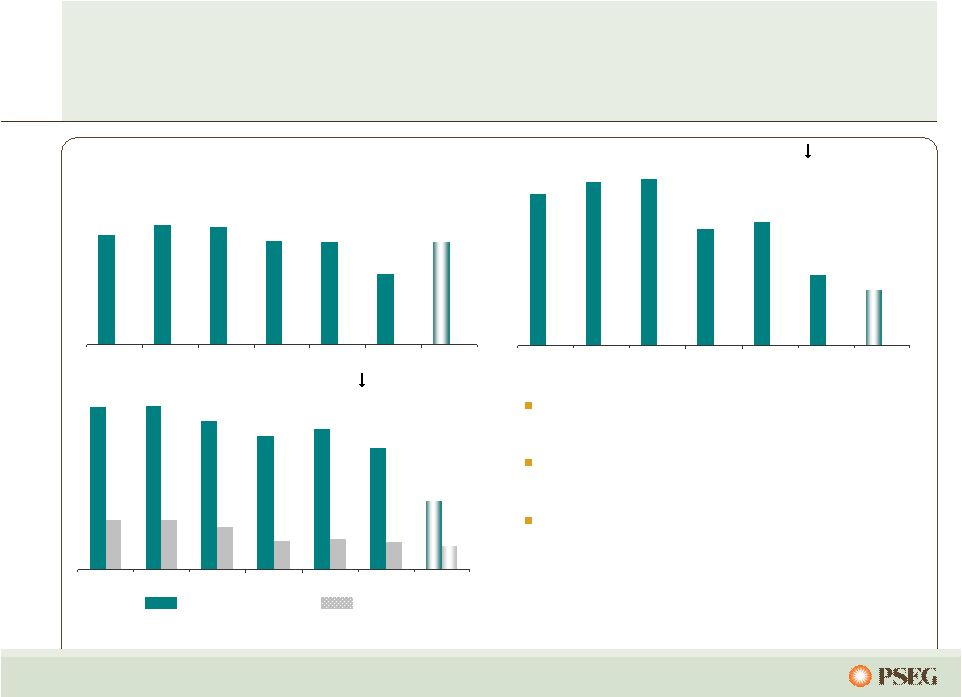 58 Power’s coal fleet has shown improvement… 14 15 15 13 13 9 13 2004 2005 2006 2007 2008 2009 2010 Target 10.3 11.1 11.3 7.9 8.4 4.8 3.8 2004 2005 2006 2007 2008 2009 2010 Target 1.11 1.12 1.01 0.91 0.96 0.83 0.47 0.34 0.34 0.29 0.20 0.21 0.19 0.16 2004 2005 2006 2007 2008 2009 2010 Target Market conditions reduced output in 2009 Operational results greatly improved Environmental footprint improved … and back-end technology investments will prepare us for the future. Output (000’s GWh) Forced Outage Rate ( ) (% EFORD) SO 2 and NOx Rates ( ) (lb/mmbtu) SO 2 NOx |
 59 Power’s combined cycle fleet is creating value… 5 4 8 10 20 20 18 2004 2005 2006 2007 2008* 2009* 2010 Target* 3.4 7 3.4 2.5 1.8 1.5 0.8 2004 2005 2006 2007 2008* 2009* 2010 Target* 8079 7847 7928 7768 7587 7507 7452 2004 2005 2006 2007 2008* 2009* 2010 Target* Output (000’s GWh) Forced Outage Rate ( ) (% EFORD) Period Heat Rate ( ) (mmbtu/KWh) Highest output ever in 2009 Approaching top quartile forced outage rate Benefiting from heat rate improvement program … benefiting from operating enhancements and market dynamics. * Includes Texas |
 60 99.7 96.5 98.6 97.0 98.9 99.3 99.7 2004 2005 2006 2007 2008 2009 2010 Target Our peaking fleet rounds out a diverse generation portfolio… 13 17 23 19 13 14 12 2004 2005 2006 2007 2008 2009 2010 Target 85 86 76 77 91 92 94 2004 2005 2006 2007 2008 2009 2010 Target Peaking start success provides opportunities in ancillary and real time markets Peaking adds flexibility in serving load and managing needs of a diverse market environment … and provides ability to follow load during periods of high demand. % Start Success ( ) Forced Outage Rate ( ) (% EFORD) Equivalent Availability ( ) (%) |
 61 Stringent environmental challenges are on the horizon, with potentially broad industry impacts… High High Regional High High Industry Impact Emission restrictions net favorable to Power Carbon Controls on coal units done or under way Power’s relative position very strong NOx, SO 2 , Hg (CAIR) Peaking fleet replacement strategy Upwind states anticipated to increase NOx stringency Ozone air quality standards (HEDD) EPA required to perform cost-benefit analysis Issue widely shared across industry Potential capital spend exposure Once-through cooling water (316(b)) Power uses dry fly ash systems Ash has been tested as non-hazardous Coal ash regulation Power’s Positioning Issue …but Power’s clean fleet is very competitively positioned for success. |
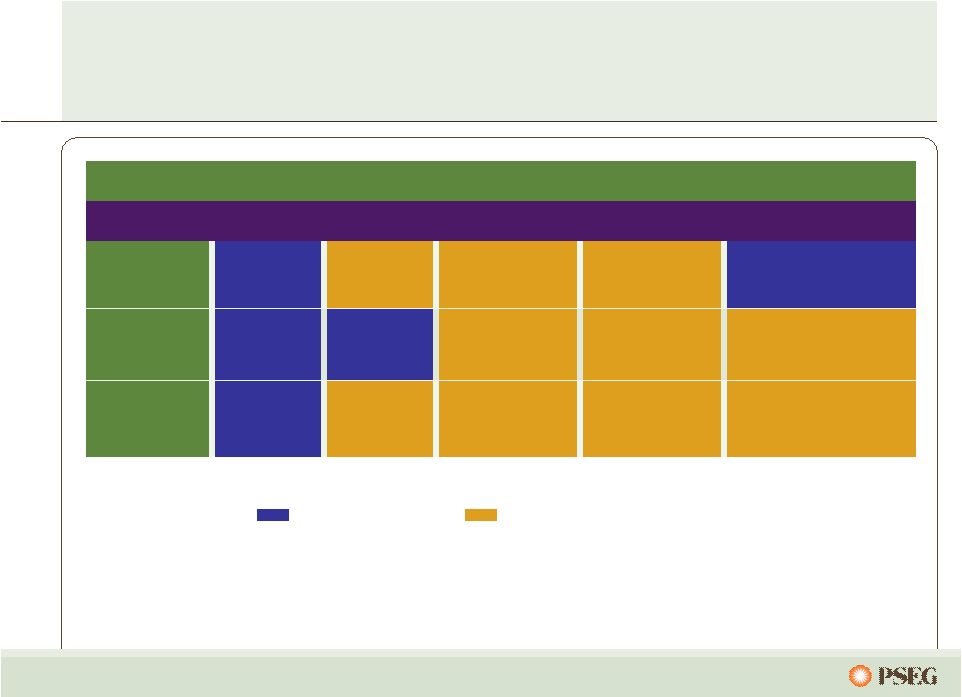 62 Power’s portfolio is well positioned… Baghouse Scrubber 2010 SCR Mercer (NJ) Baghouse 2010 Scrubber 2010 SCR 2010 Hudson (NJ) Mercury/ Particulate SO 2 NOx Description Current Regulations and Compliance Measures Baghouse Ultra-low Sulfur Coal Low Nox Burners Bridgeport (CT) Scrubber (Hg MACT Compliant) Scrubber (Hg MACT Compliant) Scrubber Scrubber SCR 2014 SCR Conemaugh (PA) Keystone (PA) …to meet current regulatory requirements. Capital Spend Planned No Additional Capital Spend Planned |
 63 0 50 100 150 200 250 Source: EPA, EIA (2006 and 2007) and PSEG Projection Power’s coal assets will have completed many environmental upgrades by 2010… …resulting in dramatically lower emissions. 0 2 4 6 8 10 12 14 0 10 20 30 40 50 60 PSEG Projected NOX Emission Rate for 2011 versus 2008 400 U.S. Coal Plants Conemaugh Hudson Bridgeport Mercer Keystone NOx Keystone Bridgeport Conemaugh Hudson Mercer SO 2 PSEG Projected SO2 Emission Rate for 2011 versus 2008 400 U.S. Coal Plants Keystone Conemaugh Bridgeport Mercer Mercury PSEG Projected HG Emission Rate for 2011 versus 2008 400 U.S. Coal Plants Hudson |
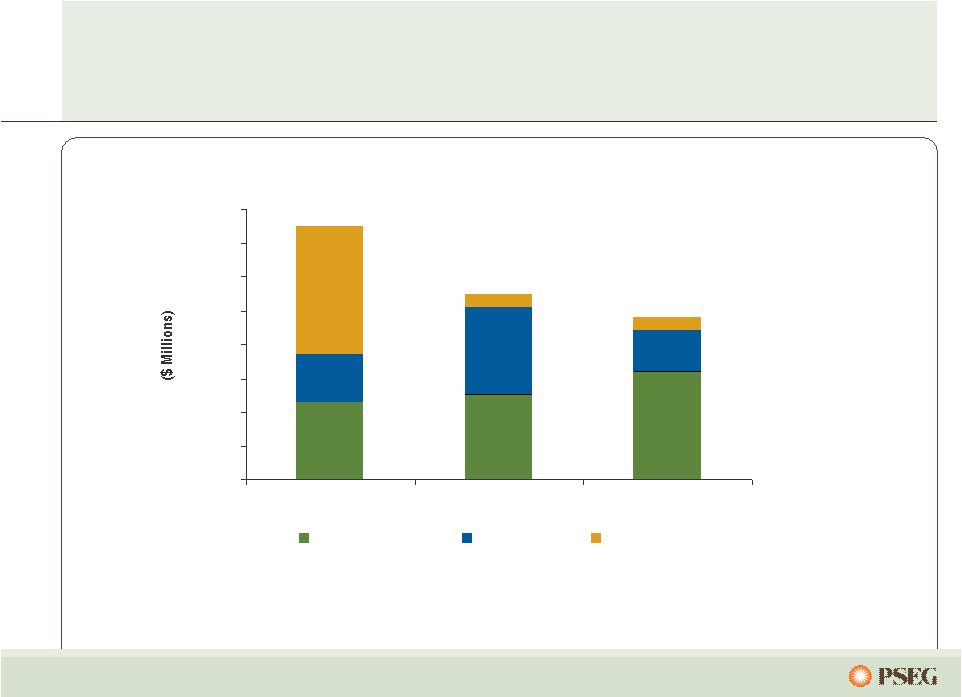 64 Power’s capital spending will decline considerably… …as we complete significant environmental back-end technology projects in 2010. PSEG Power Capital Spending $0 $100 $200 $300 $400 $500 $600 $700 $800 2010 2011 2012 Maintenance Growth Environmental |
 65 Nuclear’s operational excellence program will create value for years to come… RGGI 18 30 40 to 60 3,662 2009 None 21 25 40 3,484 2004 Progress toward National Program CO2 Program 19 O&M (non-fuel) $/MWh 30 Output (000 GWh) 60 License Life 3,694 Capacity (MW) 2012E Description …as our efforts continue to pursue a potential new unit. |
 66 Fossil’s operational excellence program… 12,125 11,211 26,789 Emissions NOx Tons 37,863 15 447 30 11,886 2009* 80,287 16 349 21 11,123 2004 12,137 Emissions SO 2 Tons 14 O&M (non-fuel) $/MWh 211 Capital ($ Millions) 32 Output (000 GWh) 11,589 Capacity (MW) 2012E* Description …is expected to result in higher output at a lower cost. * Includes Texas |
   67 $0 $100 $200 $300 $400 $500 $600 $700 $0 $10 $20 $30 $40 CO2 Price ($/ton) While the prospects for a cap and trade program may be delayed… …Power remains well positioned to capture value if implemented. CO 2 $/Ton Impact on PJM Prices and Power’s EBITDA The impact on electric prices moderates at higher CO2 prices as: • the fleet dispatch changes, and • the CO2 intensity of the grid goes down. Illustration at $20 CO 2 : (2008 Data) 62 TWh x ~ $11 to $14/MWh ~ $680 – $870 M revenue 23M tons x $20/ton ~ $460 M expense |
 PSEG Power – Market Overview Joe Hopf President, PSEG Energy Resources & Trade |
 69 ER&T employs a disciplined approach to hedging… … designed to maximize profitability and support earnings stability. NJ BGS has been and will continue to be a primary part of hedging strategy Years of experience in NJ BGS coupled with our market expertise supports supplying load in other geographies Disciplined approach to hedging, risk controls in place to manage through volatile markets Diversity, location of assets gives us ability to maximize products of a full requirement transaction |
 70 Power remains a leading provider in an excellent market… Pricing in 2009 was impacted by low economic demand, cool summer weather, and low gas prices Power’s hedging strategy enabled strong results 2010 forwards imply continued market challenges, but entities with the right assets in the right locations are best positioned Power will continue to utilize a hedging strategy that incorporates full requirement load contracts and other contracting to secure pricing over a 2-3 year forward horizon BGS continues to be the foundation of our hedging strategy Balanced generation portfolio in ideal position to serve BGS Three year nature of BGS provides pricing stability for customers and providers … and has a fleet ideally positioned to serve customers. |
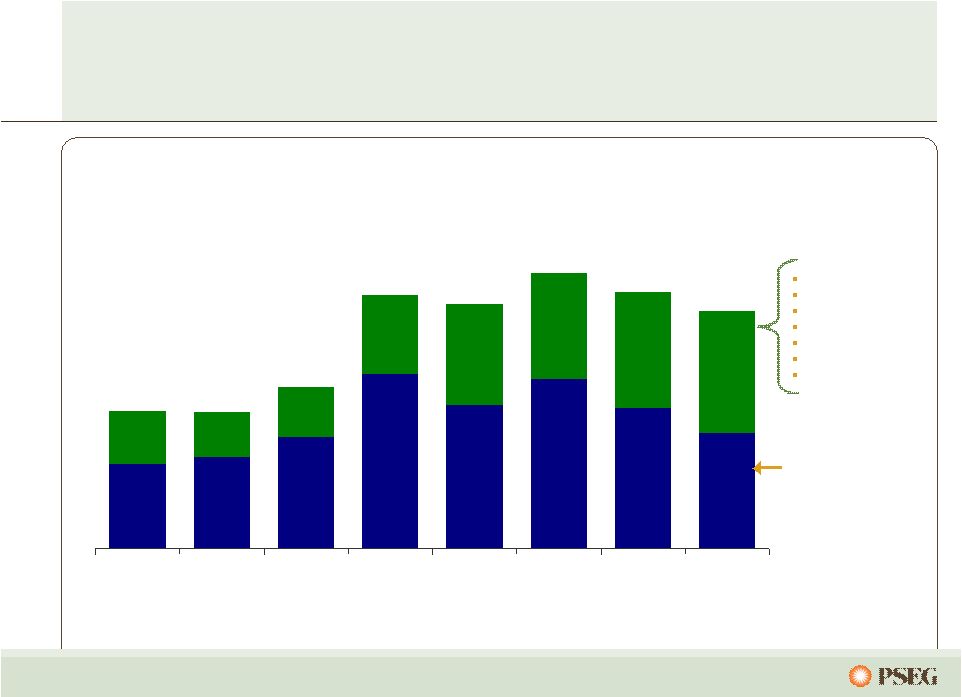 71 Full Requirements Component Increase in Capacity Markets/RPM Growing Renewable Energy Requirements Component for Market Risk Through Power’s participation in each of the BGS auctions… Market Perspective – BGS Auction Results … we have developed an expertise in serving full-requirements contracts. 2003 2004 2005 2006 2007 2008 2009 2010 3 Year Average Round the Clock PJM West Forward Energy Price $55.59 Capacity Load shape Transmission Congestion Ancillary services Risk premium Green $33 - $34 $36 - $37 $44 - $46 $67 - $70 $58 - $60 $68 - $71 $56 - $58 $48 - $50 ~ $21 $55.05 ~ $18 $65.41 ~ $21 $102.51 ~ $32 $98.88 ~ $41 $111.50 ~ $43 $103.72 ~ $47 $95.77 ~ $47 Note: BGS prices reflect PSE&G Zone |
 72 Years of experience and expertise in serving full-requirement load contracts… … is yielding benefits through disciplined auction participation for Power in other areas. Current load contracts in PJM RECO PSE&G JCPL AECO PECO PEPCO BGE PPL Power has been a successful bidder in multiple load serving contracts throughout PJM East |
 73 $0 $20 $40 $60 $80 $100 2004 2005 2006 2007 2008 2009 2010 Fwd 2011 Fwd 2012 Fwd 2013 Fwd The effect of our multi-year hedging/forward sales strategy… …creates a realized price that is a blend of prior and future pricing. PJM West PS Zone vs PJM West Basis l 2010 Realized Price *Forward prices as of February 2010 * Power’s hedging strategy enables current year prices to be derived from contracts secured over the prior 2 - 3 years. The fixed pricing of the BGS Auction has the effect of realizing forward prices up to three years ahead in the current year. l |
 74 The 2009 market environment prompted BGS customer migration … … while current market conditions lessen the incentive for future migration. 2009 Medium-Term Power Actions Current forward pricing reflects improvement over 2009 spot pricing Gradual reset of BGS rates (by one third per year) Offsets incentive to migrate Smaller loss of margin per MWh Continued migration, at a lower impact per MWh is anticipated to have no incremental financial impact on PSEG in 2010 Historic high prices in recent past Low spot market, especially given weak economy and weather Creates incentive for customers to migrate Difference represents loss of margin per MWh $0.08/sh impact to PSEG in 2009 BGS includes price component for volumetric risk of migration Option strategies being employed to manage changes in load volume Power’s diverse physical assets provide basis hedge and flexibility to manage risk Supplying wholesale hedges to third party retail providers Supplying hedges to other end use customers |
 75 The result of Power’s hedging strategy is a portfolio of contracted output… … which dampens the impact of market volatility on earnings in the near term. Power’s anticipated nuclear and coal output is contracted over the next few years: 2010: 90-95% 2011: 50-60% 2012: 15-30% 0 1000 2000 3000 4000 5000 6000 7000 8000 9000 10000 Nuclear / Pumped Storage Coal Combined Cycle (CC) Steam and Peakers Existing BGS, Other Load Contracts, Hedges + Future BGS Existing BGS, Other Load Contracts, and Hedges 2010 2011 2012 Total Fleet RTC Average |
 76 Power’s coal hedging reflects 2010 supply matched with 2010 sales… … while maintaining flexibility on supply post BET installation. 0% 20% 40% 60% 80% 100% 2010 2011 2012 $0 $10 $20 $30 $40 $50 Contracted Coal Mid $20’s To High $20’s Mid $20’s To High $20’s Mid $40’s To Low $40’s Mid $40’s To Low $40’s High $40’s To Mid $40’s Indicative Pricing ($/MWh) Prices lower, moderating Northern Appalachian Conemaugh Prices lower, moderating Northern Appalachian Keystone More limited segment of coal market Metallurgical CAPP/NAPP Mercer Flexibility after BET in 2010 Adaro (2010) CAPP/NAPP (2011+) Hudson Higher price, lower BTU, enviro coal Adaro Bridgeport Harbor Comments Coal Type Station % Hedged (left scale) $/MWh (right scale) |
 77 $0 $5 $10 2010 2011 2012 Anticipated Nuclear Fuel Cost Power has hedged its nuclear fuel needs through 2012… … with increased costs over that time horizon. Hedged |
 78 $0 $20 $40 $60 $80 $100 2004 2005 2006 2007 2008 2009 $0 $20 $40 $60 $80 $100 2004 2005 2006 2007 2008 2009 $0 $20 $40 $60 $80 $100 2004 2005 2006 2007 2008 2009 Commodity prices have been volatile… Henry Hub NYMEX ($/MMBTU) Western Hub RTC ($/MWh) West Hub On Peak ($/MWh) Central Appalachian Coal ($/Ton) $0 $2 $4 $6 $8 $10 2004 2005 2006 2007 2008 2009 |
 79 … but Power’s diverse asset portfolio and hedging strategy has mitigated the effects, providing strong results. *See page 122 for Items excluded from Income from Continuing Operations to reconcile to Operating Earnings Commodity prices have been volatile… |
 80 -$10 $0 $10 $20 $30 $40 $50 2005 2006 2007 2008 2009 2010 2011 2012 $0 $10 $20 $30 $40 $50 $60 $70 2005 2006 2007 2008 2009 2010 2011 2012 Annual Average Historical Monthly Forecast Note: Forward prices as of February 2010 Forward spark spreads and dark spreads are showing some moderation… PJM Western Hub Spark Spread (On-Peak – Henry Hub x 7.5 Heat Rate) PJM Western Hub Dark Spread (RTC – Central Appalachian Coal x 10 Heat Rate) … and are expected to remain highly influenced by gas prices. |
 81 $40 $45 $50 $55 $60 $65 Power’s assets are well positioned near load centers… … which resulted in a 9% growth in PJM gross margin from 2008 to 2009. Historical 5-year Average PJM Energy Price (Around the Clock) Note: excludes Dominion (less than 5 years of history) |
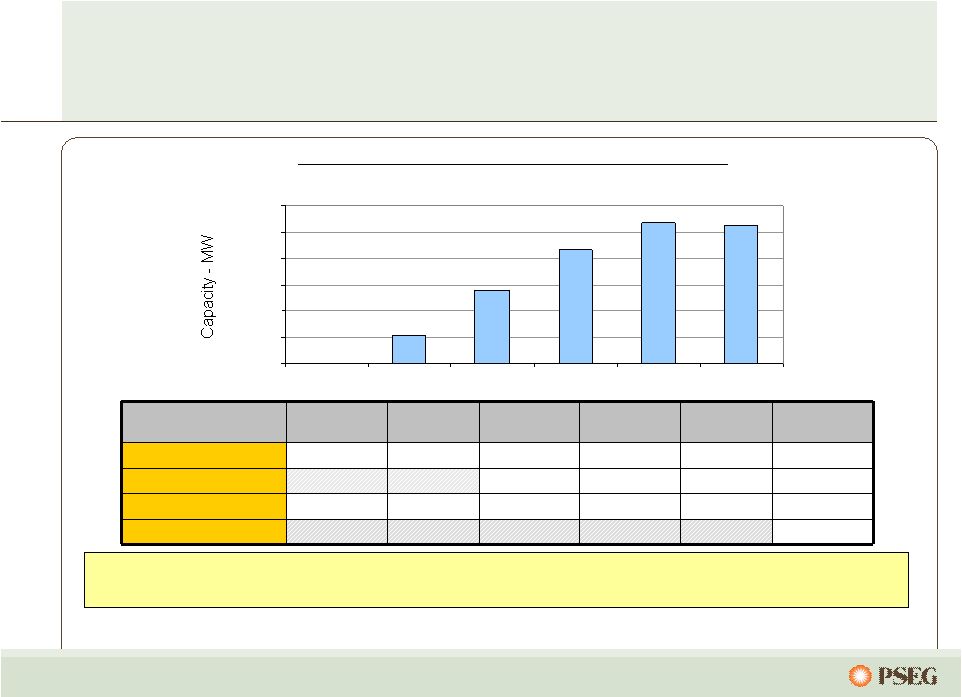 82 … and provides a forward price signal, with the 2013/2014 auction set for May. PJM’s capacity construct has acknowledged the value of Power’s fleet… $185.00 PSEG North Zone $16.46 $110.00 $174.29 $102.04 $111.92 $40.80 Rest of Pool $133.37 $110.00 $174.29 $191.32 MAAC $139.73 $110.00 $174.29 $191.32 $148.80 $197.67 Eastern MAAC 2012 / 2013 2011 / 2012 2010 / 2011 2009 / 2010 2008 / 2009 2007 / 2008 $/MW-day PJM Zones With nearly 1/3 of its capacity in PS North and nearly 2/3 of its capacity in MAAC and EMAAC, Power’s assets in congested locations received higher pricing in the 2012/2013 RPM Auction. PJM Capacity Available to Receive Auction Pricing 0 2,000 4,000 6,000 8,000 10,000 12,000 07/08 08/09 09/10 10/11 11/12 12/13 |
 83 0% 25% 50% 75% 100% 2010 2011 2012 $0 $10 $20 $30 $40 $50 $60 $70 $80 $90 0% 25% 50% 75% 100% 2010 2011 2012 $0 $50 $100 $150 Power’s hedging program provides near- term stability from market volatility… … while remaining open to long-term market forces. Estimated EPS impact of $10/MWh PJM West around the clock price change* (~$2/mmbtu gas change) Contracted Capacity Price (right scale) * As of February 2010 Assuming normal market commodity correlation and demand ** Excludes Texas – No capacity market Power has contracted for a considerable percentage of its future output over the next two years at attractive prices. The pricing for most of Power’s capacity has been fixed through May 2013, with the completion of auctions in PJM and NE. % sold (left scale) $0.35 - $0.65 $0.20 - $0.40 $0.05 - $0.15 Contracted Energy Price (right scale) % sold (left scale) ** * |
 84 Power is advantaged… … as we pursue a path to seize the opportunities of tomorrow. Right Assets, Right Markets Operational Flexibility Environmental Infrastructure investment Well positioned, environmentally sound fleet compares favorably vs the industry Investing in back-end technology and other growth opportunities to prepare us for the future Diverse fleet of low cost units in competitive liquid markets located near customers/load centers Units along the dispatch curve with fuel flexibility and improved performance provide value in dynamic market 2010 |
 PSEG – Financial Review and Outlook Caroline Dorsa Executive Vice President and Chief Financial Officer |
 86 PSEG… …is focused on providing above average risk-adjusted returns. Top quartile performance in operations with year- over-year improvements and cost management. Maintain balance between risk and return through prudent balance sheet management Met/exceeded earnings and financial objectives Securing premium value in transparent, competitive markets; implementing mechanisms supporting cost recovery in reasonable timeframe |
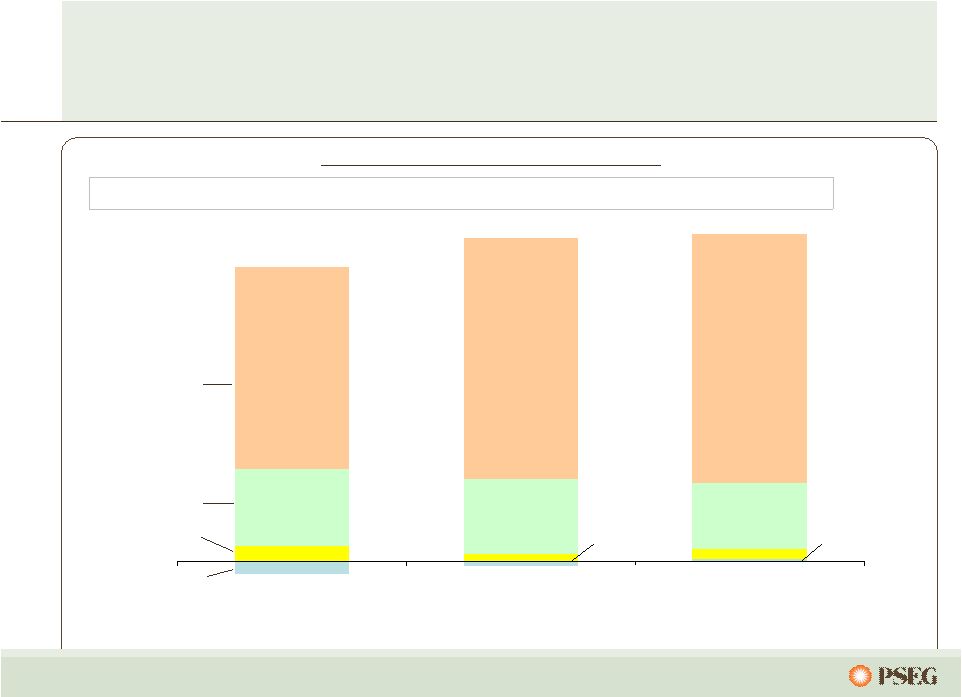 87 $(0.12) $0.14 $0.74 $1.92 $0.02 $(0.05) $0.09 $0.07 $0.63 $0.71 $2.38 $2.30 2007 2008 2009 $3.12* We have met or exceeded our earnings objectives … … and expect 2010 earnings to remain strong. Holdings PSE&G Power Parent Earnings per Share by Subsidiary $2.68* *See page 122 for Items excluded from Income from Continuing Operations to reconcile to Operating Earnings $3.00 - $3.25 $2.80 - $3.05 $2.30 - $2.50 Guidance Range $3.03* |
 88 $2,091 $1,993 $163 $30 2008 2009 Sustainability Plan Non-pension O&M Expense (1) Pension Expense Manage Staffing Levels Control General and Administrative Expenses Capture Productivity Gains (1) Excludes O&M related to PSE&G clauses We have successfully managed our O&M … … through benchmarking efforts and operational excellence. $2,121M $2,156M |
 89 Earnings were strong in 2009… …benefiting from pricing, cost control and risk mitigation. $3.12 $3.03 2008* PSE&G Power Holdings / Enterprise 2009* ($0.08) $0.08 $0.09 Interest 0.03 Debt Exchange Premium Eliminated in Consolidation 0.04 Recontracting and Lower Fuel Expense 0.04 BGSS and Wholesale Power Trading 0.01 O&M 0.02 Interest 0.03 Depreciation and Other (0.02) Margin – Gas, Electric, Transmission and Appliance Service 0.04 Weather (0.01) O&M (0.06) Depreciation (0.03) Taxes (0.03) Interest 0.01 2009 Lease Sales 0.13 Lease Income (0.04) Effective Tax Rate and Other (0.03) Debt Exchange Premium Eliminated in Consolidation (0.04) Holdings: Enterprise: *See page 122 for Items excluded from Income from Continuing Operations to reconcile to Operating Earnings |
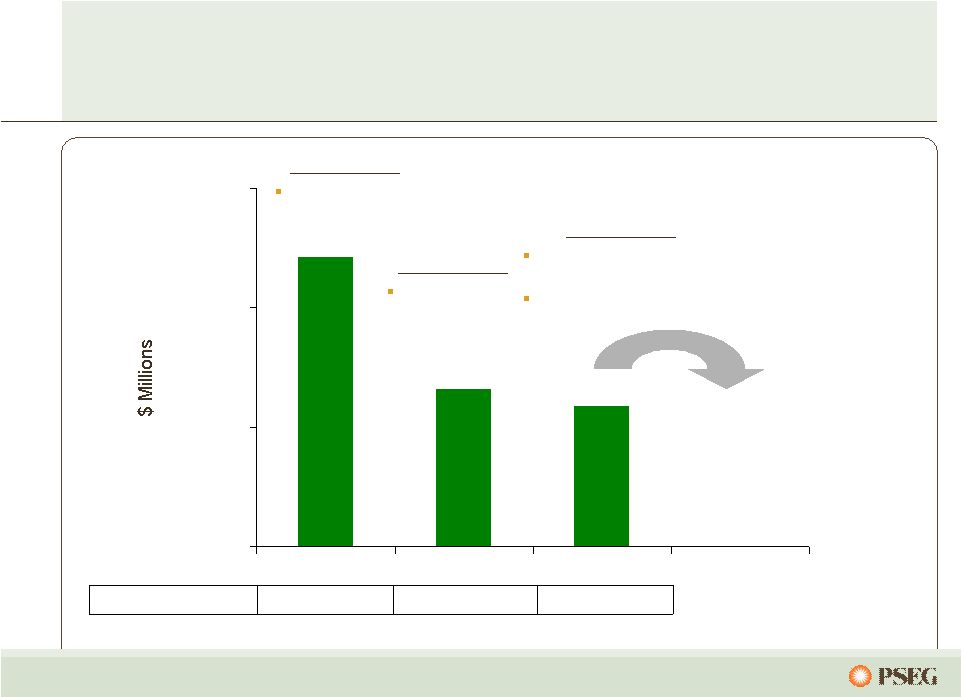 90 Cash Exposure Net of $320M of IRS Deposits 12/31/08 12/31/09 1/31/10 4 5 17 # of LILO/SILO Leases 2009 Activities Terminated 12 LILO / SILO leases 2010 Activities Terminated 1 lease in January Pursue additional lease termination opportunities 2008 Activities Terminated 1 LILO / SILO lease Exposure to our potential lease tax liability… …was reduced with aggressive asset management. $660 ~$1,200 ~$270 ~$590 $- $500 $1,000 $1,500 |
 91 $1,000 $1,250 $1,500 $1,750 $2,000 $2,250 2009 2010 2011 2012 PSEG Consolidated O&M (1) C.A.G.R. (’09 –’12) = 0.7% (1) Excludes O&M related to PSE&G clauses Aggressive employee management of our O&M, including 2010 wage freeze … …and improving pension expense, will result in modest O&M growth. |
 92 2009 Operating Earnings* 2010 Guidance Rigorous cost controls, hedging strategy and improved utility capital recovery… …help mitigate the risk of weak prices in 2010. $3.12 $3.00 - $3.25 PSE&G: Network Transmission Service (NTS) revenue increase for 2010 from 2009 ~ $0.03 EPS 2009 earned ROE = 8.3% 1% change in Distribution earned ROE in 2010 ~ $0.07 EPS 1% change in load in 2010 ~ $0.02 EPS PSEG Power: Revenue/Margin Nuclear output fully contracted Dark Spread change of $5/MWh at market – impact of $0.03-$0.07/share Spark Spread change of $5/MWh at market – impact of $0.08-$0.12/share Operations 1% change in nuclear capacity factor – impact of $0.01-$0.03/share O&M 1% change – impact of ~$0.01/share Drivers *See page 122 for Items excluded from Income from Continuing Operations to reconcile to Operating Earnings |
 93 PSEG is shifting emphasis to growth investments… …to meet the requirements of the evolving energy markets. Maintenance / Regulatory Investments $2.5B Growth Investments $5.2B Capital Spending by Category Total 2010-2012 Capital: $7.7 Billion Wind (Holdings), $0.02B, 0% New Nuclear, $0.05B, 1% Transmission, $2.14B, 27% Core Investment, $2.18B, 28% |
 94 PSE&G’s capital spending is focused on growth… …with a substantial portion allowed to earn reasonable contemporaneous returns. PSE&G Capital Spending by Category Total 2010-2012 Capital: $5.3 Billion New Business, $0.43B, 8% Renewables, $0.93B, 18% Transmission, $2.14B, 40% Core Investment, $1.26B, 24% |
 95 $- $100 $200 $300 $400 $500 $600 $700 $800 2009 2010 2011 2012 Growth Maintenance / Regulatory Power Growth Capital Spending (2010-2012) Peakers - $306M Nuclear Uprates - $136M New Nuclear - $53M Other - $32M Power’s capital spend is expected to decline… … with increased emphasis on growth projects in the future. |
 96 $0 $1,000 $2,000 $3,000 $4,000 $5,000 Sources Uses In 2009, we had substantial cash generation … PSEG Consolidated 2009 Sources and Uses Power Cash from Ops Shareholder Dividend Gross Lease Proceeds PSE&G Investment …which was applied toward improving our financial profile. Debt Redemptions Lease Termination Taxes & IRS Deposit Debt Issuances PSE&G Cash from Ops(1) Power Investment (1) PSE&G Cash from Operations adjusts for securitization principal repayments of ~ $190M Regulated investment Eliminated Parent Long-term debt and minimized Holdings’ debt Reduced Tax Risk |
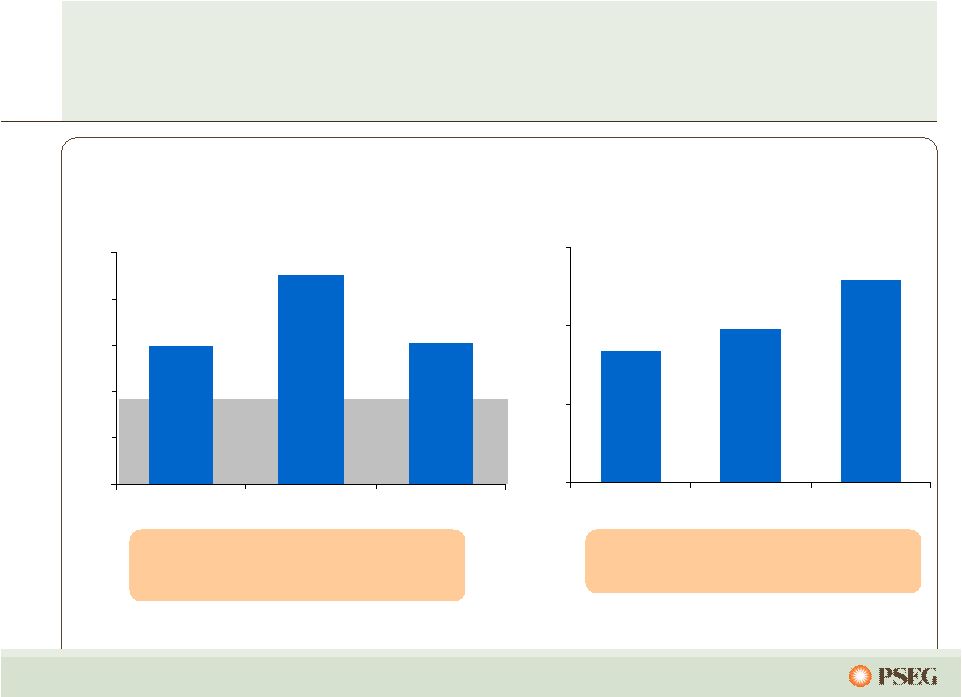 97 25% 30% 35% 40% 45% 50% 2007 2008 2009 • 2009 FFO to Debt remained strong comfortably above minimum threshold level • Decline from 2008 expected due to Power debt exchange which reduced Holdings refinancing risk 40% 45% 50% 55% 2007 2008 2009 PSEG Power Funds from Operations / Total Debt PSE&G Regulatory Equity Ratio Key credit measures support our planned investment program Our balance sheet also provides a platform for future growth. Target = 51.2% |
 98 Sources Uses PSEG Power’s internally generated cash flow enables Power… … to strengthen its long term balance sheet; support the shareholder dividend; and, allows PSE&G to retain earnings for growth. Sources Uses Cash from Ops Net Debt Redemption Investment Dividends to Parent for payment to shareholders Power 2009–2012 Sources and Uses Cash from Ops* Net Debt Issuance Intercompany Capital Contribution Investment PSE&G 2009-2012 Sources and Uses * Cash from Operations adjusts for securitization principal repayments ~ $0.8B |
 99 PSEG Consolidated Debt / Capitalization (1) Long-Term Debt includes Debt due within one year; excludes Securitization Debt and Non-Recourse Debt. PSEG Consolidated ($Millions) December 31, 2007 December 31, 2008 December 31, 2009 PSEG Total Short-term Debt 65 20 530 Long-Term Debt (1) : Power 2,902 2,903 3,121 PSE&G 3,353 3,523 3,571 Holdings 1,137 505 127 Parent / Services 298 249 (38) Total Long-Term Debt 7,690 7,180 6,781 Preferred Stock 80 80 80 Total Common Stockholders' Equity 7,299 7,771 8,788 TOTAL CAPITALIZATION 15,134 $ 15,051 $ 16,179 $ PSEG Consolidated ($Millions) December 31, 2007 December 31, 2008 December 31, 2009 Debt 7,755 7,200 7,311 Preferred Stock 80 80 80 Total Common Stockholders' Equity 7,299 7,771 8,788 Debt Plus Equity 15,134 $ 15,051 $ 16,179 $ Debt Ratio 51.2% 47.8% 45.2% |
 100 At the end of 2009, Power and Parent available liquidity totals approximately $2.4 billion … … with additional $800 million available to PSE&G. Expiration Total Usage at Available Liquidity Company Facility Date Facility 12/31/2009 12/31/2009 ($Millions) Parent / Power 5-Year Credit Facility (Power) Dec-12 $1,600 1 $117 $1,483 5-year Credit Facility (PSEG) Dec-12 1,000 2 523 477 2-Year Credit Facility Jul-11 350 0 350 Bilateral Credit Facility Mar-10 100 42 58 Uncommitted Bilateral Agreement 26 Total Parent / Power Liquidity $3,050 $2,368 PSE&G 5-year Credit Facility Jun-12 $ 600 3 $ - $ 600 ST Investment 211 Total PSE&G Liquidity $ 600 $ 811 Total Liquidity Available $3,179 1 Power Facility reduced by $75 million in 12/2011 2 PSEG Facility reduced by $47 million in 12/2011 3 PSE&G Facility reduced by $28 million in 12/2011 |
 101 $0.0 $0.5 $1.0 $1.5 $2.0 $2.5 $3.0 $3.5 $4.0 2010 2011 2012 Power Syndicated Facility - 1.60B Expires 12/2012 Power 2-Year Facility - 0.35B Expires 7/2011 PSEG Syndicated Facility - 1.00B Expires 12/2012 Power Bilateral - .10B Expires 3/2010 With our current facilities, PSEG/Power will have at least $2.6 billion of credit capacity through 2012 ... Non-PSE&G Credit Capacity ...and we will continue to ensure adequate liquidity. |
 102 PSEG value proposition PSEG provides investors with a balanced portfolio of assets within a shifting landscape for energy. PSEG’s focus on operational excellence and O&M control will yield benefits now, and over the long-term. PSEG’s capital commitments are focused on improving reliability and service quality at attractive risk-adjusted returns. PSEG’s strong balance sheet and cash flow support a capital program that will benefit shareholders through ongoing support of dividends and opportunity for future growth. |
 103 PSEG is advantaged… … with a strong balance sheet and cash flow to pursue an investment program that seizes the opportunities of tomorrow. Right Assets, Right Markets Operational Flexibility Environmental Infrastructure Improvements Integrated business model with assets located close to load centers Dispatch flexibility of operating assets and trading capability supports margins in full-requirements markets Environmentally responsible; pursuing investments in renewables; nuclear uprates Investments to improve reliability and functionality of grid 2010 |
 Executive Profiles |
 105 Ralph Izzo Chairman, President and Chief Executive Officer Public Service Enterprise Group Incorporated Ralph Izzo was elected chairman and chief executive officer of Public Service Enterprise Group Incorporated (PSEG), in April 2007. He was also named as the company’s president and chief operating officer, and a member of the board of directors of PSEG, in October 2006. Prior, Mr. Izzo was president and chief operating officer of Public Service Electric and Gas Company (PSE&G). Since joining PSE&G in 1992 Mr. Izzo was elected to several executive positions within PSEG’s family of companies, including PSE&G senior vice president – utility operations, PSE&G vice president – appliance service, PSEG vice president - corporate planning, Energis Incorporated senior vice president – finance and information services, and PSE&G vice president - electric ventures. In these capacities, he broadened his experience in the areas of general management, strategic planning and finance. Mr. Izzo is a well-known leader within the utility industry, as well as the public policy arena. His public policy experience includes service as an American Physical Society Congressional Science Fellow, in the office of U.S. Senator Bill Bradley. He also served four years as a senior policy advisor in the Office of New Jersey Governor Thomas H. Kean, specializing in energy, science and technology. Mr. Izzo’s career began as a research scientist at the Princeton Plasma Physics Laboratory, performing numerical simulations of fusion energy experiments. He has published or presented over 35 papers on magnetohydrodynamic modeling. Mr. Izzo received his Bachelor of Science and Master of Science degrees in mechanical engineering and his Doctor of Philosophy degree in applied physics from Columbia University. He also completed the requirements for a Master of Business Administration degree, with a concentration in finance from the Rutgers Graduate School of Management. He is listed in numerous editions of Who’s Who and has been the recipient of national fellowships and awards. Mr. Izzo is chairman of the board for the Drumthwacket Foundation. He serves on the board of directors for the New Jersey Chamber of Commerce, the New Jersey Utilities Association, the Edison Electric Institute (EEI), the Nuclear Energy Institute (NEI) and The Center for Energy Workforce Development, and Rutgers – The State University of New Jersey. |
 106 J.A. “Lon” Bouknight, Jr. Executive Vice President and General Counsel Public Service Enterprise Group Incorporated J.A. Bouknight, Jr. (“Lon”) was named executive vice president and general counsel in January, 2010. In this position, he has general supervisory responsibilities for the law department, office of the corporate secretary, and corporate security and claims. Bouknight had been a partner in the Washington law office of Steptoe & Johnson, where he has served as a member of the regulatory and industry affairs department and as former chairman of the firm. His practice focuses on the electric power industry and on antitrust and competition issues in both regulated and unregulated industries. From 2005 to 2008, Bouknight served as executive vice president and general counsel of Edison International, a major electric company based in California. A graduate of Duke University School of Law, he has authored a number of articles and lectured extensively on energy industry and competition topics. |
 107 Daniel J. Cregg Vice President – Finance Power PSEG Services Corporation Daniel J. Cregg was named vice president – finance power for PSEG Services Corporation, in December 2006. Prior to this appointment he was director – financial reporting and communications at PSEG Power (Power), where he oversaw financial reporting and forecasting, investor communications, financings, rating agency interactions, external reporting, and cash forecasting. He previously held leadership positions with Power in the areas of financial valuations, competitive intelligence, and fundamental market modeling; with critical responsibilities in Power’s development and strategic planning activities. Previously, Mr. Cregg was director of PSEG corporate development. He joined PSEG in 1991 with overall responsibility for tax planning, strategy and compliance for PSEG Energy Holdings, including domestic and international tax structuring work for PSEG Global and PSEG Resources. Prior to joining PSEG Mr. Cregg spent five years with the accounting and consulting firm of Deloitte and Touche, providing consulting services to a wide array of clients with an emphasis on the energy industry. Mr. Cregg has been involved in raising awareness and funding for Sudden Infant Death Syndrome (SIDS) for the last ten years. He is also an executive sponsor for Power’s diversity council and is a member of PEGPAC, PSEG’s Political Action Committee. Mr. Cregg holds a Master of Business Administration degree from the Wharton School of the University of Pennsylvania and is a graduate of Lehigh University, where he received a bachelor’s degree in accounting. |
 108 Caroline Dorsa Executive Vice President and Chief Financial Officer Public Service Enterprise Group Incorporated Public Service Electric and Gas Company PSEG Services Corporation Ms. Dorsa is responsible for all financial functions, including Internal Audit Services. She also leads the Information Technology and Procurement organizations. She is a member of PSEG’s corporate executive leadership team. Ms. Dorsa had been a Director of Public Service Enterprise Group Inc. (PSEG) since 2003, and a member of PSEG's Audit, Corporate Governance and Finance Committees. Ms. Dorsa joined PSEG from Merck & Co., Inc. where she most recently served as senior vice president – global human health, strategy and integration. Immediately prior to her most recent role at Merck, Ms. Dorsa held positions as senior vice president and chief financial officer at both Avaya, Inc., and Gilead Sciences, Inc. Earlier in her career, she held a range of financial positions at Merck, including serving as vice president and treasurer of the company for over 12 years. She was also the Secretary of the Finance Committee of Merck's Board of Directors. Prior to joining Merck, Ms. Dorsa worked for Mayor Edward Koch of the City of New York promoting economic development in midtown Manhattan. Ms. Dorsa is a member of the Board of Trustees of the Newark Museum and a member of the Junior Achievement of New Jersey State Board of Directors in Princeton, NJ. She is also a member of the Board of Directors of Biogen Idec (NASDAQ: BIIB), a biopharmaceutical company located in Cambridge, MA. Ms. Dorsa holds a B.A. from Colgate University and an M.B.A from Columbia Business School. Caroline Dorsa was named executive vice president and chief financial officer for Public Service Enterprise Group Incorporated (PSEG) in April 2009. She is also the executive vice president and chief financial officer of Public Service Electric and Gas Company (PSE&G), and PSEG Services Corporation. |
 109 Clarence (Joe) Hopf, Jr. President PSEG Energy Resources & Trade Clarence (Joe) Hopf, Jr. was named president of PSEG Energy Resources & Trade in June 2008. His responsibilities include management of PSEG Power’s generation portfolio and basic gas supply service, purchasing of fuel, mid- and back-office operations as well as trading and marketing activities. Prior to joining PSEG, Mr. Hopf was president of PPL EnergyPlus in Allentown, PA, since 2006. He was responsible for managing PPL’s wholesale/retail marketing and trading operation in the United States. Mr. Hopf has held a variety of posts with increasing responsibility in the electric generation and energy trading business since 1981. Prior to joining PPL in 2005 as a senior vice president, he served as a vice president at Goldman Sachs in New York and, before that, at AmerenEnergy in St. Louis. |
 110 Anne E. Hoskins Senior Vice President – Public Affairs & Sustainability PSEG Services Corporation Anne E. Hoskins was named senior vice president – Public Affairs and Sustainability of PSEG Services Corporation, in January 2010. In this position, she is responsible for PSEG’s federal and state governmental affairs, corporate philanthropy and sustainability and leads the development of public policy positions on issues affecting the company. Ms. Hoskins is also a member of PSEG’s Executive Officer Group. Prior to joining PSEG, Ms. Hoskins served as senior and regulatory counsel for Verizon Wireless, working from offices in Washington and New Jersey. Ms. Hoskins also served as an associate in the Newark law firm of McCarter and English, an attorney in the United States Office of the Comptroller of the Currency, and as Policy Adviser in the Governor’s Office of Policy and Planning in New Jersey. Ms. Hoskins holds a Doctor of Law degree from Harvard Law School, a Masters of Public Affairs degree from the Woodrow Wilson School at Princeton University, and a Bachelor of Science degree from Cornell University. Ms. Hoskins serves as a trustee on The Nature Conservancy of New Jersey and is on the Board of New Jersey Future. |
 111 Thomas P. Joyce President and Chief Nuclear Officer PSEG Nuclear Thomas P. Joyce was named president and chief nuclear officer of PSEG Nuclear (Nuclear), in October 2008. He had been senior vice president – operations of Salem/Hope Creek for Nuclear, since June 2007. Mr. Joyce was also vice president – Salem, since January 2007, and previously assumed the role of PSEG Nuclear’s site vice president as part of the Nuclear Operating Services Agreement between PSEG and Exelon Corporation. Mr. Joyce has more than 32 years of experience in commercial nuclear power operations, and led Salem through two successful reactor vessel head replacement outages. Salem Unit 1 completed its outage for the lowest station dose, while capturing the world record for shortest head replacement outage. Prior to coming to PSEG Mr. Joyce was site vice president at Exelon Nuclear’s Braidwood Station. During his tenure the station achieved overall performance improvements and retained their excellent INPO rating. The plant completed a refueling in 15 days, 14 hours – setting a record for outage efficiency among U.S. pressurized water reactors. Before serving at Braidwood he held leadership positions at Exelon’s Byron, Dresden, and Zion Stations, and in the corporate offices of both Exelon Corporation and Exelon Nuclear. Mr. Joyce holds a Bachelor of Science degree in nuclear engineering from the University of Missouri at Rolla, and a Master of Business Administration degree from the Keller Graduate School of Management. While at Byron, he earned his senior reactor operation (SRO) license. |
 112 Ralph A. LaRossa President and Chief Operating Officer Public Service Electric and Gas Company Ralph A. LaRossa was named president and chief operating officer of Public Service Electric and Gas Company (PSE&G), in October 2006. Prior to this position he was vice president - electric delivery for PSE&G. Mr. LaRossa joined PSE&G in 1985 as an associate engineer and advanced through a variety of management positions in the utility’s gas and electric operations. Past positions include vice president - delivery operations support, division manager - Metropolitan electric division, director - distribution operations, manager - gas distribution, project manager for AWMS (automated work management system), assistant division manager, district manager and field engineer in gas distribution. PSE&G is New Jersey’s largest electric and gas utility. Mr. LaRossa is a graduate of Stevens Institute of Technology with a Bachelor of Engineering degree in industrial engineering, and has completed the Harvard Business School’s Program for Management Development. In 1998 he received Gas Industry Magazine’s Outstanding Manager of the Year Award. He is a member of the PJM Designated Officers Committee. He serves on the board of directors for the American Gas Association (AGA), New Jersey Utilities Association (NJUA), New Jersey Performing Arts Center (NJPAC), Partnership for a Drug-Free NJ, and Bergen County’s United Way. He also serves as a board of trustee’s member for Montclair State University, Newark Alliance, New Jersey Institute for Social Justice, and the Liberty Science Center. |
 113 William Levis President and Chief Operating Officer PSEG Power Previously, Mr. Levis was also senior vice president and chief nuclear officer, as part of the Nuclear Operating Services Agreement between PSEG and Exelon Corporation. Under his leadership Nuclear’s Salem and Hope Creek stations have advanced to the highest performance levels in the stations' history. Improvement in the stations' work environment has resulted in the closing of two long standing NRC cross-cutting issues - problem identification and resolution, and safety conscious work environment. Mr. Levis has more than 25 years of diversified experience in the nuclear power industry. Before coming to PSEG he was Exelon Nuclear’s vice president Mid-Atlantic operations, where he provided executive oversight of day-to-day operations of the Limerick, Peach Bottom, Three Mile Island and Oyster Creek Stations. He joined Exelon as the Byron Station Manager in 1998 and was promoted to site vice president the following year. In 2001 he was named site vice president at Limerick Generating Station. Prior to joining Exelon Mr. Levis worked at Ontario Hydro's Pickering Plant and held several positions over a five-year period with Carolina Power & Light’s Brunswick facility. During this time the station was removed from the NRC Watch List and set new records in the areas of safety, production and cost. Mr. Levis’ background also includes experience with NRC, Westec Services, General Electric Nuclear Services and the U.S. Navy. He has a Bachelor of Science degree in marine engineering from the U.S. Naval Academy and holds an SRO (senior reactor operator) certification. Mr. Levis retired as a commander in the Naval Reserves and attained his professional engineer license in 1985. William Levis was elected president and chief operating officer of PSEG Power (Power), effective June 2007. He had been president and chief nuclear officer of PSEG Nuclear (Nuclear) since January 2007, while retaining his position as Power’s president and COO. Power is a major unregulated independent power producer in the U.S. with three main subsidiaries: PSEG Fossil, PSEG Nuclear, and PSEG Energy Resources and Trade. |
 114 Randall E. Mehrberg Executive Vice President, Strategy & Development PSEG Services Corporation President PSEG Energy Holdings Randall E. Mehrberg is president of PSEG Energy Holdings and Chairman of the Board of Energy Storage & Power. PSEG Energy Holdings develops, manages and owns renewable energy solutions including solar, energy storage and off shore wind. PSEG Energy Holdings also owns power plants in the United States and energy and other investments in the United States and abroad. Mehrberg is also PSEG’s executive vice president responsible for corporate strategy, public affairs, policy, mergers and acquisitions, and corporate communications. He is a member of PSEG’s corporate executive leadership team and has responsibility for overseeing the corporate balanced scorecard. Mehrberg’s responsibilities include PSEG’s emergent technology and transfer group, ensuring development of a corporate strategy that includes a comprehensive assessment of the role of technology in the future of our industry. Mehrberg joined PSEG after serving for eight years in various executive leadership positions at Chicago-based Exelon Corp., most recently as executive vice president, chief administrative officer and chief legal officer. Prior to his tenure at Exelon, Mehrberg was an equity partner in the Chicago law firm of Jenner & Block, where he worked from 1980 to 1993 and again from 1997 to 2000. He represented corporations, individuals, not-for-profits and government entities in a broad range of matters. From 1993 to 1997 he served as lakefront director and general counsel for the City of Chicago’s Park District. Mehrberg holds a Doctor of Law degree from the University of Michigan Law School and a Bachelor of Science degree in economics magna cum laude from the University of Pennsylvania’s Wharton School of Business. He has been active in a number of business and civic organizations, including serving as vice chairman of the board of Nuclear Electric Insurance Limited. Mr. Mehrberg currently serves as a board member of the University of Pennsylvania Medical School and the University of Michigan Law School, NJN Television Foundation, Millennium Park and the Lincoln Park Zoo. Mehrberg has been the recipient of numerous awards, such as the AJC Judge Learned Hand Human Relations Award, the Mexican-American Legal Defense and Education Fund Legal Services Award, the Chicago Bar association David C. Hilliard Award, the Catholic Charities Award for Service to the Poor, and the H.O.P.E. for the People Award – Man of the Year. |
 115 Margaret M. Pego Senior Vice President – Human Resources and Chief Human Resources Officer PSEG Services Corporation Margaret M. Pego was named senior vice president – human resources and chief human resources officer of PSEG Services Corporation, in December 2006. Prior, she had been vice president – human resources. Ms. Pego joined PSEG in 1974, and has held a variety of management positions in the human resources department. Ms. Pego holds a Bachelor of Arts degree in business administration from William Paterson College, and a Master of Business Administration degree with a concentration in management and labor relations from Seton Hall University. In addition, she holds a certificate in EEO studies from Cornell University, and has also completed the Human Resources Executive Program at the University of Michigan. She is also certified as a senior professional in human resources. Ms. Pego is active in several local and national organizations; including the EEI Chief HR Executives Policy Committee; the American Gas Association HR Policy Committee; The Conference Board Advisory Council of HR Management – Council of HR Executives; Center for Energy Workforce Development (CEWD) Executive Counsel Chair; and the Society for Human Resources Management. She is a former member of the Supreme Court of New Jersey Attorney Ethics Committee. Ms. Pego is a 2002 Leadership New Jersey graduate, a 1997 TWIN Honoree, 2006 Executive Woman of New Jersey Honoree and 2008 NJ Best 50 Women in Business Honoree. In addition, she is a member of the board of trustees of the American Conference on Diversity, the Boys and Girls Club Concert for Kids Committee, College of Saint Elizabeth, Leadership New Jersey, Rutgers Business School and the Children’s Specialized Hospital. |
 Appendix |
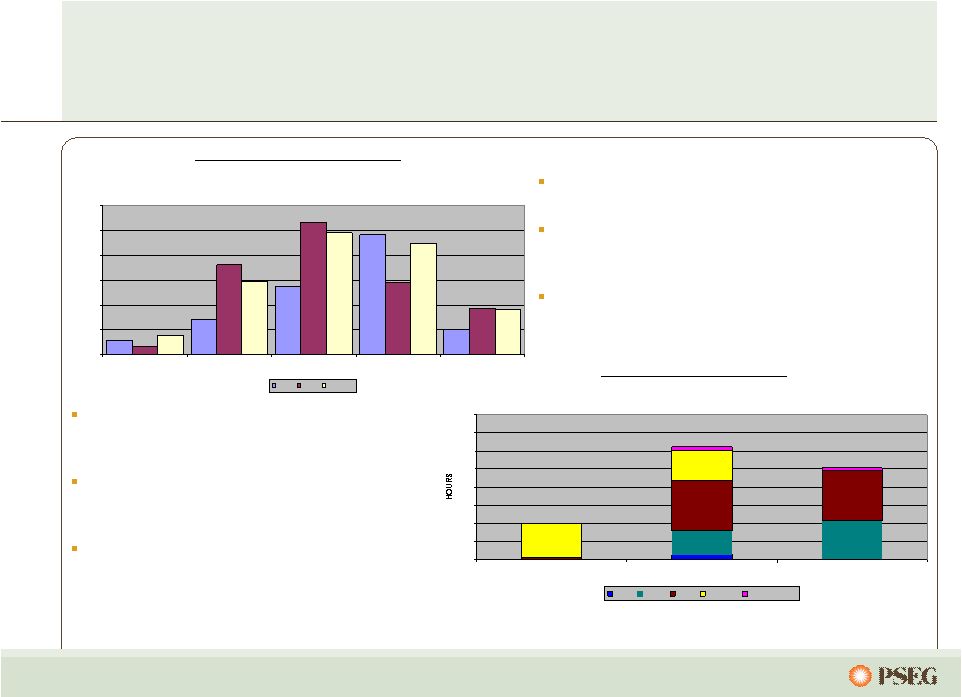 117 2009 summer weather greatly impacted earnings … Hours 90 o F or Greater 27 43 55 55 38 33 5 2.0 3 5 0 20 40 60 80 100 120 140 160 2009 Normal 2008 May June July August September Monthly Temperature-Humidity Index 2009 vs. 2008 and Normal 586 1,412 2,776 4,834 1,017 336 3,620 5,324 2,930 1,870 766 2,944 4,904 4,511 1,806 0 1,000 2,000 3,000 4,000 5,000 6,000 May June July August September 2009 2008 Normal Monthly weather correlates to the impact on monthly kWh sales and Residential revenue. 2009 summer weather was unfavorable for sales. It was both cooler than normal and cooler than the weather that occurred in 2008 Unseasonably cool June and July more than offset relatively warm August. Hourly weather correlates to the impact on monthly peak demands (kW) and Commercial and Industrial revenue. The number of peak producing hours, defined as greater than 90 o F were much lower than both 2008 and what would be normally expected. Only August had a significant number of hourly temperature readings in the 90s in 2009. Summer Hourly Weather Summer Monthly Summary … exemplified by the hours greater than 90 degrees. |
 118 PSE&G is developing innovative energy solutions to align with the State’s EMP goals. Residential Commercial Pole Mounted Industrial photo courtesy of enXco 2009, D.Holey PSE&G Site Projects 3 rd Party Site Projects Solar installed at PSE&G owned facilities Solar to be owned by PSE&G and installed on any public or private third-party host sites Solar Loan Programs Solar 4 All Programs |
 119 New Jersey regulatory agency changes The Governor appoints the five Commissioners, who must be confirmed by the Senate, for six-year staggered terms. The Governor appoints one of the five to serve as Commission President. Currently, the five commissioners are: Elizabeth Randall, Acting President Nicholas Asselta Jeanne M. Fox Joseph L. Fiordaliso Frederick F. Butler Lee Solomon has been nominated for Commission President, to replace Frederick F. Butler Assembly Bill No. 1391 has been introduced to reduce the number of BPU Commissioners from five to three Former Public Advocate Chin resigned in January 2010; Stefanie Brand, Director of Rate Counsel appointed Acting Public Advocate Public Advocate role being transformed |
 120 Operated by PSEG Nuclear PSEG Ownership: 100% Technology: Boiling Water Reactor Total Capacity: 1,199MW Owned Capacity: 1,199MW License Expiration: 2026 Filed for license extension, August 2009 Operated by PSEG Nuclear Ownership: PSEG - 57%, Exelon – 43% Technology: Pressurized Water Reactor Total Capacity: 2,345MW Owned Capacity: 1,346MW License Expiration: 2016 and 2020 Filed for license extension, August 2009 Operated by Exelon PSEG Ownership: 50% Technology: Boiling Water Reactor Total Capacity: 2,234MW Owned Capacity: 1,117MW License Expiration: 2033 and 2034 Hope Creek Salem Units 1 and 2 Peach Bottom Units 2 and 3 Our five unit nuclear fleet… … is a critical element of Power’s success. |
 121 PSEG Power Debt / Capitalization (1) Power Short-Term debt represents the Intercompany Loan with PSEG. (2) Long-Term Debt includes Debt due within one year and excludes Non-Recourse Debt. Dec 07 Dec 08 Dec 09 Power Short-Term Debt (1) 238 $ 3 $ 194 $ (Short-Term Investments) - - Power Long-Term Debt (2) 2,902 2,903 3,121 Member's Equity 3,551 4,322 4,467 Total Capitalization 6,691 7,228 7,782 Power Debt To Capitalization Dec 07 Dec 08 Dec 09 Short Term Debt 238 $ 3 $ 194 $ Long-Term Debt 2,902 2,903 3,121 Member's Equity 3,551 4,322 4,467 Total Capitalization 6,691 $ 7,228 $ 7,782 $ Total Debt to Cap 46.9% 40.2% 42.6% FFO to Debt 39.9% 47.6% 40.2% |
 122 Items Excluded from Income from Continuing Operations to Reconcile to Operating Earnings Please see Page 3 for an explanation of PSEG’s use of Operating Earnings as a non-GAAP financial measure and how it differs from Net Income. Pro-forma Adjustments, net of tax 2009 2008 2007 2006 2005 Earnings Impact ($ Millions) Gain (Loss) on Nuclear Decommissioning Trust (NDT) Fund Related Activity 9 $ (71) $ 12 $ 11 40 Gain (Loss) on Mark-to-Market (MTM) (25) 16 10 28 (9) Lease Transaction Reserves - (490) - - - Net Reversal of Lease Transaction Reserves 29 - - - - Asset Sales and Impairments - (13) (32) (178) - Premium on Bond Redemption - (1) (28) (7) (6) Merger-related Costs - - - (8) (32) Total Pro-forma adjustments 13 $ (559) $ (38) $ (146) $ 25 $ Fully Diluted Average Shares Outstanding (in Millions) 507 508 509 505 489 Per Share Impact (Diluted) Gain (Loss) on Nuclear Decommissioning Trust (NDT) Fund Related Activity 0.02 $ (0.14) $ 0.02 $ 0.02 $ 0.08 $ Gain (Loss) on Mark-to-Market (MTM) (0.05) 0.03 0.02 0.06 (0.02) Lease Transaction Reserves - (0.96) - - - Net Reversal of Lease Transaction Reserves 0.05 - - - - Asset Impairments - (0.03) (0.06) (0.35) - Premium on Bond Redemption - - (0.06) (0.01) (0.01) Merger-related Costs - - - (0.02) (0.07) Total Pro-forma adjustments 0.02 $ (1.10) $ (0.08) $ (0.30) $ (0.02) $ For the Twelve Months Ended December 31, Reconciling Items Excluded from Continuing Operations to Compute Operating Earnings (Unaudited) PUBLIC SERVICE ENTERPRISE GROUP INCORPORATED |