 PSEG Public Service Enterprise Group 2010 Edison Electric Institute Financial Conference November 1-2, 2010 Exhibit 99 |
 2 Forward-Looking Statement Readers are cautioned that statements contained in this presentation about our and our subsidiaries' future performance, including future revenues, earnings, strategies, prospects, consequences and all other statements that are not purely historical, are forward-looking statements for purposes of the safe harbor provisions under The Private Securities Litigation Reform Act of 1995. When used herein, the words “anticipate”, “intend”, “estimate”, “believe”, “expect”, “plan”, “should”, “hypothetical”, “potential”, “forecast”, “project”, variations of such words and similar expressions are intended to identify forward-looking statements. Although we believe that our expectations are based on reasonable assumptions, they are subject to risks and uncertainties and we can give no assurance they will be achieved. The results or developments projected or predicted in these statements may differ materially from what may actually occur. Factors which could cause results or events to differ from current expectations include, but are not limited to: • Adverse changes in energy industry law, policies and regulation, including market structures, transmission planning and cost allocation rules, including rules regarding who is permitted to build transmission going forward, and reliability standards. • Any inability of our transmission and distribution businesses to obtain adequate and timely rate relief and regulatory approvals from federal and state regulators. • Changes in federal and state environmental regulations that could increase our costs or limit operations of our generating units. • Changes in nuclear regulation and/or developments in the nuclear power industry generally that could limit operations of our nuclear generating units. • Actions or activities at one of our nuclear units located on a multi-unit site that might adversely affect our ability to continue to operate that unit or other units located at the same site. • Any inability to balance our energy obligations, available supply and trading risks. • Any deterioration in our credit quality. • Availability of capital and credit at commercially reasonable terms and conditions and our ability to meet cash needs. • Any inability to realize anticipated tax benefits or retain tax credits. • Changes in the cost of, or interruption in the supply of, fuel and other commodities necessary to the operation of our generating units. • Delays in receipt of necessary permits and approvals for our construction and development activities. • Delays or unforeseen cost escalations in our construction and development activities. • Adverse changes in the demand for or price of the capacity and energy that we sell into wholesale electricity markets. • Increase in competition in energy markets in which we compete. • Adverse performance of our decommissioning and defined benefit plan trust fund investments and changes in discount rates and funding requirements. • Changes in technology and customer usage patterns. For further information, please refer to our Annual Report on Form 10-K, including Item 1A. Risk Factors, and subsequent reports on Form 10-Q and Form 8-K filed with the Securities and Exchange Commission. These documents address in further detail our business, industry issues and other factors that could cause actual results to differ materially from those indicated in this presentation. In addition, any forward-looking statements included herein represent our estimates only as of today and should not be relied upon as representing our estimates as of any subsequent date. While we may elect to update forward-looking statements from time to time, we specifically disclaim any obligation to do so, even if our internal estimates change, unless otherwise required by applicable securities laws. |
 3 GAAP Disclaimer PSEG presents Operating Earnings in addition to its Net Income reported in accordance with accounting principles generally accepted in the United States (GAAP). Operating Earnings is a non-GAAP financial measure that differs from Net Income because it excludes gains or losses associated with Nuclear Decommissioning Trust (NDT), Mark-to-Market (MTM) accounting, and other material one-time items. PSEG presents Operating Earnings because management believes that it is appropriate for investors to consider results excluding these items in addition to the results reported in accordance with GAAP. PSEG believes that the non-GAAP financial measure of Operating Earnings provides a consistent and comparable measure of performance of its businesses to help shareholders understand performance trends. This information is not intended to be viewed as an alternative to GAAP information. The last two slides in this presentation include a list of items excluded from Income from Continuing Operations to reconcile to Operating Earnings, with a reference to that slide included on each of the slides where the non-GAAP information appears. |
 PSEG – Defining the Future Caroline Dorsa Executive Vice President and Chief Financial Officer |
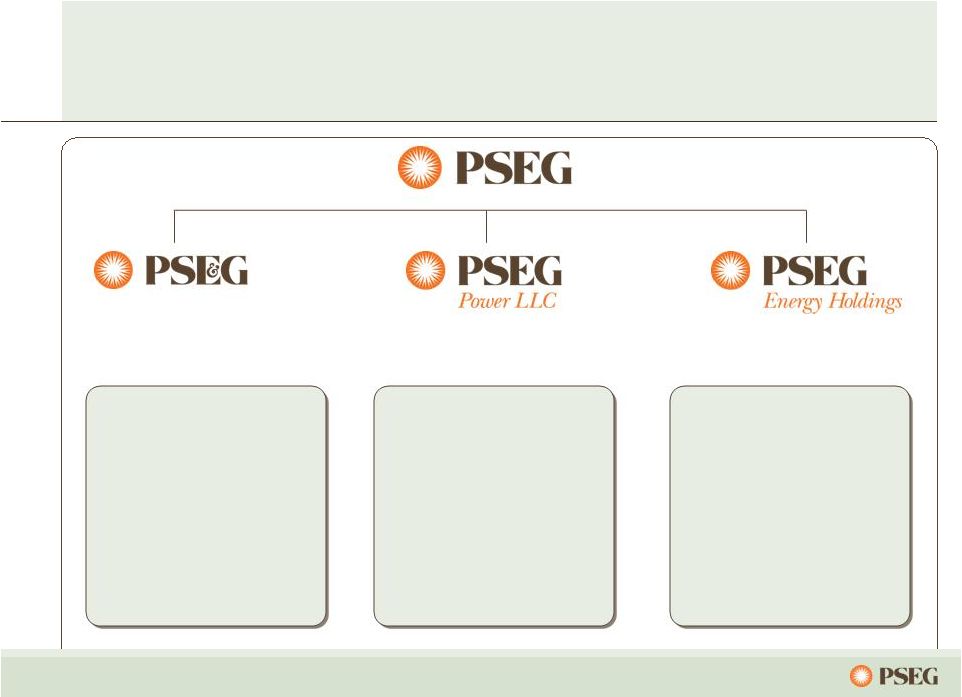 5 PSEG: the right mix for the opportunities of today and tomorrow PSE&G positioned to meet NJ’s energy policy and economic growth objectives. Electric & Gas Delivery and Transmission PSEG Power’s low-cost, load following fleet is geographically well positioned and environmentally responsible. Regional Wholesale Energy PSEG Energy Holdings positioned to pursue attractive renewable generation opportunities. Renewable Investments |
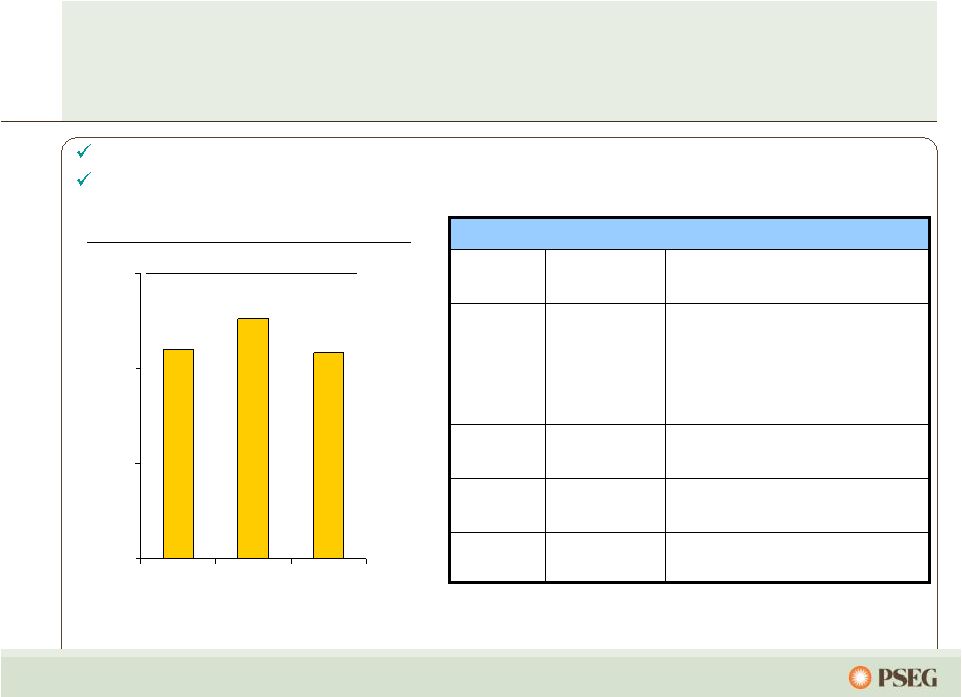
 6 A successful track record… … provides the confidence to capitalize on the opportunities of tomorrow. PSEG Power resumed independent control of nuclear fleet, produced record levels of generation and achieved top quartile performance; fossil fleet retrofitted to meet more stringent environmental requirements. PSE&G consistently recognized for reliability; investment programs expanded to meet NJ’s goals for economic growth and clean energy. Business focus improved; balance sheet strengthened; Holdings’ financial risk lessened with sale of international investments, termination of offshore leases. Operational and financial focus has allowed PSEG to meet/exceed earnings objectives in each of the past three years. History of returning cash to shareholders through common dividend. 2007 2008 2009 |
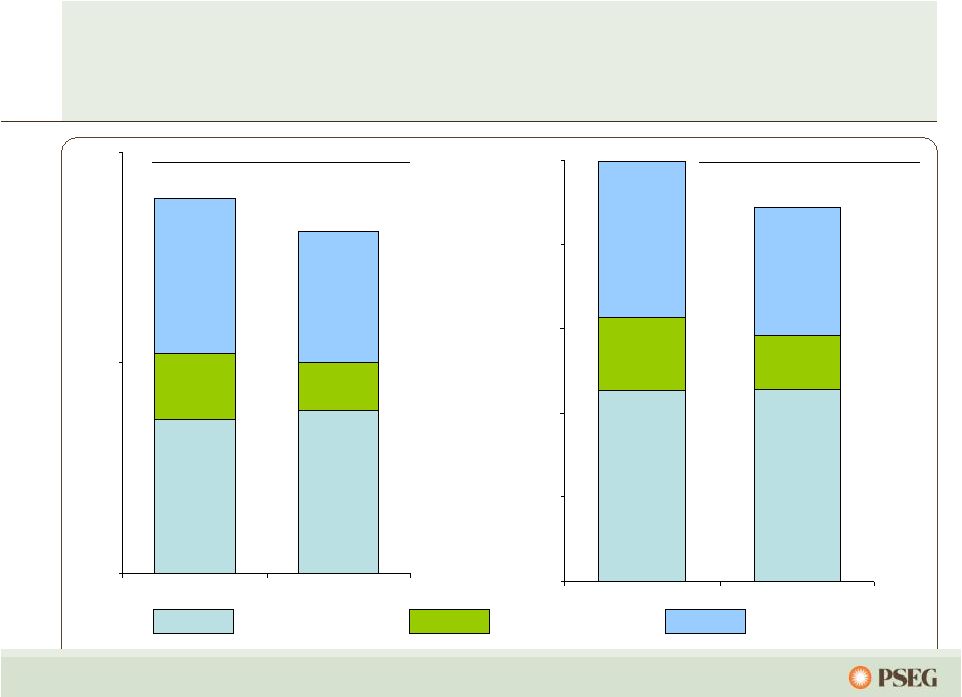
 7 Tomorrow’s energy market will reward… …an operationally efficient, environmentally responsible, integrated generation, transmission and distribution business. Higher margins driven by environmentally responsible & operationally flexible energy supply Superior operations = customer satisfaction + higher value Business driven by the need to address environmental issues and stable pricing Infrastructure investment to support reliability + improve performance |
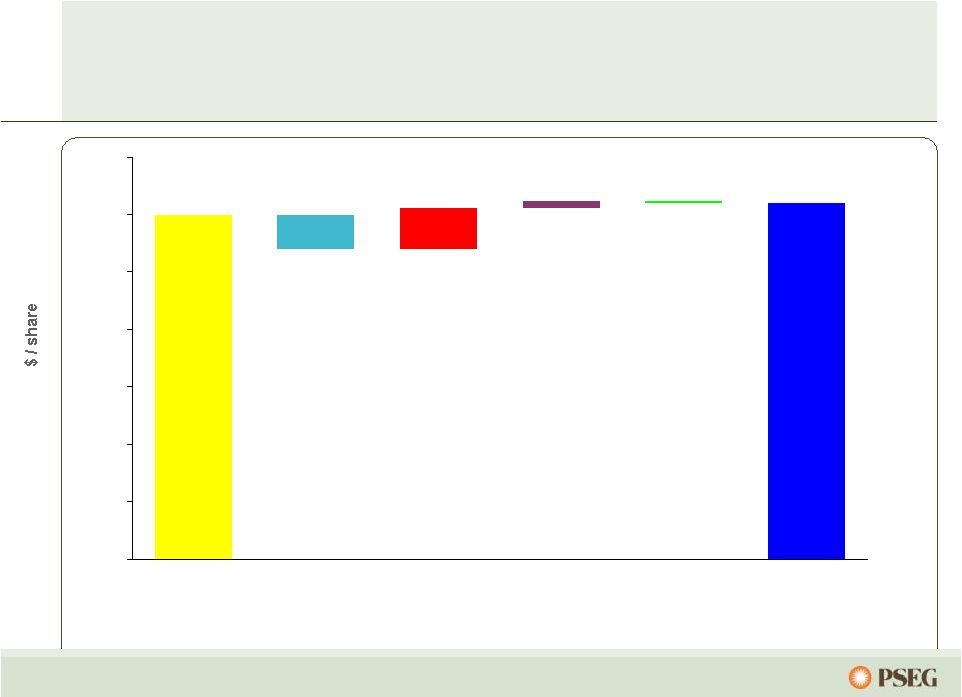
 8 Investment programs, hedge profile and cost control support 2010 outlook * See page 65 for Items excluded from Income from Continuing Operations to reconcile to Operating Earnings. $3.12 $3.00 - $3.25 2009 Operating Earnings* 2010 Guidance |
 PSEG Power |
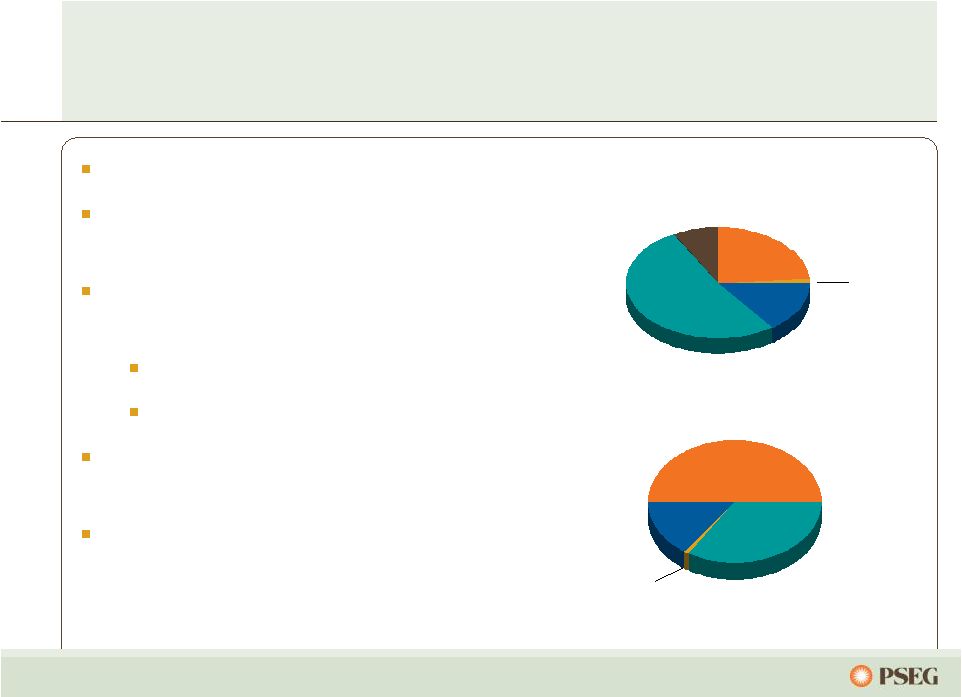 10 Low-cost portfolio Regional focus in competitive, liquid markets Assets favorably located near customers/load centers Many units east of PJM constraints Southern NEPOOL/ Connecticut Texas assets – exploring sale of 2,000 MW of combined cycle generation Market knowledge and experience to maximize the value of our assets … with low cost plants, in good locations, within solid markets. Power’s assets drive value in a dynamic environment… 15% 52% 8% Fuel Diversity Coal Gas Oil Nuclear Pumped Storage 1% Energy Produced (Twelve months ended 12/31/ 2009) Total GWh: 59,808 51% 15% 34% Pumped Storage & Oil <1% Nuclear Coal Gas (As of 12/31/2009: Total MW Capacity: 15,548) 24% 8% |
 11 Power’s 13,500 MW of Northeast assets are located in attractive markets near load centers… ... and, exploring sale of 2,000 MW of gas -fired assets in Texas. |
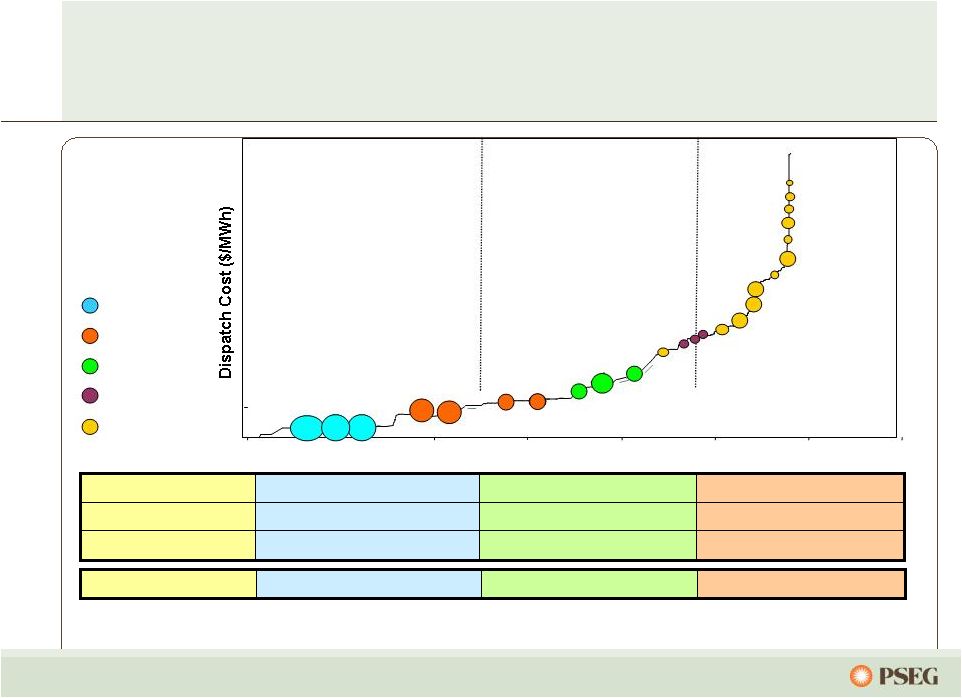 … while maintaining optionality under a variety of conditions. Power’s PJM assets along the dispatch curve reduce the risk of serving full requirement load contracts… X X Ancillary Revenue X X X X Capacity Revenue X X Energy Revenue X X Dual Fuel Salem 3 Peaking units Baseload units Load following units Illustrative Salem Hope Creek Keystone Conemaugh Hudson 2 Linden 1,2 Burlington 8-9-11 Edison 1-2-3 Essex 10-11-12 Bergen 1 Sewaren 1-4 Hudson 1 Mercer1, 2 Bergen 2 Sewaren 6 Mercer 3 Kearny 10-11 Linden 5-8 / Essex 9 Burlington 12 / Kearny 12 Peach Bottom Nuclear Coal Combined Cycle Steam Peaking Yards Creek National Park Bergen 3 12 |
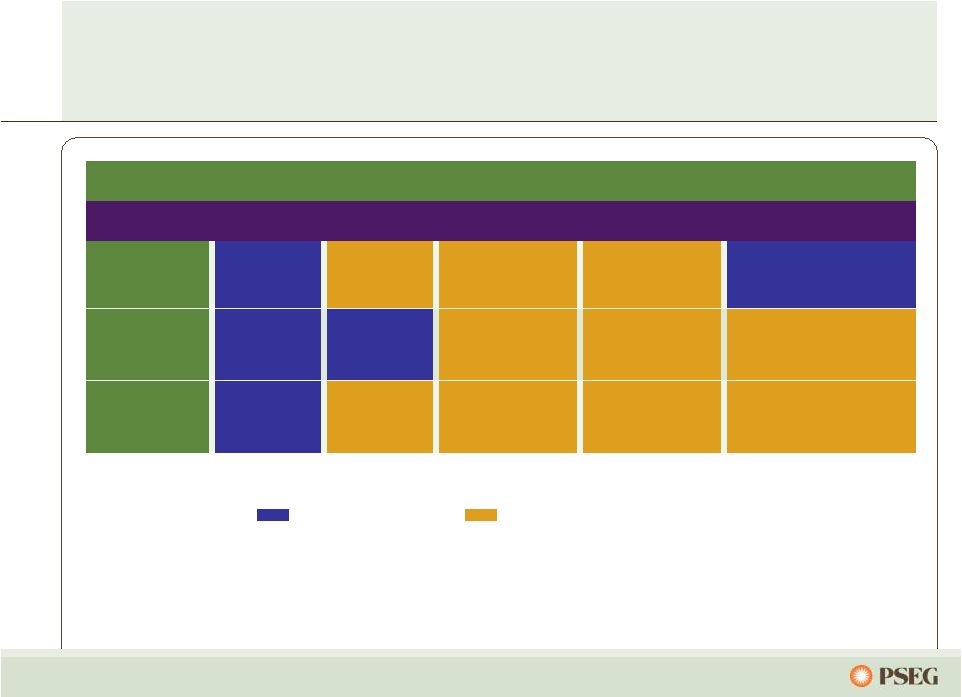 13 Power’s portfolio is well positioned… Baghouse* Scrubber 2010 SCR Mercer (NJ) Baghouse 2010* Scrubber 2010 SCR 2010 Hudson (NJ) Mercury/ Particulate SO 2 NOx Description Current Regulations and Compliance Measures Baghouse* Ultra-low Sulfur Coal Low NOx Burners Bridgeport (CT) Scrubber* Scrubber* Scrubber Scrubber SCR 2014 SCR Conemaugh (PA) Keystone (PA) …to meet current regulatory requirements. Capital Spend Planned No Additional Capital Spend Planned * Hg MACT compliant. |
 14 Increasingly stringent environmental requirements could significantly impact the electric power industry within the next decade… Major areas where new regulations are currently under development: • Management of Coal Combustion Residuals (CCRs) – Proposed new rule governing the use and disposition of coal combustion by-products under the Resource Conservation and Recovery Act (RCRA). • Clean Air Transport Rule (CATR) – The CATR represents a court-mandated revision to the Clean Air Interstate Rule (CAIR) regulating sulfur dioxide (SO2) and nitrogen oxides (NOx) emissions under the Clean Air Act. • Hazardous Air Pollutants (HAPs) Maximum Achievable Control Technology (MACT) – Forthcoming court-mandated rule that will require coal- and oil-fired steam electric generating units to meet emissions limits for mercury (Hg) and other hazardous air pollutants (HAPs) pursuant to Section 112 of the Clean Air Act. • 316(b) Cooling Water Regulations – Forthcoming rule that will define how best available technology requirements for cooling water intake structures will be applied to large existing electric generating plants under Section 316(b) of the Clean Water Act. • Carbon Legislation / Greenhouse Gas (GHG) Best Available Control Technology (BACT) – Congress may move to establish a carbon cap-and-trade system to reduce GHG emissions from power plants. – Absent Congressional preemption, EPA is developing guidance that will inform how States determine BACT requirements for GHG emissions at major new and modified power plants under the Clean Air Act. |
 15 Various environmental initiatives over 2010-2020 could put 20 GW to 150 GW of existing fossil capacity at risk of retirement… Controls on coal units done or under way Power’s relative position very strong High NOx, SO 2 , Hg (CATR) High Regional High High Industry Impact Emission restrictions net favorable to Power Carbon Peaking fleet replacement strategy Upwind states anticipated to increase NOx stringency Ozone air quality standards (HEDD) EPA required to perform cost-benefit analysis Issue widely shared across industry Potential capital spend exposure Once-through cooling water (316(b)) Power uses dry fly ash systems Ash has been tested as non-hazardous Coal ash regulation Power’s Positioning Issue …but Power’s clean fleet is very competitively positioned for success. |
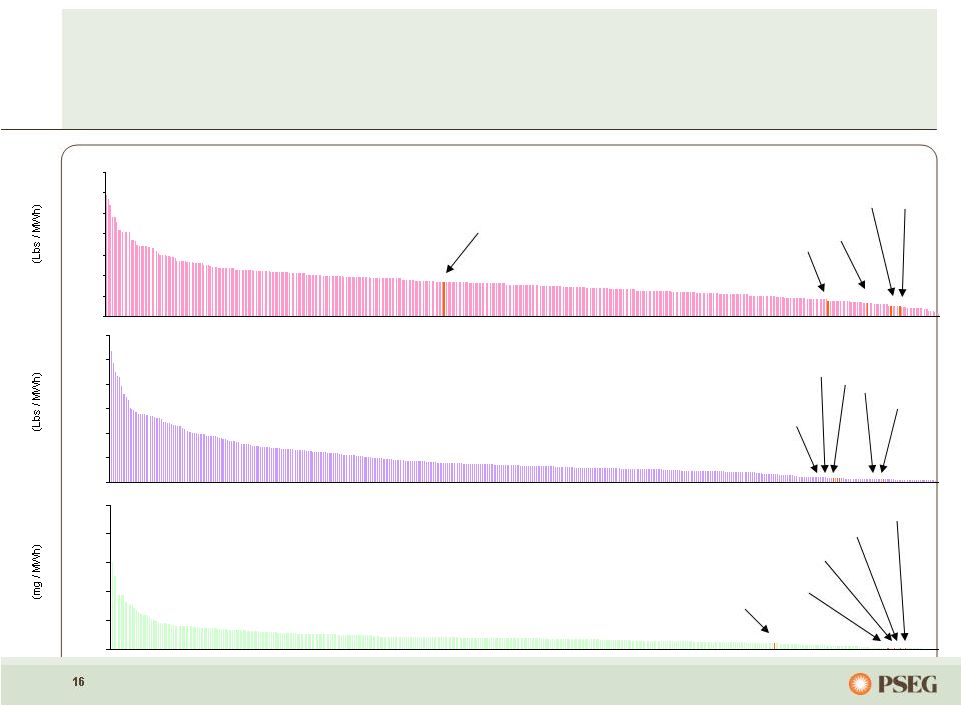 Source: EPA, EIA (2006 and 2007) and PSEG Projection Power’s coal assets will have completed many environmental upgrades by 2010… …resulting in dramatically lower emissions. PSEG Projected NOx Emission Rate for 2011 versus 2008 400 U.S. Coal Plants Conemaugh Hudson Bridgeport Mercer Keystone NOx Keystone Bridgeport Conemaugh Hudson Mercer SO 2 PSEG Projected SO Emission Rate for 2011 Keystone Conemaugh Bridgeport Mercer Mercury PSEG Projected HG Emission Rate for 2011 versus 2008 400 U.S. Coal Plants Hudson 2 versus 2008 400 U.S. Coal Plants 0 2 4 6 8 10 12 14 0 10 20 30 50 60 40 0 50 100 150 200 250 |
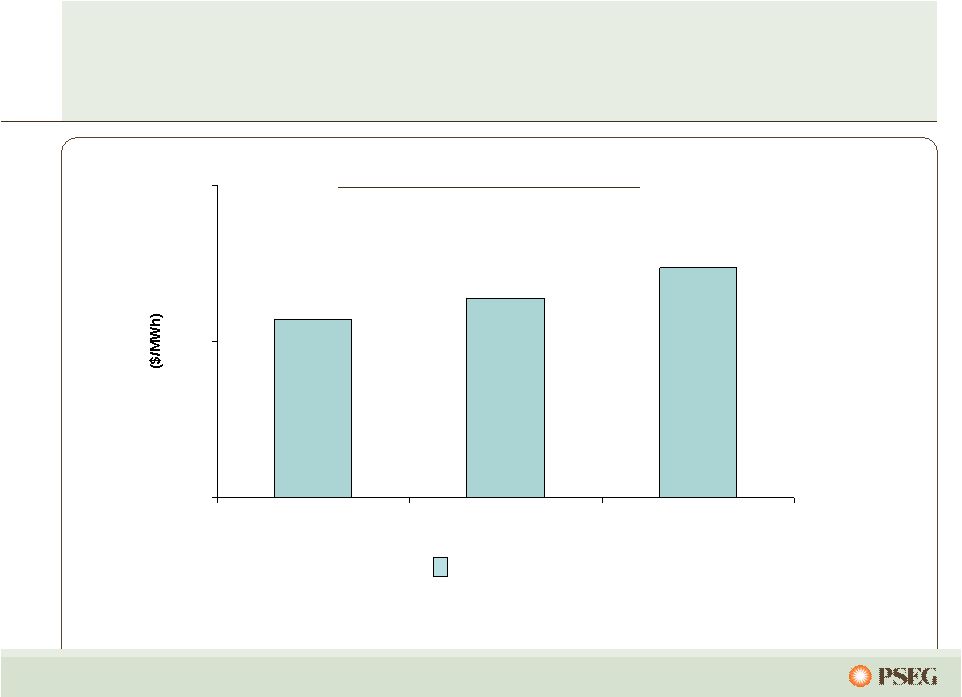
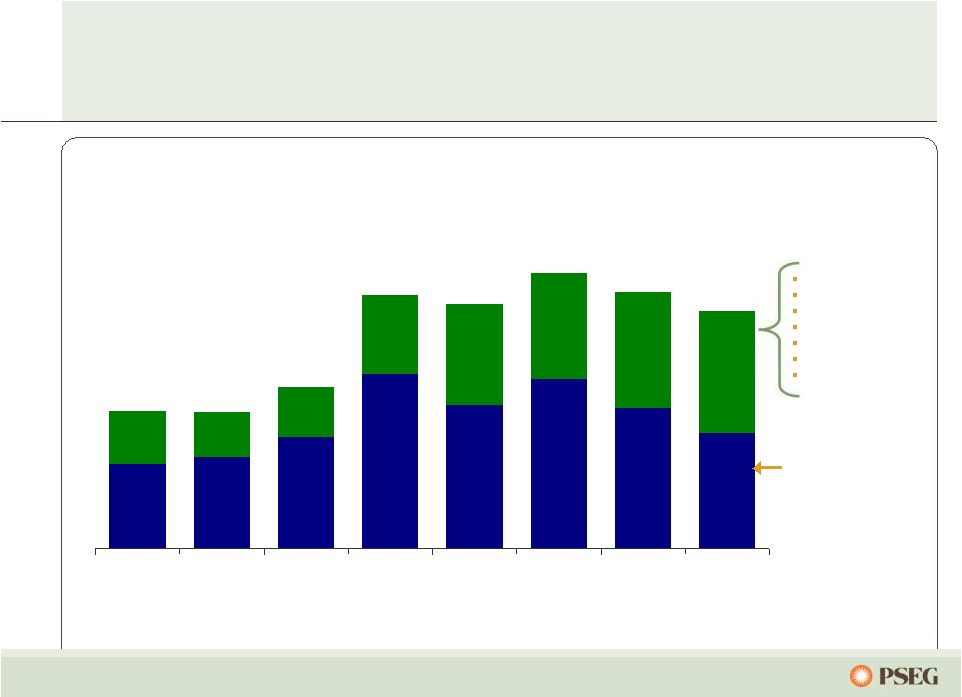 17 Full Requirements Component Increase in Capacity Markets/RPM Growing Renewable Energy Requirements Component for Market Risk The NJ BGS auction is a primary mechanism for hedging price… Market Perspective – BGS Auction Results 2003 2004 2005 2006 2007 2008 2009 2010 3 Year Average Round the Clock PJM West Forward Energy Price $55.59 Capacity Load shape Transmission Congestion Ancillary services Risk premium Green $33 - $34 $36 - $37 $44 - $46 $67 - $70 $58 - $60 $68 - $71 $56 - $58 $48 - $50 ~ $21 $55.05 ~ $18 $65.41 ~ $21 $102.51 ~ $32 $98.88 ~ $41 $111.50 ~ $43 $103.72 ~ $47 $95.77 ~ $47 Note: BGS prices reflect PSE&G Zone … the current embedded cost of energy – relative to market – results in migration. |
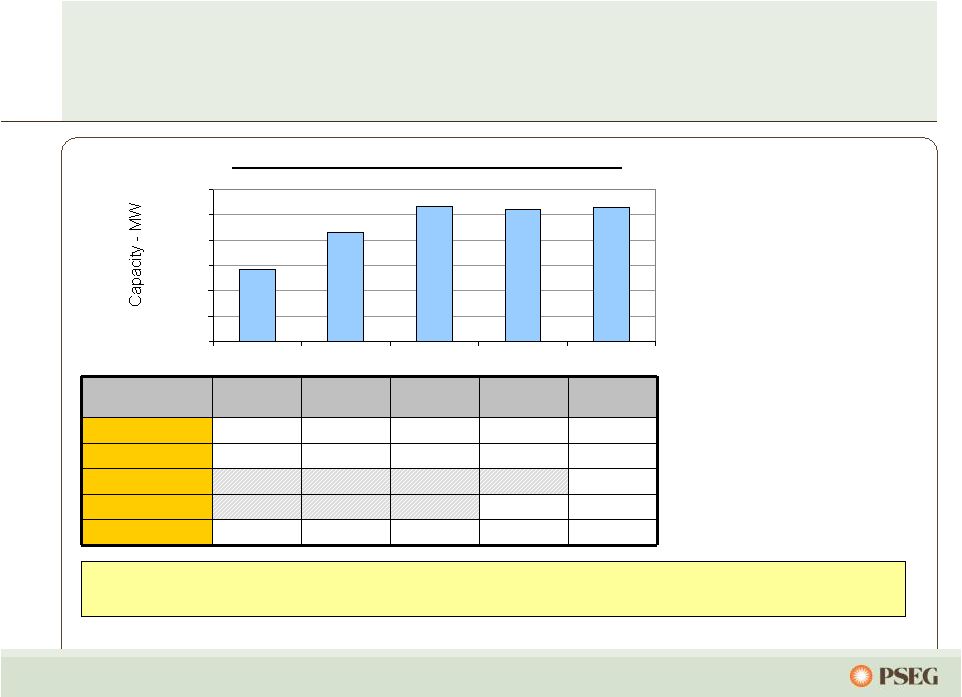 18 … with sites in the eastern part of PJM. Reliability Pricing Model – locational value of Power’s generating fleet recognized… With nearly 1/3 of its capacity in PS North and nearly 2/3 of its capacity in MAAC and EMAAC, Power’s assets in congested locations received higher pricing in the 2013/2014 RPM Auction. PJM Capacity Available to Receive Auction Pricing 0 2,000 4,000 6,000 8,000 10,000 12,000 09/10 10/11 11/12 12/13 13/14 • Locational value of Power’s fleet recognized. • Bid for 89 MW of new capacity accepted for 2013/2014 auction; in-service June 2013. • On schedule to complete 178 MW of previously cleared peaking capacity by June 2012. $27.73 $16.46 $110.00 $174.29 $102.04 Rest of Pool $245.00 $185.00 PSEG North Zone $245.00 PSEG $133.37 $139.73 2012 / 2013 $226.15 $245.00 2013/2014 $110.00 $174.29 $191.32 MAAC $110.00 $174.29 $191.32 Eastern MAAC 2011 / 2012 2010 / 2011 2009 / 2010 $/MW-day PJM Zones |
 19 0% 25% 50% 75% 100% 2010 2011 2012 $0 $10 $20 $30 $40 $50 $60 $70 $80 $90 0% 25% 50% 75% 100% 2010 2011 2012 $0 $50 $100 $150 Power’s hedging program provides near- term stability from market volatility… … while remaining open to long-term market forces. Estimated EPS impact of $10/MWh PJM West around the clock price change* (~$2/mmbtu gas change) Contracted Capacity Price (right scale) * As of September 2010 assuming normal market commodity correlation and demand ** Excludes Texas – No capacity market Power has contracted for a considerable percentage of its future output over the next two years at attractive prices. The pricing for most of Power’s capacity has been fixed through May 2014, with the completion of auctions in PJM and NE. % sold (left scale) $0.40 - $0.70 $0.20 - $0.40 $0.01 - $0.05 Contracted Energy Price (right scale) % sold (left scale) ** * |
 20 The market environment has prompted BGS customer migration … … market conditions will affect future migration. 2009 2010 Power Actions Gradual reset of BGS rates (by one third per year) Market prices strengthened during periods of high weather-related demand in summer 2010 Energy prices lower than expected Migration, at a lower impact per MWh, is anticipated to reduce earnings by an incremental $0.04 per share in 2010 Historic high prices in recent past Low spot market, especially given weak economy and weather Creates incentive for customers to migrate Difference represents loss of margin per MWh $0.08 per share impact to PSEG in 2009 Gradual reset of BGS rates (by one third per year) BGS includes price component for volumetric risk of migration Option strategies being employed to manage changes in load volume Supplying wholesale hedges to third party retail providers Each 5% of migration would reduce earnings by $0.015 per share in 2011 |
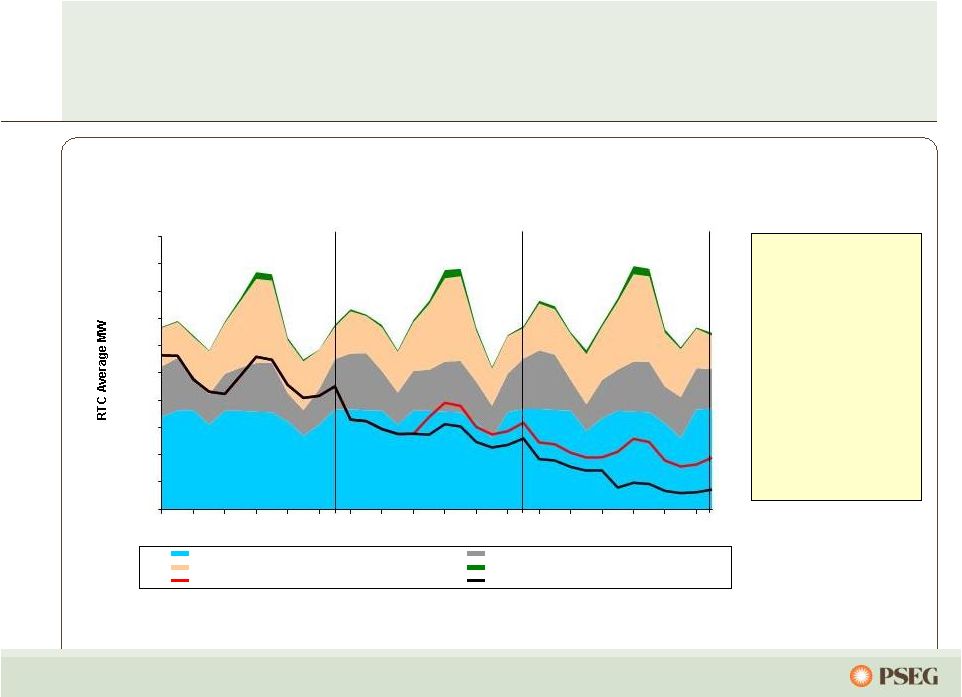 21 The result of Power’s hedging strategy is a portfolio of contracted output… … which dampens the impact of market volatility on earnings in the near term. Power’s anticipated nuclear and coal output is contracted over the next few years: 2010: 100% 2011: 65-70% 2012: 25-30% 0 1000 2000 3000 4000 5000 6000 7000 8000 9000 10000 Nuclear / Pumped Storage Coal Combined Cycle (CC) Steam and Peakers Existing BGS, Other Load Contracts, Hedges + Future BGS Existing BGS, Other Load Contracts, and Hedges 2010 2011 2012 Total Fleet RTC Average |
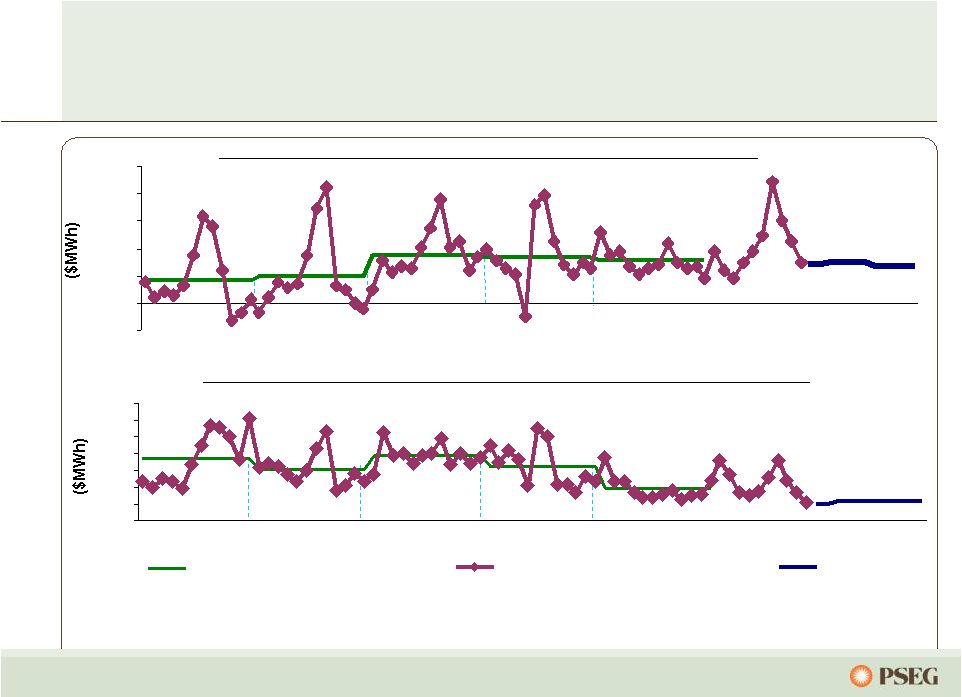 22 Note: Forward prices as of October 2010 Forward spark spreads and dark spreads are showing some moderation… PJM Western Hub Spark Spread (On-Peak – Henry Hub x 7.5 Heat Rate) PJM Western Hub Dark Spread (RTC – Central Appalachian Coal x 10 Heat Rate) … and are expected to remain highly influenced by gas prices. -$10 $0 $10 $20 $30 $40 $50 2005 2006 2007 2008 2009 2010 2011 2012 $0 $10 $20 $30 $40 $50 $60 $70 2005 2006 2007 2008 2009 2010 2011 2012 Annual Average Historical Monthly Forecast |
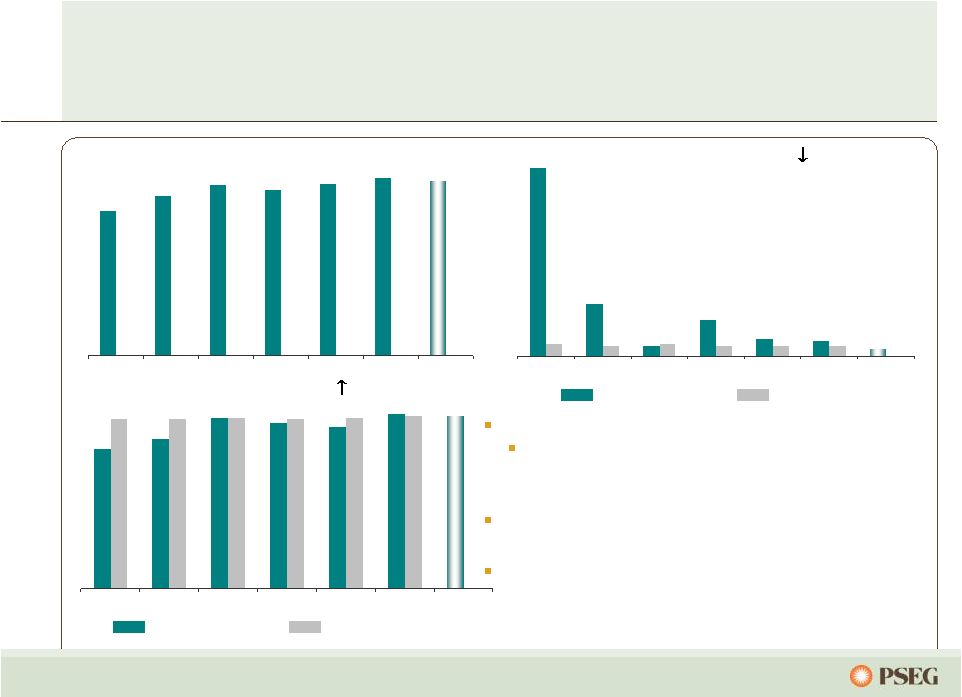 23 Our nuclear performance has improved… 11.1 3.1 0.6 2.1 1.0 0.9 0.4 0.7 0.6 0.7 0.6 0.6 0.6 2004 2005 2006 2007 2008 2009 2010 Target 25 27 29 28 29 30 30 2004 2005 2006 2007 2008 2009 2010 Target 79.0 85.0 97.0 94.0 91.7 99.0 98.0 96 96 97 96 97 98 2004 2005 2006 2007 2008 2009 2010 Target Salem station set a new generation record in 2009. Unscheduled outage in July 2010 is expected to reduced the full-year, fleet capacity factor by 0.5%. Hope Creek scored highest possible INPO rating in its 2010 review. Top quartile INPO Index. … as we maintain our drive for excellence. Nuclear Generation Output* (000’s GWh) Forced Loss Rate ( ) (%) INPO Index ( ) NJ Units 1 Quartile NJ Units 1 Quartile * Total PS share nuclear generation; target established in Q1 2010. st st |
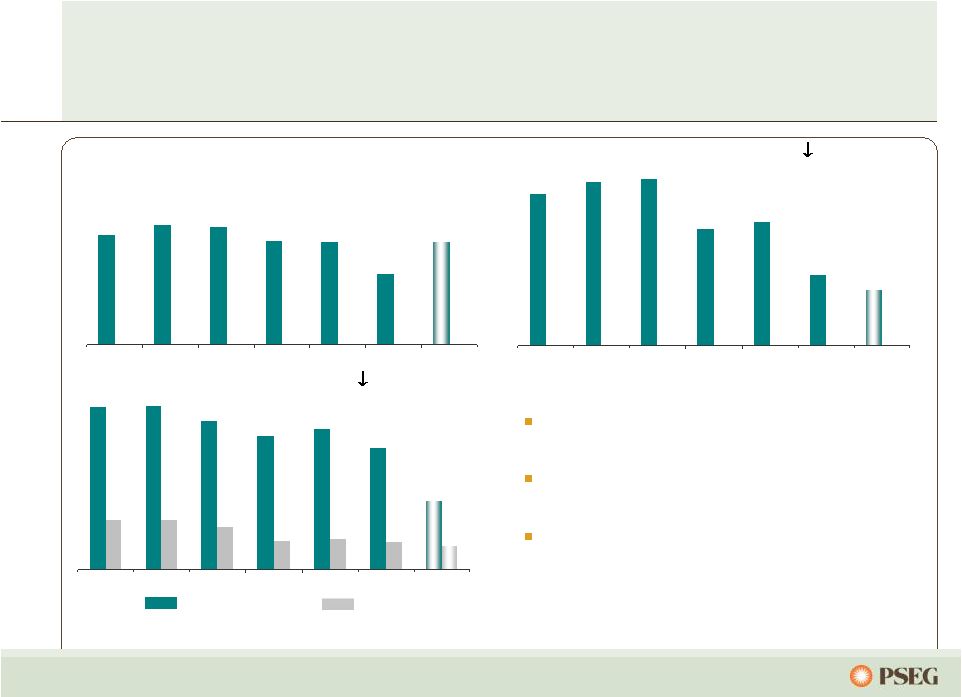 24 Power’s coal fleet has shown improvement… 14 15 15 13 13 9 13 2004 2005 2006 2007 2008 2009 2010 Target 10.3 11.1 11.3 7.9 8.4 4.8 3.8 2004 2005 2006 2007 2008 2009 2010 Target 1.11 1.12 1.01 0.91 0.96 0.83 0.47 0.34 0.34 0.29 0.20 0.21 0.19 0.16 2004 2005 2006 2007 2008 2009 2010 Target Market conditions reduced output in 2009. Operational results greatly improved. Environmental footprint improved. … and back-end technology investments will prepare us for the future. Output (000’s GWh) Forced Outage Rate ( ) (% EFORD) SO 2 and NOx Rates ( ) (lb/mmbtu) SO2 NOx |
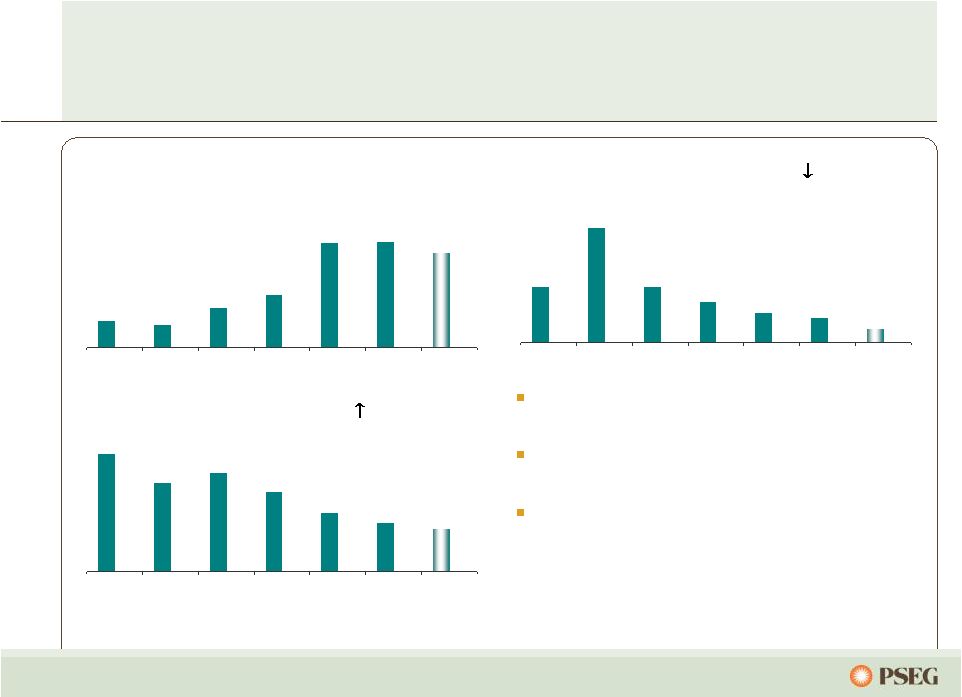 25 Power’s combined cycle fleet is creating value… 5 4 8 10 20 20 18 2004 2005 2006 2007 2008* 2009* 2010 Target* 3.4 7 3.4 2.5 1.8 1.5 0.8 2004 2005 2006 2007 2008* 2009* 2010 Target* 8079 7847 7928 7768 7587 7507 7452 2004 2005 2006 2007 2008* 2009* 2010 Target* Output* (000’s GWh) Forced Outage Rate ( ) (% EFORD) Period Heat Rate ( ) (mmbtu/KWh) Highest output ever in 2009. Approaching top quartile forced outage rate. Benefiting from heat rate improvement program. … benefiting from operating enhancements and market dynamics. * Includes Texas |
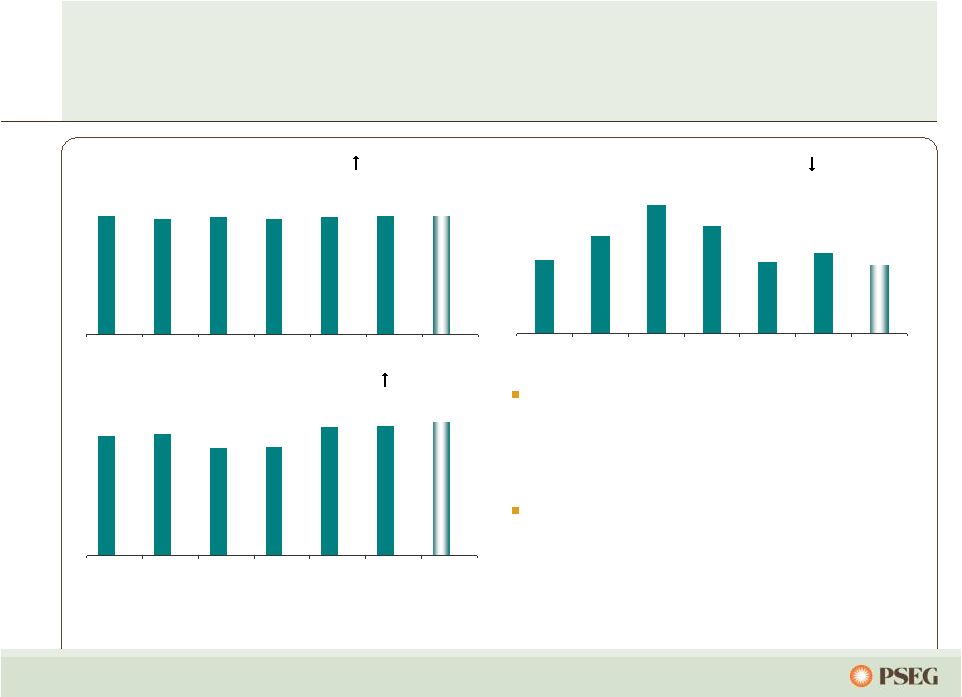 26 % Start Success ( ) Our peaking fleet rounds out a diverse generation portfolio… 13 17 23 19 13 14 12 2004 2005 2006 2007 2008 2009 2010 Target 85 86 76 77 91 92 94 2004 2005 2006 2007 2008 2009 2010 Target Peaking start success provides opportunities in ancillary and real time markets. Peaking adds flexibility in serving load and managing needs of a diverse market environment. … and provides ability to follow load during periods of high demand. Forced Outage Rate ( ) (% EFORD) Equivalent Availability ( ) (%) 99.7 96.5 98.6 97.0 98.9 99.3 99.7 2004 2005 2006 2007 2008 2009 2010 Target |
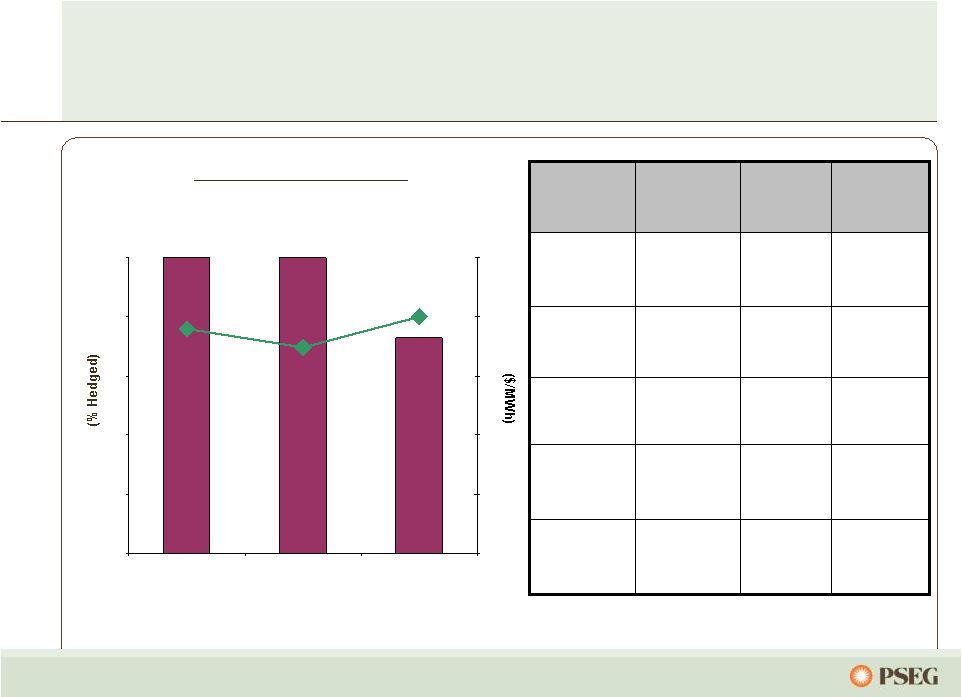 27 Power’s coal hedging reflects 2011 supply matched with 2011 sales… … while maintaining flexibility on supply post BET installation. 0% 20% 40% 60% 80% 100% 2010 2011 2012 $0 $10 $20 $30 $40 $50 Contracted Coal Mid $20’s To High $20’s Mid $20’s To High $20’s Mid $40’s Mid $40’s High $40’s To Mid $40’s Indicative Pricing ($/MWh) Prices lower, moderating Northern Appalachian Conemaugh Prices lower, moderating Northern Appalachian Keystone More limited segment of coal market Metallurgical CAPP/NAPP Mercer Flexibility after BET in 2010 Adaro (2010) CAPP/NAPP (2011+) Hudson Higher price, lower BTU, enviro coal Adaro Bridgeport Harbor Comments Coal Type Station % Hedged (left scale) $/MWh (right scale) Note: 2010 $/MWh = full year |
 PSE&G |
 29 PSE&G is the largest utility in New Jersey providing electric, gas and transmission services… …and delivering renewable and energy efficiency solutions for customers. * Actual ** Weather normalized = estimated annual growth per year over forecast period *** Lifetime GWh + Lifetime Dtherms converted to GWh 60% 31% Residential 36% 58% Commercial 0.9%** 0.4% - 1.3%** Projected Annual Load Growth (2009 – 2012) Sales Mix 3,500 M Therms 41,961 GWh Electric Sales and Gas Sold and Transported (0.4%)* (0.6%)* Historical Annual Load Growth (2005 - 2009) 4% 11% Industrial 1.7 Million 3.2% Gas 2.1 Million 3.0% Customers Growth (2004 – 2009) Electric 0.5%* Historical Annual Peak Load Growth 2005-2009 1,442 Network Circuit Miles Key Statistics Transmission 2.1%** Projected PJM Peak Load Growth 2009-2012 13,512 GWh 230 GWh Energy Efficiency Initiative (lifetime equivalent)*** 80 MW 1 MW Solar 4 All 11.6 MW 2009 Renewables and Energy Efficiency Solar Loan 81 MW Total |
 30 New Jersey Electric & Gas Rate Agreement -- A Balancing of Interests … 51.2% Equity Ratio 10.3% Return on Equity $6.0B $2.27B $3.75B Rate Base $100.0M $26.5M $73.5M Increase Total Gas Electric Rate Agreement approved by NJ Board of Public Utilities (BPU) June/July 2010 … in a difficult economic environment. •The agreement requires PSE&G to return $122 million of Market Transition Charges to customers over a 2-year period. •Agreement supports a review by the BPU of policy on consolidated tax accounting and recovery of Societal Benefits Charge. •PSE&G reduced distribution capital budgets by $140 million per year over 2010-2012 to ensure ability to earn our allowed return on equity. •Rigorous management of O&M expenses will be key to optimizing rate agreement. |
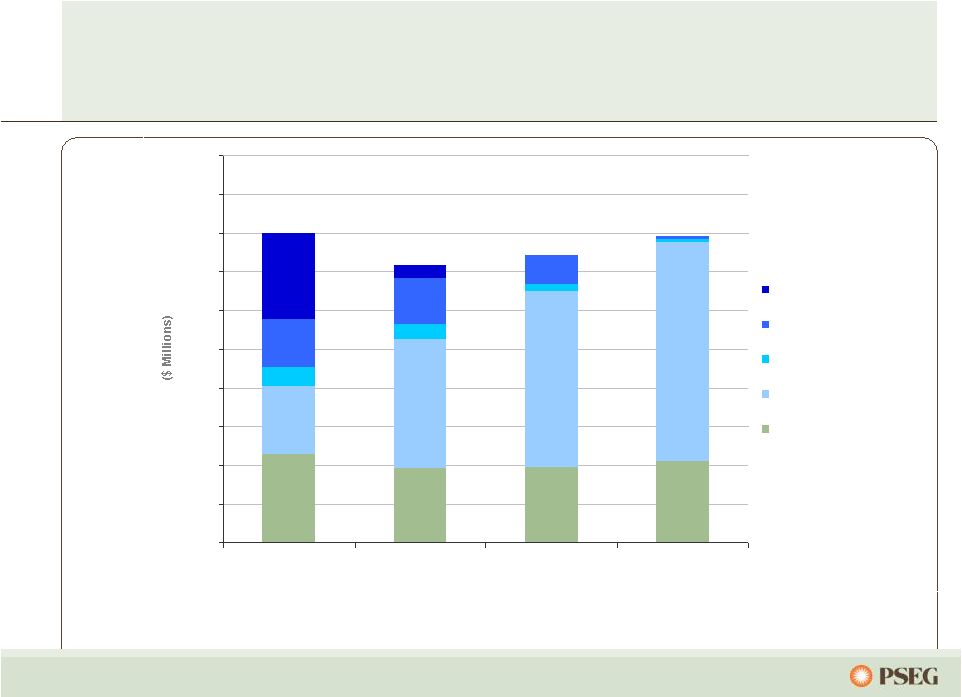 31 Our 2011 – 2013 capital plan calls for investing $ 4.5 billion… 0 200 400 600 800 1,000 1,200 1,400 1,600 1,800 2,000 2010 2011 2012 2013 NJ Infrastructure Stimulus Solar Energy Efficiency Transmission Core Investment …with contemporaneous recovery mechanisms approved for $3.3 billion. |
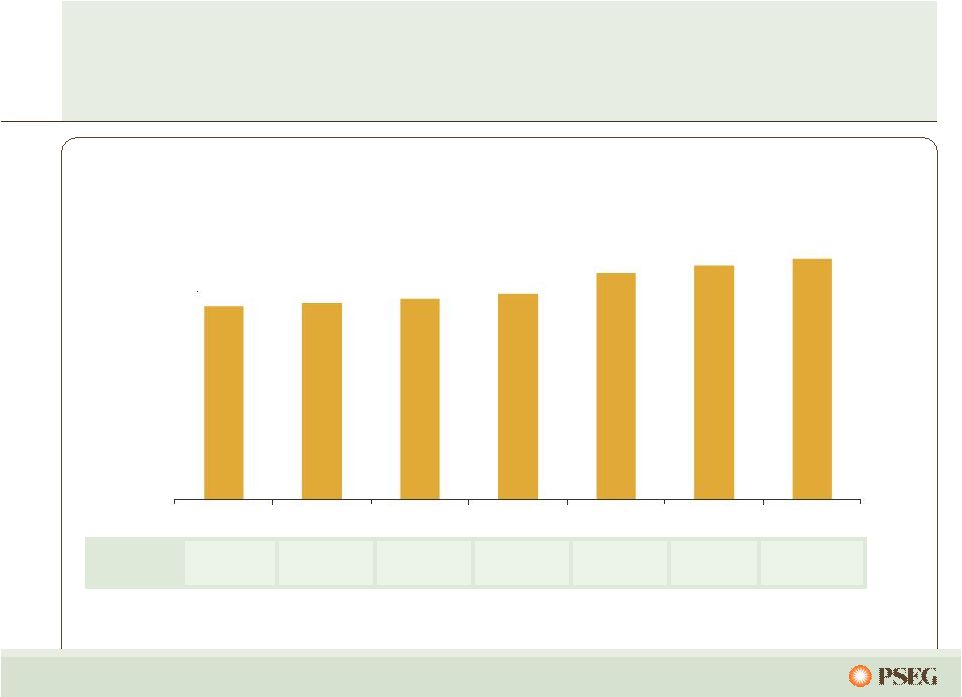
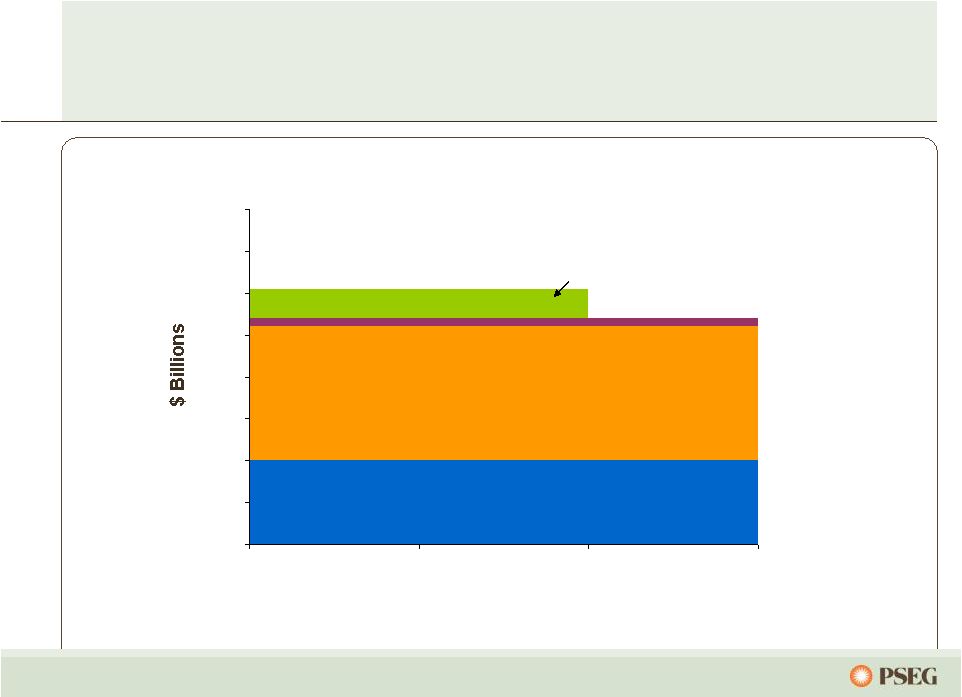
 32 PSE&G’s investment program provides opportunity for 9.5% annualized growth in rate base* PSE&G Projected Rate Base* *Starting from 2009 Rate Base of $7.3 Billion. |
 33 PSE&G’s capital spending is focused on growth… …with a substantial portion allowed to earn reasonable contemporaneous returns. PSE&G Capital Spending by Category Total 2010-2012 Capital: $4.5 Billion PSE&G Renewables / EMP, $0.86B, 19% Transmission, $1.93B, 42% Distribution, $1.75B, 39% |
 34 Roseland Roseland Hopatcong Hopatcong Hudson Hudson Transmission investment recovery… Future Transmission project spending will be influenced by PJM evaluation, potentially adding $700M in additional projects over 2011 – 2015. Various $350 Transmission Life Cycle Various $215 11 69 kV Reliability projects thru 2013 Various $870 23 Approved RTEP projects thru 2013 2015 $700 BRH alternative 125 bps 2015 $750 Susquehanna-Roseland Incentive In-Service Spending Up To ($ Millions) …is supported by formula rate treatment and CWIP in rate base*. * Approval of CWIP for 500kV backbone projects. Transmission Projects Future Projects Bergen Bergen |
 35 Success in meeting State’s energy and economic development goals… …with reasonable, contemporaneous returns. 222 472 694 April 2009 NJ Capital Infrastructure Stimulus 29 17 46 December 2008 Carbon Abatement 43 4 47 July 2009 Demand Response 161 - 161 November 2009 Solar Loan II $26 $57 $83 April 2008 Solar Loan I $928 $734 $1,662 Total 109 57 166 July 2009 Economic Energy Efficiency Stimulus 338 127 465 July 2009 Solar 4 All Remaining Spending Thru 9/30/10 Forecasted Expenditures Approval Date ($ Millions) |
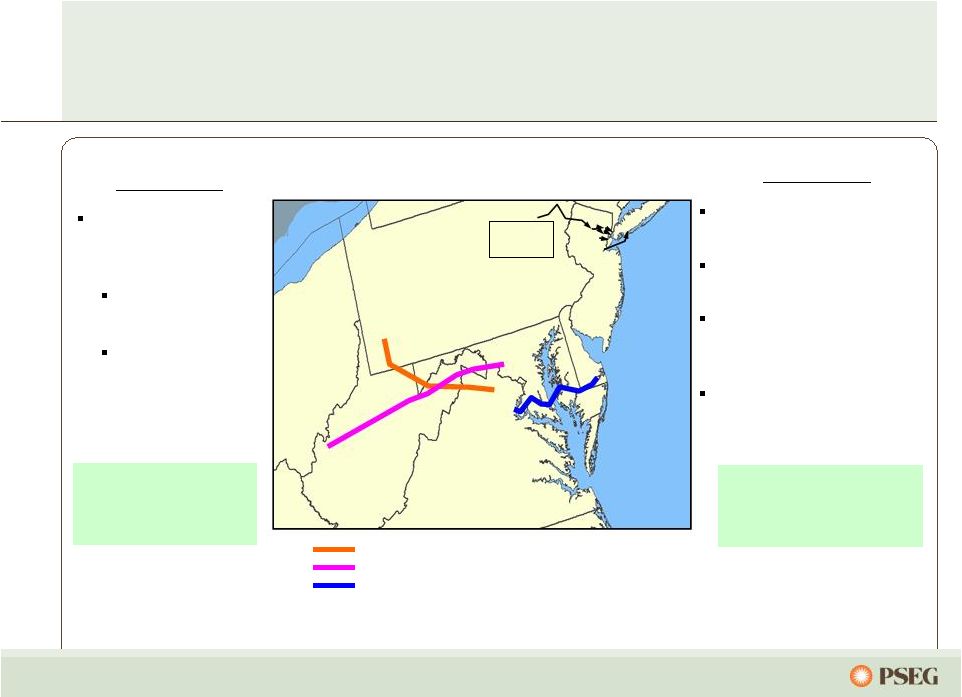 36 Projects to NY Neptune HVDC project (685 MW) Sayreville to Long Island. Linden VFT project (330 MW) Linden to Staten Island. Bergen O66 project (670 MW*) Bergen to ConEd's West 49th St. expected in-service 2012. Bergen U2-100 project (800 MW**) connecting Bergen to NY expected in-service 2012. Projects to NJ PSE&G’s evaluation of the proposed backbone Transmission projects: Susquehanna - Roseland (S-R)*** Branchburg- Roseland-Hudson (B-R-H) Re-configured to 230 kV …As a result NJ will need a mix of new generation, DSM or additional transmission imports. Total Import Capability ~ 1,700 MW Total Export Capability ~ 2,500 MW 2010-2020 NJ Summer Peak Growth Rate = 1.6% Annually Sources: Imports: PSE&G Estimates; Exports: PJM 2009 RTEP; Load Growth: PJM 2010 Load Forecast Report Tran-Allegheny Interstate Line (TrAIL) Mid-2011Estimated in-service Potomac-Appalachian Transmission Highline (PATH) Mid-2015 Estimated in-service Mid-Atlantic Power Pathway (MAPP) Mid-2015 Estimated in-service PA NJ WV VA MD DE S-R and B-R-H NJ’s load is expected to grow 3,445 MW by 2020, with net imports decreasing ~800 MW… * Project has firm contract for 320MW. ** Project in queue – no firm contracts. *** PSE&G has announced a 2-year delay of the in-service date for the eastern portion of the S-R Transmission line. |
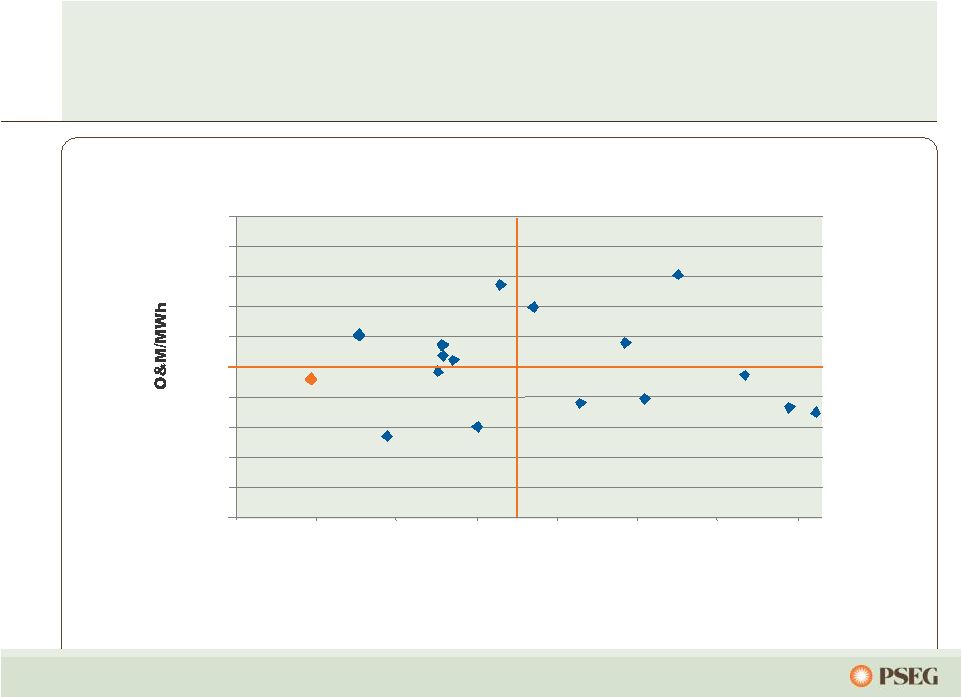 37 …which creates superior value to customers. PSE&G provides the highest reliability at below average cost... SAIDI VS O&M $- $1.00 $2.00 $3.00 $4.00 $5.00 $6.00 $7.00 $8.00 $9.00 $10.00 0 50 100 150 200 250 300 350 System Average Interruption Duration Index (SAIDI) PSE&G |
 PSEG Energy Holdings |
 39 PSEG Energy Holdings… PSEG Global International assets sold* Small remaining investment in domestic traditional generation joint venture assets PSEG Resources Tax exposure reduced by approximately $1 billion through 17 LILO/SILO lease terminations; including 4 terminations in 2010 Maximizing value and minimizing risk for traditional leases and real estate Long-term debt reduced by $1 billion over 2008 and 2009 Redemption of $642 million of Energy Holdings recourse debt $368 million eliminated through bond exchange $127 million remaining senior note called for redemption December 2010 … has streamlined its businesses and reduced its risk. * Nominal investment in Venezuela remaining |
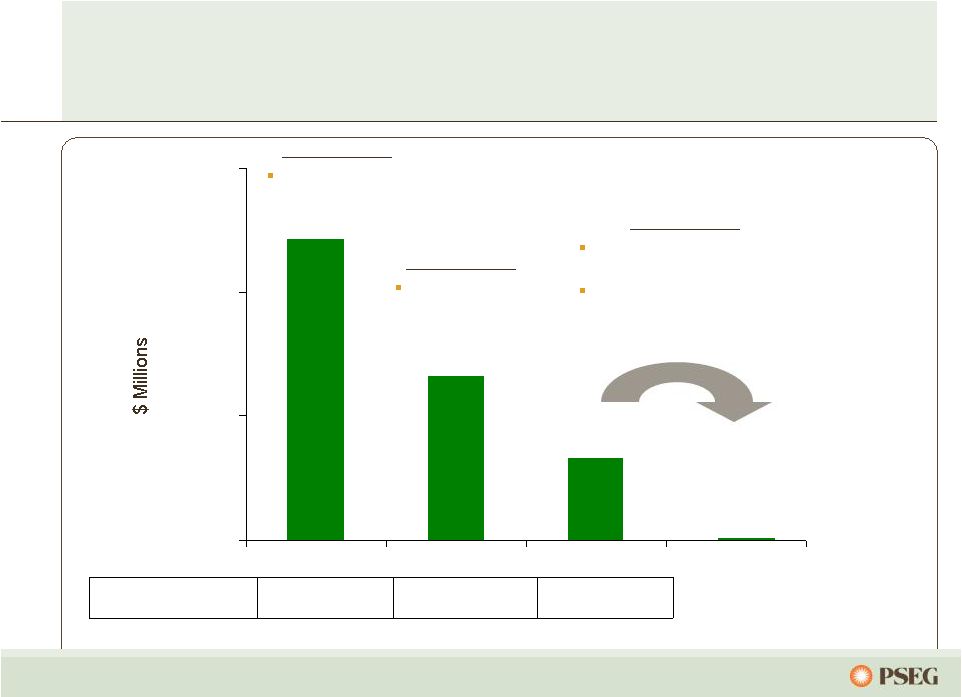 40 12/31/2008 12/31/2009 9/30/2010 Cash Exposure Net of $320M of IRS Deposits 1 5 17 # of LILO/SILO Leases Remaining 2009 Activities Terminated 12 LILO/SILO leases 2010 Activities Terminated 4 LILO/SILO leases Pursue additional lease termination opportunities Exposure to our potential lease tax liability… …was reduced with aggressive asset management. *LILO/SILO leases are international leveraged leases. $660 ~$1,200 ~$10 ~$330 $0 $500 $1,000 $1,500 2008 Activities Terminated 1 LILO/SILO lease |
 41 PSEG Energy Holdings is focused on renewable energy opportunities Complementing PSEG portfolio by increasing earnings base with structured, low risk investments Disciplined evaluation of favorable markets for renewables Transaction structure and partnerships designed to mitigate risk Expand geographic and regulatory diversity Attractive and predictable returns Pursuing renewable strategy through three primary vehicles Solar Source LLC Energy Storage and Power LLC Garden State Offshore Energy LLC |
 42 Long-term off-take agreements with creditworthy counterparties Capitalizing on existing renewable markets Leveraging partnerships and alliances A total installed capacity of 29MW in commercial service A 2 MW solar facility developed and installed in 2009 27 MW placed in-service during Q3 2010 in Florida and Ohio 20 - 30 year Power Purchase Agreements for energy, capacity and green attributes Low risk engineering, procurement and construction contracts Projects that leverage the Investment Tax Credit ~$117M total investment to date … in the emergent solar industry. PSEG Solar Source is building a portfolio to take advantage of attractive opportunities… |
 PSEG – Financial Review and Outlook |
 44 PSEG… …is focused on providing above average risk-adjusted returns. Met/exceeded earnings and financial objectives Top quartile performance in operations with year- over-year improvements and cost management. Maintain balance between risk and return through prudent balance sheet management Securing premium value in transparent, competitive markets; implementing mechanisms supporting cost recovery in reasonable timeframe |
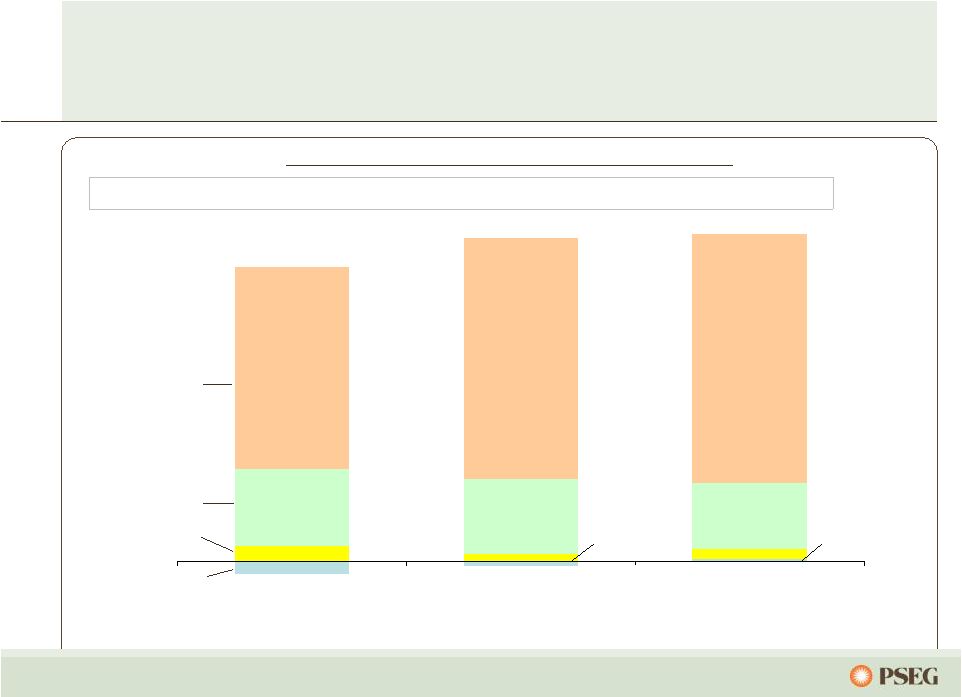 45 $(0.12) $0.14 $0.74 $1.92 $0.02 $(0.05) $0.09 $0.07 $0.63 $0.71 $2.38 $2.30 2007 2008 2009 $3.12* We have met or exceeded our earnings objectives … … and expect 2010 earnings to remain strong. Holdings PSE&G Power Parent Operating Earnings per Share by Subsidiary $2.68* $3.00 - $3.25 $2.80 - $3.05 $2.30 - $2.50 Guidance Range $3.03* *See page 65 for Items excluded from Income from Continuing Operations to reconcile to Operating Earnings |
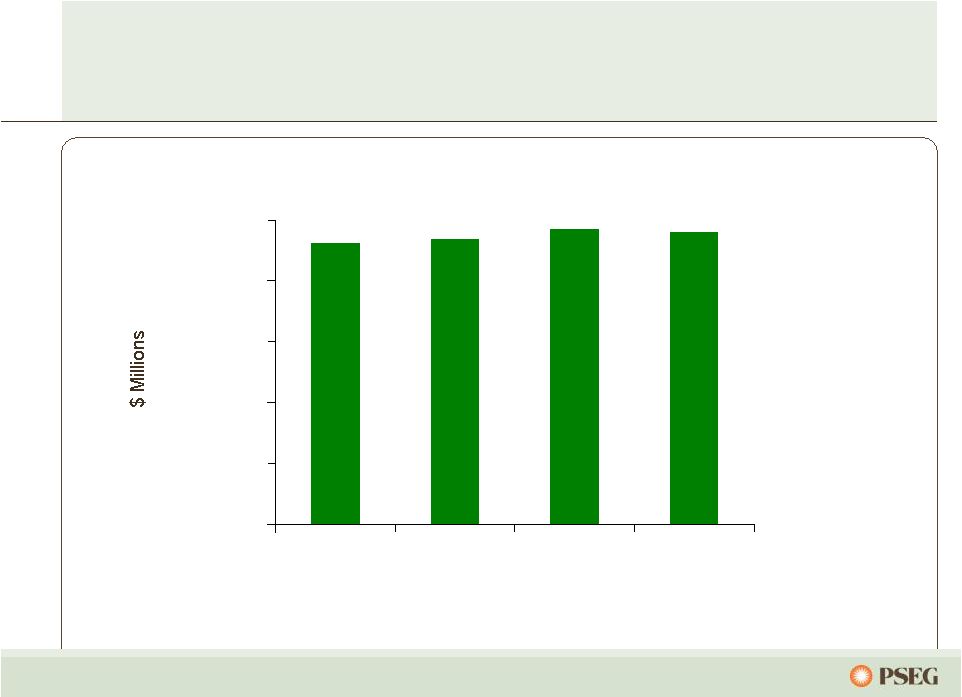 46 $1,000 $1,250 $1,500 $1,750 $2,000 $2,250 2009 2010 2011 2012 PSEG Consolidated O&M (1) C.A.G.R. (’09 –’12) = 0.7% (1) Excludes O&M related to PSE&G clauses Aggressive employee management of our O&M, including 2010 wage freeze … …and improving pension expense, will result in modest O&M growth. * * * *estimated |
 47 PSEG 2010 Operating Earnings Guidance - By Subsidiary $ 3.12 $ 1,579 $ 10 $ 43 $ 321 $ 1,205 2009A* $ 3.00 – $ 3.25 $ 1,520 – $ 1,645 $ 5 – $15 $ 30 – $ 40 $ 425 – $ 455 $ 1,060 – $ 1,135 2010E Enterprise Earnings per Share Operating Earnings* PSEG Energy Holdings PSE&G PSEG Power $ millions (except EPS) * See Page 65 for Items excluded from Income from Continuing Operations to reconcile to Operating Earnings. |
 48 25% 30% 35% 40% 45% 50% Full Year 2009 12 Months Ended 9/30/2010 • FFO to Debt is strong and comfortably above minimum threshold level 40% 45% 50% 55% Full Year 2009 12 Months Ended 9/30/2010 PSEG Power Funds from Operations / Total Debt PSE&G Regulatory Equity Ratio Key credit measures support our planned investment program Our balance sheet also provides a platform for future growth. Target = 51.2% |
 49 PSEG is responding to investors’ questions PSE&G’s capital programs have nominal impact on rates Stable supply costs provide room for regulatory support of capital programs What is the impact on customers from capital programs? Strong PSEG cash flow and approved PSE&G capital structure support financing requirements Do you need equity? Anticipated narrowing spread between market price and embedded energy cost in BGS should mitigate risk Physical assets provide optionality What is the impact of migration? Modest payout ratio and strong balance sheet provide support – 7 consecutive annual increase Is dividend secure? Multi-year hedging through participation in full-requirements auctions Asset balance dampens relative fuel price volatility Capacity markets provide stability What’s the impact of commodity volatility? Environmentally advantaged Federal and State Policy initiatives support capital plans How is PSEG affected by policy changes? PSEG Position Investors’ Questions th |
 50 PSEG value proposition PSEG provides investors with a balanced portfolio of assets within a shifting landscape for energy. PSEG’s focus on operational excellence and O&M control will yield benefits now, and over the long-term. PSEG’s capital commitments are focused on improving reliability and service quality at attractive risk-adjusted returns. PSEG’s strong balance sheet and cash flow support a capital program that will benefit shareholders through ongoing support of dividends and opportunity for future growth. |
 51 *Indicated annual dividend rate Seventh consecutive annual dividend increase is part of a 103-year history of paying common dividends… 43% 70% 43% Payout Ratio 42 – 46% 44% 66% 63% Dividends per Share … and we remain comfortably within our targeted 40-50% payout range. $1.10 $1.12 $1.14 $1.17 $1.29 $1.33 $1.37* 2004 2005 2006 2007 2008 2009 2010 |
 52 PSEG is advantaged… … with a strong balance sheet and cash flow to pursue an investment program that seizes the opportunities of tomorrow. Right Assets, Right Markets Operational Flexibility Environmental Infrastructure Improvements Integrated business model with assets located close to load centers Dispatch flexibility of operating assets and trading capability support margins in full-requirements markets Environmentally responsible; pursuing investments in renewables; nuclear uprates Investments to improve reliability and functionality of grid 2010 |
 Appendix |
 54 YTD Earnings Summary - - Discontinued Operations, Net of Tax $ 2.50 $ 2.55 EPS from Operating Earnings* $1,243 $1,282 Net Income 1,243 1,282 Income from Continuing Operations (21) (12) Reconciling Items, Net of Tax $ 1,264 $1,294 Operating Earnings 2009 2010 $ millions (except EPS) Nine Months Ended September 30 * See page 64 for Items excluded from Income from Continuing Operations to reconcile to Operating Earnings. |
 55 YTD Operating Earnings by Subsidiary $ 1,264 17 30 253 $ 964 2009 $1,294 12 43 347 $892 2010 Operating Earnings Earnings per Share 0.03 0.02 Enterprise $ 2.50 $ 2.55 Operating Earnings* 0.06 0.09 PSEG Energy Holdings 0.50 0.68 PSE&G $ 1.91 $ 1.76 PSEG Power 2009 2010 $ millions (except EPS) Nine Months Ended September 30 * See page 64 for Items excluded from Income from Continuing Operations to reconcile to Operating Earnings. |
 56 $2.50 (0.15) 0.18 0.03 (0.01) $2.55 1.00 1.25 1.50 1.75 2.00 2.25 2.50 2.75 PSEG EPS Reconciliation – YTD 2010 versus YTD 2009 Nine Months Ended 9/30/2010�� Operating Earnings* Nine Months Ended 9/30/2009 Operating Earnings* Interest .03 2009 Debt Exchange Benefit Eliminated in Consolidation (.04) Higher Volume Offset by Lower prices (.05) Weather .05 Migration (.03) Economy (.01) Nuclear (.01) WPT (.07) ; BGSS (.01) O&M (.01); Other .03 SO 2 Impairment (.02) Increase in effective tax rate related to healthcare legislation (.02) PSEG Power Electric & Gas Margin (Including Rate Increases) .07 Transmission .03 Other .02 Appliance Service .01 Weather .02 O&M .01 Depreciation, Taxes & Other .02 PSE&G PSEG Energy Holdings Enterprise 2009 Lease Sales & Other Investments (.06) Interest .03 Effective Tax Rate and Other .02 2009 Debt Exchange Cost Eliminated in Consolidation .04 * See page 64 for Items excluded from Net Income to reconcile to Operating Earnings. |
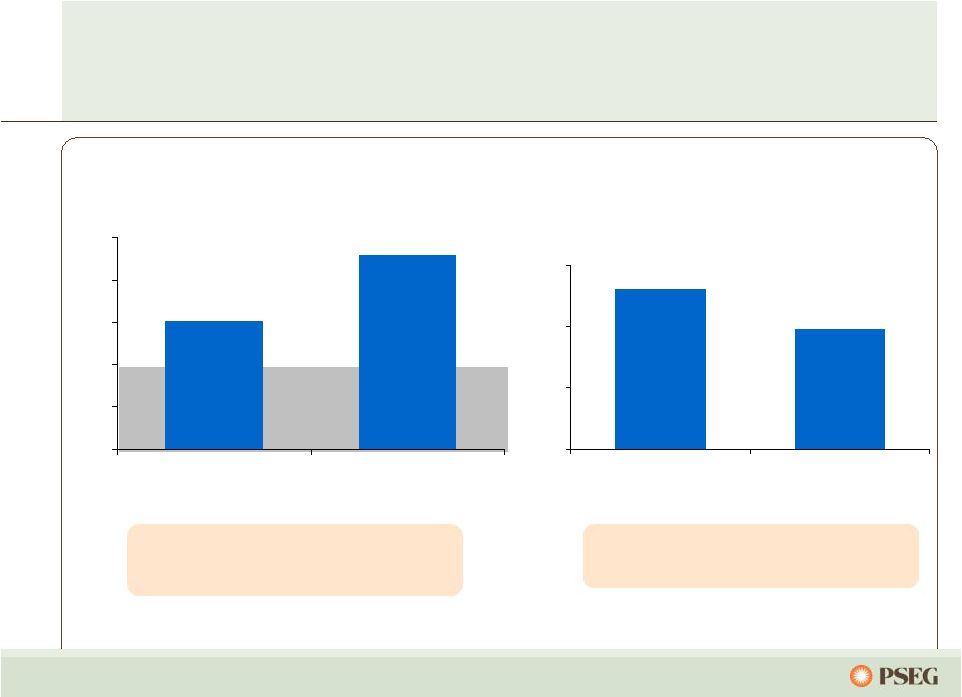
 57 PSEG Power – Gross Margin Performance $0 $25 $50 $75 2010 2009 2008 $63 $55 Nine Months Ended Sept 30 Volume increased by 12% for YTD 9/30/2010 vs. year ago in response to weather-related demand Margins influenced by fuel mix, BGS migration, and impairment of excess SO emission allowances Generation flat with year-ago levels. $88 Texas Regional Performance $44 $62 $2,292 Gross Margin ($M)** Nine Months Ended September 30, 2010 Region Low spark spreads, partially offset by increase in gas-fired generation. New York Generation increased with strong weather-related demand. New England Q3 contribution to gross margin ($M) flat versus year ago. A 10% increase in generation offsetting lower realized prices and the cost of the Salem nuclear outage. PJM PSEG Power Gross Margin ($/MWh)* $54 **For the nine months ended September 30, 2010. *Excludes Texas. Increase in generation was predominantly from combined cycle and coal with continued strong nuclear 2 |
 58 PSEG Power – Generation Measures (GWh) 7,309 7,738 3,131 2,241 7,409 6,253 0 10,000 20,000 2010 2009 Quarter Ended September 30 Total Nuclear Total Coal* Total Oil & Natural Gas * Includes figures for Pumped Storage. 16,232 17,849 22,577 22,751 8,647 6,389 18,571 15,296 0 10,000 20,000 30,000 40,000 50,000 2010 2009 9 Months Ended Sept. 30 44,436 49,795 |
 59 PSEG Power – Fuel Costs 232 318 Oil & Gas 97 122 Coal 22.67 26.95 $ / MWh 16,232 17,849 Total Generation (GWh) 368 481 Total Fuel Cost 39 41 Nuclear Total Fossil ($ millions) 329 440 2009 2010 Quarter Ended September 30 641 817 Oil & Gas 240 336 Coal 22.30 25.65 $ / MWh 44,436 49,795 Total Generation (GWh) 991 1,277 Total Fuel Cost 110 124 Nuclear Total Fossil ($ millions) 881 1,153 2009 2010 Nine Months Ended September 30 |
 60 $0 $5 $10 2010 2011 2012 Anticipated Nuclear Fuel Cost Power has hedged its nuclear fuel needs through 2012… … with increased costs over that time horizon. Hedged |
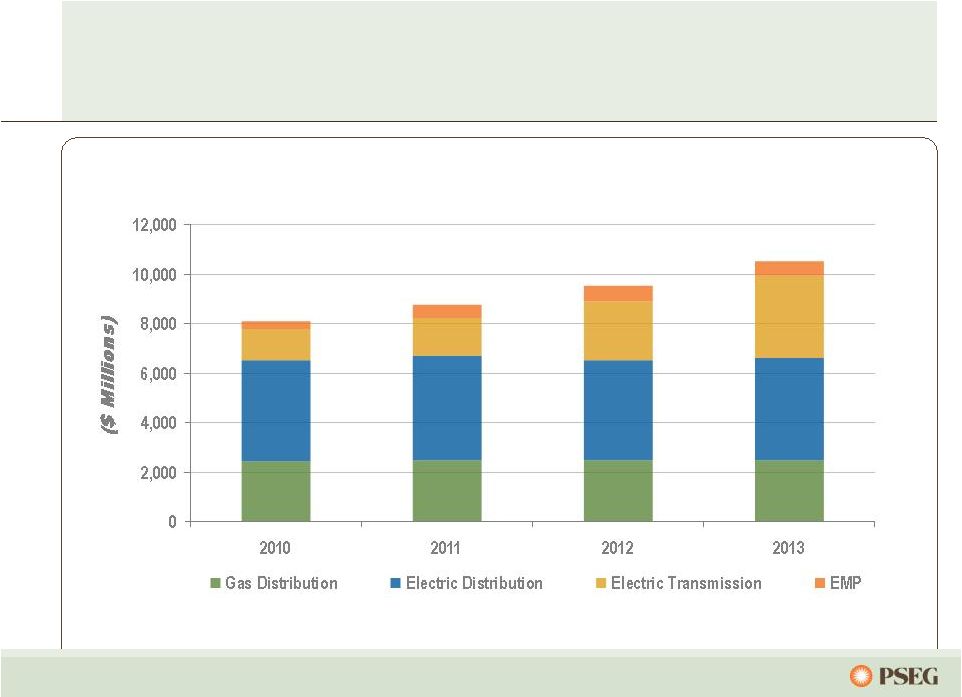
 61 PSE&G Capital Spending: 2010-2013 $6,130 $1,590 $1,490 $1,450 $1,600 Total $890 $30 $190 $320 $350 Renewables/EMP $2,170 $420 $390 $460 $900 Distribution $3,070 $1,140 $910 $670 $350 Transmission 2010-2013E 2013E 2012E 2011E 2010E* ($ Millions) Capital program provides growth in rate base of 9.5% per year from 2009 base of $7.3 Billion Transmission investment represents 50% of planned capex over 2010-2013 and is expected to comprise 31% of PSE&G rate base by 2013 Supportive regulatory treatment with contemporaneous recovery should align earnings growth with investment *Estimate |
 62 With our current facilities, PSEG/Power will have approximately $2.6 billion of credit capacity through 2012 ... Non-PSE&G Credit Capacity ...and we will continue to ensure adequate liquidity. 1 Power facility reduced by $75M in 12/2011 2 PSEG facility reduced by $47M in 12/2011 Power Bilateral – 0.10B Expires 9/2015 $0.0 $0.5 $1.0 $1.5 $2.0 $2.5 $3.0 $3.5 $4.0 2010 2011 2012 Power Syndicated Facility - 1.60B 1 Expires 12/2012 Power 2-Year Facility - 0.35B Expires 7/2011 PSEG Syndicated Facility - 1.00B 2 Expires 12/2012 |
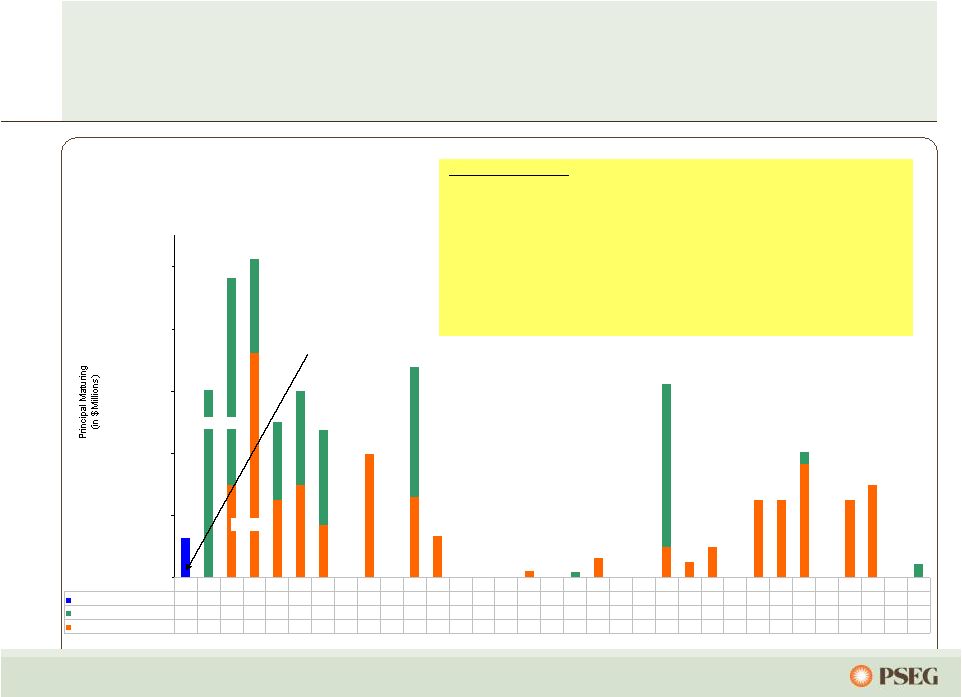 63 0 200 400 600 800 1,000 HOLDINGS (Recourse) 127 0 0 0 0 0 0 0 0 0 0 0 0 0 0 0 0 0 0 0 0 0 0 0 0 0 0 0 0 0 0 0 0 POWER 0 605 666 300 250 300 303 0 0 0 420 0 0 0 0 0 0 19 0 0 0 525 0 0 0 0 0 40 0 0 0 0 45 PSE&G excl. Securitization 0 0 300 725 250 300 171 0 400 0 259 134 0 0 0 23 0 0 64 0 0 100 50 100 0 250 250 365 0 250 300 0 0 2010 2011 2012 2013 2014 2015 2016 2017 2018 2019 2020 2021 2022 2023 2024 2025 2026 2027 2028 2029 2030 2031 2032 2033 2034 2035 2036 2037 2038 2039 2040 2041 2042 Holdings Recourse PSE&G Power Debt Maturity Profile – As of October 27, 2010 2010 Financing Activity PSE&G maturity of $300M in March 2010 PSE&G issued $300M due 2040 PSE&G issued $300M due 2015 PSE&G issued $250M due 2020 PSE&G remarketed $64M (due 2028) and $100M (due 2033) PSE&G refinanced $100M due 2031 Power remarketed $44M of tax-exempt bonds due 2042 Power called $48M due 2013 and $161M due 2014 Power issued $300M due 2013 Power issued $250M due 2020 Power exchanged $195M due 2011 for $156M due 2020 plus cash of $52M Holdings called $127M of Senior Notes due 2011 |
 64 Items Excluded from Income from Continuing Operations to Reconcile to Operating Earnings Please see Page 3 for an explanation of PSEG’s use of Operating Earnings as a non-GAAP financial measure and how it differs from Net Income. Pro-forma Adjustments, net of tax 2010 2009 2010 2009 Earnings Impact ($ Millions) Gain (Loss) on Nuclear Decommissioning Trust (NDT) 10 $ 7 $ 30 $ 1 $ Fund Related Activity (PSEG Power) Gain (Loss) on Mark-to-Market (MTM) (PSEG Power) 19 17 30 (22) Net Reversal of Lease Transaction Reserves (Energy Holdings) - - - - Market Transition Charge Refund (PSE&G) - - (72) - Total Pro-forma adjustments 29 $ 24 $ (12) $ (21) $ Fully Diluted Average Shares Outstanding (in Millions) 507 507 507 507 Per Share Impact (Diluted) Gain (Loss) on NDT Fund Related Activity (PSEG Power) 0.02 $ 0.01 $ 0.06 $ - $ Gain (Loss) on MTM (PSEG Power) 0.04 0.03 0.06 (0.05) Net Reversal of Lease Transaction Reserves (Energy Holdings) - - - - Market Transition Charge Refund (PSE&G) - - (0.14) - Total Pro-forma adjustments 0.06 $ 0.04 $ (0.02) $ (0.05) $ (a) Income from Continuing Operations for the three and nine months ended September 30, 2010 and 2009. For the Three Months Ended For the Nine Months Ended September 30, September 30, PUBLIC SERVICE ENTERPRISE GROUP INCORPORATED Reconciling Items Excluded from Continuing Operations to Compute Operating Earnings (a) (Unaudited) |
 65 Items Excluded from Income from Continuing Operations to Reconcile to Operating Earnings Please see Page 3 for an explanation of PSEG’s use of Operating Earnings as a non-GAAP financial measure and how it differs from Net Income. Pro-forma Adjustments, net of tax 2009 2008 2007 Earnings Impact ($ Millions) Gain (Loss) on Nuclear Decommissioning Trust (NDT) Fund Related Activity (PSEG Power) 9 $ (71) $ 12 $ Gain (Loss) on Mark-to-Market (MTM) (PSEG Power) (25) 16 10 Lease Transaction Reserves - (490) - Net Reversal of Lease Transaction Reserves 29 - - Asset Sales and Impairments - (13) (32) Premium on Bond Redemption - (1) (28) Total Pro-forma adjustments 13 $ (559) $ (38) $ Fully Diluted Average Shares Outstanding (in Millions) 507 508 509 Per Share Impact (Diluted) Gain (Loss) on Nuclear Decommissioning Trust (NDT) Fund Related Activity (PSEG Power) 0.02 $ (0.14) $ 0.02 $ Gain (Loss) on Mark-to-Market (MTM) (PSEG Power) (0.05) 0.03 0.02 Lease Transaction Reserves - (0.96) - Net Reversal of Lease Transaction Reserves 0.05 - - Asset Sales and Impairments - (0.03) (0.06) Premium on Bond Redemption - - (0.06) Total Pro-forma adjustments 0.02 $ (1.10) $ (0.08) $ PUBLIC SERVICE ENTERPRISE GROUP INCORPORATED For the Twelve Months Ended December 31, Reconciling Items Excluded from Continuing Operations to Compute Operating Earnings (Unaudited) |