 EXHIBIT 99 We have the energy to make things better … for you, for our investors and for our stakeholders. |
 PSEG Kathleen Lally VICE PRESIDENT, INVESTOR RELATIONS Caroline Dorsa EXECUTIVE VICE PRESIDENT AND CHIEF FINANCIAL OFFICER |
 3 Forward Looking Statement Certain of the matters discussed in this report constitute “forward-looking statements” within the meaning of the Private Securities Litigation Reform Act of 1995. Such forward-looking statements are subject to risks and uncertainties, which could cause actual results to differ materially from those anticipated. Such statements are based on management’s beliefs as well as assumptions made by and information currently available to management. When used herein, the words “anticipate,” “intend,” “estimate,” “believe,” “expect,” “plan,” “should,” “hypothetical,” “potential,” “forecast,” “project,” variations of such words and similar expressions are intended to identify forward-looking statements. Factors that may cause actual results to differ are often presented with the forward-looking statements themselves. Other factors that could cause actual results to differ materially from those contemplated in any forward-looking statements made by us herein are discussed in Item 1. Financial Statements—Note 9. Commitments and Contingent Liabilities, Item 2. Management’s Discussion and Analysis of Financial Condition and Results of Operations, and other factors discussed in filings we make with the United States Securities and Exchange Commission (SEC). These factors include, but are not limited to: • adverse changes in the demand for or the price of the capacity and energy that we sell into wholesale electricity markets, • adverse changes in energy industry law, policies and regulation, including market structures and a potential shift away from competitive markets toward subsidized market mechanisms, transmission planning and cost allocation rules, including rules regarding how transmission is planned and who is permitted to build transmission in the future, and reliability standards, • any inability of our transmission and distribution businesses to obtain adequate and timely rate relief and regulatory approvals from federal and state regulators, • changes in federal and state environmental regulations that could increase our costs or limit our operations, • changes in nuclear regulation and/or general developments in the nuclear power industry, including various impacts from any accidents or incidents experienced at our facilities or by others in the industry, that could limit operations of our nuclear generating units, • actions or activities at one of our nuclear units located on a multi-unit site that might adversely affect our ability to continue to operate that unit or other units located at the same site, • any inability to balance our energy obligations, available supply and risks, • any deterioration in our credit quality or the credit quality of our counterparties, including in our leveraged leases, • availability of capital and credit at commercially reasonable terms and conditions and our ability to meet cash needs, • changes in the cost of, or interruption in the supply of, fuel and other commodities necessary to the operation of our generating units, • delays in receipt of necessary permits and approvals for our construction and development activities, • delays or unforeseen cost escalations in our construction and development activities, • any inability to achieve, or continue to sustain, our expected levels of operating performance, • any equipment failures, accidents, severe weather events or other incidents that impact our ability to provide safe and reliable service to our customers, and any inability to sufficiently obtain coverage or recover proceeds of insurance on such matters, • increases in competition in energy supply markets as well as competition for certain rate-based transmission projects, • any inability to realize anticipated tax benefits or retain tax credits, • challenges associated with recruitment and/or retention of a qualified workforce, • adverse performance of our decommissioning and defined benefit plan trust fund investments and changes in funding requirements, and • changes in technology and customer usage patterns. All of the forward-looking statements made in this report are qualified by these cautionary statements and we cannot assure you that the results or developments anticipated by management will be realized or even if realized, will have the expected consequences to, or effects on, us or our business prospects, financial condition or results of operations. Readers are cautioned not to place undue reliance on these forward-looking statements in making any investment decision. Forward-looking statements made in this report apply only as of the date of this report. While we may elect to update forward-looking statements from time to time, we specifically disclaim any obligation to do so, even if internal estimates change, unless otherwise required by applicable securities laws. The forward-looking statements contained in this report are intended to qualify for the safe harbor provisions of Section 27A of the Securities Act of 1933, as amended, and Section 21E of the Securities Exchange Act of 1934, as amended. |
 4 GAAP Disclaimer PSEG presents Operating Earnings in addition to its Income from Continuing Operations/Net Income reported in accordance with accounting principles generally accepted in the United States (GAAP). Operating Earnings is a non- GAAP financial measure that differs from Net Income because it excludes gains or losses associated with Nuclear Decommissioning Trust (NDT), Mark-to-Market (MTM) accounting, and other material one-time items. PSEG presents Operating Earnings because management believes that it is appropriate for investors to consider results excluding these items in addition to the results reported in accordance with GAAP. PSEG believes that the non-GAAP financial measure of Operating Earnings provides a consistent and comparable measure of performance of its businesses to help shareholders understand performance trends. This information is not intended to be viewed as an alternative to GAAP information. Slides A and B at the end of this presentation include a list of items excluded from Income from Continuing Operations/Net Income to reconcile to Operating Earnings, with a reference to that slide included on each of the slides where the non-GAAP information appears. |
 PSEG OVERVIEW & OUTLOOK |
 PSEG Strategy Leveraging the strength of PSEG’s balance sheet to invest primarily in our stable, regulated business in ways that meet customer needs and state goals as we protect the upside of the merchant business and provide growth for our shareholders DISCIPLINED INVESTMENT ENGAGED WORKFORCE FINANCIAL STRENGTH OPERATIONAL EXCELLENCE 6 |
 PSEG met 2012’s challenges with our strong platform of assets ASSETS AND OPERATING EARNINGS ARE FOR THE YEAR ENDED 12/31/2012. ENERGY HOLDINGS INCLUDES PARENT. SEE PAGE A FOR ITEMS EXCLUDED FROM INCOME FROM CONTINUING OPERATIONS/NET INCOME TO RECONCILE TO OPERATING EARNINGS. . Electric & Gas Delivery and Transmission PSE&G positioned to meet NJ’s energy policy and economic growth objectives with an investment program exceeding $10 billion through 2017 PSEG Power’s low-cost, base load and load following fleet is geographically well positioned and environmentally responsible Regional Wholesale Energy Renewable Investments PSEG Energy Holdings positioned to pursue attractive renewable generation and develop new business opportunities Assets $19.2B Operating Earnings $528M Assets $11.0B Operating Earnings $644M Assets $1.5B Operating Earnings $64M 7 |
 8 PSEG – 2012 Highlights 2012 Earnings in-line with guidance • Achieved operating earnings of $2.44 per share, at the high end of guidance range of $2.25-$2.50, including storm-related costs at PSE&G • PSE&G represented 43% of consolidated operating earnings with growth in transmission Operational excellence * In May 2013, the NJBPU approved the Solar Agreement reached with BPU Staff and other parties; see slide 36 for details. • Record output from CCGTs, continued strong production from Nuclear, and Power’s control of O&M supported results • PSE&G recognized for reliability: National ReliabilityOne Excellence Award, Mid-Atlantic Reliability Award, and Award for Outstanding Response to a Major Outage Event; as well as EEI’s Emergency Response Award • Restored service to 2.1 million customers in a two-week period of time in the aftermath of Superstorm Sandy and the Nor’easter that followed • Extension of major labor contracts PSEG disciplined capital investment • Key regulatory approvals received for major transmission projects • BPU decisions pending on Solar4All Extension and Solar Loan III* • Power added 400 MW of new peakers in time to respond to summer demand • Holdings added 40 MW of new solar capacity |
 9 PSEG First Half 2013 Highlights • Based on financial results to date, we expect operating earnings for the full year to be at the upper end of our guidance range assuming normal weather and unit operations • Focused on maintaining operating efficiency and customer reliability • PSE&G’s operating earnings expected to grow at double-digit rate in 2013, and provide ~50% of consolidated operating earnings • Positive cash from Power and increasing cash flow from PSE&G supports opportunity for dividend growth and funds capital spending program without the need to issue equity • Debt as a percentage of capital was 41.2% at June 30, 2013 Maintaining 2013 operating earnings guidance of $2.25 - $2.50 per share Executing PSE&G’s existing $3.4 billion Transmission capital spending program on schedule – fueling double-digit growth in PSE&G operating earnings through 2015, based on approved programs PSE&G pursuing Energy Strong, its $3.9 billion, ten-year infrastructure spending program to strengthen electric and gas distribution, communications, and customer reliability and resiliency. In addition, PSE&G plans to invest $1.5 billion during this time-frame to harden its Transmission system Financial position remains strong Long history of returning cash to the shareholder through the common dividend, with opportunity for future growth |
 10 First Half 2013 Operating Earnings by Subsidiary *SEE PAGE B FOR ITEMS EXCLUDED FROM INCOME FROM CONTINUING OPERATIONS/NET INCOME TO RECONCILE TO OPERATING EARNINGS. Operating Earnings Earnings per Share $ millions (except EPS) 2013 2012 2013 2012 PSEG Power $ 364 $ 306 $ 0.71 $ 0.60 PSE&G 300 298 0.59 0.59 PSEG Energy Holdings/ Enterprise 12 43 0.03 0.09 Operating Earnings* $ 676 $ 647 $ 1.33 $ 1.28 Six months ended June 30 |
 11 PSEG EPS Reconciliation – First-Half 2013 versus First Half 2012 * SEE PAGE B FOR ITEMS EXCLUDED FROM INCOME FROM CONTINUING OPERATIONS/NET INCOME TO RECONCILE TO OPERATING EARNINGS. $1.33 (0.06) 0.11 $1.28 0.00 0.25 0.50 0.75 1.00 1.25 1.50 YTD 2013 Operating Earnings* YTD 2012 Operating Earnings* Capacity 0.12 Net Price (0.05) Volume 0.02 Gas Send-Out and Fixed Cost Recovery 0.04 O&M (0.01) D&A (0.01) PSEG Power Transmission Net Earnings 0.07 Distribution O&M (0.02) Net Weather 0.01 Taxes and Other 0.01 Absence of Tax Settlement (0.06) D&A (0.01) PSE&G PSEG Energy Holdings/ Enterprise Asset Sale 0.01 Absence of Tax Settlement (0.07) 0.00 |
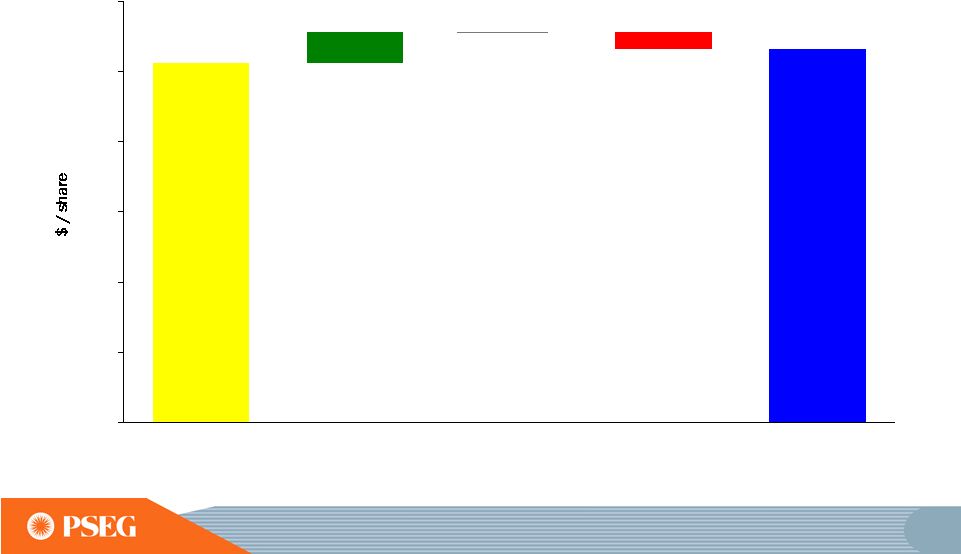
 12 2013 Operating Earnings Guidance * SEE PAGE A FOR ITEMS EXCLUDED FROM INCOME FROM CONTINUING OPERATIONS/NET INCOME TO RECONCILE TO OPERATING EARNINGS.. Based on our performance year-to-date, we expect full year operating earnings to be at the upper end of guidance, assuming normal weather and unit operations E = ESTIMATE |
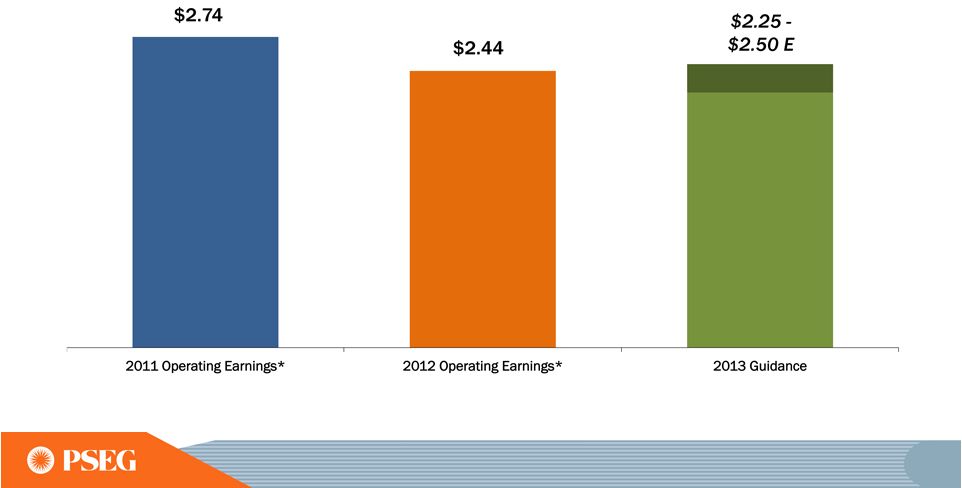
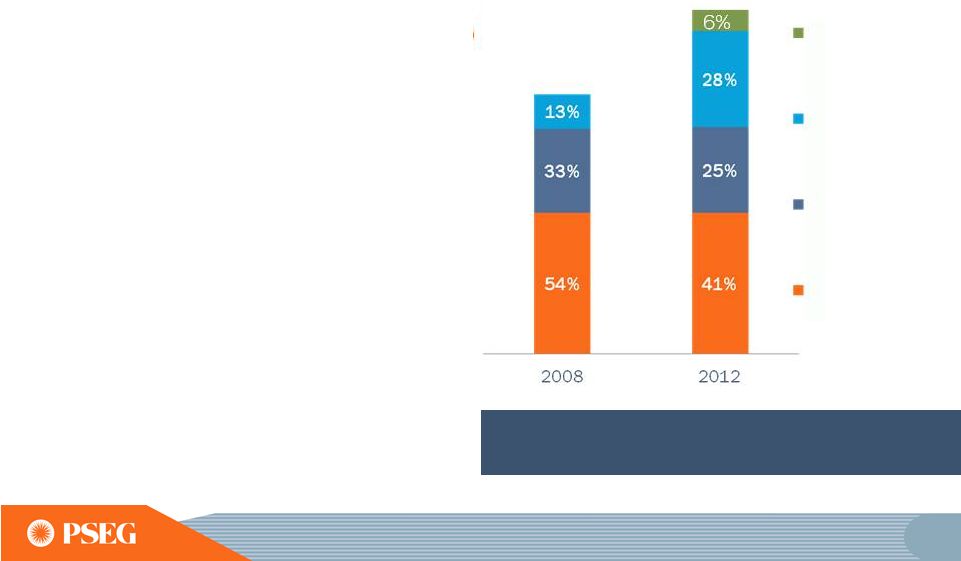
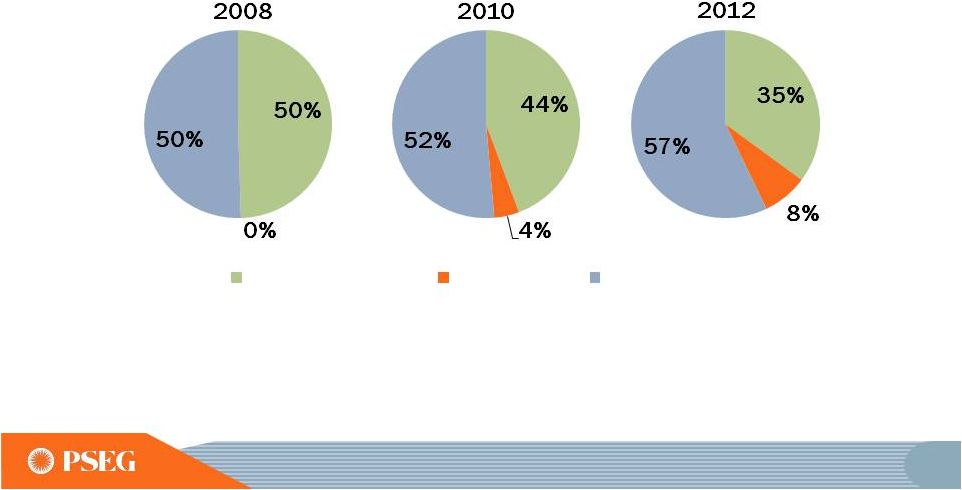
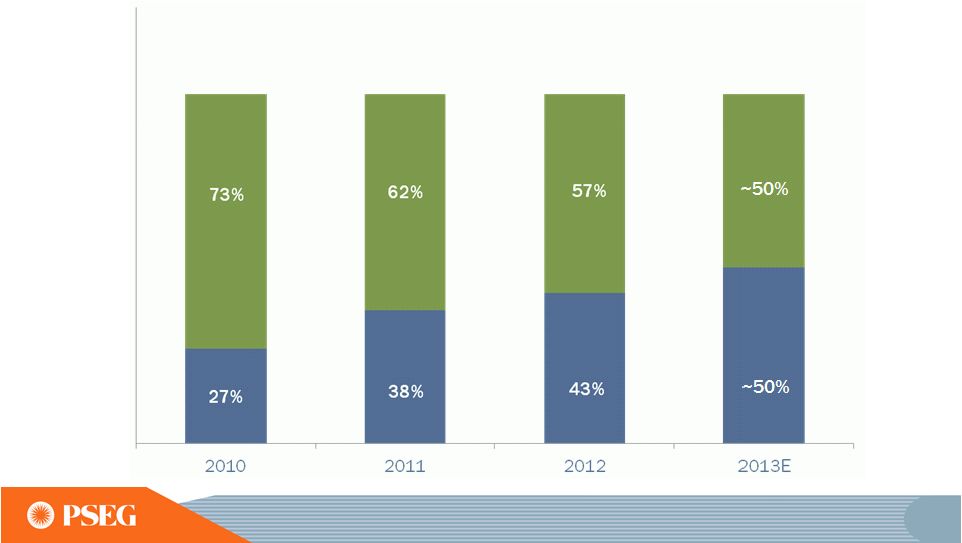
 13 2013 Operating Earnings * Investment in the regulated business has changed the earnings mix Our 2009-2013 investment focus has brought us to a 50/50 mix for 2013 PSE&G’s 2013-2017 Energy Strong Program and ongoing transmission investments will support continued growth in PSE&G’s earnings Percent of Operating Earnings Contribution by Subsidiary PSE&G Power Other $2.74 $2.44 $2.25 -$2.50E $3.09 $3.12 *SEE PAGE A FOR ITEMS EXCLUDED FROM INCOME FROM CONTINUING OPERATIONS/NET INCOME TO RECONCILE TO OPERATING EARNINGS; ALL PERIODS REFLECT TEXAS IN DISCONTINUED OPERATIONS. E=ESTIMATE. |
 14 PSEG Focus Operational excellence and disciplined investment helped offset the earnings impact of lower energy prices 2008 2012 $69.85 PJM West RTC ($/MWh) $33.88 • 2.4% (planned 1 ) • $866 • $0 • $0 • 1.6% • 29.3TWh • $0 $2.91 • 0.8% (actual 2 ) • $2,500 • $955 • $888 • 1.7% • 29.8TWh • $240 $2.44 • O&M Growth per year • Transmission Rate Base • Utility Cap Stimulus Spending • Utility Solar & EE Cap Exp • EFORd Rate CCGT • Nuclear Generation • Holdings Solar Investment Operating Earnings Per Share SEE PAGE A FOR ITEMS EXCLUDED FROM INCOME FROM CONTINUING OPERATIONS/NET INCOME TO RECONCILE TO OPERATING EARNINGS. (1) PLANNED COMPOUND ANNUAL GROWTH RATE 2008-2012.(2) ACTUAL COMPOUND ANNUAL GROWTH RATE 2008-2012. (3) 2013 INDICATED ANNUAL DIVIDEND RATE IS $1.44 PER SHARE. $1.29 Common Dividend Per Share ³ $1.42 PSEG Focus ($ millions, except as noted) |
 15 Superstorm Sandy met by an exceptional response The storm affected PSE&G and Power 2.1 million PSE&G customer restorations (2X Hurricane Irene and 3X the October ’11 Snowstorm) 96 Electric Substations Damaged (39% of the total) 14 Switching Stations Affected (33% of total) 51 of 154 Transmission Lines Interrupted (33% of total) 2,427 Utility Poles Replaced or Repaired 48,000 Trees Removed or Trimmed ~4,200 mutual aid or contract workers brought in to assist restoration efforts PSEG Power’s assets were stress tested by Superstorm Sandy, but when the load returned in the days following, Power’s assets were available |
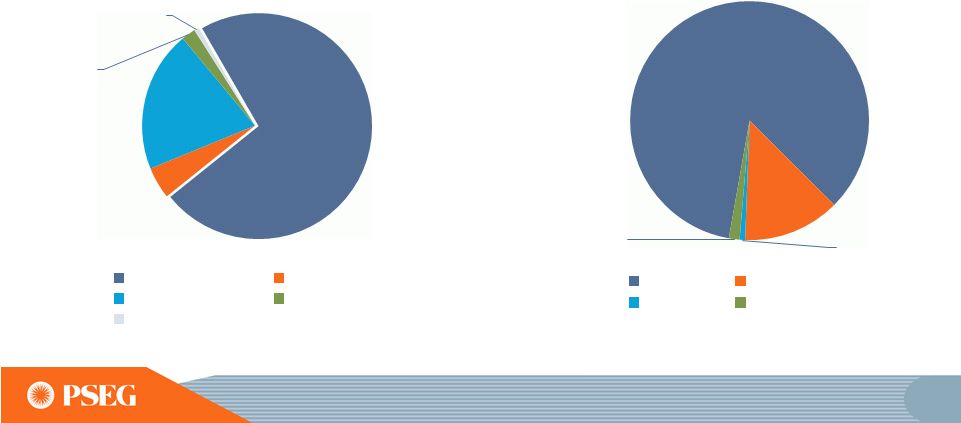
 16 PSEG Capital Spending focused on growth PSEG 2013-2015E Capital Spending* $6.3 Billion by Subsidiary PSEG 2013-2015E Capital Spending* $6.3 Billion Growth / Environmental / Maintenance E = ESTIMATE; CAPITAL EXCLUDES IDC AND AFUDC. *THIS FORECAST DOES NOT REFLECT THE IMPACT OF THE ENERGY STRONG PROPOSAL RECENTLY FILED WITH THE NJBPU. DATA AS OF JUNE 30, 2013. PSE&G Growth Power Growth Maintenance Environmental Holdings Growth PSE&G Power Holdings Parent SC $4.2B 67% $0.3B 6% $1.5B 24% $0.2B 2% $0.05B 1% $5.1B 81% $1.0B 16% $0.05B 1% $0.1B 2% |
 17 What’s Next: PSEG’s Capital Spending expansion opportunity directed toward growth in regulated business with ~ 25% growth in planned spending Potential PSEG 2013-2015E Capital Spending* $7.5 Billion by Subsidiary Potential PSEG 2013-2015E Capital Spending* $7.5 Billion Growth / Environmental / Maintenance E = ESTIMATE; CAPITAL EXCLUDES IDC AND AFUDC. DATA AS OF JUNE 30, 2013. PSE&G Growth Power Growth Maintenance Environmental Holdings Growth $5.4B 73% $0.3B 4% $1.5B 20% $0.2B 2% $0.05B 1% PSE&G Power Holdings Parent SC $6.3B 85% $1.0B 13% $0.1B 1% $0.1B 1% |
 18 PSE&G’s Energy Strong Capital Program addresses new reality New ten-year, $3.9 Billion Infrastructure Program filed with the NJBPU to strengthen PSE&G’s distribution system focusing on hardening and resiliency Plan to invest an additional $1.5 Billion in transmission grid over the ten-year period Energy Strong proposal includes: Protecting 40 utility installations from severe storms ($1.7 Billion) Making the electric grid smarter and easier to repair ($454 Million) Adding backup distribution lines and system redundancies ($415 Million) Undergrounding 20 miles of overhead distribution lines ($60 Million) Modernizing the gas distribution system ($1.1 Billion) Better protection for homes and businesses during severe weather and improved day to day system reliability Proposed filing creates ~5,800 jobs and stimulates economic activity for New Jersey businesses |
 19 55 local NJ towns and 5 counties support • 55 municipalities and five counties (Bergen, Hudson, Mercer, Passaic and Somerset) have approved resolutions in support of Energy Strong, PSE&G’s infrastructure proposal to improve and fortify its electric and gas distribution systems • The Energy Strong proposal is currently being evaluated by the NJ Board of Public Utilities • Public hearings are scheduled for September and October 2013 |
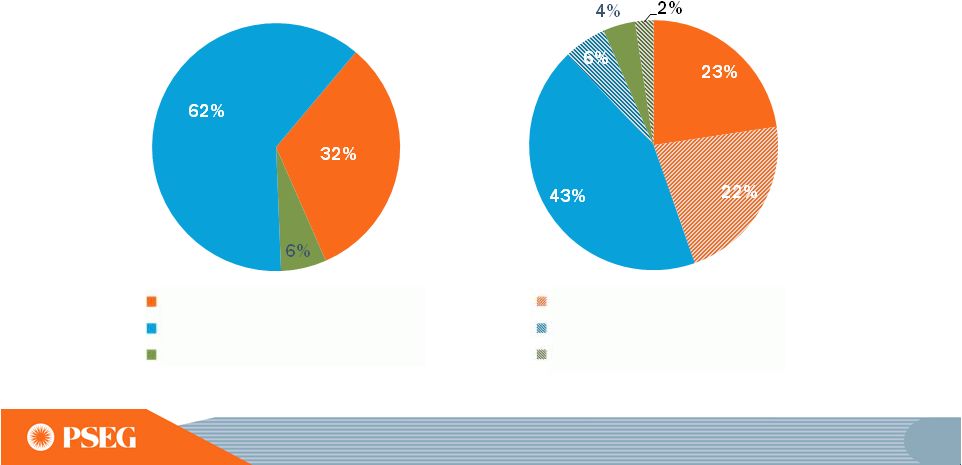
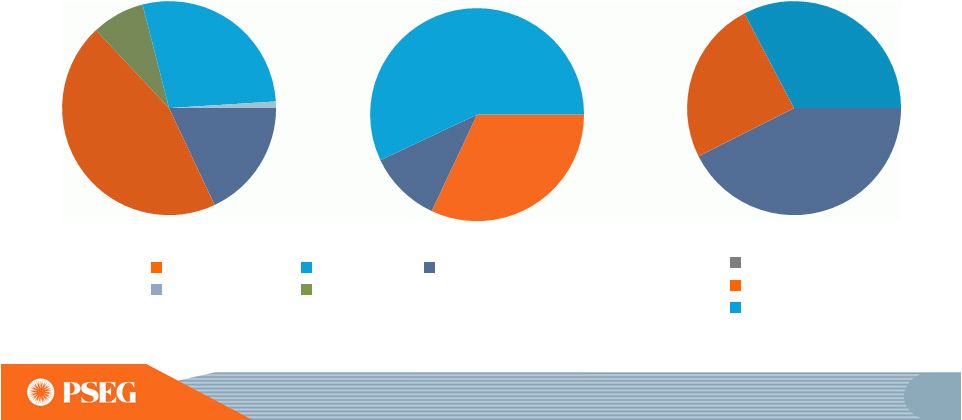 20 PSEG Power value advantaged by asset diversity, fuel flexibility and location Fuel Diversity* Total MW: 13,226 Energy Produced* Total GWh: 52,511 Energy Market Served* Total MW: 13,226 18% 45% 8% 28% 1% 32% 57% 11% 42% 25% 33% Intermediate Peaking Base load Nuclear Oil Coal** Gas Pumped Storage *2012 **INCLUDES NJ UNITS THAT FUEL SWITCH TO GAS. |
 21 • 2.2% (forecast³) • $12,600 • $5,000 4 • $6,900 5 • $700 5 • 1.4% • 30.4TWh • $290 • $12-$15 2015E • 0.8% (actual²) • $9,000 • $2,500 • $5,900 • $600 • 1.7% • 29.8TWh • $240 • $0 2012 Where we’re going • 2.4% (planned¹) • $6,800 • $866 • $5,900 • $0 • 1.6% • 29.3TWh • $0 • $0 • O&M Growth per year • PSE&G Rate Base • EFORd Rate - CCGT • Nuclear Generation • Holdings Solar Investment • LIPA Earnings PSEG Focus ($ millions, except as noted) 2008 E = ESTIMATE. . Transmission E&G Distribution EMP (1) Planned compound annual growth rate 2008-2012. (2) Actual compound annual growth rate 2008-2012. (3) Two-year compound annual growth rate from 2013. (4) Includes additional Transmission hardening. (5) Includes proposed filings: EE4A, SL3, S4Ae, and ES programs. |
 22 Balance Sheet Strengthened PSEG has reduced risk PSEG Total Capitalization 2009 2012 Power Power PSE&G PSE&G Equity 55% Debt 45% Equity 59% Debt 41% 57% 43% 55% 45% 70% 30% 51% 49% |
 23 Using PSEG’s balance sheet strength to finance growth in the regulated enterprise without equity issuance PSEG Total Capitalization 2012 2015E* * E = ESTIMATE; INCLUDES THE FOLLOWING PROPOSED FILINGS: EE4A, SL3, S4AE, ENERGY STRONG (ES) AND TRANSMISSION HARDENING. Debt 41% Equity 59% Debt 44% Equity 56% |
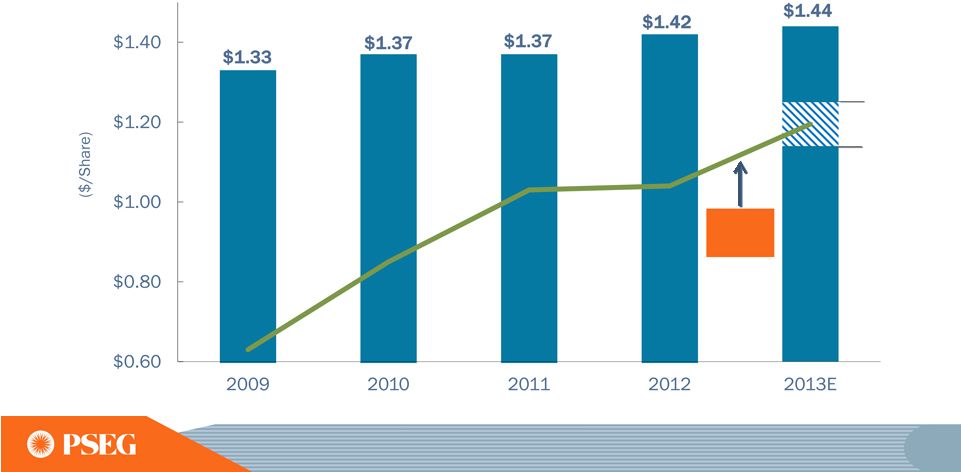
 24 PSEG Annual Dividend A long history of growth and returning cash to shareholders Payout Ratio 62% 70% 63% 66% 43% 44% 43% 44% 50% 58% 61%* 5-year Rate of Growth 2.22% 10-year Rate of Growth 2.92% PSEG Annual Dividend Rate *2013 PAYOUT RATIO REFLECTS THE MIDPOINT OF 2013 OPERATING EARNINGS GUIDANCE. **INDICATED ANNUAL RATE. $1.08 $1.10 $1.12 $1.14 $1.17 $1.29 $1.33 $1.37 $1.37 $1.42 $1.44** 2003 2004 2005 2006 2007 2008 2009 2010 2011 2012 2013 |
 25 Value Proposition PSEG is positioned to expand its investment in PSE&G projects that provide reasonable, risk adjusted returns, in ways that meet customer needs and state goals, given strong cash flow of Power and growing cash contribution from PSE&G. PSEG will maintain a strong financial profile that provides the opportunity to achieve our growth objectives and maintains our track record of returning cash to shareholders. |
 PSE&G |
 27 PSE&G strategy Building a sustainable platform that balances reliability, customer rates and public policy to ensure growth at reasonable returns DISCIPLINED INVESTMENT OPERATIONAL EXCELLENCE FINANCIAL STRENGTH ENGAGED WORKFORCE |
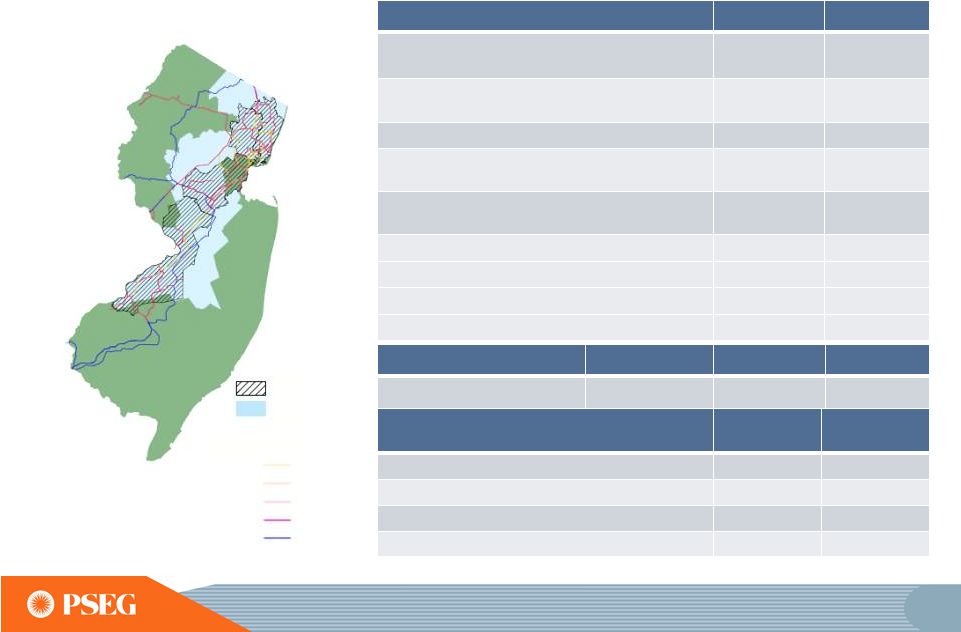 28 PSE&G is the largest electric and gas distribution and transmission utility company in New Jersey Electric Gas Customers Growth (2008 – 2012) 2.2 Million 0.6% 1.8 Million 0.6% Electric Sales and Gas Sold and Transported 41,641 GWh 3,397 M Therms Projected Annual Load Growth (2013 – 2015) 0.7%* 0.2%* Historical Annual Peak Load Growth Transmission (2008 – 2012) 0.4%** Projected Annual Load Growth Transmission (2013 – 2015) 1.4% Sales Mix Residential 33% 60% Commercial 57% 36% Industrial 10% 4% Transmission Electric Gas Approved Rate of Return 11.68% ROE*** 10.3% ROE 10.3% ROE Renewables and Energy Efficiency Approved Programs 2009-2012 Solar Loan I-III 67 MW 179 MW Solar 4 All and Extension 74 MW 125 MW Energy Efficiency Annual Electric savings 160 GWh 200 GWh Energy Efficiency Annual Gas savings 5M Therms 7M Therms * WEATHER NORMALIZED - ESTIMATED ANNUAL GROWTH PER YEAR OVER FORECAST PERIOD. ** TRANSMISSION LOAD GROWTH CAGR UTILIZES 2007 AS BASE YEAR. *** SPECIFIC PROJECTS APPROVED FOR INCENTIVE RATE TREATMENT WITH ADDITIONAL ROE. Total Program Plan Gas Territory Electric Territory 138KV 161KV 230KV 345KV 500KV Transmission by Voltage |
 29 National reliability award winner and recognized for emergency response during Hurricane Irene |
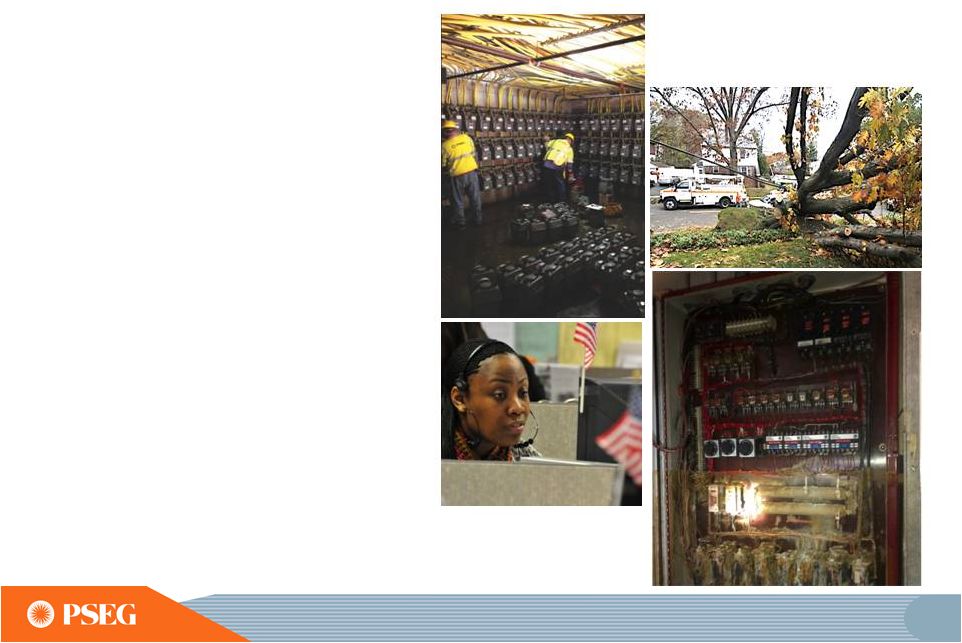 30 During Superstorm Sandy strong winds, heavy rainfall and storm surges caused significant damage to our infrastructure |
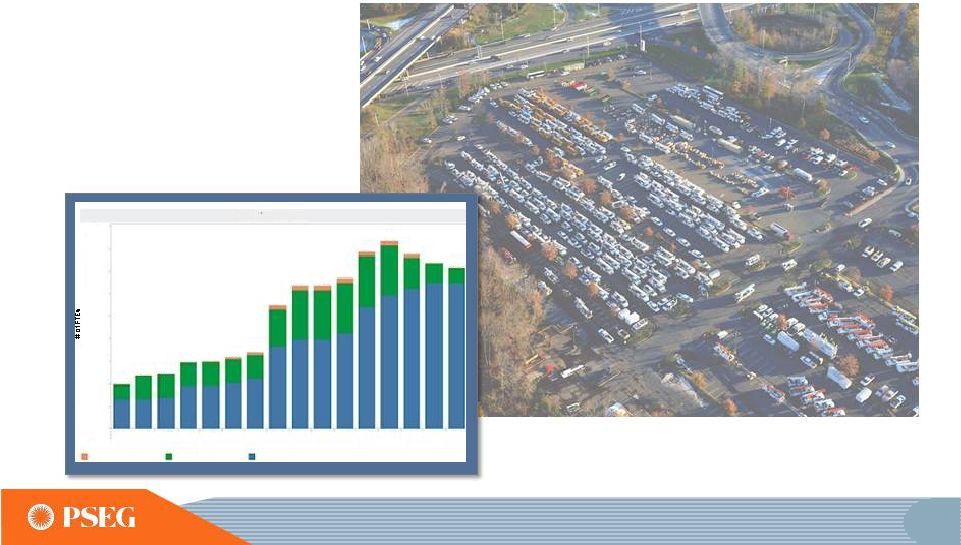 PSE&G brought in more than 4,000 contractors and mutual aid workers at the height of restoration efforts 4,500 4,000 3,500 3,000 2,500 2,000 1,500 1,000 500 0 993 1,179 1,220 1,476 1,488 1,586 1,702 2,757 3,176 3,176 3,345 3,936 4,174 3,867 3,683 3,576 10.2610.27 10.28 10.2910.30 10.31 11.1 11.2 11.3 11.4 11.5 11.6 11.7 11.8 11.9 11.10 FTE Substation Personel Tree Trimmers Uneman # of FTEs to Date 31 |
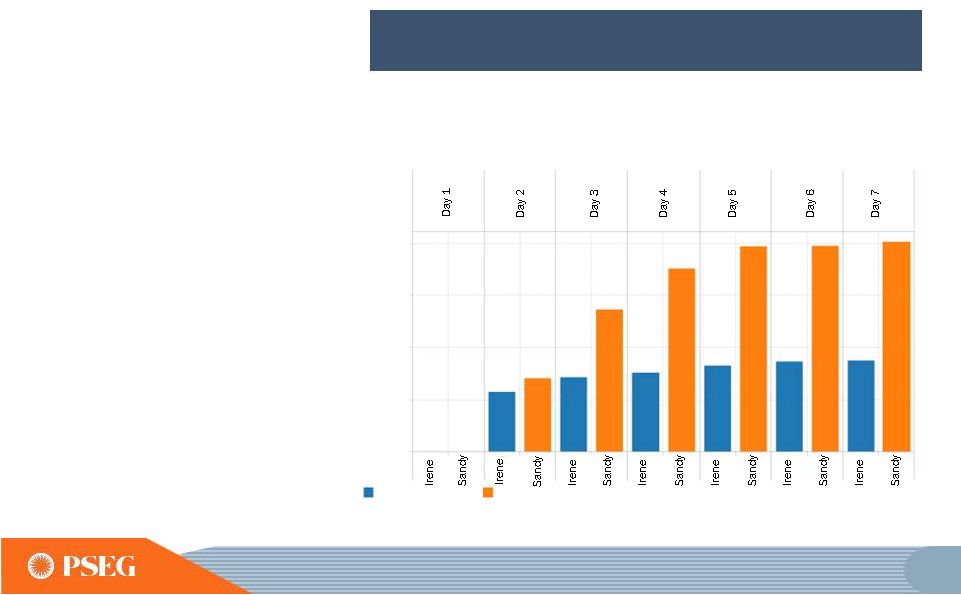 32 PSE&G’s response to customer outages during recent major events Cumulative Customers Restored Restoration response incorporated lessons learned from Hurricane Irene 2,000,000 1,500,000 1,000,000 500,000 0 Irene Sandy |
 33 PSE&G’s operating earnings grew ~10%* with increased investment, cost control and supportive rate mechanisms * COMPOUND ANNUAL GROWTH RATE SEE SLIDE A FOR ITEMS EXCLUDED FROM INCOME FROM CONTINUING OPERATIONS/ NET INCOME TO RECONCILE TO OPERATING EARNINGS. |
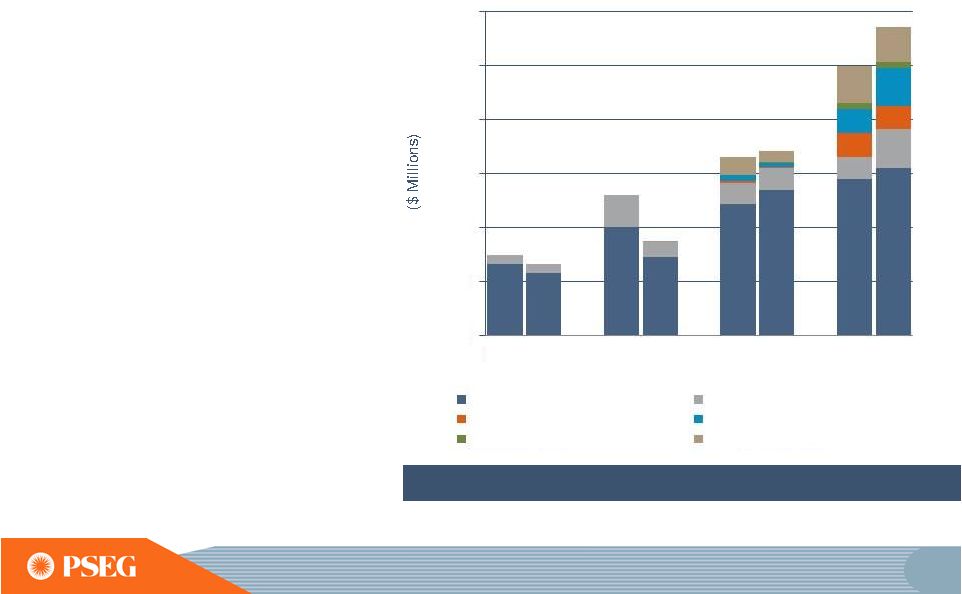
 34 Growth in rate base is driven by investments with favorable recovery mechanisms $9.0B PSE&G Rate Base $6.8B PSE&G’s rate base has grown ~7% annualized with a focus on meeting the State’s goals and customers’ needs Renewables & Energy Solutions Transmission Gas Distribution Electric Distribution |
 35 Represents ~28% of rate base in 2012 Overall, Transmission has delivered on planned spending PSE&G’s Transmission Capital Expenditures 2009 2009 Plan Actual 2010 2010 Plan Actual 2011 2011 Plan Actual 2012 2012 Plan Actual Remaining Transmission North East Grid Mickelton-Gloucester-Camden Susquehanna-Roseland North Central Reliability Burlington-Camden 1,200 1,000 800 600 400 200 0 |
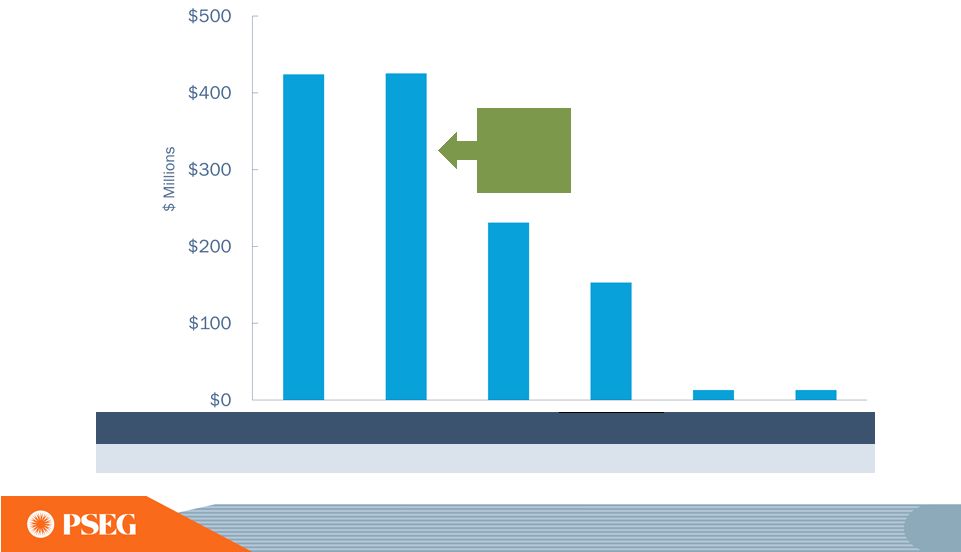
 36 Providing solutions for New Jersey’s energy and economic development goals ($ Millions) Approval Date Forecast Amount* Spend As of 6/30/13 Remaining Spending Renewables Solar Loan I & II 2008- 2009 $244 $228 $16 Solar 4 All July 2009 457 456 1 Solar Loan III May 2013 199 - 199 Solar 4 All Extension May 2013 247 - 247 Energy Efficiency Carbon Abatement December 2008 45 45 - Energy Efficiency Economic Stimulus July 2009 161 157 4 Demand Response July 2009 34 29 5 Energy Efficiency Economic Stimulus Extension July 2011 93 23 70 Distribution NJ Capital Infrastructure Program 1 (CIP 1) April 2009 702 702 - NJ Capital Infrastructure Program 2 (CIP 2) July 2011 280 280 - Total $2,462 $1,920 $542 *SOLAR 4 ALL EXT AND SOLAR LOAN 3 REFLECT BPU APPROVED PROGRAM SPEND “UP TO” LISTED AMOUNTS. |
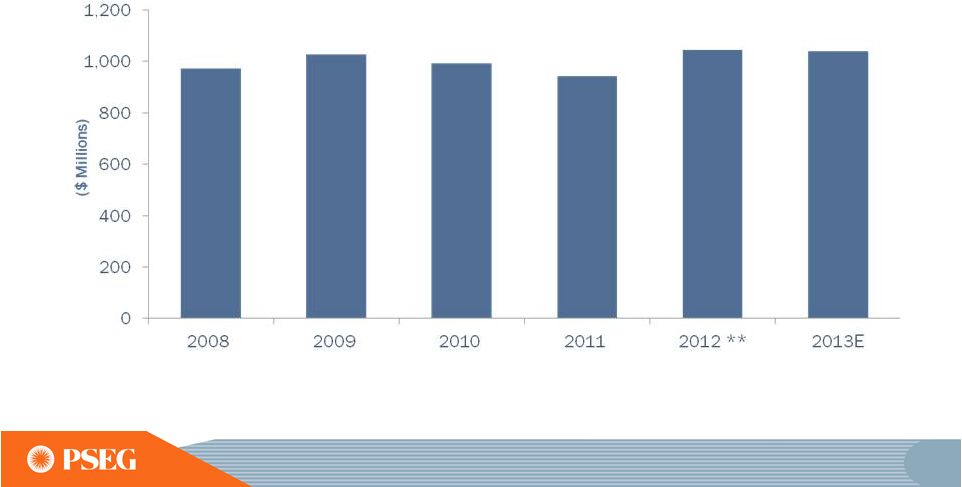 37 Focus on controlling O&M allows us to earn our authorized return PSE&G O&M* 2008 – 2013 CAGR: 1.4% * EXCLUDES REGULATORY CLAUSES ** INCLUDES $40M IMPACT FROM SUPERSTORM SANDY IN 2012 E = ESTIMATE |
 38 PSE&G’s capital program will continue to be focused on delivering energy solutions to meet New Jersey’s public policy PSE&G’s Capital Expenditures DATA AS OF JUNE 30, 2013. * PROPOSED FILINGS INCLUDE ENERGY STRONG (ES) AND EE4A. E = ESTIMATE |
 39 2013-2017 proposed investment plan would grow our current capital plan by up to 50% 2013-2017E Capital Expenditures Existing Plan $7.2 Billion Existing Plan and Proposed Filings $10.3 Billion * Distribution ES and Transmission Hardening extend 10 years * * DATA AS OF JUNE 30, 2013. E = ESTIMATE Distribution Transmission Approved Solar/Energy Efficiency Distribution ES Filing Transmission Hardening Energy Efficiency Filings |
 40 PSE&G’s proposed investments would be recovered through contemporaneous recovery mechanisms Contemporaneous Recovery Mechanisms Traditional Recovery Mechanisms DATA AS OF JUNE 30, 2013. E = ESTIMATE Energy Strong Filing (ES) Solar/Energy Efficiency Clauses FERC Formula Rates Distribution Base Rates 2013-2017E Capital Spending by Recovery Method $10.3 Billion |
 41 PSE&G’s existing major transmission investment program remains on schedule and on budget Major Transmission Projects Susquehanna -Roseland 12.93% $790 June 2014 / June 2015 Northeast Grid Reliability 11.93% $895 June 2015 North Central Reliability 11.68% $390 June 2014 Burlington – Camden 230kV 11.68% $399 June 2014 Mickleton – Gloucester-Camden 230kV 11.68% $435 June 2015 Approved ROE Inclusion of CWIP in Rate Base 100% Recovery of Costs Due to Abandonment Total Estimated Project Costs Expected In-service Date |
 42 Susquehanna-Roseland consists of constructing 150 miles of 500kV circuit (46 miles in NJ) with two new 500kV GIS switching stations at Roseland and Hopatcong Project Estimate Up To* Through Year-end 2012 2013-2015E Expected In-service Date $790M $324M $466M June 2014 / June 2015 • PJM RTEP project b0489 • ROE of 12.93% (including 1.25% incentive) • 100% CWIP in rate base during development • 100% recovery of prudently incurred costs due to abandonment Project Status: Major permitting & siting complete, outside and inside plant construction in progress *PROJECT IS SHARED WITH PPL. PROJECT ESTIMATE REPRESENTS PSE&G’S CONSTRUCTION RESPONSIBILITY FOR THE NJ PORTION. E = ESTIMATE |
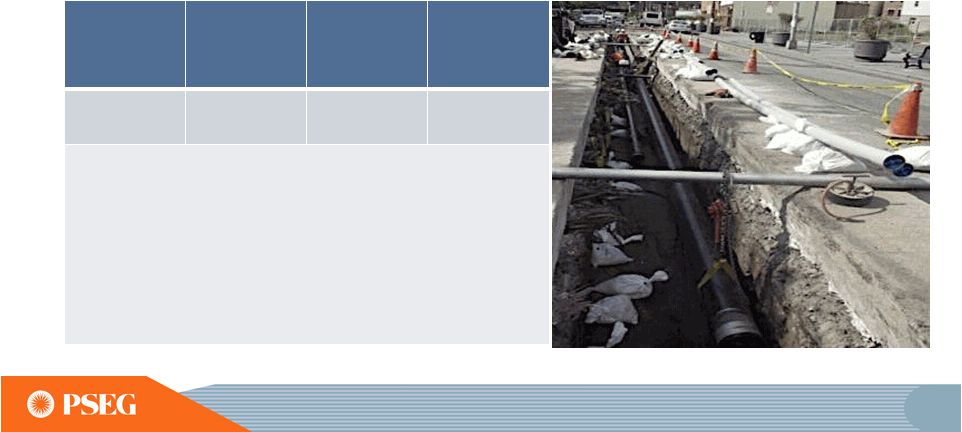 43 Northeast Grid Reliability consists of upgrading approximately 50 overhead circuit miles of 138kV transmission line to 230kV, constructing ~18 miles of new underground 230kV lines, and converting twelve existing stations to 230kV operation E = ESTIMATE Project Estimate Up To Through Year- end 2012 2013-2015E Expected In-service Date $895M $88M $807M June 2015 • PJM RTEP project b1304 • ROE of 11.93% (including 0.25% incentive) • 100% CWIP in rate base during development • 100% recovery of prudently incurred costs due to abandonment Project Status: Engineering, licensing, and outside plant underground construction in progress |
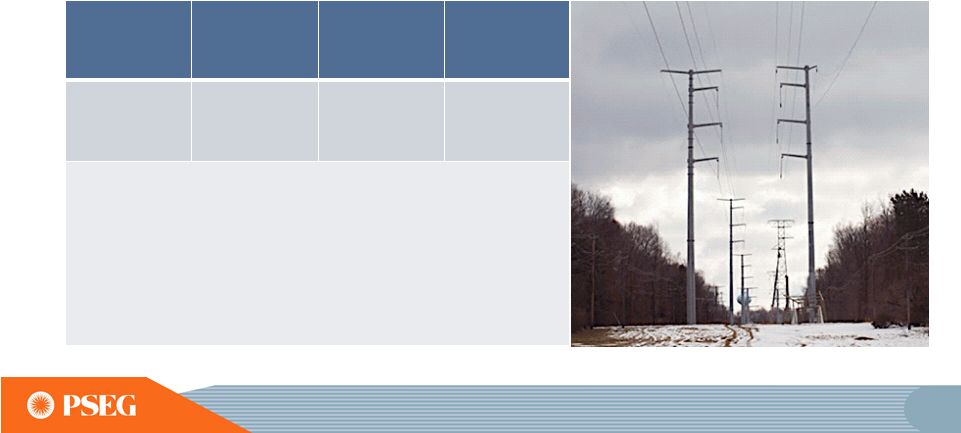 44 North Central Reliability consists of upgrading 55 circuit miles of 138kV transmission line to 230kV, and converting six existing stations to 230kV operation E = ESTIMATE Project Estimate Up To Through Year- end 2012 2013-2015E Expected In-service Date $390M $163M $227M June 2014 • PJM RTEP project b1154 • ROE of 11.68% • 100% CWIP in rate base during development • 100% recovery of prudently incurred costs due to abandonment Project Status: Major permitting & siting complete, outside and inside plant construction in progress |
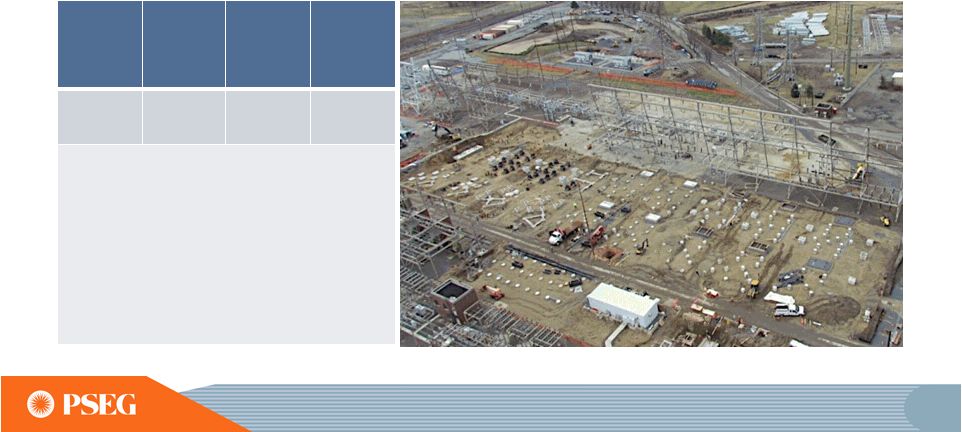 45 Burlington-Camden 230kV consists of upgrading 37 circuit miles (30 miles of overhead and 7 miles of under- ground) of 138kV transmission line to 230kV, converting the existing stations to 230kV operation E = ESTIMATE Project Estimate Up To Through Year-end 2012 2013- 2014E Expected In-service Date $399M $169M $230M June 2014 • PJM RTEP project b1156 • ROE of 11.68% • 100% CWIP in rate base during development • 100% recovery of prudently incurred costs due to abandonment Project Status: Major permitting & siting complete, outside and inside plant construction in progress |
 46 Mickleton-Gloucester-Camden 230kV consists of upgrading 10 circuit miles of overhead transmission, installing ~16 circuit miles of new 230kV underground, 10 circuit miles of new 230kV overhead, and modifications/upgrades at five existing stations E = ESTIMATE Project Estimate Up To Through Year- end 2012 2013-2015E Expected In-service Date $435M $24M $411M June 2015 • PJM RTEP project b1398 • ROE of 11.68% • 100% CWIP in rate base during development • 100% recovery of prudently incurred costs due to abandonment Project Status: Major permitting & siting complete, outside and inside plant construction in progress |
 47 State policy imperatives have been redefined by Superstorm Sandy • On February 20, 2013, at its open public meeting, the Board voted that the recovery of all such storm restoration costs would be reviewed in a generic (multi-utility) proceeding Storm Deferral Filings: • On December 19, 2012 the Board granted a PSE&G request for • Preparedness Efforts • Communications • Restoration and Response • Post Event Analysis • Underlying Infrastructure Issues Storm report issued by NJBPU focusing on: general authority to defer storm restoration costs, thereby making such costs potentially recoverable in future rate filings |
 48 We have also responded with a plan focused on infrastructure hardening and resiliency • The filing complements the NJBPU’s recently issued order requiring all Electric Distribution Companies to take specific actions to improve preparedness and response to major storms • Additional Transmission investment of approximately $1.5 billion would be included in future FERC Formula Rate filings • PSE&G filed a petition on February 20, 2013, with the NJBPU seeking approval for the Energy Strong Program (ES) which will harden electric and gas distribution infrastructure and increase the resiliency of the electric distribution system • ES program represents a potential investment of approximately $3.9 billion over the next 10 years. PSE&G has asked for initial funding approval of $2.6 billion during the first five years |
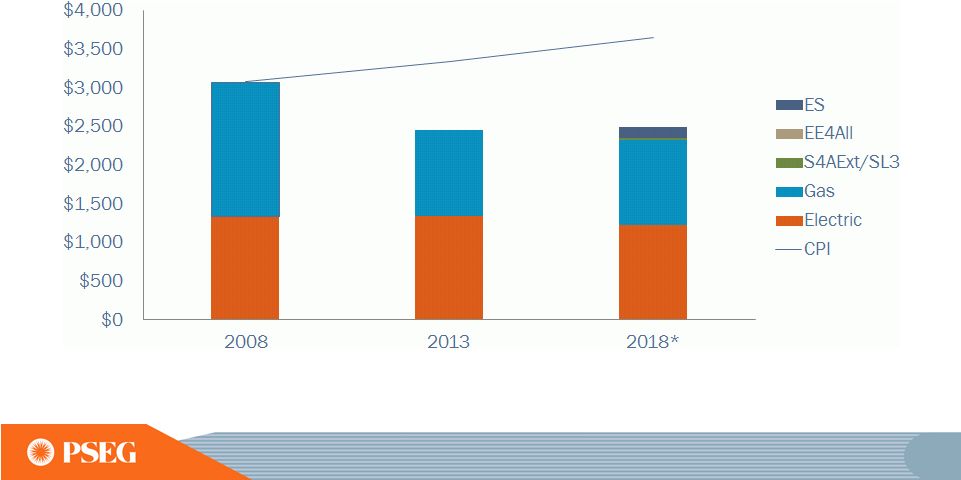 49 Lower commodity costs and expiration of certain transition charges are expected to fully offset the impact to customer bills *2018 BGS/BGSS RATES AS WELL AS SBC AND DISTRIBUTION RATES HELD CONSTANT AT CURRENT 2013 RATES. RATES RELATED TO ELECTRIC RESTRUCTURING: SECURITIZATION (STC), NON-UTILITY GENERATION CHARGE (NGC), & TRANSITIONAL ENERGY FACILITIES ASSESSMENT (TEFA), ARE REDUCED TO ZERO BY 2018. THE RGGI RECOVERY CHARGE (RRC), SOLAR PILOT RECOVERY CHARGE (SPRC), AND CAPITAL ECONOMIC STIMULUS INFRASTRUCTURE INVESTMENT PROGRAM EXTENSION (CIP II ) BILL IMPACTS ARE INCLUDED IN THEIR RESPECTIVE GAS AND ELECTRIC BARS AND FORECASTED IN 2018 BASED UPON LATEST ESTIMATE. THE 2018 BILL IMPACTS OF ES, EE4ALL, AND S4AEXT/SL3 IMPACTS ARE BASED UPON CURRENT ESTIMATES AS OF MARCH 31, 2013. Typical Residential Annual Bill |
 50 PSE&G’s 2013 operating earnings benefiting from transmission growth and cost containment initiatives E= ESTIMATE *SEE SLIDE A FOR ITEMS EXCLUDED FROM INCOME FROM CONTINUING OPERATIONS/NET INCOME TO RECONCILE TO OPERATING EARNINGS. $528 2012 2013 Guidance PSE&G Operating Earnings* ($ Millions) $580 - $635E |
 LONG ISLAND POWER AUTHORITY |
 52 LIPA T&D management contract In December 2011, the Long Island Power Authority (LIPA) selected PSEG to manage its electric transmission and distribution system for 10 years starting in 2014 Commitment to cost control and investment optimization Corporate culture of transparency and data-driven decision making Transition activities on-track – successfully achieving all milestones through February 2013 Successful management of the LIPA transmission and distribution system may lead to additional growth opportunities LIPA /National Grid Contract Thru Dec 2013 PSEG Transition Period 2012-2013 PSEG Long Island Operating Period 2014 - 2023 Reasons for selecting PSEG included: Proven technical capabilities and track record of top quartile customer service and reliability Evaluating impact of Superstorm Sandy and recent LIPA management changes on the overall schedule and transition |
 PSEG ENERGY HOLDINGS |
 54 PSEG Energy Holdings strategy Holdings’ priorities are to manage lease risks, sell remaining non- core assets and grow the renewables portfolio STREAMLINED BUSINESS AND REDUCED FINANCIAL RISK CAPITALIZE ON RENEWABLE OPPORTUNITIES MAXIMIZING THE VALUE OF THE REMAINING PORTFOLIO DEVELOP AND EXECUTE NEW BUSINESS OPPORTUNITIES |
 55 PSEG Energy Holdings has monetized the majority of its legacy assets, eliminated all Holdings debt, and returned cash to PSEG Holdings Investment Portfolio Solar Investments $1.2B Merchant Energy Leases Regulated Energy Leases & Other Regulated Energy Leases & Other Merchant Energy Leases LILO/SILO Leases International Investments $4.9B Texas LILO/SILO Lease Terminations ~$1.2B International & Other Global Asset Sales ~$2.1B Texas Transfer & Sale ~$600M Dynegy Lease Reserve ~$0.2B 2012 $M Solar Source $ 159 Merchant Energy Leases GenOn (REMA)/NRG $ 341 EME (Midwest Gen) $ 218 Regulated Energy Leases $ 202 Real Estate Leveraged Leases $ 80 Real Estate Operating Leases $ 100 Generation Legacy Assets $ 96 Aircraft Leases and Other $ 24 $1,220 2006 NOTE: 2006 AND 2012 DATA REFLECT BOOK VALUES OF ASSETS, EXCLUDING DEFERRED TAXES. TRANSACTIONS REFLECT TRANSFER VALUE IN THE CASE OF TEXAS, MARKET VALUES FOR ASSET DISPOSITIONS OR, IN THE CASE OF DYNEGY, BOOK VALUE RESERVE TAKEN IN 2011.. |
 Reducing Risk and Monetizing Legacy Assets PSEG Energy Holdings Growth in unregulated renewables PSEG Solar Source Growth by leveraging knowledge PSEG Long Island Merchant Energy Leveraged Leases Regulated Energy Leveraged Leases Real Estate Leveraged and Operating Leases Legacy Generation Assets …MANAGING RISK FOR REMAINING LEGACY ASSETS AND INVESTING IN RENEWABLES 56 |
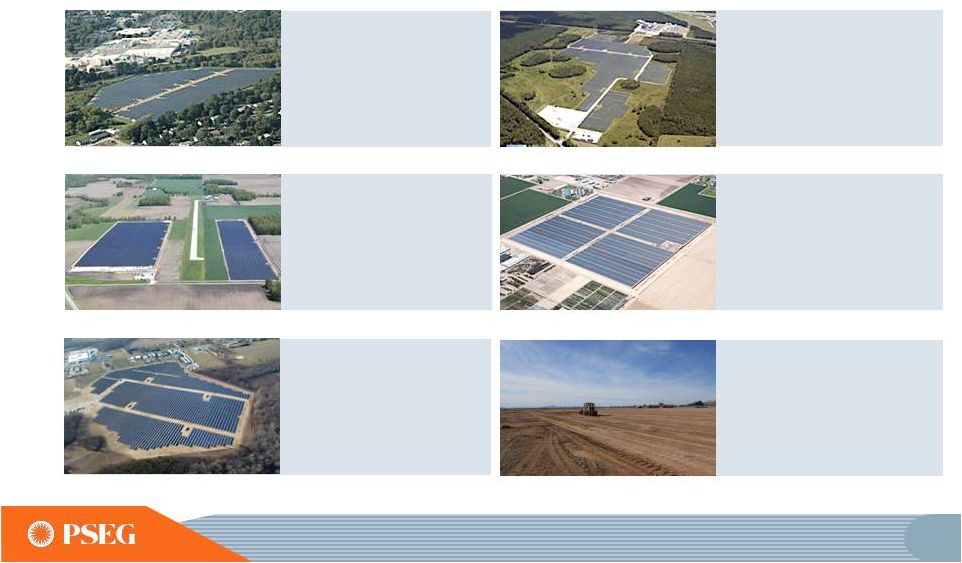 57 PSEG Solar Source has completed 69 MW and has an additional 19 MW under construction Milford Delaware (15 MW) COD December 2012 Polycrystalline - fixed tilt Investment $47 million 20 year PPA with DEMEC Hackettstown (Mars) New Jersey (2 MW) COD September 2009 Thin film panels – fixed tilt Investment $13 million 15 year PPA with Mars, Inc. … OPPORTUNITY FOR GROWTH IN UNREGULATED SOLAR Badger I Arizona (19 MW) Expected COD late 2013 Polycrystalline - single axis tracker Investment $51 million 30 year PPA with APS Wyandot Ohio (12 MW) COD May 2010 Thin film panels – fixed tilt Investment $45 million 20 year PPA with AEP Queen Creek Arizona (25 MW) COD October 2012 Polycrystalline - single axis tracker Investment $75 million 20 year PPA with SRP JEA Florida (15 MW) COD September 2010 Thin film panels – fixed tilt Investment $59 million 30 year PPA with JEA |
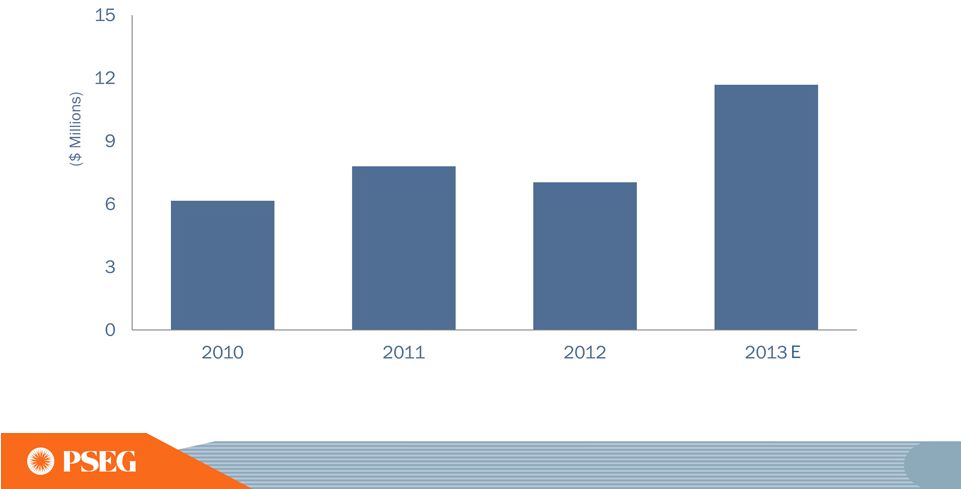 58 PSEG Energy Holdings These projects will produce steady results for PSEG PSEG Solar Source EBITDA E = ESTIMATE. … A STABLE, LOW-RISK PORTFOLIO |
 59 PSEG Energy Holdings Simplifying the business and creating growth opportunities in renewables Operational Excellence Financial Strength Disciplined Investment STREAMLINED BUSINESS AND REDUCED FINANCIAL RISK CAPITALIZE ON RENEWABLE OPPORTUNITIES MAXIMIZING THE VALUE OF THE REMAINING PORTFOLIO DEVELOP AND EXECUTE NEW BUSINESS OPPORTUNITIES |
 PSEG POWER |
 PSEG Power strategy Focused on safety performance, unit reliability, competitive cost structure with control of maintenance costs, achieving operational excellence, and supporting market rules to maintain a level playing field DISCIPLINED INVESTMENT ENGAGED WORKFORCE FINANCIAL STRENGTH OPERATIONAL EXCELLENCE 61 |
 62 PSEG Power creating value by responding to changing markets and regulations • Installed 400 MW new peaking capacity in 2012 Financial/Economic Focus • O&M cost control programs have delivered • Sites offering competitive advantage suited for expansion Regulatory Focus • Strong regulatory performance • Industry leadership in the changing regulatory environment Safety/Environmental Focus Fleet Diversity/Efficiency Focus • Fleet diversity across the dispatch curve and fuel types provides flexibility • Nuclear units continue to achieve strong operational results and are well positioned for the future • Peach Bottom steam path retrofit completed • Fossil fleet is suited for market dynamics • CCGT achieved record output in 2012 |
 63 PSEG Power delivered in 2012 Storm and weather challenges • Superstorm Sandy impacted our generating sites • Warm winter put pressure on demand and pricing for both electricity and gas • Hot summer weather created challenging operating environment Market challenges • Unit outages and transmission outages resulted in pressure on basis • Lower gas cost impacted dark spread pressuring coal unit dispatch • Load impacted by weather and economy Value delivered • Cost control • Lower dispatch and fuel cost • Captured value through coal/gas switching, unit flexibility • Improved unit availability • Coal & oil sales optimized inventory • Expedited return from storm outages, restored margin opportunities • Optimized unit dispatch across fleet during storm recovery |
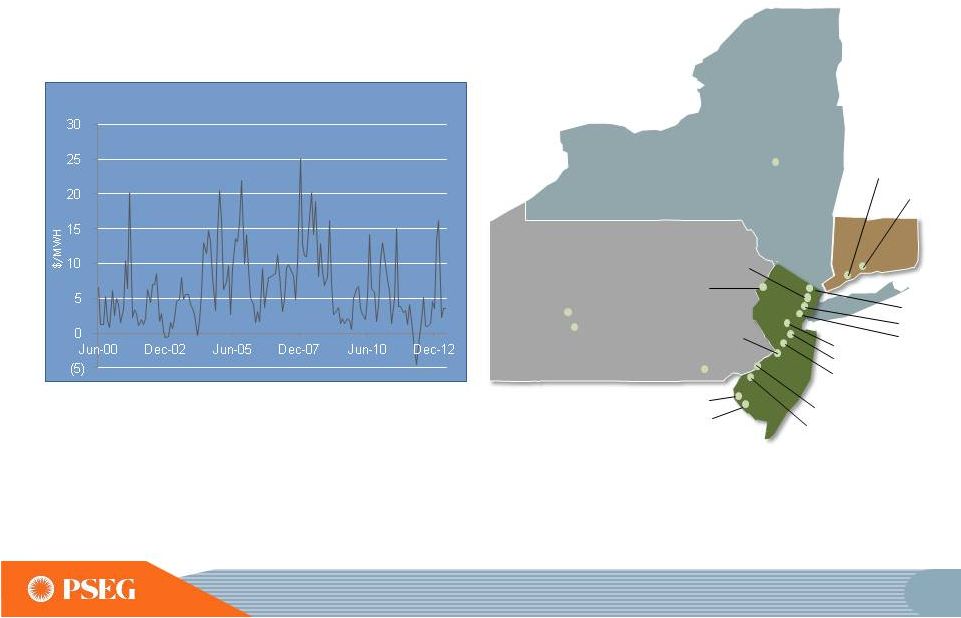
 64 PSEG Power has generating assets in three competitive markets • Low cost portfolio • Fuel flexibility • Assets near loads • Poised to benefit in real time markets • Fleet will maintain diversity and efficiency in 2016 after HEDD • Most sites suitable for expansion ISO New England New Haven Bridgeport Bethlehem Energy Center (Albany) Conemaugh Keystone Peach Bottom Bergen Kearny Essex Sewaren Edison Linden Mercer Burlington National Park Hudson Hope Creek Salem Yards Creek New York ISO PJM |
 65 PSEG Power Nuclear fleet is a critical element of success Hope Creek • Operated by PSEG Nuclear • PSEG Ownership: 100% • Technology: Boiling Water Reactor • Total Capacity: 1,174 MW • Owned Capacity: 1,174 MW • License Expiration: 2046 • Next Refueling • Fall 2013 Salem Units 1 and 2 • Operated by PSEG Nuclear • PSEG Ownership: 57%, Exelon – 43% • Technology: Pressurized Water Reactor • Total Capacity: 2,326 MW • Owned Capacity: 1,335 MW • License Expiration: 2036 and 2040 • Next Refueling • Unit 1 – Fall 2014 • Unit 2 – Spring 2014 Peach Bottom Units 2 and 3 • Operated by Exelon • PSEG Ownership: 50% • Technology: Boiling Water Reactor • Total Capacity: 2,245 MW • Owned Capacity: 1,123 MW • License Expiration: 2033 and 2034 • Next Refueling • Unit 2 – Fall 2014 • Unit 3 – Fall 2013 |
 66 PSEG Power Nuclear is core to the fleet and has competitive advantages • Continued strong nuclear operations – eight consecutive years of >90% capacity factor • Significant earnings contributor • Top quartile of cost performance/MWh • One third new staff, recruitment of the best new and experienced talent and attractive training program • Developing Fukushima action plan in response to NRC staff review • Peach Bottom extended power uprate, 130 MW Power’s share, scheduled in service 2015/2016 • Active and influential participation at INPO, NEI, EPRI, USA Alliance |
 67 EFORp improvement and availability at peak demand times has resulted in performance payments in each of the last four years EFORd improvement resulted in over 200 MW of additional capacity available PSEG Power’s Fossil Fleet availability has shown steady improvement |
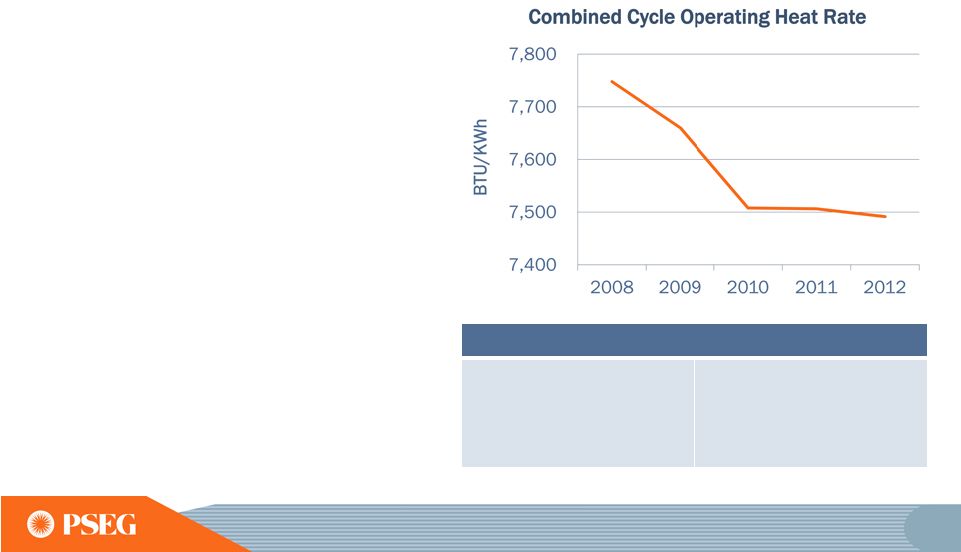 68 PSEG Power improvements achieved in combined cycle fleet efficiency Actions Taken to Create Value • Heat rate improvement program • Operational Excellence Model • Training programs • Unit testing initiative • Outage work to restore efficiency |
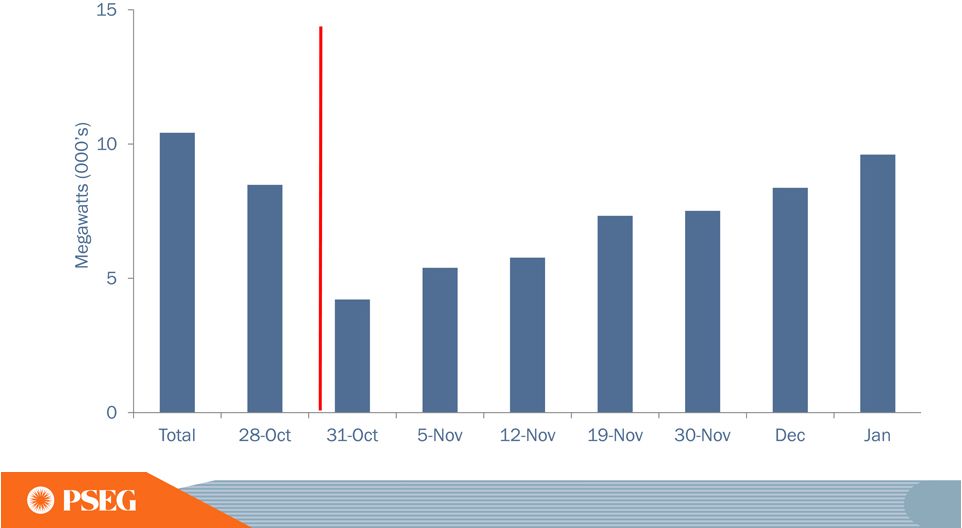 69 Superstorm Sandy affected the fleet; when the load returned, Power was ready Planned Outages Salem 2 Bergen 1 Hudson 2 Storm Outages Salem 1 Linden CC Linden 5,6,7,8 Kearny 9,12,13,14 Essex 9,10,11,12 Sewaren 1,2,3,4 Salem 1 Linden 5,7 Kearny 13,14 Linden 6,8 Bergen 1 Salem 2 Kearny 12 All PSEG NJ Generation Superstorm Sandy Hudson 2 Essex 9,10 Linden CC |
 PSEG Power’s fleet is among the lowest emitting in the industry • Mercury reduced 80% across the timeframe above • Power is well positioned for HAPS 0 10,000 20,000 30,000 40,000 50,000 60,000 70,000 80,000 90,000 10,000 20,000 30,000 40,000 50,000 60,000 70,000 2006 2007 2008 2009 2010 2011 2012 Generation SO 2 NOx 70 |
 71 PSEG Power’s focus on costs has resulted in moderate increase in O&M for six years 2008 to 2013 CAGR = 1.9% Power O&M Expense* * INCLUDES IMPACTS FROM STORM RECOVERY COSTS AND POTENTIAL RELATED INSURANCE PROCEEDS. E = ESTIMATE. Cost control actions taken: • Coal assessment • CCGT material condition assessment • Contract renegotiation • Material management • Nuclear maintenance productivity study • Nuclear outage efficiency initiative |
 72 PSEG Power is well positioned for growth in the fleet when market conditions dictate Available locations • Bergen • Burlington • Essex • Edison • Kearny • Hudson • Linden • Sewaren • Bridgeport Harbor • Electric Interconnection • Gas Pipeline Access • Sites/Space • Emissions Our sites possess infrastructure advantages |
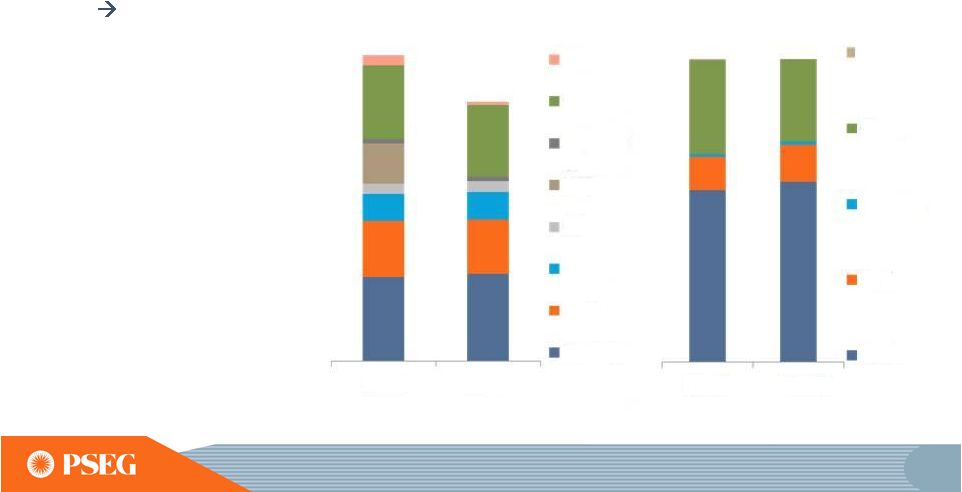 73 PSEG Power will maintain diversity and efficiency after a realignment of the fleet in 2016 13,226 MW 11,200 MW Fuel Diversity 52.5 TWh 52-54 TWh Energy Produced E Other E=ESTIMATE Oil CCGT Pumped Storage HEDD Other gas Peakers Coal Nuclear CCGT Peakers Coal Nuclear 2012 2016E 2012 2016 Objective 2012 2016E • Maintain fuel diversity • Maintain load serving capability • Improve fleet heat rate by 6% • Maintain low cost structure • Environmental improvement |
 74 PSEG Power is an established leader within the industry INPO • Board of Directors • National Nuclear Accrediting Board NEI • Chair Communications Advisory Committee • Board of Directors • Board of Directors Executive Committee • Chair Emergency Preparedness Working Group • Security Working Group • Fukushima Response Steering Committee • Nuclear Strategic Issues Advisory Committee Steering Group EPRI • Chairman Nuclear Power Counsel • Executive Committee Nuclear Power Counsel BWR Owners Group • Vice Chair of the Executive Oversight Committee USA Alliance • Chair PJM/NY/NE ISO • Various Committees |
 75 PSEG Power has added value with focus on operational excellence * EXCLUDES SANDY IMPACT. 3,622 Nuclear capacity (MW) 3,632 92% Nuclear equivalent availability 93% 29.3 Nuclear generation (TWhrs) 29.8 55 Total generation (TWhrs) 53 3,157 CCGT capacity (MW) 3,176 12.1 CCGT generation (TWhrs) 16.2 8.9% Fossil EFORd 6.3%* 87% Fossil equivalent availability 90% 63 SO 2 (Ktons) 9 16 NO x (Ktons) 10 2008 2012 |
 PSEG POWER ER&T |
 DIVERSIFIED ASSETS AND FLEXIBLE DISPATCH REGULATORY ADVOCACY MANAGING RISKS AND CREATING VALUE ENGAGED WORKFORCE 77 PSEG Power ER&T strategy Focused on optimizing the value of its asset portfolio and providing outstanding service to our customers, while prudently managing risk |
 High performing, base load nuclear assets 3,632 MW Fuel advantaged, base load coal plants in PA 776 MW Flexible combined cycle fleet 3,176 MW Well leveraged intermediate & peaking assets 5,642 MW Integrated trading and dispatch capability around fleet 78 Diversified assets and flexible dispatch |
 Fleet capacity has been advanced by: Reduced O&M and increased start-up success Trading acumen to execute fuel switching opportunities Capturing new products opportunity with minimal investment Improved Heat Rate capability 79 |
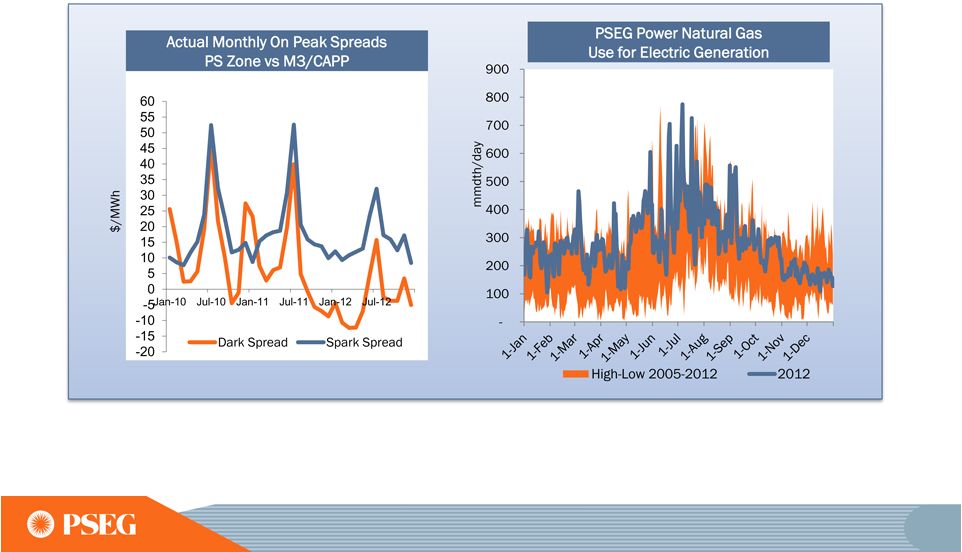 80 Spark spread replaces dark spread as major value driver • Spark spread has risen above dark spread in PJM markets • Power’s gas units operating at record throughput • Gas operation provides much more operational flexibility • Enhances the ability of trading organization to capture volatility |
 81 2013 BGS Auction Results for PSE&G Zone Capacity Load shape Transmission Congestion Ancillary services Risk premium Green $48 - $50 $45 - $47 $37 - $38 $56 - $58 $39 - $40 BGS sales account for about a third of our forward portfolio of hedges 3 Year Average Round the Clock PJM West Forward Energy Price $103.72 ~ $47 $95.77 $94.30 ~ $47 ~ $48 ~ $46 $83.88 ~ $53 $92.18 BGS PRICES REFLECT PSE&G ZONE; RESULTS FOR 2011-2013 ARE THE NEW BLENDED PRICES BEGINNING JUNE 1, 2013. 81 |
 82 • 3 Year forward BGS sales comprise smaller percentage of Power’s hedges • Other full requirement load deals help capture additional locational and load shape premium NOTE: PERCENTAGES REPRESENT HEDGED VOLUMES IN PLACE AFTER BGS AUCTION. Our hedging mix has changed with the market but still captures the fleet’s locational advantage Other Load BGS Sales to NJ EDCs Other Hedges 82 |
 Hedging strategy designed to protect gross margin and leverage the portfolio HEDGE PERCENTAGES AND PRICES AS OF JUNE 28, 2013. REVENUES OF FULL REQUIREMENT LOAD DEALS BASED ON CONTRACT PRICE, INCLUDING RENEWABLE ENERGY CREDITS, ANCILLARY, AND TRANSMISSION COMPONENTS BUT EXCLUDING CAPACITY. HEDGES INCLUDE POSITIONS WITH MTM ACCOUNTING TREATMENT AND OPTIONS. 83 Ratable Hedging on Base Load: 3 year ratable hedge tactics 3 year PJM hedge of capacity (not included in table) Load following sales (such as BGS) have strong correlation to our units for hedging basis and load shaping premium Dynamic Hedging on Intermediate Coal, Combined Cycle and Peaking: Position fleet to take advantage of market volatility Gas and load-following fleet left open until prompt year to capture volatility Use all trading products to capture option value of assets and benefit from market dislocations |
 New Haven Current plant locations Bridgeport Bethlehem Energy Center (Albany) Conemaugh Keystone Peach Bottom Bergen Kearny Essex Sewaren Edison Linden Mercer Burlington National Park Hudson Hope Creek Salem Yards Creek • Basis (PS Zone to PJM West) will continue to trend downward for forward sales • Volatility will remain significant in the prompt periods (especially summer/winter) • Power maintains sufficient length to participate in upside volatility as well as a valuable 250MW transmission position into NYC • Basis will continue to have a positive impact on PSEG Power profitability PSEG’s locational advantage and electric basis *AS OF MAY 15, 2013. 84 PS Zone On Peak Monthly Day Ahead Basis to PJM West Hub* |
 • Lower cost supplies of shale gas have been beneficial to both PSE&G customers and PSEG Power • Over 50% of our available pipeline capacity can access market area supplies of shale gas • Power’s generating units sit in close proximity to the Marcellus fairway • Power buys approximately 350BCF/year of gas • We have been able to arbitrage gas values from South to North and East to West using our storage and pipeline capacity Albany PSEG’s locational advantage and gas basis New York 85 Shale Supply 0.6 BCF/D Storage 0.9 BCF/D Gulf Coast Supply 0.7 BCF/D |
 PJM’s capacity market continues to recognize locational value of our fleet *PSEG Power’s cleared megawatts split between PS Zone and EMAAC. 86 $/MW-Day 2012 / 2013 2013 / 2014 2014 / 2015 2015 / 2016 2016 / 2017 Power’s Average Price PS Zone EMAAC RTO Power’s Capacity (MW) $153 $140 $16 10,400 $244 $162 $167 $166 $219 $245 $137 $167 $119 $28 $126 $136 $59 10,600 10,300 9,000 8,637* New Build and Higher Imports Updated Transfer Capabilities Updated Demand Curve Environmental Retirements Minimum Offer Price Rule Lower Demand Response 2016/2017 RPM Auction Influenced By: |
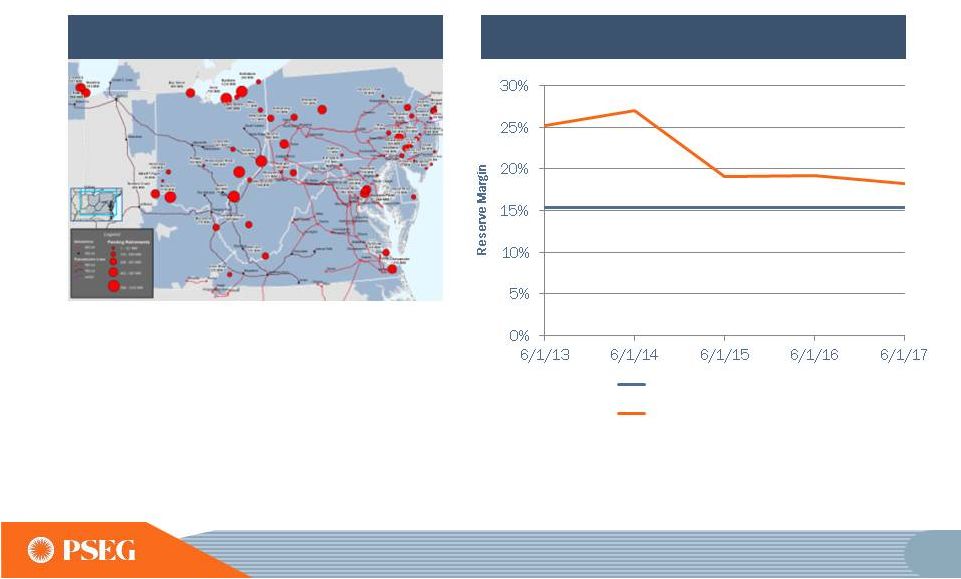 Reserve margins in PJM declining with retirements Generation Deactivation Notifications Source: PJM TEAC, 1/10/2013 • PJM Pending Deactivation Requests of 12,634 MW as of January 22, 2013 • Approximately 4,000 MW of additional owner announced retirements in PJM through next auction Forecast Reserve Margin (PJM January 2013) • PJM forecasts a declining Reserve Margin through 2017 87 Reserve Requirement RM: Existing + Expected New Gen |
 Regulatory Advocacy Current Issues • PJM RPM rules for Capacity Markets • PJM Energy/Ancillary Services Market • New England Capacity Markets • New York Energy Markets • Trade Associations and ISO/RTO activities Recent Rulings • FERC approval of Cost of New Entry (CONE) • PJM Area Regulation rules • EPA RICE/NESHAPS rules • FERC ruling imposing DR must offer requirement in ISO-NE 88 ISSUE /POLICY HOW ADDRESSED? PJM MOPR Sufficiency/Exceptions before FERC and courts DEMAND RESPONSE RULES ANCILLARY/ENERGY Regulation/Black- start modifications under consideration in PJM stakeholder process before FERC NYISO CAPACITY Jurisdictional dispute at FERC over retirement decisions; Impact of PSC approved Reliability Must Run arrangement on markets NEPOOL FCM FEDERAL Gas/Electric Coordination Participation in ISO/FERC/Industry forums Performance/eligibility/compensation issues before courts, FERC, and PJM stakeholder process Market design issues pending at Court of Appeals, FERC and ISO-NE stakeholder process |
 Diversified Assets & Flexible Dispatch Regulatory Advocacy Managing Risks & Creating Value Managing Risks & Creating Value Consistent hedging strategy • Full load requirements • Capacity sales •Monetize optionality Diversified Assets & Flexible Dispatch Strong operational performance Fuel switching Ancillary services Regulatory Advocacy Supports competitive markets Seeks a level playing field Provides insight Creates opportunity MARKET EXPECTATIONS 89 PSEG wholesale market strategy built on a strong asset portfolio |
 PSEG FINANCIAL REVIEW & OUTLOOK |
 91 Strong financial position to support our business initiatives Financial Position Achieved Earnings Guidance Stable Dividend and Opportunity for Growth Strong Balance Sheet Regulated Growth Opportunity without Equity Issuance Solid Credit Ratings O&M Controlled Well Funded Pension |
 92 Maintaining 2013 operating earnings guidance E = ESTIMATE *SEE SLIDE A FOR ITEMS EXCLUDED FROM INCOME FROM CONTINUING OPERATIONS/NET INCOME TO RECONCILE TO OPERATING EARNINGS. Based on our performance year-to-date, we expect full year operating earnings to be at the upper end of guidance, assuming normal weather and unit operations PSEG Operating Earnings $ Millions (except EPS) 2013E PSEG Power $535 - $600 PSE&G $580 - $635 PSEG Energy Holdings/Parent $25 - $35 Operating Earnings* $1,140 - $1,270 $2.25 - $2.50 2013 Earnings Guidance |
 93 PSE&G is expected to represent 50% of 2013 operating earnings PSE&G Power & Other E = ESTIMATE SEE SLIDE A FOR ITEMS EXCLUDED FROM INCOME FROM CONTINUING OPERATIONS/NET INCOME TO RECONCILE TO OPERATING EARNINGS. Business Mix of Operating Earnings |
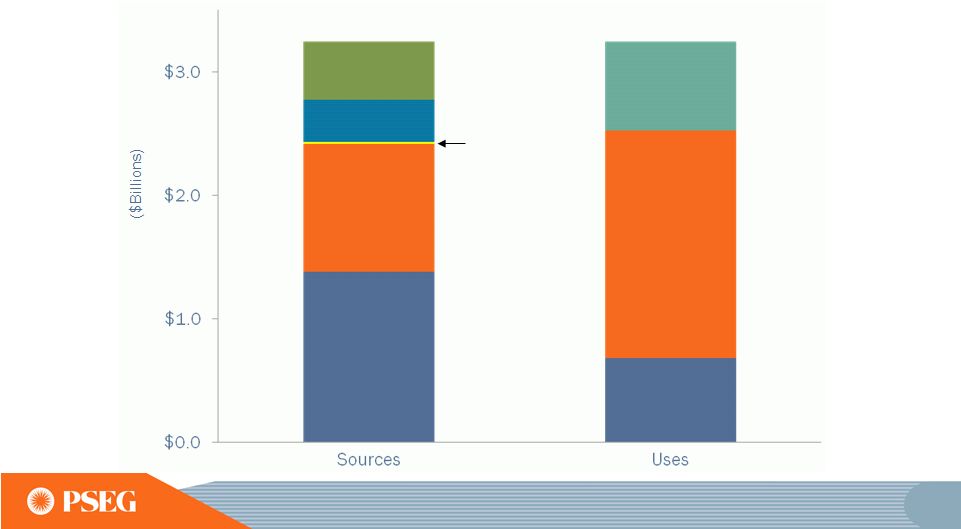 94 In 2012, PSE&G executed its capital program, Power generated significant free cash flow and PSEG increased its shareholder dividend Power Cash from Ops PSE&G Cash from Ops (1) PSE&G Capital Investment Power Capital Investment Cash Other Net Cash Flow Shareholder Dividend Net Debt Issuances (1) PSE&G CASH FROM OPERATIONS ADJUSTS FOR SECURITIZATION PRINCIPAL REPAYMENTS OF ~$216 MILLION. 2012 Sources and Uses |
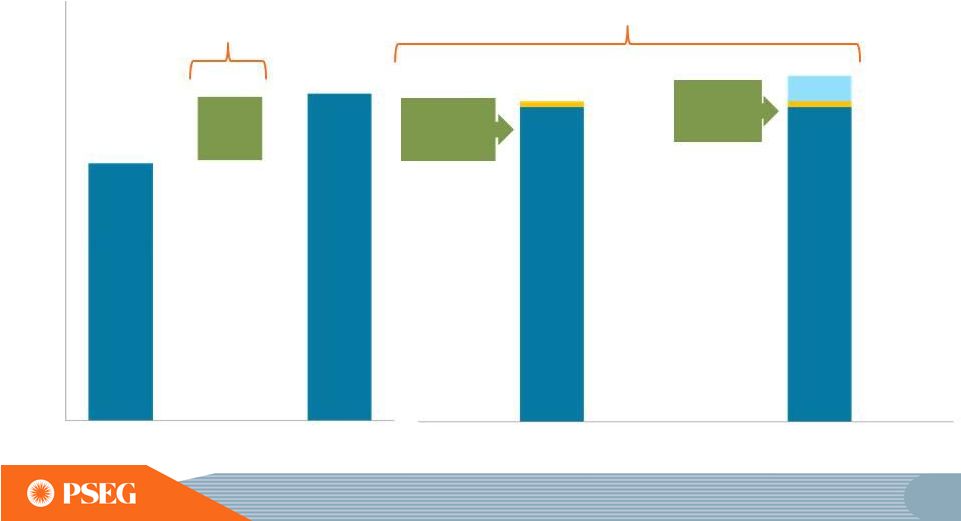
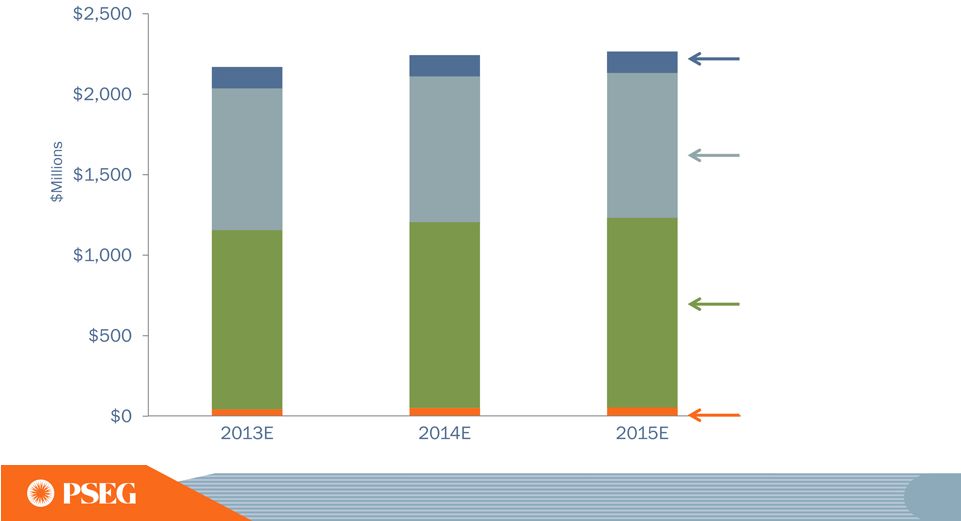
 95 Our capital investment options can result in as much as $5.4B of utility growth investment through 2015 PSE&G Growth ~$4.2B PSE&G Maintenance Power & Other ~$6.2B ~$6.3B ~$6.5B ~$7.5B PSE&G Growth $5.4B DATA AS OF JUNE 30, 2013. EMP: ENERGY MASTER PLAN E = ESTIMATE EMP ~$0.1B New Transmission ~$0.2B New Distribution ~$1B Potential Opportunities Approved Programs 2013 – 2015E Capital Investment |
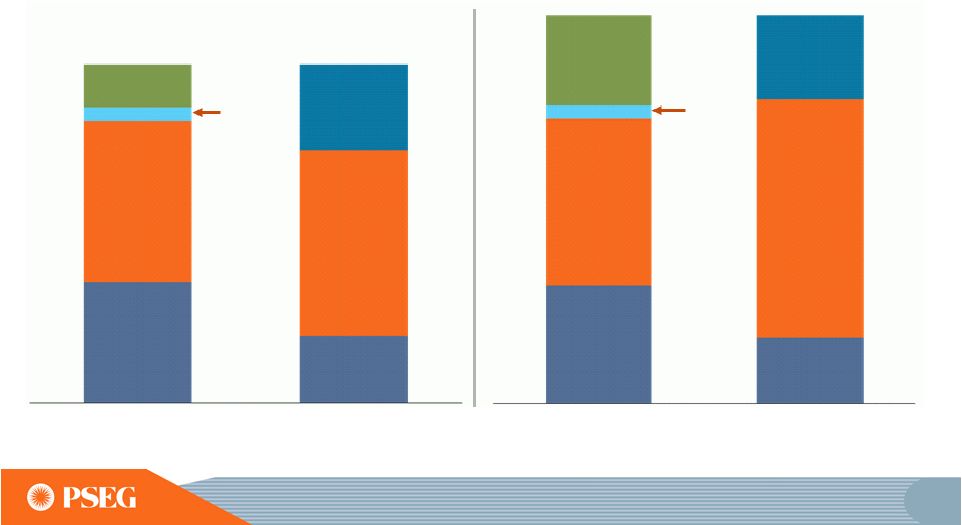 96 All scenarios can be financed without new equity 2013 – 2015E Power Cash from Ops PSE&G Cash from Ops (1) PSE&G Capital Investment Power Capital Investment Shareholder Dividend Net Debt Issuances Other Net Cash Flow 2013 – 2015E Power Cash from Ops PSE&G Cash from Ops (1) PSE&G Capital Investment Power Capital Investment Shareholder Dividend Net Debt Issuances Other Net Cash Flow Approved Programs plus EMP, New Transmission and New Distribution Approved Programs (1) PSE&G CASH FROM OPERATIONS ADJUSTS FOR SECURITIZATION PRINCIPAL REPAYMENTS OF ~$725M FROM 2013-2015 E = ESTIMATE Sources Uses Sources Uses |
 97 PSE&G’s capital spending drives regulated earnings growth with a potential future rate base of up to ~$12.6B 2013 – 2015E Rate Base Growth 2015E Rate Base 3-yr CAGR: ~12% ~$11.6B ~$12.6B DATA AS OF JUNE 30, 2013. EMP: ENERGY MASTER PLAN E = ESTIMATE 2012 Rate Base 2015E Rate Base 3-yr CAGR: ~8.2% ~$9B ~$2.4B ~$11.4B Approved Programs New Transmission ~$0.2B New Distribution ~$1B Potential New Opportunities Includes Recent Solar Agreement Approval |
 Power’s credit metrics are expected to remain strong Power FFO/Debt 2013 – 2015E Average E = ESTIMATE 98 |
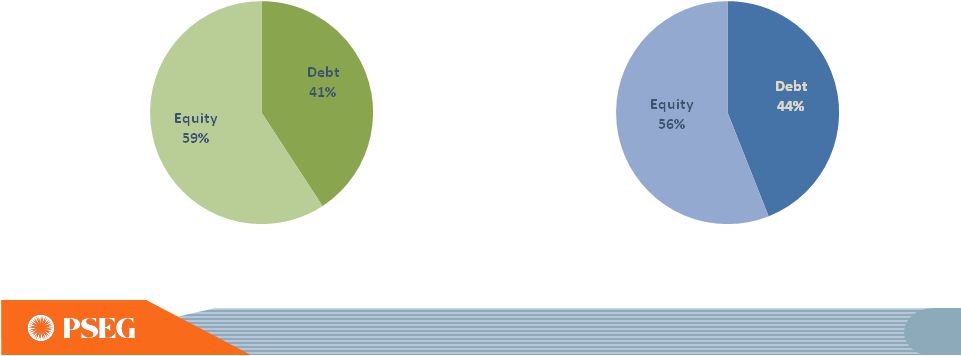 Using PSEG’s balance sheet strength to finance growth in the regulated enterprise without equity issuance PSEG Total Capitalization 2012 2015E* * E = ESTIMATE; INCLUDES THE FOLLOWING PROPOSED FILINGS: EE4A, SL3, S4AE, ENERGY STRONG (ES) AND TRANSMISSION HARDENING. 99 |
 100 Our investment programs are affordable, helped by the expiration of known charges by 2017, which lower the average residential customer bill by ~ 8.7% based on today’s current bill PSE&G Securitization & NUG Impacts ($Millions) PSE&G Securitization Impacts 2013 2014 2015 2016 2017 Revenues 439 445 386 0 0 Interest Expense (46) (30) (11) 0 0 Amortization (253) (273) (233) 0 0 Deferred Tax & Other (140) (142) (142) 0 0 P&L Impact (GAAP view) 0 0 0 0 0 PSE&G Non–Utility Generation 2013 2014 2015 2016 2017 Revenues* 157 167 141 49 0 Expenses (157) (167) (141) (49) 0 P&L Impact (GAAP view) 0 0 0 0 0 *NUG revenues reflect Feb 1, 2013 rates Typical Current Average Residential Customer Bill Impact Securitization ~6.6% Non-Utility Generation ~2.1% |
 101 Modest O&M growth with Power increases from CCGT maintenance cycles, due to high utilization rates (1) POWER EXCLUDES IMPACTS FROM STORM RECOVERY COSTS AND POTENTIAL RELATED INSURANCE PROCEEDS NM = NOT MATERIAL. E = ESTIMATE. PSEG O&M Expense (1) 2013-2015E CAGR: ~2.2% CAGR Transmission ~0.4% Distribution ~1.3% Power ~2.9% Holdings & Other: N.M. |
 102 Pension contributions expected to decline with well funded plan Pension Plan Contributions Amended Benefit Plans E = ESTIMATE 2010 2011 2012 2013E 2014E 2015E Funded Ratio 82% 84% 83% >85% >90% >90% |
 103 PSEG’s long-term outlook is influenced by Power’s hedge position and increased investment at PSE&G 2014E 2015E Each $1/mcf Change in Natural Gas Each $2/MWh Change in Spark Spread Each $2/MWh Change in Dark Spread Each 1% Change in Nuclear Capacity Factor Segment EPS Drivers Each $100 Million of Incremental Investment Each 1% Change in Sales Electric Gas Each 1% Change in O&M Each 10 bp Change in ROE $0.01 $0.01 $0.01 $0.01 $0.01 $0.10 - $0.13 $0.04 $0.01 $0.01 $0.03 - $0.06 $0.04 $0.01 $0.01 $0.01 $0.01 $0.01 $0.01 $0.01 E = ESTIMATE |
 104 Opportunity for modest and sustainable dividend increases consistent with stable regulated growth and cash generation outlook at PSEG Power PSE&G EPS $1.25 $1.14 Annual Dividend Per Share E = ESTIMATE |
 105 PSEG Summary • Maintaining 2013 operating earnings guidance of $2.25 - $2.50 per share -- based on financial results to date, we expect operating earnings for the full year to be at the upper end of our guidance range assuming normal weather and unit operations • Double digit operating earnings growth at PSE&G starting in 2013, and continuing through 2015 driven by transmission investments and approved programs • Power’s continued focus on operational excellence, market expertise and financial strength reduces risk in low price environment • Strong Balance Sheet and Cash Flow support full capital program without the need for equity • Long history of returning cash to the shareholder through the common dividend, with opportunity for future growth |
 APPENDIX |
 107 Second Quarter 2013 Operating Earnings by Subsidiary *SEE PAGE B FOR ITEMS EXCLUDED FROM INCOME FROM CONTINUING OPERATIONS/NET INCOME TO RECONCILE TO OPERATING EARNINGS. Operating Earnings Earnings per Share $ millions (except EPS) 2013 2012 2013 2012 PSEG Power $ 114 $ 110 $ 0.22 $ 0.22 PSE&G 121 101 0.24 0.20 PSEG Energy Holdings/ Enterprise 8 4 0.02 0.01 Operating Earnings* $ 243 $ 215 $ 0.48 $ 0.43 Quarter ended June 30 |
 108 PSEG EPS Reconciliation – Q2 2013 versus Q2 2012 * SEE PAGE B FOR ITEMS EXCLUDED FROM INCOME FROM CONTINUING OPERATIONS/NET INCOME TO RECONCILE TO OPERATING EARNINGS. |
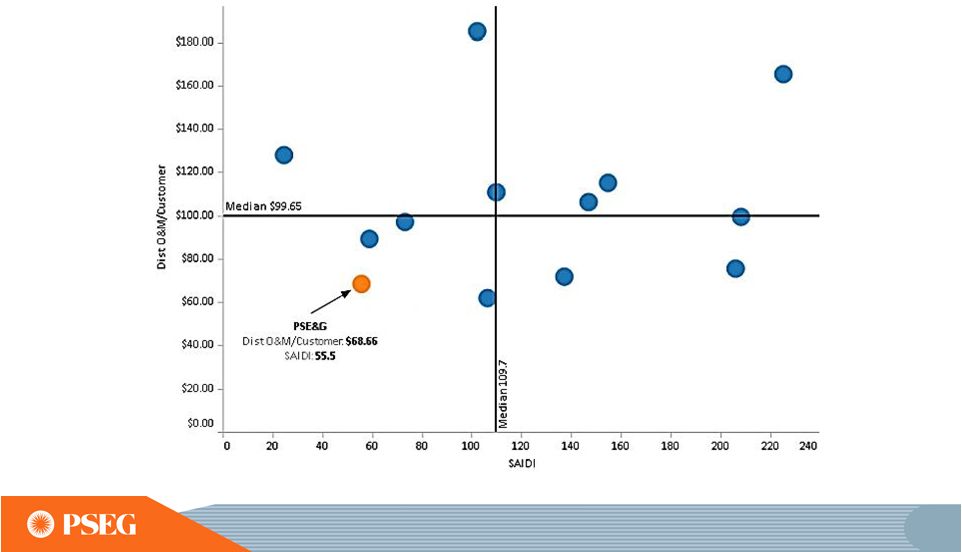 109 PSE&G provides high reliability at below average cost which creates superior value to customers SAIDI = SYSTEM AVERAGE INTERRUPTION DURATION INDEX, A MEASURE OF AVERAGE OUTAGE DURATION FOR ALL CUSTOMERS SERVED. |
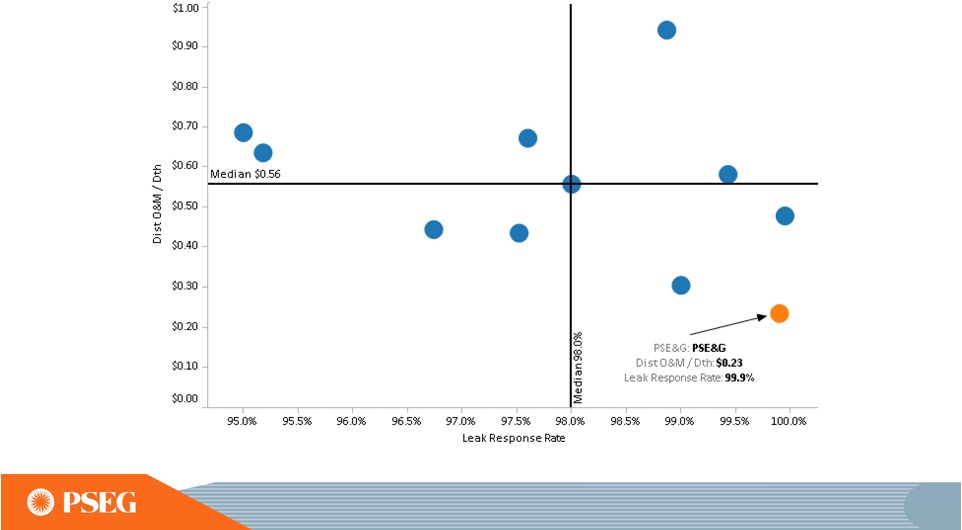 110 PSE&G prioritizes public safety while maintaining value to customers LEAK RESPONSE RATE = PERCENTAGE OF UTILITY RESPONSES TO REPORTED LEAKS WITHIN ONE HOUR. |
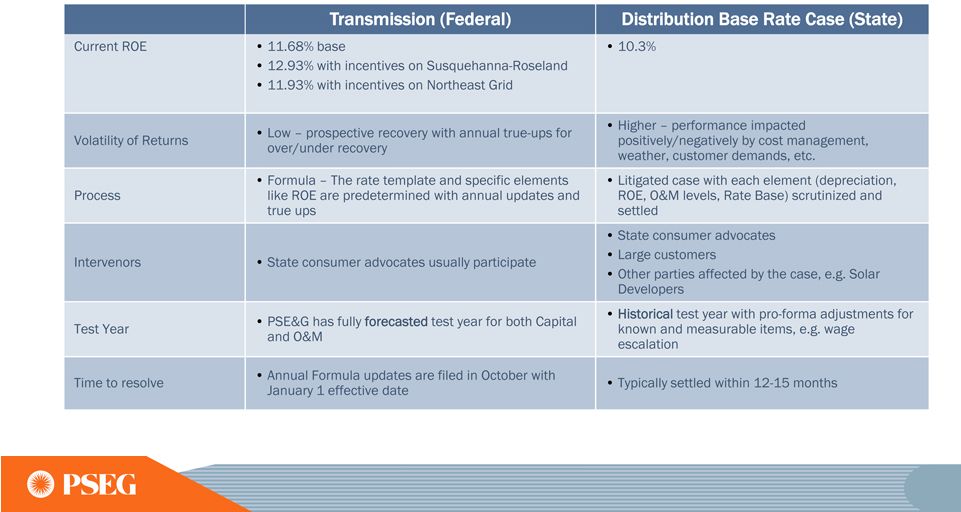 111 Formula rates for transmission make the process more predictable with contemporaneous returns |
 112 New Jersey Board of Public Utilities (BPU) • The Board of Public Utilities consists of five commissioners appointed by the Governor. These appointees are confirmed by the NJ Senate for six- year, staggered terms. The Governor appoints one of the five to serve as Commission President. Currently, the commissioners are: • Robert M. Hanna, Commission President • Jeanne M. Fox • Joseph L. Fiordaliso • Mary-Anna Holden • Dianne Solomon • Stefanie Brand, Director of the N.J. Division of Rate Counsel |
 113 Slow economic recovery in NJ is constraining growth in all market sectors Modest residential growth limited by housing market inactivity and the slow economic recovery Consumer spending is trending with the slow economic recovery and impacting growth in the commercial sector Industrial sales growth continues to be constrained by slow economic recovery 0.3% 0.4% 0.0% 0.5% 0.9% 0.7% 0.3% 0.7% 2013 - 2015 Projected Sales Growth – Gas* 2013 - 2015 Projected Sales Growth – Electric* Residential Commercial Industrial Total Residential Commercial Industrial Total * WEATHER NORMALIZED ESTIMATED ANNUAL GROWTH PER YEAR OVER FORECAST PERIOD |
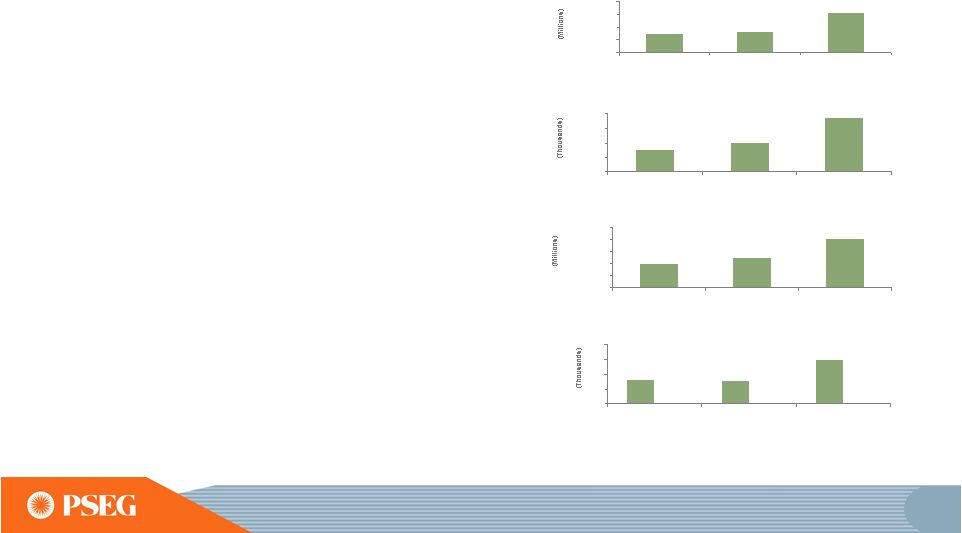 114 Key economic indicators forecast renewed growth over the 2012 to 2015 timeframe The New Jersey economy increased by 0.3% annually from 2010 to 2012 and is anticipated to grow 2.3% per year from 2012 to 2015 New Jersey total non-farm employment increased by 0.6% annually from 2010 to 2012 and is expected to grow 1.4% per year from 2012 to 2015 Real personal income in New Jersey increased by 1.4% annually from 2010 to 2012 and is expected to increase 2.5% per year from 2012 to 2015 Single family housing starts declined by 2.6% annually from 2010 to 2012 and are expected to increase ~24% per year from 2012 to 2015 NJ Total Employment 3,700 3,800 3,900 4,000 4,100 2010 2012 2015 NJ Real Gross State Product $400,000 $420,000 $440,000 $460,000 $480,000 2010 2012 2015 NJ Real Personal Income $360,000 $380,000 $400,000 $420,000 $440,000 $460,000 2010 2012 2015 NJ Single Family Housing Starts 0 5 10 15 20 2010 2012 2015 SOURCE: IHS GLOBAL INSIGHT FEBRUARY 2013 FORECAST. |
 115 Nuclear fuel needs have been hedged through 2015 $0 $5 $10 2013 2014 2015 Anticipated Nuclear Fuel Cost Hedged |
 116 Power’s coal hedging reflects 2013 supply matched with 2013 sales… Contracted Coal Station Coal Type Pricing ($/MWh) * Comments Bridgeport Harbor Adaro Mid $50’s Higher price, lower BTU, enviro coal Hudson CAPP High $40’s Flexibility after BET in 2010 Mercer Metallurgical CAPP/NAPP Mid $40’s More limited segment of coal market Keystone NAPP Mid $20’s Prices steady Conemaugh NAPP Mid $20’s Prices steady % Hedged (left scale) $/MWh (right scale) * COMMODITY PLUS TRANSPORTATION |
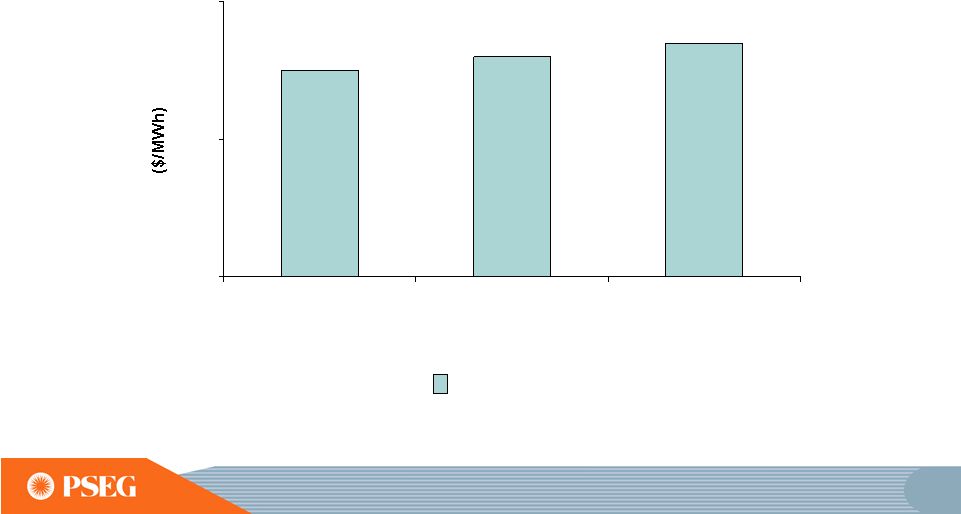
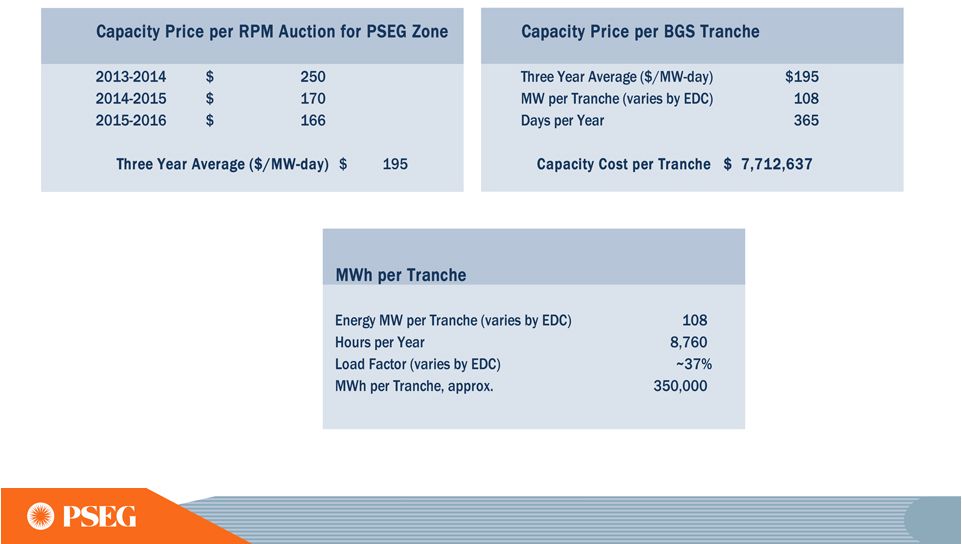 117 The full requirements BGS rate recognizes the forward PJM capacity market price |
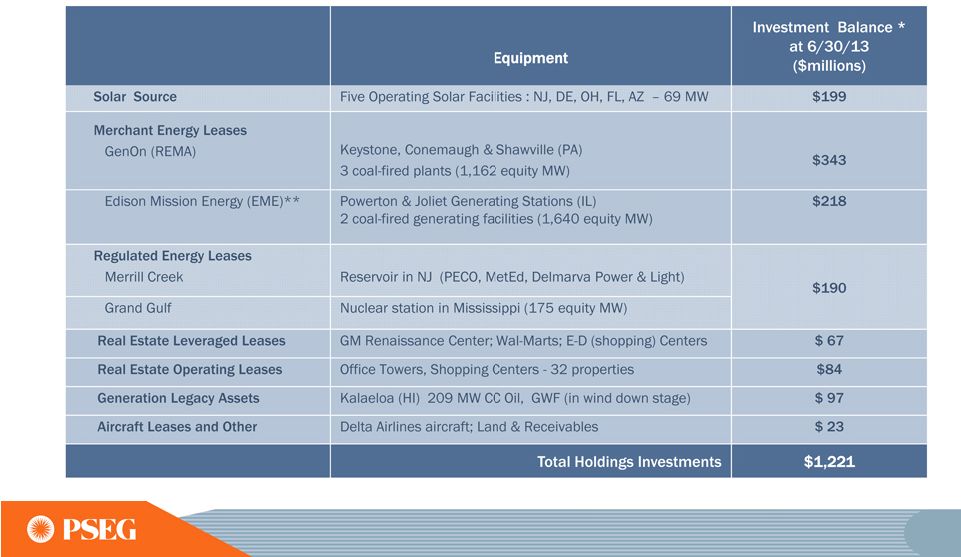 118 PSEG Energy Holdings Investment Portfolio * BOOK BALANCE EXCLUDING DEFERRED TAX ACCOUNTS **EME AND ITS SUBSIDIARIES FILED CHAPTER 11 BANKRUPTCY ON 12/17/2012. LEASE REJECTION OR ACCEPTANCE DECISION IS PENDING. |
 119 PSEG Liquidity as of June 30, 2013 Expiration Total Available Facility Date Facility Usage Liquidity ($Millions) 5-year Credit Facility (PSE&G) Mar-18 $600 1 $170 $430 5-Year Credit Facility (Power) Mar-17 1,600 54 1,546 5-Year Credit Facility (Power) Mar-18 1,000 2 0 1,000 5-Year Bilateral (Power) Sep-15 100 100 0 5-year Credit Facility (PSEG) Mar-17 500 5 495 5-year Credit Facility (PSEG) Mar-18 500 3 0 500 Total $4,300 $329 $3,971 $114 PSE&G ST Investment $0 1 PSEG Facility to be reduced by $29M on April 15, 2016 Total Liquidity Available $4,085 2 Power Facility to be reduced by $48M on April 15, 2016 Total Parent / Power Liquidity $3,655 3 PSEG Facility to be reduced by $23M on April 15, 2016 PSEG Money Pool ST Investment |
 120 Strong Balance Sheet supports our full capital program without the need for equity DEBT INCLUDES SHORT TERM DEBT (INCLUDING COMMERCIAL PAPER) AND EXCLUDES NON- RECOURSE AND SECURITIZATION DEBT $Billions Capitalization Subsidiary Debt (1) 2010 2011 2012 PSE&G 4.28 4.27 5.06 PSEG Power 3.45 2.75 2.34 Parent & Other 0.08 0.04 0.04 Total PSEG Debt 7.81 7.06 7.44 Subsidiary Equity PSE&G 4.42 4.65 5.17 PSEG Power 5.03 5.44 5.44 Parent & Other 0.18 0.18 0.17 Total PSEG Equity 9.63 10.27 10.78 PSE&G Debt to Cap 49% 48% 49% Power Debt to Cap 41% 34% 30% PSEG Debt to Cap 45% 41% 41% |
 Items Excluded from Income from Continuing Operations/Net Income to Reconcile to Operating Earnings 2012 2011 2010 2009 2008 Earnings Impact ($ Millions) Gain (Loss) on Nuclear Decommissioning Trust (NDT) Fund Related Activity (PSEG Power) 52 $ 50 $ 46 $ 9 $ (71) $ Gain (Loss) on Mark-to-Market (MTM) (PSEG Power) (10) 107 (1) (11) 14 Lease Transaction Activity (Energy Holdings) 36 (173) - 29 (490) Storm O&M (PSEG Power) (39) - - - - Market Transition Charge Refund (PSE&G) - - (72) - - Gain (Loss) on Asset Sales and Impairments (Energy Holdings) - 34 - - (13) Total Pro-forma adjustments 39 $ 18 $ (27) $ 27 $ (560) $ Fully Diluted Average Shares Outstanding (in Millions) 507 507 507 507 508 Per Share Impact (Diluted) Gain (Loss) on NDT Fund Related Activity (PSEG Power) 0.10 $ 0.10 $ 0.09 $ 0.02 $ (0.14) $ Gain (Loss) on MTM (PSEG Power) (0.02) 0.21 - (0.02) 0.03 Lease Transaction Activity (Energy Holdings) 0.07 (0.34) - 0.05 (0.96) Storm O&M (PSEG Power) (0.08) - - - - Market Transition Charge Refund (PSE&G) - - (0.14) - - Gain (Loss) on Asset Sales and Impairments (Energy Holdings) - 0.06 - - (0.03) Total Pro-forma adjustments 0.07 $ 0.03 $ (0.05) $ 0.05 $ (1.10) $ For the Year Ended December 31, (Unaudited) Pro-forma Adjustments, net of tax PLEASE SEE PAGE 3 FOR AN EXPLANATION OF PSEG’S USE OF OPERATING EARNINGS AS A NON-GAAP FINANCIAL MEASURE AND HOW IT DIFFERS FROM INCOME FROM CONTINUING OPERATIONS/NET INCOME. A |
 Items Excluded from Income from Continuing Operations/Net Income to Reconcile to Operating Earnings B PLEASE SEE PAGE 3 FOR AN EXPLANATION OF PSEG’S USE OF OPERATING EARNINGS AS A NON-GAAP FINANCIAL MEASURE AND HOW IT DIFFERS FROM INCOME FROM CONTINUING OPERATIONS/NET INCOME. 2013 2012 2013 2012 Earnings Impact ($ Millions) Gain (Loss) on Nuclear Decommissioning Trust (NDT) Fund Related Activity (PSEG Power) 8 $ 4 $ 17 $ 9 $ Gain (Loss) on Mark-to-Market (MTM) (a) (PSEG Power) 80 (10) (25) 42 Lease Related Activity (PSEG Energy Holdings) - 2 - 6 Storm O&M, net of insurance recoveries (PSEG Power) 2 - (15) - Total Pro-forma adjustments 90 $ (4) $ (23) $ 57 $ Fully Diluted Average Shares Outstanding (in Millions) 507 507 507 507 Per Share Impact (Diluted) Gain (Loss) on NDT Fund Related Activity (PSEG Power) 0.02 $ 0.01 $ 0.04 $ 0.02 $ Gain (Loss) on MTM (a) (PSEG Power) 0.16 (0.02) (0.05) 0.08 Lease Related Activity (PSEG Energy Holdings) - - - 0.01 Storm O&M, net of insurance recoveries (PSEG Power) - - (0.03) - Total Pro-forma adjustments 0.18 $ (0.01) $ (0.04) $ 0.11 $ (a) Includes the financial impact from positions with forward delivery months. Three Months Ended Six Months Ended PUBLIC SERVICE ENTERPRISE GROUP INCORPORATED Reconciling Items Excluded from Income from Continuing Operations/Net Income to Compute Operating Earnings (Unaudited) June 30, June 30, Pro-forma Adjustments, net of tax |