FY2007 Consolidated Financial Results
(Prepared in accordance with U.S. GAAP)
(Year ended March 31, 2008)
(Unaudited)
April 25, 2008
| Company name | : | Advantest Corporation |
(URL http://www.advantest.co.jp/investors/en-index.shtml) | ||
| Stock exchanges on which shares are listed | : | First section of the Tokyo Stock Exchange |
| Stock code number | : | 6857 |
| Company representative | : | Toshio Maruyama, Representative Board Director, President and CEO |
| Contact person | : | Hiroshi Nakamura, Executive Officer, |
| Senior Vice President of the Financial Group | ||
| (03) 3214-7500 | ||
Date of General Shareholders’ Meeting (as planned) | : | June 25, 2008 |
| Dividend Payable Date (as planned) | : | June 3, 2008 |
| Annual Report Filing Date (as planned) | : | June 26, 2008 |
| (Rounded to the nearest million yen) |
| 1. Consolidated Results of FY2007 (April 1, 2007 through March 31, 2008) |
(1) Consolidated Financial Results
(% changes as compared with the previous fiscal year)
| Net sales | Operating income | Income before income taxes and equity in earnings of affiliated company | Net income | |||||
| Million yen | % increase (decrease) | Million yen | % increase (decrease) | Million yen | % increase (decrease) | Million yen | % increase (decrease) | |
| FY2007 | 182,767 | (22.2) | 22,716 | (60.0) | 23,533 | (61.5) | 16,550 | (53.5) |
| FY2006 | 235,012 | (7.4) | 56,792 | (11.9) | 61,090 | (9.4) | 35,556 | (14.1) |
| Net income per share (basic) | Net income per share (diluted) | Net income to equity ratio | Ratio of income before taxes to total assets | Ratio of operating income to net sales | ||||||
| Yen | Yen | % | % | % | ||||||
| FY2007 | 90.72 | 90.57 | 6.0 | 7.1 | 12.4 | |||||
| FY2006 | 190.01 | 188.85 | 12.9 | 17.0 | 24.2 | |||||
(Note) Equity in earnings(losses) of affiliated company : (Y) (94) million in FY2007, (Y) (14) million in FY2006
(2) Consolidated Financial Position
| Total assets | Net assets | Equity-to-assets ratio | Net assets per share | |||||
| Million yen | Million yen | % | Yen | |||||
| FY2007 | 298,684 | 254,184 | 85.1 | 1,422.20 | ||||
| FY2006 | 366,374 | 294,797 | 80.5 | 1,570.99 | ||||
(3) Consolidated Cash Flows
| Cash flows from operating activities | Cash flows from investing activities | Cash flows from financing activities | Cash and cash equivalents at end of year | |||||
| Million yen | Million yen | Million yen | Million yen | |||||
| FY2007 | 24,166 | (16,322) | (46,770) | 147,348 | ||||
| FY2006 | 48,951 | (8,013) | (3,662) | 196,395 | ||||
- 1 - -
2. Dividends
| Dividend per share | Total dividend paid (annual) | Payout ratio (consolidated) | Ratio of total amount of dividends to net assets (consolidated) | |||
(Record Date) | Interim | Year end | Annual total | |||
| yen | yen | yen | Million yen | % | % | |
| FY2006 | 17.50 | 32.50 | 50.00 | 9,373 | 26.3 | 3.4 |
| FY2007 | 25.00 | 25.00 | 50.00 | 9,071 | 55.1 | 3.3 |
FY2008 (forecast) | 25.00 | 25.00 | 50.00 | - | - | - |
(Note) Per share information for FY2006 interim period is restated to reflect the effects of the two for one stock split of shares of its common stock conducted by Advantest on October 1, 2006.
3. Projected Results for FY2008 (April 1, 2008 through March 31, 2009)
Advantest’s business focuses on test systems for semiconductors, and relies heavily on the capital expenditure of semiconductor manufacturers, test houses and foundries. The capital expenditures of these companies are determined primarily by factors such as current or future trends in the demand for semiconductors. In recent years, as a result of the expansion in applications for semiconductors, such as for use in digital consumer products, mobile devices and motor vehicles, it has become difficult to foresee trends in the demand for semiconductors. Accordingly, investment plans for semiconductor related capital expenditure, the movements of which have been cyclical thus far, now vary on a daily basis. Because of the great difficulty involved in forecasting earnings in such an operating environment, the earnings forecast for the fiscal year ending March 31, 2009 has not been presented. Advantest intends to promptly disclose the relevant earnings forecast when such disclosure becomes possible.
4. Others
| (1) Material changes in Subsidiaries during this fiscal year(changes in scope of consolidation resulting from changes in subsidiaries): None | ||
| (2) Changes in accounting principles, procedures and the presentation of the consolidated financial statements | ||
| 1) | Changes based on revisions of accounting standard : Yes | |
| 2) | Changes other than 1) above : Yes | |
| (Note) Please see (Note2) “Significant Accounting Policies” on page 18 for details. | ||
| (3) Number of issued and outstanding shares(common stock) | ||
| 1) | Number of issued and outstanding shares at the end of each fiscal year (including treasury shares): FY2007 199,566,770 shares; FY2006 199,566,770 shares. | |
| 2) | Number of treasury shares at the end of each fiscal year: FY2007 20,840,721 shares; FY2006 11,916,485 shares. | |
| (Note) For the number of shares used to calculate net income per share, please see (Note4) “Per Share Information” on page 22. |
(Reference) Selected Non-Consolidated Financial Data
(Prepared in accordance with JAPAN GAAP)
(Rounded to the nearest million yen in FY2007, truncated after the million yen in FY2006)
1. Non-consolidated Results of FY2007 (April 1, 2007 through March 31, 2008)
(1) Non-Consolidated Financial Results
(% changes as compared with the previous fiscal year)
| Net sales | Operating income | Income before income taxes | Net income | |||||
| Million yen | % increase (decrease) | Million yen | % increase (decrease) | Million yen | % increase (decrease) | Million yen | % increase (decrease) | |
| FY2007 | 147,686 | (25.3) | 8,802 | (78.8) | 38,759 | (11.2) | 32,438 | 10.2 |
| FY2006 | 197,753 | (9.2) | 41,503 | (16.6) | 43,638 | (19.0) | 29,436 | (16.5) |
| Net income per share (basic) | Net income per share (diluted) | |||
| Yen | Yen | |||
| FY2007 | 177.82 | 177.68 | ||
| FY2006 | 157.31 | 156.34 | ||
(2) Non-consolidated Financial Position
| Total assets | Net assets | Equity-to-assets ratio | Net assets per share | |||||
| Million yen | Million yen | % | Yen | |||||
| FY2007 | 247,145 | 209,264 | 83.4 | 1,153.40 | ||||
| FY2006 | 289,697 | 224,805 | 76.8 | 1,185.55 | ||||
(Reference) Total equity : FY2007 (Y) 206,142 million; FY2006 (Y) 222,468 million.
- 2 - -
Explanation on the Appropriate Use of Future Earnings Projections and Other Special Instructions
This document contains “forward-looking statements” that are based on Advantest’s current expectations, estimates and projections. These forward-looking statements are subject to known and unknown risks, uncertainties and other factors that may cause Advantest’s actual results, levels of activity, performance or achievements to be materially different from those expressed or implied by such forward-looking statements. These factors include: (i) changes in demand for the products and services produced and offered by Advantest’s customers, including semiconductors, communications services and electronic goods; (ii) circumstances relating to Advantest’s investment in technology, including its ability to timely develop products that meet the changing needs of semiconductor manufacturers and communications network equipment and components makers and service providers; (iii) significant changes in the competitive environment in the major markets where Advantest purchases materials, components and supplies for the production of its products or where its products are produced, distributed or sold; and (iv) changes in economic conditions, currency exchange rates or political stability in the major markets where Advantest procures materials, components and supplies for the production of its principal products or where its products are produced, distributed or sold. A discussion of these and other factors which may affect Advantest's actual results, levels of activity, performance or achievements is contained in the "Operating and Financial Review and Prospects", "Key Information - Risk Factors" and "Information on the Company" sections and elsewhere in Advantest's annual report on Form 20-F, which is on file with the United States Securities and Exchange Commission.
- 3 - -
Advantest Corporation (FY2007)
1. Business Results
(1) Analysis of Business Results
| 1) | Consolidated Financial Results of FY2007 (April 1, 2007 through March 31, 2008) |
(in billion yen)
| FY2006 | FY2007 | as compared to the previous fiscal year Increase (decrease) | |
| Orders input received | 242.9 | 162.2 | (33.2%) |
| Net sales | 235.0 | 182.8 | (22.2%) |
| Operating income | 56.8 | 22.7 | (60.0%) |
| Income before income taxes and equity in earnings of affiliated company | 61.1 | 23.5 | (61.5%) |
| Net income | 35.6 | 16.6 | (53.5%) |
Although stable economic expansion was seen in the global economy for the first half of the fiscal year ended March 31, 2008, concerns of a slowdown of the U.S. economy increased due to turmoil in the financial market triggered by the sub-prime loan crisis in the U.S. Previously stable economies of countries in Europe and Asia have been affected by such concerns and uncertainties with respect to their future outlook. Inflation worries caused by escalating resource prices, including the price of crude oil, also caused concern with respect to the future of the economy. In addition, concerns of a business downturn grew in Japan, due to the understanding that sharp appreciation of the yen towards the latter half of the fiscal year would put pressure on corporate profits in the export industry.
In the semiconductor related market, there was a substantial decline in the price of semiconductors due to the deterioration of the supply and demand balance in the semiconductor market, as well as concerns over the dwindling consumption of products which utilize semiconductors, which resulted in semiconductor manufacturers freezing or postponing their capital expenditure programs. Accordingly, Advantest’s business environment was extremely difficult.
In this difficult environment, Advantest and its consolidated subsidiaries made efforts to obtain orders input received in order to improve net sales and secure profitability, as well as to promote further improvement of quality and cost reduction through the implementation of the just-in-time-production-system. However, the cooling of the market was more severe than expected, and Advantest’s orders input received, net sales, and net income fell substantially compared to the previous fiscal year.
Accordingly, Orders input received decreased by 33.2% from the previous fiscal year to (Y) 162.2 billion, Net sales decreased by 22.2% from the previous fiscal year to (Y) 182.8 billion, Operating income decreased by 60.0% from the previous fiscal year to (Y) 22.7 billion, Income before income taxes and equity in earnings of affiliated company decreased by 61.5% from the previous fiscal year to (Y) 23.5 billion, and Net income decreased by 53.5% from the previous fiscal year to (Y) 16.6 billion. Furthermore, the percentage of net sales to overseas customers was 69.3%, compared to 69.0% in the previous fiscal year.
Conditions of business by segment are described below.
- 4 - -
Advantest Corporation (FY2007)
<Semiconductor and Component Test System Segment>
| (in billion yen) |
| FY2006 | FY2007 | as compared to the previous fiscal year Increase (decrease) | |
| Orders input received | 175.1 | 115.7 | (33.9%) |
| Net sales | 167.8 | 131.6 | (21.6%) |
| Operating income | 48.6 | 23.3 | (52.1%) |
In the Semiconductor and Component Test System segment, primarily as a result of an excess supply of semiconductors, semiconductor manufacturers' inclination towards capital expenditure declined due to the decline in prices in the semiconductor market. Accordingly, the results for test systems for both memory and non memory semiconductors in the Semiconductor and Component Test System segment remained weak.
In the test systems for memory semiconductor market of this segment, due to excess supply there was a substantial decline in the price of DDR-2 DRAM semiconductors for use in personal computers and semiconductor manufacturers restrained their capital expenditure in test systems for DRAM semiconductors. In addition, demand for flash memory semiconductors was weak as the momentum in demand for products such as new mobile phones was not sustained, and the price of semiconductors declined from the middle of the fiscal year. Accordingly, as with DRAM semiconductors, capital expenditure in test systems for flash memory semiconductors remained weak.
In the non memory semiconductor market of this segment, although demand for the test systems for digital consumer electronic ICs remained strong in the first half of the fiscal year, capital expenditure by semiconductor manufacturers was restrained in the latter half of the fiscal year due to concerns over the future prospects of the economy. With respect to the T2000 Open Architecture Test System, although efforts were made to expand sales by attracting new customers in Japan, capital expenditure by Advantest’s major U.S. customers remained frozen, a full-scale improvement in demand for test systems towards the end of the fiscal year failed to materialize, despite indications to that effect, and results remained weak throughout the fiscal year. Furthermore, in test systems for LCD driver ICs, Advantest prepared new products with an expectation of an upturn in demand, however with a delay in an upturn in demand for multi-tone liquid crystal panel driver ICs, which were the focus of such new products, along with other reasons, capital expenditure in the test systems were restrained.
As a result of the above, Orders input received was (Y) 115.7 billion (33.9% decrease in comparison to the previous fiscal year), Net sales was (Y) 131.6 billion (21.6% decrease) and Operating income was (Y) 23.3 billion (52.1% decrease).
<Mechatronics System Segment>
| (in billion yen) | ||||
| FY2006 | FY2007 | as compared to the previous fiscal year Increase (decrease) | ||
| Orders input received | 54.9 | 30.3 | (44.9%) | |
| Net sales | 52.0 | 34.9 | (32.8%) | |
| Operating income | 13.6 | 3.3 | (76.1%) |
- 5 - -
Advantest Corporation (FY2007)
In accordance with the weak results from test systems for memory and non memory semiconductors, demand for test handlers and device interface products, which connect to such test systems, was also weak.
As a result of the above, Orders input received was (Y) 30.3 billion (44.9% decrease in comparison to the previous fiscal year), Net sales was (Y) 34.9 billion (32.8% decrease) and Operating income was (Y) 3.3 billion (76.1% decrease).
<Services, Support and Others Segment>
| (in billion yen) | ||||
| FY2006 | FY2007 | as compared to the previous fiscal year Increase (decrease) | ||
| Orders input received | 18.0 | 19.3 | 7.3% | |
| Net sales | 18.3 | 19.3 | 5.6% | |
| Operating income | 2.9 | 3.2 | 10.6% |
Orders input received was (Y) 19.3 billion (7.3% increase in comparison to the previous fiscal year), Net sales was (Y) 19.3 billion (5.6% increase) and Operating income was (Y) 3.2 billion (10.6% increase).
Prospects for the Upcoming Fiscal Year
With respect to Advantest’s future operating environment, amid increased concerns over a slowdown in the global economy, as a result of the escalation in the price of crude oil, rapid exchange rate fluctuations, and further worsening of the sub-prime loan crisis in the U.S., Advantest expects that the future of the economy will remain uncertain. In the semiconductor related market, despite expectations of demand for test systems for semiconductors as a result of an expected expansion in demand for digital consumer electronics for the Beijing Olympics, and the commencement of commercial production of next generation MPUs and next generation high-speed DRAMs, because of remaining concerns over the risk of a decline in prices due to excess supply of semiconductors and increasing competition, Advantest expects that semiconductor manufacturers will continue to be cautious in their approach to capital expenditure.
In such an operating environment, Advantest will continue to focus on furthering the expansion of market share by introducing new products which anticipate customers’ needs in a timely manner. Furthermore, in addition to developing new products in consideration of decreasing production time and reducing the cost of materials from the design phase of upstream production, Advantest will continue in its efforts to improve profitability through increasing productivity on various activities, such as reassessing its corporate business process.
(2) Financial Condition
1) Assets, Liabilities and Net Assets
Total assets at the end of FY2007 was (Y) 298.7 billion, a decrease of (Y) 67.7 billion compared to the previous fiscal year, due primarily to a decrease of (Y) 49.0 billion in cash and cash equivalents and a decrease of (Y) 24.1 billion in trade receivables compared to the end of the previous fiscal year. The amount of total liabilities was (Y) 44.5 billion, a decrease of (Y) 27.1 billion compared to the end of the previous fiscal year, due primarily to a decrease of (Y) 17.3 billion in trade accounts payable and of (Y) 8.8 billion in income taxes payable compared to the end of the previous fiscal year. Shareholders' equity was (Y) 254.2 billion. Equity to assets ratio was 85.1%, an increase of 4.6 point.
- 6 - -
Advantest Corporation (FY2007)
2) Cash Flow Condition
Cash and cash equivalents held at the end of FY2007 were (Y) 147.3 billion, a decrease of (Y) 49.0 billion from previous fiscal year.
Significant cash flows during this fiscal year and their causes are described below.
Net cash provided by operating activities was (Y) 24.2 billion. This amount was primarily attributable to a net income of (Y) 16.6 billion, a decrease of (Y) 22.7 billion in trade receivables and a decrease of (Y) 16.2 billion in trade accounts payable.
Net cash used in investing activities was (Y) 16.3 billion. This amount was primarily attributable to capital expenditures of (Y) 13.0 billion.
Net cash used in financing activities was (Y) 46.8 billion. This amount was primarily attributable to the repurchase of treasury stock in the amount of (Y) 36.6 billion and dividend payments in the amount of (Y) 10.7 billion.
The following table illustrates the historical movements of certain cash flow indexes:
| FY2003 | FY2004 | FY2005 | FY2006 | FY2007 | |
| Stockholders' equity ratio (%) | 67.0 | 69.7 | 73.5 | 80.5 | 85.1 |
| Stockholders' equity ratio based on market prices (%) | 253.4 | 256.0 | 373.3 | 267.9 | 154.7 |
Debt to annual cash flow ratio (%) | 87.4 | 22.2 | 0.1 | 0.1 | 0.0 |
| Interest coverage ratio (times) | 59.7 | 202.1 | 148.5 | 3,094.7 | 1,839.4 |
Stockholders' equity ratio: stockholders' equity / total assets
Stockholders' equity ratio based on market prices: market capitalization / total assets
Debt to annual cash flow ratio: interest-bearing liabilities / operating cash flows
Interest coverage ratio: operating cash flows / interest payments
| (Notes) | 1. These indexes are calculated using U.S. GAAP figures. |
| 2. Market capitalization is calculated based on issued and outstanding shares excluding treasury stock. | |
| 3. Operating cash flows are the cash flows provided by operating activities on the consolidated statements of cash flows. | |
| 4. Interest-bearing liabilities include all liabilities on the consolidated balance sheets that incur interest. |
(3) Basic Policy on Distribution of Profits and Distribution for FY2007 and Distribution Forecast for FY2008
Based on the premise that long-term and continued growth in corporate value is fundamental to the creation of shareholder value, Advantest deems the consistent distribution of profits to be the most important management priority. Accordingly, Advantest engages in active distribution of profits based on consolidated business performance.
With respect to the distribution of surplus, Advantest makes payout decisions after taking into consideration consolidated business performance, financial conditions, as well as the need for strategic investment for mid-to-long-term business development. While aiming to make consistent distributions, because of the fluctuation of the market in which it operates, Advantest makes dividend payouts following a target payout ratio of 20% or more.
Retained earnings are devoted to research and development, streamlining efforts, overseas expansion, investments in new businesses and resources for M&A activities, with an aim to strengthen Advantest’s business position and enhance its corporate value.
- 7 - -
Advantest Corporation (FY2007)
In order to maintain capital strategies responsive to changes in the operating environment, Advantest will repurchase its own shares from time to time through taking into account factors such as trends in stock price, capital efficiency and cash flow.
In this fiscal year, Advantest decided, pursuant to the above profit distribution policy, to distribute a year end dividend of (Y) 25 consistent with the forecast announced on April 25, 2007, with a payment date of June 3, 2008. Since Advantest has paid an interim dividend of (Y) 25 on December 3, 2007, the total dividend per share for the fiscal year will be (Y) 50.
In fiscal year 2008, Advantest plans to distribute an annual dividend of (Y) 50 per share (of which (Y) 25 per share as an interim dividend).
At the meeting of its Board of Directors held on April 25, 2007 and October 26, 2007, Advantest resolved to repurchase its own shares. Pursuant to the resolution, Advantest repurchased 9.1 million shares at an aggregate purchase price of (Y) 36.6 billion in FY2007.
- 8 - -
Advantest Corporation (FY2007)
2. Organization of the Advantest Group
The following diagram shows the business relationships among the major affiliated companies of the Advantest Group.
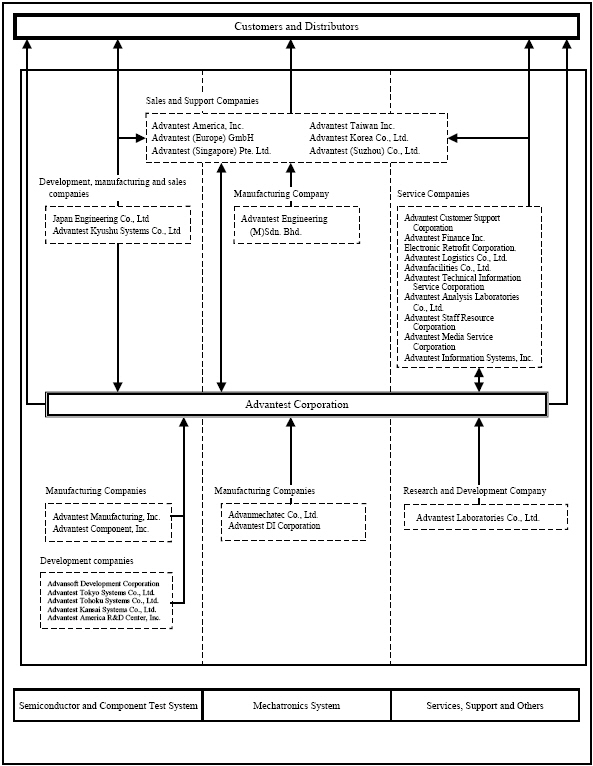
There are 11 other consolidated subsidiaries and 1 equity method affiliate in addition to those mentioned in the above diagram.
Consolidated subsidiaries (23 domestic; 17 overseas; 40 total) Equity method affiliate(1 domestic)
<—— : Main flow of products and services
- 9 - -
Advantest Corporation (FY2007)
3. Management Policy
(1) Advantest's Basic Management Policy
Advantest has established a corporate mission of “Technology Support on the Leading Edge”, and its corporate mantra of “Quest for the Essence”.Guided by these principles, Advantest respects each of its stakeholders, strives to maintain harmony with society, and aims for the sustained development of the company and the improvement of corporate value while contributing to the goal of a sustainable society.
(2) Target Financial Index
Advantest applies the "AVA" (Advantest Value Added), a financial index incorporating the concept of EVA®(Economic Value Added) *, as a significant management indicator, along with profit margin, ROE and cash flows. Specifically, Advantest will set the minimum return-on-investment ratio ("hurdle rate") for evaluating AVA at 8% and a mid-term target at 12% or more with an aim to further enhance corporate value and shareholder value.
*"EVA®" is a registered trademark of Stern Stewart & Co.
(3) Mid-and-Long-term Business Strategy and Issues to be Addressed
While maintaining "Measurements" as our core competence, Advantest intends to improve its corporate value by establishing a management and financial structure that responds timely to changes in the global market, and by aiming to increase market share by introducing fine products that will inspire the market demands of the next generation. To achieve these objectives, Advantest promotes to further strengthen its product development operations and improve production efficiency by focusing on certain businesses, while strengthening its overseas operations and support system in the U.S., Europe and Asia.
Furthermore, Advantest seeks to increase the level of customer satisfaction by maximizing the performance of our test systems and by providing solutions to improve efficiency in all aspects of businesses.
In October 2005, Advantest launched a company-wide initiative called "Activate 21" to further promote reforms that emphasize cost and efficiency from a global perspective, which will continue until the end of FY2008.
- 10 - -
Advantest Corporation (FY2007)
4.Consolidated Financial Statements and Other Information
(1) Consolidated Balance Sheets
FY2006 (As of March 31, 2007) | FY2007 (As of March 31, 2008) | as compared to the previous fiscal year | ||||
Amount (in million yen) | percentage (%) | Amount (in million yen) | percentage (%) | Increase (decrease) (in million yen) | ||
| (Assets) | ||||||
| Cash and cash equivalents | 196,395 | 147,348 | (49,047) | |||
| Trade receivables, net | 54,264 | 30,124 | (24,140) | |||
| Inventories | 31,976 | 26,823 | (5,153) | |||
| Deferred tax assets | 9,215 | 12,678 | 3,463 | |||
| Other current assets | 2,958 | 6,474 | 3,516 | |||
Total current assets | 294,808 | 80.5 | 223,447 | 74.8 | (71,361) | |
| Investment securities | 11,370 | 3.1 | 9,754 | 3.3 | (1,616) | |
| Property, plant and equipment, net | 49,650 | 13.6 | 50,765 | 17.0 | 1,115 | |
| Deferred tax assets | 2,690 | 0.7 | 6,488 | 2.2 | 3,798 | |
| Intangible assets, net | 3,101 | 0.8 | 3,476 | 1.2 | 375 | |
| Other assets | 4,755 | 1.3 | 4,754 | 1.5 | (1) | |
Total assets | 366,374 | 100.0 | 298,684 | 100.0 | (67,690) | |
- 11 - -
Advantest Corporation (FY2007)
FY2006 (As of March 31, 2007) | FY2007 (As of March 31, 2008) | as compared to the previous fiscal year | ||||
Amount (in million yen) | percentage (%) | Amount (in million yen) | percentage (%) | Increase (decrease) (in million yen) | ||
| (Liabilities) | ||||||
| Current portion of long-term debt | 10 | - | (10) | |||
| Trade accounts payable | 29,095 | 11,765 | (17,330) | |||
| Income taxes payable | 9,370 | 585 | (8,785) | |||
| Other accounts payable | 1,700 | 2,458 | 758 | |||
| Accrued expenses | 13,637 | 10,940 | (2,697) | |||
| Accrued warranty expenses | 4,135 | 3,143 | (992) | |||
| Other current liabilities | 2,705 | 2,804 | 99 | |||
Total current liabilities | 60,652 | 16.6 | 31,695 | 10.6 | (28,957) | |
| Accrued pension and severance cost | 8,267 | 2.2 | 10,711 | 3.6 | 2,444 | |
| Other liabilities | 2,658 | 0.7 | 2,094 | 0.7 | (564) | |
Total liabilities | 71,577 | 19.5 | 44,500 | 14.9 | (27,077) | |
Commitments and contingent liabilities | ||||||
| (Stockholders’ equity) | ||||||
| Common stock | 32,363 | 8.8 | 32,363 | 10.8 | - | |
| Capital surplus | 39,256 | 10.7 | 40,072 | 13.4 | 816 | |
| Retained earnings | 273,082 | 74.6 | 278,689 | 93.3 | 5,607 | |
| Accumulated other comprehensive income (loss) | 3,652 | 1.0 | (7,615) | (2.5) | (11,267) | |
| Treasury stock | (53,556) | (14.6) | (89,325) | (29.9) | (35,769) | |
Total stockholders’ equity | 294,797 | 80.5 | 254,184 | 85.1 | (40,613) | |
Total liabilities and stockholders’ equity | 366,374 | 100.0 | 298,684 | 100.0 | (67,690) | |
- 12 - -
Advantest Corporation (FY2007)
(2) Consolidated Statements of Income
FY2006 (April 1, 2006 through March 31, 2007) | FY2007 (April 1, 2007 through March 31, 2008) | as compared to the previous fiscal year | |||||||
Amount (in million yen) | percentage (%) | Amount (in million yen) | percentage (%) | Increase (decrease) (in million yen) | |||||
| Net sales | 235,012 | 100.0 | 182,767 | 100.0 | (52,245) | ||||
| Cost of sales | 108,718 | 46.3 | 88,837 | 48.6 | (19,881) | ||||
| Gross profit | 126,294 | 53.7 | 93,930 | 51.4 | (32,364) | ||||
| Research and development expenses | 29,509 | 12.6 | 30,507 | 16.7 | 998 | ||||
| Selling, general and administrative expenses | 39,993 | 16.9 | 40,707 | 22.3 | 714 | ||||
| Operating income (loss) | 56,792 | 24.2 | 22,716 | 12.4 | (34,076) | ||||
| Other income (expense): | |||||||||
| Interest and dividend income | 3,026 | 3,799 | |||||||
| Interest expense | (16) | (12) | |||||||
| Other | 1,288 | 4,298 | 1.8 | (2,970) | 817 | 0.5 | (3,481) | ||
Income (loss) before income taxes and equity in earnings (loss) of affiliated company | 61,090 | 26.0 | 23,533 | 12.9 | (37,557) | ||||
| Income taxes | 25,520 | 10.9 | 6,889 | 3.8 | (18,631) | ||||
| Equity in earnings (loss) of affiliated company | (14) | (0.0) | (94) | (0.0) | (80) | ||||
| Net income (loss) | 35,556 | 15.1 | 16,550 | 9.1 | (19,006) | ||||
FY2006 (April 1, 2006 through March 31, 2007) | FY2007 (April 1, 2007 through March 31, 2008) | as compared to the previous fiscal year | |||||||
Amount (in yen) | Amount (in yen) | Increase (decrease) (in yen) | |||||||
| Net income per share | |||||||||
| Basic | 190.01 | 90.72 | (99.29) | ||||||
| Diluted | 188.85 | 90.57 | (98.28) | ||||||
- 13 - -
Advantest Corporation (FY2007)
(3) Consolidated Statements of Stockholders’ Equity
FY2006 (April 1, 2006 through March 31, 2007)
(In million yen)
| Common stock | Capital surplus | Retained earnings | Accumulated other comprehensive income (loss) | Treasury stock | Total stockholders’ equity | |
| Balance at March 31, 2006 | 32,363 | 37,147 | 245,090 | 1,344 | (58,017) | 257,927 |
| Comprehensive income | ||||||
| Net income (loss) | 35,556 | 35,556 | ||||
| Other comprehensive income (loss), net of tax | ||||||
| Foreign currency translation adjustments | 1,123 | 1,123 | ||||
| Net unrealized gains (losses) on securities | (362) | (362) | ||||
| Total comprehensive income | 36,317 | |||||
| Adjustment to initially apply SFAS 158, net of tax | 1,547 | 1,547 | ||||
| Cash dividends | (7,474) | (7,474) | ||||
| Stock option compensation expense | 2,566 | 2,566 | ||||
| Exercise of stock option | (457) | 4,520 | 4,063 | |||
| Repurchase of treasury stock | (68) | (68) | ||||
| Sale of treasury stock | (90) | 9 | (81) | |||
| Balance at March 31, 2007 | 32,363 | 39,256 | 273,082 | 3,652 | (53,556) | 294,797 |
FY2007 (April 1, 2007 through March 31, 2008) | (In million yen) |
| Common stock | Capital surplus | Retained earnings | Accumulated other comprehensive income (loss) | Treasury stock | Total stockholders’ equity | |
| Balance at March 31, 2007 | 32,363 | 39,256 | 273,082 | 3,652 | (53,556) | 294,797 |
| Comprehensive income | ||||||
| Net income (loss) | 16,550 | 16,550 | ||||
| Other comprehensive income (loss), net of tax | ||||||
| Foreign currency translation adjustments | (6,845) | (6,845) | ||||
| Net unrealized gains (losses) on securities | (2,060) | (2,060) | ||||
| Pension related adjustments | (2,362) | (2,362) | ||||
| Total comprehensive income | 5,283 | |||||
| Cash dividends | (10,702) | (10,702) | ||||
| Stock option compensation expense | 858 | 858 | ||||
| Exercise of stock option | (42) | 793 | 751 | |||
| Repurchase of treasury stock | (36,564) | (36,564) | ||||
| Sale of treasury stock | (241) | 2 | (239) | |||
| Balance at March 31, 2008 | 32,363 | 40,072 | 278,689 | (7,615) | (89,325) | 254,184 |
- 14 - -
Advantest Corporation (FY2007)
(4) Consolidated Statements of Cash Flows
FY2006 (April 1, 2006 through March 31, 2007) | FY2007 (April 1, 2007 through March 31, 2008) | as compared to the previous fiscal year | ||||
Amount (in million yen) | Amount (in million yen) | Increase (decrease) (in million yen) | ||||
| I Cash flows from operating activities: | ||||||
| Net income (loss) | 35,556 | 16,550 | (19,006) | |||
| Adjustments to reconcile net income (loss) to net cash provided by operating activities: | ||||||
| Depreciation and amortization | 8,214 | 8,836 | 622 | |||
| Deferred income taxes | 7,381 | (4,449) | (11,830) | |||
| Stock option compensation expense | 2,566 | 858 | (1,708) | |||
| Changes in assets and liabilities: | ||||||
| Trade receivables | 15,563 | 22,666 | 7,103 | |||
| Inventories | (2,054) | 4,877 | 6,931 | |||
| Trade accounts payable | (3,318) | (16,239) | (12,921) | |||
| Income taxes payable | (10,586) | (8,657) | 1,929 | |||
| Accrued expenses | 815 | (2,527) | (3,342) | |||
| Accrued warranty expenses | (641) | (986) | (345) | |||
| Accrued pension and severance cost | (1,437) | (1,480) | (43) | |||
| Other | (3,108) | 4,717 | 7,825 | |||
| Net cash provided by operating activities | 48,951 | 24,166 | (24,785) | |||
| II Cash flows from investing activities: | ||||||
| Proceeds from sale of non-marketable securities | 20 | 56 | 36 | |||
| Purchases of marketable securities | - | (3,002) | (3,002) | |||
| Purchases of non-marketable securities | - | (233) | (233) | |||
| Investment in equity method investee | (90) | (1,035) | (945) | |||
| Proceeds from sale of property, plant and equipment | 541 | 1,015 | 474 | |||
| Purchases of intangible assets | (897) | (1,017) | (120) | |||
| Purchases of property, plant and equipment | (7,511) | (11,994) | (4,483) | |||
| Other | (76) | (112) | (36) | |||
| Net cash used in investing activities | (8,013) | (16,322) | (8,309) | |||
- 15 - -
Advantest Corporation (FY2007)
FY2006 (April 1, 2006 through March 31, 2007) | FY2007 (April 1, 2007 through March 31, 2008) | as compared to the previous fiscal year | ||||
Amount (in million yen) | Amount (in million yen) | Increase (decrease) (in million yen) | ||||
| III Cash flows from financing activities: | ||||||
| Principal payments on long-term debt | (30) | (10) | 20 | |||
| Proceeds from sale of treasury stock | 3,913 | 508 | (3,405) | |||
| Payments to acquire treasury stock | (68) | (36,564) | (36,496) | |||
| Dividends paid | (7,468) | (10,695) | (3,227) | |||
| Other | (9) | (9) | 0 | |||
| Net cash used in financing activities | (3,662) | (46,770) | (43,108) | |||
| IV | Net effect of exchange rate changes on cash and cash equivalents | 1,194 | (10,121) | (11,315) | ||
| Ⅴ | Net change in cash and cash equivalents | 38,470 | (49,047) | (87,517) | ||
| Ⅵ | Cash and cash equivalents at beginning of year | 157,925 | 196,395 | 38,470 | ||
| Ⅶ | Cash and cash equivalents at end of year | 196,395 | 147,348 | (49,047) | ||
- 16 - -
Advantest Corporation (FY2007)
Notes to the Consolidated Financial Statements
(Note 1) Accounting Principles, Procedures and the Presentation of the Consolidated
Financial Statements
(a) Terminology, Form and Method of Preparation of the Consolidated Financial Statements
Advantest Corporation prepares these consolidated financial statements in accordance with the accounting principles, procedures, terminology, form and method of preparation required in the United States of America in connection with its issuance of American Depository Shares as established under Accounting Research Bulletins (“ARB”), Accounting Principles Board (“APB”) statements, Statements of Financial Accounting Standards (“SFAS”) and other relevant sources (collectively “U.S. GAAP”). However, Advantest Corporation and its consolidated subsidiaries prepare their unconsolidated financial statements in accordance with accounting principles generally accepted in the country of their domicile. Certain adjustments and reclassifications have been incorporated in the accompanying non-consolidated financial statements to present them in conformity with accounting principles generally accepted in the United States of America.
(b) Preparation of Consolidated Financial Statements and Registration with the U.S. Securities and Exchange Commission
Advantest Corporation became listed on the New York Stock Exchange on September 17, 2001 (local time) by means of an issuance of American Depository Shares, and has been filing a Form 20-F (equivalent to the Annual Securities Report in Japan) with the U.S. Securities and Exchange Commission since FY2001. Advantest prepares the consolidated financial statements in its Form 20-F in accordance with U.S. GAAP.
(c) Scope of Consolidation and Application of the Equity Method
Advantest’s consolidated financial statements include financial statements of Advantest Corporation and its majority-owned subsidiaries. With respect to variable interest entities as provided in the U.S. Financial Accounting Standards Board’s Interpretation No. 46 (Revised December 2003) – “Consolidation of Variable Interest Entities”, Advantest does not have any such entity to be included in its consolidated financial statements. All significant intercompany balances and transactions have been eliminated in consolidation.
The following table sets forth the number of consolidated subsidiaries and equity method affiliates of Advantest:
| FY 2006 | FY 2007 | Increase (decrease) | |
| (As of March 31, 2007) | (As of March 31, 2008) | ||
| Domestic | 23 | 23 | 0 |
| Overseas | 17 | 17 | 0 |
| Consolidated subsidiaries | 40 | 40 | 0 |
| Equity method affiliates | 1 | 1 | 0 |
| Total | 41 | 41 | 0 |
- 17 - -
Advantest Corporation (FY2007)
Changes in the scope of consolidation:
Newly included (1): Advantest Component, Inc.*1
Excluded (1): Advantest Technology Solutions Corporation *2
*1 Advantest Component, Inc. was established on June 1, 2007 as a subsidiary to be engaged in the development and production of semiconductor test system key devices and electronic components.
*2 Advantest Technology Solutions Corporation was dissolved on November 30, 2007.
(Note 2) Significant Accounting Policies
(Accounting Changes)
(a) Property, Plant and Equipment
Depreciation has been calculated principally by the declining-balance method, except for certain assets which are depreciated by the straight-line method over the estimated useful lives of the assets.
On April 1, 2007, Advantest and its domestic subsidiaries elected to change the declining-balance method of depreciating machinery and equipments as well as furniture and fixtures from the fixed-percentage-on-declining base application to the 250% declining balance application. Estimated salvage values have also been reduced in conjunction with this change. Advantest and its domestic subsidiaries believe that the 250% declining balance application is preferable because it provides a better matching of allocation of cost of machinery and equipments as well as furniture and fixtures with associated revenue in light of product life cycles. In accordance with Statement of Financial Accounting Standards No. 154 “Accounting Changes and Error Corrections – a replacement of APB Opinion No.20 and FASB Statement No. 3”, this change in depreciation methods represents a change in accounting estimate effected by a change in accounting principle. Accordingly, the effects of the change are accounted for prospectively beginning with the period of change. The change in depreciation methods caused a decrease in income before income taxes and equity in earnings of affiliated company and net income by (Y) 861 million and (Y) 513 million in the year ended March 31, 2008, respectively.
(b) Income Taxes
In June 2006, the FASB issued FASB Interpretation No.48, “Accounting for Uncertainty in Income Taxes, an interpretation of FASB Statement No.109 (“FIN 48”). FIN 48 clarifies the accounting for uncertainty in income taxes by prescribing the recognition threshold a tax position is required to meet before being recognized in the financial statements. It also provides guidance on derecognition, classification, interest and penalties, accounting in interim periods, disclosure, and transition. Effective April 1, 2007, Advantest measures and recognizes uncertainty in income taxes in the consolidated financial statements in accordance with FIN 48. The adoption of FIN 48 did not have an impact on Advantest’s consolidated results of operations and financial condition.
There are no other changes pertaining to accounting policies other than as mentioned above from the fiscal year 2006 Annual Report which was submitted on June 28, 2007.
- 18 - -
Advantest Corporation (FY2007)
(Note 3) Segment Information
1. Business Segment Information
| (in million yen) | |||||
FY2006 (April 1, 2006 through March 31, 2007) | FY2007 (April 1, 2007 through March 31, 2008) | as compared to the previous fiscal year | |||
| Amount | Percentage (%) | Amount | Percentage (%) | Increase (decrease) | |
| Semiconductor and Component Test System | |||||
Net sales to unaffiliated customers | 164,899 | 98.3 | 128,779 | 97.9 | (36,120) |
Intersegment sales | 2,916 | 1.7 | 2,829 | 2.1 | (87) |
| Sales | 167,815 | 100.0 | 131,608 | 100.0 | (36,207) |
| Operating expenses | 119,207 | 71.0 | 108,345 | 82.3 | (10,862) |
Operating income before stock option compensation expense | 48,608 | 29.0 | 23,263 | 17.7 | (25,345) |
Expenditures for additions to long-lived assets | 3,173 | 7,814 | 4,641 | ||
| Depreciation and amortization | 2,812 | 3,561 | 749 | ||
| Total assets | 84,962 | 63,570 | (21,392) | ||
| Mechatronics System | |||||
Net sales to unaffiliated customers | 51,801 | 99.6 | 34,644 | 99.1 | (17,157) |
Intersegment sales | 224 | 0.4 | 300 | 0.9 | 76 |
| Sales | 52,025 | 100.0 | 34,944 | 100.0 | (17,081) |
| Operating expenses | 38,378 | 73.8 | 31,678 | 90.7 | (6,700) |
Operating income before stock option compensation expense | 13,647 | 26.2 | 3,266 | 9.3 | (10,381) |
Expenditures for additions to long-lived assets | 1,145 | 2,260 | 1,115 | ||
| Depreciation and amortization | 1,241 | 1,261 | 20 | ||
| Total assets | 24,256 | 18,511 | (5,745) | ||
| Services, Support and Others | |||||
Net sales to unaffiliated customers | 18,312 | 100.0 | 19,344 | 100.0 | 1,032 |
Intersegment sales | - | - | - | - | - |
| Sales | 18,312 | 100.0 | 19,344 | 100.0 | 1,032 |
| Operating expenses | 15,442 | 84.3 | 16,167 | 83.6 | 725 |
Operating income before stock option compensation expense | 2,870 | 15.7 | 3,177 | 16.4 | 307 |
Expenditures for additions to long-lived assets | 3,533 | 2,749 | (784) | ||
| Depreciation and amortization | 3,710 | 3,324 | (386) | ||
| Total assets | 15,163 | 14,493 | (670) | ||
| Elimination and Corporate | |||||
Net sales to unaffiliated customers | - | - | - | - | - |
Intersegment sales | (3,140) | 100.0 | (3,129) | 100.0 | 11 |
| Sales | (3,140) | 100.0 | (3,129) | 100.0 | 11 |
| Operating expenses | 2,627 | - | 3,003 | - | 376 |
Operating income (loss) before stock option compensation expense | (5,767) | - | (6,132) | - | (365) |
Expenditures for additions to long-lived assets | 485 | 1,260 | 775 | ||
| Depreciation and amortization | 451 | 690 | 239 | ||
| Total assets | 241,993 | 202,110 | (39,883) | ||
- 19 - -
Advantest Corporation (FY2007)
FY2006 (April 1, 2006 through March 31, 2007) | FY2007 (April 1, 2007 through March 31, 2008) | as compared to the previous fiscal year | |||
| Amount | Percentage (%) | Amount | Percentage (%) | Increase (decrease) | |
| Consolidated | (in million yen) | ||||
Net sales to unaffiliated customers | 235,012 | 100.0 | 182,767 | 100.0 | (52,245) |
Intersegment sales | - | - | - | - | - |
| Net sales | 235,012 | 100.0 | 182,767 | 100.0 | (52,245) |
| Operating expenses | 175,654 | 74.7 | 159,193 | 87.1 | (16,461) |
Operating income before stock option compensation expense | 59,358 | 25.3 | 23,574 | 12.9 | (35,784) |
Adjustment: Stock based compensation expense | 2,566 | 1.1 | 858 | 0.5 | (1,708) |
| Operating income | 56,792 | 24.2 | 22,716 | 12.4 | (34,076) |
Expenditures for additions to long-lived assets | 8,336 | 14,083 | 5,747 | ||
| Depreciation and amortization | 8,214 | 8,836 | 622 | ||
| Total assets | 366,374 | 298,684 | (67,690) | ||
(Notes)
1.Adjustments to operating income (loss) in Corporate principally represent corporate general and administrative expenses and research and development expenses related to fundamental research activities that are not allocated to operating segments.
2. Advantest uses the operating income (loss) before stock option compensation expense for management's analysis of business segment results.
3.Total assets included in Corporate primarily consist of the parent company’s cash and cash equivalents, assets for general corporate use and assets used for fundamental research activities.
| 2. Consolidated Net Sales by Geographic Segment | (in million yen) | ||||
Net sales to unaffiliated customers | FY2006 (April 1, 2006 through March 31, 2007) | FY2007 (April 1, 2007 through March 31, 2008) | as compared to the previous fiscal year | ||
| Amount | Percentage (%) | Amount | Percentage (%) | Increase (decrease) | |
Americas | 10,158 | 4.3 | 9,616 | 5.3 | (542) |
Europe | 11,238 | 4.8 | 8,859 | 4.8 | (2,379) |
Asia | 140,782 | 59.9 | 108,260 | 59.2 | (32,522) |
Total Overseas | 162,178 | 69.0 | 126,735 | 69.3 | (35,443) |
Japan | 72,834 | 31.0 | 56,032 | 30.7 | (16,802) |
| Consolidated | 235,012 | 100.0 | 182,767 | 100.0 | (52,245) |
- 20 - -
Advantest Corporation (FY2007)
| 3. Segment Information by Geographic Area | (in million yen) | ||||
FY2006 (April 1, 2006 through March 31, 2007) | FY2007 (April 1, 2007 through March 31, 2008) | as compared to the previous fiscal year | |||
| Amount | Percentage (%) | Amount | Percentage (%) | Increase (decrease) | |
| Japan | |||||
| Net sales to unaffiliated customers | 132,035 | - | 101,113 | - | (30,922) |
| Intersegment sales | 80,289 | - | 61,984 | - | (18,305) |
| Sales | 212,324 | 100.0 | 163,097 | 100.0 | (49,227) |
| Operating expenses | 159,782 | 75.3 | 145,026 | 88.9 | (14,756) |
| Operating income | 52,542 | 24.7 | 18,071 | 11.1 | (34,471) |
| Total assets | 160,386 | 134,418 | (25,968) | ||
| Americas | |||||
| Net sales to unaffiliated customers | 16,266 | - | 9,143 | - | (7,123) |
| Intersegment sales | 4,660 | - | 4,145 | - | (515) |
| Sales | 20,926 | 100.0 | 13,288 | 100.0 | (7,638) |
| Operating expenses | 19,049 | 91.0 | 13,084 | 98.5 | (5,965) |
| Operating income | 1,877 | 9.0 | 204 | 1.5 | (1,673) |
| Total assets | 26,313 | 24,962 | (1,351) | ||
| Europe | |||||
| Net sales to unaffiliated customers | 17,841 | - | 15,751 | - | (2,090) |
| Intersegment sales | 1,271 | - | 1,223 | - | (48) |
| Sales | 19,112 | 100.0 | 16,974 | 100.0 | (2,138) |
| Operating expenses | 17,426 | 91.2 | 16,233 | 95.6 | (1,193) |
| Operating income | 1,686 | 8.8 | 741 | 4.4 | (945) |
| Total assets | 17,670 | 10,986 | (6,684) | ||
| Asia | |||||
| Net sales to unaffiliated customers | 68,870 | - | 56,760 | - | (12,110) |
| Intersegment sales | 6,852 | - | 6,601 | - | (251) |
| Sales | 75,722 | 100.0 | 63,361 | 100.0 | (12,361) |
| Operating expenses | 67,073 | 88.6 | 52,968 | 83.6 | (14,105) |
| Operating income | 8,649 | 11.4 | 10,393 | 16.4 | 1,744 |
| Total assets | 75,948 | 35,547 | (40,401) | ||
| Elimination and Corporate | |||||
| Net sales to unaffiliated customers | - | - | - | - | - |
| Intersegment sales | (93,072) | - | (73,954) | - | 19,118 |
| Sales | (93,072) | - | (73,954) | - | 19,118 |
| Operating expenses | (85,110) | - | (67,260) | - | 17,850 |
| Operating income (loss) | (7,962) | - | (6,693) | - | 1,269 |
| Total assets | 86,057 | 92,771 | 6,714 | ||
| Consolidated | |||||
| Net sales to unaffiliated customers | 235,012 | - | 182,767 | - | (52,245) |
| Intersegment sales | - | - | - | - | - |
| Net sales | 235,012 | 100.0 | 182,767 | 100.0 | (52,245) |
| Operating expenses | 178,220 | 75.8 | 160,051 | 87.6 | (18,169) |
| Operating income | 56,792 | 24.2 | 22,716 | 12.4 | (34,076) |
| Total assets | 366,374 | 298,684 | (67,690) | ||
(Notes)
1.Adjustments to operating income (loss) in Corporate principally represent corporate general and administrative expenses and research and development expenses related to fundamental research activities that are not allocated to corporate general administrative expense and segment by geographic area. Stock option expense of (Y) 2,566 million and (Y) 858 million for FY2006 and FY2007, respectively, are included in Corporate operating expenses.
2. Total assets included in Corporate primarily consist of the parent company’s cash and cash equivalents, assets for general corporate use and assets used for fundamental research activities.
- 21 - -
Advantest Corporation (FY2007)
(Note 4) Per Share information
Basic and diluted net income per share were computed as follows:
| FY2006 | FY2007 | |||||||
| Numerator: | ||||||||
| Net income (million yen) | 35,556 | 16,550 | ||||||
| Denominator | ||||||||
Basic weighted average shares of common stock outstanding | 187,128,842 | 182,418,821 | ||||||
Dilutive effect of exercise of stock options | 1,141,846 | 305,161 | ||||||
Diluted weighted average shares of common stock outstanding | 188,270,688 | 182,723,982 | ||||||
| Basic net income per share | 190.01 | yen | 90.72 | yen | ||||
| Diluted net income per share | 188.85 | yen | 90.57 | yen | ||||
As of March 31, 2007 and March 31, 2008, Advantest held 11,980 shares and 2,309,980 shares respectively, of issued stock options that are excluded from the calculation of net income per share (diluted) because they do not currently have a dilutive effect.
(Omission of Disclosure)
For purpose of annual release in Japan, notes for lease transactions, related party transactions, income taxes, securities, derivative transactions, accrued pension and severance cost and stock options, among others, have not been disclosed because such disclosure in this consolidated financial results is not considered significant for this presentation in Japan.
- 22 - -
Advantest Corporation (FY2007)
(All non-consolidated financial information has been prepared in accordance
with accounting principles generally accepted in Japan)
with accounting principles generally accepted in Japan)
5.Non-Consolidated Financial Statements
(1) Balance Sheets
FY2006 (As of March 31, 2007) | FY2007 (As of March 31, 2008) | as compared to the previous fiscal year | |||||||
Amount (in million yen) | Percentage (%) | Amount (in million yen) | Percentage (%) | Increase (decrease) (in million yen) | |||||
| (Assets) | |||||||||
| I Current Assets | |||||||||
| 1. Cash and deposits | 112,558 | 99,745 | (12,813) | ||||||
| 2. Trade notes receivables | 4,505 | 1,230 | (3,275) | ||||||
| 3. Accounts receivable | 56,313 | 25,676 | (30,637) | ||||||
| 4. Finished goods | 5,156 | 5,093 | (63) | ||||||
| 5. Raw materials | 2,954 | 2,296 | (658) | ||||||
| 6. Work in process | 15,997 | 11,962 | (4,035) | ||||||
| 7. Supplies | 165 | 254 | 89 | ||||||
| 8. Short-term loans receivable | 6,095 | 4,058 | (2,037) | ||||||
| 9. Other receivable | 952 | 395 | (557) | ||||||
| 10. Refundable income taxes | - | 3,423 | 3,423 | ||||||
| 11. Deferred tax assets | 9,017 | 9,110 | 93 | ||||||
| 12. Other | 449 | 481 | 32 | ||||||
| 13. Allowance for doubtful accounts | (983) | - | 983 | ||||||
| Total current assets | 213,182 | 73.6 | 163,723 | 66.2 | (49,459) | ||||
Ⅱ Noncurrent assets | |||||||||
| (1) Property, plant and equipment | |||||||||
| 1. Buildings | 42,735 | 48,014 | |||||||
| Accumulated depreciation | 29,274 | 13,461 | 30,282 | 17,732 | 4,271 | ||||
| 2. Structures | 3,981 | 4,233 | |||||||
Accumulated depreciation | 3,211 | 770 | 3,318 | 915 | 145 | ||||
| 3. Machinery and equipment | 17,566 | 17,342 | |||||||
| Accumulated depreciation | 14,114 | 3,452 | 13,463 | 3,879 | 427 | ||||
| 4. Vehicles and delivery equipment | 40 | 48 | |||||||
| Accumulated depreciation | 24 | 16 | 27 | 21 | 5 | ||||
| 5. Tools and furniture | 13,019 | 12,507 | |||||||
| Accumulated depreciation | 10,855 | 2,164 | 10,731 | 1,776 | (388) | ||||
| 6. Land | 17,622 | 17,623 | - | ||||||
| 7. Construction in progress | 297 | 1,566 | 1,269 | ||||||
| Total property, plant and equipment | 37,784 | 13.0 | 43,512 | 17.6 | 5,728 | ||||
| (2) Intangible fixed assets | |||||||||
| 1. Patent rights | 139 | 128 | (11) | ||||||
| 2. Leasehold rights | 173 | 173 | - | ||||||
| 3. Telephone rights | 39 | 40 | - | ||||||
| 4. Utility rights | 23 | 13 | (10) | ||||||
| 5. Software | 940 | 1,251 | 311 | ||||||
| 6. Other | 149 | 251 | 102 | ||||||
| Total intangible fixed assets | 1,467 | 0.5 | 1,856 | 0.8 | 389 | ||||
| (Note) Accumulated depreciation includes the accumulated impairment losses. | |||||||||
- 23 - -
Advantest Corporation (FY2007)
(All non-consolidated financial information has been prepared in accordance
with accounting principles generally accepted in Japan)
with accounting principles generally accepted in Japan)
| FY2006 | FY2007 | as compared to the previous | |||||||
| (As of March 31, 2007) | (As of March 31, 2008) | fiscal year | |||||||
Amount (in million yen) | Percentage (%) | Amount (in million yen) | Percentage (%) | Increase (decrease) (in million yen) | |||||
| (3) Investments and other assets | |||||||||
1. Investment securities | 11,336 | 9,744 | (1,592) | ||||||
2. Investment in affiliated companies | 16,480 | 17,595 | 1,115 | ||||||
3. Long-term loans receivable | 34 | 19 | (15) | ||||||
4. Long-term loans to affiliated companies | 1,050 | 1,140 | 90 | ||||||
5. Long-term prepaid expenses | 2,582 | 1,994 | (588) | ||||||
6. Deferred tax assets | 4,791 | 6,433 | 1,642 | ||||||
7. Other | 988 | 1,131 | 143 | ||||||
8. Allowance for doubtful accounts | – | (2) | (2) | ||||||
Total investment and other assets | 37,263 | 12.9 | 38,054 | 15.4 | 791 | ||||
| Total noncurrent assets | 76,515 | 26.4 | 83,422 | 33.8 | 6,907 | ||||
| Total assets | 289,697 | 100.0 | 247,145 | 100.0 | (42,552) | ||||
| (Liabilities) | |||||||||
| I Current liabilities | |||||||||
1. Trade accounts payable | 26,407 | 11,338 | (15,069) | ||||||
2. Other accounts payable | 2,030 | 3,373 | 1,343 | ||||||
3. Accrued expenses | 9,992 | 7,998 | (1,994) | ||||||
4. Income tax payable | 8,082 | 1,122 | (6,960) | ||||||
5. Advance received | 204 | 500 | 296 | ||||||
6. Deposits received | 5,108 | 3,297 | (1,811) | ||||||
7. Allowance for product warranty | 4,192 | 3,060 | (1,132) | ||||||
8. Bonus accrual for directors | 203 | 135 | (68) | ||||||
9. Other | 138 | 177 | 39 | ||||||
Total current liabilities | 56,358 | 19.5 | 31,000 | 12.5 | (25,358) | ||||
| II Noncurrent liabilities | |||||||||
1. Allowance for retirement benefits | 6,255 | 5,170 | (1,085) | ||||||
2. Other | 2,277 | 1,711 | (566) | ||||||
Total noncurrent liabilities | 8,533 | 2.9 | 6,881 | 2.8 | (1,652) | ||||
Total liabilities | 64,891 | 22.4 | 37,881 | 15.3 | (27,010) | ||||
- 24 - -
Advantest Corporation (FY2007)
(All non-consolidated financial information has been prepared in accordance
with accounting principles generally accepted in Japan)
with accounting principles generally accepted in Japan)
| FY2006 | FY2007 | as compared to the previous | ||||||||
| (As of March 31, 2007) | (As of March 31, 2008) | fiscal year | ||||||||
Amount (in million yen) | Percentage (%) | Amount (in million yen) | Percentage (%) | Increase (decrease) (in million yen) | ||||||
| (Net assets) | ||||||||||
| I Stockholders' equity | ||||||||||
| 1. Common stock | 32,362 | 11.2 | 32,363 | 13.1 | - | |||||
| 2. Capital surplus | ||||||||||
| (1) Additional paid-in capital | 32,973 | 32,973 | ||||||||
| Total capital surplus | 32,973 | 11.4 | 32,973 | 13.3 | - | |||||
| 3. Retained earnings | ||||||||||
| (1) Legal reserve | 3,083 | 3,083 | - | |||||||
| (2) Other retained earnings | ||||||||||
Reserve for losses in foreign investments | 27,062 | 27,062 | - | |||||||
General reserve | 146,880 | 146,880 | - | |||||||
Retained earnings brought forward | 31,347 | 52,797 | 21,450 | |||||||
| Total retained earnings | 208,372 | 71.9 | 229,822 | 93.0 | 21,450 | |||||
| 4. Treasury stock | (53,555) | (18.5) | (89,325) | (36.1) | (35,770) | |||||
| Total stockholders' equity | 220,152 | 76.0 | 205,833 | 83.3 | (14,320) | |||||
| II Difference of appreciation and conversion | ||||||||||
| 1. Net unrealized gains on securities | 2,315 | 309 | (2,006) | |||||||
| Total difference of appreciation and conversion | 2,315 | 0.8 | 309 | 0.1 | (2,006) | |||||
| III Stock Acquisition Rights | 2,337 | 0.8 | 3,122 | 1.3 | 785 | |||||
| Total net assets | 224,805 | 77.6 | 209,264 | 84.7 | (15,541) | |||||
| Total liabilities and net assets | 289,697 | 100.0 | 247,145 | 100.0 | (42,552) | |||||
- 25 - -
Advantest Corporation (FY2007)
(All non-consolidated financial information has been prepared in accordance
with accounting principles generally accepted in Japan)
with accounting principles generally accepted in Japan)
(2) Statements of Income | |||||||||
FY2006 (April 1, 2006 through | FY2007 (April 1, 2007 through | as compared to the previous | |||||||
| March 31, 2007) | March 31, 2008) | fiscal year | |||||||
Amount (in million yen) | Percentage (%) | Amount (in million yen) | Percentage (%) | Increase (decrease) (in million yen) | |||||
| I Net sales | |||||||||
| 1. Net product sales | 197,753 | 197,753 | 100.0 | 147,686 | 147,686 | 100.0 | (50,067) | ||
| II Cost of sales | |||||||||
| 1. Inventory of finished goods at beginning of year | 3,571 | 5,156 | 1,585 | ||||||
| 2. Cost of manufactured goods | 100,563 | 80,764 | (19,799) | ||||||
| Total | 104,134 | 85,920 | (18,214) | ||||||
| 3. Transfers to other accounts | 782 | 488 | (294) | ||||||
| 4. Inventory of finished goods at end of year | 5,156 | 5,093 | (63) | ||||||
| Balance of cost of sales | 98,195 | 98,195 | 49.7 | 80,339 | 80,339 | 54.4 | (17,856) | ||
| Gross profit | 99,558 | 50.3 | 67,347 | 45.6 | (32,211) | ||||
| III Selling, general and administrative expenses | 58,054 | 29.3 | 58,545 | 39.6 | 491 | ||||
| Operating income (loss) | 41,503 | 21.0 | 8,802 | 6.0 | (32,701) | ||||
| IV Non-operating income | |||||||||
| 1. Interest income | 420 | 1,856 | |||||||
| 2. Dividends income | 2,543 | 32,687 | |||||||
| 3. Lease income | 2,119 | 2,471 | |||||||
| 4. Miscellaneous income | 356 | 5,440 | 2.8 | 405 | 37,419 | 25.3 | 31,979 | ||
| V Non-operating expenses | |||||||||
| 1. Interest expenses | 22 | 30 | |||||||
| 2. Transfer of Allowance for doubtful account | 983 | 2 | |||||||
| 3. Expenses related to leased equipment | 1,628 | 2,173 | |||||||
| 4. Foreign exchange losses | - | 3,063 | |||||||
| 5. Impairment losses on investment securities | - | 1,398 | |||||||
| 6. Miscellaneous expenses | 671 | 3,306 | 1.7 | 796 | 7,462 | 5.1 | 4,156 | ||
| Ordinary income (loss) | 43,638 | 22.1 | 38,759 | 26.2 | (4,879) | ||||
| Income (loss) before income taxes | 43,638 | 22.1 | 38,759 | 26.2 | (4,879) | ||||
| Income taxes | 14,769 | 6,701 | |||||||
| Income taxes - deferred | (567) | 14,201 | 7.2 | (380) | 6,321 | 4.2 | (7,880) | ||
| Net income (loss) | 29,436 | 14.9 | 32,438 | 22.0 | 3,002 | ||||
- 26 - -
Advantest Corporation (FY2007)
(All non-consolidated financial information has been prepared in accordance
with accounting principles generally accepted in Japan)
with accounting principles generally accepted in Japan)
| (3) Statements of Changes in Stockholders' Equity | |||||||||||||
FY2006 (April 1, 2006 through March 31, 2007) | |||||||||||||
| Stockholders' equity | Difference of appreciation and conversion | ||||||||||||
| Common | Capital surplus | Retained earnings | Stock | Total | |||||||||
| stock | Additional | Legal | Other retained earnings | Treasury | Total | Net | acquisition rights | net assets | |||||
paid-in capital | reserve | Reserve for losses in foreign investments | General reserve | Retained earnings brought forward | stock | stockholders' equity | unrealized gains on securities | ||||||
Balance of March 31, 2006 (Millions of yen) | 32,362 | 32,973 | 3,083 | 27,062 | 121,880 | 35,204 | (58,017) | 194,548 | 2,677 | - | 197,226 | ||
| Changes in the term | |||||||||||||
| Transfer to voluntary reserve (Note 1) | 25,000 | (25,000) | - | - | |||||||||
| Bonus of directors and corporate auditors (Note 2) | (203) | (203) | (203) | ||||||||||
| Dividends from surplus (Note 3) | (7,473) | (7,473) | (7,473) | ||||||||||
| Net income | 29,436 | 29,436 | 29,436 | ||||||||||
| Repurchase of treasury stock | (67) | (67) | (67) | ||||||||||
| Disposal of treasury stock | (617) | 4,529 | 3,912 | 3,912 | |||||||||
Net changes of items other than stockholders' equity | (362) | 2,337 | 1,975 | ||||||||||
Total changes in the term (Millions of yen) | - | - | - | - | 25,000 | (3,857) | 4,461 | 25,604 | (362) | 2,337 | 27,579 | ||
| Balance of March 31, 2007 | 32,362 | 32,973 | 3,083 | 27,062 | 146,880 | 31,347 | (53,555) | 220,152 | 2,315 | 2,337 | 224,805 | ||
| (Millions of yen) | |||||||||||||
| Note 1: Transfer to voluntary reserve was an appropriated earnings item for the general shareholders' meeting held in June, 2006. | |||||||||||||
| Note 2: Bonus of directors and corporate auditors was an appropriated earnings item for the general shareholders' meeting held in June, 2006. | |||||||||||||
| Note 3: 4,199 million yen out of Dividends from surplus was an appropriated earnings item for the general shareholders' meeting held in June, 2006. | |||||||||||||
FY2007 (April 1, 2007 through March 31, 2008) | |||||||||||||
| Stockholders' equity | Difference of appreciation and conversion | ||||||||||||
| Common | Capital surplus | Retained earnings | Stock | Total | |||||||||
| stock | Additional | Legal | Other retained earnings | Treasury | Total | Net | acquisition rights | net assets | |||||
paid-in capital | reserve | Reserve for losses in foreign investments | General reserve | Retained earnings brought forward | stock | stockholders' equity | unrealized gains on securities | ||||||
| Balance of March 31, 2007 | 32,362 | 32,973 | 3,083 | 27,062 | 146,880 | 31,347 | (53,555) | 220,152 | 2,315 | 2,337 | 224,805 | ||
| (Millions of yen) | |||||||||||||
| Changes in the term | |||||||||||||
| Dividends from surplus | (10,702) | (10,702) | (10,702) | ||||||||||
| Net income | 32,438 | 32,438 | 32,438 | ||||||||||
| Repurchase of treasury stock | (36,564) | (36,564) | (36,564) | ||||||||||
| Disposal of treasury stock | (286) | 794 | 508 | 508 | |||||||||
Net changes of items other than stockholders' equity | (2,006) | 785 | (1,221) | ||||||||||
Total changes in the term (Millions of yen) | - | - | - | - | - | 21,450 | (35,770) | (14,320) | (2,006) | 785 | (15,541) | ||
| Balance of March 31, 2008 | 32,363 | 32,973 | 3,083 | 27,062 | 146,880 | 52,797 | (89,325) | 205,833 | 309 | 3,122 | 209,264 | ||
| (Millions of yen) | |||||||||||||
- 27 - -
Advantest Corporation (FY2007)
Supplemental Information to the FY2007 Earnings Digest
*All consolidated figures were prepared in accordance with U.S. GAAP.
| 1.Consolidated Net Sales by Business and Geographic Segment | (Rounded to the nearest million yen) |
| By Business Segment | FY2006 | FY2007 | Increase (decrease) | Percentage change (%) |
| Semiconductor and Component Test System | 167,815 | 131,608 | (36,207) | (21.6) |
| for memory semiconductors | 109,541 | 92,896 | (16,645) | (15.2) |
| for non memory semiconductors | 58,274 | 38,712 | (19,562) | (33.6) |
| Mechatronics System | 52,025 | 34,944 | (17,081) | (32.8) |
| Services, Support and Others | 18,312 | 19,344 | 1,032 | 5.6 |
| Intercompany transactions elimination | (3,140) | (3,129) | 11 | - |
| Total net sales | 235,012 | 182,767 | (52,245) | (22.2) |
| By Geographic Segment | FY2006 | FY2007 | Increase (decrease) | Percentage change (%) |
| Japan | 72,834 | 56,032 | (16,802) | (23.1) |
| Americas | 10,158 | 9,616 | (542) | (5.3) |
| Europe | 11,238 | 8,859 | (2,379) | (21.2) |
| Korea | 51,177 | 35,967 | (15,210) | (29.7) |
| Taiwan | 63,098 | 56,122 | (6,976) | (11.1) |
| Asia and others | 26,507 | 16,171 | (10,336) | (39.0) |
| Total overseas | 162,178 | 126,735 | (35,443) | (21.9) |
| Overseas sales ratio (%) | 69.0 | 69.3 | 0.3 | - |
| 2. Consolidated Orders Input Received and Orders Backlog by Business Segment | (Rounded to the nearest million yen) |
| Orders Input Received | FY2006 | FY2007 | Increase (decrease) | Percentage change (%) |
| Semiconductor and Component Test System | 175,126 | 115,684 | (59,442) | (33.9) |
| Mechatronics System | 54,861 | 30,252 | (24,609) | (44.9) |
| Services, Support and Others | 18,013 | 19,328 | 1,315 | 7.3 |
| Intercompany transactions elimination | (5,131) | (3,051) | 2,080 | - |
| Total orders input received | 242,869 | 162,213 | (80,656) | (33.2) |
| Orders Backlog | FY2006 | FY2007 | Increase (decrease) | Percentage change (%) |
| Semiconductor and Component Test System | 43,526 | 27,602 | (15,924) | (36.6) |
| Mechatronics System | 10,727 | 6,035 | (4,692) | (43.7) |
| Services, Support and Others | 739 | 723 | (16) | (2.1) |
| Intercompany transactions elimination | (2,084) | (2,006) | 78 | - |
| Total orders backlog | 52,908 | 32,354 | (20,554) | (38.8) |
(Note)
The amount of orders input received for any given period consists of the sum of the revenues for such period and the amount of orders backlog at the end of such period less the orders backlog at the end of the previous fiscal year. Orders input received are recorded upon receipt of a written customer order.
- 28 - -
Advantest Corporation (FY2007)
| 3. Consolidated Capital Expenditure, Depreciation and Amortization and Research and Development Expenses |
(Rounded to the nearest million yen)
| FY2006 | FY2007 | Increase (decrease) | Percentage change (%) | |
| Capital expenditures | 8,336 | 14,083 | 5,747 | 69.0 |
| Depreciation and amortization | 8,214 | 8,836 | 622 | 7.6 |
| Research and Development Expenses | 29,509 | 30,507 | 998 | 3.4 |
| Sales ratio (%) | 12.6 | 16.7 | 4.1 | - |
| 4. Number of Employees (Advantest Corporation and Consolidated Subsidiaries) | (Persons) | |||
| FY2006 | FY2007 | Increase (decrease) | Percentage change (%) | |
| Non-Consolidated (Parent Company Only) | 1,454 | 1,482 | 28 | 1.9 |
| Domestic | 1,378 | 1,416 | 38 | 2.8 |
| Overseas | 805 | 768 | (37) | (4.6) |
| Consolidated Subsidiaries total | 2,183 | 2,184 | 1 | 0.0 |
| Consolidated full-time employee total | 3,637 | 3,666 | 29 | 0.8 |
| 5. Consolidated Results Indexes | (Rounded to the nearest million yen) | |||
| FY2006 | FY2007 | Increase (decrease) | Percentage change (%) | |
| Net income per share (basic) (in yen) | 190.01 | 90.72 | (99.29) | (52.3) |
| Net income per share (diluted) (in yen) | 188.85 | 90.57 | (98.28) | (52.0) |
| Net assets per share (in yen) | 1,570.99 | 1,422.20 | (148.79) | (9.5) |
| Dividends per share (in yen) | 50.00 | 50.00 | 0.00 | 0.0 |
| Net interest expense | 3,010 | 3,787 | 777 | 25.8 |
| Interest-bearing liabilities | 25 | 5 | (20) | (78.8) |
| ROE (%) | 12.9 | 6.0 | (6.9) | - |
| ROA (%) | 9.9 | 5.0 | (4.9) | - |
| Payout ratio (%) | 26.3 | 55.1 | 28.8 | - |
- 29 - -
Changes in Board Directors, Corporate Auditors and Executive Officers
(To be effective on June 25, 2008)
| 1. Nominees for Board Directors |
| Board Director | Shimpei Takeshita | ||
| Board Director | Toshio Maruyama | ||
| Board Director | Naoyuki Akikusa | ||
| Board Director | Yasushige Hagio | ||
| Board Director | Takashi Tokuno | ||
| Board Director | Hiroshi Tsukahara | ||
| Board Director | Yuichi Kurita | ||
| Board Director | Takao Tadokoro (to be newly elected) | ||
| (Managing Executive Officer) | |||
| Board Director | Hiroyasu Sawai (to be newly elected) | ||
| (Managing Executive Officer) |
Mr. Takeshita is to be elected as Chairman of the Board, and Mr. Maruyama is to be elected as Representative Board Director at the extraordinary board meeting to be held on June 25, 2008 after the 66th Shareholders Meeting of Advantest Corporation.
2. Nominees for Corporate Auditors
| Corporate Standing Auditor | Yuri Morita (to be newly elected) | |
| (Managing Executive Officer) | ||
| Corporate Auditor | Megumi Yamamuro |
3. Nominees for Executive Officers
| President and CEO | Toshio Maruyama | ||
| Senior Executive Officer | Takashi Tokuno | ||
| Managing Executive Officer | Hiroshi Tsukahara | ||
| Managing Executive Officer | Yuichi Kurita | ||
| Managing Executive Officer | Takao Tadokoro | ||
| Managing Executive Officer | Hiroyasu Sawai | ||
| Managing Executive Officer | Yoshiro Yagi | ||
| Executive Officer | Masao Shimizu | ||
| Executive Officer | Hideaki Imada | ||
| Executive Officer | Yasuhiro Kawata | ||
| Executive Officer | Takashi Sugiura | ||
| Executive Officer | Shinichiro Kuroe | ||
| Executive Officer | Takashi Sekino | ||
| Executive Officer | Hiroshi Nakamura | ||
| Executive Officer | Yoshiaki Yoshida | ||
| Executive Officer | Minoru Morishita | ||
| Executive Officer | Sae Bum Myung (to be newly elected) | ||
| Executive Officer | Soichi Tsukakoshi (to be newly elected) | ||
| Executive Officer | Haruo Matsuno (to be newly elected) | ||
| Executive Officer | Josef Schraetzenstaller (to be newly elected) | ||
| Executive Officer | R. Keith Lee (to be newly elected) |
- 30 - -
4. Resignation from Board Directors, Corporate Auditors and Executive Officers
Junji Nishiura, Board Director and Senior Executive Officer
--- to be elected as Adviser
Hiroji Agata, Board Director and Senior Executive Officer
- --- to be elected as Adviser
Takashi Takaya, Corporate Standing Auditor
--- to be elected as Adviser
Yuri Morita, Managing Executive Officer
- --- to be elected as Corporate Standing Auditor
Jiro Katoh, Managing Executive Officer --- to be elected as Adviser
Masao Araki, Executive Officer --- to be elected as Adviser
Akira Hatakeyama, Executive Officer --- to be elected as Adviser
5. Nominees for New Board Directors (Biography)
Takao Tadokoro (Date of Birth: May 29, 1949)
Mar. 1974 Graduated from Faculty of Engineering, Tokyo University of Science
Apr. 1974 Joined Advantest Corporation
Jun. 1997 General Manager, ATE SE Division, ATE Business Group
Jun. 1999 Board Director
Jun. 2003 Executive Officer
Apr. 2004 Senior Vice President, Sales and Marketing Group (Current Position)
Jun. 2005 Managing Executive Officer (Current Position)
Hiroyasu Sawai (Date of Birth: May 23, 1950)
Mar. 1974 Graduated from Faculty of Science, Osaka University
Apr. 1974 Joined Advantest Corporation
Jun. 1999 Board Director
Jun. 2001 Vice President, ATE Sales and Marketing Group
Jun. 2003 Executive Officer
Apr. 2003 Senior Vice President, SE Group (Current Position)
Jun. 2005 Managing Executive Officer (Current Position)
6. Nominees for New Corporate Auditors (Biography)
Yuri Morita (Date of Birth: July 15, 1947)
Mar. 1972 Graduated from Faculty of Law, The University of Tokyo
Sep. 1995 Joined Advantest Corporation
Apr. 1996 Manager, Legal Department (Current Position)
Jun. 2000 Board Director
Jun. 2003 Managing Executive Officer (Current Position)
Jun. 2003 Senior Vice President, Corporate Affairs Group (Current Position)
- 31 - -
7. Nominee for New Executive Officer (Biography)
Sae Bum Myung (Date of Birth: September 16, 1954)
Mar. 1989 Master’s Degree from Department of Engineering, Meiji University
Apr. 1989 Joined Advantest Corporation
Apr. 2004 Manager, International Sales Department 3, Sales and Marketing Group
Jun. 2006 Representative Director and President, Advantest Korea Co., Ltd.
(Current Position)
Soichi Tsukakoshi (Date of Birth: February 1, 1960)
Mar. 1983 Graduated from School of Science and Engineering, Tokyo Denki University
Apr. 1983 Joined Advantest Corporation
Apr. 2008 General Manager, Strategic Sales Division, Sales and Marketing Group
(Current Position)
Haruo Matsuno (Date of Birth: February 14, 1960)
Mar. 1984 Graduated from School of Law, Waseda University
Apr. 1984 Joined Advantest Corporation
Jun. 2006 Senior Vice President, Procurement Group
Jan. 2008 Senior Vice President, Production Group (Current Position)
Schraetzenstaller, Josef (Date of Birth: June 16, 1957)
Jun. 1984 Graduated from Electronic Engineering, The Munich University of Applied Sciences
Nov. 1996 Joined Advantest (Europe) GmbH
Oct. 1997 Prokurist
Apr. 2000 Managing Director, Advantest (Europe) GmbH (Current Position)
Lee, R. Keith (Date of Birth: December 15, 1955)
Mar. 1978 Graduated from Electrical Engineering, Auburn University
Aug. 1984 Joined Takeda Riken America, Inc. (now Advantest America, Inc.)
Jul. 1996 General Manager, Custom Design Engineering
Jan. 2004 President and CEO, Advantest America, Inc (Current Position)
Jan. 2004 President and CEO, Advantest America Corporation (Current Position)
- 32 -