Advantest Corporation (FY2008)
FY2008 Consolidated Financial Results
(Prepared in accordance with U.S. GAAP)
(Year ended March 31, 2009)
(Unaudited)
April 27, 2009
| Company name | : | Advantest Corporation |
| (URL http://www.advantest.co.jp/investors/en-index.shtml) | ||
| Stock exchanges on which shares are listed | : | First section of the Tokyo Stock Exchange |
| Stock code number | : | 6857 |
| Company representative | : | Toshio Maruyama, Representative Board Director, President and CEO |
| Contact person | : | Hiroshi Nakamura, Executive Officer and |
| Vice President, Corporate Administration Group | ||
| (03) 3214-7500 | ||
| Date of General Shareholders’ Meeting (as planned) | : | June 25, 2009 |
| Dividend Payable Date (as planned) | : | June 2, 2009 |
| Annual Report Filing Date (as planned) | : | June 26, 2009 |
| (Rounded to the nearest million yen) |
1. Consolidated Results of FY2008 (April 1, 2008 through March 31, 2009)
(1) Consolidated Financial Results
(% changes as compared with the previous fiscal year)
| Net sales | Operating income (loss) | Income (loss) before income taxes and equity in earnings (loss) of affiliated company | Net income (loss) | |||||
| Million yen | % increase (decrease) | Million yen | % increase (decrease) | Million yen | % increase (decrease) | Million yen | % increase (decrease) | |
| FY2008 | 76,652 | (58.1) | (49,457) | - | (52,761) | - | (74,902) | - |
| FY2007 | 182,767 | (22.2) | 22,716 | (60.0) | 23,533 | (61.5) | 16,550 | (53.5) |
Net income (loss) per share - basic | Net income (loss) per share - diluted | Net income (loss) to equity ratio | Ratio of income (loss) before taxes to total assets | Ratio of operating income (loss) to net sales | |||
| Yen | Yen | % | % | % | |||
| FY2008 | (419.09) | (419.09) | (35.9) | (21.1) | (64.5) | ||
| FY2007 | 90.72 | 90.57 | 6.0 | 7.1 | 12.4 | ||
(Note) Equity in earnings (loss) of affiliated company: FY2008 (Y) (147) million; FY2007 (Y) (94) million
(2) Consolidated Financial Position
| Total assets | Net assets | Equity-to-assets ratio | Net assets per share | |||||
| Million yen | Million yen | % | Yen | |||||
| FY2008 | 202,059 | 163,616 | 81.0 | 915.47 | ||||
| FY2007 | 298,684 | 254,184 | 85.1 | 1,422.20 | ||||
(3) Consolidated Cash Flows
Cash flows from operating activities | Cash flows from investing activities | Cash flows from financing activities | Cash and cash equivalents at end of year | |||||
| Million yen | Million yen | Million yen | Million yen | |||||
| FY2008 | 2,357 | (32,507) | (8,930) | 105,455 | ||||
| FY2007 | 24,166 | (16,322) | (46,770) | 147,348 | ||||
1
Advantest Corporation (FY2008)
2. Dividends
| Dividend per share | Total dividend paid (annual) | Payout ratio (consolidated) | Ratio of total amount of dividends to net assets (consolidated) | |||||
(Record Date) | First quarter end | Second quarter end | Third quarter end | Year end | Annual total | |||
| yen | yen | yen | yen | yen | Million yen | % | % | |
| FY2007 | - | 25.00 | - | 25.00 | 50.00 | 9,071 | 55.1 | 3.3 |
| FY2008 | - | 25.00 | - | 5.00 | 30.00 | 5,362 | - | 2.6 |
FY2009 (forecast) | - | - | - | - | - | - | - | - |
The dividend forecast for the fiscal year ending March 31, 2010 has not been decided. Advantest takes earnings forecast into consideration and intends to promptly disclose the relevant dividend forecast when such forecast becomes available.
3. Projected Results for FY2009 (April 1, 2009 through March 31, 2010)
Advantest’s business focuses on test systems for semiconductors, and relies heavily on the capital expenditure of semiconductor manufacturers, test houses and foundries. The capital expenditures of these companies are determined primarily by factors such as current or future trends in the demand for semiconductors. In the semiconductor-related market, DRAM and flash memory prices have shown signs of recovery, however trends for end-user products including automobiles, mobile phones, and consumer electronics remain uncertain and the possibility of significant change still lies ahead with M&A activity now underway in the semiconductor industry. Thus, Advantest refrains from making any predictions on the timing of the recovery of capital expenditures. Because of the great difficulty involved in forecasting earnings in such an operating environment, the earnings forecast for the fiscal year ending March 31, 2010 has not been presented. Advantest intends to promptly disclose the relevant earnings forecast when such disclosure becomes possible.
4. Others
| (1) | Material changes in subsidiaries during this fiscal year (changes in scope of consolidation resulting from changes in subsidiaries): None |
| (2) | Changes in accounting principles, procedures and the presentation of the consolidated financial statements |
| 1) | Changes based on revisions of accounting standard : Yes |
| 2) | Changes other than 1) above : None |
| (Note) | Please see (Note2) “Significant Accounting Policies” on page 17 for details. |
| (3) | Number of issued and outstanding shares (common stock) |
| 1) | Number of issued and outstanding stock at the end of each fiscal year (including treasury stock): FY2008 199,566,770 shares; FY2007 199,566,770 shares. |
| 2) | Number of treasury stock at the end of each fiscal year: FY2008 20,843,298 shares; FY2007 20,840,721 shares. |
| 3) | Average number of outstanding stock for each fiscal year: FY2008 178,724,884 shares; FY2007 182,418,821 shares. |
2
Advantest Corporation (FY2008)
(Reference) Selected Non-Consolidated Financial Data
(Prepared in accordance with JAPAN GAAP)
| 1. | Non-consolidated Results of FY2008 (April 1, 2008 through March 31, 2009) |
| (1) | Non-Consolidated Financial Results |
(% changes as compared with the previous fiscal year)
| Net sales | Operating income (loss) | Income (loss) before income taxes | Net income (loss) | |||||
| Million yen | % increase (decrease) | Million yen | % increase (decrease) | Million yen | % increase (decrease) | Million yen | % increase (decrease) | |
| FY2008 | 53,124 | (64.0) | (36,027) | - | (39,807) | - | (68,066) | - |
| FY2007 | 147,686 | (25.3) | 8,802 | (78.8) | 38,759 | (11.2) | 32,438 | 10.2 |
Net income (loss) per share - basic | Net income (loss) per share - diluted | |||
| Yen | Yen | |||
| FY2008 | (380.84) | - | ||
| FY2007 | 177.82 | 177.68 | ||
| (2) | Non-consolidated Financial Position |
| Total assets | Net assets | Equity-to-assets ratio | Net assets per share | |||||
| Million yen | Million yen | % | Yen | |||||
| FY2008 | 157,884 | 132,022 | 81.7 | 721.48 | ||||
| FY2007 | 247,145 | 209,264 | 83.4 | 1,153.40 | ||||
(Reference) Total equity : FY2008 (Y) 128,945 million; FY2007 (Y) 206,142 million.
Explanation on the Appropriate Use of Future Earnings Projections and Other Special Instructions
This document contains “forward-looking statements” that are based on Advantest’s current expectations, estimates and projections. These forward-looking statements are subject to known and unknown risks, uncertainties and other factors that may cause Advantest’s actual results, levels of activity, performance or achievements to be materially different from those expressed or implied by such forward-looking statements. These factors include: (i) changes in demand for the products and services produced and offered by Advantest’s customers, including semiconductors, communications services and electronic goods; (ii) circumstances relating to Advantest’s investment in technology, including its ability to timely develop products that meet the changing needs of semiconductor manufacturers and communications network equipment and components makers and service providers; (iii) significant changes in the competitive environment in the major markets where Advantest purchases materials, components and supplies for the production of its products or where its products are produced, distributed or sold; and (iv) changes in economic conditions, currency exchange rates or political stability in the major markets where Advantest procures materials, components and supplies for the production of its principal products or where its products are produced, distributed or sold. A discussion of these and other factors which may affect Advantest's actual results, levels of activity, performance or achievements is contained in the “Operating and Financial Review”, “Key Information - Risk Factors” and “Information on the Company” sections and elsewhere in Advantest's annual report on Form 20-F, which is on file with the United States Securities and Exchange Commission.
3
Advantest Corporation (FY2008)
1. Business Results
| (1) | Analysis of Business Results |
| 1) | Consolidated Financial Results of FY2008 (April 1, 2008 through March 31, 2009) |
| (in billion yen) | |||
| FY2007 | FY2008 | As compared to the previous fiscal year Increase (decrease) | |
| Orders input received | 162.2 | 50.1 | (69.1%) |
| Net sales | 182.8 | 76.7 | (58.1%) |
| Operating income (loss) | 22.7 | (49.5) | - |
| Income (loss) before income taxes and equity in earnings (loss) of affiliated company | 23.5 | (52.8) | - |
| Net income (loss) | 16.6 | (74.9) | - |
In the fiscal year ended March 31, 2009, the global economy saw a continued deceleration during the first half of the fiscal year due to the widening of the sub-prime loan crisis in the U.S., and the collapse of leading US investment bank Lehman Brothers in September 2008 triggered further rapid deterioration in the global economy.
In the semiconductor-related market, although excess inventory and price pressures persisted since last fiscal year, many hoped at the beginning of this fiscal year that desktop high performance PC replacements and Vista adoption, as well as demand for home electronics ahead of the Beijing Olympics, would drive an upturn in the market. However, demand fell short of expectations, and semiconductor manufacturers continued to take a cautious stance on capital expenditures, prolonging Advantest’s extremely difficult business environment.
Furthermore, ripple effects of the financial crisis in the U.S. spread to Europe and to emerging markets in Southeast Asia and elsewhere, which had previously been healthy. Decreasing demand for end-user products reinforced the defensive stance of semiconductor manufacturers, many of whom implemented production cuts and froze or postponed their capital expenditure programs starting from the second fiscal half.
In response to these dramatic environmental shifts, Advantest actively trimmed costs throughout the fiscal year, and also implemented emergency measures to improve profitability in November 2008. These measures include reduction of fixed costs such as, workforce cuts, and reduced compensation for executives and managers. However, the business climate continued to deteriorate once entering 2009 and Advantest responded with follow-on measures by reviewing underperforming product lines, acceptance of voluntary retirement from full-time employees and among others, aiming for further workforce optimization as its planned structural reforms.
However, orders input received and net sales declined steeply compared to the previous fiscal year, causing Advantest to recognize inventory valuation losses of (Y) 8.7 billion, restructuring costs of (Y) 5.1 billion, impairment loss on property, plant, and equipment of (Y) 13.8 billion and a valuation allowance on deferred tax assets of (Y) 45.1 billion.
Accordingly, orders input received decreased by 69.1% from the previous fiscal year to (Y) 50.1 billion, net sales decreased by 58.1% from the previous fiscal year to (Y) 76.7 billion, operating loss was (Y) 49.5 billion, loss before income taxes and equity in loss of affiliated company was (Y) 52.8 billion, and net loss was (Y) 74.9 billion. Furthermore, Advantest’s overseas sales ratio fell to 67.7%, compared to 69.3% in the previous fiscal year.
4
Advantest Corporation (FY2008)
Conditions of business by segment are described below.
<Semiconductor and Component Test System Segment>
| (in billion yen) | |||
| FY2007 | FY2008 | As compared to the previous fiscal year Increase (decrease) | |
| Orders input received | 115.7 | 26.1 | (77.4%) |
| Net sales | 131.6 | 49.2 | (62.6%) |
| Operating income (loss) | 23.3 | (28.9) | - |
In the Semiconductor and Component Test Systems segment, the semiconductor downturn combined with global economic fears sharply curbed major manufacturers’ appetite for capital expenditures. Accordingly, Advantest’s results for both memory and non-memory test systems remained weak.
In the memory arena, the much-anticipated transition to DDR3-DRAM semiconductors for high-performance computers was delayed, while oversupply continued to hold down prices of DDR2-DRAM, and semiconductor manufacturers restrained investment in DRAM test systems. Demand for flash memory semiconductors were also weak caused by oversupply, and in addition, falling sales of mobile phones placed pressure on prices, causing capital expenditures in flash memory test systems to remain weak.
In the non-memory sector, strong sales of notebooks and other mobile PCs were recorded in the first half of the fiscal year, and semiconductor manufacturers in related fields showed signs of renewing their capital expenditures to increase production. However, the demand associated with the Beijing Olympics fell short of expectations and a recovery in capital expenditures did not occur. Moreover, the worldwide decline in consumer confidence suppressed demand for products using semiconductors, leading to a continued weak demand in test systems for consumer, automotive, and LCD driver ICs.
As a result of the above, orders input received in the Semiconductor and Component Test System segment was (Y) 26.1 billion, a 77.4% decrease in comparison to the previous fiscal year. Net sales were (Y) 49.2 billion, 62.6% decrease in comparison to the previous fiscal year, and operating loss was (Y) 28.9 billion.
<Mechatronics System Segment>
| (in billion yen) | |||
| FY2007 | FY2008 | As compared to the previous fiscal year Increase (decrease) | |
| Orders input received | 30.3 | 9.1 | (69.9%) |
| Net sales | 34.9 | 14.4 | (58.8%) |
| Operating income (loss) | 3.3 | (11.9) | - |
The weak results for memory and non-memory test systems also weakened demand for test handlers and device interface products, which are used together with test systems. In particular, the downturn in the DRAM market produced a dramatic decline in demand for back-end test handlers.
As a result of the above, orders input received in the Mechatronics System segment was (Y) 9.1 billion (a 69.9% decrease in comparison to the previous fiscal year). Net sales were (Y) 14.4 billion (a 58.8% decrease in comparison to the previous fiscal year) and operating loss was (Y) 11.9 billion.
5
Advantest Corporation (FY2008)
<Services, Support and Others Segment>
| (in billion yen) | |||
| FY2007 | FY2008 | As compared to the previous fiscal year Increase (decrease) | |
| Orders input received | 19.3 | 15.6 | (19.1%) |
| Net sales | 19.3 | 15.8 | (18.2%) |
| Operating income (loss) | 3.2 | (1.1) | - |
Owing to a decline in demand for maintenance services, and reflecting the weak performance of the semiconductor market, resulting from the depressed semiconductor related market, orders input received in the Services, Support and Other segment was (Y) 15.6 billion, a 19.1% decline in comparison to the previous fiscal year. Net sales were (Y) 15.8 billion (a 18.2% decrease in comparison to the previous fiscal year) and operating loss was (Y) 1.1 billion.
2) Prospects for the Upcoming Fiscal Year
Despite economic and employment stimulus packages recently announced by many countries to counter the global economic slowdown, the timing of the recovery remains uncertain and visibility is still limited.
In the semiconductor-related market, DRAM and flash memory prices have shown signs of recovery, however trends in demand for end-user products including automobiles, mobile phones, and consumer electronics remain uncertain and the possibility of significant change still lies ahead with M&A activity now underway in the semiconductor industry. Thus, Advantest refrains from making any predictions on the timing of the recovery of capital expenditures.
In this operating environment, Advantest will focus on deriving efficiency gains in its research and development and manufacturing processes by consolidating subsidiaries, reduction of fixed costs through the consolidation and sale of business offices and other facilities, improvement of the productivity of in-house processes, reinforcement of the Advantest Group’s sales structure, and development of in new products and entry into new businesses.
(2) Financial Condition
1) Assets, Liabilities and Net Assets
Total assets at the end of FY2008 was (Y) 202.1 billion, a decrease of (Y) 96.6 billion compared to the previous fiscal year, due primarily to a decrease of (Y) 41.9 billion in cash and cash equivalents, a decrease of (Y) 19.7 billion in trade receivables, a decrease of (Y) 18.5 billion in deferred tax assets and an increase of (Y) 25.1 billion in short-term investments. The amount of total liabilities was (Y) 38.4 billion, a decrease of (Y) 6.1 billion compared to the end of the previous fiscal year, due primarily to a decrease of (Y) 7.0 billion in trade accounts payable. Shareholders’ equity was (Y) 163.6 billion. Equity to assets ratio was 81.0%, a decrease of 4.1 percentage point compared to the previous fiscal year.
2) Cash Flow Condition
Cash and cash equivalents held at the end of FY2008 were (Y) 105.5 billion, a decrease of (Y) 41.9 billion from previous fiscal year.
Significant cash flows during this fiscal year and their causes are described below.
Net cash provided by operating activities was (Y) 2.4 billion. This amount was primarily attributable to a decrease of (Y) 19.3 billion in trade receivables, a decrease of (Y) 17.8 billion in inventories and an adjustment of noncash items such as depreciation and amortization, despite the net loss being (Y) 74.9 billion.
6
Advantest Corporation (FY2008)
Net cash used in investing activities was (Y) 32.5 billion. This amount was primarily attributable to expenditures in short-term investments in the amount of (Y) 26.2 billion and purchases of property, plant and equipment in the amount of (Y) 4.9 billion.
Net cash used in financing activities was (Y) 8.9 billion. This amount was primarily attributable to dividend payments.
The following table illustrates the historical movements of certain cash flow indexes:
| FY2004 | FY2005 | FY2006 | FY2007 | FY2008 | |
| Stockholders’ equity ratio (%) | 69.7 | 73.5 | 80.5 | 85.1 | 81.0 |
| Stockholders’ equity ratio based on market prices (%) | 256.0 | 373.3 | 267.9 | 154.7 | 129.2 |
| Debt to annual cash flow ratio (%) | 22.2 | 0.1 | 0.1 | 0.0 | 0.2 |
| Interest coverage ratio (times) | 202.1 | 148.5 | 3,094.7 | 1,839.4 | 195.9 |
Stockholders’ equity ratio: stockholders’ equity / total assets
Stockholders’ equity ratio based on market prices: market capitalization / total assets
Debt to annual cash flow ratio: interest-bearing liabilities / operating cash flows
Interest coverage ratio: operating cash flows / interest payments
(Notes) 1. These indexes are calculated using U.S. GAAP figures.
2. Market capitalization is calculated based on issued and outstanding shares excluding treasury stock.
3. Operating cash flows are the cash flows provided by operating activities on the consolidated statements of cash flows.
4. Interest-bearing liabilities include all liabilities on the consolidated balance sheets that incur interest.
(3) Basic Policy on Distribution of Profits and Distribution for FY2008 and Distribution Forecast for FY2009
Based on the premise that long-term and continued growth in corporate value is fundamental to the creation of shareholder value, Advantest deems the consistent distribution of profits to be the most important management priority. Accordingly, Advantest engages in active distribution of profits based on consolidated business performance.
With respect to the distribution of retained earnings, Advantest makes payout decisions after taking into consideration consolidated business performance, financial conditions, as well as the need for strategic investment for mid-to-long-term business development. While aiming to make consistent distributions, because of the fluctuation of the market in which it operates, Advantest makes dividend payouts following a target payout ratio of 20% or more.
Retained earnings are devoted to research and development, streamlining efforts, overseas expansion, investments in new businesses and resources for M&A activities, with an aim to strengthen Advantest’s business position and enhance its corporate value.
In order to maintain capital strategies responsive to changes in the operating environment, Advantest will repurchase its own shares from time to time through taking into account factors such as trends in stock price, capital efficiency and cash flow.
In this fiscal year, Advantest decided, pursuant to the above profit distribution policy, to distribute a year end dividend of (Y) 5 consistent with the revised forecast announced on February 25, 2009, with a payment date of June 2, 2009. Since Advantest paid an interim dividend of (Y) 25 on December 1, 2008, the total dividend per share for the fiscal year will be (Y) 30.
Advantest has elected not to publish a dividend forecast for fiscal 2009 at this time, due to the Company’s view that its results will take time to recover, as explicated in the prospects section above. Payout decisions will take future results into consideration and will be announced when they are available.
7
Advantest Corporation (FY2008)
2. Organization of the Advantest Group
The following diagram shows the business relationships among the major affiliated companies of the Advantest Group.
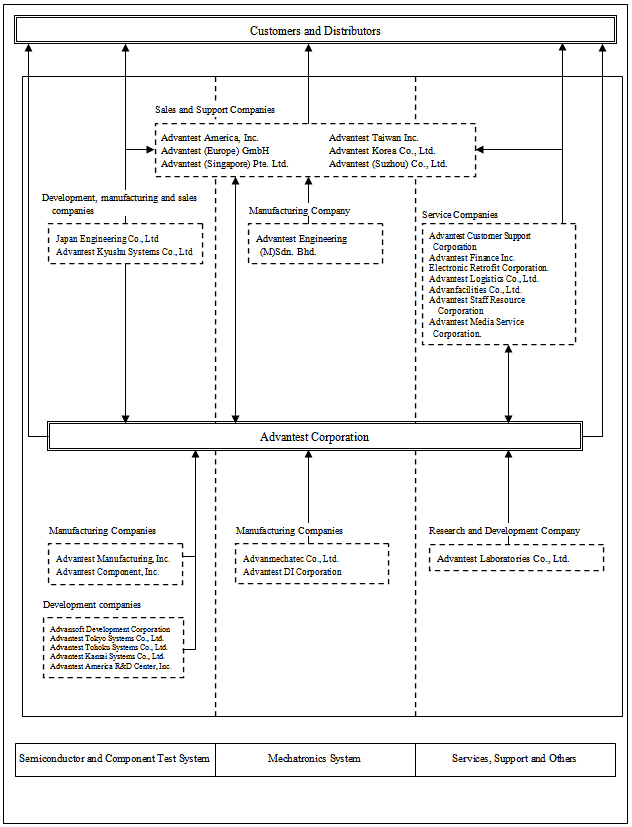
There are 13 other consolidated subsidiaries and 1 equity method affiliate in addition to those mentioned in the above diagram.
Consolidated subsidiaries (22 domestic; 17 overseas; 39 total) Equity method affiliate (1 domestic)
8
Advantest Corporation (FY2008)
3. Management Policy
(1) Advantest’s Basic Management Policy
Advantest has established a corporate vision of “Technology Support on the Leading Edge”, and its corporate mission of “Quest for the Essence”. Guided by these principles, Advantest respects each of its stakeholders, strives to maintain harmony with society, and aims for the sustained development of the Company and the improvement of corporate value while contributing to the goal of a sustainable society.
(2) Target Financial Index
Advantest applies the “AVA” (Advantest Value Added), a financial index incorporating the concept of EVA®(Economic Value Added) *, as a significant management indicator, along with profit margin, ROE and cash flows. Specifically, Advantest will set the minimum return-on-investment ratio (“hurdle rate”) for evaluating AVA at 8% and a mid-term target at 12% or more with an aim to further enhance corporate value and shareholder value.
*”EVA®” is a registered trademark of Stern Stewart & Co.
(3) Mid-and-Long-term Business Strategy and Issues to be Addressed
While maintaining “Measurements” as our core competence in mid-and-long term, Advantest intends to improve its corporate value by establishing a management and financial structure that responds timely to changes in the global market, and by aiming to increase market share by introducing fine products that will inspire the market demands of the next generation. To achieve these objectives, Advantest promotes to further strengthen its product development operations and improve production efficiency by focusing on certain businesses, while strengthening its overseas operations and support system in the U.S., Europe and Asia.
Confronting deepening capital spending cuts by semiconductor manufacturers and the likely prolongation of Advantest’s weakened operating environment, the Company has announced the following plans for structural reforms to strengthen management practices, workforce optimization targeted to reinforce management structure, the merger of four manufacturing subsidiaries into one, the merger likewise of four software subsidiaries into one, ongoing review of underperforming business segments, exploration of and investment into new businesses, payroll cost reductions, and the consolidation and sale of facilities.
Through “Activate 21,” a corporate initiative launched in October 2005, Advantest has pursued greater efficiency, cost savings, and financial health from a global perspective. The initiative concluded in March 2009, with positive results including productivity improvements from the just-in-time (“JIT”) production system, inventory optimization, and standardization of design specifications leading to enhanced research and development efficiency. The Company’s new corporate initiative, starting from fiscal 2009, will incorporate detailed measures and goals after the structural reforms that Advantest is currently carrying out.
9
Advantest Corporation (FY2008)
4. Consolidated Financial Statements and Other Information
(1) Consolidated Balance Sheets (Unaudited)
| Yen (Millions) | ||||||||
| Assets | March 31, 2008 | March 31, 2009 | ||||||
| Current assets: | ||||||||
| Cash and cash equivalents | ¥ | 147,348 | 105,455 | |||||
| Short-term investments | — | 25,114 | ||||||
| Trade receivables, net | 30,124 | 10,415 | ||||||
| Inventories | 26,823 | 9,737 | ||||||
| Deferred tax assets | 12,678 | 653 | ||||||
| Other current assets | 6,474 | 5,933 | ||||||
| Total current assets | 223,447 | 157,307 | ||||||
| Investment securities | 9,754 | 6,679 | ||||||
| Property, plant and equipment, net | 50,765 | 33,974 | ||||||
| Deferred tax assets | 6,488 | 30 | ||||||
| Intangible assets, net | 3,476 | 1,470 | ||||||
| Other assets | 4,754 | 2,599 | ||||||
| Total assets | ¥ | 298,684 | 202,059 | |||||
10
Advantest Corporation (FY2008)
| Yen (Millions) | ||||||||
| Liabilities and Stockholders’ Equity | March 31, 2008 | March 31, 2009 | ||||||
| Current liabilities: | ||||||||
| Trade accounts payable | 11,765 | 4,767 | ||||||
| Other accounts payable | 2,458 | 6,409 | ||||||
| Accrued expenses | 10,940 | 6,043 | ||||||
| Accrued warranty expenses | 3,143 | 2,811 | ||||||
| Other current liabilities | 3,389 | 1,507 | ||||||
| Total current liabilities | 31,695 | 21,537 | ||||||
| Accrued pension and severance cost | 10,711 | 13,996 | ||||||
| Other liabilities | 2,094 | 2,910 | ||||||
| Total liabilities | 44,500 | 38,443 | ||||||
| Commitments and contingent liabilities | ||||||||
| Stockholders’ equity: | ||||||||
| Common stock | 32,363 | 32,363 | ||||||
| Capital surplus | 40,072 | 40,320 | ||||||
| Retained earnings | 278,689 | 194,848 | ||||||
| Accumulated other comprehensive income (loss) | (7,615 | ) | (14,587 | ) | ||||
| Treasury stock | (89,325 | ) | (89,328 | ) | ||||
| Total stockholders’ equity | 254,184 | 163,616 | ||||||
| Total liabilities and stockholders’ equity | ¥ | 298,684 | 202,059 | |||||
11
Advantest Corporation (FY2008)
(2) Consolidated Statements of Operations (Unaudited)
| Yen (Millions) | ||||||||
| Year ended | Year ended | |||||||
| March 31, 2008 | March 31, 2009 | |||||||
| Net sales | ¥ | 182,767 | 76,652 | |||||
| Cost of sales | 88,837 | 56,837 | ||||||
| Gross profit | 93,930 | 19,815 | ||||||
| Research and development expenses | 30,507 | 23,713 | ||||||
| Selling, general and administrative expenses | 40,707 | 31,771 | ||||||
| Restructuring and impairment charges | — | 13,788 | ||||||
| Operating income (loss) | 22,716 | (49,457 | ) | |||||
| Other income (expense): | ||||||||
| Interest and dividends income | 3,799 | 2,157 | ||||||
| Interest expense | (12 | ) | (11 | ) | ||||
| Impairment losses on investment securities | (1,331 | ) | (3,510 | ) | ||||
| Other, net | (1,639 | ) | (1,940 | ) | ||||
| Total other income (expense) | 817 | (3,304 | ) | |||||
| Income (loss) before income taxes and equity | ||||||||
| in earnings (loss) of affiliated company | 23,533 | (52,761 | ) | |||||
| Income taxes | 6,889 | 21,994 | ||||||
| Equity in earnings (loss) of affiliated company | (94 | ) | (147 | ) | ||||
| Net income (loss) | ¥ | 16,550 | (74,902 | ) | ||||
| Yen | ||||||||
| Year ended | Year ended | |||||||
| March 31, 2008 | March 31, 2009 | |||||||
| Net income (loss) per share: | ||||||||
| Basic | ¥ | 90.72 | (419.09 | ) | ||||
| Diluted | 90.57 | (419.09 | ) | |||||
12
Advantest Corporation (FY2008)
(3) Consolidated Statements of Stockholders’ Equity (Unaudited)
| Yen (Millions) | ||||||||
| Year ended | Year ended | |||||||
| March 31, 2008 | March 31, 2009 | |||||||
| Common stock | ||||||||
| Balance at beginning of year | 32,363 | 32,363 | ||||||
| Changes in the year | ||||||||
| Total changes in the year | — | — | ||||||
| Balance at end of year | 32,363 | 32,363 | ||||||
| Capital surplus | ||||||||
| Balance at beginning of year | 39,256 | 40,072 | ||||||
| Changes in the year | ||||||||
| Stock option compensation expense | 858 | 248 | ||||||
| Exercise of stock option | (42 | ) | — | |||||
| Total changes in the year | 816 | 248 | ||||||
| Balance at end of year | 40,072 | 40,320 | ||||||
| Retained earnings | ||||||||
| Balance at beginning of year | 273,082 | 278,689 | ||||||
| Changes in the year | ||||||||
| Net income(loss) | 16,550 | (74,902 | ) | |||||
| Cash dividends | (10,702 | ) | (8,936 | ) | ||||
| Sale of treasury stock | (241 | ) | (3 | ) | ||||
| Total changes in the year | 5,607 | (83,841 | ) | |||||
| Balance at end of year | 278,689 | 194,848 | ||||||
| Accumulated other comprehensive income (loss) | ||||||||
| Balance at beginning of year | 3,652 | (7,615 | ) | |||||
| Changes in the year | ||||||||
| Other comprehensive income (loss), net of tax | (11,267 | ) | (6,972 | ) | ||||
| Total changes in the year | (11,267 | ) | (6,972 | ) | ||||
| Balance at end of year | (7,615 | ) | (14,587 | ) | ||||
| Treasury stock | ||||||||
| Balance at beginning of year | (53,556 | ) | (89,325 | ) | ||||
| Changes in the year | ||||||||
| Exercise of stock option | 793 | — | ||||||
| Repurchase of treasury stock | (36,564 | ) | (7 | ) | ||||
| Sale of treasury stock | 2 | 4 | ||||||
| Total changes in the year | (35,769 | ) | (3 | ) | ||||
| Balance at end of year | (89,325 | ) | (89,328 | ) | ||||
13
Advantest Corporation (FY2008)
| Yen (Millions) | ||||||||
| Year ended | Year ended | |||||||
| March 31, 2008 | March 31, 2009 | |||||||
| Total stockholders' equity | ||||||||
| Balance at beginning of year | 294,797 | 254,184 | ||||||
| Changes in the year | ||||||||
| Net income (loss) | 16,550 | (74,902 | ) | |||||
| Other comprehensive income (loss), net of tax | (11,267 | ) | (6,972 | ) | ||||
| Cash dividends | (10,702 | ) | (8,936 | ) | ||||
| Stock option compensation expense | 858 | 248 | ||||||
| Exercise of stock option | 751 | — | ||||||
| Repurchase of treasury stock | (36,564 | ) | (7 | ) | ||||
| Sale of treasury stock | (239 | ) | 1 | |||||
| Total changes in the year | (40,613 | ) | (90,568 | ) | ||||
| Balance at end of year | 254,184 | 163,616 | ||||||
| Yen (Millions) | ||||||||
| Year ended | Year ended | |||||||
| March 31, 2008 | March 31, 2009 | |||||||
| Comprehensive income (loss) | ||||||||
| Net income (loss) | 16,550 | (74,902 | ) | |||||
| Other comprehensive income (loss), net of tax | ||||||||
| Foreign currency translation adjustments | (6,845 | ) | (1,793 | ) | ||||
| Net unrealized gains (losses) on investment securities | (2,060 | ) | (244 | ) | ||||
| Pension related adjustments | (2,362 | ) | (4,935 | ) | ||||
| Total other comprehensive income (loss) | (11,267 | ) | (6,972 | ) | ||||
| Comprehensive income (loss) in the year | 5,283 | (81,874 | ) | |||||
14
Advantest Corporation (FY2008)
(4) Consolidated Statement of Cash Flows (Unaudited)
| Yen (Millions) | ||||||||
| Year ended | Year ended | |||||||
| March 31, 2008 | March 31, 2009 | |||||||
Cash flows from operating activities: | ||||||||
| Net income (loss) | ¥ | 16,550 | (74,902 | ) | ||||
| Adjustments to reconcile net income (loss) to net cash provided by | ||||||||
| operating activities: | ||||||||
| Depreciation and amortization | 8,836 | 8,719 | ||||||
| Deferred income taxes | (4,449 | ) | 20,205 | |||||
| Stock option compensation expense | 858 | 248 | ||||||
| Restructuring and impairment charges | — | 18,930 | ||||||
| Impairment losses on investment securities | 1,331 | 3,510 | ||||||
| Changes in assets and liabilities: | ||||||||
| Trade receivables | 22,666 | 19,323 | ||||||
| Inventories | 4,877 | 17,816 | ||||||
| Trade accounts payable | (16,239 | ) | (6,879 | ) | ||||
| Income taxes payable | (8,657 | ) | (371 | ) | ||||
| Accrued expenses | (2,527 | ) | (4,893 | ) | ||||
| Accrued warranty expenses | (986 | ) | (617 | ) | ||||
| Accrued pension and severance cost | (1,480 | ) | (1,605 | ) | ||||
| Other | 3,386 | 2,873 | ||||||
| Net cash provided by operating activities | 24,166 | 2,357 | ||||||
| Cash flows from investing activities: | ||||||||
| (Increase) decrease in short-term investments | — | (26,210 | ) | |||||
| Proceeds from sale of non-marketable investment securities | 56 | 36 | ||||||
| Purchase of available-for-sales securities | (3,002 | ) | — | |||||
| Purchase of non-marketable investment securities | (233 | ) | (911 | ) | ||||
| Investment in equity method investee | (1,035 | ) | — | |||||
| Proceeds from sale of property, plant and equipment | 1,015 | 390 | ||||||
| Purchases of intangible assets | (1,017 | ) | (645 | ) | ||||
| Purchases of property, plant and equipment | (11,994 | ) | (4,909 | ) | ||||
| Other | (112 | ) | (258 | ) | ||||
Net cash used in investing activities | (16,322 | ) | (32,507 | ) | ||||
Cash flows from financing activities: | ||||||||
| Principal payments on long-term debt | (10 | ) | — | |||||
| Proceeds from sale of treasury stock | 508 | 2 | ||||||
| Payments to acquire treasury stock | (36,564 | ) | (6 | ) | ||||
| Dividends paid | (10,695 | ) | (8,924 | ) | ||||
| Other | (9 | ) | (2 | ) | ||||
| Net cash used in financing activities | (46,770 | ) | (8,930 | ) | ||||
| Net effect of exchange rate changes on cash and cash equivalents | (10,121 | ) | (2,813 | ) | ||||
| Net change in cash and cash equivalents | (49,047 | ) | (41,893 | ) | ||||
| Cash and cash equivalents at beginning of year | 196,395 | 147,348 | ||||||
| Cash and cash equivalents at end of year | ¥ | 147,348 | 105,455 | |||||
(5) Notes on Preconditions to Going Concerns: None
15
Advantest Corporation (FY2008)
(6) Notes to the Consolidated Financial Statements
(Note 1) Accounting Principles, Procedures and the Presentation of the Consolidated
Financial Statements
(a) Terminology, Form and Method of Preparation of the Consolidated Financial Statements
Advantest Corporation prepares these consolidated financial statements in accordance with the accounting principles, procedures, terminology, form and method of preparation required in the United States of America in connection with its issuance of American Depository Shares as established under Accounting Research Bulletins (“ARB”), Accounting Principles Board (“APB”) statements, Statements of Financial Accounting Standards (“SFAS”) and other relevant sources (collectively “U.S. GAAP”). However, Advantest Corporation and its consolidated subsidiaries prepare their unconsolidated financial statements in accordance with accounting principles generally accepted in the country of their domicile. Certain adjustments and reclassifications have been incorporated in the accompanying non-consolidated financial statements to present them in conformity with accounting principles generally accepted in the United States of America.
(b) Preparation of Consolidated Financial Statements and Registration with the U.S. Securities and Exchange Commission
Advantest Corporation became listed on the New York Stock Exchange on September 17, 2001 (local time) by means of an issuance of American Depository Shares, and has been filing a Form 20-F (equivalent to the Annual Securities Report in Japan) with the U.S. Securities and Exchange Commission since FY2001. Advantest prepares the consolidated financial statements in its Form 20-F in accordance with U.S. GAAP.
(c) Scope of Consolidation and Application of the Equity Method
Advantest’s consolidated financial statements include financial statements of Advantest Corporation and its majority-owned subsidiaries. With respect to variable interest entities as provided in the U.S. Financial Accounting Standards Board’s Interpretation No. 46 (Revised December 2003) – “Consolidation of Variable Interest Entities”, Advantest does not have any such entity to be included in its consolidated financial statements. All significant intercompany balances and transactions have been eliminated in consolidation.
The following table sets forth the number of consolidated subsidiaries and equity method affiliates of Advantest:
| FY 2007 | FY 2008 | Increase (decrease) | |
| (As of March 31, 2008) | (As of March 31, 2009) | ||
| Domestic | 23 | 22 | (1) |
| Overseas | 17 | 17 | 0 |
| Consolidated subsidiaries | 40 | 39 | (1) |
| Equity method affiliates | 1 | 1 | 0 |
| Total | 41 | 40 | (1) |
16
Advantest Corporation (FY2008)
Changes in the scope of consolidation:
Excluded (1): Advantest Information Systems, Inc. *
*Advantest Information Systems, Inc. was merged into Advantest Corporation on August 1, 2008.
(Note 2) Significant Accounting Policies
(Accounting Changes)
In September 2006, the Financial Accounting Standards Board (“FASB”) issued SFAS No. 157, “Fair Value Measurements” (“SFAS157”) which defines fair value, establishes a framework for measuring fair value, and enhances fair value measurement disclosure. SFAS 157 does not expand the use of fair value to any new circumstances, but does require additional disclosures in both annual and quarterly reports. Advantest adopted SFAS 157 and its related amendments for financial assets and liabilities on April 1, 2008. The adoption of SFAS 157 did not have a significant impact on its consolidated results of operations and financial condition. SFAS 157 will be effective for non-financial assets and liabilities in financial statements issued for fiscal years beginning after November 15, 2008 and is required to be adopted by Advantest in the first quarter beginning April 1, 2009.
There are no other changes pertaining to accounting policies other than as mentioned above from the fiscal year 2007 Annual Report which was submitted on June 26, 2008.
17
Advantest Corporation (FY2008)
(Note3) Segment Information
1. Business Segment Information
| Yen (Millions) | ||||||||||||||||||||
| Year ended March 31, 2008 | ||||||||||||||||||||
| Semiconductor and Component Test System Business | Mechatronics System Business | Services, Support and Others | Elimination and Corporate | Total | ||||||||||||||||
| Net sales to unaffiliated customers | 128,779 | 34,644 | 19,344 | - | 182,767 | |||||||||||||||
| Inter-segment sales | 2,829 | 300 | - | (3,129 | ) | - | ||||||||||||||
| Sales | 131,608 | 34,944 | 19,344 | (3,129 | ) | 182,767 | ||||||||||||||
| Depreciation and amortization | 3,561 | 1,261 | 3,324 | 690 | 8,836 | |||||||||||||||
| Operating income (loss) before stock option compensation expense | 23,263 | 3,266 | 3,177 | (6,132 | ) | 23,574 | ||||||||||||||
| Adjustment: | ||||||||||||||||||||
| Stock option compensation expense | 858 | |||||||||||||||||||
| Operating income (loss) | 22,716 | |||||||||||||||||||
| Expenditures for additions to long-lived assets | 7,814 | 2,260 | 2,749 | 1,260 | 14,083 | |||||||||||||||
| Total assets | 63,570 | 18,511 | 14,493 | 202,110 | 298,684 | |||||||||||||||
| Yen (Millions) | ||||||||||||||||||||
| Year ended March 31, 2009 | ||||||||||||||||||||
| Semiconductor and Component Test System Business | Mechatronics System Business | Services, Support and Others | Elimination and Corporate | Total | ||||||||||||||||
Net sales to unaffiliated customers | 48,629 | 12,208 | 15,815 | - | 76,652 | |||||||||||||||
Inter-segment sales | 587 | 2,180 | - | (2,767 | ) | - | ||||||||||||||
| Sales | 49,216 | 14,388 | 15,815 | (2,767 | ) | 76,652 | ||||||||||||||
| Depreciation and amortization | 3,893 | 1,813 | 2,668 | 345 | 8,719 | |||||||||||||||
| Operating income (loss) before stock option compensation expense | (28,914 | ) | (11,865 | ) | (1,099 | ) | (7,331 | ) | (49,209 | ) | ||||||||||
| Adjustment: | ||||||||||||||||||||
| Stock option compensation expense | 248 | |||||||||||||||||||
| Operating income (loss) | (49,457 | ) | ||||||||||||||||||
| Expenditures for additions to long-lived assets | 1,657 | 1,249 | 1,606 | 96 | 4,608 | |||||||||||||||
| Total assets | 29,449 | 11,017 | 10,773 | 150,820 | 202,059 | |||||||||||||||
(Notes)
1. Adjustments to operating income (loss) in Corporate principally represent corporate general and administrative expenses and research and development expenses related to fundamental research activities that are not allocated to operating segments.
2. Advantest uses the operating income (loss) before stock option compensation expense for management's analysis of business segment results.
3. Total assets included in Corporate primarily consist of cash and cash equivalents assets for general corporate use and assets used for fundamental research activities, which are not allocated to reportable segments.
18
Advantest Corporation (FY2008)
| Yen (Millions) | ||||
Year ended March 31, 2008 | ||||
| Japan | 56,032 | |||
| Americas | 9,616 | |||
| Europe | 8,859 | |||
| Asia | 108,260 | |||
| Total | 182,767 | |||
| Yen (Millions) | ||||
Year ended March 31, 2009 | ||||
| Japan | 24,734 | |||
| Americas | 11,759 | |||
| Europe | 2,844 | |||
| Asia | 37,315 | |||
| Total | 76,652 | |||
(Notes)
| 1. | Net sales to unaffiliated customers are based on the customer’s location. |
| 2. | Each of the segments includes primarily the following countries or regions: |
| (1) Americas | U.S.A. and Republic of Costa Rica, etc. |
| (2) Europe | Israel, Ireland and Germany, etc. |
| (3) Asia | South Korea, Taiwan and China, etc. |
19
Advantest Corporation (FY2008)
3. Segment Information by Geographic Area
| Yen (Millions) | ||||||||||||||||||||||||
Year ended March 31, 2008 | ||||||||||||||||||||||||
| Japan | Americas | Europe | Asia | Elimination and Corporate | Total | |||||||||||||||||||
Net sales to unaffiliated customers | 101,113 | 9,143 | 15,751 | 56,760 | - | 182,767 | ||||||||||||||||||
Inter-segment sales | 61,984 | 4,145 | 1,223 | 6,601 | (73,954 | ) | - | |||||||||||||||||
| Sales | 163,097 | 13,288 | 16,974 | 63,361 | (73,954 | ) | 182,767 | |||||||||||||||||
| Operating income (loss) | 18,071 | 204 | 741 | 10,393 | (6,693 | ) | 22,716 | |||||||||||||||||
| Total assets | 134,418 | 24,962 | 10,986 | 35,547 | 92,771 | 298,684 | ||||||||||||||||||
| Yen (Millions) | ||||||||||||||||||||||||
Year ended March 31, 2009 | ||||||||||||||||||||||||
| Japan | Americas | Europe | Asia | Elimination and Corporate | Total | |||||||||||||||||||
Net sales to unaffiliated customers | 42,052 | 20,464 | 2,702 | 11,434 | - | 76,652 | ||||||||||||||||||
Inter-segment sales | 22,923 | 3,299 | 1,446 | 4,727 | (32,395 | ) | - | |||||||||||||||||
| Sales | 64,975 | 23,763 | 4,148 | 16,161 | (32,395 | ) | 76,652 | |||||||||||||||||
| Operating income (loss) | (44,860 | ) | 1,894 | (1,677 | ) | 1,996 | (6,810 | ) | (49,457 | ) | ||||||||||||||
| Total assets | 78,830 | 25,110 | 8,135 | 29,625 | 60,359 | 202,059 | ||||||||||||||||||
(Notes)
1. Adjustments to operating income (loss) in Corporate principally represent corporate general and administrative expenses and research and development expenses related to fundamental research activities that are not allocated to corporate general administrative expense and segment by geographic area. Stock option expense of (Y) 858 million and (Y) 248 million for FY2007 and FY2008, respectively, are included in Corporate operating expenses.
2. Total assets included in Corporate primarily consist of the parent company’s cash and cash equivalents, assets for general corporate use and assets used for fundamental research activities.
20
Advantest Corporation (FY2008)
(Note 4) Per Share information
Basic and diluted net income per share were computed as follows:
| Yen (millions) except per share data | ||||||||
| FY2007 | FY2008 | |||||||
| Numerator: | ||||||||
| Net income (loss) | 16,550 | (74,902 | ) | |||||
| Denominator | ||||||||
Basic weighted average shares of common stock outstanding | 182,418,821 | 178,724,884 | ||||||
Dilutive effect of exercise of stock options | 305,161 | - | ||||||
Diluted weighted average shares of common stock outstanding | 182,723,982 | 178,724,884 | ||||||
| Basic net income (loss) per share | 90.72 | (419.09 | ) | |||||
| Diluted net income (loss) per share | 90.57 | (419.09 | ) | |||||
As of March 31, 2008 and March 31, 2009, Advantest held 2,309,980 shares and 3,938,980 shares respectively, of issued stock options that are excluded from the calculation of net income per share (diluted) because they do not currently have a dilutive effect.
(Omission of Disclosure)
For purpose of annual release in Japan, notes for lease transactions, related party transactions, income taxes, financial instruments, securities, derivative transactions, accrued pension and severance costs, stock options, among others, have not been disclosed because such disclosure in this consolidated financial results is not considered significant for this presentation in Japan.
21
(All non-consolidated financial information has been prepared in accordance
with accounting principles generally accepted in Japan.)
Advantest Corporation (FY2008)
| 5. Non-Consolidated Financial Statements | |||||||
| (1) Non-Consolidated Balance Sheets (Unaudited) | |||||||
| Yen (Millions) | ||||||||
| March 31, 2008 | March 31, 2009 | |||||||
| Assets | ||||||||
| Current assets | ||||||||
| Cash and deposits | ¥ | 99,745 | 63,857 | |||||
| Trade notes receivables | 1,230 | 40 | ||||||
| Accounts receivable | 25,676 | 7,714 | ||||||
| Short-term investments | — | 17,300 | ||||||
| Finished goods | 5,093 | — | ||||||
| Merchandises and finished goods | — | 2,763 | ||||||
| Raw materials | 2,296 | — | ||||||
| Work in process | 11,962 | 3,573 | ||||||
| Supplies | 254 | — | ||||||
| Raw materials and supplies | — | 608 | ||||||
| Short-term loans receivable | 4,058 | 2,466 | ||||||
| Other receivable | 395 | 944 | ||||||
| Refundable income taxes | 3,423 | 2,022 | ||||||
| Deferred tax assets | 9,110 | — | ||||||
| Other | 481 | 499 | ||||||
| Allowance for doubtful accounts | — | (724 | ) | |||||
| Total current assets | 163,723 | 101,062 | ||||||
| Noncurrent assets | ||||||||
| Property, plant and equipment | ||||||||
| Buildings | 48,014 | 43,860 | ||||||
| Accumulated depreciation | (30,282 | ) | (31,890 | ) | ||||
| Buildings, net | 17,732 | 11,970 | ||||||
| Structures | 4,233 | 3,896 | ||||||
| Accumulated depreciation | (3,318 | ) | (3,281 | ) | ||||
| Structures, net | 915 | 615 | ||||||
| Machinery and equipment | 17,342 | 19,164 | ||||||
| Accumulated depreciation | (13,463 | ) | (18,295 | ) | ||||
| Machinery and equipment, net | 3,879 | 869 | ||||||
| Vehicles and delivery equipment | 48 | 40 | ||||||
| Accumulated depreciation | (27 | ) | (29 | ) | ||||
| Vehicles and delivery equipment, net | 21 | 11 | ||||||
| Tools and furniture | 12,507 | 11,712 | ||||||
| Accumulated depreciation | (10,731 | ) | (11,308 | ) | ||||
| Tools and furniture, net | 1,776 | 404 | ||||||
| Land | 17,623 | 15,907 | ||||||
| Construction in progress | 1,566 | 1 | ||||||
| Total property, plant and equipment | ¥ | 43,512 | 29,777 | |||||
(Note) Accumulated depreciation includes the accumulated impairment losses.
22
(All non-consolidated financial information has been prepared in accordance
with accounting principles generally accepted in Japan.)
Advantest Corporation (FY2008)
| Yen (Millions) | ||||||||
| March 31, 2008 | March 31, 2009 | |||||||
| Intangible fixed assets | ||||||||
| Patent rights | ¥ | 128 | 50 | |||||
| Leasehold rights | 173 | 173 | ||||||
| Telephone rights | 40 | 40 | ||||||
| Utility rights | 13 | 10 | ||||||
| Software | 1,251 | 298 | ||||||
| Other | 251 | 8 | ||||||
| Total intangible fixed assets | 1,856 | 579 | ||||||
| Investments and other assets | ||||||||
| Investment securities | 9,744 | 6,669 | ||||||
| Investment in affiliated companies | 17,595 | 17,425 | ||||||
| Long-term loans receivable | 19 | 7 | ||||||
| Long-term loans to affiliated companies | 1,140 | 1,137 | ||||||
| Long-term prepaid expenses | 1,994 | 309 | ||||||
| Deferred tax assets | 6,433 | — | ||||||
| Other | 1,131 | 958 | ||||||
| Allowance for doubtful accounts | (2 | ) | (39 | ) | ||||
| Total investments and other assets | 38,054 | 26,466 | ||||||
| Total noncurrent assets | 83,422 | 56,822 | ||||||
| Total assets | 247,145 | 157,884 | ||||||
| Liabilities | ||||||||
| Current liabilities | ||||||||
| Trade accounts payable | 11,338 | 5,852 | ||||||
| Other accounts payable | 3,373 | 3,007 | ||||||
| Accrued expenses | 7,998 | 5,094 | ||||||
| Income tax payable | 1,122 | 1 | ||||||
| Advance received | 500 | 24 | ||||||
| Deposits received | 3,297 | 3,458 | ||||||
| Allowance for product warranty | 3,060 | 2,642 | ||||||
| Bonus accrual for directors | 135 | — | ||||||
| Other | 177 | 138 | ||||||
| Total current liabilities | 31,000 | 20,216 | ||||||
| Noncurrent liabilities | ||||||||
| Allowance for retirement benefits | 5,170 | 4,382 | ||||||
| Deferred tax liabilities | — | 81 | ||||||
| Other | 1,711 | 1,183 | ||||||
| Total noncurrent liabilities | 6,881 | 5,646 | ||||||
| Total liabilities | ¥ | 37,881 | 25,862 | |||||
23
(All non-consolidated financial information has been prepared in accordance
with accounting principles generally accepted in Japan.)
Advantest Corporation (FY2008)
| Yen (Millions) | ||||||||
| March 31, 2008 | March 31, 2009 | |||||||
| Net assets | ||||||||
| Stockholders' equity | ||||||||
| Common stock | ¥ | 32,363 | 32,363 | |||||
| Capital surplus | ||||||||
| Capital reserve | 32,973 | 32,973 | ||||||
| Total capital surplus | 32,973 | 32,973 | ||||||
| Retained earnings | ||||||||
| Legal reserve | 3,083 | 3,083 | ||||||
| Other retained earnings | ||||||||
| Reserve for losses in foreign investments | 27,062 | 27,062 | ||||||
| General reserve | 146,880 | 146,880 | ||||||
| Retained earnings (accumulated loss) | 52,797 | (24,208 | ) | |||||
| Total retained earnings | 229,822 | 152,817 | ||||||
| Treasury stock | (89,325 | ) | (89,328 | ) | ||||
| Total stockholders' equity | 205,833 | 128,825 | ||||||
| Difference of appreciation and conversion | ||||||||
| Net unrealized gains on securities | 309 | 120 | ||||||
| Total difference of appreciation and conversion | 309 | 120 | ||||||
| Stock acquisition rights | 3,122 | 3,077 | ||||||
| Total net assets | 209,264 | 132,022 | ||||||
| Total liabilities and net assets | ¥ | 247,145 | 157,884 | |||||
24
(All non-consolidated financial information has been prepared in accordance
with accounting principles generally accepted in Japan.)
Advantest Corporation (FY2008)
(2) Non-Consolidated Statements of Operations (Unaudited)
| Yen (Millions) | ||||||||
| Year ended | Year ended | |||||||
| March 31, 2008 | March 31, 2009 | |||||||
| Net sales | ¥ | |||||||
| Net product sales | 147,686 | 53,124 | ||||||
| Cost of sales | ||||||||
| Finished goods at beginning of year | 5,156 | 5,093 | ||||||
| Cost of manufactured goods | 80,764 | 40,900 | ||||||
| Total | 85,920 | 45,993 | ||||||
| Transfers to other accounts | 488 | 489 | ||||||
| Finished goods at end of year | 5,093 | 2,763 | ||||||
| Balance of cost of sales | 80,339 | 42,741 | ||||||
| Gross profit | 67,347 | 10,383 | ||||||
| Selling, general and administrative expenses | 58,545 | 46,410 | ||||||
| Operating income (loss) | 8,802 | (36,027 | ) | |||||
| Non-operating income | ||||||||
| Interest income | 1,856 | 984 | ||||||
| Dividends income | 32,687 | 786 | ||||||
| Lease income | 2,471 | 2,342 | ||||||
| Miscellaneous income | 405 | 1,052 | ||||||
| Total non-operating income | 37,419 | 5,164 | ||||||
| Non-operating expenses | ||||||||
| Interest expenses | 30 | 33 | ||||||
| Allowance for doubtful account | 2 | 79 | ||||||
| Expenses for leased equipment | 2,173 | 3,278 | ||||||
| Foreign exchange losses | 3,063 | 1,383 | ||||||
| Impairment losses on investment securities | 1,398 | 3,603 | ||||||
| Miscellaneous expenses | 796 | 568 | ||||||
| Total non-operating expenses | 7,462 | 8,944 | ||||||
| Ordinary income (loss) | 38,759 | (39,807 | ) | |||||
| Extraordinary income | ||||||||
| Gain on extinguishment of tie-in shares | — | 61 | ||||||
| Total extraordinary income | — | 61 | ||||||
| Extraordinary loss | ||||||||
| Impairment losses | — | 11,789 | ||||||
| Additonal termination benefit | — | 1,631 | ||||||
| Other | — | 83 | ||||||
| Total extraordinary loss | — | 13,503 | ||||||
| Income (loss) before income taxes | 38,759 | (53,249 | ) | |||||
| Income taxes - current | 6,701 | (937 | ) | |||||
| Income taxes - deferred | (380 | ) | 15,754 | |||||
| Total income taxes | 6,321 | 14,817 | ||||||
| Net income (loss) | ¥ | 32,438 | (68,066 | ) | ||||
25
(All non-consolidated financial information has been prepared in accordance
with accounting principles generally accepted in Japan.)
Advantest Corporation (FY2008)
| (3) Non-Consolidated statements of Changes in Stockholders' Equity (Unaudited) |
| Yen (Millions) | ||||||||
| Year ended | Year ended | |||||||
| March 31, 2008 | March 31, 2009 | |||||||
| Stockholders' Equity | ||||||||
| Common stock | ||||||||
| Balance at beginning of year | 32,362 | 32,363 | ||||||
| Changes in the year | ||||||||
| Total changes in the year | — | — | ||||||
| Balance at end of year | 32,362 | 32,363 | ||||||
| Capital surplus | ||||||||
| Capital reserve | ||||||||
| Balance at beginning of year | 32,973 | 32,973 | ||||||
| Changes in the year | ||||||||
| Total changes in the year | — | — | ||||||
| Balance at end of year | 32,973 | 32,973 | ||||||
| Retained earnings | ||||||||
| Legal reserve | ||||||||
| Balance at beginning of year | 3,083 | 3,083 | ||||||
| Changes in the year | ||||||||
| Total changes in the year | — | — | ||||||
| Balance at end of year | 3,083 | 3,083 | ||||||
| Other retained earnings | ||||||||
| Reserve for losses in foreign investments | ||||||||
| Balance at beginning of year | 27,062 | 27,062 | ||||||
| Changes in the year | ||||||||
| Total changes in the year | — | — | ||||||
| Balance at end of year | 27,062 | 27,062 | ||||||
| General reserve | ||||||||
| Balance at beginning of year | 146,880 | 146,880 | ||||||
| Changes in the year | ||||||||
| Total changes in the year | — | — | ||||||
| Balance at end of year | 146,880 | 146,880 | ||||||
| Retained earnings (accumulated loss) | ||||||||
| Balance at beginning of year | 31,347 | 52,797 | ||||||
| Changes in the year | ||||||||
| Dividends from retained earnings | (10,702 | ) | (8,936 | ) | ||||
| Net income (loss) | 32,438 | (68,066 | ) | |||||
| Sale of treasury stock | (286 | ) | (3 | ) | ||||
| Total changes in the year | 21,450 | (77,005 | ) | |||||
| Balance at end of year | 52,797 | (24,208 | ) | |||||
26
(All non-consolidated financial information has been prepared in accordance
with accounting principles generally accepted in Japan.)
Advantest Corporation (FY2008)
| Yen (Millions) | ||||||||
| Year ended | Year ended | |||||||
| March 31, 2008 | March 31, 2009 | |||||||
| Treasury stock | ||||||||
| Balance at beginning of year | (53,555 | ) | (89,325 | ) | ||||
| Changes in the year | ||||||||
| Repurchase of treasury stock | (36,564 | ) | (7 | ) | ||||
| Sale of treasury stock | 794 | 4 | ||||||
| Total changes in the year | (35,770 | ) | (3 | ) | ||||
| Balance at end of year | (89,325 | ) | (89,328 | ) | ||||
| Total stockholders' equity | ||||||||
| Balance at beginning of year | 220,152 | 205,833 | ||||||
| Changes in the year | ||||||||
| Dividends from retained earnings | (10,702 | ) | (8,936 | ) | ||||
| Net income (loss) | 32,438 | (68,066 | ) | |||||
| Repurchase of treasury stock | (36,564 | ) | (7 | ) | ||||
| Sale of treasury stock | 508 | 1 | ||||||
| Total changes in the year | (14,320 | ) | (77,008 | ) | ||||
| Balance at end of year | 205,833 | 128,825 | ||||||
| Difference of appreciation and conversion | ||||||||
| Net unrealized gains on securities | ||||||||
| Balance at beginning of year | 2,315 | 309 | ||||||
| Changes in the year | ||||||||
| Changes of items other than stockholders' equity, net | (2,006 | ) | (189 | ) | ||||
| Total changes in the year | (2,006 | ) | (189 | ) | ||||
| Balance at end of year | 309 | 120 | ||||||
| Stock acquisition rights | ||||||||
| Balance at beginning of year | 2,337 | 3,122 | ||||||
| Changes in the year | ||||||||
| Changes of items other than stockholders' equity, net | 785 | (45 | ) | |||||
| Total changes in the year | 785 | (45 | ) | |||||
| Balance at end of year | 3,122 | 3,077 | ||||||
| Total net assets | ||||||||
| Balance at beginning of year | 224,805 | 209,264 | ||||||
| Changes in the year | ||||||||
| Dividends from retained earnings | (10,702 | ) | (8,936 | ) | ||||
| Net income (loss) | 32,438 | (68,066 | ) | |||||
| Repurchase of treasury stock | (36,564 | ) | (7 | ) | ||||
| Sale of treasury stock | 508 | 1 | ||||||
| Changes of items other than stockholders' equity, net | (1,221 | ) | (234 | ) | ||||
| Total changes in the year | (15,541 | ) | (77,242 | ) | ||||
| Balance at end of year | 209,264 | 132,022 | ||||||
27
Advantest Corporation (FY2008)
(All non-consolidated financial information has been prepared in accordance
with accounting principles generally accepted in Japan.)
(4) Notes on Preconditions to Going Concerns: None
(5) Changes in accounting principles
1. Accounting standard for measurement of inventories
Because Advantest has applied the “Accounting Standard for Measurement of Inventories” (Accounting Standards Board of Japan Statement No. 9 issued July 5, 2006 (“ASBJ 9”)) effective from the current fiscal year, inventories are stated at cost determined principally by the gross average method (book value of inventories stated in the balance sheet are written down in accordance with decreased profitability). The adoption of ASBJ 9 did not have a material impact on Advantest’s non-consolidated profit and loss.
2. Accounting standard for lease transactions
Effective from the current fiscal year, Advantest has adopted the “Accounting Standard for Lease Transactions” (Accounting Standards Board of Japan Statement No. 13 issued June 17, 1993, (First Division of the Business Accounting Council), revised March 30, 2007) and the “Implementation Guidance on the Accounting Standard for Lease Transactions” (Accounting Standards Board of Japan Implementation Guidance No. 16 issued January 18, 1994, (Japanese Institute of Certified Public Accountants, Accounting System Committee), revised March 30, 2007). Accordingly, lease transactions apply the same accounting treatment as used in ordinary sales transactions. With respect to finance lease transactions which do not transfer ownership of the property to the lessee that commenced on or before March 31, 2008, Advantest will continue to apply the same accounting treatment as used in ordinary sales transactions, as previously used. Because Advantest has no lease transactions that commenced after April 1, 2008 that would necessitate the application of the accounting treatment based on ordinary sales transactions, the adoption of this accounting standard did not have a material impact on Advantest’s non-consolidated profit and loss.
28
Changes in Board Directors and Executive Officers
(To be effective on June 25, 2009)
1. | Nominees for Board Directors |
| Board Director | Toshio Maruyama (to be promoted) |
Representative Director and Chief Executive Officer of Advantest Corporation |
| Board Director | Haruo Matsuno (to be newly elected) |
Executive Officer of Advantest Corporation |
| Board Director | Naoyuki Akikusa |
| Board Director | Yasushige Hagio |
| Board Director | Takashi Tokuno |
| Board Director | Hiroshi Tsukahara |
| Board Director | Yuichi Kurita |
| Board Director | Hiroyasu Sawai |
| Board Director | Shinichiro Kuroe (to be newly elected) |
Executive Officer of Advantest Corporation |
Mr. Maruyama is to be elected as Representative Board Director, Chairman of the Board and Mr. Matsuno is to be elected as Representative Board Director at the extraordinary board meeting to be held on June 25, 2009 after the 67th Shareholders Meeting of Advantest Corporation.
| 2. | Nominees for Executive Officers |
| President | Haruo Matsuno (to be promoted) |
Executive Officer of Advantest Corporation |
| Senior Executive Officer | Takashi Tokuno |
| Managing Executive Officer | Hiroshi Tsukahara |
| Managing Executive Officer | Yuichi Kurita |
| Managing Executive Officer | Hiroyasu Sawai |
| Managing Executive Officer | Shinichiro Kuroe (to be promoted) |
| Executive Officer of Advantest Corporation |
| Managing Executive Officer | Yoshiro Yagi |
Managing Executive Officer | Hiroshi Nakamura (to be promoted) |
| Executive Officer of Advantest Corporation |
| Managing Executive Officer | Yoshiaki Yoshida (to be promoted) |
| Executive Officer of Advantest Corporation |
| Executive Officer | Masao Shimizu |
| Executive Officer | Hideaki Imada |
| Executive Officer | Yasuhiro Kawata |
| Executive Officer | Takashi Sugiura |
| Executive Officer | Takashi Sekino |
| Executive Officer | Sae Bum Myung |
| Executive Officer | Soichi Tsukakoshi |
29
| Executive Officer | Josef Schraetzenstaller |
| Executive Officer | R. Keith Lee |
| 3. | Resignation from Board Directors and Executive Officers |
Shimpei Takeshita, Chairman of the Board
--- To be elected as Senior Executive Advisor
Takao Tadokoro, Board Director and Managing Executive Officer
--- To be elected as Advisor
Minoru Morishita, Executive Officer
--- To be elected as Advisor
| 4. | Nominees for New Board Directors (Biography) |
Haruo Matsuno (Date of Birth: February 14, 1960)
| Mar. 1984 | Graduated from School of Law, Waseda University |
| Apr. 1984 | Joined Advantest Corporation |
| Jun. 1997 | Section Manager, Executive Secretary Section, Corporate Relations Group |
| May 2002 | Vice President, Corporate Liaison Advantest America Corporation |
| Jun. 2005 | Deputy Manager, Personnel Department, Corporate Affairs Group |
| Jun. 2006 | Senior Vice President, Procurement Group |
| Jan. 2008 | Senior Vice President, Production Group (present position) |
| Jun. 2008 | Executive Officer (present position) |
Shinichiro Kuroe (Date of Birth: March 30, 1959)
| Mar. 1981 | Graduated from Hosei University, Faculty of Engineering |
| Apr. 1981 | Joined Advantest Corporation | |
| Jun. 2001 | General Manager, Memory Tester Business Division | |
| Apr. 2005 | General Manager, Solution Business Division, Sales and Marketing Group |
| Jun. 2005 | Executive Officer (present position) |
| Jun. 2005 | Vice President, Sales and Marketing Group |
| Dec. 2007 | General Manager, 1st SoC Tester Business Division, 1st Test System Business Group |
| Jun. 2008 | Senior Vice President, SoC Tester Business Group |
| Apr. 2009 | Senior Vice President, Test System Business Group (present position) |
30