Advantest Corporation (FY2009)
FY2009 Consolidated Financial Results
(Prepared in accordance with U.S. GAAP)
(Year ended March 31, 2010)
(Unaudited)
April 27, 2010
| Company name | : | Advantest Corporation |
| (URL http://www.advantest.co.jp/investors/en-index.shtml) | ||
| Stock exchanges on which shares are listed | : | First section of the Tokyo Stock Exchange |
| Stock code number | : | 6857 |
| Company representative | : | Haruo Matsuno, Representative Director, President and |
| CEO | ||
| Contact person | : | Hiroshi Nakamura, Managing Executive Officer and |
| Vice President, Corporate Administration Group | ||
| (03) 3214-7500 | ||
| Date of General Shareholders’ Meeting (as planned) | : | June 24, 2010 |
Dividend Payable Date (as planned) | : | June 2, 2010 |
| Annual Report Filing Date (as planned) | : | June 25, 2010 |
(Rounded to the nearest million yen)
| 1. | Consolidated Results of FY2009 (April 1, 2009 through March 31, 2010) |
| (1) | Consolidated Financial Results |
(% changes as compared with the previous fiscal year)
| | Net sales | Operating income (loss) | Income (loss) before income taxes and equity in earnings (loss) of affiliated company | Net income (loss) | ||||
| Million yen | % increase (decrease) | Million yen | % increase (decrease) | Million yen | % increase (decrease) | Million yen | % increase (decrease) | |
| FY2009 | 53,225 | (30.6) | (11,639) | - | (9,926) | - | (11,454) | - |
| FY2008 | 76,652 | (58.1) | (49,457) | - | (52,761) | - | (74,902) | - |
| | Net income (loss) per share - basic | Net income (loss) per share - diluted | Net income (loss) to equity ratio | Ratio of income (loss) before taxes to total assets | Ratio of operating income (loss) to net sales | ||
| Yen | Yen | % | % | % | |||
| FY2009 | (64.09) | (64.09) | (7.3) | (5.1) | (21.9) | ||
| FY2008 | (419.09) | (419.09) | (35.9) | (21.1) | (64.5) | ||
(Reference) Equity in earnings (loss) of affiliated company: FY2009 (Y) (71) million; FY2008 (Y) (147) million
(Note) Advantest does not have noncontrolling interests.
| (2) | Consolidated Financial Position |
| | Total assets | Net assets | Equity-to-assets ratio | Net assets per share | ||||
| Million yen | Million yen | % | Yen | |||||
| FY2009 | 188,663 | 150,242 | 79.6 | 840.65 | ||||
| FY2008 | 202,059 | 163,616 | 81.0 | 915.47 | ||||
| (3) | Consolidated Cash Flows |
Cash flows from operating activities | Cash flows from investing activities | Cash flows from financing activities | Cash and cash equivalents at end of year | |||||
| Million yen | Million yen | Million yen | Million yen | |||||
| FY2009 | (17,746) | 10,824 | (1,803) | 96,439 | ||||
| FY2008 | 2,357 | (32,507) | (8,930) | 105,455 | ||||
1
Advantest Corporation (FY2009)
| 2. | Dividends |
| Dividend per share | Total dividend paid (annual) | Payout ratio (consolidated) | Ratio of total amount of dividends to net assets (consolidated) | |||||
(Record Date) | First quarter end | Second quarter end | Third quarter end | Year end | Annual total | |||
| yen | yen | yen | yen | yen | Million yen | % | % | |
| FY2008 | - | 25.00 | - | 5.00 | 30.00 | 5,362 | - | 2.6 |
| FY2009 | - | 5.00 | - | 5.00 | 10.00 | 1,787 | - | 1.1 |
FY2010 (forecast) | - | - | - | - | - | N/A | - | N/A |
The dividend forecast for the fiscal year ending March 31, 2011 has not been decided. Advantest takes earnings forecast into consideration and intends to promptly disclose the relevant dividend forecast when such forecast becomes available.
| 3. | Projected Results for FY2010 (April 1, 2010 through March 31, 2011) |
Advantest’s business focuses on test systems for semiconductors, and relies heavily on the capital expenditures of semiconductor manufacturers, test houses and foundries. The capital expenditures of these companies are determined primarily by factors such as current or future trends in the demand for semiconductors. Amid the developing consensus that the global economy has bottomed out, the semiconductor industry appears to be set for a period of renewed expansion. Chip-makers are proactively ramping up capital expenditures to support increased production volumes and enhanced productivity, producing signs of improvement in Advantest’s business environment. However, it remains difficult to predict whether the momentum of capital expenditures will be sustained. In this environment, Advantest is unable to provide a detailed forecast at this time. Therefore the earnings forecast for the fiscal year ending March 31, 2011 has not been presented. Advantest intends to promptly disclose the relevant earnings forecast when such disclosure becomes possible.
| 4. | Others |
| (1) | Material changes in subsidiaries during this fiscal year (changes in scope of consolidation resulting from changes in subsidiaries): Yes Newly included None; Excluded 1 (Company name: Advantest DI Corporation) (Note) Please see “Scope of Consolidation and Application of the Equity Method” on page 16-17 for details. |
| (2) | Changes in accounting principles, procedures and the presentation of the consolidated financial statements 1) Changes based on revisions of accounting standard : None 2) Changes other than 1) above : None |
| (3) | Number of issued and outstanding shares (common stock) |
| 1) | Number of issued and outstanding stock at the end of each fiscal year (including treasury stock): FY2009 199,566,770 shares; FY2008 199,566,770 shares. |
| 2) | Number of treasury stock at the end of each fiscal year: FY2009 20,845,178 shares; FY2008 20,843,298 shares. |
| 3) | Average number of outstanding stock for each fiscal year: FY2009 178,722,505 shares; FY2008 178,724,884 shares. |
2
Advantest Corporation (FY2009)
(Reference) Selected Non-Consolidated Financial Data
(Prepared in accordance with JAPAN GAAP)
| 1. | Non-consolidated Results of FY2009 (April 1, 2009 through March 31, 2010) |
| (1) | Non-Consolidated Financial Results |
(% changes as compared with the previous fiscal year)
| | Net sales | Operating income (loss) | Income (loss) before income taxes | Net income (loss) | ||||
| Million yen | % increase (decrease) | Million yen | % increase (decrease) | Million yen | % increase (decrease) | Million yen | % increase (decrease) | |
| FY2009 | 41,907 | (21.1) | (17,307) | - | (2,384) | - | (2,402) | - |
| FY2008 | 53,124 | (64.0) | (36,027) | - | (39,807) | - | (68,066) | - |
| | Net income (loss) per share - basic | Net income (loss) per share - diluted | ||
| Yen | Yen | |||
| FY2009 | (13.44) | - | ||
| FY2008 | (380.84) | - | ||
| (2) | Non-consolidated Financial Position |
| | Total assets | Net assets | Equity-to-assets ratio | Net assets per share | ||||
| Million yen | Million yen | % | Yen | |||||
| FY2009 | 157,639 | 128,647 | 79.6 | 702.18 | ||||
| FY2008 | 157,884 | 132,022 | 81.7 | 721.48 | ||||
(Reference) Total equity : FY2009 (Y) 125,494 million; FY2008 (Y) 128,945 million.
Explanation on the Appropriate Use of Future Earnings Projections and Other Special Instructions
This document contains “forward-looking statements” that are based on Advantest’s current expectations, estimates and projections. These forward-looking statements are subject to known and unknown risks, uncertainties and other factors that may cause Advantest’s actual results, levels of activity, performance or achievements to be materially different from those expressed or implied by such forward-looking statements. These factors include: (i) changes in demand for the products and services produced and offered by Advantest’s customers, including semiconductors, communications services and electronic goods; (ii) circumstances relating to Advantest’s investment in technology, including its ability to timely develop products that meet the changing needs of semiconductor manufacturers, communications network equipment and components makers and service providers; (iii) significant changes in the competitive environment in the major markets where Advantest purchases materials, components and supplies for the production of its products or where its products are produced, distributed or sold; and (iv) changes in economic conditions, currency exchange rates or political stability in the major markets where Advantest procures materials, components and supplies for the production of its principal products or where its products are produced, distributed or sold. A discussion of these and other factors which may affect Advantest’s actual results, levels of activity, performance or achievements is contained in the “Operating and Financial Review”, “Key Information - Risk Factors” and “Information on the Company” sections and elsewhere in Advantest’s annual report on Form 20-F, which is on file with the United States Securities and Exchange Commission.
3
Advantest Corporation (FY2009)
| 1. | Business Results |
| (1) | Analysis of Business Results |
| 1) | Consolidated Financial Results of FY2009 (April 1, 2009 through March 31, 2010) |
| (in billion yen) | |||
| FY2008 | FY2009 | As compared to the previous fiscal year Increase (decrease) | |
| Orders input received | 50.1 | 67.7 | 35.2% |
| Net sales | 76.7 | 53.2 | (30.6%) |
| Operating income (loss) | (49.5) | (11.6) | - |
| Income (loss) before income taxes and equity in earnings (loss) of affiliated company | (52.8) | (9.9) | - |
| Net income (loss) | (74.9) | (11.5) | - |
Advantest’s FY2009 (April 1, 2009 through March 31, 2010) dawned with the global economy in recession triggered by the financial crisis of late 2008. However, a mild upswing has now taken hold worldwide, led by economic growth in China, India, and other emerging nations, and underpinned by the stimulus measures adopted by many national governments.
In the semiconductor industry, chip-makers were also impacted by the global downturn, and restricted capital expenditures sharply at the beginning of the period. They gradually resumed capital expenditures as chip prices rose and equipment utilization rates climbed, driven by increasing demand for PCs, flat-screen TVs, and cellular phones.
Advantest benefited from these positive market factors. Additionally, throughout the period, the Company strove to improve profitability by cutting costs and reducing fixed expenses through integration of manufacturing subsidiaries, while expanding its sources of revenue by reorganizing its sales structure and launching new products that adapt to customer needs. These measures enabled Advantest to return to profitability in the fourth quarter of FY2009.
As a result of the above, although sales for the period totaled only (Y) 53.2 billion (a 30.6% decrease in comparison to FY2008), due to the drop in orders seen in late FY2008, orders and earnings improved significantly year on year. Orders input received was (Y) 67.7 billion (a 35.2% increase in comparison to FY2008). Operating loss was (Y) 11.6 billion ((Y) 37.8 billion improvement in comparison to FY2008). Loss before income taxes and equity in loss of affiliated company was (Y) 9.9 billion ((Y) 42.8 billion improvement in comparison to FY2008). Net loss was (Y) 11.5 billion ((Y) 63.4 billion improvement in comparison to FY2008). The percentage of net sales to overseas customers was 77.5%, compared to 67.7% in FY2008.
4
Advantest Corporation (FY2009)
Conditions of business by segment are described below.
<Semiconductor and Component Test System Segment>
| (in billion yen) | |||
| FY2008 | FY2009 | As compared to the previous fiscal year Increase (decrease) | |
| Orders input received | 26.1 | 42.5 | 62.7% |
| Net sales | 49.2 | 32.6 | (33.8%) |
| Operating income (loss) | (28.9) | (7.0) | - |
In the Semiconductor and Component Test Systems segment, orders input received improved significantly. Sales remained weak, due to the impact of weakened orders carried over from the second half of FY2008.
In the memory sector, the Company was mired in an extremely challenging environment at the beginning of the period, as memory makers continued to take a cautious stance on capital expenditures. However, the upturn in PC shipments left manufacturers struggling to keep up with demand, sparking fears of DRAM shortages. Prices for DDR3-DRAM and other DRAM devices rose, encouraging memory makers to resume capital expenditures, which led to a jump in orders for memory test systems towards the end of the period.
In non-memory, orders for MPU test systems continued to be robust. Demand for LCD driver IC test systems and consumer SoC test systems also expanded from the second half of the period, as the global recovery stimulated demand for consumer electronics including LCD TVs, cellular phones, and notebook computers.
As a result of the above, orders input received was (Y) 42.5 billion (a 62.7% increase in comparison to FY2008), net sales were (Y) 32.6 billion (a 33.8% decrease in comparison to FY2008) and operating loss was (Y) 7.0 billion ((Y) 21.9 billion improvement in comparison to FY2008).
<Mechatronics System Segment>
| (in billion yen) | |||
| FY2008 | FY2009 | As compared to the previous fiscal year Increase (decrease) | |
| Orders input received | 9.1 | 14.8 | 62.7% |
| Net sales | 14.4 | 11.2 | (21.9%) |
| Operating income (loss) | (11.9) | (1.9) | - |
Demand for Advantest’s test handlers also improved sharply during the second half of FY2009, supported by increased activity in the DDR3-DRAM and analog IC markets. However, the steep drop in orders in the second half of FY2008 kept sales at a low level for the full year.
As a result of the above, orders input received was (Y) 14.8 billion (a 62.7% increase in comparison to FY2008), net sales were (Y) 11.2 billion (a 21.9% decrease in comparison to FY2008) and operating loss was (Y) 1.9 billion ((Y) 10.0 billion improvement in comparison to FY2008).
5
Advantest Corporation (FY2009)
<Services, Support and Others Segment>
| (in billion yen) | |||
| FY2008 | FY2009 | As compared to the previous fiscal year Increase (decrease) | |
| Orders input received | 15.6 | 13.0 | (17.1%) |
| Net sales | 15.8 | 11.8 | (25.1%) |
| Operating income (loss) | (1.1) | 2.2 | - |
The Services, Support and Others Segment did not perform strongly in the period; volumes declined in customer utilization rates of testing equipment.
As a result, orders input received was (Y) 13.0 billion (a 17.1% decrease in comparison to FY2008), net sales were (Y) 11.8 billion (a 25.1% decrease in comparison to FY2008) and operating income was (Y) 2.2 billion ((Y) 3.3 billion improvement in comparison to FY2008).
| 2) | Prospects for the Upcoming Fiscal Year |
Amid the developing consensus that the global economy has bottomed out, the semiconductor industry appears to be set for a period of renewed expansion. Chip-makers are proactively ramping up capital expenditures to support increased production volumes and enhance productivity, producing signs of improvement in Advantest’s business environment. However, it remains difficult to predict whether the momentum of capital expenditures will be sustained. In this environment, Advantest is unable to provide a detailed forecast at this time.
With due consideration of the above, Advantest continues to strive for improved profitability through its corporate initiative “1000 Days,” launched in July 2009, by boosting the efficiency of its business processes and enriching its pipeline of new products. The Company will also continue its push into new markets, exemplified by the TAS7000, a 3D imaging and analysis system launched in April 2010. Concurrently with these efforts, Advantest will focus on further reinforcing its management structure. An additional merger of two manufacturing and service subsidiaries scheduled for July 2010 will also enhance the Company’s ability to deliver solutions characterized by Advantest’s best-in-class technology and optimized for current market needs.
| (2) | Financial Condition |
Total assets at the end of FY2009 was (Y) 188.7 billion, a decrease of (Y) 13.4 billion compared to the previous fiscal year, due primarily due to a decrease of (Y) 14.6 billion and (Y) 9.0 billion in short-term investments and cash and cash equivalents, respectively, and an increase of (Y) 6.9 billion and (Y) 5.5 billion in inventories and trade receivable, respectively. Stockholders’ equity was (Y) 150.2 billion. Equity to assets ratio was 79.6%, a decrease of 1.4 percentage point compared to the previous fiscal year.
(Cash Flow Condition)
Cash and cash equivalents held at the end of FY2009 were (Y) 96.4 billion, a decrease of (Y) 9.0 billion from previous fiscal year.
Significant cash flows during this fiscal year and their causes are described below.
Net cash used in operating activities was (Y) 17.7 billion (Net cash inflow (Y) 2.4 billion in FY2008). This amount was primarily attributable to net loss of (Y) 11.5 billion.
6
Advantest Corporation (FY2009)
Net cash provided by investing activities was (Y) 10.8 billion (Net cash outflow (Y) 32.5 billion in FY2008). This amount was primarily attributable to decrease in short-term investments in the amount of (Y) 13.9 billion and purchases of property, plant and equipment in the amount of (Y) 2.8 billion.
Net cash used in financing activities was (Y) 1.8 billion (Net cash outflow (Y) 8.9 billion in FY2008). This amount was primarily attributable to dividend payments.
The following table illustrates the historical movements of certain cash flow indexes:
| FY2005 | FY2006 | FY2007 | FY2008 | FY2009 | |
| Stockholders’ equity ratio (%) | 73.5 | 80.5 | 85.1 | 81.0 | 79.6 |
| Stockholders’ equity ratio based on market prices (%) | 373.3 | 267.9 | 154.7 | 129.2 | 221.5 |
| Debt to annual cash flow ratio (%) | 0.1 | 0.1 | 0.0 | 0.2 | - |
| Interest coverage ratio (times) | 148.5 | 3,094.7 | 1,839.4 | 195.9 | - |
Stockholders’ equity ratio: stockholders’ equity / total assets
Stockholders’ equity ratio based on market prices: market capitalization / total assets
Debt to annual cash flow ratio: interest-bearing liabilities / operating cash flows
Interest coverage ratio: operating cash flows / interest payments
| (Notes) | 1. These indexes are calculated using U.S. GAAP figures. 2. Market capitalization is calculated based on issued and outstanding shares excluding treasury stock. 3. Operating cash flows are the cash flows provided by operating activities on the consolidated statements of cash flows. 4. Interest-bearing liabilities include all liabilities on the consolidated balance sheets that incur interest. |
| (3) | Basic Policy on Distribution of Profits and Distribution for FY2009 and Distribution Forecast for FY2010 |
Based on the premise that long-term and continued growth in corporate value is fundamental to the creation of shareholder value, Advantest deems the consistent distribution of profits to be the most important management priority. Accordingly, Advantest engages in active distribution of profits based on consolidated business performance.
With respect to the distribution of retained earnings, Advantest makes payout decisions after taking into consideration consolidated business performance, financial conditions, as well as the need for strategic investment for mid-to-long-term business development. While aiming to make consistent distributions, because of the fluctuation of the market in which it operates, Advantest makes dividend payouts following a target payout ratio of 20% or more.
Retained earnings are devoted to research and development, streamlining efforts, overseas expansion, investments in new businesses and resources for M&A activities, with an aim to strengthen Advantest’s business position and enhance its corporate value.
In order to maintain capital strategies responsive to changes in the operating environment, Advantest will repurchase its own shares from time to time through taking into account factors such as trends in stock price, capital efficiency and cash flow.
In this fiscal year, Advantest decided, pursuant to the above profit distribution policy, to distribute a year end dividend of (Y) 5 consistent with the revised forecast announced on January 28, 2010, with a payment date of June 2, 2010. Since Advantest paid an interim dividend of (Y) 5 on December 1, 2009, the total dividend per share for the fiscal year will be (Y) 10.
Advantest has elected not to publish a dividend forecast for fiscal 2010 at this time, due to the Company’s view that its results will take time to recover, despite the improvement of the Company’s business environment, as explicated in the prospects section above. Payout decisions will take future results into consideration and will be announced when they are available.
7
Advantest Corporation (FY2009)
| 2. | Organization of the Advantest Group The following diagram shows the business relationships among the major affiliated companies of the Advantest Group. |
Customers and Distributors Sales and Support Companies Advantest America, Inc. Advantest Europe GmbH Advantest (Singapore) Pte. Ltd. Advantest Taiwan Inc. Advantest Korea Co., Ltd. Advantest (Suzhou) Co., Ltd. Development, manufacturing and sales Companies Manufacturing Company Service Companies Japan Engineering Co., Ltd Advantest Kyushu Systems Co., Ltd Advantest Engineering (M)Sdn. Bhd. Advantest Customer Support Corporation Advantest Finance Inc. Electronic Retrofit Corporation Advanfacilities Co., Ltd. Advantest Staff Resource Corporation Advantest Media Service Corporation Advantest Corporation Manufacturing Company Advantest Manufacturing, Inc. Research and Development Company Manufacturing Company Advantest Laboratories Co., Ltd. Advantest Component, Inc. Development Companies Advansoft Development Corporation Advantest America R&D Center, Inc. Semiconductor and Component Test System Mechatronics System Services, Support and Others | 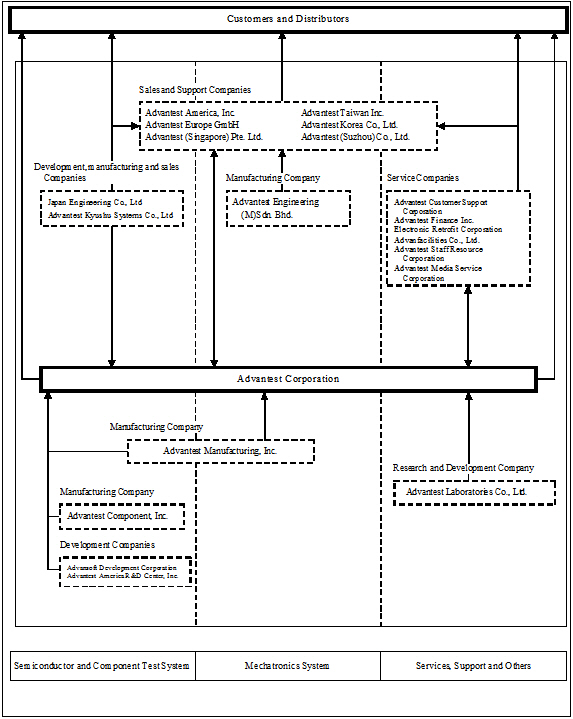 |
There are 10 other consolidated subsidiaries and 1 equity method affiliate in addition to those mentioned in the above diagram.
Consolidated subsidiaries (14 domestic; 16 overseas; 30 total) Equity method affiliate (1 domestic)
| :Main flow of products and services |
8
Advantest Corporation (FY2009)
| 3. | Management Policy |
| (1) | Advantest’s Basic Management Policy |
Advantest has established a corporate vision of “Technology Support on the Leading Edge”, and its corporate mission of “Quest for the Essence”. Guided by these principles, Advantest respects each of its stakeholders, strives to maintain harmony with society, and aims for the sustained development of the Company and the improvement of corporate value while contributing to the goal of a sustainable society.
| (2) | Target Financial Index |
Advantest applies the “AVA” (Advantest Value Added), a financial index incorporating the concept of EVA®(Economic Value Added) *, as a significant management indicator, along with profit margin, ROE and cash flows. Specifically, Advantest will set the minimum return-on-investment ratio (“hurdle rate”) for evaluating AVA at 8% and a mid-term target at 12% or more with an aim to further enhance corporate value and shareholder value.
*”EVA®” is a registered trademark of Stern Stewart & Co.
| (3) | Mid-and-Long-term Business Strategy and Issues to be Addressed |
While maintaining “Measurements” as our core competence in mid-and-long term, Advantest intends to improve its corporate value by establishing a management and financial structure that responds timely to changes in the global market, and by aiming to increase market share by introducing fine products that will inspire the market demands of the next generation. To achieve these objectives, Advantest promotes to further strengthen its product development operations and improve production efficiency while strengthening its overseas operations and support system in the U.S., Europe and Asia.
As semiconductor manufacturers relax their restrictions on capital expenditures, Advantest is responding to signs of improvement in its business environment by speeding up the implementation of its management strategy and seeking greater business efficiencies. In the upcoming fiscal year, the Company will merge with one of its manufacturing subsidiaries and one of its service subsidiaries, and will review its R&D, manufacturing, sales, and service processes to further align them with customer requirements, enhancing the Company’s ability to respond actively to market shifts.
Through “1000 Days,” a corporate initiative launched in July 2009, Advantest will continue to strive to reduce lead times, provide timely new solutions optimized for market needs, explore new markets outside the semiconductor industry, and pursue overall cost savings, as part of a concerted strategy to improve profitability and swiftly return to financial health.
9
Advantest Corporation (FY2009)
| 4. Consolidated Financial Statements and Other Information | ||||||||
| �� | ||||||||
| (1) Consolidated Balance Sheets (Unaudited) | ||||||||
| Yen (Millions) | ||||||||
| Assets | March 31, 2009 | March 31, 2010 | ||||||
| Current assets: | ||||||||
| Cash and cash equivalents | ¥ | 105,455 | 96,439 | |||||
| Short-term investments | 25,114 | 10,498 | ||||||
| Trade receivables, net | 10,415 | 15,930 | ||||||
| Inventories | 9,737 | 16,590 | ||||||
| Other current assets | 6,586 | 4,292 | ||||||
| Total current assets | 157,307 | 143,749 | ||||||
| Investment securities | 6,679 | 8,077 | ||||||
| Property, plant and equipment, net | 33,974 | 32,881 | ||||||
| Intangible assets, net | 1,470 | 1,445 | ||||||
| Other assets | 2,629 | 2,511 | ||||||
| Total assets | ¥ | 202,059 | 188,663 | |||||
10
Advantest Corporation (FY2009)
| Yen (Millions) | ||||||||
| Liabilities and Stockholders’ Equity | March 31, 2009 | March 31, 2010 | ||||||
| Current liabilities: | ||||||||
| Trade accounts payable | ¥ | 4,767 | 11,430 | |||||
| Other accounts payable | 6,409 | 981 | ||||||
| Accrued expenses | 6,043 | 4,894 | ||||||
| Accrued warranty expenses | 2,811 | 2,802 | ||||||
| Other current liabilities | 1,507 | 1,812 | ||||||
| Total current liabilities | 21,537 | 21,919 | ||||||
| Accrued pension and severance cost | 13,996 | 13,765 | ||||||
| Other liabilities | 2,910 | 2,737 | ||||||
| Total liabilities | 38,443 | 38,421 | ||||||
| Commitments and contingent liabilities | ||||||||
| Stockholders’ equity: | ||||||||
| Common stock | 32,363 | 32,363 | ||||||
| Capital surplus | 40,320 | 40,463 | ||||||
| Retained earnings | 194,848 | 181,606 | ||||||
| Accumulated other comprehensive income (loss) | (14,587 | ) | (14,859 | ) | ||||
| Treasury stock | (89,328 | ) | (89,331 | ) | ||||
| Total stockholders’ equity | 163,616 | 150,242 | ||||||
| Total liabilities and stockholders’ equity | ¥ | 202,059 | 188,663 | |||||
11
Advantest Corporation (FY2009)
| (2) Consolidated Statements of Operations (Unaudited) | ||||||||
| Yen (Millions) | ||||||||
| Year ended | Year ended | |||||||
| March 31, 2009 | March 31, 2010 | |||||||
| Net sales | ¥ | 76,652 | 53,225 | |||||
| Cost of sales | 56,837 | 27,297 | ||||||
| Gross profit | 19,815 | 25,928 | ||||||
| Research and development expenses | 23,713 | 17,896 | ||||||
| Selling, general and administrative expenses | 31,771 | 19,671 | ||||||
| Restructuring and impairment charges | 13,788 | — | ||||||
| Operating income (loss) | (49,457 | ) | (11,639 | ) | ||||
| Other income (expense): | ||||||||
| Interest and dividend income | 2,157 | 579 | ||||||
| Interest expense | (11 | ) | (4 | ) | ||||
| Impairment losses on investment securities | (3,510 | ) | (316 | ) | ||||
| Other, net | (1,940 | ) | 1,454 | |||||
| Total other income (expense) | (3,304 | ) | 1,713 | |||||
| Income (loss) before income taxes and equity | ||||||||
| in earnings (loss) of affiliated company | (52,761 | ) | (9,926 | ) | ||||
| Income taxes | 21,994 | 1,457 | ||||||
| Equity in earnings (loss) of affiliated company | (147 | ) | (71 | ) | ||||
| Net income (loss) | ¥ | (74,902 | ) | (11,454 | ) | |||
| Yen | ||||||||
| Year ended | Year ended | |||||||
| March 31, 2009 | March 31, 2010 | |||||||
| Net income (loss) per share: | ||||||||
| Basic | ¥ | (419.09 | ) | (64.09 | ) | |||
| Diluted | (419.09 | ) | (64.09 | ) | ||||
12
Advantest Corporation (FY2009)
| (3) Consolidated Statements of Stockholders’ Equity (Unaudited) | ||||||||
| Yen (Millions) | ||||||||
| Year ended | Year ended | |||||||
| March 31, 2009 | March 31, 2010 | |||||||
| Common stock | ||||||||
| Balance at beginning of year | ¥ | 32,363 | 32,363 | |||||
| Changes in the year | ||||||||
| Total changes in the year | — | — | ||||||
| Balance at end of year | 32,363 | 32,363 | ||||||
| Capital surplus | ||||||||
| Balance at beginning of year | 40,072 | 40,320 | ||||||
| Changes in the year | ||||||||
| Stock option compensation expense | 248 | 143 | ||||||
| Total changes in the year | 248 | 143 | ||||||
| Balance at end of year | 40,320 | 40,463 | ||||||
| Retained earnings | ||||||||
| Balance at beginning of year | 278,689 | 194,848 | ||||||
| Changes in the year | ||||||||
| Net income (loss) | (74,902 | ) | (11,454 | ) | ||||
| Cash dividends | (8,936 | ) | (1,787 | ) | ||||
| Sale of treasury stock | (3 | ) | (1 | ) | ||||
| Total changes in the year | (83,841 | ) | (13,242 | ) | ||||
| Balance at end of year | 194,848 | 181,606 | ||||||
| Accumulated other comprehensive income (loss) | ||||||||
| Balance at beginning of year | (7,615 | ) | (14,587 | ) | ||||
| Changes in the year | ||||||||
| Other comprehensive income (loss), net of tax | (6,972 | ) | (272 | ) | ||||
| Total changes in the year | (6,972 | ) | (272 | ) | ||||
| Balance at end of year | (14,587 | ) | (14,859 | ) | ||||
| Treasury stock | ||||||||
| Balance at beginning of year | (89,325 | ) | (89,328 | ) | ||||
| Changes in the year | ||||||||
| Repurchase of treasury stock | (7 | ) | (4 | ) | ||||
| Sale of treasury stock | 4 | 1 | ||||||
| Total changes in the year | (3 | ) | (3 | ) | ||||
| Balance at end of year | ¥ | (89,328 | ) | (89,331 | ) | |||
13
Advantest Corporation (FY2009)
| Yen (Millions) | ||||||||
| Year ended | Year ended | |||||||
| March 31, 2009 | March 31, 2010 | |||||||
Total stockholders’ equity | ||||||||
| Balance at beginning of year | ¥ | 254,184 | 163,616 | |||||
| Changes in the year | ||||||||
| Net income (loss) | (74,902 | ) | (11,454 | ) | ||||
| Other comprehensive income (loss), net of tax | (6,972 | ) | (272 | ) | ||||
| Cash dividends | (8,936 | ) | (1,787 | ) | ||||
| Stock option compensation expense | 248 | 143 | ||||||
| Repurchase of treasury stock | (7 | ) | (4 | ) | ||||
| Sale of treasury stock | 1 | 0 | ||||||
| Total changes in the year | (90,568 | ) | (13,374 | ) | ||||
| Balance at end of year | 163,616 | 150,242 | ||||||
| Yen (Millions) | ||||||||
| Year ended | Year ended | |||||||
| March 31, 2009 | March 31, 2010 | |||||||
| Comprehensive income (loss) | ||||||||
| Net income (loss) | (74,902 | ) | (11,454 | ) | ||||
| Other comprehensive income (loss), net of tax | ||||||||
| Foreign currency translation adjustments | (1,793 | ) | (2,614 | ) | ||||
| Net unrealized gains (losses) on investment securities | (244 | ) | 776 | |||||
| Pension related adjustments | (4,935 | ) | 1,566 | |||||
| Total other comprehensive income (loss) | (6,972 | ) | (272 | ) | ||||
| Comprehensive income (loss) in the year | ¥ | (81,874 | ) | (11,726 | ) | |||
14
Advantest Corporation (FY2009)
| (4) Consolidated Statement of Cash Flows (Unaudited) | ||||||||
| Yen (Millions) | ||||||||
| Year ended | Year ended | |||||||
| March 31, 2009 | March 31, 2010 | |||||||
Cash flows from operating activities: | ||||||||
| Net income (loss) | ¥ | (74,902 | ) | (11,454 | ) | |||
| Adjustments to reconcile net income (loss) to net cash | ||||||||
| provided by (used in) operating activities: | ||||||||
| Depreciation and amortization | 8,719 | 4,314 | ||||||
| Deferred income taxes | 20,205 | (148 | ) | |||||
| Stock option compensation expense | 248 | 143 | ||||||
| Restructuring and impairment charges | 18,930 | — | ||||||
| Impairment losses on investment securities | 3,510 | 316 | ||||||
| Changes in assets and liabilities: | ||||||||
| Trade receivables | 19,323 | (5,457 | ) | |||||
| Inventories | 17,816 | (6,942 | ) | |||||
| Trade accounts payable | (6,879 | ) | 6,525 | |||||
| Other accounts payable | 5,948 | (5,534 | ) | |||||
| Accrued expenses | (4,893 | ) | (1,126 | ) | ||||
| Accrued warranty expenses | (617 | ) | (8 | ) | ||||
| Accrued pension and severance cost | (1,605 | ) | (240 | ) | ||||
| Other | (3,446 | ) | 1,865 | |||||
| Net cash provided by (used in) operating activities | 2,357 | (17,746 | ) | |||||
| Cash flows from investing activities: | ||||||||
| (Increase) decrease in short-term investments | (26,210 | ) | 13,881 | |||||
| Purchase of non-marketable investment securities | (911 | ) | (389 | ) | ||||
| Proceeds from sale of property, plant and equipment | 390 | 287 | ||||||
| Purchases of property, plant and equipment | (4,909 | ) | (2,798 | ) | ||||
| Purchases of intangible assets | (645 | ) | (215 | ) | ||||
| Other | (222 | ) | 58 | |||||
Net cash provided by (used in) investing activities | (32,507 | ) | 10,824 | |||||
Cash flows from financing activities: | ||||||||
| Proceeds from sale of treasury stock | 2 | 0 | ||||||
| Payments to acquire treasury stock | (6 | ) | (4 | ) | ||||
| Dividends paid | (8,924 | ) | (1,796 | ) | ||||
| Other | (2 | ) | (3 | ) | ||||
| Net cash used in financing activities | (8,930 | ) | (1,803 | ) | ||||
| Net effect of exchange rate changes on cash and cash equivalents | (2,813 | ) | (291 | ) | ||||
| Net change in cash and cash equivalents | (41,893 | ) | (9,016 | ) | ||||
| Cash and cash equivalents at beginning of year | 147,348 | 105,455 | ||||||
| Cash and cash equivalents at end of year | ¥ | 105,455 | 96,439 | |||||
| (5) Notes on Preconditions to Going Concerns: None |
15
Advantest Corporation (FY2009)
| (6) | Notes to the Consolidated Financial Statements |
(Note 1) Accounting Principles, Procedures and the Presentation of the ConsolidatedFinancial Statements
| (a) | Terminology, Form and Method of Preparation of the Consolidated Financial Statements |
Advantest Corporation (or the “Company”) and its consolidated subsidiaries (collectively “Advantest”) prepare the consolidated financial statements in accordance with generally accepted accounting principle in the United States of America (“U.S. GAAP”). U.S. GAAP is codified in the Financial Accounting Standards Board (“FASB”) Accounting Standards Codification (“ASC”), which is the source of authoritative accounting principles recognized by the FASB to be applied by nongovernmental entities. Advantest Corporation and its consolidated subsidiaries prepare their unconsolidated financial statements in accordance with accounting principles generally accepted in the country of their domicile. Certain adjustments and reclassifications have been incorporated in the accompanying non-consolidated financial statements to present them in conformity with U.S.GAAP.
| (b) | Preparation of Consolidated Financial Statements and Registration with the U.S. Securities and Exchange Commission |
Advantest Corporation became listed on the New York Stock Exchange on September 17, 2001 (local time) by means of an issuance of American Depository Shares, and has been filing a Form 20-F (equivalent to the Annual Securities Report in Japan) with the U.S. Securities and Exchange Commission since FY2001. Advantest prepares the consolidated financial statements in its Form 20-F in accordance with U.S. GAAP.
| (c) | Scope of Consolidation and Application of the Equity Method |
Advantest’s consolidated financial statements include financial statements of Advantest Corporation and its subsidiaries, all of which are wholly-owned. Advantest is not involved with any significant variable interest entities where Advantest is the primary beneficiary, and which require consolidation in accordance with U.S. GAAP. All significant intercompany balances and transactions have been eliminated in consolidation.
The following table sets forth the number of consolidated subsidiaries and equity method affiliates of Advantest:
| FY 2008 (As of March 31, 2009) | FY 2009 (As of March 31, 2010) | Increase (decrease) | |
| Domestic | 22 | 14 | (8) |
| Overseas | 17 | 16 | (1) |
| Consolidated subsidiaries | 39 | 30 | (9) |
| Equity method affiliates | 1 | 1 | - |
| Total | 40 | 31 | (9) |
16
Advantest Corporation (FY2009)
Changes in the scope of consolidation: Excluded 9
Material changes in subsidiaries: Excluded 1 (Company name: Advantest DI Corporation *)
* Advantest DI Corporation was merged with Advantest Manufacturing, Inc. which is Advantest’s subsidiary on April 1, 2009.
| (Note 2) | Significant Accounting Policies |
There are no significant changes pertaining to accounting policies from the fiscal year 2008 Annual Report which was submitted on June 26, 2009.
| (Note 3) | Reclassifications |
Certain reclassifications have been made to the prior years’ consolidated financial statements to conform with the presentation used for the year ended March 31, 2010.
17
Advantest Corporation (FY2009)
| (Note 4) | Segment Information |
| 1. | Business Segment Information |
| Yen (Millions) | ||||||||||||||||||||
| Year ended March 31, 2009 | ||||||||||||||||||||
Semiconductor and Component Test System Business | Mechatronics System Business | Services, Support and Others | Elimination and Corporate | Total | ||||||||||||||||
Net sales to unaffiliated customers | ¥ | 48,629 | 12,208 | 15,815 | - | 76,652 | ||||||||||||||
Inter-segment sales | 587 | 2,180 | - | (2,767 | ) | - | ||||||||||||||
| Sales | 49,216 | 14,388 | 15,815 | (2,767 | ) | 76,652 | ||||||||||||||
| Depreciation and amortization | 3,893 | 1,813 | 2,668 | 345 | 8,719 | |||||||||||||||
| Operating income (loss) before stock option compensation expense | (28,914 | ) | (11,865 | ) | (1,099 | ) | (7,331 | ) | (49,209 | ) | ||||||||||
| Adjustment: | ||||||||||||||||||||
| Stock option compensation expense | 248 | |||||||||||||||||||
| Operating income (loss) | ¥ | (49,457 | ) | |||||||||||||||||
| Expenditures for additions to long-lived assets | 1,657 | 1,249 | 1,606 | 96 | 4,608 | |||||||||||||||
| Total assets | 29,449 | 11,017 | 10,773 | 150,820 | 202,059 | |||||||||||||||
| Yen (Millions) | ||||||||||||||||||||
| Year ended March 31, 2010 | ||||||||||||||||||||
| Semiconductor and Component Test System Business | Mechatronics System Business | Services, Support and Others | Elimination and Corporate | Total | ||||||||||||||||
Net sales to unaffiliated customers | ¥ | 30,168 | 11,219 | 11,838 | - | 53,225 | ||||||||||||||
Inter-segment sales | 2,404 | 18 | - | (2,422 | ) | - | ||||||||||||||
| Sales | 32,572 | 11,237 | 11,838 | (2,422 | ) | 53,225 | ||||||||||||||
| Depreciation and amortization | 1,364 | 470 | 1,977 | 503 | 4,314 | |||||||||||||||
| Operating income (loss) before stock option compensation expense | (7,042 | ) | (1,897 | ) | 2,175 | (4,732 | ) | (11,496 | ) | |||||||||||
| Adjustment: | ||||||||||||||||||||
| Stock option compensation expense | 143 | |||||||||||||||||||
| Operating income (loss) | ¥ | (11,639 | ) | |||||||||||||||||
| Expenditures for additions to long-lived assets | 942 | 396 | 1,856 | 231 | 3,425 | |||||||||||||||
| Total assets | 38,782 | 10,478 | 11,474 | 127,929 | 188,663 | |||||||||||||||
(Notes)
| 1. | Adjustments to operating income (loss) in Corporate principally represent corporate general and administrative expenses and research and development expenses related to fundamental research activities that are not allocated to operating segments. |
| 2. | Advantest uses the operating income (loss) before stock option compensation expense for management’s analysis of business segment results. |
| 3. | Total assets included in Corporate primarily consist of cash and cash equivalents assets for general corporate use and assets used for fundamental research activities, which are not allocated to reportable segments. |
18
Advantest Corporation (FY2009)
| 2. | Consolidated Net Sales by Geographical Areas |
| Yen (Millions) | ||||||||
Year ended March 31, 2009 | Year ended March 31, 2010 | |||||||
| Japan | ¥ | 24,734 | 11,976 | |||||
| Americas | 11,759 | 4,930 | ||||||
| Europe | 2,844 | 2,137 | ||||||
| Asia | 37,315 | 34,182 | ||||||
Total | ¥ | 76,652 | 53,225 | |||||
(Notes)
| 1. | Net sales to unaffiliated customers are based on the customer’s location. |
| 2. | Each of the segments includes primarily the following countries or regions: |
| (1) | Americas | U.S.A., Republic of Costa Rica, etc. | |
| (2) | Europe | Israel, Germany, etc. | |
| (3) | Asia | Taiwan, South Korea, China, Malaysia, etc. | |
| 3. | Segment Information by Geographic Area |
| Yen (Millions) | |||||||||||||||||||||||||||||
| Year ended March 31, 2009 | |||||||||||||||||||||||||||||
| Japan | Americas | Europe | Asia | Elimination and Corporate | Total | ||||||||||||||||||||||||
Net sales to unaffiliated customers | ¥ | 42,052 | 20,464 | 2,702 | 11,434 | - | 76,652 | ||||||||||||||||||||||
Inter-segment sales | 22,923 | 3,299 | 1,446 | 4,727 | (32,395 | ) | - | ||||||||||||||||||||||
| Sales | 64,975 | 23,763 | 4,148 | 16,161 | (32,395 | ) | 76,652 | ||||||||||||||||||||||
| Operating income (loss) | (44,860 | ) | 1,894 | (1,677 | ) | 1,996 | (6,810 | ) | (49,457 | ) | |||||||||||||||||||
| Total assets | ¥ | 78,830 | 25,110 | 8,135 | 29,625 | 60,359 | 202,059 | ||||||||||||||||||||||
| Yen (Millions) | |||||||||||||||||||||||||||||
| Year ended March 31, 2010 | |||||||||||||||||||||||||||||
| Japan | Americas | Europe | Asia | Elimination and Corporate | Total | ||||||||||||||||||||||||
Net sales to unaffiliated customers | ¥ | 22,831 | 12,319 | 2,100 | 15,975 | - | 53,225 | ||||||||||||||||||||||
Inter-segment sales | 26,286 | 3,266 | 1,498 | 3,915 | (34,965 | ) | - | ||||||||||||||||||||||
| Sales | 49,117 | 15,585 | 3,598 | 19,890 | (34,965 | ) | 53,225 | ||||||||||||||||||||||
| Operating income (loss) | (8,630 | ) | 704 | 226 | 1,612 | (5,551 | ) | (11,639 | ) | ||||||||||||||||||||
| Total assets | ¥ | 89,970 | 10,435 | 7,205 | 37,626 | 43,427 | 188,663 | ||||||||||||||||||||||
(Notes)
| 1. | Adjustments to operating income (loss) in Corporate principally represent corporate general and administrative expenses and research and development expenses related to fundamental research activities that are not allocated to corporate general administrative expense and segment by geographic area. Stock option expense of (Y) 248 million and (Y) 143 million for FY2008 and FY2009, respectively, are included in Corporate operating expenses. |
| 2. | Total assets included in Corporate primarily consist of the parent company’s cash and cash equivalents, assets for general corporate use and assets used for fundamental research activities. |
19
Advantest Corporation (FY2009)
(Note 5) Per Share information
The following table sets forth the computation of basic and diluted net income (loss) per share for the years ended March 31:
| Yen (millions) | ||||||||
| except per share data | ||||||||
| Year ended March 31, 2009 | Year ended March 31, 2010 | |||||||
| Numerator: | ||||||||
| Net income (loss) | (74,902 | ) | (11,454 | ) | ||||
| Denominator | ||||||||
Basic weighted average shares of common stock outstanding | 178,724,884 | 178,722,505 | ||||||
Dilutive effect of exercise of stock options | - | - | ||||||
Diluted weighted average shares of common stock outstanding | 178,724,884 | 178,722,505 | ||||||
| Basic net income (loss) per share | (419.09 | ) | (64.09 | ) | ||||
| Diluted net income (loss) per share | (419.09 | ) | (64.09 | ) | ||||
At March 31, 2009 and 2010, Advantest had outstanding stock options into 3,938,980 and 3,060,000 shares of common stock, respectively, which were anti-dilutive and excluded from the calculation of diluted net income per share but could potentially dilute net income per share in future periods.
(Omission of Disclosure)
For purpose of annual release in Japan, notes for lease transactions, related party transactions, income taxes, financial instruments, securities, derivative transactions, accrued pension and severance costs, stock options, among others, have not been disclosed because such disclosure in this consolidated financial results is not considered significant for this presentation in Japan.
20
Advantest Corporation (FY2009)
(All non-consolidated financial information has been prepared in accordance
with accounting principles generally accepted in Japan.)
| 5. | Non-Consolidated Financial Statements |
| (1) | Non-Consolidated Balance Sheets (Unaudited) |
| Yen (Millions) | ||||||||
| March 31, 2009 | March 31, 2010 | |||||||
| Assets | ||||||||
| Current assets | ||||||||
| Cash and deposits | ¥ | 63,857 | 52,542 | |||||
| Trade notes receivables | 40 | 414 | ||||||
| Accounts receivable | 7,714 | 15,901 | ||||||
| Short-term investments | 17,300 | 16,900 | ||||||
| Merchandises and finished goods | 2,763 | 3,993 | ||||||
| Work in process | 3,573 | 6,910 | ||||||
| Raw materials and supplies | 608 | 2,104 | ||||||
| Short-term loans receivable | 2,466 | 2,192 | ||||||
| Other receivable | 944 | 939 | ||||||
| Refundable income taxes | 2,022 | 66 | ||||||
| Other | 499 | 613 | ||||||
| Allowance for doubtful accounts | (724 | ) | (50 | ) | ||||
| Total current assets | 101,062 | 102,524 | ||||||
| Noncurrent assets | ||||||||
| Property, plant and equipment | ||||||||
| Buildings | 43,860 | 43,609 | ||||||
| Accumulated depreciation | (31,890 | ) | (32,946 | ) | ||||
| Buildings, net | 11,970 | 10,663 | ||||||
| Structures | 3,896 | 3,894 | ||||||
| Accumulated depreciation | (3,281 | ) | (3,376 | ) | ||||
| Structures, net | 615 | 518 | ||||||
| Machinery and equipment | 19,164 | 18,319 | ||||||
| Accumulated depreciation | (18,295 | ) | (17,382 | ) | ||||
| Machinery and equipment, net | 869 | 937 | ||||||
| Vehicles and delivery equipment | 40 | 45 | ||||||
| Accumulated depreciation | (29 | ) | (28 | ) | ||||
| Vehicles and delivery equipment, net | 11 | 17 | ||||||
| Tools and furniture | 11,712 | 11,021 | ||||||
| Accumulated depreciation | (11,308 | ) | (10,461 | ) | ||||
| Tools and furniture, net | 404 | 560 | ||||||
| Land | 15,907 | 15,852 | ||||||
| Construction in progress | 1 | 6 | ||||||
| Total property, plant and equipment | ¥ | 29,777 | 28,553 | |||||
| (Note) Accumulated depreciation includes the accumulated impairment losses. | ||||||||
21
Advantest Corporation (FY2009)
(All non-consolidated financial information has been prepared in accordance
with accounting principles generally accepted in Japan.)
| Yen (Millions) | ||||||||
| March 31, 2009 | March 31, 2010 | |||||||
| Intangible fixed assets | ||||||||
| Patent rights | ¥ | 50 | 25 | |||||
| Leasehold rights | 173 | 173 | ||||||
| Telephone rights | 40 | 40 | ||||||
| Utility rights | 10 | 8 | ||||||
| Software | 298 | 344 | ||||||
| Other | 8 | 5 | ||||||
| Total intangible fixed assets | 579 | 595 | ||||||
| Investments and other assets | ||||||||
| Investment securities | 6,669 | 7,656 | ||||||
| Investment in affiliated companies | 17,425 | 16,980 | ||||||
| Long-term loans receivable | 7 | 11 | ||||||
| Long-term loans to affiliated companies | 1,137 | 250 | ||||||
| Long-term prepaid expenses | 309 | 215 | ||||||
| Other | 958 | 855 | ||||||
| Allowance for doubtful accounts | (39 | ) | — | |||||
| Total investments and other assets | 26,466 | 25,967 | ||||||
Total noncurrent assets | 56,822 | 55,115 | ||||||
| Total assets | 157,884 | 157,639 | ||||||
| Liabilities | ||||||||
| Current liabilities | ||||||||
| Trade accounts payable | 5,852 | 11,067 | ||||||
| Other accounts payable | 3,007 | 572 | ||||||
| Accrued expenses | 5,094 | 3,616 | ||||||
| Income tax payable | 1 | 1 | ||||||
| Advance received | 24 | 34 | ||||||
| Deposits received | 3,458 | 4,004 | ||||||
| Allowance for product warranty | 2,642 | 2,727 | ||||||
| Other | 138 | 79 | ||||||
| Total current liabilities | 20,216 | 22,100 | ||||||
| Noncurrent liabilities | ||||||||
| Allowance for retirement benefits | 4,382 | 5,520 | ||||||
| Deferred tax liabilities | 81 | 587 | ||||||
| Other | 1,183 | 785 | ||||||
| Total noncurrent liabilities | 5,646 | 6,892 | ||||||
| Total liabilities | ¥ | 25,862 | 28,992 | |||||
22
Advantest Corporation (FY2009)
(All non-consolidated financial information has been prepared in accordance
with accounting principles generally accepted in Japan.)
| Yen (Millions) | ||||||||
| March 31, 2009 | March 31, 2010 | |||||||
| Net assets | ||||||||
| Stockholders' equity | ||||||||
| Common stock | ¥ | 32,363 | 32,363 | |||||
| Capital surplus | ||||||||
| Capital reserve | 32,973 | 32,973 | ||||||
| Total capital surplus | 32,973 | 32,973 | ||||||
| Retained earnings | ||||||||
| Legal reserve | 3,083 | 3,083 | ||||||
| Other retained earnings | ||||||||
| Reserve for losses in foreign investments | 27,062 | 27,062 | ||||||
| General reserve | 146,880 | 146,880 | ||||||
| Retained earnings (accumulated loss) | (24,208 | ) | (28,398 | ) | ||||
| Total retained earnings | 152,817 | 148,627 | ||||||
| Treasury stock | (89,328 | ) | (89,331 | ) | ||||
| Total stockholders' equity | 128,825 | 124,632 | ||||||
| Difference of appreciation and conversion | ||||||||
| Net unrealized gains on securities | 120 | 862 | ||||||
| Total difference of appreciation and conversion | 120 | 862 | ||||||
| Stock acquisition rights | 3,077 | 3,153 | ||||||
| Total net assets | 132,022 | 128,647 | ||||||
| Total liabilities and net assets | ¥ | 157,884 | 157,639 | |||||
23
Advantest Corporation (FY2009)
(All non-consolidated financial information has been prepared in accordance
with accounting principles generally accepted in Japan.)
| (2) Non-Consolidated Statements of Operations (Unaudited) | ||||||||
| Yen (Millions) | ||||||||
| Year ended | Year ended | |||||||
| March 31, 2009 | March 31, 2010 | |||||||
| Net sales | ¥ | |||||||
| Net product sales | 53,124 | 41,907 | ||||||
| Cost of sales | ||||||||
| Finished goods at beginning of year | 5,093 | 2,763 | ||||||
| Cost of manufactured goods | 40,900 | 26,443 | ||||||
| Total | 45,993 | 29,206 | ||||||
| Transfers to other accounts | 489 | 252 | ||||||
| Finished goods at end of year | 2,763 | 3,993 | ||||||
| Balance of cost of sales | 42,741 | 24,961 | ||||||
| Gross profit | 10,383 | 16,946 | ||||||
| Selling, general and administrative expenses | 46,410 | 34,253 | ||||||
| Operating income (loss) | (36,027 | ) | (17,307 | ) | ||||
| Non-operating income | ||||||||
| Interest income | 984 | 290 | ||||||
| Dividends income | 786 | 13,583 | ||||||
| Lease income | 2,342 | 1,788 | ||||||
| Miscellaneous income | 1,052 | 1,431 | ||||||
| Total non-operating income | 5,164 | 17,092 | ||||||
| Non-operating expenses | ||||||||
| Interest expenses | 33 | 11 | ||||||
| Allowance for doubtful account | 79 | — | ||||||
| Expenses for leased equipment | 3,278 | 1,440 | ||||||
| Foreign exchange losses | 1,383 | — | ||||||
| Impairment losses on investment securities | 3,603 | 259 | ||||||
| Miscellaneous expenses | 568 | 459 | ||||||
| Total non-operating expenses | 8,944 | 2,169 | ||||||
| Ordinary income (loss) | (39,807 | ) | (2,384 | ) | ||||
| Extraordinary income | ||||||||
| Gain on extinguishment of tie-in shares | 61 | — | ||||||
| Total extraordinary income | 61 | — | ||||||
| Extraordinary loss | ||||||||
| Impairment losses | 11,789 | — | ||||||
| Additonal termination benefit | 1,631 | — | ||||||
| Other | 83 | — | ||||||
| Total extraordinary loss | 13,503 | — | ||||||
| Income (loss) before income taxes | (53,249 | ) | (2,384 | ) | ||||
| Income taxes - current | (937 | ) | 18 | |||||
| Income taxes - deferred | 15,754 | — | ||||||
| Total income taxes | 14,817 | 18 | ||||||
| Net income (loss) | ¥ | (68,066 | ) | (2,402 | ) | |||
24
Advantest Corporation (FY2009)
(All non-consolidated financial information has been prepared in accordance
with accounting principles generally accepted in Japan.)
| (3) Non-Consolidated statements of Changes in Stockholders' Equity (Unaudited) | ||||||||
| Yen (Millions) | ||||||||
| Year ended | Year ended | |||||||
| March 31, 2009 | March 31, 2010 | |||||||
| Stockholders' Equity | ||||||||
| Common stock | ||||||||
| Balance at beginning of year | ¥ | 32,363 | 32,363 | |||||
| Changes in the year | ||||||||
| Total changes in the year | — | — | ||||||
| Balance at end of year | 32,363 | 32,363 | ||||||
| Capital surplus | ||||||||
| Capital reserve | ||||||||
| Balance at beginning of year | 32,973 | 32,973 | ||||||
| Changes in the year | ||||||||
| Total changes in the year | — | — | ||||||
| Balance at end of year | 32,973 | 32,973 | ||||||
| Retained earnings | ||||||||
| Legal reserve | ||||||||
| Balance at beginning of year | 3,083 | 3,083 | ||||||
| Changes in the year | ||||||||
| Total changes in the year | — | — | ||||||
| Balance at end of year | 3,083 | 3,083 | ||||||
| Other retained earnings | ||||||||
| Reserve for losses in foreign investments | ||||||||
| Balance at beginning of year | 27,062 | 27,062 | ||||||
| Changes in the year | ||||||||
| Total changes in the year | — | — | ||||||
| Balance at end of year | 27,062 | 27,062 | ||||||
| General reserve | ||||||||
| Balance at beginning of year | 146,880 | 146,880 | ||||||
| Changes in the year | ||||||||
| Total changes in the year | — | — | ||||||
| Balance at end of year | 146,880 | 146,880 | ||||||
| Retained earnings (accumulated loss) | ||||||||
| Balance at beginning of year | 52,797 | (24,208 | ) | |||||
| Changes in the year | ||||||||
| Dividends from retained earnings | (8,936 | ) | (1,787 | ) | ||||
| Net income (loss) | (68,066 | ) | (2,402 | ) | ||||
| Sale of treasury stock | (3 | ) | (1 | ) | ||||
| Total changes in the year | (77,005 | ) | (4,190 | ) | ||||
| Balance at end of year | ¥ | (24,208 | ) | (28,398 | ) | |||
25
Advantest Corporation (FY2009)
(All non-consolidated financial information has been prepared in accordance
with accounting principles generally accepted in Japan.)
| Yen (Millions) | ||||||||
| Year ended | Year ended | |||||||
| March 31, 2009 | March 31, 2010 | |||||||
| Treasury stock | ||||||||
| Balance at beginning of year | ¥ | (89,325 | ) | (89,328 | ) | |||
| Changes in the year | ||||||||
| Repurchase of treasury stock | (7 | ) | (4 | ) | ||||
| Sale of treasury stock | 4 | 1 | ||||||
| Total changes in the year | (3 | ) | (3 | ) | ||||
| Balance at end of year | (89,328 | ) | (89,331 | ) | ||||
| Total stockholders' equity | ||||||||
| Balance at beginning of year | 205,833 | 128,825 | ||||||
| Changes in the year | ||||||||
| Dividends from retained earnings | (8,936 | ) | (1,787 | ) | ||||
| Net income (loss) | (68,066 | ) | (2,402 | ) | ||||
| Repurchase of treasury stock | (7 | ) | (4 | ) | ||||
| Sale of treasury stock | 1 | 0 | ||||||
| Total changes in the year | (77,008 | ) | (4,193 | ) | ||||
| Balance at end of year | 128,825 | 124,632 | ||||||
| Difference of appreciation and conversion | ||||||||
| Net unrealized gains on securities | ||||||||
| Balance at beginning of year | 309 | 120 | ||||||
| Changes in the year | ||||||||
| Changes of items other than stockholders' equity, net | (189 | ) | 742 | |||||
| Total changes in the year | (189 | ) | 742 | |||||
| Balance at end of year | 120 | 862 | ||||||
| Stock acquisition rights | ||||||||
| Balance at beginning of year | 3,122 | 3,077 | ||||||
| Changes in the year | ||||||||
| Changes of items other than stockholders' equity, net | (45 | ) | 76 | |||||
| Total changes in the year | (45 | ) | 76 | |||||
| Balance at end of year | 3,077 | 3,153 | ||||||
| Total net assets | ||||||||
| Balance at beginning of year | 209,264 | 132,022 | ||||||
| Changes in the year | ||||||||
| Dividends from retained earnings | (8,936 | ) | (1,787 | ) | ||||
| Net income (loss) | (68,066 | ) | (2,402 | ) | ||||
| Repurchase of treasury stock | (7 | ) | (4 | ) | ||||
| Sale of treasury stock | 1 | 0 | ||||||
| Changes of items other than stockholders' equity, net | (234 | ) | 818 | |||||
| Total changes in the year | (77,242 | ) | (3,375 | ) | ||||
| Balance at end of year | ¥ | 132,022 | 128,647 | |||||
| (4) Notes on Preconditions to Going Concerns: None | ||||||||
26
Advantest Corporation (FY2009)
(All non-consolidated financial information has been prepared in accordance
with accounting principles generally accepted in Japan.)
| (5) | Notes on Non-Consolidated Financial Statements |
(Significant subsequent event)
The Merger of Subsidiaries
The Company resolved at the meeting of its Board of Directors on April 27, 2010 to merge its consolidated subsidiaries.
1. Purpose of the Merger
The subsidiaries to be merged are wholly-owned consolidated subsidiaries of the Company, which engage in manufacture and/or maintenance service of the Company’s products. The Company will merge the subsidiaries, and review their R&D, manufacturing, sales, and service processes to further align them with the Company’s customer requirements, speeding up the implementation of its management strategy and seeking greater business efficiency.
2. Overview of the Merger
| ① | Merger method |
Each subsidiary will be merged into the Company as the surviving company and such subsidiary will be dissolved.
| ② | Details of the allotment upon the Merger |
As the Company owns all shares of each subsidiary, there will be no issuance of new shares, increase of share capital or cash payment upon the merger for either subsidiary.
| ③ | Outline of participants in the merger (as of March 31, 2010) |
| Registered trade name | Advantest Manufacturing, Inc. |
| Business description | Manufacture of the Company’s products |
| Sales | (Y) 10,361 million |
| Net income | (Y) 1,236 million |
| Stockholders’ equity | (Y) 2,327 million |
| Total assets | (Y) 3,648 million |
| Registered trade name | Advantest Customer Support Corporation |
| Business description | Maintenance service of the Company’s products |
| Sales | (Y) 4,655 million |
| Net income | (Y) 371 million |
| Stockholders’ equity | (Y) 2,549 million |
| Total assets | (Y) 3,216 million |
| ④ | Date of Merger (the effective date) |
July 1, 2010 (as planned)
27
Changes in Directors and Executive Officers
(To be effective on June 24, 2010)
| 1. | Nominees for Directors |
| Director | Toshio Maruyama |
| Director | Haruo Matsuno |
| Director | Naoyuki Akikusa |
| Director | Yasushige Hagio |
| Director | Yuichi Kurita |
| Director | Hiroshi Tsukahara |
| Director | Hiroyasu Sawai |
| Director | Shinichiro Kuroe |
Mr. Maruyama is to be elected as Chairman of the Board and Representative Director and Mr. Matsuno is to be elected as Representative Director at the special meeting of the board of directors to be held on June 24, 2010 after the 68th ordinary general meeting of shareholders of Advantest Corporation.
| 2. | Nominees for Executive Officers |
| President and CEO | Haruo Matsuno |
| Senior Executive Officer | Yuichi Kurita (to be promoted) |
| Managing Executive Officer of Advantest Corporation | |
| Managing Executive Officer | Hiroshi Tsukahara |
| Managing Executive Officer | Hiroyasu Sawai |
| Managing Executive Officer | Shinichiro Kuroe |
| Managing Executive Officer | Hiroshi Nakamura |
| Managing Executive Officer | Yoshiaki Yoshida |
| Managing Executive Officer | Masao Shimizu (to be promoted) |
| Executive Officer of Advantest Corporation | |
| Executive Officer | Hideaki Imada |
| Executive Officer | Yasuhiro Kawata |
| Executive Officer | Takashi Sugiura |
| Executive Officer | Takashi Sekino |
| Executive Officer | Sae Bum Myung |
| Executive Officer | Soichi Tsukakoshi |
| Executive Officer | Josef Schraetzenstaller |
| Executive Officer | R. Keith Lee |
| 3. | Resignation from Directors and Executive Officers |
Takashi Tokuno, Director and Senior Executive Officer
--- To be elected as Advisor
Yoshiro Yagi, Managing Executive Officer
--- To be elected as Advisor
28