UNITED STATES
SECURITIES AND EXCHANGE COMMISSION
Washington, D.C. 20549
FORM N-CSR
CERTIFIED SHAREHOLDER REPORT OF REGISTERED MANAGEMENT INVESTMENT COMPANIES
Investment Company Act file number 811-10503
Name of Fund: BlackRock New York Municipal 2018 Term Trust (BLH)
Fund Address: 100 Bellevue Parkway, Wilmington, DE 19809
Name and address of agent for service: John M. Perlowski, Chief Executive Officer, BlackRock New York Municipal 2018 Term Trust, 55 East 52nd Street, New York, NY 10055
Registrant’s telephone number, including area code: (800) 882-0052, Option 4
Date of fiscal year end: 12/31/2013
Date of reporting period: 06/30/2013
Item 1 – Report to Stockholders
JUNE 30, 2013
| SEMI-ANNUAL REPORT (UNAUDITED) | |  |
BlackRock California Municipal 2018 Term Trust (BJZ)
BlackRock Municipal 2018 Term Trust (BPK)
BlackRock New York Municipal 2018 Term Trust (BLH)
Not FDIC Insured • May Lose Value • No Bank Guarantee |
Table of Contents
Page |
| | | | | 3 | |
Semi-Annual Report:
| | | | | | |
| | | | | 4 | |
| | | | | 5 | |
| | | | | 6 | |
Financial Statements:
| | | | | | |
| | | | | 12 | |
| | | | | 23 | |
| | | | | 24 | |
| | | | | 25 | |
| | | | | 26 | |
| | | | | 29 | |
| | | | | 35 | |
| | | | | 39 | |
| | | | | 40 | |
| 2 | SEMI-ANNUAL REPORT | JUNE 30, 2013
|
One year ago, risk assets (such as equities) were on the rise as weakening global economic data spurred increasing optimism that the world’s largest central banks would intervene to stimulate growth. This theme, along with the European Central Bank’s (“ECB’s”) firm commitment to preserve the euro currency bloc, drove most asset classes higher through the summer of 2012. The much-anticipated monetary stimulus ultimately came in September when the ECB and the US Federal Reserve announced their plans for increasing global liquidity.
Although financial markets worldwide were buoyed by these aggressive policy actions, risk assets weakened later in the fall of 2012. Global trade slowed as many European countries fell into recession and growth continued to decelerate in China. In the United States, stocks slid on lackluster corporate earnings, and volatility rose in advance of the US Presidential election. In the post-election environment, investors became increasingly concerned about the “fiscal cliff” of tax increases and spending cuts that had been scheduled to take effect at the beginning of 2013. High levels of global market volatility persisted through year-end due to fears that bipartisan gridlock would preclude a timely resolution, putting the US economy at high risk for recession. As 2013 began, the worst of the fiscal cliff was averted with a last-minute tax deal.
Investors shook off the nerve-wracking finale to 2012 and the New Year started with a powerful relief rally. Money that had been pulled to the sidelines amid year-end tax-rate uncertainty poured back into the markets in January. Key indicators signaling modest but broad-based improvements in the world’s major economies underpinned the rally. Underlying this aura of comfort was the absence of negative headlines from Europe. Global equities surged, while rising US Treasury yields pressured high quality fixed income assets. (Bond prices move inversely with yields.)
However, February brought a slowdown in global economic momentum and investors toned down their risk appetite. In the months that followed, US equities outperformed international markets, as the US economic recovery showed greater stability compared to most other regions. Slow, but positive growth in the United States was sufficient to support corporate earnings, while uncomfortably high unemployment reinforced investors’ expectations that the US Federal Reserve would keep interest rates low. US equities moved higher through the spring, with major indices notching a string of all-time highs until finally peaking in late May. Markets abruptly reversed course on May 22 when the US Federal Reserve hinted at a gradual pull-back on monetary policy accommodation. Volatility picked up considerably after this announcement and risk assets broadly slid through the remainder of the period.
Volatility has been higher in financial markets outside the United States in 2013. International equities weakened in the middle of the first quarter when political instability in Italy and a severe banking crisis in Cyprus reminded investors that the eurozone was still vulnerable to a number of macro risks. A poor outlook for European economies already mired in recession further dampened sentiment. Emerging markets significantly lagged the rest of the world as growth in these economies (particularly China and Brazil) fell short of expectations.
Despite recent weakness, most risk asset classes generated positive returns for the 6- and 12-month periods ended June 30, 2013, while high quality fixed income assets posted modestly negative results. US equities were particularly strong. International equities also performed well, although rising uncertainty in Europe resulted in less impressive gains for the last six months. Emerging markets were especially hurt by slowing growth and concerns about a shrinking global money supply. US Treasury yields remained low from a historical perspective, but were highly volatile and rose sharply in the final two months of the period amid concerns about monetary policy tightening. In this volatile rate environment, US Treasury and investment grade corporate bond prices declined. Returns on high yield and tax-exempt municipal bonds, which had benefited from supportive market conditions during most of the period, were also weighed down by the recent spike in rates. Short-term interest rates, however, remained near zero, keeping yields on money market securities near historical lows.
Market conditions remain volatile, and investors still face a number of uncertainties in the current environment. At BlackRock, we believe investors need to think globally and extend their scope across a broader array of asset classes in a portfolio that moves freely as market conditions change over time. We encourage you to talk with your financial advisor and visit www.blackrock.com for further insight about investing in today’s world.
Sincerely,
Rob Kapito
President, BlackRock Advisors, LLC

Despite recent weakness, most risk asset classes generated positive returns for the 6- and 12-month periods ended June 30, 2013, while high quality fixed income assets posted modestly negative results.” | Rob Kapito
President, BlackRock Advisors, LLC
Total Returns as of June 30, 2013 | | | | 6-month | | 12-month |
US large cap equities
(S&P 500® Index) | | | | | 13.82 | % | | | 20.60 | % |
US small cap equities
(Russell 2000® Index) | | | | | 15.86 | | | | 24.21 | |
International equities
(MSCI Europe, Australasia,
Far East Index) | | | | | 4.10 | | | | 18.62 | |
Emerging market equities
(MSCI Emerging Markets
Index) | | | | | (9.57 | ) | | | 2.87 | |
3-month Treasury bill
(BofA Merrill Lynch
3-Month US Treasury
Bill Index) | | | | | 0.04 | | | | 0.11 | |
US Treasury securities
(BofA Merrill Lynch
10-Year US Treasury Index) | | | | | (4.88 | ) | | | (4.21 | ) |
US investment grade
bonds (Barclays US
Aggregate Bond Index) | | | | | (2.44 | ) | | | (0.69 | ) |
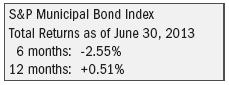
Tax-exempt municipal
bonds (S&P Municipal
Bond Index) | | | | | (2.55 | ) | | | 0.51 | |
US high yield bonds
(Barclays US Corporate
High Yield 2% Issuer
Capped Index) | | | | | 1.42 | | | | 9.49 | |
Past performance is no guarantee of future results. Index performance is shown for illustrative purposes only. You cannot invest directly in an index.
| THIS PAGE NOT PART OF YOUR FUND REPORT | | 3
|
| |
| Municipal Market Overview |
|
For the Reporting Period Ended June 30, 2013
Municipal Market Conditions
During the majority of the period, municipal bond supply was met with strong demand as investors were starved for yield in the low-rate, low-return environment. Investors poured into municipal bond mutual funds, favoring long-duration and high-yield funds as they tend to provide higher levels of income. For the 12 months ended June 30, 2013, municipal bond fund inflows exceeded $13.6 billion (according to the Investment Company Institute).
Market conditions turned less favorable in the final two months of the period when signals from the US Federal Reserve suggesting a retrenchment of its bond-buying stimulus program led to rising interest rates and waning demand. (Bond prices fall as rates rise.) High levels of interest rate volatility resulted in a sharp curtailment of tax-exempt issuance in May and June. However, from a historical perspective, total new issuance for the 12 months ended June 30, 2013 remained relatively strong at $356 billion (down only slightly from the $366 billion issued in the prior 12-month period). A significant portion of new supply during this period (roughly 60%) was attributable to refinancing activity as issuers took advantage of lower interest rates to reduce their borrowing costs. Total new supply was also supported by recent activity in the taxable market, where taxable-municipal issuance was up 89% year-over-year.
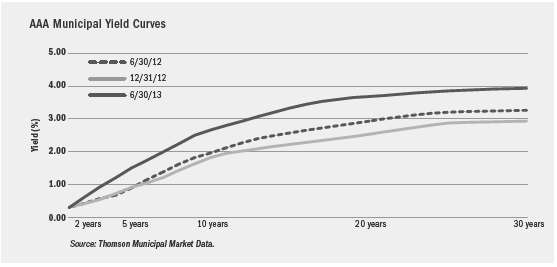
A Closer Look at Yields
From June 30, 2012 to June 30, 2013, muni yields increased by 67 basis points (“bps”) from 3.16% to 3.83% on AAA-rated 30-year municipal bonds, while increasing 70 bps from 1.86% to 2.56% on 10-year bonds and raising another 61 bps from 0.79% to 1.40% on 5-year issues (as measured by Thomson Municipal Market Data). Overall, the municipal yield curve remained relatively steep over the 12-month period as the spread between 2- and 30-year maturities widened by 49 bps and the spread between 2- and 10-year maturities widened by 52 bps.
During the same time period, US Treasury rates rose by 75 bps on 30-year and 84 bps on 10-year bonds, while moving up 68 bps in 5-years. Accordingly, tax-exempt municipal bonds moderately outperformed Treasuries across the yield curve. This outperformance was driven largely by a supply/demand imbalance within the municipal market while evidence of a recovering domestic economy coupled with the removal of certain political and tax policy uncertainties pushed interest rates higher. Additionally, as higher US tax rates began to appear imminent late in 2012, municipal bonds benefited from the increased appeal of tax-exempt investing. The municipal market has become an attractive avenue for investors seeking yield in the low-rate, low-return environment as the asset class is known for its lower volatility and preservation of principal with an emphasis on income as tax rates rise.
Financial Conditions of Municipal Issuers Continue to Improve
Following an extended period of nation-wide austerity and de-leveraging as states sought to balance their budgets, 13 consecutive quarters of positive revenue growth coupled with the elimination of more than 750,000 jobs in recent years have put state and local governments in a better financial position. Many local municipalities, however, continue to face increased health care and pension costs passed down from the state level. BlackRock maintains the view that municipal bond defaults will be minimal and remain in the periphery, and that the overall market is fundamentally sound. We continue to recognize that careful credit research, appropriate structure and security selection remain imperative amid uncertainty in this fragile economic environment.
Past performance is no guarantee of future results. Index performance is shown for illustrative purposes only. You cannot invest directly in an index.
| 4 | SEMI-ANNUAL REPORT | JUNE 30, 2013
|
| |
| The Benefits and Risks of Leveraging |
|
The Trusts may utilize leverage to seek to enhance the yield and net asset value (“NAV”) of their common shares (“Common Shares”). However, these objectives cannot be achieved in all interest rate environments.
To obtain leverage, the Trusts issue Auction Market Preferred Shares (“Preferred Shares”), which pay dividends at prevailing short-term interest rates, and the Trusts invest the proceeds in long-term municipal bonds. In general, the concept of leveraging is based on the premise that the financing cost of assets to be obtained from leverage, which will be based on short-term interest rates, will normally be lower than the income earned by each Trust on its longer-term portfolio investments. To the extent that the total assets of each Trust (including the assets obtained from leverage) are invested in higher-yielding portfolio investments, each Trust’s shareholders will benefit from the incremental net income.
The interest earned on securities purchased with the proceeds from leverage is paid to shareholders in the form of dividends, and the value of these portfolio holdings is reflected in the per share NAV. However, in order to benefit shareholders, the yield curve must be positively sloped; that is, short-term interest rates must be lower than long-term interest rates. If the yield curve becomes negatively sloped, meaning short-term interest rates exceed long-term interest rates, income to shareholders will be lower than if the Trusts had not used leverage.
To illustrate these concepts, assume a Trust’s Common Shares capitalization is $100 million and it issues Preferred Shares for an additional $50 million, creating a total value of $150 million available for investment in long-term municipal bonds. If prevailing short-term interest rates are 3% and long-term interest rates are 6%, the yield curve has a strongly positive slope. In this case, the Trust pays dividends on the $50 million of Preferred Shares based on the lower short-term interest rates. At the same time, the securities purchased by the Trust with assets received from Preferred Shares issuance earn income based on long-term interest rates. In this case, the dividends paid to holders of Preferred Shares (“Preferred Shareholders”) are significantly lower than the income earned on the Trust’s long-term investments, and therefore the holders of Common Shares (“Common Shareholders”) are the beneficiaries of the incremental net income.
If short-term interest rates rise, narrowing the differential between short-term and long-term interest rates, the incremental net income pickup will be reduced or eliminated completely. Furthermore, if prevailing short-term interest rates rise above long-term interest rates, the yield curve has a negative slope. In this case, the Trust pays higher short-term interest rates whereas the Trust’s total portfolio earns income based on lower long-term interest rates.
Furthermore, the value of the Trusts’ portfolio investments generally varies inversely with the direction of long-term interest rates, although other factors can influence the value of portfolio investments. In contrast, the redemption value of the Trusts’ Preferred Shares does not fluctuate in relation to interest rates. As a result, changes in interest rates can influence the Trusts’ NAVs positively or negatively in addition to the impact on Trust performance from leverage from Preferred Shares discussed above.
The Trusts may also leverage their assets through the use of tender option bond trusts (“TOBs”), as described in Note 3 of the Notes to Financial Statements. TOB investments generally will provide the Trusts with economic benefits in periods of declining short-term interest rates, but expose the Trusts to risks during periods of rising short-term interest rates similar to those associated with Preferred Shares issued by the Trusts, as described above. Additionally, fluctuations in the market value of municipal bonds deposited into the TOB trust may adversely affect each Trust’s NAV per share.
The use of leverage may enhance opportunities for increased income to the Trusts and Common Shareholders, but as described above, it also creates risks as short- or long-term interest rates fluctuate. Leverage also will generally cause greater changes in the Trusts’ NAVs, market prices and dividend rates than comparable portfolios without leverage. If the income derived from securities purchased with assets received from leverage exceeds the cost of leverage, the Trusts’ net income will be greater than if leverage had not been used. Conversely, if the income from the securities purchased is not sufficient to cover the cost of leverage, each Trust’s net income will be less than if leverage had not been used, and therefore the amount available for distribution to Common Shareholders will be reduced. Each Trust may be required to sell portfolio securities at inopportune times or at distressed values in order to comply with regulatory requirements applicable to the use of leverage or as required by the terms of leverage instruments, which may cause a Trust to incur losses. The use of leverage may limit each Trust’s ability to invest in certain types of securities or use certain types of hedging strategies, such as in the case of certain restrictions imposed by rating agencies that rate the Preferred Shares issued by the Trusts. Each Trust will incur expenses in connection with the use of leverage, all of which are borne by Common Shareholders and may reduce income to the Common Shares.
Under the Investment Company Act of 1940, as amended (the “1940 Act”), the Trusts are permitted to issue senior securities in the form of equity securities (e.g., Preferred Shares) up to 50% of their total managed assets (each Trust’s total assets less the sum of its accrued liabilities). In addition, each Trust voluntarily limits its economic leverage to 50% of its total managed assets. As of June 30, 2013, the Trusts had economic leverage from Preferred Shares and/or TOBs as a percentage of their total managed assets as follows:
|
| Percent of
Economic
Leverage
|
BJZ | 31% |
BPK | 26% |
BLH | 32% |
| SEMI-ANNUAL REPORT | JUNE 30, 2013 | 5
|
| |
| Trust Summary as of June 30, 2013 | BlackRock California Municipal 2018 Term Trust
|
Trust Overview
BlackRock California Municipal 2018 Term Trust’s (BJZ) (the “Trust”) investment objectives seek to provide current income exempt from regular federal and California income taxes and to return $15 per common share to holders of common shares on or about December 31, 2018. The Trust seeks to achieve its investment objectives by investing, under normal market conditions, at least 80% of its total assets in municipal bonds that at the time of investment are investment grade quality.
No assurance can be given that the Trust’s investment objective will be achieved.
Performance
• | | For the six months ended June 30, 2013, the Trust returned (3.57)% based on market price and (1.32)% based on net asset value (“NAV”). The Trust’s peer group of closed-end funds in the Lipper California Municipal Debt Funds category posted an average return of (7.59)% based on market price and (5.41)% based on NAV for the same period. All returns reflect reinvestment of dividends. The Trust’s premium to NAV, which narrowed during the period, accounts for the difference between performance based on price and performance based on NAV. The following discussion pertains to performance based on NAV. |
• | | The Trust’s performance was negative given the broad decline across the municipal market during the period. Interest rates moved higher with increasing volatility in response to comments from the US Federal Reserve alluding to tapering its bond-buying stimulus program. (Bond prices fall as interest rates rise.) The Trust’s longer duration holdings and exposure to zero-coupon bonds were the greatest detractors from performance as these securities are more sensitive to interest rate movements. Higher-rated bonds declined more than lower-quality issues, which were supported by investors seeking higher yields. The Trust’s positions in high-quality bonds in the education, utilities and transportation sectors were particularly negative for the period. |
• | | There were no positive contributors to performance on an absolute basis as all areas of the municipal market posted losses for the period. However, the Trust benefited from the accrual of income generated on its fully invested portfolio of tax-exempt municipal bonds. The Trust is scheduled to mature on or about December 31, 2018 and thus holds securities that will mature close to that date. The Trust’s shorter maturity profile was an advantage in comparison to its Lipper category peers that typically hold longer-dated issues as rate increases were significantly larger further out on the yield curve, driving prices lower on longer-dated issues. |
| | The views expressed reflect the opinions of BlackRock as of the date of this report and are subject to change based on changes in market, economic or other conditions. These views are not intended to be a forecast of future events and are no guarantee of future results. |
Trust Information
Symbol on New York Stock Exchange (“NYSE”) | | | | BJZ |
Initial Offering Date | | | | October 26, 2001 |
Termination Date (on or about) | | | | December 31, 2018 |
Yield on Closing Market Price as of June 30, 2013 ($15.32)1 | | | | 4.02% |
Tax Equivalent Yield2 | | | | 8.19% |
Current Monthly Distribution per Common Share3 | | | | $0.0513 |
Current Annualized Distribution per Common Share3 | | | | $0.6156 |
Economic Leverage as of June 30, 20134 | | | | 31% |
| 1 | | Yield on closing market price is calculated by dividing the current annualized distribution per share by the closing market price. Past performance does not guarantee future results. |
| 2 | | Tax equivalent yield assumes the maximum marginal federal and state tax rate of 50.93%, which includes the 3.8% Medicare tax. Actual tax rates will vary based on income, exemptions and deductions. Lower taxes will result in lower tax equivalent yields. |
| 3 | | The distribution rate is not constant and is subject to change. |
| 4 | | Represents Preferred Shares as a percentage of total managed assets, which is the total assets of the Trust, including any assets attributable to Preferred Shares, minus the sum of accrued liabilities. For a discussion of leveraging techniques utilized by the Trust, please see The Benefits and Risks of Leveraging on page 5. |
| 6 | SEMI-ANNUAL REPORT | JUNE 30, 2013
|
| |
| | BlackRock California Municipal 2018 Term Trust
|
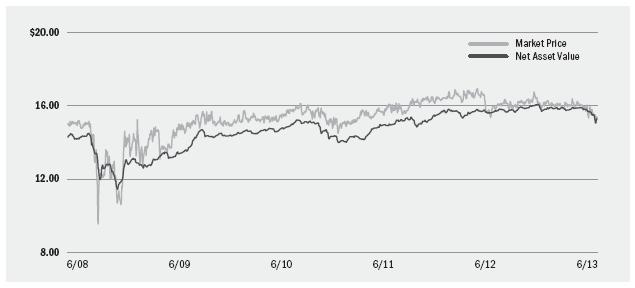
Market Price and Net Asset Value Per Share Summary
|
|
|
| 6/30/13
|
| 12/31/12
|
| Change
|
| High
|
| Low
|
Market Price | | | | $ | 15.32 | | | $ | 16.21 | | | | (5.49 | )% | | $ | 16.49 | | | $ | 15.17 | |
Net Asset Value | | | | $ | 15.29 | | | $ | 15.81 | | | | (3.29 | )% | | $ | 15.92 | | | $ | 15.06 | |
Market Price and Net Asset Value History For the Past Five Years | | | |
Overview of the Trust’s Long-Term Investments
Sector Allocation
| 6/30/13
|
| 12/31/12
|
County/City/Special District/School District | 25 | % | | 25 | % |
Utilities | 19 | | | 18 | |
Transportation | 18 | | | 17 | |
State | 11 | | | 12 | |
Health | 10 | | | 13 | |
Corporate | 9 | | | 8 | |
Education | 6 | | | 5 | |
Housing | 2 | | | 2 | |
Credit Quality Allocation1
| 6/30/13
|
| 12/31/12
|
AAA/Aaa | 3 | % | | 2 | % |
AA/Aa | 48 | | | 47 | |
A | 27 | | | 27 | |
BBB/Baa | 17 | | | 19 | |
BB/Ba | 1 | | | — | |
Not Rated2 | 4 | | | 5 | |
| 1 | | Using the higher of Standard & Poor’s (”S&P’s”) or Moody’s Investors Service (“Moody’s”) ratings. |
| 2 | | The investment advisor has deemed certain of these securities to be of investment grade quality. As of June 30, 2013 and December 31, 2012, the market value of these securities was $1,007,654, representing 1%, and $3,063,184, representing 2%, respectively, of the Trust’s long-term investments. |
|
|
Call/Maturity Schedule3
|
|
Calendar Year Ended December 31,
| | | |
| |
2013 | | 25 | % |
2014 | | 5 | |
2015 | | — | |
2016 | | — | |
2017 | | 3 | |
| 3 | | Scheduled maturity dates and/or bonds that are subject to potential calls by issuers over the next five years. |
| SEMI-ANNUAL REPORT | JUNE 30, 2013 | 7
|
| |
| Trust Summary as of June 30, 2013 | BlackRock Municipal 2018 Term Trust
|
Trust Overview
BlackRock Municipal 2018 Term Trust’s (BPK) (the “Trust”) investment objectives seek to provide current income exempt from regular federal income tax and to return $15 per common share (the initial offering price per common share) to holders of common shares on or about December 31, 2018. The Trust seeks to achieve its investment objectives by investing, under normal market conditions, its assets in municipal bonds exempt from federal income taxes (except that the interest may be subject to the federal alternative minimum tax). The Trust invests at least 80% of its assets in municipal bonds that are investment grade quality at the time of investment.
No assurance can be given that the Trust’s investment objective will be achieved.
Performance
• | | For the six months ended June 30, 2013, the Trust returned (0.45)% based on market price and (0.40)% based on NAV. The Trust’s peer group of closed-end funds in the Lipper General & Insured Municipal Debt Funds (Leveraged) category posted an average return of (8.70)% based on market price and (6.15)% based on NAV for the same period. All returns reflect reinvestment of dividends. The Trust’s premium to NAV, which narrowed during the period, accounts for the difference between performance based on price and performance based on NAV. The following discussion pertains to performance based on NAV. |
• | | The Trust’s performance was negative given the broad decline across the municipal market during the period. Interest rates moved higher with increasing volatility in response to comments from the US Federal Reserve alluding to tapering its bond-buying stimulus program. (Bond prices fall as interest rates rise.) The Trust’s longer duration holdings and exposure to zero-coupon bonds were the greatest detractors from performance as these securities are more sensitive to interest rate movements. Higher-rated bonds declined more than lower-quality issues, which were supported by investors seeking higher yields. The Trust’s positions in high-quality bonds in the education, utilities and transportation sectors were particularly negative for the period. |
• | | There were no positive contributors to performance on an absolute basis as all areas of the municipal market posted losses for the period. However, the Trust benefited from the accrual of income generated on its fully invested portfolio of tax-exempt municipal bonds. The Trust is scheduled to mature on or about December 31, 2018 and thus holds securities that will mature close to that date. The Trust’s shorter maturity profile was an advantage in comparison to its Lipper category peers that typically hold longer-dated issues as rate increases were significantly larger further out on the yield curve, driving prices lower on longer-dated issues. |
| | The views expressed reflect the opinions of BlackRock as of the date of this report and are subject to change based on changes in market, economic or other conditions. These views are not intended to be a forecast of future events and are no guarantee of future results. |
Trust Information
Symbol on NYSE | | | | BPK |
Initial Offering Date | | | | October 26, 2001 |
Termination Date (on or about) | | | | December 31, 2018 |
Yield on Closing Market Price as of June 30, 2013 ($16.10)1 | | | | 4.55% |
Tax Equivalent Yield2 | | | | 8.04% |
Current Monthly Distribution per Common Share3 | | | | $0.0610 |
Current Annualized Distribution per Common Share3 | | | | $0.7320 |
Economic Leverage as of June 30, 20134 | | | | 26% |
| 1 | | Yield on closing market price is calculated by dividing the current annualized distribution per share by the closing market price. Past performance does not guarantee future results. |
| 2 | | Tax equivalent yield assumes the maximum marginal federal tax rate of 43.4%, which includes the 3.8% Medicare tax. Actual tax rates will vary based on income, exemptions and deductions. Lower taxes will result in lower tax equivalent yields. |
| 3 | | The distribution rate is not constant and is subject to change. |
| 4 | | Represents Preferred Shares and TOBs as a percentage of total managed assets, which is the total assets of the Trust, including any assets attributable to Preferred Shares and TOBs, minus the sum of accrued liabilities. For a discussion of leveraging techniques utilized by the Trust, please see The Benefits and Risks of Leveraging on page 5. |
| 8 | SEMI-ANNUAL REPORT | JUNE 30, 2013
|
| |
| | BlackRock Municipal 2018 Term Trust
|
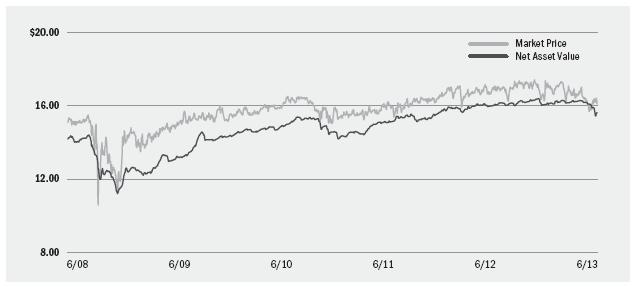
Market Price and Net Asset Value Per Share Summary
|
|
|
| 6/30/13
|
| 12/31/12
|
| Change
|
| High
|
| Low
|
Market Price | | | | $ | 16.10 | | | $ | 16.56 | | | | (2.78 | )% | | $ | 17.39 | | | $ | 15.61 | |
Net Asset Value | | | | $ | 15.63 | | | $ | 16.07 | | | | (2.74 | )% | | $ | 16.30 | | | $ | 15.45 | |
Market Price and Net Asset Value History For the Past Five Years |
Overview of the Trust’s Long-Term Investments
Sector Allocation
| 6/30/13
|
| 12/31/12
|
County/City/Special District/School District | 21 | % | | 17 | % |
Corporate | 16 | | | 18 | |
Transportation | 13 | | | 13 | |
Utilities | 12 | | | 11 | |
State | 11 | | | 13 | |
Housing | 11 | | | 10 | |
Health | 9 | | | 11 | |
Tobacco | 5 | | | 5 | |
Education | 2 | | | 2 | |
Credit Quality Allocation1
| 6/30/13
|
| 12/31/12
|
AAA/Aaa | 14 | % | | 13 | % |
AA/Aa | 22 | | | 26 | |
A | 27 | | | 28 | |
BBB/Baa | 25 | | | 23 | |
BB/Ba | 6 | | | 3 | |
B | 1 | | | 2 | |
Not Rated2 | 5 | | | 5 | |
| 1 | | Using the higher of S&P’s or Moody’s ratings. |
| 2 | | The investment advisor has deemed certain of these securities to be of investment grade quality. As of June 30, 2013 and December 31, 2012, the market value of these securities was $5,237,231, representing 2%, and $5,352,592, representing 1%, respectively, of the Trust’s long-term investments. |
|
|
Call/Maturity Schedule3
|
|
Calendar Year Ended December 31,
| | | |
| |
2013 | | 7 | % |
2014 | | 7 | |
2015 | | 10 | |
2016 | | 7 | |
2017 | | 5 | |
| 3 | | Scheduled maturity dates and/or bonds that are subject to potential calls by issuers over the next five years. |
| SEMI-ANNUAL REPORT | JUNE 30, 2013 | 9
|
| |
| Trust Summary as of June 30, 2013 | BlackRock New York Municipal 2018 Term Trust
|
Trust Overview
BlackRock New York Municipal 2018 Term Trust’s (BLH) (the “Trust”) investment objectives seek to provide current income exempt from regular federal income tax and New York State and New York City personal income taxes and to return $15 per common share (the initial offering price per common share) to holders of common shares on or about December 31, 2018. The Trust seeks to achieve its investment objectives by investing at least 80% of its total assets in municipal bonds that at the time of investment are investment grade quality.
No assurance can be given that the Trust’s investment objective will be achieved.
Performance
• | | For the six months ended June 30, 2013, the Trust returned (4.74)% based on market price and (1.84)% based on NAV. The Trust’s peer group of closed-end funds in the Lipper New York Municipal Debt Funds category posted an average return of (8.79)% based on market price and (5.98)% based on NAV for the same period. All returns reflect reinvestment of dividends. The Trust moved from a premium to NAV to a discount by period-end, which accounts for the difference between performance based on price and performance based on NAV. The following discussion pertains to performance based on NAV. |
• | | The Trust’s performance was negative given the broad decline across the municipal market during the period. Interest rates moved higher with increasing volatility in response to comments from the US Federal Reserve alluding to tapering its bond-buying stimulus program. (Bond prices fall as interest rates rise.) The Trust’s holdings that exhibit a greater degree of duration (sensitivity to interest rate movements) were the largest detractors from performance. Higher-rated bonds declined more than lower-quality issues, which were supported by investors seeking higher yields. The Trust’s positions in high-quality bonds in the education, utilities and transportation sectors were particularly negative for the period. |
• | | There were no positive contributors to performance on an absolute basis as all areas of the municipal market posted losses for the period. However, the Trust benefited from the accrual of income generated on its fully invested portfolio of tax-exempt municipal bonds. The Trust is scheduled to mature on or about December 31, 2018 and thus holds securities that will mature close to that date. The Trust’s shorter maturity profile was an advantage in comparison to its Lipper category peers that typically hold longer-dated issues as rate increases were significantly larger further out on the yield curve, driving prices lower on longer-dated issues. |
| | The views expressed reflect the opinions of BlackRock as of the date of this report and are subject to change based on changes in market, economic or other conditions. These views are not intended to be a forecast of future events and are no guarantee of future results. |
Trust Information
Symbol on NYSE | | | | BLH |
Initial Offering Date | | | | October 26, 2001 |
Termination Date (on or about) | | | | December 31, 2018 |
Yield on Closing Market Price as of June 30, 2013 ($15.00)1 | | | | 3.62% |
Tax Equivalent Yield2 | | | | 7.34% |
Current Monthly Distribution per Common Share3 | | | | $0.0453 |
Current Annualized Distribution per Common Share3 | | | | $0.5436 |
Economic Leverage as of June 30, 20134 | | | | 32% |
| 1 | | Yield on closing market price is calculated by dividing the current annualized distribution per share by the closing market price. Past performance does not guarantee future results. |
| 2 | | Tax equivalent yield assumes the maximum marginal federal and state tax rate of 50.67%, which includes the 3.8% Medicare tax. Actual tax rates will vary based on income, exemptions and deductions. Lower taxes will result in lower tax equivalent yields. |
| 3 | | The distribution rate is not constant and is subject to change. |
| 4 | | Represents Preferred Shares as a percentage of total managed assets, which is the total assets of the Trust, including any assets attributable to Preferred Shares, minus the sum of accrued liabilities. For a discussion of leveraging techniques utilized by the Trust, please see The Benefits and Risks of Leveraging on page 5. |
| 10 | SEMI-ANNUAL REPORT | JUNE 30, 2013
|
| |
| | BlackRock New York Municipal 2018 Term Trust
|
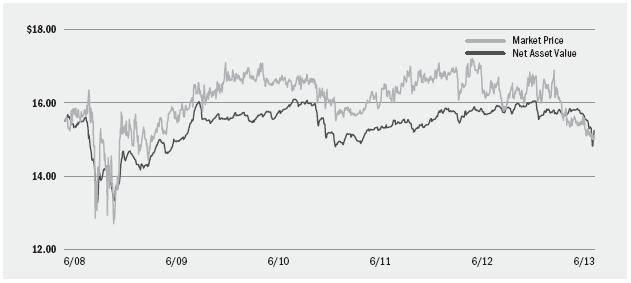
Market Price and Net Asset Value Per Share Summary
|
|
|
| 6/30/13
|
| 12/31/12
|
| Change
|
| High
|
| Low
|
Market Price | | | | $ | 15.00 | | | $ | 16.05 | | | | (6.54 | )% | | $ | 16.94 | | | $ | 14.92 | |
Net Asset Value | | | | $ | 15.09 | | | $ | 15.67 | | | | (3.70 | )% | | $ | 15.84 | | | $ | 14.82 | |
Market Price and Net Asset Value History For the Past Five Years |
Overview of the Trust’s Long-Term Investments
Sector Allocation
| 6/30/13
|
| 12/31/12
|
County/City/Special District/School District | 36 | % | | 35 | % |
Education | 18 | | | 17 | |
Transportation | 16 | | | 16 | |
Housing | 8 | | | 3 | |
State | 8 | | | 13 | |
Utilities | 7 | | | 8 | |
Health | 5 | | | 6 | |
Corporate | 2 | | | 2 | |
Credit Quality Allocation1
| 6/30/13
|
| 12/31/12
|
AAA/Aaa | 17 | % | | 18 | % |
AA/Aa | 47 | | | 47 | |
A | 19 | | | 18 | |
BBB/Baa | 3 | | | 6 | |
BB/Ba | 1 | | | — | |
Not Rated2 | 13 | | | 11 | |
| 1 | | Using the higher of S&P’s or Moody’s ratings. |
| 2 | | The investment advisor has deemed certain of these securities to be of investment grade quality. As of June 30, 2013 and December 31, 2012, the market value of these securities was $2,008,400, representing 3%, and $2,008,600, representing 2%, respectively, of the Trust’s long-term investments. |
|
|
Call/Maturity Schedule3
|
|
Calendar Year Ended December 31,
| | | |
| |
2013 | | 10 | % |
2014 | | — | |
2015 | | 8 | |
2016 | | 1 | |
2017 | | 2 | |
| 3 | | Scheduled maturity dates and/or bonds that are subject to potential calls by issuers over the next five years. |
| SEMI-ANNUAL REPORT | JUNE 30, 2013 | 11
|
| |
| Schedule of Investments June 30, 2013 (Unaudited) | BlackRock California Municipal 2018 Term Trust (BJZ)
(Percentages shown are based on Net Assets)
|
Municipal Bonds
| | | | Par
(000) | | Value |
California — 134.3% |
Corporate — 12.0% | | | | | | | | | | |
California Pollution Control Financing Authority, RB, Mandatory Put Bonds, AMT (a): | | | | | | | | | | |
Republic Services, Inc. Project, Series B, 5.25%, 6/01/23 | | | | $ | 2,020 | | | $ | 2,199,982 | |
Waste Management, Inc. Project, Series A, 5.13%, 7/01/31 | | | | | 4,000 | | | | 4,106,440 | |
California Pollution Control Financing Authority, Refunding RB: | | | | | | | | | | |
Mandatory Put Bonds, Republic Services, Inc. Project, Series C, AMT, 5.25%, 6/01/23 (a) | | | | | 2,030 | | | | 2,210,873 | |
San Diego Gas & Electric, Series A, 5.90%, 6/01/14 | | | | | 3,100 | | | | 3,254,411 | |
| | | | | | | | | 11,771,706 | |
County/City/Special District/School District — 35.0% |
City & County of San Francisco California, GO, Refunding, Series R-1, 5.00%, 6/15/18 | | | | | 2,500 | | | | 2,908,325 | |
City of Vista California, COP, Refunding, Community Projects (NPFGC): | | | | | | | | | | |
5.00%, 5/01/19 | | | | | 1,000 | | | | 1,088,980 | |
4.75%, 5/01/21 | | | | | 1,115 | | | | 1,183,762 | |
County of San Bernardino California, Special Tax Bonds, Community Facilities District No. 2002-1: | | | | | | | | | | |
5.35%, 9/01/17 | | | | | 105 | | | | 106,470 | |
5.50%, 9/01/18 | | | | | 245 | | | | 248,357 | |
Fontana Public Finance Authority California, Tax Allocation Bonds, Refunding, North Fontana Redevelopment Project, Series A (AGM), 5.25%, 9/01/18 | | | | | 3,395 | | | | 3,402,164 | |
Irvine Unified School District California, Refunding, Special Tax Bonds, Community Facilities District No. 86-1 (AGM), 5.25%, 9/01/18 | | | | | 5,000 | | | | 5,663,350 | |
Lathrop Financing Authority, RB, Water Supply Project, 5.80%, 6/01/21 | | | | | 995 | | | | 1,001,487 | |
Lodi Unified School District, GO, Refunding (AGM), 4.00%, 8/01/18 | | | | | 1,000 | | | | 1,100,520 | |
Los Angeles Community College District California, GO, Election of 2001, Series E-1, 4.00%, 8/01/18 | | | | | 200 | | | | 223,354 | |
Los Angeles Unified School District California, GO: | | | | | | | | | | |
Election of 2004, Series H (AGM), 5.00%, 7/01/18 | | | | | 600 | | | | 684,294 | |
Series I, 5.00%, 7/01/20 | | | | | 2,000 | | | | 2,356,720 | |
| | | | | | | | | | | |
Municipal Bonds
| | | | Par
(000) | | Value |
California (continued) |
County/City/Special District/School District (concluded) |
Los Banos Unified School District, GO, Election of 2008 (AGM), 5.00%, 8/01/18 | | | | $ | 475 | | | $ | 542,502 | |
Palm Springs Unified School District, GO, Refunding, 5.00%, 8/01/18 | | | | | 2,745 | | | | 3,205,090 | |
San Manuel Entertainment Authority, Series 04-C, 4.50%, 12/01/16 (b) | | | | | 4,000 | | | | 4,101,520 | |
San Marcos Unified School District, GO, CAB (c): | | | | | | | | | | |
2.06%, 8/01/17 | | | | | 385 | | | | 354,034 | |
2.50%, 8/01/18 | | | | | 500 | | | | 440,570 | |
Santa Clara Unified School District, GO, Election of 2004, Series A, 5.00%, 7/01/18 | | | | | 2,190 | | | | 2,560,241 | |
Stockton East Water District, COP, Refunding, Series B (NPFGC), 5.92%, 4/01/19 (c) | | | | | 4,590 | | | | 3,280,565 | |
| | | | | | | | | 34,452,305 | |
Education — 7.8% | | | | | | | | | | |
California State Public Works Board, Refunding RB, Trustees of the California State University, Series A, 5.00%, 10/01/17 | | | | | 2,415 | | | | 2,423,090 | |
University of California, Refunding RB: | | | | | | | | | | |
General, Series AB, 5.00%, 5/15/19 | | | | | 2,500 | | | | 2,948,500 | |
Series S, 5.00%, 5/15/18 | | | | | 2,000 | | | | 2,327,940 | |
| | | | | | | | | 7,699,530 | |
Health — 13.4% | | | | | | | | | | |
ABAG Finance Authority for Nonprofit Corps, RB, San Diego Hospital Association, Series C, 5.38%, 3/01/21 | | | | | 2,100 | | | | 2,148,258 | |
California Health Facilities Financing Authority, RB: | | | | | | | | | | |
Scripps Health, Series A, 5.00%, 10/01/18 | | | | | 750 | | | | 867,428 | |
Sutter Health, Series B, 5.00%, 8/15/19 | | | | | 1,430 | | | | 1,664,720 | |
California Health Facilities Financing Authority, Refunding RB, Sutter Health, Series D, 5.00%, 8/15/18 | | | | | 515 | | | | 598,301 | |
California Statewide Communities Development Authority, Refunding RB, Episcopal Communities & Services, 5.00%, 5/15/18 | | | | | 300 | | | | 335,745 | |
California Statewide Communities Development Authority, RB, Kaiser Permanente: | | | | | | | | | | |
Series A, 5.00%, 4/01/19 | | | | | 2,000 | | | | 2,267,980 | |
Series E-1, 5.00%, 4/01/44 (a) | | | | | 4,700 | | | | 5,309,355 | |
| | | | | | | | | 13,191,787 | |
Portfolio Abbreviations
To simplify the listings of portfolio holdings in the Schedules of Investments, the names and descriptions of many of the securities have been abbreviated according to the following list: | AGC
AGM
AMBAC
AMT
CAB
COP
EDA
Fannie Mae
Freddie Mac
GO
HDA | | Assured Guarantee Corp.
Assured Guaranty Municipal Corp.
American Municipal Bond Assurance Corp.
Alternative Minimum Tax (subject to)
Capital Appreciation Bonds
Certificates of Participation
Economic Development Authority
Federal National Mortgage Association
Federal Home Loan Mortgage Corp.
General Obligation Bonds
Housing Development Authority | | HFA
IDA
IDB
ISD
LRB
NPFGC
PSF-GTD
Radian
RB
S/F
SONYMA | | Housing Finance Agency
Industrial Development Authority
Industrial Development Board
Independent School District
Lease Revenue Bonds
National Public Finance Guarantee Corp.
Permanent School Fund Guaranteed
Radian Guaranty, Inc.
Revenue Bonds
Single-Family
State of New York Mortgage Agency |
See Notes to Financial Statements.
| 12 | SEMI-ANNUAL REPORT | JUNE 30, 2013
|
| |
| Schedule of Investments (continued) | BlackRock California Municipal 2018 Term Trust (BJZ)
(Percentages shown are based on Net Assets)
|
Municipal Bonds
| | | | Par
(000) | | Value |
California (continued) |
Housing — 2.9% | | | | | | | | | | |
California HFA, RB, Series A (Fannie Mae): | | | | | | | | | | |
3.20%, 8/01/18 | | | | $ | 915 | | | $ | 959,817 | |
3.50%, 2/01/19 | | | | | 1,780 | | | | 1,868,252 | |
| | | | | | | | | 2,828,069 | |
State — 13.6% | | | | | | | | | | |
California State Public Works Board, LRB, Various Capital Projects, Series A, 5.00%, 4/01/18 | | | | | 1,500 | | | | 1,720,905 | |
California State Public Works Board, Refunding RB, California Community Colleges, Series A, 5.00%, 12/01/17 | | | | | 2,020 | | | | 2,026,767 | |
State of California, GO, Refunding: | | | | | | | | | | |
5.00%, 9/01/18 | | | | | 3,400 | | | | 3,956,512 | |
5.00%, 11/01/20 | | | | | 20 | | | | 20,074 | |
Series A, 5.00%, 7/01/18 | | | | | 720 | | | | 835,884 | |
Various Purpose, 5.25%, 10/01/22 | | | | | 4,000 | | | | 4,803,240 | |
Veterans, Series BZ, AMT (NPFGC), 5.35%, 12/01/21 | | | | | 10 | | | | 10,013 | |
| | | | | | | | | 13,373,395 | |
Transportation — 23.9% | | | | | | | | | | |
City of Long Beach California, RB, Series A, 5.00%, 5/15/18 | | | | | 500 | | | | 580,710 | |
Foothill-Eastern Transportation Corridor Agency California, Refunding RB, CAB, 5.94%, 1/15/21 (c) | | | | | 20,000 | | | | 12,858,200 | |
Los Angeles Department of Airports, Refunding RB, Senior, Los Angeles International Airport, Series A, 4.50%, 5/15/19 | | | | | 3,420 | | | | 3,911,181 | |
Port of Oakland, Refunding RB, Series O, AMT: | | | | | | | | | | |
5.00%, 5/01/18 | | | | | 2,500 | | | | 2,816,200 | |
5.00%, 5/01/19 | | | | | 3,000 | | | | 3,389,070 | |
| | | | | | | | | 23,555,361 | |
Utilities — 25.7% | | | | | | | | | | |
California State Department of Water Resources, Refunding RB: | | | | | | | | | | |
Series H, Power Supply, 5.00%, 5/01/22 | | | | | 3,500 | | | | 3,968,895 | |
Series L, 5.00%, 5/01/19 | | | | | 2,000 | | | | 2,355,020 | |
Series M, 4.00%, 5/01/18 | | | | | 1,000 | | | | 1,117,840 | |
Series N, 5.00%, 5/01/19 | | | | | 3,500 | | | | 4,121,285 | |
City of San Francisco California Public Utilities Commission Water Revenue, Refunding RB, Series D, 3.00%, 11/01/18 | | | | | 2,000 | | | | 2,139,400 | |
Contra Costa Water Authority, Refunding RB, California Water Treatment, Series A, 3.00%, 10/01/18 | | | | | 900 | | | | 963,405 | |
Cucamonga Valley Water District, Refunding RB, Series A (AGM): | | | | | | | | | | |
4.00%, 9/01/18 | | | | | 325 | | | | 361,361 | |
3.00%, 9/01/19 | | | | | 375 | | | | 394,886 | |
4.00%, 9/01/19 | | | | | 325 | | | | 361,771 | |
| | | | | | | | | | | |
Municipal Bonds
| | | | Par
(000) | | Value |
California (concluded) |
Utilities (concluded) | | | | | | | | | | |
Los Angeles County Sanitation Districts Financing Authority, Refunding RB, Series A, 3.00%, 10/01/18 | | | | $ | 3,000 | | | $ | 3,211,350 | |
Los Angeles Department of Water & Power, RB, Series B, 5.00%, 7/01/18 | | | | | 600 | | | | 699,870 | |
Los Angeles Department of Water & Power, Refunding RB, Power System, Series A, 5.00%, 7/01/19 | | | | | 2,500 | | | | 2,945,950 | |
Metropolitan Water District of Southern California, Refunding RB, Series B, 4.00%, 7/01/18 | | | | | 1,250 | | | | 1,405,087 | |
Sacramento Municipal Utility District, Refunding RB, Series X, 5.00%, 8/15/18 | | | | | 400 | | | | 465,860 | |
Southern California Public Power Authority, Refunding RB, Canyon Power, Series A, 4.00%, 7/01/18 | | | | | 685 | | | | 759,487 | |
| | | | | | | | | 25,271,467 | |
Total Municipal Bonds in California | | | | | | | | | 132,143,620 | |
|
Guam — 0.3% |
Utility — 0.3% | | | | | | | | | | |
Guam Power Authority, Refunding RB, Series A (AGM), 5.00%, 10/01/19 | | | | | 240 | | | | 269,119 | |
|
Puerto Rico — 3.7% |
State — 1.6% | | | | | | | | | | |
Puerto Rico Public Buildings Authority, Refunding RB, Government Facilities: | | | | | | | | | | |
Series C, 5.75%, 7/01/19 (d) | | | | | 5 | | | | 6,167 | |
Series M, 6.00%, 7/01/20 | | | | | 1,000 | | | | 1,034,330 | |
Puerto Rico Sales Tax Financing Corp., Refunding RB, Sales Tax Revenue, Series C, 5.00%, 8/01/22 | | | | | 485 | | | | 542,361 | |
| | | | | | | | | 1,582,858 | |
Transportation — 1.2% | | | | | | | | | | |
Puerto Rico Highway & Transportation Authority, Refunding RB, Series Z (AGM): | | | | | | | | | | |
6.00%, 7/01/18 (d) | | | | | 535 | | | | 639,052 | |
6.00%, 7/01/18 | | | | | 465 | | | | 521,051 | |
| | | | | | | | | 1,160,103 | |
Utility — 0.9% | | | | | | | | | | |
Puerto Rico Commonwealth Aqueduct & Sewer Authority, Refunding RB, Senior Lien, Series A, 5.00%, 7/01/19 | | | | | 890 | | | | 868,168 | |
Total Municipal Bonds in Puerto Rico | | | | | | | | | 3,611,129 | |
See Notes to Financial Statements.
| SEMI-ANNUAL REPORT | JUNE 30, 2013 | 13
|
| |
| Schedule of Investments (concluded) | BlackRock California Municipal 2018 Term Trust (BJZ)
(Percentages shown are based on Net Assets)
|
Municipal Bonds
| | | | Par
(000) | | Value |
US Virgin Islands — 0.8% |
State — 0.8% | | | | | | | | | | |
Virgin Islands Public Finance Authority, RB, Senior Lien, Matching Fund Loan Note, Series A: | | | | | | | | | | |
5.25%, 10/01/17 | | | | $ | 360 | | | $ | 372,719 | |
5.25%, 10/01/19 | | | | | 455 | | | | 470,042 | |
Total Municipal Bonds in US Virgin Islands | | | | | | | | | 842,761 | |
Total Long-Term Investments
(Cost — $132,905,900) — 139.1% | | | | | | | | | 136,866,629 | |
Short-Term Securities
| | | |
Shares | | Value |
BIF California Municipal Money Fund, 0.00% (e)(f) | | | | | 2,733,052 | | | $ | 2,733,052 | |
Total Short-Term Securities
(Cost — $2,733,052) — 2.8% | | | | | | | | | 2,733,052 | |
Total Investments (Cost — $135,638,952) — 141.9% | | | | | | | | | 139,599,681 | |
Other Assets Less Liabilities — 2.1% | | | | | | | | | 2,071,726 | |
Preferred Shares, at Redemption Value — (44.0%) | | (43,300,932 | ) |
Net Assets Applicable to Common Shares — 100.0% | $ | 98,370,475 | |
Notes to Schedule of Investments
| (a) | | | | Variable rate security. Rate shown is as of report date. |
| (b) | | | | Security exempt from registration pursuant to Rule 144A under the Securities Act of 1933, as amended. These securities may be resold in transactions exempt from registration to qualified institutional investors. |
| (c) | | | | Represents a zero-coupon bond. Rate shown reflects the current yield as of report date. |
| (d) | | | | Security is collateralized by municipal or US Treasury obligations. |
| (e) | | | | Investments in issuers considered to be an affiliate of the Trust during the six months ended June 30, 2013, for purposes of Section 2(a)(3) of 1940 Act, were as follows: |
Affiliate
|
|
|
| Shares
Held at
December 31, 2012
|
| Net
Activity
|
| Shares
Held at
June 30, 2013
|
| Income
|
BIF California Municipal Money Fund | | | | | 6,482,117 | | | | (3,749,065 | ) | | | 2,733,052 | | | $ | 10,737 | |
| (f) | | | | Represents the current yield as of report date. |
| • | | | | Fair Value Measurements—Various inputs are used in determining the fair value of investments. These inputs to valuation techniques are categorized into a disclosure hierarchy consisting of three broad levels for financial statement purposes as follows: |
| • | | | | Level 1 — unadjusted price quotations in active markets/exchanges for identical assets or liabilities that the Trust has the ability to access |
| • | | | | Level 2 — other observable inputs (including, but not limited to, quoted prices for similar assets or liabilities in markets that are active, quoted prices for identical or similar assets or liabilities in markets that are not active, inputs other than quoted prices that are observable for the assets or liabilities (such as interest rates, yield curves, volatilities, prepayment speeds, loss severities, credit risks and default rates) or other market-corroborated inputs) |
| • | | | | Level 3 — unobservable inputs based on the best information available in the circumstances, to the extent observable inputs are not available (including the Trust’s own assumptions used in determining the fair value of investments) |
| | | | | The hierarchy gives the highest priority to unadjusted quoted prices in active markets for identical assets or liabilities (Level 1 measurements) and the lowest priority to unobservable inputs (Level 3 measurements). Accordingly, the degree of judgment exercised in determining fair value is greatest for instruments categorized in Level 3. The inputs used to measure fair value may fall into different levels of the fair value hierarchy. In such cases, for disclosure purposes, the fair value hierarchy classification is determined based on the lowest level input that is significant to the fair value measurement in its entirety. |
| | | | | Changes in valuation techniques may result in transfers into or out of an assigned level within the disclosure hierarchy. In accordance with the Trust’s policy, transfers between different levels of the fair value disclosure hierarchy are deemed to have occurred as of the beginning of the reporting period. The categorization of a value determined for investments is based on the pricing transparency of the investment and is not necessarily an indication of the risks associated with investing in those securities. For information about the Trust’s policy regarding valuation of investments, please refer to Note 2 of the Notes to Financial Statements. |
| | | | | The following table summarizes the Trust’s investments categorized in the disclosure hierarchy as of June 30, 2013: |
|
|
|
| Level 1
|
| Level 2
|
| Level 3
|
| Total
|
Assets:
| | | | | | | |
Investments:
| | | | | | | | | | | | | | | | | | |
Long-Term Investments1 | | | | | — | | | $ | 136,866,629 | | | | — | | | $ | 136,866,629 | |
Short-Term Securities | | | | $ | 2,733,052 | | | | — | | | | — | | | | 2,733,052 | |
Total
| | | | $ | 2,733,052 | | | $ | 136,866,629 | | | | — | | | $ | 139,599,681 | |
| 1 | See above Schedule of Investments for values in each sector. |
| | | | | Certain of the Trust’s assets are held at carrying amount, which approximates fair value for financial statement purposes. As of June 30, 2013, cash of $1,089 is categorized as Level 1 within the disclosure hierarchy, |
| | | | | There were no transfers between levels during the six months ended June 30, 2013. |
See Notes to Financial Statements.
| 14 | SEMI-ANNUAL REPORT | JUNE 30, 2013
|
| |
| Schedule of Investments June 30, 2013 (Unaudited) | BlackRock Municipal 2018 Term Trust (BPK)
(Percentages shown are based on Net Assets)
|
Municipal Bonds
|
|
|
| Par
(000)
|
| Value
|
Alabama — 0.6% | | | | | | | | | | |
Alabama 21st Century Authority, Refunding RB, Series A, 5.00%, 6/01/18 | | | | $ | 500 | | | $ | 572,760 | |
Courtland IDB, Refunding RB, International Paper Co. Projects, Series A, 4.75%, 5/01/17 | | | | | 1,000 | | | | 1,014,620 | |
| | | | | | | | | 1,587,380 | |
Arizona — 2.2% | | | | | | | | | | |
Phoenix Civic Improvement Corp., RB, Junior Lien, Series A, 5.00%, 7/01/21 | | | | | 4,660 | | | | 5,434,585 | |
California — 12.2% | | | | | | | | | | |
Agua Caliente Band of Cahuilla Indians, RB, 5.60%, 7/01/13 (a) | | | | | 395 | | | | 394,949 | |
California Health Facilities Financing Authority, RB, Sutter Health, Series B, 5.00%, 8/15/19 | | | | | 2,570 | | | | 2,991,840 | |
California Pollution Control Financing Authority, RB, Waste Management, Inc. Project, Series C, AMT, 5.13%, 11/01/23 (b) | | | | | 6,500 | | | | 6,589,115 | |
California Pollution Control Financing Authority, Refunding RB, Mandatory Put Bonds, Republic Services, Inc. Project, Series C, AMT, 5.25%, 6/01/23 (b) | | | | | 4,055 | | | | 4,416,300 | |
California State Department of Water Resources, Refunding RB, Power Supply, Series L, 5.00%, 5/01/18 | | | | | 5,000 | | | | 5,816,900 | |
Los Angeles Regional Airports Improvement Corp., Refunding RB, Facilities Lease, LAXFuel Corp., AMT: | | | | | | | | | | |
5.00%, 1/01/17 | | | | | 450 | | | | 501,831 | |
5.00%, 1/01/18 | | | | | 930 | | | | 1,045,859 | |
Los Angeles Unified School District California, GO, Series I, 5.00%, 7/01/20 | | | | | 3,750 | | | | 4,418,850 | |
San Manuel Entertainment Authority, Series 04-C, 4.50%, 12/01/16 (a) | | | | | 4,000 | | | | 4,101,520 | |
| | | | | | | | | 30,277,164 | |
Colorado — 4.8% | | | | | | | | | | |
Colorado Health Facilities Authority, Refunding RB, Evangelical Lutheran Good Samaritan Society Project: | | | | | | | | | | |
4.00%, 12/01/17 | | | | | 515 | | | | 547,291 | |
4.00%, 12/01/18 | | | | | 540 | | | | 572,972 | |
Colorado Housing & Finance Authority, RB, Disposal, Waste Management, Inc. Project, AMT, 5.70%, 7/01/18 | | | | | 5,000 | | | | 5,608,600 | |
Park Creek Metropolitan District Colorado, Refunding RB, Senior Limited Property Tax, 5.25%, 12/01/20 | | | | | 5,010 | | | | 5,314,508 | |
| | | | | | | | | 12,043,371 | |
Florida — 5.0% | | | | | | | | | | |
Broward County Florida Airport System Revenue, Refunding RB, Series P-1, AMT, 5.00%, 10/01/18 | | | | | 3,930 | | | | 4,468,214 | |
Broward County School Board, COP, Series A (AGM), 5.25%, 7/01/22 | | | | | 1,250 | | | | 1,407,713 | |
County of Miami-Dade Florida, Refunding RB, Series A, AMT, 5.00%, 10/01/18 | | | | | 2,000 | | | | 2,267,540 | |
Pine Island Community Development District, RB, 5.30%, 11/01/10 (c)(d) | | | | | 400 | | | | 156,356 | |
Stevens Plantation Community Development District, Special Assessment Bonds, Series B, 6.38%, 12/31/49 (c)(d) | | | | | 2,270 | | | | 1,690,060 | |
| | | | | | | | | | | |
Municipal Bonds
|
|
|
| Par
(000)
|
| Value
|
Florida (concluded) | | | | | | | | | | |
Village Center Community Development District, RB, Sub-Series B, 5.88%, 1/01/15 | | | | $ | 2,480 | | | $ | 2,499,046 | |
| | | | | | | | | 12,488,929 | |
Guam — 0.3% | | | | | | | | | | |
Guam Power Authority, Refunding RB, Series A (AGM), 5.00%, 10/01/19 | | | | | 620 | | | | 695,225 | |
Hawaii — 0.2% | | | | | | | | | | |
Hawaii State Department of Budget & Finance, Refunding RB, Special Purpose Senior Living Revenue, 5.00%, 11/15/18 | | | | | 370 | | | | 407,041 | |
Illinois — 13.5% | | | | | | | | | | |
City of Chicago Illinois, RB, General Airport, Third Lien, Series A (AMBAC): | | | | | | | | | | |
5.00%, 1/01/19 | | | | | 5,000 | | | | 5,380,450 | |
5.00%, 1/01/20 | | | | | 3,000 | | | | 3,228,270 | |
Illinois Finance Authority, Refunding RB, Central DuPage Health, Series B, 5.00%, 11/01/18 | | | | | 2,290 | | | | 2,616,348 | |
Illinois Sports Facilities Authority, RB, State Tax Supported (AMBAC): | | | | | | | | | | |
5.35%, 6/15/19 | | | | | 1,885 | | | | 2,002,680 | |
5.40%, 6/15/20 | | | | | 1,985 | | | | 2,103,584 | |
5.45%, 6/15/21 | | | | | 2,090 | | | | 2,206,079 | |
Illinois State Toll Highway Authority, RB, Senior Priority, Series A (AGM), 5.00%, 1/01/19 | | | | | 2,250 | | | | 2,422,890 | |
Railsplitter Tobacco Settlement Authority, RB, 5.00%, 6/01/18 | | | | | 10,000 | | | | 11,262,800 | |
State of Illinois, RB, Build Illinois, Series B, 5.00%, 6/15/18 | | | | | 2,000 | | | | 2,314,420 | |
| | | | | | | | | 33,537,521 | |
Indiana — 3.0% | | | | | | | | | | |
City of Vincennes Indiana, Refunding RB, Southwest Indiana Regional Youth Village, 6.25%, 1/01/24 | | | | | 3,185 | | | | 1,889,883 | |
Indiana Finance Authority, RB, Ohio River Bridges East End Crossing Project, Series B, AMT, 5.00%, 1/01/19 | | | | | 1,715 | | | | 1,870,208 | |
Indiana State Municipal Power Agency, Refunding RB, Series A, 5.00%, 1/01/19 | | | | | 875 | | | | 1,012,751 | |
Indianapolis Airport Authority, Refunding RB, Special Facilities, FedEx Corp. Project, AMT, 5.10%, 1/15/17 | | | | | 2,500 | | | | 2,772,375 | |
| | | | | | | | | 7,545,217 | |
Iowa — 1.5% | | | | | | | | | | |
Iowa Finance Authority, RB, Iowa Fertilizer Co. Project, 5.00%, 12/01/19 | | | | | 3,720 | | | | 3,699,689 | |
Kansas — 1.2% | | | | | | | | | | |
Kansas Development Finance Authority, Refunding RB, Adventist Health, 5.00%, 11/15/18 | | | | | 2,500 | | | | 2,886,975 | |
Kentucky — 3.5% | | | | | | | | | | |
Kenton County School District Finance Corp., Refunding RB, 2.50%, 6/01/18 | | | | | 3,210 | | | | 3,298,404 | |
Kentucky Housing Corp., RB, Series C, AMT, 4.63%, 7/01/22 | | | | | 3,195 | | | | 3,289,412 | |
Louisville Jefferson County Metropolitan Government, Refunding RB, Catholic Health Initiatives, Series A, 5.00%, 12/01/18 | | | | | 1,755 | | | | 2,028,271 | |
| | | | | | | | | 8,616,087 | |
See Notes to Financial Statements.
| SEMI-ANNUAL REPORT | JUNE 30, 2013 | 15
|
| |
| Schedule of Investments (continued) | BlackRock Municipal 2018 Term Trust (BPK)
(Percentages shown are based on Net Assets)
|
Municipal Bonds
|
|
|
| Par
(000)
|
| Value
|
Louisiana — 0.2% | | | | | | | | | | |
Louisiana Public Facilities Authority, RB, Department of Public Safety, Fire Marshal’s Headquarter Project (NPFGC), 5.88%, 6/15/14 | | | | $ | 475 | | | $ | 486,367 | |
Maryland — 3.5% | | | | | | | | | | |
Maryland Health & Higher Educational Facilities Authority, Refunding RB: | | | | | | | | | | |
Charlestown Community, 5.00%, 1/01/19 | | | | | 1,685 | | | | 1,827,315 | |
University of Maryland Medical System, 5.00%, 7/01/18 | | | | | 1,000 | | | | 1,134,400 | |
Maryland State Transportation Authority, Refunding RB, Baltimore/Washington Thurgood Marshall Airport Project, Series B, AMT, 5.00%, 3/01/19 | | | | | 5,000 | | | | 5,648,600 | |
| | | | | | | | | 8,610,315 | |
Massachusetts — 0.1% | | | | | | | | | | |
Massachusetts Water Pollution Abatement Trust, Refunding RB, MWRA Program, Sub-Series A, 6.00%, 8/01/23 | | | | | 135 | | | | 135,613 | |
Michigan — 3.0% | | | | | | | | | | |
Detroit Water and Sewerage Department, Refunding RB, Sewage Disposal System, Senior Lien, Series A (AGM), 5.00%, 7/01/18 | | | | | 3,000 | | | | 3,076,050 | |
Kalamazoo Hospital Finance Authority, Refunding RB, Bronson Methodist Hospital (AGM), 5.00%, 5/15/18 | | | | | 2,025 | | | | 2,290,741 | |
Michigan State Hospital Finance Authority, Refunding RB, Oakwood Obligation Group, Series A, 5.00%, 7/15/18 | | | | | 1,000 | | | | 1,096,880 | |
Michigan State Housing Development Authority, Refunding RB, Series B, 4.15%, 4/01/18 | | | | | 1,000 | | | | 1,058,130 | |
| | | | | | | | | 7,521,801 | |
Mississippi — 4.1% | | | | | | | | | | |
County of Lowndes Mississippi, Refunding RB, Weyerhaeuser Co. Project, Series A, 6.80%, 4/01/22 | | | | | 9,000 | | | | 10,242,810 | |
Multi-State — 8.3% | | | | | | | | | | |
Centerline Equity Issuer Trust (Freddie Mac), 6.80%, 10/31/52 (a)(e) | | | | | 14,000 | | | | 14,946,960 | |
MuniMae TE Bond Subsidiary LLC, 5.20%, 6/29/49 (a)(e) | | | | | 6,000 | | | | 5,759,940 | |
| | | | | | | | | 20,706,900 | |
Nebraska — 1.7% | | | | | | | | | | |
Central Plains Energy Project Nebraska, RB, Gas Project (Project No. 3), 5.00%, 9/01/17 | | | | | 2,330 | | | | 2,521,806 | |
Public Power Generation Agency, RB, Whelan Energy Center, Series 2-A (AGC), 5.00%, 1/01/18 | | | | | 1,500 | | | | 1,638,405 | |
| | | | | | | | | 4,160,211 | |
Nevada — 4.4% | | | | | | | | | | |
City of Las Vegas Nevada, Special Assessment Bonds, Summerlin Area, 5.35%, 6/01/17 | | | | | 1,000 | �� | | | 1,017,220 | |
Clark County Nevada, Special Assessment Bonds, Refunding, Improvement District No. 142, Mountain’s Edge, 4.00%, 8/01/18 | | | | | 4,300 | | | | 4,266,073 | |
Director of the State of Nevada Department of Business & Industry, RB, Mandatory Put Bonds, Republic Services, Inc. Project, AMT, 5.63%, 12/01/26 (b) | | | | | 5,120 | | | | 5,686,374 | |
| | | | | | | | | 10,969,667 | |
| | | | | | | | | | | |
Municipal Bonds
|
|
|
| Par
(000)
|
| Value
|
New Hampshire — 1.1% | | | | | | | | | | |
New Hampshire Business Finance Authority, Refunding RB, Public Service Co. of New Hampshire Project, Series B, AMT (NPFGC), 4.75%, 5/01/21 | | | | $ | 2,650 | | | $ | 2,710,287 | |
New Jersey — 14.3% | | | | | | | | | | |
New Jersey EDA, RB, Continental Airlines, Inc. Project, AMT, 7.20%, 11/15/30 (b) | | | | | 4,250 | | | | 4,253,612 | |
New Jersey EDA, Refunding RB, Cigarette Tax Revenue, 5.00%, 6/15/18 | | | | | 5,000 | | | | 5,529,350 | |
New Jersey EDA, Special Assessment Bonds, Refunding, Kapkowski Road Landfill Project, 5.50%, 4/01/16 | | | | | 6,660 | | | | 6,868,791 | |
New Jersey Educational Facilities Authority, RB, Seton Hall University, Series D, 5.00%, 7/01/18 (f) | | | | | 320 | | | | 367,187 | |
New Jersey Educational Facilities Authority, Refunding RB, University of Medicine & Dentistry, Series B, 6.25%, 12/01/18 (g) | | | | | 2,500 | | | | 3,099,375 | |
New Jersey Health Care Facilities Financing Authority, Refunding RB: | | | | | | | | | | |
AHS Hospital Corp., 5.00%, 7/01/18 | | | | | 850 | | | | 956,072 | |
AtlantiCare Regional Medical Center, 5.00%, 7/01/20 | | | | | 1,500 | | | | 1,640,985 | |
Barnabas Health, Series A, 5.00%, 7/01/18 | | | | | 2,000 | | | | 2,231,540 | |
New Jersey State Housing & Mortgage Finance Agency, Refunding RB, S/F Housing, Series T, AMT, 4.55%, 10/01/22 | | | | | 2,275 | | | | 2,354,284 | |
New Jersey State Turnpike Authority, Refunding RB, Series G, 5.00%, 1/01/18 | | | | | 1,350 | | | | 1,543,819 | |
New Jersey Transportation Trust Fund Authority, RB, Series B, 5.00%, 6/15/18 | | | | | 2,000 | | | | 2,296,480 | |
Newark Housing Authority, RB, South Ward Police Facility (AGC), 4.50%, 12/01/18 | | | | | 4,000 | | | | 4,426,760 | |
| | | | | | | | | 35,568,255 | |
New York — 9.8% | | | | | | | | | | |
City of New York, New York, GO, Sub-Series F-1, 5.00%, 9/01/18 | | | | | 7,500 | | | | 8,131,350 | |
Metropolitan Transportation Authority, Refunding RB, Series A, 5.00%, 11/15/18 | | | | | 1,000 | | | | 1,162,630 | |
New York State Dormitory Authority, RB, General Purpose, Series A, 5.00%, 3/15/18 | | | | | 8,000 | | | | 9,217,520 | |
Port Authority of New York & New Jersey, RB, LLC Project, JFK International Air Terminal Special Project, 5.00%, 12/01/20 | | | | | 1,200 | | | | 1,311,840 | |
Tobacco Settlement Financing Corp. New York, RB, Asset-Backed, Series B-1C, 5.50%, 6/01/20 | | | | | 4,500 | | | | 4,518,765 | |
| | | | | | | | | 24,342,105 | |
North Carolina — 2.9% | | | | | | | | | | |
North Carolina Eastern Municipal Power Agency, Refunding RB, Series B, 4.00%, 1/01/18 | | | | | 3,865 | | | | 4,259,810 | |
North Carolina HFA, Refunding RB, Series 28-A, AMT, 4.65%, 7/01/23 (b) | | | | | 2,795 | | | | 2,874,182 | |
| | | | | | | | | 7,133,992 | |
Ohio — 1.4% | | | | | | | | | | |
State of Ohio, GO, Refunding, Higher Education, Series B, 5.00%, 8/01/18 | | | | | 3,000 | | | | 3,500,160 | |
Oklahoma — 0.6% | | | | | | | | | | |
Canadian County Educational Facilities Authority, RB, Mustang Public Schools Project, 4.00%, 9/01/18 | | | | | 1,000 | | | | 1,086,360 | |
See Notes to Financial Statements.
| 16 | SEMI-ANNUAL REPORT | JUNE 30, 2013
|
| |
| Schedule of Investments (continued) | BlackRock Municipal 2018 Term Trust (BPK)
(Percentages shown are based on Net Assets)
|
Municipal Bonds
|
|
|
| Par
(000)
|
| Value
|
Oklahoma (concluded) | | | | | | | | | | |
Oklahoma County Finance Authority, Refunding RB, Epworth Villa Project: | | | | | | | | | | |
2.50%, 4/01/15 | | | | $ | 175 | | | $ | 172,534 | |
Series A, 2.25%, 4/01/14 | | | | | 175 | | | | 173,941 | |
| | | | | | | | | 1,432,835 | |
Pennsylvania — 3.9% | | | | | | | | | | |
Cumberland County Municipal Authority, Refunding RB, Diakon Lutheran, 5.75%, 1/01/19 | | | | | 2,375 | | | | 2,738,185 | |
Pennsylvania Economic Development Financing Authority, Refunding RB, Amtrak Project, Series A, AMT, 3.00%, 11/01/18 | | | | | 1,000 | | | | 1,006,930 | |
Pennsylvania Higher Educational Facilities Authority, RB, Shippensburg University Student Services, Inc., Student Housing Project: | | | | | | | | | | |
4.00%, 10/01/17 | | | | | 275 | | | | 283,462 | |
4.00%, 10/01/18 | | | | | 560 | | | | 572,236 | |
Pennsylvania Higher Educational Facilities Authority, Refunding RB, Drexel University, Series A, 5.00%, 5/01/18 | | | | | 1,000 | | | | 1,144,090 | |
Pennsylvania IDA, Refunding RB, Economic Development, 5.00%, 7/01/18 | | | | | 1,500 | | | | 1,721,970 | |
Pennsylvania Turnpike Commission, RB, Sub-Series A (AGC), 5.00%, 6/01/22 | | | | | 1,000 | | | | 1,107,250 | |
State Public School Building Authority, RB, Community College of Allegheny County Project (AGM), 5.00%, 7/15/18 | | | | | 900 | | | | 1,032,831 | |
| | | | | | | | | 9,606,954 | |
Puerto Rico — 1.4% | | | | | | | | | | |
Puerto Rico Commonwealth Aqueduct & Sewer Authority, RB, Senior Lien, Series A, 5.00%, 7/01/19 | | | | | 2,210 | | | | 2,155,789 | |
Puerto Rico Sales Tax Financing Corp., Refunding RB, Sales Tax Revenue, Series C, 5.00%, 8/01/22 | | | | | 1,320 | | | | 1,476,116 | |
| | | | | | | | | 3,631,905 | |
South Carolina — 2.0% | | | | | | | | | | |
South Carolina Jobs EDA, Refunding RB, Palmetto Health Alliance, Series A, 6.13%, 8/01/23 | | | | | 5,000 | | | | 5,021,900 | |
Texas — 15.3% | | | | | | | | | | |
Alliance Airport Authority Texas, Refunding RB, FedEx Corp. Project, AMT, 4.85%, 4/01/21 | | | | | 2,000 | | | | 2,097,340 | |
Birdville ISD Texas, GO, Refunding, CAB (PSF-GTD) (h): | | | | | | | | | | |
1.76%, 2/15/18 | | | | | 1,615 | | | | 1,489,062 | |
2.07%, 2/15/19 | | | | | 1,815 | | | | 1,616,875 | |
2.32%, 2/15/20 | | | | | 2,625 | | | | 2,252,381 | |
2.61%, 2/15/21 | | | | | 2,500 | | | | 2,051,600 | |
Central Texas Regional Mobility Authority, Refunding RB, Senior Lien: | | | | | | | | | | |
5.75%, 1/01/18 | | | | | 750 | | | | 846,825 | |
5.75%, 1/01/19 | | | | | 750 | | | | 854,408 | |
City of Dallas Texas, Refunding RB, Civic Center Convention Complex (AGC), 5.00%, 8/15/21 | | | | | 2,500 | | | | 2,790,325 | |
City of Houston Texas, Refunding RB, Sub Lien, Series B, 5.00%, 7/01/18 | | | | | 1,000 | | | | 1,149,010 | |
Love Field Airport Modernization Corp., RB, Southwest Airlines Co., Love Field Modernization Program Project, AMT, 5.00%, 11/01/18 | | | | | 5,000 | | | | 5,374,900 | |
Lower Colorado River Authority, Refunding RB, LCRA Transmission, Series B, 5.00%, 5/15/18 | | | | | 5,000 | | | | 5,780,400 | |
| | | | | | | | | | | |
Municipal Bonds
|
|
|
| Par
(000)
|
| Value
|
Texas (concluded) | | | | | | | | | | |
North Texas Tollway Authority, Refunding RB, Series C: | | | | | | | | | | |
5.00%, 1/01/19 | | | | $ | 2,215 | | | $ | 2,491,011 | |
5.25%, 1/01/20 | | | | | 4,000 | | | | 4,501,360 | |
Texas Municipal Gas Acquisition & Supply Corp. III, RB, 5.00%, 12/15/18 | | | | | 4,360 | | | | 4,803,063 | |
| | | | | | | | | 38,098,560 | |
US Virgin Islands — 0.4% | | | | | | | | | | |
Virgin Islands Public Finance Authority, Refunding RB, Senior Lien, Series B, 5.00%, 10/01/18 | | | | | 1,000 | | | | 1,103,360 | |
Virginia — 1.9% | | | | | | | | | | |
City of Norfolk Virginia, Refunding RB, Water Revenue, 5.00%, 11/01/18 | | | | | 1,230 | | | | 1,442,446 | |
Hanover County EDA, Refunding RB, Residential Care Facility, Covenant Woods, Series A, 3.00%, 7/01/14 | | | | | 415 | | | | 416,025 | |
Virginia HDA, Refunding RB, Sub-Series E-2, AMT, 4.38%, 10/01/19 | | | | | 2,750 | | | | 2,817,760 | |
| | | | | | | | | 4,676,231 | |
Washington — 0.2% | | | | | | | | | | |
Washington Health Care Facilities Authority, Refunding RB, Providence Health & Services, Series B, 5.00%, 10/01/18 | | | | | 500 | | | | 576,120 | |
Wisconsin — 1.9% | | | | | | | | | | |
City of Franklin Wisconsin, RB, Waste Management, Inc. Project, AMT, 4.95%, 4/01/16 | | | | | 1,990 | | | | 2,122,932 | |
State of Wisconsin, Refunding RB, Series A, 5.00%, 5/01/18 | | | | | 1,000 | | | | 1,155,450 | |
Wisconsin Health & Educational Facilities Authority, Refunding RB, Froedtert & Community Health, Inc., 5.00%, 4/01/19 | | | | | 1,265 | | | | 1,451,157 | |
| | | | | | | | | 4,729,539 | |
Total Municipal Bonds — 130.4% | | | | | | | | | 324,185,071 | |
| |
Municipal Bonds Transferred to
Tender Option Bond Trusts (i) |
Illinois — 2.3% | | | | | | | | | | |
City of Chicago Illinois, Refunding RB, Second Lien (AGM), 5.00%, 11/01/20 | | | | | 5,000 | | | | 5,622,950 | |
Total Long-Term Investments
(Cost — $316,187,637) — 132.7% | | | | | | | | | 329,808,021 | |
| |
Short-Term Securities | | | | | Shares | | | | | |
FFI Institutional Tax-Exempt Fund, 0.03% (j)(k) | | | | 6,092,288 | | | 6,092,288 | |
Total Short-Term Securities
(Cost — $6,092,288) — 2.4% | | | | | | | | | 6,092,288 | |
Total Investments (Cost — $322,279,925) — 135.1% | | | | | | | | | 335,900,309 | |
Other Assets Less Liabilities — 0.9% | | | | | | | | | 2,400,557 | |
Liability for TOB Trust Certificates, Including Interest Expense and Fees Payable — (1.5%) | | | | | | | | | (3,751,040 | ) |
Preferred Shares, at Redemption Value — (34.5%) | | (85,851,022 | ) |
Net Assets Applicable to Common Shares — 100.0% | $ | 248,698,804 | |
See Notes to Financial Statements.
| SEMI-ANNUAL REPORT | JUNE 30, 2013 | 17
|
| |
| Schedule of Investments (continued) | BlackRock Municipal 2018 Term Trust (BPK)
|
Notes to Schedule of Investments
| (a) | | | | Security exempt from registration pursuant to Rule 144A under the Securities Act of 1933, as amended. These securities may be resold in transactions exempt from registration to qualified institutional investors. |
| (b) | | | | Variable rate security. Rate shown is as of report date. |
| (c) | | | | Issuer filed for bankruptcy and/or is in default of principal and/or interest payments. |
| (d) | | | | Non-income producing security. |
| (e) | | | | Security represents a beneficial interest in a trust. The collateral deposited into the trust is federally tax-exempt revenue bonds issued by various state or local governments, or their respective agencies or authorities. The security is subject to remarketing prior to its stated maturity. |
| (f) | | | | When-issued security. Unsettled when-issued transactions were as follows: |
Counterparty
|
|
|
| Value
|
| Unrealized
Appreciation
|
Citigroup, Inc. | | | | $ | 367,187 | | | | $3,082 | |
| (g) | | | | Security is collateralized by municipal or US Treasury obligations. |
| (h) | | | | Represents a zero-coupon bond. Rate shown reflects the current yield as of report date. |
| (i) | | | | Securities represent bonds transferred to a TOB in exchange for which the Trust acquired residual interest certificates. These securities serve as collateral in a financing transaction. See Note 3 of the Notes to Financial Statements for details of municipal bonds transferred to TOBs. |
| (j) | | | | Investments in issuers considered to be an affiliate of the Trust during the six months ended June 30, 2013, for purposes of Section 2(a)(3) of the 1940 Act, were as follows: |
Affiliate
|
|
|
| Shares
Held at
December 31, 2012
|
| Net
Activity
|
| Shares
Held at
June 30, 2013
|
| Income
|
FFI Institutional Tax-Exempt Fund | | | | | 26,827,828 | | | | (20,735,540 | ) | | | 6,092,288 | | | $ | 599 | |
| (k) | | | | Represents the current yield as of report date. |
| • | | | | Fair Value Measurements—Various inputs are used in determining the fair value of investments. These inputs to valuation techniques are categorized into a disclosure hierarchy consisting of three broad levels for financial statement purposes as follows: |
| • | | | | Level 1 — unadjusted price quotations in active markets/exchanges for identical assets or liabilities that the Trust has the ability to access |
| • | | | | Level 2 — other observable inputs (including, but not limited to, quoted prices for similar assets or liabilities in markets that are active, quoted prices for identical or similar assets or liabilities in markets that are not active, inputs other than quoted prices that are observable for the assets or liabilities (such as interest rates, yield curves, volatilities, prepayment speeds, loss severities, credit risks and default rates) or other market-corroborated inputs) |
| • | | | | Level 3 — unobservable inputs based on the best information available in the circumstances, to the extent observable inputs are not available (including the Trust’s own assumptions used in determining the fair value of investments) |
| | | | | The hierarchy gives the highest priority to unadjusted quoted prices in active markets for identical assets or liabilities (Level 1 measurements) and the lowest priority to unobservable inputs (Level 3 measurements). Accordingly, the degree of judgment exercised in determining fair value is greatest for instruments categorized in Level 3. The inputs used to measure fair value may fall into different levels of the fair value hierarchy. In such cases, for disclosure purposes, the fair value hierarchy classification is determined based on the lowest level input that is significant to the fair value measurement in its entirety. |
| | | | | Changes in valuation techniques may result in transfers into or out of an assigned level within the disclosure hierarchy. In accordance with the Trust’s policy, transfers between different levels of the fair value disclosure hierarchy are deemed to have occurred as of the beginning of the reporting period. The categorization of a value determined for investments is based on the pricing transparency of the investment and is not necessarily an indication of the risks associated with investing in those securities. For information about the Trust’s policy regarding valuation of investments, please refer to Note 2 of the Notes to Financial Statements. |
| | | | | The following table summarizes the Trust’s investments categorized in the disclosure hierarchy as of June 30, 2013: |
|
|
|
| Level 1
|
| Level 2
|
| Level 3
|
| Total
|
Assets:
| | | |
Investments:
| | | | | | | | | | | | | | | | | | |
Long-Term Investments1 | | | | | — | | | $ | 329,808,021 | | | | — | | | $ | 329,808,021 | |
Short-Term Securities | | | | $ | 6,092,288 | | | | — | | | | — | | | | 6,092,288 | |
Total
| | | | $ | 6,092,288 | | | $ | 329,808,021 | | | | — | | | $ | 335,900,309 | |
| 1 | See above Schedule of Investments for values in each state or political subdivision. |
See Notes to Financial Statements.
| 18 | SEMI-ANNUAL REPORT | JUNE 30, 2013
|
| |
| Schedule of Investments (concluded) | BlackRock Municipal 2018 Term Trust (BPK)
|
| | | | | Certain of the Trust’s assets and/or liabilities are held at carrying amount, which approximates fair value for financial statement purposes. As of June 30, 2013, such assets and liabilities are categorized within the disclosure hierarchy as follows: |
|
|
|
| Level 1
|
| Level 2
|
| Level 3
|
| Total
|
Assets:
| | | |
Cash | | | | $ | 2,156 | | | | — | | | | — | | | $ | 2,156 | |
Liabilities:
| | | | | | | | | | | | | | | | | | |
TOB trust certificates | | | | | — | | | $ | (3,750,000 | ) | | | — | | | | (3,750,000 | ) |
Total
| | | | $ | 2,156 | | | $ | (3,750,000 | ) | | | — | | | $ | (3,747,844 | ) |
| | | | | There were no transfers between levels during the six months ended June 30, 2013. |
See Notes to Financial Statements.
| SEMI-ANNUAL REPORT | JUNE 30, 2013 | 19
|
| |
| Schedule of Investments June 30, 2013 (Unaudited) | BlackRock New York Municipal 2018 Term Trust (BLH)
(Percentages shown are based on Net Assets) |
|
Municipal Bonds
| | | | Par
(000) | | Value |
New York — 135.5% |
Corporate — 2.5% | | | | | | | | | | |
Port Authority of New York & New Jersey, RB, Continental Airlines, Inc. and Eastern Air Lines, Inc. Project, LaGuardia, AMT, 9.13%, 12/01/15 | | | | $ | 1,325 | | | $ | 1,357,860 | |
County/City/Special District/School District — 50.5% | | | |
City of New York, New York, GO: | | | | | | | | | | |
Series M, 5.00%, 4/01/15 (a) | | | | | 1,055 | | | | 1,138,588 | |
Series M, 5.00%, 4/01/23 | | | | | 335 | | | | 357,321 | |
Sub-Series G-1, 5.00%, 4/01/18 | | | | | 5,000 | | | | 5,767,850 | |
Sub-Series H-2, 5.00%, 6/01/20 | | | | | 3,470 | | | | 4,089,846 | |
City of Rochester New York, GO, Refunding, Series I, 4.00%, 8/15/18 | | | | | 2,500 | | | | 2,779,975 | |
New York City Transitional Finance Authority, RB, Fiscal 2008, Series S-1, 5.00%, 1/15/23 | | | | | 1,400 | | | | 1,546,020 | |
New York City Transitional Finance Authority, Refunding RB, Future Tax Secured, Series B, 5.00%, 2/01/20 | | | | | 2,000 | | | | 2,346,060 | |
New York State, Series E, GO: | | | | | | | | | | |
5.00%, 12/15/18 | | | | | 1,000 | | | | 1,179,770 | |
5.00%, 12/15/20 | | | | | 2,000 | | | | 2,405,540 | |
New York State Dormitory Authority, RB: | | | | | | | | | | |
Series E, 5.00%, 8/15/19 | | | | | 1,500 | | | | 1,764,480 | |
State University Dormitory Facilities, Series A, 5.00%, 7/01/18 | | | | | 1,045 | | | | 1,212,378 | |
New York State Dormitory Authority, Refunding RB, Third General Resolution, State University Educational Facilites, Series A, 4.00%, 5/15/18 | | | | | 1,000 | | | | 1,108,390 | |
New York State Urban Development Corp., Refunding RB, Series D, 5.50%, 1/01/19 | | | | | 750 | | | | 884,985 | |
Owego Apalachin Central School District, GO, Refunding (AGM), 4.00%, 6/15/18 | | | | | 1,015 | | | | 1,115,292 | |
| | | | | | | | | 27,696,495 | |
Education — 25.2% | | | | | | | | | | |
Albany Industrial Development Agency, RB, New Covenant Charter School Project, Series A, 7.00%, 5/01/25 (b)(c) | | | | | 450 | | | | 67,388 | |
City of Troy New York, Refunding RB, Rensselaer Polytechnic, Series B, 5.00%, 9/01/18 | | | | | 1,000 | | | | 1,150,650 | |
New York State Dormitory Authority, LRB, State University Dormitory Facilities, Series A, 5.00%, 7/01/21 | | | | | 1,155 | | | | 1,313,801 | |
New York State Dormitory Authority, RB: | | | | | | | | | | |
Mental Health Services, 5.00%, 8/15/18 | | | | | 1,020 | | | | 1,178,692 | |
Pratt Institute, Series C (AGC), 5.00%, 7/01/19 | | | | | 600 | | | | 690,984 | |
School District Financing Program, Series C, 4.00%, 10/01/18 | | | | | 535 | | | | 589,688 | |
University of Rochester, Series A, 5.00%, 7/01/21 | | | | | 250 | | | | 287,962 | |
New York State Dormitory Authority, Refunding RB: | | | | | | | | | | |
Brooklyn Law School, Series A (Radian), 5.50%, 7/01/13 (a) | | | | | 1,000 | | | | 1,000,430 | |
Mental Health Services, 5.00%, 8/15/18 (d) | | | | | 5 | | | | 5,881 | |
State University Dormitory Facilities, Series A, 5.00%, 7/01/18 | | | | | 250 | | | | 286,995 | |
Teachers College, Series A, 5.00%, 7/01/17 | | | | | 200 | | | | 228,016 | |
Yeshiva University, 5.00%, 9/01/27 | | | | | 2,000 | | | | 2,160,200 | |
Westchester County Industrial Development Agency, RB, New York, Purchase College Foundation Housing, Series A (AMBAC), 5.13%, 12/01/22 | | | | | 3,710 | | | | 3,729,477 | |
| | | | | | | | | | | |
Municipal Bonds
| | | | Par
(000) | | Value |
New York (continued) |
Education (concluded) | | | | | | | | | | |
Yonkers Industrial Development Agency New York, RB, Sarah Lawrence College Project, Series A: | | | | | | | | | | |
5.00%, 6/01/18 | | | | $ | 600 | | | $ | 669,246 | |
5.00%, 6/01/19 | | | | | 400 | | | | 448,704 | |
| | | | | | | | | 13,808,114 | |
Health — 7.1% | | | | | | | | | | |
New York State Dormitory Authority, Refunding RB, Miriam Osborn Memorial Home, 2.50%, 7/01/18 | | | | | 1,890 | | | | 1,893,137 | |
Orange County Industrial Development Agency, Refunding RB, St. Luke’s Hospital Newburgh New York Project, Series A (Radian), 5.38%, 12/01/21 | | | | | 2,000 | | | | 2,008,400 | |
| | | | | | | | | 3,901,537 | |
Housing — 11.4% | | | | | | | | | | |
New York Mortgage Agency, Refunding RB, AMT, 4.50%, 10/01/20 | | | | | 4,110 | | | | 4,265,070 | |
New York State Dormitory Authority, Refunding RB, Series A: | | | | | | | | | | |
North Shore Long Island Jewish, 5.00%, 5/01/18 | | | | | 615 | | | | 701,161 | |
North Shore Long Island Jewish, 4.00%, 5/01/19 | | | | | 250 | | | | 272,868 | |
North Shore Long Island Jewish, 5.00%, 5/01/19 | | | | | 650 | | | | 744,776 | |
State University Educational Facilities, 5.88%, 5/15/17 | | | | | 125 | | | | 142,689 | |
New York State HFA, RB, Affordable Housing, Series E (SONYMA), 1.50%, 5/01/18 | | | | | 120 | | | | 117,282 | |
| | | | | | | | | 6,243,846 | |
State — 8.4% | | | | | | | | | | |
Monroe County Industrial Development Agency, RB, Rochester Schools Modernization Project, Series A, 5.00%, 5/01/18 | | | | | 1,000 | | | | 1,145,090 | |
New York State Dormitory Authority, RB, Series A, 5.00%, 3/15/18 | | | | | 2,000 | | | | 2,304,380 | |
New York State Dormitory Authority, Refunding LRB, Municipal Health Facilities, 4.00%, 5/15/18 | | | | | 550 | | | | 604,637 | |
New York State Urban Development Corp., RB, State Personal Income Tax, Series A-1, 5.00%, 12/15/22 | | | | | 500 | | | | 573,570 | |
| | | | | | | | | 4,627,677 | |
Transportation — 23.4% | | | | | | | | | | |
Metropolitan Transportation Authority, RB: | | | | | | | | | | |
Series A, 5.00%, 11/15/18 | | | | | 1,000 | | | | 1,162,630 | |
Series C, 4.00%, 11/15/16 | | | | | 1,000 | | | | 1,088,790 | |
Series C, 5.00%, 11/15/17 | | | | | 1,000 | | | | 1,143,000 | |
Series C, 5.00%, 11/15/18 | | | | | 1,965 | | | | 2,267,276 | |
New York State Thruway Authority, RB: | | | | | | | | | | |
Refunding, Series I, 5.00%, 1/01/18 | | | | | 1,300 | | | | 1,485,419 | |
Transportation, Series A, 5.00%, 3/15/20 | | | | | 1,750 | | | | 2,017,085 | |
Port Authority of New York & New Jersey, RB, JFK International Air Terminal, 5.00%, 12/01/20 | | | | | 300 | | | | 327,960 | |
Triborough Bridge & Tunnel Authority, Refunding RB, Series B, 4.00%, 11/15/18 | | | | | 3,000 | | | | 3,347,400 | |
| | | | | | | | | 12,839,560 | |
See Notes to Financial Statements.
| 20 | SEMI-ANNUAL REPORT | JUNE 30, 2013
|
| |
| Schedule of Investments (continued) | BlackRock New York Municipal 2018 Term Trust (BLH)
(Percentages shown are based on Net Assets)
|
Municipal Bonds
| | | | Par
(000) | | Value |
New York (concluded) |
Utilities — 7.0% | | | | | | | | | | |
Long Island Power Authority, Refunding RB, Series A, 5.25%, 4/01/21 | | | | $ | 1,000 | | | $ | 1,140,390 | |
New York City Municipal Water Finance Authority, Refunding RB, Series FF, 5.00%, 6/15/20 | | | | | 2,000 | | | | 2,374,560 | |
Upper Mohawk Valley Regional Water Finance Authority, Refunding RB, Series 2012, 4.00%, 4/01/18 | | | | | 300 | | | | 326,289 | |
| | | | | | | | | 3,841,239 | |
Total Municipal Bonds in New York | | | | | | | | | 74,316,328 | |
|
Guam — 0.3% |
Utility — 0.3% | | | | | | | | | | |
Guam Power Authority, Refunding RB, Series A (AGM), 5.00%, 10/01/19 | | | | | 140 | | | | 156,986 | |
|
Puerto Rico — 5.5% |
State — 2.8% | | | | | | | | | | |
Puerto Rico Sales Tax Financing Corp., Refunding RB, Sales Tax Revenue, Series C, 5.00%, 8/01/22 | | | | | 1,365 | | | | 1,526,439 | |
| | | | | | | | | | | |
Municipal Bonds
| | | | Par
(000) | | Value |
Puerto Rico (concluded) |
Utilities — 2.7% | | | | | | | | | | |
Puerto Rico Commonwealth Aqueduct & Sewer Authority, Refunding RB, Senior Lien, Series A, 5.00%, 7/01/19 | | | | $ | 500 | | | $ | 487,735 | |
Puerto Rico Electric Power Authority, RB, Series WW, 5.50%, 7/01/21 | | | | | 1,000 | | | | 1,015,290 | |
| | | | | | | | | 1,503,025 | |
Total Municipal Bonds in Puerto Rico | | | | | | | | | 3,029,464 | |
Total Long-Term Investments
(Cost — $76,426,186) — 141.3% | | | | | | | | | 77,502,778 | |
| |
Short-Term Securities | | | | | Shares | | | | | |
BIF New York Municipal Money Fund, 0.00% (e)(f) | | | | | 2,070,734 | | | | 2,070,734 | |
Total Short-Term Securities
(Cost — $2,070,734) — 3.8% | | | | | | | | | 2,070,734 | |
Total Investments (Cost — $78,496,920) — 145.1% | | | | | | | | | 79,573,512 | |
Other Assets Less Liabilities — 2.0% | | | | | | | | | 1,082,077 | |
Preferred Shares, at Redemption Value — (47.1%) | | (25,825,463 | ) |
Net Assets Applicable to Common Shares — 100.0% | $ | 54,830,126 | |
Notes to Schedule of Investments
| (a) | | | | US government securities, held in escrow, are used to pay interest on this security, as well as to retire the bond in full at the date indicated, typically at a premium to par. |
| (b) | | | | Issuer filed for bankruptcy and/or is in default of principal and/or interest payments. |
| (c) | | | | Non-income producing security. |
| (d) | | | | Security is collateralized by municipal or US Treasury obligations. |
| (e) | | | | Investments in issuers considered to be an affiliate of the Trust during the six months ended June 30, 2013, for purposes of Section 2(a)(3) of the 1940 Act, were as follows: |
Affiliate
|
|
|
| Shares
Held at
December 31, 2012
|
| Net
Activity
|
| Shares
Held at
June 30, 2013
|
| Income
|
BIF New York Municipal Money Fund | | | | | 577,963 | | | | 1,492,771 | | | | 2,070,734 | | | $ | 11 | |
| (f) | | | | Represents the current yield as of report date. |
| • | | | | Fair Value Measurements—Various inputs are used in determining the fair value of investments. These inputs to valuation techniques are categorized into a disclosure hierarchy consisting of three broad levels for financial statement purposes as follows: |
| • | | | | Level 1 — unadjusted price quotations in active markets/exchanges for identical assets or liabilities that the Trust has the ability to access |
| • | | | | Level 2 — other observable inputs (including, but not limited to, quoted prices for similar assets or liabilities in markets that are active, quoted prices for identical or similar assets or liabilities in markets that are not active, inputs other than quoted prices that are observable for the assets or liabilities (such as interest rates, yield curves, volatilities, prepayment speeds, loss severities, credit risks and default rates) or other market-corroborated inputs) |
| • | | | | Level 3 — unobservable inputs based on the best information available in the circumstances, to the extent observable inputs are not available (including the Trust’s own assumptions used in determining the fair value of investments) |
| | | | | The hierarchy gives the highest priority to unadjusted quoted prices in active markets for identical assets or liabilities (Level 1 measurements) and the lowest priority to unobservable inputs (Level 3 measurements). Accordingly, the degree of judgment exercised in determining fair value is greatest for instruments categorized in Level 3. The inputs used to measure fair value may fall into different levels of the fair value hierarchy. In such cases, for disclosure purposes, the fair value hierarchy classification is determined based on the lowest level input that is significant to the fair value measurement in its entirety. |
| | | | | Changes in valuation techniques may result in transfers into or out of an assigned level within the disclosure hierarchy. In accordance with the Trust’s policy, transfers between different levels of the fair value disclosure hierarchy are deemed to have occurred as of the beginning of the reporting period. The categorization of a value determined for investments is based on the pricing transparency of the investment and is not necessarily an indication of the risks associated with investing in those securities. For information about the Trust’s policy regarding valuation of investments, please refer to Note 2 of the Notes to Financial Statements. |
See Notes to Financial Statements.
| SEMI-ANNUAL REPORT | JUNE 30, 2013 | 21
|
| |
| Schedule of Investments (concluded) | BlackRock New York Municipal 2018 Term Trust (BLH)
|
| | | | | The following table summarizes the Trust’s investments categorized in the disclosure hierarchy as of June 30, 2013: |
|
|
|
| Level 1
|
| Level 2
|
| Level 3
|
| Total
|
Assets:
| | | |
Investments:
| | | | | | | | | | | | | | | | | | |
Long-Term Investments1 | | | | | — | | | $ | 77,502,778 | | | | — | | | $ | 77,502,778 | |
Short-Term Securities | | | | $ | 2,070,734 | | | | — | | | | — | | | | 2,070,734 | |
Total
| | | | $ | 2,070,734 | | | $ | 77,502,778 | | | | — | | | $ | 79,573,512 | |
| 1 | See above Schedule of Investments for values in each sector. |
Certain of the Trust’s assets are held at carrying amount, which approximates fair value for financial statement purposes. As of June 30, 2013, cash of $648 is categorized as Level 1 within the disclosure hierarchy. |
There were no transfers between levels during the six months ended June 30, 2013. |
See Notes to Financial Statements.
| 22 | SEMI-ANNUAL REPORT | JUNE 30, 2013
|
| |
| Statements of Assets and Liabilities |
|
June 30, 2013 (Unaudited)
| | | | BlackRock
California
Municipal
2018
Term Trust
(BJZ) | | BlackRock
Municipal
2018
Term Trust
(BPK) | | BlackRock
New York
Municipal
2018
Term Trust
(BLH) |
Assets
|
Investments at value — unaffiliated1 | | | | $ | 136,866,629 | | | $ | 329,808,021 | | | $ | 77,502,778 | |
Investments at value — affiliated2 | | | | | 2,733,052 | | | | 6,092,288 | | | | 2,070,734 | |
Cash | | | | | 1,089 | | | | 2,156 | | | | 648 | |
Interest receivable | | | | | 1,419,708 | | | | 3,980,605 | | | | 832,159 | |
Investments sold receivable | | | | | 1,098,263 | | | | — | | | | 501,080 | |
Prepaid expenses | | | | | 4,488 | | | | 11,273 | | | | 1,925 | |
Total assets | | | | | 142,123,229 | | | | 339,894,343 | | | | 80,909,324 | |
| | | | | | | | | | | | | | | |
Accrued Liabilities
|
Income dividends payable — Common Shares | | | | | 330,014 | | | | 970,390 | | | | 164,576 | |
Investments purchased payable | | | | | — | | | | 364,106 | | | | — | |
Investment advisory fees payable | | | | | 46,836 | | | | 112,295 | | | | 26,668 | |
Officer’s and Trustees’ fees payable | | | | | 10,601 | | | | 42,959 | | | | 7,728 | |
Interest expense and fees payable | | | | | — | | | | 1,040 | | | | — | |
Other accrued expenses payable | | | | | 64,371 | | | | 103,727 | | | | 54,763 | |
Total accrued liabilities | | | | | 451,822 | | | | 1,594,517 | | | | 253,735 | |
| | | | | | | | | | | | | | | |
Other Liabilities
|
TOB trust certificates | | | | | — | | | | 3,750,000 | | | | — | |
Total liabilities | | | | | 451,822 | | | | 5,344,517 | | | | 253,735 | |
| | | | | | | | | | | | | | | |
Preferred Shares at Redemption Value
|
$25,000 per share liquidation preference, plus unpaid dividends3 | | | | | 43,300,932 | | | | 85,851,022 | | | | 25,825,463 | |
Net Assets Applicable to Common Shareholders | | | | $ | 98,370,475 | | | $ | 248,698,804 | | | $ | 54,830,126 | |
| | | | | | | | | | | | | | | |
Net Assets Applicable to Common Shareholders Consist of
|
Paid-in capital4 | | | | $ | 91,946,843 | | | $ | 231,732,309 | | | $ | 52,539,382 | |
Undistributed net investment income | | | | | 3,938,589 | | | | 12,059,639 | | | | 1,767,813 | |
Accumulated net realized loss | | | | | (1,475,686 | ) | | | (8,713,528 | ) | | | (553,661 | ) |
Net unrealized appreciation/depreciation | | | | | 3,960,729 | | | | 13,620,384 | | | | 1,076,592 | |
Net Assets Applicable to Common Shareholders | | | | $ | 98,370,475 | | | $ | 248,698,804 | | | $ | 54,830,126 | |
Net asset value per Common Share | | | | $ | 15.29 | | | $ | 15.63 | | | $ | 15.09 | |
| |
1 Investments at cost — unaffiliated | | | | $ | 132,905,900 | | | $ | 316,187,637 | | | $ | 76,426,186 | |
| |
2 Investments at cost — affiliated | | | | $ | 2,733,052 | | | $ | 6,092,288 | | | $ | 2,070,734 | |
| |
3 Preferred Shares outstanding, unlimited number of
shares authorized, par value $0.001 per share | | | | | 1,732 | | | | 3,434 | | | | 1,033 | |
| |
4 Common Shares outstanding, unlimited number of
shares authorized, par value $0.001 per share | | | | | 6,433,028 | | | | 15,908,028 | | | | 3,633,028 | |
See Notes to Financial Statements.
| SEMI-ANNUAL REPORT | JUNE 30, 2013 | 23
|
Six Months Ended June 30, 2013 (Unaudited)
| | | | BlackRock
California
Municipal
2018
Term Trust
(BJZ) | | BlackRock
Municipal
2018
Term Trust
(BPK) | | BlackRock
New York
Municipal
2018
Term Trust
(BLH) |
Investment Income
|
Interest | | | | $ | 2,453,755 | | | $ | 6,986,119 | | | $ | 1,138,802 | |
Income — affiliated | | | | | 10,737 | | | | 599 | | | | 11 | |
Total income | | | | | 2,464,492 | | | | 6,986,718 | | | | 1,138,813 | |
| | | | | | | | | | | | | | | |
Expenses
|
Investment advisory | | | | | 295,091 | | | | 714,252 | | | | 165,553 | |
Remarketing fees for Preferred Shares | | | | | 40,362 | | | | 92,110 | | | | 22,377 | |
Professional | | | | | 28,753 | | | | 38,913 | | | | 25,376 | |
Accounting services | | | | | 14,789 | | | | 24,839 | | | | 11,046 | |
Transfer agent | | | | | 11,383 | | | | 17,346 | | | | 10,332 | |
Officer and Trustees | | | | | 5,851 | | | | 14,422 | | | | 3,397 | |
Custodian | | | | | 5,617 | | | | 12,008 | | | | 3,926 | |
Registration | | | | | 4,526 | | | | 4,526 | | | | 4,526 | |
Printing | | | | | 3,681 | | | | 5,499 | | | | 2,990 | |
Miscellaneous | | | | | 11,137 | | | | 14,913 | | | | 11,421 | |
Total expenses excluding interest expense and fees | | | | | 421,190 | | | | 938,828 | | | | 260,944 | |
Interest expense and fees1 | | | | | — | | | | 19,858 | | | | — | |
Total expenses | | | | | 421,190 | | | | 958,686 | | | | 260,944 | |
Less fees waived by Manager | | | | | (1,123 | ) | | | (1,827 | ) | | | (290 | ) |
Total expenses after fees waived | | | | | 420,067 | | | | 956,859 | | | | 260,654 | |
Net investment income | | | | | 2,044,425 | | | | 6,029,859 | | | | 878,159 | |
| | | | | | | | | | | | | | | |
Realized and Unrealized Gain (Loss)
|
Net realized gain (loss) from investments | | | | | (12,351 | ) | | | (655,817 | ) | | | 41,978 | |
Net change in unrealized appreciation/depreciation on investments | | | | | (3,283,247 | ) | | | (5,992,129 | ) | | | (1,889,464 | ) |
Total realized and unrealized loss | | | | | (3,295,598 | ) | | | (6,647,946 | ) | | | (1,847,486 | ) |
| | | | | | | | | | | | | | | |
Dividends to Preferred Shareholders From
|
Net investment income | | | | | (47,699 | ) | | | (101,149 | ) | | | (27,085 | ) |
Net Decrease in Net Assets Applicable to Common Shareholders Resulting from Operations | | | | $ | (1,298,872 | ) | | $ | (719,236 | ) | | $ | (996,412 | ) |
See Notes to Financial Statements.
| 24 | SEMI-ANNUAL REPORT | JUNE 30, 2013
|
| |
| Statements of Changes in Net Assets |
|
| | | BlackRock
California Municipal
2018 Term Trust (BJZ)
| | BlackRock
Municipal 2018
Term Trust (BPK)
|
Increase (Decrease) in Net Assets Applicable to Common Shareholders:
| | | Six Months Ended
June 30, 2013
(Unaudited) | | Year Ended
December 31,
2012 | | Six Months Ended
June 30, 2013
(Unaudited) | | Year Ended
December 31,
2012 |
Operations
|
Net investment income | | | $ | 2,044,425 | | | $ | 4,570,677 | | | $ | 6,029,859 | | | $ | 13,858,758 | |
Net realized gain (loss) | | | | (12,351 | ) | | | 2,234,212 | | | | (655,817 | ) | | | 5,294,463 | |
Net change in unrealized appreciation/depreciation | | | | (3,283,247 | ) | | | (372,381 | ) | | | (5,992,129 | ) | | | 2,762,824 | |
Dividends to Preferred Shareholders from net investment income | | | | (47,699 | ) | | | (143,300 | ) | | | (101,149 | ) | | | (345,256 | ) |
Net increase (decrease) in net assets applicable to Common Shareholders resulting from operations | | | | (1,298,872 | ) | | | 6,289,208 | | | | (719,236 | ) | | | 21,570,789 | |
| | | | | | | | | | | | | | | | | | |
Dividends to Common Shareholders From
|
Net investment income | | | | (2,059,856 | ) | | | (4,905,184 | ) 1 | | | (6,293,216 | ) | | | (14,928,093 | )1 |
| | | | | | | | | | | | | | | | | |
Net Assets Applicable to Common Shareholders
|
Total increase (decrease) in net assets applicable to Common Shareholders | | | | (3,358,728 | ) | | | 1,384,024 | | | | (7,012,452 | ) | | | 6,642,696 | |
Beginning of period | | | | 101,729,203 | | | | 100,345,179 | | | | 255,711,256 | | | | 249,068,560 | |
End of period | | | $ | 98,370,475 | | | $ | 101,729,203 | | | $ | 248,698,804 | | | $ | 255,711,256 | |
Undistributed net investment income | | | $ | 3,938,589 | | | $ | 4,001,719 | | | $ | 12,059,639 | | | $ | 12,424,145 | |
| | | | BlackRock
New York Municipal
2018 Term Trust (BLH)
|
Increase (Decrease) in Net Assets Applicable to Common Shareholders:
| | | | Six Months
Ended
June 30, 2013
(Unaudited) | | Year Ended
December 31,
2012 |
Operations
|
Net investment income | | | | $ | 878,159 | | | $ | 2,356,843 | |
Net realized gain | | | | | 41,978 | | | | 619,851 | |
Net change in unrealized appreciation/depreciation | | | | | (1,889,464 | ) | | | 248,956 | |
Dividends to Preferred Shareholders from net investment income | | | | | (27,085 | ) | | | (80,614 | ) |
Net increase in net assets applicable to Common Shareholders resulting from operations | | | | | (996,412 | ) | | | 3,145,036 | |
| | | | | | | | | | | |
Dividends to Common Shareholders From
|
Net investment income | | | | | (1,094,268 | ) | | | (3,032,489 | )1 |
| | | | | | | | | | |
Net Assets Applicable to Common Shareholders
|
Total increase (decrease) in net assets applicable to Common Shareholders | | | | | (2,090,680 | ) | | | 112,547 | |
Beginning of period | | | | | 56,920,806 | | | | 56,808,259 | |
End of period | | | | $ | 54,830,126 | | | $ | 56,920,806 | |
Undistributed net investment income | | | | $ | 1,767,813 | | | $ | 2,011,007 | |
| 1 | | Dividends are determined in accordance with federal income tax regulations. |
See Notes to Financial Statements.
| SEMI-ANNUAL REPORT | JUNE 30, 2013 | 25
|
| |
| Financial Highlights | BlackRock California Municipal 2018 Term Trust (BJZ)
|
| | | | Six Months
Ended
June 30,
2013
(Unaudited) | |
Year Ended December 31,
|
| | | | | 2012 | | 2011 | | 2010 | | 2009 | | 2008 |
Per Share Operating Performance |
Net asset value, beginning of period | | | | $ | 15.81 | | | $ | 15.60 | | | $ | 14.34 | | | $ | 14.36 | | | $ | 11.94 | | | $ | 14.82 | |
Net investment income1 | | | | | 0.32 | | | | 0.71 | | | | 0.86 | | | | 0.98 | | | | 1.03 | | | | 1.05 | |
Net realized and unrealized gain (loss) | | | | | (0.51 | ) | | | 0.28 | | | | 1.28 | | | | (0.11 | ) | | | 2.25 | | | | (2.90 | ) |
Dividends to Preferred Shareholders from net investment income | | | | | (0.01 | ) | | | (0.02 | ) | | | (0.02 | ) | | | (0.03 | ) | | | (0.05 | ) | | | (0.29 | ) |
Net increase (decrease) from investment operations | | | | | (0.20 | ) | | | 0.97 | | | | 2.12 | | | | 0.84 | | | | 3.23 | | | | (2.14 | ) |
Dividends to Common Shareholders from net investment income | | | | | (0.32 | ) | | | (0.76 | )2 | | | (0.86 | )2 | | | (0.86 | )2 | | | (0.81 | )2 | | | (0.74 | )2 |
Net asset value, end of period | | | | $ | 15.29 | | | $ | 15.81 | | | $ | 15.60 | | | $ | 14.34 | | | $ | 14.36 | | | $ | 11.94 | |
Market price, end of period | | | | $ | 15.32 | | | $ | 16.21 | | | $ | 16.34 | | | $ | 15.38 | | | $ | 15.09 | | | $ | 11.60 | |
| | | | | | | | | | | | | | | | | | | | | | | | | | | |
Total Investment Return3
|
Based on net asset value | | | | | (1.32)% | 4 | | | 6.16% | | | | 14.86% | | | | 5.56% | | | | 27.09% | | | | (15.18)% |
Based on market price | | | | | (3.57)% | 4 | | | 3.92% | | | | 12.17% | | | | 7.73% | | | | 37.46% | | | | (20.70)% |
| | | | | | | | | | | | | | | | | | | | | | | |
Ratios to Average Net Assets Applicable to Common Shareholders
|
Total expenses5 | | | | | 0.84% | 6 | | | 0.93% | | | | 0.93% | | | | 0.92% | | | | 0.96% | | | | 0.97% | |
Total expenses after fees waived5 | | | | | 0.83% | 6,7 | | | 0.92% | | | | 0.91% | | | | 0.91% | | | | 0.95% | | | | 0.96% | |
Net investment income5 | | | | | 4.06% | 6 | | | 4.51% | | | | 5.82% | | | | 6.64% | | | | 7.56% | | | | 7.43% | |
Dividends to Preferred Shareholders | | | | | 0.10% | 6 | | | 0.14% | | | | 0.17% | | | | 0.24% | | | | 0.38% | | | | 2.07% | |
Net investment income to Common Shareholders | | | | | 3.96% | 6 | | | 4.37% | | | | 5.65% | | | | 6.40% | | | | 7.18% | | | | 5.36% | |
| | | | | | | | | | | | | | | | | | | | | | | | | | | |
Supplemental Data
|
Net assets applicable to Common Shareholders, end of period (000) | | | | $ | 98,370 | | | $ | 101,729 | | | $ | 100,345 | | | $ | 92,260 | | | $ | 92,410 | | | $ | 76,795 | |
Preferred Shares outstanding at $25,000 liquidation preference,
end of period (000) | | | | $ | 43,300 | | | $ | 55,525 | | | $ | 55,525 | | | $ | 55,525 | | | $ | 55,525 | | | $ | 55,525 | |
Portfolio turnover | | | | | — | | | | 15% | | | | 28% | | | | 7% | | | | 5% | | | | 1% | |
Asset coverage per Preferred Share at $25,000 liquidation preference, end of period | | | | $ | 81,796 | | | $ | 70,803 | | | $ | 70,180 | | | $ | 66,542 | | | $ | 66,609 | | | $ | 59,580 | |
| 1 | | Based on average Common Shares outstanding. |
| 2 | | Dividends are determined in accordance with federal income tax regulations. |
| 3 | | Total investment returns based on market price, which can be significantly greater or lesser than the net asset value, may result in substantially different returns. Where applicable, total investment returns exclude the effects of any sales charges and include the reinvestment of dividends and distributions. |
| 4 | | Aggregate total investment return. |
| 5 | | Do not reflect the effect of dividends to Preferred Shareholders. |
| 7 | | For the six months ended June 30, 2013, the total expense ratio after fees waived and excluding remarketing fees was 0.75%. |
See Notes to Financial Statements.
| 26 | SEMI-ANNUAL REPORT | JUNE 30, 2013
|
| |
| Financial Highlights | BlackRock Municipal 2018 Term Trust (BPK)
|
| | Six Months
Ended
June 30,
2013
(Unaudited) | | |
Year Ended December 31,
|
| | | | 2012 | | | | 2011 | | | | 2010 | | | | 2009 | | | | 2008 | |
Per Share Operating Performance
|
Net asset value, beginning of period | | $ | 16.07 | | | $ | 15.66 | | | $ | 14.58 | | | $ | 14.32 | | | $ | 11.63 | | | $ | 15.06 | |
Net investment income1 | | | 0.38 | | | | 0.87 | | | | 1.04 | | | | 1.07 | | | | 1.12 | | | | 1.12 | |
Net realized and unrealized gain (loss) | | | (0.41 | ) | | | 0.50 | | | | 1.00 | | | | 0.16 | | | | 2.54 | | | | (3.35 | ) |
Dividends to Preferred Shareholders from net investment income | | | (0.01 | ) | | | (0.02 | ) | | | (0.02 | ) | | | (0.03 | ) | | | (0.05 | ) | | | (0.29 | ) |
Net increase (decrease) from investment operations | | | (0.04 | ) | | | 1.35 | | | | 2.02 | | | | 1.20 | | | | 3.61 | | | | (2.52 | ) |
Dividends to Common Shareholders from net investment income | | | (0.40 | ) | | | (0.94 | )2 | | | (0.94 | )2 | | | (0.94 | )2 | | | (0.92 | )2 | | | (0.91 | )2 |
Net asset value, end of period | | $ | 15.63 | | | $ | 16.07 | | | $ | 15.66 | | | $ | 14.58 | | | $ | 14.32 | | | $ | 11.63 | |
Market price, end of period | | $ | 16.10 | | | $ | 16.56 | | | $ | 16.59 | | | $ | 15.75 | | | $ | 15.15 | | | $ | 12.97 | |
| | | | | | | | | | | | | | | | | | | | | | | | | |
Total Investment Return3
|
Based on net asset value | | | (0.40)% | 4 | | | 8.42% | | | | 13.86% | | | | 7.94% | | | | 30.92% | | | | (17.96)% | |
Based on market price | | | (0.45)% | 4 | | | 5.46% | | | | 11.66% | | | | 10.22% | | | | 24.20% | | | | (9.47)% | |
| | | | | | | | | | | | | | | | | | | | | | | | | |
Ratios to Average Net Assets Applicable to Common Shareholders
|
Total expenses5 | | | 0.76% | 6 | | | 0.86% | | | | 0.85% | | | | 0.88% | | | | 0.92% | | | | 0.94% | |
Total expenses after fees waived5 | | | 0.76% | 6 | | | 0.86% | | | | 0.85% | | | | 0.88% | | | | 0.91% | | | | 0.93% | |
Total expenses after fees waived and excluding interest expense and fees5,7 | | | 0.76% | 6,8 | | | 0.85% | | | | 0.84% | | | | 0.87% | | | | 0.90% | | | | 0.91% | |
Net investment income5 | | | 4.79% | 6 | | | 5.51% | | | | 6.94% | | | | 7.23% | | | | 8.36% | | | | 8.04% | |
Dividends to Preferred Shareholders | | | 0.08% | 6 | | | 0.14% | | | | 0.16% | | | | 0.23% | | | | 0.36% | | | | 2.10% | |
Net investment income to Common Shareholders | | | 4.71% | 6 | | | 5.37% | | | | 6.78% | | | | 7.00% | | | | 8.00% | | | | 5.94% | |
| | | | | | | | | | | | | | | | | | | | | | | | | |
Supplemental Data
|
Net assets applicable to Common Shareholders, end of period (000) | | $ | 248,699 | | | $ | 255,711 | | | $ | 249,069 | | | $ | 231,925 | | | $ | 227,780 | | | $ | 185,049 | |
Preferred Shares outstanding at $25,000 liquidation preference,
end of period (000) | | $ | 85,850 | | | $ | 133,850 | | | $ | 133,850 | | | $ | 133,850 | | | $ | 133,850 | | | $ | 133,850 | |
Portfolio turnover | | | 2% | | | | 23% | | | | 13% | | | | 6% | | | | 11% | | | | 4% | |
Asset coverage per Preferred Share at $25,000 liquidation preference, end of period | | $ | 97,422 | | | $ | 72,761 | | | $ | 71,521 | | | $ | 68,319 | | | $ | 67,546 | | | $ | 59,571 | |
| 1 | | Based on average Common Shares outstanding. |
| 2 | | Dividends are determined in accordance with federal income tax regulations. |
| 3 | | Total investment returns based on market price, which can be significantly greater or lesser than the net asset value, may result in substantially different returns. Where applicable, total investment returns exclude the effects of any sales charges and include the reinvestment of dividends and distributions. |
| 4 | | Aggregate total investment return. |
| 5 | | Do not reflect the effect of dividends to Preferred Shareholders. |
| 7 | | Interest expense and fees relate to TOBs. See Note 3 of the Notes to Financial Statements for details of municipal bonds transferred to TOBs. |
| 8 | | For the six months ended June 30, 2013, the total expense ratio after fees waived and excluding interest expense, fees and remarketing fees was 0.67%. |
See Notes to Financial Statements.
| SEMI-ANNUAL REPORT | JUNE 30, 2013 | 27
|
| |
| Financial Highlights | BlackRock New York Municipal 2018 Term Trust (BLH)
|
| | | | Six Months
Ended
June 30,
2013
(Unaudited) | |
Year Ended December 31,
|
| | | | | 2012 | | 2011 | | 2010 | | 2009 | | 2008 |
Per Share Operating Performance
|
Net asset value, beginning of period | | | | $ | 15.67 | | | $ | 15.64 | | | $ | 15.18 | | | $ | 15.57 | | | $ | 13.78 | | | $ | 15.98 | |
Net investment income1 | | | | | 0.24 | | | | 0.65 | | | | 1.00 | | | | 1.03 | | | | 1.10 | | | | 1.08 | |
Net realized and unrealized gain (loss) | | | | | (0.51 | ) | | | 0.23 | | | | 0.46 | | | | (0.33 | ) | | | 1.67 | | | | (2.16 | ) |
Dividends to Preferred Shareholders from net investment income | | | | | (0.01 | ) | | | (0.02 | ) | | | (0.02 | ) | | | (0.03 | ) | | | (0.05 | ) | | | (0.29 | ) |
Net increase (decrease) from investment operations | | | | | (0.28 | ) | | | 0.86 | | | | 1.44 | | | | 0.67 | | | | 2.72 | | | | (1.37 | ) |
Dividends to Common Shareholders from net investment income | | | | | (0.30 | ) | | | (0.83 | )2 | | | (0.98 | )2 | | | (1.06 | )2 | | | (0.93 | )2 | | | (0.83 | )2 |
Net asset value, end of period | | | | $ | 15.09 | | | $ | 15.67 | | | $ | 15.64 | | | $ | 15.18 | | | $ | 15.57 | | | $ | 13.78 | |
Market price, end of period | | | | $ | 15.00 | | | $ | 16.05 | | | $ | 16.71 | | | $ | 15.92 | | | $ | 16.90 | | | $ | 13.97 | |
| | | | | | | | | | | | | | | | | | | | | | | | | | | |
Total Investment Return3
|
Based on net asset value | | | | | (1.84)% | 4 | | | 5.34% | | | | 9.41% | | | | 3.90% | | | | 19.76% | | | | (9.12)% | |
Based on market price | | | | | (4.74)% | 4 | | | 0.99% | | | | 11.46% | | | | 0.39% | | | | 28.22% | | | | (9.00)% | |
| | | | | | | | | | | | | | | | | | | | | | | |
Ratios to Average Net Assets Applicable to Common Shareholders
|
Total expenses5 | | | | | 0.92% | 6 | | | 0.96% | | | | 0.99% | | | | 1.02% | | | | 1.00% | | | | 1.05% | |
Total expenses after fees waived 5 | | | | | 0.92% | 6,7 | | | 0.95% | | | | 0.98% | | | | 1.01% | | | | 0.99% | | | | 1.02% | |
Net investment income5 | | | | | 3.11% | 6 | | | 4.11% | | | | 6.52% | | | | 6.60% | | | | 7.30% | | | | 7.06% | |
Dividends to Preferred Shareholders | | | | | 0.10% | 6 | | | 0.14% | | | | 0.16% | | | | 0.22% | | | | 0.34% | | | | 1.88% | |
Net investment income to Common Shareholders | | | | | 3.01% | 6 | | | 3.97% | | | | 6.36% | | | | 6.38% | | | | 6.96% | | | | 5.18% | |
| | | | | | | | | | | | | | | | | | | | | | | | | | | |
Supplemental Data
|
Net assets applicable to Common Shareholders, end of period (000) | | | | $ | 54,830 | | | $ | 56,921 | | | $ | 56,808 | | | $ | 55,159 | | | $ | 56,580 | | | $ | 50,058 | |
Preferred Shares outstanding at $25,000 liquidation preference,
end of period (000) | | | | $ | 25,825 | | | $ | 31,400 | | | $ | 31,400 | | | $ | 31,400 | | | $ | 31,400 | | | $ | 31,400 | |
Portfolio turnover | | | | | 5% | | | | 48% | | | | 16% | | | | 6% | | | | 14% | | | | 6% | |
Asset coverage per Preferred Share at $25,000 liquidation preference, end of period | | | | $ | 78,079 | | | $ | 70,319 | | | $ | 70,230 | | | $ | 68,918 | | | $ | 70,050 | | | $ | 64,857 | |
| 1 | | Based on average Common Shares outstanding. |
| 2 | | Dividends are determined in accordance with federal income tax regulations. |
| 3 | | Total investment returns based on market price, which can be significantly greater or lesser than the net asset value, may result in substantially different returns. Where applicable, total investment returns exclude the effects of any sales charges and include the reinvestment of dividends and distributions. |
| 4 | | Aggregate total investment return. |
| 5 | | Do not reflect the effect of dividends to Preferred Shareholders. |
| 7 | | For the six months ended June 30, 2013, the total expense ratio after fees waived and excluding remarketing fees was 0.84%. |
See Notes to Financial Statements.
| 28 | SEMI-ANNUAL REPORT | JUNE 30, 2013
|
| |
| Notes to Financial Statements (Unaudited) |
|
1. Organization:
BlackRock California Municipal 2018 Term Trust (“BJZ”), BlackRock Municipal 2018 Term Trust (“BPK”) and BlackRock New York Municipal 2018 Term Trust (“BLH”) (collectively, the “Trusts” or individually as a “Trust”) are organized as Delaware statutory trusts. BPK is registered under the 1940 Act as a diversified, closed-end management investment company. BJZ and BLH are registered as non-diversified, closed-end management investment companies under the 1940 Act. The Board of Trustees of the Trusts are referred to throughout this report as the “Board”, and the trustees thereof are collectively referred to throughout this report as “Trustees”. The Trusts determine, and make available for publication the NAVs of their Common Shares on a daily basis.
2. Significant Accounting Policies:
The Trusts’ financial statements are prepared in conformity with accounting principles generally accepted in the United States of America (“US GAAP”), which may require management to make estimates and assumptions that affect the reported amounts of assets and liabilities in financial statements and the reported amounts of increases and decreases in net assets from operations during the reporting period. Actual results could differ from those estimates. The following is a summary of significant accounting policies followed by the Trusts:
Valuation: US GAAP defines fair value as the price the Trusts would receive to sell an asset or pay to transfer a liability in an orderly transaction between market participants at the measurement date. The Trusts determine the fair values of their financial instruments at market value using independent dealers or pricing services under policies approved by the Board. The BlackRock Global Valuation Methodologies Committee (the “Global Valuation Committee”) is the committee formed by management to develop global pricing policies and procedures and to provide oversight of the pricing function for the Trusts for all financial instruments.
Municipal investments (including commitments to purchase such investments on a “when-issued” basis) are valued on the basis of prices provided by dealers or pricing services. In determining the value of a particular investment, pricing services may use certain information with respect to transactions in such investments, quotations from dealers, pricing matrixes, market transactions in comparable investments and information with respect to various relationships between investments. Short-term securities with remaining maturities of 60 days or less may be valued at amortized cost, which approximates fair value. Investments in open-end registered investment companies are valued at net asset value each business day.
In the event that application of these methods of valuation results in a price for an investment that is deemed not to be representative of the market value of such investment, or if a price is not available, the investment will be valued by the Global Valuation Committee or its delegate, in accordance with a policy approved by the Board as reflecting fair value (“Fair Value Assets”). When determining the price for Fair Value Assets, the Global Valuation Committee, or its delegate, seeks to determine the price that each Trust might reasonably expect to receive from the current sale of that asset in an arm’s-length transaction. Fair value determinations shall be based upon all available factors that the Global Valuation Committee, or its delegate deem relevant consistent with the principals of fair value measurement which include the market approach, income approach and/or in the case of recent investments, the cost approach, as appropriate. The market approach generally consists of using comparable market transactions. The income approach generally is used to discount future cash flows to present value and adjusted for liquidity as appropriate. These factors include but are not limited to: (i) attributes specific to the investment or asset; (ii) the principal market for the investment or asset; (iii) the customary participants in the principal market for the investment or asset; (iv) data assumptions by market participants for the investment or asset, if reasonably available; (v) quoted prices for similar investments or assets in active markets; and (vi) other factors, such as future cash flows, interest rates, yield curves, volatilities, prepayment speeds, loss severities, credit risks, recovery rates, liquidation amounts and/or default rates. Due to the inherent uncertainty of valuations of such investments, the fair values may differ from the values that would have been used had an active market existed. The Global Valuation Committee, or its delegate, employs various methods for calibrating valuation approaches for investments where an active market does not exist, including regular due diligence of each Funds’ pricing vendors, a regular review of key inputs and assumptions, transactional back-testing or disposition analysis to compare unrealized gains and losses to realized gains and losses, reviews of missing or stale prices and large movements in market values and reviews of any market related activity. The pricing of all Fair Value Assets is subsequently reported to the Board or a committee thereof on a quarterly basis.
Segregation and Collateralization: In cases in which the 1940 Act and the interpretive positions of the Securities and Exchange Commission (the “SEC”) require that a Trust either deliver collateral or segregate assets in connection with certain investments (e.g., TOBs), a Trust will, consistent with SEC rules and/or certain interpretive letters issued by the SEC, segregate collateral or designate on its books and records cash or liquid securities having a market value at least equal to the amount that would otherwise be required to be physically segregated. Furthermore, based on requirements and agreements with certain exchanges and third party broker-dealers, a Trust engaging in such transactions may have requirements to deliver/deposit securities to/with an exchange or broker-dealer as collateral for certain investments.
| SEMI-ANNUAL REPORT | JUNE 30, 2013 | 29
|
| |
| Notes to Financial Statements (continued) |
|
Investment Transactions and Investment Income: For financial reporting purposes, investment transactions are recorded on the dates the transactions are entered into (the trade dates). Realized gains and losses on investment transactions are determined on the identified cost basis. Dividend income is recorded on the ex-dividend dates. Interest income, including amortization and accretion of premiums and discounts on debt securities, is recognized on the accrual basis.
Dividends and Distributions: Dividends from net investment income are declared and paid monthly. Distributions of capital gains are recorded on the ex-dividend dates. The character and timing of dividends and distributions are determined in accordance with federal income tax regulations, which may differ from US GAAP. Dividends and distributions to Preferred Shareholders are accrued and determined as described in Note 6.
Income Taxes: It is the Trusts’ policy to comply with the requirements of the Internal Revenue Code of 1986, as amended, applicable to regulated investment companies and to distribute substantially all of their taxable income to their shareholders. Therefore, no federal income tax provision is required.
Each Trust files US federal and various state and local tax returns. No income tax returns are currently under examination. The statute of limitations on the Trusts’ US federal tax returns remains open for each of the four years ended December 31, 2012. The statutes of limitations on the each Trust’s state and local tax returns may remain open for an additional year depending upon the jurisdiction. Management does not believe there are any uncertain tax positions that require recognition of a tax liability.
Deferred Compensation Plan: Under the Deferred Compensation Plan (the “Plan”) approved by each Trust’s Board, the independent Trustees (“Independent Trustees”) may defer a portion of their annual complex-wide compensation. Deferred amounts earn an approximate return as though equivalent dollar amounts had been invested in common shares of certain other BlackRock Closed-End Funds selected by the Independent Trustees. This has the same economic effect for the Independent Trustees as if the Independent Trustees had invested the deferred amounts directly in certain other BlackRock Closed-End Funds.
The Plan is not funded and obligations thereunder represent general unsecured claims against the general assets of each Fund. Deferred compensation liabilities are included in officer’s and trustees’ fees payable in the Statements of Assets and Liabilities and will remain as a liability of the Funds until such amounts are distributed in accordance with the Plan.
Other: Expenses directly related to a Trust are charged to that Trust. Other operating expenses shared by several funds are pro rated among those funds on the basis of relative net assets or other appropriate methods.
The Trusts have an arrangement with the custodian whereby fees may be reduced by credits earned on uninvested cash balances, which, if applicable, are shown as fees paid indirectly in the Statements of Operations. The custodian imposes fees on overdrawn cash balances, which can be offset by accumulated credits earned or may result in additional custody charges.
3. Securities and Other Investments:
Zero-Coupon Bonds: The Trusts may invest in zero-coupon bonds, which are normally issued at a significant discount from face value and do not provide for periodic interest payments. Zero-coupon bonds may experience greater volatility in market value than similar maturity debt obligations which provide for regular interest payments.
Forward Commitments and When-Issued Delayed Delivery Securities: The Trusts may purchase securities on a when-issued basis and may purchase or sell securities on a forward commitment basis. Settlement of such transactions normally occurs within a month or more after the purchase or sale commitment is made. The Trusts may purchase securities under such conditions with the intention of actually acquiring them, but may enter into a separate agreement to sell the securities before the settlement date. Since the value of securities purchased may fluctuate prior to settlement, the Trusts may be required to pay more at settlement than the security is worth. In addition, the Trusts are not entitled to any of the interest earned prior to settlement. When purchasing a security on a delayed delivery basis, the Trusts assume the rights and risks of ownership of the security, including the risk of price and yield fluctuations. In the event of default by the counterparty, the Trusts’ maximum amount of loss is the unrealized appreciation of unsettled when-issued transactions, which is shown in the Schedules of Investments.
Municipal Bonds Transferred to TOBs: BPK leverages its assets through the use of TOBs. A TOB is a special purpose entity established by a third party sponsor, into which BPK, or an agent on behalf of BPK, transfers municipal bonds into a trust (“TOB Trust”). Other funds managed by the investment advisor may also contribute municipal bonds to a TOB into which BPK has contributed bonds. A TOB typically issues two classes of beneficial interests: short-term floating rate certificates (“TOB Trust Certificates”), which are sold to third party investors, and residual certificates (“TOB Residuals”), which are generally issued to the participating funds that contributed the municipal bonds to the TOB Trust. If multiple funds participate in the same TOB, the rights and obligations under the TOB Residual will be shared among the funds ratably in proportion to their participation.
The TOB Residuals held by BPK include the right of BPK (1) to cause the holders of a proportional share of the TOB Trust Certificates to tender their certificates at par plus accrued interest upon the occurrence of certain mandatory tender events defined in the TOB agreements, and
| 30 | SEMI-ANNUAL REPORT | JUNE 30, 2013
|
| |
| Notes to Financial Statements (continued) |
|
(2) to transfer, subject to a specified number of days’ prior notice, a corresponding share of the municipal bonds from the TOB to BPK. The TOB may also be collapsed without the consent of BPK, as the TOB Residual holder, upon the occurrence of certain termination events as defined in the TOB agreements. Such termination events may include the bankruptcy or default of the municipal bond, a substantial downgrade in credit quality of the municipal bond, the inability of the TOB to obtain renewal of the liquidity support agreement, a substantial decline in market value of the municipal bond and a judgment or ruling that interest on the municipal bond is subject to federal income taxation. Upon the occurrence of a Termination Event, the TOB would generally be liquidated in full with the proceeds typically applied first to any accrued fees owed to the trustee, remarketing agent and liquidity provider, and then to the holders of the TOB Trust Certificates up to par plus accrued interest owed on the TOB Trust Certificates, with the balance paid out to the TOB Residual holder. During the six months ended June 30, 2013, no TOBs in which BPK participated were terminated without the consent of BPK.
The cash received by the TOB from the sale of the TOB Trust Certificates, less transaction expenses, is paid to BPK. BPK typically invests the cash received in additional municipal bonds. BPK’s transfer of the municipal bonds to a TOB Trust is accounted for as a secured borrowing; therefore, the municipal bonds deposited into a TOB are presented in BPK’s Schedule of Investments and TOB Trust Certificates issued are shown in other liabilities in the Statement of Assets and Liabilities. The carrying amount of BPK’s payable to the holder of the TOB Trust Certificates, as reported in Statement of Assets and Liabilities as TOB Trust Certificates approximates its fair value.
BPK may invest in TOBs on either a non-recourse or recourse basis. TOB Trusts are typically supported by a liquidity facility provided by a bank or other financial institution (the “Liquidity Provider”) that allows the holders of the TOB Trust Certificates to tender their certificates in exchange for payment from the Liquidity Provider of par plus accrued interest on any business day prior to the occurrence of the termination events described above. When BPK invests in TOBS on a non-recourse basis, and the Liquidity Provider is required to make a payment under the liquidity facility due to a termination event, the Liquidity Provider will typically liquidate all or a portion of the municipal securities held in the TOB Trust and then fund, on a net basis, the balance, if any, of the amount owed under the liquidity facility over the liquidation proceeds (the “Liquidation Shortfall”). If BPK invests in a TOB on a recourse basis, BPK will typically enter into a reimbursement agreement with the Liquidity Provider where BPK is required to repay the Liquidity Provider the amount of any Liquidation Shortfall. As a result, BPK investing in a recourse TOB will bear the risk of loss with respect to any Liquidation Shortfall. If multiple funds participate in any such TOB, these losses will be shared ratably in proportion to their participation. The recourse TOB Trusts, if any, are identified in the Schedule of Investments.
Interest income, including amortization and accretion of premiums and discounts, from the underlying municipal bonds is recorded by BPK on an accrual basis. Interest expense incurred on the secured borrowing and other expenses related to remarketing, administration and trustee services to a TOB are shown as interest expense fees and amortization of offering costs in the Statement of Operations. The TOB Trust Certificates have interest rates that generally reset weekly and their holders have the option to tender such certificates to the TOB for redemption at par at each reset date. At June 30, 2013, the aggregate value of the underlying municipal bonds transferred to TOBs, the related liability for TOB Trust Certificates and the range of interest rates on the liability for TOB Trust Certificates were as follows:
|
|
|
| Underlying
Municipal
Bonds
Transferred
to TOBs
|
| Liability for
Trust
Certificates
|
| Interest
Rate
|
BPK | | | | $ | 5,622,950 | | | $ | 3,750,000 | | | | 0.17 | % |
For the six months ended June 30, 2013, BPK’s average TOB Trust Certificates outstanding and the daily weighted average interest rate, including fees, were as follows:
|
|
|
| Average Trust
Certificates
Outstanding
|
| Daily Weighted
Average
Interest Rate
|
BPK | | | | $ | 3,750,000 | | | | 1.14% | |
Should short-term interest rates rise, BPK’s investments in TOBs may adversely affect BPK’s net investment income and dividends to Common Shareholders. Also, fluctuations in the market value of municipal bonds deposited into the TOB Trust may adversely affect BPK’s NAV per share.
4. Investment Advisory Agreement and Other Transactions with Affiliates:
The PNC Financial Services Group, Inc. (“PNC”) is the largest stockholder and an affiliate, for 1940 Act purposes of BlackRock, Inc. (“BlackRock”).
Each Trust entered into an Investment Advisory Agreement with BlackRock Advisors, LLC (the “Manager”), the Trusts’ investment advisor, an indirect, wholly owned subsidiary of BlackRock, to provide investment advisory and administration services. The Manager is responsible for the management of each Trust’s portfolio and provides the necessary personnel, facilities, equipment and certain other services necessary to the operations of each Trust. For such services, each Trust pays the Manager a monthly fee at an annual rate of 0.40% of each Trust’s average weekly managed assets. Average weekly managed assets are the average weekly value of each Trust’s total assets minus the sum of its accrued liabilities.
| SEMI-ANNUAL REPORT | JUNE 30, 2013 | 31
|
| |
| Notes to Financial Statements (continued) |
|
The Manager voluntarily agreed to waive its investment advisory fees by the amount of investment advisory fees each Trust pays to the Manager indirectly through its investment in affiliated money market funds. However, the Manager does not waive its investment advisory fees by the amount of investment advisory fees paid in connection with each Trust’s investment in other affiliated investment companies, if any. This amount is shown as fees waived by Manager in the Statements of Operations.
The Manager and each Trust entered into a sub-advisory agreement with BlackRock Financial Management (“BFM”), an affiliate of the Manager. The Manager pays BFM for services it provides, a monthly fee equal to all reimbursements of expenses approved by the Board of such Trust under the sub-advisory agreement.
Certain officers and/or Trustees of the Trust are officers and/or directors of BlackRock or its affiliates. The Trusts reimburse the Manager for compensation paid to the Trusts’ Chief Compliance Officer.
5. Purchases and Sales:
Purchases and sales of investments, excluding short-term securities for the six months ended June 30, 2013, were as follows:
|
|
|
| Purchases
|
| Sales
|
BJZ | | | | | — | | | $ | 8,909,076 | |
BPK | | | | $ | 6,007,401 | | | $ | 29,725,203 | |
BLH | | | | $ | 4,286,401 | | | $ | 6,345,052 | |
6. Income Tax Information:
As of December 31, 2012, the Trusts had capital loss carryforwards available to offset future realized capital gains through the indicated expiration dates as follows:
Expires December 31,
|
|
|
| BJZ
|
| BPK
|
| BLH
|
2013 | | | | $ | 332,071 | | | | — | | | | — | |
2014 | | | | | — | | | $ | 6,871,194 | | | | — | |
2015 | | | | | 470,704 | | | | 889,102 | | | $ | 304,150 | |
2017 | | | | | 660,560 | | | | 202,544 | | | | — | |
2018 | | | | | — | | | | — | | | | 291,488 | |
Total
| | | | $ | 1,463,335 | | | $ | 7,962,840 | | | $ | 595,638 | |
As of June 30, 2013, gross unrealized appreciation and gross unrealized depreciation based on cost for federal income tax purposes were as follows:
|
|
|
| BJZ
|
| BPK
|
| BLH
|
| | | | | | | | | | | | | | |
Tax cost | | | | $ | 135,638,952 | | | $ | 318,450,225 | | | $ | 78,497,149 | |
Gross unrealized appreciation | | | | $ | 4,397,557 | | | $ | 17,248,017 | | | $ | 1,794,107 | |
Gross unrealized depreciation | | | | | (436,828 | ) | | | (3,547,933 | ) | | | (717,744 | ) |
Net unrealized appreciation | | | | $ | 3,960,729 | | | $ | 13,700,084 | | | $ | 1,076,363 | |
7. Concentration, Market and Credit Risk:
BJZ and BLH invest a substantial amount of their assets in issuers located in a single state or limited number of states. Please see the Schedules of Investments for concentrations in specific states or US territories.
Many municipalities insure repayment of their bonds, which may reduce the potential for loss due to credit risk. The market value of these bonds may fluctuate for other reasons, including market perception of the value of such insurance, and there is no guarantee that the insurer will meet its obligation.
In the normal course of business, the Trusts invest in securities and enter into transactions where risks exist due to fluctuations in the market (market risk) or failure of the issuer of a security to meet all its obligations (issuer credit risk). The value of securities held by the Trusts may decline in response to certain events, including those directly involving the issuers whose securities are owned by the Trusts; conditions affecting the general economy; overall market changes; local, regional or global political, social or economic instability; and currency and interest rate and price fluctuations. Similar to issuer credit risk, the Trusts may be exposed to counterparty credit risk, or the risk that an entity with which the Trusts have unsettled or open transactions may fail to or be unable to perform on its commitments. The Trusts manage counterparty credit risk by entering into transactions only with counterparties that they believe have the financial resources to honor their obligations and by monitoring the financial stability of those counterparties. Financial assets, which potentially expose the Trusts to market, issuer and counterparty credit risks, consist principally of financial instruments and receivables due from counterparties. The extent of the Trusts’ exposure to market, issuer and counterparty credit risks with respect to these financial assets is generally approximated by their value recorded in the Statements of Assets and Liabilities, less any collateral held by the Trusts.
As of June 30, 2013, each Trust invested a significant portion of their assets in securities in the county/city/special district/school district sector. Changes in economic conditions affecting the county/city/special district/school district sector would have a greater impact on the Trusts and could affect the value, income and/or liquidity of positions in such securities.
8. Capital Share Transactions:
The Trusts are authorized to issue an unlimited number of shares, including Preferred Shares, par value $0.001 per share, all of which were initially classified as Common Shares. The Board is authorized, however, to reclassify any unissued Common Shares to Preferred Shares without approval of Common Shareholders.
| 32 | SEMI-ANNUAL REPORT | JUNE 30, 2013
|
| |
| Notes to Financial Statements (continued) |
|
Common Shares
Shares issued and outstanding remained constant for all Trusts for the six months ended June 30, 2013 and the year ended December 31, 2012.
Preferred Shares
Each Trust’s Preferred Shares rank prior to the Trust’s Common Shares as to the payment of dividends by the Trust and distribution of assets upon dissolution or liquidation of the Trust. The 1940 Act prohibits the declaration of any dividend on the Trust’s Common Shares or the repurchase of the Trust’s Common Shares if the Trust fails to maintain the asset coverage of at least 200% of the liquidation preference of the outstanding Preferred Shares. In addition, pursuant to the Preferred Shares’ governing instrument, the Trusts are restricted from declaring and paying dividends on classes of shares ranking junior to or on parity with the Preferred Shares or repurchasing such shares if the Trusts fail to declare and pay dividends on the Preferred Shares, redeem any Preferred Shares required to be redeemed under the Preferred Shares governing instrument or comply with the basic maintenance amount requirement of the rating agencies then rating the Preferred Shares.
The holders of Preferred Shares have voting rights equal to the holders of Common Shares (one vote per share) and will vote together with holders of Common Shares (one vote per share) as a single class. However, the holders of Preferred Shares, voting as a separate class, are also entitled to elect two Trustees for each Trust. In addition, the 1940 Act requires that along with approval by shareholders that might otherwise be required, the approval of the holders of a majority of any outstanding Preferred Shares, voting separately as a class would be required to (a) adopt any plan of reorganization that would adversely affect the Preferred Shares, (b) change a Trust’s sub-classification as a closed-end investment company or change its fundamental investment restrictions or (c) change its business so as to cease to be an investment company.
The Preferred Shares are redeemable at the option of each Trust, (BJZ, BPK, BLH), in whole or in part, on any dividend payment date at their liquidation preference per share plus any accumulated and unpaid dividends whether or not declared. The Preferred Shares are also subject to mandatory redemption at their liquidation preference plus any accumulated and unpaid dividends, whether or not declared, if certain requirements relating to the composition of the assets and liabilities of a Trust, as set forth in each Trust’s Statement of Preferences (the “Governing Instrument”) are not satisfied. For financial reporting purposes, the liquidation preference of Preferred Shares approximates the Trust’s fair valuation of the Preferred Shares.
From time to time in the future, each Trust may effect repurchases of its Preferred Shares at prices below their liquidation preference as agreed upon by the Trust and seller. Each Trust also may redeem its Preferred Shares from time to time as provided in the applicable Governing Instrument. Each Trust intends to effect such redemptions and/or repurchases to the extent necessary to maintain applicable asset coverage requirements or for such other reasons as the Board may determine.
The Trusts had the following series of Preferred Shares outstanding, effective yields and reset frequency as of June 30, 2013:
|
|
|
| Series
|
| Preferred
Shares
|
| Effective
Yield
|
| Reset
Frequency
Days
|
BJZ | | | | | M7 | | | | 1,732 | | | | 0.13 | % | | | 7 | |
BPK | | | | | W7 | | | | 1,717 | | | | 0.13 | % | | | 7 | |
| | | | | R7 | | | | 1,717 | | | | 0.12 | % | | | 7 | |
BLH | | | | | T7 | | | | 1,033 | | | | 0.13 | % | | | 7 | |
Dividends on seven-day Preferred Shares are cumulative at a rate which is reset every seven days based on the results of an auction. If the Preferred Shares fail to clear the auction on an auction date, each Trust is required to pay the maximum applicable rate on the Preferred Shares to holders of such shares for successive dividend periods until such time as the shares are successfully auctioned. The maximum applicable rate on all series of Preferred Shares prior to November 1, 2012 was the higher of 110% of the AA commercial paper rate or 100% of 90% of the Kenny S&P 30-day High Grade Index rate divided by 1.00 minus the marginal tax rate. The Kenny S&P 30-day High Grade Index was discontinued as of November 1, 2012. For purposes of calculating the maximum applicable rate, the Kenny S&P 30-day High Grade Index was replaced with the S&P Municipal Bond 7 Day High Grade Rate Index as of November 1, 2012. The low, high and average dividend rates on the Preferred Shares for each Trust for the six months ended June 30, 2013
|
|
|
| Series
|
| Low
|
| High
|
| Average
|
BJZ | | | | | M7 | | | | 0.13 | % | | | 0.38 | % | | | 0.20 | % |
BPK | | | | | W7 | | | | 0.13 | % | | | 0.38 | % | | | 0.21 | % |
| | | | | R7 | | | | 0.12 | % | | | 0.38 | % | | | 0.21 | % |
BLH | | | | | T7 | | | | 0.13 | % | | | 0.38 | % | | | 0.21 | % |
Since February 13, 2008, the Preferred Shares of the Trusts failed to clear any of their auctions. As a result, the Preferred Shares dividend rates were reset to the maximum applicable rate, which ranged from 0.12% to 0.38% for the six months ended June 30, 2013. A failed auction is not an event of default for the Trusts but it has a negative impact on the liquidity of Preferred Shares. A failed auction occurs when there are more sellers of a Trust’s Preferred Shares than buyers. A successful auction for the Trusts’ Preferred Shares may not occur for some time, if ever, and even if liquidity does resume, holders of Preferred Shares may not have the ability to sell the Preferred Shares at their liquidation preference.
| SEMI-ANNUAL REPORT | JUNE 30, 2013 | 33
|
| |
| Notes to Financial Statements (concluded) |
|
The Trusts pay commissions of 0.15% on the aggregate principal amount of all shares that fail to clear their auctions and 0.25% on the aggregate principal amount of all shares that successfully clear their auctions. Certain broker dealers have individually agreed to reduce commissions for failed auctions. The commissions paid to these broker dealers are included in remarketing fees on Preferred Shares in the Statements of Operations.
During the six months ended June 30, 2013, the Trusts announced the following redemptions of Preferred Shares at a price of $25,000 per share plus any accrued and unpaid dividends through the redemption date:
|
|
|
| Series
|
| Redemption
Date
|
| Shares
Redeemed
|
| Aggregate
Principal
|
BJZ | | | | | M7 | | | | 1/22/13 | | | | 261 | | | $ | 6,525,000 | |
| | | | | M7 | | | | 4/09/13 | | | | 228 | | | $ | 5,700,000 | |
BPK | | | | | R7 | | | | 1/25/13 | | | | 714 | | | $ | 17,850,000 | |
| | | | | R7 | | | | 2/01/13 | | | | 40 | | | $ | 1,000,000 | |
| | | | | R7 | | | | 5/24/13 | | | | 206 | | | $ | 5,150,000 | |
| | | | | W7 | | | | 1/24/13 | | | | 714 | | | $ | 17,850,000 | |
| | | | | W7 | | | | 1/31/13 | | | | 40 | | | $ | 1,000,000 | |
| | | | | W7 | | | | 5/23/13 | | | | 206 | | | $ | 5,150,000 | |
BLH | | | | | T7 | | | | 1/23/13 | | | | 223 | | | $ | 5,575,000 | |
9. Subsequent Events:
Management’s evaluation of the impact of all subsequent events on the Trusts’ financial statements was completed through the date the financial statements were issued and the following items were noted:
The Trusts paid a net investment income dividend in the following amounts per share on August 1, 2013 to Common Shareholders of record on July 15, 2013:
| Common
Dividend
Per Share
|
BJZ | $ | 0.0513 |
BPK | $ | 0.0610 |
BLH | $ | 0.0453 |
Additionally, the Trusts declared a net investment income dividend on August 1, 2013, payable to Common Shareholders of record on August 15, 2013 for the same amounts noted above.
The dividends declared on Preferred Shares for the period July 1, 2013 to July 31, 2013 were as follows:
|
|
|
| Series
|
| Dividends
Declared
|
BJZ | | | | | M7 | | | $ | 3,306 | |
BPK | | | | | R7 | | | $ | 3,357 | |
| | | | | W7 | | | $ | 4,206 | |
BLH | | | | | T7 | | | $ | 2,055 | |
On June 7, 2013, July 11, 2013 and August 19, 2013, the Trusts announced the following redemptions of Preferred Shares at a price of $25,000 per share plus any accrued and unpaid dividends through the redemption date:
|
|
|
| Series
|
| Redemption
Date
|
| Shares
Redeemed
|
| Aggregate
Principal
|
BJZ | | | | | M7 | | | | 7/02/13 | | | | 88 | | | $ | 2,200,000 | |
| | | | | M7 | | | | 8/06/13 | | | | 56 | | | $ | 1,400,000 | |
| | | | | M7 | | | | 9/10/13 | | | | 80 | | | $ | 2,000,000 | |
BPK | | | | | R7 | | | | 8/02/13 | | | | 112 | | | $ | 2,800,000 | |
| | | | | R7 | | | | 9/13/13 | | | | 92 | | | $ | 2,300,000 | |
| | | | | W7 | | | | 8/01/13 | | | | 112 | | | $ | 2,800,000 | |
| | | | | W7 | | | | 9/12/13 | | | | 92 | | | $ | 2,300,000 | |
BLH | | | | | T7 | | | | 7/31/13 | | | | 136 | | | $ | 3,400,000 | |
| | | | | T7 | | | | 9/11/13 | | | | 104 | | | $ | 2,600,000 | |
| 34 | SEMI-ANNUAL REPORT | JUNE 30, 2013
|
| |
Disclosure of Investment Advisory Agreements and Sub-Advisory Agreements
|
The Board of Trustees (each a “Board,” collectively, the “Boards,” and the members of which are referred to as “Board Members”) of BlackRock California Municipal 2018 Term Trust (“BJZ”), BlackRock Municipal 2018 Term Trust (“BPK”) and BlackRock New York Municipal 2018 Term Trust (“BLH” and together with BJZ and BPK, each a “Trust,” and, collectively, the “Trusts”) met in person on April 18, 2013 (the “April Meeting”) and June 4-5, 2013 (the “June Meeting”) to consider the approval of each Trust’s investment advisory agreement (each, an “Advisory Agreement”) with BlackRock Advisors, LLC (the “Manager”), each Trust’s investment advisor. The Board of each Trust also considered the approval of the sub-advisory agreement (each, a “Sub-Advisory Agreement”) among the Manager, BlackRock Financial Management, Inc. (the “Sub-Advisor”), and such Trust. The Manager and the Sub-Advisor are referred to herein as “BlackRock.” The Advisory Agreements and the Sub-Advisory Agreements are referred to herein as the “Agreements.”
Activities and Composition of the Board
Each Board consists of eleven individuals, nine of whom are not “interested persons” of such Trust as defined in the Investment Company Act of 1940 (the “1940 Act”) (the “Independent Board Members”). The Board Members are responsible for the oversight of the operations of the Trusts and perform the various duties imposed on the directors of investment companies by the 1940 Act. The Independent Board Members have retained independent legal counsel to assist them in connection with their duties. The Chairman of each Board is an Independent Board Member. Each Board has established six standing committees: an Audit Committee, a Governance and Nominating Committee, a Compliance Committee, a Performance Oversight Committee, an Executive Committee, and a Leverage Committee, each of which is chaired by an Independent Board Member and composed of Independent Board Members (except for the Executive Committee and the Leverage Committee, each of which also has one interested Board Member).
The Agreements
Pursuant to the 1940 Act, the Boards are required to consider the continuation of the Agreements on an annual basis. The Boards have four quarterly meetings per year, each extending over two days, and a fifth one-day meeting to consider specific information surrounding the consideration of renewing the Agreements. In connection with this process, the Boards assessed, among other things, the nature, scope and quality of the services provided to the Trusts by BlackRock, its personnel and its affiliates, including investment management, administrative and shareholder services, oversight of fund accounting and custody, marketing services, risk oversight, compliance and assistance in meeting applicable legal and regulatory requirements.
The Boards, acting directly and through their respective committees, considered at each of their meetings, and from time to time as appropriate, factors that are relevant to its annual consideration of the renewal of the Agreements, including the services and support provided by BlackRock to the Trusts and their shareholders. Among the matters the Boards considered were: (a) investment performance for one-year, three-year, five-year and/or since inception periods, as applicable, against peer funds, and applicable benchmarks, if any, as well as senior management’s and portfolio managers’ analysis of the reasons for any over performance or underperformance against their peers and/or benchmark, as applicable; (b) fees, including advisory, administration, if applicable, and other amounts paid to BlackRock and its affiliates by the Trusts for services such as call center and fund accounting; (c) Trust operating expenses and how BlackRock allocates expenses to the Trusts; (d) the resources devoted to, risk oversight of, and compliance reports relating to, implementation of the Trusts’ investment objectives, policies and restrictions; (e) the Trusts’ compliance with their Code of Ethics and other compliance policies and procedures; (f) the nature, cost and character of non-investment management services provided by BlackRock and its affiliates; (g) BlackRock’s and other service providers’ internal controls and risk and compliance oversight mechanisms; (h) BlackRock’s implementation of the proxy voting policies approved by the Boards; (i) execution quality of portfolio transactions; (j) BlackRock’s implementation of the Trusts’ valuation and liquidity procedures; (k) an analysis of management fees for products with similar investment objectives across the open-end fund, closed-end fund and institutional account product channels, as applicable; (l) BlackRock’s compensation methodology for its investment professionals and the incentives it creates; and (m) periodic updates on BlackRock’s business.
The Boards have engaged in an ongoing strategic review with BlackRock of opportunities to consolidate funds and of BlackRock’s commitment to investment performance. In addition, the Boards requested and BlackRock provided an analysis of fair valuation and stale pricing policies. BlackRock also furnished information to the Boards in response to specific questions. These questions covered issues such as BlackRock’s profitability, investment performance and management fee levels. The Boards further considered the importance of: (i) organizational and structural variables to investment performance; (ii) rates of portfolio turnover; (iii) BlackRock’s performance accountability for portfolio managers; (iv) marketing support for the funds; (v) services provided to the Trusts by BlackRock affiliates; and (vi) BlackRock’s oversight of relationships with third party service providers.
The Board of each Trust considered BlackRock’s efforts during the past year with regard to refinancing outstanding AMPS, as well as ongoing time and resources devoted to other forms of preferred shares and alternative leverage. As of the date of this report, BJZ, BPK and BLH have redeemed 28.5%, 41.7% and 28.6% of its outstanding AMPS, respectively.
Board Considerations in Approving the Agreements
The Approval Process: Prior to the April Meeting, the Boards requested and received materials specifically relating to the Agreements. The Boards are engaged in a process with its independent legal counsel and BlackRock to review the nature and scope of the information provided to
| SEMI-ANNUAL REPORT | JUNE 30, 2013 | 35
|
| |
Disclosure of Investment Advisory Agreements and Sub-Advisory Agreements (continued)
|
better assist their deliberations. The materials provided in connection with the April Meeting included (a) information independently compiled and prepared by Lipper, Inc. (“Lipper”) on Trust fees and expenses as compared with a peer group of funds as determined by Lipper (“Expense Peers”) and the investment performance of the Trusts as compared with a peer group of funds as determined by Lipper;1 (b) information on the profits realized by BlackRock and its affiliates pursuant to the Agreements and a discussion of fall-out benefits to BlackRock and its affiliates; (c) a general analysis provided by BlackRock concerning investment management fees charged to other clients, such as institutional clients and open-end funds, under similar investment mandates, as applicable; (d) review of non-management fees; (e) the existence, impact and sharing of potential economies of scale; (f) a summary of aggregate amounts paid by each Trust to BlackRock and (g) if applicable, a comparison of management fees to similar BlackRock closed-end funds, as classified by Lipper.
At the April Meeting, the Boards reviewed materials relating to their consideration of the Agreements. As a result of the discussions that occurred during the April Meeting, and as a culmination of the Boards’ year-long deliberative process, the Boards presented BlackRock with questions and requests for additional information. BlackRock responded to these requests with additional written information in advance of the June Meeting.
At the June Meeting, each Board, including the Independent Board Members, unanimously approved the continuation of the Advisory Agreement between the Manager and its Trust, and the Sub-Advisory Agreement among the Manager, the Sub-Advisor, and its Trust, each for a one-year term ending June 30, 2014. In approving the continuation of the Agreements, the Boards considered: (a) the nature, extent and quality of the services provided by BlackRock; (b) the investment performance of the Trusts and BlackRock; (c) the advisory fee and the cost of the services and profits to be realized by BlackRock and its affiliates from their relationship with the Trusts; (d) the Fund’s costs to investors compared to the costs of Expense Peers and performance compared to the relevant performance comparison as previously discussed; (e) economies of scale; (f) fall-out benefits to BlackRock as a result of its relationship with the Trusts; and (g) other factors deemed relevant by the Board Members.
The Boards also considered other matters they deemed important to the approval process, such as payments made to BlackRock or its affiliates relating to securities lending, services related to the valuation and pricing of Trust portfolio holdings, direct and indirect benefits to BlackRock and its affiliates from their relationship with the Trusts and advice from independent legal counsel with respect to the review process and materials submitted for the Boards’ review. The Boards noted the willingness of BlackRock personnel to engage in open, candid discussions with the Boards. The Boards did not identify any particular information as determinative, and each Board Member may have attributed different weights to the various items considered.
A. Nature, Extent and Quality of the Services Provided by BlackRock: The Boards, including the Independent Board Members, reviewed the nature, extent and quality of services provided by BlackRock, including the investment advisory services and the resulting performance of the Trusts. Throughout the year, the Boards compared Trust performance to the performance of a comparable group of closed-end funds and/or the performance of a relevant benchmark, if any. The Boards met with BlackRock’s senior management personnel responsible for investment operations, including the senior investment officers. Each Board also reviewed the materials provided by its Trust’s portfolio management team discussing the Trust’s performance and the Trust’s investment objective, strategies and outlook.
The Boards considered, among other factors, with respect to BlackRock: the number, education and experience of investment personnel generally and their Trusts’ portfolio management teams; investments by portfolio managers in the funds they manage; portfolio trading capabilities; use of technology; commitment to compliance; credit analysis capabilities; risk analysis and oversight capabilities; and the approach to training and retaining portfolio managers and other research, advisory and management personnel. The Boards engaged in a review of BlackRock’s compensation structure with respect to their Trusts’ portfolio management teams and BlackRock’s ability to attract and retain high-quality talent and create performance incentives.
In addition to advisory services, the Boards considered the quality of the administrative and other non-investment advisory services provided to the Trusts. BlackRock and its affiliates provide the Trusts with certain services (in addition to any such services provided to the Trusts by third parties) and officers and other personnel as are necessary for the operations of the Trusts. In particular, BlackRock and its affiliates provide the Trusts with the following administrative services including, among others: (i) preparing disclosure documents, such as the prospectus, the summary prospectus (as applicable) and the statement of additional information in connection with the initial public offering and periodic shareholder reports; (ii) preparing communications with analysts to support secondary market trading of the Trusts; (iii) assisting with daily accounting and pricing; (iv) preparing periodic filings with regulators and stock exchanges; (v) overseeing and coordinating the activities of other service providers; (vi) organizing Board meetings and preparing the materials for such Board meetings; (vii) providing legal and compliance support; (viii) furnishing analytical and other support to assist the Board in its consideration of strategic issues such as the merger or consolidation of certain closed-end funds; and (ix) performing other administrative functions necessary for the operation of the Trusts, such as tax reporting, fulfilling regulatory filing requirements and call center services. The Boards reviewed the structure and duties of BlackRock’s fund administration, shareholder services, legal and compliance departments and considered BlackRock’s policies and procedures for assuring compliance with applicable laws and regulations.
| 1 | | Lipper ranks funds in quartiles, ranging from first to fourth, where first is the most desirable quartile position and fourth is the least desirable. |
| 36 | SEMI-ANNUAL REPORT | JUNE 30, 2013
|
| |
Disclosure of Investment Advisory Agreements and Sub-Advisory Agreements (continued)
|
B. The Investment Performance of the Trusts and BlackRock: Each Board, including the Independent Board Members, also reviewed and considered the performance history of its Trust. In preparation for the April Meeting, the Boards worked with its independent legal counsel, BlackRock and Lipper to develop a template for, and were provided with reports independently prepared by Lipper, which included a comprehensive analysis of each Trust’s performance. The Boards also reviewed a narrative and statistical analysis of the Lipper data that was prepared by BlackRock, which analyzed various factors that affect Lipper’s rankings. In connection with its review, each Board received and reviewed information regarding the investment performance, based on net asset value (NAV), of its Trust as compared to other funds in that Trust’s applicable Lipper category. The Boards were provided with a description of the methodology used by Lipper to select peer funds and periodically meets with Lipper representatives to review its methodology. Each Board and its Performance Oversight Committee regularly review, and meet with Trust management to discuss, the performance of its Trust throughout the year.
BJZ’s Board noted that BJZ ranked in the fourth quartile against its Lipper Performance Universe Composite for each of the one-, three- and five-year periods reported. BlackRock believes that the Lipper Performance Universe Composite is an appropriate performance metric for BJZ in that it measures a blend of total return and yield. The Board of BJZ and BlackRock reviewed and discussed the reasons for BJZ’s underperformance during these periods compared to its Lipper Performance Universe Composite. BJZ’s Board was informed that, among other things, BJZ has a targeted maturity, and as such, is managed to achieve the specific maturity goal.
BLH’s Board noted that BLH ranked in the fourth, third and second quartiles against its Lipper Performance Universe Composite for the one-, three- and five-year periods reported, respectively. BlackRock believes that the Lipper Performance Universe Composite is an appropriate performance metric for BLH in that it measures a blend of total return and yield. The Board of BLH and BlackRock reviewed and discussed the reasons for BLH’s underperformance during the one- and three-year periods compared to its Lipper Performance Universe Composite. BLH’s Board was informed that, among other things, BLH has a targeted maturity, and as such, is managed to achieve the specific maturity goal.
BPK’s Board noted that BPK ranked in the fourth, fourth and second quartiles against its Lipper Performance Universe Composite for the one-, three- and five-year periods reported, respectively. BlackRock believes that the Lipper Performance Universe Composite is an appropriate performance metric for BPK in that it measures a blend of total return and yield. The Board of BPK and BlackRock reviewed and discussed the reasons for BPK’s underperformance during the one- and three-year periods compared to its Lipper Performance Universe Composite. BPK’s Board was informed that, among other things, BPK has a targeted maturity, and as such is managed to achieve the specific maturity goal.
The Boards noted that BlackRock has recently made, and continues to make, changes to the organization of BlackRock’s overall portfolio management structure designed to result in strengthened leadership teams.
C. Consideration of the Advisory/Management Fees and the Cost of the Services and Profits to be Realized by BlackRock and its Affiliates from their Relationship with the Trusts: Each Board, including the Independent Board Members, reviewed its Trust’s contractual management fee rate compared with the other funds in its Lipper category. The contractual management fee rate represents a combination of the advisory fee and any administrative fees, before taking into account any reimbursements or fee waivers. The Board also compared the Trust’s total net operating expense ratio, as well as actual management fee rate, to those of other funds in its Lipper category. The total net operating expense ratio and actual management fee rate both give effect to any expense reimbursements or fee waivers that benefit the funds. The Boards considered the services provided and the fees charged by BlackRock to other types of clients with similar investment mandates, including institutional accounts.
The Boards received and reviewed statements relating to BlackRock’s financial condition. The Boards were also provided with a profitability analysis that detailed the revenues earned and the expenses incurred by BlackRock for services provided to the Trusts. The Boards reviewed BlackRock’s profitability with respect to the Trusts and other funds the Boards currently oversees for the year ended December 31, 2012 compared to available aggregate profitability data provided for the prior two years. The Boards reviewed BlackRock’s profitability with respect to certain other fund complexes managed by the Manager and/or its affiliates. The Boards reviewed BlackRock’s assumptions and methodology of allocating expenses in the profitability analysis, noting the inherent limitations in allocating costs among various advisory products. The Boards recognized that profitability may be affected by numerous factors including, among other things, fee waivers and expense reimbursements by the Manager, the types of funds managed, precision of expense allocations and business mix. As a result, comparing profitability is difficult.
The Boards noted that, in general, individual fund or product line profitability of other advisors is not publicly available. The Boards reviewed BlackRock’s overall operating margin, in general, compared to that of certain other publicly-traded asset management firms. The Boards considered the differences between BlackRock and these other firms, including the contribution of technology at BlackRock, BlackRock’s expense management, and the relative product mix.
In addition, the Boards considered the cost of the services provided to the Trusts by BlackRock, and BlackRock’s and its affiliates’ profits relating to the management of the Trusts and the other funds advised by BlackRock and its affiliates. As part of its analysis, the Boards reviewed BlackRock’s methodology in allocating its costs to the management of the Trusts. The Boards also considered whether BlackRock has the
| SEMI-ANNUAL REPORT | JUNE 30, 2013 | 37
|
| |
Disclosure of Investment Advisory Agreements and Sub-Advisory Agreements (concluded)
|
financial resources necessary to attract and retain high quality investment management personnel to perform its obligations under the Agreements and to continue to provide the high quality of services that is expected by the Boards.
Each Board noted that its Trust’s contractual management fee rate ranked in the first quartile relative to the Trust’s Expense Peers.
D. Economies of Scale: Each Board, including the Independent Board Members, considered the extent to which economies of scale might be realized as the assets of its Trust increase. Each Board also considered the extent to which its Trust benefits from such economies and whether there should be changes in the advisory fee rate or breakpoint structure in order to enable the Trust to participate in these economies of scale, for example through the use of breakpoints in the advisory fee based upon the asset level of the Trust.
Based on the Boards’ review and consideration of the issue, the Boards concluded that most closed-end funds do not have fund level breakpoints because closed-end funds generally do not experience substantial growth after the initial public offering. They are typically priced at scale at a fund’s inception. The Boards noted that only one closed-end fund in the Fund Complex has breakpoints in its advisory fee structure.
E. Other Factors Deemed Relevant by the Board Members: The Boards, including the Independent Board Members, also took into account other ancillary or “fall-out” benefits that BlackRock or its affiliates may derive from their respective relationships with the Trusts, both tangible and intangible, such as BlackRock’s ability to leverage its investment professionals who manage other portfolios and risk management personnel, an increase in BlackRock’s profile in the investment advisory community, and the engagement of BlackRock’s affiliates as service providers to the Trusts, including securities lending and cash management services. The Boards also considered BlackRock’s overall operations and its efforts to expand the scale of, and improve the quality of, its operations. The Boards also noted that BlackRock may use and benefit from third party research obtained by soft dollars generated by certain registered fund transactions to assist in managing all or a number of its other client accounts. The Boards further noted that it had considered the investment by BlackRock’s funds in exchange traded funds (i.e., ETFs) without any offset against the management fees payable by the funds to BlackRock.
In connection with its consideration of the Agreements, the Boards also received information regarding BlackRock’s brokerage and soft dollar practices. The Boards received reports from BlackRock which included information on brokerage commissions and trade execution practices throughout the year.
The Boards noted the competitive nature of the closed-end fund marketplace, and that shareholders are able to sell their Trust shares in the secondary market if they believe that their Trust’s fees and expenses are too high or if they are dissatisfied with the performance of their Trust.
The Boards also considered the various notable initiatives and projects BlackRock performed in connection with its closed-end fund product line. These initiatives included the refinancing of auction rate preferred securities; efforts to eliminate product overlap with fund mergers; ongoing services to manage leverage that has become increasingly complex; share repurchases and other support initiatives for certain BlackRock funds; and continued communications efforts with shareholders, fund analysts and financial advisers. With respect to the latter, the Independent Board Members noted BlackRock’s continued commitment to supporting the secondary market for the common shares of its closed-end funds through a comprehensive secondary market communication program designed to raise investor and analyst awareness and understanding of closed-end funds. BlackRock’s support services included, among other things: continuing communications concerning the refinancing efforts related to auction rate preferred securities; sponsoring and participating in conferences; communicating with closed-end fund analysts covering the BlackRock funds throughout the year; providing marketing and product updates for the closed-end funds; and maintaining and enhancing its closed-end fund website.
Conclusion
Each Board, including the Independent Board Members, unanimously approved the continuation of the Advisory Agreement between the Manager and its Trust for a one-year term ending June 30, 2014, and the Sub-Advisory Agreement among the Manager, the Sub-Advisor, and its Trust for a one-year term ending June 30, 2014. Based upon their evaluation of all of the aforementioned factors in their totality, the Boards, including the Independent Board Members, were satisfied that the terms of the Agreements were fair and reasonable and in the best interest of the Trusts and their shareholders. In arriving at their decision to approve the Agreements, the Boards did not identify any single factor or group of factors as all-important or controlling, but considered all factors together, and different Board Members may have attributed different weights to the various factors considered. The Independent Board Members were also assisted by the advice of independent legal counsel in making these determinations. The contractual fee arrangements for the Trusts reflect the results of several years of review by the Board Members and predecessor Board Members, and discussions between such Board Members (and predecessor Board Members) and BlackRock. As a result, the Board Members’ conclusions may be based in part on their consideration of these arrangements in prior years.
| 38 | SEMI-ANNUAL REPORT | JUNE 30, 2013
|
Richard E. Cavanagh, Chairman of the Board and
Trustee
Karen P. Robards, Vice Chairperson of the Board, Chairperson of the Audit Committee and Trustee
Paul L. Audet, Trustee
Michael J. Castellano, Trustee and Member of the Audit
Committee
Frank J. Fabozzi, Trustee and Member of the Audit
Committee
Kathleen F. Feldstein, Trustee
James T. Flynn, Trustee and Member of the Audit Committee
Henry Gabbay, Trustee
Jerrold B. Harris, Trustee
R. Glenn Hubbard, Trustee
W. Carl Kester, Trustee and Member of the Audit Committee
John M. Perlowski, President and Chief Executive Officer
Anne Ackerley, Vice President
Brendan Kyne, Vice President
Robert W. Crothers, Vice President
Neal Andrews, Chief Financial Officer
Jay Fife, Treasurer
Brian Kindelan, Chief Compliance Officer and
Anti-Money Laundering Officer
Janey Ahn, Secretary
Investment Advisor
BlackRock Advisors, LLC
Wilmington, DE 19809
Sub-Advisor
BlackRock Financial Management, Inc.
New York, NY 10055
Custodian and Accounting Agent
State Street Bank and Trust Company
Boston, MA 02110
Transfer Agent
Computershare Trust Company, N.A.
Canton, MA 02021
Legal Counsel
Skadden, Arps, Slate, Meagher & Flom LLP
New York, NY 10036
Independent Registered Public Accounting Firm
Deloitte & Touche LLP
Boston, MA 02116
Address of the Trusts
100 Bellevue Parkway
Wilmington, DE 19809
| SEMI-ANNUAL REPORT | JUNE 30, 2013 | 39
|
Regulation Regarding Derivatives
Effective December 31, 2012, the Commodity Futures Trading Commission (“CFTC”) adopted certain regulatory changes that subjects registered investment companies and advisers to registered investment companies to regulation by the CFTC if a fund invests more than a prescribed level of its net assets in CFTC-regulated futures, options and swaps (“CFTC Derivatives”), or if a fund markets itself as providing investment exposure to such instruments. To the extent a Trust uses CFTC-regulated futures, options and swaps, it intends to do so below such prescribed levels and will not market itself as a “commodity pool” or a vehicle for trading such instruments. Accordingly, BlackRock Advisors, LLC has claimed an exclusion from the definition of the term “commodity pool operator” under the Commodity Exchange Act (“CEA”) pursuant to Rule 4.5 under the CEA. BlackRock Advisors, LLC is not, therefore, subject to registration or regulation as a “commodity pool operator” under the CEA in respect to each Trust.
Dividend Policy
The Trusts’ dividend policy is to distribute all or a portion of their net investment income to their shareholders on a monthly basis. In order to provide shareholders with a more stable level of dividend distributions, the Trusts may at times pay out less than the entire amount of net investment income earned in any particular month and may at times in any particular month pay out such accumulated but undistributed income in addition to net investment income earned in that month. As a result, the dividends paid by the Trusts for any particular month may be more or less than the amount of net investment income earned by the Trusts during such month. The Trusts’ current accumulated but undistributed net investment income, if any, is disclosed in the Statements of Assets and Liabilities, which comprises part of the financial information included in this report.
General Information
The Trusts do not make available copies of their Statements of Additional Information because the Trusts’ shares are not continuously offered, which means that the Statement of Additional Information of each Trust has not been updated after completion of the respective Trust’s offerings and the information contained in each Trust’s Statement of Additional Information may have become outdated.
During the period, there were no material changes in the Trusts’ investment objectives or policies or to the Trusts’ charters or by-laws that would delay or prevent a change of control of the Trusts that were not approved by the shareholders or in the principal risk factors associated with investment in the Trusts. There have been no changes in the persons who are primarily responsible for the day-to-day management of the Trusts’ portfolios.
Quarterly performance, semi-annual and annual reports and other information regarding the Trusts may be found on BlackRock’s website, which can be accessed at http://www.blackrock.com. This reference to BlackRock’s website is intended to allow investors public access to information regarding the Trusts and does not, and is not intended to, incorporate BlackRock’s website in this report.
Electronic Delivery
Electronic copies of most financial reports are available on the Trusts’ websites or shareholders can sign up for e-mail notifications of quarterly statements, annual and semi-annual reports by enrolling in the Trusts’ electronic delivery program.
Shareholders Who Hold Accounts with Investment Advisors, Banks or Brokerages:
Please contact your financial advisor to enroll. Please note that not all investment advisors, banks or brokerages may offer this service.
Householding
The Trusts will mail only one copy of shareholder documents, including annual and semi-annual reports and proxy statements, to shareholders with multiple accounts at the same address. This practice is commonly called “householding” and is intended to reduce expenses and eliminate duplicate mailings of shareholder documents. Mailings of your shareholder documents may be householded indefinitely unless you instruct us otherwise. If you do not want the mailing of these documents to be combined with those for other members of your household, please call the Trusts at (800) 882-0052.
| 40 | SEMI-ANNUAL REPORT | JUNE 30, 2013
|
| |
| Additional Information (continued) |
|
General Information (concluded)
Availability of Quarterly Schedule of Investments
The Trusts file their complete schedule of portfolio holdings with the SEC for the first and third quarters of each fiscal year on Form N-Q. The Trusts’ Forms N-Q are available on the SEC’s website at http://www.sec.gov and may also be reviewed and copied at the SEC’s Public Reference Room in Washington, DC. Information on how to access documents on the SEC’s website without charge may be obtained by calling (800) SEC-0330. The Trusts’ Forms N-Q may also be obtained upon request and without charge by calling (800) 882-0052.
Availability of Proxy Voting Policies and Procedures
A description of the policies and procedures that the Trusts use to determine how to vote proxies relating to portfolio securities is available (1) without charge, upon request, by calling (800) 882-0052; (2) at http://www.blackrock.com; and (3) on the SEC’s website at http://www.sec.gov.
Availability of Proxy Voting Record
Information about how the Trusts voted proxies relating to securities held in the Trusts’ portfolios during the most recent 12-month period ended June 30 is available upon request and without charge (1) at http://www.blackrock.com or by calling (800) 882-0052 and (2) on the SEC’s website at http://www.sec.gov.
Availability of Trust Updates
BlackRock will update performance and certain other data for the Trusts on a monthly basis on its website in the “Closed-end Funds” section of http://www.blackrock.com as well as certain other material information as necessary from time to time. Investors and others are advised to periodically check the website for updated performance information and the release of other material information about the Trusts. This reference to BlackRock’s website is intended to allow investors public access to information regarding the Trusts and does not, and is not intended to, incorporate BlackRock’s website in this report.
| SEMI-ANNUAL REPORT | JUNE 30, 2013 | 41
|
| |
| Additional Information (concluded) |
|
BlackRock Privacy Principles
BlackRock is committed to maintaining the privacy of its current and former fund investors and individual clients (collectively, “Clients”) and to safeguarding their non-public personal information. The following information is provided to help you understand what personal information BlackRock collects, how we protect that information and why in certain cases we share such information with select parties.
If you are located in a jurisdiction where specific laws, rules or regulations require BlackRock to provide you with additional or different privacy-related rights beyond what is set forth below, then BlackRock will comply with those specific laws, rules or regulations.
BlackRock obtains or verifies personal non-public information from and about you from different sources, including the following: (i) information we receive from you or, if applicable, your financial intermediary, on applications, forms or other documents; (ii) information about your transactions with us, our affiliates, or others; (iii) information we receive from a consumer reporting agency; and (iv) from visits to our websites.
BlackRock does not sell or disclose to non-affiliated third parties any non-public personal information about its Clients, except as permitted by law or as is necessary to respond to regulatory requests or to service Client accounts. These non-affiliated third parties are required to protect the confidentiality and security of this information and to use it only for its intended purpose.
We may share information with our affiliates to service your account or to provide you with information about other BlackRock products or services that may be of interest to you. In addition, BlackRock restricts access to non-public personal information about its Clients to those BlackRock employees with a legitimate business need for the information. BlackRock maintains physical, electronic and procedural safeguards that are designed to protect the non-public personal information of its Clients, including procedures relating to the proper storage and disposal of such information.
| 42 | SEMI-ANNUAL REPORT | JUNE 30, 2013
|
[THIS PAGE INTENTIONALLY LEFT BLANK]
This report is transmitted to shareholders only. It is not a prospectus. Past performance results shown in this report should not be considered a representation of future performance. The Trusts leverage their Common Shares, which creates risks for Common Shareholders, including the likelihood of greater volatility of net asset value and market price of the Common Shares, and the risk that fluctuations in the short-term dividend rates of the Preferred Shares, which are currently set at the maximum reset rate as a result of failed auctions, may reduce the Common Shares’ yield. Statements and other information herein are as dated and are subject to change.
CEF-BK3-6/13-SAR
Item 2 – Code of Ethics – Not Applicable to this semi-annual report
Item 3 – Audit Committee Financial Expert – Not Applicable to this semi-annual report
Item 4 – Principal Accountant Fees and Services – Not Applicable to this semi-annual report
Item 5 – Audit Committee of Listed Registrants – Not Applicable to this semi-annual report
Item 6 – Investments
(a) The registrant’s Schedule of Investments is included as part of the Report to Stockholders filed under Item 1 of this Form.
(b) Not Applicable due to no such divestments during the semi-annual period covered since the previous Form N-CSR filing.
Item 7 – Disclosure of Proxy Voting Policies and Procedures for Closed-End Management Investment Companies – Not Applicable to this semi-annual report
Item 8 – Portfolio Managers of Closed-End Management Investment Companies
(a) Not Applicable to this semi-annual report
(b) As of the date of this filing, there have been no changes in any of the portfolio managers identified in the most recent annual report on Form N-CSR.
Item 9 – Purchases of Equity Securities by Closed-End Management Investment Company and Affiliated Purchasers – Not Applicable
Item 10 – Submission of Matters to a Vote of Security Holders – There have been no material changes to these procedures.
Item 11 – Controls and Procedures
(a) – The registrant’s principal executive and principal financial officers, or persons performing similar functions, have concluded that the registrant’s disclosure controls and procedures (as defined in Rule 30a-3(c) under the Investment Company Act of 1940, as amended (the “1940 Act”)) are effective as of a date within 90 days of the filing of this report based on the evaluation of these controls and procedures required by Rule 30a-3(b) under the 1940 Act and Rule 13a-15(b) under the Securities Exchange Act of 1934, as amended.
(b) – There were no changes in the registrant’s internal control over financial reporting (as defined in Rule 30a-3(d) under the 1940 Act) that occurred during the second fiscal quarter of the period covered by this report that have materially affected, or are reasonably likely to materially affect, the registrant’s internal control over financial reporting.
Item 12 – Exhibits attached hereto
(a)(1) – Code of Ethics – Not Applicable to this semi-annual report
(a)(2) – Certifications – Attached hereto
(a)(3) – Not Applicable
(b) – Certifications – Attached hereto
Pursuant to the requirements of the Securities Exchange Act of 1934 and the Investment Company Act of 1940, the registrant has duly caused this report to be signed on its behalf by the undersigned, thereunto duly authorized.
BlackRock New York Municipal 2018 Term Trust
| By: | | /s/ John M. Perlowski |
| | John M. Perlowski |
| | Chief Executive Officer (principal executive officer) of |
| | BlackRock New York Municipal 2018 Term Trust |
Date: August 29, 2013
Pursuant to the requirements of the Securities Exchange Act of 1934 and the Investment Company Act of 1940, this report has been signed below by the following persons on behalf of the registrant and in the capacities and on the dates indicated.
| By: | | /s/ John M. Perlowski |
| | John M. Perlowski |
| | Chief Executive Officer (principal executive officer) of |
| | BlackRock New York Municipal 2018 Term Trust |
Date: August 29, 2013
| By: | | /s/ Neal J. Andrews |
| | Neal J. Andrews |
| | Chief Financial Officer (principal financial officer) of |
| | BlackRock New York Municipal 2018 Term Trust |
Date: August 29, 2013