UNITED STATES
SECURITIES AND EXCHANGE COMMISSION
Washington, D.C. 20549
FORM N-CSR
CERTIFIED SHAREHOLDER REPORT OF REGISTERED MANAGEMENT INVESTMENT COMPANIES
Investment Company Act file number: 811-10501
Name of Fund: BlackRock Municipal 2018 Term Trust (BPK)
Fund Address: 100 Bellevue Parkway, Wilmington, DE 19809
Name and address of agent for service: John M. Perlowski, Chief Executive Officer, BlackRock Municipal 2018 Term Trust, 55 East 52nd Street, New York, NY 10055
Registrant’s telephone number, including area code: (800) 882-0052, Option 4
Date of fiscal year end: 12/31/2016
Date of reporting period: 06/30/2016
Item 1 – Report to Stockholders
JUNE 30, 2016
| | | | |
SEMI-ANNUAL REPORT (UNAUDITED) | | | |  |
BlackRock California Municipal 2018 Term Trust (BJZ)
BlackRock Municipal 2018 Term Trust (BPK)
BlackRock New York Municipal 2018 Term Trust (BLH)
|
| Not FDIC Insured • May Lose Value • No Bank Guarantee |
| | | | | | |
| | | | | | | |
| 2 | | SEMI-ANNUAL REPORT | | JUNE 30, 2016 | | |
Dear Shareholder,
Uneven economic outlooks and divergence of monetary policies across regions have been the overarching themes driving financial markets over the past couple of years. In the latter half of 2015, as U.S. growth outpaced other developed markets, investors were focused largely on the timing of the Federal Reserve’s (the “Fed”) decision to end its near-zero interest rate policy. The Fed ultimately hiked rates in December, whereas the European Central Bank and the Bank of Japan took additional steps to stimulate growth, even introducing negative interest rates. The U.S. dollar had strengthened considerably ahead of these developments, causing profit challenges for U.S. companies that generate revenues overseas, and pressuring emerging market currencies and commodities prices.
Also during this time period, oil prices collapsed due to excess global supply. China, one of the world’s largest consumers of oil, was another notable source of stress for financial markets as the country showed signs of slowing economic growth and took measures to devalue its currency. Declining confidence in the country’s policymakers stoked investors’ worries about the potential impact of China’s weakness on the global economy. Global market volatility increased and risk assets (such as equities and high yield bonds) suffered in this environment.
The elevated market volatility spilled over into 2016, but as the first quarter wore on, fears of a global recession began to fade, allowing markets to calm and risk assets to rebound. Central bank stimulus in Europe and Japan, combined with a more tempered outlook for rate hikes in the United States, helped bolster financial markets. A softening in U.S. dollar strength brought relief to U.S. exporters and emerging market economies. Oil prices rebounded as the world’s largest producers agreed to reduce supply.
Volatility spiked again in late June when the United Kingdom shocked investors with its vote to leave the European Union. Uncertainty around how the British exit might affect the global economy and political landscape long term drove investors to high quality assets, pushing already-low global yields to even lower levels.
At BlackRock, we believe investors need to think globally, extend their scope across a broad array of asset classes and be prepared to adjust accordingly as market conditions change over time. We encourage you to talk with your financial advisor and visit blackrock.com for further insight about investing in today’s markets.
Sincerely,

Rob Kapito
President, BlackRock Advisors, LLC

Rob Kapito
President, BlackRock Advisors, LLC
| | | | | | | | |
| Total Returns as of June 30, 2016 | |
| | | 6-month | | | 12-month | |
U.S. large cap equities
(S&P 500® Index) | | | 3.84 | % | | | 3.99 | % |
U.S. small cap equities
(Russell 2000® Index) | | | 2.22 | | | | (6.73 | ) |
International equities
(MSCI Europe, Australasia,
Far East Index) | | | (4.42 | ) | | | (10.16 | ) |
Emerging market equities
(MSCI Emerging
Markets Index) | | | 6.41 | | | | (12.05 | ) |
3-month Treasury bills
(BofA Merrill Lynch 3-Month
U.S. Treasury Bill Index) | | | 0.15 | | | | 0.19 | |
U.S. Treasury securities
(BofA Merrill Lynch 10-Year
U.S. Treasury Index) | | | 7.95 | | | | 9.49 | |
U.S. investment grade
bonds (Barclays
U.S. Aggregate Bond Index) | | | 5.31 | | | | 6.00 | |
Tax-exempt municipal
bonds (S&P Municipal
Bond Index) | | | 4.35 | | | | 7.80 | |
U.S. high yield bonds
(Barclays U.S.
Corporate High Yield 2%
Issuer Capped Index) | | | 9.06 | | | | 1.65 | |
| Past performance is no guarantee of future results. Index performance is shown for illustrative purposes only. You cannot invest directly in an index. | |
| | | | | | |
| | | | | | | |
| | THIS PAGE NOT PART OF YOUR FUND REPORT | | | | 3 |
| | |
| Municipal Market Overview | | |
|
| For the Reporting Period Ended June 30, 2016 |
Municipal Market Conditions
Municipal bonds generated positive performance for the period, due to falling interest rates and a favorable supply-and-demand environment. Interest rates were volatile in 2015 (bond prices rise as rates fall) leading up to a long-awaited rate hike from the U.S. Federal Reserve (the “Fed”) that ultimately came in December. However, ongoing reassurance from the Fed that rates would be increased gradually and would likely remain low overall resulted in strong demand for fixed income investments, with municipal bonds being one of the strongest-performing sectors for the 12-month period. Investors favored the relative yield and stability of municipal bonds amid bouts of volatility resulting from uneven U.S. economic data, volatile oil prices, global growth concerns, geopolitical risks (particularly the United Kingdom’s decision to leave the European Union), and widening central bank divergence — i.e., policy easing outside the United States while the Fed was posturing to commence policy tightening. During the 12 months ended June 30, 2016, municipal bond funds garnered net inflows of approximately $42 billion (based on data from the Investment Company Institute).
For the same 12-month period, total new issuance remained relatively strong from a historical perspective at $390 billion (though lower than the $410 billion issued in the prior 12-month period). A noteworthy portion of new supply during this period was attributable to refinancing activity (roughly 59%) as issuers continued to take advantage of low interest rates and a flatter yield curve to reduce their borrowing costs.
|
S&P Municipal Bond Index |
Total Returns as of June 30, 2016 |
6 months: 4.35% |
12 months: 7.80% |
A Closer Look at Yields
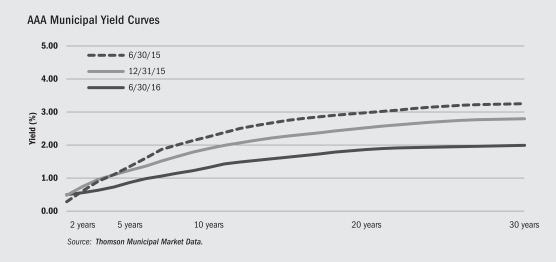
From June 30, 2015 to June 30, 2016, yields on AAA-rated 30-year municipal bonds decreased by 126 basis points (“bps”) from 3.28% to 2.02%, while 10-year rates fell by 93 bps from 2.28% to 1.35% and 5-year rates decreased 49 bps from 1.38% to 0.89% (as measured by Thomson Municipal Market Data). The municipal yield curve experienced significant flattening over the 12-month period with the spread between 2- and 30-year maturities flattening by 121 bps and the spread between 2- and 10-year maturities flattening by 88 bps.
During the same time period, on a relative basis, tax-exempt municipal bonds broadly outperformed U.S. Treasuries with the greatest outperformance experienced in longer-term issues. In absolute terms, the positive performance of municipal bonds was driven largely by falling interest rates as well as a supply/demand imbalance within the municipal market as investors sought income and incremental yield in an environment where opportunities became increasingly scarce. More broadly, municipal bonds benefited from the greater appeal of tax-exempt investing in light of the higher tax rates implemented in 2014. The asset class is known for its lower relative volatility and preservation of principal with an emphasis on income as tax rates rise.
Financial Conditions of Municipal Issuers
The majority of municipal credits remain strong, despite well-publicized distress among a few issuers. Four of the five states with the largest amount of debt outstanding — California, New York, Texas and Florida — have exhibited markedly improved credit fundamentals during the slow national recovery. However, several states with the largest unfunded pension liabilities have seen their bond prices decline noticeably and remain vulnerable to additional price deterioration. On the local level, Chicago’s credit quality downgrade is an outlier relative to other cities due to its larger pension liability and inadequate funding remedies. BlackRock maintains the view that municipal bond defaults will remain minimal and in the periphery while the overall market is fundamentally sound. We continue to advocate careful credit research and believe that a thoughtful approach to structure and security selection remains imperative amid uncertainty in a modestly improving economic environment.
The opinions expressed are those of BlackRock as of June 30, 2016, and are subject to change at any time due to changes in market or economic conditions. The comments should not be construed as a recommendation of any individual holdings or market sectors. Investing involves risk including loss of principal. Bond values fluctuate in price so the value of your investment can go down depending on market conditions. Fixed income risks include interest-rate and credit risk. Typically, when interest rates rise, there is a corresponding decline in bond values. Credit risk refers to the possibility that the bond issuer will not be able to make principal and interest payments. There may be less information on the financial condition of municipal issuers than for public corporations. The market for municipal bonds may be less liquid than for taxable bonds. Some investors may be subject to Alternative Minimum Tax (AMT). Capital gains distributions, if any, are taxable.
The Standard & Poor’s Municipal Bond Index, a broad, market value-weighted index, seeks to measure the performance of the U.S. municipal bond market. All bonds in the index are exempt from U.S. federal income taxes or subject to the AMT. Past performance is no guarantee of future results. Index performance is shown for illustrative purposes only. It is not possible to invest directly in an index.
| | | | | | |
| | | | | | | |
| 4 | | SEMI-ANNUAL REPORT | | JUNE 30, 2016 | | |
| | |
| The Benefits and Risks of Leveraging | | |
The Trusts may utilize leverage to seek to enhance the distribution rate on, and net asset value (“NAV”) of, their common shares (“Common Shares”). However, these objectives cannot be achieved in all interest rate environments.
In general, the concept of leveraging is based on the premise that the financing cost of leverage, which is based on short-term interest rates, is normally lower than the income earned by a Trust on its longer-term portfolio investments purchased with the proceeds from leverage. To the extent that the total assets of the Trusts (including the assets obtained from leverage) are invested in higher-yielding portfolio investments, the Trusts’ shareholders benefit from the incremental net income. The interest earned on securities purchased with the proceeds from leverage is paid to shareholders in the form of dividends, and the value of these portfolio holdings is reflected in the per share NAV.
To illustrate these concepts, assume a Trust’s capitalization is $100 million and it utilizes leverage for an additional $30 million, creating a total value of $130 million available for investment in longer-term income securities. If prevailing short-term interest rates are 3% and longer-term interest rates are 6%, the yield curve has a strongly positive slope. In this case, a Trust’s financing costs on the $30 million of proceeds obtained from leverage are based on the lower short-term interest rates. At the same time, the securities purchased by a Trust with the proceeds from leverage earn income based on longer-term interest rates. In this case, a Trust’s financing cost of leverage is significantly lower than the income earned on a Trust’s longer-term investments acquired from such leverage proceeds, and therefore the holders of Common Shares (“Common Shareholders”) are the beneficiaries of the incremental net income.
However, in order to benefit shareholders, the return on assets purchased with leverage proceeds must exceed the ongoing costs associated with the leverage. If interest and other costs of leverage exceed the Trusts’ return on assets purchased with leverage proceeds, income to shareholders is lower than if the Trusts had not used leverage. Furthermore, the value of the Trusts’ portfolio investments generally varies inversely with the direction of long-term interest rates, although other factors can influence the value of portfolio investments. In contrast,
the value of the Trusts’ obligations under their respective leverage arrangements generally does not fluctuate in relation to interest rates. As a result, changes in interest rates can influence the Trusts’ NAVs positively or negatively. Changes in the future direction of interest rates are very difficult to predict accurately, and there is no assurance that the Trusts’ intended leveraging strategy will be successful.
The use of leverage also generally causes greater changes in each Trust’s NAV, market price and dividend rates than comparable portfolios without leverage. In a declining market, leverage is likely to cause a greater decline in the NAV and market price of a Trust’s shares than if the Trust were not leveraged. In addition, each Trust may be required to sell portfolio securities at inopportune times or at distressed values in order to comply with regulatory requirements applicable to the use of leverage or as required by the terms of leverage instruments, which may cause the Trusts to incur losses. The use of leverage may limit a Trust’s ability to invest in certain types of securities or use certain types of hedging strategies. Each Trust incurs expenses in connection with the use of leverage, all of which are borne by shareholders and may reduce income to the shareholders. Moreover, to the extent the calculation of the Trusts’ investment advisory fees includes assets purchased with the proceeds of leverage, the investment advisory fees payable to the Trusts’ investment adviser will be higher than if the Trusts did not use leverage.
Each Trust may utilize leverage through TOB Trusts as described in the Notes to Financial Statements.
Under the Investment Company Act of 1940, as amended (the “1940 Act”), the Trusts are permitted to issue debt up to 33 1/3% of their total managed assets. A Trust may voluntarily elect to limit its leverage to less than the maximum amount permitted under the 1940 Act.
If a Trust segregates or designates on its books and records cash or liquid assets having values not less than the value of a Trust’s obligations under the TOB Trust (including accrued interest), then such transaction is not considered a senior security and is not subject to the foregoing limitations and requirements under the 1940 Act.
| | | | | | |
| | | | | | | |
| | SEMI-ANNUAL REPORT | | JUNE 30, 2016 | | 5 |
| | | | |
| Trust Summary as of June 30, 2016 | | BlackRock California Municipal 2018 Term Trust |
BlackRock California Municipal 2018 Term Trust’s (BJZ) (the “Trust”) investment objectives seek to provide current income exempt from regular federal and California income taxes and to return $15 per common share to holders of common shares on or about December 31, 2018. The Trust seeks to achieve its investment objectives by investing, under normal market conditions, at least 80% of its total assets in municipal bonds that at the time of investment are investment grade quality.
There is no assurance that the Trust will achieve its investment objective of returning $15 per share.
| | |
Symbol on New York Stock Exchange (“NYSE”) | | BJZ |
Initial Offering Date | | October 26, 2001 |
Termination Date (on or about) | | December 31, 2018 |
Yield on Closing Market Price as of June 30, 2016 ($15.17)1 | | 2.19% |
Tax Equivalent Yield2 | | 4.46% |
Current Monthly Distribution per Common Share3 | | $0.0277 |
Current Annualized Distribution per Common Share3 | | $0.3324 |
Economic Leverage as of June 30, 2016 | | — |
| | 1 | | Yield on closing market price is calculated by dividing the current annualized distribution per share by the closing market price. Past performance does not guarantee future results. |
| | 2 | | Tax equivalent yield assumes the maximum marginal federal and state tax rate of 50.93%, which includes the 3.8% Medicare tax. Actual tax rates will vary based on income, exemptions and deductions. Lower taxes will result in lower tax equivalent yields. |
| | 3 | | The distribution rate is not constant and is subject to change. |
Returns for the six months ended June 30, 2016 were as follows:
| | | | | | | | |
| | | Returns Based On | |
| | | Market Price | | | NAV | |
BJZ1,2 | | | 1.91 | % | | | 1.17 | % |
Lipper California Municipal Debt Funds3 | | | 11.26 | % | | | 6.80 | % |
| | 1 | | All returns reflect reinvestment of dividends and/or distributions. |
| | 2 | | The Trust moved from a discount to NAV to a small premium during the period, which accounts for the difference between performance based on price and performance based on NAV. |
The following discussion relates to the Trust’s absolute performance based on NAV:
| • | | The Trust is scheduled to terminate on or about December 31, 2018, and it therefore holds securities that will mature close to that date. As rates declined more on the long end of the yield curve, the Trust’s shorter maturity profile was a disadvantage in comparison to its Lipper category peers, which typically hold longer-dated securities. |
| • | | California’s municipal bond market generated strong performance in the first half of 2016, reflecting both the sharp decline in U.S. Treasury yields and the continued improvement in fiscal conditions at both the state and local levels. (Bond prices rise as yields fall.) The gains were largely concentrated among intermediate- and longer-term bonds, while shorter-term issues produced much smaller returns. |
| • | | The Trust’s NAV was generally stable during the period, with a significant portion of total return coming from income. At the sector level, California tax-backed state, utility and transportation issues provided the largest positive contribution to performance. The Trust’s positions in lower-rated investment grade and below investment grade bonds also contributed, as lower-quality issues generally outpaced their higher-quality counterparts. The Trust maintained a fully invested portfolio, which helped maximize the income component of total return. |
| • | | The majority of the Trust’s investments delivered positive price performance, as all components of the S&P Muni Main Index gained ground during the period. However, the Trust’s low duration — which is a function of its termination date on or about December 31, 2018 — prevented it from fully participating in the gains of the broader market. (Duration is a measure of interest rate sensitivity.) Reinvestment risk also detracted from Trust performance. As higher yielding bonds mature or are called, the subsequent purchases need to be made at materially lower yields. |
The views expressed reflect the opinions of BlackRock as of the date of this report and are subject to change based on changes in market, economic or other conditions. These views are not intended to be a forecast of future events and are no guarantee of future results.
| | | | | | |
| | | | | | | |
| 6 | | SEMI-ANNUAL REPORT | | JUNE 30, 2016 | | |
| | |
| | | BlackRock California Municipal 2018 Term Trust |
|
| Market Price and Net Asset Value Per Share Summary |
| | | | | | | | | | | | | | | | | | | | |
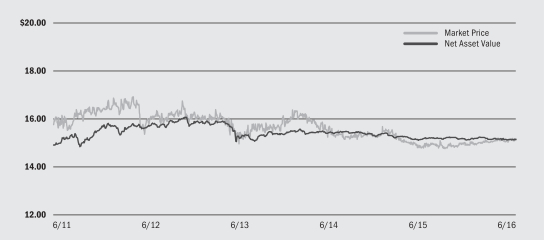
| | | 6/30/16 | | | 12/31/15 | | | Change | | | High | | | Low | |
Market Price | | $ | 15.17 | | | $ | 15.05 | | | | 0.80 | % | | $ | 15.24 | | | $ | 14.91 | |
Net Asset Value | | $ | 15.16 | | | $ | 15.15 | | | | 0.07 | % | | $ | 15.25 | | | $ | 15.13 | |
|
| Market Price and Net Asset Value History For the Past Five Years |
|
| Overview of the Trust’s Total Investments* |
| | | | | | | | |
| Sector Allocation | | 6/30/16 | | | 12/31/15 | |
Utilities | | | 28 | % | | | 28 | % |
County/City/Special District/School District | | | 24 | | | | 21 | |
Health | | | 12 | | | | 12 | |
Education | | | 11 | | | | 10 | |
State | | | 11 | | | | 17 | |
Transportation | | | 9 | | | | 7 | |
Corporate | | | 4 | | | | 4 | |
Housing | | | 1 | | | | 1 | |
| | | | |
| | |
| Call/Maturity Schedule3 | | | |
Calendar Year Ended December 31, | | | | |
2016 | | | 11 | % |
2017 | | | 7 | |
2018 | | | 55 | |
2019 | | | 17 | |
2020 | | | — | |
| | 3 | | Scheduled maturity dates and/or bonds that are subject to potential calls by issuers over the next five years. |
| | * | | Excludes short-term securities. |
| | | | | | | | |
| Credit Quality Allocation1 | | 6/30/16 | | | 12/31/15 | |
AAA/Aaa | | | 2 | % | | | 2 | % |
AA/Aa | | | 68 | | | | 67 | |
A | | | 15 | | | | 18 | |
BBB/Baa | | | 6 | | | | 7 | |
N/R2 | | | 9 | | | | 6 | |
| | 1 | | For financial reporting purposes, credit quality ratings shown above reflect the highest rating assigned by either Standard & Poor’s (“S&P”) or Moody’s Investors Service (“Moody’s”) if ratings differ. These rating agencies are independent, nationally recognized statistical rating organizations and are widely used. Investment grade ratings are credit ratings of BBB/Baa or higher. Below investment grade ratings are credit ratings of BB/Ba or lower. Investments designated N/R are not rated by either rating agency. Unrated investments do not necessarily indicate low credit quality. Credit quality ratings are subject to change. |
| | 2 | | The investment adviser evaluates the credit quality of unrated investments based upon certain factors including, but not limited to, credit ratings for similar investments and financial analysis of sectors and individual investments. Using this approach, the investment adviser has deemed certain of these unrated securities as investment grade quality. As of June 30, 2016 and December 31, 2015, the market value of unrated securities deemed by the investment adviser to be investment grade represents 5% and 4%, respectively, of the Trust’s total investments. |
| | | | | | |
| | | | | | | |
| | SEMI-ANNUAL REPORT | | JUNE 30, 2016 | | 7 |
| | | | |
| Trust Summary as of June 30, 2016 | | BlackRock Municipal 2018 Term Trust |
BlackRock Municipal 2018 Term Trust’s (BPK) (the “Trust”) investment objectives seek to provide current income exempt from regular federal income tax and to return $15 per common share (the initial offering price per common share) to holders of common shares on or about December 31, 2018. The Trust seeks to achieve its investment objectives by investing, under normal market conditions, its assets in municipal bonds exempt from federal income taxes (except that the interest may be subject to the federal AMT). The Trust invests at least 80% of its assets in municipal bonds that are investment grade quality at the time of investment.
There is no assurance that the Trust will achieve its investment objective of returning $15 per share.
| | |
Symbol on NYSE | | BPK |
Initial Offering Date | | October 26, 2001 |
Termination Date (on or about) | | December 31, 2018 |
Yield on Closing Market Price as of June 30, 2016 ($15.25)1 | | 2.19% |
Tax Equivalent Yield2 | | 3.87% |
Current Monthly Distribution per Common Share3 | | $0.0278 |
Current Annualized Distribution per Common Share3 | | $0.3336 |
Economic Leverage as of June 30, 20164 | | 2% |
| | 1 | | Yield on closing market price is calculated by dividing the current annualized distribution per share by the closing market price. Past performance does not guarantee future results. |
| | 2 | | Tax equivalent yield assumes the maximum marginal federal tax rate of 43.4%, which includes the 3.8% Medicare tax. Actual tax rates will vary based on income, exemptions and deductions. Lower taxes will result in lower tax equivalent yields. |
| | 3 | | The distribution rate is not constant and is subject to change. |
| | 4 | | Represents TOB Trusts as a percentage of total managed assets, which is the total assets of the Trust, including any assets attributable to TOB Trusts, minus the sum of accrued liabilities. For a discussion of leveraging techniques utilized by the Trust, please see The Benefits and Risks of Leveraging on page 5. |
Returns for the six months ended June 30, 2016 were as follows:
| | | | | | | | |
| | | Returns Based On | |
| | | Market Price | | | NAV | |
BPK1,2 | | | (0.30 | )% | | | 1.40 | % |
Lipper Intermediate Municipal Debt Funds3 | | | 7.02 | % | | | 5.41 | % |
| | 1 | | All returns reflect reinvestment of dividends and/or distributions. |
| | 2 | | The Trust moved from a premium to NAV to a discount during the period, which accounts for the difference between performance based on price and performance based on NAV. |
The following discussion relates to the Trust’s absolute performance based on NAV:
| • | | The Trust is scheduled to terminate on or about December 31, 2018, and it therefore holds securities that will mature close to that date. As rates declined more on the long end of the yield curve, the Trust’s shorter maturity profile was a disadvantage in comparison to its Lipper category peers, which typically hold longer-dated securities. |
| • | | Municipal bonds generated strong performance in the first half of 2016, reflecting both the sharp decline in U.S. Treasury yields and the continued health of state and local finances. (Bond prices rise as yields fall.) The gains were largely concentrated among intermediate- and longer-term bonds, while shorter-term issues produced much smaller returns. |
| • | | The Trust’s NAV was generally stable during the period, with a significant portion of total return coming from income. At the sector level, health and transportation issues provided the largest positive contribution to performance. The Trust’s positions in lower-rated investment grade and below investment grade bonds also contributed, as lower-quality issues generally outpaced their higher-quality counterparts. The Trust maintained a fully invested portfolio, which helped maximize the income component of total return. The Trust also employed leverage through the use of tender option bonds, which modestly enhanced returns for the period. |
| • | | The majority of the Trust’s investments delivered positive price performance, as all components of the S&P Muni Main Index gained ground during the period. However, the Trust’s low duration — which is a function of its termination date on or about December 31, 2018 — prevented it from fully participating in the gains of the broader market. (Duration is a measure of interest rate sensitivity.) Reinvestment risk also detracted from performance. As higher yielding bonds mature or are called, the subsequent purchases need to be made at materially lower yields. |
The views expressed reflect the opinions of BlackRock as of the date of this report and are subject to change based on changes in market, economic or other conditions. These views are not intended to be a forecast of future events and are no guarantee of future results.
| | | | | | |
| | | | | | | |
| 8 | | SEMI-ANNUAL REPORT | | JUNE 30, 2016 | | |
| | |
| | | BlackRock Municipal 2018 Term Trust |
|
| Market Price and Net Asset Value Per Share Summary |
| | | | | | | | | | | | | | | | | | | | |
| | | 6/30/16 | | | 12/31/15 | | | Change | | | High | | | Low | |
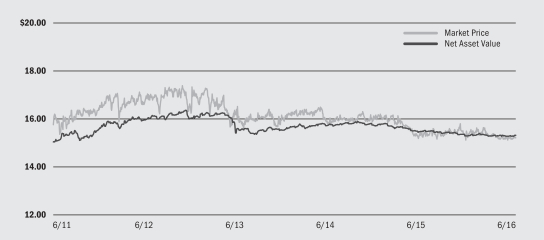
Market Price | | $ | 15.25 | | | $ | 15.50 | | | | (1.61 | )% | | $ | 15.80 | | | $ | 15.14 | |
Net Asset Value | | $ | 15.35 | | | $ | 15.34 | | | | 0.07 | % | | $ | 15.42 | | | $ | 15.31 | |
|
| Market Price and Net Asset Value History For the Past Five Years |
|
| Overview of the Trust’s Total Investments* |
| | | | | | | | |
| Sector Allocation | | 6/30/16 | | | 12/31/15 | |
County/City/Special District/School District | | | 25 | % | | | 23 | % |
Transportation | | | 19 | | | | 16 | |
Health | | | 15 | | | | 14 | |
State | | | 12 | | | | 11 | |
Corporate | | | 10 | | | | 12 | |
Utilities | | | 8 | | | | 11 | |
Education | | | 6 | | | | 8 | |
Housing | | | 4 | | | | 5 | |
Tobacco | | | 1 | | | | — | |
| | | | |
| | |
| Call/Maturity Schedule3 | | | |
Calendar Year Ended December 31, | | | | |
2016 | | | 1 | % |
2017 | | | 10 | |
2018 | | | 69 | |
2019 | | | 12 | |
2020 | | | 1 | |
| | 3 | | Scheduled maturity dates and/or bonds that are subject to potential calls by issuers over the next five years. |
| | * | | Excludes short-term securities. |
| | | | | | | | |
| Credit Quality Allocation1 | | 6/30/16 | | | 12/31/15 | |
AAA/Aaa | | | 6 | % | | | 6 | % |
AA/Aa | | | 28 | | | | 27 | |
A | | | 37 | | | | 37 | |
BBB/Baa | | | 16 | | | | 15 | |
BB/Ba | | | 1 | | | | 1 | |
B | | | 1 | | | | — | |
N/R2 | | | 11 | | | | 14 | |
| | 1 | | For financial reporting purposes, credit quality ratings shown above reflect the highest rating assigned by either S&P or Moody’s if ratings differ. These rating agencies are independent, nationally recognized statistical rating organizations and are widely used. Investment grade ratings are credit ratings of BBB/Baa or higher. Below investment grade ratings are credit ratings of BB/Ba or lower. Investments designated N/R are not rated by either rating agency. Unrated investments do not necessarily indicate low credit quality. Credit quality ratings are subject to change. |
| | 2 | | The investment adviser evaluates the credit quality of unrated investments based upon certain factors including, but not limited to, credit ratings for similar investments and financial analysis of sectors and individual investments. Using this approach, the investment adviser has deemed certain of these unrated securities as investment grade quality. As of June 30, 2016 and December 31, 2015, the market value of unrated securities deemed by the investment adviser to be investment grade represents 6% and 8%, respectively, of the Trust’s total investments. |
| | | | | | |
| | | | | | | |
| | SEMI-ANNUAL REPORT | | JUNE 30, 2016 | | 9 |
| | | | |
| Trust Summary as of June 30, 2016 | | BlackRock New York Municipal 2018 Term Trust |
BlackRock New York Municipal 2018 Term Trust’s (BLH) (the “Trust”) investment objectives seek to provide current income exempt from regular federal income tax and New York State and New York City personal income taxes and to return $15 per common share (the initial offering price per common share) to holders of common shares on or about December 31, 2018. The Trust seeks to achieve its investment objectives by investing at least 80% of its total assets in municipal bonds that at the time of investment are investment grade quality.
There is no assurance that the Trust will achieve its investment objective of returning $15 per share.
| | |
Symbol on NYSE | | BLH |
Initial Offering Date | | October 26, 2001 |
Termination Date (on or about) | | December 31, 2018 |
Yield on Closing Market Price as of June 30, 2016 ($15.03)1 | | 1.41% |
Tax Equivalent Yield2 | | 2.85% |
Current Monthly Distribution per Common Share3 | | $0.0177 |
Current Annualized Distribution per Common Share3 | | $0.2124 |
Economic Leverage as of June 30, 2016 | | — |
| | 1 | | Yield on closing market price is calculated by dividing the current annualized distribution per share by the closing market price. Past performance does not guarantee future results. |
| | 2 | | Tax equivalent yield assumes the maximum marginal federal and state tax rate of 50.59%, which includes the 3.8% Medicare tax. Actual tax rates will vary based on income, exemptions and deductions. Lower taxes will result in lower tax equivalent yields. |
| | 3 | | The distribution rate is not constant and is subject to change. |
Returns for the six months ended June 30, 2016 were as follows:
| | | | | | | | |
| | | Returns Based On | |
| | | Market Price | | | NAV | |
BLH1,2 | | | 1.42 | % | | | 1.21 | % |
Lipper New York Municipal Debt Funds3 | | | 11.97 | % | | | 6.56 | % |
| | 1 | | All returns reflect reinvestment of dividends and/or distributions. |
| | 2 | | The Trust’s discount to NAV, which narrowed slightly during the period, accounts for the difference between performance based on price and performance based on NAV. |
The following discussion relates to the Trust’s absolute performance based on NAV:
| • | | The Trust is scheduled to terminate on or about December 31, 2018, and it therefore holds securities that will mature close to that date. As rates declined more on the long end of the yield curve, the Trust’s shorter maturity profile was a disadvantage in comparison to its Lipper category peers, which typically hold longer-dated securities. |
| • | | New York’s municipal bond market generated strong performance in the first half of 2016, reflecting both the sharp decline in U.S. Treasury yields and the continued improvement in fiscal conditions at both the state and local levels. (Bond prices rise as yields fall.) The gains were largely concentrated among intermediate- and longer-term bonds, while shorter-term issues produced much smaller returns. |
| • | | The Trust’s NAV was generally stable during the period, with a significant portion of total return coming from income. At the sector level, New York state and local tax-backed bonds provided the largest positive contribution to performance, followed by transportation issues. The Trust’s positions in lower-rated investment grade and below investment grade bonds also contributed, as lower-quality issues generally outpaced their higher-quality counterparts. The Trust maintained a fully invested portfolio, which helped maximize the income component of total return. |
| • | | The majority of the Trust’s investments delivered positive price performance, as all components of the S&P Muni Main Index gained ground during the period. However, the Trust’s low duration — which is a function of its termination date on or about December 31, 2018 — prevented it from fully participating in the gains of the broader market. (Duration is a measure of interest rate sensitivity.) Reinvestment risk also detracted from performance. As higher yielding bonds mature or are called, the subsequent purchases need to be made at materially lower yields. |
The views expressed reflect the opinions of BlackRock as of the date of this report and are subject to change based on changes in market, economic or other conditions. These views are not intended to be a forecast of future events and are no guarantee of future results.
| | | | | | |
| | | | | | | |
| 10 | | SEMI-ANNUAL REPORT | | JUNE 30, 2016 | | |
| | |
| | | BlackRock New York Municipal 2018 Term Trust |
|
| Market Price and Net Asset Value Per Share Summary |
| | | | | | | | | | | | | | | | | | | | |
| | | 6/30/16 | | | 12/31/15 | | | Change | | | High | | | Low | |
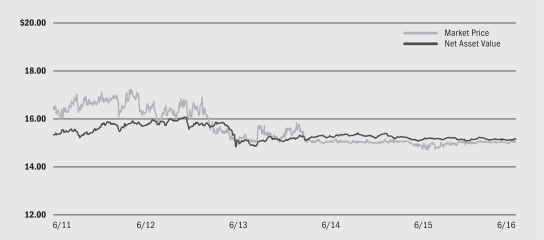
Market Price | | $ | 15.03 | | | $ | 14.94 | | | | 0.60 | % | | $ | 15.13 | | | $ | 14.90 | |
Net Asset Value | | $ | 15.14 | | | $ | 15.08 | | | | 0.40 | % | | $ | 15.21 | | | $ | 15.08 | |
|
| Market Price and Net Asset Value History For the Past Five Years |
|
| Overview of the Trust’s Total Investments* |
| | | | | | | | |
| Sector Allocation | | 6/30/16 | | | 12/31/15 | |
County/City/Special District/School District | | | 40 | % | | | 38 | % |
Transportation | | | 18 | | | | 19 | |
Education | | | 13 | | | | 11 | |
State | | | 10 | | | | 11 | |
Utilities | | | 7 | | | | 7 | |
Health | | | 7 | | | | 7 | |
Housing | | | 3 | | | | 3 | |
Tobacco | | | 1 | | | | 1 | |
Corporate | | | 1 | | | | 3 | |
| | | | |
| | |
| Call/Maturity Schedule3 | | | |
Calendar Year Ended December 31, | | | | |
2016 | | | 1 | % |
2017 | | | 1 | |
2018 | | | 63 | |
2019 | | | 11 | |
2020 | | | 21 | |
| | 3 | | Scheduled maturity dates and/or bonds that are subject to potential calls by issuers over the next five years. |
| | * | | Excludes short-term securities. |
| | | | | | | | |
| Credit Quality Allocation1 | | 6/30/16 | | | 12/31/15 | |
AAA/Aaa | | | 15 | % | | | 15 | % |
AA/Aa | | | 61 | | | | 62 | |
A | | | 12 | | | | 10 | |
BBB/Baa | | | 4 | | | | 5 | |
BB/Ba | | | 1 | | | | — | |
N/R2 | | | 7 | | | | 8 | |
| | 1 | | For financial reporting purposes, credit quality ratings shown above reflect the highest rating assigned by either S&P or Moody’s if ratings differ. These rating agencies are independent, nationally recognized statistical rating organizations and are widely used. Investment grade ratings are credit ratings of BBB/Baa or higher. Below investment grade ratings are credit ratings of BB/Ba or lower. Investments designated N/R are not rated by either rating agency. Unrated investments do not necessarily indicate low credit quality. Credit quality ratings are subject to change. |
| | 2 | | The investment adviser evaluates the credit quality of unrated investments based upon certain factors including, but not limited to, credit ratings for similar investments and financial analysis of sectors and individual investments. Using this approach, the investment adviser has deemed certain of these unrated securities as investment grade quality. As of June 30, 2016 and December 31, 2015 the market value of unrated securities deemed by the investment adviser to be investment grade represents 5% and 1%, respectively, of the Trust’s total investments. |
| | | | | | |
| | | | | | | |
| | SEMI-ANNUAL REPORT | | JUNE 30, 2016 | | 11 |
| | |
Schedule of Investments June 30, 2016 (Unaudited) | | BlackRock California Municipal 2018 Term Trust (BJZ) (Percentages shown are based on Net Assets) |
| | | | | | | | |
| Municipal Bonds | | Par (000) | | | Value | |
California — 96.5% | | | | | | | | |
Corporate — 4.4% | |
California Pollution Control Financing Authority, RB, Mandatory Put Bonds, Republic Services, Inc. Project, Series B, AMT, 5.25%, 6/01/23 (a) | | $ | 2,020 | | | $ | 2,137,423 | |
California Pollution Control Financing Authority, Refunding RB, Mandatory Put Bonds, Republic Services, Inc. Project, Series C, AMT,
5.25%, 6/01/23 (a) | | | 2,030 | | | | 2,148,004 | |
| | | | | | | | |
| | | | | | | | 4,285,427 | |
County/City/Special District/School District — 23.2% | | | | | | | | |
City & County of San Francisco California, GO, Refunding, Series R-1, 5.00%, 6/15/18 | | | 1,640 | | | | 1,782,352 | |
City of Vista California, COP, Refunding, Community Projects (NPFGC) (b): | | | | | | | | |
4.75%, 5/01/17 | | | 1,115 | | | | 1,154,137 | |
5.00%, 5/01/17 | | | 1,000 | | | | 1,037,180 | |
Fontana Public Finance Authority California, Refunding, Tax Allocation Bonds, North Fontana Redevelopment Project, Series A (AGM), 5.25%, 9/01/18 | | | 3,395 | | | | 3,409,021 | |
Golden Empire Schools Financing Authority, Refunding RB, Kern High School District Projects,
0.91%, 5/01/17 (a) | | | 3,000 | | | | 2,999,100 | |
Irvine Unified School District California, Refunding, Special Tax Bonds, Community Facilities District No. 86-1 (AGM), 5.25%, 9/01/18 | | | 5,000 | | | | 5,451,800 | |
Jurupa Public Financing Authority, Refunding, Special Tax Bonds, Series A, 4.00%, 9/01/18 | | | 380 | | | | 404,172 | |
Lathrop Financing Authority, RB, Water Supply Project, 5.80%, 6/01/21 | | | 470 | | | | 480,664 | |
Lodi Unified School District California, GO, Refunding (AGM), 4.00%, 8/01/18 | | | 1,000 | | | | 1,068,760 | |
Los Angeles Community College District California, GO, Election of 2001, Series E-1, 4.00%, 8/01/18 | | | 200 | | | | 214,054 | |
Los Angeles Unified School District California, GO, Election of 2004, Series H (AGM),
5.00%, 7/01/17 (b) | | | 300 | | | | 313,362 | |
Los Banos Unified School District California, GO, Election of 2008 (AGM), 5.00%, 8/01/17 (b) | | | 475 | | | | 502,845 | |
Oakland Unified School District/Alameda County, GO, Refunding, 5.00%, 8/01/18 | | | 900 | | | | 970,308 | |
Placentia-Yorba Linda Unified School District, COP, Refunding Series A (AGM), 4.00%, 10/01/18 | | | 160 | | | | 171,779 | |
San Marcos Unified School District California, GO, CAB (c): | |
0.00%, 8/01/17 | | | 385 | | | | 380,565 | |
0.00%, 8/01/18 | | | 500 | | | | 487,220 | |
Santa Clara Unified School District California, GO, Election of 2004, Series A, 5.00%, 7/01/18 | | | 1,690 | | | | 1,837,807 | |
| | | | | | | | |
| | | | | | | | 22,665,126 | |
| | | | | | | | |
| Municipal Bonds | | Par (000) | | | Value | |
California (continued) | | | | | | | | |
Education — 10.6% | | | | | | | | |
California Municipal Finance Authority, Refunding RB, Series A: | | | | | | | | |
3.00%, 1/01/17 | | $ | 425 | | | $ | 427,541 | |
3.00%, 1/01/18 | | | 440 | | | | 446,873 | |
University of California, Refunding RB: | | | | | | | | |
General, Series AB, 5.00%, 5/15/19 | | | 2,500 | | | | 2,807,350 | |
Series A, 4.00%, 11/01/18 | | | 3,000 | | | | 3,233,070 | |
Series A, 5.00%, 11/01/18 | | | 900 | | | | 990,756 | |
Series AR, 3.00%, 5/15/18 | | | 230 | | | | 240,387 | |
Series S, 5.00%, 5/15/18 (d) | | | 5 | | | | 5,412 | |
Series S, 5.00%, 5/15/18 | | | 1,995 | | | | 2,160,166 | |
| | | | | | | | |
| | | | | | | | 10,311,555 | |
Health — 11.9% | | | | | | | | |
California Health Facilities Financing Authority, RB, Scripps Health, Series A, 5.00%, 10/01/18 | | | 750 | | | | 822,038 | |
California Health Facilities Financing Authority, Refunding RB: | | | | | | | | |
Adventist Health System/West, Series A, 4.00%, 3/01/18 | | | 1,000 | | | | 1,052,220 | |
Sutter Health, Series D, 5.00%, 8/15/18 | | | 515 | | | | 563,034 | |
California Statewide Communities Development Authority, RB, Kaiser Permanente, Series E-1, 5.00%, 4/01/44 (a) | | | 4,700 | | | | 4,867,226 | |
California Statewide Communities Development Authority, Refunding RB: | | | | | | | | |
CHF Irvine LLC, 5.00%, 5/15/18 | | | 1,000 | | | | 1,077,620 | |
Episcopal Communities & Services, 5.00%, 5/15/18 | | | 300 | | | | 322,161 | |
Huntington Memorial Hospital, Series B, 5.00%, 7/01/18 | | | 500 | | | | 542,370 | |
Rady Children’s Hospital, Series A, 4.00%, 8/15/18 | | | 1,000 | | | | 1,068,880 | |
County of Los Angeles California Redevelopment Authority, Refunding, Tax Allocation Bonds, South Gate Redevelopment Project No. 1 and Claremont Consolidated Redevelopment Project, Series A, 4.00%, 9/01/18 | | | 850 | | | | 910,086 | |
Union City Community Redevelopment Agency, Refunding, Tax Allocation Bonds, Series A, 4.00%, 10/01/18 | | | 350 | | | | 376,135 | |
| | | | | | | | |
| | | | | | | | 11,601,770 | |
Housing — 1.2% | |
California HFA, RB, Series A (Fannie Mae): | | | | | | | | |
3.20%, 8/01/18 | | | 390 | | | | 407,378 | |
3.50%, 2/01/19 | | | 750 | | | | 795,435 | |
| | | | | | | | |
| | | | | | | | 1,202,813 | |
| | | | | | | | | | |
| AGC | | Assured Guarantee Corp. | | COP | | Certificates of Participation | | ISD | | Independent School District |
| AGM | | Assured Guaranty Municipal Corp. | | EDA | | Economic Development Authority | | LRB | | Lease Revenue Bonds |
| AMBAC | | American Municipal Bond Assurance Corp. | | GAN | | Grant Anticipation Notes | | NPFGC | | National Public Finance Guarantee Corp. |
| AMT | | Alternative Minimum Tax (subject to) | | GO | | General Obligation Bonds | | PSF-GTD | | Permanent School Fund Guaranteed |
| ARB | | Airport Revenue Bonds | | HFA | | Housing Finance Agency | | RB | | Revenue Bonds |
| CAB | | Capital Appreciation Bonds | | IDA | | Industrial Development Authority | | S/F | | Single-Family |
See Notes to Financial Statements.
| | | | | | |
| | | | | | | |
| 12 | | SEMI-ANNUAL REPORT | | JUNE 30, 2016 | | |
| | |
Schedule of Investments (continued) | | BlackRock California Municipal 2018 Term Trust (BJZ) |
| | | | | | | | |
| Municipal Bonds | | Par (000) | | | Value | |
California (continued) | | | | | | | | |
State — 9.6% | |
State of California, GO, Refunding: | | | | | | | | |
5.00%, 9/01/18 | | $ | 5,900 | | | $ | 6,451,001 | |
5.00%, 11/01/20 | | | 20 | | | | 20,080 | |
Series A, 5.00%, 7/01/18 (d) | | | 720 | | | | 783,274 | |
Veterans, Series BZ, AMT (NPFGC),
5.35%, 12/01/21 | | | 10 | | | | 10,031 | |
State of California Public Works Board, Refunding RB, California Community Colleges, Series A,
5.00%, 12/01/17 | | | 2,020 | | | | 2,051,673 | |
| | | | | | | | |
| | | | | | | | 9,316,059 | |
Transportation — 8.7% | |
City of Long Beach California, RB, Series A,
5.00%, 5/15/18 | | | 500 | | | | 541,200 | |
Port of Oakland California, Refunding RB, Series O, AMT: | | | | | | | | |
5.00%, 5/01/18 | | | 4,280 | | | | 4,607,762 | |
5.00%, 5/01/19 | | | 3,000 | | | | 3,344,820 | |
| | | | | | | | |
| | | | | | | | 8,493,782 | |
Utilities — 26.9% | | | | | | | | |
California State Department of Water Resources, Refunding RB: | | | | | | | | |
Series H, 5.00%, 5/01/18 (b) | | | 2,500 | | | | 2,702,150 | |
Series H, 5.00%, 5/01/22 | | | 1,000 | | | | 1,078,810 | |
Series L, 5.00%, 5/01/19 | | | 2,000 | | | | 2,243,680 | |
Series N, 5.00%, 5/01/19 | | | 3,500 | | | | 3,926,440 | |
City of Riverside California Sewer Revenue, Refunding RB, Series A, 4.00%, 8/01/18 | | | 1,000 | | | | 1,068,320 | |
City of San Francisco California Public Utilities Commission Water Revenue, Refunding RB, Series D, 3.00%, 11/01/18 | | | 2,000 | | | | 2,108,600 | |
City of Tulare California Sewer Revenue, Refunding RB (AGM), 4.00%, 11/15/18 | | | 315 | | | | 339,110 | |
County of Los Angeles California Sanitation Districts Financing Authority, Refunding RB, Series A,
3.00%, 10/01/18 | | | 3,000 | | | | 3,162,210 | |
Cucamonga Valley California Water District, Refunding RB, Series A (AGM): | | | | | | | | |
4.00%, 9/01/18 | | | 325 | | | | 348,338 | |
4.00%, 9/01/19 | | | 325 | | | | 358,088 | |
| | | | | | | | |
| Municipal Bonds | | Par (000) | | | Value | |
California (continued) | | | | | | | | |
Utilities (continued) | | | | | | | | |
Los Angeles California Department of Water & Power, RB, Series B, 5.00%, 7/01/18 | | $ | 955 | | | $ | 1,039,327 | |
Los Angeles California Department of Water & Power, Refunding RB, Power System, Series A,
5.00%, 7/01/19 | | | 2,500 | | | | 2,820,475 | |
Sacramento California Municipal Utility District, Refunding RB, Series X, 5.00%, 8/15/18 | | | 400 | | | | 437,040 | |
Southern California Public Power Authority, Refunding RB, Canyon Power, Series A, 4.00%, 7/01/18 | | | 685 | | | | 732,149 | |
Stockton East Water District California, COP, Refunding, Series B (NPFGC), 0.00%, 4/01/19 (c) | | | 4,590 | | | | 3,915,040 | |
| | | | | | | | |
| | | | | | | | 26,279,777 | |
| Total Municipal Bonds in California | | | | | | | 94,156,309 | |
| | | | | | | | |
Guam — 0.3% | | | | | | | | |
Utilities — 0.3% | |
Guam Power Authority, Refunding RB, Series A (AGM), 5.00%, 10/01/19 | | | 240 | | | | 270,890 | |
| | | | | | | | |
U.S. Virgin Islands — 0.9% | | | | | | | | |
State — 0.9% | | | | | | | | |
Virgin Islands Public Finance Authority, RB, Series A, 5.00%, 10/01/16 | | | 930 | | | | 939,077 | |
Total Long-Term Investments (Cost — 92,520,380) — 97.7% | | | | 95,366,276 | |
| | | | | | | | |
| | | | | | | | | |
| | |
| Short-Term Securities | | Shares | | | | |
BlackRock Liquidity Funds, MuniCash, Institutional Class, 0.26%, (e)(f) | | | 1,439,683 | | | | 1,439,683 | |
Total Short-Term Securities (Cost — $1,439,683) — 1.5% | | | | 1,439,683 | |
| Total Investments (Cost — $93,960,063) — 99.2% | | | | 96,805,959 | |
| Other Assets Less Liabilities — 0.8% | | | | 741,465 | |
| | | | | | | | |
Net Assets — 100.0% | | | $ | 97,547,424 | |
| | | | | | | | |
|
| Notes to Schedule of Investments |
| (a) | | Variable rate security. Rate as of period end. |
| (b) | | U.S. Government securities, held in escrow, are used to pay interest on this security, as well as to retire the bond in full at the date indicated, typically at a premium to par. |
| (d) | | Security is collateralized by municipal bonds or U.S. Treasury obligations. |
| (e) | | During the six months ended June 30, 2016, investments in issuers considered to be affiliates of the Trust for purposes of Section 2(a)(3) of the Investment Company Act of 1940, as amended, were as follows: |
| | | | | | | | | | | | | | | | | | | | |
| Affiliate | | Shares Held
at December 31,
2015 | | | Net
Activity | | | Shares Held
at June 30,
2016 | | | Value at
June 30,
2016 | | | Income | |
BlackRock Liquidity Funds, MuniCash, Institutional Class | | | — | | | | 1,439,683 | | | | 1,439,683 | | | $ | 1,439,683 | | | $ | 352 | |
BIF California Municipal Money Fund | | | 1,076,590 | | | | (1,076,590 | ) | | | — | | | | — | | | | 2 | |
| |
Total | | | | | | | | | | | | | | $ | 1,439,683 | | | $ | 354 | |
| | | | | | | | | | | | | | | | |
See Notes to Financial Statements.
| | | | | | |
| | | | | | | |
| | SEMI-ANNUAL REPORT | | JUNE 30, 2016 | | 13 |
| | |
Schedule of Investments (concluded) | | BlackRock California Municipal 2018 Term Trust (BJZ) |
| (f) | | Current yield as of period end. |
For Trust compliance purposes, the Trust’s sector classifications refer to any one or more of the sector sub-classifications used by one or more widely recognized market indexes or rating group indexes, and/or as defined by the investment adviser. These definitions may not apply for purposes of this report, which may combine such sector sub-classifications for reporting ease.
|
| Fair Value Hierarchy as of Period End |
Various inputs are used in determining the fair value of investments. For information about the Trust’s policy regarding valuation of investments, refer to the Notes to Financial Statements.
The following table summarizes the Trust’s investments categorized in the disclosure hierarchy:
| | | | | | | | | | | | | | | | |
| | | Level 1 | | | Level 2 | | | Level 3 | | | Total | |
Assets: | | | | | | | | | | | | | | | | |
| Investments: | | | | | | | | | | | | | | | | |
Long-Term Investments1 | | | — | | | $ | 95,366,276 | | | | — | | | $ | 95,366,276 | |
Short-Term Securities | | $ | 1,439,683 | | | | — | | | | — | | | | 1,439,683 | |
| | | | |
Total | | $ | 1,439,683 | | | $ | 95,366,276 | | | | — | | | $ | 96,805,959 | |
| | | | |
1 See above Schedule of Investments for values in each sector. | |
During the six months ended June 30, 2016, there were no transfers between levels.
See Notes to Financial Statements.
| | | | | | |
| | | | | | | |
| 14 | | SEMI-ANNUAL REPORT | | JUNE 30, 2016 | | |
| | |
Schedule of Investments June 30, 2016 (Unaudited) | | BlackRock Municipal 2018 Term Trust (BPK) (Percentages shown are based on Net Assets) |
| | | | | | | | |
| Municipal Bonds | | Par
(000) | | | Value | |
Alabama — 2.9% | | | | | | | | |
Alabama 21st Century Authority, Refunding RB, Series A, 5.00%, 6/01/18 | | $ | 500 | | | $ | 538,205 | |
Alabama Federal Aid Highway Finance Authority, RB, GAN, Garvee, 5.00%, 9/01/18 | | | 6,000 | | | | 6,545,340 | |
| | | | | | | | |
| | | | | | | | 7,083,545 | |
Alaska — 2.6% | | | | | | | | |
City of Valdez Alaska, Refunding RB,
5.00%, 1/01/18 | | | 6,000 | | | | 6,337,620 | |
California — 6.4% | | | | | | | | |
California Health Facilities Financing Authority, RB, Sutter Health, Series B, 5.00%, 8/15/19 | | | 2,500 | | | | 2,835,875 | |
California Pollution Control Financing Authority, Refunding RB, Mandatory Put Bonds, Republic Services, Inc. Project, Series C, AMT,
5.25%, 6/01/23 (a) | | | 4,055 | | | | 4,290,717 | |
Golden Empire Schools Financing Authority, Refunding RB, Kern High School District Projects,
0.91%, 5/01/17 (a) | | | 1,710 | | | | 1,709,487 | |
Los Angeles Regional Airports Improvement Corp., Refunding RB, Facilities Lease, LAXFuel Corp., AMT: | | | | | | | | |
5.00%, 1/01/17 | | | 450 | | | | 459,878 | |
5.00%, 1/01/18 | | | 930 | | | | 988,376 | |
Los Angeles Unified School District California, GO, Series I, 5.00%, 7/01/20 | | | 3,750 | | | | 4,227,150 | |
Oakland Unified School District/Alameda County, GO, Refunding, 5.00%, 8/01/18 | | | 1,000 | | | | 1,078,120 | |
| | | | | | | | |
| | | | | | | | 15,589,603 | |
Colorado — 1.0% | | | | | | | | |
Colorado Educational & Cultural Facilities Authority, Refunding RB, Peak to Peak Charter School,
4.00%, 8/15/18 | | | 175 | | | | 185,391 | |
Colorado Health Facilities Authority, Refunding RB, Evangelical Lutheran Good Samaritan Society Project: | | | | | | | | |
4.00%, 12/01/17 | | | 515 | | | | 532,309 | |
4.00%, 12/01/18 | | | 540 | | | | 569,533 | |
Park Creek Metropolitan District Colorado, Refunding RB, Senior Limited Property Tax, 4.00%, 12/01/18 | | | 1,000 | | | | 1,067,930 | |
| | | | | | | | |
| | | | | | | | 2,355,163 | |
Delaware — 0.3% | | | | | | | | |
Delaware State Economic Development Authority, RB, State University Project, 5.00%, 10/01/18 | | | 735 | | | | 801,091 | |
Florida — 5.4% | | | | | | | | |
City of Miami Beach Florida, RB, 5.00%, 9/01/18 | | | 875 | | | | 954,266 | |
County of Broward Florida Airport System Revenue, Refunding RB, Series P-1, AMT, 5.00%, 10/01/18 | | | 3,930 | | | | 4,283,857 | |
County of Broward Florida School Board, COP, Series A (AGM), 5.25%, 7/01/18 (b) | | | 1,250 | | | | 1,363,437 | |
County of Indian River Florida School Board, COP, Refunding, Series A, 5.00%, 7/01/18 | | | 600 | | | | 650,472 | |
County of Miami-Dade Florida, Refunding RB, Series A, AMT, 5.00%, 10/01/18 | | | 2,000 | | | | 2,183,140 | |
Miami Beach Health Facilities Authority, Refunding RB, Mount Sinai Medical Center, 4.00%, 11/15/18 | | | 250 | | | | 266,598 | |
Miami-Dade County School Board Foundation, Inc, COP, Refunding Series A, 5.00%, 5/01/18 | | | 1,500 | | | | 1,615,740 | |
| | | | | | | | |
| Municipal Bonds | | Par
(000) | | | Value | |
Florida (continued) | | | | | | | | |
Pine Island Community Development District, RB,
5.30%, 11/01/10 (c)(d) | | $ | 400 | | | $ | 224,292 | |
Stevens Plantation Community Development District, Special Assessment Bonds, Series B,
6.38%, 5/01/13 (c)(d) | | | 2,270 | | | | 1,588,410 | |
| | | | | | | | |
| | | | | | | | 13,130,212 | |
Guam — 0.3% | | | | | | | | |
Guam Power Authority, Refunding RB, Series A (AGM), 5.00%, 10/01/19 | | | 620 | | | | 699,800 | |
Hawaii — 0.2% | | | | | | | | |
Hawaii State Department of Budget & Finance, Refunding RB, Special Purpose Senior Living Revenue, 5.00%, 11/15/18 | | | 370 | | | | 396,326 | |
Illinois — 6.7% | | | | | | | | |
Chicago Transit Authority, Refunding RB,
5.00%, 6/01/18 | | | 1,000 | | | | 1,069,020 | |
Counties of Du Page & Will Illinois Community School District No. 204 Indian Prairie, GO, Refunding Series B, 3.00%, 12/30/18 | | | 1,935 | | | | 2,029,854 | |
Fox Valley Park District, GO, Series A,
5.00%, 12/15/18 | | | 1,725 | | | | 1,903,348 | |
Illinois Finance Authority, Refunding RB: | | | | | | | | |
University Medical Center Rush, Series A,
5.00%, 11/15/18 | | | 1,000 | | | | 1,093,640 | |
Central DuPage Health, Series B, 5.00%, 11/01/18 | | | 2,290 | | | | 2,499,283 | |
Peoples Gas Light and Coke Co. Project, Series B, 1.88%, 2/01/33 (a) | | | 1,000 | | | | 1,024,410 | |
Railsplitter Tobacco Settlement Authority, RB,
5.00%, 6/01/18 | | | 1,290 | | | | 1,386,737 | |
State of Illinois, GO (AGM), 5.00%, 4/01/18 | | | 465 | | | | 486,423 | |
State of Illinois, RB, Build Illinois, Series B: | | | | | | | | |
5.00%, 6/15/18 (e) | | | 355 | | | | 384,958 | |
Unrefunded Balance, 5.00%, 6/15/18 | | | 1,645 | | | | 1,777,422 | |
State of Illinois, GO, Refunding, 5.00%, 8/01/18 | �� | | 2,500 | | | | 2,672,050 | |
| | | | | | | | |
| | | | | | | | 16,327,145 | |
Indiana — 2.2% | | | | | | | | |
Indiana Finance Authority, RB, Ohio River Bridges East End Crossing Project, Series B, AMT,
5.00%, 1/01/19 | | | 1,715 | | | | 1,750,672 | |
Indiana State Municipal Power Agency, Refunding RB, Series A, 5.00%, 1/01/19 | | | 875 | | | | 968,415 | |
Indianapolis Airport Authority, Refunding RB, Special Facilities, FedEx Corp. Project, AMT,
5.10%, 1/15/17 (e) | | | 2,500 | | | | 2,557,975 | |
| | | | | | | | |
| | | | | | | | 5,277,062 | |
Iowa — 1.1% | | | | | | | | |
Iowa Finance Authority, Refunding RB, Midwestern Disaster Area, Iowa Fertilizer Co. Project,
5.00%, 12/01/19 | | | 1,850 | | | | 1,924,721 | |
University of Iowa, Refunding RB, Series S,
5.00%, 11/01/18 | | | 655 | | | | 720,035 | |
| | | | | | | | |
| | | | | | | | 2,644,756 | |
Kansas — 1.1% | | | | | | | | |
Kansas Development Finance Authority, Refunding RB, Adventist Health, 5.00%, 11/15/18 | | | 2,500 | | | | 2,745,100 | |
See Notes to Financial Statements.
| | | | | | |
| | | | | | | |
| | SEMI-ANNUAL REPORT | | JUNE 30, 2016 | | 15 |
| | |
Schedule of Investments (continued) | | BlackRock Municipal 2018 Term Trust (BPK) |
| | | | | | | | |
| Municipal Bonds | | Par
(000) | | | Value | |
Kentucky — 3.4% | | | | | | | | |
County of Kenton Kentucky School District Finance Corp., Refunding RB, 2.50%, 6/01/18 | | $ | 3,210 | | | $ | 3,306,172 | |
County of Louisville & Jefferson Kentucky Metropolitan Government, Refunding RB, Catholic Health Initiatives, Series A, 5.00%, 12/01/18 | | | 1,755 | | | | 1,924,006 | |
Kentucky Housing Corp., RB, S/F Housing, Series C, AMT, 4.63%, 7/01/22 | | | 3,195 | | | | 3,205,448 | |
| | | | | | | | |
| | | | | | | | 8,435,626 | |
Maryland — 3.6% | | | | | | | | |
Maryland Health & Higher Educational Facilities Authority, Refunding RB: | | | | | | | | |
Charlestown Community, 5.00%, 1/01/19 | | | 1,685 | | | | 1,851,192 | |
Meritas Medical Center, 5.00%, 7/01/18 | | | 400 | | | | 431,896 | |
University of Maryland Medical System,
5.00%, 7/01/18 | | | 1,000 | | | | 1,078,700 | |
Maryland State Transportation Authority, Refunding RB, Baltimore/Washington Thurgood Marshall Airport Project, Series B, AMT, 5.00%, 3/01/19 | | | 5,000 | | | | 5,529,250 | |
| | | | | | | | |
| | | | | | | | 8,891,038 | |
Michigan — 3.9% | | | | | | | | |
Kalamazoo Hospital Finance Authority, Refunding RB, Bronson Methodist Hospital (AGM),
5.00%, 5/15/18 | | | 2,025 | | | | 2,170,759 | |
Michigan State Finance Authority, Refunding RB, AMT: | | | | | | | | |
5.00%, 11/01/17 | | | 2,275 | | | | 2,375,032 | |
5.00%, 11/01/18 | | | 2,100 | | | | 2,257,332 | |
Michigan State Hospital Finance Authority, Refunding RB, Oakwood Obligation Group, Series A,
5.00%, 7/15/17 (b) | | | 1,000 | | | | 1,046,050 | |
Michigan State Housing Development Authority, Refunding RB, Series B, 4.15%, 4/01/18 | | | 1,000 | | | | 1,050,110 | |
Saginaw Valley State University, RB, Series A,
5.00%, 7/01/18 | | | 600 | | | | 649,092 | |
| | | | | | | | |
| | | | | | | | 9,548,375 | |
Mississippi — 0.4% | | | | | | | | |
Mississippi Development Bank, Refunding RB,
5.00%, 3/01/18 | | | 1,000 | | | | 1,063,930 | |
Missouri — 0.8% | | | | | | | | |
City of Kansas City Missouri, Refunding ARB, AMT, Series A, 5.00%, 9/01/18 | | | 1,750 | | | | 1,897,857 | |
Nebraska — 1.6% | | | | | | | | |
Central Plains Energy Project, RB, Gas Project
(Project No. 3), 5.00%, 9/01/17 | | | 2,330 | | | | 2,431,355 | |
Public Power Generation Agency, RB, Whelan Energy Center, Series 2-A (AGC), 5.00%, 1/01/17 (b) | | | 1,500 | | | | 1,533,000 | |
| | | | | | | | |
| | | | | | | | 3,964,355 | |
Nevada — 4.0% | | | | | | | | |
City of Las Vegas Nevada, Special Assessment Bonds, Summerlin Area, 5.35%, 6/01/17 | | | 450 | | | | 456,291 | |
County of Clark Nevada, Refunding, Special Assessment Bonds, Improvement District No. 142, Mountain’s Edge, 4.00%, 8/01/18 | | | 3,715 | | | | 3,845,954 | |
Director of the State of Nevada Department of Business & Industry, RB, Mandatory Put Bonds, Republic Services, Inc. Project, AMT,
5.63%, 12/01/26 (a) | | | 5,120 | | | | 5,481,830 | |
| | | | | | | | |
| | | | | | | | 9,784,075 | |
| | | | | | | | |
| Municipal Bonds | | Par
(000) | | | Value | |
New Hampshire — 2.1% | | | | | | | | |
New Hampshire State Turnpike System, RB, Series A, 5.00%, 10/01/18 | | $ | 4,740 | | | $ | 5,191,912 | |
New Jersey — 13.9% | | | | | | | | |
County of Atlantic New Jersey, Refunding,
3.00%, 10/01/18 (f) | | | 1,855 | | | | 1,934,876 | |
New Jersey EDA, Refunding RB: | | | | | | | | |
Cigarette Tax Revenue, 5.00%, 6/15/18 | | | 5,000 | | | | 5,294,100 | |
Lions Gate Project, 3.25%, 1/01/18 | | | 250 | | | | 253,600 | |
New Jersey Educational Facilities Authority, RB, Seton Hall University, Series D, 5.00%, 7/01/18 | | | 320 | | | | 344,589 | |
New Jersey Educational Facilities Authority, Refunding RB, University of Medicine & Dentistry, Series B,
6.25%, 12/01/18 (e) | | | 2,500 | | | | 2,826,025 | |
New Jersey Health Care Facilities Financing Authority, Refunding RB: | | | | | | | | |
AHS Hospital Corp., 5.00%, 7/01/18 | | | 850 | | | | 919,725 | |
AtlantiCare Regional Medical Center,
5.00%, 7/01/17 (b) | | | 1,500 | | | | 1,564,965 | |
Barnabas Health, Series A, 5.00%, 7/01/18 | | | 2,000 | | | | 2,153,260 | |
Princeton HealthCare System, 5.00%, 7/01/18 | | | 1,620 | | | | 1,748,174 | |
New Jersey Higher Education Student Assistance Authority, RB, Series 1A, AMT: | | | | | | | | |
5.00%, 12/01/17 | | | 460 | | | | 484,178 | |
5.00%, 12/01/18 | | | 2,000 | | | | 2,168,000 | |
New Jersey State Housing & Mortgage Finance Agency, Refunding RB, S/F Housing, Series T, AMT,
4.55%, 10/01/22 | | | 1,705 | | | | 1,737,054 | |
New Jersey State Turnpike Authority, Refunding RB, Series G, 5.00%, 1/01/18 | | | 1,350 | | | | 1,436,211 | |
New Jersey Transportation Trust Fund Authority, RB: | | | | | | | | |
Series B, 5.00%, 6/15/18 | | | 2,000 | | | | 2,126,440 | |
Transportation Program, Series AA, 5.00%, 6/15/18 | | | 2,000 | | | | 2,126,440 | |
Transportation System, Series A, 5.75%, 6/15/18 | | | 1,320 | | | | 1,422,445 | |
Transportation System, Series A (AMBAC),
5.75%, 6/15/18 | | | 2,070 | | | | 2,230,653 | |
Newark Housing Authority, RB, South Ward Police Facility (AGC), 4.50%, 12/01/18 | | | 2,785 | | | | 2,904,226 | |
South Jersey Transportation Authority LLC, Refunding RB, Series A, 5.00%, 11/01/20 | | | 200 | | | | 225,118 | |
| | | | | | | | |
| | | | | | | | 33,900,079 | |
New York — 5.9% | | | | | | | | |
City of New York New York Industrial Development Agency, ARB, American Airlines, Inc., JFK International Airport Project, AMT, Series B,
2.00%, 8/01/28 (a) | | | 1,530 | | | | 1,528,440 | |
Metropolitan Transportation Authority, Refunding RB: | | | | | | | | |
Series A, 5.00%, 11/15/18 | | | 1,000 | | | | 1,102,540 | |
Series F, 4.00%, 11/15/18 | | | 200 | | | | 215,506 | |
New York State Dormitory Authority, RB, General Purpose, Series A, 5.00%, 3/15/18 | | | 6,500 | | | | 6,984,575 | |
New York State Dormitory Authority, Refunding RB, Series A, 3.00%, 7/01/18 | | | 440 | | | | 460,451 | |
New York Transportation Development Corp., Refunding RB, American Airlines, Inc., AMT,
5.00%, 8/01/18 | | | 1,500 | | | | 1,594,320 | |
Port Authority of New York & New Jersey, ARB, JFK International Air Terminal LLC Project,
5.00%, 12/01/20 | | | 1,200 | | | | 1,375,884 | |
See Notes to Financial Statements.
| | | | | | |
| | | | | | | |
| 16 | | SEMI-ANNUAL REPORT | | JUNE 30, 2016 | | |
| | |
Schedule of Investments (continued) | | BlackRock Municipal 2018 Term Trust (BPK) |
| | | | | | | | |
| Municipal Bonds | | Par
(000) | | | Value | |
New York (continued) | | | | | | | | |
State of New York Dormitory Authority, Refunding RB, Original Regional Medical Center,
5.00%, 12/01/17 (g) | | $ | 1,000 | | | $ | 1,055,640 | |
| | | | | | | | |
| | | | | | | | 14,317,356 | |
North Carolina — 0.9% | | | | | | | | |
North Carolina HFA, Refunding RB, Series 28-A, AMT, 4.65%, 7/01/23 | | | 2,170 | | | | 2,196,778 | |
Pennsylvania — 11.6% | | | | | | | | |
Altoona City Authority, Refunding RB,
5.25%, 11/01/18 | | | 2,500 | | | | 2,741,025 | |
Chester County Health & Education Facilities Authority, Refunding RB: | | | | | | | | |
3.00%, 12/01/17 | | | 585 | | | | 595,203 | |
4.00%, 12/01/18 | | | 805 | | | | 840,307 | |
Cumberland County Municipal Authority, Refunding RB: | | | | | | | | |
4.00%, 1/01/18 | | | 1,380 | | | | 1,439,906 | |
5.75%, 1/01/19 (e) | | | 2,135 | | | | 2,398,054 | |
5.75%, 1/01/19 | | | 240 | | | | 267,475 | |
Lancaster Industrial Development Authority, Refunding RB, Garden Spot Village Project, 5.00%, 5/01/17 | | | 1,175 | | | | 1,201,872 | |
Montgomery County Industrial Development Authority, Refunding RB, 5.00%, 1/15/18 | | | 1,000 | | | | 1,053,570 | |
Pennsylvania Economic Development Financing Authority, RB: | | | | | | | | |
PA Bridges Finco LP, AMT, 5.00%, 12/31/18 | | | 2,100 | | | | 2,301,411 | |
University of Pennsylvania Medical Center,
5.00%, 3/15/18 | | | 750 | | | | 804,765 | |
Waste Management, Inc. Project,
1.55%, 12/01/33 (a) | | | 5,000 | | | | 5,050,650 | |
Pennsylvania Economic Development Financing Authority, Refunding RB, Amtrak Project, Series A, AMT, 3.00%, 11/01/18 | | | 1,000 | | | | 1,035,300 | |
Pennsylvania Higher Educational Facilities Authority, RB, Shippensburg University Student Services, Inc., Student Housing Project: | | | | | | | | |
4.00%, 10/01/17 | | | 275 | | | | 282,282 | |
4.00%, 10/01/18 | | | 560 | | | | 584,035 | |
Pennsylvania Higher Educational Facilities Authority, Refunding RB, Drexel University, Series A,
5.00%, 5/01/18 | | | 1,000 | | | | 1,073,470 | |
Pennsylvania IDA, Refunding RB, Economic Development, 5.00%, 7/01/18 | | | 1,500 | | | | 1,621,485 | |
Pennsylvania Turnpike Commission, RB, Sub-Series A (AGC), 5.00%, 6/01/19 (b) | | | 1,000 | | | | 1,122,130 | |
Philadelphia Gas Works Co., Refunding RB,
4.00%, 8/01/18 | | | 1,790 | | | | 1,905,437 | |
State Public School Building Authority, RB, Community College of Allegheny County Project (AGM),
5.00%, 7/15/18 | | | 900 | | | | 970,245 | |
West Chester Area School District, GO, Refunding, Series AA, 5.00%, 5/15/18 | | | 1,000 | | | | 1,082,110 | |
| | | | | | | | |
| | | | | | | | 28,370,732 | |
Tennessee — 1.2% | | | | | | | | |
Metropolitan Government Nashville & Davidson County Health & Educational Facilities Board, Refunding RB, Lipscomb University Project, Series A, 4.00%, 10/01/18 | | | 260 | | | | 276,637 | |
| | | | | | | | |
| Municipal Bonds | | Par
(000) | | | Value | |
Tennessee (continued) | | | | | | | | |
Tennessee Energy Acquisition Corp., RB: | | | | | | | | |
Series A, 5.25%, 9/01/18 | | $ | 1,040 | | | $ | 1,128,983 | |
Series C, 5.00%, 2/01/18 | | | 1,500 | | | | 1,592,700 | |
| | | | | | | | |
| | | | | | | | 2,998,320 | |
Texas — 12.1% | | | | | | | | |
Birdville ISD Texas, GO, Refunding, CAB (PSF-GTD), 0.00%, 2/15/18 (h) | | | 1,615 | | | | 1,596,250 | |
Central Texas Regional Mobility Authority, Refunding RB, Senior Lien, 5.75%, 1/01/18 (e) | | | 750 | | | | 807,345 | |
City of Dallas Texas, GO, Refunding, 5.00%, 2/15/18 | | | 2,500 | | | | 2,675,700 | |
City of Dallas Texas, Refunding RB, Civic Center Convention Complex (AGC), 5.00%, 8/15/21 | | | 2,500 | | | | 2,783,675 | |
City of Houston Texas, Refunding RB, Sub Lien, Series B, 5.00%, 7/01/18 | | | 1,000 | | | | 1,080,570 | |
Eagle Mountain & Saginaw ISD, GO, Refunding,
5.00%, 8/15/18 | | | 150 | | | | 163,689 | |
Houston ISD Public Facilities Authority, RB,
5.00%, 9/15/18 | | | 5,000 | | | | 5,465,350 | |
Lower Colorado River Authority, Refunding RB, LCRA Transmission, Series B, 5.00%, 5/15/18 | | | 5,000 | | | | 5,399,800 | |
New Hope Cultural Education Facilities Corp., RB, Stephenville LLC Tarleton State University Project, Series A: | | | | | | | | |
4.00%, 4/01/17 | | | 160 | | | | 163,016 | |
4.00%, 4/01/18 | | | 685 | | | | 713,168 | |
4.00%, 4/01/20 | | | 165 | | | | 179,805 | |
North Texas Tollway Authority, Refunding RB, Series C, 5.00%, 1/01/19 | | | 2,215 | | | | 2,445,648 | |
Tarrant County Cultural Education Facilities Finance Corp., Refunding RB, 5.00%, 11/15/18 | | | 1,195 | | | | 1,267,990 | |
Texas Municipal Gas Acquisition & Supply Corp. III, RB, 5.00%, 12/15/18 | | | 4,360 | | | | 4,750,133 | |
| | | | | | | | |
| | | | | | | | 29,492,139 | |
Virginia — 0.9% | | | | | | | | |
City of Norfolk Virginia, Refunding RB, Water Revenue, 5.00%, 11/01/18 | | | 1,230 | | | | 1,352,213 | |
Virginia College Building Authority, Refunding RB, Series A, 5.00%, 7/01/18 (g) | | | 785 | | | | 833,081 | |
| | | | | | | | |
| | | | | | | | 2,185,294 | |
Washington — 1.5% | | | | | | | | |
Energy Northwest, Refunding RB, Wind Project Revenue, 5.00%, 7/01/18 | | | 2,865 | | | | 3,101,219 | |
Washington Health Care Facilities Authority, Refunding RB, Providence Health & Services, Series B,
5.00%, 10/01/18 | | | 500 | | | | 548,025 | |
| | | | | | | | |
| | | | | | | | 3,649,244 | |
Wisconsin — 1.0% | | | | | | | | |
State of Wisconsin, Refunding RB, Series A,
5.00%, 5/01/18 | | | 1,000 | | | | 1,079,200 | |
Wisconsin Health & Educational Facilities Authority, Refunding RB, Froedtert & Community Health, Inc., 5.00%, 4/01/19 | | | 1,265 | | | | 1,408,628 | |
| | | | | | | | |
| | | | | | | | 2,487,828 | |
| Total Municipal Bonds – 99.0% | | | | | | | 241,762,361 | |
See Notes to Financial Statements.
| | | | | | |
| | | | | | | |
| | SEMI-ANNUAL REPORT | | JUNE 30, 2016 | | 17 |
| | |
Schedule of Investments (continued) | | BlackRock Municipal 2018 Term Trust (BPK) |
| | | | | | | | |
Municipal Bonds Transferred to
Tender Option Bond Trusts (i) — 2.2% | | Par
(000) | | | Value | |
Illinois — 2.2% | | | | | | | | |
City of Chicago Illinois Waterworks Revenue, Refunding RB, 2nd Lien (AGM),
5.00%, 11/01/20 (a) | | $ | 5,000 | | | $ | 5,394,950 | |
Total Long-Term Investments
(Cost — $241,430,194) — 101.2% | | | | | | | 247,157,311 | |
| | | | | | | | |
| Short-Term Securities | |
Shares | | | Value | |
BlackRock Liquidity Funds, MuniCash, Institutional Class, 0.26% (j)(k) | | | 502,055 | | | $ | 502,055 | |
Total Short-Term Securities
(Cost — $502,055) — 0.2% | | | | | | | 502,055 | |
| Total Investments (Cost — $241,932,249) — 101.4% | | | | 247,659,366 | |
| Other Assets Less Liabilities — 0.1% | | | | 265,077 | |
Liability for TOB Trust Certificates, Including Interest
Expense and Fees Payable — (1.5)% | | | | (3,754,069 | ) |
| | | | | | | | |
| Net Assets —100.0% | | | | | | $ | 244,170,374 | |
| | | | | | | | |
|
| Notes to Schedule of Investments |
| (a) | | Variable rate security. Rate as of period end. |
| (b) | | U.S. Government securities, held in escrow, are used to pay interest on this security, as well as to retire the bond in full at the date indicated, typically at a premium to par. |
| (c) | | Non-income producing security. |
| (d) | | Issuer filed for bankruptcy and/or is in default of interest payments. |
| (e) | | Security is collateralized by municipal bonds or U.S. Treasury obligations. |
| (f) | | When-issued security. |
| (g) | | Security exempt from registration pursuant to Rule 144A under the Securities Act of 1933, as amended. These securities may be resold in transactions exempt from registration to qualified institutional investors. |
| (i) | | Represent bonds transferred to a TOB Trust in exchange of cash and residual certificates received by the Trust. These bonds serve as collateral in a secured borrowing. See Note 4 of the Notes to Financial Statements for details. |
| (j) | | During the six months ended June 30, 2016, investments in issuers considered to be affiliates of the Trust for purposes of Section 2(a)(3) of the Investment Company Act of 1940, as amended, were as follows: |
| | | | | | | | | | | | | | | | | | | | |
| Affiliate | | Shares Held
at December 31,
2015 | | | Net
Activity | | | Shares Held
at June 30,
2016 | | | Value at
June 30,
2016 | | | Income | |
BlackRock Liquidity Funds, MuniCash, Institutional Class | | | — | | | | 502,055 | | | | 502,055 | | | $ | 502,055 | | | $ | 862 | |
FFI Institutional Tax-Exempt Fund | | | 69 | | | | (69 | ) | | | — | | | | — | | | | 132 | |
Total | | | | | | | | | | | | | | $ | 502,055 | | | $ | 994 | |
| | | | | | | | | | | | | | | | |
| (k) | | Current yield as of period end. |
|
| Fair Value Hierarchy as of Period End |
Various inputs are used in determining the fair value of investments. For information about the Trust’s policy regarding valuation of investments, refer to the Notes to Financial Statements.
The following table summarizes the Trust’s investments categorized in the disclosure hierarchy:
| | | | | | | | | | | | | | | | |
| | | Level 1 | | | Level 2 | | | Level 3 | | | Total | |
Assets: | | | | | | | | | | | | | | | | |
| Investments: | | | | | | | | | | | | | | | | |
Long Term Investments1 | | | — | | | $ | 247,157,311 | | | | — | | | $ | 247,157,311 | |
Short-Term Securities | | $ | 502,055 | | | | — | | | | — | | | | 502,055 | |
| | | | |
Total | | $ | 502,055 | | | $ | 247,157,311 | | | | — | | | $ | 247,659,366 | |
| | | | |
1 See above Schedule of Investments for values in each state or political subdivision. | |
The Trust may hold assets and/or liabilities in which the fair value approximates the carrying amount for financial statement purposes. As of period end, TOB Trust Certificates of $3,750,000 are categorized as Level 2 within the disclosure hierarchy.
During the six months ended June 30, 2016, there were no transfers between levels.
See Notes to Financial Statements.
| | | | | | |
| | | | | | | |
| 18 | | SEMI-ANNUAL REPORT | | JUNE 30, 2016 | | |
| | |
Schedule of Investments June 30, 2016 (Unaudited) | | BlackRock New York Municipal 2018 Term Trust (BLH) (Percentages shown are based on Net Assets) |
| | | | | | | | |
| Municipal Bonds | | Par (000) | | | Value | |
New York — 97.7% | | | | | | | | |
Corporate — 1.0% | |
New York Transportation Development Corp., Refunding RB, American Airlines, Inc., AMT, 5.00%, 8/01/18 | | $ | 500 | | | $ | 531,440 | |
County/City/Special District/School District — 40.1% | |
City of New York New York, GO, Refunding, Series A, 5.00%, 8/01/18 | | | 500 | | | | 544,790 | |
City of New York New York, GO: | | | | | | | | |
Sub-Series G-1, 5.00%, 4/01/18 (a) | | | 5,000 | | | | 5,383,450 | |
Sub-Series H-2, 5.00%, 6/01/20 | | | 3,470 | | | | 4,016,664 | |
City of New York New York Industrial Development Agency, ARB, American Airlines, Inc., JFK International Airport Project, AMT, Series B,
2.00%, 8/01/28 (b) | | | 1,530 | | | | 1,528,439 | |
City of New York New York Transitional Finance Authority, RB, Fiscal 2008, Series S-1,
5.00%, 1/15/23 | | | 1,400 | | | | 1,495,018 | |
City of Rochester New York, GO, Refunding,
Series I, 4.00%, 8/15/18 | | | 2,000 | | | | 2,138,200 | |
County of Erie New York Industrial Development Agency, GO: | | | | | | | | |
Series A, 5.00%, 9/15/18 | | | 350 | | | | 382,333 | |
Series B, 5.00%, 6/01/18 | | | 1,000 | | | | 1,080,770 | |
Haverstraw-Stony Point Central School District, GO, Refunding, 4.00%, 10/15/18 | | | 1,000 | | | | 1,074,710 | |
New York State Dormitory Authority, RB: | | | | | | | | |
General Purpose, Series E, 5.00%, 8/15/19 | | | 1,500 | | | | 1,698,030 | |
School Districts Financing Program, Series C, 4.00%, 10/01/18 | | | 535 | | | | 574,199 | |
New York State Dormitory Authority, Refunding RB, 3rd General Resolution, State University Educational Facilities, 4.00%, 5/15/18 | | | 1,000 | | | | 1,062,530 | |
Owego Apalachin Central School District, GO, Refunding (AGM), 4.00%, 6/15/18 | | | 1,015 | | | | 1,074,510 | |
| | | | | | | | |
| | | | | | | | 22,053,643 | |
Education — 12.8% | |
City of New York New York Transitional Finance Authority, Refunding RB, Subordinate, Future Tax Secured, Series B, 5.00%, 2/01/20 | | | 2,000 | | | | 2,294,180 | |
County of Tompkins New York Development Corp., Refunding RB, Ithaca College, 4.00%, 7/01/18 | | | 500 | | | | 531,110 | |
New York State Dormitory Authority, LRB, State University Dormitory Facilities, Series A,
5.00%, 7/01/21 | | | 250 | | | | 291,820 | |
New York State Dormitory Authority, RB, Pratt Institute, Series C (AGC), 5.00%, 7/01/19 (a) | | | 600 | | | | 675,768 | |
New York State Dormitory Authority, Refunding RB: | | | | | | | | |
Mental Health Service, 5.00%, 8/15/18 (a) | | | 5 | | | | 5,460 | |
Pratt Institute, Series A, 4.00%, 7/01/18 | | | 310 | | | | 329,031 | |
Series A, 3.00%, 7/01/18 | | | 1,300 | | | | 1,360,424 | |
Teachers College, Series A, 5.00%, 7/01/17 | | | 200 | | | | 208,662 | |
Teachers College, Series A, 5.00%, 7/01/18 | | | 250 | | | | 270,977 | |
Yonkers Industrial Development Agency New York, RB, Sarah Lawrence College Project, Series A: | | | | | | | | |
5.00%, 6/01/18 | | | 600 | | | | 642,696 | |
5.00%, 6/01/19 | | | 400 | | | | 441,856 | |
| | | | | | | | |
| | | | | | | | 7,051,984 | |
| | | | | | | | |
| Municipal Bonds | | Par (000) | | | Value | |
New York (continued) | | | | | | | | |
Health — 6.5% | |
New York State Dormitory Authority, Refunding RB: | | | | | | | | |
Miriam Osborn Memorial Home, 2.50%, 7/01/18 | | $ | 1,890 | | | $ | 1,924,530 | |
North Shore Long Island Jewish, Series A,
5.00%, 5/01/18 | | | 615 | | | | 661,082 | |
North Shore Long Island Jewish, Series A,
4.00%, 5/01/19 | | | 250 | | | | 269,823 | |
North Shore Long Island Jewish, Series A,
5.00%, 5/01/19 | | | 650 | | | | 722,520 | |
| | | | | | | | |
| | | | | | | | 3,577,955 | |
Housing — 2.6% | |
New York State Dormitory Authority, Refunding RB, State University Educational Facilities, Series A,
5.88%, 5/15/17 | | | 65 | | | | 67,964 | |
New York State Urban Development Corp., RB, State Personal Income Tax, Series A-1, 5.00%, 12/15/22 | | | 500 | | | | 555,840 | |
New York State Urban Development Corp., Refunding RB, Series D, 5.50%, 1/01/19 | | | 750 | | | | 838,560 | |
| | | | | | | | |
| | | | | | | | 1,462,364 | |
State — 8.3% | |
New York State Dormitory Authority, RB, General Purpose, Series A, 5.00%, 3/15/18 | | | 1,500 | | | | 1,611,825 | |
New York State Dormitory Authority, Refunding LRB, Municipal Health Facilities, 4.00%, 5/15/18 | | | 550 | | | | 581,471 | |
State of New York, GO, Series E, 5.00%, 12/15/20 | | | 2,000 | | | | 2,367,680 | |
| | | | | | | | |
| | | | | | | | 4,560,976 | |
Tobacco — 1.3% | |
Chautauqua Tobacco Asset Securitization Corp., Refunding RB: | | | | | | | | |
4.00%, 6/01/17 | | | 350 | | | | 360,815 | |
4.00%, 6/01/18 | | | 350 | | | | 370,580 | |
| | | | | | | | |
| | | | | | | | 731,395 | |
Transportation — 18.3% | |
Metropolitan Transportation Authority, Refunding RB: | | | | | | | | |
Series C, 5.00%, 11/15/18 | | | 1,965 | | | | 2,163,544 | |
Series F, 4.00%, 11/15/18 | | | 300 | | | | 323,259 | |
New York State Thruway Authority, RB, Transportation, Series A, 5.00%, 9/15/18 (c) | | | 1,750 | | | | 1,917,737 | |
Port Authority of New York & New Jersey, ARB, JFK International Air Terminal LLC Project,
5.00%, 12/01/20 | | | 300 | | | | 343,971 | |
Port Authority of New York & New Jersey,
Refunding RB, AMT: | | | | | | | | |
178th Series, 5.00%, 12/01/18 | | | 900 | | | | 988,749 | |
193rd Series, 4.00%, 10/15/18 | | | 1,000 | | | �� | 1,071,120 | |
Triborough Bridge & Tunnel Authority, Refunding RB, General, Series B, 4.00%, 11/15/18 | | | 3,000 | | | | 3,241,080 | |
| | | | | | | | |
| | | | | | | | 10,049,460 | |
Utilities — 6.8% | |
Long Island Power Authority, Refunding RB, Series A, 5.25%, 4/01/21 | | | 1,000 | | | | 1,102,810 | |
New York City Municipal Water Finance Authority, Refunding RB, Water & Sewer System, 2nd General Resolution, Fiscal 2012, Series FF, 5.00%, 6/15/20 | | | 2,000 | | | | 2,322,760 | |
See Notes to Financial Statements.
| | | | | | |
| | | | | | | |
| | SEMI-ANNUAL REPORT | | JUNE 30, 2016 | | 19 |
| | |
Schedule of Investments (concluded) | | BlackRock New York Municipal 2018 Term Trust (BLH) |
| | | | | | | | |
| Municipal Bonds | | Par (000) | | | Value | |
New York (continued) | | | | | | | | |
Utilities (continued) | |
Upper Mohawk Valley Regional Water Finance Authority, Refunding RB, Water System, Series 2012,
4.00%, 4/01/18 | | $ | 300 | | | $ | 315,381 | |
| | | | | | | | |
| | | | | | | | 3,740,951 | |
| Total Municipal Bonds in New York | | | | | | | 53,760,168 | |
| | | | | | | | |
Guam — 0.3% | | | | | | | | |
Utilities — 0.3% | |
Guam Power Authority, Refunding RB, Series A (AGM), 5.00%, 10/01/19 | | | 140 | | | | 158,019 | |
| | | | | | | | |
U.S. Virgin Islands — 1.2% | | | | | | | | |
State — 1.2% | |
Virgin Islands Public Finance Authority, RB, Series A, 5.00%, 10/01/16 | | | 630 | | | | 636,149 | |
Total Municipal Bonds
(Cost — $52,850,256) — 99.2% | | | | 54,554,336 | |
| | | | | | | | |
| | |
| Short-Term Securities | | Shares | | | Value | |
BlackRock Liquidity Funds, MuniCash, Institutional Class, 0.26% (d)(e) | | | 77,664 | | | $ | 77,664 | |
Total Short-Term Securities
(Cost — $77,664) — 0.1% | | | | | | | 77,664 | |
| Total Investments (Cost — $52,927,920) — 99.3% | | | | | | | 54,632,000 | |
| Other Assets Less Liabilities — 0.7% | | | | | | | 377,177 | |
| | | | | | | | |
| Net Assets — 100.0% | | | | | | $ | 55,009,177 | |
| | | | | | | | |
| | |
| Notes to Schedule of Investments |
| (a) | | Security is collateralized by municipal bonds or U.S. Treasury obligations. |
| (b) | | Variable rate security. Rate as of period end. |
| (c) | | U.S. Government securities, held in escrow, are used to pay interest on this security, as well as to retire the bond in full at the date indicated, typically at a premium to par. |
| (d) | | During the six months ended June 30, 2016, investments in issuers considered to be affiliates of the Trust for purposes of Section 2(a)(3) of the Investment Company Act of 1940, as amended, were as follows: |
| | | | | | | | | | | | | | | | | | | | |
| Affiliate | | Shares Held
at December 31,
2015 | | | Net
Activity | | | Shares Held
at June 30,
2016 | | | Value at
June 30,
2016 | | | Income | |
BlackRock Liquidity Funds, MuniCash, Institutional Class | | | — | | | | 77,664 | | | | 77,664 | | | $ | 77,664 | | | $ | 91 | |
BIF New York Municipal Money Fund | | | 664,307 | | | | (664,307 | ) | | | — | | | | — | | | | 115 | |
Total | | | | | | | | | | | | | | $ | 77,664 | | | $ | 206 | |
| | | | | | | | | | | | | | | | |
| (e) | | Current yield as of period end. |
For Trust compliance purposes, the Trust’s sector classifications refer to any one or more of the sector sub-classifications used by one or more widely recognized market indexes or rating group indexes, and/or as defined by the investment adviser. These definitions may not apply for purposes of this report, which may combine such sector sub-classifications for reporting ease.
| | |
| Fair Value Hierarchy as of Period End |
Various inputs are used in determining the fair value of investments. For information about the Trust’s policy regarding valuation of investments, refer to the Notes to Financial Statements.
The following table summarizes the Trust’s investments categorized in the disclosure hierarchy:
| | | | | | | | | | | | | | | | |
| | | Level 1 | | | Level 2 | | | Level 3 | | | Total | |
Assets: | | | | | | | | | | | | | | | | |
| Investments: | | | | | | | | | | | | | | | | |
Long-Term Investments1 | | | — | | | $ | 54,554,336 | | | | — | | | $ | 54,554,336 | |
Short-Term Securities | | $ | 77,664 | | | | — | | | | — | | | | 77,664 | |
| | | | |
Total | | $ | 77,664 | | | $ | 54,554,336 | | | | — | | | $ | 54,632,000 | |
| | | | |
1 See above Schedule of Investments for values in each sector. | |
During the six months ended June 30, 2016, there were no transfers between levels.
See Notes to Financial Statements.
| | | | | | |
| | | | | | | |
| 20 | | SEMI-ANNUAL REPORT | | JUNE 30, 2016 | | |
| | |
| Statements of Assets and Liabilities | | |
| | | | | | | | | | | | |
| June 30, 2016 (Unaudited) | | BlackRock
California
Municipal 2018
Term Trust (BJZ) | | | BlackRock
Municipal 2018
Term Trust (BPK) | | | BlackRock
New York
Municipal 2018
Term Trust (BLH) | |
| | | | | | | | | | | | |
| Assets | | | | | | | | | | | | |
Investments at value — unaffiliated1 | | $ | 95,366,276 | | | $ | 247,157,311 | | | $ | 54,554,336 | |
Investments at value — affiliated2 | | | 1,439,683 | | | | 502,055 | | | | 77,664 | |
Receivables: | | | | | | | | | | | | |
Interest | | | 962,510 | | | | 2,828,755 | | | | 511,242 | |
Investments sold | | | 45,638 | | | | — | | | | — | |
Dividends — affiliated | | | 269 | | | | 36 | | | | 51 | |
Prepaid expenses | | | 6,148 | | | | 7,493 | | | | 5,772 | |
| | | | |
Total assets | | | 97,820,524 | | | | 250,495,650 | | | | 55,149,065 | |
| | | | |
| | | | | | | | | | | | |
| Accrued Liabilities | | | | | | | | | | | | |
| Payables: | | | | | | | | | | | | |
Income dividends | | | 178,195 | | | | 442,243 | | | | 64,305 | |
Investment advisory fees | | | 31,841 | | | | 81,141 | | | | 17,975 | |
Officer’s and Trustees’ fees | | | 12,087 | | | | 42,301 | | | | 8,702 | |
Investments purchased | | | — | | | | 1,923,487 | | | | — | |
Interest expense and fees | | | — | | | | 4,069 | | | | — | |
Other accrued expenses | | | 50,977 | | | | 82,035 | | | | 48,906 | |
| | | | |
Total accrued liabilities | | | 273,100 | | | | 2,575,276 | | | | 139,888 | |
| | | | |
| | | | | | | | | | | | |
| Other Liabilities | | | | | | | | | | | | |
TOB Trust Certificates | | | — | | | | 3,750,000 | | | | — | |
| | | | |
Total liabilities | | | 273,100 | | | | 6,325,276 | | | | 139,888 | |
| | | | |
Net Assets | | $ | 97,547,424 | | | $ | 244,170,374 | | | $ | 55,009,177 | |
| | | | |
| | | | | | | | | | | | |
| Net Assets Consist of | | | | | | | | | | | | |
Paid-in capital3 | | $ | 92,746,843 | | | $ | 234,196,356 | | | $ | 52,879,382 | |
Undistributed net investment income | | | 2,072,256 | | | | 4,294,854 | | | | 713,869 | |
Accumulated net realized loss | | | (117,571 | ) | | | (47,953 | ) | | | (288,154 | ) |
Net unrealized appreciation (depreciation) | | | 2,845,896 | | | | 5,727,117 | | | | 1,704,080 | |
| | | | |
Net Assets | | $ | 97,547,424 | | | $ | 244,170,374 | | | $ | 55,009,177 | |
| | | | |
Net asset value | | $ | 15.16 | | | $ | 15.35 | | | $ | 15.14 | |
| | | | |
1 Investments at cost — unaffiliated | | $ | 92,520,380 | | | $ | 241,430,194 | | | $ | 52,850,256 | |
2 Investments at cost — affiliated | | $ | 1,439,683 | | | $ | 502,055 | | | $ | 77,664 | |
3 Shares outstanding, unlimited number of shares authorized, par value $0.001 per share | | | 6,433,028 | | | | 15,908,028 | | | | 3,633,028 | |
| | | | | | |
| See Notes to Financial Statements. | | | | |
| | | | | | | |
| | SEMI-ANNUAL REPORT | | JUNE 30, 2016 | | 21 |
| | | | | | | | | | | | |
| Six Months Ended June 30, 2016 (Unaudited) | | BlackRock
California
Municipal 2018
Term Trust
(BJZ) | | | BlackRock
Municipal 2018
Term Trust
(BPK) | | | BlackRock New York
Municipal 2018
Term Trust
(BLH) | |
| | | | | | | | | | | | |
| Investment Income | | | | | | | | | | | | |
Interest | | $ | 1,375,265 | | | $ | 3,184,328 | | | $ | 564,474 | |
Dividends — affiliated | | | 354 | | | | 994 | | | | 206 | |
| | | | |
Total income | | | 1,375,619 | | | | 3,185,322 | | | | 564,680 | |
| | | | |
| | | | | | | | | | | | |
| Expenses | | | | | | | | | | | | |
Investment advisory | | | 194,210 | | | | 493,131 | | | | 109,330 | |
Professional | | | 24,583 | | | | 32,154 | | | | 22,750 | |
Transfer agent | | | 10,042 | | | | 14,038 | | | | 9,477 | |
Accounting services | | | 8,769 | | | | 18,602 | | | | 5,620 | |
Officer and Trustees | | | 4,829 | | | | 13,219 | | | | 2,913 | |
Printing | | | 4,568 | | | | 6,149 | | | | 4,176 | |
Registration | | | 3,592 | | | | 3,573 | | | | 3,592 | |
Custodian | | | 2,216 | | | | 6,569 | | | | 1,267 | |
Miscellaneous | | | 6,668 | | | | 12,240 | | | | 4,833 | |
| | | | |
Total expenses excluding interest expense and fees | | | 259,477 | | | | 599,675 | | | | 163,958 | |
Interest expense and fees1 | | | — | | | | 17,217 | | | | — | |
| | | | |
Total expenses | | | 259,477 | | | | 616,892 | | | | 163,958 | |
Less fees waived by the Manager | | | (404 | ) | | | (181 | ) | | | (679 | ) |
| | | | |
Total expenses after fees waived | | | 259,073 | | | | 616,711 | | | | 163,279 | |
| | | | |
Net investment income | | | 1,116,546 | | | | 2,568,611 | | | | 401,401 | |
| | | | |
| | | | | | | | | | | | |
| Realized and Unrealized Gain (Loss) | | | | | | | | | | | | |
Net realized gain from investments | | | 524,361 | | | | 127,877 | | | | 683 | |
Net change in unrealized appreciation (depreciation) on investments | | | (459,161 | ) | | | 729,323 | | | | 269,204 | |
| | | | |
Net realized and unrealized gain | | | 65,200 | | | | 857,200 | | | | 269,887 | |
| | | | |
Net Increase in Net Assets Resulting from Operations | | $ | 1,181,746 | | | $ | 3,425,811 | | | $ | 671,288 | |
| | | | |
1 Related to TOB Trusts. | | | | | | | | | | | | |
| | | | | | |
| See Notes to Financial Statements. | | | | |
| | | | | | | |
| 22 | | SEMI-ANNUAL REPORT | | JUNE 30, 2016 | | |
| | |
| Statements of Changes in Net Assets | | |
| | | | | | | | |
| | | BlackRock California Municipal
2018 Term Trust (BJZ) | |
| Increase (Decrease) in Net Assets: | | Six Months Ended
June 30,
2016
(Unaudited) | | | Year Ended
December 31,
2015 | |
| | | | | | | | |
| Operations | | | | | | | | |
Net investment income | | $ | 1,116,546 | | | $ | 2,343,699 | |
Net realized gain | | | 524,361 | | | | 225,340 | |
Net change in unrealized appreciation (depreciation) | | | (459,161 | ) | | | (1,147,966 | ) |
| | | | |
Net increase in net assets resulting from operations | | | 1,181,746 | | | | 1,421,073 | |
| | | | |
| | | | | | | | |
| Distributions to Shareholders1 | | | | | | | | |
From net investment income | | | (1,069,169 | ) | | | (2,425,251 | ) |
| | | | |
| | | | | | | | |
| Net Assets | | | | | | | | |
Total increase (decrease) in net assets | | | 112,577 | | | | (1,004,178 | ) |
Beginning of period | | | 97,434,847 | | | | 98,439,025 | |
| | | | |
End of period | | $ | 97,547,424 | | | $ | 97,434,847 | |
| | | | |
Undistributed net investment income, end of period | | $ | 2,072,256 | | | $ | 2,024,879 | |
| | | | |
| | 1 | | Distributions for annual periods determined in accordance with federal income tax regulations. |
| | | | | | |
| See Notes to Financial Statements. | | | | |
| | | | | | | |
| | SEMI-ANNUAL REPORT | | JUNE 30, 2016 | | 23 |
| | |
| Statements of Changes in Net Assets | | |
| | | | | | | | | | | | | | | | | | | | | | | | |
| | | BlackRock Municipal
2018 Term Trust (BPK) | | | | | | BlackRock New York Municipal
2018 Term Trust (BLH) | |
| Increase (Decrease) in Net Assets: | | Six Months Ended
June 30,
2016
(Unaudited) | | | Year Ended
December 31,
2015 | | | | | | Six Months Ended
June 30,
2016
(Unaudited) | | | Year Ended
December 31,
2015 | | | | |
| | | | | | | | | | | | | | | | | | | | | | | | |
| Operations | | | | | | | | | | | | | | | | | | | | | | | | |
Net investment income | | $ | 2,568,611 | | | $ | 6,456,714 | | | | | | | $ | 401,401 | | | $ | 905,492 | | | | | |
Net realized gain | | | 127,877 | | | | 1,011,247 | | | | | | | | 683 | | | | 282,654 | | | | | |
Net change in unrealized appreciation (depreciation) | | | 729,323 | | | | (4,712,774 | ) | | | | | | | 269,204 | | | | (474,024 | ) | | | | |
Distributions to AMPS shareholders from net investment income | | | — | | | | — | | | | | | | | — | | | | (3,026 | ) | | | | |
| | | | | | | | | | | | |
Net increase in net assets resulting from operations | | | 3,425,811 | | | | 2,755,187 | | | | | | | | 671,288 | | | | 711,096 | | | | | |
| | | | | | | | | | | | |
| | | | | | | | | | | | | | | | | | | | | | | | |
| Distributions to Shareholders1 | | | | | | | | | | | | | | | | | | | | | | | | |
From net investment income | | | (3,264,327 | ) | | | (9,497,093 | ) | | | | | | | (443,229 | ) | | | (1,204,712 | ) | | | | |
| | | | | | | | | | | | |
| | | | | | | | | | | | | | | | | | | | | | | | |
| Net Assets | | | | | | | | | | | | | | | | | | | | | | | | |
Total increase (decrease) in net assets | | | 161,484 | | | | (6,741,906 | ) | | | | | | | 228,059 | | | | (493,616 | ) | | | | |
Beginning of period | | | 244,008,890 | | | | 250,750,796 | | | | | | | | 54,781,118 | | | | 55,274,734 | | | | | |
| | | | | | | | | | | | |
End of period | | $ | 244,170,374 | | | $ | 244,008,890 | | | | | | | $ | 55,009,177 | | | $ | 54,781,118 | | | | | |
| | | | | | | | | | | | |
Undistributed net investment income, end of period | | $ | 4,294,854 | | | $ | 4,990,584 | | | | | | | $ | 713,869 | | | $ | 755,697 | | | | | |
| | | | | | | | | | | | |
| | 1 | | Distributions for annual periods determined in accordance with federal income tax regulations. |
| | | | | | |
| See Notes to Financial Statements. | | | | |
| | | | | | | |
| 24 | | SEMI-ANNUAL REPORT | | JUNE 30, 2016 | | |
| | |
| Financial Highlights | | BlackRock California Municipal 2018 Term Trust (BJZ) |
| | | | | | | | | | | | | | | | | | | | | | | | |
| | | Six Months Ended
June 30,
2016
(Unaudited) | | | Year Ended December 31, | |
| | | | 2015 | | | 2014 | | | 2013 | | | 2012 | | | 2011 | |
| | | | | | | | | | | | | | | | | | | | | | | | |
| Per Share Operating Performance | |
Net asset value, beginning of period | | $ | 15.15 | | | $ | 15.30 | | | $ | 15.36 | | | $ | 15.81 | | | $ | 15.60 | | | $ | 14.34 | |
| | | | |
Net investment income1 | | | 0.17 | | | | 0.36 | | | | 0.40 | | | | 0.61 | | | | 0.71 | | | | 0.86 | |
Net realized and unrealized gain (loss) | | | 0.01 | | | | (0.13 | ) | | | 0.08 | | | | (0.42 | ) | | | 0.28 | | | | 1.28 | |
Distributions to AMPS Shareholders from net investment income | | | — | | | | — | | | | (0.00 | )2 | | | (0.01 | ) | | | (0.02 | ) | | | (0.02 | ) |
| | | | |
Net increase from investment operations | | | 0.18 | | | | 0.23 | | | | 0.48 | | | | 0.18 | | | | 0.97 | | | | 2.12 | |
| | | | |
Distributions to Common Shareholders from net investment income3 | | | (0.17 | ) | | | (0.38 | ) | | | (0.54 | ) | | | (0.63 | ) | | | (0.76 | ) | | | (0.86 | ) |
| | | | |
Net asset value, end of period | | $ | 15.16 | | | $ | 15.15 | | | $ | 15.30 | | | $ | 15.36 | | | $ | 15.81 | | | $ | 15.60 | |
| | | | |
Market price, end of period | | $ | 15.17 | | | $ | 15.05 | | | $ | 15.24 | | | $ | 15.77 | | | $ | 16.21 | | | $ | 16.34 | |
| | | | |
| | | | | | | | | | | | | | | | | | | | | | | | |
| Total Return Applicable to Common Shareholders4 | | | | | | | | | | | | | | | | | | | | | | | | |
Based on net asset value | | | 1.17% | 5 | | | 1.52% | | | | 3.09% | | | | 1.07% | | | | 6.16% | | | | 14.86% | |
| | | | |
Based on market price | | | 1.91% | 5 | | | 1.24% | | | | 0.01% | | | | 1.21% | | | | 3.92% | | | | 12.17% | |
| | | | |
| | | | | | | | | | | | | | | | | | | | | | | | |
| Ratios to Average Net Assets Applicable to Common Shareholders | | | | | | | | | | | | | | | | | | | | | | | | |
Total expenses | | | 0.53% | 6 | | | 0.54% | | | | 0.57% | 7 | | | 0.82% | 7 | | | 0.93% | 7 | | | 0.93% | 7 |
| | | | |
Total expenses after fees waived | | | 0.53% | 6 | | | 0.54% | | | | 0.57% | 7,8 | | | 0.82% | 7,8 | | | 0.92% | 7 | | | 0.91% | 7 |
| | | | |
Net investment income | | | 2.30% | 6 | | | 2.39% | | | | 2.57% | 7 | | | 3.92% | 7 | | | 4.51% | 7 | | | 5.82% | 7 |
| | | | |
Distributions to AMPS Shareholders | | | — | | | | — | | | | 0.00% | 9 | | | 0.07% | | | | 0.14% | | | | 0.17% | |
| | | | |
Net investment income to Common Shareholders | | | 2.30% | 6 | | | 2.39% | | | | 2.57% | | | | 3.85% | | | | 4.37% | | | | 5.65% | |
| | | | |
| | | | | | | | | | | | | | | | | | | | | | | | |
| Supplemental Data | | | | | | | | | | | | | | | | | | | | | | | | |
Net assets applicable to Common Shareholders, end of period (000) | | $ | 97,547 | | | $ | 97,435 | | | $ | 98,439 | | | $ | 98,842 | | | $ | 101,729 | | | $ | 100,345 | |
| | | | |
AMPS outstanding at $25,000 liquidation preference, end of period (000) | | | — | | | | — | | | | — | | | $ | 26,850 | | | $ | 55,525 | | | $ | 55,525 | |
| | | | |
Asset coverage per AMPS at $25,000 liquidation preference, end of period | | | — | | | | — | | | | — | | | $ | 117,032 | | | $ | 70,803 | | | $ | 70,180 | |
| | | | |
Portfolio turnover rate | | | 11% | | | | 6% | | | | 12% | | | | — | | | | 15% | | | | 28% | |
| | | | |
| | 1 | | Based on average Common Shares outstanding. |
| | 2 | | Amount is greater than $(0.005) per share. |
| | 3 | | Distributions for annual periods determined in accordance with federal income tax regulations. |
| | 4 | | Total returns based on market price, which can be significantly greater or less than the net asset value, may result in substantially different returns. Where applicable, excludes the effects of any sales charges and assumes the reinvestment of distributions. |
| | 5 | | Aggregate total return. |
| | 7 | | Does not reflect the effect of distributions to Auction Market Preferred Shares (“AMPS”) Shareholders. |
| | 8 | | For the years ended December 31, 2014 and December 31, 2013, the total expense ratio after fees waived and paid indirectly and excluding interest and remarketing fees was 0.57% and 0.75%, respectively. |
| | 9 | | Amount is less than 0.005%. |
| | | | | | |
| See Notes to Financial Statements. | | | | |
| | | | | | | |
| | SEMI-ANNUAL REPORT | | JUNE 30, 2016 | | 25 |
| | |
| Financial Highlights | | BlackRock Municipal 2018 Term Trust (BPK) |
| | | | | | | | | | | | | | | | | | | | | | | | |
| | | Six Months Ended
June 30,
2016
(Unaudited) | | | Year Ended December 31, | |
| | | | 2015 | | | 2014 | | | 2013 | | | 2012 | | | 2011 | |
| | | | | | | | | | | | | | | | | | | | | | | | |
| Per Share Operating Performance | |
Net asset value, beginning of period | | $ | 15.34 | | | $ | 15.76 | | | $ | 15.57 | | | $ | 16.07 | | | $ | 15.66 | | | $ | 14.58 | |
| | | | |
Net investment income1 | | | 0.16 | | | | 0.41 | | | | 0.61 | | | | 0.72 | | | | 0.87 | | | | 1.04 | |
Net realized and unrealized gain (loss) | | | 0.06 | | | | (0.23 | ) | | | 0.26 | | | | (0.44 | ) | | | 0.50 | | | | 1.00 | |
Distributions to AMPS Shareholders from net investment income | | | — | | | | — | | | | (0.00 | )2 | | | (0.01 | ) | | | (0.02 | ) | | | (0.02 | ) |
| | | | |
Net increase from investment operations | | | 0.22 | | | | 0.18 | | | | 0.87 | | | | 0.27 | | | | 1.35 | | | | 2.02 | |
| | | | |
Distributions to Common Shareholders from net investment income3 | | | (0.21 | ) | | | (0.60 | ) | | | (0.68 | ) | | | (0.77 | ) | | | (0.94 | ) | | | (0.94 | ) |
| | | | |
Net asset value, end of period | | $ | 15.35 | | | $ | 15.34 | | | $ | 15.76 | | | $ | 15.57 | | | $ | 16.07 | | | $ | 15.66 | |
| | | | |
Market price, end of period | | $ | 15.25 | | | $ | 15.50 | | | $ | 16.13 | | | $ | 15.94 | | | $ | 16.56 | | | $ | 16.59 | |
| | | | |
| | | | | | | | | | | | | | | | | | | | | | | | |
| Total Return Applicable to Common Shareholders4 | | | | | | | | | | | | | | | | | | | | | | | | |
Based on net asset value | | | 1.40% | 5 | | | 1.11% | | | | 5.53% | | | | 1.55% | | | | 8.42% | | | | 13.86% | |
| | | | |
Based on market price | | | (0.30)% | 5 | | | (0.18)% | | | | 5.50% | | | | 0.88% | | | | 5.46% | | | | 11.66% | |
| | | | |
| | | | | | | | | | | | | | | | | | | | | | | | |
| Ratios to Average Net Assets Applicable to Common Shareholders | | | | | | | | | | | | | | | | | | | | | | | | |
Total expenses | | | 0.51% | 6 | | | 0.51% | | | | 0.64% | 7 | | | 0.73% | 7 | | | 0.86% | 7 | | | 0.85% | 7 |
| | | | |
Total expenses after fees waived | | | 0.51% | 6 | | | 0.51% | | | | 0.64% | 7,8 | | | 0.73% | 7,8 | | | 0.86% | 7 | | | 0.85% | 7 |
| | | | |
Total expenses after fees waived and excluding interest expense and fees | | | 0.49% | 6 | | | 0.50% | | | | 0.63% | 7 | | | 0.72% | 7 | | | 0.85% | 7 | | | 0.84% | 7 |
| | | | |
Net investment income | | | 2.12% | | | | 2.61% | | | | 3.89% | | | | 4.56% | | | | 5.51% | | | | 6.94% | |
| | | | |
Distributions to AMPS Shareholders | | | — | | | | — | | | | 0.02% | | | | 0.06% | | | | 0.14% | | | | 0.16% | |
| | | | |
Net investment income to Common Shareholders | | | 2.12% | 6 | | | 2.61% | | | | 3.87% | | | | 4.50% | | | | 5.37% | | | | 6.78% | |
| | | | |
| | | | | | | | | | | | | | | | | | | | | | | | |
| Supplemental Data | | | | |
Net assets applicable to Common Shareholders, end of period (000) | | $ | 244,170 | | | $ | 244,009 | | | $ | 250,751 | | | $ | 247,679 | | | $ | 255,711 | | | $ | 249,069 | |
| | | | |
AMPS outstanding at $25,000 liquidation preference, end of period (000) | | | — | | | | — | | | | — | | | $ | 69,250 | | | $ | 133,850 | | | $ | 133,850 | |
| | | | |
Asset coverage per AMPS at $25,000 liquidation preference, end of period | | | — | | | | — | | | | — | | | $ | 114,415 | | | $ | 72,761 | | | $ | 71,521 | |
| | | | |
Borrowings outstanding, end of period (000) | | $ | 3,750 | | | $ | 3,750 | | | $ | 3,750 | | | $ | 3,750 | | | $ | 3,750 | | | $ | 3,750 | |
| | | | |
Portfolio turnover rate | | | 11% | | | | 18% | | | | 14% | | | | 3% | | | | 23% | | | | 13% | |
| | | | |
| | 1 | | Based on average Common Shares outstanding. |
| | 2 | | Amount is greater than $(0.005) per share. |
| | 3 | | Distributions for annual periods determined in accordance with federal income tax regulations. |
| | 4 | | Total returns based on market price, which can be significantly greater or less than the net asset value, may result in substantially different returns. Where applicable, excludes the effects of any sales charges and assumes the reinvestment of distributions. |
| | 5 | | Aggregate total return. |
| | 7 | | Does not reflect the effect of distributions to Auction Market Preferred Shares (“AMPS”) Shareholders. |
| | 8 | | For years ended December 31, 2014 and December 31, 2013, the total expense ratio after fees waived and excluding interest expense and fees and remarketing fees was 0.60% and 0.67%, respectively. |
| | | | | | |
| See Notes to Financial Statements. | | | | |
| | | | | | | |
| 26 | | SEMI-ANNUAL REPORT | | JUNE 30, 2016 | | |
| | |
| Financial Highlights | | BlackRock New York Municipal 2018 Term Trust (BLH) |
| | | | | | | | | | | | | | | | | | | | | | | | |
| | | Six Months Ended
June 30,
2016
(Unaudited) | | | Year Ended December 31, | |
| | | | 2015 | | | 2014 | | | 2013 | | | 2012 | | | 2011 | |
| | | | | | | | | | | | | | | | | | | | | | | | |
| Per Share Operating Performance | |
Net asset value, beginning of period | | $ | 15.08 | | | $ | 15.21 | | | $ | 15.05 | | | $ | 15.67 | | | $ | 15.64 | | | $ | 15.18 | |
| | | | |
Net investment income1 | | | 0.11 | | | | 0.25 | | | | 0.35 | | | | 0.44 | | | | 0.65 | | | | 1.00 | |
Net realized and unrealized gain (loss) | | | 0.07 | | | | (0.05 | ) | | | 0.18 | | | | (0.48 | ) | | | 0.23 | | | | 0.46 | |
Distributions to AMPS Shareholders from net investment income | | | — | | | | (0.00 | )2 | | | (0.00 | )2 | | | (0.01 | ) | | | (0.02 | ) | | | (0.02 | ) |
| | | | |
Net increase (decrease) from investment operations | | | 0.18 | | | | 0.20 | | | | 0.53 | | | | (0.05 | ) | | | 0.86 | | | | 1.44 | |
| | | | |
Distributions to Common Shareholders from net investment income3 | | | (0.12 | ) | | | (0.33 | ) | | | (0.37 | ) | | | (0.57 | ) | | | (0.83 | ) | | | (0.98 | ) |
| | | | |
Net asset value, end of period | | $ | 15.14 | | | $ | 15.08 | | | $ | 15.21 | | | $ | 15.05 | | | $ | 15.67 | | | $ | 15.64 | |
| | | | |
Market price, end of period | | $ | 15.03 | | | $ | 14.94 | | | $ | 14.95 | | | $ | 15.23 | | | $ | 16.05 | | | $ | 16.71 | |
| | | | |
| | | | | | | | | | | | | | | | | | | | | | | | |
| Total Return Applicable to Common Shareholders4 | | | | | | | | | | | | | | | | | | | | | | | | |
Based on net asset value | | | 1.21% | 5 | | | 1.29% | | | | 3.58% | | | | (0.36 | )% | | | 5.34% | | | | 9.41% | |
| | | | |
Based on market price | | | 1.42% | 5 | | | 2.16% | | | | 0.61% | | | | (1.55 | )% | | | 0.99% | | | | 11.46% | |
| | | | |
| | | | | | | | | | | | | | | | | | | | | | | | |
| Ratios to Average Net Assets Applicable to Common Shareholders | | | | | | | | | | | | | | | | | | | | | | | | |
Total expenses | | | 0.60% | 6 | | | 0.64% | 7 | | | 0.79% | 7 | | | 0.89% | 7 | | | 0.96% | 7 | | | 0.99% | 7 |
| | | | |
Total expenses after fees waived | | | 0.60% | 6 | | | 0.64% | 7,8 | | | 0.79% | 7,8 | | | 0.89% | 7,8 | | | 0.95% | 7 | | | 0.98% | 7 |
| | | | |
Net investment income | | | 1.47% | 6 | | | 1.64% | 7 | | | 2.29% | 7 | | | 2.89% | 7 | | | 4.11% | 7 | | | 6.52% | 7 |
| | | | |
Distributions to AMPS Shareholders | | | — | | | | 0.00% | 9 | | | 0.03% | | | | 0.07% | | | | 0.14% | | | | 0.16% | |
| | | | |
Net investment income to Common Shareholders | | | 1.47% | 6 | | | 1.64% | | | | 2.26% | | | | 2.82% | | | | 3.97% | | | | 6.36% | |
| | | | |
| | | | | | | | | | | | | | | | | | | | | | | | |
| Supplemental Data | | | | | | | | | | | | | | | | | | | | | | | | |
Net assets applicable to Common Shareholders, end of period (000) | | $ | 55,009 | | | $ | 54,781 | | | $ | 55,275 | | | $ | 54,667 | | | $ | 56,921 | | | $ | 56,808 | |
| | | | |
AMPS outstanding at $25,000 liquidation preference, end of period (000) | | | — | | | | — | | | $ | 12,050 | | | $ | 16,425 | | | $ | 31,400 | | | $ | 31,400 | |
| | | | |
Asset coverage per AMPS at $25,000 liquidation preference, end of period | | | — | | | | — | | | $ | 139,678 | | | $ | 108,207 | | | $ | 70,319 | | | $ | 70,230 | |
| | | | |
Portfolio turnover rate | | | 1% | | | | 14% | | | | 4% | | | | 7% | | | | 48% | | | | 16% | |
| | | | |
| | 1 | | Based on average Common Shares outstanding. |
| | 2 | | Amount is greater than $(0.005) per share. |
| | 3 | | Distributions for annual periods determined in accordance with federal income tax regulations. |
| | 4 | | Total returns based on market price, which can be significantly greater or less than the net asset value, may result in substantially different returns. Where applicable, excludes the effects of any sales charges and assumes the reinvestment of distributions. |
| | 5 | | Aggregate total return. |
| | 7 | | Does not reflect the effect of distributions to Auction Market Preferred Shares (“AMPS”) Shareholders. |
| | 8 | | For the years ended December 31, 2015, December 31, 2014 and December 31, 2013, the total expense ratio after fees waived and excluding remarketing fees was 0.63%, 0.75% and 0.83%, respectively. |
| | 9 | | Amount is less than 0.005%. |
| | | | | | |
| See Notes to Financial Statements. | | | | |
| | | | | | | |
| | SEMI-ANNUAL REPORT | | JUNE 30, 2016 | | 27 |
| | | | |
| Notes to Financial Statements (Unaudited) | | |
1. Organization:
The following are registered under the Investment Company Act of 1940, as amended (the “1940 Act”), as closed-end management investment companies and are referred to herein collectively as the “Trusts”, or individually, a “Trust”:
| | | | | | | | | | |
| Trust Name | | Herein Referred To As | | | Organized | | | Diversification Classification |
BlackRock California Municipal 2018 Term Trust | | | BJZ | | | | Delaware | | | Non-diversified |
BlackRock Municipal 2018 Term Trust | | | BPK | | | | Delaware | | | Diversified |
BlackRock New York Municipal 2018 Term Trust | | | BLH | | | | Delaware | | | Non-diversified |
The Board of Trustees of the Trusts are collectively referred to throughout this report as the “Board of Trustees” or the “Board” and the trustees thereof are collectively referred to throughout this report as “Trustees.” The Trusts determine and make available for publication the NAVs of their shares on a daily basis.
The Trusts, together with certain other registered investment companies advised by BlackRock Advisors, LLC (the “Manager”) or its affiliates, are included in a complex of closed-end funds referred to as the Closed-End Complex.
2. Significant Accounting Policies:
The financial statements are prepared in conformity with accounting principles generally accepted in the United States of America (“U.S. GAAP”), which may require management to make estimates and assumptions that affect the reported amounts of assets and liabilities in the financial statements, disclosure of contingent assets and liabilities at the date of the financial statements and the reported amounts of increases and decreases in net assets from operations during the reporting period. Actual results could differ from those estimates. Each Trust is considered an investment company under U.S. GAAP and follows the accounting and reporting guidance applicable to investment companies. Below is a summary of significant accounting policies:
Segregation and Collateralization: In cases where a Trust enters into certain borrowings (e.g., TOB transactions) that would be treated as “senior securities” for 1940 Act purposes, a Trust may segregate or designate on its books and records cash or liquid assets having a market value at least equal to the amount of its future obligations under such borrowings. Doing so allows the borrowing to be excluded from treatment as a “senior security.” Furthermore, if required by an exchange or counterparty agreement, the Trust may be required to deliver/deposit cash and/or securities to/with an exchange, or broker-dealer or custodian as collateral for certain investments or obligations.
Investment Transactions and Investment Income: For financial reporting purposes, investment transactions are recorded on the dates the transactions are entered into (the trade dates). Realized gains and losses on investment transactions are determined on the identified cost basis. Interest income, including amortization and accretion of premiums and discounts on debt securities, is recognized on the accrual basis.
Distributions: Distributions from net investment income are declared and paid monthly. Distributions of capital gains are recorded on the ex-dividend date and made at least annually. The character and timing of distributions are determined in accordance with federal income tax regulations, which may differ from U.S. GAAP.
Deferred Compensation Plan: Under the Deferred Compensation Plan (the “Plan”) approved by each Trust’s Board, the independent Trustees (“Independent Trustees”) may defer a portion of their annual complex-wide compensation. Deferred amounts earn an approximate return as though equivalent dollar amounts had been invested in common shares of certain other BlackRock Closed-End Funds selected by the Independent Directors. This has the same economic effect for the Independent Trustees as if the Independent Trustees had invested the deferred amounts directly in certain other BlackRock Closed-End Funds.
The Plan is not funded and obligations thereunder represent general unsecured claims against the general assets of each Trust, if applicable. Deferred compensation liabilities are included in officer’s and trustees’ fees payable in the Statements of Assets and Liabilities and will remain as a liability of the Trusts until such amounts are distributed in accordance with the Plan.
Indemnifications: In the normal course of business, a Trust enters into contracts that contain a variety of representations that provide general indemnification. A Trust’s maximum exposure under these arrangements is unknown because it involves future potential claims against a Trust, which cannot be predicted with any certainty.
Other: Expenses directly related to a Trust are charged to that Trust. Other operating expenses shared by several funds, including other funds managed by the Manager, are prorated among those funds on the basis of relative net assets or other appropriate methods.
| | | | | | |
| | | | | | | |
| 28 | | SEMI-ANNUAL REPORT | | JUNE 30, 2016 | | |
| | |
| Notes to Financial Statements (continued) | | |
The Trusts have an arrangement with their custodian whereby fees may be reduced by credits earned on uninvested cash balances, which, if applicable, are shown as fees paid indirectly in the Statements of Operations. The custodian imposes fees on overdrawn cash balances, which can be offset by accumulated credits earned or may result in additional custody charges. Effective October 2015, the custodian is imposing fees on certain uninvested cash balances.
3. Investment Valuation and Fair Value Measurements:
Investment Valuation Policies: The Trusts’ investments are valued at fair value (also referred to as “market value” within the financial statements) as of the close of trading on the New York Stock Exchange (“NYSE”) (generally 4:00 p.m., Eastern time). U.S. GAAP defines fair value as the price the Trusts would receive to sell an asset or pay to transfer a liability in an orderly transaction between market participants at the measurement date. The Trusts determine the fair values of their financial instruments using various independent dealers or pricing services under policies approved by the Board. The BlackRock Global Valuation Methodologies Committee (the “Global Valuation Committee”) is the committee formed by management to develop global pricing policies and procedures and to oversee the pricing function for all financial instruments.
Fair Value Inputs and Methodologies: The following methods (or “techniques”) and inputs are used to establish the fair value of each Trust’s assets and liabilities:
| • | | Municipal investments (including commitments to purchase such investments on a “when-issued” basis) are valued on the basis of prices provided by dealers or pricing services. In determining the value of a particular investment, pricing services may use certain information with respect to transactions in such investments, quotations from dealers, pricing matrixes, market transactions in comparable investments and information with respect to various relationships between investments. |
| • | | Investments in open-end U.S. mutual funds are valued at NAV each business day. |
If events (e.g., a company announcement, market volatility or a natural disaster) occur that are expected to materially affect the value of such instruments, or in the event that the application of these methods of valuation results in a price for an investment that is deemed not to be representative of the market value of such investment, or if a price is not available, the investment will be valued by the Global Valuation Committee, or its delegate, in accordance with a policy approved by the Board as reflecting fair value (“Fair Valued Investments”). When determining the price for Fair Valued Investments, the Global Valuation Committee, or its delegate, seeks to determine the price that each Trust might reasonably expect to receive or pay from the current sale or purchase of that asset or liability in an arm’s-length transaction. Fair value determinations shall be based upon all available factors that the Global Valuation Committee, or its delegate, deems relevant consistent with the principles of fair value measurement. The pricing of all Fair Valued Investments is subsequently reported to the Board or a committee thereof on a quarterly basis.
Fair Value Hierarchy: Various inputs are used in determining the fair value of investments. These inputs to valuation techniques are categorized into a fair value hierarchy consisting of three broad levels for financial statement purposes as follows:
| • | | Level 1 — unadjusted price quotations in active markets/exchanges for identical assets or liabilities that each Trust has the ability to access |
| • | | Level 2 — other observable inputs (including, but not limited to, quoted prices for similar assets or liabilities in markets that are active, quoted prices for identical or similar assets or liabilities in markets that are not active, inputs other than quoted prices that are observable for the assets or liabilities (such as interest rates, yield curves, volatilities, prepayment speeds, loss severities, credit risks and default rates) or other market–corroborated inputs) |
| • | | Level 3 — unobservable inputs based on the best information available in the circumstances, to the extent observable inputs are not available (including each Trust’s own assumptions used in determining the fair value of investments) |
The hierarchy gives the highest priority to unadjusted quoted prices in active markets for identical assets or liabilities (Level 1 measurements) and the lowest priority to unobservable inputs (Level 3 measurements). Accordingly, the degree of judgment exercised in determining fair value is greatest for instruments categorized in Level 3. The inputs used to measure fair value may fall into different levels of the fair value hierarchy. In such cases, for disclosure purposes, the fair value hierarchy classification is determined based on the lowest level input that is significant to the fair value measurement in its entirety. The significant unobservable inputs used by the Global Valuation Committee in determining the price for Fair Valued Investments are typically categorized as Level 3. The fair value hierarchy for each Trust’s investments has been included in the Schedules of Investments.
Changes in valuation techniques may result in transfers into or out of an assigned level within the hierarchy. In accordance with each Trust’s policy, transfers between different levels of the fair value hierarchy are deemed to have occurred as of the beginning of the reporting period. The
| | | | | | |
| | | | | | | |
| | SEMI-ANNUAL REPORT | | JUNE 30, 2016 | | 29 |
| | | | |
| Notes to Financial Statements (continued) | | |
categorization of a value determined for investments is based on the pricing transparency of the investments and is not necessarily an indication of the risks associated with investing in those securities.
4. Securities and Other Investments:
Zero-Coupon Bonds: Zero-coupon bonds are normally issued at a significant discount from face value and do not provide for periodic interest payments. These bonds may experience greater volatility in market value than other debt obligations of similar maturity which provide for regular interest payments.
Forward Commitments and When-Issued Delayed Delivery Securities: Certain Trusts may purchase securities on a when-issued basis and may purchase or sell securities on a forward commitment basis. Settlement of such transactions normally occurs within a month or more after the purchase or sale commitment is made. A Trust may purchase securities under such conditions with the intention of actually acquiring them, but may enter into a separate agreement to sell the securities before the settlement date. Since the value of securities purchased may fluctuate prior to settlement, a Trust may be required to pay more at settlement than the security is worth. In addition, a Trust is not entitled to any of the interest earned prior to settlement. When purchasing a security on a delayed delivery basis, a Trust assumes the rights and risks of ownership of the security, including the risk of price and yield fluctuations. In the event of default by the counterparty, a Trust’s maximum amount of loss is the unrealized appreciation of unsettled when-issued transactions.
Municipal Bonds Transferred to TOB Trusts: Certain Trusts leverage their assets through the use of TOB transactions. The Trusts transfer municipal bonds into a special purpose trust (a “TOB Trust”). A TOB Trust generally issues two classes of beneficial interests: short-term floating rate interests (“TOB Trust Certificates”), which are sold to third party investors, and residual inverse floating rate interests (“TOB Residuals”), which are generally issued to the participating funds that contributed the municipal bonds to the TOB Trust. The TOB Trust Certificates have interest rates that generally reset weekly and their holders have the option to tender such certificates to the TOB Trust for redemption at par and any accrued interest at each reset date. The TOB Residuals held by a Trust generally provide the Trust with the right to cause the holders of a proportional share of the TOB Trust Certificates to tender their certificates to the TOB Trust at par plus accrued interest. The Trusts may withdraw a corresponding share of the municipal bonds from the TOB Trust. Other trusts managed by the investment adviser may also contribute municipal bonds to a TOB Trust into which a Trust has contributed bonds. If multiple BlackRock advised funds participate in the same TOB Trust, the economic rights and obligations under the TOB Residuals will be shared among the funds ratably in proportion to their participation in the TOB Trust.
TOB Trusts are generally supported by a liquidity facility provided by a third party bank or other financial institution (the “Liquidity Provider”) that allows the holders of the TOB Trust Certificates to tender their certificates in exchange for payment of par plus accrued interest on any business day. The tendered TOB Trust Certificates may be purchased by the Liquidity Provider and are usually remarketed by a Remarketing Agent, which is typically an affiliated entity of the Liquidity Provider. The Remarketing Agent may also purchase the tendered TOB Trust Certificates for its own account in the event of a failed remarketing.
The TOB Trust may be collapsed without the consent of a Trust, upon the occurrence of tender option termination events (“TOTEs”) or mandatory termination events (“MTEs”), as defined in the TOB Trust agreements. TOTEs include the bankruptcy or default of the issuer of the municipal bonds held in the TOB Trust, a substantial downgrade in the credit quality of the issuer of the municipal bonds held in the TOB Trust, failure of any scheduled payment of principal or interest on the municipal bonds, and/or a judgment or ruling that interest on the municipal bond is subject to federal income taxation. MTEs may include, among other things, a failed remarketing of the TOB Trust Certificates, the inability of the TOB Trust to obtain renewal of the liquidity support agreement and a substantial decline in the market value of the municipal bonds held in the TOB Trust. Upon the occurrence of a TOTE or an MTE, the TOB Trust would be liquidated with the proceeds applied first to any accrued fees owed to the trustee of the TOB Trust, the Remarketing Agent and the Liquidity Provider. In the case of an MTE, after the payment of fees, the TOB Trust Certificates holders would be paid before the TOB Residuals holders (i.e., the Trusts). In contrast, in the case of a TOTE, after payment of fees, the TOB Trust Certificates holders and the TOB Residuals holders would be paid pro rata in proportion to the respective face values of their certificates. During the six months ended June 30, 2016, no TOB Trusts in which a Trust participated were terminated without the consent of a Trust.
While a Trust’s investment policies and restrictions expressly permit investments in inverse floating rate securities, such as TOB Residuals, they generally restrict the ability of a Trust to borrow money for purposes of making investments. Each Trust’s transfer of the municipal bonds to a TOB Trust is considered a secured borrowing for financial reporting purposes. The cash received by the TOB Trust from the sale of the TOB Trust Certificates, less certain transaction expenses, is paid to a Trust. A Trust typically invests the cash received in additional municipal bonds. The municipal bonds deposited into a TOB Trust are presented in a Trust’s Schedule of Investments and the TOB Trust Certificates are shown in Other Liabilities in the
| | | | | | |
| | | | | | | |
| 30 | | SEMI-ANNUAL REPORT | | JUNE 30, 2016 | | |
| | |
| Notes to Financial Statements (continued) | | |
Statements of Assets and Liabilities. Any loans drawn by the TOB Trust pursuant to the liquidity facility to purchase tendered TOB Trust Certificates would be shown as Loan for TOB Trust Certificates.
Volcker Rule Impact: On December 10, 2013, regulators published final rules implementing section 619 of the Dodd-Frank Wall Street Reform and Consumer Protection Act (the “Volcker Rule”), which precludes banking entities and their affiliates from sponsoring and investing in TOB Trusts. Banking entities subject to the Volcker Rule were required to fully comply by July 21, 2015, with respect to investments in and relationships with TOB Trusts established after December 31, 2013 (“Non-Legacy TOB Trusts”), and by July 21, 2017, with respect to investments in and relationships with TOB Trusts established prior to December 31, 2013 (“Legacy TOB Trusts”).
As a result, a new structure for TOB Trusts has been designed in which no banking entity would sponsor the TOB Trust. Specifically, a Trust establishes, structures and “sponsors” the TOB Trusts in which it holds TOB Residuals. In such a structure, certain responsibilities that previously belonged to a third party bank are performed by, or on behalf of, the Trusts. The Trusts have restructured any Non-Legacy TOB Trusts and are in the process of restructuring Legacy TOB Trusts in conformity with regulatory guidelines. Until all restructurings are completed, a Trust may, for a period of time, hold TOB Residuals in both Legacy TOB Trusts and new or restructured non-bank sponsored TOB Trusts.
Under the new TOB Trust structure, the Liquidity Provider or Remarketing Agent will no longer purchase the tendered TOB Trust Certificates even in the event of failed remarketing. This may increase the likelihood that a TOB Trust will need to be collapsed and liquidated in order to purchase the tendered TOB Trust Certificates. The TOB Trust may draw upon a loan from the Liquidity Provider to purchase the tendered TOB Trust Certificates. Any loans made by the Liquidity Provider will be secured by the purchased TOB Trust Certificates held by the TOB Trust and will be subject to an increased interest rate based on the number of days the loan is outstanding.
Accounting for TOB Trusts: The municipal bonds deposited into a TOB Trust are presented in a Trust’s Schedule of Investments and the TOB Trust Certificates are shown in Other Liabilities in the Statements of Assets and Liabilities. Any loans drawn by the TOB Trust pursuant to the liquidity facility to purchase tendered TOB Trust Certificates are shown as Loan for TOB Trust Certificates. The carrying amount of a Trust’s payable to the holder of the TOB Trust Certificates, as reported in the Statements of Assets and Liabilities as TOB Trust Certificates, approximates its fair value.
Interest income, including amortization and accretion of premiums and discounts, from the underlying municipal bonds is recorded by a Trust on an accrual basis. Interest expense incurred on the TOB transaction and other expenses related to remarketing, administration, trustee, liquidity and other services to a TOB Trust are shown as interest expense, fees and amortization of offering costs in the Statements of Operations. Fees paid upon creation of the TOB Trust are recorded as debt issuance costs and are amortized to interest expense, fees and amortization of offering costs in the Statements of Operations to the expected maturity of the TOB Trust. In connection with the restructurings of the TOB Trusts to non-bank sponsored TOB Trusts, a Trust incurred non-recurring, legal and restructuring fees, which are recorded as interest expense and fees in the Statements of Operations.
For the six months ended June 30, 2016, the following table is a summary of the Trusts’ TOB Trusts:
| | | | | | | | | | | | | | | | | | | | |
| | | Underlying Municipal Bonds Transferred to TOB Trusts1 | | | Liability for TOB Trust Certificates2 | | | Interest Rate | | | Average TOB Trust Certificates Outstanding | | | Daily Weighted Average Interest Rate | |
BPK | | $ | 5,394,950 | | | $ | 3,750,000 | | | | 0.66% | | | $ | 3,750,000 | | | | 0.92% | |
| | 1 | | The municipal bonds transferred to a TOB Trust are generally high grade municipal bonds. In certain cases, when municipal bonds transferred are lower grade municipal bonds, the TOB transaction may include a credit enhancement feature that provides for the timely payment of principal and interest on the bonds to the TOB Trust by a credit enhancement provider in the event of default of the municipal bond. The TOB Trust would be responsible for the payment of the credit enhancement fee and the Trusts, as TOB Residuals holders, would be responsible for reimbursement of any payments of principal and interest made by the credit enhancement provider. The municipal bonds transferred to TOB Trusts with a credit enhancement are identified in the Schedules of Investments including the maximum potential amounts owed by the Trusts. |
| | 2 | | The Trusts may invest in TOB Trusts that are structured on a non-recourse or recourse basis. When a Trust invests in TOB Trusts on a non-recourse basis, the Liquidity Provider may be required to make a payment under the liquidity facility. In such an event, the Liquidity Provider will typically either (i) fund the full amount owed under the liquidity facility and be subsequently reimbursed from only the proceeds of the liquidation of all or a portion of the municipal bonds held in the TOB Trust or the remarketing of the TOB Trust Certificates, or (ii) liquidate all or a portion of the municipal bonds held in the TOB Trust and then fund the balance, if any, of the amount owed under the liquidity facility over the liquidation proceeds (the “Liquidation Shortfall”). If a Trust invests in a TOB Trust on a recourse basis, the Trusts will usually enter into a reimbursement agreement with the Liquidity Provider where the Trusts are required to reimburse the Liquidity Provider the amount of any Liquidation Shortfall. As a result, if a Trust invests in a recourse TOB Trust, a Trust will bear the risk of loss with respect to any Liquidation Shortfall. If multiple funds participate in any such TOB Trust, these losses will be shared ratably, including the maximum potential amounts owed by the Trusts at June 30, 2016, in proportion to their participation in the TOB Trust. The recourse TOB Trusts are identified in the Schedules of Investments including the maximum potential amounts owed by the Trusts at June 30, 2016. |
| | | | | | |
| | | | | | | |
| | SEMI-ANNUAL REPORT | | JUNE 30, 2016 | | 31 |
| | | | |
| Notes to Financial Statements (continued) | | |
5. Investment Advisory Agreement and Other Transactions with Affiliates:
The PNC Financial Services Group, Inc. is the largest stockholder and an affiliate of BlackRock, Inc. (“BlackRock”) for 1940 Act purposes.
Investment Advisory
Each Trust entered into an Investment Advisory Agreement with the Manager, the Trusts’ investment adviser, an indirect, wholly owned subsidiary of BlackRock, to provide investment advisory and administration services. The Manager is responsible for the management of each Trust’s portfolio and provides the personnel, facilities, equipment and certain other services necessary to the operations of each Trust.
For such services, each Trust pays the Manager a monthly fee, which is determined by calculating a percentage of each Trust’s average weekly managed assets based on an annual rate of 0.40%.
“Managed assets” mean the total assets of the Trust minus the sum of its accrued liabilities (other than the aggregate indebtedness constituting financial leverage).
Waivers
The Manager voluntarily agreed to waive its investment advisory fees by the amount of investment advisory fees each Trust pays to the Manager indirectly through its investment in affiliated money market funds. These amounts are shown as fees waived by the Manager in the Statements of Operations. However, the Manager does not waive its investment advisory fees by the amount of investment advisory fees paid in connection with each Trust’s investments in other affiliated investment companies, if any. For the six months ended June 30, 2016, the amounts waived were as follows:
| | | | | | | | |
| BJZ | | BPK | | | BLH | |
| $404 | | $ | 181 | | | $ | 679 | |
Officers and Trustees
Certain officers and/or Trustees of the Trusts are officers and/or directors of BlackRock or its affiliates. The Trusts reimburse the Manager for a portion of the compensation paid to the Trusts’ Chief Compliance Officer, which is included in Officer and Trustees in the Statements of Operations.
6. Purchases and Sales:
For the six months ended June 30, 2016, purchases and sales of investments, excluding short-term securities, were as follows:
| | | | | | | | | | | | |
| | | BJZ | | | BPK | | | BLH | |
Purchases | | $ | 11,118,607 | | | $ | 29,108,314 | | | $ | 1,892,092 | |
Sales | | $ | 10,594,078 | | | $ | 26,309,564 | | | $ | 763,776 | |
7. Income Tax Information:
It is the Trusts’ policy to comply with the requirements of the Internal Revenue Code of 1986, as amended, applicable to regulated investment companies, and to distribute substantially all of their taxable income to their shareholders. Therefore, no federal income tax provision is required.
Each Trust files U.S. federal and various state and local tax returns. No income tax returns are currently under examination. The statute of limitations on each Trust’s U.S. federal tax returns generally remains open for each of the four years ended December 31, 2015. The statutes of limitations on each Trust’s state and local tax returns may remain open for an additional year depending upon the jurisdiction.
Management has analyzed tax laws and regulations and their application to the Trusts as of June 30, 2016, inclusive of the open tax return years, and does not believe there are any uncertain tax positions that require recognition of a tax liability in the Trusts’ financial statements.
As of December 31, 2015, the Trusts had capital loss carryforwards available to offset future realized capital gains through the indicated expiration dates as follows:
| | | | | | | | | | | | |
| Expires December 31, | | BJZ | | | BPK | | | BLH | |
2017 | | $ | 641,932 | | | $ | 93,002 | | | | — | |
2018 | | | — | | | | — | | | $ | 288,836 | |
| | | | |
Total | | $ | 641,932 | | | $ | 93,002 | | | $ | 288,836 | |
| | | | |
| | | | | | |
| | | | | | | |
| 32 | | SEMI-ANNUAL REPORT | | JUNE 30, 2016 | | |
| | |
| Notes to Financial Statements (continued) | | |
As of June 30, 2016, gross unrealized appreciation and depreciation based on cost for federal income tax purposes were as follows:
| | | | | | | | | | | | |
| | | BJZ | | | BPK | | | BLH | |
Tax cost | | $ | 93,960,063 | | | $ | 238,205,956 | | | $ | 52,927,920 | |
| | | | |
Gross unrealized appreciation | | $ | 2,849,209 | | | $ | 6,604,517 | | | $ | 1,705,641 | |
Gross unrealized depreciation | | | (3,313 | ) | | | (901,107 | ) | | | (1,561 | ) |
| | | | |
Net unrealized appreciation | | $ | 2,845,896 | | | $ | 5,703,410 | | | $ | 1,704,080 | |
| | | | |
8. Principal Risks:
Many municipalities insure repayment of their bonds, which may reduce the potential for loss due to credit risk. The market value of these bonds may fluctuate for other reasons, including market perception of the value of such insurance, and there is no guarantee that the insurer will meet its obligation.
Inventories of municipal bonds held by brokers and dealers may decrease, which would lessen their ability to make a market in these securities. Such a reduction in market making capacity could potentially decrease a Trust’s ability to buy or sell bonds. As a result, a Trust may sell a security at a lower price, sell other securities to raise cash, or give up an investment opportunity, any of which could have a negative impact on performance. If a Trust needed to sell large blocks of bonds, those sales could further reduce the bonds’ prices and impact performance.
In the normal course of business, the Trusts invest in securities and enter into transactions where risks exist due to fluctuations in the market (market risk) or failure of the issuer to meet all its obligations, including the ability to pay principal and interest when due (issuer credit risk). The value of securities held by the Trusts may decline in response to certain events, including those directly involving the issuers of securities owned by the Trusts. Changes arising from the general economy, the overall market and local, regional or global political and/or social instability, as well as currency, interest rate and price fluctuations, may also affect the securities’ value.
Each Trust may be exposed to prepayment risk, which is the risk that borrowers may exercise their option to prepay principal earlier than scheduled during periods of declining interest rates, which would force each Trust to reinvest in lower yielding securities. Each Trust may also be exposed to reinvestment risk, which is the risk that income from each Trust’s portfolio will decline if each Trust invests the proceeds from matured, traded or called fixed income securities at market interest rates that are below each Trust portfolio’s current earnings rate.
The Trusts may hold a significant amount of bonds subject to calls by the issuers at defined dates and prices. When bonds are called by issuers and the Trusts reinvest the proceeds received, such investments may be in securities with lower yields than the bonds originally held, and correspondingly, could adversely impact the yield and total return performance of a Trust.
There is no assurance that the Trusts will achieve their investment objectives and the Trusts may return less than $15.00 per share. As the Trusts approach their scheduled termination dates, it is expected that the maturity of the Trusts’ portfolio securities will shorten, which is likely to reduce the Trusts’ income and distributions to shareholders.
It is possible that regulators could take positions that could limit the market for non-bank sponsored TOB Trust transactions or the Trusts’ ability to hold TOB Residuals. Under the new TOB Trust structure, the Trusts will have certain additional duties and responsibilities, which may give rise to certain additional risks including, but not limited to, compliance, securities law and operational risks.
There can be no assurance that the Trusts can successfully enter into restructured TOB Trust transactions in order to refinance their existing TOB Residuals holdings prior to the compliance date for the Volcker Rule, which may require that the Trusts unwind existing TOB Trusts. There can be no assurance that alternative forms of leverage will be available to the Trusts and any alternative forms of leverage may be more or less advantageous to the Trusts than existing TOB leverage.
Should short-term interest rates rise, the Trusts’ investments in TOB transactions may adversely affect the Trusts’ net investment income and dividends to Common Shareholders. Also, fluctuations in the market value of municipal bonds deposited into the TOB Trust may adversely affect the Trusts’ NAVs per share.
The SEC and various federal banking and housing agencies have adopted credit risk retention rules for securitizations (the “Risk Retention Rules”), which take effect in December 2016. The Risk Retention Rules would require the sponsor of a TOB Trust to retain at least 5% of the credit risk of the underlying assets supporting the TOB Trust’s municipal bonds. The Risk Retention Rules may adversely affect the Trusts’ ability to engage in TOB Trust transactions or increase the costs of such transactions in certain circumstances.
| | | | | | |
| | | | | | | |
| | SEMI-ANNUAL REPORT | | JUNE 30, 2016 | | 33 |
| | | | |
| Notes to Financial Statements (concluded) | | |
TOB Trust transactions constitute an important component of the municipal bond market. Accordingly, implementation of the Volcker Rule and Risk Retention Rules may adversely impact the municipal market, including through reduced demand for and liquidity of municipal bonds and increased financing costs for municipal issuers. Any such developments could adversely affect the Trusts. The ultimate impact of these rules on the TOB Trust market and the overall municipal market is not yet certain.
Counterparty Credit Risk: Similar to issuer credit risk, the Trusts may be exposed to counterparty credit risk, or the risk that an entity may fail to or be unable to perform on its commitments related to unsettled or open transactions. The Trusts manage counterparty credit risk by entering into transactions only with counterparties that the Manager believes have the financial resources to honor their obligations and by monitoring the financial stability of those counterparties. Financial assets, which potentially expose the Trusts to market, issuer and counterparty credit risks, consist principally of financial instruments and receivables due from counterparties. The extent of the Trusts’ exposure to market, issuer and counterparty credit risks with respect to these financial assets is approximately their value recorded in the Statements of Assets and Liabilities, less any collateral held by the Trusts.
Concentration Risk: BJZ and BLH invest a substantial amount of their assets in issuers located in a single state or limited number of states. This may subject each Trust to the risk that economic, political or social issues impacting a particular state or group of states could have an adverse and disproportionate impact on the income from, or the value or liquidity of, the Trusts’ respective portfolios. Investment percentages in specific states or U.S. territories are presented in the Schedules of Investments.
As of period end, BJZ invested a significant portion of its assets in securities in the utilities sector. BPK and BLH invested a significant portion of their assets in securities in the county, city, special district and school district sector. Changes in economic conditions affecting such sectors would have a greater impact on the Trusts and could affect the value, income and/or liquidity of positions in such securities.
The Trusts invest a significant portion of their assets in fixed-income securities and/or use derivatives tied to the fixed-income markets. Changes in market interest rates or economic conditions may affect the value and/or liquidity of such investments. Interest rate risk is the risk that prices of bonds and other fixed-income securities will increase as interest rates fall and decrease as interest rates rise. The Trusts may be subject to a greater risk of rising interest rates due to the current period of historically low rates.
9. Capital Share Transactions:
Each Trust is authorized to issue an unlimited number of shares, all of which were initially classified as Common Shares. The par value for each Trust’s Common Shares is $0.001. The Board is authorized, however, to reclassify any unissued Common Shares to Preferred Shares without approval of Common Shareholders.
Common Shares
For the six months ended June 30, 2016 and the year ended December 31, 2015, shares issued and outstanding remained constant for all Trusts.
10. Subsequent Events:
Management’s evaluation of the impact of all subsequent events on the Trusts’ financial statements was completed through the date the financial statements were issued and the following items were noted:
The Trusts paid a net investment income dividend in the following amounts per share on August 1, 2016 to shareholders of record on July 15, 2016:
| | | | |
| | | Common Dividend Per Share | |
BJZ | | $ | 0.0277 | |
BPK | | $ | 0.0278 | |
BLH | | $ | 0.0177 | |
Additionally, the Trusts declared a net investment income dividend on August 1, 2016 payable to Common Shareholders of record on August 15, 2016 for the same amounts noted above.
| | | | | | |
| | | | | | | |
| 34 | | SEMI-ANNUAL REPORT | | JUNE 30, 2016 | | |
| | |
| Disclosure of Investment Advisory Agreements | | |
The Board of Trustees (the “Board,” the members of which are referred to as “Board Members”) of BlackRock California Municipal 2018 Term Trust (“BJZ”), BlackRock Municipal 2018 Term Trust (“BPK”) and BlackRock New York Municipal 2018 Term Trust (“BLH” and together with BJZ and BPK, each a “Trust,” and, collectively, the “Trusts”) met in person on April 28, 2016 (the “April Meeting”) and June 9-10, 2016 (the “June Meeting”) to consider the approval of each Trust’s investment advisory agreement (each an “Agreement,” and, collectively, the “Agreements”) with BlackRock Advisors, LLC (the “Manager”), each Trust’s investment advisor. The Manager is also referred to herein as “BlackRock”.
Activities and Composition of the Board
On the date of the June Meeting, the Board of each Trust consisted of eleven individuals, nine of whom were not “interested persons” of the Trust as defined in the Investment Company Act of 1940, as amended (the “1940 Act”) (the “Independent Board Members”). The Board Members are responsible for the oversight of the operations of its Trust and perform the various duties imposed on the directors of investment companies by the 1940 Act. The Independent Board Members have retained independent legal counsel to assist them in connection with their duties. The Chair of each Board is an Independent Board Member. Each Board has established five standing committees: an Audit Committee, a Governance and Nominating Committee, a Compliance Committee, a Performance Oversight Committee, and an Executive Committee, each of which is chaired by an Independent Board Member and composed of Independent Board Members (except for the Executive Committee, which also has one interested Board Member).
The Agreements
Pursuant to the 1940 Act, each Board is required to consider the continuation of the Agreement for its Trust on an annual basis. Each Board has four quarterly meetings per year, each extending over two days, a fifth one-day meeting to consider specific information surrounding the consideration of renewing the Agreement for its Trust and additional in-person and telephonic meetings as needed. In connection with this year-long deliberative process, each Board assessed, among other things, the nature, extent and quality of the services provided to its Trust by BlackRock, BlackRock’s personnel and affiliates, including, as applicable; investment management, administrative, and shareholder services; the oversight of fund service providers; marketing; risk oversight; compliance; and ability to meet applicable legal and regulatory requirements.
Each Board, acting directly and through its committees, considers at each of its meetings, and from time to time as appropriate, factors that are relevant to its annual consideration of the renewal of the Agreement for its Trust, including the services and support provided by BlackRock to the Trust and its shareholders. BlackRock also furnished additional information to each Board in response to specific questions from the Board. This additional information is discussed further below in the section titled “Board Considerations in Approving the Agreements.” Among the matters each Board considered were: (a) investment performance for one-year, three-year, five-year, ten-year, and/or since inception periods, as applicable, against peer funds, applicable benchmarks, and performance metrics, as applicable, as well as senior management’s and portfolio managers’ analysis of the reasons for any over-performance or underperformance relative to its peers, benchmarks, and other performance metrics, as applicable; (b) fees, including advisory, administration, if applicable, paid to BlackRock and its affiliates by the Trust for services; (c) Trust operating expenses and how BlackRock allocates expenses to the Trust; (d) the resources devoted to, risk oversight of, and compliance reports relating to, implementation of the Trust’s investment objective(s), policies and restrictions, and meeting regulatory requirements; (e) the Trust’s compliance with its compliance policies and procedures; (f) the nature, cost and character of non-investment management services provided by BlackRock and its affiliates; (g) BlackRock’s and other service providers’ internal controls and risk and compliance oversight mechanisms; (h) BlackRock’s implementation of the proxy voting policies approved by the Board; (i) execution quality of portfolio transactions; (j) BlackRock’s implementation of the Trust’s valuation and liquidity procedures; (k) an analysis of management fees for products with similar investment mandates across the open-end fund, closed-end fund and institutional account product channels, as applicable, and the similarities and differences between these products and the services provided as compared to the Trust; (l) BlackRock’s compensation methodology for its investment professionals and the incentives and accountability it creates, along with investment professionals’ investments in the fund(s) they manage; and (m) periodic updates on BlackRock’s business.
Each Board considered BlackRock’s efforts during the past several years with regard to the redemption of outstanding auction rate preferred securities (“AMPS”). As of the date of this report each Trust has redeemed all of its outstanding AMPS.
Board Considerations in Approving the Agreements
The Approval Process: Prior to the April Meeting, each Board requested and received materials specifically relating to the Agreement for its Trust. Each Board is continuously engaged in a process with its independent legal counsel and BlackRock to review the nature and scope of the information provided to better assist its deliberations. The materials provided to the Board of each Trust in connection with the April Meeting included (a) information independently compiled and prepared by Broadridge Financial Solutions, Inc. (“Broadridge”) on Trust fees and expenses as compared with a peer group of funds as determined by Broadridge (“Expense Peers”) and the investment performance of the Trust as compared with a peer
| | | | | | |
| | | | | | | |
| | SEMI-ANNUAL REPORT | | JUNE 30, 2016 | | 35 |
| | |
| Disclosure of Investment Advisory Agreements (continued) |
group of funds as determined by Broadridge1; (b) information on the profits realized by BlackRock and its affiliates pursuant to the Trust’s Agreement and a discussion of fall-out benefits to BlackRock and its affiliates; (c) a general analysis provided by BlackRock concerning investment management fees charged to other clients, such as institutional clients, sub-advised mutual funds, and open-end funds, under similar investment mandates, as applicable; (d) review of non-management fees; (e) the existence, impact and sharing of potential economies of scale; and (f) a summary of aggregate amounts paid by the Trust to BlackRock.
At the April Meeting, each Board reviewed materials relating to its consideration of the Agreement for its Trust. As a result of the discussions that occurred during the April Meeting, and as a culmination of each Board’s year-long deliberative process, each Board presented BlackRock with questions and requests for additional information. BlackRock responded to these requests with additional written information in advance of the June Meeting.
At the June Meeting, each Board, including the Independent Board Members, unanimously approved the continuation of the Agreement between the Manager and its Trust for a one-year term ending June 30, 2017. In approving the continuation of the Agreement for its Trust, each Board considered: (a) the nature, extent and quality of the services provided by BlackRock; (b) the investment performance of the Trust; (c) the advisory fee and the cost of the services and profits to be realized by BlackRock and its affiliates from their relationship with the Trust; (d) the Trust’s costs to investors compared to the costs of Expense Peers and performance compared to the relevant performance metrics as previously discussed; (e) the sharing of potential economies of scale; (f) fall-out benefits to BlackRock and its affiliates as a result of its relationship with the Trust; and (g) other factors deemed relevant by the Board Members.
Each Board also considered other matters it deemed important to the approval process, such as other payments made to BlackRock or its affiliates relating to securities lending and cash management, services related to the valuation and pricing of Trust portfolio holdings, and advice from independent legal counsel with respect to the review process and materials submitted for the Board’s review. Each Board noted the willingness of BlackRock personnel to engage in open, candid discussions with the Board. Each Board did not identify any particular information as determinative, and each Board Member may have attributed different weights to the various items considered.
A. Nature, Extent and Quality of the Services Provided by BlackRock: Each Board, including the Independent Board Members, reviewed the nature, extent and quality of services provided by BlackRock, including the investment advisory services and the resulting performance of its Trust. Throughout the year, each Board compared its Trust’s performance to the performance of a comparable group of closed-end funds, relevant benchmark, and performance metrics, as applicable. Each Board met with BlackRock’s senior management personnel responsible for investment activities, including the senior investment officers. Each Board also reviewed the materials provided by its Trust’s portfolio management team discussing the Trust’s performance and the Trust’s investment objective(s), strategies and outlook.
Each Board considered, among other factors, with respect to BlackRock: the number, education and experience of investment personnel generally and its Trust’s portfolio management team; BlackRock’s research capabilities; investments by portfolio managers in the funds they manage; portfolio trading capabilities; use of technology; commitment to compliance; credit analysis capabilities; risk analysis and oversight capabilities; and the approach to training and retaining portfolio managers and other research, advisory and management personnel. Each Board engaged in a review of BlackRock’s compensation structure with respect to the Trust’s portfolio management team and BlackRock’s ability to attract and retain high-quality talent and create performance incentives.
In addition to investment advisory services, each Board considered the quality of the administrative and other non-investment advisory services provided to its Trust. BlackRock and its affiliates provide each Trust with certain administrative, shareholder, and other services (in addition to any such services provided to the Trust by third parties) and officers and other personnel as are necessary for the operations of the Trust. In particular, BlackRock and its affiliates provide each Trust with administrative services including, among others: (i) preparing disclosure documents, such as the prospectus and the statement of additional information in connection with the initial public offering and periodic shareholder reports; (ii) preparing communications with analysts to support secondary market trading of the Trust; (iii) preparing periodic filings with regulators; (iv) oversight of daily accounting and pricing; (v) preparing periodic filings with regulators and stock exchanges; (vi) overseeing and coordinating the activities of other service providers; (vii) organizing Board meetings and preparing the materials for such Board meetings; (viii) providing legal and compliance support; (ix) furnishing analytical and other support to assist the Board in its consideration of strategic issues such as the merger, consolidation or repurposing of certain closed-end funds; and (x) performing other administrative functions necessary for the operation of the Trust, such as tax reporting, fulfilling regulatory filing requirements and call center services. Each Board reviewed the structure and duties of BlackRock’s fund administration, shareholder
| 1 | | Funds are ranked by Broadridge in quartiles, ranging from first to fourth, where first is the most desirable quartile position and fourth is the least desirable. |
| | | | | | |
| | | | | | | |
| 36 | | SEMI-ANNUAL REPORT | | JUNE 30, 2016 | | |
| | |
| Disclosure of Investment Advisory Agreements (continued) |
services, and legal & compliance departments and considered BlackRock’s policies and procedures for assuring compliance with applicable laws and regulations.
B. The Investment Performance of the Trusts and BlackRock: Each Board, including the Independent Board Members, also reviewed and considered the performance history of its Trust. In preparation for the April Meeting, the Board of each Trust was provided with reports independently prepared by Broadridge, which included a comprehensive analysis of the Trust’s performance. Each Board also reviewed a narrative and statistical analysis of the Broadridge data that was prepared by BlackRock. In connection with its review, the Board of each Trust received and reviewed information regarding the investment performance, based on net asset value (NAV), of the Trust as compared to other funds in its applicable Broadridge category. Each Board was provided with a description of the methodology used by Broadridge to select peer funds and periodically meets with Broadridge representatives to review its methodology. Each Board was provided with information on the composition of the Broadridge performance universes and expense universes. Each Board and its Performance Oversight Committee regularly review, and meet with Trust management to discuss, the performance of its Trust throughout the year.
In evaluating performance, each Board recognized that the performance data reflects a snapshot of a period as of a particular date and that selecting a different performance period could produce significantly different results. Further, each Board recognized that it is possible that long-term performance can be adversely affected by even one period of significant underperformance so that a single investment decision or theme has the ability to affect long-term performance disproportionately.
Each Board noted that for each of the one-, three- and five-year periods reported, its Trust ranked in the fourth quartile against its Performance Universe Composite. BlackRock believes that the Composite is an appropriate performance metric for each Trust. The Composite measures a blend of total return and yield. Each Board and BlackRock reviewed and discussed the reasons for its Trust’s performance during these periods. Each Board was informed that, among other things, its Trust has a targeted maturity, and as such is managed to achieve the specific maturity goal. The peer funds within the Performance Universe generally do not have a similar specific maturity goal.
C. Consideration of the Advisory/Management Fees and the Cost of the Services and Profits to be Realized by BlackRock and its Affiliates from their Relationship with the Trusts: Each Board, including the Independent Board Members, reviewed its Trust’s contractual management fee rate compared with the other funds in its Broadridge category. The contractual management fee rate represents a combination of the advisory fee and any administrative fees, before taking into account any reimbursements or fee waivers. Each Board also compared its Trust’s total expense ratio, as well as its actual management fee rate as a percentage of total assets, to those of other funds in its Broadridge category. The total expense ratio represents a fund’s total net operating expenses, excluding any investment related expenses. The total expense ratio gives effect to any expense reimbursements or fee waivers that benefit a fund, and the actual management fee rate gives effect to any management fee reimbursements or waivers that benefit a fund. Each Board considered the services provided and the fees charged by BlackRock and its affiliates to other types of clients with similar investment mandates, as applicable, including institutional accounts and sub-advised mutual funds (including mutual funds sponsored by third parties).
Each Board received and reviewed statements relating to BlackRock’s financial condition. Each Board reviewed BlackRock’s profitability methodology and was also provided with a profitability analysis that detailed the revenues earned and the expenses incurred by BlackRock for services provided to its Trust. Each Board reviewed BlackRock’s profitability with respect to its Trust and other funds the Board currently oversees for the year ended December 31, 2015 compared to available aggregate profitability data provided for the prior two years. Each Board reviewed BlackRock’s profitability with respect to certain other U.S. fund complexes managed by the Manager and/or its affiliates. Each Board reviewed BlackRock’s assumptions and methodology of allocating expenses in the profitability analysis, noting the inherent limitations in allocating costs among various advisory products. Each Board recognized that profitability may be affected by numerous factors including, among other things, fee waivers and expense reimbursements by the Manager, the types of funds managed, precision of expense allocations and business mix. As a result, calculating and comparing profitability at individual fund level is difficult.
Each Board noted that, in general, individual fund or product line profitability of other advisors is not publicly available. Each Board reviewed BlackRock’s overall operating margin, in general, compared to that of certain other publicly-traded asset management firms. Each Board considered the differences between BlackRock and these other firms, including the contribution of technology at BlackRock, BlackRock’s expense management, and the relative product mix.
In addition, each Board considered the cost of the services provided to its Trust by BlackRock, and BlackRock’s and its affiliates’ profits relating to the management of its Trust and the other funds advised by BlackRock and its affiliates. As part of its analysis, each Board reviewed BlackRock’s methodology in allocating its costs of managing its Trust, to the Trust. Each Board may receive and review information from independent third parties
| | | | | | |
| | | | | | | |
| | SEMI-ANNUAL REPORT | | JUNE 30, 2016 | | 37 |
| | | | |
| Disclosure of Investment Advisory Agreements (continued) |
as part of its annual evaluation. Each Board considered whether BlackRock has the financial resources necessary to attract and retain high quality investment management personnel to perform its obligations under the Trust’s Agreement and to continue to provide the high quality of services that is expected by the Board. Each Board further considered factors including but not limited to BlackRock’s commitment of time, assumption of risk, and liability profile in servicing its Trust in contrast to what is required of BlackRock with respect to other products with similar investment mandates across the open-end fund, ETF, closed-end fund, sub-advised mutual fund and institutional account product channels, as applicable.
Each Board noted that its Trust’s contractual management fee rate ranked in the first quartile, and that the actual management fee rate and total expense ratio each ranked in the first quartile, relative to the Expense Peers.
D. Economies of Scale: Each Board, including the Independent Board Members, considered the extent to which economies of scale might be realized as the assets of its Trust increase. Each Board also considered the extent to which its Trust benefits from such economies in a variety of ways, and whether there should be changes in the advisory fee rate or breakpoint structure in order to enable the Trust to more fully participate in these economies of scale. The Board considered the Trust’s asset levels and whether the current fee was appropriate.
Based on each Board’s review and consideration of the issue, each Board concluded that most closed-end funds do not have fund level breakpoints because closed-end funds generally do not experience substantial growth after the initial public offering. They are typically priced at scale at a fund’s inception.
E. Other Factors Deemed Relevant by the Board Members: Each Board, including the Independent Board Members, also took into account other ancillary or “fall-out” benefits that BlackRock or its affiliates may derive from their respective relationships with its Trust, both tangible and intangible, such as BlackRock’s ability to leverage its investment professionals who manage other portfolios and risk management personnel, an increase in BlackRock’s profile in the investment advisory community, and the engagement of BlackRock’s affiliates as service providers to the Trust, including for administrative, securities lending and cash management services. Each Board also considered BlackRock’s overall operations and its efforts to expand the scale of, and improve the quality of, its operations. Each Board also noted that BlackRock may use and benefit from third party research obtained by soft dollars generated by certain registered fund transactions to assist in managing all or a number of its other client accounts. Each Board further noted that it had considered the investment by BlackRock’s funds in affiliated exchange traded funds (i.e., ETFs) without any offset against the management fees payable by the funds to BlackRock.
In connection with its consideration of the Agreement for its Trust, each Board also received information regarding BlackRock’s brokerage and soft dollar practices. Each Board received reports from BlackRock which included information on brokerage commissions and trade execution practices throughout the year.
Each Board noted the competitive nature of the closed-end fund marketplace, and that shareholders are able to sell their Trust shares in the secondary market if they believe that the Trust’s fees and expenses are too high or if they are dissatisfied with the performance of the Trust.
Each Board also considered the various notable initiatives and projects BlackRock performed in connection with its closed-end fund product line. These initiatives included the redemption of AMPS for the BlackRock closed-end funds with AMPS outstanding, including the completion of the redemption of AMPS for the Trusts; developing equity shelf programs; efforts to eliminate product overlap with fund mergers; ongoing services to manage leverage that has become increasingly complex; periodic evaluation of share repurchases and other support initiatives for certain BlackRock funds; and continued communications efforts with shareholders, fund analysts and financial advisers. With respect to the latter, the Independent Board Members noted BlackRock’s continued commitment to supporting the secondary market for the common shares of its closed-end funds through a comprehensive secondary market communication program designed to raise investor and analyst awareness and understanding of closed-end funds. BlackRock’s support services included, among other things: continuing communications concerning the redemption efforts related to AMPS; sponsoring and participating in conferences; communicating with closed-end fund analysts covering the BlackRock funds throughout the year; providing marketing and product updates for the closed-end funds; and maintaining and enhancing its closed-end fund website.
Conclusion
Each Board, including the Independent Board Members, unanimously approved the continuation of the Agreement between the Manager and its Trust for a one-year term ending June 30, 2017. Based upon its evaluation of all of the aforementioned factors in their totality, as well as other information, each Board, including the Independent Board Members, was satisfied that the terms of Agreement for its Trust were fair and reasonable and in the best interest of the Trust and its shareholders. In arriving at its decision to approve the Agreement for its Trust, each Board did not identify any single factor or group of factors as, all-important or controlling, but considered all factors together, and different Board Members may have attributed different weights to the various factors considered. The Independent Board Members were also assisted by the advice of independent legal counsel in
| | | | | | |
| | | | | | | |
| 38 | | SEMI-ANNUAL REPORT | | JUNE 30, 2016 | | |
| | |
| Disclosure of Investment Advisory Agreements (concluded) |
making this determination. The contractual fee arrangements for each Trust reflect the results of several years of review by the Trust’s Board Members and predecessor Board Members, and discussions between such Board Members (and predecessor Board Members) and BlackRock. As a result, the Board Members’ conclusions may be based in part on their consideration of these arrangements in prior years.
| | | | | | |
| | | | | | | |
| | SEMI-ANNUAL REPORT | | JUNE 30, 2016 | | 39 |
Richard E. Cavanagh, Chair of the Board and Trustee
Karen P. Robards, Vice Chair of the Board and Trustee
Michael J. Castellano, Trustee
Cynthia L. Egan, Trustee
Frank J. Fabozzi, Trustee
Jerrold B. Harris, Trustee
R. Glenn Hubbard, Trustee
Catherine A. Lynch, Trustee
W. Carl Kester, Trustee
Barbara G. Novick, Interested Trustee
John M. Perlowski, Interested Trustee, President and Chief Executive Officer
Jonathan Diorio, Vice President
Neal J. Andrews, Chief Financial Officer
Jay M. Fife, Treasurer
Charles Park, Chief Compliance Officer
Janey Ahn, Secretary
Effective March 1, 2016, Catherine A. Lynch was appointed to serve as a Trustee of the Trusts.
Effective April 1, 2016, Cynthia L. Egan was appointed to serve as a Trustee of the Trusts.
Effective July 1, 2016, Ted Jaeckel was removed as a portfolio manager of BJZ and BLH. The portfolio managers are Phil Soccio and Walter O’Connor.
Effective July 1, 2016, Walter O’Connor was removed as a portfolio manager of BPK. The portfolio managers are Phil Soccio and Ted Jaeckel.
| | | | |
| | | |
Investment Adviser BlackRock Advisors, LLC Wilmington, DE 19809 | | Transfer Agent Computershare Trust Company, N.A. Canton, MA 02021 | | Independent Registered Public Accounting Firm Deloitte & Touche LLP Boston, MA 02116 |
| | |
Accounting Agent and Custodian
State Street Bank and Trust Company Boston, MA 02110 | | Legal Counsel Skadden, Arps, Slate, Meagher & Flom LLP Boston, MA 02116 | | Address of the Trusts 100 Bellevue Parkway Wilmington, DE 19809 |
| | | | | | |
| | | | | | | |
| 40 | | SEMI-ANNUAL REPORT | | JUNE 30, 2016 | | |
The Trusts are listed for trading on the NYSE and have filed with the NYSE their annual chief executive officer certification regarding compliance with the NYSE’s listing standards. The Trusts filed with the Securities and Exchange Commission (“SEC”) the certification of its chief executive officer and chief financial officer required by section 302 of the Sarbanes-Oxley Act.
Each Trust’s dividend policy is to distribute all or a portion of its net investment income to its shareholders on a monthly basis. In order to provide shareholders with a more stable level of dividend distributions, the Trusts may at times pay out less than the entire amount of net investment income earned in any particular month and may at times in any particular month pay out such accumulated but undistributed income in addition to net investment income earned in that month. As a result, the distributions paid by the Trusts for any particular month may be more or less than the amount of net investment income earned by the Trusts during such month. The Trusts’ current accumulated but undistributed net investment income, if any, is disclosed in the Statements of Assets and Liabilities, which comprises part of the financial information included in this report.
| | | | | | |
| | | | | | | |
| | SEMI-ANNUAL REPORT | | JUNE 30, 2016 | | 41 |
| | |
| Additional Information (continued) | | |
The Trusts do not make available copies of their Statements of Additional Information because the Trusts’ shares are not continuously offered, which means that the Statement of Additional Information of each Trust has not been updated after completion of the respective Trust’s offerings and the information contained in each Trust’s Statement of Additional Information may have become outdated.
During the period, there were no material changes in the Trusts’ investment objectives or policies or to the Trusts’ charters or by-laws that would delay or prevent a change of control of the Trusts that were not approved by the shareholders or in the principal risk factors associated with investment in the Trusts. Except as described on page 40, there have been no changes in the persons who are primarily responsible for the day-to-day management of the Trusts’ portfolios.
Quarterly performance, semi-annual and annual reports, current net asset value and other information regarding the Trusts may be found on BlackRock’s website, which can be accessed at http://www.blackrock.com. This reference to BlackRock’s website is intended to allow investors public access to information regarding the Trusts and does not, and is not intended to, incorporate BlackRock’s website in this report.
Electronic Delivery
Shareholders can sign up for e-mail notifications of quarterly statements, annual and semi-annual shareholder reports by enrolling in the electronic delivery program. Electronic copies of shareholder reports are available on BlackRock’s website.
To enroll in electronic delivery:
Shareholders Who Hold Accounts with Investment Advisers, Banks or Brokerages:
Please contact your financial advisor. Please note that not all investment advisers, banks or brokerages may offer this service.
Householding
The Trusts will mail only one copy of shareholder documents, including annual and semi-annual reports and proxy statements, to shareholders with multiple accounts at the same address. This practice is commonly called “householding” and is intended to reduce expenses and eliminate duplicate mailings of shareholder documents. Mailings of your shareholder documents may be householded indefinitely unless you instruct us otherwise. If you do not want the mailing of these documents to be combined with those for other members of your household, please call the Trusts at (800) 882-0052.
Availability of Quarterly Schedule of Investments
The Trusts file their complete schedule of portfolio holdings with the SEC for the first and third quarters of each fiscal year on Form N-Q. The Trusts’ Forms N-Q are available on the SEC’s website at http://www.sec.gov and may also be reviewed and copied at the SEC’s Public Reference Room in Washington, D.C. Information on the operation of the Public Reference Room or how to access documents on the SEC’s website without charge may be obtained by calling (800) SEC-0330. The Trusts’ Forms N-Q may also be obtained upon request and without charge by calling (800) 882-0052.
Availability of Proxy Voting Policies and Procedures
A description of the policies and procedures that the Trusts use to determine how to vote proxies relating to portfolio securities is available upon request and without charge (1) by calling (800) 882-0052; (2) at http://www.blackrock.com; and (3) on the SEC’s website at http://www.sec.gov.
Availability of Proxy Voting Record
Information about how the Trusts voted proxies relating to securities held in the Trusts’ portfolios during the most recent 12-month period ended June 30 is available upon request and without charge (1) at http://www.blackrock.com; or by calling (800) 882-0052; and (2) on the SEC’s website at http://www.sec.gov.
Availability of Trust Updates
BlackRock will update performance and certain other data for the Trusts on a monthly basis on its website in the “Closed-end Funds” section of http://www.blackrock.com as well as certain other material information as necessary from time to time. Investors and others are advised to check the website for updated performance information and the release of other material information about the Trusts. This reference to BlackRock’s website is intended to allow investors public access to information regarding the Trusts and does not, and is not intended to, incorporate BlackRock’s website in this report.
| | | | | | |
| | | | | | | |
| 42 | | SEMI-ANNUAL REPORT | | JUNE 30, 2016 | | |
| | | | |
| Additional Information (concluded) | | |
|
| BlackRock Privacy Principles |
BlackRock is committed to maintaining the privacy of its current and former fund investors and individual clients (collectively, “Clients”) and to safeguarding their non-public personal information. The following information is provided to help you understand what personal information BlackRock collects, how we protect that information and why in certain cases we share such information with select parties.
If you are located in a jurisdiction where specific laws, rules or regulations require BlackRock to provide you with additional or different privacy-related rights beyond what is set forth below, then BlackRock will comply with those specific laws, rules or regulations.
BlackRock obtains or verifies personal non-public information from and about you from different sources, including the following: (i) information we receive from you or, if applicable, your financial intermediary, on applications, forms or other documents; (ii) information about your transactions with us, our affiliates, or others; (iii) information we receive from a consumer reporting agency; and (iv) from visits to our websites.
BlackRock does not sell or disclose to non-affiliated third parties any non-public personal information about its Clients, except as permitted by law or as is necessary to respond to regulatory requests or to service Client accounts. These non-affiliated third parties are required to protect the confidentiality and security of this information and to use it only for its intended purpose.
We may share information with our affiliates to service your account or to provide you with information about other BlackRock products or services that may be of interest to you. In addition, BlackRock restricts access to non-public personal information about its Clients to those BlackRock employees with a legitimate business need for the information. BlackRock maintains physical, electronic and procedural safeguards that are designed to protect the non-public personal information of its Clients, including procedures relating to the proper storage and disposal of such information.
| | | | | | |
| | | | | | | |
| | SEMI-ANNUAL REPORT | | JUNE 30, 2016 | | 43 |
This report is intended for current holders. It is not a prospectus. Past performance results shown in this report should not be considered a representation of future performance. Certain Trusts have leveraged their Common Shares, which creates risks for Common Shareholders, including the likelihood of greater volatility of net asset value and market price of the Common Shares, and the risk that fluctuations in short-term interest rates may reduce the Common Shares’ yield. Statements and other information herein are as dated and are subject to change.

| | |
| CEF-BK3-6/16-SAR | | |
| |
| |  |
Item 2 – Code of Ethics – Not Applicable to this semi-annual report
Item 3 – Audit Committee Financial Expert – Not Applicable to this semi-annual report
Item 4 – Principal Accountant Fees and Services – Not Applicable to this semi-annual report
Item 5 – Audit Committee of Listed Registrants – Not Applicable to this semi-annual report
Item 6 – Investments
(a) The registrant’s Schedule of Investments is included as part of the Report to Stockholders filed under Item 1 of this Form.
(b) Not Applicable due to no such divestments during the semi-annual period covered since the previous Form N-CSR filing.
Item 7 – Disclosure of Proxy Voting Policies and Procedures for Closed-End Management Investment Companies – Not Applicable to this semi-annual report
Item 8 – Portfolio Managers of Closed-End Management Investment Companies
(a) Not Applicable to this semi-annual report
(b) Effective July 1, 2016, Mr. O’Connor was removed as portfolio manager.
Item 9 – Purchases of Equity Securities by Closed-End Management Investment Company and Affiliated Purchasers – Not Applicable
Item 10 – Submission of Matters to a Vote of Security Holders – There have been no material changes to these procedures.
Item 11 – Controls and Procedures
(a) – The registrant’s principal executive and principal financial officers, or persons performing similar functions, have concluded that the registrant’s disclosure controls and procedures (as defined in Rule 30a-3(c) under the Investment Company Act of 1940, as amended (the “1940 Act”)) are effective as of a date within 90 days of the filing of this report based on the evaluation of these controls and procedures required by Rule 30a-3(b) under the 1940 Act and Rule 13a-15(b) under the Securities Exchange Act of 1934, as amended.
(b) – There were no changes in the registrant’s internal control over financial reporting (as defined in Rule 30a-3(d) under the 1940 Act) that occurred during the second fiscal quarter of the period covered by this report that have materially affected, or are reasonably likely to materially affect, the registrant’s internal control over financial reporting.
Item 12 – Exhibits attached hereto
(a)(1) – Code of Ethics – Not Applicable to this semi-annual report
(a)(2) – Certifications – Attached hereto
(a)(3) – Not Applicable
(b) – Certifications – Attached hereto
2
Pursuant to the requirements of the Securities Exchange Act of 1934 and the Investment Company Act of 1940, the registrant has duly caused this report to be signed on its behalf by the undersigned, thereunto duly authorized.
BlackRock Municipal 2018 Term Trust
| | | | |
| By: | | /s/ John M. Perlowski | | |
| | John M. Perlowski |
| | Chief Executive Officer (principal executive officer) of |
| | BlackRock Municipal 2018 Term Trust |
Date: September 2, 2016
Pursuant to the requirements of the Securities Exchange Act of 1934 and the Investment Company Act of 1940, this report has been signed below by the following persons on behalf of the registrant and in the capacities and on the dates indicated.
| | | | |
| By: | | /s/ John M. Perlowski | | |
| | John M. Perlowski |
| | Chief Executive Officer (principal executive officer) of |
| | BlackRock Municipal 2018 Term Trust |
| |
Date: September 2, 2016 | | |
| | |
By: | | /s/ Neal J. Andrews | | |
| | Neal J. Andrews |
| | Chief Financial Officer (principal financial officer) of |
| | BlackRock Municipal 2018 Term Trust |
Date: September 2, 2016
3