


Searchable text section of graphics shown above
[GRAPHIC]
Forward Looking Statements
Statements contained in this presentation that state either company’s or their management’s expectations or predictions of future events are forward-looking statements intended to be covered by the safe harbor provisions of the Securities Act of 1933 and the Securities Exchange Act of 1934. The words “believe,” “expect,” “should,” “estimates,” and other similar expressions identify forward-looking statements. It is important to note that either company’s actual results could differ materially from those projected in their forward-looking statements. For more information concerning factors that could cause actual results to differ from those expressed or forecasted, see the proxy statement/prospectus regarding the proposed merger, which is included with the Form S-4 Registration Statement filed with the Securities and Exchange Commission on May 20, 2005 (as the same may be supplemented or amended). Also see both companies’ annual reports on Form 10-K and quarterly reports on Form 10-Q, filed with the Securities and Exchange Commission and available on the companies’ respective web sites at http://www.valero.com and http://www.premcor.com.
[LOGO]
2
Proxy Statement/Prospectus
Investors and security holders are urged to read the proxy statement/prospectus regarding the proposed merger, which is included with the Form S-4 Registration Statement filed with the Securities and Exchange Commission on May 20, 2005 (as the same may be supplemented or amended). The proxy statement/prospectus contains important information and will, when finalized, be sent to Premcor stockholders. Investors and security holders may obtain a free copy of the proxy statement/prospectus, when it is available, and other documents filed by Valero and Premcor with the SEC at the SEC’s web site at www.sec.gov. The proxy statement/prospectus and these other documents may also be obtained, when available, free of charge from Valero and Premcor.
Premcor and its directors, executive officers and certain other employees, may be deemed to be soliciting proxies from stockholders in favor of the approval of the merger and related matters. Information regarding the persons who may, under SEC rules, be deemed to be participants in the solicitation of Premcor stockholders in connection with the merger is set forth in the proxy statement/prospectus referred to above.
3
Valero at a Glance
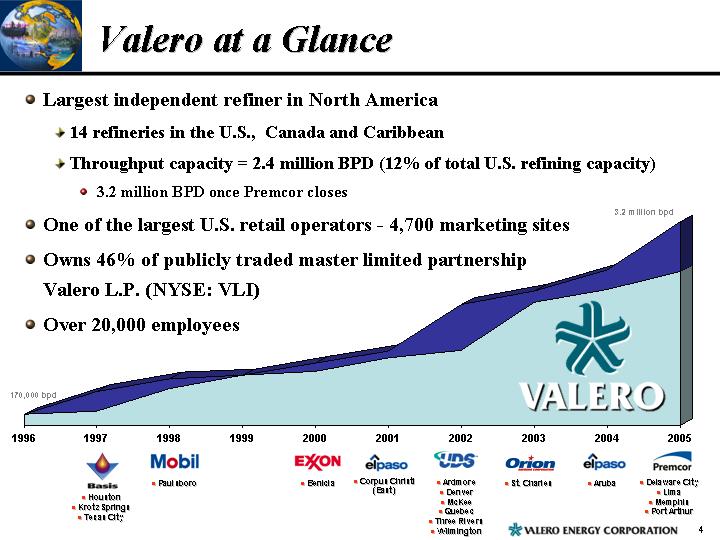
• Largest independent refiner in North America
• 14 refineries in the U.S., Canada and Caribbean
• Throughput capacity = 2.4 million BPD (12% of total U.S. refining capacity)
• 3.2 million BPD once Premcor closes
• One of the largest U.S. retail operators - 4,700 marketing sites
• Owns 46% of publicly traded master limited partnership Valero L.P. (NYSE: VLI)
• Over 20,000 employees
[CHART]
[LOGO] | [LOGO] | [LOGO] | [LOGO] | [LOGO] | [LOGO] | [LOGO] | [LOGO] |
• Houston | • Paulsboro | • Benicia | • Corpus Christi | • Ardmore | • St. Charles | • Aruba | • Delaware City |
• Krotz Springs |
|
| (East) | • Denver |
|
| • Lima |
• Texas City |
|
|
| • McKee |
|
| • Memphis |
|
|
|
| • Quebec |
|
| • Port Arthur |
|
|
|
| • Three Rivers |
|
|
|
|
|
|
| • Wilmington |
|
|
|
4
Right Business, Right Time
• 2004 – A record year
• $6.53 EPS and 98% Total Shareholder Return
• Two-for-one stock split
• Added to the S&P 500
• 2005 – Expect another record year [GRAPHIC]
• 1Q05 EPS of $1.92
• 2Q05 EPS guidance of about $3.00
• First Call full year EPS of $7.51 is too low
• Balance sheet in great shape
• 29.6% Debt-to-cap at 3/31/05
• Market capitalization of $20 Billion
5
Valero Acquiring Premcor
• Announced $8 billion acquisition of Premcor April 25th
• Approximately 50/50 cash and stock consideration
• Assuming $1.8 billion of Premcor long-term debt
• Cash consideration will be financed with a combination of cash on hand, bank debt, and/or proceeds from a public debt offering
• Closing expected on or before December 31, 2005, subject to FTC and Premcor shareholder approval
[LOGO] |
| [LOGO] |
6
Strategic Rationale
• Premcor assets a great fit with Valero
• Combined company would be largest refiner in North America
• Enhanced geographic diversity, which further increases earnings stability
• Aligned strategies that further increase exposure to light-heavy spread
• Combined entity would process around 1 million bpd of Maya-like crudes by 2007
• Premcor assets provide profit improvement opportunities
• Ample optimization and strategic opportunities
• Valero has proven track record of increasing reliability, capacity and yields
• Market value of refining assets approaching replacement costs
• Scarcity of quality U.S. refining assets
• Acquiring 790 mbpd of capacity at 70% of current replacement cost
7
Financial Benefits
• Expected to be significantly accretive to earnings and cash flow per share
• 14% accretive to estimated 2006 Case earnings per share
• 13% accretive to estimated 2006 Case cash flow per share [GRAPHIC]
• Expect at least $350 million of annually recurring synergies
• Expect to retain investment grade credit rating
8
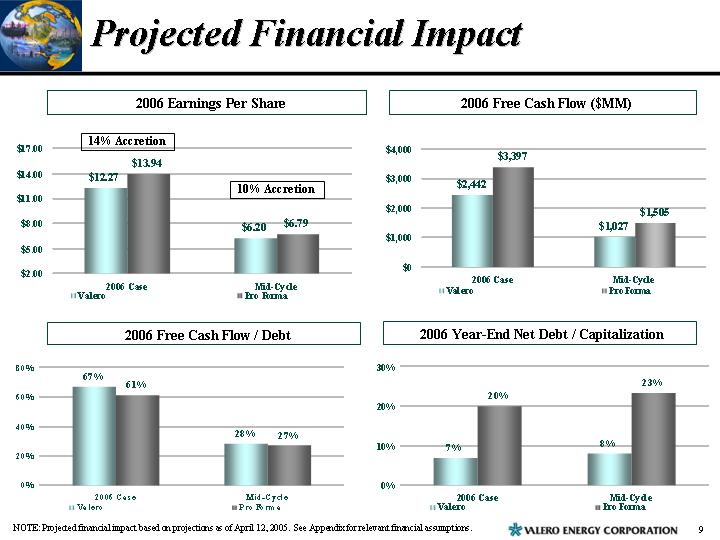
Projected Financial Impact
2006 Earnings Per Share |
| 2006 Free Cash Flow ($MM) |
|
|
|
[CHART] |
| [CHART] |
|
|
|
2006 Free Cash Flow / Debt |
| 2006 Year-End Net Debt / Capitalization |
|
|
|
[CHART] |
| [CHART] |
NOTE: Projected financial impact based on projections as of April 12, 2005. See Appendix for relevant financial assumptions.
9
2005 – Expect Another Record Year
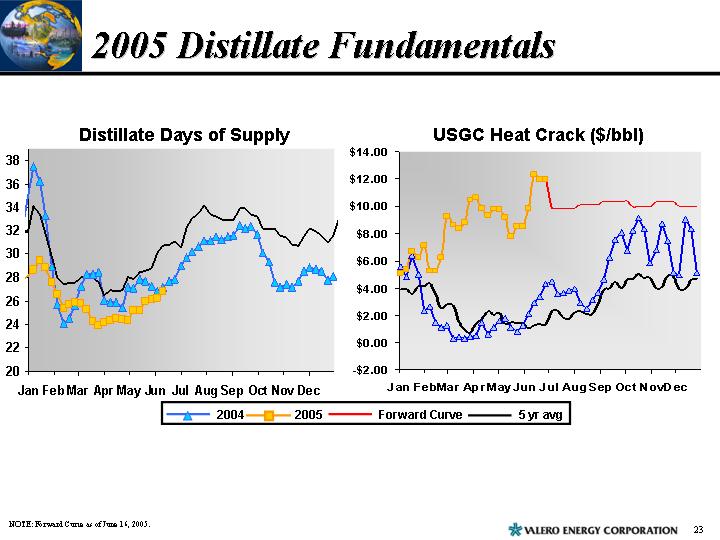
• Outstanding distillate fundamentals
• U.S. low sulfur distillate demand up 2.2% YTD
• Distillate imports down 26% YTD
• U.S. distillate days-of-supply at 5-year lows
• 2005 U.S. Gulf Coast forward curve indicating around $10.00 per barrel vs. 2004 average of below $3.95 per barrel
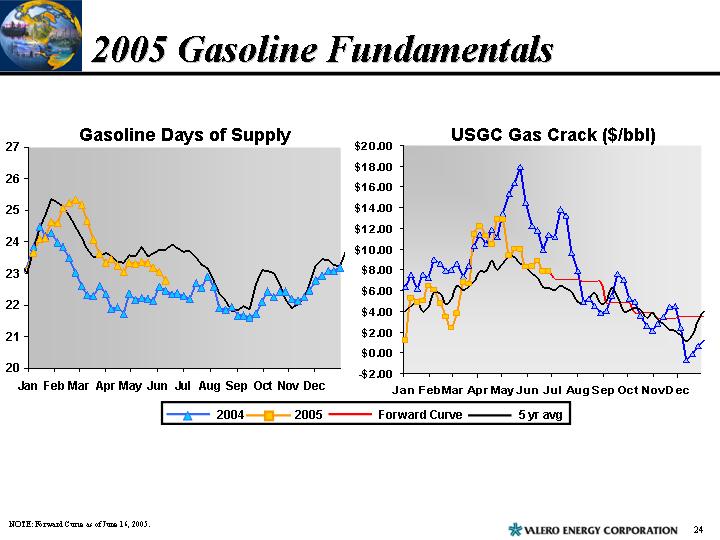
• Strong gasoline fundamentals as well
• U.S. gasoline demand up 1.1% YTD over 2004
• U.S. gasoline days-of-supply below 5-year average
• 2005 U.S. Gulf Coast forward curve indicating around $6.25 per barrel vs. 2004 average of $7.69 per barrel
• Lower than last year, but still very good
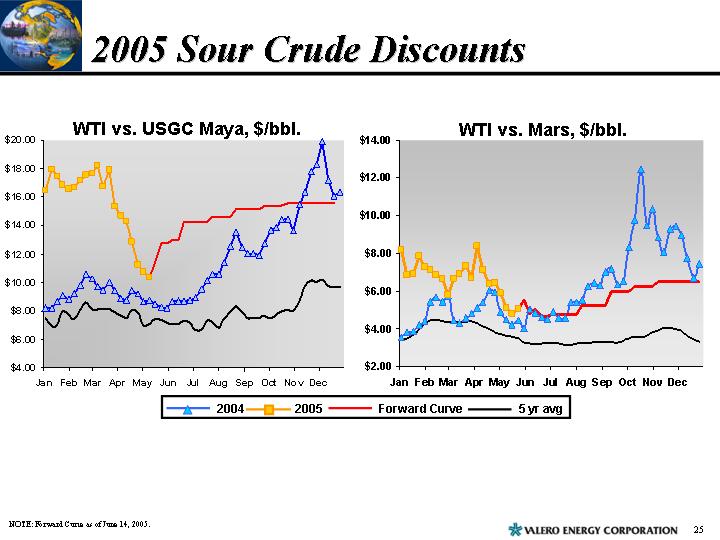
• Record sour crude discounts
• 2005 heavy sour crude discounts (Maya) averaging over $15.00 per barrel YTD vs. last year’s average discount of around $9.00 per barrel YTD
• Forward curves for Maya and Mars indicating record year
10
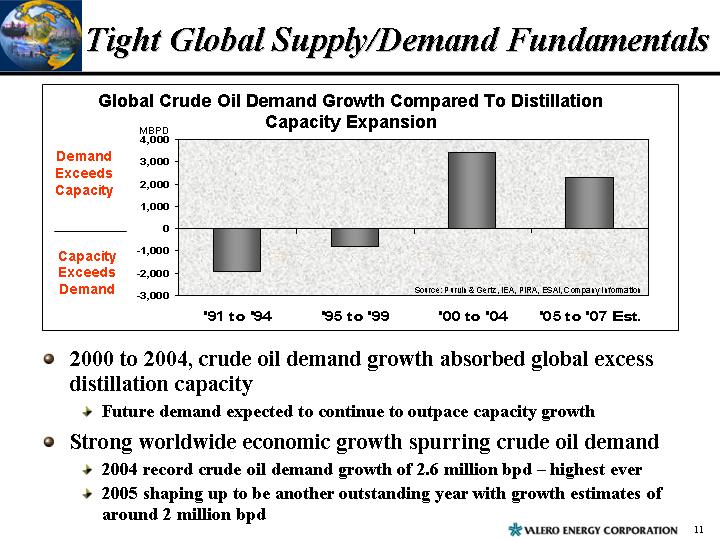
Tight Global Supply/Demand Fundamentals
[CHART]
• 2000 to 2004, crude oil demand growth absorbed global excess distillation capacity
• Future demand expected to continue to outpace capacity growth
• Strong worldwide economic growth spurring crude oil demand
• 2004 record crude oil demand growth of 2.6 million bpd – highest ever
• 2005 shaping up to be another outstanding year with growth estimates of around 2 million bpd
11
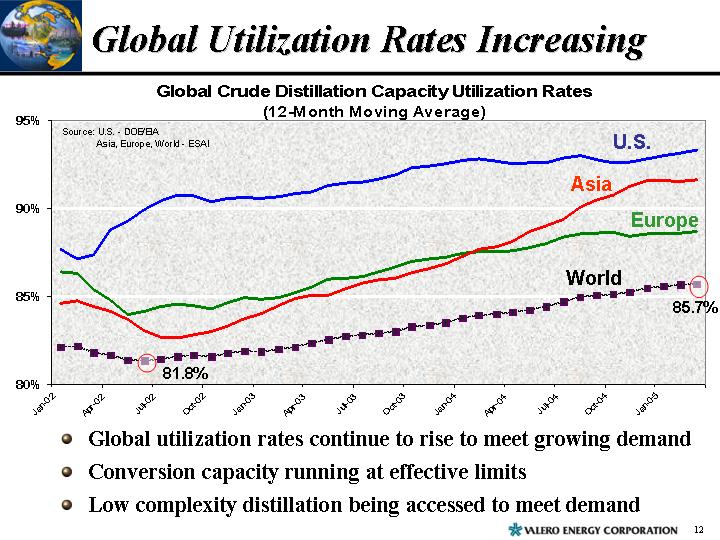
Global Utilization Rates Increasing
Global Crude Distillation Capacity Utilization Rates
(12-Month Moving Average)
[CHART]
• Global utilization rates continue to rise to meet growing demand
• Conversion capacity running at effective limits
• Low complexity distillation being accessed to meet demand
12
Higher Utilization Producing More Resid
Residual Fuel Oil and Sour Crude Discounts to WTI
[CHART]
• Increased global crude runs have led to more resid being produced
• Resid discounts have widened substantially leading to wider sour crude discounts
13
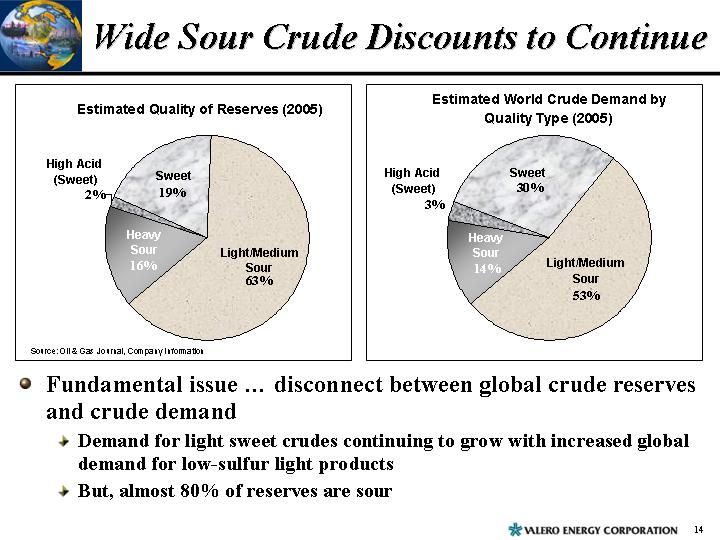
Wide Sour Crude Discounts to Continue
Estimated Quality of Reserves (2005) |
| Estimated World Crude Demand by |
|
|
|
[CHART] |
| [CHART] |
|
|
|
Source: Oil & Gas Journal, Company Information |
|
|
• Fundamental issue … disconnect between global crude reserves and crude demand
• Demand for light sweet crudes continuing to grow with increased global demand for low-sulfur light products
• But, almost 80% of reserves are sour
14
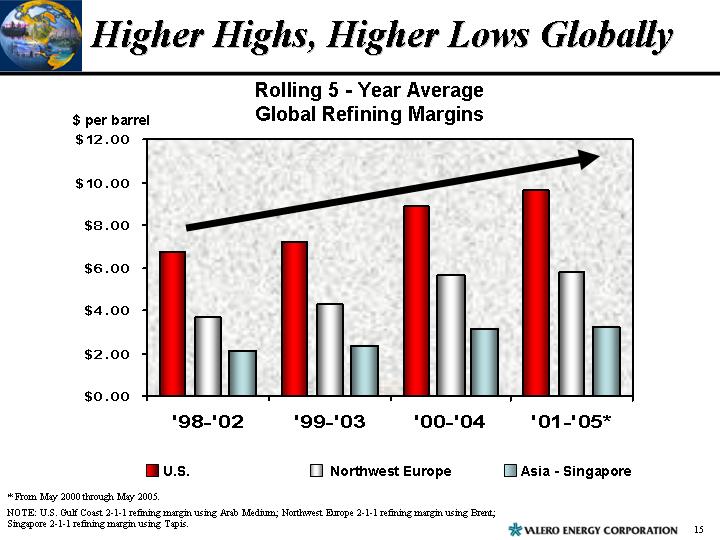
Higher Highs, Higher Lows Globally
Rolling 5 -Year Average Global Refining Margins
[CHART]
* From May 2000 through May 2005.
NOTE: U.S. Gulf Coast 2-1-1 refining margin using Arab Medium; Northwest Europe 2-1-1 refining margin using Brent; Singapore 2-1-1 refining margin using Tapis.
15
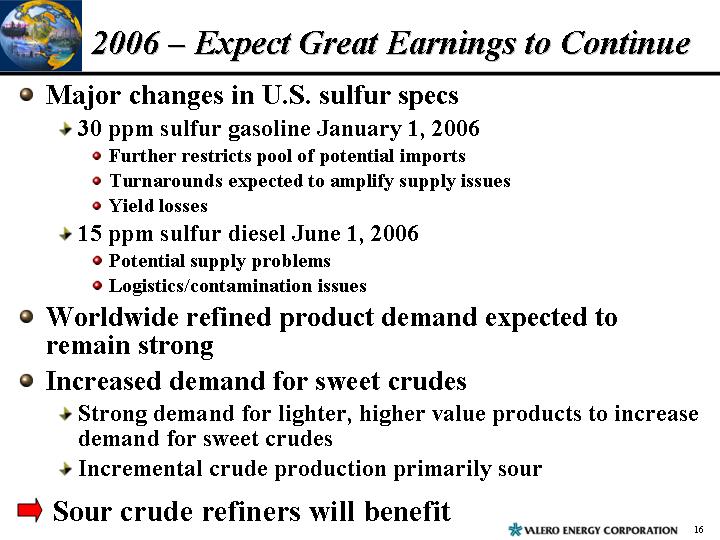
2006 – Expect Great Earnings to Continue
• Major changes in U.S. sulfur specs
• 30 ppm sulfur gasoline January 1, 2006
• Further restricts pool of potential imports
• Turnarounds expected to amplify supply issues
• Yield losses
• 15 ppm sulfur diesel June 1, 2006
• Potential supply problems
• Logistics/contamination issues
• Worldwide refined product demand expected to remain strong
• Increased demand for sweet crudes
• Strong demand for lighter, higher value products to increase demand for sweet crudes
• Incremental crude production primarily sour
|
| Sour crude refiners will benefit |
16
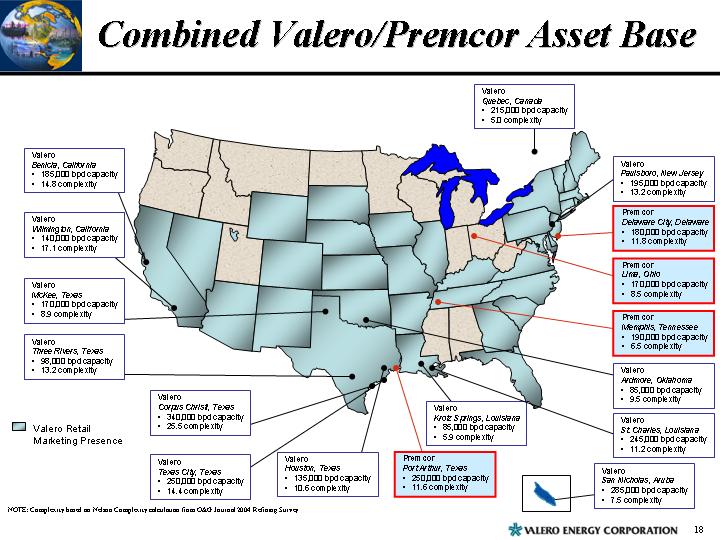
Combined Valero/Premcor Asset Base
[GRAPHIC]
NOTE: Complexity based on Nelson Complexity calculation from O&GJournal 2004 Refining Survey
18
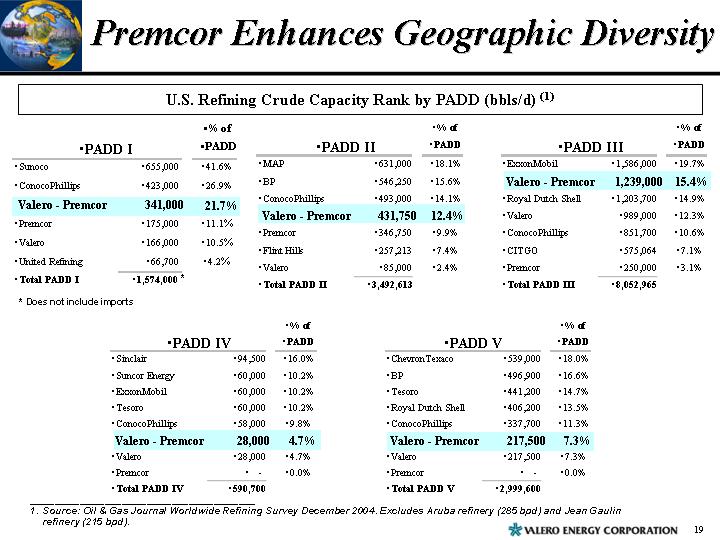
Premcor Enhances Geographic Diversity
U.S. Refining Crude Capacity Rank by PADD (bbls/d) (1)
• PADD I |
|
|
| •% of |
|
•Sunoco |
| •655,000 |
| •41.6 | % |
•ConocoPhillips |
| •423,000 |
| •26.9 | % |
Valero - Premcor |
| 341,000 |
| 21.7 | % |
•Premcor |
| •175,000 |
| •11.1 | % |
•Valero |
| •166,000 |
| •10.5 | % |
•United Refining |
| •66,700 |
| •4.2 | % |
•Total PADD I |
| •1,574,000 | * |
|
|
* Does not include imports
•PADD II |
|
|
| •% of |
|
•MAP |
| •631,000 |
| •18.1 | % |
•BP |
| •546,250 |
| •15.6 | % |
•ConocoPhillips |
| •493,000 |
| •14.1 | % |
Valero - Premcor |
| 431,750 |
| 12.4 | % |
•Premcor |
| •346,750 |
| •9.9 | % |
•Flint Hills |
| •257,213 |
| •7.4 | % |
•Valero |
| •85,000 |
| •2.4 | % |
•Total PADD II |
| •3,492,613 |
|
|
|
•PADD III |
|
|
| •% of |
|
•ExxonMobil |
| •1,586,000 |
| •19.7 | % |
Valero - Premcor |
| 1,239,000 |
| 15.4 | % |
•Royal Dutch Shell |
| •1,203,700 |
| •14.9 | % |
•Valero |
| •989,000 |
| •12.3 | % |
•ConocoPhillips |
| •851,700 |
| •10.6 | % |
•CITGO |
| •575,064 |
| •7.1 | % |
•Premcor |
| •250,000 |
| •3.1 | % |
•Total PADD III |
| •8,052,965 |
|
|
|
•PADD IV |
|
|
| •% of |
|
•Sinclair |
| •94,500 |
| •16.0 | % |
•Suncor Energy |
| •60,000 |
| •10.2 | % |
•ExxonMobil |
| •60,000 |
| •10.2 | % |
•Tesoro |
| •60,000 |
| •10.2 | % |
•ConocoPhillips |
| •58,000 |
| •9.8 | % |
Valero - Premcor |
| 28,000 |
| 4.7 | % |
•Valero |
| •28,000 |
| •4.7 | % |
•Premcor |
| • — |
| •0.0 | % |
•Total PADD IV |
| •590,700 |
|
|
|
•PADD V |
|
|
| •% of |
|
•ChevronTexaco |
| •539,000 |
| •18.0 | % |
•BP |
| •496,900 |
| •16.6 | % |
•Tesoro |
| •441,200 |
| •14.7 | % |
•Royal Dutch Shell |
| •406,200 |
| •13.5 | % |
•ConocoPhillips |
| •337,700 |
| •11.3 | % |
Valero - Premcor |
| 217,500 |
| 7.3 | % |
•Valero |
| •217,500 |
| •7.3 | % |
•Premcor |
| • — |
| •0.0 | % |
•Total PADD V |
| •2,999,600 |
|
|
|
1. Source: Oil & Gas Journal Worldwide Refining Survey December 2004. Excludes Aruba refinery (285 bpd) and Jean Gaulin refinery (215 bpd).
19
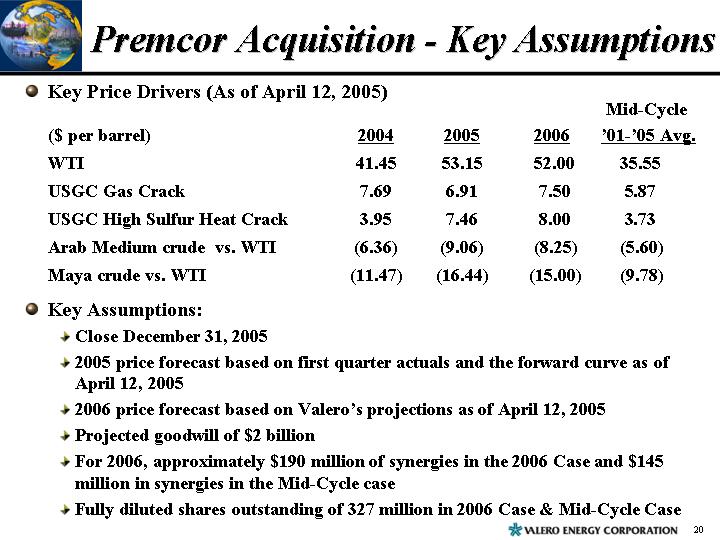
Premcor Acquisition - Key Assumptions
• Key Price Drivers (As of April 12, 2005)
($ per barrel) |
| 2004 |
| 2005 |
| 2006 |
| Mid-Cycle |
|
|
|
|
|
|
|
|
|
|
|
WTI |
| 41.45 |
| 53.15 |
| 52.00 |
| 35.55 |
|
USGC Gas Crack |
| 7.69 |
| 6.91 |
| 7.50 |
| 5.87 |
|
USGC High Sulfur Heat Crack |
| 3.95 |
| 7.46 |
| 8.00 |
| 3.73 |
|
Arab Medium crude vs. WTI |
| (6.36 | ) | (9.06 | ) | (8.25 | ) | (5.60 | ) |
Maya crude vs. WTI |
| (11.47 | ) | (16.44 | ) | (15.00 | ) | (9.78 | ) |
• Key Assumptions:
• Close December 31, 2005
• Close December 31, 2005
• 2005 price forecast based on first quarter actuals and the forward curve as of April 12, 2005
• 2006 price forecast based on Valero’s projections as of April 12, 2005
• Projected goodwill of $2 billion
• For 2006, approximately $190 million of synergies in the 2006 Case and $145 million in synergies in the Mid-Cycle case
• Fully diluted shares outstanding of 327 million in 2006 Case & Mid-CycleCase
20
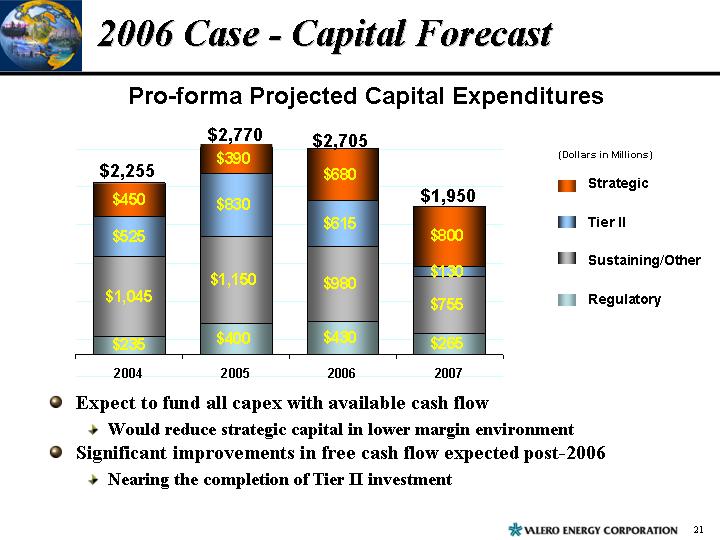
2006 Case - Capital Forecast
Pro-forma Projected Capital Expenditures
[CHART]
• Expect to fund all capex with available cash flow
• Would reduce strategic capital in lower margin environment
• Significant improvements in free cash flow expected post-2006
• Nearing the completion of Tier II investment
21
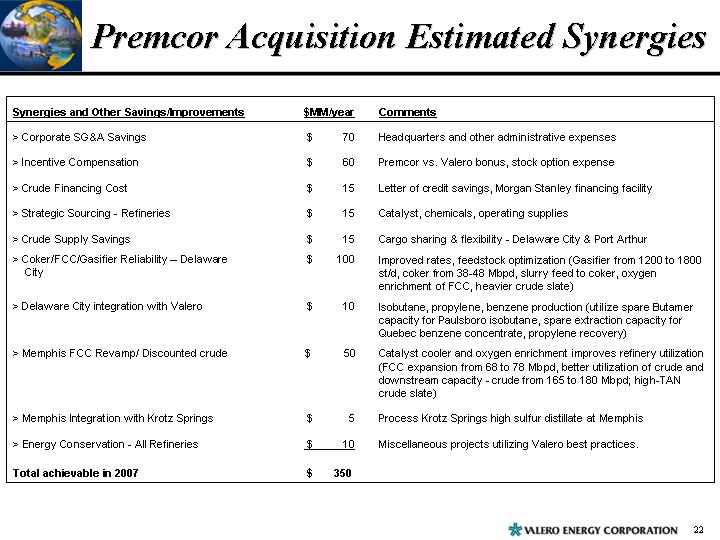
Premcor Acquisition Estimated Synergies
Synergies and Other Savings/Improvements |
| $MM/year |
| Comments |
| |
|
|
|
|
|
| |
• Corporate SG&A Savings |
| $ | 70 |
| Headquarters and other administrative expenses |
|
|
|
|
|
|
| |
• Incentive Compensation |
| $ | 60 |
| Premcor vs. Valero bonus, stock option expense |
|
|
|
|
|
|
| |
• Crude Financing Cost |
| $ | 15 |
| Letter of credit savings, Morgan Stanley financing facility |
|
|
|
|
|
|
| |
• Strategic Sourcing - Refineries |
| $ | 15 |
| Catalyst, chemicals, operating supplies |
|
|
|
|
|
|
| |
• Crude Supply Savings |
| $ | 15 |
| Cargo sharing & flexibility - Delaware City & Port Arthur |
|
|
|
|
|
|
| |
• Coker/FCC/Gasifier Reliability – Delaware City |
| $ | 100 |
| Improved rates, feedstock optimization (Gasifier from 1200 to 1800 st/d, coker from 38-48 Mbpd, slurry feed to coker, oxygen enrichment of FCC, heavier crude slate) |
|
|
|
| ||||
|
|
| ||||
• Delaware City integration with Valero |
| $ | 10 |
| Isobutane, propylene, benzene production (utilize spare Butamer capacity for Paulsboro isobutane, spare extraction capacity for Quebec benzene concentrate, propylene recovery) |
|
|
|
| ||||
|
|
| ||||
• Memphis FCC Revamp/ Discounted crude |
| $ | 50 |
| Catalyst cooler and oxygen enrichment improves refinery utilization (FCC expansion from 68 to 78 Mbpd, better utilization of crude and downstream capacity - crude from 165 to 180 Mbpd; high-TAN crude slate) |
|
|
|
| ||||
|
|
| ||||
|
|
| ||||
|
|
|
|
|
| |
• Memphis Integration with Krotz Springs |
| $ | 5 |
| Process Krotz Springs high sulfur distillate at Memphis |
|
|
|
|
|
|
| |
• Energy Conservation - All Refineries |
| $ | 10 |
| Miscellaneous projects utilizing Valero best practices. |
|
|
|
|
|
|
| |
Total achievable in 2007 |
| $ | 350 |
|
|
|
22
2005 Distillate Fundamentals
Distillate Days of Supply |
| USGC Heat Crack ($/bbl) |
|
|
|
[CHART] |
| [CHART] |
NOTE: Forward Curve as of June 16, 2005.
23
2005 Gasoline Fundamentals
Gasoline Days of Supply |
| USGC Gas Crack ($/bbl) |
|
|
|
[CHART] |
| [CHART] |
NOTE: Forward Curve as of June 16, 2005.
24