
Lehman Brothers CEO Energy/Power Conference
September 9, 2004
Safe Harbor Statement
Statements contained in this presentation that state the company’s or its management’s expectations or predictions of the future are forward-looking statements intended to be covered by the safe harbor provisions of the Securities Act of 1933 and the Securities Exchange Act of 1934. The words “believe,” “expect,” “should,” “estimates,” and other similar expressions identify forward-looking statements. It is important to note that the company’s actual results could differ materially from those projected in its forward-looking statements. For more information concerning factors that could cause actual results to differ from those expressed or forecast, see the company’s annual reports on Form 10-K and its quarterly reports on Form 10-Q filed with the Securities and Exchange Commission.

Thomas D. O’Malley
Chairman and Chief Executive Officer
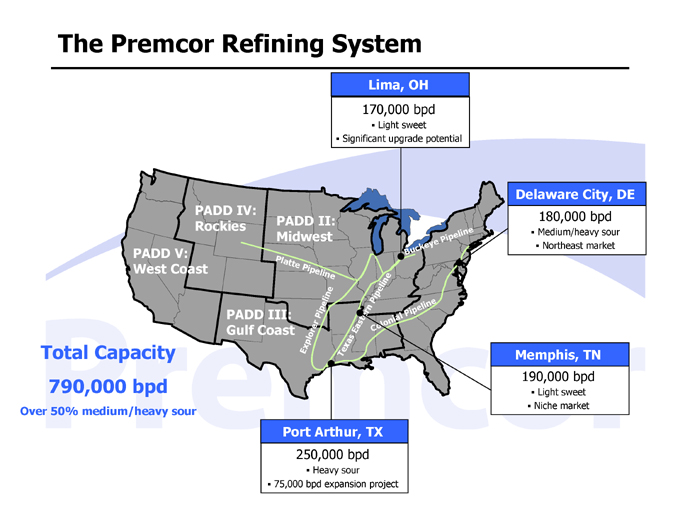
The Premcor Refining System
Lima, OH
170,000 bpd
Light sweet
Significant upgrade potential
Total Capacity 790,000 bpd
Over 50% medium/heavy sour
Port Arthur, TX
250,000 bpd
Heavy sour
75,000 bpd expansion project
Delaware City, DE
180,000 bpd
Medium/heavy sour
Northeast market
Memphis, TN
190,000 bpd
Light sweet
Niche market
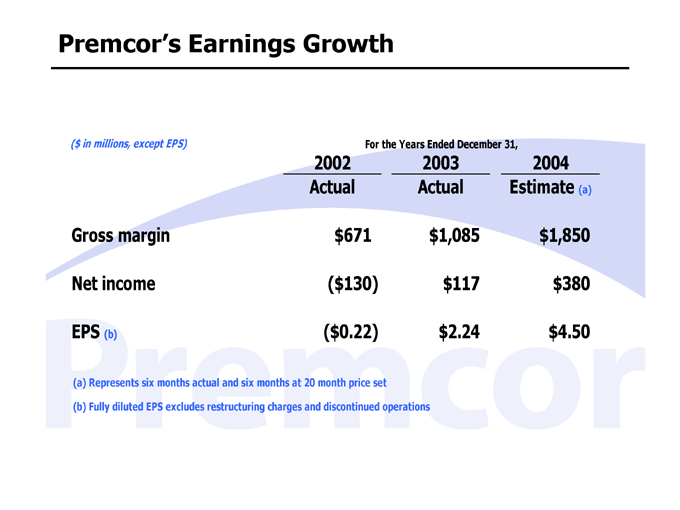
Premcor’s Earnings Growth
($ in millions, except EPS) For the Years Ended December 31,
2002 2003 2004
Actual Actual Estimate (a)
Gross margin $671 $1,085 $1,850
Net income ($130) $117 $380
EPS (b) ($0.22) $2.24 $4.50
(a) Represents six months actual and six months at 20 month price set
(b) Fully diluted EPS excludes restructuring charges and discontinued operations
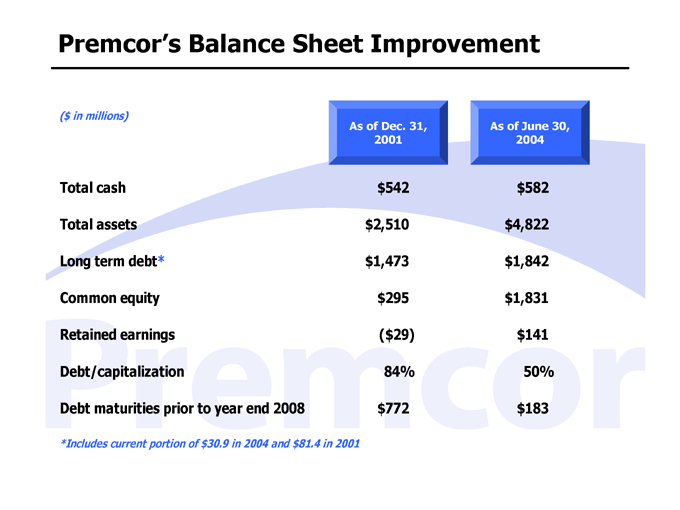
Premcor’s Balance Sheet Improvement
($ in millions)
As of Dec. 31, 2001 As of June 30, 2004
Total cash $542 $582
Total assets $2,510 $4,822
Long term debt* $1,473 $1,842
Common equity $295 $1,831
Retained earnings ($29) $141
Debt/capitalization 84% 50%
Debt maturities prior to year end 2008 $772 $183
*Includes current portion of $30.9 in 2004 and $81.4 in 2001

Premcor’s Growth Trajectory
Millions of Barrels
300 250 200 150 100
2002 2003 2004 2005 2006
135 180 240 270 295
Annual Production
2003: Memphis Refinery acquisition (10 months)
2004: Delaware City Refinery acquisition (8 months)
2005: Delaware City (12 months)
2006: Port Arthur Refinery expansion (Q1 startup)
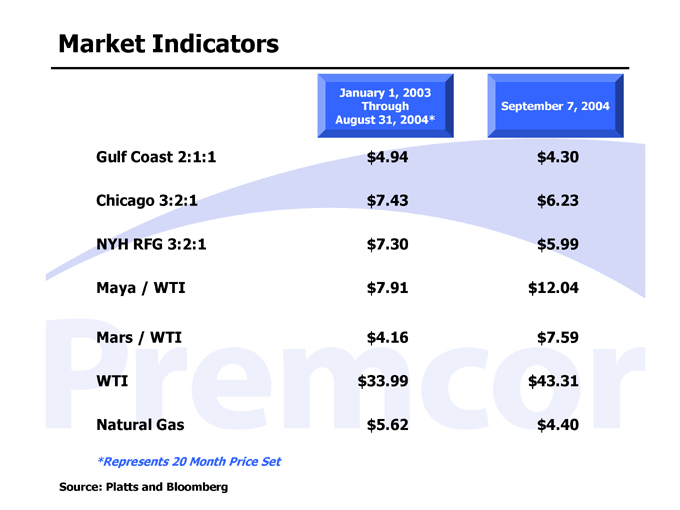
Market Indicators
January 1, 2003 Through August 31, 2004* September 7, 2004
Gulf Coast 2:1:1 $4.94 $4.30
Chicago 3:2:1 $7.43 $6.23
NYH RFG 3:2:1 $7.30 $5.99
Maya / WTI $7.91 $12.04
Mars / WTI $4.16 $7.59
WTI $33.99 $43.31
Natural Gas $5.62 $4.40
*Represents 20 Month Price Set
Source: Platts and Bloomberg
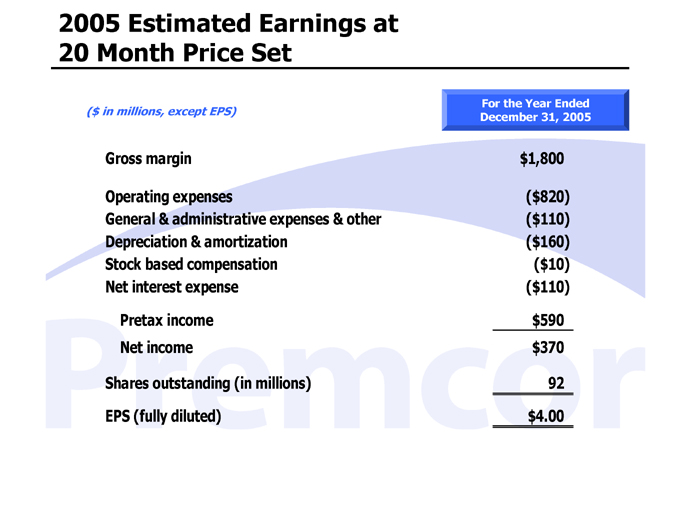
2005 Estimated Earnings at 20 Month Price Set
($ in millions, except EPS)
For the Year Ended December 31, 2005
Gross margin $1,800
Operating expenses ($820)
General & administrative expenses & other ($110)
Depreciation & amortization ($160)
Stock based compensation ($10)
Net interest expense ($110)
Pretax income $590
Net income $370
Shares outstanding (in millions) 92
EPS (fully diluted) $4.00
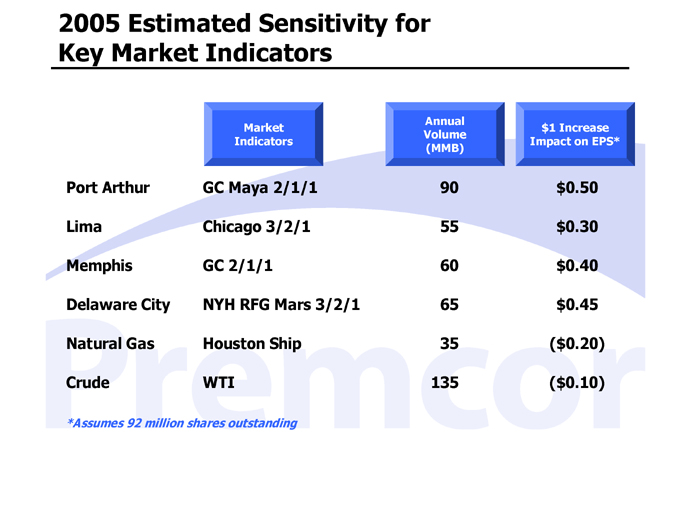
2005 Estimated Sensitivity for Key Market Indicators
Market Indicators Annual Volume (MMB) $1 Increase Impact on EPS*
Port Arthur GC Maya 2/1/1 90 $0.50
Lima Chicago 3/2/1 55 $0.30
Memphis GC 2/1/1 60 $0.40
Delaware City NYH RFG Mars 3/2/1 65 $0.45
Natural Gas Houston Ship 35 ($0.20)
Crude WTI 135 ($0.10)
*Assumes 92 million shares outstanding
Premcor’s Strategic Advantage and Plan
Large pure-play refiner
Intend to stay that way
Over 50% heavy, high sulfur crude oil conversion capacity
Intend to grow our throughput in this category both internally and externally
Management has a track record of finding high quality growth opportunities
We will continue to uncover new opportunities

An Investment in Premcor Represents...
Great market environment for pure refiners
First class assets
Management team with a strong track record of delivering value to shareholders