Republic Airways Imperial Capital Global Opportunities Conference September 18, 2014

Safe harbor disclosure 2 Statements in this presentation, as well as oral statements that may be made by officers or directors of Republic Airways Holdings Inc., its advisors, affiliates or subsidiaries (collectively or separately the “Company”), that are not historical fact constitute “forward-looking statements”. Such forward-looking statements involve known and unknown risks, uncertainties and other factors that could cause the actual results of the Company to differ materially from historical results or from any results expressed or implied by the forward-looking statements. Such risks and uncertainties are outlined in the Company’s Annual Report on Form 10-K, most recent Quarterly Report and other documents filed with the SEC from time to time. The Company cautions users of this presentation not to place undue reliance on forward-looking statements, which may be based on assumptions and anticipated events that do not materialize. Disclaimer
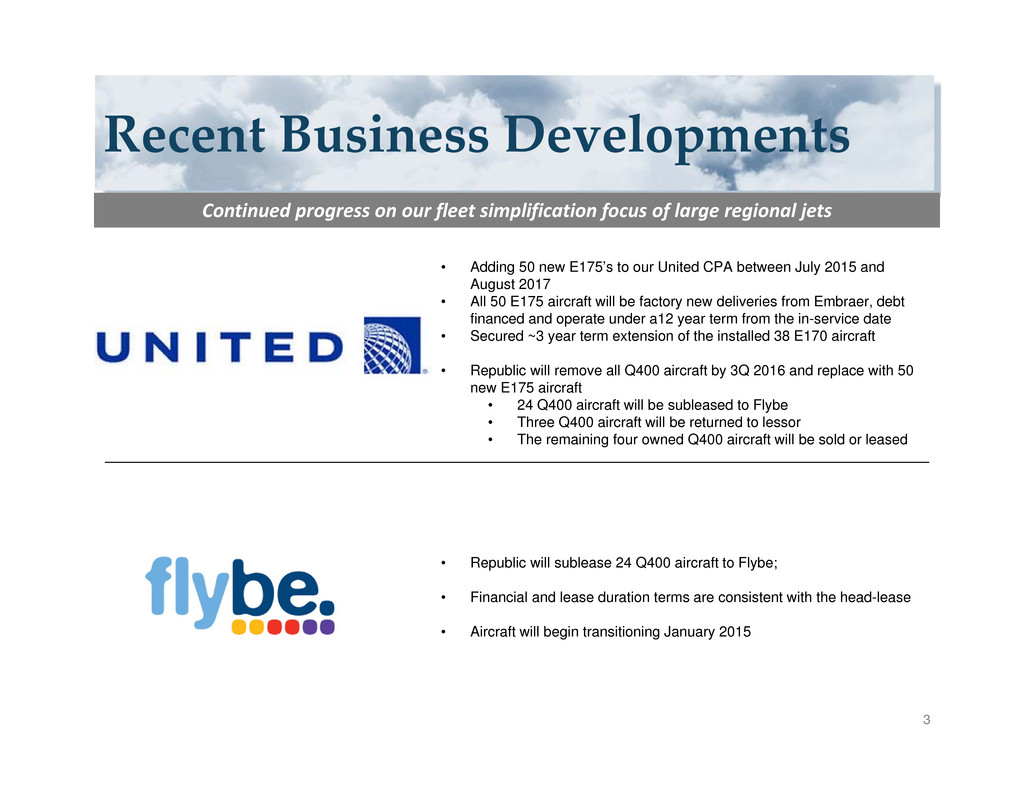
Recent Business Developments 3 Continued progress on our fleet simplification focus of large regional jets • Adding 50 new E175’s to our United CPA between July 2015 and August 2017 • All 50 E175 aircraft will be factory new deliveries from Embraer, debt financed and operate under a12 year term from the in-service date • Secured ~3 year term extension of the installed 38 E170 aircraft • Republic will remove all Q400 aircraft by 3Q 2016 and replace with 50 new E175 aircraft • 24 Q400 aircraft will be subleased to Flybe • Three Q400 aircraft will be returned to lessor • The remaining four owned Q400 aircraft will be sold or leased • Republic will sublease 24 Q400 aircraft to Flybe; • Financial and lease duration terms are consistent with the head-lease • Aircraft will begin transitioning January 2015

Simplifying the Fleet ‐ United Q400 Swap 4 Growth and Simplicity 31 Q400 aircraft 50 E175 aircraft The whys: • The E175 maximizes United’s existing scope authority and meets United’s long-term product requirements • The shift from the Q400 aircraft to the E175 platform is consistent with our thesis of streamlining and simplifying our business
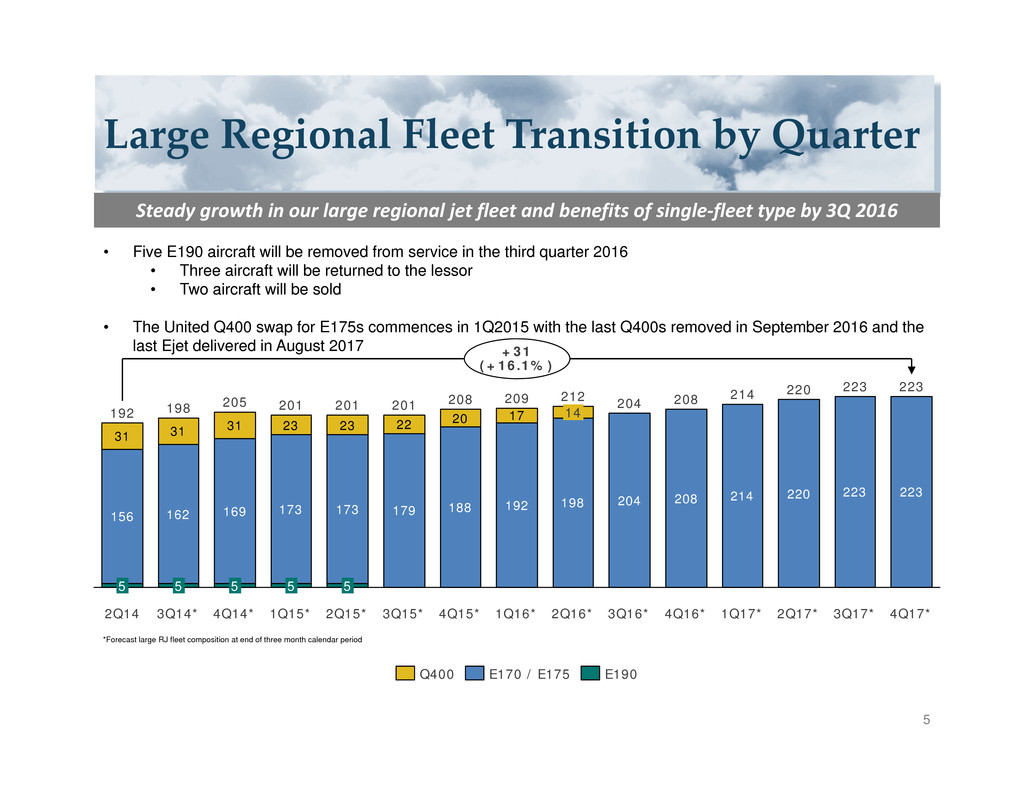
Large Regional Fleet Transition by Quarter 5 156 162 169 173 173 179 188 192 198 204 208 214 220 223 223 31 31 31 23 23 22 20 17198 5 3Q14* 201 3Q15* 201 1Q15* 5 201 2Q15* 5 205 4Q14* 5 4Q17*2Q17* 223220 1Q17* 223214 3Q17* 14 3Q16* 208204212 1Q16* 2Q16* 209 4Q15* 208 4Q16* +31 (+16.1%) 2Q14 192 5 Q400 E190E170 / E175 Steady growth in our large regional jet fleet and benefits of single‐fleet type by 3Q 2016 *Forecast large RJ fleet composition at end of three month calendar period • Five E190 aircraft will be removed from service in the third quarter 2016 • Three aircraft will be returned to the lessor • Two aircraft will be sold • The United Q400 swap for E175s commences in 1Q2015 with the last Q400s removed in September 2016 and the last Ejet delivered in August 2017

Big moves to de‐risk our model 5/20/2014 6 Management has a proven track record of adapting to challenging business conditions 2011 – Successfully restructured Frontier 2012 – Successfully restructured Chautauqua 2013 – Successful sale of Frontier 2014 and beyond – Continued simplification of our business model • Reduction in operating certificates drives: organizational productivity, lower infrastructure and administrative burden, and consistency in processes • Allocate our human and financial capital where they produce the best sustainable returns • Improves labor efficiency for our flight crews, maintenance technicians, and operational support personnel

Reducing Risks in Our Business Model 7 Talent Risk Business Risk Financial Risk Focus our energy on making good things happen and reduce risk in our model • Invest in our employees and renew our winning employee culture through enhanced employee engagement • Resolve our open pilot labor agreement in a fair and timely manner • Stimulate growth to facilitate timely career progression • Minimize attrition and recruit the talent necessary to capitalize on future opportunities • Execute on strategies to continue to mitigate our financial exposure on 50 seat regional jets that are no longer operating under fixed‐fee agreements • Secure extensions of existing E170/E175 aircraft under contract with our mainline partners through the underlying assets debt or lease obligation period • Continue our focus on delivering our mission of safe, clean and reliable air service for our mainline partners • Maintain cost‐control over wages, benefits, maintenance and other expenses that have historically escalated faster than our revenue escalators based on CPI • Mitigate increasing costs related to aging aircraft • Stable free cash flow

Our 2014 Corporate Objectives 8 Be the industry‐leading provider of safe, clean, reliable and cost‐efficient air service Renew focus on our guiding principles • Improve employee satisfaction and engagement • Retain our best and brightest talent • Recruit the best talent • Resolve our open labor contract with our pilots Refocus our brand • Enhance operational reliability and product quality • Provide a seamless customer service experience for our mainline partners Mitigate parked aircraft costs • Sell / sublease surplus E145 aircraft and related assets • Transfer our human capital from small to large regional jet opportunities Enhance our 5‐year strategic plan • Develop and execute new, strategic initiatives (streamlining and simplification strategy) • Increase shareholder returns Mitigate long‐term maintenance costs • Manage our Ejet engine overhaul and engine LLP replacement program • Negotiate new, long‐term agreements with our strategic suppliers Make our people our priority

Gaining Earnings Momentum 9 First Half 2014 Highlights • Placed 12 E175 aircraft into revenue service for American • Removed 12 E145 aircraft from revenue service with United • Removed 11 of 15 E140 aircraft from revenue service with American (final four aircraft were removed in August 2014) • Announced $75M share repurchase authorization • Settled a $22.3M convertible note pursuant to the authorization Margins stabilizing at high single digits Operating Performance 1Q14 2Q14 On‐time Departures D0 59.4 66.8 On‐time Arrivals A14 74.2 75.4 Controllable Completion Factor CCF 99.0 99.4 Completion Factor CF 89.2 96.4 $33.3 $22.8 $29.6 $26.6 $27.0 $19.3 2Q13 8.5% 3Q13 4Q13 7.9% 2Q141Q14 6.8% 9.7% 5.9% 8.0% 1Q13 Adj. Pre-tax income Adj. Pre-tax margin %

Best in class fleet mix and CPA diversity 10 10 16 8 3 0 4 13 5 9 11 2 1 14 12 15 7 6 15.1 10% 88% 2014(F) M i l l i o n s o f A S M s 2% 12% 69% -2% 15.3 2010 19% 400 450 150 50 0 600 550 500 350 250 200 300 100 800 750 700 650 4% AA/US DL 770 UA/CO T h o u s a n d s o f B l o c k h o u r s Other 2014E 26.6% 43.3% 28.8% 740 UA 19.7% Other 19.9% 2010 DL 16.2% AA 6.1% CO 6.6% 1.3% US 31.4% 2010 vs 2014 ASMs 2010 vs 2014 Block hours 44-50 Seats 69-80 seats 99 Seats 60% reduction in 44‐50 seat flying
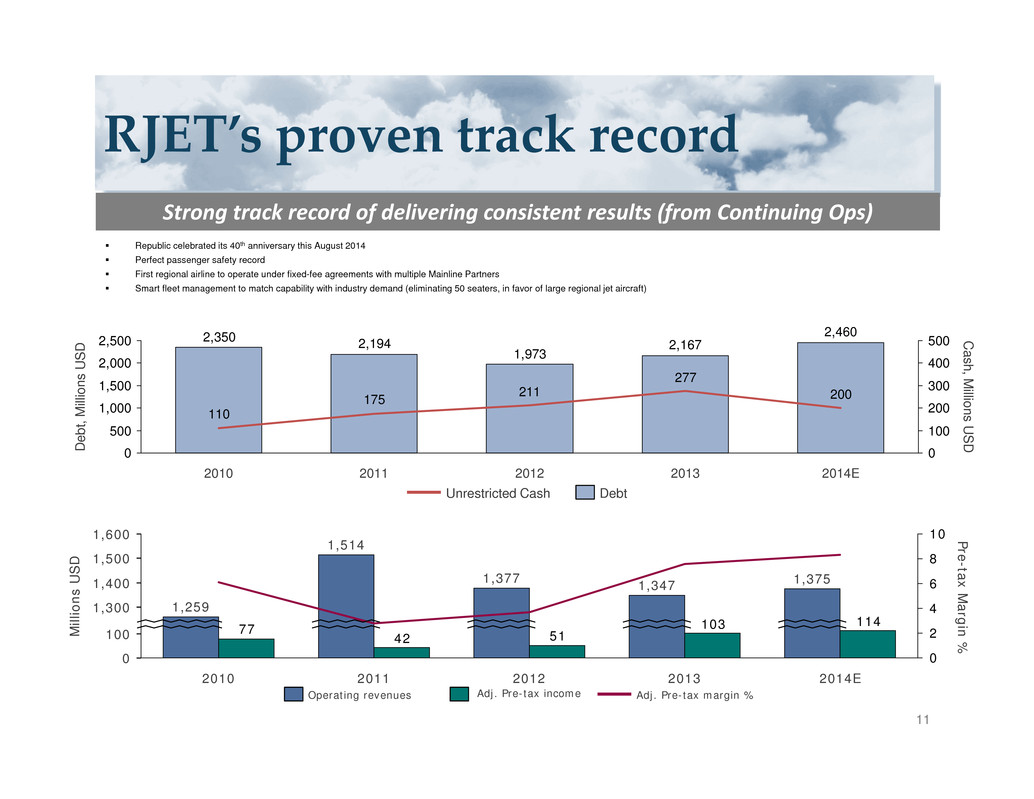
RJET’s proven track record 11 Republic celebrated its 40th anniversary this August 2014 Perfect passenger safety record First regional airline to operate under fixed-fee agreements with multiple Mainline Partners Smart fleet management to match capability with industry demand (eliminating 50 seaters, in favor of large regional jet aircraft) 2,460 2,167 1,973 2,1942,350 200 277 211175 110 0 500 1,000 1,500 2,000 2,500 0 100 200 300 400 500 Cash, M illions U S D 201320122010 2011 D e b t , M i l l i o n s U S D 2014E DebtUnrestricted Cash Strong track record of delivering consistent results (from Continuing Ops) 114103 5142 77 0 2 4 6 8 10 100 1,300 0 1,600 1,500 1,400 2011 1,259 2014E M i l l i o n s U S D 2010 1,375 1,514 Pre-tax M argin % 2013 1,347 2012 1,377 Adj. Pre-tax margin %Operating revenues Adj. Pre-tax income
Q&A SESSION 12

NON‐GAAP RECONCILIATIONS 13
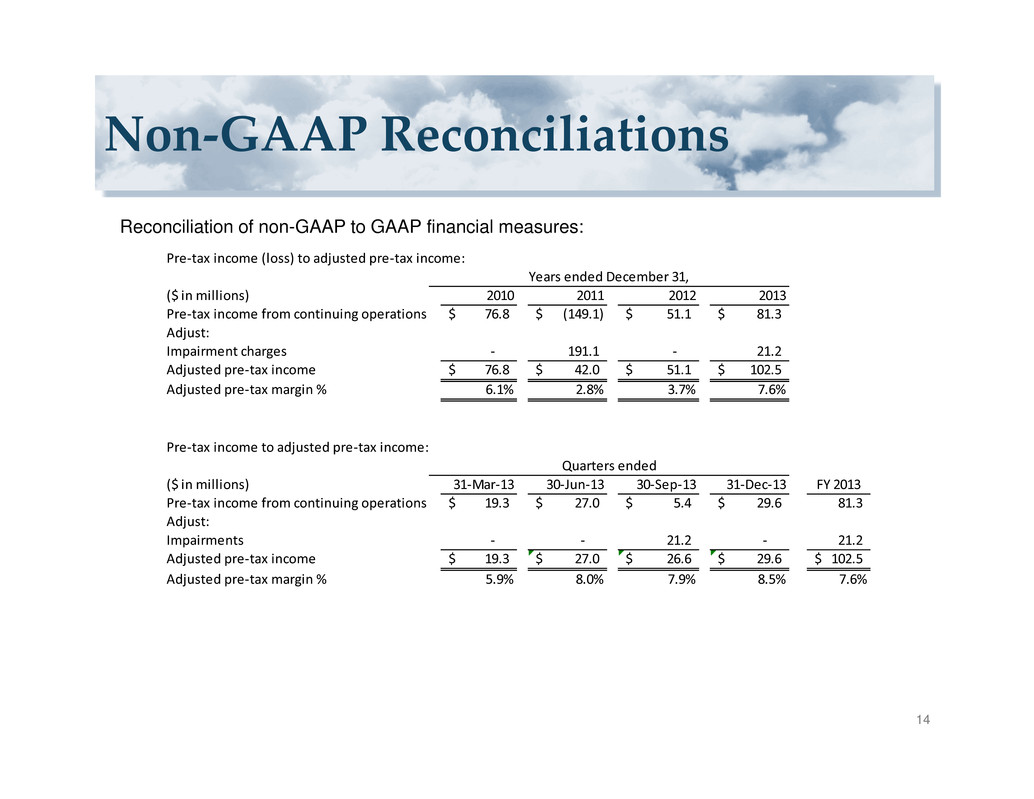
Non‐GAAP Reconciliations 14 Reconciliation of non-GAAP to GAAP financial measures: Pre‐tax income (loss) to adjusted pre‐tax income: ($ in millions) 2010 2011 2012 2013 Pre‐tax income from continuing operations 76.8$ (149.1)$ 51.1$ 81.3$ Adjust: Impairment charges ‐ 191.1 ‐ 21.2 Adjusted pre‐tax income 76.8$ 42.0$ 51.1$ 102.5$ Adjusted pre‐tax margin % 6.1% 2.8% 3.7% 7.6% Pre‐tax income to adjusted pre‐tax income: ($ in millions) 31‐Mar‐13 30‐Jun‐13 30‐Sep‐13 31‐Dec‐13 FY 2013 Pre‐tax income from continuing operations 19.3$ 27.0$ 5.4$ 29.6$ 81.3 Adjust: Impairments ‐ ‐ 21.2 ‐ 21.2 Adjusted pre‐tax income 19.3$ 27.0$ 26.6$ 29.6$ 102.5$ Adjusted pre‐tax margin % 5.9% 8.0% 7.9% 8.5% 7.6% Years ended December 31, Quarters ended


