Exhibit 99.2

Exhibit 99.2
FOURTH QUARTER 2004 EARNINGS
John A. Luke, Jr.
Chairman and CEO
James A. Buzzard
President
E. Mark Rajkowski
Senior Vice President and CFO
January 31, 2005
FORWARD-LOOKING STATEMENT
Certain statements in this document and elsewhere by management of the company that are neither reported financial results nor other historical information are “forward-looking statements” within the meaning of the Private Securities Litigation Reform Act of 1995. Such information includes, without limitation, the business outlook, assessment of market conditions, anticipated financial and operating results, strategies, future plans, contingencies and contemplated transactions of the company. Such forward-looking statements are not guarantees of future performance and are subject to known and unknown risks, uncertainties and other factors which may cause or contribute to actual results of company operations, or the performance or achievements of each company, or industry results, to differ materially from those expressed or implied by the forward-looking statements. In addition to any such risks, uncertainties and other factors discussed elsewhere herein, risks, uncertainties and other factors that could cause or contribute to actual results differing materially from those expressed or implied for the forward-looking statements include, but are not limited to, events or circumstances which affect the ability of MeadWestvaco to realize improvements in operating earnings and cash flow expected from the company’s productivity initiative; to close the sale of the papers business and uncertainties related to the timing of the closing; competitive pricing for the company’s products; changes in raw materials pricing; energy and other costs; fluctuations in demand and changes in production capacities; changes to economic growth in the United States and international economies; government policies and regulations, including, but not limited to those affecting the environment and the tobacco industry; adverse results in current or future litigation, currency movements and other risk factors discussed in the company’s Annual Report on Form 10-K for the year ended December 31, 2003 and in other filings made from time to time with the SEC. MeadWestvaco undertakes no obligation to publicly update any forward-looking statement, whether as a result of new information, future events or otherwise. Investors are advised, however, to consult any further disclosures made on related subjects in the company’s reports filed with the SEC.
2
FOURTH QUARTER EPS
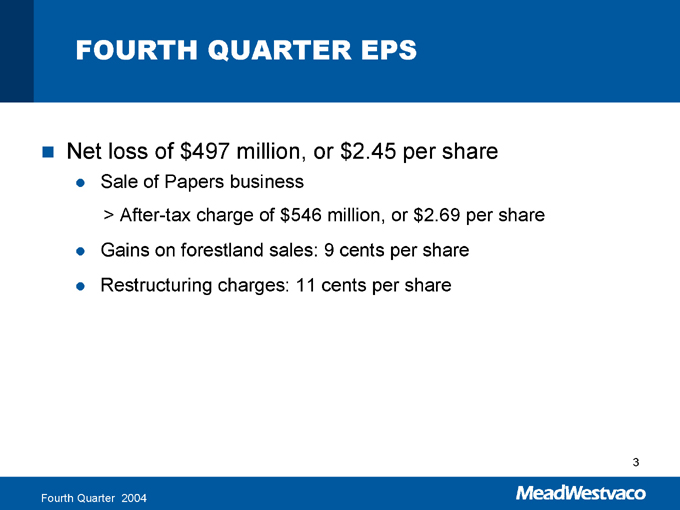
Net loss of $497 million, or $2.45 per share
> After-tax charge of $546 million, or $2,.69 per share
Sale of Papers business
$546 million, or $2.69 per share
Gains on forestland sales: 9 cents per share
Restructuring charges: 11 cents per share
3
John A. Luke Jr.
Chairman and
Chief Executive Officer
4
FOURTH QUARTER HIGHLIGHTS
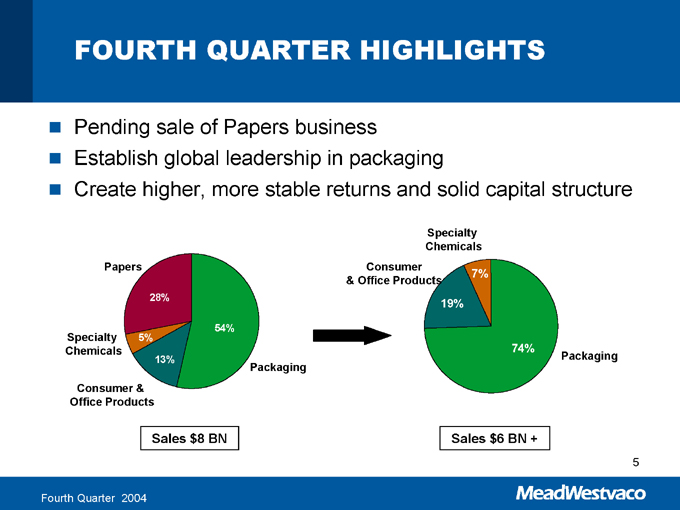
Pending sale of Papers business
Establish global leadership in packaging
Create higher, more stable returns and solid capital structure
Papers
28%
Specialty Chemicals 5%
Consumer & Office Products 13%
Packaging 54%
Sales $8 BN
Specialty Chemicals 7%
Consumer & Office Products 19%
Packaging 74%
Sales $6 BN +
5
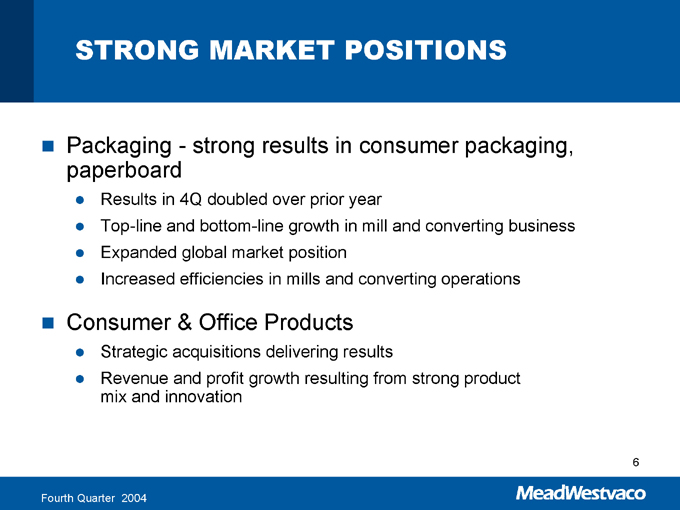
STRONG MARKET POSITIONS
Packaging—strong results in consumer packaging, paperboard
Results in 4Q doubled over prior year
Top-line and bottom-line growth in mill and converting business
Expanded global market position
Increased efficiencies in mills and converting operations
Consumer & Office Products
Strategic acquisitions delivering results
Revenue and profit growth resulting from strong product mix and innovation
6
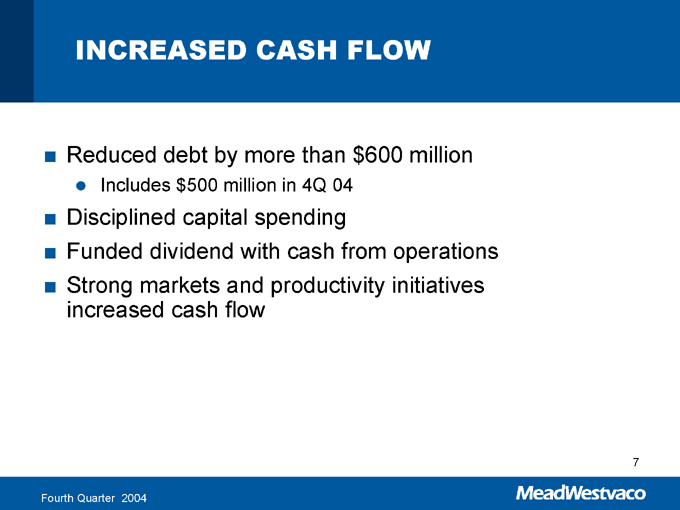
INCREASED CASH FLOW
Reduced debt by more than $600 million
Includes $500 million in 4Q 04
Disciplined capital spending
Funded dividend with cash from operations
Strong markets and productivity initiatives increased cash flow
7
James A. Buzzard
President
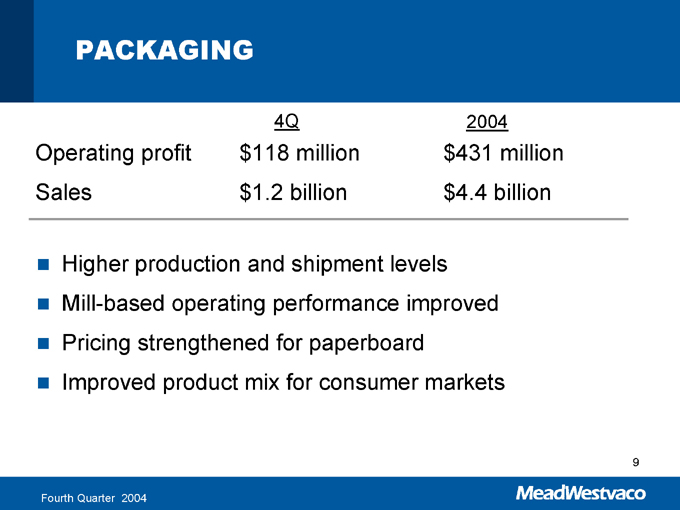
PACKAGING
4Q 2004
Operating profit $118 million $431 million
Sales $1.2 billion $4.4 billion
Higher production and shipment levels
Mill-based operating performance improved
Pricing strengthened for paperboard
Improved product mix for consumer markets
9
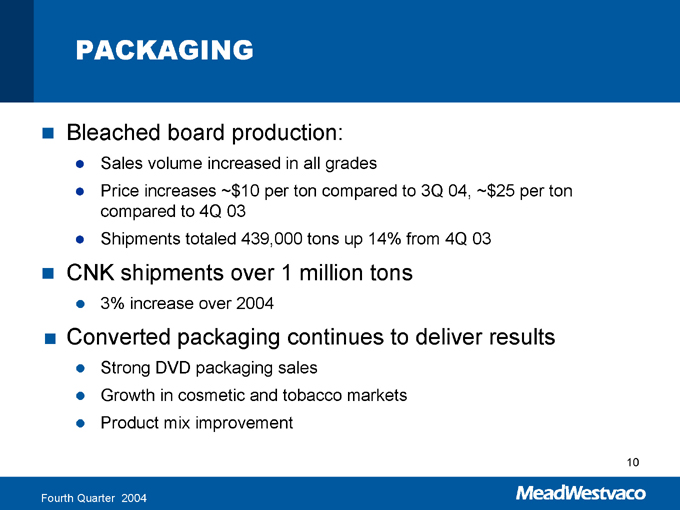
PACKAGING
Bleached board production:
Sales volume increased in all grades
Price increases ~$10 per ton compared to 3Q 04, ~$25 per ton compared to 4Q 03
Shipments totaled 439,000 tons up 14% from 4Q 03
CNK shipments over 1 million tons
3% increase over 2004
Converted packaging continues to deliver results
Strong DVD packaging sales
Growth in cosmetic and tobacco markets
Product mix improvement
10
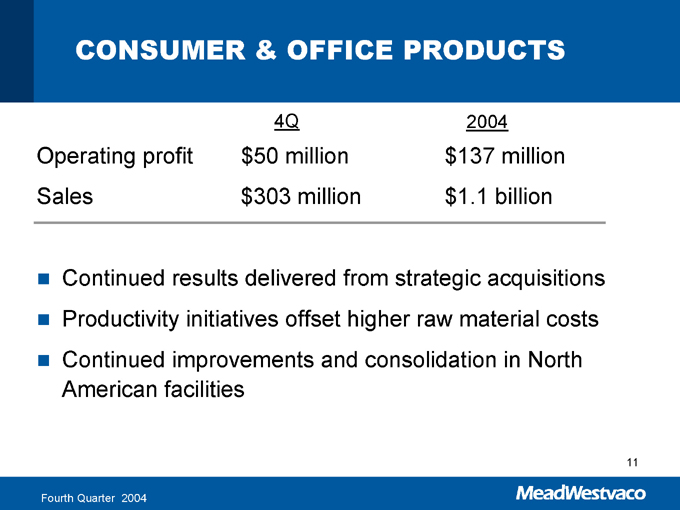
CONSUMER & OFFICE PRODUCTS
4Q 2004
Operating profit $50 million $137 million
Sales $303 million $1.1 billion
Continued results delivered from strategic acquisitions
Productivity initiatives offset higher raw material costs
Continued improvements and consolidation in North American facilities
11
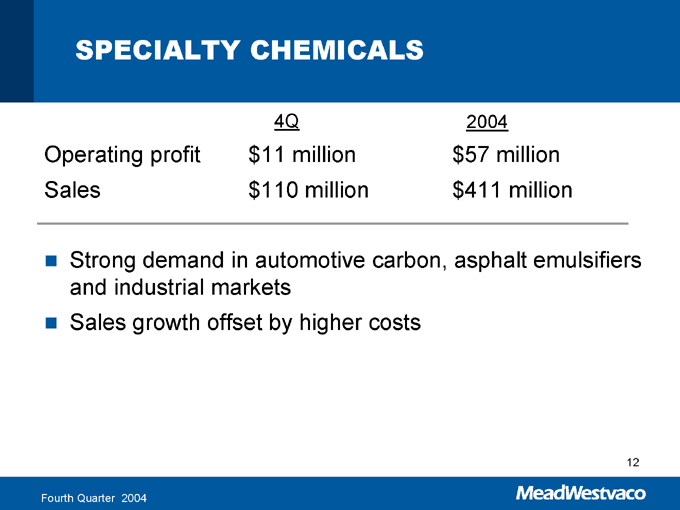
SPECIALTY CHEMICALS
4Q 2004
Operating profit $11 million $57 million
Sales $110 million $411 million
Strong demand in automotive carbon, asphalt emulsifiers and industrial markets
Sales growth offset by higher costs
12
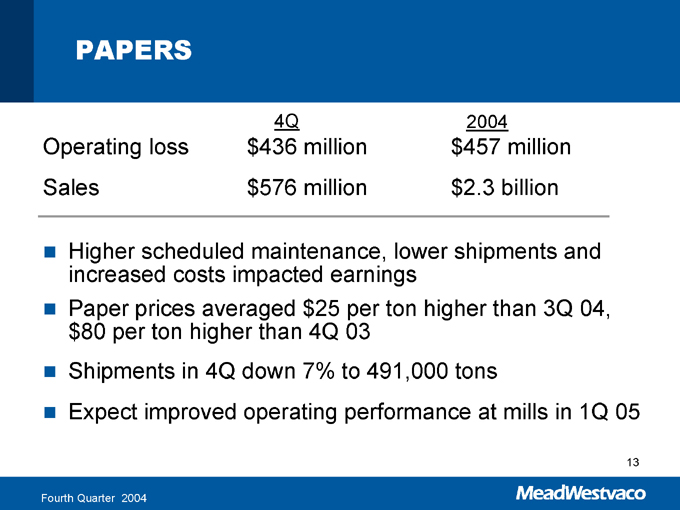
PAPERS
4Q 2004
Operating loss $436 million $457 million
Sales $576 million $2.3 billion
Higher scheduled maintenance, lower shipments and increased costs impacted earnings
Paper prices averaged $25 per ton higher than 3Q 04, $80 per ton higher than 4Q 03
Shipments in 4Q down 7% to 491,000 tons
Expect improved operating performance at mills in 1Q 05
13
E. Mark Rajkowski
Senior Vice President and CFO
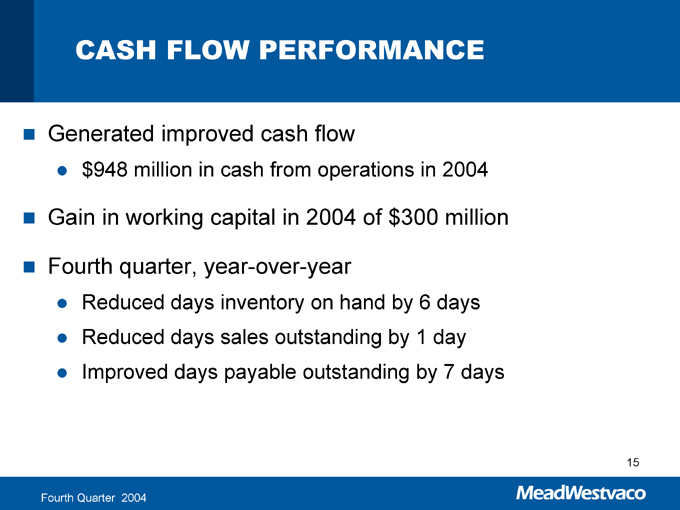
CASH FLOW PERFORMANCE
Generated improved cash flow
$948 million in cash from operations in 2004
Fourth quarter, year-over-year
Gain in working capital in 2004 of $300 million
Reduced days inventory on hand by 6 days
Reduced days sales outstanding by 1 day
Improved days payable outstanding by 7 days
15
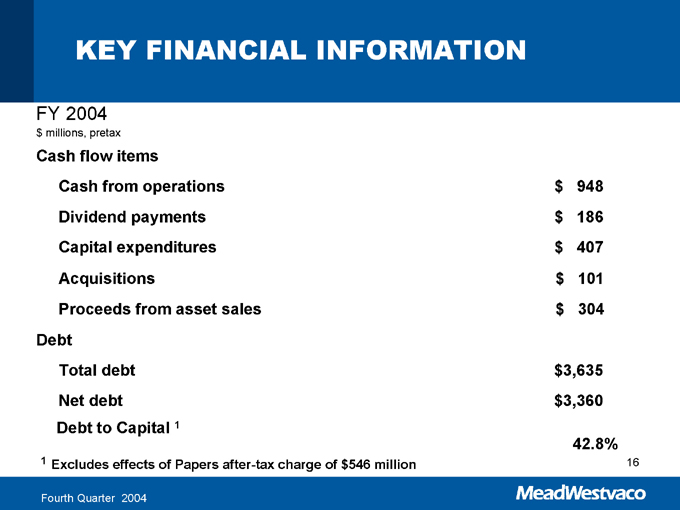
KEY FINANCIAL INFORMATION
FY 2004
$ millions, pretax
Cash flow items
Cash from operations $948
Dividend payments $186
Capital expenditures $407
Acquisitions $101
Proceeds from asset sales $304
Debt
Total debt $3,635
Net debt $3,360
Debt to Capital 1 42.8%
1 Excludes effects of Papers after-tax charge of $546 million
16
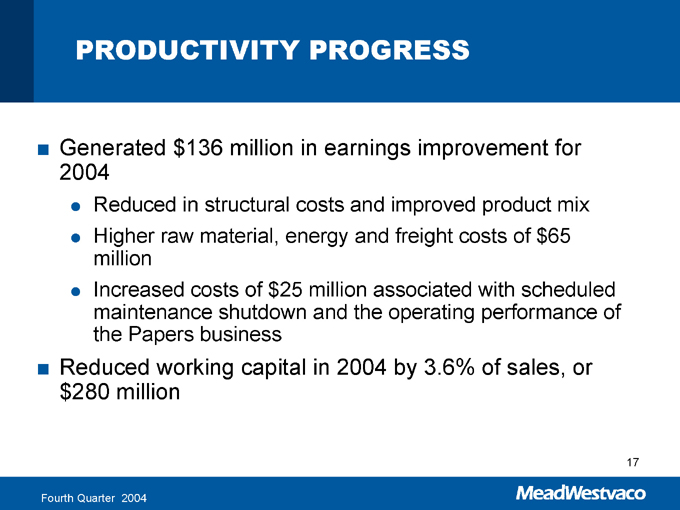
PRODUCTIVITY PROGRESS
Generated $136 million in earnings improvement for 2004
Reduced in structural costs and improved product mix
Higher raw material, energy and freight costs of $65 million
Increased costs of $25 million associated with scheduled maintenance shutdown and the operating performance of the Papers business
Reduced working capital in 2004 by 3.6% of sales, or $280 million
17
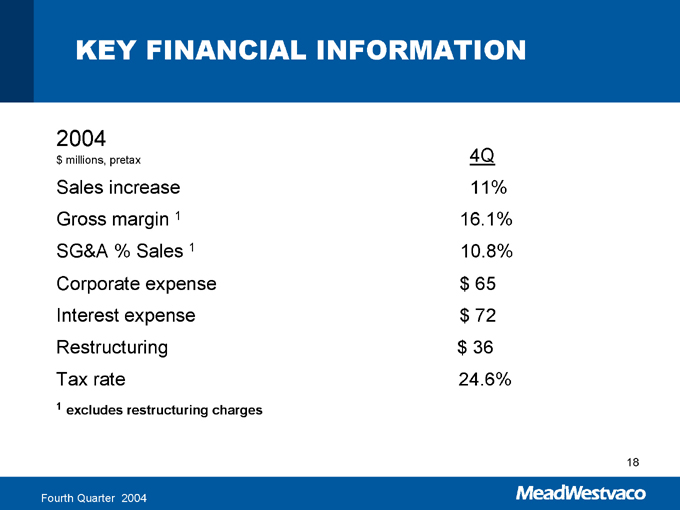
KEY FINANCIAL INFORMATION
2004
$ millions, pretax 4Q
Sales increase 11%
Gross margin 16.1%
SG&A % Sales 10.8%
Corporate expense $65
Interest expense $72
Restructuring $36
Tax rate 24.6%
1 excludes restructuring charges
18
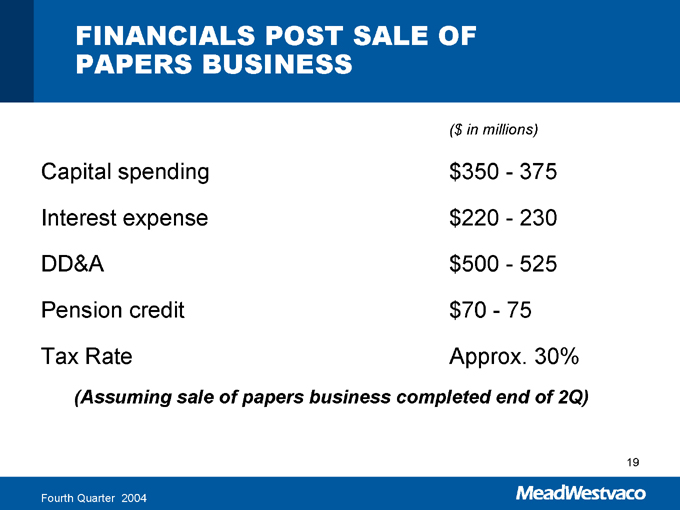
FINANCIALS POST SALE OF PAPERS BUSINESS
($ in millions)
Capital spending $350—375
Interest expense $220—230
DD&A $500—525
Pension credit $70—75
Tax Rate Approx. 30%
(Assuming sale of papers business completed end of 2Q)
19
MOVING FORWARD
Continued strengthening in core packaging markets
Challenges from rising costs for energy and raw materials
Focus on productivity improvements
Positioned for success with our strong packaging platform
20

QUESTIONS
APPENDIX
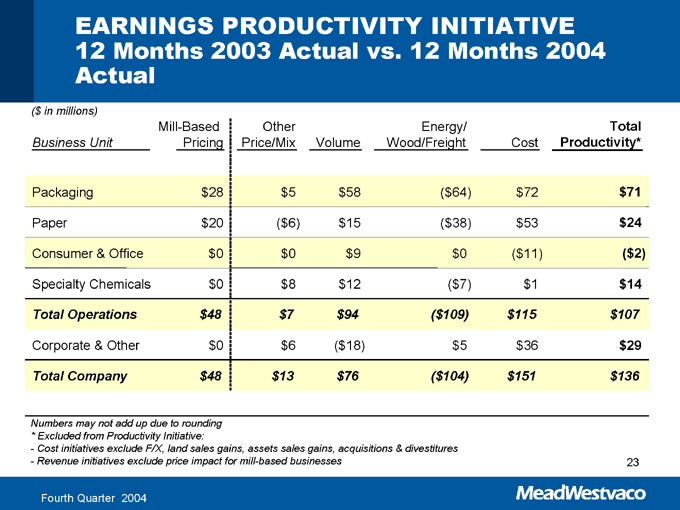
EARNINGS PRODUCTIVITY INITIATIVE
12 Months 2003 Actual vs. 12 Months 2004 Actual
($ in millions)
Mill-Based Other Energy/ Total
Business Unit Pricing Price/Mix Volume Wood/Freight Cost Productivity*
Packaging $28 $5 $58 ( $64) $72 $71
Paper $20 ( $6) $15 ( $38) $53 $24
Consumer & Office $0 $0 $9 $0 ( $11) ( $2)
Specialty Chemicals $0 $8 $12 ( $7) $1 $14
Total Operations $48 $7 $94 ($109) $115 $107
Corporate & Other $0 $6 ($18) $5 $36 $29
Total Company $48 $13 $76 ($104) $151 $136
Numbers may not add up due to rounding * Excluded from Productivity Initiative:
Cost initiatives exclude F/X, land sales gains, assets sales gains, acquisitions & divestitures Revenue initiatives exclude price impact for mill-based businesses
23
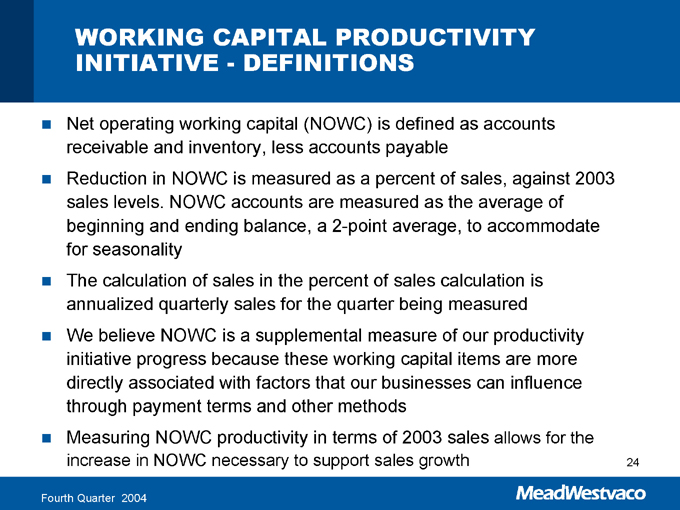
WORKING CAPITAL PRODUCTIVITY INITIATIVE—DEFINITIONS
Net operating working capital (NOWC) is defined as accounts receivable and inventory, less accounts payable
Reduction in NOWC is measured as a percent of sales, against 2003 sales levels. NOWC accounts are measured as the average of beginning and ending balance, a 2-point average, to accommodate for seasonality
The calculation of sales in the percent of sales calculation is annualized quarterly sales for the quarter being measured
We believe NOWC is a supplemental measure of our productivity initiative progress because these working capital items are more directly associated with factors that our businesses can influence through payment terms and other methods
Measuring NOWC productivity in terms of 2003 sales allows for the increase in NOWC necessary to support sales growth
24
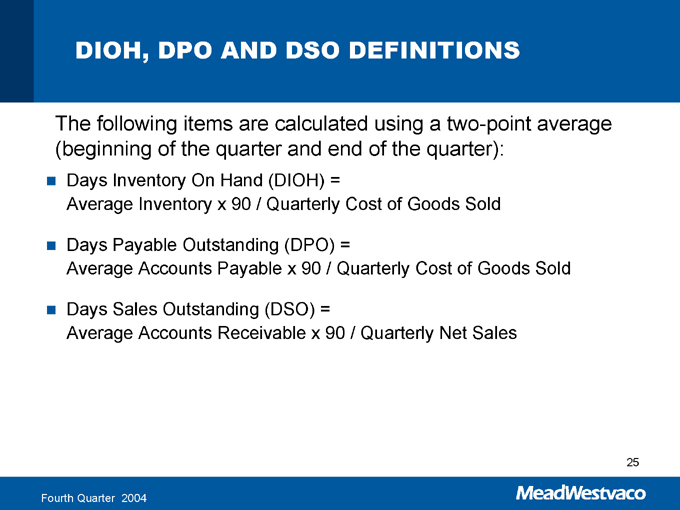
DIOH, DPO AND DSO DEFINITIONS
The following items are calculated using a two-point average (beginning of the quarter and end of the quarter):
Days Inventory On Hand (DIOH) = Average Inventory x 90 / Quarterly Cost of Goods Sold
Days Payable Outstanding (DPO) = Average Accounts Payable x 90 / Quarterly Cost of Goods Sold
Days Sales Outstanding (DSO) = Average Accounts Receivable x 90 / Quarterly Net Sales
25
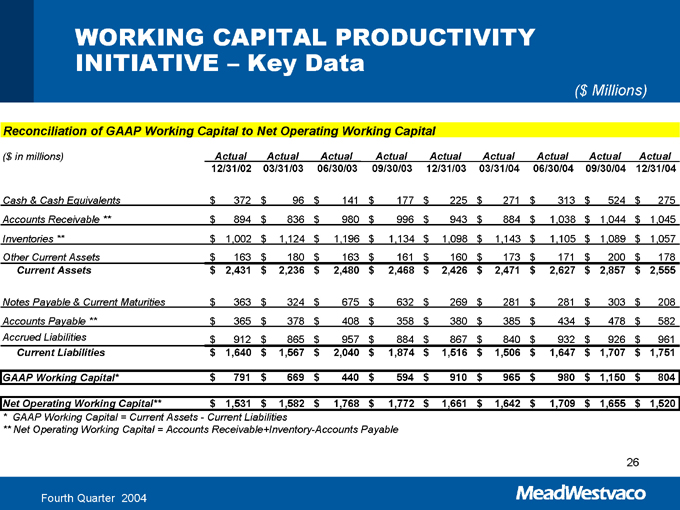
WORKING CAPITAL PRODUCTIVITY INITIATIVE – Key Data
($ Millions)
($ in millions) Actual Actual Actual Actual Actual Actual Actual Actual Actual
12/31/02 03/31/03 06/30/03 09/30/03 12/31/03 03/31/04 06/30/04 09/30/04 12/31/04
Cash & Cash Equivalents $372 $96 $141 $177 $225 $271 $313 $524 $275
Accounts Receivable ** $894 $836 $980 $996 $943 $884 $1,038 $1,044 $1,045
Inventories ** $1,002 $1,124 $1,196 $1,134 $1,098 $1,143 $1,105 $1,089 $1,057
Other Current Assets $163 $180 $163 $161 $160 $173 $171 $200 $178
Current Assets $2,431 $2,236 $2,480 $2,468 $2,426 $2,471 $2,627 $2,857 $2,555
Notes Payable & Current Maturities $363 $324 $675 $632 $269 $281 $281 $303 $208
Accounts Payable ** $365 $378 $408 $358 $380 $385 $434 $478 $582
Accrued Liabilities $912 $865 $957 $884 $867 $840 $932 $926 $961
Current Liabilities $1,640 $1,567 $2,040 $1,874 $1,516 $1,506 $1,647 $1,707 $1,751
GAAP Working Capital* $791 $669 $440 $594 $910 $965 $980 $1,150 $804
Net Operating Working Capital** $1,531 $1,582 $1,768 $1,772 $1,661 $1,642 $1,709 $1,655 $1,520
* GAAP Working Capital = Current Assets—Current Liabilities
** Net Operating Working Capital = Accounts Receivable+Inventory-Accounts Payable
26
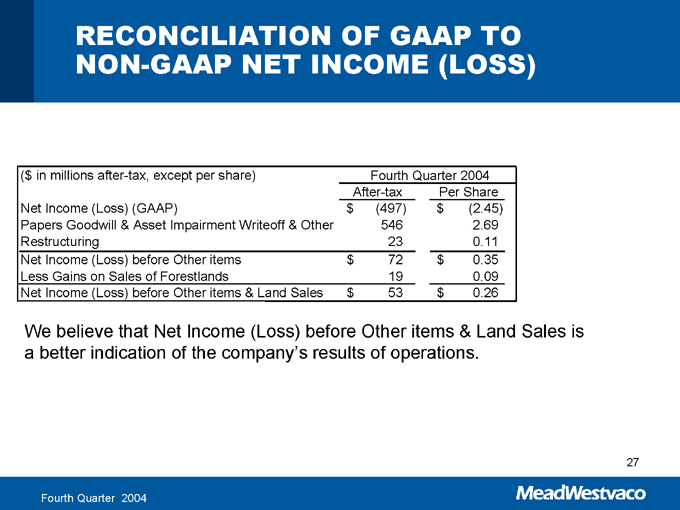
RECONCILIATION OF GAAP TO NON-GAAP NET INCOME (LOSS)
27
($ in millions after-tax, except per share) Fourth Quarter 2004 After-tax Per Share
Net Income (Loss) (GAAP) $(497) $(2.45)
Papers Goodwill & Asset Impairment Writeoff & Other 546 2.69
Restructuring 23 0.11
Net Income (Loss) before Other items $72 $0.35
Less Gains on Sales of Forestlands 19 0.095
Net Income (Loss) before Other items & Land Sales $53 $ 0.26
We believe that Net Income (loss) before Other items & Land Sales is a better indication of the company’s results of operation.