ISSUER FREE WRITING PROSPECTUS Filed Pursuant to Rule 433 Registration Statement No. 333-137902 Dated March 6, 2009 |
 | Global Markets / Equity Global Markets Equity Proprietary Indices Monthly Report - March 2009 A Passion to Perform Deutsche Bank |
 |
GME Indices Review
(as of 27th February 2009)

TABLE OF CONTENTS

Performance Summary
Deutsche Bank CROCI Indices                                            2
Deutsche Bank Evergreen Indices                                        2
Deutsche Bank Alpha Indices                                            3
Deutsche Bank Multi-Asset Indices                                      4
Deutsche Bank Specialised Indices                                      4
Deutsche Bank Islamic Indices                                          5

Monthly Reviews
Deutsche Bank CROCI US+ Index                                          6
Deutsche Bank CROCI US Plus II Index                                   7
Deutsche Bank CROCI Euro+ Index                                        8
Deutsche Bank CROCI Euro II Index                                      9
Deutsche Bank CROCI Japan+ Index                                       10
Deutsche Bank CROCI Japan II Index                                     11
Deutsche Bank US Growth Total Return Index                             12
Deutsche Bank US Value Total Return Index                              13
Deutsche Bank Euro Growth Total Return Index                           14
Deutsche Bank Euro Value Total Return Index                            15
Deutsche Bank UK Growth Total Return Index                             16
Deutsche Bank UK Value Total Return Index                              17
Deutsche Bank Japan Growth Total Return Index                          18
Deutsche Bank Japan Value Total Return Index                           19
S&P X-Alpha Total Return USD Index                                     20
S&P X-Alpha Excess Return USD Index                                    21
Deutsche Bank X-Alpha Total Return USD Index                           22
Deutsche Bank X-Alpha Excess Return USD Index                          23
DBIQ ImpAct  Dollar Equity Volatility (Bid) Index                      24
Deutsche Bank Liquid Alpha USD 5 Total Return S1 Index                 25
Deutsche Bank Liquid Alpha USD 5 Excess Return S1 Index                26
Deutsche Bank US ValueGrowth Select Index                              27
Deutsche Bank ValueGrowth Select Total Return Index                    28
Deutsche Bank Global Yield US Total Return Index                       29
Deutsche Bank Global Yield Euro Total Return Index                     30
Deutsche Bank Global Yield AP Total Return Index                       31
Deutsche Bank E-REV Europe Total Return Index                          32
Deutsche Bank E-REV Japan Total Return Index                           33
Deutsche Bank SectorLeader Total Return Index                          34
Deutsche Bank ChinaOpportunity USD Total Return Index                  35
Deutsche Bank Islamic US EquityBuilder Total Return Index              36
Deutsche Bank Islamic Europe EquityBuilder Total Return Index          37
Deutsche  Bank  Islamic  Asia  Pacific  EquityBuilder  Total Return    38
Index
Deutsche Bank Islamic  Global  Pacific  EquityBuilder  Total Return    39
Index

                                                                               1
|
  |
GME Indices Performance Summary
(as of 27th February 2009)
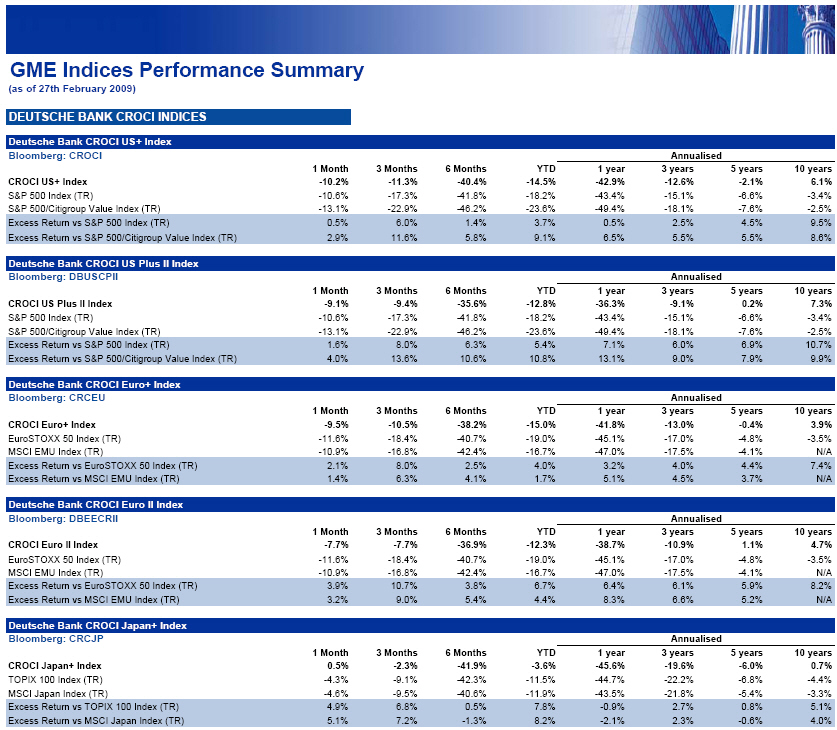
Deutsche Bank Croci Indices
Deutsche Bank CROCI US+ Index
Bloomberg: CROCI
1 Month 3 Months 6 Months YTD 1 year
CROCI US+ Index -10.2% -11.3% -40.4% -14.5% -42.9%
S&P 500 Index (TR) -10.6% -17.3% -41.8% -18.2% -43.4%
S&P 500/Citigroup Value Index (TR) -13.1% -22.9% -46.2% -23.6% -49.4%
Excess Return vs S&P 500 Index (TR) 0.5% 6.0% 1.4% 3.7% 0.5%
Excess Return vs S&P 500/Citigroup Value Index (TR) 2.9% 11.6% 5.8% 9.1% 6.5%
Deutsche Bank CROCI US Plus II Index
Bloomberg: DBUSCPII 1 Month 3 Months 6 Months YTD 1 year
CROCI US Plus II Index -9.1% -9.4% -35.6% -12.8% -36.3%
S&P 500 Index (TR) -10.6% -17.3% -41.8% -18.2% -43.4%
S&P 500/Citigroup Value Index (TR) -13.1% -22.9% -46.2% -23.6% -49.4%
Excess Return vs S&P 500 Index (TR) 1.6% 8.0% 6.3% 5.4% 7.1%
Excess Return vs S&P 500/Citigroup Value Index (TR) 4.0% 13.6% 10.6% 10.8% 13.1%
Deutsche Bank CROCI Euro+
Index Bloomberg: CRCEU
1 Month 3 Months 6 Months YTD 1 year
CROCI Euro+ Index -9.5% -10.5% -38.2% -15.0% -41.8%
EuroSTOXX 50 Index (TR) -11.6% -18.4% -40.7% -19.0% -45.1%
MSCI EMU Index (TR) -10.9% -16.8% -42.4% -16.7% -47.0%
Excess Return vs EuroSTOXX 50 Index (TR) 2.1% 8.0% 2.5% 4.0% 3.2%
Excess Return vs MSCI EMU Index (TR) 1.4% 6.3% 4.1% 1.7% 5.1%
Deutsche Bank CROCI Euro II Index
Bloomberg: DBEECRII
1 Month 3 Months 6 Months YTD 1 year
CROCI Euro II Index -7.7% -7.7% -36.9% -12.3% -38.7%
EuroSTOXX 50 Index (TR) -11.6% -18.4% -40.7% -19.0% -45.1%
MSCI EMU Index (TR) -10.9% -16.8% -42.4% -16.7% -47.0%
Excess Return vs EuroSTOXX 50 Index (TR) 3.9% 10.7% 3.8% 6.7% 6.4%
Excess Return vs MSCI EMU Index (TR) 3.2% 9.0% 5.4% 4.4% 8.3%
Deutsche Bank CROCI Japan+ Index
Bloomberg: CRCJP
1 Month 3 Months 6 Months YTD 1 year
CROCI Japan+ Index 0.5% -2.3% -41.9% -3.6% -45.6%
TOPIX 100 Index (TR) -4.3% -9.1% -42.3% -11.5% -44.7%
MSCI Japan Index (TR) -4.6% -9.5% -40.6% -11.9% -43.5%
Excess Return vs TOPIX 100 Index (TR) 4.9% 6.8% 0.5% 7.8% -0.9%
Excess Return vs MSCI Japan Index (TR) 5.1% 7.2% -1.3% 8.2% -2.1%
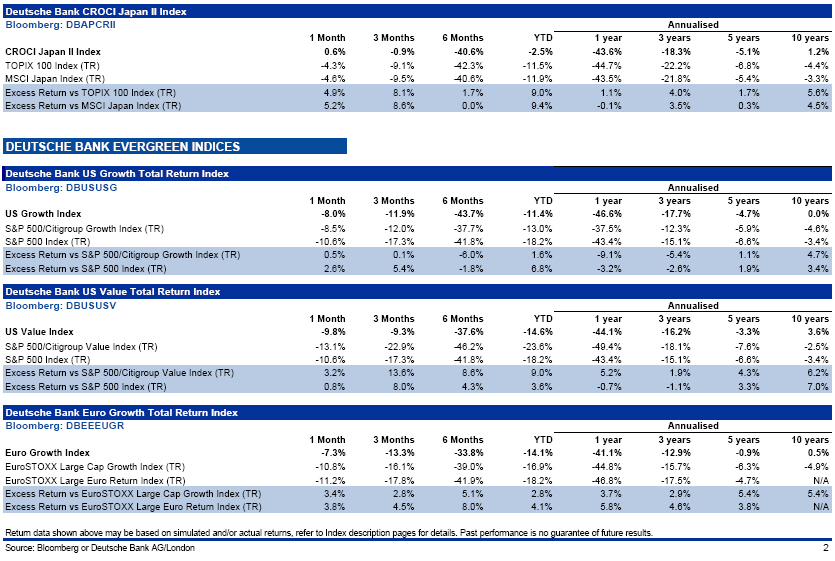
Deutsche Bank CROCI Japan II Index
Bloomberg: DBAPCRII
1 Month 3 Months 6 Months YTD 1 year
CROCI Japan II Index 0.6% -0.9% -40.6% -2.5% -43.6%
TOPIX 100 Index (TR) -4.3% -9.1% -42.3% -11.5% -44.7%
MSCI Japan Index (TR) -4.6% -9.5% -40.6% -11.9% -43.5%
Excess Return vs TOPIX 100 Index (TR) 4.9% 8.1% 1.7% 9.0% 1.1%
Excess Return vs MSCI Japan Index (TR) 5.2% 8.6% 0.0% 9.4% -0.1%
Deutsche Bank Evergreen Indices
Deutsche Bank US Growth Total Return Index
Bloomberg: DBUSUSG
1 Month 3 Months 6 Months YTD 1 year
US Growth Index -8.0% -11.9% -43.7% -11.4% -46.6%
S&P 500/Citigroup Growth Index (TR) -8.5% -12.0% -37.7% -13.0% -37.5%
S&P 500 Index (TR) -10.6% -17.3% -41.8% -18.2% -43.4%
Excess Return vs S&P 500/Citigroup Growth Index (TR) 0.5% 0.1% -6.0% 1.6% -9.1%
Excess Return vs S&P 500 Index (TR) 2.6% 5.4% -1.8% 6.8% -3.2%
Deutsche Bank US Value Total Return Index
Bloomberg: DBUSUSV
1 Month 3 Months 6 Months YTD 1 year
US Value Index -9.8% -9.3% -37.6% -14.6% -44.1%
S&P 500/Citigroup Value Index (TR) -13.1% -22.9% -46.2% -23.6% -49.4%
S&P 500 Index (TR) -10.6% -17.3% -41.8% -18.2% -43.4%
Excess Return vs S&P 500/Citigroup Value Index (TR) 3.2% 13.6% 8.6% 9.0% 5.2%
Excess Return vs S&P 500 Index (TR) 0.8% 8.0% 4.3% 3.6% -0.7%
Deutsche Bank Euro Growth Total Return Index
Bloomberg: DBEEEUGR
1 Month 3 Months 6 Months YTD 1 year
Euro Growth Index -7.3% -13.3% -33.8% -14.1% -41.1%
EuroSTOXX Large Cap Growth Index (TR) -10.8% -16.1% -39.0% -16.9% -44.8%
EuroSTOXX Large Euro Return Index (TR) -11.2% -17.8% -41.9% -18.2% -46.8%
Excess Return vs EuroSTOXX Large Cap Growth Index (TR) 3.4% 2.8% 5.1% 2.8% 3.7%
Excess Return vs EuroSTOXX Large Euro Return Index (TR) 3.8% 4.5% 8.0% 4.1% 5.8%
Deutsche Bank Croci Indices
Deutsche Bank CROCI US+ Index Annualised
Bloomberg: CROCI
3 years 5 years 0 years
CROCI US+ Index -12.6% -2.1% 6.1%
S&P 500 Index (TR) -15.1% -6.6% -3.4%
S&P 500/Citigroup Value Index (TR) -18.1% -7.6% -2.5%
Excess Return vs S&P 500 Index (TR) 2.5% 4.5% 9.5%
Excess Return vs S&P 500/Citigroup Value Index (TR) 5.5% 5.5% 8.6%
Deutsche Bank CROCI US Plus II Index Annualised
Bloomberg: DBUSCPII 3 years 5 years 0 years
CROCI US Plus II Index -9.1% 0.2% 7.3%
S&P 500 Index (TR) -15.1% -6.6% -3.4%
S&P 500/Citigroup Value Index (TR) -18.1% -7.6% -2.5%
Excess Return vs S&P 500 Index (TR) 6.0% 6.9% 10.7%
Excess Return vs S&P 500/Citigroup Value Index (TR) 9.0% 7.9% 9.9%
Deutsche Bank CROCI Euro+
Index Bloomberg: CRCEU
Annualised
3 years 5 years 0 years
CROCI Euro+ Index -13.0% -0.4% 3.9%
EuroSTOXX 50 Index (TR) -17.0% -4.8% -3.5%
MSCI EMU Index (TR) -17.5% -4.1% N/A
Excess Return vs EuroSTOXX 50 Index (TR) 4.0% 4.4% 7.4%
Excess Return vs MSCI EMU Index (TR) 4.5% 3.7% N/A
Deutsche Bank CROCI Euro II Index
Bloomberg: DBEECRII
Annualised
3 years 5 years 0 years
CROCI Euro II Index -10.9% 1.1% 4.7%
EuroSTOXX 50 Index (TR) -17.0% -4.8% -3.5%
MSCI EMU Index (TR) -17.5% -4.1% N/A
Excess Return vs EuroSTOXX 50 Index (TR) 6.1% 5.9% 8.2%
Excess Return vs MSCI EMU Index (TR) 6.6% 5.2% N/A
Deutsche Bank CROCI Japan+ Index
Bloomberg: CRCJP Annualised
3 years 5 years 0 years
CROCI Japan+ Index -19.6% -6.0% 0.7%
TOPIX 100 Index (TR) -22.2% -6.8% -4.4%
MSCI Japan Index (TR) -21.8% -5.4% -3.3%
Excess Return vs TOPIX 100 Index (TR) 2.7% 0.8% 5.1%
Excess Return vs MSCI Japan Index (TR) 2.3% -0.6% 4.0%
Deutsche Bank CROCI Japan II Index
Bloomberg: DBAPCRII Annualised
3 years 5 years 0 years
CROCI Japan II Index -18.3% -5.1% 1.2%
TOPIX 100 Index (TR) -22.2% -6.8% -4.4%
MSCI Japan Index (TR) -21.8% -5.4% -3.3%
Excess Return vs TOPIX 100 Index (TR) 4.0% 1.7% 5.6%
Excess Return vs MSCI Japan Index (TR) 3.5% 0.3% 4.5%
Deutsche Bank Evergreen Indices
Deutsche Bank US Growth Total Return Index
Bloomberg: DBUSUSG Annualised
3 years 5 years 10 years
US Growth Index -17.7% -4.7% 0.0%
S&P 500/Citigroup Growth Index (TR) -12.3% -5.9% -4.6%
S&P 500 Index (TR) -15.1% -6.6% -3.4%
Excess Return vs S&P 500/Citigroup Growth Index (TR) -5.4% 1.1% 4.7%
Excess Return vs S&P 500 Index (TR) -2.6% 1.9% 3.4%
Deutsche Bank US Value Total Return Index
Bloomberg: DBUSUSV
Annualised
3 years 5 years 10 years
US Value Index -16.2% -3.3% 3.6%
S&P 500/Citigroup Value Index (TR) -18.1% -7.6% -2.5%
S&P 500 Index (TR) -15.1% -6.6% -3.4%
Excess Return vs S&P 500/Citigroup Value Index (TR) 1.9% 4.3% 6.2%
Excess Return vs S&P 500 Index (TR) -1.1% 3.3% 7.0%
Deutsche Bank Euro Growth Total Return Index
Bloomberg: DBEEEUGR
Annualised
3 years 5 years 10 years
Euro Growth Index -12.9% -0.9% 0.5%
EuroSTOXX Large Cap Growth Index (TR) -15.7% -6.3% -4.9%
EuroSTOXX Large Euro Return Index (TR) -17.5% -4.7% N/A
Excess Return vs EuroSTOXX Large Cap Growth Index (TR) 2.9% 5.4% 5.4%
Excess Return vs EuroSTOXX Large Euro Return Index (TR) 4.6% 3.8% N/A
Return data shown above may be based on simulated and/or actual returns, refer to Index description
pages for details. Past performance is no guarantee of future results.
Source: Bloomberg or Deutsche Bank AG/London
2
|
  |
GME Indices Performance Summary
(as of 27th February 2009)
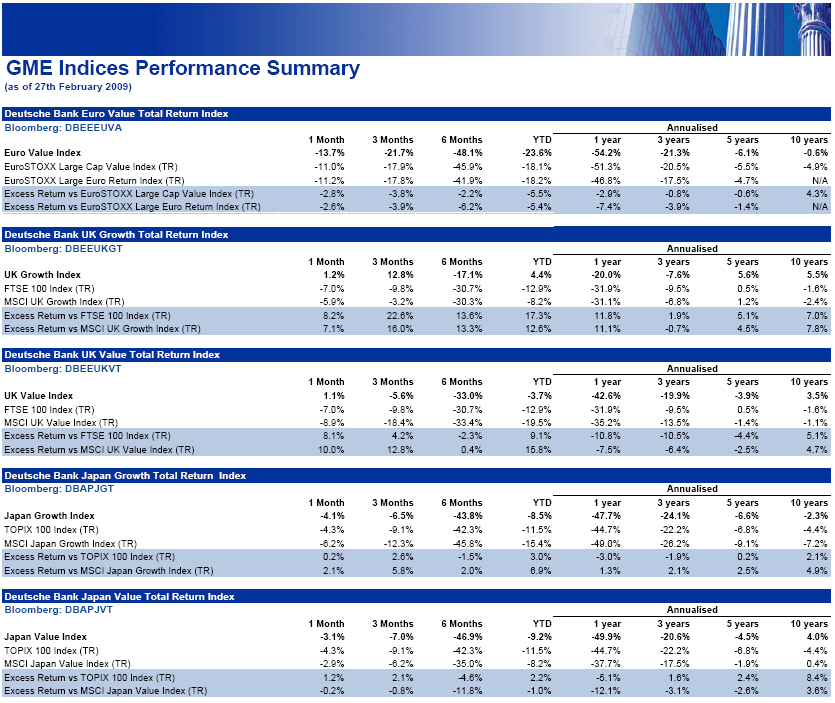
Deutsche Bank Euro Value Total Return Index
Bloomberg: DBEEEUVA
1 Month 3 Months 6 Months YTD 1 year
EURO VALUE INDEX -13.7% -21.7% -48.1% -23.6% -54.2%
EuroSTOXX Large Cap Value Index (TR) -11.0% -17.9% -45.9% -18.1% -51.3%
EuroSTOXX Large Euro Return Index (TR) -11.2% -17.8% -41.9% -18.2% -46.8%
Excess Return vs EuroSTOXX Large Cap Value Index (TR) -2.8% -3.8% -2.2% -5.5% -2.9%
Excess Return vs EuroSTOXX Large Euro Return Index (TR) -2.6% -3.9% -6.2% -5.4% -7.4%
Deutsche Bank UK Growth Total Return Index
Bloomberg: DBEEUKGT
1 Month 3 Months 6 Months YTD 1 year
UK Growth Index 1.2% 12.8% -17.1% 4.4% -20.0%
FTSE 100 Index (TR) -7.0% -9.8% -30.7% -12.9% -31.9%
MSCI UK Growth Index (TR) -5.9% -3.2% -30.3% -8.2% -31.1%
Excess Return vs FTSE 100 Index (TR) 8.2% 22.6% 13.6% 17.3% 11.8%
Excess Return vs MSCI UK Growth Index (TR) 7.1% 16.0% 13.3% 12.6% 11.1%
Deutsche Bank UK Value Total Return Index
Bloomberg: DBEEUKVT
1 Month 3 Months 6 Months YTD 1 year
UK Value Index 1.1% -5.6% -33.0% -3.7% -42.6%
FTSE 100 Index (TR) -7.0% -9.8% -30.7% -12.9% -31.9%
MSCI UK Value Index (TR) -8.9% -18.4% -33.4% -19.5% -35.2%
Excess Return vs FTSE 100 Index (TR) 8.1% 4.2% -2.3% 9.1% -10.8%
Excess Return vs MSCI UK Value Index (TR) 10.0% 12.8% 0.4% 15.8% -7.5%
Deutsche Bank Japan Growth Total Return Index
Bloomberg: DBAPJGT
1 Month 3 Months 6 Months YTD 1 year
Japan Growth Index -4.1% -6.5% -43.8% -8.5% -47.7%
TOPIX 100 Index (TR) -4.3% -9.1% -42.3% -11.5% -44.7%
MSCI Japan Growth Index (TR) -6.2% -12.3% -45.8% -15.4% -49.0%
Excess Return vs TOPIX 100 Index (TR) 0.2% 2.6% -1.5% 3.0% -3.0%
Excess Return vs MSCI Japan Growth Index (TR) 2.1% 5.8% 2.0% 6.9% 1.3%
Deutsche Bank Japan Value Total Return Index
Bloomberg: DBAPJVT
1 Month 3 Months 6 Months YTD 1 year
Japan Value Index -3.1% -7.0% -46.9% -9.2% -49.9%
TOPIX 100 Index (TR) -4.3% -9.1% -42.3% -11.5% -44.7%
MSCI Japan Value Index (TR) -2.9% -6.2% -35.0% -8.2% -37.7%
Excess Return vs TOPIX 100 Index (TR) 1.2% 2.1% -4.6% 2.2% -5.1%
Excess Return vs MSCI Japan Value Index (TR) -0.2% -0.8% -11.8% -1.0% -12.1%
DEUTSCHE BANK ALPHA INDICES
S&P X-Alpha Total Return USD Index
Bloomberg: SPXADT
1 Month 3 Months 6 Months YTD 1 year
S&P X-Alpha TR Index 1.8% 4.6% 1.5% 3.9% -2.7%
MSCI World Index (TR) -10.2% -15.5% -43.6% -18.1% -47.2%
HFRX USD Equity Market Neutral Index (TR) -1.0% -3.1% -2.4% -0.9% -0.1%
Excess Return vs MSCI World Index (TR) 12.1% 20.1% 45.0% 22.0% 44.5%
Excess Return vs HFRX USD Equity Market Neutral Index (TR)2.8% 7.7% 3.9% 4.8% -2.6%
S&P X-Alpha Excess Return USD Index
Bloomberg: SPXADE
1 Month 3 Months 6 Months YTD 1 year
S&P X-Alpha ER Index 1.8% 4.6% 1.2% 3.9% -4.1%
MSCI World Index (TR) -10.2% -15.5% -43.6% -18.1% -47.2%
HFRX USD Equity Market Neutral Index (TR) -1.0% -3.1% -2.4% -0.9% -0.1%
Excess Return vs MSCI World Index (TR) 12.0% 20.1% 44.7% 22.0% 43.2%
Excess Return vs HFRX USD Equity Market Neutral Index (TR)2.8% 7.7% 3.6% 4.8% -4.0%
Deutsche Bank X-Alpha Total Return USD Index
Bloomberg: DBGLXAT
1 Month 3 Months 6 Months YTD 1 year
X-Alpha TR Index 1.2% 4.0% 0.1% 3.2% -3.9%
MSCI World Index (TR) -10.2% -15.5% -43.6% -18.1% -47.2%
HFRX USD Equity Market Neutral Index (TR) -1.0% -3.1% -2.4% -0.9% -0.1%
Excess Return vs MSCI World Index (TR) 11.5% 19.4% 43.7% 21.3% 43.4%
Excess Return vs HFRX USD Equity Market Neutral Index (TR)2.2% 7.0% 2.5% 4.2% -3.8%
Deutsche Bank X-Alpha Excess Return USD Index
Bloomberg: DBGLXAE
1 Month 3 Months 6 Months YTD 1 year
X-Alpha ER Index 1.2% 3.9% -0.2% 3.2% -5.2%
MSCI World Index (TR) -10.2% -15.5% -43.6% -18.1% -47.2%
HFRX USD Equity Market Neutral Index (TR) -1.0% -3.1% -2.4% -0.9% -0.1%
Excess Return vs MSCI World Index (TR) 11.4% 19.4% 43.4% 21.3% 42.0%
Excess Return vs HFRX USD Equity Market Neutral Index (TR)2.2% 7.0% 2.2% 4.2% -5.1%
Deutsche Bank Euro Value Total Return Index
Bloomberg: DBEEEUVA
Annualised
3 years 5 years 10 years
EURO VALUE INDEX -21.3% -6.1% -0.6%
EuroSTOXX Large Cap Value Index (TR) -20.5% -5.5% -4.9%
EuroSTOXX Large Euro Return Index (TR) -17.5% -4.7% N/A
Excess Return vs EuroSTOXX Large Cap Value Index (TR) -0.8% -0.6% 4.3%
Excess Return vs EuroSTOXX Large Euro Return Index (TR) -3.9% -1.4% N/A
Deutsche Bank UK Growth Total Return Index
Bloomberg: DBEEUKGT Annualised
3 years 5 years 10 years
UK Growth Index -7.6% 5.6% 5.5%
FTSE 100 Index (TR) -9.5% 0.5% -1.6%
MSCI UK Growth Index (TR) -6.8% 1.2% -2.4%
Excess Return vs FTSE 100 Index (TR) 1.9% 5.1% 7.0%
Excess Return vs MSCI UK Growth Index (TR) -0.7% 4.5% 7.8%
Deutsche Bank UK Value Total Return Index
Bloomberg: DBEEUKVT Annualised
3 years 5 years 10 years
UK Value Index -19.9% -3.9% 3.5%
FTSE 100 Index (TR) -9.5% 0.5% -1.6%
MSCI UK Value Index (TR) -13.5% -1.4% -1.1%
Excess Return vs FTSE 100 Index (TR) -10.5% -4.4% 5.1%
Excess Return vs MSCI UK Value Index (TR) -6.4% -2.5% 4.7%
Deutsche Bank Japan Growth Total Return Index
Bloomberg: DBAPJGT Annualised
3 years 5 years 10 years
Japan Growth Index -24.1% -6.6% -2.3%
TOPIX 100 Index (TR) -22.2% -6.8% -4.4%
MSCI Japan Growth Index (TR) -26.2% -9.1% -7.2%
Excess Return vs TOPIX 100 Index (TR) -1.9% 0.2% 2.1%
Excess Return vs MSCI Japan Growth Index (TR) 2.1% 2.5% 4.9%
Deutsche Bank Japan Value Total Return Index
Bloomberg: DBAPJVT Annualised
3 years 5 years 10 years
Japan Value Index -20.6% -4.5% 4.0%
TOPIX 100 Index (TR) -22.2% -6.8% -4.4%
MSCI Japan Value Index (TR) -17.5% -1.9% 0.4%
Excess Return vs TOPIX 100 Index (TR) 1.6% 2.4% 8.4%
Excess Return vs MSCI Japan Value Index (TR) -3.1% -2.6% 3.6%
DEUTSCHE BANK ALPHA INDICES
S&P X-Alpha Total Return USD Index
Bloomberg: SPXADT Annualised
3 years 5 years 10 years
S&P X-Alpha TR Index 2.0% 7.8% 9.1%
MSCI World Index (TR) -15.2% -5.0% -2.5%
HFRX USD Equity Market Neutral Index (TR) 1.8% 1.2% N/A
Excess Return vs MSCI World Index (TR) 17.2% 12.9% 11.7%
Excess Return vs HFRX USD Equity Market Neutral Index ( 0.2% 6.7% N/A
S&P X-Alpha Excess Return USD Index
Bloomberg: SPXADE Annualised
3 years 5 years 10 years
S&P X-Alpha ER Index -1.8% 4.4% 5.6%
MSCI World Index (TR) -15.2% -5.0% -2.5%
HFRX USD Equity Market Neutral Index (TR) 1.8% 1.2% N/A
Excess Return vs MSCI World Index (TR) 13.4% 9.4% 8.1%
Excess Return vs HFRX USD Equity Market Neutral Index ( -3.6% 3.2% N/A
Deutsche Bank X-Alpha Total Return USD Index
Bloomberg: DBGLXAT Annualised
3 years 5 years 10 years
X-Alpha TR Index 1.5% 7.7% 9.4%
MSCI World Index (TR) -15.2% -5.0% -2.5%
HFRX USD Equity Market Neutral Index (TR) 1.8% 1.2% N/A
Excess Return vs MSCI World Index (TR) 16.8% 12.8% 11.9%
Excess Return vs HFRX USD Equity Market Neutral Index ( -0.2% 6.6% N/A
Deutsche Bank X-Alpha Excess Return USD Index
Bloomberg: DBGLXAE Annualised
3 years 5 years 10 years
X-Alpha ER Index -2.2% 4.3% 5.8%
MSCI World Index (TR) -15.2% -5.0% -2.5%
HFRX USD Equity Market Neutral Index (TR) 1.8% 1.2% N/A
Excess Return vs MSCI World Index (TR) 13.0% 9.3% 8.3%
Excess Return vs HFRX USD Equity Market Neutral Index ( -4.0% 3.1% N/A
Return data shown above may be based on simulated and/or actual returns, refer to Index description
pages for details. Past performance is no guarantee of future results.
Source: Bloomberg or Deutsche Bank AG/London
3
|
  |
GME Indices Performance Summary
(as of 27th February 2009)
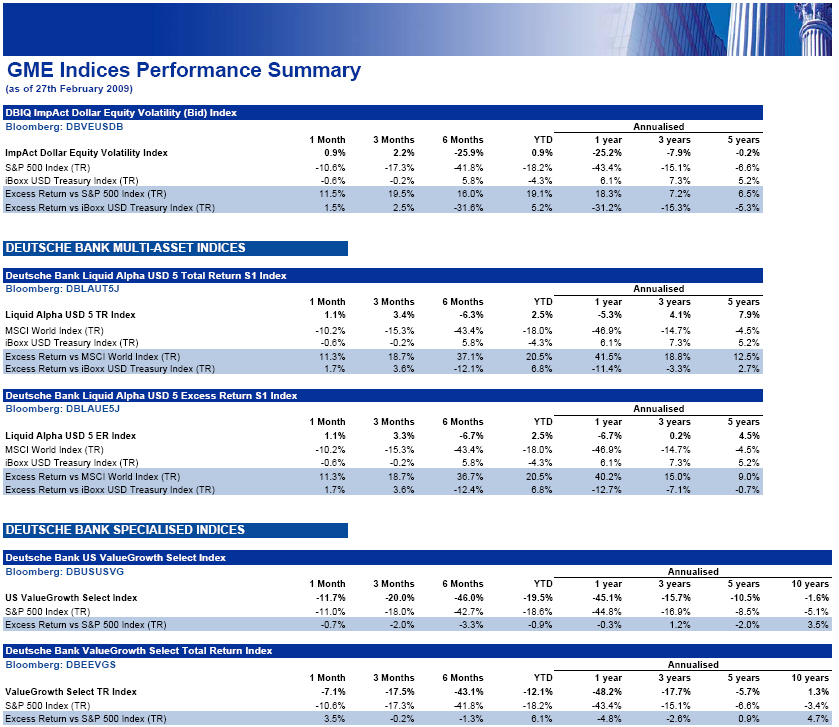
DBIQ ImpAct Dollar Equity Volatility (Bid) Index
Bloomberg: DBVEUSDB
1 Month 3 Months 6 Months YTD 1 year
ImpAct Dollar Equity Volatility Index 0.9% 2.2% -25.9% 0.9% -25.2%
S&P 500 Index (TR) -10.6% -17.3% -41.8% -18.2% -43.4%
iBoxx USD Treasury Index (TR) -0.6% -0.2% 5.8% -4.3% 6.1%
Excess Return vs S&P 500 Index (TR) 11.5% 19.5% 16.0% 19.1% 18.3%
Excess Return vs iBoxx USD Treasury Index (TR) 1.5% 2.5% -31.6% 5.2% -31.2%
DEUTSCHE BANK MULTI-ASSET INDICES
Deutsche Bank Liquid Alpha USD 5 Total Return S1 Index
Bloomberg: DBLAUT5J
1 Month 3 Months 6 Months YTD 1 year
Liquid Alpha USD 5 TR Index 1.1% 3.4% -6.3% 2.5% -5.3%
MSCI World Index (TR) -10.2% -15.3% -43.4% -18.0% -46.9%
iBoxx USD Treasury Index (TR) -0.6% -0.2% 5.8% -4.3% 6.1%
Excess Return vs MSCI World Index (TR) 11.3% 18.7% 37.1% 20.5% 41.5%
Excess Return vs iBoxx USD Treasury Index (TR) 1.7% 3.6% -12.1% 6.8% -11.4%
Deutsche Bank Liquid Alpha USD 5 Excess Return S1 Index
Bloomberg: DBLAUE5J
1 Month 3 Months 6 Months YTD 1 year
Liquid Alpha USD 5 ER Index 1.1% 3.3% -6.7% 2.5% -6.7%
MSCI World Index (TR) -10.2% -15.3% -43.4% -18.0% -46.9%
iBoxx USD Treasury Index (TR) -0.6% -0.2% 5.8% -4.3% 6.1%
Excess Return vs MSCI World Index (TR) 11.3% 18.7% 36.7% 20.5% 40.2%
Excess Return vs iBoxx USD Treasury Index (TR) 1.7% 3.6% -12.4% 6.8% -12.7%
Deutsche Bank US ValueGrowth Select Index
Bloomberg: DBUSUSVG
1 Month 3 Months 6 Months YTD 1 year
US ValueGrowth Select Index -11.7% -20.0% -46.0% -19.5% -45.1%
S&P 500 Index (TR) -11.0% -18.0% -42.7% -18.6% -44.8%
Excess Return vs S&P 500 Index (TR) -0.7% -2.0% -3.3% -0.9% -0.3%
Deutsche Bank ValueGrowth Select Total Return Index
Bloomberg: DBEEVGS
1 Month 3 Months 6 Months YTD 1 year
ValueGrowth Select TR Index -7.1% -17.5% -43.1% -12.1% -48.2%
S&P 500 Index (TR) -10.6% -17.3% -41.8% -18.2% -43.4%
Excess Return vs S&P 500 Index (TR) 3.5% -0.2% -1.3% 6.1% -4.8%
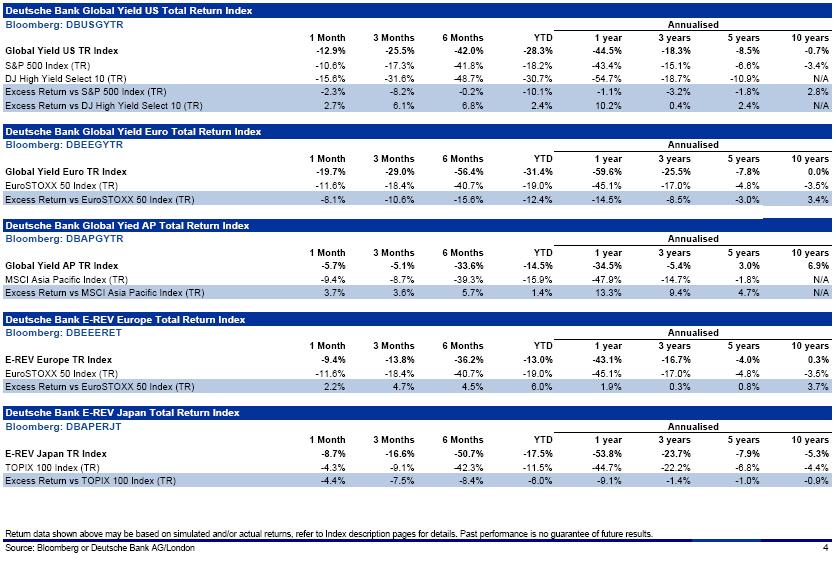
Deutsche Bank Global Yield US Total Return Index
Bloomberg: DBUSGYTR
1 Month 3 Months 6 Months YTD 1 year
Global Yield US TR Index -12.9% -25.5% -42.0% -28.3% -44.5%
S&P 500 Index (TR) -10.6% -17.3% -41.8% -18.2% -43.4%
DJ High Yield Select 10 (TR) -15.6% -31.6% -48.7% -30.7% -54.7%
Excess Return vs S&P 500 Index (TR) -2.3% -8.2% -0.2% -10.1% -1.1%
Excess Return vs DJ High Yield Select 10 (TR) 2.7% 6.1% 6.8% 2.4% 10.2%
Deutsche Bank Global Yield Euro Total Return Index
Bloomberg: DBEEGYTR
1 Month 3 Months 6 Months YTD 1 year
Global Yield Euro TR Index -19.7% -29.0% -56.4% -31.4% -59.6%
EuroSTOXX 50 Index (TR) -11.6% -18.4% -40.7% -19.0% -45.1%
Excess Return vs EuroSTOXX 50 Index (TR) -8.1% -10.6% -15.6% -12.4% -14.5%
Deutsche Bank Global Yied AP Total Return Index
Bloomberg: DBAPGYTR
1 Month 3 Months 6 Months YTD 1 year
Global Yield AP TR Index -5.7% -5.1% -33.6% -14.5% -34.5%
MSCI Asia Pacific Index (TR) -9.4% -8.7% -39.3% -15.9% -47.9%
Excess Return vs MSCI Asia Pacific Index (TR) 3.7% 3.6% 5.7% 1.4% 13.3%
Deutsche Bank E-REV Europe Total Return Index
Bloomberg: DBEEERET
1 Month 3 Months 6 Months YTD 1 year
E-REV Europe TR Index -9.4% -13.8% -36.2% -13.0% -43.1%
EuroSTOXX 50 Index (TR) -11.6% -18.4% -40.7% -19.0% -45.1%
Excess Return vs EuroSTOXX 50 Index (TR) 2.2% 4.7% 4.5% 6.0% 1.9%
Deutsche Bank E-REV Japan Total Return Index
Bloomberg: DBAPERJT
1 Month 3 Months 6 Months YTD 1 year
E-REV Japan TR Index -8.7% -16.6% -50.7% -17.5% -53.8%
TOPIX 100 Index (TR) -4.3% -9.1% -42.3% -11.5% -44.7%
Excess Return vs TOPIX 100 Index (TR) -4.4% -7.5% -8.4% -6.0% -9.1%
DBIQ ImpAct Dollar Equity Volatility (Bid) Index
Bloomberg: DBVEUSDB Annualised
3 years 5 years
ImpAct Dollar Equity Volatility Index -7.9% -0.2%
S&P 500 Index (TR) -15.1% -6.6%
iBoxx USD Treasury Index (TR) 7.3% 5.2%
Excess Return vs S&P 500 Index (TR) 7.2% 6.5%
Excess Return vs iBoxx USD Treasury Index (TR) -15.3% -5.3%
DEUTSCHE BANK MULTI-ASSET INDICES
Deutsche Bank Liquid Alpha USD 5 Total Return S1 Index
Bloomberg: DBLAUT5J Annualised
3 years 5 years
Liquid Alpha USD 5 TR Index 4.1% 7.9%
MSCI World Index (TR) -14.7% -4.5%
iBoxx USD Treasury Index (TR) 7.3% 5.2%
Excess Return vs MSCI World Index (TR) 18.8% 12.5%
Excess Return vs iBoxx USD Treasury Index (TR) -3.3% 2.7%
Deutsche Bank Liquid Alpha USD 5 Excess Return S1 Index
Bloomberg: DBLAUE5J Annualised
3 years 5 years
Liquid Alpha USD 5 ER Index 0.2% 4.5%
MSCI World Index (TR) -14.7% -4.5%
iBoxx USD Treasury Index (TR) 7.3% 5.2%
Excess Return vs MSCI World Index (TR) 15.0% 9.0%
Excess Return vs iBoxx USD Treasury Index (TR) -7.1% -0.7%
Deutsche Bank US ValueGrowth Select Index
Bloomberg: DBUSUSVG Annualised
3 years 5 years 10 years
US ValueGrowth Select Index -15.7% -10.5% -1.6%
S&P 500 Index (TR) -16.9% -8.5% -5.1%
Excess Return vs S&P 500 Index (TR) 1.2% -2.0% 3.5%
Deutsche Bank ValueGrowth Select Total Return Index
Bloomberg: DBEEVGS Annualised
3 years 5 years 10 years
ValueGrowth Select TR Index -17.7% -5.7% 1.3%
S&P 500 Index (TR) -15.1% -6.6% -3.4%
Excess Return vs S&P 500 Index (TR) -2.6% 0.9% 4.7%
Deutsche Bank Global Yield US Total Return Index
Bloomberg: DBUSGYTR Annualised
3 years 5 years 10 years
Global Yield US TR Index -18.3% -8.5% -0.7%
S&P 500 Index (TR) -15.1% -6.6% -3.4%
DJ High Yield Select 10 (TR) -18.7% -10.9% N/A
Excess Return vs S&P 500 Index (TR) -3.2% -1.8% 2.8%
Excess Return vs DJ High Yield Select 10 (TR) 0.4% 2.4% N/A
Deutsche Bank Global Yield Euro Total Return Index
Bloomberg: DBEEGYTR Annualised
3 years 5 years 10 years
Global Yield Euro TR Index -25.5% -7.8% 0.0%
EuroSTOXX 50 Index (TR) -17.0% -4.8% -3.5%
Excess Return vs EuroSTOXX 50 Index (TR) -8.5% -3.0% 3.4%
Deutsche Bank Global Yied AP Total Return Index
Bloomberg: DBAPGYTR Annualised
3 years 5 years 10 years
Global Yield AP TR Index -5.4% 3.0% 6.9%
MSCI Asia Pacific Index (TR) -14.7% -1.8% N/A
Excess Return vs MSCI Asia Pacific Index (TR) 9.4% 4.7% N/A
Deutsche Bank E-REV Europe Total Return Index
Bloomberg: DBEEERET Annualised
3 years 5 years 10 years
E-REV Europe TR Index -16.7% -4.0% 0.3%
EuroSTOXX 50 Index (TR) -17.0% -4.8% -3.5%
Excess Return vs EuroSTOXX 50 Index (TR) 0.3% 0.8% 3.7%
Deutsche Bank E-REV Japan Total Return Index
Bloomberg: DBAPERJT Annualised
3 years 5 years 10 years
E-REV Japan TR Index -23.7% -7.9% -5.3%
TOPIX 100 Index (TR) -22.2% -6.8% -4.4%
Excess Return vs TOPIX 100 Index (TR) -1.4% -1.0% -0.9%
Return data shown above may be based on simulated and/or actual returns, refer to Index description
pages for details. Past performance is no guarantee of future results.
Source: Bloomberg or Deutsche Bank AG/London
4
|
  |
GME Indices Performance Summary
(as of 27th February 2009
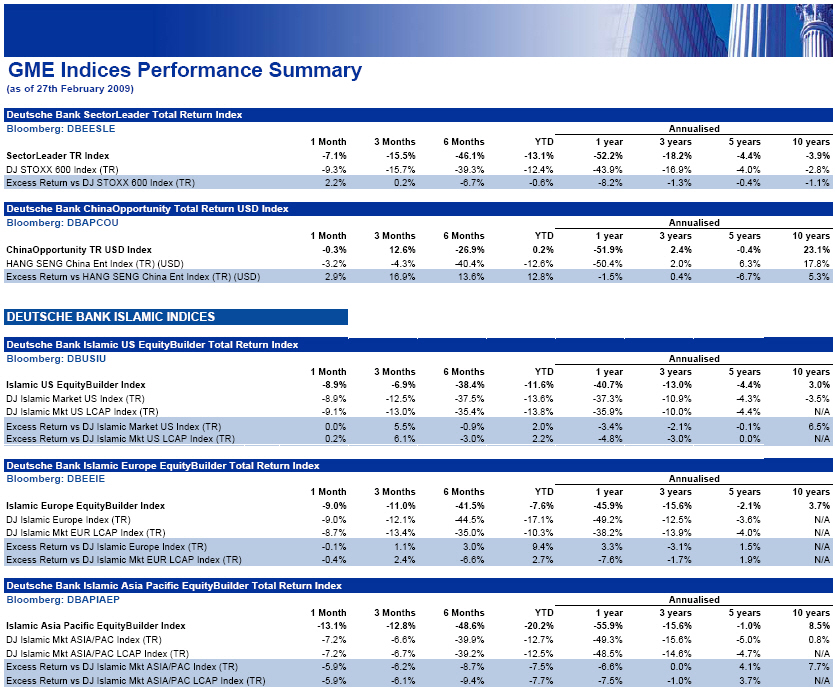
Deutsche Bank SectorLeader Total Return Index
Bloomberg: DBUSIU
1 Month 3 Months 6 Months YTD
Islamic US EquityBuilder Index -8.9% -6.9% -38.4% -11.6%
DJ Islamic Market US Index (TR) -8.9% -12.5% -37.5% -13.6%
DJ Islamic Mkt US LCAP Index (TR) -9.1% -13.0% -35.4% -13.8%
Excess Return vs DJ Islamic Market US Index (TR) 0.0% 5.5% -0.9% 2.0%
Excess Return vs DJ Islamic Mkt US LCAP Index (TR) 0.2% 6.1% -3.0% 2.2%
Deutsche Bank Islamic Europe EquityBuilder Total Return Index
Bloomberg: DBEEIE
1 Month 3 Months 6 Months YTD
Islamic Europe EquityBuilder Index -9.0% -11.0% -41.5% -7.6%
DJ Islamic Europe Index (TR) -9.0% -12.1% -44.5% -17.1%
DJ Islamic Mkt EUR LCAP Index (TR) -8.7% -13.4% -35.0% -10.3%
Excess Return vs DJ Islamic Europe Index (TR) -0.1% 1.1% 3.0% 9.4%
Excess Return vs DJ Islamic Mkt EUR LCAP Index (TR) -0.4% 2.4% -6.6% 2.7%
Deutsche Bank Islamic Asia Pacific EquityBuilder Total Return
Index
Bloomberg: DBAPIAEP
1 Month 3 Months 6 Months YTD
Islamic Asia Pacific EquityBuilder Index -13.1% -12.8% -48.6% -20.2%
DJ Islamic Mkt ASIA/PAC Index (TR) -7.2% -6.6% -39.9% -12.7%
DJ Islamic Mkt ASIA/PAC LCAP Index (TR) -7.2% -6.7% -39.2% -12.5%
Excess Return vs DJ Islamic Mkt ASIA/PAC Index (TR) -5.9% -6.2% -8.7% -7.5%
Excess Return vs DJ Islamic Mkt ASIA/PAC LCAP Index (TR) -5.9% -6.1% -9.4% -7.7%
Deutsche Bank Islamic Global EquityBuilder Total Return Index
Bloomberg: DBGLIGEP
1 Month 3 Months 6 Months YTD
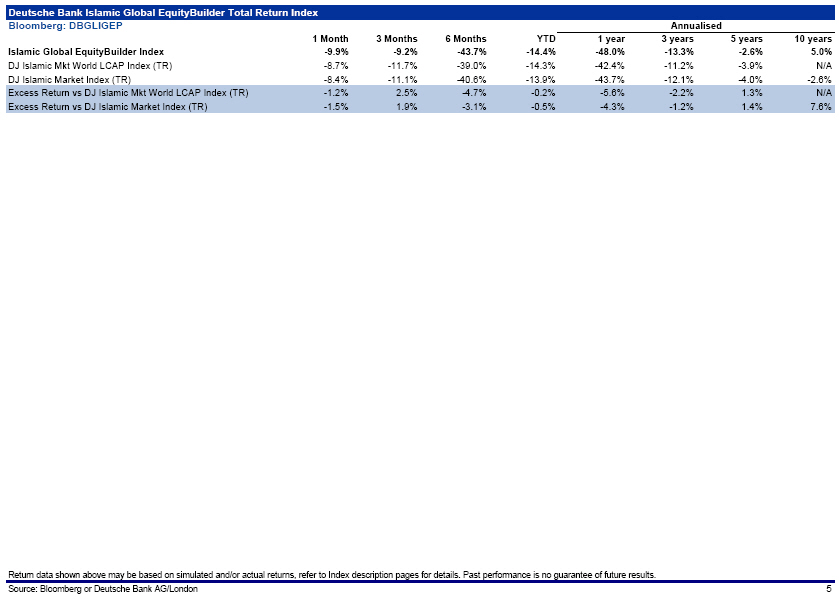
Islamic Global EquityBuilder Index -9.9% -9.2% -43.7% -14.4%
DJ Islamic Mkt World LCAP Index (TR) -8.7% -11.7% -39.0% -14.3%
DJ Islamic Market Index (TR) -8.4% -11.1% -40.6% -13.9%
Excess Return vs DJ Islamic Mkt World LCAP Index (TR) -1.2% 2.5% -4.7% -0.2%
Excess Return vs DJ Islamic Market Index (TR) -1.5% 1.9% -3.1% -0.5%
Deutsche Bank SectorLeader Total Return Index
Bloomberg: DBUSIU Annualised
1year 3 years 5 years 10 years
Islamic US EquityBuilder Index -40.7% -13.0% -4.4% 3.0%
DJ Islamic Market US Index (TR) -37.3% -10.9% -4.3% -3.5%
DJ Islamic Mkt US LCAP Index (TR) -35.9% -10.0% -4.4% N/A
Excess Return vs DJ Islamic Market US Index (TR) -3.4% -2.1% -0.1% 6.5%
Excess Return vs DJ Islamic Mkt US LCAP Index (TR) -4.8% -3.0% 0.0% N/A
Deutsche Bank Islamic Europe EquityBuilder Total Return Index
Bloomberg: DBEEIE Annualised
1year 3 years 5 years 10 years
Islamic Europe EquityBuilder Index -45.9% -15.6% -2.1% 3.7%
DJ Islamic Europe Index (TR) -49.2% -12.5% -3.6% N/A
DJ Islamic Mkt EUR LCAP Index (TR) -38.2% -13.9% -4.0% N/A
Excess Return vs DJ Islamic Europe Index (TR) 3.3% -3.1% 1.5% N/A
Excess Return vs DJ Islamic Mkt EUR LCAP Index (TR) -7.6% -1.7% 1.9% N/A
Deutsche Bank Islamic Asia Pacific EquityBuilder Total Return
Index
Bloomberg: DBAPIAEP Annualised
1year 3 years 5 years 10 years
Islamic Asia Pacific EquityBuilder Index -55.9% -15.6% -1.0% 8.5%
DJ Islamic Mkt ASIA/PAC Index (TR) -49.3% -15.6% -5.0% 0.8%
DJ Islamic Mkt ASIA/PAC LCAP Index (TR) -48.5% -14.6% -4.7% N/A
Excess Return vs DJ Islamic Mkt ASIA/PAC Index (TR) -6.6% 0.0% 4.1% 7.7%
Excess Return vs DJ Islamic Mkt ASIA/PAC LCAP Index (TR) -7.5% -1.0% 3.7% N/A
Deutsche Bank Islamic Global EquityBuilder Total Return Index
Bloomberg: DBGLIGEP Annualised
1year 3 years 5 years 10 years
Islamic Global EquityBuilder Index -48.0% -13.3% -2.6% 5.0%
DJ Islamic Mkt World LCAP Index (TR) -42.4% -11.2% -3.9% N/A
DJ Islamic Market Index (TR) -43.7% -12.1% -4.0% -2.6%
Excess Return vs DJ Islamic Mkt World LCAP Index (TR) -5.6% -2.2% 1.3% N/A
Excess Return vs DJ Islamic Market Index (TR) -4.3% -1.2% 1.4% 7.6%
Return data shown above may be based on simulated and/or actual returns, refer to Index description
pages for details. Past performance is no guarantee of future results.
Source: Bloomberg or Deutsche Bank AG/London
5
|
  |
REUTERS: .CROCI
BLOOMBERG: CROCI
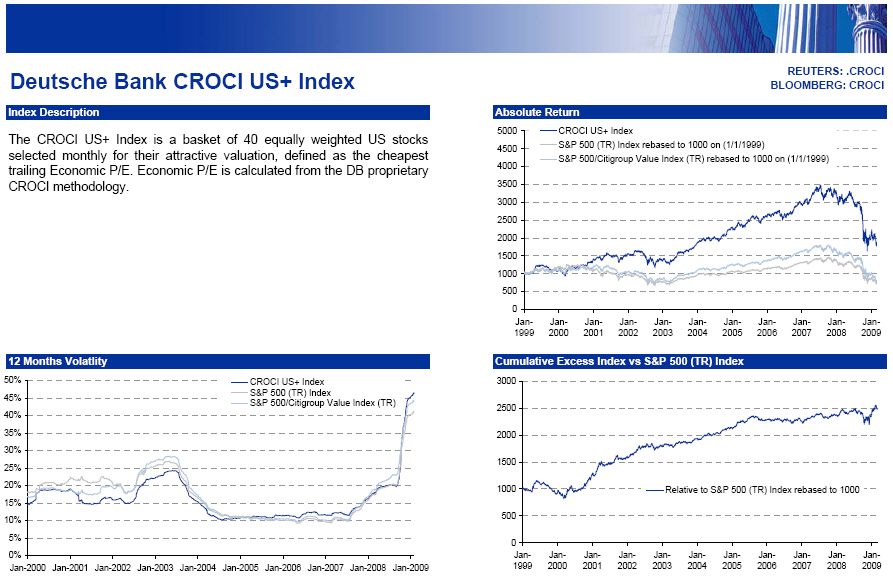
Deutsche Bank CROCI US+ Index
Index Description
The CROCI US+ Index is a basket of 40 equally weighted US stocks selected monthly for their
attractive valuation, defined as the cheapest trailing Economic P/E. Economic P/E is calculated
from the DB proprietary CROCI methodology.
12 Months Volatlity
50% CROCI US+ Index
45% S&P 500 (TR) Index
S&P 500/Citigroup Value Index (TR)
40%
35%
30%
25%
20%
15%
10%
5%
0%
Jan-2000 Jan-2001 Jan-2002 Jan-2003 Jan-2004 Jan-2005 Jan-2006 Jan-2007 Jan-2008 Jan-2009
Monthly Performance
1999 2000 2001 2002 2003 2004 2005 2006 2007 2008 2009
Jan 1.0% -4.8% 2.3% -1.3% -2.0% 0.8% -2.1% 3.3% 2.5% -5.8% -4.8%
Feb -2.6% -7.8% 0.5% 0.6% -1.4% 3.8% 6.5% -0.3% -0.8% 0.3% -10.2%
Mar 3.1% 11.2% -2.0% 5.5% 0.4% 0.4% -1.2% 1.7% 1.4% -2.7%
Apr 16.1% 6.6% 6.8% -0.9% 6.0% -0.2% -2.2% 0.7% 5.5% 3.9%
May 2.9% 4.4% 1.7% -0.3% 9.0% -0.6% 3.4% -3.1% 5.4% 4.0%
Jun 2.2% -5.4% -2.5% -6.9% 3.2% 3.3% 2.6% 1.0% -1.8% -7.1%
Jul -2.9% -0.2% 0.0% -6.3% 0.4% -2.0% 5.7% 1.1% -3.0% -3.6%
Aug -2.6% 7.6% -0.9% -1.2% 3.4% -0.4% -1.2% 0.4% -0.1% 1.9%
Sep -5.1% 0.3% -9.0% -10.2% -1.6% 4.3% -0.5% 2.1% 2.1% -10.6%
Oct 0.8% 7.4% 3.1% 7.4% 5.4% 2.5% -3.0% 4.5% 3.6% -18.5%
Nov -0.8% -0.9% 7.4% 6.5% 3.0% 5.6% 3.0% 3.7% -3.4% -7.8%
Dec 0.3% 7.3% 3.6% -4.1% 6.9% 3.3% 0.8% -1.2% -0.6% 3.7%
Year 11.6% 26.5% 10.6% -12.0% 37.2% 22.5% 12.0% 14.5% 10.8% -36.8% -14.5%
Absolute Return
5000CROCI US+ Index
4500S&P 500 (TR) Index rebased to 1000 on (1/1/1999)
S&P 500/Citigroup Value Index (TR) rebased to 1000 on (1/1/1999)
4000
3500
3000
2500
2000
1500
1000
500
0
Jan- Jan- Jan- Jan- Jan- Jan- Jan- Jan- Jan- Jan- Jan-
1999 2000 2001 2002 2003 2004 2005 2006 2007 2008 2009
Cumulative Excess Index vs S&P 500 (TR) Index
3000
2500
2000
1500
1000 Relative to S&P 500 (TR) Index rebased to 1000
500
0
Jan- Jan- Jan- Jan- Jan- Jan- Jan- Jan- Jan- Jan- Jan-
1999 2000 2001 2002 2003 2004 2005 2006 2007 2008 2009
Annual Returns
60%
CROCI US+ Index
S&P 500 (TR) Index
40%
20%
0%
-20%
-40%
-60%
1999 2000 2001 2002 2003 2004 2005 2006 2007 2008 2009
Historical Performance Through February 2009
1 Month 3 Months 6 Months YTD
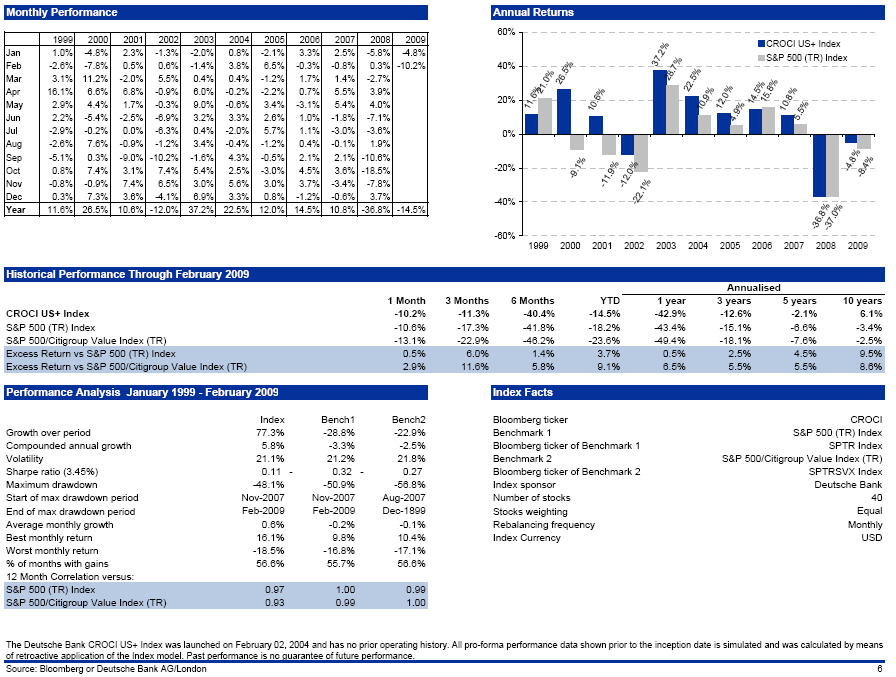
CROCI US+ Index -10.2% -11.3% -40.4% -14.5%
S&P 500 (TR) Index -10.6% -17.3% -41.8% -18.2%
S&P 500/Citigroup Value Index (TR) -13.1% -22.9% -46.2% -23.6%
Excess Return vs S&P 500 (TR) Index 0.5% 6.0% 1.4% 3.7%
Excess Return vs S&P 500/Citigroup Value Index (TR) 2.9% 11.6% 5.8% 9.1%
Annualised
1year 3 years 5 years 10 years
CROCI US+ Index -42.9% -12.6% -2.1% 6.1%
S&P 500 (TR) Index -43.4% -15.1% -6.6% -3.4%
S&P 500/Citigroup Value Index (TR) -49.4% -18.1% -7.6% -2.5%
Excess Return vs S&P 500 (TR) Index 0.5% 2.5% 4.5% 9.5%
Excess Return vs S&P 500/Citigroup Value Index (TR) 6.5% 5.5% 5.5% 8.6%
Performance Analysis January 1999 - February 2009
Index Bench1 Bench2
Growth over period 77.3% -28.8% -22.9%
Compounded annual growth 5.8% -3.3% -2.5%
Volatility 21.1% 21.2% 21.8%
Sharpe ratio (3.45%) 0.11 - 0.32 - 0.27
Maximum drawdown -48.1% -50.9% -56.8%
Start of max drawdown period Nov-2007 Nov-2007 Aug-2007
End of max drawdown period Feb-2009 Feb-2009 Dec-1899
Average monthly growth 0.6% -0.2% -0.1%
Best monthly return 16.1% 9.8% 10.4%
Worst monthly return -18.5% -16.8% -17.1%
% of months with gains 56.6% 55.7% 56.6%
12 Month Correlation versus:
S&P 500 (TR) Index 0.97 1.00 0.99
S&P 500/Citigroup Value Index (TR) 0.93 0.99 1.00
Index Facts
Bloomberg ticker CROCI
Benchmark 1 S&P 500 (TR) Index
Bloomberg ticker of Benchmark 1 SPTR Index
Benchmark 2 S&P 500/Citigroup Value Index (TR)
Bloomberg ticker of Benchmark 2 SPTRSVX Index
Index sponsor Deutsche Bank
Number of stocks 40
Stocks weighting Equal
Rebalancing frequency Monthly
Index Currency USD
The Deutsche Bank CROCI US+ Index was launched on February 02, 2004 and has no prior operating
history. All pro-forma performance data shown prior to the inception date is simulated and was
calculated by means of retroactive application of the Index model. Past performance is no guarantee
of future performance.
Source: Bloomberg or Deutsche Bank AG/London
6
|
  |
BLOOMBERG: DBUSCPII
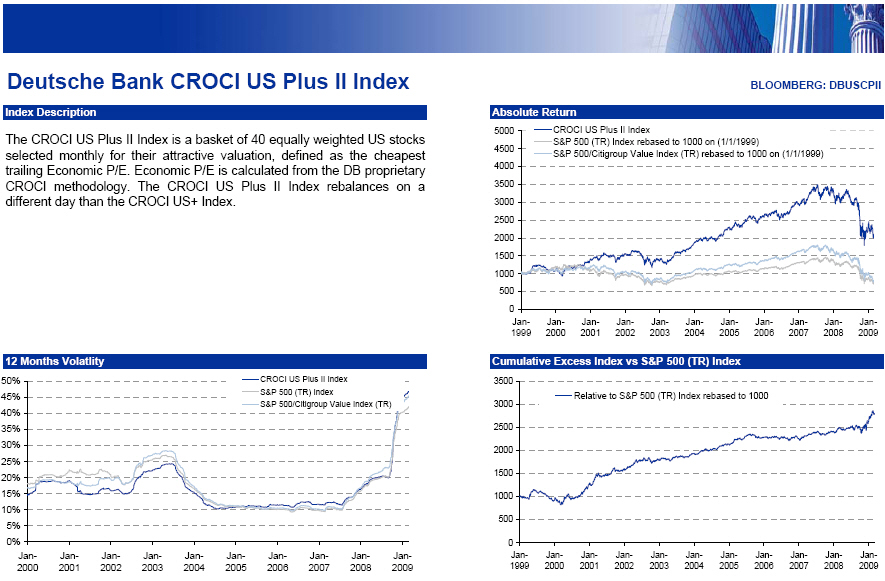
Deutsche Bank CROCI US Plus II Index
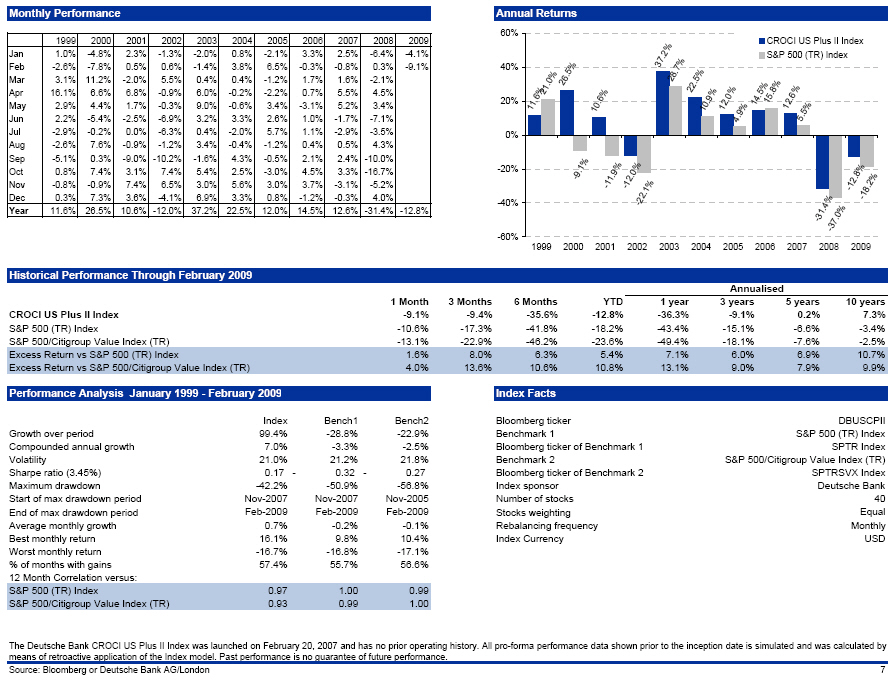
Index Description
The CROCI US Plus II Index is a basket of 40 equally weighted US stocks selected monthly for their
attractive valuation, defined as the cheapest trailing Economic P/E. Economic P/E is calculated
from the DB proprietary CROCI methodology. The CROCI US Plus II Index rebalances on a different day
than the CROCI US+ Index.
12 Months Volatlity
50% CROCI US Plus II Index
45% S&P 500 (TR) Index
S&P 500/Citigroup Value Index (TR)
40%
35%
30%
25%
20%
15%
10%
5%
0%
Jan- Jan- Jan- Jan- Jan- Jan- Jan- Jan- Jan- Jan-
2000 2001 2002 2003 2004 2005 2006 2007 2008 2009
Monthly Performance
1999 2000 2001 2002 2003 2004 2005 2006 2007 2008 2009
Jan 1.0% -4.8% 2.3% -1.3% -2.0% 0.8% -2.1% 3.3% 2.5% -6.4% -4.1%
Feb -2.6% -7.8% 0.5% 0.6% -1.4% 3.8% 6.5% -0.3% -0.8% 0.3% -9.1%
Mar 3.1% 11.2% -2.0% 5.5% 0.4% 0.4% -1.2% 1.7% 1.6% -2.1%
Apr 16.1% 6.6% 6.8% -0.9% 6.0% -0.2% -2.2% 0.7% 5.5% 4.5%
May 2.9% 4.4% 1.7% -0.3% 9.0% -0.6% 3.4% -3.1% 5.2% 3.4%
Jun 2.2% -5.4% -2.5% -6.9% 3.2% 3.3% 2.6% 1.0% -1.7% -7.1%
Jul -2.9% -0.2% 0.0% -6.3% 0.4% -2.0% 5.7% 1.1% -2.9% -3.5%
Aug -2.6% 7.6% -0.9% -1.2% 3.4% -0.4% -1.2% 0.4% 0.5% 4.3%
Sep -5.1% 0.3% -9.0% -10.2% -1.6% 4.3% -0.5% 2.1% 2.4% -10.0%
Oct 0.8% 7.4% 3.1% 7.4% 5.4% 2.5% -3.0% 4.5% 3.3% -16.7%
Nov -0.8% -0.9% 7.4% 6.5% 3.0% 5.6% 3.0% 3.7% -3.1% -5.2%
Dec 0.3% 7.3% 3.6% -4.1% 6.9% 3.3% 0.8% -1.2% -0.3% 4.0%
Year 11.6% 26.5% 10.6% -12.0% 37.2% 22.5% 12.0% 14.5% 12.6% -31.4% -12.8%
Absolute Return
5000CROCI US Plus II Index
S&P 500 (TR) Index rebased to 1000 on (1/1/1999)
4500S&P 500/Citigroup Value Index (TR) rebased to 1000 on (1/1/1999)
4000
3500
3000
2500
2000
1500
1000
500
0
Jan- Jan- Jan- Jan- Jan- Jan- Jan- Jan- Jan- Jan- Jan-
1999 2000 2001 2002 2003 2004 2005 2006 2007 2008 2009
Cumulative Excess Index vs S&P 500 (TR) Index
3500 Relative to S&P 500 (TR) Index rebased to 1000
3000
2500
2000
1500
1000
500
0
Jan- Jan- Jan- Jan- Jan- Jan- Jan- Jan- Jan- Jan- Jan-
1999 2000 2001 2002 2003 2004 2005 2006 2007 2008 2009
Annual Returns
60%
CROCI US Plus II Index
S&P 500 (TR) Index
40%
20%
0%
-20%
-40%
-60%
1999 2000 2001 2002 2003 2004 2005 2006 2007 2008 2009
Historical Performance Through February 2009
1 Month 3 Months 6 Months YTD
CROCI US Plus II Index -9.1% -9.4% -35.6% -12.8%
S&P 500 (TR) Index 10.6% -17.3% -41.8% -18.2%
S&P 500/Citigroup Value Index (TR) 13.1% -22.9% -46.2% -23.6%
Excess Return vs S&P 500 (TR) Index 1.6% 8.0% 6.3% 5.4%
Excess Return vs S&P 500/Citigroup Value Index (TR) 4.0% 13.6% 10.6% 10.8%
Annualised
1year 3 years 5 years 10 years
CROCI US Plus II Index -36.3% -9.1% 0.2% 7.3%
S&P 500 (TR) Index -43.4% -15.1% -6.6% -3.4%
S&P 500/Citigroup Value Index (TR) -49.4% -18.1% -7.6% -2.5%
Excess Return vs S&P 500 (TR) Index 7.1% 6.0% 6.9% 10.7%
Excess Return vs S&P 500/Citigroup Value Index (TR) 13.1% 9.0% 7.9% 9.9%
Performance Analysis January 1999 - February 2009
Index Bench1 Bench2
Growth over period 99.4% -28.8% -22.9%
Compounded annual growth 7.0% -3.3% -2.5%
Volatility 21.0% 21.2% 21.8%
Sharpe ratio (3.45%) 0.17 - 0.32 - 0.27
Maximum drawdown -42.2% -50.9% -56.8%
Start of max drawdown period Nov-2007 Nov-2007 Nov-2005
End of max drawdown period Feb-2009 Feb-2009 Feb-2009
Average monthly growth 0.7% -0.2% -0.1%
Best monthly return 16.1% 9.8% 10.4%
Worst monthly return -16.7% -16.8% -17.1%
% of months with gains 57.4% 55.7% 56.6%
12 Month Correlation versus:
S&P 500 (TR) Index 0.97 1.00 0.99
S&P 500/Citigroup Value Index (TR) 0.93 0.99 1.00
Index Facts
Bloomberg ticker DBUSCPII
Benchmark 1 S&P 500 (TR) Index
Bloomberg ticker of Benchmark 1 SPTR Index
Benchmark 2 S&P 500/Citigroup Value Index (TR)
Bloomberg ticker of Benchmark 2 SPTRSVX Index
Index sponsor Deutsche Bank
Number of stocks 40
Stocks weighting Equal
Rebalancing frequency Monthly
Index Currency USD
The Deutsche Bank CROCI US Plus II Index was launched on February 20, 2007 and has no prior
operating history. All pro-forma performance data shown prior to the inception date is simulated
and was calculated by means of retroactive application of the Index model. Past performance is no
guarantee of future performance.
Source: Bloomberg or Deutsche Bank AG/London
7
|
  |
REUTERS: .CRCEU
BLOOMBERG: CRCEU
Deutsche Bank CROCI Euro+ Index
Index Description
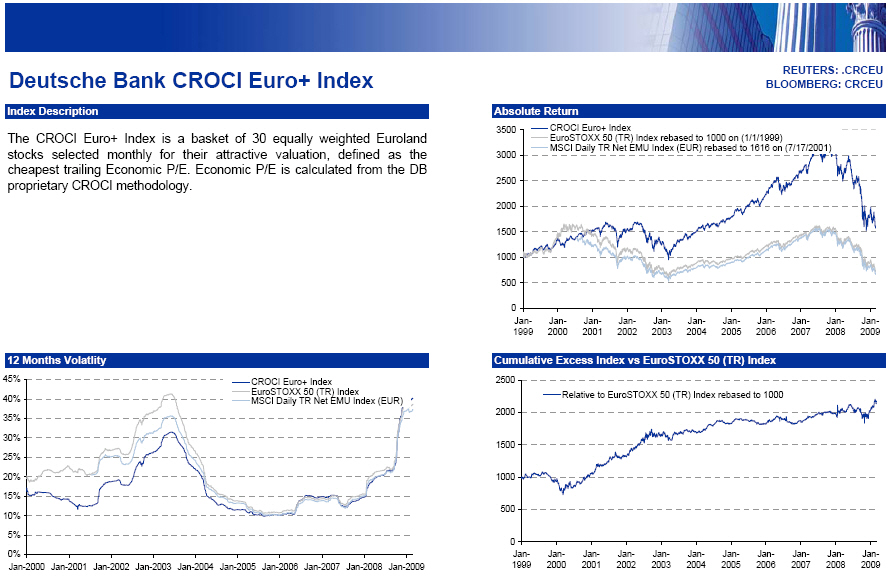
The CROCI Euro+ Index is a basket of 30 equally weighted Euroland stocks selected monthly for their
attractive valuation, defined as the cheapest trailing Economic P/E. Economic P/E is calculated
from the DB proprietary CROCI methodology.
Months atlity
45% CROCI Euro+ Index
EuroSTOXX 50 (TR) Index
40% MSCI Daily TR Net EMU Index (EUR)
35%
30%
25%
20%
15%
10%
5%
0%
Jan-2000 Jan-2001 Jan-2002 Jan-2003 Jan-2004 Jan-2005 Jan-2006 Jan-2007 Jan-2008 Jan-2009
Monthly Performance
1999 2000 2001 2002 2003 2004 2005 2006 2007 2008 2009
Jan 5.9% -10.8% 1.6% 0.4% -4.8% 3.8% 4.1% 5.4% 1.7% -12.8% -6.1%
Feb 0.9% 1.9% 0.1% 2.4% -7.9% 1.8% 4.0% 1.9% -1.0% -0.7% -9.5%
Mar -0.2% 6.7% -3.0% 5.1% -5.8% -1.9% -0.4% 4.2% 4.4% -2.5%
Apr 9.5% 1.1% 7.1% -1.7% 15.6% 3.5% -4.1% 1.6% 5.1% 7.0%
May -2.5% 0.4% 1.7% -0.3% 5.0% 0.5% 6.0% -4.7% 5.9% 3.6%
Jun 3.9% -0.5% -1.5% -6.8% 3.9% 2.4% 3.0% -0.6% 0.7% -12.6%
Jul -1.2% 5.2% -1.5% -10.3% 3.9% -0.8% 4.4% 3.0% -3.6% -2.4%
Aug 4.2% 1.9% -4.9% 2.2% 4.7% -0.1% -1.6% -0.4% 0.3% 2.4%
Sep -4.3% -2.2% -12.6% -16.7% -5.8% 2.0% 2.6% 1.4% 2.0% -13.7%
Oct 1.9% 7.7% 5.7% 10.3% 5.5% 0.6% -3.7% 1.9% 2.6% -14.4%
Nov 4.6% -0.7% 7.7% 7.8% 3.5% 2.8% 4.3% 1.3% -2.6% -6.6%
Dec 11.4% 1.7% 2.7% -10.1% 3.5% 1.8% 4.5% 4.4% -0.1% 5.3%
Year 38.2% 11.5% 1.2% -19.3% 20.7% 17.5% 24.8% 20.7% 16.0% -40.7% -15.0%
Absolute Return
3500 CROCI Euro+ Index
EuroSTOXX 50 (TR) Index rebased to 1000 on (1/1/1999)
MSCI Daily TR Net EMU Index (EUR) rebased to 1616 on (7/17/2001)
3000
2500
2000
1500
1000
500
0
Jan- Jan- Jan- Jan- Jan- Jan- Jan- Jan- Jan- Jan- Jan-
1999 2000 2001 2002 2003 2004 2005 2006 2007 2008 2009
Cumulative Excess Index vs EuroSTOXX 50 (TR) Index
2500
Relative to EuroSTOXX 50 (TR) Index rebased to 1000
2000
1500
1000
500
0
Jan- Jan- Jan- Jan- Jan- Jan- Jan- Jan- Jan- Jan- Jan-
1999 2000 2001 2002 2003 2004 2005 2006 2007 2008 2009
Annual Returns
60% CROCI Euro+ Index
40% EuroSTOXX 50 (TR) Index
20%
0%
- -20%
- -40%
- -60%
1999 2000 2001 2003 2004 2005 2006 2007 2008 2009
Historical Performance Through February 2009
1 Month 3 Months 6 Months YTD
CROCI Euro+ Index -9.5% -10.5% -38.2% -15.0%
EuroSTOXX 50 (TR) Index -11.6% -18.4% -40.7% -19.0%
MSCI Daily TR Net EMU Index (EUR) -10.9% -16.8% -42.4% -16.7%
Excess Return vs EuroSTOXX 50 (TR) Index 2.1% 8.0% 2.5% 4.0%
Excess Return vs MSCI Daily TR Net EMU Index (EUR) 1.4% 6.3% 4.1% 1.7%
Annualised
1year 3 years 5 years 10 years
CROCI Euro+ Index -41.8% -13.0% -0.4% 3.9%
EuroSTOXX 50 (TR) Index -45.1% -17.0% -4.8% -3.5%
MSCI Daily TR Net EMU Index (EUR) -47.0% -17.5% -4.1% N/A
Excess Return vs EuroSTOXX 50 (TR) Index 3.2% 4.0% 4.4% 7.4%
Excess Return vs MSCI Daily TR Net EMU Index (EUR) 5.1% 4.5% 3.7% N/A
Performance Analysis January 1999 - February 2009
Index Bench1 Bench2
Growth over period 57.4% -26.7% -51.3%
Compounded annual growth 4.6% -3.0% -8.0%
Volatility 21.0% 24.6% 23.2%
Sharpe ratio (3.18%) 0.07 - 0.25 - 0.48
Maximum drawdown -51.0% -59.9% -56.3%
Start of max drawdown period Nov-2007 May-2000 Dec-2004
End of max drawdown period Feb-2009 Feb-2009 Mar-2008
Average monthly growth 0.5% -0.1% -0.5%
Best monthly return 15.6% 14.7% 13.5%
Worst monthly return -16.7% -18.6% -17.5%
% of months with gains 61.5% 54.9% 53.4%
12 Month Correlation versus:
EuroSTOXX 50 (TR) Index 0.95 1.00 0.98
MSCI Daily TR Net EMU Index (EUR) 0.94 0.98 1.00
Index Facts
Bloomberg ticker CRCEU
Benchmark 1 EuroSTOXX 50 (TR) Index
Bloomberg ticker of Benchmark 1 SX5T Index
Benchmark 2 MSCI Daily TR Net EMU Index (EUR)
Bloomberg ticker of Benchmark 2 NDDUEMU Index
Index sponsor Deutsche Bank
Number of stocks 30
Stocks weighting Equal
Rebalancing frequency Monthly
Index Currency EUR
The Deutsche Bank CROCI Euro+ Index was launched on February 02, 2004 and has no prior operating
history. All pro-forma performance data shown prior to the inception date is simulated and was
calculated by means of retroactive application of the Index model. Past performance is no guarantee
of future performance.
Source: Bloomberg or Deutsche Bank AG/London
8
|
  |
BLOOMBERG: DBEECRII
Deutsche Bank CROCI Euro II Index
Index Description
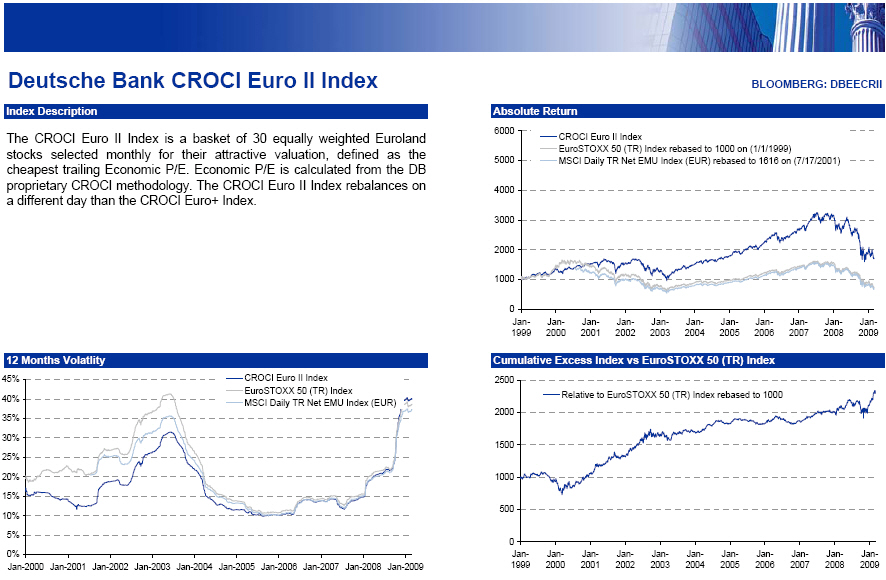
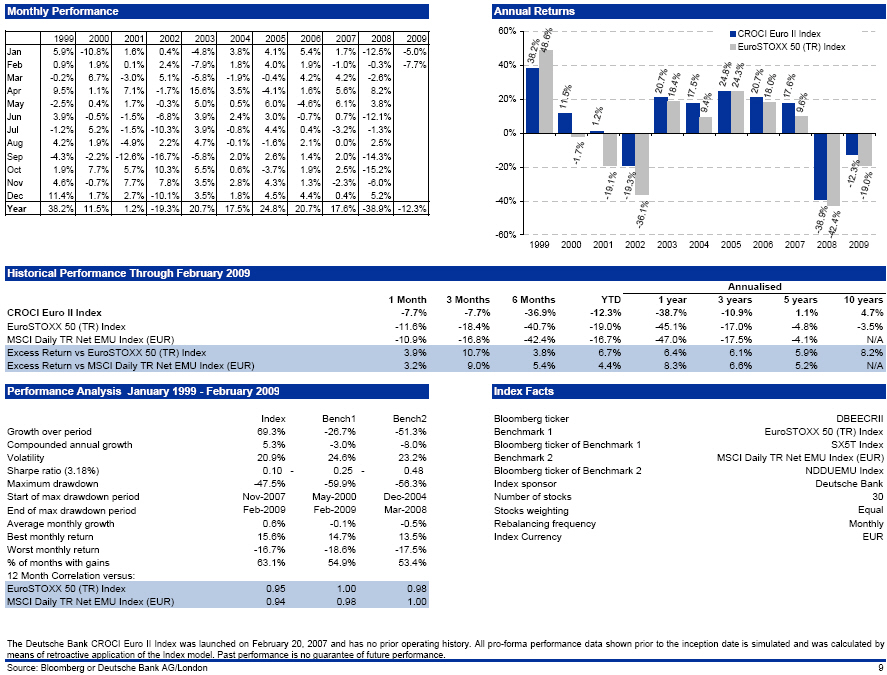
The CROCI Euro II Index is a basket of 30 equally weighted Euroland stocks selected monthly for
their attractive valuation, defined as the cheapest trailing Economic P/E. Economic P/E is
calculated from the DB proprietary CROCI methodology. The CROCI Euro II Index rebalances on a
different day than the CROCI Euro+ Index.
12 Months Volatlity
45% CROCI Euro+ Index
40% EuroSTOXX 50 (TR) Index
35% MSCI Daily TR Net EMU Index (EUR)
30%
25%
20%
15%
10%
5%
0%
Jan-2000 Jan-2001 Jan-2002 Jan-2003 Jan-2004 Jan-2005 Jan-2006 Jan-2007 Jan-2008 Jan-2009
Monthly Performance
1999 2000 2001 2002 2003 2004 2005 2006 2007 2008 2009
Jan 5.9% -10.8% 1.6% 0.4% -4.8% 3.8% 4.1% 5.4% 1.7% -12.5% -5.0%
Feb 0.9% 1.9% 0.1% 2.4% -7.9% 1.8% 4.0% 1.9% -1.0% -0.3% -7.7%
Mar -0.2% 6.7% -3.0% 5.1% -5.8% -1.9% -0.4% 4.2% 4.2% -2.6%
Apr 9.5% 1.1% 7.1% -1.7% 15.6% 3.5% -4.1% 1.6% 5.6% 8.2%
May -2.5% 0.4% 1.7% -0.3% 5.0% 0.5% 6.0% -4.6% 6.1% 3.8%
Jun 3.9% -0.5% -1.5% -6.8% 3.9% 2.4% 3.0% -0.7% 0.7% -12.1%
Jul -1.2% 5.2% -1.5% -10.3% 3.9% -0.8% 4.4% 0.4% -3.2% -1.3%
Aug 4.2% 1.9% -4.9% 2.2% 4.7% -0.1% -1.6% 2.1% 0.0% 2.5%
Sep -4.3% -2.2% -12.6% -16.7% -5.8% 2.0% 2.6% 1.4% 2.0% -14.3%
Oct 1.9% 7.7% 5.7% 10.3% 5.5% 0.6% -3.7% 1.9% 2.5% -15.2%
Nov 4.6% -0.7% 7.7% 7.8% 3.5% 2.8% 4.3% 1.3% -2.3% -6.0%
Dec 11.4% 1.7% 2.7% -10.1% 3.5% 1.8% 4.5% 4.4% 0.4% 5.2%
Year 38.2% 11.5% 1.2% -19.3% 20.7% 17.5% 24.8% 20.7% 17.6% -38.9% -12.3%
Absolute Return
6000 CROCI Euro+ Index
5000 EuroSTOXX 50 (TR) Index rebased to 1000 on (1/1/1999)
4000 MSCI Daily TR Net EMU Index (EUR) rebased to 16 16 on (7/17/2001)
3000
2000
1000
0
Jan- Jan- Jan- Jan- Jan- Jan- Jan- Jan- Jan- Jan- Jan-
1999 2000 2001 2002 2003 2004 2005 2006 2007 2008 2009
Cumulative Excess Index vs EuroSTOXX 50 (TR) Index
2500
2000 Relative to EuroSTOXX 50 (TR) Index rebased to 1000
1500
1000
500
0
Jan- Jan- Jan- Jan- Jan- Jan- Jan- Jan- Jan- Jan- Jan-
1999 2000 2001 2002 2003 2004 2005 2006 2007 2008 2009
Annual Returns
60% CROCI Euro II Index
40% EuroSTOXX 50 (TR) Index
20%
0%
- -20%
- -40%
- -60%
1999 2000 2001 2003 2004 2005 2006 2007 2008 2009
Historical Performance Through February 2009
1 Month 3 Months 6 Months YTD
CROCI Euro II Index -7.7% -7.7% -36.9% -12.3%
EuroSTOXX 50 (TR) Index -11.6% -18.4% -40.7% -19.0%
MSCI Daily TR Net EMU Index (EUR) -10.9% -16.8% -42.4% -16.7%
Excess Return vs EuroSTOXX 50 (TR) Index 3.9% 10.7% 3.8% 6.7%
Excess Return vs MSCI Daily TR Net EMU Index (EUR) 3.2% 9.0% 5.4% 4.4%
Annualised
1year 3 years 5 years 10 years
CROCI Euro II Index -38.7% -10.9% 1.1% 4.7%
EuroSTOXX 50 (TR) Index -45.1% -17.0% -4.8% -3.5%
MSCI Daily TR Net EMU Index (EUR) -47.0% -17.5% -4.1% N/A
Excess Return vs EuroSTOXX 50 (TR) Index 6.4% 6.1% 5.9% 8.2%
Excess Return vs MSCI Daily TR Net EMU Index (EUR) 8.3% 6.6% 5.2% N/A
Performance Analysis January 1999 - February 2009
Index Bench1 Bench2
Growth over period 69.3% -26.7% -51.3%
Compounded annual growth 5.3% -3.0% -8.0%
Volatility 20.9% 24.6% 23.2%
Sharpe ratio (3.18%) 0.10 - 0.25 - 0.48
Maximum drawdown -47.5% -59.9% -56.3%
Start of max drawdown period Nov-2007 May-2000 Dec-2004
End of max drawdown period Feb-2009 Feb-2009 Mar-2008
Average monthly growth 0.6% -0.1% -0.5%
Best monthly return 15.6% 14.7% 13.5%
Worst monthly return -16.7% -18.6% -17.5%
% of months with gains 63.1% 54.9% 53.4%
12 Month Correlation versus:
EuroSTOXX 50 (TR) Index 0.95 1.00 0.98
MSCI Daily TR Net EMU Index (EUR) 0.94 0.98 1.00
Index Facts
Bloomberg ticker DBEECRII
Benchmark 1 EuroSTOXX 50 (TR) Index
Bloomberg ticker of Benchmark 1 SX5T Index
Benchmark 2 MSCI Daily TR Net EMU Index (EUR)
Bloomberg ticker of Benchmark 2 NDDUEMU Index
Index sponsor Deutsche Bank
Number of stocks 30
Stocks weighting Equal
Rebalancing frequency Monthly
Index Currency EUR
The Deutsche Bank CROCI Euro II Index was launched on February 20, 2007 and has no prior operating
history. All pro-forma performance data shown prior to the inception date is simulated and was
calculated by means of retroactive application of the Index model. Past performance is no guarantee
of future performance.
Source: Bloomberg or Deutsche Bank AG/London
9
|
  |
REUTERS: .CRCJP
BLOOMBERG: CRCJP
Deutsche Bank CROCI Japan+ Index
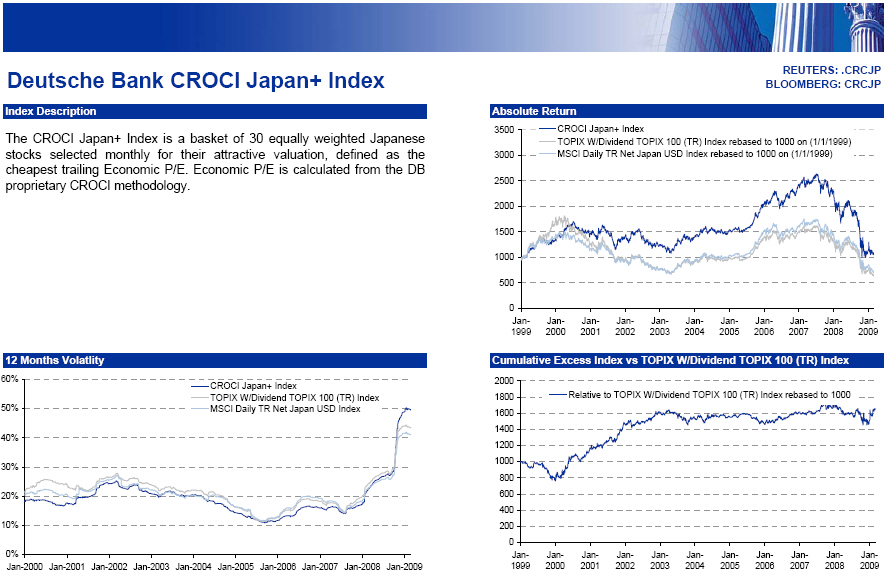
Index Description
The CROCI Japan+ Index is a basket of 30 equally weighted Japanese stocks selected monthly for
their attractive valuation, defined as the cheapest trailing Economic P/E. Economic P/E is
calculated from the DB proprietary CROCI methodology.
12 Months Volatlity
60%
50% CROCI Japan+ Index
40% TOPIX W/Dividend TOPIX 100 (TR) Index
30% MSCI Daily TR Net Japan USD Index
20%
10%
0%
Jan-2000 Jan-2001 Jan-2002 Jan-2003 Jan-2004 Jan-2005 Jan-2006 Jan-2007 Jan-2008 Jan-2009
Monthly Performance
1999 2000 2001 2002 2003 2004 2005 2006 2007 2008 2009
Jan 2.8% 4.2% 2.8% -5.8% -3.7% 2.3% -1.8% 4.7% 1.5% -11.8% -4.2%
Feb -0.6% -1.2% -6.7% 5.2% -1.9% 3.9% 3.3% -1.2% 1.1% -0.7% 0.5%
Mar 10.1% 7.1% 5.9% 2.2% -2.3% 3.0% -0.9% 4.3% -0.8% -11.5%
Apr 4.1% 5.0% 5.1% 4.6% -2.2% 1.4% -2.8% 2.4% -0.5% 12.0%
May 1.9% 0.7% -1.5% 1.9% 5.8% -2.8% 2.4% -6.0% 3.1% 5.4%
Jun 8.8% 5.8% -0.6% -8.1% 5.6% 4.1% 1.6% -0.5% 3.0% -7.1%
Jul 3.4% -6.0% -5.5% -7.1% 3.7% -2.1% 1.8% 0.3% -4.2% -3.6%
Aug -1.9% -2.0% -11.6% -0.4% 4.3% -2.4% 3.6% 5.9% -2.4% 0.1%
Sep 0.0% -1.8% -5.4% -2.8% -0.1% -1.5% 12.0% -0.2% 1.7% -15.5%
Oct -1.4% -2.5% 7.8% -2.9% 0.6% -1.2% -1.5% 2.2% -1.7% -21.7%
Nov 0.1% 0.9% 5.2% 6.0% -0.7% -0.3% 7.9% -0.3% -5.0% -10.0%
Dec 5.3% -2.8% 3.4% -4.6% 4.0% 5.2% 3.3% 7.0% -1.0% 1.4%
Year 37.0% 6.8% -3.2% -12.3% 13.2% 9.6% 31.9% 19.5% -5.6% -50.5% -3.6%
Absolute Return
3500
3000 CROCI Japan+ Index
2500 TOPIX W/Dividend TOPIX 100 (TR) Index rebased to 1000 on (1/1/1999)
2000 MSCI Daily TR Net Japan USD Index rebased to 1000 on (1/1/1999)
1500
1000
500
0
Jan- Jan- Jan- Jan- Jan- Jan- Jan- Jan- Jan- Jan- Jan-
1999 2000 2001 2002 2003 2004 2005 2006 2007 2008 2009
Cumulative Excess Index vs TOPIX W/Dividend TOPIX 100 (TR) Index
2000
1800 Relative to TOPIX W/Dividend TOPIX 100 (TR) Index rebased to 1000
1600
1400
1200
1000
800
600
400
200
0
Jan- Jan- Jan- Jan- Jan- Jan- Jan- Jan- Jan- Jan- Jan-
1999 2000 2001 2002 2003 2004 2005 2006 2007 2008 2009
Annual Returns
100%
80% CROCI Japan+ Index
60%
40% TOPIX W/Dividend TOPIX 100 (TR)
20%
0%
-20%
-40%
-60%
-80%
1999 2000 2001 2002 2003 2004 2005 2006 2007 2008 2009
Historical Performance Through February 2009
1 Month 3 Months 6 Months YTD
CROCI Japan+ Index 0.5% -2.3% -41.9% -3.6%
TOPIX W/Dividend TOPIX 100 (TR) Index -4.3% -9.1% -42.3% -11.5%
MSCI Daily TR Net Japan USD Index -4.6% -9.5% -40.6% -11.9%
Excess Return vs TOPIX W/Dividend TOPIX 100 (TR) Index 4.9% 6.8% 0.5% 7.8%
Excess Return vs MSCI Daily TR Net Japan USD Index 5.1% 7.2% -1.3% 8.2%
Annualised
1year 3 years 5 years 10 years
CROCI Japan+ Index -45.6% -19.6% -6.0% 0.7%
TOPIX W/Dividend TOPIX 100 (TR) Index -44.7% -22.2% -6.8% -4.4%
MSCI Daily TR Net Japan USD Index -43.5% -21.8% -5.4% -3.3%
Excess Return vs TOPIX W/Dividend TOPIX 100 (TR) Index -0.9% 2.7% 0.8% 5.1%
Excess Return vs MSCI Daily TR Net Japan USD Index -2.1% 2.3% -0.6% 4.0%
Performance Analysis January 1999 - February 2009
Index Bench1 Bench2
Growth over period 9.5% -33.4% -26.3%
Compounded annual growth 0.9% -3.9% -3.0%
Volatility 23.8% 24.5% 23.3%
Sharpe ratio (0.2%) 0.03 - 0.17 - 0.14
Maximum drawdown -58.4% -62.7% -57.2%
Start of max drawdown period Jul-2007 Jan-2000 Sep-2007
End of max drawdown period Feb-2009 Feb-2009 Dec-1899
Average monthly growth 0.2% -0.2% -0.1%
Best monthly return 12.0% 14.9% 13.6%
Worst monthly return -21.7% -21.4% -21.2%
% of months with gains 51.6% 51.6% 51.6%
12 Month Correlation versus:
TOPIX W/Dividend TOPIX 100 (TR) Index 0.96 1.00 0.98
MSCI Daily TR Net Japan USD Index 0.94 0.98 1.00
Index Facts
Bloomberg ticker CRCJP
Benchmark 1 TOPIX W/Dividend TOPIX 100 (TR) Index
Bloomberg ticker of Benchmark 1 TPXD100 Index
Benchmark 2 MSCI Daily TR Net Japan USD Index
Bloomberg ticker of Benchmark 2 NDDUJN Index
Index sponsor Deutsche Bank
Number of stocks 30
Stocks weighting Equal
Rebalancing frequency Monthly
Index Currency JPY
The Deutsche Bank CROCI Japan+ Index was launched on February 02, 2004 and has no prior operating
history. All pro-forma performance data shown prior to the inception date is simulated and was
calculated by means of retroactive application of the Index model. Past performance is no guarantee
of future performance.
Source: Bloomberg or Deutsche Bank AG/London
10
|
  |
BLOOMBERG: DBAPCRII
Deutsche Bank CROCI Japan II Index
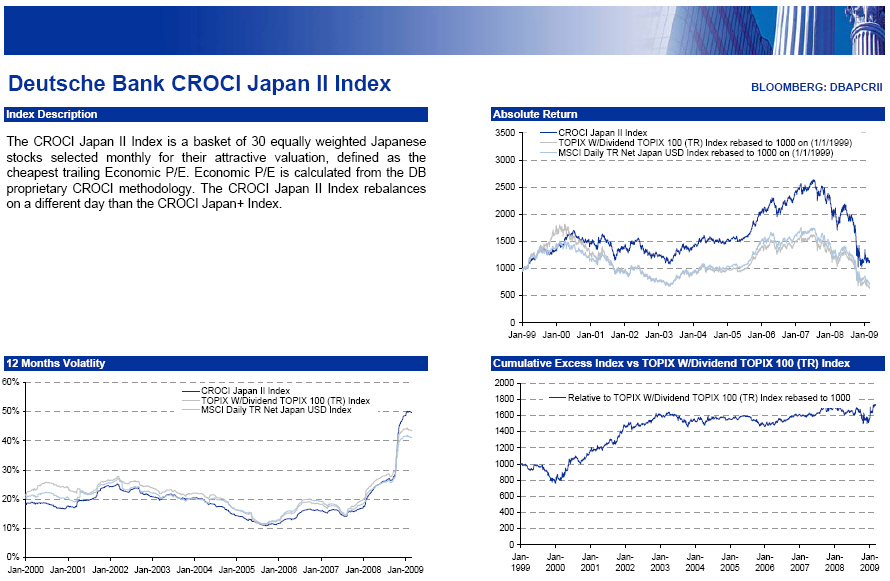
Index Description
The CROCI Japan II Index is a basket of 30 equally weighted Japanese stocks selected monthly for
their attractive valuation, defined as the cheapest trailing Economic P/E. Economic P/E is
calculated from the DB proprietary CROCI methodology. The CROCI Japan II Index rebalances on a
different day than the CROCI Japan+ Index.
12 Months Volatlity
60%
50% CROCI Japan II Index
40% TOPIX W/Dividend TOPIX 100 (TR) Index
30% MSCI Daily TR Net Japan USD Index
20%
10%
0%
Jan-2000 Jan-2001 Jan-2002 Jan-2003 Jan-2004 Jan-2005 Jan-2006 Jan-2007 Jan-2008 Jan-2009
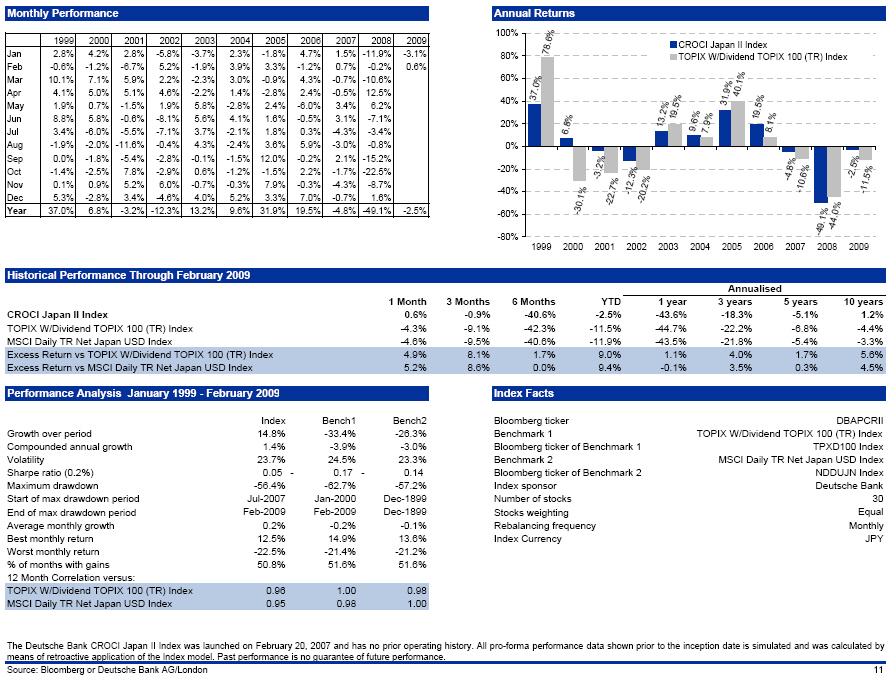
Monthly Performance
1999 2000 2001 2002 2003 2004 2005 2006 2007 2008 2009
Jan 2.8% 4.2% 2.8% -5.8% -3.7% 2.3% -1.8% 4.7% 1.5% -11.9% -3.1%
Feb -0.6% -1.2% -6.7% 5.2% -1.9% 3.9% 3.3% -1.2% 0.7% -0.2% 0.6%
Mar 10.1% 7.1% 5.9% 2.2% -2.3% 3.0% -0.9% 4.3% -0.7% -10.6%
Apr 4.1% 5.0% 5.1% 4.6% -2.2% 1.4% -2.8% 2.4% -0.5% 12.5%
May 1.9% 0.7% -1.5% 1.9% 5.8% -2.8% 2.4% -6.0% 3.4% 6.2%
Jun 8.8% 5.8% -0.6% -8.1% 5.6% 4.1% 1.6% -0.5% 3.1% -7.1%
Jul 3.4% -6.0% -5.5% -7.1% 3.7% -2.1% 1.8% 0.3% -4.3% -3.4%
Aug -1.9% -2.0% -11.6% -0.4% 4.3% -2.4% 3.6% 5.9% -3.0% -0.8%
Sep 0.0% -1.8% -5.4% -2.8% -0.1% -1.5% 12.0% -0.2% 2.1% -15.2%
Oct -1.4% -2.5% 7.8% -2.9% 0.6% -1.2% -1.5% 2.2% -1.7% -22.5%
Nov 0.1% 0.9% 5.2% 6.0% -0.7% -0.3% 7.9% -0.3% -4.3% -8.7%
Dec 5.3% -2.8% 3.4% -4.6% 4.0% 5.2% 3.3% 7.0% -0.7% 1.6%
Year 37.0% 6.8% -3.2% -12.3% 13.2% 9.6% 31.9% 19.5% -4.8% -49.1% -2.5%
Absolute Return
3500
3000 CROCI Japan II Index
2500 TOPIX W/Dividend TOPIX 100 (TR) Index rebased to 1000 on (1/1/1999)
2000 MSCI Daily TR Net Japan USD Index rebased to 1000 on (1/1/1999)
1500
1000
500
0
Jan-99 Jan-00 Jan-01 Jan-02 Jan-03 Jan-04 Jan-05 Jan-06 Jan-07 Jan-08 Jan-09
Cumulative Excess Index vs TOPIX W/Dividend TOPIX 100 (TR) Index
2000
1800 Relative to TOPIX W/Dividend TOPIX 100 (TR) Index rebased to 1000
1600
1400
1200
1000
800
600
400
200
0
Jan- Jan- Jan- Jan- Jan- Jan- Jan- Jan- Jan- Jan- Jan-
1999 2000 2001 2002 2003 2004 2005 2006 2007 2008 2009
Annual Returns
100%
80% CROCI Japan II Index
60% TOPIX W/Dividend TOPIX 100 (TR) Index
40%
20%
0%
-20%
-40%
-60%
-80%
1999 2000 2001 2002 2003 2004 2005 2006 2007 2008 2009
Historical Performance Through February 2009
1 Month 3 Months 6 Months YTD
CROCI Japan II Index 0.6% -0.9% -40.6% -2.5%
TOPIX W/Dividend TOPIX 100 (TR) Index -4.3% -9.1% -42.3% -11.5%
MSCI Daily TR Net Japan USD Index -4.6% -9.5% -40.6% -11.9%
Excess Return vs TOPIX W/Dividend TOPIX 100 (TR) Index 4.9% 8.1% 1.7% 9.0%
Excess Return vs MSCI Daily TR Net Japan USD Index 5.2% 8.6% 0.0% 9.4%
Annualised
1year 3 years 5 years 10 years
CROCI Japan II Index -43.6% -18.3% -5.1% 1.2%
TOPIX W/Dividend TOPIX 100 (TR) Index -44.7% -22.2% -6.8% -4.4%
MSCI Daily TR Net Japan USD Index -43.5% -21.8% -5.4% -3.3%
Excess Return vs TOPIX W/Dividend TOPIX 100 (TR) Index 1.1% 4.0% 1.7% 5.6%
Excess Return vs MSCI Daily TR Net Japan USD Index -0.1% 3.5% 0.3% 4.5%
Performance Analysis January 1999 - February 2009
Index Bench1 Bench2
Growth over period 14.8% -33.4% -26.3%
Compounded annual growth 1.4% -3.9% -3.0%
Volatility 23.7% 24.5% 23.3%
Sharpe ratio (0.2%) 0.05 - 0.17 - 0.14
Maximum drawdown -56.4% -62.7% -57.2%
Start of max drawdown period Jul-2007 Jan-2000 Dec-1899
End of max drawdown period Feb-2009 Feb-2009 Dec-1899
Average monthly growth 0.2% -0.2% -0.1%
Best monthly return 12.5% 14.9% 13.6%
Worst monthly return -22.5% -21.4% -21.2%
% of months with gains 50.8% 51.6% 51.6%
12 Month Correlation versus:
TOPIX W/Dividend TOPIX 100 (TR) Index 0.96 1.00 0.98
MSCI Daily TR Net Japan USD Index 0.95 0.98 1.00
Index Facts
Bloomberg ticker DBAPCRII
Benchmark 1 TOPIX W/Dividend TOPIX 100 (TR) Index
Bloomberg ticker of Benchmark 1 TPXD100 Index
Benchmark 2 MSCI Daily TR Net Japan USD Index
Bloomberg ticker of Benchmark 2 NDDUJN Index
Index sponsor Deutsche Bank
Number of stocks 30
Stocks weighting Equal
Rebalancing frequency Monthly
Index Currency JPY
The Deutsche Bank CROCI Japan II Index was launched on February 20, 2007 and has no prior operating
history. All pro-forma performance data shown prior to the inception date is simulated and was
calculated by means of retroactive application of the Index model. Past performance is no guarantee
of future performance.
Source: Bloomberg or Deutsche Bank AG/London
11
|
  |
REUTERS: .DBEIUSG
BLOOMBERG: DBUSUSG
Deutsche Bank US Growth Total Return Index
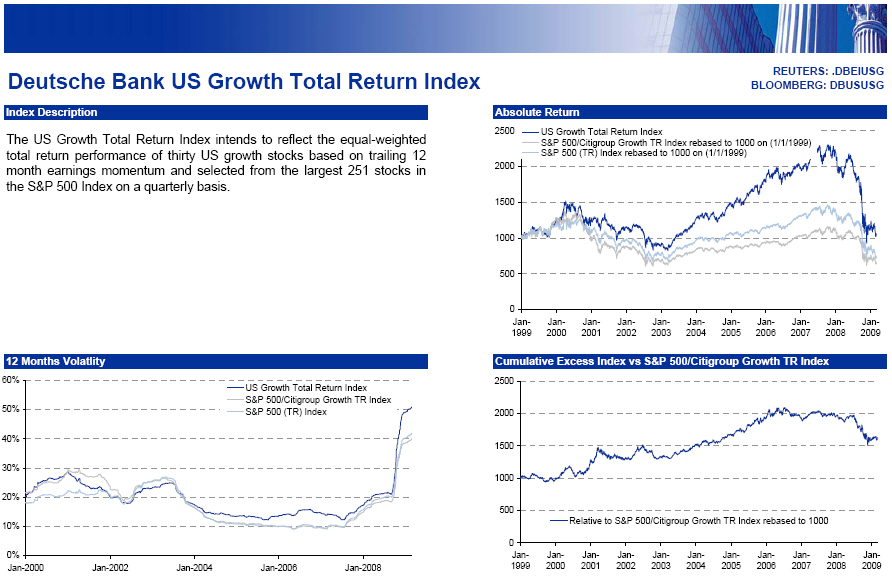
Index Description
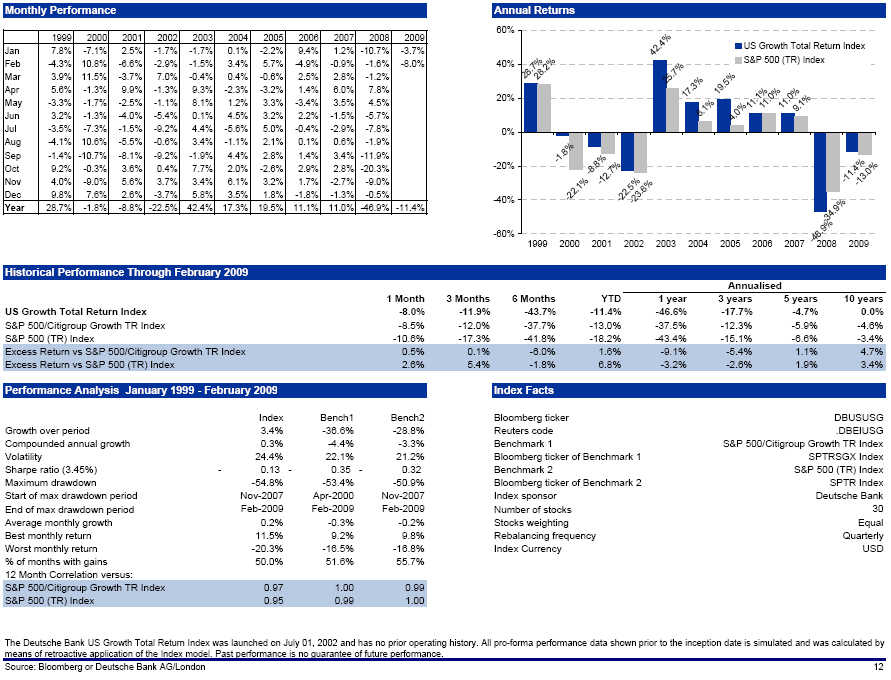
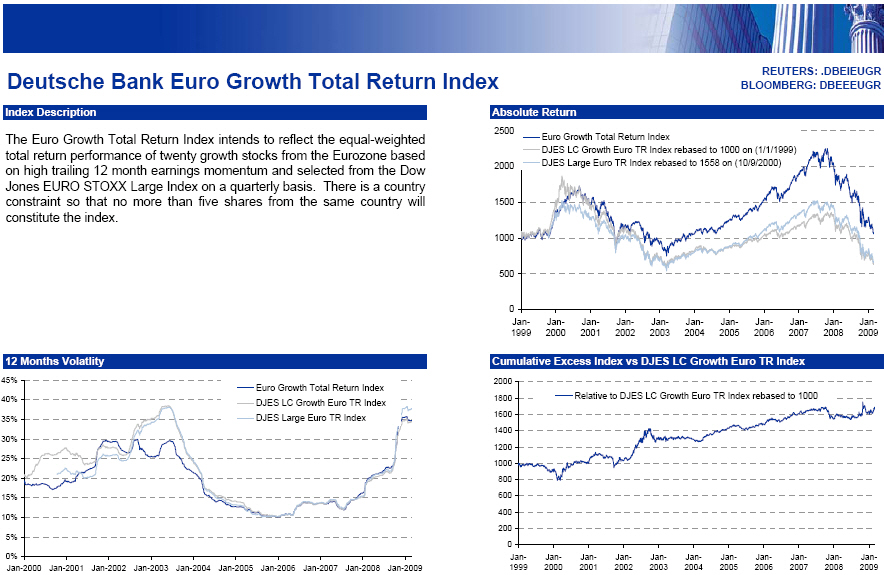
The US Growth Total Return Index intends to reflect the equal-weighted total return performance of
thirty US growth stocks based on trailing 12 month earnings momentum and selected from the largest
251 stocks in the S&P 500 Index on a quarterly basis.
12 Months Volatlity
60%
50% US Growth Total Return Index
40% S&P 500/Citigroup Growth TR Index
30% S&P 500 (TR) Index
20%
10%
0%
Jan-2000 Jan-2002 Jan-2004 Jan-2006 Jan-2008
Monthly Performance
1999 2000 2001 2002 2003 2004 2005 2006 2007 2008 2009
Jan 7.8% -7.1% 2.5% -1.7% -1.7% 0.1% -2.2% 9.4% 1.2% -10.7% -3.7%
Feb -4.3% 10.8% -6.6% -2.9% -1.5% 3.4% 5.7% -4.9% -0.9% -1.6% -8.0%
Mar 3.9% 11.5% -3.7% 7.0% -0.4% 0.4% -0.6% 2.5% 2.8% -1.2%
Apr 5.6% -1.3% 9.9% -1.3% 9.3% -2.3% -3.2% 1.4% 6.0% 7.8%
May -3.3% -1.7% -2.5% -1.1% 8.1% 1.2% 3.3% -3.4% 3.5% 4.5%
Jun 3.2% -1.3% -4.0% -5.4% 0.1% 4.5% 3.2% 2.2% -1.5% -5.7%
Jul -3.5% -7.3% -1.5% -9.2% 4.4% -5.6% 5.0% -0.4% -2.9% -7.8%
Aug -4.1% 10.6% -5.5% -0.6% 3.4% -1.1% 2.1% 0.1% 0.6% -1.9%
Sep -1.4% -10.7% -8.1% -9.2% -1.9% 4.4% 2.8% 1.4% 3.4% -11.9%
Oct 9.2% -0.3% 3.6% 0.4% 7.7% 2.0% -2.6% 2.9% 2.8% -20.3%
Nov 4.0% -9.0% 5.6% 3.7% 3.4% 6.1% 3.2% 1.7% -2.7% -9.0%
Dec 9.8% 7.6% 2.6% -3.7% 5.8% 3.5% 1.8% -1.8% -1.3% -0.5%
Year 28.7% -1.8% -8.8% -22.5% 42.4% 17.3% 19.5% 11.1% 11.0% -46.9% -11.4%
[Graphic Appears Here]
[Graphic Appears Here]
[Graphic Appears Here]
Historical Performance Through February 2009
1 Month 3 Months 6 Months YTD
US Growth Total Return Index -8.0% -11.9% -43.7% -11.4%
S&P 500/Citigroup Growth TR Index -8.5% -12.0% -37.7% -13.0%
S&P 500 (TR) Index -10.6% -17.3% -41.8% -18.2%
Excess Return vs S&P 500/Citigroup Growth TR Index 0.5% 0.1% -6.0% 1.6%
Excess Return vs S&P 500 (TR) Index 2.6% 5.4% -1.8% 6.8%
Annualised
1year 3 years 5 years 10 years
US Growth Total Return Index -46.6% -17.7% -4.7% 0.0%
S&P 500/Citigroup Growth TR Index -37.5% -12.3% -5.9% -4.6%
S&P 500 (TR) Index -43.4% -15.1% -6.6% -3.4%
Excess Return vs S&P 500/Citigroup Growth TR Index -9.1% -5.4% 1.1% 4.7%
Excess Return vs S&P 500 (TR) Index -3.2% -2.6% 1.9% 3.4%
Performance Analysis January 1999 - February 2009
Index Bench1 Bench2
Growth over period 3.4% -36.6% -28.8%
Compounded annual growth 0.3% -4.4% -3.3%
Volatility 24.4% 22.1% 21.2%
Sharpe ratio (3.45%) - 0.13- 0.35 - 0.32
Maximum drawdown -54.8% -53.4% -50.9%
Start of max drawdown period Nov-2007 Apr-2000 Nov-2007
End of max drawdown period Feb-2009 Feb-2009 Feb-2009
Average monthly growth 0.2% -0.3% -0.2%
Best monthly return 11.5% 9.2% 9.8%
Worst monthly return -20.3% -16.5% -16.8%
% of months with gains 50.0% 51.6% 55.7%
12 Month Correlation versus:
S&P 500/Citigroup Growth TR Index 0.97 1.00 0.99
S&P 500 (TR) Index 0.95 0.99 1.00
Index Facts
Bloomberg ticker DBUSUSG
Reuters code .DBEIUSG
Benchmark 1 S&P 500/Citigroup Growth TR Index
Bloomberg ticker of Benchmark 1 SPTRSGX Index
Benchmark 2 S&P 500 (TR) Index
Bloomberg ticker of Benchmark 2 SPTR Index
Index sponsor Deutsche Bank
Number of stocks 30
Stocks weighting Equal
Rebalancing frequency Quarterly
Index Currency USD
The Deutsche Bank US Growth Total Return Index was launched on July 01, 2002 and has no prior
operating history. All pro-forma performance data shown prior to the inception date is simulated
and was calculated by means of retroactive application of the Index model. Past performance is no
guarantee of future performance.
Source: Bloomberg or Deutsche Bank AG/London
12
|
  |
REUTERS: DBEIUSV
BLOOMBERG: DBEIUSV
Deutsche Bank US Value Total Return Index
Index Description
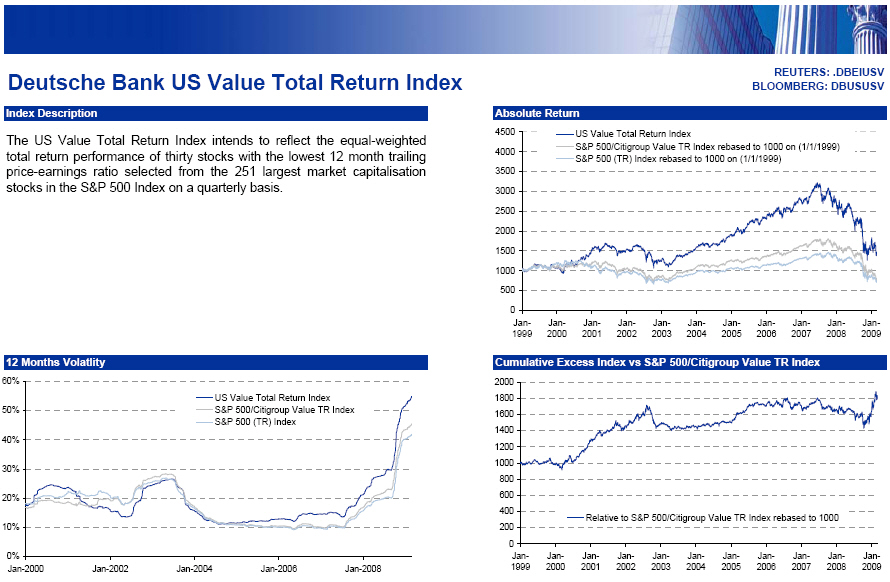
The US Value Total Return Index intends to reflect the equal-weighted total return performance of
thirty stocks with the lowest 12 month trailing price-earnings ratio selected from the 251 largest
market capitalisation stocks in the S&P 500 Index on a quarterly basis.
12 Months Volatlity
60%
50% US Value Total Return Index
40% S&P 500/Citigroup Value TR Index
30% S&P 500 (TR) Index
20%
10%
0%
Jan-2000 Jan-2002 Jan-2004 Jan-2006 Jan-2008
Monthly Performance
1999 2000 2001 2002 2003 2004 2005 2006 2007 2008 2009
Jan 0.4% -4.9% 6.3% -1.7% -2.7% 1.9% -0.9% 6.6% 0.2% -1.5% -5.3%
Feb -1.1% -8.5% -2.5% 0.7% -3.8% 2.9% 7.4% -2.0% -0.8% -7.2% -9.8%
Mar 5.2% 16.7% -1.7% 6.3% -1.5% -0.1% -1.5% 2.4% 2.9% -3.2%
Apr 6.8% 0.2% 3.9% 0.2% 8.1% -1.7% -1.5% 3.5% 4.9% 6.6%
May 2.1% 7.8% 4.0% -2.4% 8.9% -1.1% 4.7% -2.9% 4.9% -0.4%
Jun 0.3% -10.9% -2.1% -3.5% 1.0% 3.5% 4.3% 3.4% -0.9% -12.9%
Jul -4.6% 5.8% -0.4% -7.5% -0.2% 0.0% 4.1% 1.8% -6.8% 0.4%
Aug 0.0% 10.7% -4.5% 1.5% 2.8% 0.6% 0.3% -2.2% -1.7% -0.2%
Sep -4.0% 5.8% -7.4% -15.0% 0.5% 3.6% 2.3% 0.6% 4.3% -9.0%
Oct 10.4% 4.6% 0.4% 0.0% 5.8% 0.8% -2.9% 4.7% 1.5% -19.4%
Nov -5.2% -2.1% 3.2% 4.4% 1.7% 5.1% 3.4% 3.5% -7.0% -6.2%
Dec 1.6% 9.7% 3.6% -2.5% 5.6% 3.2% -1.0% 0.1% -1.0% 6.2%
Year 11.2% 36.2% 2.0% -19.3% 28.3% 20.0% 19.8% 21.0% -0.5% -40.1% -14.6%
[Graphic Appears Here]
[Graphic Appears Here]
[Graphic Appears Here]
Historical Performance Through February 2009
1 Month 3 Months 6 Months YTD
US Value Total Return Index -9.8% -9.3% -37.6% -14.6%
S&P 500/Citigroup Value TR Index -13.1% -22.9% -46.2% -23.6%
S&P 500 (TR) Index -10.6% -17.3% -41.8% -18.2%
Excess Return vs S&P 500/Citigroup Value TR Index 3.2% 13.6% 8.6% 9.0%
Excess Return vs S&P 500 (TR) Index 0.8% 8.0% 4.3% 3.6%
Annualised
1year 3 years 5 years 10 years
US Value Total Return Index -44.1% -16.2% -3.3% 3.6%
S&P 500/Citigroup Value TR Index -49.4% -18.1% -7.6% -2.5%
S&P 500 (TR) Index -43.4% -15.1% -6.6% -3.4%
Excess Return vs S&P 500/Citigroup Value TR Index 5.2% 1.9% 4.3% 6.2%
Excess Return vs S&P 500 (TR) Index -0.7% -1.1% 3.3% 7.0%
Performance Analysis January 1999 - February 2009
Index Bench1 Bench2
Growth over period 41.5% -22.9% -28.8%
Compounded annual growth 3.5% -2.5% -3.3%
Volatility 24.5% 21.8% 21.2%
Sharpe ratio (3.45%) 0.00 - 0.27 - 0.32
Maximum drawdown -54.8% -56.8% -50.9%
Start of max drawdown period Jun-2007 Jun-2007 Nov-2007
End of max drawdown period Feb-2009 Feb-2009 Feb-2009
Average monthly growth 0.4% -0.1% -0.2%
Best monthly return 16.7% 10.4% 9.8%
Worst monthly return -19.4% -17.1% -16.8%
% of months with gains 56.6% 56.6% 55.7%
12 Month Correlation versus:
S&P 500/Citigroup Value TR Index 0.94 1.00 0.99
S&P 500 (TR) Index 0.96 0.99 1.00
Index Facts
Bloomberg ticker DBUSUSV
Reuters code .DBEIUSV
Benchmark 1 S&P 500/Citigroup Value TR Index
Bloomberg ticker of Benchmark 1 SPTRSVX Index
Benchmark 2 S&P 500 (TR) Index
Bloomberg ticker of Benchmark 2 SPTR Index
Index sponsor Deutsche Bank
Number of stocks 30
Stocks weighting Equal
Rebalancing frequency Quarterly
Index Currency USD
The Deutsche Bank US Value Total Return Index was launched on July 01, 2002 and has no prior
operating history. All pro-forma performance data shown prior to the inception date is simulated
and was calculated by means of retroactive application of the Index model. Past performance is no
guarantee of future performance.
Source: Bloomberg or Deutsche Bank AG/London
13
|
  |
REUTERS: DBEIEUGR
BLOOMBERG: DBEEEUGR
Deutsche Bank Euro Growth Total Return Index
Index Description
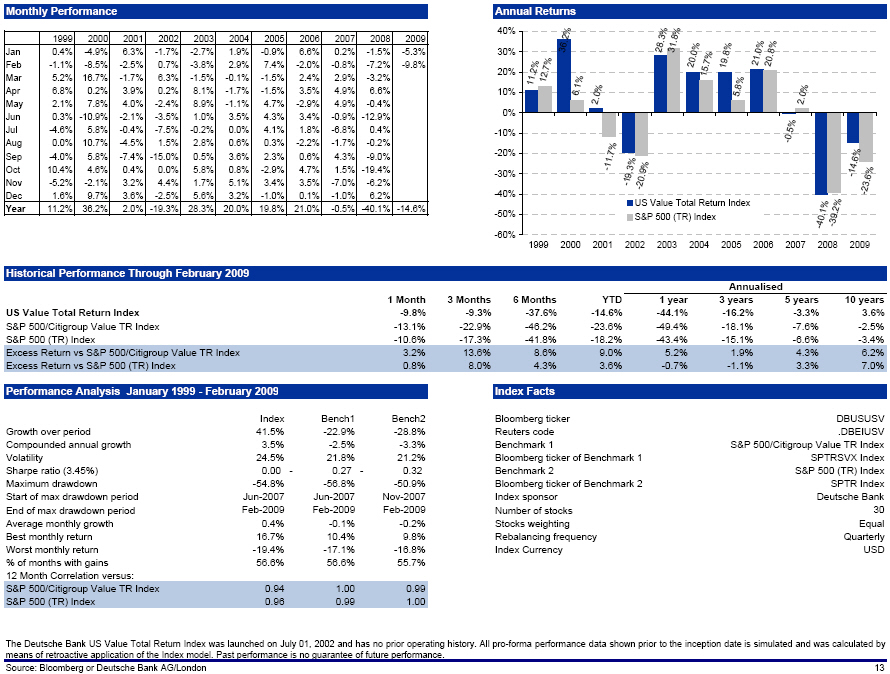
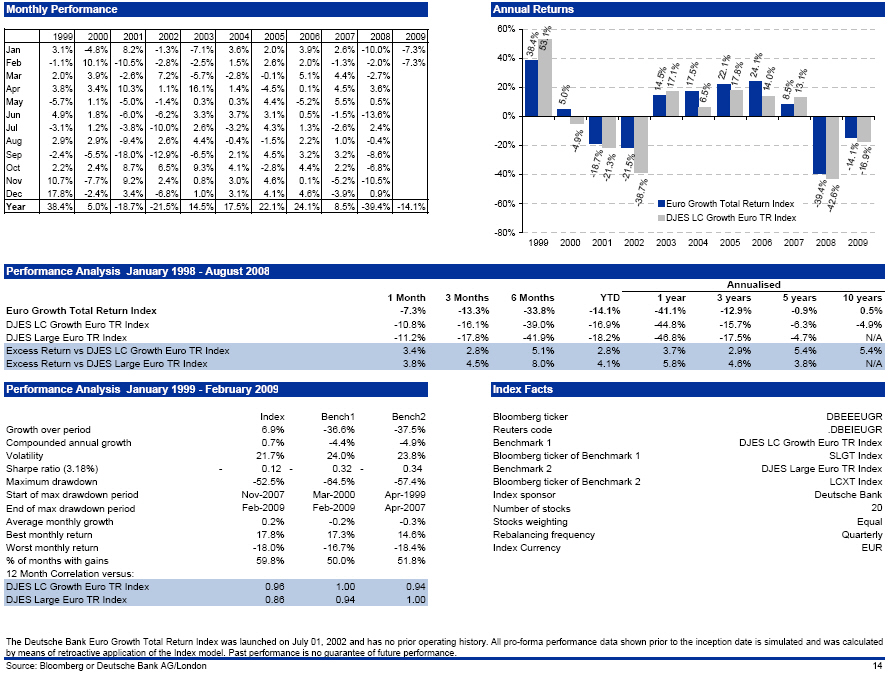
The Euro Growth Total Return Index intends to reflect the equal-weighted total return performance
of twenty growth stocks from the Eurozone based on high trailing 12 month earnings momentum and
selected from the Dow Jones EURO STOXX Large Index on a quarterly basis. There is a country
constraint so that no more than five shares from the same country will constitute the index.
[Graphic Appears Here]
Monthly Performance
1999 2000 2001 2002 2003 2004 2005 2006 2007 2008 2009
Jan 3.1% -4.8% 8.2% -1.3% -7.1% 3.6% 2.0% 3.9% 2.6% -10.0% -7.3%
Feb -1.1% 10.1% -10.5% -2.8% -2.5% 1.5% 2.6% 2.0% -1.3% -2.0% -7.3%
Mar 2.0% 3.9% -2.6% 7.2% -5.7% -2.8% -0.1% 5.1% 4.4% -2.7%
Apr 3.8% 3.4% 10.3% 1.1% 16.1% 1.4% -4.5% 0.1% 4.5% 3.6%
May -5.7% 1.1% -5.0% -1.4% 0.3% 0.3% 4.4% -5.2% 5.5% 0.5%
Jun 4.9% 1.8% -6.0% -6.2% 3.3% 3.7% 3.1% 0.5% -1.5% -13.6%
Jul -3.1% 1.2% -3.8% -10.0% 2.6% -3.2% 4.3% 1.3% -2.6% 2.4%
Aug 2.9% 2.9% -9.4% 2.6% 4.4% -0.4% -1.5% 2.2% 1.0% -0.4%
Sep -2.4% -5.5% -18.0% -12.9% -6.5% 2.1% 4.5% 3.2% 3.2% -8.6%
Oct 2.2% 2.4% 8.7% 6.5% 9.3% 4.1% -2.8% 4.4% 2.2% -6.8%
Nov 10.7% -7.7% 9.2% 2.4% 0.8% 3.0% 4.6% 0.1% -5.2% -10.5%
Dec 17.8% -2.4% 3.4% -6.8% 1.0% 3.1% 4.1% 4.6% -3.9% 0.9%
Year 38.4% 5.0% -18.7% -21.5% 14.5% 17.5% 22.1% 24.1% 8.5% -39.4% -14.1%
Absolute Return
2500
2000 Euro Growth Total Return Index
1500 DJES LC Growth Euro TR Index rebased to 1000 on (1/1/1999)
1000 DJES Large Euro TR Index rebased to 1558 on (10/9/2000)
500
0
Jan- Jan- Jan- Jan- Jan- Jan- Jan- Jan- Jan- Jan- Jan-
1999 2000 2001 2002 2003 2004 2005 2006 2007 2008 2009
Cumulative Excess Index vs DJES LC Growth Euro TR Index
2000
1800 Relative to DJES LC Growth Euro TR Index rebased to 1000
1600
1400
1200
1000
800
600
400
200
0
Jan- Jan- Jan- Jan- Jan- Jan- Jan- Jan- Jan- Jan- Jan-
1999 2000 2001 2002 2003 2004 2005 2006 2007 2008 2009
Annual Returns
60%
40% Euro Growth Total Return Index
20% DJES LC Growth Euro TR Index
0%
-20%
-40%
-60%
-80%
1999 2000 2001 2002 2003 2004 2005 2006 2007 2008 2009
Performance Analysis January 1998 - August 2008
1 Month 3 Months 6 Months YTD
Euro Growth Total Return Index -7.3% -13.3% -33.8% -14.1%
DJES LC Growth Euro TR Index -10.8% -16.1% -39.0% -16.9%
DJES Large Euro TR Index -11.2% -17.8% -41.9% -18.2%
Excess Return vs DJES LC Growth Euro TR Index 3.4% 2.8% 5.1% 2.8%
Excess Return vs DJES Large Euro TR Index 3.8% 4.5% 8.0% 4.1%
Annualised
1year 3 years 5 years 10 years
Euro Growth Total Return Index -41.1% -12.9% -0.9% 0.5%
DJES LC Growth Euro TR Index -44.8% -15.7% -6.3% -4.9%
DJES Large Euro TR Index -46.8% -17.5% -4.7% N/A
Excess Return vs DJES LC Growth Euro TR Index 3.7% 2.9% 5.4% 5.4%
Excess Return vs DJES Large Euro TR Index 5.8% 4.6% 3.8% N/A
Performance Analysis January 1999 - February 2009
Index Bench1 Bench2
Growth over period 6.9% -36.6% -37.5%
Compounded annual growth 0.7% -4.4% -4.9%
Volatility 21.7% 24.0% 23.8%
Sharpe ratio (3.18%) - 0.12- 0.32 - 0.34
Maximum drawdown -52.5% -64.5% -57.4%
Start of max drawdown period Nov-2007 Mar-2000 Apr-1999
End of max drawdown period Feb-2009 Feb-2009 Apr-2007
Average monthly growth 0.2% -0.2% -0.3%
Best monthly return 17.8% 17.3% 14.6%
Worst monthly return -18.0% -16.7% -18.4%
% of months with gains 59.8% 50.0% 51.8%
12 Month Correlation versus:
DJES LC Growth Euro TR Index 0.96 1.00 0.94
DJES Large Euro TR Index 0.86 0.94 1.00
Index Facts
Bloomberg ticker DBEEEUGR
Reuters code .DBEIEUGR
Benchmark 1 DJES LC Growth Euro TR Index
Bloomberg ticker of Benchmark 1 SLGT Index
Benchmark 2 DJES Large Euro TR Index
Bloomberg ticker of Benchmark 2 LCXT Index
Index sponsor Deutsche Bank
Number of stocks 20
Stocks weighting Equal
Rebalancing frequency Quarterly
Index Currency EUR
The Deutsche Bank Euro Growth Total Return Index was launched on July 01, 2002 and has no prior
operating history. All pro-forma performance data shown prior to the inception date is simulated
and was calculated by means of retroactive application of the Index model. Past performance is no
guarantee of future performance.
Source: Bloomberg or Deutsche Bank AG/London
14
|
  |
REUTERS: DBEIEUVA
BLOOMBERG: DBEEEUVA
Deutsche Bank Euro Value Total Return Index
Index Description
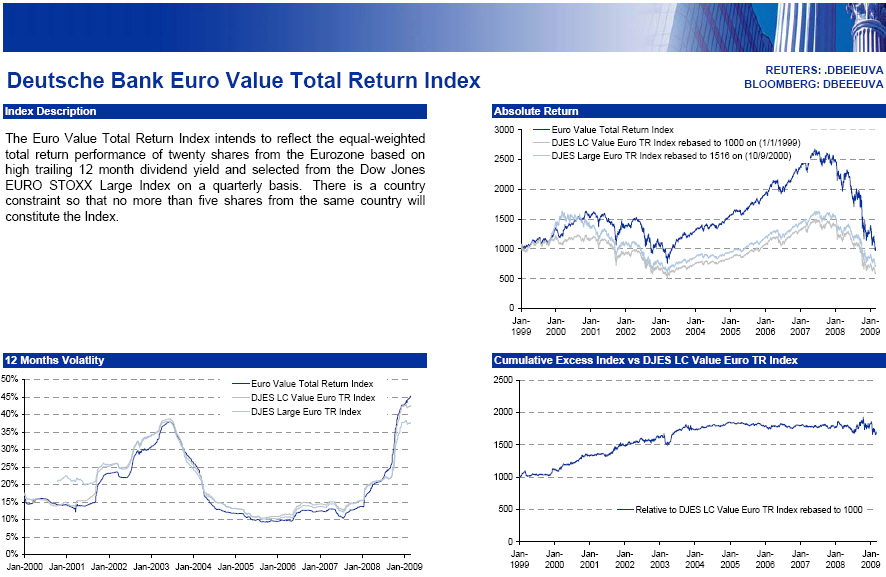
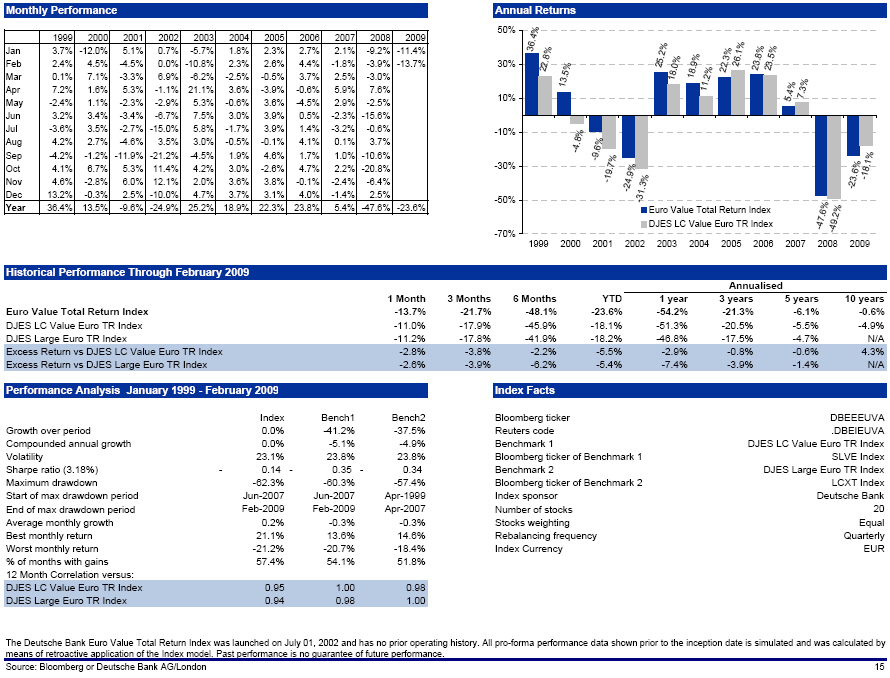
The Euro Value Total Return Index intends to reflect the equal-weighted total return performance of
twenty shares from the Eurozone based on high trailing 12 month dividend yield and selected from
the Dow Jones EURO STOXX Large Index on a quarterly basis. There is a country constraint so that no
more than five shares from the same country will constitute the Index.
[Graphic Appears Here]
Monthly Performance
1999 2000 2001 2002 2003 2004 2005 2006 2007 2008 2009
Jan 3.7% -12.0% 5.1% 0.7% -5.7% 1.8% 2.3% 2.7% 2.1% -9.2% -11.4%
Feb 2.4% 4.5% -4.5% 0.0% -10.8% 2.3% 2.6% 4.4% -1.8% -3.9% -13.7%
Mar 0.1% 7.1% -3.3% 6.9% -6.2% -2.5% -0.5% 3.7% 2.5% -3.0%
Apr 7.2% 1.6% 5.3% -1.1% 21.1% 3.6% -3.9% -0.6% 5.9% 7.6%
May -2.4% 1.1% -2.3% -2.9% 5.3% -0.6% 3.6% -4.5% 2.9% -2.5%
Jun 3.2% 3.4% -3.4% -6.7% 7.5% 3.0% 3.9% 0.5% -2.3% -15.6%
Jul -3.6% 3.5% -2.7% -15.0% 5.8% -1.7% 3.9% 1.4% -3.2% -0.6%
Aug 4.2% 2.7% -4.6% 3.5% 3.0% -0.5% -0.1% 4.1% 0.1% 3.7%
Sep -4.2% -1.2% -11.9% -21.2% -4.5% 1.9% 4.6% 1.7% 1.0% -10.6%
Oct 4.1% 6.7% 5.3% 11.4% 4.2% 3.0% -2.6% 4.7% 2.2% -20.8%
Nov 4.6% -2.8% 6.0% 12.1% 2.0% 3.6% 3.8% -0.1% -2.4% -6.4%
Dec 13.2% -0.3% 2.5% -10.0% 4.7% 3.7% 3.1% 4.0% -1.4% 2.5%
Year 36.4% 13.5% -9.6% -24.9% 25.2% 18.9% 22.3% 23.8% 5.4% -47.6% -23.6%
Absolute Return
3000
2500 Euro Value Total Return Index
2000 DJES LC Value Euro TR Index rebased to 1000 on (1/1/1999)
1500 DJES Large Euro TR Index rebased to 1516 on (10/9/2000)
1000
500
0
Jan- Jan- Jan- Jan- Jan- Jan- Jan- Jan- Jan- Jan- Jan-
1999 2000 2001 2002 2003 2004 2005 2006 2007 2008 2009
Cumulative Excess Index vs DJES LC Value Euro TR Index
2500
2000
1500
1000
500 Relative to DJES LC Value Euro TR Index rebased to 1000
0
Jan- Jan- Jan- Jan- Jan- Jan- Jan- Jan- Jan- Jan- Jan-
1999 2000 2001 2002 2003 2004 2005 2006 2007 2008 2009
Annual Returns
50% Euro Value Total Return Index
30%
10%
-10%
-30% DJES LC Value Euro TR Index
-50%
-70%
1999 2001 2002 2003 2004 2006 2007 2008 2009
Historical Performance Through February 2009
1 Month 3 Months 6 Months YTD
Euro Value Total Return Index -13.7% -21.7% -48.1% -23.6%
DJES LC Value Euro TR Index -11.0% -17.9% -45.9% -18.1%
DJES Large Euro TR Index -11.2% -17.8% -41.9% -18.2%
Excess Return vs DJES LC Value Euro TR Index -2.8% -3.8% -2.2% -5.5%
Excess Return vs DJES Large Euro TR Index -2.6% -3.9% -6.2% -5.4%
Annualised
1year 3 years 5 years 10 years
Euro Value Total Return Index -54.2% -21.3% -6.1% -0.6%
DJES LC Value Euro TR Index -51.3% -20.5% -5.5% -4.9%
DJES Large Euro TR Index -46.8% -17.5% -4.7% N/A
Excess Return vs DJES LC Value Euro TR Index -2.9% -0.8% -0.6% 4.3%
Excess Return vs DJES Large Euro TR Index -7.4% -3.9% -1.4% N/A
Performance Analysis January 1999 - February 2009
Index Bench1 Bench2
Growth over period 0.0% -41.2% -37.5%
Compounded annual growth 0.0% -5.1% -4.9%
Volatility 23.1% 23.8% 23.8%
Sharpe ratio (3.18%) - 0.14- 0.35 - 0.34
Maximum drawdown -62.3% -60.3% -57.4%
Start of max drawdown period Jun-2007 Jun-2007 Apr-1999
End of max drawdown period Feb-2009 Feb-2009 Apr-2007
Average monthly growth 0.2% -0.3% -0.3%
Best monthly return 21.1% 13.6% 14.6%
Worst monthly return -21.2% -20.7% -18.4%
% of months with gains 57.4% 54.1% 51.8%
12 Month Correlation versus:
DJES LC Value Euro TR Index 0.95 1.00 0.98
DJES Large Euro TR Index 0.94 0.98 1.00
Index Facts
Bloomberg ticker DBEEEUVA
Reuters code .DBEIEUVA
Benchmark 1 DJES LC Value Euro TR Index
Bloomberg ticker of Benchmark 1 SLVE Index
Benchmark 2 DJES Large Euro TR Index
Bloomberg ticker of Benchmark 2 LCXT Index
Index sponsor Deutsche Bank
Number of stocks 20
Stocks weighting Equal
Rebalancing frequency Quarterly
Index Currency EUR
The Deutsche Bank Euro Value Total Return Index was launched on July 01, 2002 and has no prior
operating history. All pro-forma performance data shown prior to the inception date is simulated
and was calculated by means of retroactive application of the Index model. Past performance is no
guarantee of future performance.
Source: Bloomberg or Deutsche Bank AG/London
15
|
  |
REUTERS: DBUKGT
BLOOMBERG: DBEEUKGT
Deutsche Bank UK Growth Total Return Index
Index Description
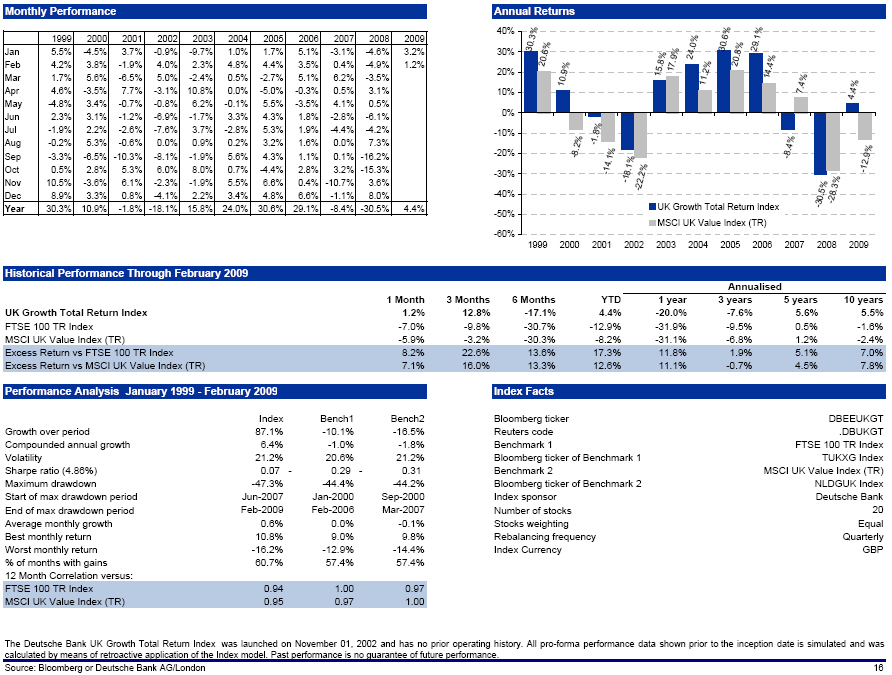
The UK Growth Total Return Index intends to reflect the equal-weighted total return performance of
twenty UK growth stocks based on trailing 12 month earnings momentum and selected from the FTSE 100
Index on a quarterly basis.
[Graphic Appears Here]
Monthly Performance
1999 2000 2001 2002 2003 2004 2005 2006 2007 2008 2009
Jan 5.5% -4.5% 3.7% -0.9% -9.7% 1.0% 1.7% 5.1% -3.1% -4.6% 3.2%
Feb 4.2% 3.8% -1.9% 4.0% 2.3% 4.8% 4.4% 3.5% 0.4% -4.9% 1.2%
Mar 1.7% 5.6% -6.5% 5.0% -2.4% 0.5% -2.7% 5.1% 6.2% -3.5%
Apr 4.6% -3.5% 7.7% -3.1% 10.8% 0.0% -5.0% -0.3% 0.5% 3.1%
May -4.8% 3.4% -0.7% -0.8% 6.2% -0.1% 5.5% -3.5% 4.1% 0.5%
Jun 2.3% 3.1% -1.2% -6.9% -1.7% 3.3% 4.3% 1.8% -2.8% -6.1%
Jul -1.9% 2.2% -2.6% -7.6% 3.7% -2.8% 5.3% 1.9% -4.4% -4.2%
Aug -0.2% 5.3% -0.6% 0.0% 0.9% 0.2% 3.2% 1.6% 0.0% 7.3%
Sep -3.3% -6.5% -10.3% -8.1% -1.9% 5.6% 4.3% 1.1% 0.1% -16.2%
Oct 0.5% 2.8% 5.3% 6.0% 8.0% 0.7% -4.4% 2.8% 3.2% -15.3%
Nov 10.5% -3.6% 6.1% -2.3% -1.9% 5.5% 6.6% 0.4% -10.7% 3.6%
Dec 8.9% 3.3% 0.8% -4.1% 2.2% 3.4% 4.8% 6.6% -1.1% 8.0%
Year 30.3% 10.9% -1.8% -18.1% 15.8% 24.0% 30.6% 29.1% -8.4% -30.5% 4.4%
Absolute Return
3500
3000 UK Growth Total Return Index
2500 FTSE 100 TR Index rebased to 1000 on (1/1/1999)
2000 MSCI UK Value Index (TR) rebased to 1303 on (12/30/1999)
1500
1000
500
0
Jan- Jan- Jan- Jan- Jan- Jan- Jan- Jan- Jan- Jan- Jan-
1999 2000 2001 2002 2003 2004 2005 2006 2007 2008 2009
Cumulative Excess Index vs FTSE 100 TR Index
2500
2000 Relative to FTSE 100 TR Index rebased to 1000
1500
1000
500
0
Jan- Jan- Jan- Jan- Jan- Jan- Jan- Jan- Jan- Jan- Jan-
1999 2000 2001 2002 2003 2004 2005 2006 2007 2008 2009
Annual Returns
40%
30%
20%
10% UK Growth Total Return Index
0%
-10% MSCI UK Value Index (TR)
-20%
-30%
-40%
-50%
-60%
1999 2000 2001 2002 2003 2004 2005 2006 2007 2008 2009
Historical Performance Through February 2009
1 Month 3 Months 6 Months YTD
UK Growth Total Return Index 1.2% 12.8% -17.1% 4.4%
FTSE 100 TR Index -7.0% -9.8% -30.7% -12.9%
MSCI UK Value Index (TR) -5.9% -3.2% -30.3% -8.2%
Excess Return vs FTSE 100 TR Index 8.2% 22.6% 13.6% 17.3%
Excess Return vs MSCI UK Value Index (TR) 7.1% 16.0% 13.3% 12.6%
Annualised
1year 3 years 5 years 10 years
UK Growth Total Return Index -20.0% -7.6% 5.6% 5.5%
FTSE 100 TR Index -31.9% -9.5% 0.5% -1.6%
MSCI UK Value Index (TR) -31.1% -6.8% 1.2% -2.4%
Excess Return vs FTSE 100 TR Index 11.8% 1.9% 5.1% 7.0%
Excess Return vs MSCI UK Value Index (TR) 11.1% -0.7% 4.5% 7.8%
Performance Analysis January 1999 - February 2009
Index Bench1 Bench2
Growth over period 87.1% -10.1% -16.5%
Compounded annual growth 6.4% -1.0% -1.8%
Volatility 21.2% 20.6% 21.2%
Sharpe ratio (4.86%) 0.07 - 0.29 - 0.31
Maximum drawdown -47.3% -44.4% -44.2%
Start of max drawdown period Jun-2007 Jan-2000 Sep-2000
End of max drawdown period Feb-2009 Feb-2006 Mar-2007
Average monthly growth 0.6% 0.0% -0.1%
Best monthly return 10.8% 9.0% 9.8%
Worst monthly return -16.2% -12.9% -14.4%
% of months with gains 60.7% 57.4% 57.4%
12 Month Correlation versus:
FTSE 100 TR Index 0.94 1.00 0.97
MSCI UK Value Index (TR) 0.95 0.97 1.00
Index Facts
Bloomberg ticker DBEEUKGT
Reuters code .DBUKGT
Benchmark 1 FTSE 100 TR Index
Bloomberg ticker of Benchmark 1 TUKXG Index
Benchmark 2 MSCI UK Value Index (TR)
Bloomberg ticker of Benchmark 2 NLDGUK Index
Index sponsor Deutsche Bank
Number of stocks 20
Stocks weighting Equal
Rebalancing frequency Quarterly
Index Currency GBP
The Deutsche Bank UK Growth Total Return Index was launched on November 01, 2002 and has no prior
operating history. All pro-forma performance data shown prior to the inception date is simulated
and was calculated by means of retroactive application of the Index model. Past performance is no
guarantee of future performance.
Source: Bloomberg or Deutsche Bank AG/London
16
|
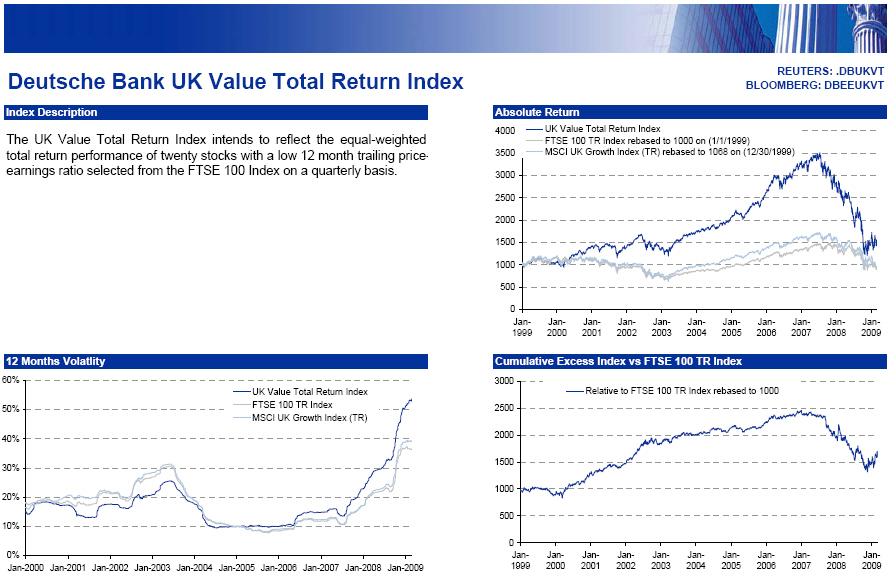 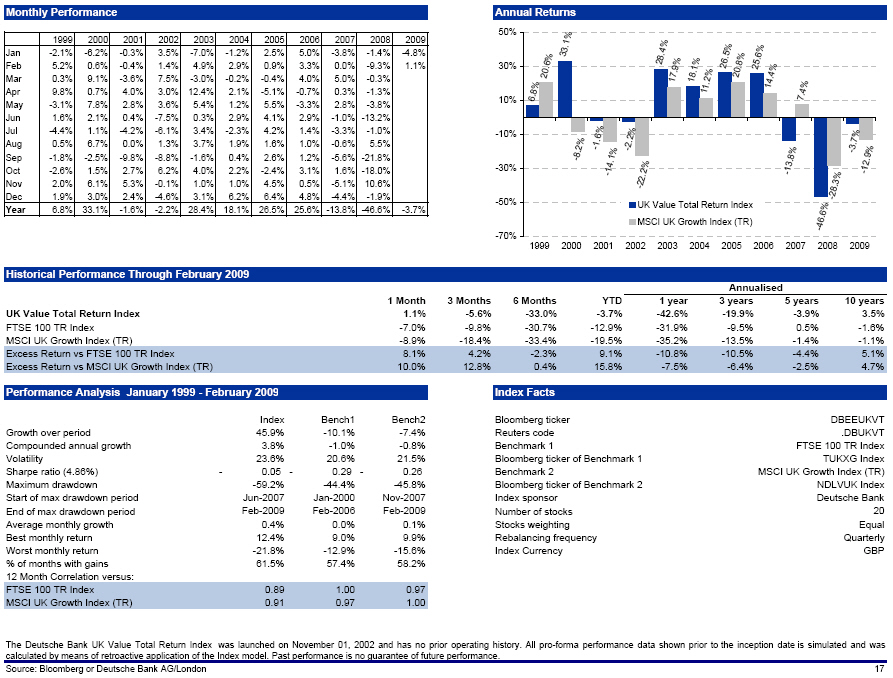 |
                                                                                    REUTERS: DBUKVT
                                                                                BLOOMBERG: DBEEUKVT

Deutsche Bank UK Value Total Return Index

Index Description

The UK Value Total Return Index intends to reflect the  equal-weighted  total return performance of
twenty stocks with a low 12 month trailing price earnings ratio selected from the FTSE 100 Index on
a quarterly basis.

12 Months Volatlity

 60%
 50%           UK Value Total Return Index
 40%           FTSE 100 TR Index
 30%           MSCI UK Growth Index (TR)
 20%
 10%
  0%
    Jan-2000 Jan-2001 Jan-2002 Jan-2003 Jan-2004 Jan-2005 Jan-2006 Jan-2007 Jan-2008 Jan-2009

Monthly Performance
         1999   2000  2001   2002    2003   2004   2005     2006      2007     2008      2009
Jan     -2.1%  -6.2% -0.3%   3.5%   -7.0%  -1.2%   2.5%     5.0%     -3.8%    -1.4%     -4.8%
Feb      5.2%   0.6% -0.4%   1.4%    4.9%   2.9%   0.9%     3.3%      0.0%    -9.3%      1.1%
Mar      0.3%   9.1% -3.6%   7.5%   -3.0%  -0.2%  -0.4%     4.0%      5.0%    -0.3%
Apr      9.8%   0.7%  4.0%   3.0%   12.4%   2.1%  -5.1%    -0.7%      0.3%    -1.3%
May     -3.1%   7.8%  2.8%   3.6%    5.4%   1.2%   5.5%    -3.3%      2.8%    -3.8%
Jun      1.6%   2.1%  0.4%  -7.5%    0.3%   2.9%   4.1%     2.9%     -1.0%   -13.2%
Jul     -4.4%   1.1% -4.2%  -6.1%    3.4%  -2.3%   4.2%     1.4%     -3.3%    -1.0%
Aug      0.5%   6.7%  0.0%   1.3%    3.7%   1.9%   1.6%     1.0%     -0.6%     5.5%
Sep     -1.8%  -2.5% -9.8%  -8.8%   -1.6%   0.4%   2.6%     1.2%     -5.6%   -21.8%
Oct     -2.6%   1.5%  2.7%   6.2%    4.0%   2.2%  -2.4%     3.1%      1.6%   -18.0%
Nov      2.0%   6.1%  5.3%  -0.1%    1.0%   1.0%   4.5%     0.5%     -5.1%    10.6%
Dec      1.9%   3.0%  2.4%  -4.6%    3.1%   6.2%   6.4%     4.8%     -4.4%    -1.9%
Year     6.8%  33.1% -1.6%  -2.2%   28.4%  18.1%  26.5%    25.6%    -13.8%   -46.6%     -3.7%

Absolute Return

4000
3500     UK Value Total Return Index
3000     FTSE 100 TR Index rebased to 1000 on (1/1/1999)
2500     MSCI UK Growth Index (TR) rebased to 1068 on (12/30/1999)
2000
1500
1000
 500
   0
       Jan-  Jan- Jan- Jan- Jan- Jan- Jan- Jan- Jan- Jan- Jan-
       1999  2000 2001 2002 2003 2004 2005 2006 2007 2008 2009

Cumulative Excess Index vs FTSE 100 TR Index
3000
2500       Relative to FTSE 100 TR Index rebased to 1000
2000
1500
1000
500
0
    Jan- Jan- Jan- Jan- Jan- Jan- Jan- Jan- Jan- Jan- Jan-
    1999 2000 2001 2002 2003 2004 2005 2006 2007 2008 2009

Annual Returns

       50%
       30%
       10%
      -10%              UK Value Total Return Index
      -30%
      -50%              MSCI UK Growth Index (TR)
      -70%
               1999 2000 2001 2002 2003 2004 2005 2006 2007 2008 2009

Historical Performance Through February 2009

                                                           1 Month   3 Months  6 Months      YTD
UK Value Total Return Index                                   1.1%      -5.6%    -33.0%    -3.7%
FTSE 100 TR Index                                            -7.0%      -9.8%    -30.7%   -12.9%
MSCI UK Growth Index (TR)                                    -8.9%     -18.4%    -33.4%   -19.5%
Excess Return vs FTSE 100 TR Index                            8.1%       4.2%     -2.3%     9.1%
Excess Return vs MSCI UK Growth Index (TR)                   10.0%      12.8%      0.4%    15.8%

                                                                    Annualised
                                                             1year   3 years  5 years    10 years
UK Value Total Return Index                                 -42.6%    -19.9%    -3.9%       3.5%
FTSE 100 TR Index                                           -31.9%     -9.5%     0.5%      -1.6%
MSCI UK Growth Index (TR)                                   -35.2%    -13.5%    -1.4%      -1.1%
Excess Return vs FTSE 100 TR Index                          -10.8%    -10.5%    -4.4%       5.1%
Excess Return vs MSCI UK Growth Index (TR)                   -7.5%     -6.4%    -2.5%       4.7%

Performance Analysis January 1999 - February 2009
                                                         Index       Bench1        Bench2
Growth over period                                        45.9%       -10.1%         -7.4%
Compounded annual growth                                   3.8%        -1.0%         -0.8%
Volatility                                                23.6%        20.6%         21.5%
Sharpe ratio (4.86%)                                    - 0.05-      0.29 -          0.26
Maximum drawdown                                         -59.2%       -44.4%        -45.8%
Start of max drawdown period                            Jun-2007    Jan-2000        Nov-2007
End of max drawdown period                              Feb-2009    Feb-2006        Feb-2009
Average monthly growth                                     0.4%         0.0%          0.1%
Best monthly return                                       12.4%         9.0%          9.9%
Worst monthly return                                     -21.8%       -12.9%        -15.6%
% of months with gains                                    61.5%        57.4%         58.2%
12 Month Correlation versus:
FTSE 100 TR Index                                         0.89         1.00          0.97
MSCI UK Growth Index (TR)                                 0.91         0.97          1.00

Index Facts

Bloomberg ticker                                                             DBEEUKVT
Reuters code                                                                  .DBUKVT
Benchmark 1                                                         FTSE 100 TR Index
Bloomberg ticker of Benchmark 1                                           TUKXG Index
Benchmark 2                                                 MSCI UK Growth Index (TR)
Bloomberg ticker of Benchmark 2                                          NDLVUK Index
Index sponsor                                                           Deutsche Bank
Number of stocks                                                                   20
Stocks weighting                                                                Equal
Rebalancing frequency                                                       Quarterly
Index Currency                                                                    GBP

The  Deutsche  Bank UK Value Total  Return Index was launched on November 01, 2002 and has no prior
operating  history.  All pro-forma  performance data shown prior to the inception date is simulated
and was calculated by means of retroactive  application of the Index model.  Past performance is no
guarantee of future performance.

Source: Bloomberg or Deutsche Bank AG/London

                                                                                                 17
|
  |
                                                                                     REUTERS: DBJGT
                                                                                 BLOOMBERG: DBAPJGT

Deutsche Bank Japan Growth Total Return Index

Index Description

The Japan Growth Total Return Index intends to reflect the equal-weighted  total return performance
of twenty JPY growth  stocks based on trailing 12 month  earnings  momentum  and selected  from the
Topix 100 Index on a quarterly basis.

12 Months Volatlity

50%
45%         Japan Growth Total Return Index
40%         TOPIX W/Dividend TOPIX 100 (TR)
35%         MSCI Japan Growth (TR)
30%
25%
20%
15%
10%
 5%
 0%
    Jan-2000  Jan-2002  Jan-2004  Jan-2006  Jan-2008

Monthly Performance
            1999   2000    2001   2002   2003    2004    2005    2006    2007     2008     2009
Jan        -1.7%   1.3%    2.4%  -9.1%  -3.5%    3.6%   -1.6%    5.3%    2.8%   -10.1%    -4.6%
Feb         0.5%   4.6%   -8.4%   2.5%  -0.6%    4.3%    4.6%    0.8%    0.0%     2.1%    -4.1%
Mar        13.7%   4.0%    1.2%   2.5%  -4.5%    5.0%   -1.5%    4.5%   -0.2%   -10.3%
Apr         5.2%   2.5%    8.8%   2.3%  -0.9%    1.5%   -4.8%   -1.8%   -0.3%    14.9%
May         0.6%  -2.1%   -4.3%   2.1%   4.3%   -2.2%    2.0%   -7.1%    4.1%     3.8%
Jun        10.4%   2.7%   -5.1%  -7.7%   5.1%    1.5%    1.7%   -0.7%    2.7%    -6.2%
Jul         2.2%  -6.9%   -8.1%  -6.2%   4.9%   -4.0%    3.1%    0.4%   -3.5%    -2.5%
Aug        -1.9%   0.8%   -8.6%   0.9%   5.0%   -0.4%    5.1%    3.9%   -5.3%    -4.7%
Sep         4.3%  -1.0%   -8.7%   0.0%   2.6%   -1.3%   14.9%   -2.9%    2.4%   -18.8%
Oct         3.8%  -1.8%    4.2%  -3.5%   3.4%   -1.4%    2.5%    1.6%   -0.6%   -23.7%
Nov         0.3%  -0.6%    1.1%   4.9%  -5.1%    4.3%    4.8%   -1.5%   -8.5%    -3.0%
Dec        -0.1%  -3.8%   -1.6%  -2.8%   2.8%    3.6%    7.3%    5.1%   -3.0%     2.2%
Year       42.8%  -1.0%  -25.4% -14.3%  13.5%   15.1%   43.7%    7.0%   -9.8%   -47.5%    -8.5%

Absolute Return

2500
2000    Japan Growth Total Return Index
1500    TOPIX W/Dividend TOPIX 100 (TR) rebased to 1000 on (1/1/1999)
1000    MSCI Japan Growth (TR) rebased to 1428 on (12/30/1999)
 500
   0
       Jan-  Jan- Jan- Jan- Jan- Jan- Jan- Jan- Jan- Jan- Jan-
       1999  2000 2001 2002 2003 2004 2005 2006 2007 2008 2009

Cumulative Excess Index vs TOPIX W/Dividend TOPIX 100 (TR)
1400
1200
1000
800
600   Relative to TOPIX W/Dividend TOPIX 100 (TR) rebased to 1000
400
200
0
   Jan- Jan- Jan- Jan- Jan- Jan- Jan- Jan- Jan- Jan- Jan-
   1999 2000 2001 2002 2003 2004 2005 2006 2007 2008 2009

Annual Returns

       100%                                       Japan Growth Total Return Index
        80%                                                MSCI Japan Growth (TR)
        60%
        40%
        20%
         0%
       -20%
       -40%
       -60%
       -80%
               1999 2000 2001 2002 2003 2004 2005 2006 2007 2008 2009

Historical Performance Through February 2009

                                                            1 Month 3 Months  6 Months     YTD
Japan Growth Total Return Index                               -4.1%    -6.5%    -43.8%   -8.5%
TOPIX W/Dividend TOPIX 100 (TR)                               -4.3%    -9.1%    -42.3%  -11.5%
MSCI Japan Growth (TR)                                        -6.2%   -12.3%    -45.8%  -15.4%
Excess Return vs TOPIX W/Dividend TOPIX 100 (TR)               0.2%     2.6%     -1.5%    3.0%
Excess Return vs MSCI Japan Growth (TR)                        2.1%     5.8%      2.0%    6.9%

                                                                     Annualised
                                                              1year   3 years  5 years     10 years
Japan Growth Total Return Index                              -47.7%    -24.1%    -6.6%       -2.3%
TOPIX W/Dividend TOPIX 100 (TR)                              -44.7%    -22.2%    -6.8%       -4.4%
MSCI Japan Growth (TR)                                       -49.0%    -26.2%    -9.1%       -7.2%
Excess Return vs TOPIX W/Dividend TOPIX 100 (TR)              -3.0%     -1.9%     0.2%        2.1%
Excess Return vs MSCI Japan Growth (TR)                        1.3%      2.1%     2.5%        4.9%

Performance Analysis January 1999 - February 2009
                                                         Index         Bench1        Bench2
Growth over period                                       -21.4%         -33.4%        -50.6%
Compounded annual growth                                  -2.3%          -3.9%         -6.7%
Volatility                                                23.9%          24.5%         25.0%
Sharpe ratio (0.2%)                                     - 0.11-        0.17 -          0.28
Maximum drawdown                                         -60.4%         -62.7%        -69.8%
Start of max drawdown period                            Jul-2007       Jan-2000      Mar-2000
End of max drawdown period                              Feb-2009       Feb-2009      Feb-2009
Average monthly growth                                     0.0%          -0.2%         -0.4%
Best monthly return                                       14.9%          14.9%         13.4%
Worst monthly return                                     -23.7%         -21.4%        -23.4%
% of months with gains                                    54.1%          51.6%         50.0%
12 Month Correlation versus:
TOPIX W/Dividend TOPIX 100 (TR)                           0.98           1.00          0.99
MSCI Japan Growth (TR)                                    0.98           0.99          1.00
- -----------------------------------------------------------------------------------------------

Index Facts

Bloomberg ticker                                                                    DBAPJGT
Reuters code                                                                         .DBJGT
Benchmark 1                                                 TOPIX W/Dividend TOPIX 100 (TR)
Bloomberg ticker of Benchmark 1                                               TPXD100 Index
Benchmark 2                                                          MSCI Japan Growth (TR)
Bloomberg ticker of Benchmark 2                                                NAGLJN Index
Index sponsor                                                                 Deutsche Bank
Number of stocks                                                                         20
Stocks weighting                                                                      Equal
Rebalancing frequency                                                             Quarterly
Index Currency                                                                          JPY

The  Deutsche  Bank Japan  Growth  Total  Return Index was launched on November 01, 2002 and has no
prior  operating  history.  All pro-forma  performance  data shown prior to the  inception  date is
simulated  and was  calculated  by  means of  retroactive  application  of the  Index  model.  Past
performance is no guarantee of future performance.

Source: Bloomberg or Deutsche Bank AG/London

                                                                                                 18
|
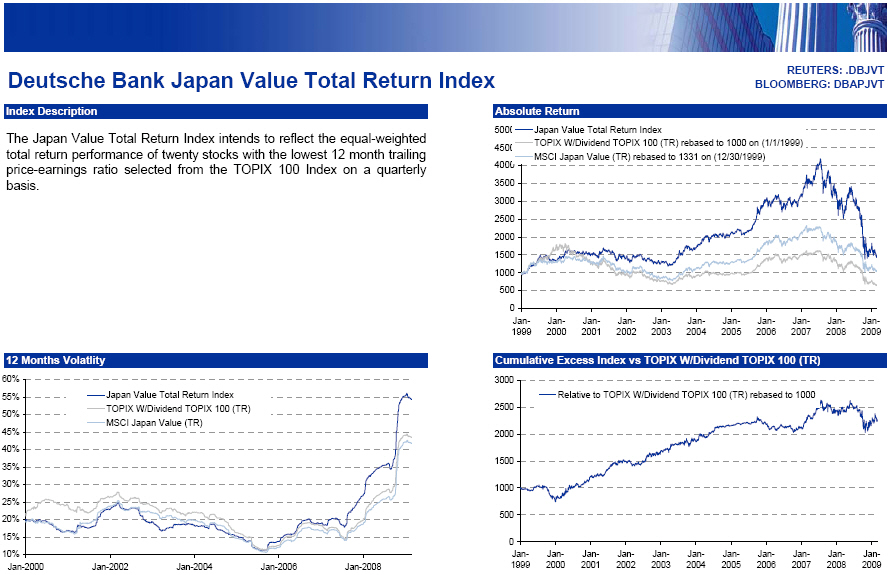 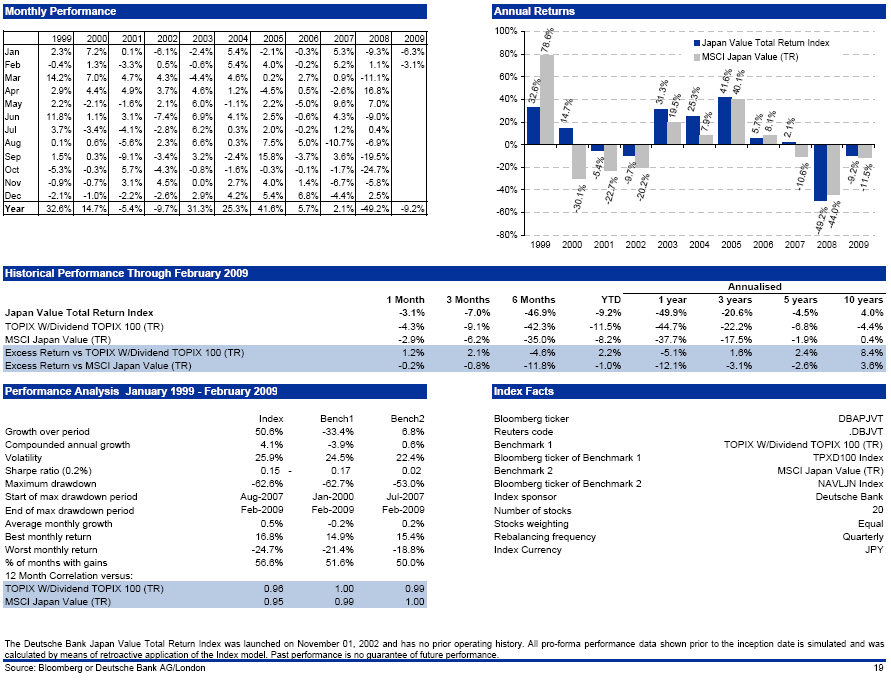 |
                                                                                     REUTERS: DBJVT
                                                                                 BLOOMBERG: DBAPJVT

Deutsche Bank Japan Value Total Return Index

Index Description

The Japan Value Total Return Index intends to reflect the  equal-weighted  total return performance
of twenty stocks with the lowest 12 month trailing price-earnings ratio selected from the TOPIX 100
Index on a quarterly basis.

12 Months Volatlity
 60%
 55%
 50%        Japan Value Total Return Index
 45%        TOPIX W/Dividend TOPIX 100 (TR)
 40%        MSCI Japan Value (TR)
 35%
 30%
 25%
 20%
 15%
 10%
    Jan -2000   Jan-2002    Jan-2004   Jan-2006   Jan-2008

Monthly Performance
        1999   2000    2001     2002   2003    2004     2005    2006    2007    2008    2009
Jan     2.3%   7.2%    0.1%    -6.1%  -2.4%    5.4%    -2.1%   -0.3%    5.3%   -9.3%   -6.3%
Feb    -0.4%   1.3%   -3.3%     0.5%  -0.6%    5.4%     4.0%   -0.2%    5.2%    1.1%   -3.1%
Mar    14.2%   7.0%    4.7%     4.3%  -4.4%    4.6%     0.2%    2.7%    0.9%  -11.1%
Apr     2.9%   4.4%    4.9%     3.7%   4.6%    1.2%    -4.5%    0.5%   -2.6%   16.8%
May     2.2%  -2.1%   -1.6%     2.1%   6.0%   -1.1%     2.2%   -5.0%    9.6%    7.0%
Jun    11.8%   1.1%    3.1%    -7.4%   6.9%    4.1%     2.5%   -0.6%    4.3%   -9.0%
Jul     3.7%  -3.4%   -4.1%    -2.8%   6.2%    0.3%     2.0%   -0.2%    1.2%    0.4%
Aug     0.1%   0.6%   -5.6%     2.3%   6.6%    0.3%     7.5%    5.0%  -10.7%   -6.9%
Sep     1.5%   0.3%   -9.1%    -3.4%   3.2%   -2.4%    15.8%   -3.7%    3.6%  -19.5%
Oct    -5.3%  -0.3%    5.7%    -4.3%  -0.8%   -1.6%    -0.3%   -0.1%   -1.7%  -24.7%
Nov    -0.9%  -0.7%    3.1%     4.5%   0.0%    2.7%     4.0%    1.4%   -6.7%   -5.8%
Dec    -2.1%  -1.0%   -2.2%    -2.6%   2.9%    4.2%     5.4%    6.8%   -4.4%    2.5%
Year   32.6%  14.7%   -5.4%    -9.7%  31.3%   25.3%    41.6%    5.7%    2.1%  -49.2%   -9.2%

Absolute Return

5000Japan Value Total Return Index
4500TOPIX W/Dividend TOPIX 100 (TR) rebased to 1000 on (1/1/1999)
    MSCI Japan Value (TR) rebased to 1331 on (12/30/1999)
4000
3500
3000
2500
2000
1500
1000
 500
   0
       Jan- Jan- Jan- Jan- Jan- Jan- Jan- Jan- Jan-  Jan-  Jan-
       1999 2000 2001 2002 2003 2004 2005 2006 2007  2008  2009

Cumulative Excess Index vs TOPIX W/Dividend TOPIX 100 (TR)

3000
2500   Relative to TOPIX W/Dividend TOPIX 100 (TR) rebased to 1000
2000
1500
1000
500
0
   Jan- Jan- Jan- Jan- Jan- Jan- Jan- Jan- Jan- Jan- Jan-
   1999 2000 2001 2002 2003 2004 2005 2006 2007 2008 2009

Annual Returns

      100%
                                     Japan Value Total Return Index
       80%                                    MSCI Japan Value (TR)
       60%
       40%
       20%
      -20%
      -40%
      -60%
      -80%
            1999 2000 2001 2002 2003 2004 2005 2006 2007 2008 2009

Historical Performance Through February 2009

                                                         1 Month    3 Months   6 Months      YTD
Japan Value Total Return Index                             -3.1%       -7.0%     -46.9%    -9.2%
TOPIX W/Dividend TOPIX 100 (TR)                            -4.3%       -9.1%     -42.3%   -11.5%
MSCI Japan Value (TR)                                      -2.9%       -6.2%     -35.0%    -8.2%
Excess Return vs TOPIX W/Dividend TOPIX 100 (TR)            1.2%        2.1%      -4.6%     2.2%
Excess Return vs MSCI Japan Value (TR)                     -0.2%       -0.8%     -11.8%    -1.0%

                                                                 Annualised
                                                          1year   3 years  5 years    10 years
Japan Value Total Return Index                           -49.9%    -20.6%    -4.5%        4.0%
TOPIX W/Dividend TOPIX 100 (TR)                          -44.7%    -22.2%    -6.8%       -4.4%
MSCI Japan Value (TR)                                    -37.7%    -17.5%    -1.9%        0.4%
Excess Return vs TOPIX W/Dividend TOPIX 100 (TR)          -5.1%      1.6%     2.4%        8.4%
Excess Return vs MSCI Japan Value (TR)                   -12.1%     -3.1%    -2.6%        3.6%

Performance Analysis January 1999 - February 2009
                                                       Index       Bench1          Bench2
Growth over period                                      50.6%       -33.4%            6.8%
Compounded annual growth                                 4.1%        -3.9%            0.6%
Volatility                                              25.9%        24.5%           22.4%
Sharpe ratio (0.2%)                                   0.15 -         0.17            0.02
Maximum drawdown                                       -62.6%       -62.7%          -53.0%
Start of max drawdown period                          Aug-2007     Jan-2000        Jul-2007
End of max drawdown period                            Feb-2009     Feb-2009        Feb-2009
Average monthly growth                                   0.5%        -0.2%            0.2%
Best monthly return                                     16.8%        14.9%           15.4%
Worst monthly return                                   -24.7%       -21.4%          -18.8%
% of months with gains                                  56.6%        51.6%           50.0%
12 Month Correlation versus:
TOPIX W/Dividend TOPIX 100 (TR)                         0.96         1.00            0.99
MSCI Japan Value (TR)                                   0.95         0.99            1.00

Index Facts

Bloomberg ticker                                                       DBAPJVT
Reuters code                                                            .DBJVT
Benchmark 1                                    TOPIX W/Dividend TOPIX 100 (TR)
Bloomberg ticker of Benchmark 1                                  TPXD100 Index
Benchmark 2                                              MSCI Japan Value (TR)
Bloomberg ticker of Benchmark 2                                   NAVLJN Index
Index sponsor                                                    Deutsche Bank
Number of stocks                                                            20
Stocks weighting                                                         Equal
Rebalancing frequency                                                Quarterly
Index Currency                                                             JPY

The Deutsche Bank Japan Value Total Return Index was launched on November 01, 2002 and has no prior
operating  history.  All pro-forma  performance data shown prior to the inception date is simulated
and was calculated by means of retroactive  application of the Index model.  Past performance is no
guarantee of future performance.

Source: Bloomberg or Deutsche Bank AG/London

                                                                                                 19
|
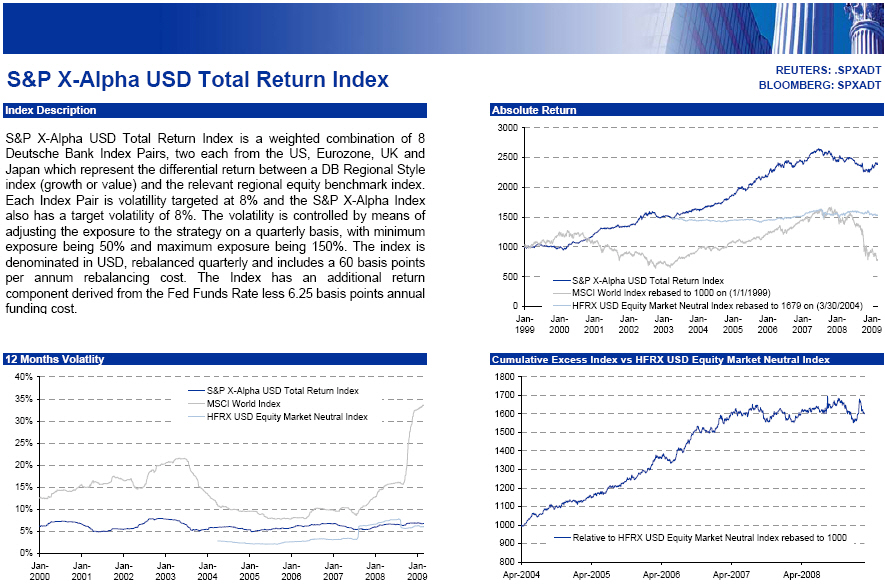 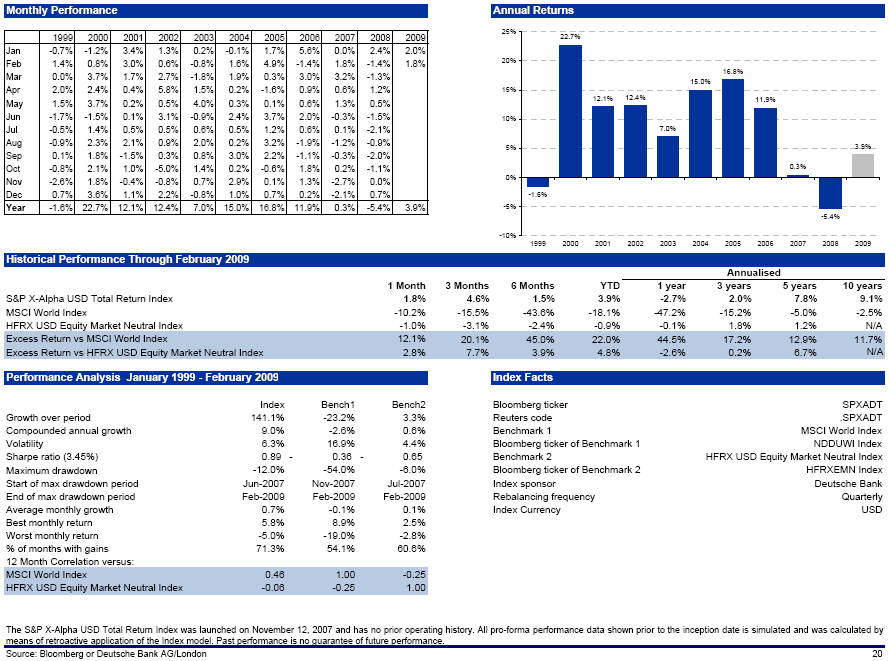 |
                                                                                    REUTERS: SPXADT
                                                                                  BLOOMBERG: SPXADT

S&P X-Alpha USD Total Return Index

Index Description

S&P X-Alpha USD Total Return Index is a weighted  combination  of 8 Deutsche Bank Index Pairs,  two
each from the US,  Eurozone,  UK and Japan which  represent the  differential  return  between a DB
Regional Style index (growth or value) and the relevant regional equity benchmark index. Each Index
Pair is  volatillity  targeted at 8% and the S&P X-Alpha Index also has a target  volatility of 8%.
The  volatility  is  controlled  by means of adjusting  the exposure to the strategy on a quarterly
basis, with minimum exposure being 50% and maximum exposure being 150%. The index is denominated in
USD, rebalanced  quarterly and includes a 60 basis points per annum rebalancing cost. The Index has
an  additional  return  component  derived  from the Fed Funds Rate less 6.25 basis  points  annual
funding cost.

12 Months Volatlity

40%
35%       S&P X-Alpha USD Total Return Index
30%       MSCI World Index
25%       HFRX USD Equity Market Neutral Index
20%
15%
10%
 5%
 0%
      Jan- Jan- Jan-  Jan-  Jan- Jan- Jan- Jan- Jan-  Jan-
      2000 2001 2002  2003  2004 2005 2006 2007 2008  2009

Monthly Performance
          1999   2000   2001   2002   2003   2004   2005    2006    2007     2008      2009
Jan      -0.7%  -1.2%   3.4%   1.3%   0.2%  -0.1%   1.7%    5.6%    0.0%     2.4%      2.0%
Feb       1.4%   0.8%   3.0%   0.6%  -0.8%   1.6%   4.9%   -1.4%    1.8%    -1.4%      1.8%
Mar       0.0%   3.7%   1.7%   2.7%  -1.8%   1.9%   0.3%    3.0%    3.2%    -1.3%
Apr       2.0%   2.4%   0.4%   5.8%   1.5%   0.2%  -1.6%    0.9%    0.6%     1.2%
May       1.5%   3.7%   0.2%   0.5%   4.0%   0.3%   0.1%    0.6%    1.3%     0.5%
Jun      -1.7%  -1.5%   0.1%   3.1%  -0.9%   2.4%   3.7%    2.0%   -0.3%    -1.5%
Jul      -0.5%   1.4%   0.5%   0.5%   0.6%   0.5%   1.2%    0.6%    0.1%    -2.1%
Aug      -0.9%   2.3%   2.1%   0.9%   2.0%   0.2%   3.2%   -1.9%   -1.2%    -0.9%
Sep       0.1%   1.8%  -1.5%   0.3%   0.8%   3.0%   2.2%   -1.1%   -0.3%    -2.0%
Oct      -0.8%   2.1%   1.0%  -5.0%   1.4%   0.2%  -0.6%    1.8%    0.2%    -1.1%
Nov      -2.6%   1.8%  -0.4%  -0.8%   0.7%   2.9%   0.1%    1.3%   -2.7%     0.0%
Dec       0.7%   3.6%   1.1%   2.2%  -0.8%   1.0%   0.7%    0.2%   -2.1%     0.7%
Year     -1.6%  22.7%  12.1%  12.4%   7.0%  15.0%  16.8%   11.9%    0.3%    -5.4%      3.9%

Absolute Return

3000
2500
2000        S&P X-Alpha USD Total Return Index
1500        MSCI World Index rebased to 1000 on (1/1/1999)
1000        HFRX USD Equity Market Neutral Index rebased to 1679 on (3/30/2004)
 500
   0
       Jan- Jan- Jan- Jan- Jan- Jan- Jan- Jan- Jan- Jan- Jan-
       1999 2000 2001 2002 2003 2004 2005 2006 2007 2008 2009

Cumulative Excess Index vs HFRX USD Equity Market Neutral Index
1800
1700
1600
1500
1400
1300
1200
1100
1000
900 Relative to HFRX USD Equity Market Neutral Index rebased to 1000
800
    Apr-2004   Apr-2005   Apr-2006   Apr-2007   Apr-2008

[Graphic Appears Here]

Historical Performance Through February 2009

                                                            1 Month   3 Months   6 Months      YTD
S&P X-Alpha USD Total Return Index                             1.8%       4.6%       1.5%     3.9%
MSCI World Index                                             -10.2%     -15.5%     -43.6%   -18.1%
HFRX USD Equity Market Neutral Index                          -1.0%      -3.1%      -2.4%    -0.9%
Excess Return vs MSCI World Index                             12.1%      20.1%      45.0%    22.0%
Excess Return vs HFRX USD Equity Market Neutral Index          2.8%       7.7%       3.9%     4.8%

                                                                     Annualised
                                                               1year   3 years  5 years    10 years
S&P X-Alpha USD Total Return Index                             -2.7%      2.0%     7.8%       9.1%
MSCI World Index                                              -47.2%    -15.2%    -5.0%      -2.5%
HFRX USD Equity Market Neutral Index                           -0.1%      1.8%     1.2%       N/A
Excess Return vs MSCI World Index                              44.5%     17.2%    12.9%      11.7%
Excess Return vs HFRX USD Equity Market Neutral Index          -2.6%      0.2%     6.7%       N/A

Performance Analysis January 1999 - February 2009
                                                             Index         Bench1        Bench2
Growth over period                                           141.1%         -23.2%          3.3%
Compounded annual growth                                       9.0%          -2.6%          0.6%
Volatility                                                     6.3%          16.9%          4.4%
Sharpe ratio (3.45%)                                        0.89 -         0.36 -          0.65
Maximum drawdown                                             -12.0%         -54.0%         -6.0%
Start of max drawdown period                                Jun-2007       Nov-2007      Jul-2007
End of max drawdown period                                  Feb-2009       Feb-2009      Feb-2009
Average monthly growth                                         0.7%          -0.1%          0.1%
Best monthly return                                            5.8%           8.9%          2.5%
Worst monthly return                                          -5.0%         -19.0%         -2.8%
% of months with gains                                        71.3%          54.1%         60.6%
12 Month Correlation versus:
MSCI World Index                                              0.46           1.00         -0.25
HFRX USD Equity Market Neutral Index                         -0.06          -0.25          1.00

Index Facts

Bloomberg ticker                                                               SPXADT
Reuters code                                                                  .SPXADT
Benchmark 1                                                          MSCI World Index
Bloomberg ticker of Benchmark 1                                          NDDUWI Index
Benchmark 2                                      HFRX USD Equity Market Neutral Index
Bloomberg ticker of Benchmark 2                                         HFRXEMN Index
Index sponsor                                                           Deutsche Bank
Rebalancing frequency                                                       Quarterly
Index Currency                                                                    USD

The S&P X-Alpha USD Total Return Index was launched on November 12, 2007 and has no prior operating
history.  All pro-forma  performance  data shown prior to the  inception  date is simulated and was
calculated by means of retroactive application of the Index model. Past performance is no guarantee
of future performance.

Source: Bloomberg or Deutsche Bank AG/London

                                                                                                 20
|
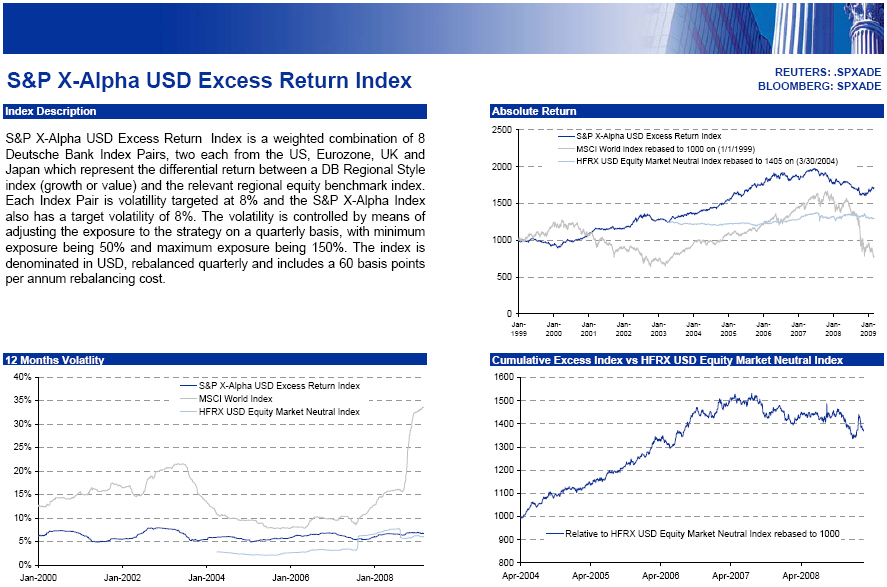  |
                                                                                    REUTERS: SPXADE
                                                                                  BLOOMBERG: SPXADE

S&P X-Alpha USD Excess Return Index

Index Description

S&P X-Alpha USD Excess Return Index is a weighted  combination of 8 Deutsche Bank Index Pairs,  two
each from the US,  Eurozone,  UK and Japan which  represent the  differential  return  between a DB
Regional Style index (growth or value) and the relevant regional equity benchmark index. Each Index
Pair is  volatillity  targeted at 8% and the S&P X-Alpha Index also has a target  volatility of 8%.
The  volatility  is  controlled  by means of adjusting  the exposure to the strategy on a quarterly
basis, with minimum exposure being 50% and maximum exposure being 150%. The index is denominated in
USD, rebalanced quarterly and includes a 60 basis points per annum rebalancing cost.

12 Months Volatlity

40%
35%          S&P X-Alpha USD Excess Return Index
30%          MSCI World Index
25%          HFRX USD Equity Market Neutral Index
20%
15%
10%
 5%
 0%
        Jan-2000    Jan-2002      Jan-2004     Jan-2006     Jan-2008

Monthly Performance
           1999    2000    2001    2002     2003    2004    2005    2006    2007    2008     2009
Jan       -1.1%   -1.7%    2.9%    1.1%     0.1%   -0.2%    1.6%    5.3%   -0.5%    2.1%     2.0%
Feb        1.0%    0.3%    2.6%    0.4%    -0.9%    1.6%    4.7%   -1.8%    1.4%   -1.6%     1.8%
Mar       -0.5%    3.2%    1.2%    2.5%    -1.9%    1.8%    0.1%    2.6%    2.8%   -1.6%
Apr        1.7%    2.0%    0.0%    5.7%     1.4%    0.1%   -1.9%    0.6%    0.2%    1.0%
May        1.1%    3.2%   -0.1%    0.4%     3.9%    0.2%   -0.1%    0.1%    0.9%    0.3%
Jun       -2.1%   -2.0%   -0.2%    3.0%    -1.0%    2.3%    3.4%    1.5%   -0.7%   -1.7%
Jul       -0.9%    0.8%    0.2%    0.4%     0.5%    0.4%    0.9%    0.2%   -0.4%   -2.3%
Aug       -1.3%    1.8%    1.8%    0.8%     1.9%    0.1%    2.9%   -2.4%   -1.7%   -1.1%
Sep       -0.3%    1.3%   -1.7%    0.2%     0.7%    2.9%    1.9%   -1.5%   -0.7%   -2.2%
Oct       -1.2%    1.5%    0.7%   -5.1%     1.3%    0.1%   -1.0%    1.3%   -0.2%   -1.1%
Nov       -3.1%    1.2%   -0.5%   -0.9%     0.6%    2.7%   -0.3%    0.8%   -3.1%    0.0%
Dec        0.2%    3.1%    0.9%    2.1%    -0.9%    0.8%    0.4%   -0.3%   -2.5%    0.7%
Year      -6.4%   15.5%    8.0%   10.6%     5.8%   13.5%   13.2%    6.5%   -4.7%   -7.2%     3.9%

Absolute Return

2500
2000      S&P X-Alpha USD Excess Return Index
1500      MSCI World Index rebased to 1000 on (1/1/1999)
1000      HFRX USD Equity Market Neutral Index rebased to 1405 on (3/30/2004)
 500
   0
       Jan-  Jan- Jan- Jan- Jan- Jan- Jan- Jan- Jan- Jan-  Jan-
       1999  2000 2001 2002 2003 2004 2005 2006 2007 2008  2009

Cumulative Excess Index vs HFRX USD Equity Market Neutral Index
1600
1500
1400
1300
1200
1100
1000
900       Relative to HFRX USD Equity Market Neutral Index rebased to 1000
800
Apr-2004   Apr-2005    Apr-2006    Apr-2007    Apr-2008

Annual Returns

    20%
                 15.5%
    15%                                13.5% 13.2% 6.5%
    10%               8.0%
     5%                                                             3.9%
     0%
    -5%
          -6.4%                                        -4.7% -7.2%
   -10%
          1999  2000  2001  2002 2003  2004  2005 2006  2007  2008 2009

Historical Performance Through February 2009

                                                              1 Month   3 Months   6 Months
S&P X-Alpha USD Excess Return Index                              1.8%       4.6%       1.2%
MSCI World Index                                               -10.2%     -15.5%     -43.6%
HFRX USD Equity Market Neutral Index                            -1.0%      -3.1%      -2.4%
Excess Return vs MSCI World Index                               12.0%      20.1%      44.7%
Excess Return vs HFRX USD Equity Market Neutral Index            2.8%       7.7%       3.6%

                                                                     Annualised
                                                               1year   3 years  5 years    10 years
S&P X-Alpha USD Excess Return Index                            -4.1%     -1.8%     4.4%        5.6%
MSCI World Index                                              -47.2%    -15.2%    -5.0%       -2.5%
HFRX USD Equity Market Neutral Index                           -0.1%      1.8%     1.2%        N/A
Excess Return vs MSCI World Index                              43.2%     13.4%     9.4%        8.1%
Excess Return vs HFRX USD Equity Market Neutral Index          -4.0%     -3.6%     3.2%        N/A

Performance Analysis January 1999 - February 2009
                                                    Index       Bench1       Bench2
Growth over period                                   71.8%       -23.2%         3.3%
Compounded annual growth                              5.5%        -2.6%         0.6%
Volatility                                            6.3%        16.9%         4.4%
Sharpe ratio (3.45%)                               0.86 -       0.36 -         0.65
Maximum drawdown                                    -16.2%       -54.0%        -6.0%
Start of max drawdown period                      Jun-2007      Nov-2007      Jul-2007
End of max drawdown period                        Feb-2009      Feb-2009      Feb-2009
Average monthly growth                                0.5%        -0.1%         0.1%
Best monthly return                                   5.7%         8.9%         2.5%
Worst monthly return                                 -5.1%       -19.0%        -2.8%
% of months with gains                               63.1%        54.1%        60.6%
12 Month Correlation versus:
MSCI World Index                                     0.45         1.00        -0.25
HFRX USD Equity Market Neutral Index                -0.06        -0.25         1.00

Index Facts

Bloomberg ticker                                                               SPXADE
Reuters code                                                                  .SPXADE
Benchmark 1                                                          MSCI World Index
Bloomberg ticker of Benchmark 1                                          NDDUWI Index
Benchmark 2                                      HFRX USD Equity Market Neutral Index
Bloomberg ticker of Benchmark 2                                         HFRXEMN Index
Index sponsor                                                           Deutsche Bank
Rebalancing frequency                                                       Quarterly
Index Currency                                                                    USD

The S&P  X-Alpha  USD Excess  Return  Index was  launched  on  November  12,  2007 and has no prior
operating  history.  All pro-forma  performance data shown prior to the inception date is simulated
and was calculated by means of retroactive  application of the Index model.  Past performance is no
guarantee of future performance.

Source: Bloomberg or Deutsche Bank AG/London

                                                                                                 21
|
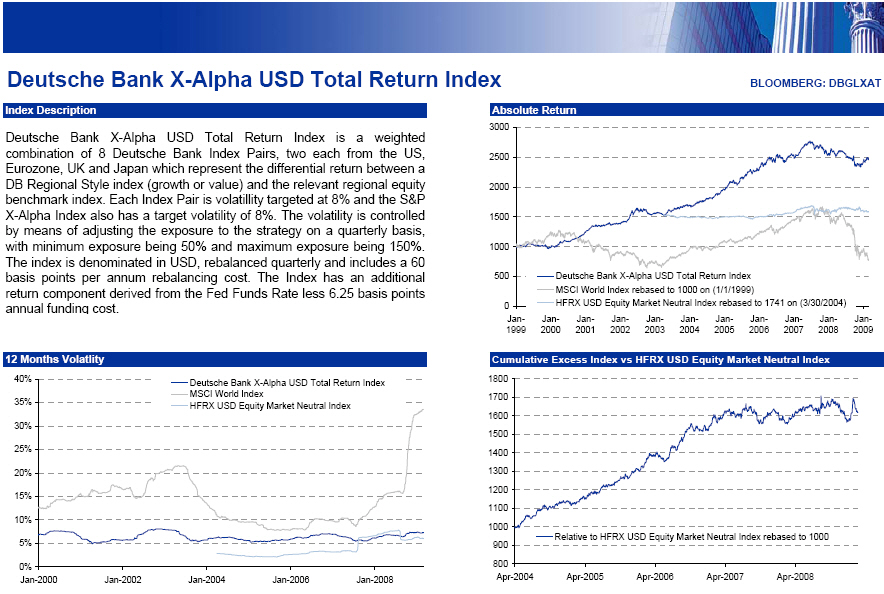 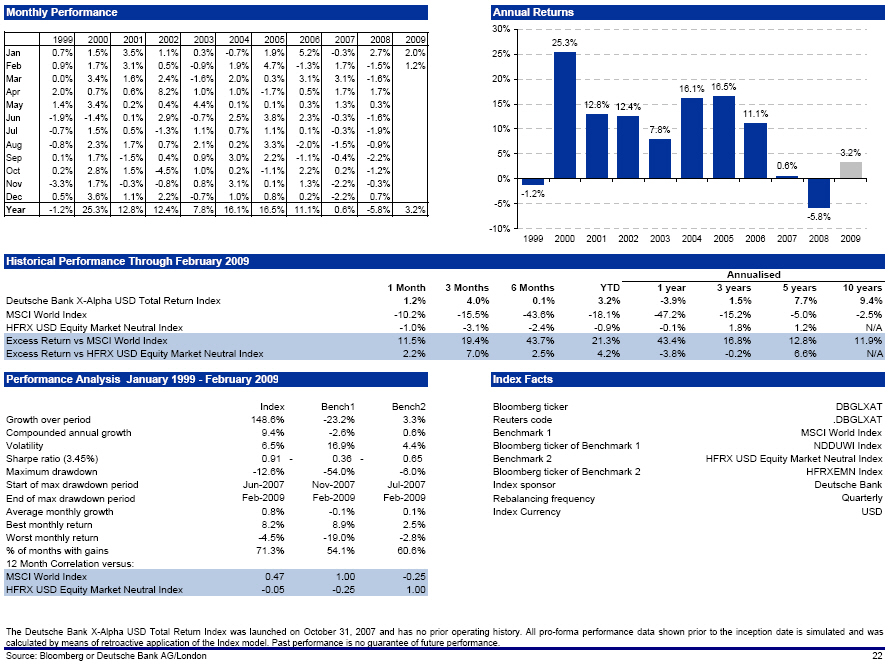 |
                                                                                 BLOOMBERG: DBGLXAT

Deutsche Bank X-Alpha USD Total Return Index

Index Description

Deutsche  Bank X-Alpha USD Total Return Index is a weighted  combination  of 8 Deutsche  Bank Index
Pairs, two each from the US, Eurozone, UK and Japan which represent the differential return between
a DB Regional Style index (growth or value) and the relevant  regional equity benchmark index. Each
Index Pair is volatillity  targeted at 8% and the S&P X-Alpha Index also has a target volatility of
8%. The  volatility is controlled by means of adjusting the exposure to the strategy on a quarterly
basis, with minimum exposure being 50% and maximum exposure being 150%. The index is denominated in
USD, rebalanced  quarterly and includes a 60 basis points per annum rebalancing cost. The Index has
an  additional  return  component  derived  from the Fed Funds Rate less 6.25 basis  points  annual
funding cost.

[Graphic Appears Here]

Monthly Performance
         1999   2000    2001    2002    2003    2004    2005    2006    2007    2008      2009
Jan      0.7%   1.5%    3.5%    1.1%    0.3%   -0.7%    1.9%    5.2%   -0.3%    2.7%      2.0%
Feb      0.9%   1.7%    3.1%    0.5%   -0.9%    1.9%    4.7%   -1.3%    1.7%   -1.5%      1.2%
Mar      0.0%   3.4%    1.6%    2.4%   -1.6%    2.0%    0.3%    3.1%    3.1%   -1.6%
Apr      2.0%   0.7%    0.6%    8.2%    1.0%    1.0%   -1.7%    0.5%    1.7%    1.7%
May      1.4%   3.4%    0.2%    0.4%    4.4%    0.1%    0.1%    0.3%    1.3%    0.3%
Jun     -1.9%  -1.4%    0.1%    2.9%   -0.7%    2.5%    3.8%    2.3%   -0.3%   -1.6%
Jul     -0.7%   1.5%    0.5%   -1.3%    1.1%    0.7%    1.1%    0.1%   -0.3%   -1.9%
Aug     -0.8%   2.3%    1.7%    0.7%    2.1%    0.2%    3.3%   -2.0%   -1.5%   -0.9%
Sep      0.1%   1.7%   -1.5%    0.4%    0.9%    3.0%    2.2%   -1.1%   -0.4%   -2.2%
Oct      0.2%   2.8%    1.5%   -4.5%    1.0%    0.2%   -1.1%    2.2%    0.2%   -1.2%
Nov     -3.3%   1.7%   -0.3%   -0.8%    0.8%    3.1%    0.1%    1.3%   -2.2%   -0.3%
Dec      0.5%   3.6%    1.1%    2.2%   -0.7%    1.0%    0.8%    0.2%   -2.2%    0.7%
Year    -1.2%  25.3%   12.8%   12.4%    7.8%   16.1%   16.5%   11.1%    0.6%   -5.8%      3.2%

Absolute Return

3000
2500     Deutsche Bank X-Alpha USD Total Return Index
2000     MSCI World Index rebased to 1000 on (1/1/1999)
1500     HFRX USD Equity Market Neutral Index rebased to 1741 on (3/30/2004)
1000
 500
   0
       Jan-  Jan- Jan- Jan- Jan- Jan- Jan- Jan- Jan- Jan- Jan-
       1999  2000 2001 2002 2003 2004 2005 2006 2007 2008 2009

Cumulative Excess Index vs HFRX USD Equity Market Neutral Index
1800
1700
1600
1500
1400
1300
1200
1100
1000   Relative to HFRX USD Equity Market Neutral Index rebased to 1000
900
800
     Apr-2004     Apr-2005    Apr-2006    Apr-2007    Apr-2008

Annual Returns

  30%
                   25.3%
  25%
  20%
                                                  16.1% 16.5%
  15%                      12.8% 12.4%
                                                                11.1%
  10%                                   7.8%
   5%                                                                                      3.2%
                                                                        0.6%
   0%
           -1.2%
  -5%
                                                                                -5.8%
 -10%
           1999   2000    2001   2002    2003    2004    2005    2006    2007    2008     2009

Historical Performance Through February 2009

                                                            1 Month   3 Months    6 Months     YTD
Deutsche Bank X-Alpha USD Total Return Index                   1.2%       4.0%        0.1%    3.2%
MSCI World Index                                             -10.2%     -15.5%      -43.6%  -18.1%
HFRX USD Equity Market Neutral Index                          -1.0%      -3.1%       -2.4%   -0.9%
Excess Return vs MSCI World Index                             11.5%      19.4%       43.7%   21.3%
Excess Return vs HFRX USD Equity Market Neutral Index          2.2%       7.0%        2.5%    4.2%

                                                                             Annualised
                                                               1year   3 years  5 years    10 years
Deutsche Bank X-Alpha USD Total Return Index                   -3.9%      1.5%     7.7%        9.4%
MSCI World Index                                              -47.2%    -15.2%    -5.0%       -2.5%
HFRX USD Equity Market Neutral Index                           -0.1%      1.8%     1.2%        N/A
Excess Return vs MSCI World Index                              43.4%     16.8%    12.8%       11.9%
Excess Return vs HFRX USD Equity Market Neutral Index          -3.8%     -0.2%     6.6%        N/A

Performance Analysis January 1999 - February 2009
                                                   Index         Bench1           Bench2
Growth over period                                 148.6%         -23.2%             3.3%
Compounded annual growth                             9.4%          -2.6%             0.6%
Volatility                                           6.5%          16.9%             4.4%
Sharpe ratio (3.45%)                              0.91 -         0.36 -             0.65
Maximum drawdown                                   -12.6%         -54.0%            -6.0%
Start of max drawdown period                      Jun-2007        Nov-2007        Jul-2007
End of max drawdown period                        Feb-2009        Feb-2009        Feb-2009
Average monthly growth                               0.8%          -0.1%             0.1%
Best monthly return                                  8.2%           8.9%             2.5%
Worst monthly return                                -4.5%         -19.0%            -2.8%
% of months with gains                              71.3%          54.1%            60.6%
12 Month Correlation versus:
MSCI World Index                                    0.47           1.00            -0.25
HFRX USD Equity Market Neutral Index               -0.05          -0.25             1.00

Index Facts

Bloomberg ticker                                                                     DBGLXAT
Reuters code                                                                        .DBGLXAT
Benchmark 1                                                                 MSCI World Index
Bloomberg ticker of Benchmark 1                                                 NDDUWI Index
Benchmark 2                                             HFRX USD Equity Market Neutral Index
Bloomberg ticker of Benchmark 2                                                HFRXEMN Index
Index sponsor                                                                  Deutsche Bank
Rebalancing frequency                                                              Quarterly
Index Currency                                                                           USD

The Deutsche  Bank X-Alpha USD Total Return Index was launched on October 31, 2007 and has no prior
operating  history.  All pro-forma  performance data shown prior to the inception date is simulated
and was calculated by means of retroactive  application of the Index model.  Past performance is no
guarantee of future performance.

Source: Bloomberg or Deutsche Bank AG/London

                                                                                                 22
|
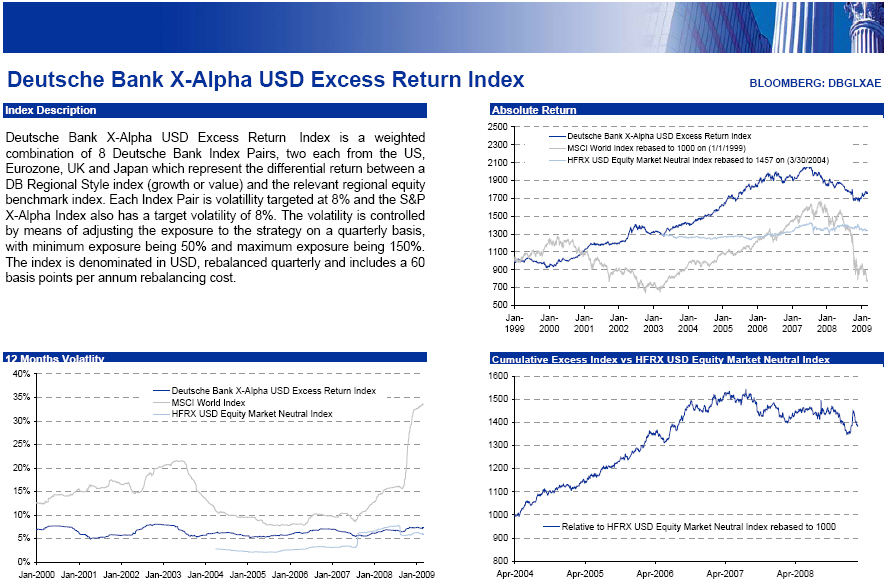 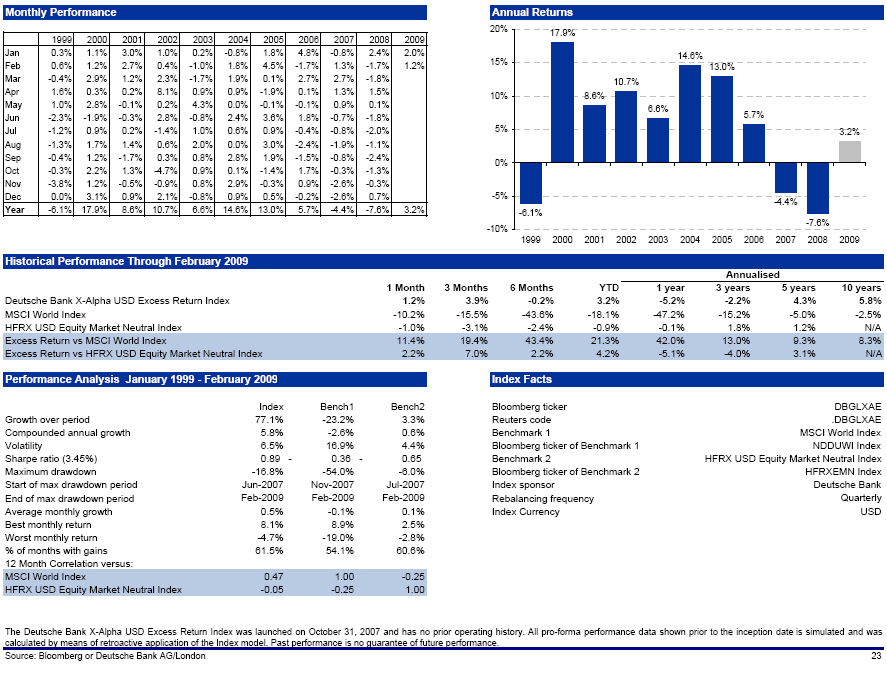 |
Deutsche Bank X-Alpha USD Excess Return Index                                    BLOOMBERG: DBGLXAE

Index Description

Deutsche  Bank X-Alpha USD Excess Return Index is a weighted  combination  of 8 Deutsche Bank Index
Pairs, two each from the US, Eurozone, UK and Japan which represent the differential return between
a DB Regional Style index (growth or value) and the relevant  regional equity benchmark index. Each
Index Pair is volatillity  targeted at 8% and the S&P X-Alpha Index also has a target volatility of
8%. The  volatility is controlled by means of adjusting the exposure to the strategy on a quarterly
basis, with minimum exposure being 50% and maximum exposure being 150%. The index is denominated in
USD, rebalanced quarterly and includes a 60 basis points per annum rebalancing cost.

12 Months Volatlity
40%
35%            Deutsche Bank X-Alpha USD Excess Return Index
30%            MSCI World Index
25%            HFRX USD Equity Market Neutral Index
20%
15%
10%
 5%
 0%
       Jan-2000 Jan-2001 Jan-2002 Jan-2003 Jan-2004 Jan-2005 Jan-2006 Jan-2007 Jan-2008 Jan-2009

Monthly Performance
          1999    2000   2001   2002   2003    2004   2005   2006    2007    2008     2009
Jan       0.3%    1.1%   3.0%   1.0%   0.2%   -0.8%   1.8%   4.8%   -0.8%    2.4%     2.0%
Feb       0.6%    1.2%   2.7%   0.4%  -1.0%    1.8%   4.5%  -1.7%    1.3%   -1.7%     1.2%
Mar      -0.4%    2.9%   1.2%   2.3%  -1.7%    1.9%   0.1%   2.7%    2.7%   -1.8%
Apr       1.6%    0.3%   0.2%   8.1%   0.9%    0.9%  -1.9%   0.1%    1.3%    1.5%
May       1.0%    2.8%  -0.1%   0.2%   4.3%    0.0%  -0.1%  -0.1%    0.9%    0.1%
Jun      -2.3%   -1.9%  -0.3%   2.8%  -0.8%    2.4%   3.6%   1.8%   -0.7%   -1.8%
Jul      -1.2%    0.9%   0.2%  -1.4%   1.0%    0.6%   0.9%  -0.4%   -0.8%   -2.0%
Aug      -1.3%    1.7%   1.4%   0.6%   2.0%    0.0%   3.0%  -2.4%   -1.9%   -1.1%
Sep      -0.4%    1.2%  -1.7%   0.3%   0.8%    2.8%   1.9%  -1.5%   -0.8%   -2.4%
Oct      -0.3%    2.2%   1.3%  -4.7%   0.9%    0.1%  -1.4%   1.7%   -0.3%   -1.3%
Nov      -3.8%    1.2%  -0.5%  -0.9%   0.8%    2.9%  -0.3%   0.9%   -2.6%   -0.3%
Dec       0.0%    3.1%   0.9%   2.1%  -0.8%    0.9%   0.5%  -0.2%   -2.6%    0.7%
Year     -6.1%   17.9%   8.6%  10.7%   6.6%   14.6%  13.0%   5.7%   -4.4%   -7.6%     3.2%

Absolute Return

 2500
 2300     Deutsche Bank X-Alpha USD Excess Return Index
 2100     MSCI World Index rebased to 1000 on (1/1/1999)
 1900     HFRX USD Equity Market Neutral Index rebased to 1457 on (3/30/2004)
 1700
 1500
 1300
 1100
  900
  700
  500
       Jan- Jan- Jan- Jan- Jan- Jan- Jan- Jan- Jan- Jan-   Jan-
       19992000 2001 2002 2003 2004 2005 2006 2007 2008    2009

Cumulative Excess Index vs HFRX USD Equity Market Neutral Index
1600
1500
1400
1300
1200
1100
1000   Relative to HFRX USD Equity Market Neutral Index rebased to 1000
900
800
    Apr-2004    Apr-2005    Apr-2006   Apr-2007    Apr -2008

Annual Returns

   20%              17.9%
                                               14.6%
   15%                                                  13.0%
                                  10.7%
   10%                      8.6%
                                         6.6%                   5.7%
    5%                                                                                    3.2%
    0%
   -5%                                                                 -4.4%
          -6.1%
                                                                               -7.6%
  -10%
          1999    2000    2001   2002    2003   2004    2005   2006    2007    2008        2009

Historical Performance Through February 2009

                                                            Month   3 Months   6 Months     YTD
Deutsche Bank X-Alpha USD Excess Return Index                1.2%       3.9%      -0.2%     3.2%
MSCI World Index                                           -10.2%     -15.5%     -43.6%   -18.1%
HFRX USD Equity Market Neutral Index                        -1.0%      -3.1%      -2.4%    -0.9%
Excess Return vs MSCI World Index                           11.4%      19.4%      43.4%    21.3%
Excess Return vs HFRX USD Equity Market Neutral Index        2.2%       7.0%       2.2%     4.2%

                                                                 Annualised
                                                            1year   3 years  5 years    10 years
Deutsche Bank X-Alpha USD Excess Return Index               -5.2%     -2.2%     4.3%       5.8%
MSCI World Index                                           -47.2%    -15.2%    -5.0%      -2.5%
HFRX USD Equity Market Neutral Index                        -0.1%      1.8%     1.2%       N/A
Excess Return vs MSCI World Index                           42.0%     13.0%     9.3%       8.3%
Excess Return vs HFRX USD Equity Market Neutral Index       -5.1%     -4.0%     3.1%       N/A

Performance Analysis January 1999 - February 2009
                                                        Index       Bench1        Bench2
Growth over period                                       77.1%       -23.2%          3.3%
Compounded annual growth                                  5.8%        -2.6%          0.6%
Volatility                                                6.5%        16.9%          4.4%
Sharpe ratio (3.45%)                                   0.89 -       0.36 -          0.65
Maximum drawdown                                        -16.8%       -54.0%         -6.0%
Start of max drawdown period                           Jun-2007     Nov-2007      Jul-2007
End of max drawdown period                             Feb-2009     Feb-2009      Feb-2009
Average monthly growth                                    0.5%        -0.1%          0.1%
Best monthly return                                       8.1%         8.9%          2.5%
Worst monthly return                                     -4.7%       -19.0%         -2.8%
% of months with gains                                   61.5%        54.1%         60.6%
12 Month Correlation versus:
MSCI World Index                                         0.47         1.00         -0.25
HFRX USD Equity Market Neutral Index                    -0.05        -0.25          1.00

Index Facts

Bloomberg ticker                                                                       DBGLXAE
Reuters code                                                                          .DBGLXAE
Benchmark 1                                                                   MSCI World Index
Bloomberg ticker of Benchmark 1                                                   NDDUWI Index
Benchmark 2                                               HFRX USD Equity Market Neutral Index
Bloomberg ticker of Benchmark 2                                                  HFRXEMN Index
Index sponsor                                                                    Deutsche Bank
Rebalancing frequency                                                                Quarterly
Index Currency                                                                             USD

The Deutsche Bank X-Alpha USD Excess Return Index was launched on October 31, 2007 and has no
prior operating history. All pro-forma performance data shown prior to the inception date is
simulated and was calculated by means of retroactive application of the Index model. Past
performance is no guarantee of future performance.

Source: Bloomberg or Deutsche Bank AG/London

                                                                                                 23
|
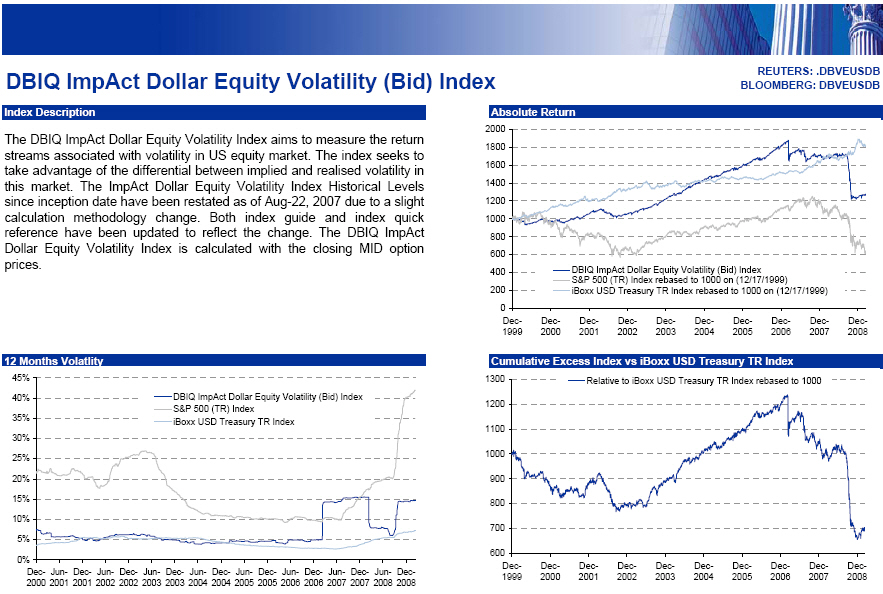 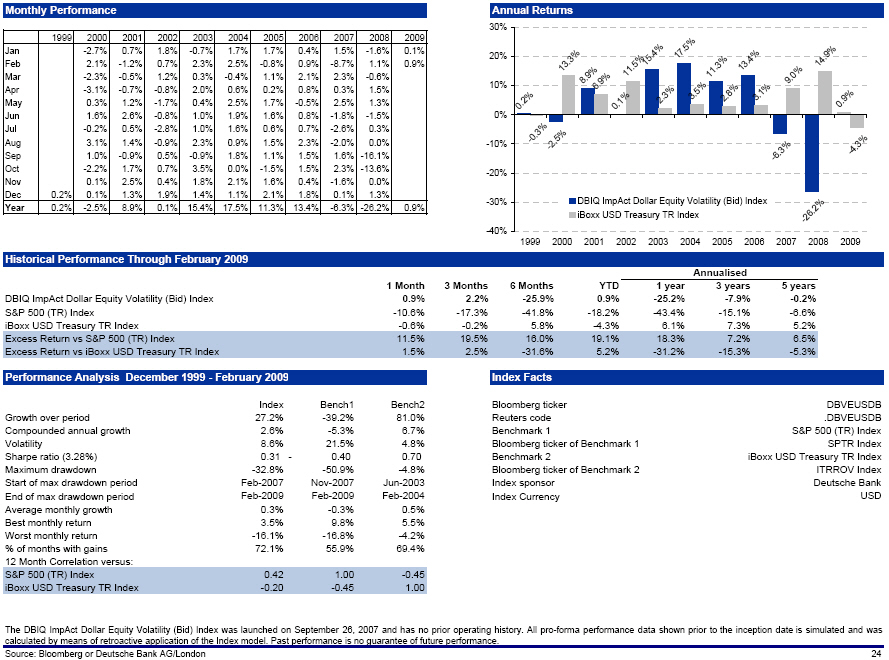 |
                                                                                 REUTERS: .DBVEUSDB
DBIQ ImpAct Dollar Equity Volatility (Bid) Index                                BLOOMBERG: DBVEUSDB
Index Description

The DBIQ ImpAct Dollar Equity  Volatility Index aims to measure the return streams  associated with
volatility  in US equity  market.  The index seeks to take  advantage of the  differential  between
implied  and  realised  volatility  in this  market.  The ImpAct  Dollar  Equity  Volatility  Index
Historical  Levels  since  inception  date have been  restated  as of Aug-22,  2007 due to a slight
calculation  methodology  change.  Both index guide and index quick  reference have been updated to
reflect the change.  The DBIQ ImpAct Dollar Equity  Volatility Index is calculated with the closing
MID option prices.


[Graphic Appears Here]


Monthly Performance
        1999   2000    2001   2002    2003   2004    2005    2006    2007    2008     2009
Jan           -2.7%    0.7%   1.8%   -0.7%   1.7%    1.7%    0.4%    1.5%   -1.6%     0.1%
Feb            2.1%   -1.2%   0.7%    2.3%   2.5%   -0.8%    0.9%   -8.7%    1.1%     0.9%
Mar           -2.3%   -0.5%   1.2%    0.3%  -0.4%    1.1%    2.1%    2.3%   -0.6%
Apr           -3.1%   -0.7%  -0.8%    2.0%   0.6%    0.2%    0.8%    0.3%    1.5%
May            0.3%    1.2%  -1.7%    0.4%   2.5%    1.7%   -0.5%    2.5%    1.3%
Jun            1.6%    2.6%  -0.8%    1.0%   1.9%    1.6%    0.8%   -1.8%   -1.5%
Jul           -0.2%    0.5%  -2.8%    1.0%   1.6%    0.6%    0.7%   -2.6%    0.3%
Aug            3.1%    1.4%  -0.9%    2.3%   0.9%    1.5%    2.3%   -2.0%    0.0%
Sep            1.0%   -0.9%   0.5%   -0.9%   1.8%    1.1%    1.5%    1.6%  -16.1%
Oct           -2.2%    1.7%   0.7%    3.5%   0.0%   -1.5%    1.5%    2.3%  -13.6%
Nov            0.1%    2.5%   0.4%    1.8%   2.1%    1.6%    0.4%   -1.6%    0.0%
Dec     0.2%   0.1%    1.3%   1.9%    1.4%   1.1%    2.1%    1.8%    0.1%    1.3%
Year    0.2%  -2.5%    8.9%   0.1%   15.4%  17.5%   11.3%   13.4%   -6.3%  -26.2%     0.9%

Absolute Return

2000
1800
1600
1400
1200
1000
 800
 600      DBIQ ImpAct Dollar Equity Volatility (Bid) Index S&P 500 (TR)
400       Index rebased to 1000 on (12/17/1999)
200       iBoxx USD Treasury TR Index rebased to 1000 on (12/17/1999)
  0
      Dec- Dec- Dec- Dec- Dec- Dec- Dec- Dec- Dec- Dec-
      1999 2000 2001 2002 2003 2004 2005 2006 2007 2008

Cumulative Excess Index vs iBoxx USD Treasury TR Index

1300  Relative to iBoxx USD Treasury TR Index rebased to 1000
1200
1100
1000
 900
 800
 700
 600
     Dec- Dec- Dec- Dec- Dec- Dec- Dec- Dec- Dec- Dec-
     1999 2000 2001 2002 2003 2004 2005 2006 2007 2008

Historical Performance Through February 2009

                                                          1 Month    3 Months   6 Months      YTD
DBIQ ImpAct Dollar Equity Volatility
(Bid) Index                                                  0.9%        2.2%     -25.9%     0.9%
S&P 500 (TR) Index                                         -10.6%      -17.3%     -41.8%   -18.2%
iBoxx USD Treasury TR Index                                 -0.6%       -0.2%       5.8%    -4.3%
Excess Return vs S&P 500 (TR) Index                         11.5%       19.5%      16.0%    19.1%
Excess Return vs iBoxx USD Treasury TR Index                 1.5%        2.5%     -31.6%     5.2%

                                                                    Annualised
                                                             1year      3 years     5 years
DBIQ ImpAct Dollar Equity Volatility
(Bid) Index                                                 -25.2%        -7.9%       -0.2%
S&P 500 (TR) Index                                          -43.4%       -15.1%       -6.6%
iBoxx USD Treasury TR Index                                   6.1%         7.3%        5.2%
Excess Return vs S&P 500 (TR) Index                          18.3%         7.2%        6.5%
Excess Return vs iBoxx USD Treasury TR Index                -31.2%       -15.3%       -5.3%

Performance Analysis December 1999 - February 2009


                                               Index      Bench 1     Bench 2
Growth over period                             27.2%      -39.2%       81.0%
Compounded annual growth                        2.6%       -5.3%        6.7%
Volatility                                      8.6%       21.5%        4.8%
Sharpe ratio (3.28%)                            0.31-       0.40        0.70
Maximum drawdown                              -32.8%      -50.9%       -4.8%
Start of max drawdown period               Feb-2007        Nov-2007        Jun-2003
End of max drawdown period                 Feb-2009        Feb-2009        Feb-2004
Average monthly growth                          0.3%       -0.3%        0.5%
Best monthly return                             3.5%        9.8%        5.5%
Worst monthly return                          -16.1%      -16.8%       -4.2%
% of months with gains                         72.1%       55.9%       69.4%
12 Month Correlation versus:
S&P 500 (TR) Index                             0.42        1.00       -0.45
iBoxx USD Treasury TR Index                   -0.20       -0.45        1.00

Index Facts

   Bloomberg
   ticker                                                  DBVEUSDB
   Reuters code                                           .DBVEUSDB
   Benchmark 1                                   S&P 500 (TR) Index
   Bloomberg ticker of Benchmark 1                       SPTR Index
   Benchmark 2                          iBoxx USD Treasury TR Index
   Bloomberg ticker of Benchmark 2                     ITRROV Index
   Index sponsor                                      Deutsche Bank
   Index Currency                                               USD

The DBIQ ImpAct Dollar Equity  Volatility (Bid) Index was launched on September 26, 2007 and has no
prior  operating  history.  All pro-forma  performance  data shown prior to the  inception  date is
simulated  and was  calculated  by  means of  retroactive  application  of the  Index  model.  Past
performance is no guarantee of future performance.

Source: Bloomberg or Deutsche Bank AG/London

                                                                                                 24
|
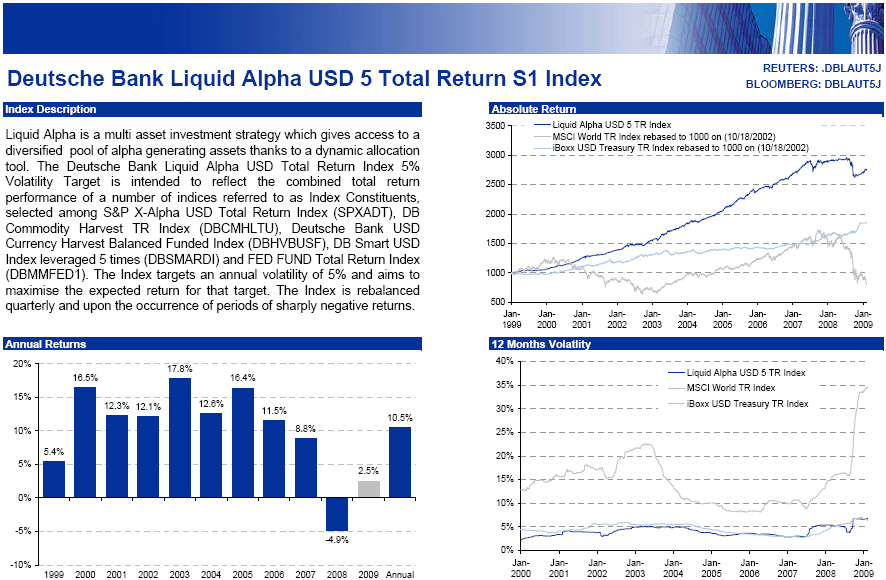 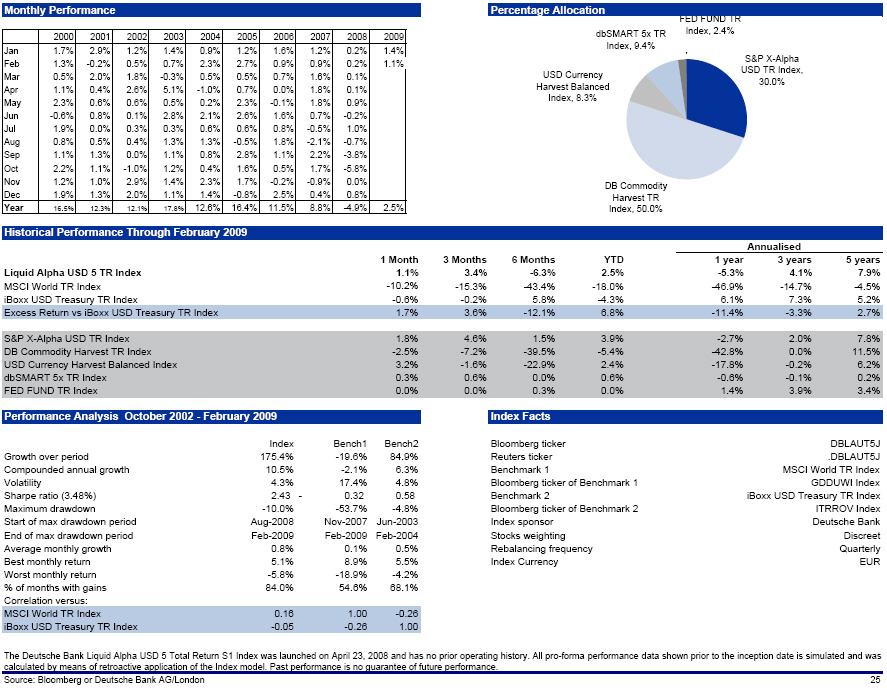 |
Deutsche Bank Liquid Alpha USD 5 Total Return S1 Index                           REUTERS: DBLAUT5J
                                                                                BLOOMBERG: DBLAUT5J

Index Description

Liquid Alpha is a multi asset investment strategy which gives access to a diversified pool of alpha
generating  assets thanks to a dynamic  allocation  tool.  The Deutsche Bank Liquid Alpha USD Total
Return Index 5% Volatility Target is intended to reflect the combined total return performance of a
number of indices  referred to as Index  Constituents,  selected among S&P X-Alpha USD Total Return
Index  (SPXADT),  DB Commodity  Harvest TR Index  (DBCMHLTU),  Deutsche  Bank USD Currency  Harvest
Balanced  Funded Index  (DBHVBUSF),  DB Smart USD Index  leveraged 5 times  (DBSMARDI) and FED FUND
Total Return Index  (DBMMFED1).  The Index targets an annual  volatility of 5% and aims to maximise
the expected return for that target.  The Index is rebalanced  quarterly and upon the occurrence of
periods of sharply negative returns.

Annual Returns

         20%                                  17.8%
       16.5%          16.4%
         15%
                             12.3% 12.1%  12.6%    11.5%
                                                                          10.5%
         10%                                             8.8%
                  5.4%
          5%
                                                                     2.5%
          0%
         -5%
                                                              -4.9%
        -10%
                 1999 2000 2001 2002 2003 2004 2005 2006 2007 2008  2009 Annual
Monthly Performance
        2000     2001    2002    2003   2004   2005    2006   2007    2008     2009
Jan     1.7%     2.9%    1.2%    1.4%   0.9%   1.2%    1.6%   1.2%    0.2%     1.4%
Feb     1.3%    -0.2%    0.5%    0.7%   2.3%   2.7%    0.9%   0.9%    0.2%     1.1%
Mar     0.5%     2.0%    1.8%   -0.3%   0.5%   0.5%    0.7%   1.6%    0.1%
Apr     1.1%     0.4%    2.6%    5.1%  -1.0%   0.7%    0.0%   1.8%    0.1%
May     2.3%     0.6%    0.6%    0.5%   0.2%   2.3%   -0.1%   1.8%    0.9%
Jun    -0.6%     0.8%    0.1%    2.8%   2.1%   2.6%    1.6%   0.7%   -0.2%
Jul     1.9%     0.0%    0.3%    0.3%   0.6%   0.6%    0.8%  -0.5%    1.0%
Aug     0.8%     0.5%    0.4%    1.3%   1.3%  -0.5%    1.8%  -2.1%   -0.7%
Sep     1.1%     1.3%    0.0%    1.1%   0.8%   2.8%    1.1%   2.2%   -3.8%
Oct     2.2%     1.1%   -1.0%    1.2%   0.4%   1.6%    0.5%   1.7%   -5.8%
Nov     1.2%     1.0%    2.9%    1.4%   2.3%   1.7%   -0.2%  -0.9%    0.0%
Dec     1.9%     1.3%    2.0%    1.1%   1.4%  -0.8%    2.5%   0.4%    0.8%
Year   16.5%    12.3%   12.1%   17.8%  12.6%  16.4%   11.5%   8.8%   -4.9%     2.5%

Absolute Return
3500      Liquid Alpha USD 5 TR Index
3000      MSCI World TR Index rebased to 1000 on (10/18/2002)
2500      iBoxx USD Treasury TR Index rebased to 1000 on (10/18/2002)
2000
1500
1000
 500
      Jan-   Jan- Jan- Jan- Jan- Jan- Jan- Jan- Jan-  Jan-   Jan-
      1999   2000 2001 2002 2003 2004 2005 2006 2007  2008   2009

12 Months Volatlity
40%          Liquid Alpha USD 5 TR Index
35%          MSCI World TR Index
30%          iBoxx USD Treasury TR Index
25%
20%
15%
10%
 5%
 0%
       Jan- Jan- Jan- Jan-  Jan-  Jan- Jan- Jan- Jan- Jan-
       2000 2001 2002 2003  2004  2005 2006 2007 2008 2009

Percentage Allocation
                         FED FUND TR
dbSMART 5x TR             Index, 2.4%
Index, 9.4%
                                                               S&P X-Alpha
                               USD Currency                    USD TR Index,
                             Harvest Balanced                  30.0%
                                Index, 8.3%

                               DB Commodity
                                Harvest TR
                               Index, 50.0%

Historical Performance Through February 2009

                                                          1 Month   3 Months    6 Months     YTD
Liquid Alpha USD 5 TR Index                                 1.1%        3.4%       -6.3%     2.5%
MSCI World TR Index                                       -10.2%      -15.3%      -43.4%   -18.0%
iBoxx USD Treasury TR Index                                -0.6%       -0.2%        5.8%    -4.3%
Excess Return vs iBoxx USD Treasury TR Index                1.7%        3.6%      -12.1%     6.8%
S&P X-Alpha USD TR Index                                    1.8%        4.6%        1.5%     3.9%
DB Commodity Harvest TR Index                              -2.5%       -7.2%      -39.5%    -5.4%
USD Currency Harvest Balanced Index                         3.2%       -1.6%      -22.9%     2.4%
dbSMART 5x TR Index                                         0.3%        0.6%        0.0%     0.6%
FED FUND TR Index                                           0.0%        0.0%        0.3%     0.0%

                                                                Annualised
                                                              1year        3 years     5 years
Liquid Alpha USD 5 TR Index                                    -5.3%          4.1%        7.9%
MSCI World TR Index                                           -46.9%        -14.7%       -4.5%
iBoxx USD Treasury TR Index                                     6.1%          7.3%        5.2%
Excess Return vs iBoxx USD Treasury TR Index                  -11.4%         -3.3%        2.7%
S&P X-Alpha USD TR Index                                       -2.7%          2.0%        7.8%
DB Commodity Harvest TR Index                                 -42.8%          0.0%       11.5%
USD Currency Harvest Balanced Index                           -17.8%         -0.2%        6.2%
dbSMART 5x TR Index                                            -0.6%         -0.1%        0.2%
FED FUND TR Index                                               1.4%          3.9%        3.4%

Performance Analysis October 2002 - February 2009
                                                             Index            Bench1      Bench2
Growth over period                                           175.4%            -19.6%       84.9%
Compounded annual growth                                      10.5%             -2.1%        6.3%
Volatility                                                     4.3%             17.4%        4.8%
Sharpe ratio (3.48%)                                        2.43 -              0.32        0.58
Maximum drawdown                                             -10.0%            -53.7%       -4.8%
Start of max drawdown period                                Aug-2008          Nov-2007     Jun-2003
End of max drawdown period                                  Feb-2009          Feb-2009     Feb-2004
Average monthly growth                                         0.8%              0.1%        0.5%
Best monthly return                                            5.1%              8.9%        5.5%
Worst monthly return                                          -5.8%            -18.9%       -4.2%
% of months with gains                                        84.0%             54.6%       68.1%
Correlation versus:
MSCI World TR Index                                           0.16              1.00       -0.26
iBoxx USD Treasury TR Index                                  -0.05             -0.26        1.00

Index Facts

Bloomberg ticker                                                                  DBLAUT5J
Reuters ticker                                                                   .DBLAUT5J
Benchmark 1                                                            MSCI World TR Index
Bloomberg ticker of Benchmark 1                                               GDDUWI Index
Benchmark 2                                                    iBoxx USD Treasury TR Index
Bloomberg ticker of Benchmark 2                                               ITRROV Index
Index sponsor                                                                Deutsche Bank
Stocks weighting                                                                  Discreet
Rebalancing frequency                                                            Quarterly
Index Currency                                                                         EUR

The  Deutsche  Bank Liquid Alpha USD 5 Total Return S1 Index was launched on April 23, 2008 and has
no prior operating  history.  All pro-forma  performance  data shown prior to the inception date is
simulated  and was  calculated  by  means of  retroactive  application  of the  Index  model.  Past
performance is no guarantee of future performance.

Source: Bloomberg or Deutsche Bank AG/London

                                                                                                 25
|
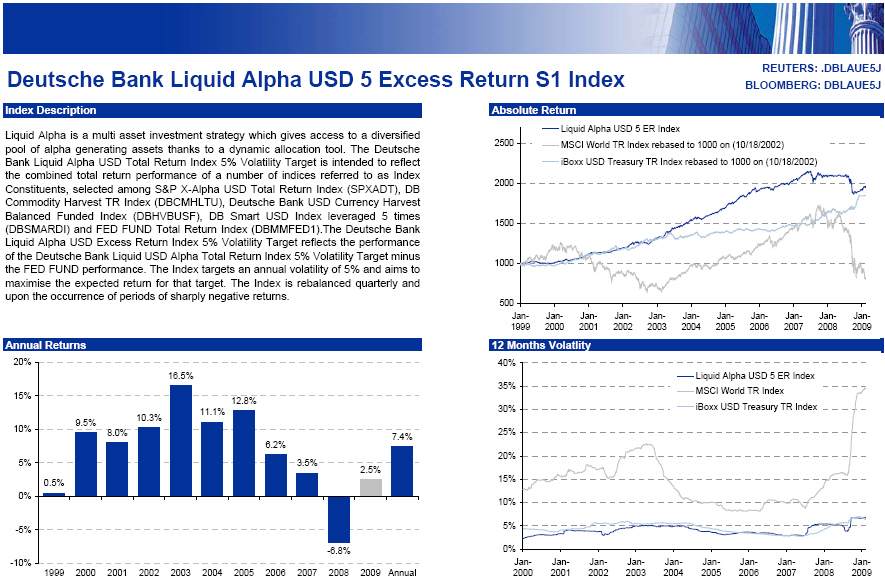 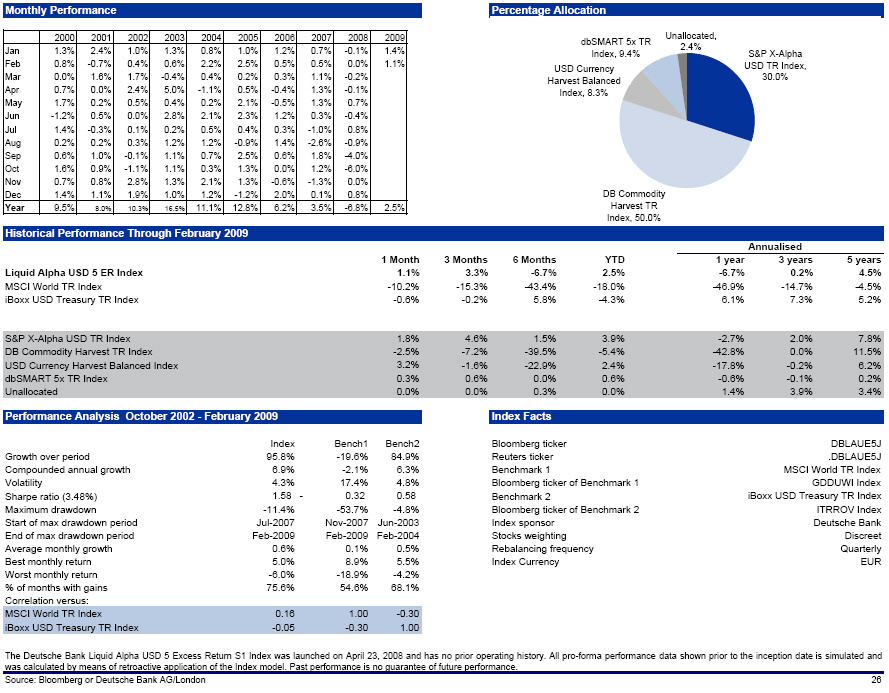 |
                                                                                 REUTERS: DBLAUE5J
Deutsche Bank Liquid Alpha USD 5 Excess Return S1 Index                        BLOOMBERG: DBLAUE5J

Index Description

Liquid Alpha is a multi asset investment strategy which gives access to a diversified pool of alpha
generating  assets thanks to a dynamic  allocation  tool.  The Deutsche Bank Liquid Alpha USD Total
Return Index 5% Volatility Target is intended to reflect the combined total return performance of a
number of indices  referred to as Index  Constituents,  selected among S&P X-Alpha USD Total Return
Index  (SPXADT),  DB Commodity  Harvest TR Index  (DBCMHLTU),  Deutsche  Bank USD Currency  Harvest
Balanced  Funded Index  (DBHVBUSF),  DB Smart USD Index  leveraged 5 times  (DBSMARDI) and FED FUND
Total Return Index (DBMMFED1).The  Deutsche Bank Liquid Alpha USD Excess Return Index 5% Volatility
Target  reflects  the  performance  of the  Deutsche  Bank Liquid USD Alpha Total  Return  Index 5%
Volatility Target minus the FED FUND performance.  The Index targets an annual volatility of 5% and
aims to maximise the expected  return for that target.  The Index is rebalanced  quarterly and upon
the occurrence of periods of sharply negative returns.

Annual Returns

  20%
                                    16.5%
  15%                                           12.8%
                             10.3%        11.1%
                9.5%
  10%                 8.0%                                                   7.4%
                                                     6.2%
   5%                                                     3.5%
                                                                       2.5%
          0.5%
   0%
  -5%
                                                                 -6.8%
 -10%
          1999  2000  2001   2002  2003  2004  2005  2006  2007  2008  2009  Annual

Monthly Performance
         2000   2001    2002    2003     2004     2005    2006    2007       2008         2009
Jan      1.3%   2.4%    1.0%    1.3%     0.8%     1.0%    1.2%    0.7%      -0.1%         1.4%
Feb      0.8%  -0.7%    0.4%    0.6%     2.2%     2.5%    0.5%    0.5%       0.0%         1.1%
Mar      0.0%   1.6%    1.7%   -0.4%     0.4%     0.2%    0.3%    1.1%      -0.2%
Apr      0.7%   0.0%    2.4%    5.0%    -1.1%     0.5%   -0.4%    1.3%      -0.1%
May      1.7%   0.2%    0.5%    0.4%     0.2%     2.1%   -0.5%    1.3%       0.7%
Jun     -1.2%   0.5%    0.0%    2.8%     2.1%     2.3%    1.2%    0.3%      -0.4%
Jul      1.4%  -0.3%    0.1%    0.2%     0.5%     0.4%    0.3%   -1.0%       0.8%
Aug      0.2%   0.2%    0.3%    1.2%     1.2%    -0.9%    1.4%   -2.6%      -0.9%
Sep      0.6%   1.0%   -0.1%    1.1%     0.7%     2.5%    0.6%    1.8%      -4.0%
Oct      1.6%   0.9%   -1.1%    1.1%     0.3%     1.3%    0.0%    1.2%      -6.0%
Nov      0.7%   0.8%    2.8%    1.3%     2.1%     1.3%   -0.6%   -1.3%       0.0%
Dec      1.4%   1.1%    1.9%    1.0%     1.2%    -1.2%    2.0%    0.1%       0.8%
Year     9.5%   8.0%   10.3%   16.5%    11.1%    12.8%    6.2%    3.5%      -6.8%         2.5%

Absolute Return

2500      Liquid Alpha USD 5 ER Index
2000      MSCI World TR Index rebased to 1000 on (10/18/2002)
1500      iBoxx USD Treasury TR Index rebased to 1000 on (10/18/2002)
1000
 500
       Jan-   Jan- Jan- Jan- Jan- Jan- Jan- Jan- Jan- Jan- Jan-
       1999   2000 2001 2002 2003 2004 2005 2006 2007 2008 2009

12 Months Volatlity
40%
35%        Liquid Alpha USD 5 ER Index
30%        MSCI World TR Index
25%        iBoxx USD Treasury TR Index
20%
15%
10%
 5%
 0%
         Jan- Jan- Jan-  Jan-   Jan-  Jan- Jan- Jan- Jan- Jan-
         2000 2001 2002  2003   2004  2005 2006 2007 2008 2009

Percentage Allocation
                                                              Unallocated,
         dbSMART 5x TR                    2.4%
          Index, 9.4%                                    S&P X-Alpha

           USD Currency                                  USD TR Index,
        Harvest Balanced                                    30.0%
          Index, 8.3%

          DB Commodity
           Harvest TR
          Index, 50.0%

Historical Performance Through February 2009

                                                    1 Month    3 Months    6 Months       YTD
Liquid Alpha USD 5 ER Index                            1.1%        3.3%       -6.7%      2.5%
MSCI World TR Index                                  -10.2%      -15.3%      -43.4%    -18.0%
iBoxx USD Treasury TR Index                           -0.6%       -0.2%        5.8%     -4.3%
S&P X-Alpha USD TR Index                               1.8%        4.6%        1.5%      3.9%
DB Commodity Harvest TR Index                         -2.5%       -7.2%      -39.5%     -5.4%
USD Currency Harvest Balanced Index                    3.2%       -1.6%      -22.9%      2.4%
dbSMART 5x TR Index                                    0.3%        0.6%        0.0%      0.6%
Unallocated                                            0.0%        0.0%        0.3%      0.0%

                                                                     Annualised
                                                      1year   3 years     5 years
Liquid Alpha USD 5 ER Index                           -6.7%      0.2%        4.5%
MSCI World TR Index                                  -46.9%    -14.7%       -4.5%
iBoxx USD Treasury TR Index                            6.1%      7.3%        5.2%
S&P X-Alpha USD TR Index                              -2.7%      2.0%        7.8%
DB Commodity Harvest TR Index                        -42.8%      0.0%       11.5%
USD Currency Harvest Balanced Index                  -17.8%     -0.2%        6.2%
dbSMART 5x TR Index                                   -0.6%     -0.1%        0.2%
Unallocated                                            1.4%      3.9%        3.4%

Performance Analysis October 2002 - February 2009
                                                            Index            Bench1        Bench2
Growth over period                                           95.8%            -19.6%         84.9%
Compounded annual growth                                      6.9%             -2.1%          6.3%
Volatility                                                    4.3%             17.4%          4.8%
Sharpe ratio (3.48%)                                       1.58 -              0.32          0.58
Maximum drawdown                                            -11.4%            -53.7%         -4.8%
Start of max drawdown period                              Jul-2007          Nov-2007       Jun-2003
End of max drawdown period                                Feb-2009          Feb-2009        Feb-2004
Average monthly growth                                        0.6%              0.1%          0.5%
Best monthly return                                           5.0%              8.9%          5.5%
Worst monthly return                                         -6.0%            -18.9%         -4.2%
% of months with gains                                       75.6%             54.6%         68.1%
Correlation versus:
MSCI World TR Index                                          0.16              1.00         -0.30
iBoxx USD Treasury TR Index                                 -0.05             -0.30          1.00

Index Facts

Bloomberg ticker                                                                        DBLAUE5J
Reuters ticker                                                                         .DBLAUE5J
Benchmark 1                                                                  MSCI World TR Index
Bloomberg ticker of Benchmark 1                                                     GDDUWI Index
Benchmark 2                                                          iBoxx USD Treasury TR Index
Bloomberg ticker of Benchmark 2                                                     ITRROV Index
Index sponsor                                                                      Deutsche Bank
Stocks weighting                                                                        Discreet
Rebalancing frequency                                                                  Quarterly
Index Currency                                                                               EUR

The Deutsche Bank Liquid Alpha USD 5 Excess Return S1 Index was launched on April 23, 2008 and
has no prior operating history. All pro-forma performance data shown prior to the inception
date is simulated and was calculated by means of retroactive application of the Index model.
Past performance is no guarantee of future performance.

Source: Bloomberg or Deutsche Bank AG/London

                                                                                                 26
|
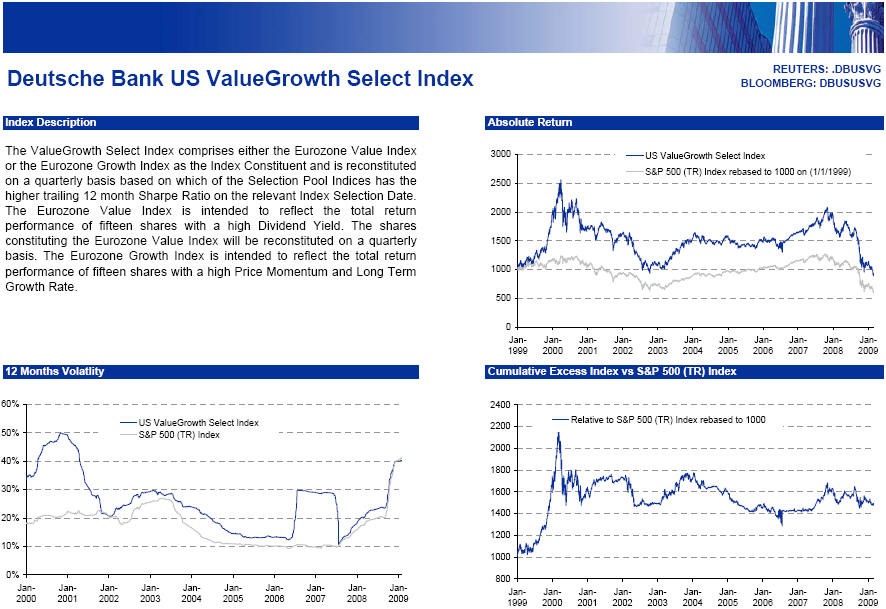 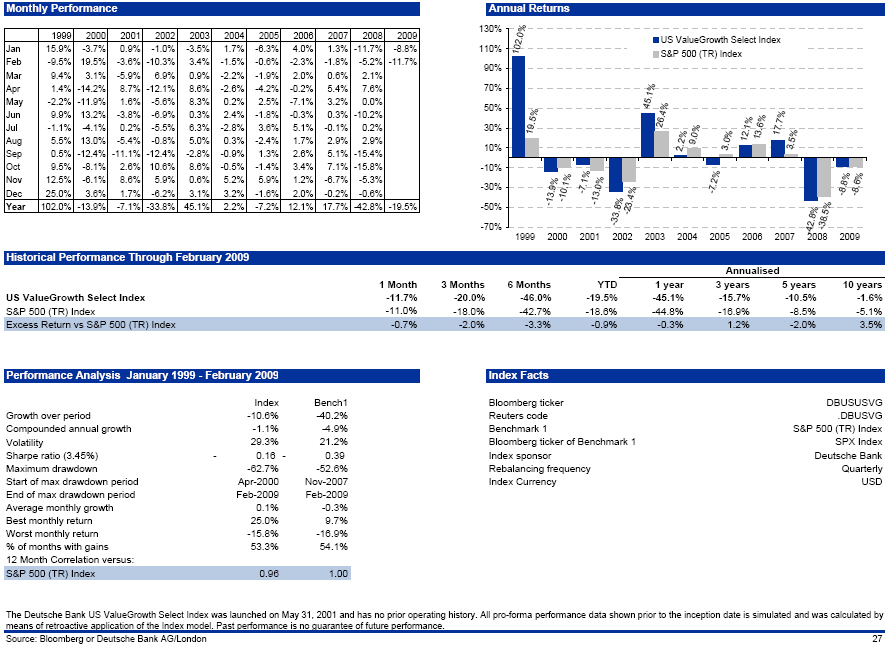 |
Deutsche Bank US ValueGrowth Select Index                                          REUTERS: .DBUSVG
                                                                                BLOOMBERG: DBUSUSVG

Index Description

The ValueGrowth Select Index comprises either the Eurozone Value Index or the Eurozone Growth Index
as the Index  Constituent and is reconstituted on a quarterly basis based on which of the Selection
Pool Indices has the higher  trailing 12 month Sharpe Ratio on the relevant Index  Selection  Date.
The Eurozone Value Index is intended to reflect the total return performance of fifteen shares with
a high Dividend Yield. The shares  constituting the Eurozone Value Index will be reconstituted on a
quarterly basis.  The Eurozone Growth Index is intended to reflect the total return  performance of
fifteen shares with a high Price Momentum and Long Term Growth Rate.

12 Months Volatlity
60%
50%      US ValueGrowth Select Index
40%      S&P 500 (TR) Index
30%
20%
10%
 0%
      Jan- Jan- Jan- Jan- Jan- Jan- Jan- Jan-    Jan-  Jan-
      2000 2001 2002 2003 2004 2005 2006 2007    2008  2009

Monthly Performance
          1999    2000    2001     2002     2003    2004   2005    2006    2007      2008      2009
Jan      15.9%   -3.7%    0.9%    -1.0%    -3.5%    1.7%  -6.3%    4.0%    1.3%    -11.7%     -8.8%
Feb      -9.5%   19.5%   -3.6%   -10.3%     3.4%   -1.5%  -0.6%   -2.3%   -1.8%     -5.2%    -11.7%
Mar       9.4%    3.1%   -5.9%     6.9%     0.9%   -2.2%  -1.9%    2.0%    0.6%      2.1%
Apr       1.4%  -14.2%    8.7%   -12.1%     8.6%   -2.6%  -4.2%   -0.2%    5.4%      7.6%
May      -2.2%  -11.9%    1.6%    -5.6%     8.3%    0.2%   2.5%   -7.1%    3.2%      0.0%
Jun       9.9%   13.2%   -3.8%    -6.9%     0.3%    2.4%  -1.8%   -0.3%    0.3%    -10.2%
Jul      -1.1%   -4.1%    0.2%    -5.5%     6.3%   -2.8%   3.6%    5.1%   -0.1%      0.2%
Aug       5.5%   13.0%   -5.4%    -0.8%     5.0%    0.3%  -2.4%    1.7%    2.9%      2.9%
Sep       0.5%  -12.4%  -11.1%   -12.4%    -2.8%   -0.9%   1.3%    2.6%    5.1%    -15.4%
Oct       9.5%   -8.1%    2.6%    10.6%     8.6%   -0.5%  -1.4%    3.4%    7.1%    -15.8%
Nov      12.5%   -6.1%    8.6%     5.9%     0.6%    5.2%   5.9%    1.2%   -6.7%     -5.3%
Dec      25.0%    3.6%    1.7%    -6.2%     3.1%    3.2%  -1.6%    2.0%   -0.2%     -0.6%
Year    102.0%  -13.9%   -7.1%   -33.8%    45.1%    2.2%  -7.2%   12.1%   17.7%    -42.8%    -19.5%

Absolute Return
3000             US ValueGrowth Select Index
2500             S&P 500 (TR) Index rebased to 1000 on (1/1/1999)
2000
1500
1000
 500
   0
         Jan- Jan- Jan-  Jan-  Jan- Jan- Jan- Jan- Jan- Jan- Jan-
         1999 2000 2001  2002  2003 2004 2005 2006 2007 2008 2009

Cumulative Excess Index vs S&P 500 (TR) Index
2400
2200  Relative to S&P 500 (TR) Index rebased to 1000
2000
1800
1600
1400
1200
1000
800
     Jan - Jan- Jan- Jan- Jan- Jan- Jan- Jan- Jan - Jan - Jan -
     1999 2000 2001 2002 2003 2004 2005 2006 2007 2008 2009

Annual Returns

     130%
     110%              US ValueGrowth Select Index
      90%
      70%              S&P 500 (TR) Index
      50%
      30%
      10%
     -10%
     -30%
     -50%
     -70%
                1999   2000   2001   2002    2003  2004  2005 2006   2007 2008 -2009

Historical Performance Through February 2009

                                                       1 Month    3 Months   6 Months         YTD
US ValueGrowth Select Index                             -11.7%      -20.0%     -46.0%      -19.5%
S&P 500 (TR) Index                                      -11.0%      -18.0%     -42.7%      -18.6%
Excess Return vs S&P 500 (TR) Index                      -0.7%       -2.0%      -3.3%       -0.9%

                                                               Annualised
                                                        1year    3 years  5 years    10 years
US ValueGrowth Select Index                            -45.1%     -15.7%   -10.5%      -1.6%
S&P 500 (TR) Index                                     -44.8%     -16.9%    -8.5%      -5.1%
Excess Return vs S&P 500 (TR) Index                     -0.3%       1.2%    -2.0%       3.5%


Performance Analysis January 1999 - February 2009
                                                             Index            Bench1
Growth over period                                           -10.6%            -40.2%
Compounded annual growth                                      -1.1%             -4.9%
Volatility                                                    29.3%             21.2%
Sharpe ratio (3.45%)                                        - 0.16-             0.39
Maximum drawdown                                             -62.7%            -52.6%
Start of max drawdown period                                Apr-2000          Nov-2007
End of max drawdown period                                  Feb-2009           Feb-2009
Average monthly growth                                         0.1%             -0.3%
Best monthly return                                           25.0%              9.7%
Worst monthly return                                         -15.8%            -16.9%
% of months with gains                                        53.3%             54.1%
12 Month Correlation versus:
S&P 500 (TR) Index                                            0.96              1.00

Index Facts

Bloomberg ticker                                                        DBUSUSVG
Reuters code                                                             .DBUSVG
Benchmark 1                                                   S&P 500 (TR) Index
Bloomberg ticker of Benchmark 1                                        SPX Index
Index sponsor                                                      Deutsche Bank
Rebalancing frequency                                                  Quarterly
Index Currency                                                               USD

The Deutsche Bank US ValueGrowth Select Index was launched on May 31, 2001 and has no prior
operating history. All pro-forma performance data shown prior to the inception date is
simulated and was calculated by means of retroactive application of the Index model. Past
performance is no guarantee of future performance.

Source: Bloomberg or Deutsche Bank AG/London

                                                                                                 27
|
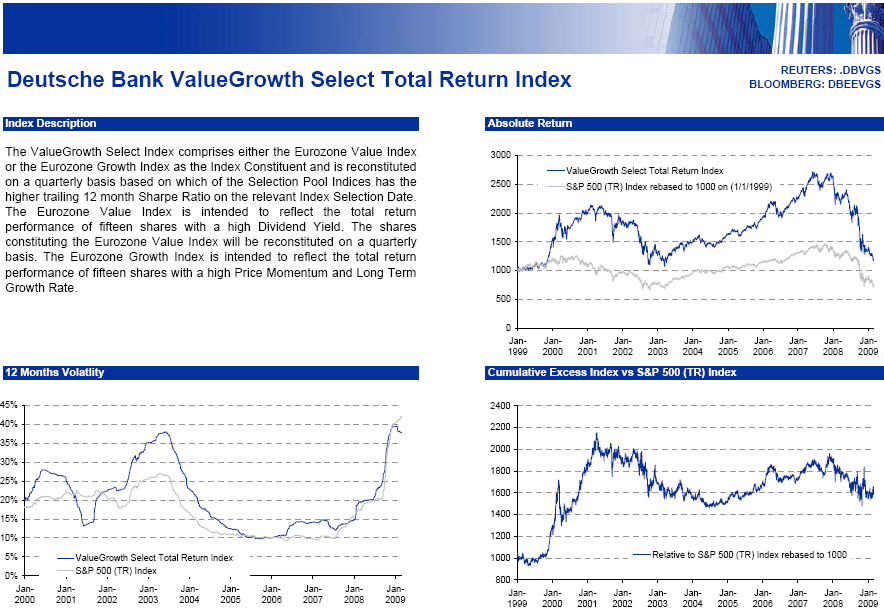 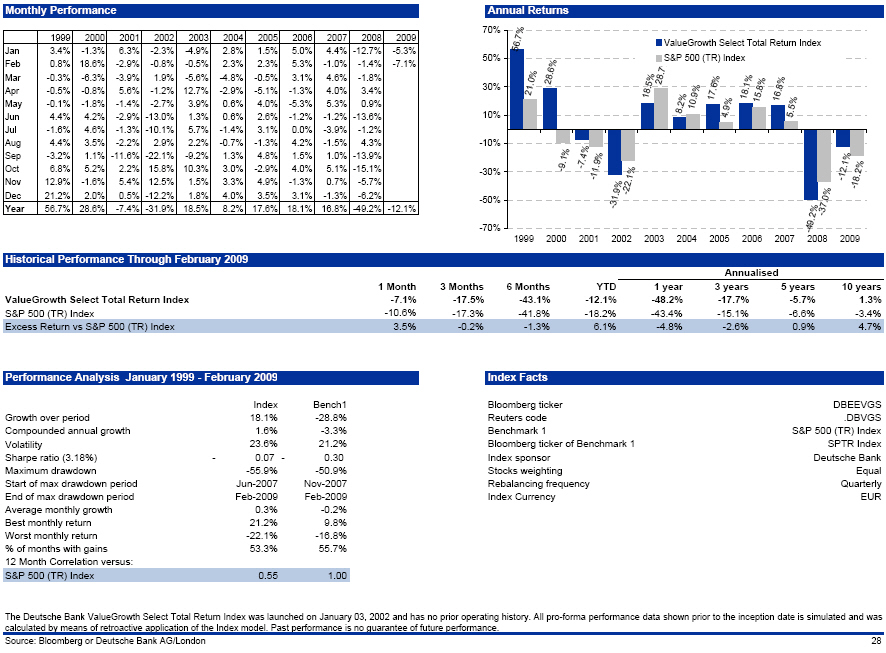 |
Deutsche Bank ValueGrowth Select Total Return Index                                 REUTERS: .DBVGS
                                                                                 BLOOMBERG: DBEEVGS

Index Description

The ValueGrowth Select Index comprises either the Eurozone Value Index or the Eurozone Growth Index
as the Index  Constituent and is reconstituted on a quarterly basis based on which of the Selection
Pool Indices has the higher  trailing 12 month Sharpe Ratio on the relevant Index  Selection  Date.
The Eurozone Value Index is intended to reflect the total return performance of fifteen shares with
a high Dividend Yield. The shares  constituting the Eurozone Value Index will be reconstituted on a
quarterly basis.  The Eurozone Growth Index is intended to reflect the total return  performance of
fifteen shares with a high Price Momentum and Long Term Growth Rate.

12 Months Volatlity
45%
40%
35%
30%
25%
20%
15%
10%
 5%              ValueGrowth Select Total Return Index
 0%              S&P 500 (TR) Index
      Jan-  Jan- Jan- Jan- Jan- Jan-   Jan-  Jan-  Jan-   Jan-
      2000  2001 2002 2003 2004 2005   2006  2007  2008   2009

Monthly Performance
         1999    2000     2001     2002    2003   2004    2005   2006     2007    2008     2009
Jan      3.4%   -1.3%     6.3%    -2.3%   -4.9%   2.8%    1.5%   5.0%     4.4%  -12.7%    -5.3%
Feb      0.8%   18.6%    -2.9%    -0.8%   -0.5%   2.3%    2.3%   5.3%    -1.0%   -1.4%    -7.1%
Mar     -0.3%   -6.3%    -3.9%     1.9%   -5.6%  -4.8%   -0.5%   3.1%     4.6%   -1.8%
Apr     -0.5%   -0.8%     5.6%    -1.2%   12.7%  -2.9%   -5.1%  -1.3%     4.0%    3.4%
May     -0.1%   -1.8%    -1.4%    -2.7%    3.9%   0.6%    4.0%  -5.3%     5.3%    0.9%
Jun      4.4%    4.2%    -2.9%   -13.0%    1.3%   0.6%    2.6%  -1.2%    -1.2%  -13.6%
Jul     -1.6%    4.6%    -1.3%   -10.1%    5.7%  -1.4%    3.1%   0.0%    -3.9%   -1.2%
Aug      4.4%    3.5%    -2.2%     2.9%    2.2%  -0.7%   -1.3%   4.2%    -1.5%    4.3%
Sep     -3.2%    1.1%   -11.6%   -22.1%   -9.2%   1.3%    4.8%   1.5%     1.0%  -13.9%
Oct      6.8%    5.2%     2.2%    15.8%   10.3%   3.0%   -2.9%   4.0%     5.1%  -15.1%
Nov     12.9%   -1.6%     5.4%    12.5%    1.5%   3.3%    4.9%  -1.3%     0.7%   -5.7%
Dec     21.2%    2.0%     0.5%   -12.2%    1.8%   4.0%    3.5%   3.1%    -1.3%   -6.2%
Year    56.7%   28.6%    -7.4%   -31.9%   18.5%   8.2%   17.6%  18.1%    16.8%  -49.2%   -12.1%

Absolute Return
3000
                                                             ValueGrowth Select Total Return Index
2500                                              S&P 500 (TR) Index rebased to 1000 on (1/1/1999)
2000
1500
1000
 500
   0
         Jan-   Jan- Jan- Jan- Jan- Jan- Jan- Jan-   Jan-   Jan-   Jan-
         1999   2000 2001 2002 2003 2004 2005 2006   2007   2008   2009

Cumulative Excess Index vs S&P 500 (TR) Index
2400
2200
2000
1800
1600
1400
1200
1000 Relative to S&P 500 (TR) Index rebased to 1000
800
     Jan - Jan- Jan - Jan- Jan- Jan- Jan- Jan- Jan- Jan- Jan -
     1999 2000 2001 2002 2003 2004 2005 2006 2007 2008 2009

Annual Returns
 70%
                             ValueGrowth Select Total Return Index
 50%                         S&P 500 (TR) Index
 30%
 10%
- -10%
- -30%
- -50%
- -70%
           1999   2000   2001  2002  2003 2004  2005  2006 2007  2008  2009

Historical Performance Through February 2009

                                                       1 Month   3 Months    6 Months       YTD
ValueGrowth Select Total Return Index                    -7.1%      -17.5%      -43.1%   -12.1%
S&P 500 (TR) Index                                      -10.6%      -17.3%      -41.8%   -18.2%
Excess Return vs S&P 500 (TR) Index                       3.5%       -0.2%       -1.3%     6.1%

                                                          Annualised
                                                       1year   3 years   5 years     10 years
ValueGrowth Select Total Return Index                 -48.2%    -17.7%    -5.7%        1.3%
S&P 500 (TR) Index                                    -43.4%    -15.1%    -6.6%       -3.4%
Excess Return vs S&P 500 (TR) Index                    -4.8%     -2.6%     0.9%        4.7%

Performance Analysis January 1999 - February 2009
                                                                Index            Bench1
Growth over period                                               18.1%            -28.8%
Compounded annual growth                                          1.6%             -3.3%
Volatility                                                       23.6%             21.2%
Sharpe ratio (3.18%)                                           - 0.07-             0.30
Maximum drawdown                                                -55.9%            -50.9%
Start of max drawdown period                                    Jun-2007        Nov-2007
End of max drawdown period                                      Feb-2009        Feb-2009
Average monthly growth                                            0.3%             -0.2%
Best monthly return                                              21.2%              9.8%
Worst monthly return                                            -22.1%            -16.8%
% of months with gains                                           53.3%             55.7%
12 Month Correlation versus:
S&P 500 (TR) Index                                               0.55              1.00

Index Facts

Bloomberg ticker                                                           DBEEVGS
Reuters code                                                                .DBVGS
Benchmark 1                                                     S&P 500 (TR) Index
Bloomberg ticker of Benchmark 1                                         SPTR Index
Index sponsor                                                        Deutsche Bank
Stocks weighting                                                             Equal
Rebalancing frequency                                                    Quarterly
Index Currency                                                                 EUR

The Deutsche Bank ValueGrowth Select Total Return Index was launched on January 03, 2002 and
has no prior operating history. All pro-forma performance data shown prior to the inception
date is simulated and was calculated by means of retroactive application of the Index model.
Past performance is no guarantee of future performance.

Source: Bloomberg or Deutsche Bank AG/London

                                                                                                 28
|
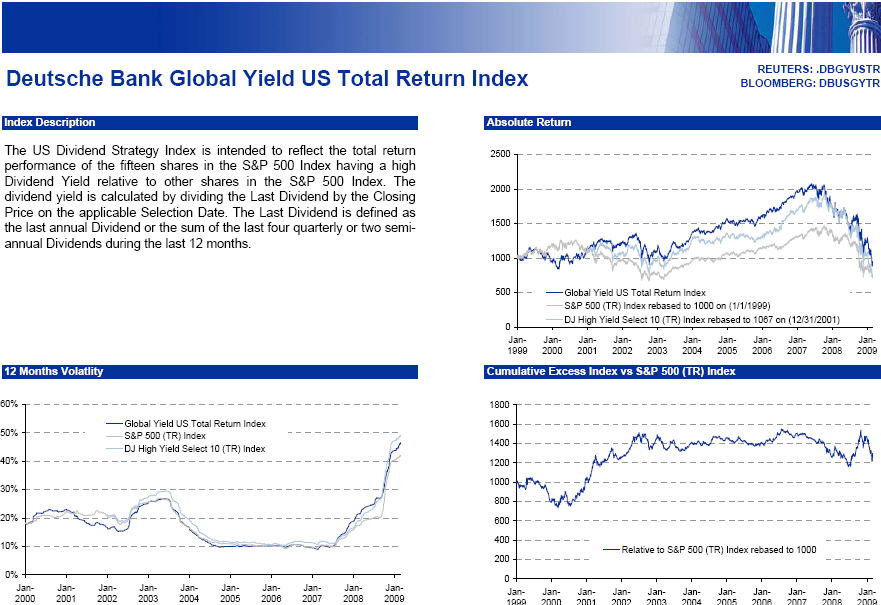 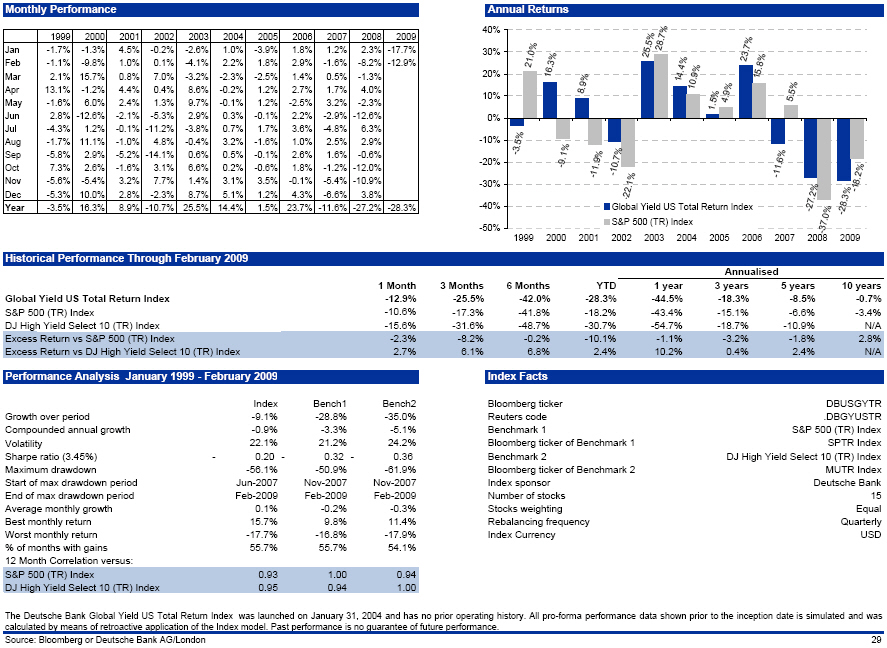 |
Deutsche Bank Global Yield US Total Return Index                                REUTERS: .DBGYUSTR
                                                                                BLOOMBERG: DBUSGYTR

Index Description

The US Dividend  Strategy Index is intended to reflect the total return  performance of the fifteen
shares in the S&P 500 Index having a high  Dividend  Yield  relative to other shares in the S&P 500
Index.  The dividend  yield is calculated by dividing the Last Dividend by the Closing Price on the
applicable  Selection  Date. The Last Dividend is defined as the last annual Dividend or the sum of
the last four quarterly or two semi-annual Dividends during the last 12 months.

12 Months Volatlity
60%
                              Global Yield US Total Return Index
50%                           S&P 500 (TR) Index
                              DJ High Yield Select 10 (TR) Index
40%
30%
20%
10%
 0%
      Jan- Jan- Jan- Jan- Jan- Jan- Jan-   Jan-    Jan-    Jan-
      2000 2001 2002 2003 2004 2005 2006   2007    2008    2009

Monthly Performance
         1999   2000   2001   2002     2003   2004    2005    2006    2007     2008     2009
Jan     -1.7%  -1.3%   4.5%  -0.2%    -2.6%   1.0%   -3.9%    1.8%    1.2%     2.3%   -17.7%
Feb     -1.1%  -9.8%   1.0%   0.1%    -4.1%   2.2%    1.8%    2.9%   -1.6%    -8.2%   -12.9%
Mar      2.1%  15.7%   0.8%   7.0%    -3.2%  -2.3%   -2.5%    1.4%    0.5%    -1.3%
Apr     13.1%  -1.2%   4.4%   0.4%     8.6%  -0.2%    1.2%    2.7%    1.7%     4.0%
May     -1.6%   6.0%   2.4%   1.3%     9.7%  -0.1%    1.2%   -2.5%    3.2%    -2.3%
Jun      2.8% -12.6%  -2.1%  -5.3%     2.9%   0.3%   -0.1%    2.2%   -2.9%   -12.6%
Jul     -4.3%   1.2%  -0.1% -11.2%    -3.8%   0.7%    1.7%    3.6%   -4.8%     6.3%
Aug     -1.7%  11.1%  -1.0%   4.8%    -0.4%   3.2%   -1.6%    1.0%    2.5%     2.9%
Sep     -5.8%   2.9%  -5.2% -14.1%     0.6%   0.5%   -0.1%    2.6%    1.6%    -0.6%
Oct      7.3%   2.6%  -1.6%   3.1%     6.6%   0.2%   -0.6%    1.8%   -1.2%   -12.0%
Nov     -5.6%  -5.4%   3.2%   7.7%     1.4%   3.1%    3.5%   -0.1%   -5.4%   -10.9%
Dec     -5.3%  10.0%   2.8%  -2.3%     8.7%   5.1%    1.2%    4.3%   -6.6%     3.8%
Year    -3.5%  16.3%   8.9% -10.7%    25.5%  14.4%    1.5%   23.7%  -11.6%   -27.2%   -28.3%

Absolute Return
2500
2000
1500
1000
 500      Global Yield US Total Return Index
          S&P 500 (TR) Index rebased to 1000 on (1/1/1999)
          DJ High Yield Select 10 (TR) Index rebased to 1067 on (12/31/2001)
   0
        Jan-  Jan- Jan- Jan- Jan- Jan- Jan- Jan- Jan- Jan-   Jan-
        1999  2000 2001 2002 2003 2004 2005 2006 2007 2008   2009

Cumulative Excess Index vs S&P 500 (TR) Index
1800
1600
1400
1200
1000
800
600
400   Relative to S&P 500 (TR) Index rebased to 1000
200
0
Jan - Jan- Jan- Jan- Jan- Jan- Jan- Jan- Jan- Jan- Jan -
1999 2000 2001 2002 2003 2004 2005 2006 2007 2008 2009

Annual Returns
     40%
     30%
     20%
     10%
      0%
    -10%
    -30%
    -40%                                            Global Yield US Total Return Index
                                                                 S&P 500 (TR) Index
    -50%

           1999  2000  2001  2002 2003 2004 2005   2006 2007   2008  2009

Historical Performance Through February 2009

                                                          1 Month    3 Months   6 Months      YTD
Global Yield US Total Return Index                         -12.9%      -25.5%     -42.0%    -28.3%
S&P 500 (TR) Index                                         -10.6%      -17.3%     -41.8%    -18.2%
DJ High Yield Select 10 (TR) Index                         -15.6%      -31.6%     -48.7%    -30.7%
Excess Return vs S&P 500 (TR) Index                         -2.3%       -8.2%      -0.2%    -10.1%
Excess Return vs DJ High Yield Select 10 (TR) Index          2.7%        6.1%       6.8%      2.4%

                                                                        Annualised
                                                            1year   3 years   5 years   10 years
Global Yield US Total Return Index                          -44.5%   -18.3%     -8.5%      -0.7%
S&P 500 (TR) Index                                          -43.4%   -15.1%     -6.6%      -3.4%
DJ High Yield Select 10 (TR) Index                          -54.7%   -18.7%    -10.9%       N/A
Excess Return vs S&P 500 (TR) Index                          -1.1%    -3.2%     -1.8%       2.8%
Excess Return vs DJ High Yield Select 10 (TR) Index          10.2%     0.4%      2.4%       N/A

Performance Analysis January 1999 - February 2009
                                                     Index            Bench1          Bench2
Growth over period                                    -9.1%           -28.8%          -35.0%
Compounded annual growth                              -0.9%            -3.3%           -5.1%
Volatility                                            22.1%            21.2%           24.2%
Sharpe ratio (3.45%)                                - 0.20-          0.32 -            0.36
Maximum drawdown                                      -56.1%           -50.9%          -61.9%
Start of max drawdown period                        Jun-2007          Nov-2007        Nov-2007
End of max drawdown period                          Feb-2009          Feb-2009        Feb-2009
Average monthly growth                                 0.1%            -0.2%           -0.3%
Best monthly return                                   15.7%             9.8%           11.4%
Worst monthly return                                 -17.7%           -16.8%          -17.9%
% of months with gains                                55.7%            55.7%           54.1%
12 Month Correlation versus:
S&P 500 (TR) Index                                    0.93             1.00            0.94
DJ High Yield Select 10 (TR) Index                    0.95             0.94            1.00

Index Facts

Bloomberg ticker                                                                DBUSGYTR
Reuters code                                                                   .DBGYUSTR
Benchmark 1                                                           S&P 500 (TR) Index
Bloomberg ticker of Benchmark 1                                               SPTR Index
Benchmark 2                                           DJ High Yield Select 10 (TR) Index
Bloomberg ticker of Benchmark 2                                               MUTR Index
Index sponsor                                                              Deutsche Bank
Number of stocks                                                                      15
Stocks weighting                                                                   Equal
Rebalancing frequency                                                          Quarterly
Index Currency                                                                       USD

The Deutsche Bank Global Yield US Total Return Index was launched on January 31, 2004 and has
no prior operating history. All pro-forma performance data shown prior to the inception date is
simulated and was calculated by means of retroactive application of the Index model. Past
performance is no guarantee of future performance.

Source: Bloomberg or Deutsche Bank AG/London

                                                                                                 29
|
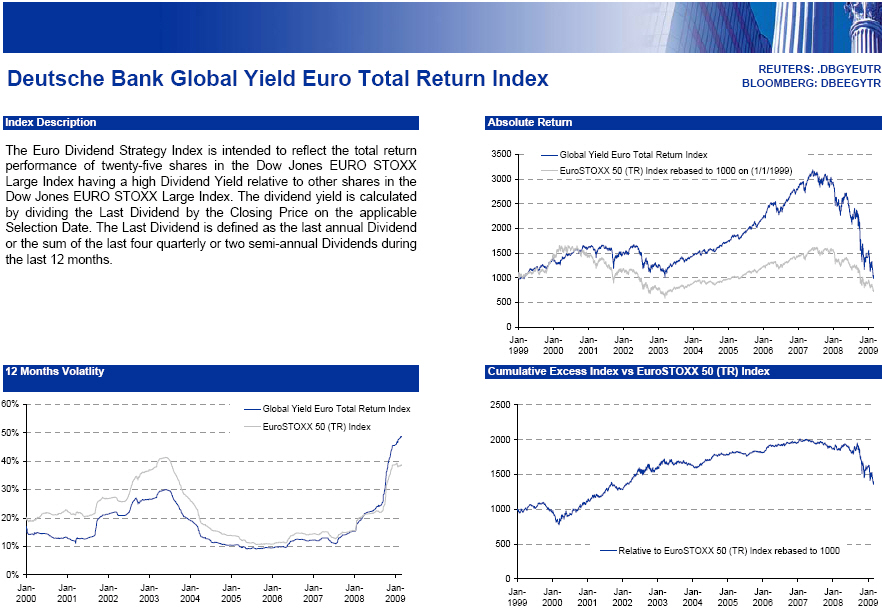 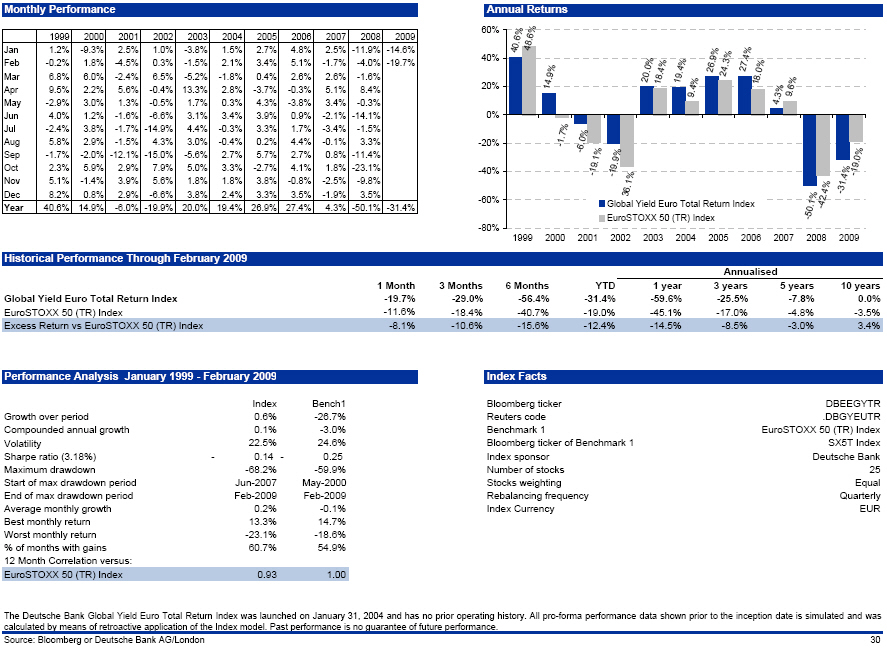 |
Deutsche Bank Global Yield Euro Total Return Index                              REUTERS: .DBGYEUTR
                                                                                BLOOMBERG: DBEEGYTR

Index Description

The Euro Dividend Strategy Index is intended to reflect the total return performance of twenty-five
shares in the Dow Jones EURO STOXX  Large  Index  having a high  Dividend  Yield  relative to other
shares in the Dow Jones EURO STOXX Large Index.  The dividend  yield is  calculated by dividing the
Last Dividend by the Closing Price on the applicable  Selection  Date. The Last Dividend is defined
as the last annual  Dividend or the sum of the last four  quarterly  or two  semi-annual  Dividends
during the last 12 months.

12 Months Volatlity
 60%                                        Global Yield Euro Total Return Index
 50%                                        EuroSTOXX 50 (TR) Index
 40%
 30%
 20%
 10%
  0%
       Jan- Jan- Jan-  Jan-   Jan-  Jan-   Jan- Jan- Jan- Jan-
       2000 2001 2002  2003   2004  2005   2006 2007 2008 2009

Monthly Performance
           1999   2000     2001    2002   2003   2004    2005    2006    2007     2008      2009
Jan        1.2%  -9.3%     2.5%    1.0%  -3.8%   1.5%    2.7%    4.8%    2.5%   -11.9%    -14.6%
Feb       -0.2%   1.8%    -4.5%    0.3%  -1.5%   2.1%    3.4%    5.1%   -1.7%    -4.0%    -19.7%
Mar        6.8%   6.0%    -2.4%    6.5%  -5.2%  -1.8%    0.4%    2.6%    2.6%    -1.6%
Apr        9.5%   2.2%     5.6%   -0.4%  13.3%   2.8%   -3.7%   -0.3%    5.1%     8.4%
May       -2.9%   3.0%     1.3%   -0.5%   1.7%   0.3%    4.3%   -3.8%    3.4%    -0.3%
Jun        4.0%   1.2%    -1.6%   -6.6%   3.1%   3.4%    3.9%    0.9%   -2.1%   -14.1%
Jul       -2.4%   3.8%    -1.7%  -14.9%   4.4%  -0.3%    3.3%    1.7%   -3.4%    -1.5%
Aug        5.8%   2.9%    -1.5%    4.3%   3.0%  -0.4%    0.2%    4.4%   -0.1%     3.3%
Sep       -1.7%  -2.0%   -12.1%  -15.0%  -5.6%   2.7%    5.7%    2.7%    0.8%   -11.4%
Oct        2.3%   5.9%     2.9%    7.9%   5.0%   3.3%   -2.7%    4.1%    1.8%   -23.1%
Nov        5.1%  -1.4%     3.9%    5.6%   1.8%   1.8%    3.8%   -0.8%   -2.5%    -9.8%
Dec        8.2%   0.8%     2.9%   -6.6%   3.8%   2.4%    3.3%    3.5%   -1.9%     3.5%
Year      40.6%  14.9%    -6.0%  -19.9%  20.0%  19.4%   26.9%   27.4%    4.3%   -50.1%    -31.4%


Historical Performance Through February 2009

                                                    1 Month     3 Months   6 Months       YTD
Global Yield Euro Total Return Index                 -19.7%      -29.0%     -56.4%      -31.4%
EuroSTOXX 50 (TR) Index                              -11.6%      -18.4%     -40.7%      -19.0%
Excess Return vs EuroSTOXX 50 (TR) Index              -8.1%      -10.6%     -15.6%      -12.4%

                                                                       Annualised
                                                      1year   3 years   5 years    10 years
Global Yield Euro Total Return Index                 -59.6%   -25.5%    -7.8%        0.0%
EuroSTOXX 50 (TR) Index                              -45.1%   -17.0%    -4.8%       -3.5%
Excess Return vs EuroSTOXX 50 (TR) Index             -14.5%    -8.5%    -3.0%        3.4%


Performance Analysis January 1999 - February 2009
                                                                  Index               Bench1
Growth over period                                                  0.6%               -26.7%
Compounded annual growth                                            0.1%                -3.0%
Volatility                                                         22.5%                24.6%
Sharpe ratio (3.18%)                                             - 0.14-                0.25
Maximum drawdown                                                  -68.2%               -59.9%
Start of max drawdown period                                    Jun-2007             May-2000
End of max drawdown period                                      Feb-2009             Feb-2009
Average monthly growth                                              0.2%                -0.1%
Best monthly return                                                13.3%                14.7%
Worst monthly return                                              -23.1%               -18.6%
% of months with gains                                             60.7%                54.9%
12 Month Correlation versus:
EuroSTOXX 50 (TR) Index                                            0.93                 1.00

Index Facts

Bloomberg ticker                                                              DBEEGYTR
Reuters code                                                                 .DBGYEUTR
Benchmark 1                                                    EuroSTOXX 50 (TR) Index
Bloomberg ticker of Benchmark 1                                             SX5T Index
Index sponsor                                                            Deutsche Bank
Number of stocks                                                                    25
Stocks weighting                                                                 Equal
Rebalancing frequency                                                        Quarterly
Index Currency                                                                     EUR

The Deutsche Bank Global Yield Euro Total Return Index was launched on January 31, 2004 and has
no prior operating history. All pro-forma performance data shown prior to the inception date is
simulated and was calculated by means of retroactive application of the Index model. Past
performance is no guarantee of future performance.

Source: Bloomberg or Deutsche Bank AG/London

                                                                                                 30
|
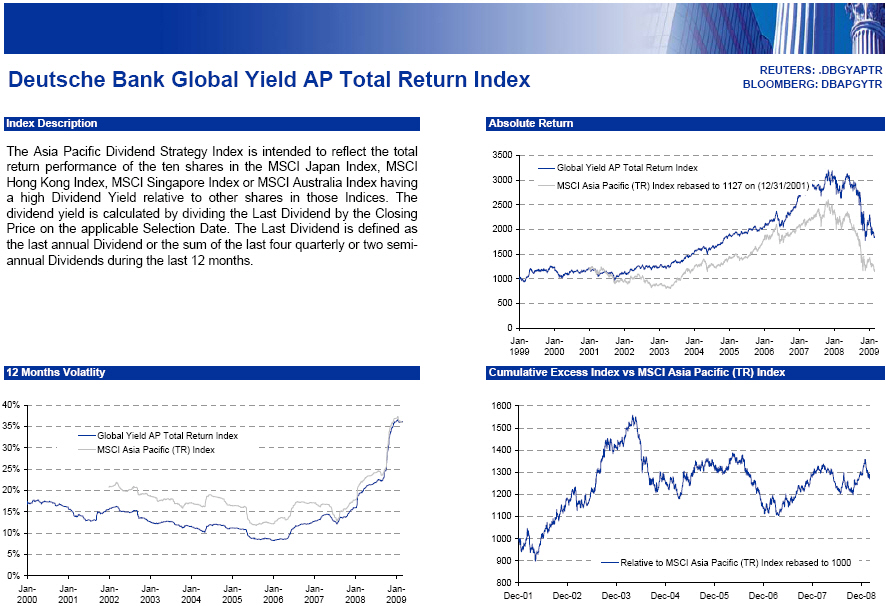 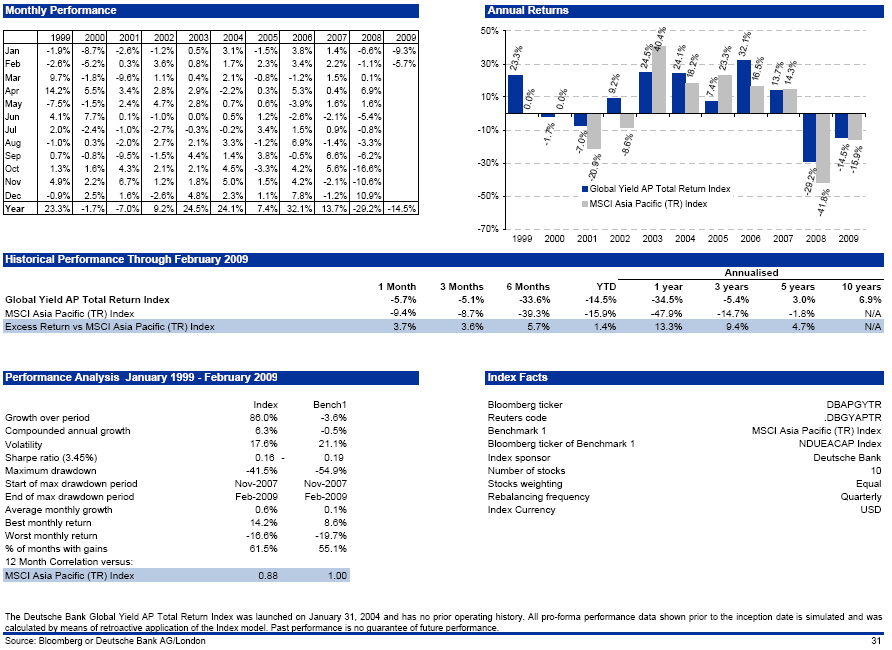 |
Deutsche Bank Global Yield AP Total Return Index                                REUTERS: .DBGYAPTR
                                                                                BLOOMBERG: DBAPGYTR

Index Description

The Asia Pacific Dividend Strategy Index is intended to reflect the total return performance of the
ten shares in the MSCI Japan Index,  MSCI Hong Kong Index,  MSCI Singapore  Index or MSCI Australia
Index having a high Dividend Yield relative to other shares in those Indices. The dividend yield is
calculated by dividing the Last Dividend by the Closing Price on the applicable Selection Date. The
Last Dividend is defined as the last annual  Dividend or the sum of the last four  quarterly or two
semi-annual Dividends during the last 12 months.

Monthly Performance
          1999    2000    2001    2002    2003    2004   2005     2006    2007     2008        2009
Jan      -1.9%   -8.7%   -2.6%   -1.2%    0.5%    3.1%  -1.5%     3.8%    1.4%    -6.6%       -9.3%
Feb      -2.6%   -5.2%    0.3%    3.6%    0.8%    1.7%   2.3%     3.4%    2.2%    -1.1%       -5.7%
Mar       9.7%   -1.8%   -9.6%    1.1%    0.4%    2.1%  -0.8%    -1.2%    1.5%     0.1%
Apr      14.2%    5.5%    3.4%    2.8%    2.9%   -2.2%   0.3%     5.3%    0.4%     6.9%
May      -7.5%   -1.5%    2.4%    4.7%    2.8%    0.7%   0.6%    -3.9%    1.6%     1.6%
Jun       4.1%    7.7%    0.1%   -1.0%    0.0%    0.5%   1.2%    -2.6%   -2.1%    -5.4%
Jul       2.0%   -2.4%   -1.0%   -2.7%   -0.3%   -0.2%   3.4%     1.5%    0.9%    -0.8%
Aug      -1.0%    0.3%   -2.0%    2.7%    2.1%    3.3%  -1.2%     6.9%   -1.4%    -3.3%
Sep       0.7%   -0.8%   -9.5%   -1.5%    4.4%    1.4%   3.8%    -0.5%    6.6%    -6.2%
Oct       1.3%    1.6%    4.3%    2.1%    2.1%    4.5%  -3.3%     4.2%    5.6%   -16.6%
Nov       4.9%    2.2%    6.7%    1.2%    1.8%    5.0%   1.5%     4.2%   -2.1%   -10.6%
Dec      -0.9%    2.5%    1.6%   -2.6%    4.8%    2.3%   1.1%     7.8%   -1.2%    10.9%
Year     23.3%   -1.7%   -7.0%    9.2%   24.5%   24.1%   7.4%    32.1%   13.7%   -29.2%      -14.5%


Historical Performance Through February 2009

                                                       1 Month  3 Months    6 Months      YTD
Global Yield AP Total Return Index                     -5.7%       -5.1%     -33.6%    -14.5%
MSCI Asia Pacific (TR) Index                           -9.4%       -8.7%     -39.3%    -15.9%
Excess Return vs MSCI Asia Pacific (TR) Index           3.7%        3.6%       5.7%      1.4%

                                                               Annualised
                                                        1year   3 years   5 years     10 years
Global Yield AP Total Return Index                     -34.5%     -5.4%     3.0%        6.9%
MSCI Asia Pacific (TR) Index                           -47.9%    -14.7%    -1.8%        N/A
Excess Return vs MSCI Asia Pacific (TR) Index           13.3%      9.4%     4.7%        N/A

Performance Analysis January 1999 - February 2009
                                                            Index                  Bench1
Growth over period                                           86.0%                   -3.6%
Compounded annual growth                                      6.3%                   -0.5%
Volatility                                                   17.6%                   21.1%
Sharpe ratio (3.45%)                                       0.16 -                    0.19
Maximum drawdown                                            -41.5%                  -54.9%
Start of max drawdown period                        Nov     -2007            Nov    -2007
End of max drawdown period                          Feb     -2009            Feb    -2009
Average monthly growth                                        0.6%                    0.1%
Best monthly return                                          14.2%                    8.6%
Worst monthly return                                        -16.6%                  -19.7%
% of months with gains                                       61.5%                   55.1%
12 Month Correlation versus:
MSCI Asia Pacific (TR) Index                                 0.88                    1.00

Index Facts

Bloomberg ticker                                                           DBAPGYTR
Reuters code                                                              .DBGYAPTR
Benchmark 1                                            MSCI Asia Pacific (TR) Index
Bloomberg ticker of Benchmark 1                                      NDUEACAP Index
Index sponsor                                                         Deutsche Bank
Number of stocks                                                                 10
Stocks weighting                                                              Equal
Rebalancing frequency                                                     Quarterly
Index Currency                                                                  USD

The Deutsche Bank Global Yield AP Total Return Index was launched on January 31, 2004 and has
no prior operating history. All pro-forma performance data shown prior to the inception date is
simulated and was calculated by means of retroactive application of the Index model. Past
performance is no guarantee of future performance.

Source: Bloomberg or Deutsche Bank AG/London

                                                                                                 31
|
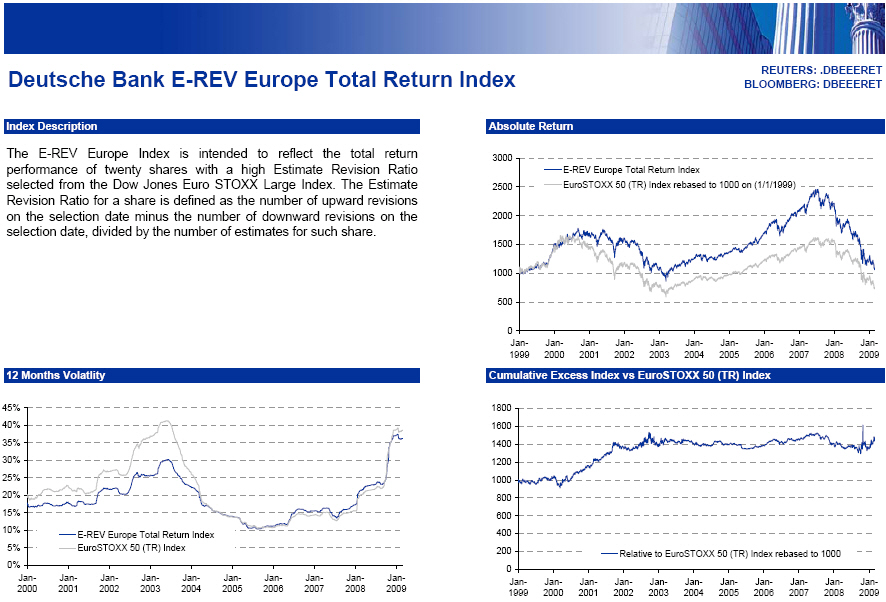 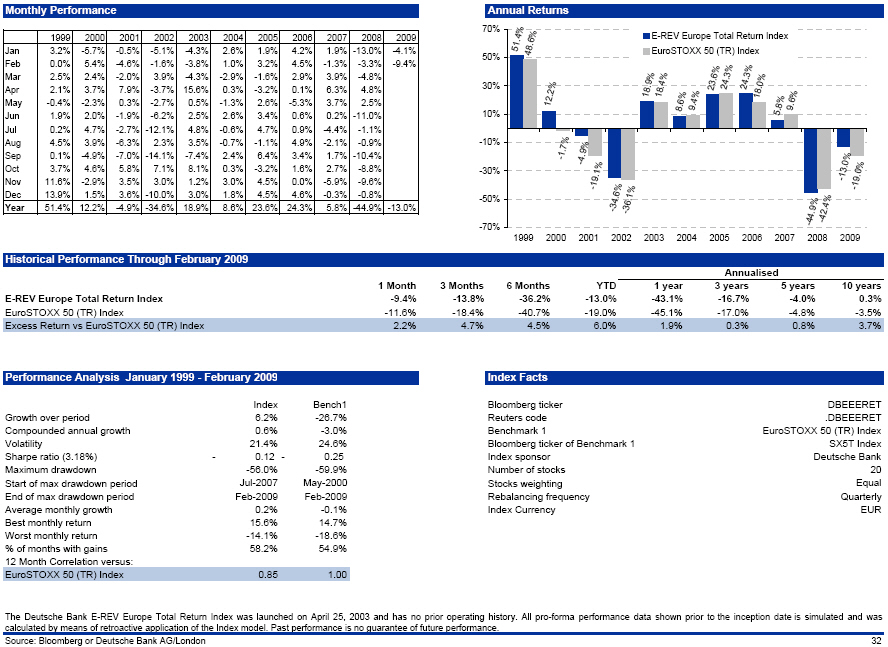 |
Deutsche Bank E-REV Europe Total Return Index                                   REUTERS: .DBEEERET
                                                                                BLOOMBERG: DBEEERET

Index Description

The E-REV Europe Index is intended to reflect the total return  performance of twenty shares with a
high  Estimate  Revision  Ratio  selected  from the Dow Jones Euro STOXX Large Index.  The Estimate
Revision Ratio for a share is defined as the number of upward revisions on the selection date minus
the number of downward revisions on the selection date, divided by the number of estimates for such
share.

Monthly Performance
       1999     2000    2001     2002   2003    2004   2005     2006    2007     2008      2009
Jan     3.2%    -5.7%   -0.5%    -5.1%  -4.3%    2.6%   1.9%     4.2%    1.9%   -13.0%     -4.1%
Feb     0.0%     5.4%   -4.6%    -1.6%  -3.8%    1.0%   3.2%     4.5%   -1.3%    -3.3%     -9.4%
Mar     2.5%     2.4%   -2.0%     3.9%  -4.3%   -2.9%  -1.6%     2.9%    3.9%    -4.8%
Apr     2.1%     3.7%    7.9%    -3.7%  15.6%    0.3%  -3.2%     0.1%    6.3%     4.8%
May    -0.4%    -2.3%    0.3%    -2.7%   0.5%   -1.3%   2.6%    -5.3%    3.7%     2.5%
Jun     1.9%     2.0%   -1.9%    -6.2%   2.5%    2.6%   3.4%     0.6%    0.2%   -11.0%
Jul     0.2%     4.7%   -2.7%   -12.1%   4.8%   -0.6%   4.7%     0.9%   -4.4%    -1.1%
Aug     4.5%     3.9%   -6.3%     2.3%   3.5%   -0.7%  -1.1%     4.9%   -2.1%    -0.9%
Sep     0.1%    -4.9%   -7.0%   -14.1%  -7.4%    2.4%   6.4%     3.4%    1.7%   -10.4%
Oct     3.7%     4.6%    5.8%     7.1%   8.1%    0.3%  -3.2%     1.6%    2.7%    -8.8%
Nov    11.6%    -2.9%    3.5%     3.0%   1.2%    3.0%   4.5%     0.0%   -5.9%    -9.6%
Dec    13.9%     1.5%    3.6%   -10.0%   3.0%    1.8%   4.5%     4.6%   -0.3%    -0.8%
Year   51.4%    12.2%   -4.9%   -34.6%  18.9%    8.6%  23.6%    24.3%    5.8%   -44.9%    -13.0%


Historical Performance Through February 2009

                                                       1 Month    3 Months   6 Months     YTD
E-REV Europe Total Return Index                          -9.4%      -13.8%     -36.2%   -13.0%
EuroSTOXX 50 (TR) Index                                 -11.6%      -18.4%     -40.7%   -19.0%
Excess Return vs EuroSTOXX 50 (TR) Index                  2.2%        4.7%       4.5%     6.0%

                                                            Annualised
                                                         1year    3 years   5 years    10 years
E-REV Europe Total Return Index                          -43.1%    -16.7%    -4.0%       0.3%
EuroSTOXX 50 (TR) Index                                  -45.1%    -17.0%    -4.8%      -3.5%
Excess Return vs EuroSTOXX 50 (TR) Index                   1.9%      0.3%     0.8%       3.7%

Performance Analysis January 1999 - February 2009
                                                      Index                        Bench1
Growth over period                                      6.2%                        -26.7%
Compounded annual growth                                0.6%                         -3.0%
Volatility                                             21.4%                         24.6%
Sharpe ratio (3.18%)                                 - 0.12-                         0.25
Maximum drawdown                                      -56.0%                        -59.9%
Start of max drawdown period          Jul             -2007                May      -2000
End of max drawdown period            Feb             -2009                Feb      -2009
Average monthly growth                                  0.2%                         -0.1%
Best monthly return                                    15.6%                         14.7%
Worst monthly return                                  -14.1%                        -18.6%
% of months with gains                                 58.2%                         54.9%
12 Month Correlation versus:
EuroSTOXX 50 (TR) Index                                0.85                          1.00

Index Facts
Bloomberg ticker                                                     DBEEERET
Reuters code                                                        .DBEEERET
Benchmark 1                                           EuroSTOXX 50 (TR) Index
Bloomberg ticker of Benchmark 1                                    SX5T Index
Index sponsor                                                   Deutsche Bank
Number of stocks                                                           20
Stocks weighting                                                        Equal
Rebalancing frequency                                               Quarterly
Index Currency                                                            EUR

The Deutsche Bank E-REV Europe Total Return Index was launched on April 25, 2003 and has no
prior operating history. All pro-forma performance data shown prior to the inception date is
simulated and was calculated by means of retroactive application of the Index model. Past
performance is no guarantee of future performance.

Source: Bloomberg or Deutsche Bank AG/London

                                                                                                 32
|
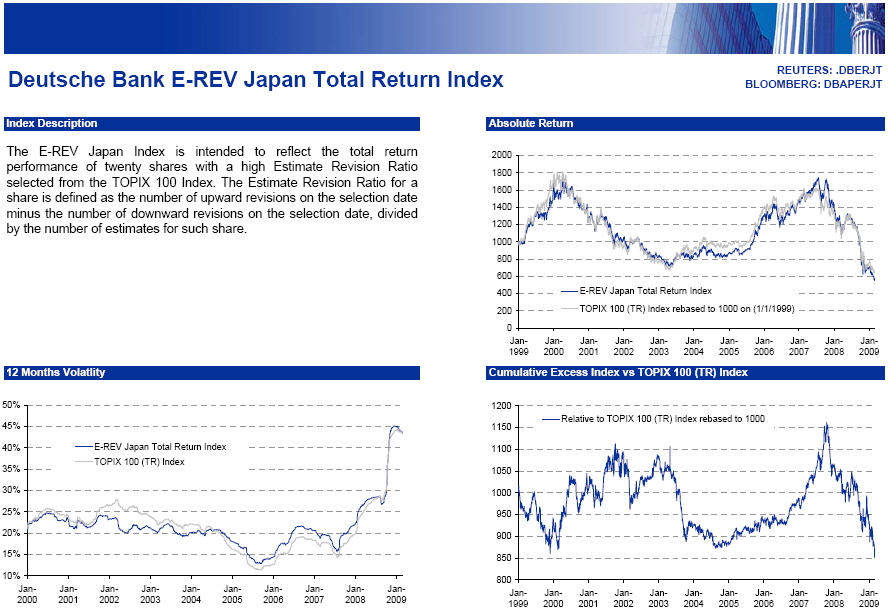 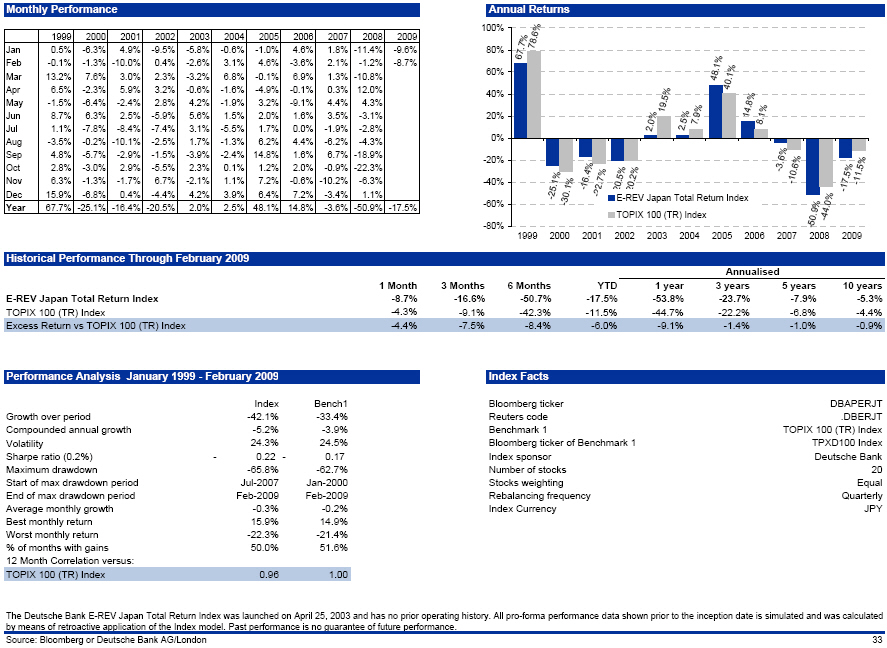 |
REUTERS: .DBERJT
BLOOMBERG: DBAPERJT

Deutsche Bank E-REV Japan Total Return Index

Index Description                                               Absolute Return

The E-REV Japan Index is intended to reflect the total return  performance  of twenty shares with a
high Estimate  Revision Ratio selected from the TOPIX 100 Index. The Estimate  Revision Ratio for a
share is defined as the number of upward  revisions on the selection  date 1600 minus the number of
downward revisions on the selection date, divided 1400 by the number of estimates for such share.

12 Months Volatility        Cumulative Excess Index vs TOPIX 100 (TR) Index

Monthly Performance                                     Annual Returns

        1999    2000    2001   2002    2003   2004   2005   2006   2007   2008    2009

Jan    0.5%  -6.3%    4.9%   -9.5%   -5.8%  -0.6%   -1.0%   4.6%   1.8%   -11.4%   -9.6%
Feb   -0.1%  -1.3%   -10.0%   0.4%   -2.6%   3.1%   4.6%   -3.6%   2.1%   -1.2%    -8.7%
Mar   13.2%   7.6%   3.0%     2.3%   -3.2%   6.8%   -0.1%   6.9%   1.3%   -10.8%
Apr    6.5%  -2.3%   5.9%     3.2%   -0.6%  -1.6%   -4.9%  -0.1%   0.3%   12.0%
May   -1.5%  -6.4%   -2.4%    2.8%   4.2%   -1.9%   3.2%   -9.1%   4.4%    4.3%
Jun    8.7%   6.3%   2.5%    -5.9%   5.6%    1.5%   2.0%    1.6%   3.5%   -3.1%
Jul    1.1%  -7.8%   -8.4%   -7.4%   3.1%   -5.5%   1.7%    0.0%   -1.9%  -2.8%
Aug   -3.5%  -0.2%   -10.1%  -2.5%   1.7%   -1.3%   6.2%    4.4%   -6.2%  -4.3%
Sep    4.8%  -5.7%   -2.9%   -1.5%   -3.9%  -2.4%  14.8%    1.6%   6.7%  -18.9%
Oct    2.8%  -3.0%   2.9%    -5.5%   2.3%   0.1%    1.2 %   2.0%   -0.9%  -22.3%
Nov    6.3%  -1.3%   -1.7%    6.7%  -2.1%   1.1%    7.2%   -0.6%   -10.2%  -6.3%
Dec   15.9%  -6.8%   0.4%    -4.4%   4.2%   3.9%    6.4%    7.2%   -3.4%   1.1%
Year  67.7%  -25.1%  -16.4%  -20.5%  2.0%   2.5%   48.1%   14.8%   -3.6%   -50.9%   -17.5%

Historical Performance Through February 2009


                                        1 Month  3 Months  6 Months    YTD

E-REV Japan Total Return Index            -8.7%   -16.6%   -50.7%    -17.5%
TOPIX 100 (TR) Index                      -4.3%    -9.1%   -42.3%    -11.5%
Excess Return vs TOPIX 100 (TR) Index     -4.4%    -7.5%    -8.4%     -6.0%

                                                    Annualised

                                          1 year  3 years  5 years  10 years

E-REV Japan Total Return Index            -53.8%    23.7%   -7.9%   -5.3%
TOPIX 100 (TR) Index                      -44.7%    22.2%   -6.8%   -4.4%
Excess Return vs TOPIX 100 (TR) Index      -9.1%    -1.4%   -1.0%   -0.9%


Performance Analysis January 1999 - February 2009         Index Facts

Growth over period            -42.1%         -33.4%    Bloomberg ticker         DBAPERJT
Compounded annual growth      -5.2%          -3.9%     Reuters code             .DBERJT
Volatility                    24.3%          24.5%     Benchmark 1              TOPIX 100 (tr Index
Sharpe ratio (3.18%)          0.22           0.17      Bloomberg ticker of
                                                          Benchmark 1            TPXD100 Index
Maximum drawdown              -65.8%         -62.7%    Index sponsor            Deutsche Bank
Start of max drawdown period  Jul-2007       Jan-2000  Stocks weighting         20
End of max drawdown period    Feb-2009       Feb-2009  Rebalancing frequency    Equal
Average monthly growth        -0.3%          -0.2%     Index Currency           JPY
Best monthly return           15.9%          14.9%
Worst monthly return          -22.3%         -21.4%
% of months with gains        50.0%          51.6%
12 Month Correlation versus:
DJ STOXX 600 (TR) Index       0.96           1.00


The  Deutsche  Bank E-REV Japan Total  Return Index was launched on April 25, 2003 and has no prior
operating  history.  All pro-forma  performance data shown prior to the inception date is simulated
and was calculated by means of retroactive  application of the Index model.  Past performance is no
guarantee of future performance.

Source: Bloomberg or Deutsche Bank AG/London
                                                                                                 33
|
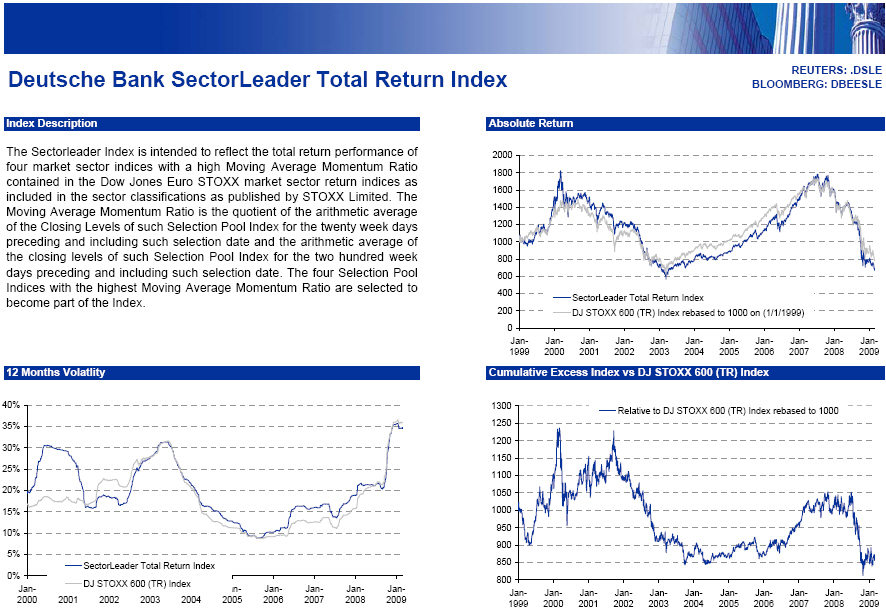 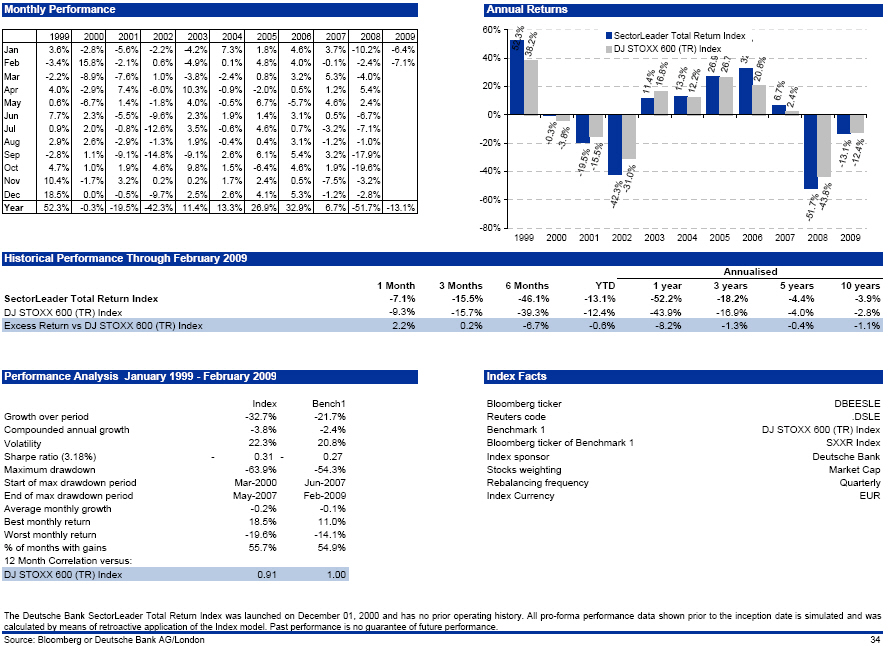 |
REUTERS: .DSLE
BLOOMBERG: DBEESLE

Deutsche Bank SectorLeader Total Return Index

Index Description

The  Sectorleader  Index is intended to reflect the total return  performance of four market sector
indices  with a high Moving  Average  Momentum  Ratio  contained in the Dow Jones Euro STOXX market
sector return indices as included in the sector  classifications as published by STOXX Limited. The
Moving Average  Momentum  Ratio is the quotient of the arithmetic  average of the Closing Levels of
such  Selection Pool Index for the twenty week days preceding and including such selection date and
the arithmetic  average of the closing levels of such Selection Pool Index for the two hundred week
days preceding and including such selection  date. The four Selection Pool Indices with the highest
Moving Average Momentum Ratio are selected to

                                                            Absolute Return
12 Month Volatility

Cumulative Excess Index vs DJ STOXX 600 (TR) Index

Monthly Performance                                             Annual Returns

        1999    2000    2001   2002    2003   2004   2005   2006   2007   2008    2009

Jan     3.6%   -2.8%   -5.6%   -2.2%  -4.2%   7.3%   1.8%   4.6%   3.7%    -10.2   -6.4%
Feb    -3.4%   15.8%   -2.1%   0.6%   -4.9%   0.1%   4.8%   4.0%   -0.1%   -2.4%   -7.1%
Mar    -2.2%   -8.9%   -7.6%   1.0%   -3.8%   -2.4%  0.8%   3.2%   5.3%    -4.0%
Apr     4.0%   -2.9%    7.4%   -6.0%  10.3%   -0.9%  -2.0%  0.5%   1.2%    5.4%
May     0.6%   -6.7%    1.4%   -1.8%  4.0%    -0.5%  6.7%   -5.7%  4.6%    2.4%
Jun     7.7%    2.3%   -5.5%   -9.6%  2.3%     1.9%   1.4%   3.1%  0.5%    -6.7%
Jul     0.9%    2.0%   -0.8%  -12.6%  3.5%    -0.6%   4.6%   0.7%  -3.2%   -7.1%
Aug     2.9%    2.6%   -2.9%  -1.3%   1.9%    -0.4%   0.4%   3.1%  -1.2%   -1.0%
Sep    -2.8%    1.1%   -9.1%  -14.8%  -9.1%    2.6%   6.1%   5.4%   3.2%   -17.9%
Oct     4.7%    1.0%    1.9%   4.6%    9.8%    1.5%  -6.4%   4.6%  1.9%    -19.6%
Nov    10.4%   -1.7%   3.2%    0.2%    0.2%    1.7%   2.4%   0.5%   -7.5%   -3.2%
Dec    18.5%    0.0%   -0.5%  -9.7%    2.5%    2.6%   4.1%   5.3%   -1.2%   -2.8%
Year   52.3%   -0.3%   -19.5  -42.3%  11.4%   13.3%   26.9%  32.9%  6.7%   -51.7   -13.1%

Historical Performance Through February 2009


                                             1 Month  3 Months  6 Months  YTD

SectorLeader Total Return Index                -7.1%  -15.5%   -46.1%   -13.1%
DJ STOXX 600 (TR) Index                        -9.3%  -15.7%   -39.3%   -12.4%
Excess Return vs DJ STOXX 600 (TR) Index        2.2%    0.2%    -6.7%    -0.6%

                                                     Annualised

                                             1 year  3 years  5 years  10 years

SectorLeader Total Return Index               -52.2%   -18.2%   -4.4%    -3.9%
DJ STOXX 600 (TR) Index                       -43.9%   -16.9%   -4.0%    -2.8%
Excess Return vs DJ STOXX 600 (TR) Index       -8.2%   -1.3%    -0.4%    -1.1%


Performance Analysis January 1999 - February 2009          Index Facts

Growth over period             -32.7%     -21.7%     Bloomberg ticker       DBEESLE
Compounded annual growth       -3.8%      -2.4%      Reuters code           .DSLE
Volatility                     22.3%      20.8%      Benchmark 1            DJ STOXX 600 (TR) Index
Sharpe ratio (3.18%)           0.31       0.27       Bloomberg ticker
                                                         of Benchmark 1     SXXR Index
Maximum drawdown               -63.9%     -54.3%     Index sponsor          Deutsche Bank
Start of max drawdown period   Mar-2000   June-2007  Stocks weighting       Market Cap
End of max drawdown period     May-2007   Feb-2009   Rebalancing frequency  Quarterly
Average monthly growth         -0.2%      -0.1%      Index Currency         EUR
Best monthly return            18.5%      11.0%
Worst monthly return           -19.6%     -14.1%
% of months with gains         55.7%      54.9%
12 Month Correlation versus:
DJ STOXX 600 (TR) Index        0.91       1.00


The  Deutsche  Bank  SectorLeader  Total  Return Index was launched on December 01, 2000 and has no
prior  operating  history.  All pro-forma  performance  data shown prior to the  inception  date is
simulated  and was  calculated  by  means of  retroactive  application  of the  Index  model.  Past
performance is no guarantee of future performance.

Source: Bloomberg or Deutsche Bank AG/London
                                                                                                 34
|
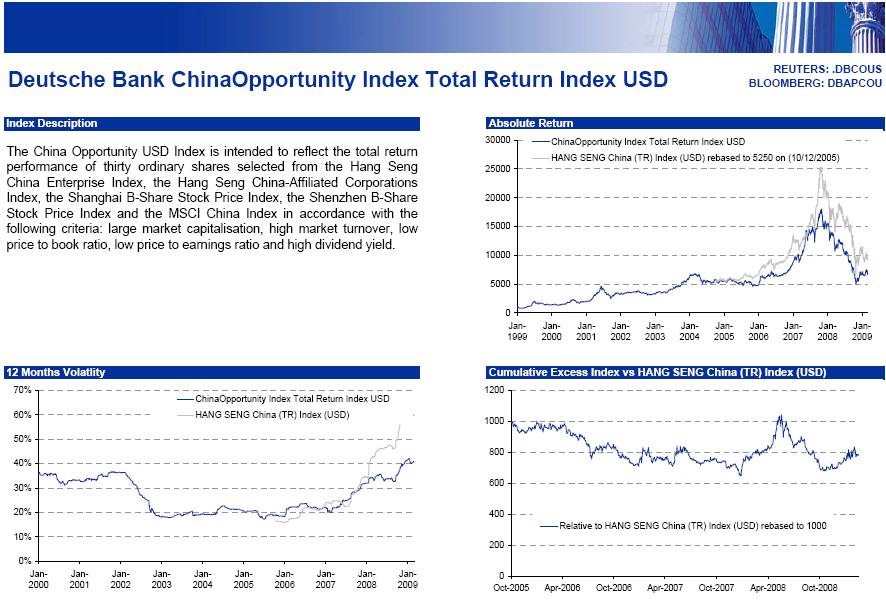 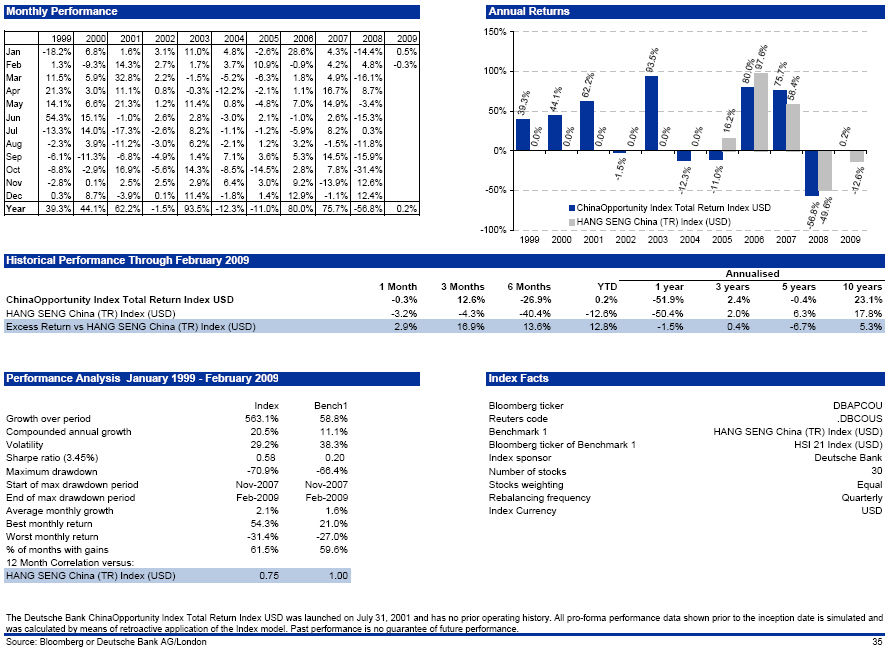 |
REUTERS: .DBCOUS
BLOOMBERG: DBAPCOU

Deutsche Bank ChinaOpportunity Index Total Return Index USD

Index Description

The China  Opportunity  USD Index is  intended to reflect the total  return  performance  of thirty
ordinary shares selected from the Hang Seng China Enterprise Index, the Hang Seng  China-Affiliated
Corporations  Index, the Shanghai B-Share Stock Price Index, the Shenzhen B-Share Stock Price Index
and the MSCI China Index in accordance with the following  criteria:  large market  capitalisation,
high market turnover, low price to book ratio, low price to earnings ratio and high dividend yield.

Monthly Performance                             Annual Returns

       1999    2000    2001   2002    2003   2004   2005   2006   2007   2008    2009

Jan  -18.2%   6.8%   1.6%    3.1%   11.0%    4.8%  -2.6%  28.6%  4.3%  -14.4%  0.5%
Feb    1.3%  -9.3%   14.3%   2.7%    1.7%    3.7%  10.9%  -0.9%  4.2%   4.8%  -0.3%
Mar   11.5%   5.9%   32.8%   2.2%   -1.5%   -5.2%   -6.3%   1.8%  4.9%  -16.1%
Apr   21.3%   3.0%   11.1%   0.8%    -0.3%  -12.2%  -2.1%  1.1%  16.7%  8.7%
May   14.1%   6.6%   21.3%   1.2%    11.4%   0.8%  -4.8%  7.0%  14.9%  -3.4%
Jun   54.3%   15.1%  -1.0%   2.6%     2.8%  -3.0%  2.1%   -1.0%  2.6%  -15.3%
Jul  -13.3%   14.0%  -17.3%  -2.6%    8.2%  -1.1%  -1.2%  -5.9%  8.2%   0.3%
Aug   -2.3%   3.9%   -11.2%  -3.0%    6.2%  -2.1%  1.2%   3.2%  -1.5%  -11.8%
Sep   -6.1%  -11.3%  -6.8%   -4.9%    1.4%  7.1%   3.6%   5.3%  14.5%  -15.9%
Oct   -8.8%   -2.9%  16.9%   -5.6%   14.3%  -8.5%  -14.5%  2.8%  7.8%  -31.4%
Nov   -2.8%   0.1%   2.5%     2.5%    2.9%  6.4%   3.0%   9.2%  -13.9%  12.6%
Dec    0.3%   8.7%  -3.9%     0.1%   11.4%  -1.8%  1.4%  12.9%  -1.1%  12.4%

Historical Performance Through February 2009

                                                   1 Month  3 Months  6 Months    YTD

ChinaOpportunity Index Total Return Index
USD HANG SENG China (TR) Index (USD)
                                                      -0.3%     12.6%   -26.9%      0.2%
     Excess Return vs HANG SENG China (TR)            -3.2%     -4.3%   -40.4%      -12.6%
Index (USD)                                           2.9%      16.9%   13.6%       12.8%

                                                     1 year  3 years  5 years  10 years

ChinaOpportunity Index Total Return Index
USD HANG SENG China (TR) Index (USD)
                                                    -51.9%   2.4% -0.4% 2.0%   23.1%
     Excess Return vs HANG SENG China (TR)              -50.4%   6.3% 0.4% -6.7%   17.8%
Index (USD)                                              -1.5%   5.3%


Performance Analysis January 1999 - February 2009      Index Facts

Growth over period               563.1%       58.8%   Bloomberg ticker      DBAPCOU
Compounded annual growth          20.5%       11.1%   Reuters code          .DBCOUS
Volatility                        29.2%       38.3%   Benchmark 1           HANG SENG China (TR)
                                                                             Index (USD)
Sharpe ratio (3.45%)               0.58        0.20   Bloomberg ticker
                                                          of Benchmark 1    HSI 21 Index (USD)
Maximum drawdown                 -70.9%      -66.4%   Index sponsor         Deutsche Bank
Start of max drawdown period     Nov-2007    Nov-2007 Number of stocks      30
End of max drawdown period       Feb-2009    Feb-2009 Stocks weighting      Equal
Average monthly growth             2.1%        1.6%   Rebalancing frequency Quarterly
Best monthly return               54.3%       21.0%   Index Currency        USD
Worst monthly return             -31.4%      -27.0%
% of months with gains            61.5%       59.6%
12 Month Correlation versus:
HANG SENG China (TR) Index (USD)   0.75        1.00

The Deutsche Bank  ChinaOpportunity  Index Total Return Index USD was launched on July 31, 2001 and
has no prior operating history. All pro-forma performance data shown prior to the inception date is
simulated  and was  calculated  by  means of  retroactive  application  of the  Index  model.  Past
performance is no guarantee of future performance.

Source: Bloomberg or Deutsche Bank AG/London
                                                                                                 35
|
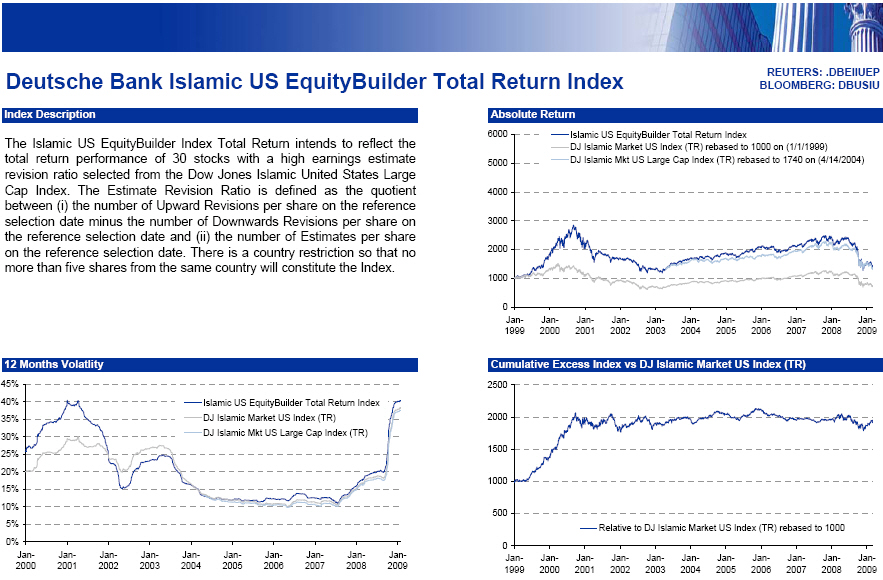 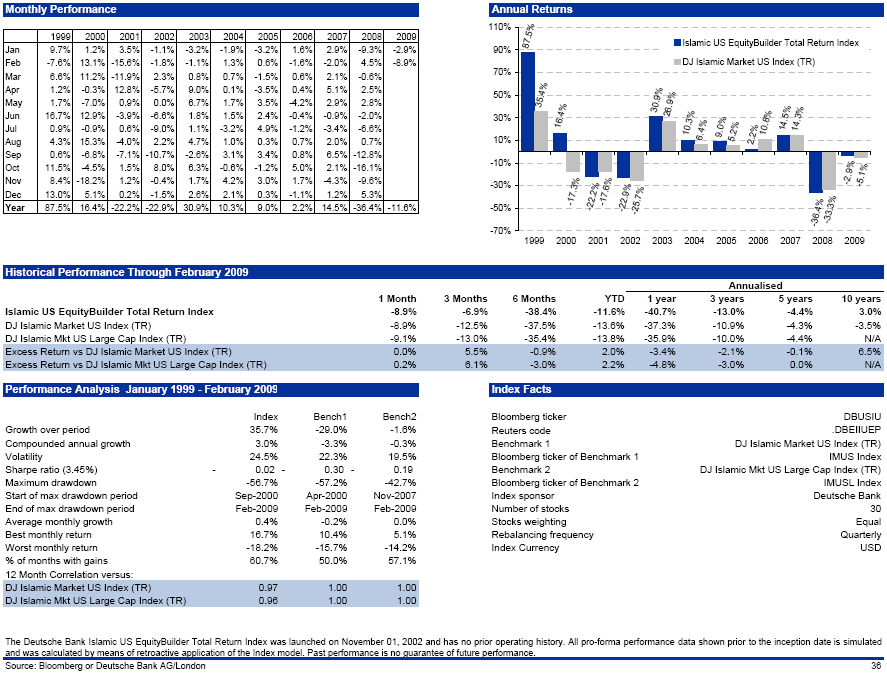 |
REUTERS: .DBEIIUEP
BLOOMBERG: DBUSIU

Deutsche Bank Islamic US EquityBuilder Total Return Index

Index Description                               Absolute Return

6000 Islamic US EquityBuilder Total Return Index

The Islamic US EquityBuilder  Index Total Return intends to reflect the total return performance of
30 stocks with a high earnings  estimate  revision ratio selected from the Dow Jones Islamic United
States Large Cap Index.  The  Estimate  Revision  Ratio is defined as the quotient  between (i) the
number of Upward Revisions per share on the reference  selection date minus the number of Downwards
Revisions per share on the reference  selection  date and (ii) the number of Estimates per share on
the reference  selection date. There is a country restriction so that no more than five shares from
the same country will constitute the Index.

12 Months Volatility

Cumulative Excess Index vs DJ Islamic Market US Index (TR)

Monthly Performance                                             Annual Returns

       1999    2000    2001   2002    2003   2004   2005   2006   2007   2008    2009

Jan    9.7%    1.2%     3.5%   -1.1%  -3.2%  -1.9%  -3.2%  1.6%   2.9%   -9.3%   -2.9%
Feb   -7.6%   13.1%  -15.6%   -1.8%   -1.1%  1.3%   0.6%  -1.6%  -2.0%    4.5%   -8.9%
Mar    6.6%   11.2%  -11.9%    2.3%   0.8%   0.7%   -1.5%  0.6%   2.1%  -0.6%
Apr    1.2%   -0.3%   12.8%   -5.7%   9.0%   0.1%   -3.5%  0.4%   5.1%   2.5%
May    1.7%   -7.0%    0.9%    0.0%   6.7%   1.7%   3.5%  -4.2%   2.9%   2.8%
Jun   16.7%   12.9%   -3.9%   -6.6%  1.8%    1.5%   2.4%  -0.4%  -0.9%  -2.0%
Jul    0.9%   -0.9%    0.6%   -9.0%  1.1%   -3.2%   4.9%  -1.2%  -3.4%  -6.6%
Aug    4.3%   15.3%   -4.0%    2.2%  4.7%   1.0%    0.3%  0.7%    2.0%   0.7%
Sep    0.6%   -6.8%   -7.1%  -10.7%  -2.6%  3.1%    3.4%  0.8%    6.5%  -12.8%
Oct    11.5%  -4.5%    1.5%    8.0%  6.3%   -0.6%  -1.2%  5.0%    2.1%  -16.1%
Nov    8.4%  -18.2%    1.2%  -0.4%   1.7%   4.2%    3.0%  1.7%    -4.3%  -9.6%
Dec   13.0%    5.1%    0.2%  -1.5%   2.6%   2.1%    0.3%  -1.1%    1.2%  5.3%
Year  87.5%   16.4%  -22.2%  -22.9%  30.9%  10.3%   9.0%  2.2%    14.5%  -36.4%  -11.6%

Historical Performance Through February 2009

                                                       1 Month  3 Months  6 Months    YTD

Islamic US EquityBuilder Total Return                   -8.9%    -6.9%     -38.4%     -11.6%
Index
DJ Islamic Market US Index (TR)                         -8.9%   -12.5%     -37.5%     -13.6%
DJ Islamic Mkt US Large Cap Index (TR)                  -9.1%   -13.0%     -35.4%     -13.8%
Excess Return vs DJ Islamic Market US                   0.0%     5.5%       -0.9%      2.0%
Index (TR)
Excess Return vs DJ Islamic Mkt US Large                0.2%     6.1%       -3.0%      2.2%
Cap Index (TR)

                                                        1 year  3 years  5 years  10 years
                                                                                Annualised
Islamic US EquityBuilder Total Return                   -40.7%  -13.0%     -4.4%      3.0%
Index
DJ Islamic Market US Index (TR)                         -37.3%  -10.9%     -4.3%     -3.5%
DJ Islamic Mkt US Large Cap Index (TR)                  -35.9%  -10.0%     -4.4%       N/A
Excess Return vs DJ Islamic Market US                   -3.4%   -2.1%      -0.1%      6.5%
Index (TR)
Excess Return vs DJ Islamic Mkt US Large                -4.8%   -3.0%       0.0%       N/A
Cap Index (TR)


Performance Analysis January 1999 - February 2009                       Index Facts

Index                                          Bench1  Bench2             Bloomberg
                                                                           ticker
Growth over period                  35.7%     -29.0%    -1.6%              Reuters code
Compounded annual growth            3.0%      -3.3%     -0.3%              Benchmark 1

Volatility                          24.5%     22.3%     19.5%    Bloomberg ticker of Benchmark 1
Sharpe ratio (3.45%)           -    -0.02     0.30 -    0.19               Benchmark 2

Maximum drawdown                   -56.7%     -57.2%   -42.7%    Bloomberg ticker of Benchmark 2
Start of max drawdown             Sep-2000   Apr-2000  Nov-2007           Index sponsor
period
End of max drawdown               Feb-2009   Feb-2009  Feb-2009          Number of stocks
period
Average monthly growth              0.4%      -0.2%     0.0%             Stocks weighting
Best monthly return                 16.7%     10.4%     5.1%          Rebalancing frequency
Worst monthly return               -18.2%     -15.7%   -14.2%             Index Currency
% of months with gains              60.7%     50.0%     57.1%
12 Month Correlation versus:
DJ Islamic Market US Index (TR)        0.97    1.00     1.00
DJ Islamic Mkt US Large Cap            0.96    1.00     1.00
Index (TR)

Performance Analysis January 1999 - February 2009

Index                                                  DBUSIU

Growth over period                                 .DBEIIUEP
Compounded annual growth          DJ Islamic Market US Index
                                                        (TR)
Volatility                                        IMUS Index
Sharpe ratio (3.45%)             DJ Islamic Mkt US Large Cap
                                                  Index (TR)
Maximum drawdown                                 IMUSL Index
Start of max drawdown                          Deutsche Bank
period
End of max drawdown                                       30
period
Average monthly growth                                 Equal
Best monthly return                                Quarterly
Worst monthly return                                     USD
% of months with gains
12 Month Correlation versus:
DJ Islamic Market US Index (TR)
DJ Islamic Mkt US Large Cap
Index (TR)


The Deutsche Bank Islamic US EquityBuilder Total Return Index was launched on November 01, 2002 and
has no prior operating history. All pro-forma performance data shown prior to the inception date is
simulated  and was  calculated  by  means of  retroactive  application  of the  Index  model.  Past
performance is no guarantee of future performance.

Source: Bloomberg or Deutsche Bank AG/London
                                                                                                 36
|
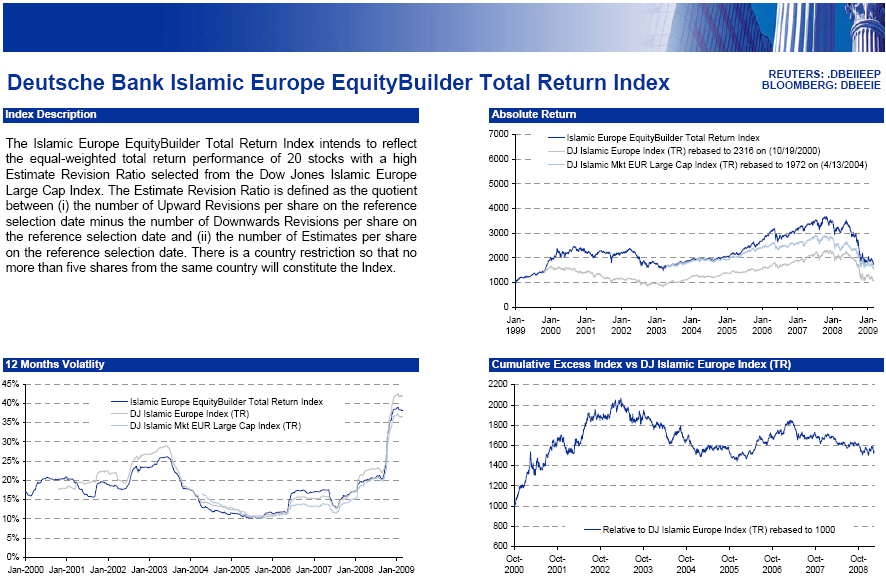 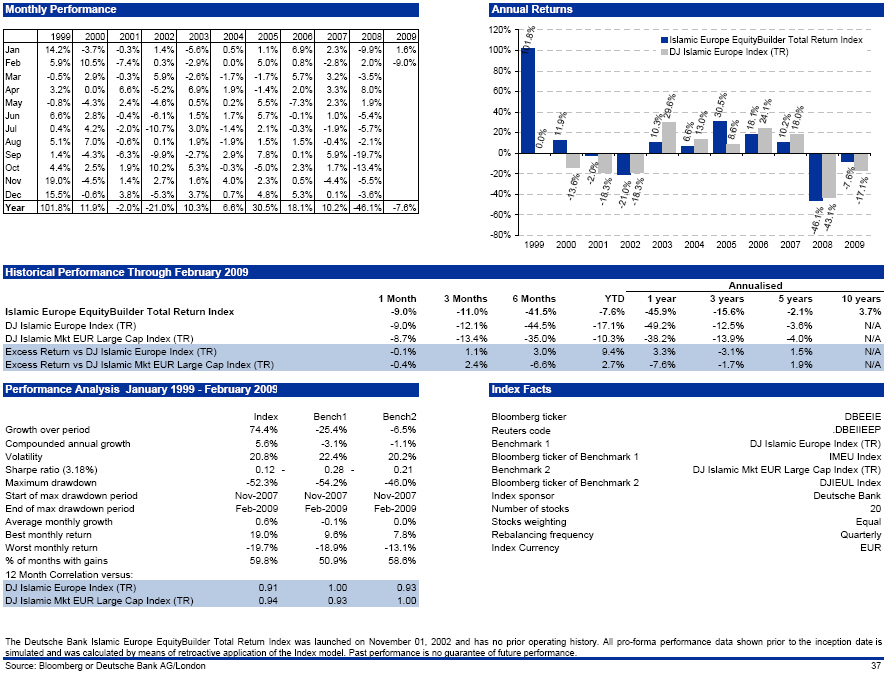 |
REUTERS: .DBEIIEEP
BLOOMBERG: DBEEIE

Deutsche Bank Islamic Europe EquityBuilder Total Return Index

Index Description

The Islamic Europe  EquityBuilder  Total Return Index intends to reflect the  equal-weighted  total
return  performance  of 20 stocks with a high Estimate  Revision  Ratio selected from the Dow Jones
Islamic Europe Large Cap Index. The Estimate  Revision Ratio is defined as the quotient between (i)
the  number of Upward  Revisions  per share on the  reference  selection  date  minus the number of
Downwards  Revisions per share on the reference selection date and (ii) the number of Estimates per
share on the reference  selection  date.  There is a country  restriction so that no more than five
shares from the same country will constitute the Index.

12 Months Volatility            Cumulative Excess Index vs DJ Islamic Europe Index (TR)

Monthly Performance

       1999    2000    2001   2002    2003   2004   2005   2006   2007   2008    2009

Jan   14.2%  -3.7%  -0.3%   1.4%   -5.6%   0.5%   1.1%   6.9%   2.3%  -9.9%  1.6%
Feb    5.9%   10.5%  -7.4%   0.3%   -2.9%  0.0%   5.0%   0.8%   -2.8%  2.0%  -9.0%
Mar   -0.5%  2.9%   -0.3%   5.9%   -2.6%  -1.7%  -1.7%  5.7%   3.2%   -3.5%
Apr    3.2%  0.0%   6.6%   -5.2%   6.9%   1.9%   -1.4%  2.0%   3.3%   8.0%
May   -0.8%  -4.3%  2.4%   -4.6%   0.5%   0.2%   5.5%   -7.3%  2.3%   1.9%
Jun    6.6%  2.8%   -0.4%  -6.1%   1.5%   1.7%   5.7%   -0.1%  1.0%   -5.4%
Jul    0.4%  4.2%   -2.0% -10.7%   3.0%   -1.4%  2.1%   -0.3%  -1.9%  -5.7%
Aug    5.1%  7.0%   -0.6%   0.1%   1.9%   -1.9%  1.5%   1.5%   -0.4%  -2.1%
Sep    1.4%  -4.3%  -6.3%  -9.9%  -2.7%   2.9%   7.8%   0.1%   5.9%   -19.7%
Oct    4.4%  2.5%   1.9%   10.2%   5.3%   -0.3%  -5.0%  2.3%   1.7%   -13.4%
Nov   19.0%  -4.5%  1.4%    2.7%   1.6%   4.0%   2.3%   0.5%   -4.4%  -5.5%
Dec   15.5%  -0.6%  3.8%   -5.3%   3.7%   0.7%   4.8%   5.3%   0.1%   -3.6%
Year  101.8% 11.9%  -2.0%  -21.0%  10.3%  6.6%   30.5%  18.1%  10.2%  -46.1%  -7.6%

Absolute Return

Cumulative Excess Index vs DJ Islamic Europe Index (TR)

                                                            Annual Returns

Historical Performance Through February 2009

                                                      1 Month  3 Months  6 Months    YTD


Islamic Europe EquityBuilder Total Return               -9.0%   -11.0%     -41.5%     -7.6%
Index
DJ Islamic Europe Index (TR)                            -9.0%   -12.1%     -44.5%     -17.1%
DJ Islamic Mkt EUR Large Cap Index (TR)                 -8.7%   -13.4%     -35.0%     -10.3%
Excess Return vs DJ Islamic Europe Index                -0.1%    1.1%       3.0%       9.4%
(TR)
Excess Return vs DJ Islamic Mkt EUR Large               -0.4%    2.4%       -6.6%      2.7%
Cap Index (TR)

                                                       1 year  3 years  5 years  10 years

                                                                       Annualised
Islamic Europe EquityBuilder Total Return               -45.9%  -15.6%     -2.1%      3.7%
Index
DJ Islamic Europe Index (TR)                            -49.2%  -12.5%     -3.6%       N/A
DJ Islamic Mkt EUR Large Cap Index (TR)                 -38.2%  -13.9%     -4.0%       N/A
Excess Return vs DJ Islamic Europe Index                 3.3%    -3.1%      1.5%       N/A
(TR)
Excess Return vs DJ Islamic Mkt EUR Large               -7.6%    -1.7%      1.9%       N/A
Cap Index (TR)


Performance Analysis January 1999 - February 2009                       Index Facts

Index                                         Bench1   Bench2             Bloomberg
                                                                           ticker
Growth over period                  74.4%     -25.4%    -6.5%              Reuters code
Compounded annual growth             5.6%     -3.1%     -1.1%               Benchmark 1

Volatility                          20.8%     22.4%     20.2%     Bloomberg ticker of Benchmark 1
Sharpe ratio (3.18%)                -0.12     0.28 -    0.21                Benchmark 2

Maximum drawdown                    -52.3%    -54.2%   -46.0%     Bloomberg ticker of Benchmark 2
Start of max drawdown              Nov-2007  Nov-2007  Nov-2007            Index sponsor
period
End of max drawdown                Feb-2009  Feb-2009  Feb-2009          Number of stocks
period
Average monthly growth               0.6%     -0.1%     0.0%             Stocks weighting
Best monthly return                 19.0%      9.6%     7.8%           Rebalancing frequency
Worst monthly return                -19.7%    -18.9%   -13.1%             Index Currency
% of months with gains              59.8%     50.9%     58.6%
12 Month Correlation versus:
DJ Islamic Europe Index (TR)         0.91      1.00     0.93
DJ Islamic Mkt EUR Large Cap         0.94      0.93     1.00
Index (TR)

Index                                                     DBEEIE

Growth over period                                     .DBEIIEEP
Compounded annual growth                 DJ Islamic Europe Index
                                                            (TR)
Volatility                                            IMEU Index
Sharpe ratio (3.18%)                    DJ Islamic Mkt EUR Large
                                                  Cap Index (TR)
Maximum drawdown                                    DJIEUL Index
Start of max drawdown                              Deutsche Bank
period
End of max drawdown                                           20
period
Average monthly growth                                     Equal
Best monthly return                                    Quarterly
Worst monthly return                                         EUR
% of months with gains
12 Month Correlation versus:
DJ Islamic Europe Index (TR)
DJ Islamic Mkt EUR Large Cap
Index (TR)


The Deutsche Bank Islamic Europe EquityBuilder Total Return Index was launched on November 01, 2002
and has no prior operating  history.  All pro-forma  performance  data shown prior to the inception
date is simulated and was calculated by means of retroactive  application of the Index model.  Past
performance is no guarantee of future performance.

Source: Bloomberg or Deutsche Bank AG/London
                                                                                                 37
|
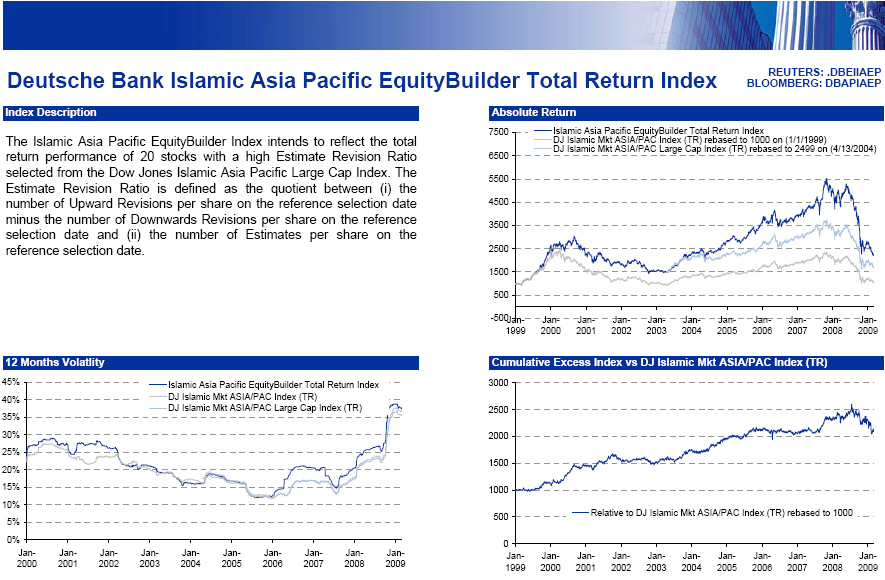 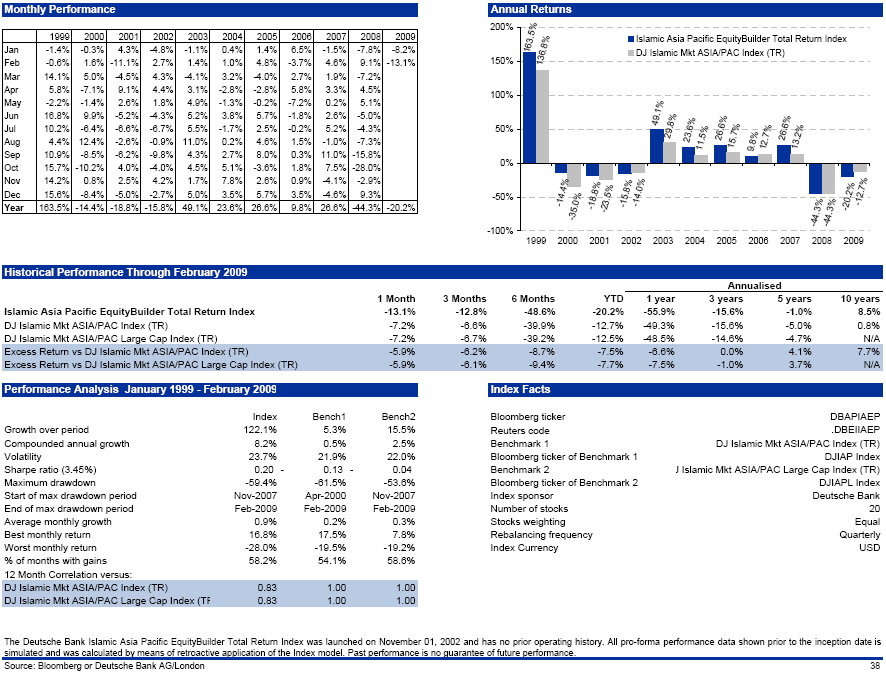 |
REUTERS: .DBEIIAEP
BLOOMBERG: DBAPIAEP

Deutsche Bank Islamic Asia Pacific EquityBuilder Total Return Index

Index Description Absolute Return

                                              Islamic Asia Pacific EquityBuilder Total Return Index

The Islamic Asia Pacific  EquityBuilder Index intends to reflect the total return performance of 20
stocks with a high Estimate  Revision  Ratio selected from the Dow Jones Islamic Asia Pacific Large
Cap Index. The Estimate  Revision Ratio is defined as the quotient between (i) the number of Upward
Revisions per share on the  reference  selection  date minus the number of Downwards  Revisions per
share on the reference  selection  date and (ii) the number of Estimates per share on the reference
selection date.

Absolute Return

Cumulative Excess Index vs DJ I slamic Mkt ASIA/PAC Index (TR)

12 Months Volatility

       1999    2000    2001   2002    2003   2004   2005   2006   2007   2008    2009

Jan     -1.4%   -0.3%    4.3%   -4.8%  -1.1%  0.4%  1.4%   6.5%   -1.5%   -7.8%     -8.2%
Feb     -0.6%    1.6%  -11.1%   2.7%   1.4%   1.0%   4.8%  -3.7%  4.6%    9.1%    -13.1%
Mar     14.1%    5.0%   -4.5%    4.3% -4.1%   3.2%  -4.0%   2.7%  1.9%   -7.2%
Apr      5.8%   -7.1%    9.1%    4.4%  3.1%   -2.8  %-2.8%  5.8%  3.3%   4.5%
May     -2.2%   -1.4%    2.6%    1.8% 4.9%   -1.3%  -0.2%  -7.2%  0.2%
Jun     16.8%    9.9%   -5.2%   -4.3%  5.2%  3.8%   5.7%   -1.8%  2.6%   -5.0%
Jul     10.2%   -6.4%   -6.6%   -6.7%  5.5%  -1.7%  2.5%   -0.2%  5.2%   -4.3%
Aug      4.4%   12.4%   -2.6%   -0.9%  11.0%  0.2%  4.6%   1.5%   -1.0%  -7.3%
Sep     10.9%   -6.2%   -9.8%    4.3%  2.7%   8.0%  0.3%   11.0%  -15.8%  7.5%
Oct     15.7%  -10.2%   -8.5%    4.0% -4.0%  4.5%   5.1%   -3.6%  1.8%   -28.0%
Nov     14.2%    0.8%    2.5%   4.2%   1.7%  7.8%   2.6%    0.9%  -4.1%  -2.9%
Dec     15.6%   -8.4%   -5.0%  -2.7%   5.0%   3.5%  5.7%   3.5%  -4.6%   9.3%
Year   163.5%  -14.4%  -18.8%  -15.8%  49.1%  23.6% 26.6%   9.8%  26.6%  -44.3%   -20.2%


Annual Returns

Historical performance Through February 2009

                                                       1 Month  3 Months  6 Months    YTD

Islamic Asia Pacific EquityBuilder                      -13.1%    -12.8%   -48.6%      -20.2%
Total Return Index
DJ Islamic Mkt ASIA/PAC Index (TR)                       -7.2%    -6.6%    -39.9%      -12.7%
DJ Islamic Mkt ASIA/PAC Large Cap Index                  -7.2%    -6.7%    -39.2%      -12.5%
(TR)
Excess Return vs DJ Islamic Mkt                          -5.9%    -6.2%     -8.7%      -7.5%
ASIA/PAC Index (TR)
Excess Return vs DJ Islamic Mkt ASIA/PAC                   -5.9%  -6.1%     -9.4%      -7.7%
Large Cap Index (TR)

                                                        1 year  3 years  5 years  10 years

Islamic Asia Pacific EquityBuilder                        -55.9%  -15.6%     -1.0%    8.5%
Total Return Index
DJ Islamic Mkt ASIA/PAC Index (TR)                        -49.3%  -15.6%     -5.0%    0.8%
DJ Islamic Mkt ASIA/PAC Large Cap Index                   -48.5%  -14.6%     -4.7%     N/A
(TR)
Excess Return vs DJ Islamic Mkt                           -6.6%    0.0%       4.1%    7.7%
ASIA/PAC Index (TR)
Excess Return vs DJ Islamic Mkt ASIA/PAC                  -7.5%  -1.0%      3.7%       N/A
Large Cap Index (TR)


Performance Analysis January 1999 - February 2009                         Index Facts

Index                                          Bench1   Bench2             Bloomberg ticker
Growth over period                 122.1%      5.3%      15.5%           Reuters code
Compounded annual growth            8.2%       0.5%      2.5%            Benchmark 1

Volatility                         23.7%      21.9%      22.0%           Bloomberg ticker of
                                                                         Benchmark 1
Sharpe ratio (3.45%)                0.20  -   -0.13      0.04            Benchmark 2              I

Maximum drawdown                   -59.4%     -61.5%    -53.6%           Bloomberg ticker of
                                                                         Benchmark 2
Start of max drawdown              Nov-2007  Apr-2000  Nov-2007          Index sponsor
period
End of max drawdown                Feb-2009  Feb-2009  Feb-2009          Number of stocks
period
Average monthly growth              0.9%       0.2%      0.3%            Stocks weighting
Best monthly return                16.8%      17.5%      7.8%            Rebalancing
                                                                         frequency
Worst monthly return               -28.0%     -19.5%    -19.2%           Index Currency
% of months with gains             58.2%      54.1%      58.6%
12 Month Correlation versus:
DJ Islamic Mkt ASIA/PAC Index       0.83       1.00      1.00
(TR)
DJ Islamic Mkt ASIA/PAC Large Cap   0.83       1.00      1.00
Index (TR

Index                                    DBAPIAEP
Growth over period                                       .DBEIIAEP
Compounded annual growth                   DJ Islamic Mkt ASIA/PAC
                                                        Index (TR)
Volatility                                             DJIAP Index

Sharpe ratio (3.45%)                I Islamic Mkt ASIA/PAC Large
                                           Cap Index (TR)
Maximum drawdown                                      DJIAPL Index

Start of max drawdown                                Deutsche Bank
period
End of max drawdown                                             20
period
Average monthly growth                                       Equal
Best monthly return                                      Quarterly

Worst monthly return                                           USD
% of months with gains
12 Month Correlation versus:
DJ Islamic Mkt ASIA/PAC Index
(TR)
DJ Islamic Mkt ASIA/PAC Large Cap
Index (TR


The Deutsche  Bank Islamic Asia Pacific  EquityBuilder  Total Return Index was launched on November
01, 2002 and has no prior  operating  history.  All pro-forma  performance  data shown prior to the
inception  date is simulated and was  calculated by means of  retroactive  application of the Index
model. Past performance is no guarantee of future performance.

Source: Bloomberg or Deutsche Bank AG/London
                                                                                                 38
|
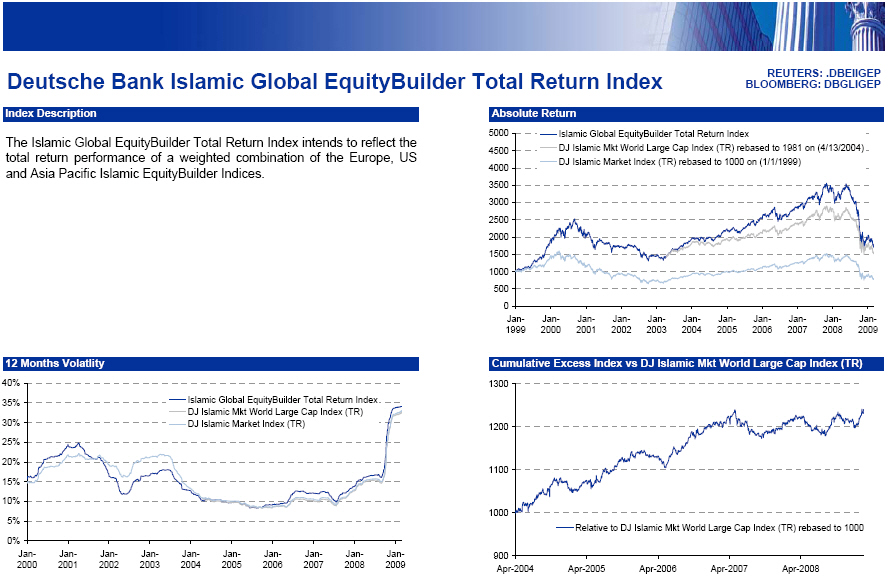 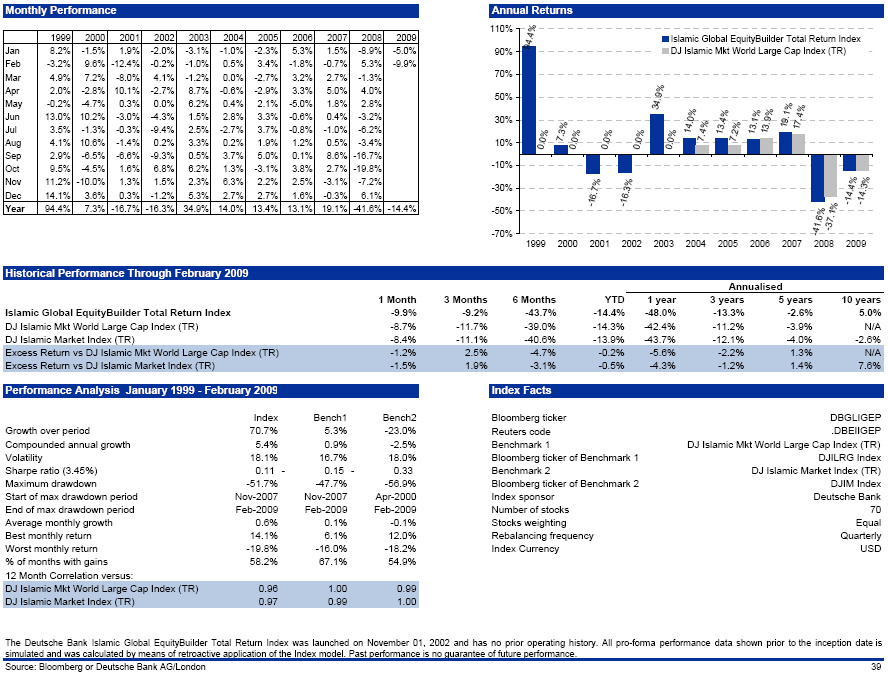 |
REUTERS: .DBEIIGEP
BLOOMBERG: DBGLIGEP

Deutsche Bank Islamic Global EquityBuilder Total Return Index

Index Description

The Islamic Global EquityBuilder Total Return Index intends to reflect the total return performance
of a weighted combination of the Europe, US and Asia Pacific Islamic EquityBuilder Indices.

12 Months Volatility

40% 35% 30% 25% 20% 15% 10%

5% 0% Jan-Jan-Jan2000 2001 2002

Monthly Performance

       1999    2000    2001   2002    2003   2004   2005   2006   2007   2008    2009

Jan     8.2%  -1.5%    1.9%  -2.0%  -3.1%  -1.0%  -2.3%  5.3%   1.5%   -8.9%  -5.0%
Feb    -3.2%   9.6%  -12.4%  -0.2%  -1.0%   0.5%   3.4%   -1.8%  -0.7%  5.3%  -9.9%
Mar     4.9%   7.2%   -8.0%   4.1%  -1.2%   0.0%   -2.7%  3.2%   2.7%   -1.3%
Apr     2.0%  -2.8%   10.1%  -2.7%   8.7%  -0.6%  -2.9%  3.3%   5.0%   4.0%
May    -0.2%  -4.7%    0.3%   0.0%   6.2%   0.4%   2.1%   -5.0%  1.8%   2.8%
Jun    13.0%  10.2%   -3.0%  -4.3%   1.5%   2.8%   3.3%   -0.6%  0.4%   -3.2%
Jul     3.5%  -1.3%   -0.3%  -9.4%   2.5%  -2.7%   3.7%   -0.8%  -1.0%  -6.2%
Aug     4.1%  10.6%   -1.4%   0.2%   3.3%   0.2%   1.9%   1.2%   0.5%   -3.4%
Sep     2.9%  -6.5%   -6.6%  -9.3%   0.5%   3.7%   5.0%   0.1%   8.6%   -16.7%
Oct     9.5%  -4.5%    1.6%   6.8%   6.2%   1.3%   -3.1%  3.8%   2.7%   -19.8%
Nov    11.2% -10.0%    1.3%   1.5%   2.3%   6.3%   2.2%   2.5%   -3.1%  -7.2%
Dec    14.1%   3.6%    0.3%  -1.2%   5.3%   2.7%   2.7%   1.6%   -0.3%  6.1%
Year   94.4%   7.3%  -16.7% -16.3%  34.9%  14.0%  13.4%  13.1%  19.1%  -41.6%  -14.4%

Historical Performance Through February 2009

                                                       1 Month  3 Months  6 Months    YTD

Islamic Global EquityBuilder Total Return               -9.9%    -9.2%     -43.7%     -14.4%
Index
DJ Islamic Mkt World Large Cap Index (TR)               -8.7%   -11.7%     -39.0%     -14.3%
DJ Islamic Market Index (TR)                            -8.4%   -11.1%     -40.6%     -13.9%
Excess Return vs DJ Islamic Mkt World                   -1.2%    2.5%       -4.7%     -0.2%
Large Cap Index (TR)
Excess Return vs DJ Islamic Market Index                -1.5%    1.9%       -3.1%     -0.5%
(TR)

                                                       1 year  3 years  5 years  10 years

Islamic Global EquityBuilder Total Return              -48.0%  -13.3%      -2.6%     5.0%
Index
DJ Islamic Mkt World Large Cap Index (TR)              -42.4%  -11.2%      -3.9%      N/A
DJ Islamic Market Index (TR)                           -43.7%  -12.1%      -4.0%    -2.6%
Excess Return vs DJ Islamic Mkt World                  -5.6%    -2.2%       1.3%      N/A
Large Cap Index (TR)
Excess Return vs DJ Islamic Market Index               -4.3%    -1.2%       1.4%     7.6%
(TR)


Performance Analysis January 1999 - February 2009                 Index Facts


Index                                         Bench1   Bench2             Bloomberg
                                                                           ticker
Growth over period                  70.7%      5.3%    -23.0%              Reuters code
Compounded annual growth             5.4%      0.9%     -2.5%               Benchmark 1

Volatility                          18.1%     16.7%     18.0%     Bloomberg ticker of Benchmark 1
Sharpe ratio (3.45%)                0.11 -    -0.15     0.33                Benchmark 2

Maximum drawdown                    -51.7%    -47.7%   -56.9%     Bloomberg ticker of Benchmark 2
Start of max drawdown              Nov-2007  Nov-2007  Apr-2000            Index sponsor
period
End of max drawdown                Feb-2009  Feb-2009  Feb-2009          Number of stocks
period
Average monthly growth               0.6%      0.1%     -0.1%            Stocks weighting
Best monthly return                 14.1%      6.1%     12.0%          Rebalancing frequency
Worst monthly return                -19.8%    -16.0%   -18.2%             Index Currency
% of months with gains              58.2%     67.1%     54.9%
12 Month Correlation versus:
DJ Islamic Mkt World Large Cap       0.96      1.00     0.99
Index (TR)
DJ Islamic Market Index (TR)         0.97      0.99     1.00

Index                                                 DBGLIGEP

Growth over period                                  .DBEIIGEP
Compounded annual growth           DJ Islamic Mkt World Large
                                               Cap Index (TR)
Volatility                                       DJILRG Index
Sharpe ratio (3.45%)                  DJ Islamic Market Index
                                                         (TR)
Maximum drawdown                                   DJIM Index
Start of max drawdown                           Deutsche Bank
period
End of max drawdown                                        70
period
Average monthly growth                                  Equal
Best monthly return                                 Quarterly
Worst monthly return                                      USD
% of months with gains
12 Month Correlation versus:
DJ Islamic Mkt World Large Cap
Index (TR)
DJ Islamic Market Index (TR)


The Deutsche Bank Islamic Global EquityBuilder Total Return Index was launched on November 01, 2002
and has no prior operating  history.  All pro-forma  performance  data shown prior to the inception
date is simulated and was calculated by means of retroactive  application of the Index model.  Past
performance is no guarantee of future performance.

Source: Bloomberg or Deutsche Bank AG/London
                                                                                                 39
|
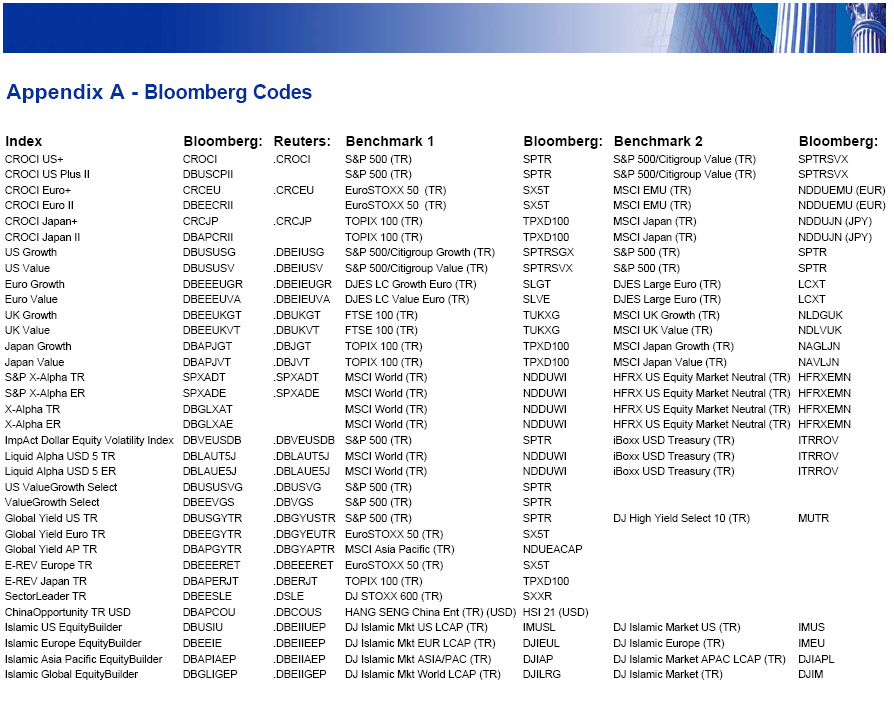  |
Appendix A -Bloomberg Codes

Index                       Bloomberg:   Reuters:  Benchmark 1              Bloomberg:
CROCI US+                   CROCI        .CROCI    S&P 500 (TR)             SPTR

CROCI US Plus II            DBUSCPII               S&P 500 (TR)             SPTR

CROCI Euro+                 CRCEU        .CRCEU    EuroSTOXX 50 (TR)        SX5T

CROCI Euro II               DBEECRII               EuroSTOXX 50 (TR)        SX5T

CROCI Japan+                CRCJP        .CRCJP    TOPIX 100 (TR)           TPXD100

CROCI Japan II              DBAPCRII               TOPIX 100 (TR)           TPXD100

US Growth                   DBUSUSG      .DBEIUSG  S&P 500/Citigroup        SPTRSGX
                                                   Growth (TR)
US Value                    DBUSUSV      .DBEIUSV  S&P 500/Citigroup        SPTRSVX
                                                   Value (TR)
Euro Growth                 DBEEEUGR     .DBEIEUGR DJES LC Growth Euro      SLGT
                                                   (TR)
Euro Value                  DBEEEUVA     .DBEIEUVA DJES LC Value Euro       SLVE
                                                   (TR)
UK Growth                   DBEEUKGT     .DBUKGT   FTSE 100 (TR)            TUKXG
UK Value                    DBEEUKVT     .DBUKVT   FTSE 100 (TR)            TUKXG
Japan Growth                DBAPJGT      .DBJGT    TOPIX 100 (TR)           TPXD100
Japan Value                 DBAPJVT      .DBJVT    TOPIX 100 (TR)           TPXD100
S&P X-Alpha TR              SPXADT       .SPXADT   MSCI World (TR)     NDDUWI

S&P X-Alpha ER              SPXADE       .SPXADE   MSCI World (TR)     NDDUWI

X-Alpha TR                  DBGLXAT                MSCI World (TR)     NDDUWI

X-Alpha ER                  DBGLXAE                MSCI World (TR)     NDDUWI

ImpAct Dollar Equity        DBVEUSDB     .DBVEUSDB S&P 500 (TR)        SPTR
Volatility Index
Liquid Alpha USD 5 TR       DBLAUT5J     .DBLAUT5J MSCI World (TR)     NDDUWI
Liquid Alpha USD 5 ER       DBLAUE5J     .DBLAUE5J MSCI World (TR)     NDDUWI
US ValueGrowth Select       DBUSUSVG     .DBUSVG   S&P 500 (TR)        SPTR
ValueGrowth Select          DBEEVGS      .DBVGS    S&P 500 (TR)        SPTR
Global Yield US TR          DBUSGYTR     .DBGYUSTR S&P 500 (TR)       SPTR

Global Yield Euro TR        DBEEGYTR     .DBGYEUTR EuroSTOXX 50 (TR)    SX5T
Global Yield AP TR          DBAPGYTR     .DBGYAPTR MSCI Asia Pacific     NDUEACAP
                                                   (TR)
E-REV Europe TR             DBEEERET     .DBEEERET EuroSTOXX 50 (TR)     SX5T
E-REV Japan TR              DBAPERJT     .DBERJT   TOPIX 100 (TR)        TPXD100
SectorLeader TR             DBEESLE      .DSLE     DJ STOXX 600 (TR)     SXXR
ChinaOpportunity TR USD     DBAPCOU      .DBCOUS   HANG SENG China Ent (TR) (USD) HSI
                                                   21 (USD)
Islamic US EquityBuilder    DBUSIU       .DBEIIUEP DJ Islamic Mkt US LCAP   IMUSL
                                                   (TR)
Islamic Europe              DBEEIE       .DBEIIEEP DJ Islamic Mkt EUR       DJIEUL
EquityBuilder                                      LCAP (TR)
Islamic Asia Pacific        DBAPIAEP     .DBEIIAEP DJ Islamic Mkt           DJIAP
EquityBuilder                                      ASIA/PAC (TR)
Islamic Global              DBGLIGEP     .DBEIIGEP DJ Islamic Mkt World     DJILRG
EquityBuilder                                      LCAP (TR)

Index                          Benchmark 2                Bloomberg:
CROCI US+                      S&P 500/Citigroup Value    SPTRSVX
                               (TR)
CROCI US Plus II               S&P 500/Citigroup Value    SPTRSVX
                               (TR)
CROCI Euro+                    MSCI EMU (TR)              NDDUEMU
                                                          (EUR)
CROCI Euro II                  MSCI EMU (TR)              NDDUEMU
                                                          (EUR)
CROCI Japan+                   MSCI Japan (TR)            NDDUJN
                                                          (JPY)
CROCI Japan II                 MSCI Japan (TR)            NDDUJN
                                                          (JPY)
US Growth                      S&P 500 (TR)               SPTR

US Value                       S&P 500 (TR)               SPTR

Euro Growth                    DJES Large Euro (TR)       LCXT

Euro Value                     DJES Large Euro (TR)       LCXT

UK Growth                      MSCI UK Growth (TR)        NLDGUK
UK Value                       MSCI UK Value (TR)         NDLVUK
Japan Growth                   MSCI Japan Growth (TR)     NAGLJN
Japan Value                    MSCI Japan Value (TR)      NAVLJN
S&P X-Alpha TR                 HFRX US Equity Market      HFRXEMN
                               Neutral (TR)
S&P X-Alpha ER                 HFRX US Equity Market      HFRXEMN
                               Neutral (TR)
X-Alpha TR                     HFRX US Equity Market      HFRXEMN
                               Neutral (TR)
X-Alpha ER                     HFRX US Equity Market      HFRXEMN
                               Neutral (TR)
ImpAct Dollar Equity           iBoxx USD Treasury (TR)    ITRROV
Volatility Index
Liquid Alpha USD 5 TR          iBoxx USD Treasury (TR)    ITRROV
Liquid Alpha USD 5 ER          iBoxx USD Treasury (TR)    ITRROV
US ValueGrowth Select
ValueGrowth Select
Global Yield US TR             DJ High Yield Select 10    MUTR
                               (TR)
Global Yield Euro TR
Global Yield AP TR

E-REV Europe TR
E-REV Japan TR
SectorLeader TR
ChinaOpportunity TR USD

Islamic US EquityBuilder       DJ Islamic Market US       IMUS
                               (TR)
Islamic Europe                 DJ Islamic Europe (TR)     IMEU
EquityBuilder
Islamic Asia Pacific           DJ Islamic Market APAC     DJIAPL
EquityBuilder                  LCAP (TR)
Islamic Global                 DJ Islamic Market (TR)     DJIM
EquityBuilder


Source: Bloomberg or Deutsche Bank AG/London
                                                                                                 40
|
  |
Additional  information is available from your Deutsche Bank sales  representative.  In addition to
this GME Indices Review, the CROCI Indices Review, X-Alpha Monthly Reports and Liquid Alpha Monthly
Reports are available upon request.

Disclaimer

This  document is intended for  discussion  purposes  only and does not create any legally  binding
obligations on the part of Deutsche Bank AG and/or its affiliates ("DB"). Without limitation,  this
document does not constitute an offer, an invitation to offer or a recommendation to enter into any
transaction.  When making an investment decision, you should rely solely on the final documentation
relating  to the  transaction  and not the  summary  contained  herein.  DB is not  acting  as your
financial adviser or in any other fiduciary capacity with respect to this proposed transaction. The
transaction(s) or products(s)  mentioned herein may not be appropriate for all investors and before
entering  into any  transaction  you should  take  steps to ensure  that you fully  understand  the
transaction and have made an independent  assessment of the  appropriateness  of the transaction in
the light of your own  objectives and  circumstances,  including the possible risks and benefits of
entering  into such  transaction.  For general  information  regarding  the nature and risks of the
proposed     transaction     and    types    of    financial     instruments     please    go    to
www.globalmarkets.db.com/riskdisclosures.  You should also  consider  seeking  advice from your own
advisers in making this assessment. If you decide to enter into a transaction with DB, you do so in
reliance on your own  judgment.  Assumptions,  estimates  and opinions  contained in this  document
constitute  our judgment as of the date of the document and are subject to change  without  notice.
Any  projections  are based on a number of assumptions as to market  conditions and there can be no
guarantee  that any  projected  results will be achieved.  Past  performance  is not a guarantee of
future  results.  This material was prepared by a Sales or Trading  function within DB, and was not
produced,  reviewed or edited by the Research Department.  Any opinions expressed herein may differ
from the opinions expressed by other DB departments  including the Research  Department.  Sales and
Trading  functions are subject to  additional  potential  conflicts of interest  which the Research
Department  does not face. DB may engage in transactions  in a manner  inconsistent  with the views
discussed herein. DB trades or may trade as principal in the instruments (or related  derivatives),
and may have proprietary positions in the instruments (or related derivatives) discussed herein. DB
may make a market in the instruments (or related  derivatives)  discussed herein. Sales and Trading
personnel  are  compensated  in part  based on the volume of  transactions  effected  by them.  The
distribution  of this  document  and  availability  of  these  products  and  services  in  certain
jurisdictions may be restricted by law. You may not distribute this document,  in whole or in part,
without our express  written  permission.  DB is  authorized  under German  Banking Law  (competent
authority: BaFin - Federal Financial Supervising Authority) and regulated by the Financial Services
Authority for the conduct of UK business.

Deutsche Bank AG has filed a registration  statement  (including a prospectus) with the SEC for the
offerings to which this communication may relate. Before you invest, you should read the prospectus
in that  registration  statement  and other  documents  the  issuer has filed with the SEC for more
complete  information about the issuer and the relevant  offering.  You may get these documents for
free by  visiting  EDGAR  on the SEC  Web  site at  www.sec.gov.  Alternatively,  the  issuer,  any
underwriter or any dealer  participating in the offering will arrange to send you the prospectus if
you request it by calling toll-free 1-800-311-4409.

For further information or for a copy of the monthly report, please contact:  Quantitative Products
Structuring (QPS) at 212 250 8866

Past performance is not indicative of future results.
Source: Bloomberg or Deutsche Bank AG/London
                                                                                                 41
|