Issuer Free Writing Prospectus
File Pursuant to Rule 433
Registration Statement No. 333-137902
Dated March 27, 2009
STANDARD & POOR'S S&P U.S. Carbon Efficient Index Standard & Poor's does not sponsor, endorse, sell or promote any S&P index-based investment product. About the Index The S&P U.S. Carbon Effi cient Index addresses the investment community's increasing concern with environmental issues by offering a broad, U.S. market index that not only comprises companies with relatively low carbon emissions, but also seeks to track the return of the S&P 500. Contact Us: index_services@standardandpoors.com New York +1.212.438.2046 Toronto +1.416.507.3200 London +44.20.7176.8888 Tokyo +813.4550.8463 Beijing +86.10.6569.2919 Sydney +61.2.9255.9870 For more information, including current data and index performance, visit our Web site: www.indices.standardandpoors.com About the Index The S&P U.S. Carbon Effi cient Index is composed of a subset of constituents in the S&P 500 with a relatively low Carbon Footprint while maintaining at least 50% of the original weight representation for every GICS(R) sector in the S&P 500. The Carbon Footprint is calculated by Trucost Plc and is defi ned by the company's annual greenhouse gas (GHG) emissions assessment, expressed as tons of carbon dioxide equivalent (CO2e) divided by annual revenues. Index Methodology The S&P U.S. Carbon Effi cient Index constituents must be members of the S&P 500. In addition, all companies must go through a two fold screening process, the fi rst focusing on Carbon Footprints and the second on constituent list optimization with respect to the S&P 500. o GICS Sector Weight. The 100 equities with the highest Carbon Footprints that do not reduce an individual Global Industry Classifi cation (GICS) sector weight of the S&P 500 by more than 50% are excluded. If the next equity to be excluded takes the sector reduction beyond the 50% threshold, but not more than 55%, that equity will be excluded. If the next equity to be excluded is in a sector which has already exceeded the 50% reduction threshold, or takes the sector reduction beyond 55%, it remains eligible for inclusion. o Optimization. Once the initial stock selection is complete, the qualifying constituents are optimized using Northfi eld Information Service's optimization and risk model data to generate a list of companies, with assigned weights, that seek to minimize tracking error versus the S&P 500. This may result in the removal of companies where the weight is de minimis. Index Construction The S&P U.S. Carbon Effi cient Index is a modifi ed-capitalization weighted index based originally on fl oat-adjusted common shares outstanding. The index constituents, of which there are no more than 375, and their weights are modifi ed at each rebalancing to refl ect an optimization process seeking to track the S&P 500. Rebalancing occurs quarterly after the market close on the third Friday of March, June, September, and December. At each rebalancing reference date, S&P 500 index constituent level data used in the rebalancing process will include index shares that were announced as part of the S&P 500 quarterly share rebalancing. o Shares Outstanding. The shares counted for the sector weightings criteria and used as inputs in the optimization model are shares outstanding. This count is fl oat-adjusted to refl ect only shares available to the general market. o Carbon Footprint. Carbon Footprints are updated annually, approximately eight months following the individual company's fi scal year end. Any updates to a company's Carbon Footprint will be applied to the screening process at the next rebalancing. Complete details of the methodology employed by S&P, including the criteria for index additions and removals, policy statements, and research papers are available on the Web site at www.indices.standardandpoors.com. |  | |
STANDARD & POOR'S
S&P U.S. Carbon Efficient Index
Leading Measures for Global Markets
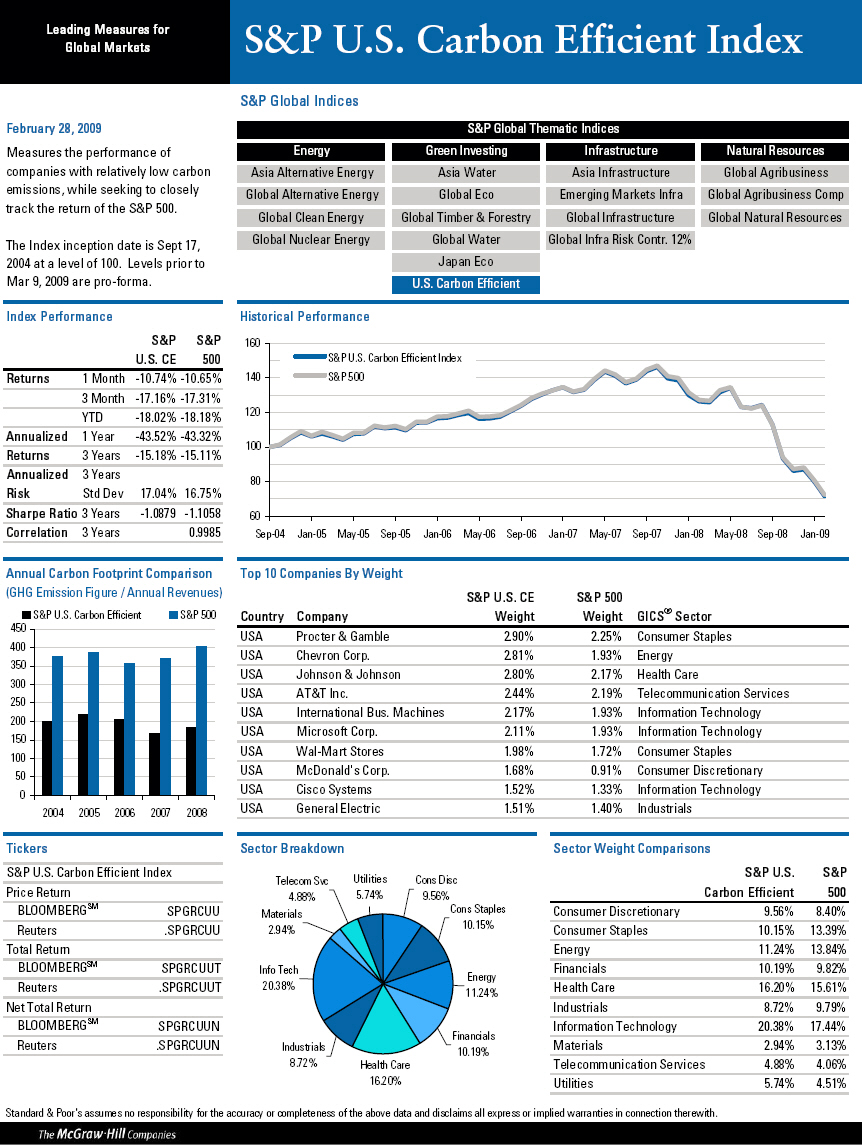
February 28, 2009
Measures the performance of companies with relatively low carbon emissions,
while seeking to closely track the return of the S&P 500.
The Index inception date is Sept 17, 2004 at a level of 100. Levels prior to Mar
9, 2009 are pro-forma.
Index Performance
S&P S&P
U.S. CE 500
- --------------------------------------
Returns 1 Month -10.74%
-10.65%
- --------------------------------------
3 Month -17.16%
-17.31%
- --------------------------------------
YTD -18.02%
-18.18%
- --------------------------------------
Annualized 1 Year -43.52%
-43.32%
- --------------------------------------
Returns 3 Years -15.18%
-15.11%
- --------------------------------------
Annualized 3 Years
Risk Std Dev 17.04% 16.75%
- --------------------------------------
Sharpe Ratio 3 Years -1.0879-1.1058
- --------------------------------------
Correlation 3 Years 0.9985
- --------------------------------------
Annual Carbon Footprint Comparison
[GRAPHIC OMITTED]
S&P U.S. Carbon Efficient Index
S&P Global Indices
S&P Global Thematic Indices
Energy Green Investing Infrastructure Natural Resources
Asia Alternative Energy Asia Water Asia Infrastructure Global Agribusiness
Global Alternative Energy Global Eco Emerging Markets Infra Global Agribusiness Comp
Global Clean Energy Global Timber & Forestry Global Infrastructure Global Natural Resources
Global Infra Risk Contr.
Global Nuclear Energy Global Water 12%
Japan Eco
U.S. Carbon Efficient
Historical Performance
[GRAPHIC OMITTED]
Top 10 Companies By Weight
S&P U.S. CE S&P 500
Country Company Weight Weight GICS(R) Sector
- ------------------------------------------------------------------------------------------------
USA Procter & Gamble 2.90% 2.25% Consumer Staples
- ------------------------------------------------------------------------------------------------
USA Chevron Corp. 2.81% 1.93% Energy
- ------------------------------------------------------------------------------------------------
USA Johnson & Johnson 2.80% 2.17% Health Care
- ------------------------------------------------------------------------------------------------
USA AT&T Inc. 2.44% 2.19% Telecommunication Services
- ------------------------------------------------------------------------------------------------
USA International Bus. Machines 2.17% 1.93% Information Technology
- ------------------------------------------------------------------------------------------------
USA Microsoft Corp. 2.11% 1.93% Information Technology
- ------------------------------------------------------------------------------------------------
USA Wal-Mart Stores 1.98% 1.72% Consumer Staples
- ------------------------------------------------------------------------------------------------
USA McDonald's Corp. 1.68% 0.91% Consumer Discretionary
- ------------------------------------------------------------------------------------------------
USA Cisco Systems 1.52% 1.33% Information Technology
- ------------------------------------------------------------------------------------------------
USA General Electric 1.51% 1.40% Industrials
- ------------------------------------------------------------------------------------------------
Tickers
- --------------------------------------
S&P U.S. Carbon Efficient Index
- --------------------------------------
Price Return
- --------------------------------------
BLOOMBERGSM SPGRCUU
- --------------------------------------
Reuters .SPGRCUU
- --------------------------------------
Total Return
- --------------------------------------
BLOOMBERGSM SPGRCUUT
- --------------------------------------
Reuters .SPGRCUUT
- --------------------------------------
Net Total Return
- --------------------------------------
BLOOMBERGSM SPGRCUUN
- --------------------------------------
Reuters .SPGRCUUN
- --------------------------------------
Sector Breakdown
[GRAPHIC OMITTED]
Sector Weight Comparisons
S&P U.S. S&P
Carbon Efficient 500
- ----------------------------------------------------
Consumer Discretionary 9.56% 8.40%
- ----------------------------------------------------
Consumer Staples 10.15% 13.39%
- ----------------------------------------------------
Energy 11.24% 13.84%
- ----------------------------------------------------
Financials 10.19% 9.82%
- ----------------------------------------------------
Health Care 16.20% 15.61%
- ----------------------------------------------------
Industrials 8.72% 9.79%
- ----------------------------------------------------
Information Technology 20.38% 17.44%
- ----------------------------------------------------
Materials 2.94% 3.13%
- ----------------------------------------------------
Telecommunication Services 4.88% 4.06%
- ----------------------------------------------------
Utilities 5.74% 4.51%
- ----------------------------------------------------
Standard & Poor's assumes no responsibility for the accuracy or completeness of
the above data and disclaims all express or implied warranties in connection
therewith.
The McGraw-Hill Companies
|  | |
| Deutsche Bank AG has filed a registration statement (including a prospectus) with the Securities and Exchange Commission, or SEC, for offerings to which this communication relates. Before you invest, you should read the prospectus in that registration statement and the other documents relating to such offering that Deutsche Bank AG has filed with the SEC for more complete information about Deutsche Bank AG and the offering. You may obtain these documents without cost by visiting EDGAR on the SEC website at www.sec.gov. Alternatively, Deutsche Bank AG, any agent or any dealer participating in the offering will arrange to send you the prospectus if you so request by calling toll-free 1-800-311-4409. |