Issuer Free Writing Prospectus Bloomberg Ticker:SPGRCUUT File Pursuant to Rule 43 Reuters Ticker:.SPGRCUUT Registration Statement No. 333-137902 Dated April 2, 2009 April 2009 Presentation The S&P U.S. Carbon Efficient Index was launched on March 9, 2009. Accordingly, the Index performance from September 17, 2004 to March 6, 2009 shown in this presentation does not reflect the performance of the actual Index, but has been back-calculated on a retrospective basis by Standard & Poor's. The Index did not exist during the period of retrospective calculation, and past performance is not indicative of how the Index will perform in the future. |  |
S&P U.S. Carbon Efficient Index
Market Performance with a Carbon Efficient Perspective

o   It is widely believed that CO2emissions are causing global warming and
    climate change with far reaching negative impact to the planet

o   S&P U.S. Carbon Efficient Index aims to closely track S&P 500 performance
    with a lower Carbon Footprint and Greenhouse Gas emissions

o   A "Green" alternative/complement to the S&P 500 benchmark

    -   Very high correlation to S&P 500 (0.99)
    -   Historically close tracking to S&P 500 performance since 2004 (1.1%
        annualized tracking error)
    -   45% lower Carbon Footprint (higher energy efficiency) compared to S&P
        500
    -   60% lower Greenhouse Gas emissions (total emissions tonnage per year)

o   S&P U.S. Carbon Efficient Index was developed in collaboration with Deutsche
    Bank and Trucost, the market leader in company Carbon Footprint analysis.
|  |
Carbon Emissions
Growing Impact Everywhere

o   Effect on Environment:
    -   Expected temperature increase of 3 -10.5 F and sea-level rise of 7 -23
        inches by end of century
    -   Glacier retreat: Glacier National Park had 27 glaciers in 2007 versus
        150 in 1910 and the Himalayan glaciers could disappear by 2035
    -   Rising levels of CO2in oceans will harm aquatic life and ecosystems,
        many species are threatened to extinction due to rising temperatures

o   Effect on Humanity:
    -   By 2080, homes of 13 to 88 million people around the world would be
        flooded each year
    -   Underdeveloped nations may face armed conflict and riots over resources
        and food (already witnessed in 2008)
    -   Increased chances of cardiovascular diseases due to air pollution and
        temperature rise

Sources:  Wikepedia, National Geographic Magazine, The Telegraph
|  |
Low Carbon Indices Have Been Unsuccessful Thus Far

o   Existing Carbon Indices have underperformed their equity benchmarks
    -   There has been negative alpha in most long-only Carbon Indices
    -   Some European Low Carbon Indices have underperformed by more than 20%
        since 2004
    -Investors have been unwilling to forgo performance in order to be "green"

o   Carbon Index "Trackers" have recently been introduced in Europe
    -   These indices include allbenchmark companies -overweight Low Carbon
        companies and underweight high carbon companies
    -   Resulting performance is in line with benchmark but only marginally
        lower carbon footprint

o   How can market performance be delivered with a meaningfully lower Carbon
    Footprint?
|  |
S&P U.S. Carbon Efficient Index
Executive Summary
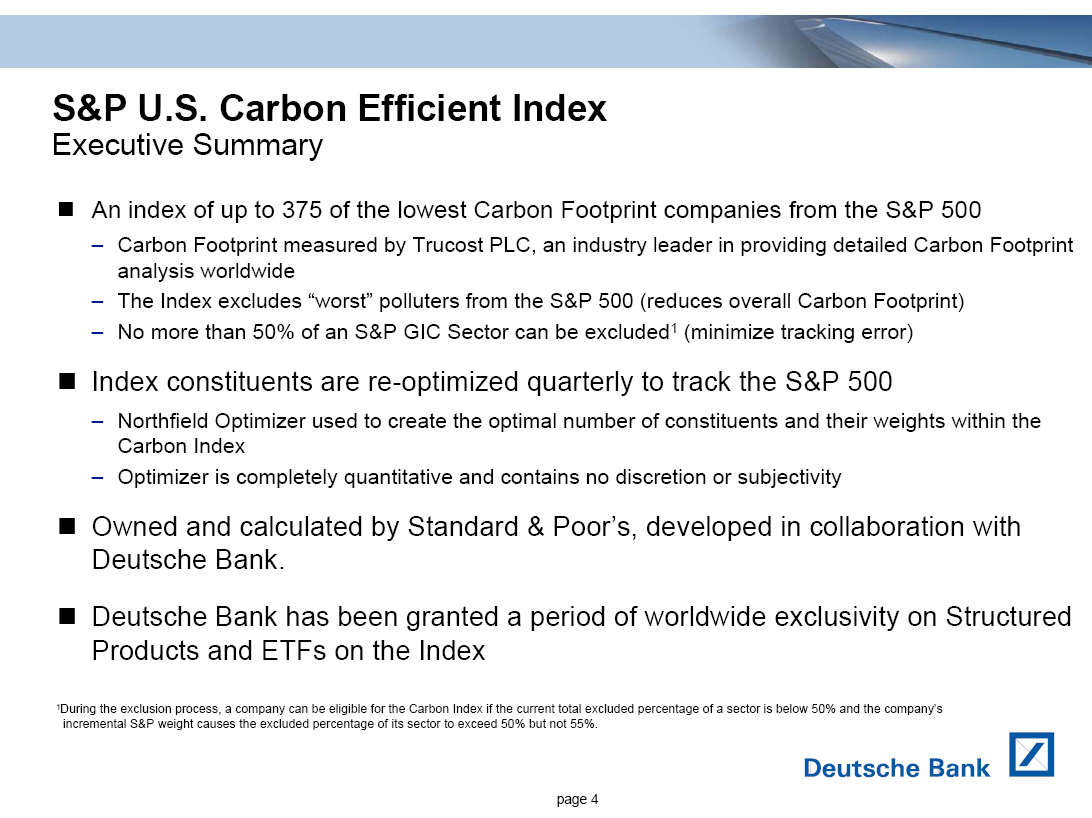
o An index of up to 375 of the lowest Carbon Footprint companies from the S&P
500
- Carbon Footprint measured by Trucost PLC, an industry leader in
providing detailed Carbon Footprint analysis worldwide
- The Index excludes "worst" polluters from the S&P 500 (reduces overall
Carbon Footprint)
- No more than 50% of an S&P GIC Sector can be excluded1(minimize tracking
error)
o Index constituents are re-optimized quarterly to track the S&P 500
- Northfield Optimizer used to create the optimal number of constituents
and their weights within the Carbon Index
- Optimizer is completely quantitative and contains no discretion or
subjectivity
o Owned and calculated by Standard & Poor's, developed in collaboration with
Deutsche Bank.
o Deutsche Bank has been granted a period of worldwide exclusivityon
Structured Products and ETFson the Index
1During the exclusion process, a company can be eligible for the Carbon Index if
the curent total excluded percentage of a sector is below 50% and the company's
incremental S&P weight cause the excluded percentage of its sector to exceed 50%
but not 55%.
|  |
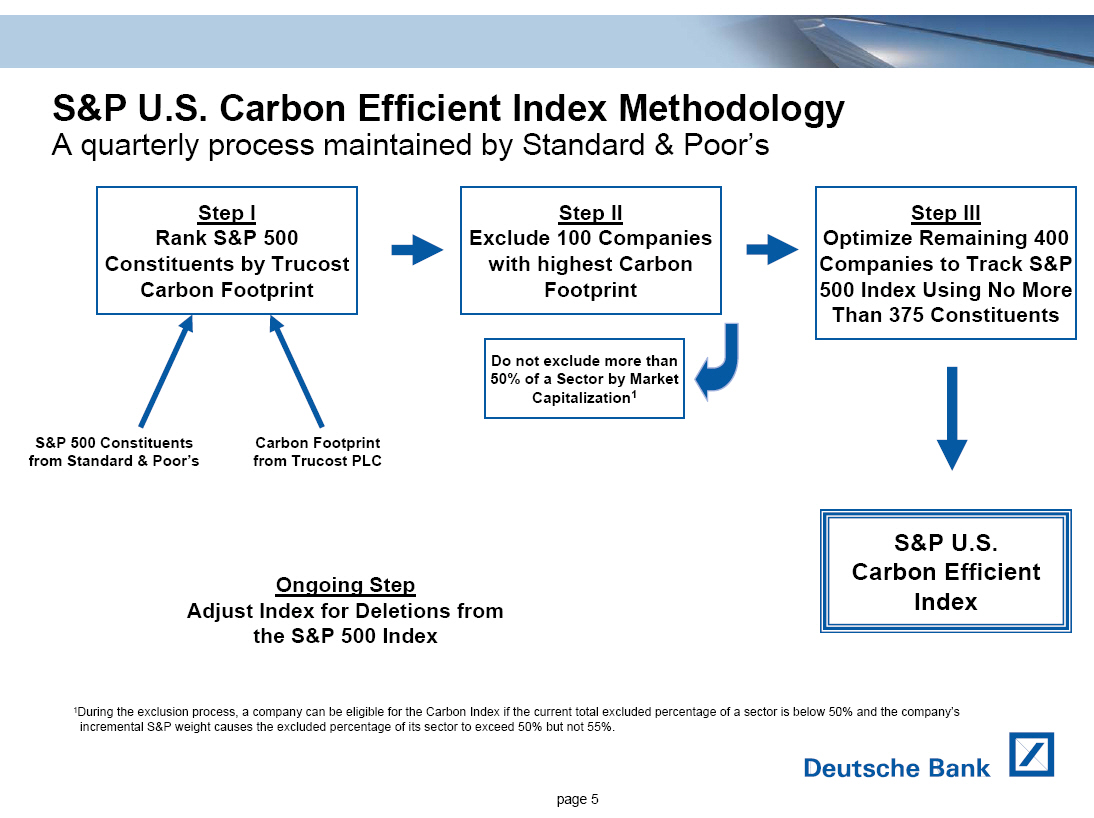
S&P U.S. Carbon Efficient Index Methodology
A quarterly process maintained by Standard & Poor's


             Step I                             Step II                 Step III
          Rank S&P 500                   Exclude 100 Companies   Optimize Remaining 400
    Constituents by Trucost               with highest Carbon    Companies to Track S&P
        Carbon Footprint                       Footprint        500 Index Using No More
                                                                 Than 375 Constituents

  S&P 500 Constituents   Carbon Footprint  Do not exclude more than
 from Standard & Poor's  from Trucost PLC  50% of a Sector by Market
                                               Capitalization1

                                                                             S&P U.S.
           Ongoing Step                                                  Carbon Efficient
 Adjust Index for Deletions from                                             Index
        the S&P 500 Index

1During the exclusion process, a company can be eligible for the Carbon Index if
the curent total excluded percentage of a sector is below 50% and the company's
incremental S&P weight cause the excluded percentage of its sector to exceed 50%
but not 55%.
|  |
Carbon Reduction Analysis: Annual Carbon Footprint Comparison (GHG Emissions/Annual Revenues) Source: Standard & Poor's, Trucost PLC | 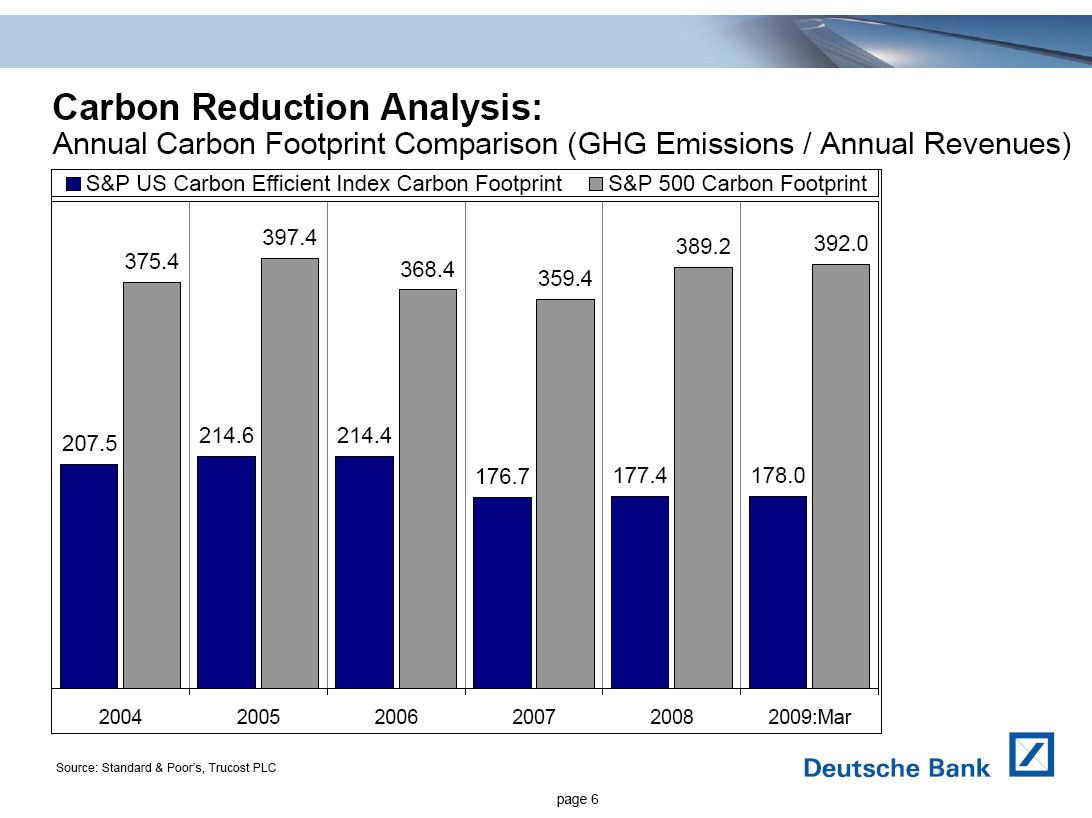 |
Carbon Reduction Analysis: Annual Total Carbon Emissions (Total GHG Emissions Tonnage) Source: Standard & Poor's, Trucost PLC | 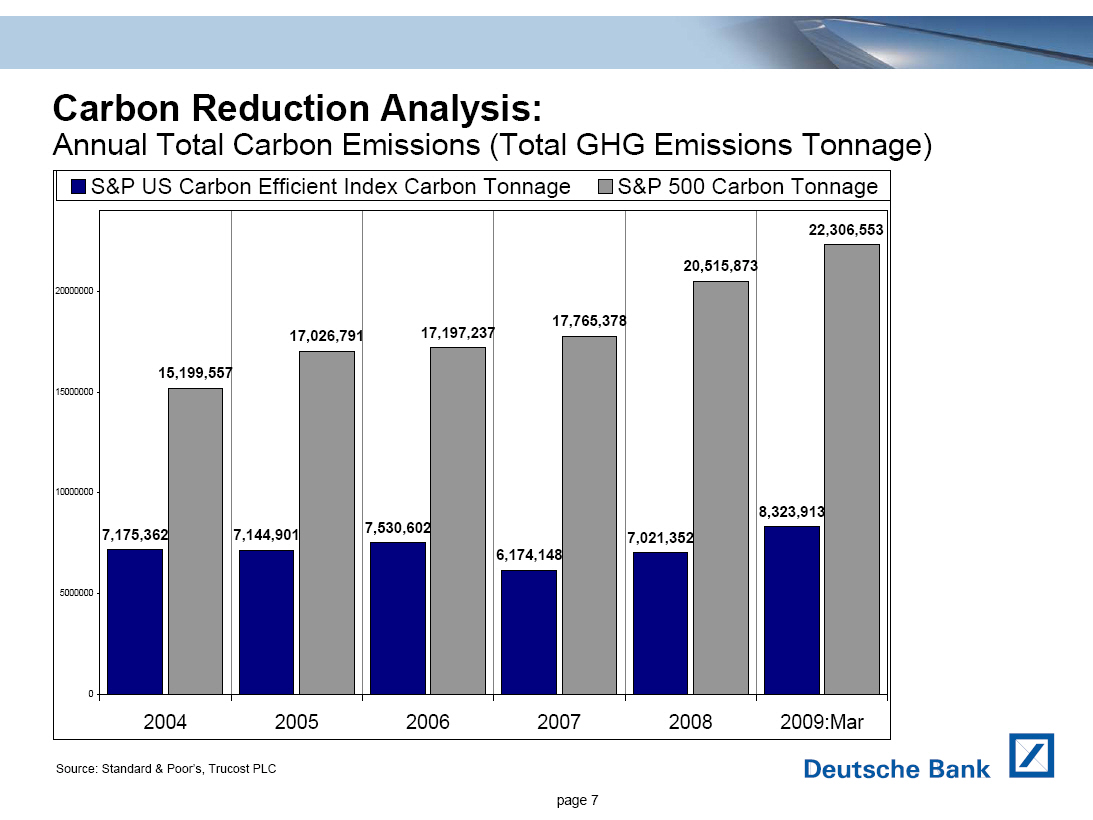 |
Carbon Reduction Analysis: Carbon Efficient Index vs S&P 500 From Sep. 2004 through Mar. 2009: Average Reduction in Carbon Footprint was 49% Average Reduction in Carbon Tonnage was 60% Source: Standard & Poor's, Trucost PLC | 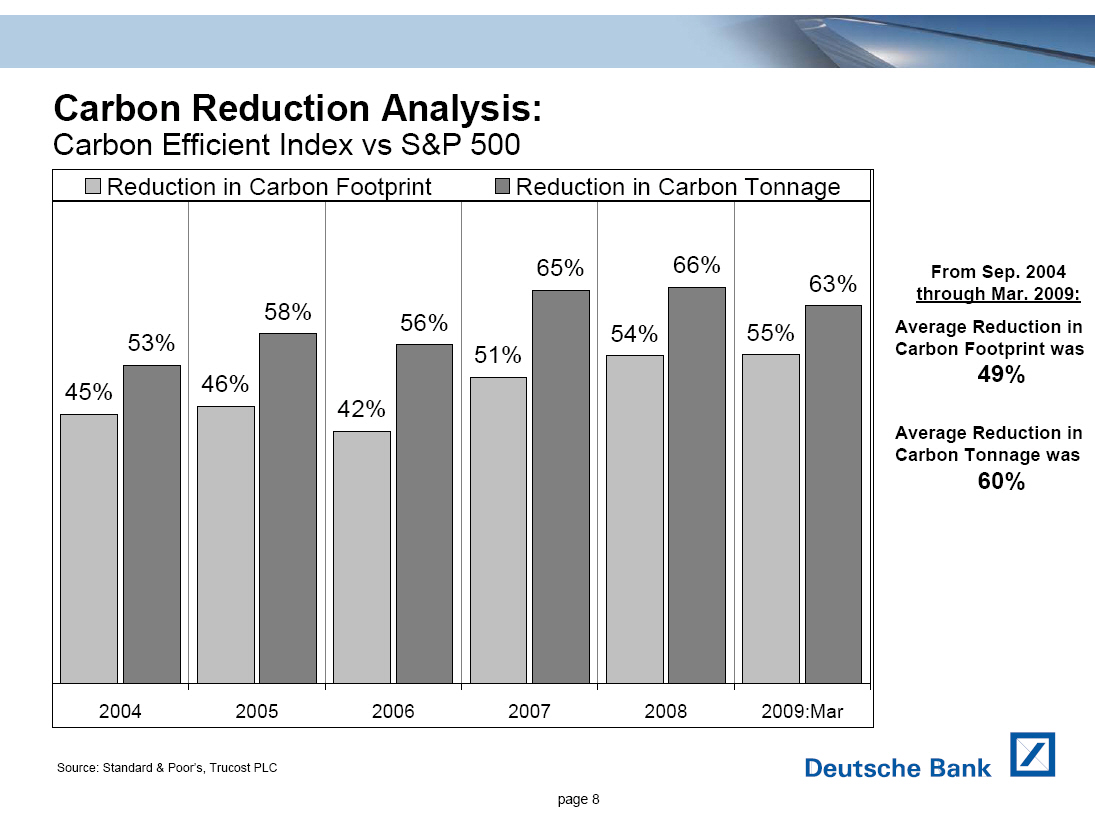 |
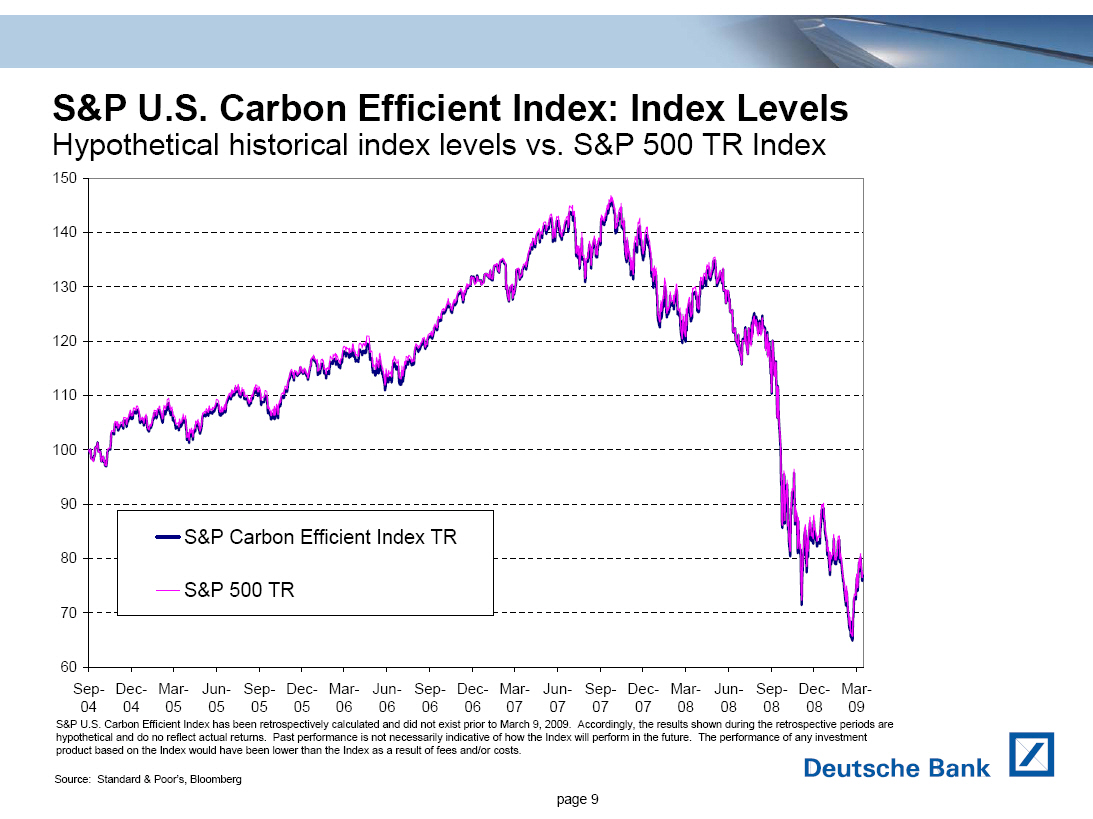
S&P U.S. Carbon Efficient Index: Index Levels

Hypothetical historical index levels vs. S&P 500 TR Index


                               [GRAPHIC OMITTED]


S&P U.S. Carbon Efficient Index has been retrospectively calculated and did not
Accordingly, the results shown during the exist prior to March 9, 2009.
retrospective periods are hypothetical and do no reflect actual returns. Past
performance is not necessarily indicative of how the Index will perform in the
future. The performance of any investment product based on the Index would have
been lower than the Index as a result of fees and/or costs.

                               [GRAPHIC OMITTED]

 Source: Standard & Poor's, Bloomberg        P              [Deutsche Bank Logo]

                                    Page 7
|  |
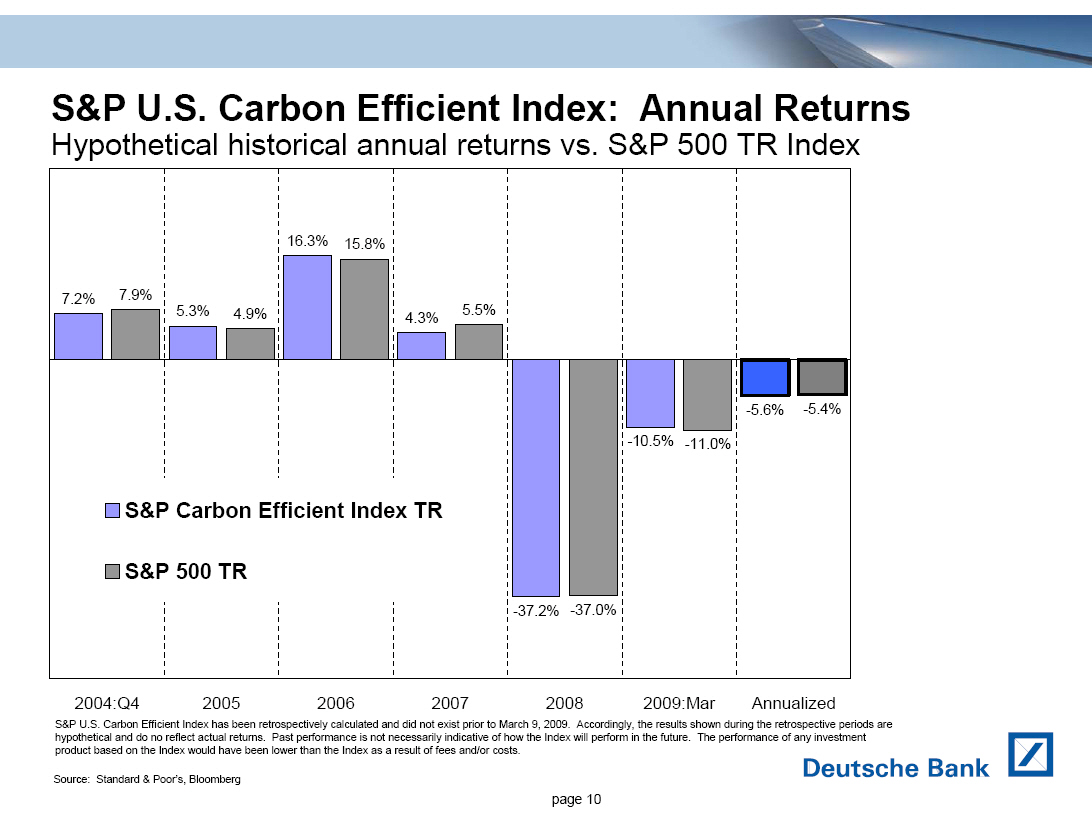
S&P U.S. Carbon Efficient Index:  Annual Returns

Hypothetical historical annual returns vs. S&P 500 TR Index


                               [GRAPHIC OMITTED]


S&P U.S. Carbon Efficient Index has been retrospectively calculated and did not
exist prior to March 9, 2009. Accordingly, the results shown during the
retrospective periods are hypothetical and do no reflect actual returns. Past
performance is not necessarily indicative of how the Index will perform in the
future. The performance of any investment product based on the Index would have
been lower than the Index as a result of fees and/or costs.

                               [GRAPHIC OMITTED]

 Source: Standard & Poor's, Bloomberg                       [Deutsche Bank Logo]

                                    Page 10
|  |
S&P U.S. Carbon Efficient Index:  Tracking Error

Hypothetical historical annual tracking error vs. S&P 500 TR Index


                               [GRAPHIC OMITTED]


        2004:Q4 begins on Index Inception
        Date, Sep 17, 2004
        Annualized Tracking Error is from Sep
        17, 2004 through March 31, 2009


S&P U.S. Carbon Efficient Index has been retrospectively calculated and did not
exist prior to March 9, 2009. Accordingly, the results shown during the
retrospective periods are hypothetical and do no reflect actual returns. Past
performance is not necessarily indicative of how the Index will perform in the
future. The performance of any investment product based on the Index would have
been lower than the Index as a result of fees and/or costs.

                               [GRAPHIC OMITTED]

 Source: Standard & Poor's, Bloomberg                       [Deutsche Bank Logo]

                                    Page 11
|  |
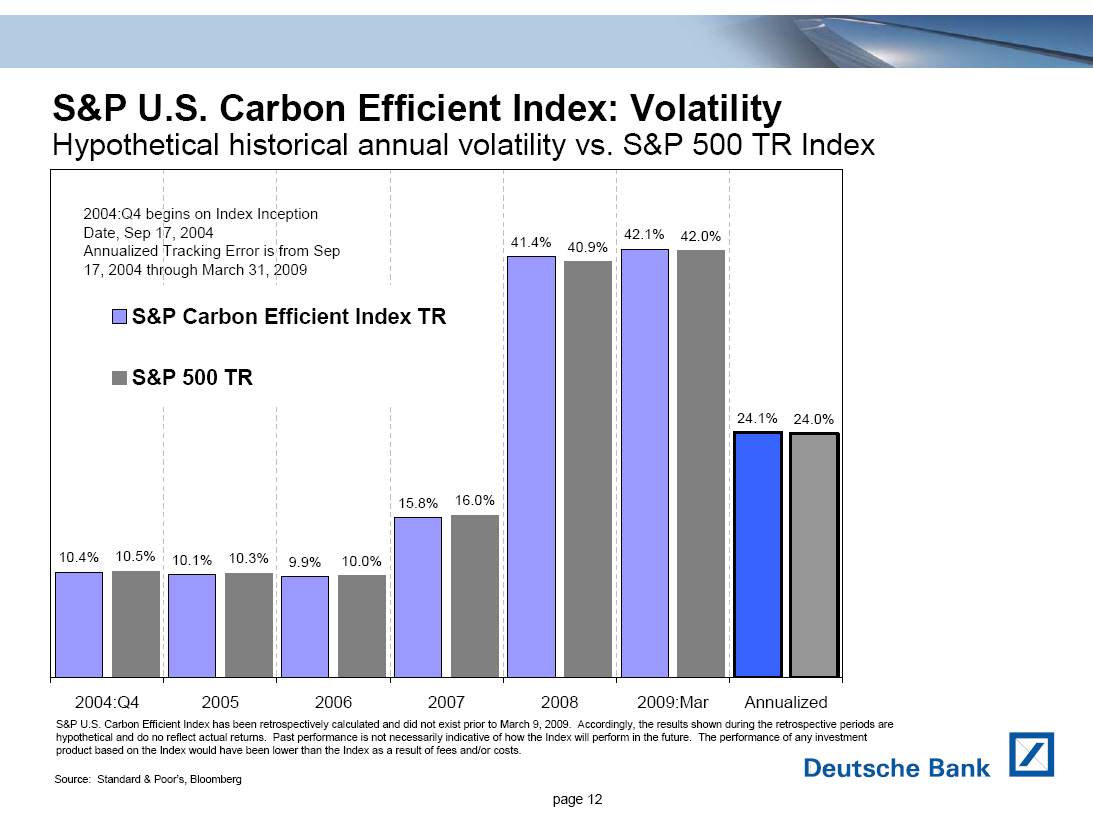
S&P U.S. Carbon Efficient Index: Volatility

Hypothetical historical annual volatility vs. S&P 500 TR Index


                               [GRAPHIC OMITTED]


2004:Q4 begins on Index Inception D
ate, Sep 17, 2004
Annualized Tracking Error
is from Sep 17, 2004 through March 31, 2009

        S&P Carbon Efficient Index TR

        S&P 500 TR


                               [GRAPHIC OMITTED]


S&P U.S. Carbon Efficient Index has been retrospectively calculated and did not
exist prior to March 9, 2009. Accordingly, the results shown during the
retrospective periods are hypothetical and do no reflect actual returns. Past
performance is not necessarily indicative of how the Index will perform in the
future. The performance of any investment product based on the Index would have
been lower than the Index as a result of fees and/or costs.

                               [GRAPHIC OMITTED]

 Source: Standard & Poor's, Bloomberg                       [Deutsche Bank Logo]

                                    Page 12

slide12
|  |
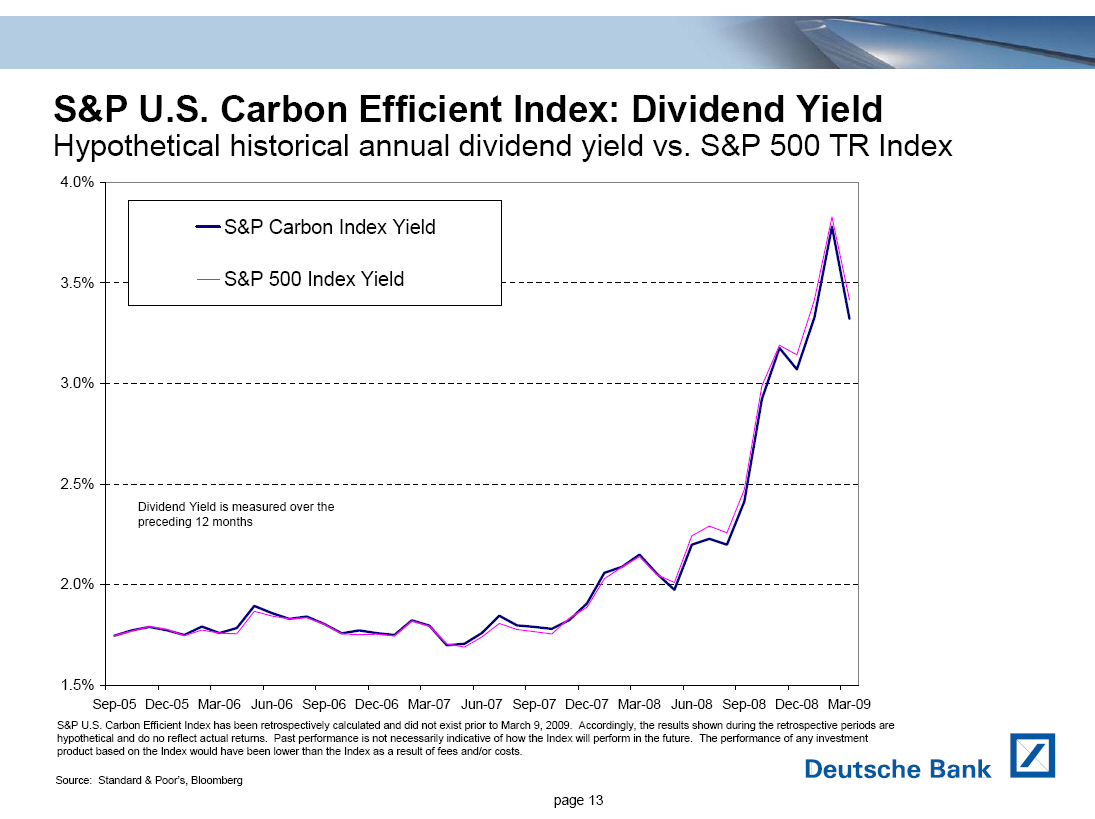
S&P U.S. Carbon Efficient Index: Dividend Yield
Hypothetical historical annual dividend yield vs. S&P 500 TR Index

 4.0%

                               [GRAPHIC OMITTED]

 S&P U.S. Carbon Efficient Index has been retrospectively calculated and did
 not Accordingly, the results shown during the exist prior to March 9, 2009.
 retrospective periods are hypothetical and do no reflect actual returns. Past
 performance is not necessarily indicative of how the Index will perform in the
 future. The performance of any investment product based on the Index would
 have been lower than the Index as a result of fees and/or costs.

                               [GRAPHIC OMITTED]

 Source: Standard & Poor's, Bloomberg                       [Deutsche Bank Logo]

                                    Page 13

slide13
|  |
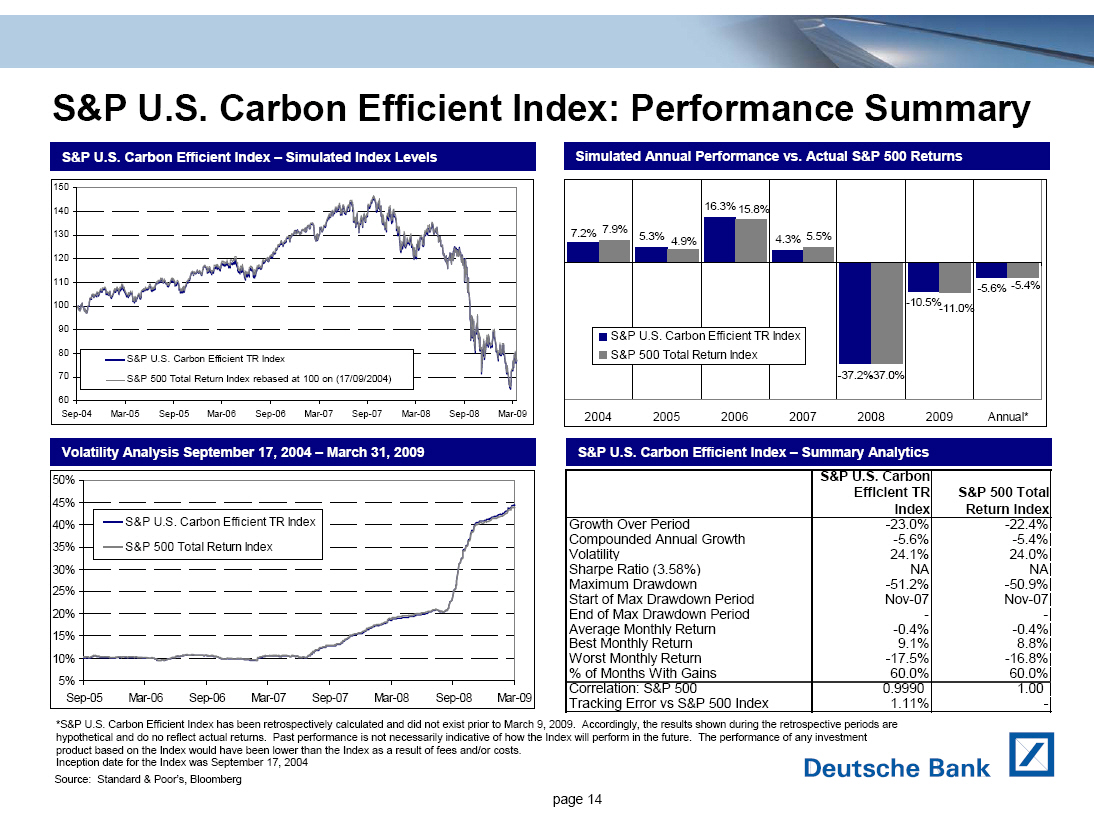
S&P U.S. Carbon Efficient Index: Performance Summary


                               [GRAPHIC OMITTED][
- --------------------------------------------------------------------------------
Volatility Analysis September 17, 2004 - March 31, 2009

                               GRAPHIC OMITTED]

- --------------------------------------------------------------------------------

Simulated Annual Performance vs. Actual S&P 500 ReturnsS&

                               GRAPHIC OMITTED]

- --------------------------------------------------------------------------------

ReturnsS&P U.S. Carbon Efficient Index - Summary Analytics
 -------------------------------------------------------------------------------
                                                S&P U.S. Carbon
                                                   Efficient TR    S&P 500 Total
                                                   Index Return            Index
 -------------------------------------------------------------------------------
 Growth Over Period                                      -23.0%         -22.4%
 Compounded Annual Growth                                 -5.6%          -5.4%
 Volatility                                               24.1%          24.0%
 Sharpe Ratio (3.58%)                                        NA             NA
 Maximum Drawdown                                        -51.2%         -50.9%
 Start of Max Drawdown Period                            Nov-07         Nov-07
 End of Max Drawdown Period                                   -              -
 Average Monthly Return                                   -0.4%          -0.4%
 Best Monthly Return                                       9.1%           8.8%
 Worst Monthly Return                                    -17.5%         -16.8%
 % of Months With Gains                                   60.0%          60.0%
- --------------------------------------------------------------------------------
 Correlation: S&P 500                                    0.9990           1.00
 Tracking Error vs S&P 500 Index                          1.11%              -
 -------------------------------------------------------------------------------

 *S&P U.S. Carbon Efficient Index has been retrospectively calculated and did
 not exist prior to March 9, 2009. Accordingly, the results shown during the
 retrospective periods are hypothetical and do no reflect actual returns. Past
 performance is not necessarily indicative of how the Index will perform in the
 future. The performance of any investment product based on the Index would
 have been lower than the Index as a result of fees and/or costs.


                               [GRAPHIC OMITTED]

 Source: Standard & Poor's, Bloomberg                       [Deutsche Bank Logo]

                                    Page 14

slide14
|  |
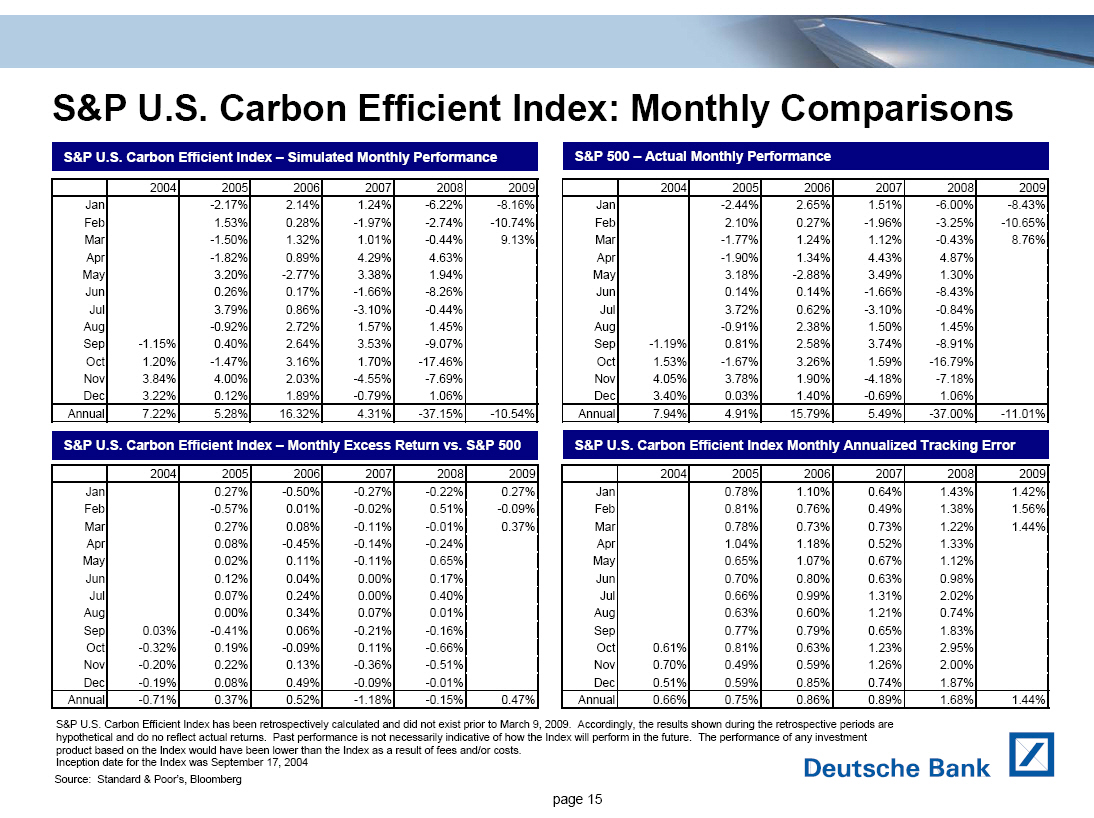
S&P U.S. Carbon Efficient Index: Monthly Comparisons
- --------------------------------------------------------------------------------
S&P U.S. Carbon Efficient Index - Simulated Monthly Performance
- --------------------------------------------------------------------------------
                2004        2005       2006        2007       2008        2009
- --------------------------------------------------------------------------------
      Jan                 -2.17%      2.14%       1.24%     -6.22%      -8.16%
      Feb                  1.53%      0.28%      -1.97%     -2.74%     -10.74%
      Mar                 -1.50%      1.32%       1.01%     -0.44%       9.13%
      Apr                 -1.82%      0.89%       4.29%      4.63%
      May                  3.20%     -2.77%       3.38%      1.94%
      Jun                  0.26%      0.17%      -1.66%     -8.26%
      Jul                  3.79%      0.86%      -3.10%     -0.44%
      Aug                 -0.92%      2.72%       1.57%      1.45%
      Sep     -1.15%       0.40%      2.64%       3.53%     -9.07%
      Oct      1.20%      -1.47%      3.16%       1.70%    -17.46%
      Nov      3.84%       4.00%      2.03%      -4.55%     -7.69%
      Dec      3.22%       0.12%      1.89%      -0.79%      1.06%
- --------------------------------------------------------------------------------
   Annual      7.22%       5.28%     16.32%       4.31%    -37.15%     -10.54%
- --------------------------------------------------------------------------------

- --------------------------------------------------------------------------------
S&P 500 - Actual Monthly Performance
- --------------------------------------------------------------------------------
                2004        2005       2006       2007        2008       2009
- --------------------------------------------------------------------------------
      Jan                 -2.44%      2.65%      1.51%      -6.00%     -8.43%
      Feb                  2.10%      0.27%     -1.96%      -3.25%    -10.65%
      Mar                 -1.77%      1.24%      1.12%      -0.43%      8.76%
      Apr                 -1.90%      1.34%      4.43%       4.87%
      May                  3.18%     -2.88%      3.49%       1.30%
      Jun                  0.14%      0.14%     -1.66%      -8.43%
      Jul                  3.72%      0.62%     -3.10%      -0.84%
      Aug                 -0.91%      2.38%      1.50%       1.45%
      Sep     -1.19%       0.81%      2.58%      3.74%      -8.91%
      Oct      1.53%      -1.67%      3.26%      1.59%     -16.79%
      Nov      4.05%       3.78%      1.90%     -4.18%      -7.18%
      Dec      3.40%       0.03%      1.40%     -0.69%       1.06%
- --------------------------------------------------------------------------------
   Annual      7.94%       4.91%     15.79%      5.49%     -37.00%    -11.01%
- --------------------------------------------------------------------------------

- --------------------------------------------------------------------------------
Carbon Efficient Index - Monthly Excess Return vs. S&P 500
- --------------------------------------------------------------------------------
                2004        2005       2006        2007       2008        2009
- --------------------------------------------------------------------------------
      Jan                  0.27%     -0.50%      -0.27%     -0.22%       0.27%
      Feb                 -0.57%      0.01%      -0.02%      0.51%      -0.09%
      Mar                  0.27%      0.08%      -0.11%     -0.01%       0.37%
      Apr                  0.08%     -0.45%      -0.14%     -0.24%
      May                  0.02%      0.11%      -0.11%      0.65%
      Jun                  0.12%      0.04%       0.00%      0.17%
      Jul                  0.07%      0.24%       0.00%      0.40%
      Aug                  0.00%      0.34%       0.07%      0.01%
      Sep      0.03%      -0.41%      0.06%      -0.21%     -0.16%
      Oct     -0.32%       0.19%     -0.09%       0.11%     -0.66%
      Nov     -0.20%       0.22%      0.13%      -0.36%     -0.51%
      Dec     -0.19%       0.08%      0.49%      -0.09%     -0.01%
- --------------------------------------------------------------------------------
   Annual     -0.71%       0.37%      0.52%      -1.18%     -0.15%       0.47%
- --------------------------------------------------------------------------------

- --------------------------------------------------------------------------------
S&P U.S. Carbon Efficient Index Monthly Annualized Tracking Error
- --------------------------------------------------------------------------------
                2004       2005        2006       2007        2008       2009
- --------------------------------------------------------------------------------
      Jan                 0.78%       1.10%      0.64%       1.43%      1.42%
      Feb                 0.81%       0.76%      0.49%       1.38%      1.56%
      Mar                 0.78%       0.73%      0.73%       1.22%      1.44%
      Apr                 1.04%       1.18%      0.52%       1.33%
      May                 0.65%       1.07%      0.67%       1.12%
      Jun                 0.70%       0.80%      0.63%       0.98%
      Jul                 0.66%       0.99%      1.31%       2.02%
      Aug                 0.63%       0.60%      1.21%       0.74%
      Sep                 0.77%       0.79%      0.65%       1.83%
      Oct      0.61%      0.81%       0.63%      1.23%       2.95%
      Nov      0.70%      0.49%       0.59%      1.26%       2.00%
      Dec      0.51%      0.59%       0.85%      0.74%       1.87%
- --------------------------------------------------------------------------------
   Annual      0.66%      0.75%       0.86%      0.89%       1.68%      1.44%
- --------------------------------------------------------------------------------
S&P U.S. Carbon Efficient Index has been retrospectively calculated and did not
Accordingly, the results shown during the exist prior to March 9, 2009.
retrospective periods are hypothetical and do no reflect actual returns. Past
performance is not necessarily indicative of how the Index will perform in the
future. The performance of any investment product based on the Index would have
been lower than the Index as a result of fees and/or costs.
Inception date for the Index was September 17, 2004

 Source: Standard & Poor's, Bloomberg                       [Deutsche Bank Logo]

                                    Page 15

slide15
|  |
Contacts OMITTED]

[]   GM Structuring - Quantitative Products - Americas
     Markus E. Barth - T. +1 212 250 4608 Michael Nadel - T. +1 212 250 8866

[]   GM Structuring - Quantitative Products - Europe
       Emanuele Di Stefano - T. +44 207 547 3541

[]   GM Structuring - Quantitative Products - Asia
       Christian Pemberton - T. +852 220 36112
       Chrif Youssfi - T. +852 220 36014

[]   GM Structuring - Quantitative Products - Japan
       Masahiro Oshige - T. +81 (3) 5156 6802
       Tomoyuki Sasai - T. +81 (3) 5156 6814

[]   Structured Equity Products Sales Team - US
       T. +1 212 250 9905

 Source: Standard & Poor's, Bloomberg              16       [Deutsche Bank Logo]

                                    Page 16


slide16
|  |
[DisclaimerITTED]

This document is intended for discussion purposes only and does not create any
legally binding obligations on the part of Deutsche Bank AG and/or its
affiliates ("DB"). When making an investment decision, you should rely solely
on the final documentation relating to the transaction and not the summary
contained herein. DB is not acting as your financial adviser or in any other
fiduciary capacity with respect to this proposed transaction. The transactions
or products mentioned herein may not be appropriate for all investors and
before entering into any transaction you should take steps to ensure that you
fully understand the transaction and have made an independent assessment of the
appropriateness of the transaction in the light of your own objectives and
circumstances, including the possible risks and benefits of entering into such
transaction. For general information regarding the nature and risks of the
proposed transaction and types of financial instruments please go to
www.globalmarkets.db.com/riskdisclosures. You should also consider seeking
advice from your own advisers in making this assessment. If you decide to enter
into a transaction with DB, you do so in reliance on your own judgment.
Assumptions, estimates and opinions contained in this document constitute our
judgment as of the date of the document and are subject to change without
notice. Any projections are based on a number of assumptions as to market
conditions and there can be no guarantee that any projected results will be
achieved. Past performance is not a guarantee of future results. This material
was prepared by a Sales or Trading function within DB, and was not produced,
reviewed or edited by the Research Department. Any opinions expressed herein
may differ from the opinions expressed by other DB departments including the
Research Department. Sales and Trading functions are subject to additional
potential conflicts of interest which the Research Department does not face. DB
may engage in transactions in a manner inconsistent with the views discussed
herein. DB trades or may trade as principal in the instruments (or related
derivatives), and may have proprietary positions in the instruments (or related
derivatives) discussed herein. DB may make a market in the instruments (or
related derivatives) discussed herein. Sales and Trading personnel are
compensated in part based on the volume of transactions effected by them. The
distribution of this document and availability of these products and services
in certain jurisdictions may be restricted by law. DB is authorised under
German Banking Law (competent authority: BaFin - Federal Financial Supervising
Authority) and regulated by the Financial Services Authority for the conduct of
UK business.

"The Products are not sponsored, endorsed, sold or promoted by Standard &
Poor's, a division of The McGraw-Hill Companies, Inc. ("S&P"). Standard &
Poor's does not make any representation or warranty, express or implied, to the
owners of the Products or any member of the public regarding the advisability
of investing in securities generally or in the Products particularly or the
ability of the S&P Indices to track general stock market performance. S&P's
only relationship to the Licensee is the licensing of certain trademarks and
trade names of S&P and of the S&P Indices, which indices are determined,
composed and calculated by S&P without regard to the Licensee or the Products.
S&P has no obligation to take the needs of the Licensee or the owners of the
Products into consideration in determining, composing or calculating the S&P
Indices. S&P is not responsible for and have not participated in the
determination of the timing of, prices at, or quantities of the Products to be
issued or in the determination or calculation of the equation by which the
Products are to be converted into cash. S&P has no obligation or liability in
connection with the administration, marketing or trading of the Products.

S&P DOES NOT GUARANTEE THE ACCURACY AND/OR THE COMPLETENESS OF THE S&P INDICES
OR ANY DATA INCLUDED THEREIN AND S&P SHALL HAVE NO LIABILITY FOR ANY ERRORS,
OMISSIONS, OR INTERRUPTIONS THEREIN. S&P MAKES NO WARRANTY, EXPRESS OR IMPLIED,
AS TO RESULTS TO BE OBTAINED BY LICENSEE, OWNERS OF THE PRODUCTS OR ANY OTHER
PERSON OR ENTITY FROM THE USE OF THE S&P INDICES OR ANY DATA INCLUDED THEREIN.
S&P MAKES NO EXPRESS OR IMPLIED WARRANTIES, AND EXPRESSLY DISCLAIMS ALL
WARRANTIES OF MERCHANTABILITY OR FITNESS FOR A PARTICULAR PURPOSE OR USE WITH
RESPECT TO THE S&P INDICES OR ANY DATA INCLUDED THEREIN. WITHOUT LIMITING ANY
OF THE FOREGOING, IN NO EVENT SHALL S&P HAVE ANY LIABILITY FOR ANY SPECIAL,
PUNITIVE, INDIRECT, OR CONSEQUENTIAL DAMAGES (INCLUDING LOST PROFITS), EVEN IF
NOTIFIED OF THE POSSIBILITY OF SUCH DAMAGES.

                                                            [Deutsche Bank Logo]
                                    Page 17
slide17
|  |
Important Information

Deutsche Bank AG has filed a registration statement (including a prospectus)
with the Securities and Exchange Commission, or SEC, for offerings to which
this communication relates. Before you invest, you should read the prospectus
in that registration statement and the other documents relating to such
offering that Deutsche Bank AG has filed with the SEC for more complete
information about Deutsche Bank AG and the offering. You may obtain these
documents without cost by visiting EDGAR on the SEC website at www.sec.gov.
Alternatively, Deutsche Bank AG, any agent or any dealer participating in the
offering will arrange to send you the prospectus if you so request by calling
toll-free 1-800-311-4409.

Risk Factors
LIMITED HISTORY OF THE INDEX -- Publication of the Index began on March 9,
2009. Therefore, the Index has very limited performance history, and no actual
investments which allowed a tracking of the performance of the Index was
possible before that date.

STANDARD & POOR'S, AS THE SPONSOR OF THE INDEX, MAY ADJUST THE INDEX IN A WAY
THAT AFFECTS ITS LEVEL--Standard & Poor's, as the sponsor of the Index, is
responsible for calculating and maintaining the Index. The sponsor can make
methodological changes that could affect the level of the Index. You should
realize that any changes in the components of the Index, as well as changes in
the components of the S&P 500 Index, may affect the Index, as any newly added
component stock may perform significantly better or worse than the component
stock it replaces.

INDEX STRATEGY RISK -- The Index seeks to closely track the S&P 500 Index
performance with a basket of stocks having a lower carbon footprint and
greenhouse gas emissions. AN INVESTMENT LINKED OR RELATED TO THE INDEX IS NOT
THE SAME AS AN INVESTMENT IN THE S&P 500 INDEX OR IN ANY OF ITS UNDERLYING
COMPONENTS. The Index may not successfully track the market performance of the
S&P 500 Index.

                                                            [Deutsche Bank Logo]
                                    Page 18

slide18
|  |