                                           Registration Statement No. 333-137902
                                                     Dated May 7, 2009; Rule 433


                            Commodity-Linked Indices

Deutsche Bank Liquid Commodity Index - Mean Reversion and Mean Reversion Plus


                                    May 2009

The instruments described in this presentation are hybrid instruments under the
Commodity Exchange Act ("CEA").

As such, the instruments are not contracts of sale of a commodity for future
delivery (or options on such contracts) and are not subject to the CEA.
                                                                             p01
|  |
Disclaimer

Commodities are speculative and highly volatile. The risk of loss in trading
commodities can be substantial. Commodity prices may be subject to substantial
and unpredictable fluctuations over short periods of time and may be affected
by, among other things, a wide variety of regulatory, monetary and/or economic
developments and policies. Prospective investors must independently assess the
appropriateness of an investment in commodities in light of their own financial
situation and investment objectives.


The price of an instrument and the commodities which comprise the index may be
affected by numerous market factors, including events in the market for
commodities, the equity markets, the bond market and the foreign exchange
market, fluctuations in interest rates, and world economic, political and
regulatory events. A rise in the value of one commodity may be offset by a fall
in the value of one or more of the other commodities comprising the index.

Commodity prices can be highly volatile and may impact negatively the value of
an instrument. Volatility around the time of maturity could have a significant
impact on the overall performance of an investment.

The value of any instrument linked to either index described herein will depend
on, among other things, fluctuations in interest rates, the value of the
commodities underlying the index, the time remaining to the maturity date, and
associated options markets and hedging costs of the issuer. The value of any
instrument may start to decline significantly if the value of the index is below
the level of the index on the issue date of the instrument. Price movements may
also be caused by changes in the credit spread of the issuer.

The receipt by the investor of monies owed under instruments linked to either
index described herein is subject to and dependent on the issuer's abilities to
pay such monies. Consequently, investors are subject to a counterparty risk and
are susceptible to risks relating to the creditworthiness of the issuer.

                                     page 2
                                                                             p02
|  |
Contents

Deutsche Bank Liquid Commodity Index - Mean Reversion TM and Mean Reversion Plus(TM)

o    Executive Summary

o    Sources of Return in Commodities

o    The Deutsche Bank Liquid Commodity Index - Mean Reversion TM

o    The Deutsche Bank Liquid Commodity Index - Mean Reversion Plus TM

o    Performance and Descriptive Statistics

o    Market Data Sources

                                     page 3
                                                                             p03
|  |
Executive Summary

Why invest in Commodities via an Index?

o    An investment in a commodity index is a simple way for an investor to gain
     exposure to the asset class while insulating them from the mechanics of
     rolling futures and posting collateral

o    Transparent, rule-based roll mechanism eliminates human intervention


Characteristics of Commodities

o    Commodities are an asset class in their own right and exhibit unique
     characteristics

     o    Low to negative correlation with traditional asset classes

     o    Historically exhibit mean reversion

     o    Positive correlation with inflation on a historical basis

                                     page 4
                                                                             p04
|  |
Sources of Return in Commodities

Commodity indices invest in futures contracts and are subject to the impact of
"roll return."

Spot Return:  Return resulting from the change in the value of a commodity futures contract

Roll Return:  Return from the change in value of a commodity futures contract resulting from
              its movement over time along its forward curve - also known as "roll yield" or
              "carry."

Backwardation:*  The roll return  (carry) is Positive

     o    Negative slope or inverted "backward" forward curve
     o    Supply disruption price elasticity
     o    Risk premium at near-term delivery - "convenience yield" theory

Contango:*       The roll return (carry) is Negative

     o    Positive slope or "normal" upward forward curve
     o    Typically reflects markets that are not as price elastic to supply
          shocks
     o    Market participants pay a "cost of carry" for deferred payment and
          delivery
     o    Time value of money, storage costs and delivery are all priced into
          the deferred premium

*Definitions:

Backwardation: market condition where the futures price is lower in the distant
delivery months than in the near delivery months

Contango: market condition where the future price for distant delivery is higher
than near delivery months, often due to the costs of storing and insuring the
underlying commodity; opposite of backwardation

                                     page 5
                                                                             p05
|  |
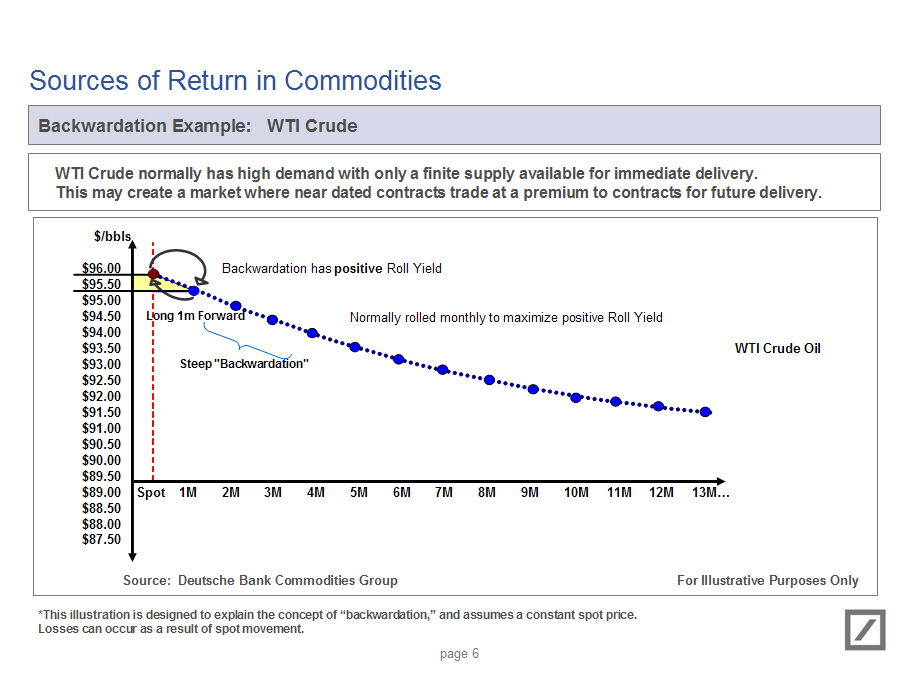
Sources of Return in Commodities

Backwardation Example: WTI Crude

WTI Crude normally has high demand with only a finite supply available for
immediate delivery. This may create a market where near dated contracts trade at
a premium to contracts for future delivery.

                                [GRAPHIC OMITTED]

*This illustration is designed to explain the concept of "backwardation," and
assumes a constant spot price.

Losses can occur as a result of spot movement.

                                     page 6
                                                                             p06
|  |
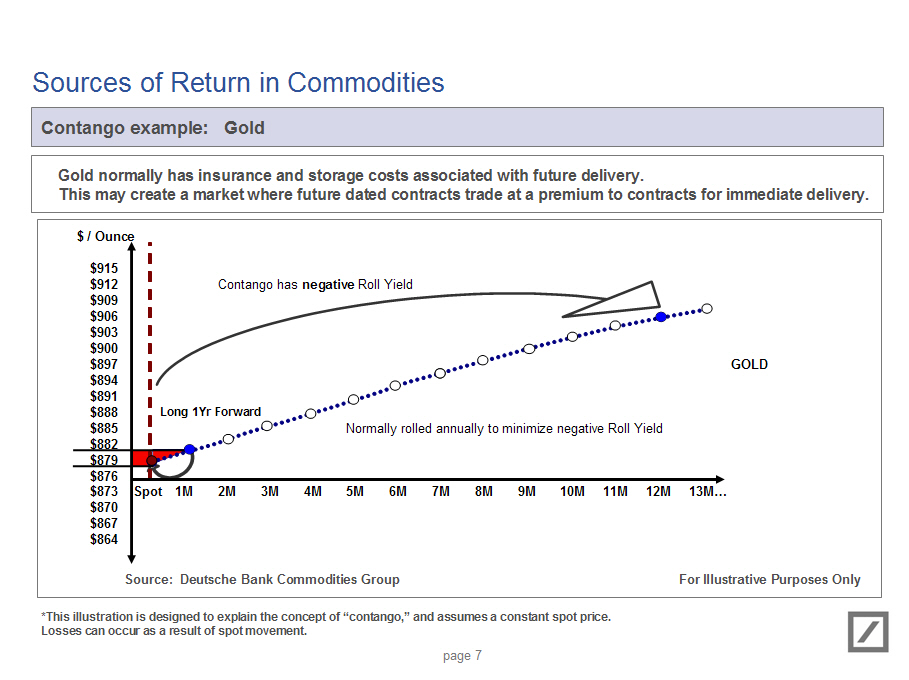
Sources of Return in Commodities

Contango example: Gold


Gold normally has insurance and storage costs associated with future delivery.
This may create a market where future dated contracts trade at a premium to
contracts for immediate delivery.

                               [GRAPHIC OMITTED]

*This illustration is designed to explain the concept of "contango," and assumes
a constant spot price.
Losses can occur as a result of spot movement.

                                     page 7
|  |
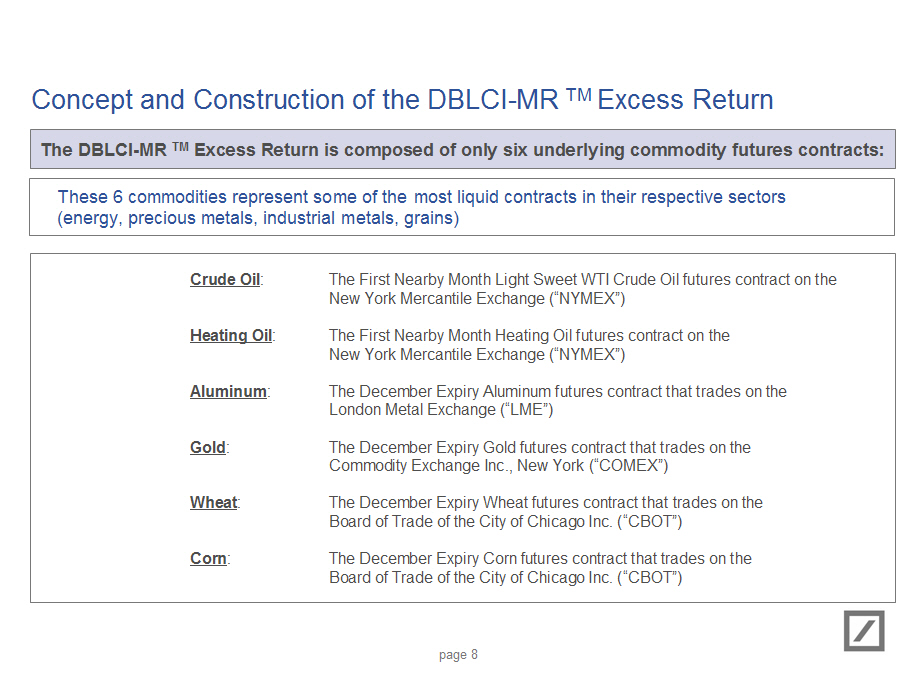
Concept and Construction of the DBLCI-MR TM Excess Return

The DBLCI-MR TM Excess Return is composed of only six underlying commodity
futures contracts:

These 6 commodities represent some of the most liquid contracts in their
respective sectors (energy, precious metals, industrial metals, grains)

  Crude Oil:                 The First Nearby Month Light Sweet WTI Crude Oil
                             futures contract on the New York Mercantile
                             Exchange ("NYMEX")

  Heating Oil:               The First Nearby Month Heating Oil futures contract
                             on the New York Mercantile Exchange ("NYMEX")

  Aluminum:                  The December Expiry Aluminum futures contract that
                             trades on the London Metal Exchange ("LME")

  Gold:                      The December Expiry Gold futures contract that
                             trades on the Commodity Exchange Inc., New York
                             ("COMEX")

  Wheat:                     The December Expiry Wheat futures contract that
                             trades on the Board of Trade of the City of Chicago
                             Inc. ("CBOT")

  Corn:                      The December Expiry Corn futures contract that
                             trades on the Board of Trade of the City of Chicago
                             Inc. ("CBOT")

                                     page 8
|  |
Concept and Construction of the DBLCI-MR TM Excess Return

Weighting of the Index mechanically rebalances


o    The DBLCI - MR TM mechanically rebalances its 6 constituent commodities
     such that "expensive" commodities have their weights reduced while "cheap"
     commodities have their weights increased. This is done according to a
     simple, pre-defined formula.

o    A rebalancing will occur whenever one of the commodities undergoes a
     "trigger event." A trigger event occurs when the one-year moving average
     price of the commodity trades +/- 5% than the five- year moving average.

o    The DBLCI-MR Plus TM combines the DBLCI-MR's approach to optimizing
     sector-allocation in commodities with a quantitative rule-based momentum
     strategy that aims to reduce exposure and maintain returns during downturns
     in commodity markets.

o    The entire rebalancing process is rule-based and mandatory.

                                     page 9
                                                                             p09
|  |
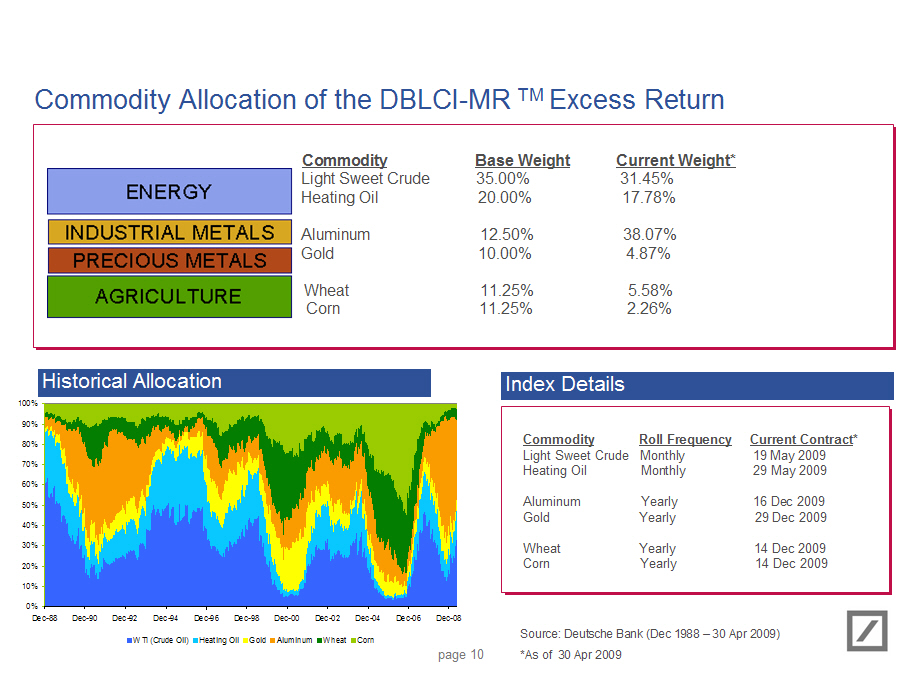
Commodity Allocation of the DBLCI-MR TM Excess Return
- --------------------------------------------------------------------
                   Commodity            Base Weight  Current Weight*
                   ---------            -----------  ---------------
ENERGY             Light Sweet Crude    35.00%       31.45%
                   Heating Oil          20,00%       17.78%

INDUSTRIAL METALS  Aluminum             12.50%       38.07%
                   Gold                 10.00%        4.87%

AGRICULTURE        Wheat                11.25%        5.58%
                   Corn                 11.25%        2.26%
- --------------------------------------------------------------------

Historical Allocation

[GRAPHIC OMITTED]


Index Details
- ---------------------------------------------------------------------------
Commodity                Roll Frequency      Current Contract*
- ---------                --------------      -----------------
Light Sweet Crude        Monthly             19 May 2009
Heating Oil              Monthly             29 May 2009

Aluminum                 Yearly              16 Dec 2009
Gold                     Yearly              29 Dec 2009

Wheat                    Yearly              14 Dec 2009
Corn                     Yearly              14 Dec 2009
- ---------------------------------------------------------------------------

                                    page 10
                                                                             p10
|  |
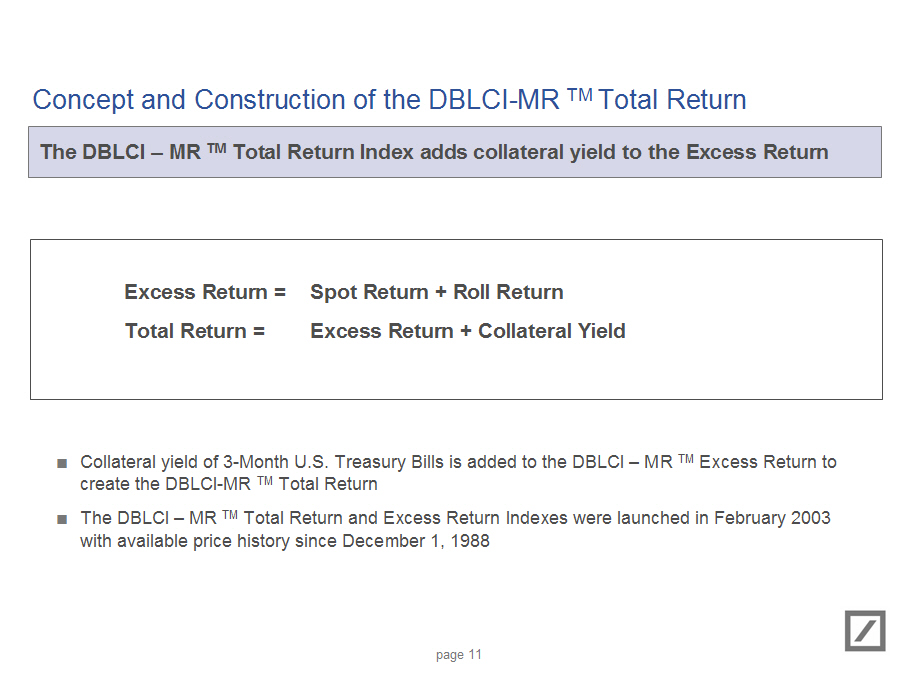
Concept and Construction of the DBLCI-MR TM Total Return

The DBLCI - MR TM Total Return Index adds collateral yield to the Excess Return


- --------------------------------------------------------------------------------
                    Excess Return = Spot Return + Roll Return

                 Total Return = Excess Return + Collateral Yield
- --------------------------------------------------------------------------------


o    Collateral yield of 3-Month U.S. Treasury Bills is added to the DBLCI - MR
     TM Excess Return to create the DBLCI-MR TM Total Return

o    The DBLCI - MR TM Total Return and Excess Return Indexes were launched in
     February 2003 with available price history since December 1, 1988

                                    page 11
                                                                             p11
|  |
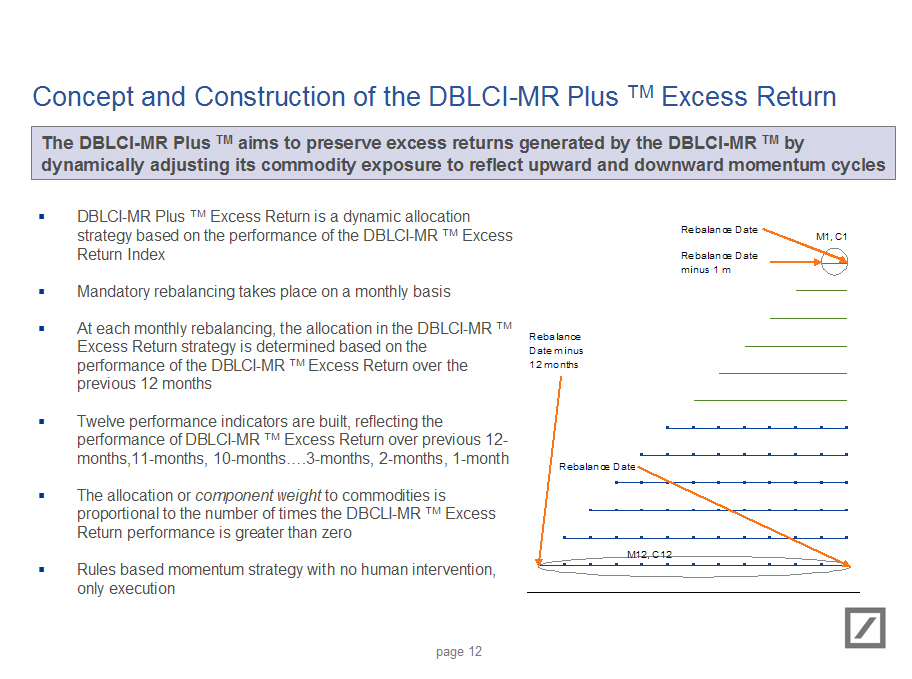
Concept and Construction of the DBLCI-MR Plus TM Excess Return

The DBLCI-MR Plus TM aims to preserve excess returns generated by the DBLCI-MR
TM by dynamically adjusting its commodity exposure to reflect upward and
downward momentum cycles

o    DBLCI-MR Plus TM Excess Return is a dynamic allocation strategy based on
     the performance of the DBLCI-MR TM Excess Return Index

o    Mandatory rebalancing takes place on a monthly basis

o    At each monthly rebalancing, the allocation in the DBLCI-MR TM Excess
     Return strategy is determined based on the performance of the DBLCI-MR TM
     Excess Return over the previous 12 months

o    Twelve performance indicators are built, reflecting the performance of
     DBLCI-MR TM Excess Return over previous 12- months,11-months,
     10-months�.3-months, 2-months, 1-month

o    The allocation or component weight to commodities is proportional to the
     number of times the DBCLI-MR TM Excess Return performance is greater than
     zero

o    Rules based momentum strategy with no human intervention, only execution

                               [GRAPHIC OMITTED]

                                    page 12
                                                                             p12
|  |
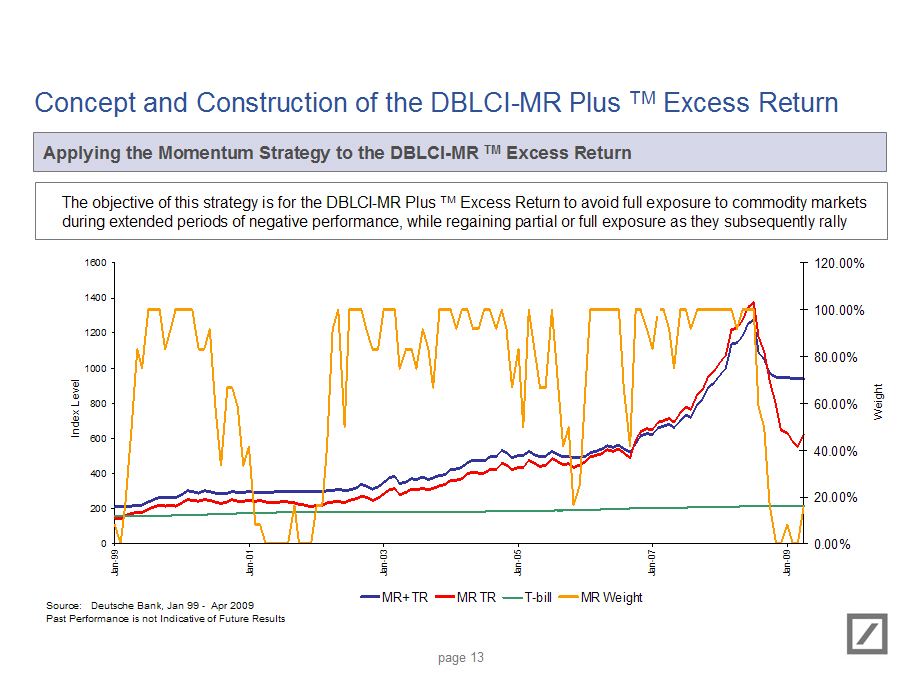
Concept and Construction of the DBLCI-MR Plus TM Excess Return

Applying the Momentum Strategy to the DBLCI-MR TM Excess Return


The objective of this strategy is for the DBLCI-MR Plus TM Excess Return to
avoid full exposure to commodity markets during extended periods of negative
performance, while regaining partial or full exposure as they subsequently rally

                               [GRAPHIC OMITTED]

                                    page 13
                                                                             p13
|  |
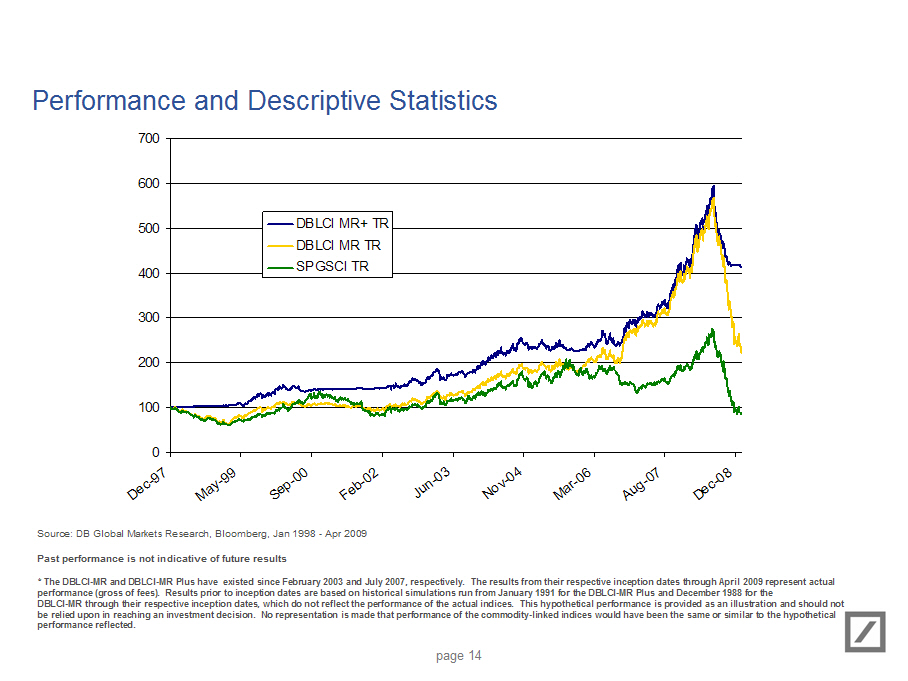
Performance and Descriptive Statistics

                               [GRAPHIC OMITTED]

Past performance is not indicative of future results

* The DBLCI-MR and DBLCI-MR Plus have existed since February 2003 and July 2007,
respectively. The results from their respective inception dates through April
2009 represent actual performance (gross of fees). Results prior to inception
dates are based on historical simulations run from January 1991 for the DBLCI-MR
Plus and December 1988 for the DBLCI-MR through their respective inception
dates, which do not reflect the performance of the actual indices. This
hypothetical performance is provided as an illustration and should not be relied
upon in reaching an investment decision. No representation is made that
performance of the commodity-linked indices would have been the same or similar
to the hypothetical performance reflected.

                                    page 14
                                                                             p14
|  |
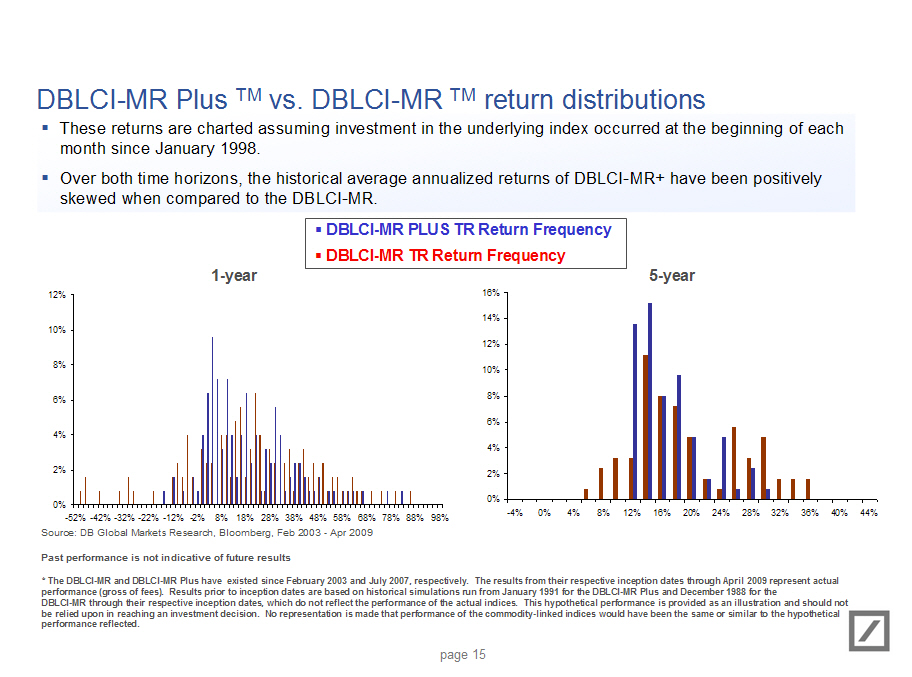
DBLCI-MR Plus TM vs. DBLCI-MR TM return distributions

o    These returns are charted assuming investment in the underlying index
     occurred at the beginning of each month since January 1998.

o    Over both time horizons, the historical average annualized returns of
     DBLCI-MR+ have been positively skewed when compared to the DBLCI-MR.


                      o DBLCI-MR PLUS TR Return Frequency

                         o DBLCI-MR TR Return Frequency


                               [GRAPHIC OMITTED]

Past performance is not indicative of future results

* The DBLCI-MR and DBLCI-MR Plus have existed since February 2003 and July 2007,
respectively. The results from their respective inception dates through April
2009 represent actual performance (gross of fees). Results prior to inception
dates are based on historical simulations run from January 1991 for the DBLCI-MR
Plus and December 1988 for the DBLCI-MR through their respective inception
dates, which do not reflect the performance of the actual indices. This
hypothetical performance is provided as an illustration and should not be relied
upon in reaching an investment decision. No representation is made that
performance of the commodity-linked indices would have been the same or similar
to the hypothetical performance reflected.

                                    page 15
                                                                             p15
|  |
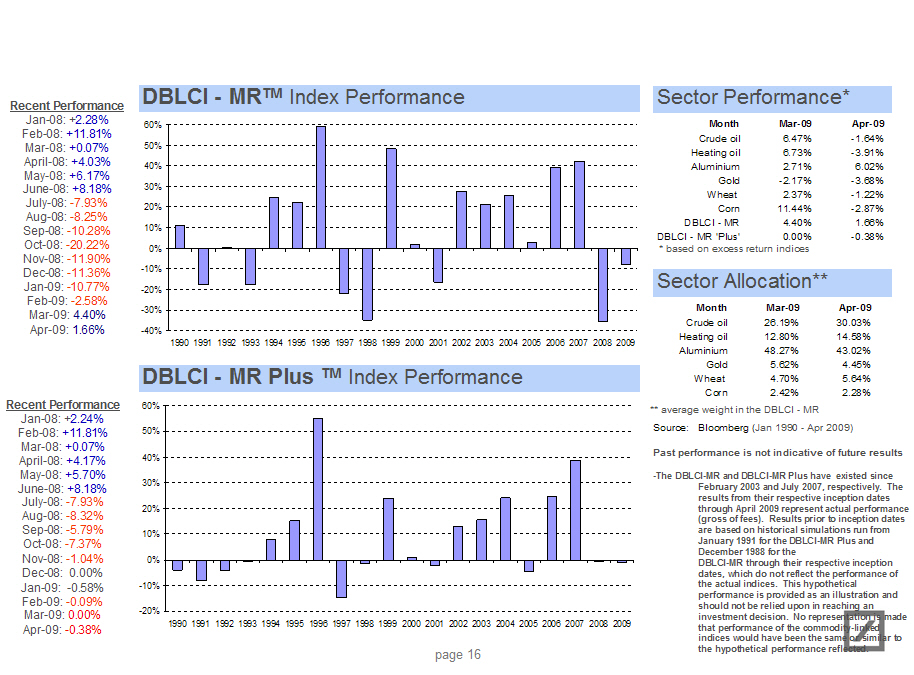
Recent Performance

 Jan-08: +2.28%
 Feb-08: +11.81%
 Mar-08: +0.07%
 April-08: +4.03%
 May-08: +6.17%
 June-08: +8.18%
 July-08: -7.93%
 Aug-08: -8.25%
 Sep-08: -10.28%
 Oct-08: -20.22%
 Nov-08: -11.90%
 Dec-08: -11.36%
 Jan-09: -10.77%
 Feb-09: -2.58%
 Mar-09: 4.40%
 Apr-09: 1.66%


Recent Performance

 Jan-08: +2.24%
 Feb-08: +11.81%
 Mar-08: +0.07%
 April-08: +4.17%
 May-08: +5.70%
 June-08: +8.18%
 July-08: -7.93%
 Aug-08: -8.32%
 Sep-08: -5.79%
 Oct-08: -7.37%
 Nov-08: -1.04%
 Dec-08:  0.00%
 Jan-09:  -0.58%
 Feb-09: -0.09%
 Mar-09: 0.00%
 Apr-09: -0.38%

[GRAPHIC OMITTED]

  Sector Performance*

               Month         Mar-09    Apr-09
           Crude oil          6.47%    -1.64%
         Heating oil          6.73%    -3.91%
           Aluminium          2.71%     6.02%
                Gold         -2.17%    -3.68%
               Wheat          2.37%    -1.22%
                Corn         11.44%    -2.87%
          DBLCI - MR          4.40%     1.66%
   DBLCI - MR 'Plus'          0.00%    -0.38%
   * based on excess return indices

                Sector Allocation**
               Month         Mar-09    Apr-09
           Crude oil         26.19%    30.03%
         Heating oil         12.80%    14.58%
           Aluminium         48.27%    43.02%
                Gold          5.62%     4.45%
               Wheat          4.70%     5.64%
                Corn          2.42%     2.28%
** average weight in the DBLCI - MR
Source: Bloomberg (Jan 1990 - Apr 2009)

Past performance is not indicative of future results

- -The DBLCI-MR and DBLCI-MR Plus have existed since February 2003 and July 2007,
     respectively. The results from their respective inception dates through
     April 2009 represent actual performance (gross of fees). Results prior to
     inception dates are based on historical simulations run from January 1991
     for the DBLCI-MR Plus and December 1988 for the DBLCI-MR through their
     respective inception dates, which do not reflect the performance of the
     actual indices. This hypothetical performance is provided as an
     illustration and should not be relied upon in reaching an investment
     decision. No representation is made that performance of the
     commodity-linked indices would have been the same or similar to the
     hypothetical performance reflected.

                                    page 16
                                                                             p16
|  |
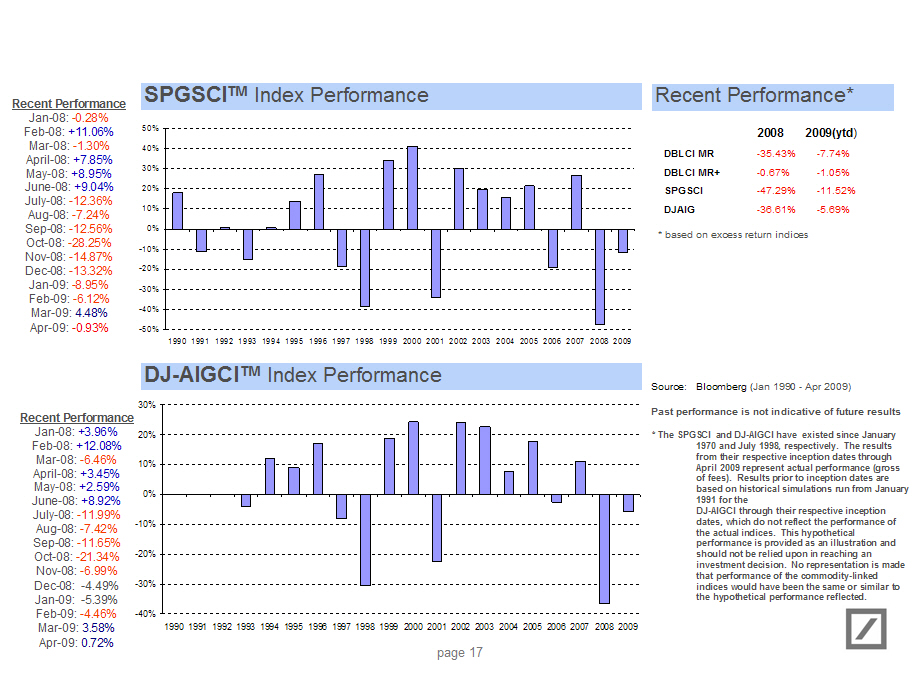
Recent Performance
  Jan-08: -0.28%
  Feb-08: +11.06%
  Mar-08: -1.30%
 April-08: +7.85%
  May-08: +8.95%
  June-08: +9.04%
 July-08: -12.36%
  Aug-08: -7.24%
  Sep-08: -12.56%
  Oct-08: -28.25%
  Nov-08: -14.87%
  Dec-08: -13.32%
  Jan-09: -8.95%
  Feb-09: -6.12%
   Mar-09: 4.48%
  Apr-09: -0.93%


Recent Performance
  Jan-08: +3.96%
  Feb-08: +12.08%
  Mar-08: -6.46%
 April-08: +3.45%
  May-08: +2.59%
  June-08: +8.92%
 July-08: -11.99%
  Aug-08: -7.42%
  Sep-08: -11.65%
  Oct-08: -21.34%
  Nov-08: -6.99%
  Dec-08: -4.49%
  Jan-09: -5.39%
  Feb-09: -4.46%
   Mar-09: 3.58%
   Apr-09: 0.72%

[GRAPHIC OMITTED]

Recent Performance*

          2008       2009(ytd)
DBLCI MR  -35.43%    -7.74%
DBLCI MR+  -0.67%    -1.05%
SPGSCI    -47.29%   -11.52%
DJAIG     -36.61%    -5.69%
* based on excess return indices


Source:  Bloomberg (Jan 1990 - Apr 2009)

Past performance is not indicative of future results

*    The SPGSCI and DJ-AIGCI have existed since January 1970 and July 1998,
     respectively. The results from their respective inception dates through
     April 2009 represent actual performance (gross of fees). Results prior to
     inception dates are based on historical simulations run from January 1991
     for the DJ-AIGCI through their respective inception dates, which do not
     reflect the performance of the actual indices. This hypothetical
     performance is provided as an illustration and should not be relied upon in
     reaching an investment decision. No representation is made that performance
     of the commodity-linked indices would have been the same or similar to the
     hypothetical performance reflected.

                                     page17
                                                                             p17
|  |
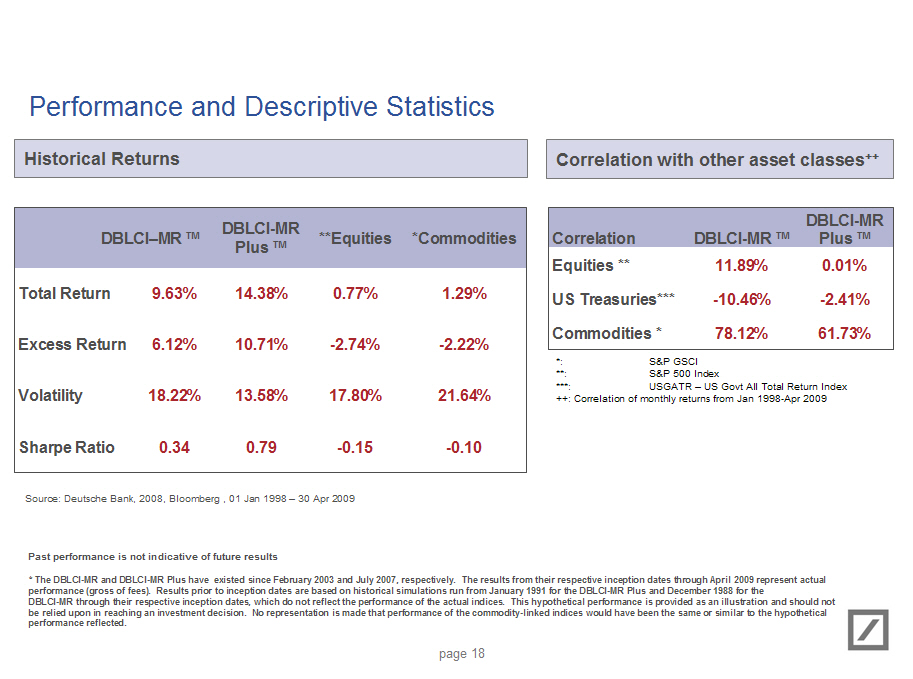
Performance and Descriptive Statistics

- --------------------------------------------------------------------------------
Historical Returns
- --------------------------------------------------------------------------------

- --------------------------------------------------------------------------------
                DBLCI-MR TM   DBLCI-MR     **Equities        *Commodities
                              Plus TM

Total Return       9.63%       14.38%          0.77%              1.29%
Excess Return      6.12%       10.71%         -2.74%             -2.22%
Volatility        18.22%       13.58%         17.80%             21.64%
Sharpe Ratio       0.34         0.79          -0.15              -0.10
- --------------------------------------------------------------------------------
Source: Deutsche Bank, 2008, Bloomberg , 01 Jan 1998 - 30 Apr 2009


- --------------------------------------------------------------------------------
Correlation with other asset classes++
- --------------------------------------------------------------------------------
                                              DBLCI-MR
Correlation              DBLCI-MR TM          Plus TM
Equities **                 11.89%              0.01%
US Treasuries***           -10.46%             -2.41%
Commodities *               78.12%             61.73%

*: S&P GSCI
**: S&P 500 Index
***: USGATR - US Govt All Total Return Index
++: Correlation of monthly returns from Jan 1998-Apr 2009


Past performance is not indicative of future results

* The DBLCI-MR and DBLCI-MR Plus have existed since February 2003 and July 2007,
respectively. The results from their respective inception dates through April
2009 represent actual performance (gross of fees). Results prior to inception
dates are based on historical simulations run from January 1991 for the DBLCI-MR
Plus and December 1988 for the DBLCI-MR through their respective inception
dates, which do not reflect the performance of the actual indices. This
hypothetical performance is provided as an illustration and should not be relied
upon in reaching an investment decision. No representation is made that
performance of the commodity-linked indices would have been the same or similar
to the hypothetical performance reflected.

                                    page 18
                                                                             p18
|  |
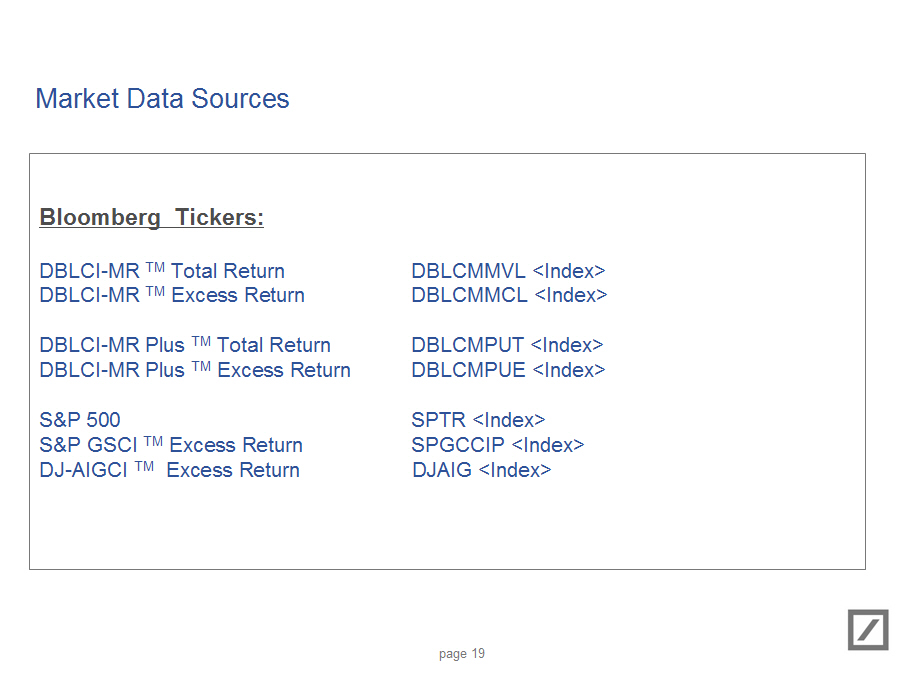
Market Data Sources


 Bloomberg Tickers:
 -----------------

 DBLCI-MR TM Total Return             DBLCMMVL (Index)
 DBLCI-MR TM Excess Return            DBLCMMCL (Index)

 DBLCI-MR Plus TM Total Return        DBLCMPUT (Index)

 DBLCI-MR Plus TM Excess Return       DBLCMPUE (Index)

 S&P 500                              SPTR (Index)
 S&P GSCI TM Excess Return            SPGCCIP (Index)
 DJ-AIGCI TM  Excess Return           DJAIG (Index)

                                    page 19
                                                                             p19
|  |
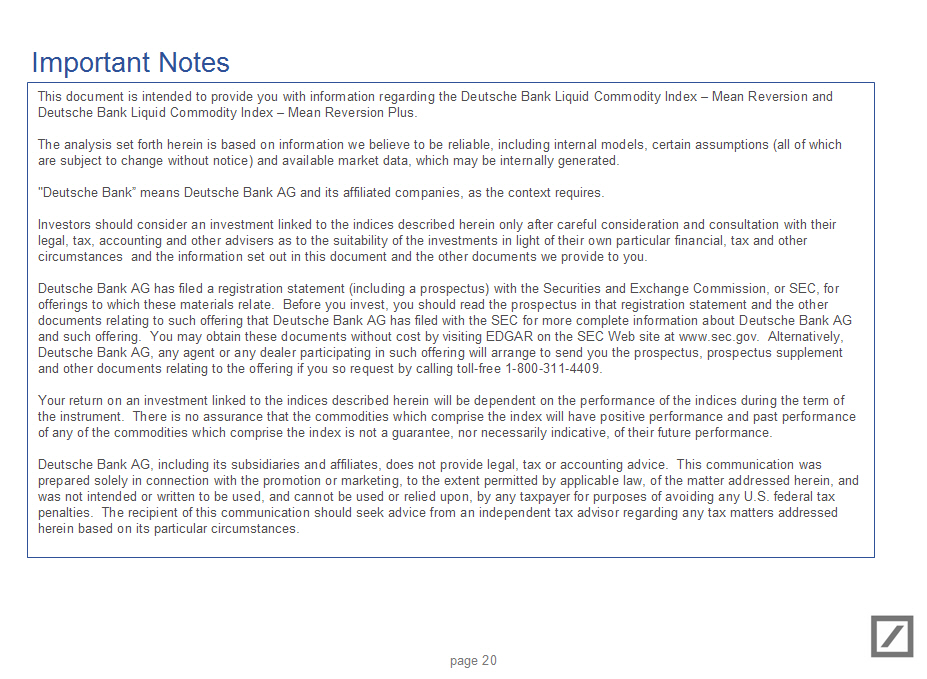
Important Notes

This document is intended to provide you with information regarding the Deutsche
Bank Liquid Commodity Index - Mean Reversion and Deutsche Bank Liquid Commodity
Index - Mean Reversion Plus.

The analysis set forth herein is based on information we believe to be reliable,
including internal models, certain assumptions (all of which are subject to
change without notice) and available market data, which may be internally
generated.

"Deutsche Bank" means Deutsche Bank AG and its affiliated companies, as the
context requires.

Investors should consider an investment linked to the indices described herein
only after careful consideration and consultation with their legal, tax,
accounting and other advisers as to the suitability of the investments in light
of their own particular financial, tax and other circumstances and the
information set out in this document and the other documents we provide to you.

Deutsche Bank AG has filed a registration statement (including a prospectus)
with the Securities and Exchange Commission, or SEC, for offerings to which
these materials relate. Before you invest, you should read the prospectus in
that registration statement and the other documents relating to such offering
that Deutsche Bank AG has filed with the SEC for more complete information about
Deutsche Bank AG and such offering. You may obtain these documents without cost
by visiting EDGAR on the SEC Web site at www.sec.gov. Alternatively, Deutsche
Bank AG, any agent or any dealer participating in such offering will arrange to
send you the prospectus, prospectus supplement and other documents relating to
the offering if you so request by calling toll-free 1-800-311-4409.

Your return on an investment linked to the indices described herein will be
dependent on the performance of the indices during the term of the instrument.
There is no assurance that the commodities which comprise the index will have
positive performance and past performance of any of the commodities which
comprise the index is not a guarantee, nor necessarily indicative, of their
future performance.

Deutsche Bank AG, including its subsidiaries and affiliates, does not provide
legal, tax or accounting advice. This communication was prepared solely in
connection with the promotion or marketing, to the extent permitted by
applicable law, of the matter addressed herein, and was not intended or written
to be used, and cannot be used or relied upon, by any taxpayer for purposes of
avoiding any U.S. federal tax penalties. The recipient of this communication
should seek advice from an independent tax advisor regarding any tax matters
addressed herein based on its particular circumstances.

                                    page 20
                                                                             p20
|  |
S&P GSCI Disclaimer

These materials are not sponsored, endorsed, sold or promoted by Standard &
Poor's, a division of The McGraw-Hill Companies, Inc. ("S&P"). Standard & Poor's
does not make any representation or warranty, express or implied, to the owners
of any instrument linked to the indices described herein or any member of the
public regarding the advisability of investing in securities generally or in any
instrument linked to the indices described herein or the ability of S&P GSCI
Index to track general commodity market performance. S&P's only relationship to
Deutsche Bank AG is the licensing of certain trademarks and trade names of S&P
and of S&P GSCI Index, which indices are determined, composed and calculated by
S&P without regard to Deutsche Bank AG any instrument linked to the indices
described herein. S&P has no obligation to take the needs of Deutsche Bank AG or
the owners of any instrument linked to the indices described herein into
consideration in determining, composing or calculating S&P GSCI Index. S&P is
not responsible for and have not participated in the determination of the timing
of, prices at, or quantities of any instrument linked to the indices described
herein to be issued or in the determination or calculation of the equation by
which the S&P GSCI Index are to be converted into cash. S&P has no obligation or
liability in connection with the administration, marketing or trading of any
instrument linked to the indices described herein.

S&P DOES NOT GUARANTEE THE ACCURACY AND/OR THE COMPLETENESS OF S&P GSCI INDEX OR
ANY DATA INCLUDED THEREIN AND S&P SHALL HAVE NO LIABILITY FOR ANY ERRORS,
OMISSIONS, OR INTERRUPTIONS THEREIN. S&P MAKES NO WARRANTY, EXPRESS OR IMPLIED,
AS TO RESULTS TO BE OBTAINED BY DEUTSCHE BANK AG, OWNERS OF ANY INSTRUMENT
LINKED TO THE INDICES DESCRIBED HEREIN OR ANY OTHER PERSON OR ENTITY FROM THE
USE OF S&P GSCI INDEX OR ANY DATA INCLUDED THEREIN. S&P MAKES NO EXPRESS OR
IMPLIED WARRANTIES, AND EXPRESSLY DISCLAIMS ALL WARRANTIES OF MERCHANTABILITY OR
FITNESS FOR A PARTICULAR PURPOSE OR USE WITH RESPECT TO THE S&P INDICES OR ANY
DATA INCLUDED THEREIN. WITHOUT LIMITING ANY OF THE FOREGOING, IN NO EVENT SHALL
S&P HAVE ANY LIABILITY FOR ANY SPECIAL, PUNITIVE, INDIRECT, OR CONSEQUENTIAL
DAMAGES (INCLUDING LOST PROFITS), EVEN IF NOTIFIED OF THE POSSIBILITY OF SUCH
DAMAGES.

S&P GSCI Index is a trademark of The McGraw-Hill Companies, Inc. and has been
licensed for use by Deutsche Bank AG.

                                    page 21
                                                                             p21
|  |