 | Deutsche Bank Commodity Indices June 2009 Registration Statement No. 333-137902 Dated June 5, 2009; Filed pursuant to Rule 433 Deutsche Bank AG has filed a registration statement (including a prospectus) with the Securities and Exchange Commission, or SEC, for the offering to which this communication relates. Before you invest, you should read the prospectus in that registration statement and other documents that Deutsche Bank AG has filed with the SEC for more complete information about Deutsche Bank AG and this offering. You may obtain these documents without cost by visiting EDGAR on the SEC website at www.sec.gov. Alternatively, Deutsche Bank AG, any agent or any dealer participating in the offering will arrange to send you the prospectus if you so request by calling toll-free 1-800-311-4409. |
 | Contents 1 Executive Summary 2 Beta Commodity Indices 3 Enhanced Beta Commodity Indices 4 Alpha Commodity Indices 5 Commodity Index Comparative Performance 2 |
 |
Executive Summary
The Evolution of Commodity Markets

- -    Commodities have been accepted by investors as an asset class in its own
     right, suitable for absolute returns and portfolio diversification. Optimal
     use of commodities can not only enhance returns, but also reduce overall
     volatility in an investment portfolio

- -    The primary way most investors have been accessing the asset class is
     through commodity indices. They provide a diversified, easy, and quick way
     to get an exposure to the asset class

- -    However, commodities represent a unique asset class with some
     characteristics that need to be considered. As the market has evolved,
     Deutsche Bank has created new indices to try to capture the special
     features of the asset class

- -    Deutsche Bank is a provider of non-benchmark commodity indices and provides
     a comprehensive suite of commodity index products aimed at enhancing beta
     returns and extracting market-neutral alpha returns in the commodity space

3
|
 |
Executive Summary
Commodity Index FAQ
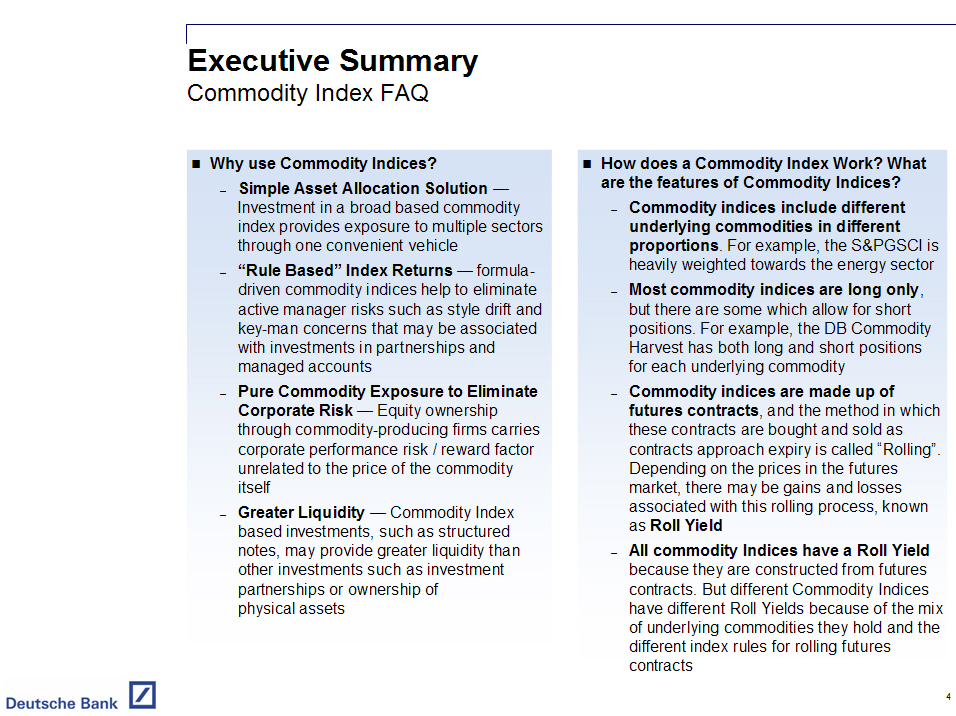
- - Why use Commodity Indices?
- Simple Asset Allocation Solution -- Investment in a broad based
commodity index provides exposure to multiple sectors through one
convenient vehicle
- "Rule Based" Index Returns -- formula- driven commodity indices help
to eliminate active manager risks such as style drift and key-man
concerns that may be associated with investments in partnerships and
managed accounts
- Pure Commodity Exposure to Eliminate Corporate Risk -- Equity
ownership through commodity-producing firms carries corporate
performance risk / reward factor unrelated to the price of the
commodity itself
- Greater Liquidity -- Commodity Index based investments, such as
structured notes, may provide greater liquidity than other investments
such as investment partnerships or ownership of physical assets
- - How does a Commodity Index Work? What are the features of Commodity
Indices?
- Commodity indices include different underlying commodities in
different proportions. For example, the S&PGSCI is heavily weighted
towards the energy sector
- Most commodity indices are long only, but there are some which allow
for short positions. For example, the DB Commodity Harvest has both
long and short positions for each underlying commodity
- Commodity indices are made up of futures contracts, and the method in
which these contracts are bought and sold as contracts approach expiry
is called "Rolling".
Depending on the prices in the futures market, there may be gains and
losses associated with this rolling process, known as Roll Yield
- All commodity Indices have a Roll Yield because they are constructed
from futures contracts. But different Commodity Indices have different
Roll Yields because of the mix of underlying commodities they hold and
the different index rules for rolling futures contracts
4
|
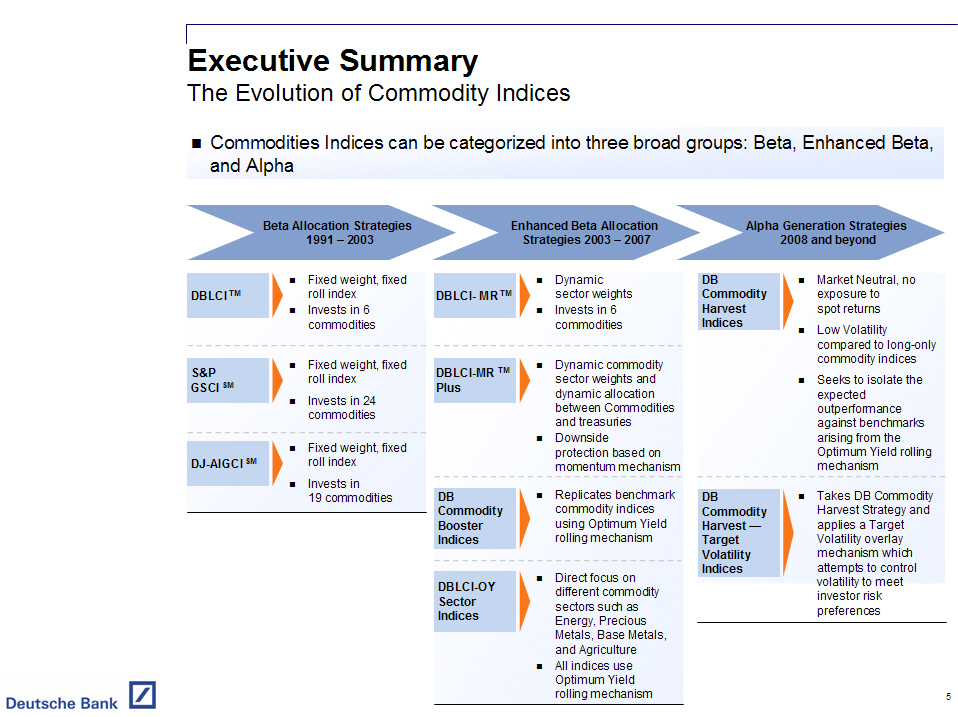 |
Executive Summary
The Evolution of Commodity Indices

- -    Commodities Indices can be categorized into three broad groups: Beta,
     Enhanced Beta, and Alpha

[GRAPHIC OMITTED]

5
|
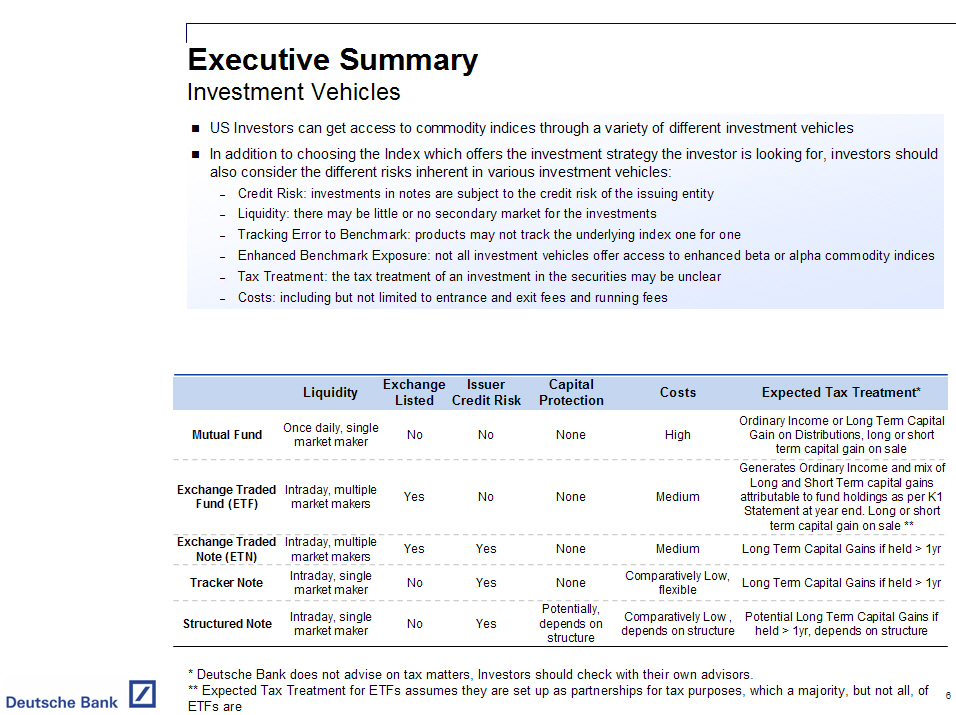 |
Executive Summary
Investment Vehicles

- -    US Investors can get access to commodity indices through a variety of
     different investment vehicles

- -    In addition to choosing the Index which offers the investment strategy the
     investor is looking for, investors should also consider the different risks
     inherent in various investment vehicles:

     -    Credit Risk: investments in notes are subject to the credit risk of
          the issuing entity - Liquidity: there may be little or no secondary
          market for the investments

     -    Tracking Error to Benchmark: products may not track the underlying
          index one for one

     -    Enhanced Benchmark Exposure: not all investment vehicles offer access
          to enhanced beta or alpha commodity indices - Tax Treatment: the tax
          treatment of an investment in the securities may be unclear

     -    Costs: including but not limited to entrance and exit fees and running
          fees

- -----------------------------------------------------------------------------------------------------------------------------------------
                                       Exchange    Issuer        Capital
                     Liquidity          Listed   Credit Risk    Protection       Costs                 Expected Tax Treatment*
- -----------------------------------------------------------------------------------------------------------------------------------------
                                                                                                 Ordinary Income or Long Term Capital
 Mutual Fund       Once daily, single     No         No            None            High           Gain on Distributions, long or short
                     market maker                                                                      term capital gain on sale
- -----------------------------------------------------------------------------------------------------------------------------------------
Exchange Traded   Intraday, multiple     Yes         No            None           Medium            Generates Ordinary Income and mix
  Fund (ETF)         market makers                                                                 of Long and Short Term capital gains
                                                                                                   attributable to fund holdings as per
                                                                                                 K1 Statement at year end. Long or short
                                                                                                       term capital gain on sale **
- -----------------------------------------------------------------------------------------------------------------------------------------
Exchange Traded   Intraday, multiple     Yes         Yes           None           Medium          Long Term Capital Gains if held > 1yr
  Note (ETN)         market makers
- -----------------------------------------------------------------------------------------------------------------------------------------
 Tracker Note      Intraday, single       No         Yes           None       Comparatively Low,   Long Term Capital Gains if held > 1yr
                     market maker                                                  flexible
- -----------------------------------------------------------------------------------------------------------------------------------------
Structured Note    Intraday, single       No         Yes       Potentially,   Comparatively Low,   Potential Long Term Capital Gains if
                     market maker                               depends on       depends on          held > 1yr, depends on structure
                                                                structure        structure
- -----------------------------------------------------------------------------------------------------------------------------------------
* Deutsche Bank does not advise on tax matters, Investors should check with
their own advisors.
** Expected Tax Treatment for ETFs assumes they are set up as partnerships for
tax purposes, which a majority, but not all, of 6 ETFs are

6
|
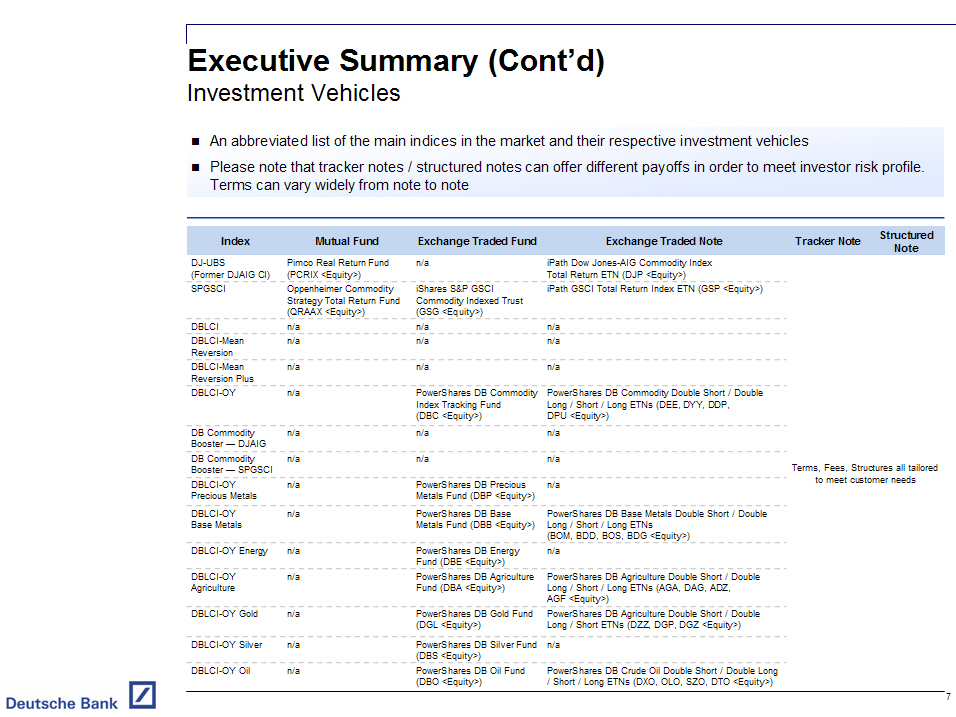 |
Executive Summary (Cont'd)
Investment Vehicles

- -    An abbreviated list of the main indices in the market and their respective
     investment vehicles

- -    Please note that tracker notes / structured notes can offer different
     payoffs in order to meet investor risk profile. Terms can vary widely from
     note to note

- ------------------------------------------------------------------------------------------------------------------------------------
Index               Mutual Fund                Exchange Traded Fund         Exchange Traded Note   Tracker Note      Structured Note
- ------------------------------------------------------------------------------------------------------------------------------------
DJ-UBS              Pimco Real Return Fund     n/a                          iPath Dow Jones-AIG
(Former DJAIG CI)   (PCRIX (Equity))                                        Commodity Index Total
                                                                            Return ETN (DJP
                                                                            (Equity))
- ----------------------------------------------------------------------------------------------------
SPGSCI              Oppenheimer Commodity      iShares S&P GSCI             iPath GSCI Total Return
                    Strategy Total Return Fund Commodity Indexed Trust      Index ETN (GSP (Equity))
                    (QRAAX (Equity))           (GSG (Equity))
- ----------------------------------------------------------------------------------------------------
DBLCI               n/a                        n/a                          n/a
- ----------------------------------------------------------------------------------------------------
DBLCI-Mean          n/a                        n/a                          n/a
Reversion
- ----------------------------------------------------------------------------------------------------
DBLCI-Mean          n/a                        n/a                          n/a
Reversion Plus
- ----------------------------------------------------------------------------------------------------
DBLCI-OY            n/a                        PowerShares DB Commodity     PowerShares DB Commodity
                                               Index Tracking Fund          Double Short / Double
                                               (DBC (Equity))               Long / Short / Long ETNs
                                                                            (DEE, DYY, DDP, DPU
                                                                            (Equity))
- ----------------------------------------------------------------------------------------------------
DB Commodity        n/a                        n/a                          n/a
Booster -- DJAIG
- ----------------------------------------------------------------------------------------------------
DB Commodity        n/a                        n/a                          n/a
Booster -- SPGSCI
- ----------------------------------------------------------------------------------------------------
DBLCI-OY            n/a                        PowerShares DB Precious      n/a
Precious Metals                                Metals Fund (DBP (Equity))
- ----------------------------------------------------------------------------------------------------
DBLCI-OY            n/a                        PowerShares DB Base          PowerShares DB Base         Terms, Fees, Structures
Base Metals                                    Metals Fund (DBB (Equity))   Metals Double Short /         all tailored to meet
                                                                            Double Long / Short /           customer needs
                                                                            Long ETNs (BOM, BDD,
                                                                            BOS, BDG (Equity))
- ----------------------------------------------------------------------------------------------------
DBLCI-OY Energy     n/a                        PowerShares DB Energy        n/a
                                               Fund (DBE (Equity))
- ----------------------------------------------------------------------------------------------------
DBLCI-OY            n/a                        PowerShares DB Agriculture   PowerShares DB
Agriculture                                    Fund (DBA (Equity))          Agriculture Double Short
                                                                            / Double Long / Short /
                                                                            Long ETNs (AGA, DAG,
                                                                            ADZ, AGF (Equity))
- ----------------------------------------------------------------------------------------------------
DBLCI-OY Gold       n/a                        PowerShares DB Gold Fund     PowerShares DB
                                               (DGL (Equity))               Agriculture Double Short
                                                                            / Double Long / Short
                                                                            ETNs (DZZ, DGP, DGZ
                                                                            (Equity))
- ----------------------------------------------------------------------------------------------------
DBLCI-OY Silver     n/a                        PowerShares DB Silver Fund   n/a
                                               (DBS (Equity))
- ----------------------------------------------------------------------------------------------------
DBLCI-OY Oil        n/a                        PowerShares DB Oil Fund      PowerShares DB Crude Oil
                                               (DBO (Equity))               Double Short / Double
                                                                            Long/ Short / Long ETNs
                                                                            (DXO, OLO, SZO, DTO
                                                                            (Equity))
- ------------------------------------------------------------------------------------------------------------------------------------

7
|
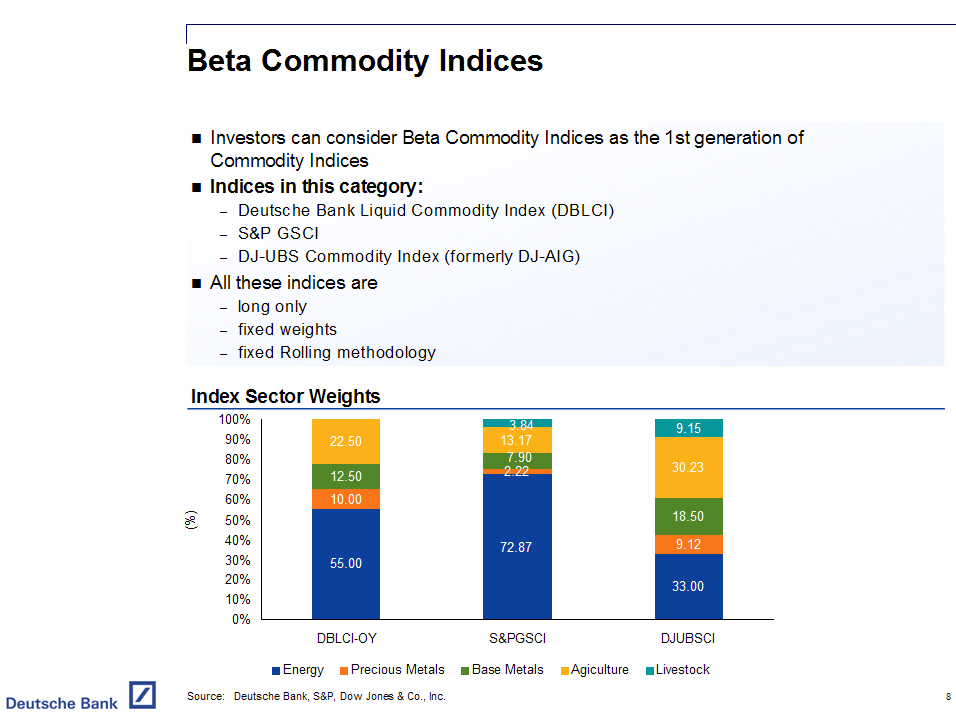 |
Beta Commodity Indices

- -    Investors can consider Beta Commodity Indices as the 1st generation of
     Commodity Indices

- -    Indices in this category:
     -    Deutsche Bank Liquid Commodity Index (DBLCI)
     -    S&P GSCI
     -    DJ-UBS Commodity Index (formerly DJ-AIG)

- -    All these indices are
     -    long only
     -    fixed weights
     -    fixed Rolling methodology

Index Sector Weights
- --------------------
[GRAPHIC OMITTED]

Source:   Deutsche Bank, S&P, Dow Jones & Co., Inc.
8
|
 |
Enhanced Beta
Introduction
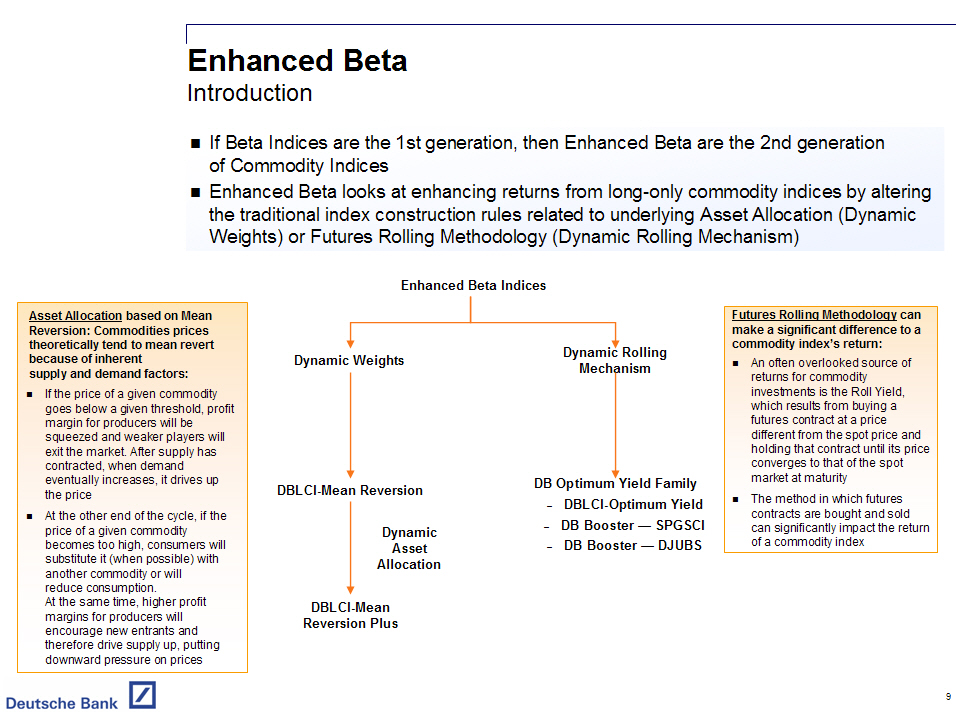
- - If Beta Indices are the 1st generation, then Enhanced Beta are the 2nd
generation of Commodity Indices
- - Enhanced Beta looks at enhancing returns from long-only commodity indices
by altering the traditional index construction rules related to underlying
Asset Allocation (Dynamic Weights) or Futures Rolling Methodology (Dynamic
Rolling Mechanism)
[GRAPHIC OMITTED]
Asset Allocation based on Mean Reversion: Commodities prices theoretically tend
to mean revert because of inherent supply and demand factors:
- - If the price of a given commodity goes below a given threshold, profit
margin for producers will be squeezed and weaker players will exit the
market. After supply has contracted, when demand eventually increases, it
drives up the price
- - At the other end of the cycle, if the price of a given commodity becomes
too high, consumers will substitute it (when possible) with another
commodity or will reduce consumption.
At the same time, higher profit margins for producers will encourage new
entrants and therefore drive supply up, putting downward pressure on
prices
Futures Rolling Methodology can make a significant difference to a commodity
index's return:
- - An often overlooked source of returns for commodity investments is the
Roll Yield, which results from buying a futures contract at a price
different from the spot price and holding that contract until its price
converges to that of the spot market at maturity
- - The method in which futures contracts are bought and sold can
significantly impact the return of a commodity index
9
|
 |
Enhanced Beta
Mean Reversion Methodology in Practice
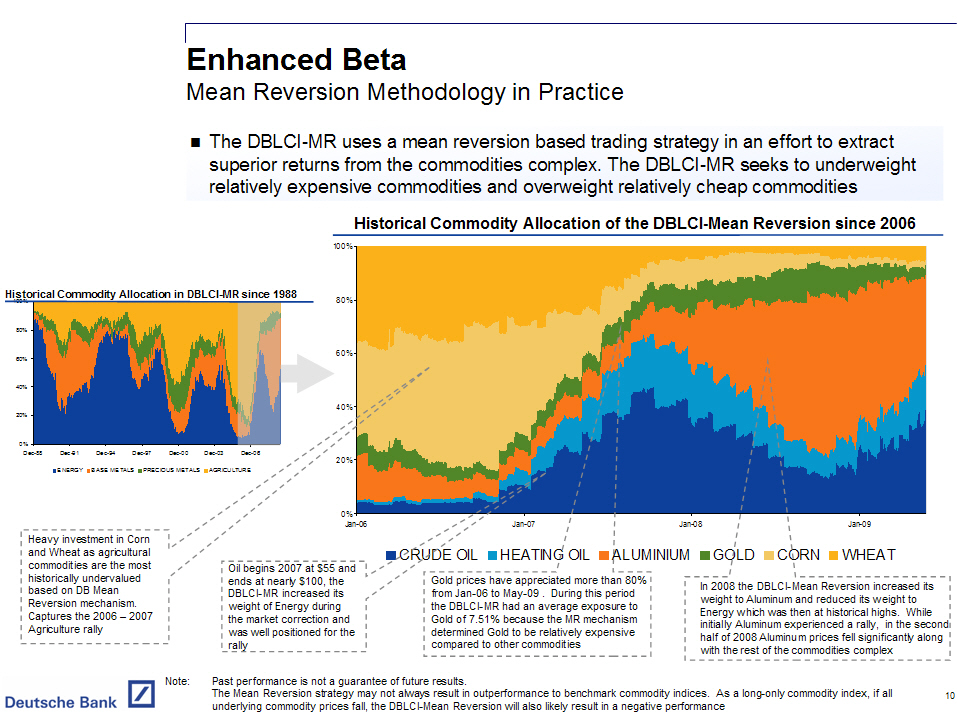
- - The DBLCI-MR uses a mean reversion based trading strategy in an effort to
extract superior returns from the commodities complex. The DBLCI-MR seeks
to underweight relatively expensive commodities and overweight relatively
cheap commodities
Historical Commodity Allocation of the DBLCI-Mean Reversion since 2006
[GRAPHIC OMITTED]
Heavy investment in Corn and Wheat as agricultural commodities are the most
historically undervalued based on DB Mean Reversion mechanism. Captures the
2006 - 2007 Agriculture rally
Oil begins 2007 at $55 and ends at nearly $100, the DBLCI-MR increased its
weight of Energy during the market correction and was well positioned for the
rally
Gold prices have appreciated more than 80% from Jan-06 to May-09 . During this
period the DBLCI-MR had an average exposure to Gold of 7.51% because the MR
mechanism determined Gold to be relatively expensive compared to other
commodities
In 2008 the DBLCI-Mean Reversion increased its weight to Aluminum and reduced
its weight to Energy which was then at historical highs. While initially
Aluminum experienced a rally, in the second half of 2008 Aluminum prices fell
significantly along with the rest of the commodities complex
Note: Past performance is not a guarantee of future results.
The Mean Reversion strategy may not always result in outperformance
to benchmark commodity indices. As a long-only commodity index, if
all 10 underlying commodity prices fall, the DBLCI-Mean Reversion
will also likely result in a negative performance
10
|
 |
Enhanced Beta
DBLCI-Mean Reversion
Commodity Allocation Mechanism
- ------------------------------
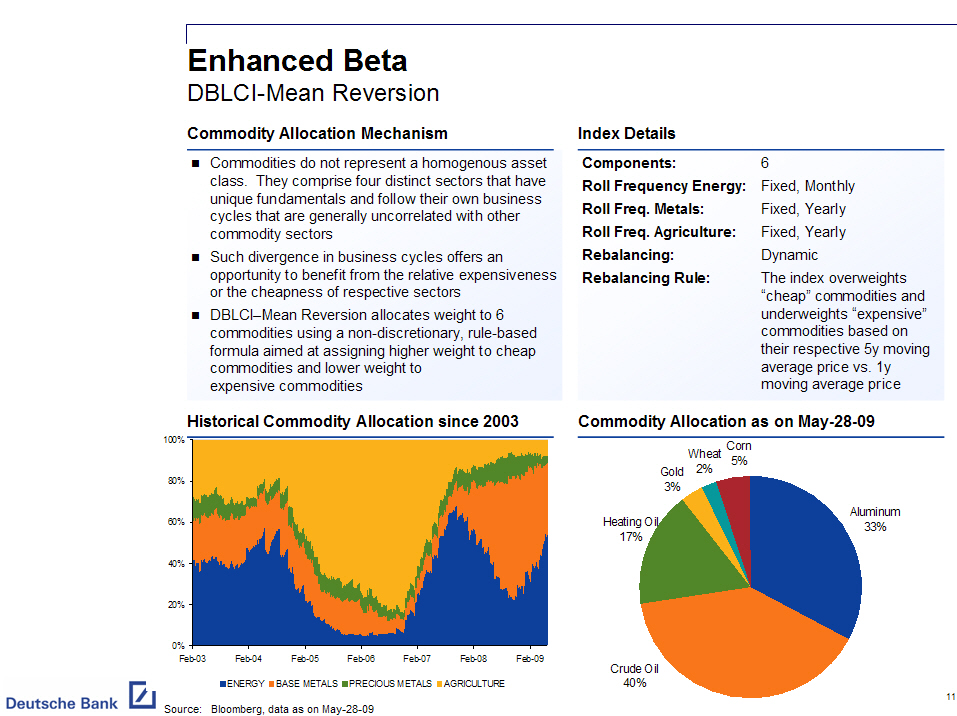
- - Commodities do not represent a homogenous asset class. They comprise four
distinct sectors that have unique fundamentals and follow their own
business cycles that are generally uncorrelated with other commodity
sectors
- - Such divergence in business cycles offers an opportunity to benefit from
the relative expensiveness or the cheapness of respective sectors
- - DBLCI-Mean Reversion allocates weight to 6 commodities using a
non-discretionary, rule-based formula aimed at assigning higher weight to
cheap commodities and lower weight to expensive commodities
Index Details
- -------------
Components: 6
Roll Frequency Energy: Fixed, Monthly
Roll Freq. Metals: Fixed, Yearly
Roll Freq. Agriculture: Fixed, Yearly
Rebalancing: Dynamic
Rebalancing Rule: The index overweights "cheap" commodities and
underweights "expensive" commodities based on their
respective 5y moving average price vs. 1y moving
average price
Historical Commodity Allocation since 2003 Commodity Allocation as on May-28-09
[GRAPHIC OMITTED] [GRAPHIC OMITTED]
Source: Bloomberg, data as on May-28-09
11
|
 |
Enhanced Beta
DBLCI-Mean Reversion Plus
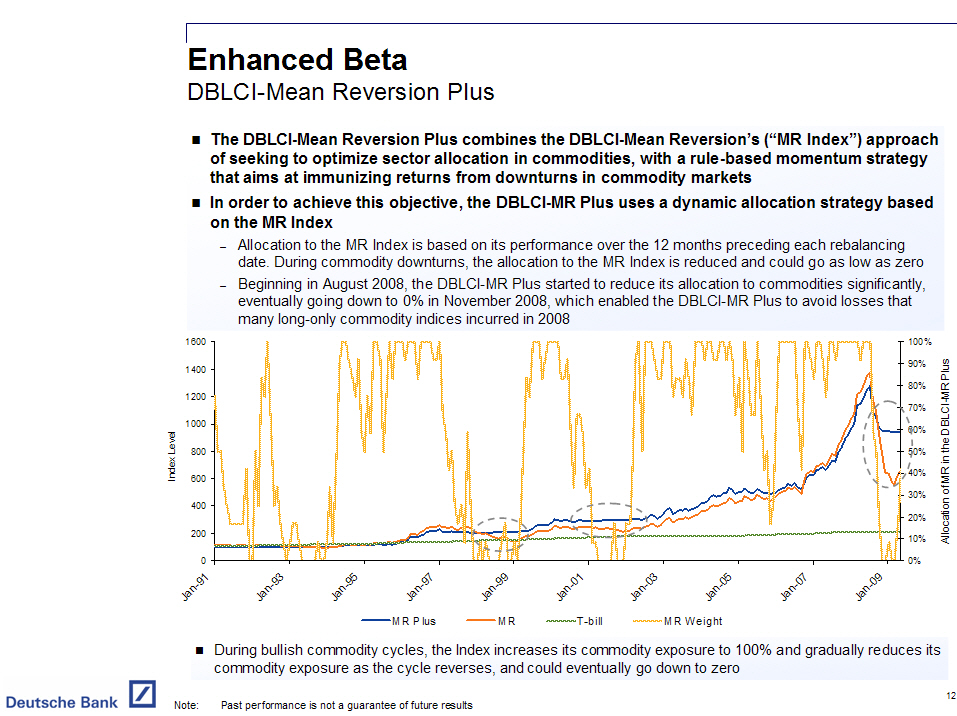
- - The DBLCI-Mean Reversion Plus combines the DBLCI-Mean Reversion's ("MR
Index") approach of seeking to optimize sector allocation in commodities,
with a rule-based momentum strategy that aims at immunizing returns from
downturns in commodity markets
- - In order to achieve this objective, the DBLCI-MR Plus uses a dynamic
allocation strategy based on the MR Index
- Allocation to the MR Index is based on its performance over the 12
months preceding each rebalancing date. During commodity downturns,
the allocation to the MR Index is reduced and could go as low as zero
- Beginning in August 2008, the DBLCI-MR Plus started to reduce its
allocation to commodities significantly, eventually going down to 0%
in November 2008, which enabled the DBLCI-MR Plus to avoid losses that
many long-only commodity indices incurred in 2008
[GRAPHIC OMITTED]
- - During bullish commodity cycles, the Index increases its commodity exposure
to 100% and gradually reduces its commodity exposure as the cycle reverses,
and could eventually go down to zero
Note: Past performance is not a guarantee of future results
12
|
 |
Enhanced Beta
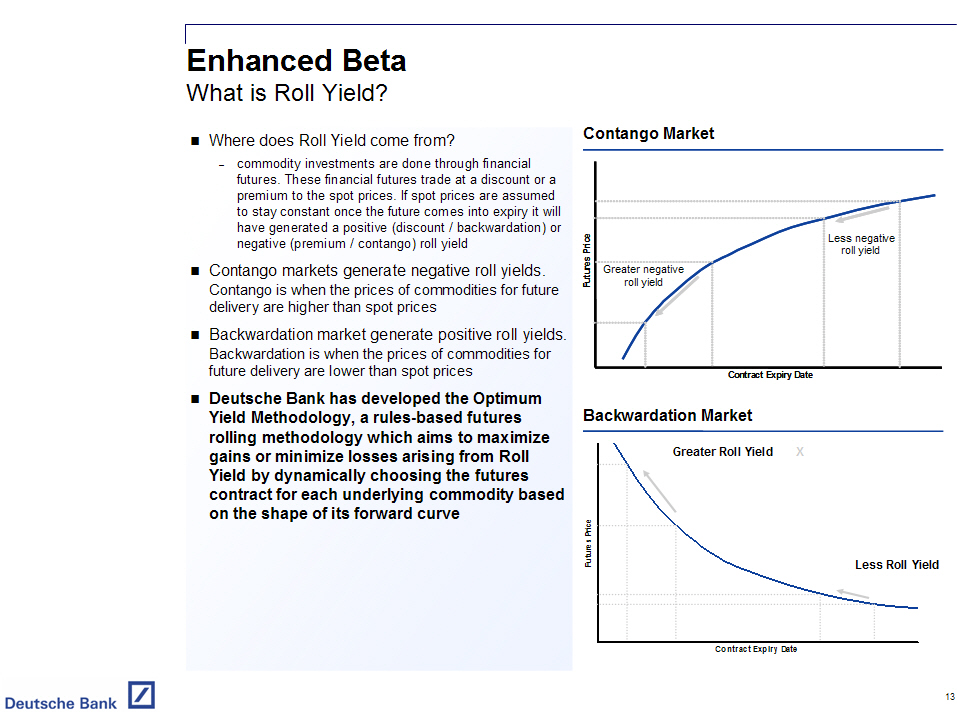
What is Roll Yield?
- - Where does Roll Yield come from?
- commodity investments are done through financial futures. These
financial futures trade at a discount or a premium to the spot prices.
If spot prices are assumed to stay constant once the future comes into
expiry it will have generated a positive (discount / backwardation) or
negative (premium / contango) roll yield
- - Contango markets generate negative roll yields.
- - Contango is when the prices of commodities for future delivery are higher
than spot prices
- - Backwardation market generate positive roll yields.
Backwardation is when the prices of commodities for future delivery are
lower than spot prices
- - Deutsche Bank has developed the Optimum
Yield Methodology, a rules-based futures rolling methodology which aims to
maximize gains or minimize losses arising from Roll Yield by dynamically
choosing the futures contract for each underlying commodity based on the
shape of its forward curve
[GRAPHIC OMITTED]
13
|
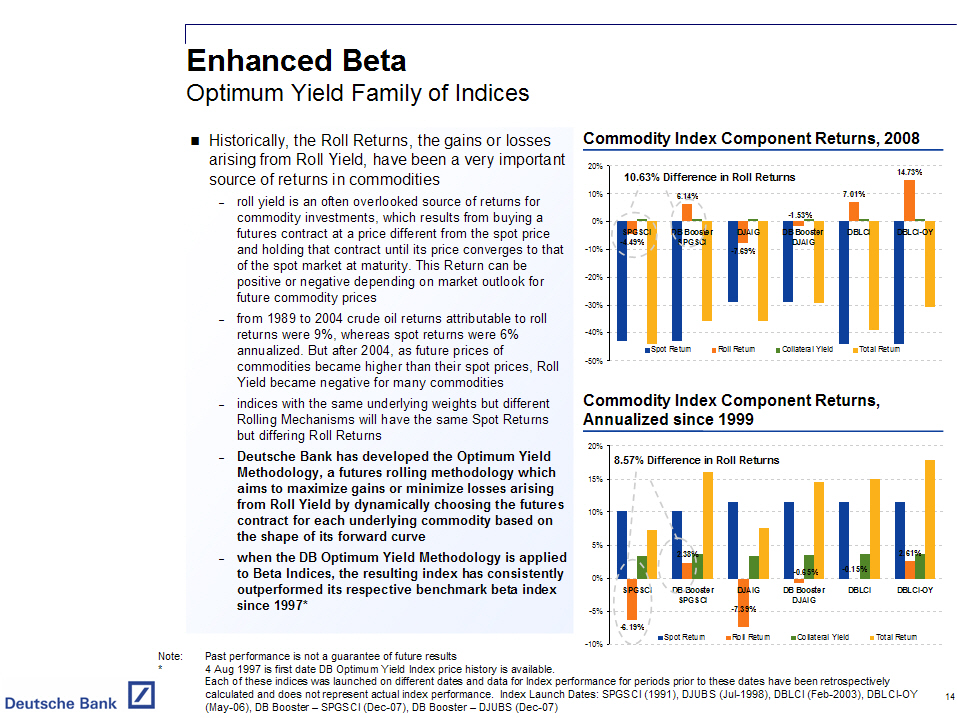 |
Enhanced Beta
Optimum Yield Family of Indices

- -    Historically, the Roll Returns, the gains or losses arising from Roll
     Yield, have been a very important source of returns in commodities

     -    roll yield is an often overlooked source of returns for commodity
          investments, which results from buying a futures contract at a price
          different from the spot price and holding that contract until its
          price converges to that of the spot market at maturity. This Return
          can be positive or negative depending on market outlook for future
          commodity prices

     -    from 1989 to 2004 crude oil returns attributable to roll returns were
          9%, whereas spot returns were 6% annualized. But after 2004, as future
          prices of commodities became higher than their spot prices, Roll Yield
          became negative for many commodities

     -    indices with the same underlying weights but different Rolling
          Mechanisms will have the same Spot Returns but differing Roll Returns

     -    Deutsche Bank has developed the Optimum Yield
          Methodology, a futures rolling methodology which aims to maximize
          gains or minimize losses arising from Roll Yield by dynamically
          choosing the futures contract for each underlying commodity based on
          the shape of its forward curve

     -    when the DB Optimum Yield Methodology is applied to Beta Indices, the
          resulting index has consistently outperformed its respective benchmark
          beta index since 1997*

Commodity Index Component Returns, 2008
- ---------------------------------------
[GRAPHIC OMITTED]

Commodity Index Component Returns,
Annualized since 1999
- ---------------------
[GRAPHIC OMITTED]

Note:     Past performance is not a guarantee of future results
*         4 Aug 1997 is first date DB Optimum Yield Index price history is
          available. Each of these indices was launched on different dates and
          data for Index performance for periods prior to these dates have been
          retrospectively calculated and does not represent actual index
          performance. Index Launch Dates: SPGSCI (1991), DJUBS (Jul-1998),
          DBLCI (Feb-2003), DBLCI-OY 14 (May-06), DB Booster - SPGSCI (Dec-07),
          DB Booster - DJUBS (Dec-07)

14
|
 |
Enhanced Beta
Optimum Yield Family of Indices

- ---------------------------------------------------------------------------------------------------
   Beta Benchmark               Enhanced Beta Counterpart                 Annualized Outperformance
- ---------------------------------------------------------------------------------------------------
       SPGSCI                 DB Commodity Booster -- SPGSCI                         9.00%
SPGSCI Light Energy     DB Commodity Booster -- SPGSCI Light Energy                  5.83%
       DJUBS                   DB Commodity Booster -- DJUBS                         6.45%
       DBLCI                      DBLCI -- Optimum Yield                             3.59%
- ---------------------------------------------------------------------------------------------------

Optimum Yield Index Performance vs Benchmarks
[GRAPHIC OMITTED]

Note:     Past performance is not a guarantee of future results
     *    4 Aug 1997 is first date DB Optimum Yield Index price history is
          available. Data from 4 August 1997 to 29 May 2009 Each of these
          indices was launched on different dates and data for Index performance
          for periods prior to these dates have been retrospectively calculated
          and does not represent actual index performance. Index Launch Dates:
          SPGSCI (Jan-91), SPGSCI Light Energy (Jan-91), DJUBS (Jul-98), DBLCI
          (Feb-03), 15 DBLCI-OY (May-06), DB Booster - SPGSCI (Dec-07), DB
          Booster - DJUBS (Dec-07), DB Booster - SPGSCI Light Energy (Dec-07 )

15
|
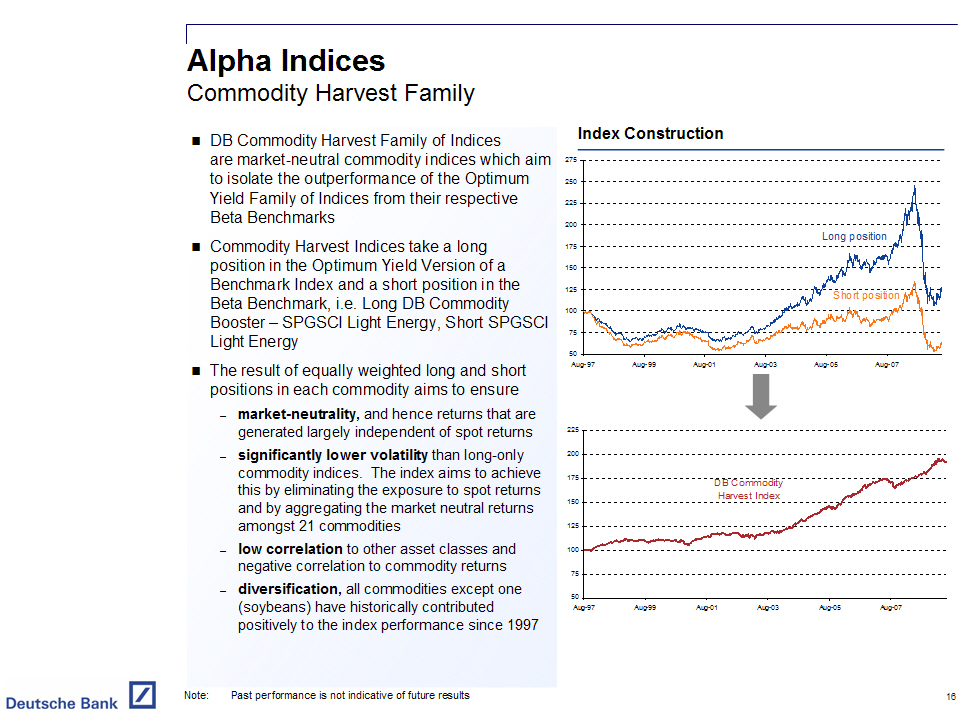 |
Alpha Indices
Commodity Harvest Family

- -    DB Commodity Harvest Family of Indices are market-neutral commodity indices
     which aim to isolate the outperformance of the Optimum Yield Family of
     Indices from their respective Beta Benchmarks

- -    Commodity Harvest Indices take a long position in the Optimum Yield Version
     of a Benchmark Index and a short position in the Beta Benchmark, i.e. Long
     DB Commodity Booster - SPGSCI Light Energy, Short SPGSCI Light Energy

- -    The result of equally weighted long and short positions in each commodity
     aims to ensure

     -    market-neutrality, and hence returns that are generated largely
          independent of spot returns

     -    significantly lower volatility than long-only commodity indices. The
          index aims to achieve this by eliminating the exposure to spot returns
          and by aggregating the market neutral returns amongst 21 commodities

     -    low correlation to other asset classes and negative correlation to
          commodity returns

     -    diversification, all commodities except one (soybeans) have
          historically contributed positively to the index performance since
          1997

Index Construction
[GRAPHIC OMITTED]

Note:     Past performance is not indicative of future results

16
|
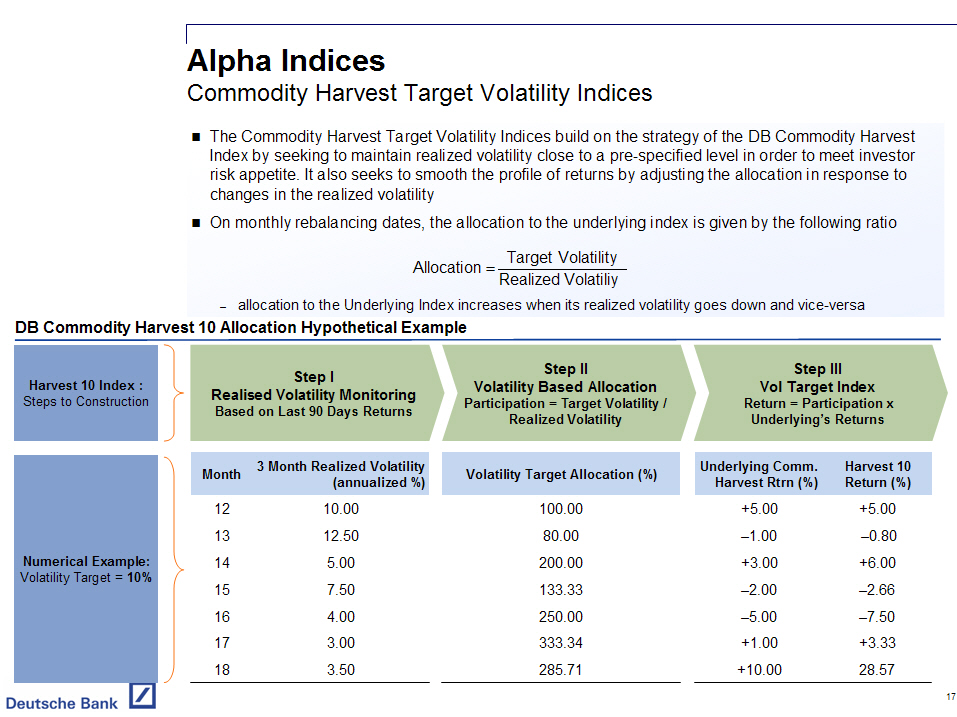 |
Alpha Indices
Commodity Harvest Target Volatility Indices

- -    The Commodity Harvest Target Volatility Indices build on the strategy of
     the DB Commodity Harvest Index by seeking to maintain realized volatility
     close to a pre-specified level in order to meet investor risk appetite. It
     also seeks to smooth the profile of returns by adjusting the allocation in
     response to changes in the realized volatility

- -    On monthly rebalancing dates, the allocation to the underlying index is
     given by the following ratio

       Allocation =                   Target Volatility
                           ----------------------------------------
                                      Realized Volatiliy

               -    allocation to the Underlying Index increases when its
                    realized volatility goes down and vice-versa

DB Commodity Harvest 10 Allocation Hypothetical Example
- -------------------------------------------------------

Harvest 10 Index :
Steps to Construction
- ---------------------
           Step I                                Step II                             Step III
Realised Volatility Monitoring           Volatility Based Allocation              Vol Target Index
Based on Last 90 Days Returns         Participation = Target Volatility /      Return = Participation x
                                            Realized Volatility                  Underlying's Returns

Numerical Example:
Volatility Target = 10%

        3 Month Realized
              Volatility               Volatility    Underlying Comm.  Harvest 10
Month     (annualized %)    Target Allocation (%)   Harvest Rtrn (%)    Return (%)
- ----------------------------------------------------------------------------------
12            10.00                     100.00           +5.00          +5.00
13            12.50                      80.00           -1.00          -0.80
14            5.00                      200.00           +3.00          +6.00
15            7.50                      133.33           -2.00          -2.66
16            4.00                      250.00           -5.00          -7.50
17            3.00                      333.34           +1.00          +3.33
18            3.50                      285.71          +10.00          28.57


17
|
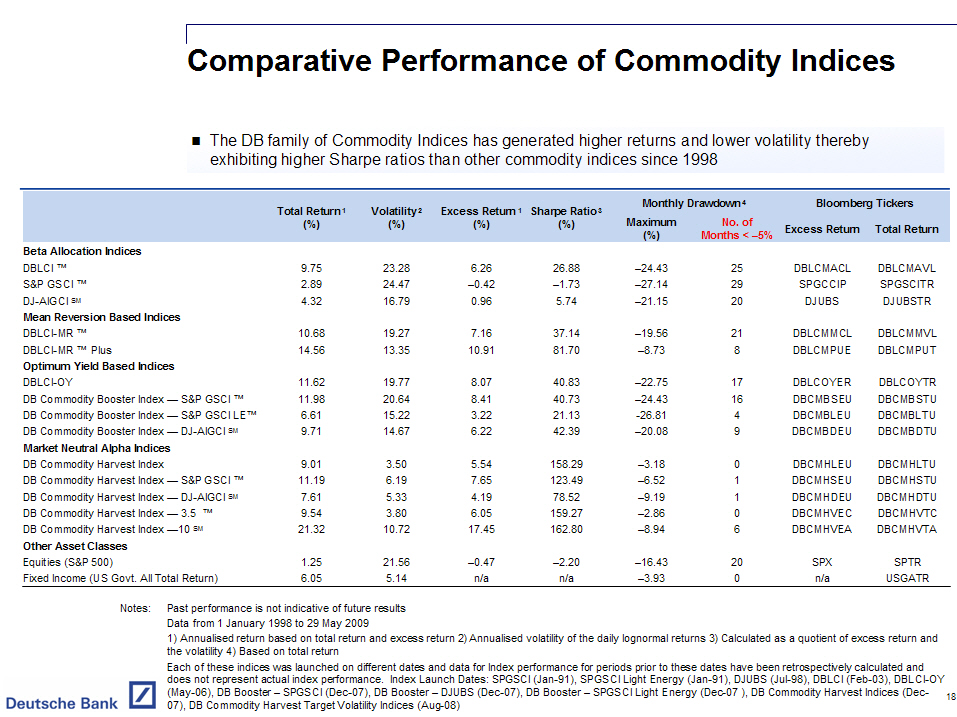 |
Comparative Performance of Commodity Indices

- -    The DB family of Commodity Indices has generated higher returns and lower
     volatility thereby exhibiting higher Sharpe ratios than other commodity
     indices since 1998

                                                Total   Volatility(2)    Excess      Sharpe              Monthly               Bloomberg
                                            Return (1)                  Return (1)   Ratio (3)         Drawdown (4)             Tickers
                                                                                                 Maximum     No. of      Excess      Total
                                                 (%)         (%)           (%)         (%)         (%)    Months < -5%   Return      Return
- -----------------------------------------------------------------------------------------------------------------------------------------------
Beta Allocation Indices
DBLCI (TM)                                       9.75      23.28          6.26       26.88       -24.43       25         DBLCMACL    DBLCMAVL
S&P GSCI (TM)                                    2.89      24.47         -0.42       -1.73       -27.14       29         SPGCCIP     SPGSCITR
DJ-AIGCI SM                                      4.32      16.79          0.96       5.74        -21.15       20          DJUBS      DJUBSTR
Mean Reversion Based Indices
DBLCI-MR (TM)                                   10.68      19.27          7.16       37.14       -19.56       21         DBLCMMCL    DBLCMMVL
DBLCI-MR (TM) Plus                              14.56      13.35         10.91       81.70       -8.73         8         DBLCMPUE    DBLCMPUT
Optimum Yield Based Indices
DBLCI-OY                                        11.62      19.77          8.07       40.83       -22.75       17         DBLCOYER    DBLCOYTR
DB Commodity Booster Index -- S&P GSCI (TM)     11.98      20.64          8.41       40.73       -24.43       16         DBCMBSEU    DBCMBSTU
DB Commodity Booster Index -- S&P GSCI LE(TM)    6.61      15.22          3.22       21.13       -26.81        4         DBCMBLEU    DBCMBLTU
DB Commodity Booster Index -- DJ-AIGCI SM        9.71      14.67          6.22       42.39       -20.08        9         DBCMBDEU    DBCMBDTU
Market Neutral Alpha Indices
DB Commodity Harvest Index                       9.01      3.50           5.54   1   58.29       -3.18         0         DBCMHLEU    DBCMHLTU
DB Commodity Harvest Index -- S&P GSCI (TM)     11.19      6.19           7.65   1   23.49       -6.52         1         DBCMHSEU    DBCMHSTU
DB Commodity Harvest Index -- DJ-AIGCI SM        7.61      5.33           4.19       78.52       -9.19         1         DBCMHDEU    DBCMHDTU
DB Commodity Harvest Index -- 3.5  (TM)          9.54      3.80           6.05   1   59.27       -2.86         0         DBCMHVEC    DBCMHVTC
DB Commodity Harvest Index --10 SM              21.32      10.72         17.45   1   62.80       -8.94         6         DBCMHVEA    DBCMHVTA
Other Asset Classes
Equities (S&P 500)                               1.25      21.56         -0.47       -2.20       -16.43       20           SPX         SPTR
Fixed Income (US Govt. All Total Return)         6.05      5.14           n/a         n/a         -3.93         0           n/a        USGATR

Notes:    Past performance is not indicative of future results
          Data from 1 January 1998 to 29 May 2009
          1) Annualised return based on total return and excess return 2)
          Annualised volatility of the daily lognormal returns 3) Calculated as
          a quotient of excess return and the volatility 4) Based on total
          return
          Each of these indices was launched on different dates and data for
          Index performance for periods prior to these dates have been
          retrospectively calculated and does not represent actual index
          performance. Index Launch Dates: SPGSCI (Jan-91), SPGSCI Light Energy
          (Jan-91), DJUBS (Jul-98), DBLCI (Feb-03), DBLCI-OY (May-06), DB
          Booster - SPGSCI (Dec-07), DB Booster - DJUBS (Dec-07), DB Booster -
          SPGSCI Light Energy (Dec-07 ), DB Commodity Harvest Indices (Dec- 18
          07), DB Commodity Harvest Target Volatility Indices (Aug-08)

18
|
 | Important Considerations For further details on the DB Commodity Index Suite refer to Underlying Supplement dated December 16, 2008: http://www.sec.gov/Archives/edgar/data/1159508/000119312508254080/d424b21.pdf Commodities are speculative and highly volatile and the risk of loss of trading in commodities can be substantial. An investment linked to a commodity index involves a number of risks, including the risk that the index's strategy may not be successful, and its return, if any, will be dependent on, among other things, the performance of the relevant index during the term of the investment and the terms and conditions of that investment. The absence of backwardation or presence of contango in the markets for futures contracts included in a long-only commodity index will adversely affect the level of that index. An index's performance is unpredictable, and past performance is not indicative of future performance. We give no representation or warranty on the future performance of any index or investment. Deutsche Bank AG and its affiliates do not provide legal, tax, or accounting advice, and we are not acting in any way as an advisory or in a fiduciary capacity. Prospective investors should consider an investment linked to a DB commodity index only after careful consideration of the risks, consultation with their legal, tax, accounting, and other advisors as to the suitability of the investment in light of their own particular financial, tax and other circumstances, and review and consideration of any documents that we provide to you in connection with any offering We are not acting and do not purport to act in any way as an advisor or in a fiduciary capacity. We therefore strongly suggest that recipients seek their own independent advice in relation to any investment, financial, legal, tax, accounting or regulatory issues discussed herein. Analyses and opinions contained herein may be based on assumptions that if altered can change the analyses or opinions expressed. Nothing contained herein shall constitute any representation or warranty as to future performance of any financial instrument, credit, index, currency rate or other market or economic measure. Furthermore, past performance is not necessarily indicative of future results. Securities and investment banking activities in the United States are performed by Deutsche Bank Securities Inc., member NYSE, NASD and SIPC, and its broker-dealer affiliates. Lending and other commercial banking activities in the United States are performed by Deutsche Bank AG, and its banking affiliates. (C) 2009 Deutsche Bank AG 19 |
 |
Disclaimer

S&P GSCI SM Disclaimer

Any securities Deutsche Bank AG may issue from time to time and this
presentation are not sponsored, endorsed, sold or promoted by Standard & Poor's,
a division of The McGraw-Hill Companies, Inc. ("S&P"). Standard & Poor's does
not make any representation or warranty, express or implied, to the owners of
the securities or any member of the public regarding the advisability of
investing in securities generally or in these securities, particularly or the
ability of S&P GSCI Index to track general commodity market performance. S&P's
only relationship to Deutsche Bank AG is the licensing of certain trademarks and
trade names of S&P and of S&P GSCI Index, which indices are determined, composed
and calculated by S&P without regard to Deutsche Bank AG or the securities. S&P
has no obligation to take the needs of Deutsche Bank AG or the owners of the
Bonds into consideration in determining, composing or calculating S&P GSCI
Index. S&P is not responsible for and have not participated in the determination
of the timing of, prices at, or quantities of the securities to be issued or in
the determination or calculation of the equation by which the S&P GSCI Index are
to be converted into cash. S&P has no obligation or liability in connection with
the administration, marketing or trading of the Bonds.

S&P DOES NOT GUARANTEE THE ACCURACY AND/OR THE COMPLETENESS OF S&P GSCI INDEX OR
ANY DATA INCLUDED THEREIN AND S&P SHALL HAVE NO LIABILITY FOR ANY ERRORS,
OMISSIONS, OR INTERRUPTIONS THEREIN. S&P MAKES NO WARRANTY, EXPRESS OR IMPLIED,
AS TO RESULTS TO BE OBTAINED BY DEUTSCHE BANK AG, OWNERS OF SECURITIES OR ANY
OTHER PERSON OR ENTITY FROM THE USE OF S&P GSCI INDEX OR ANY DATA INCLUDED
THEREIN. S&P MAKES NO EXPRESS OR IMPLIED WARRANTIES, AND EXPRESSLY DISCLAIMS ALL
WARRANTIES OF MERCHANTABILITY OR FITNESS FOR A PARTICULAR PURPOSE OR USE WITH
RESPECT TO THE S&P INDICES OR DEUTSCHE BANK'S VARIATIONS OF S&P INDICES OR ANY
DATA INCLUDED THEREIN. WITHOUT LIMITING ANY OF THE FOREGOING, IN NO EVENT SHALL
S&P HAVE ANY LIABILITY FOR ANY SPECIAL, PUNITIVE, INDIRECT, OR CONSEQUENTIAL
DAMAGES (INCLUDING LOST PROFITS), EVEN IF NOTIFIED OF THE POSSIBILITY OF SUCH
DAMAGES.

S&P GSCI Index is a trademark of The McGraw-Hill Companies, Inc. and has been
licensed for use by Deutsche Bank AG.

DJ-UBSCISM Disclaimer

"Dow Jones(R)", "DJ", "UBS," "DJ-UBSCISM" are service marks of Dow Jones &
Company, Inc. ("Dow Jones") and UBS AG ("UBS AG"), as the case may be, and have
been licensed for use for certain purposes by Deutsche Bank AG

The securities which Deutsche Bank AG may offer from time to time are not
sponsored, endorsed, sold or promoted by Dow Jones, UBS AG, UBS Securities LLC
("UBS Securities") or any of their subsidiaries or affiliates. None of Dow
Jones, UBS AG, UBS Securities or any of their subsidiaries or affiliates makes
any representation or warranty, express or implied, to the owners of or
counterparts to the securities or any member of the public regarding the
advisability of investing in securities or commodities generally or in the
securities particularly. The only relationship of Dow Jones, UBS AG, UBS
Securities or any of their subsidiaries or affiliates to the Licensee is the
licensing of certain trademarks, trade names and service marks and of the
DJ-UBSCISM, which is determined, composed and calculated by Dow Jones in
conjunction with UBS Securities without regard to Deutsche Bank AG or the
securities. Dow Jones and UBS Securities have no obligation to take the needs of
Deutsche Bank AG or the owners of the securities into consideration in
determining, composing or calculating DJ-UBSCISM. None of Dow Jones, UBS AG, UBS
Securities or any of their respective subsidiaries or affiliates is responsible
for or has participated in the determination of the timing of, prices at, or
quantities of the securities to be issued or in the determination or calculation
of the equation by which the securities are to be converted into cash. None of
Dow Jones, UBS AG, UBS Securities or any of their subsidiaries or affiliates
shall have any obligation or liability, including, without limitation, to
securities' customers, in connection with the administration, marketing or
trading of the securities. Notwithstanding the foregoing, UBS AG, UBS Securities
and their respective subsidiaries and affiliates may independently issue and/or
sponsor financial products unrelated to the securities currently being issued by
Licensee, but which may be similar to and competitive with such securities. In
addition, UBS AG, UBS Securities and their subsidiaries and affiliates actively
trade commodities, commodity indexes and commodity futures (including the Dow
Jones-UBS Commodity IndexSM and Dow Jones-UBS Commodity Index Total ReturnSM),
as well as swaps, options and derivatives which are linked to the performance of
such commodities, commodity indexes and commodity futures. It is possible that
this trading activity will affect the value of the Dow Jones-UBS Commodity
IndexSM and any securities Deutsche Bank AG may issue from time to time.

NONE OF DOW JONES, UBS AG, UBS SECURITIES OR ANY OF THEIR SUBSIDIARIES OR
AFFILIATES GUARANTEES THE ACCURACY AND/OR THE COMPLETENESS OF THE DOW JONES-UBS
COMMODITY INDEXSM OR ANY DATA RELATED THERETO AND NONE OF DOW JONES, UBS AG, UBS
SECURITIES OR ANY OF THEIR SUBSIDIARIES OR AFFILIATES SHALL HAVE ANY LIABILITY
FOR ANY ERRORS, OMISSIONS OR INTERRUPTIONS THEREIN. NONE OF DOW JONES, UBS AG,
UBS SECURITIES OR ANY OF THEIR SUBSIDIARIES OR AFFILIATES MAKES ANY WARRANTY,
EXPRESS OR IMPLIED, AS TO RESULTS TO BE OBTAINED BY DEUTSCHE BANK AG, OWNERS OF
THE SECURITIES OR ANY OTHER PERSON OR ENTITY FROM THE USE OF THE DOW JONES-UBS
COMMODITY INDEXSM OR ANY DATA RELATED THERETO. NONE OF DOW JONES, UBS AG, UBS
SECURITIES OR ANY OF THEIR SUBSIDIARIES OR AFFILIATES MAKES ANY EXPRESS OR
IMPLIED WARRANTIES AND EXPRESSLY DISCLAIMS ALL WARRANTIES OF MERCHANTABILITY OR
FITNESS FOR A PARTICULAR PURPOSE OR USE WITH RESPECT TO THE DOW JONES-UBS
COMMODITY INDEXSM OR ANY DATA RELATED THERETO. WITHOUT LIMITING ANY OF THE
FOREGOING, IN NO EVENT SHALL DOW JONES, UBS AG, UBS SECURITIES OR ANY OF THEIR
SUBSIDIARIES OR AFFILIATES HAVE ANY LIABILITY FOR ANY LOST PROFITS OR INDIRECT,
PUNITIVE, SPECIAL OR CONSEQUENTIAL DAMAGES OR LOSSES, EVEN IF NOTIFIED OF THE
POSSIBILITY THEREOF. THERE ARE NO THIRD PARTY BENEFICIARIES OF ANY AGREEMENTS OR
ARRANGEMENTS AMONG DOW JONES, UBS SECURITIES AND DEUTSCHE BANK AG, OTHER THAN
UBS AG.

"Dow Jones(R)", "DJ", "UBS(R)" "Dow Jones-UBS Commodity IndexSM" are service
marks of Dow Jones & Company, Inc. and UBS AG, as the case may be, and have been
licensed for use for certain purposes by Deutsche Bank. The DB Commodity Harvest
- - DJUBS and DB Commodity Booster - DJUBS, which is based in part on the Dow
Jones-UBS Commodity Index, is not sponsored or endorsed by Dow Jones & Company,
Inc. or UBS Securities LLC, but is published with their consent.

20
|