 |
                                                         Free Writing Prospectus
                                                      Filed Pursuant to Rule 433
                                            Registration Statement No.333-162195
                                                         Dated December 18, 2009


Deutsche Bank Liquid Commodity Index
Suite of Mean Reversion Indices
December 2009
[GRAPHIC OMITTED]

                                                                   Deutsche Bank
                                                                               1
|
 |
Mean Reversion Indices

Executive Summary

DBLCI - Mean Reversion (MR) Index

DBLCI - Mean Reversion Enhanced (MRE) Index

DBLCI - Mean Reversion Enhanced 15 (MRE15) Index

DBLCI - Mean Reversion "Plus" (MR+) Index


Appendix

Types of Returns in a Commodity Index
Mean Reversion
Momentum
Optimized Yield
Target Volatility
Comparative Statistics
Market Data Sources
Important Considerations

                                                                               2
|
 |
Mean Reversion Indices

                                                                               3
|
 |
Executive Summary

The Evolution of Commodity Markets

o    Commodities are an asset class in their own right and exhibit unique
     characteristics such as historically low correlation with traditional asset
     classes and a positive correlation with inflation

o    Deutsche Bank is one of the largest providers of non-benchmark commodity
     indices with a comprehensive suite of commodity index products aimed at
     enhancing beta returns and extracting market neutral alpha returns in the
     commodity space

o    An investment in a commodity index is a simple way for investors to gain
     exposure to the asset class while insulating them from the mechanics of
     rolling future contracts and posting collateral

o    As the commodity market has evolved, Deutsche Bank has created new indices
     that may benefit from the special features of the asset class

                                                                               4
|
 |
Enhanced Beta
Introduction
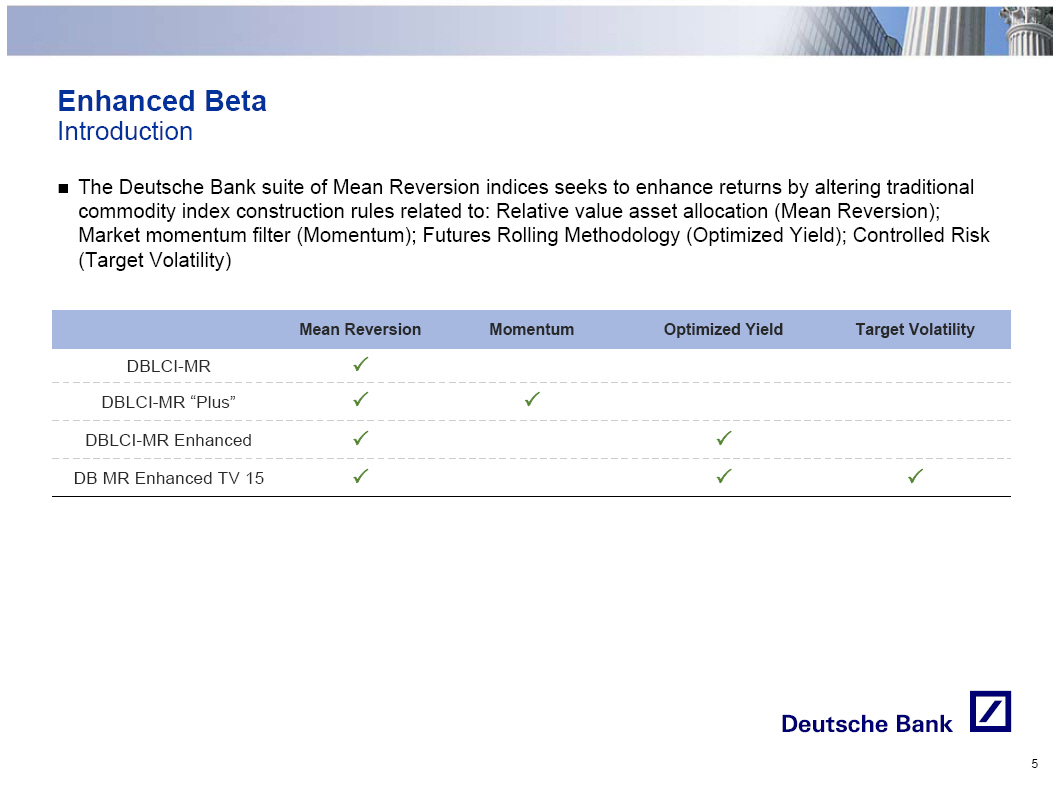
o The Deutsche Bank suite of Mean Reversion indices seeks to enhance returns
by altering traditional commodity index construction rules related to:
Relative value asset allocation (Mean Reversion); Market momentum filter
(Momentum); Futures Rolling Methodology (Optimized Yield); Controlled Risk
(Target Volatility)
Mean Reversion Momentum Optimized Yield Target Volatility
DBLCI-MR o
DBLCI-MR "Plus" o o
DBLCI-MR Enhanced o o
DB MR Enhanced TV 15 o o o
5
|
 |
DBLCI - Mean Reversion (MR) Excess Return
Relative Value Asset Allocation

Key Features

o    Components: Tracks the performance of 6 commodity futures: Aluminum, WTI
     Crude Oil, Heating Oil, Gold, Corn and Wheat

o    Transparency: The DBLCI-MR is a rules-based index with the closing level
     and weights published daily on Bloomberg (DBLCMMCL) and DBIQ

o    Dynamic Weights: Seeks to underweight relatively expensive commodities and
     overweight relatively cheap commodities among six of the most liquid
     futures contracts in four sectors: Energy, Base Metals, Precious Metals,
     Agriculture

o    Rebalancing: A rebalancing will occur whenever one of the commodities
     undergoes a "trigger event." A trigger event occurs when the one-year
     moving average price of the commodity trades +/- 5% than the five-year
     moving average

o    Roll Frequency and Method: Fixed monthly roll for Energy components, fixed
     yearly roll for Metals and Agriculture components

                                                                               6
|
 |
DBLCI - Mean Reversion (MR) Excess Return
Performance Analysis
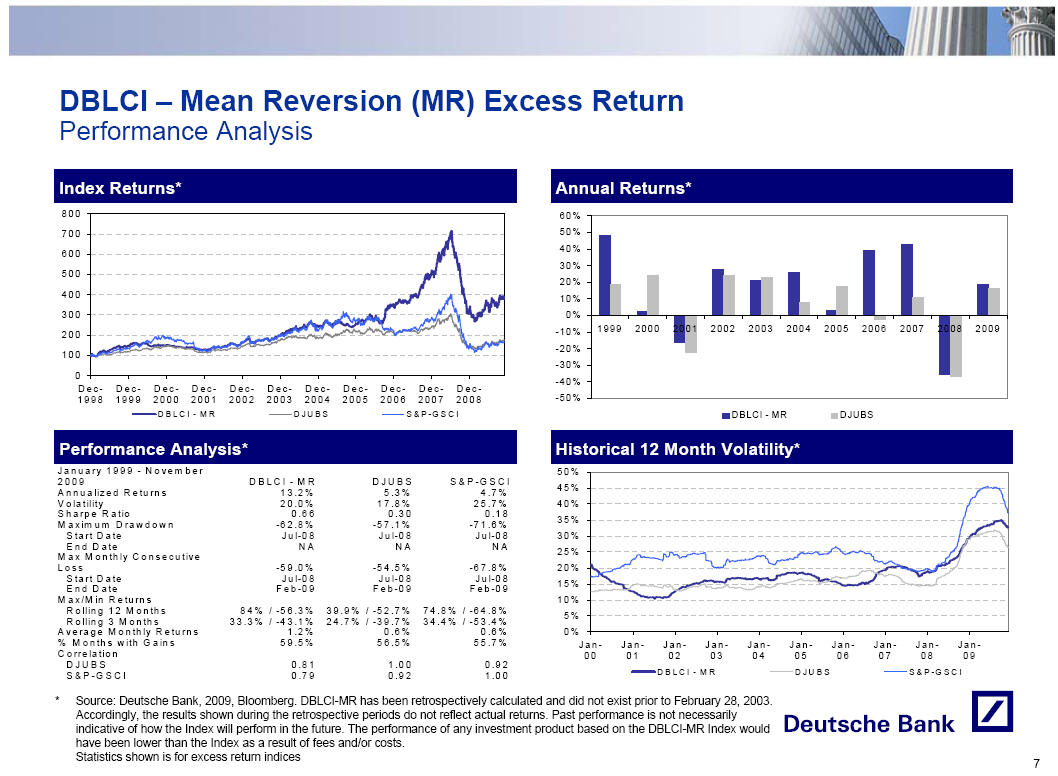
Index Returns*
[GRAPHIC OMITTED]
Performance Analysis*
January 1999 - November 2009
D B L C I - M R D J U B SS & P -G S C I
Annualized Returns 13.2% 5.3% 4.7%
Volatility 20.0% 17.8% 25.7%
SharpeRatio 0.66 0.30 0.18
MaximumDrawdown -62.8% -57.1% -71.6%
StartDate Jul-08 Jul-08 Jul-08
EndDate NA NA NA
Max Monthly Consecutive Loss -59.0% -54.5% -67.8%
StartDate Jul-08 Jul-08 Jul-08
EndDate Feb-09 Feb-09 Feb-09
Max/Min Returns
Rolling 12 Months 84%/-56.3% 39.9%/-52.7% 74.8%/-64.8%
Rolling 3 Months 33.3%/-43.1% 24.7%/-39.7% 34.4%/-53.4%
Average Monthly Returns 1.2% 0.6% 0.6%
%MonthswithGains 59.5% 56.5% 55.7%
Correlation
DJUBS 0.81 1.00 0.92
S&P-GSCI 0.79 0.92 1.00
Annual Returns*
[GRAPHIC OMITTED]
Historical 12 Month Volatility*
[GRAPHIC OMITTED]
* Source: Deutsche Bank, 2009, Bloomberg. DBLCI-MR has been retrospectively
calculated and did not exist prior to February 28, 2003. Accordingly, the
results shown during the retrospective periods do not reflect actual
returns. Past performance is not necessarily indicative of how the Index
will perform in the future. The performance of any investment product based
on the DBLCI-MR Index would have been lower than the Index as a result of
fees and/or costs. Statistics shown is for excess return indices
7
|
 |
DBLCI - Mean Reversion (MR) Excess Return (Cont'd)
Performance Analysis
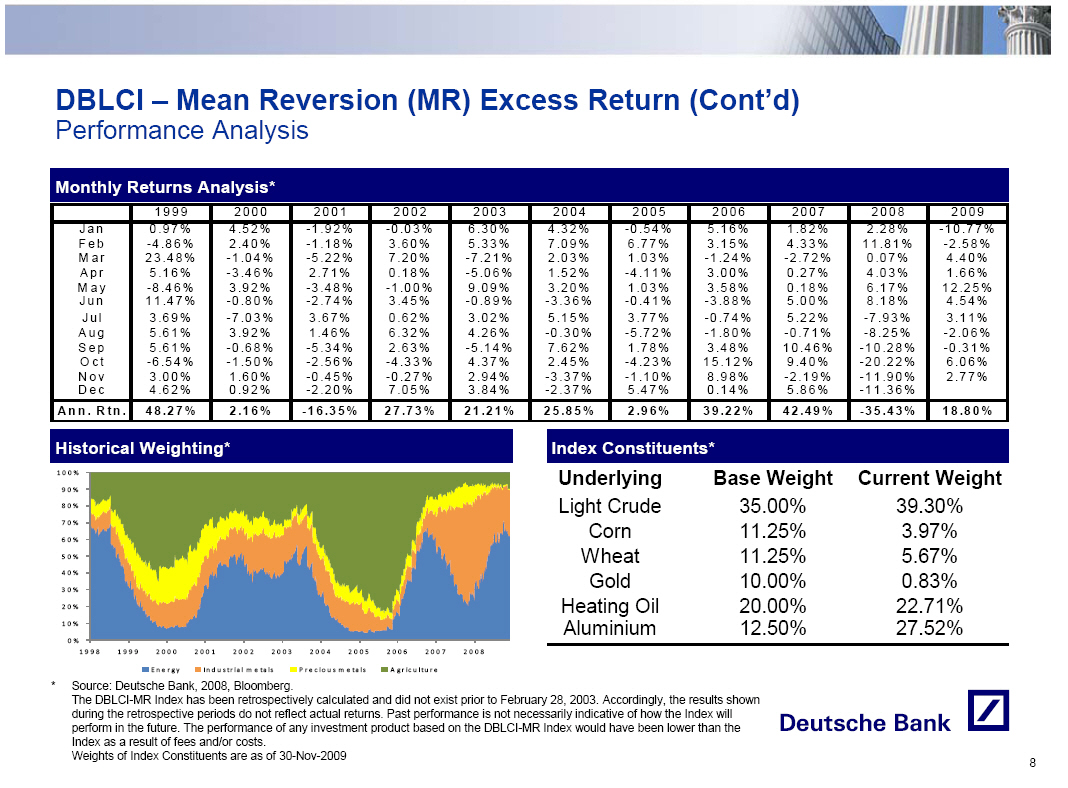
Monthly Returns Analysis*
1999 2000 2001 2002 2003
Jan 0.97% 4.52% -1.92% -0.03% 6.30%
Feb -4.86% 2.40% -1.18% 3.60% 5.33%
Mar 23.48% -1.04% -5.22% 7.20% -7.21%
Apr 5.16% -3.46% 2.71% 0.18% -5.06%
May -8.46% 3.92% -3.48% -1.00% 9.09%
Jun 11.47% -0.80% -2.74% 3.45% -0.89%
Jul 3.69% -7.03% 3.67% 0.62% 3.02%
Aug 5.61% 3.92% 1.46% 6.32% 4.26%
Sep 5.61% -0.68% -5.34% 2.63% -5.14%
Oct -6.54% -1.50% -2.56% -4.33% 4.37%
Nov 3.00% 1.60% -0.45% -0.27% 2.94%
Dec 4.62% 0.92% -2.20% 7.05% 3.84%
Ann.Rtn. 48.27% 2.16% -16.35% 27.73% 21.21%
2004 2005 2006 2007 2008 2009
4.32% -0.54% 5.16% 1.82% 2.28% -10.77%
7.09% 6.77% 3.15% 4.33% 11.81% -2.58%
2.03% 1.03% -1.24% -2.72% 0.07% 4.40%
1.52% -4.11% 3.00% 0.27% 4.03% 1.66%
3.20% 1.03% 3.58% 0.18% 6.17% 12.25%
-3.36% -0.41% -3.88% 5.00% 8.18% 4.54%
5.15% 3.77% -0.74% 5.22% -7.93% 3.11%
-0.30% -5.72% -1.80% -0.71% -8.25% -2.06%
7.62% 1.78% 3.48% 10.46% -10.28% -0.31%
2.45% -4.23% 15.12% 9.40% -20.22% 6.06%
-3.37% -1.10% 8.98% -2.19% -11.90% 2.77%
-2.37% 5.47% 0.14% 5.86% -11.36%
25.85% 2.96% 39.22% 42.49% -35.43% 18.80%
Historical Weighting*
[GRAPHIC OMITTED]
Index Constituents*
Underlying Base Weight Current Weight
Light Crude 35.00% 39.30%
Corn 11.25% 3.97%
Wheat 11.25% 5.67%
Gold 10.00% 0.83%
Heating Oil 20.00% 22.71%
Aluminium 12.50% 27.52%
* Source: Deutsche Bank, 2008, Bloomberg.
The DBLCI-MR Index has been retrospectively calculated and did not exist
prior to February 28, 2003. Accordingly, the results shown during the
retrospective periods do not reflect actual returns. Past performance is
not necessarily indicative of how the Index will perform in the future. The
performance of any investment product based on the DBLCI-MR Index would
have been lower than the Index as a result of fees and/or costs.
Weights of Index Constituents are as of 30-Nov-2009
8
|
 |
DBLCI - Mean Reversion Enhanced (MRE) Excess Return
Relative Value Asset Allocation with Optimized Roll Methodology

Key Features

o    Components: Tracks the performance of 12 commodity futures: Aluminum,
     Nickel, Zinc, Copper, Lead, WTI Crude Oil, Natural Gas, Gold, Silver, Corn,
     Wheat and Soybeans

o    Transparency: The DBLCI-MRE is a rules-based index with the closing level
     and weights published daily on Bloomberg (DBLCMREU) and DBIQ

o    Dynamic Weights and Diversification: Seeks to underweight relatively
     expensive commodities and overweight relatively cheap commodities among
     twelve of the most liquid futures contracts in four sectors: Energy, Base
     Metals, Precious Metals, Agriculture. Single commodity allocations are
     subject to a 35% cap (1) in order to avoid concentration and ensure
     adequate diversification

o    Rebalancing: A rebalancing will occur if on the monthly rebalance date, the
     one-year moving average price of one or more commodities trade +/- 5% than
     the five-year moving average

o    Optimizing Roll Returns: Deutsche Bank's proprietary Optimum Yield ("OY")
     technology rolls an expiring contract into the contract that maximizes
     positive roll yield (in a backwardated market) or minimizes negative roll
     yield (in a contango market) from the list of tradable futures which expire
     in the next 13 months

Note:

1    No commodity can have a weight higher than 35%. Only one commodity can have
     a weight higher than 20%
                                                                               9
|
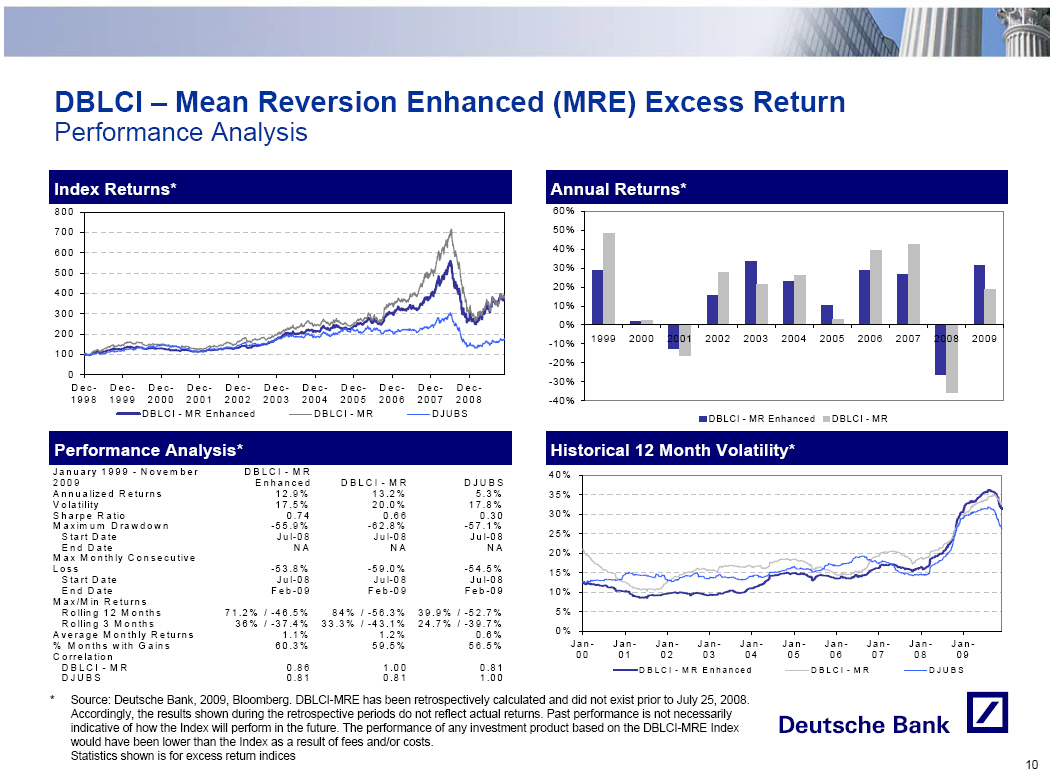 |
DBLCI - Mean Reversion Enhanced (MRE) Excess Return

Performance Analysis

Index Returns*
[GRAPHIC OMITTED]

Performance Analysis*

January 1999 - November              DBLCI-MR
2009                                 Enhanced        DBLCI-MR     DJUBS
Annualized Returns                   12.9%           13.2%        5.3%
Volatility                           17.5%           20.0%        17.8%
Sharpe Ratio                         0.74            0.66         0.30
Maximum Drawdown                     -55.9%          -62.8%       -57.1%
Start Date                           Jul-08          Jul-08       Jul-08
End Date                             NA              NA           NA
Max MonthlyConsecutive
Loss                                 -53.8%          -59.0%       -54.5%
Start Date                           Jul-08          Jul-08       Jul-08
End Date                             Feb-09          Feb-09       Feb-09
Max/Min                              Returns
Rolling 12 Months                    71.2%/-46.5%    84%/-56.3%   39.9%/-52.7%
Rolling 3 Months                     36%/-37.4%      33.3%/-43.1% 24.7%/-39.7%
Average Monthly Returns              1.1%            1.2%         0.6%
% Months with Gains                  60.3%           59.5%        56.5%
Correlation
DBLCI-MR                             0.86            1.00         0.81
DJUBS                                0.81            0.81         1.00

Annual Returns*
[GRAPHIC OMITTED]


 Historical 12 Month Volatility*
[GRAPHIC OMITTED]


*    Source: Deutsche Bank, 2009, Bloomberg. DBLCI-MRE has been retrospectively
     calculated and did not exist prior to July 25, 2008. Accordingly, the
     results shown during the retrospective periods do not reflect actual
     returns. Past performance is not necessarily indicative of how the Index
     will perform in the future. The performance of any investment product based
     on the DBLCI-MRE Index would have been lower than the Index as a result of
     fees and/or costs.

     Statistics shown is for excess return indices

                                                                              10
|
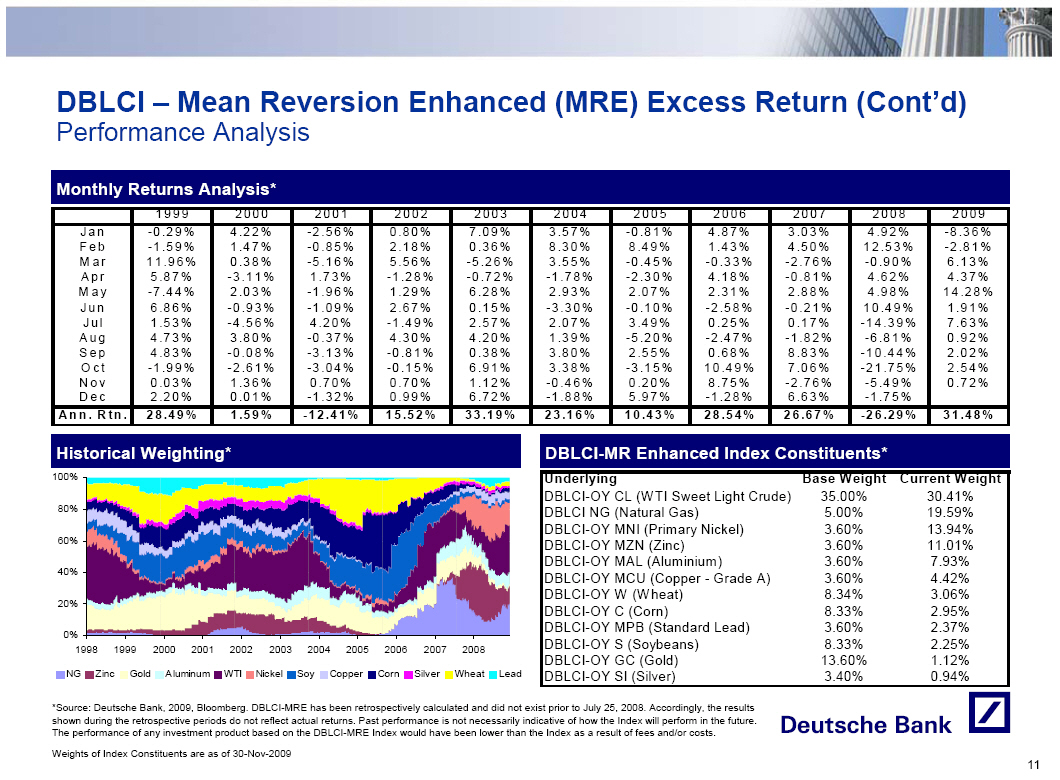 |
DBLCI - Mean Reversion Enhanced (MRE) Excess Return (Cont'd)

Performance Analysis

Monthly Returns Analysis*

             1999     2000    2001     2002     2003     2004     2005     2006     2007     2008     2009
Jan          -0.29%   4.22%   -2.56%   0.80%    7.09%    3.57%    -0.81%   4.87%    3.03%    4.92%    -8.36%
Feb          -1.59%   1.47%   -0.85%   2.18%    0.36%    8.30%    8.49%    1.43%    4.50%    12.53%   -2.81%
Mar          11.96%   0.38%   -5.16%   5.56%    -5.26%   3.55%    -0.45%   -0.33%   -2.76%   -0.90%   6.13%
Apr          5.87%    -3.11%  1.73%    -1.28%   -0.72%   -1.78%   -2.30%   4.18%    -0.81%   4.62%    4.37%
May          -7.44%   2.03%   -1.96%   1.29%    6.28%    2.93%    2.07%    2.31%    2.88%    4.98%    14.28%
Jun          6.86%    -0.93%  -1.09%   2.67%    0.15%    -3.30%   -0.10%   -2.58%   -0.21%   10.49%   1.91%
Jul          1.53%    -4.56%  4.20%    -1.49%   2.57%    2.07%    3.49%    0.25%    0.17%    -14.39%  7.63%
Aug          4.73%    3.80%   -0.37%   4.30%    4.20%    1.39%    -5.20%   -2.47%   -1.82%   -6.81%   0.92%
Sep          4.83%    -0.08%  -3.13%   -0.81%   0.38%    3.80%    2.55%    0.68%    8.83%    -10.44%  2.02%
Oct          -1.99%   -2.61%  -3.04%   -0.15%   6.91%    3.38%    -3.15%   10.49%   7.06%    -21.75%  2.54%
Nov          0.03%    1.36%   0.70%    0.70%    1.12%    -0.46%   0.20%    8.75%    -2.76%   -5.49%   0.72%
Dec          2.20%    0.01%   -1.32%   0.99%    6.72%    -1.88%   5.97%    -1.28%   6.63%    -1.75%
Ann.Rtn.     28.49%   1.59%   -12.41%  15.52%   33.19%   23.16%   10.43%   28.54%   26.67%   -26.29%  31.48%

Historical Weighting*
[GRAPHIC OMITTED]


DBLCI-MR Enhanced Index Constituents*
- --------------------------------------------------------------------------------
Underlying                                       Base Weight    Current Weight
DBLCI-OY CL (WTI Sweet Light Crude)               35.00%            30.41%
DBLCI NG (Natural Gas)                            5.00%             19.59%
DBLCI-OY MNI (Primary Nickel)                     3.60%             13.94%
DBLCI-OY MZN (Zinc)                               3.60%             11.01%
DBLCI-OY MAL (Aluminium)                          3.60%             7.93%
DBLCI-OY MCU (Copper - Grade A)                   3.60%             4.42%
DBLCI-OY W  (Wheat)                               8.34%             3.06%
DBLCI-OY C (Corn)                                 8.33%             2.95%
DBLCI-OY MPB (Standard Lead)                      3.60%             2.37%
DBLCI-OY S (Soybeans)                             8.33%             2.25%
DBLCI-OY GC (Gold)                                13.60%            1.12%
DBLCI-OY SI (Silver)                              3.40%             0.94%
- -------------------------------------------------------------------------------

*Source: Deutsche Bank, 2009, Bloomberg. DBLCI-MRE has been retrospectively
calculated and did not exist prior to July 25, 2008. Accordingly, the results
shown during the retrospective periods do not reflect actual returns. Past
performance is not necessarily indicative of how the Index will perform in the
future. The performance of any investment product based on the DBLCI-MRE Index
would have been lower than the Index as a result of fees and/or costs.
Weights of Index Constituents are as of 30-Nov-2009

                                                                              11
|
 |
DBLCI - Mean Reversion Enhanced TV15 (MRE15) Excess Return

Relative Value Asset Allocation with Optimized Roll Methodology and Target Volatility


Key Features

o    Components: Tracks the performance of 12 commodity futures: Aluminum,
     Nickel, Zinc, Copper, Lead, WTI Crude Oil, Natural Gas, Gold, Silver, Corn,
     Wheat and Soybeans

o    Transparency: The DBLCI-MRE15 is a rules-based index with the closing level
     and weights published daily on Bloomberg (DBLCMTEU) and DBIQ

o    Dynamic Weights and Diversification: Seeks to underweight relatively
     expensive commodities and overweight relatively cheap commodities among
     twelve of the most liquid futures contracts in four sectors: Energy, Base
     Metals, Precious Metals, Agriculture. Single commodity allocations are
     subject to a 35% cap (1) in order to avoid concentration problem and ensure
     adequate diversification

o    Rebalancing: A rebalancing will occur if on the monthly rebalance date, the
     one-year moving average price of one or more commodities trade +/- 5% than
     the five-year moving average

o    Optimizing Roll Returns: Deutsche Bank's proprietary optimum yield ("OY")
     technology rolls an expiring contract into the contract that maximizes
     positive roll yield (in a backwardated market) or minimizes negative roll
     yield (in a contango market) from the list of tradable futures which expire
     in the next 13 months

o    Target Volatility: Exposure to the DBLCI-MRE is reset monthly in order to
     target a realized volatility close to 15%. Exposure = Max (300%, 15% target
     volatility / 90 day realized volatility)

Note:

1    No commodity can have a weight higher than 35%. Only one commodity can have
     a weight higher than 20%

                                                                              12
|
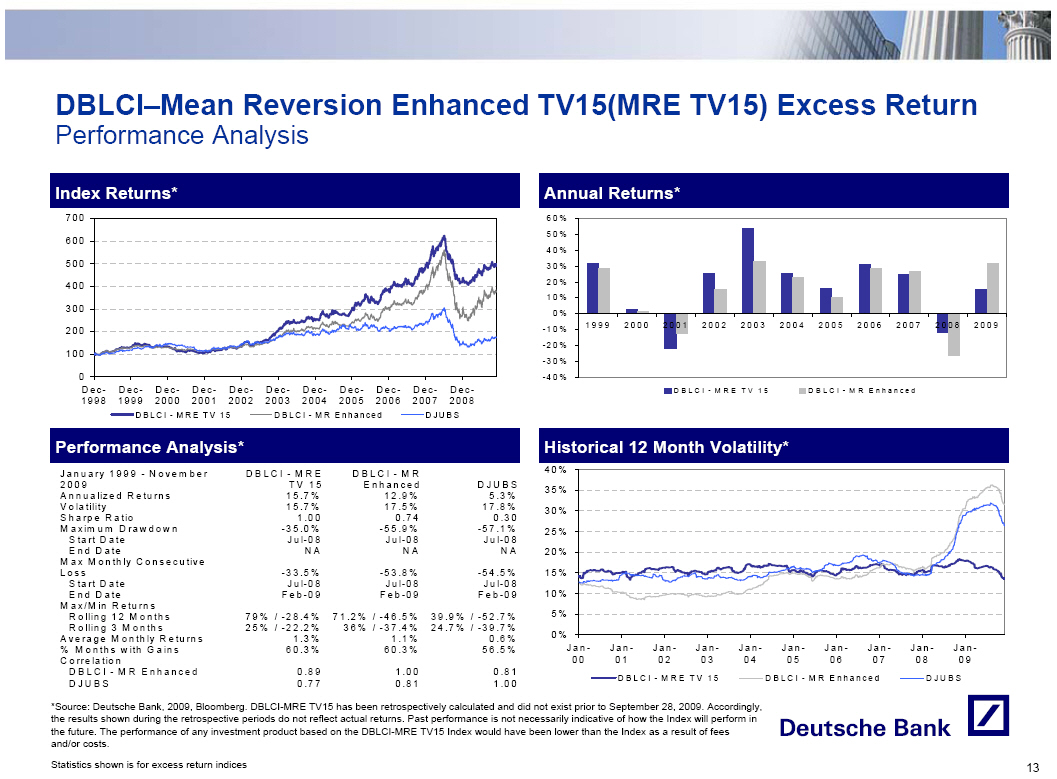 |
DBLCI-Mean Reversion Enhanced TV15(MRE TV15) Excess Return
Performance Analysis

Index Returns*
[GRAPHIC OMITTED]

Annual Returns*
[GRAPHIC OMITTED]

Performance Analysis*

January 1999 - November             DBLCI-MRE   DBLCI-MR
2009                                TV15        Enhanced        DJUBS
Annualized Returns                  15.7%       12.9%           5.3%
Volatility                          15.7%       17.5%           17.8%
Sharpe Ratio                        1.00        0.74            0.30
Maximum Drawdown                    -35.0%      -55.9%          -57.1%
Start Date                          Jul-08      Jul-08          Jul-08
End Date                            NA          NA              NA
Max Monthly Consecutive
Loss                                -33.5%      -53.8%          -54.5%
Start Date                          Jul-08      Jul-08          Jul-08
End Date                            Feb-09      Feb-09          Feb-09
Max/Min                             Returns
Rolling 12 Months                   79%/-28.4%  71.2%/-46.5%    39.9%/-52.7%
Rolling 3 Months                    25%/-22.2%  36%/-37.4%      24.7%/-39.7%
Average Monthly Returns             1.3%        1.1%            0.6%
% Months with Gains                 60.3%       60.3%           56.5%
Correlation
DBLCI-MREnhanced                    0.89        1.00            0.81
DJUBS                               0.77        0.81            1.00

Historical 12 Month Volatility*
[GRAPHIC OMITTED]

*Source: Deutsche Bank, 2009, Bloomberg. DBLCI-MRE TV15 has been retrospectively
calculated  and did not exist prior to  September  28,  2009.  Accordingly,  the
results shown during the  retrospective  periods do not reflect actual  returns.
Past performance is not necessarily  indicative of how the Index will perform in
the future.  The  performance of any  investment  product based on the DBLCI-MRE
TV15  Index  would  have been  lower  than the Index as a result of fees  and/or
costs.
Statistics shown is for excess return indices

                                                                              13
|
 |
DBLCI-Mean Reversion Enhanced TV15(MRE TV15) Excess Return
Performance Analysis (Cont'd)
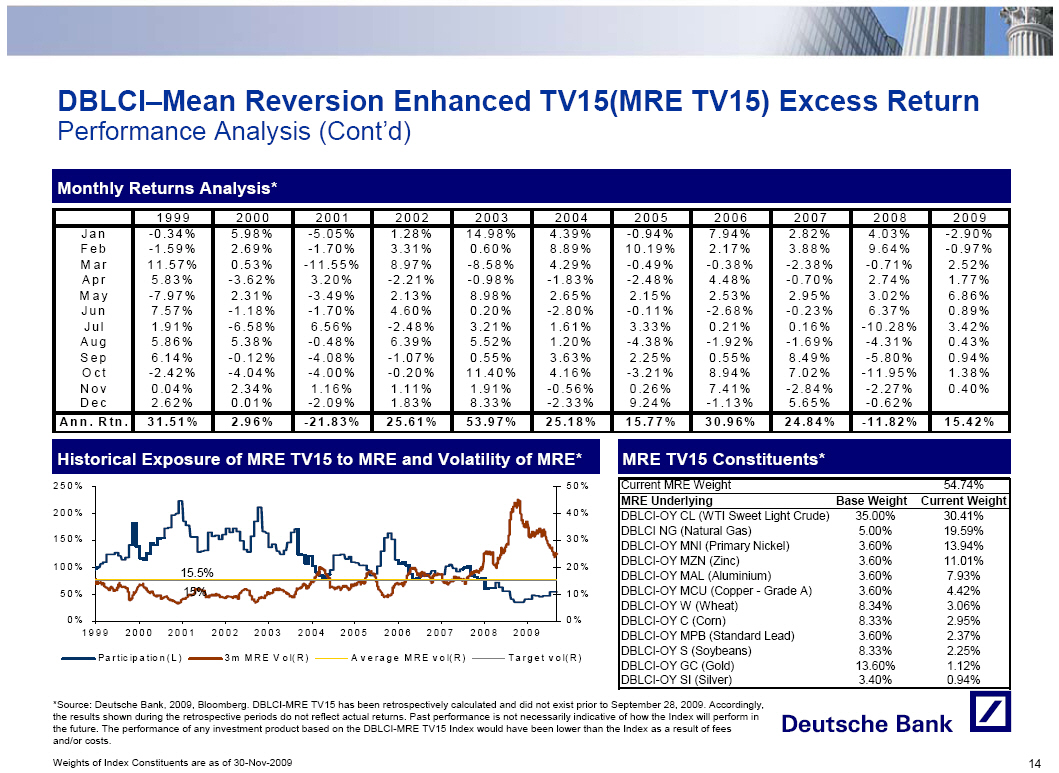
Monthly Returns Analysis*
1999 2000 2001 2002 2003
Jan -0.34% 5.98% -5.05% 1.28% 14.98%
Feb -1.59% 2.69% -1.70% 3.31% 0.60%
Mar 11.57% 0.53% -11.55% 8.97% -8.58%
Apr 5.83% -3.62% 3.20% -2.21% -0.98%
May -7.97% 2.31% -3.49% 2.13% 8.98%
Jun 7.57% -1.18% -1.70% 4.60% 0.20%
Jul 1.91% -6.58% 6.56% -2.48% 3.21%
Aug 5.86% 5.38% -0.48% 6.39% 5.52%
Sep 6.14% -0.12% -4.08% -1.07% 0.55%
Oct -2.42% -4.04% -4.00% -0.20% 11.40%
Nov 0.04% 2.34% 1.16% 1.11% 1.91%
Dec 2.62% 0.01% -2.09% 1.83% 8.33%
Ann.Rtn. 31.51% 2.96% -21.83% 25.61% 53.97%
2004 2005 2006 2007 2008 2009
4.39% -0.94% 7.94% 2.82% 4.03% -2.90%
8.89% 10.19% 2.17% 3.88% 9.64% -0.97%
4.29% -0.49% -0.38% -2.38% -0.71% 2.52%
-1.83% -2.48% 4.48% -0.70% 2.74% 1.77%
2.65% 2.15% 2.53% 2.95% 3.02% 6.86%
-2.80% -0.11% -2.68% -0.23% 6.37% 0.89%
1.61% 3.33% 0.21% 0.16% -10.28% 3.42%
1.20% -4.38% -1.92% -1.69% -4.31% 0.43%
3.63% 2.25% 0.55% 8.49% -5.80% 0.94%
4.16% -3.21% 8.94% 7.02% -11.95% 1.38%
-0.56% 0.26% 7.41% -2.84% -2.27% 0.40%
-2.33% 9.24% -1.13% 5.65% -0.62%
25.18% 15.77% 30.96% 24.84% -11.82% 15.42%
Historical Exposure of MRE TV15 to MRE and Volatility of MRE*
[GRAPHIC OMITTED]
MRE TV15 Constituents*
- -------------------------------------------------------------------
Current MRE Weight 54.74%
- -------------------------------------------------------------------
MRE Underlying Base Weight Current Weight
- -------------------------------------------------------------------
DBLCI-OY CL (WTI Sweet Light Crude) 35.00% 30.41%
DBLCI NG (Natural Gas) 5.00% 19.59%
DBLCI-OY MNI (Primary Nickel) 3.60% 13.94%
DBLCI-OY MZN (Zinc) 3.60% 11.01%
DBLCI-OY MAL (Aluminium) 3.60% 7.93%
DBLCI-OY MCU (Copper - Grade A) 3.60% 4.42%
DBLCI-OY W (Wheat) 8.34% 3.06%
DBLCI-OY C (Corn) 8.33% 2.95%
DBLCI-OY MPB (Standard Lead) 3.60% 2.37%
DBLCI-OY S (Soybeans) 8.33% 2.25%
DBLCI-OY GC (Gold) 13.60% 1.12%
DBLCI-OY SI (Silver) 3.40% 0.94%
- -------------------------------------------------------------------
*Source: Deutsche Bank, 2009, Bloomberg. DBLCI-MRE TV15 has been retrospectively
calculated and did not exist prior to September 28, 2009. Accordingly, the
results shown during the retrospective periods do not reflect actual returns.
Past performance is not necessarily indicative of how the Index will perform in
the future. The performance of any investment product based on the DBLCI-MRE
TV15 Index would have been lower than the Index as a result of fees and/or
costs.
Weights of Index Constituents are as of 30-Nov-2009
14
|
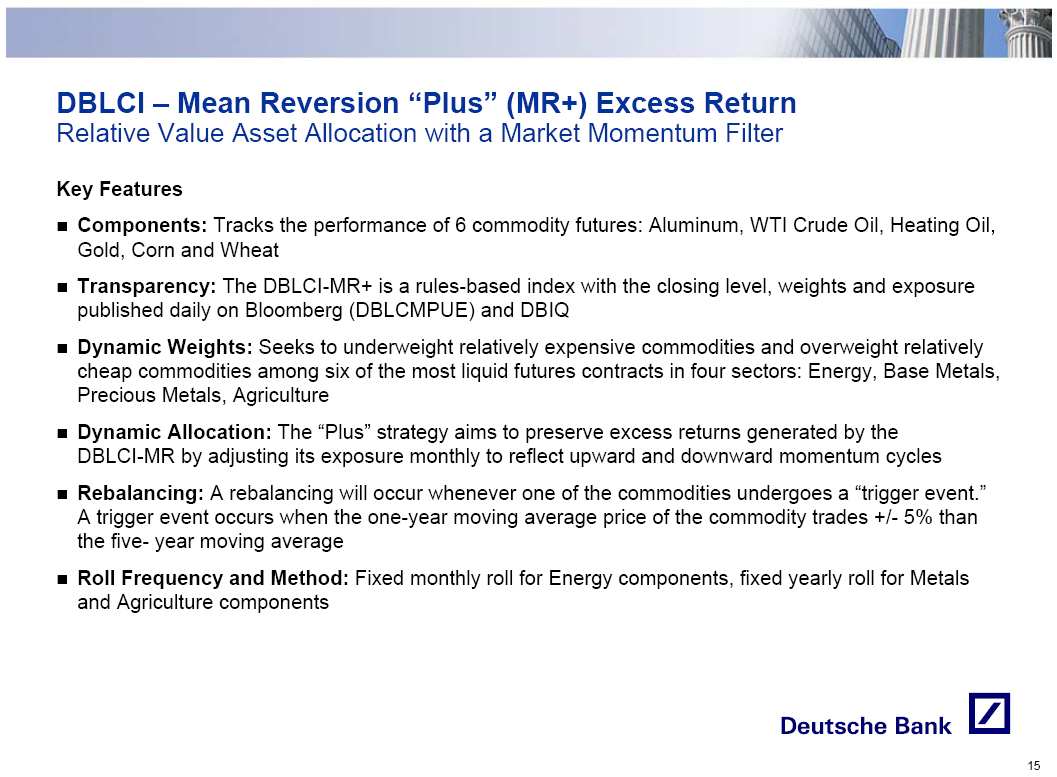 |
DBLCI - Mean Reversion "Plus" (MR+) Excess Return
Relative Value Asset Allocation with a Market Momentum Filter

Key Features

o    Components: Tracks the performance of 6 commodity futures: Aluminum, WTI
     Crude Oil, Heating Oil, Gold, Corn and Wheat

o    Transparency: The DBLCI-MR+ is a rules-based index with the closing level,
     weights and exposure published daily on Bloomberg (DBLCMPUE) and DBIQ

o    Dynamic Weights: Seeks to underweight relatively expensive commodities and
     overweight relatively cheap commodities among six of the most liquid
     futures contracts in four sectors: Energy, Base Metals, Precious Metals,
     Agriculture

o    Dynamic Allocation: The "Plus" strategy aims to preserve excess returns
     generated by the DBLCI-MR by adjusting its exposure monthly to reflect
     upward and downward momentum cycles

o    Rebalancing: A rebalancing will occur whenever one of the commodities
     undergoes a "trigger event." A trigger event occurs when the one-year
     moving average price of the commodity trades +/- 5% than the five- year
     moving average

o    Roll Frequency and Method: Fixed monthly roll for Energy components, fixed
     yearly roll for Metals and Agriculture components

                                                                              15
|
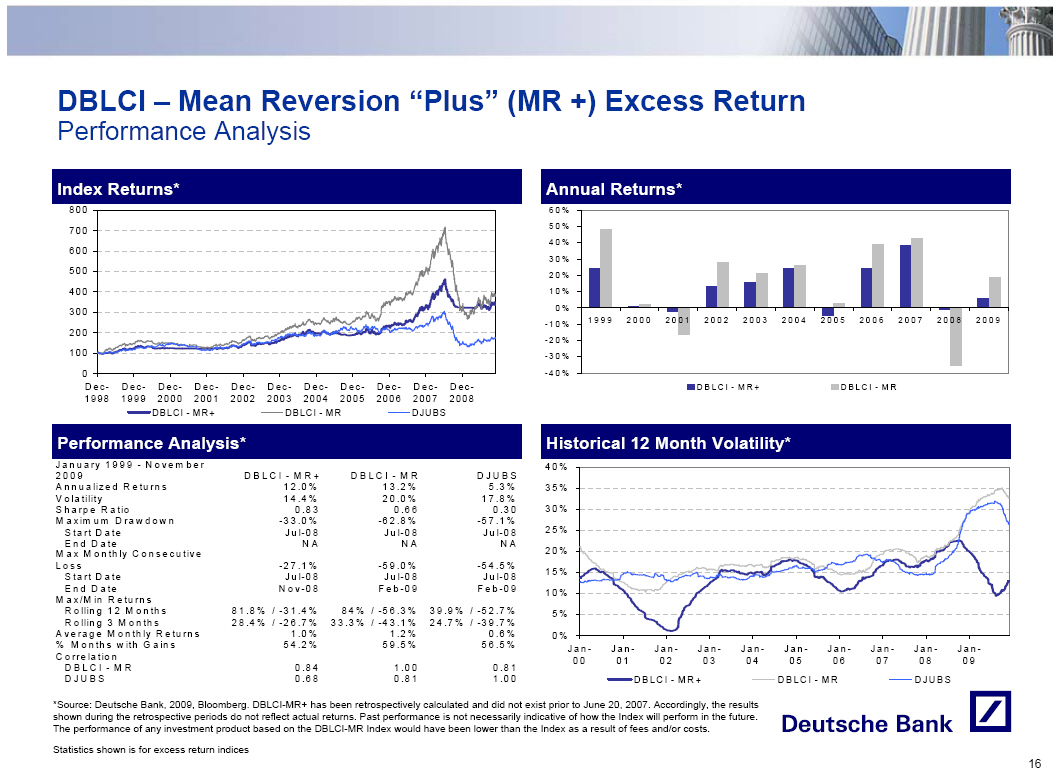 |
DBLCI - Mean Reversion "Plus" (MR +) Excess Return
Performance Analysis

Index Returns*
[GRAPHIC OMITTED]

Annual Returns*
[GRAPHIC OMITTED]

 Performance Analysis*
 J a n u a ry  1 9 9 9  -
 N o v e m b e r
                             D B L C I  -  M R
 2 0 0 9                                     +D B L C I  -  M R         D J U B S
 A n n u a liz e d  R e turn s        1 2 .0 %         1 3 .2 %            5 .3 %
 V o latility                         1 4 .4 %         2 0 .0 %          1 7 .8 %
 S h a rp e  R a tio                    0 .8 3           0 .6 6            0 .3 0
 M a x im u m   D ra w d o w n       -3 3 .0 %        -6 2 .8 %         -5 7 .1 %
 S ta rt  D a te                     J u l-0 8        J u l-0 8         J u l-0 8
 E n d  D a te                             N A              N A               N A
 M a x  M o n th ly  C o n s e c u tiv e
 L o s s                             -2 7 .1 %        -5 9 .0 %         -5 4 .5 %
 S ta rt  D a te                     J u l-0 8        J u l-0 8         J u l-0 8
 E n d  D a te                      N o v -0 8       F e b -0 9        F e b -0 9
 M a x /M in  R e tu rn s
 R o llin                     8 1 .8 %   /  -3          -5 6     3 9 .9 %   /  -5
 g        1 2  M o n th s               1 .4 %  8 4 %/     .3 %            2 .7 %
 R o llin                     2 8 .4 %   /  -2 3 3 .3 %   /  -4  2 4 .7 %   /  -3
 g        3  M o n th s                 6 .7 %           3 .1 %            9 .7 %
 Average Monthly Returns                1 .0 %           1 .2 %            0 .6 %
 %   M o n th s  w ith  G ain s       5 4 .2 %         5 9 .5 %          5 6 .5 %
 C o rre la tio n
 D B L C I  -  M R                      0 .8 4           1 .0 0            0 .8 1
 D J U B S                              0 .6 8           0 .8 1            1 .0 0

Historical 12 Month Volatility*
[GRAPHIC OMITTED]

*Source: Deutsche Bank, 2009, Bloomberg. DBLCI-MR+ has been retrospectively
calculated and did not exist prior to June 20, 2007. Accordingly, the results
shown during the retrospective periods do not reflect actual returns. Past
performance is not necessarily indicative of how the Index will perform in the
future. The performance of any investment product based on the DBLCI-MR Index
would have been lower than the Index as a result of fees and/or costs.

Statistics shown is for excess return indices

                                                                              16
|
 |
DBLCI - Mean Reversion "Plus" (MR +) Excess Return (Cont'd)
Performance Analysis

Monthly Returns Analysis*

                  1999          2000         2001          2002         2003
      Jan         0.03%        4.52%        -0.82%        -0.37%        6.00%
      Feb        -0.47%        2.40%        -0.54%        0.59%         5.33%
      Mar         1.48%        -1.04%       -0.43%        1.82%        -7.21%
      Apr         3.46%        -3.25%        0.19%        0.56%        -4.81%
      May        -6.05%        3.26%         0.00%        -1.06%        7.06%
      Jun         8.94%        -0.72%        0.00%        0.96%        -0.72%
      Jul         3.15%        -5.41%        0.00%        0.46%         2.41%
      Aug         5.61%        1.14%         0.00%        6.32%         3.38%
      Sep         5.61%        0.12%        -0.71%        2.63%        -4.70%
      Oct        -6.02%        -0.96%       -0.11%        -4.22%        3.50%
      Nov         2.40%        1.02%         0.00%        -0.63%        1.68%
      Dec         4.67%        0.22%         0.00%        5.88%         3.84%
   Ann.Rtn.      23.97%        0.90%        -2.40%        13.21%       15.56%

     2004          2005         2006          2007         2008         2009
     4.32%        -0.37%        3.00%        1.18%         2.24%       -0.59%
     6.67%        3.29%         2.93%        4.41%        11.81%       -0.09%
     2.24%        0.00%        -1.24%        -2.72%        0.07%        0.00%
     1.52%        -3.91%        3.00%        0.32%         4.17%       -0.38%
     3.16%        0.30%         3.58%        -0.39%        5.70%        2.83%
    -3.08%        -0.28%       -3.88%        4.11%         8.18%        1.72%
     4.96%        1.94%        -0.74%        5.22%        -7.93%       -1.69%
    -0.30%        -4.54%       -1.50%        -0.99%       -8.32%       -2.17%
     7.12%        0.69%         0.30%        9.93%        -5.79%       -0.17%
     2.31%        -2.10%        8.63%        9.40%        -7.37%        4.19%
    -3.34%        -0.54%        8.98%        -2.19%       -1.04%        2.37%
    -3.07%        1.17%        -0.11%        5.76%         0.00%
    24.07%        -4.53%       24.53%        38.57%       -0.67%        6.00%


Historical Exposure of MR+ to MR*
[GRAPHIC OMITTED]

MR+ Constituents*

- --------------------------------------------------------------------
 Current MR  W eight                                91.67%
 -------------------------------------------------------------------
 M R  Underlying            Base Weight        Current Weight
 -------------------------------------------------------------------
 Light Crude                  35.00%                39.30%
 Corn                         11.25%                3.97%
 W heat                       11.25%                5.67%
 Gold                         10.00%                0.83%
 Heating Oil                  20.00%                22.71%
 Alum inium                   12.50%                27.52%
 -------------------------------------------------------------------


*Source: Deutsche Bank, 2009, Bloomberg. DBLCI-MR+ has been retrospectively
calculated and did not exist prior to June 20, 2007. Accordingly, the results
shown during the retrospective periods do not reflect actual returns. Past
performance is not necessarily indicative of how the Index will perform in the
future. The performance of any investment product based on the DBLCI-MR Index
would have been lower than the Index as a result of fees and/or costs.

Weights of Index Constituents are as of 30-Nov-2009

                                                                              17
|
 |
Appendix

                                                                              18
|
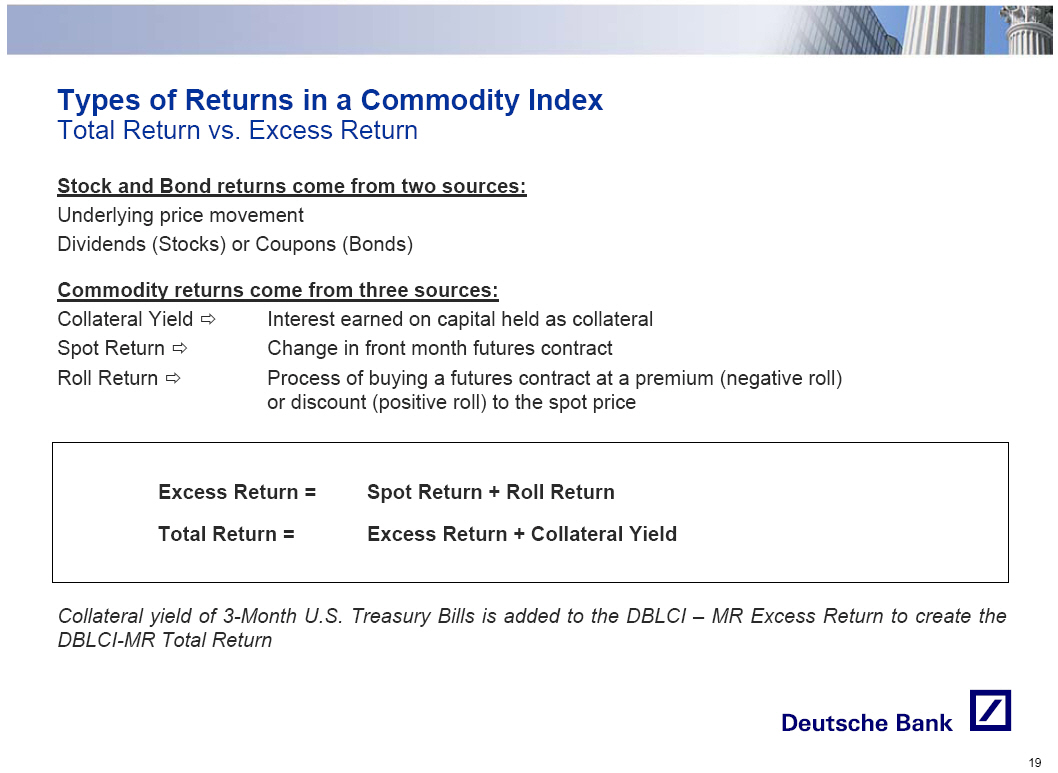 |
Types of Returns in a Commodity Index
Total Return vs. Excess Return

Stock and Bond returns come from two sources:
Underlying price movement
Dividends (Stocks) or Coupons
(Bonds)

Commodity returns come from three sources:
Collateral Yield >   Interest earned on capital held as collateral
Spot Return >        Change in front month futures contract
Roll Return >        Process of buying a futures contract at a premium (negative roll)
                     or discount (positive roll) to the spot price

                  Excess Return =   Spot Return + Roll Return

                  Total Return =    Excess Return + Collateral Yield

Collateral yield of 3-Month U.S. Treasury Bills is added to the DBLCI - MR
Excess Return to create the DBLCI-MR Total Return

                                                                              19
|
 |
Mean Reversion
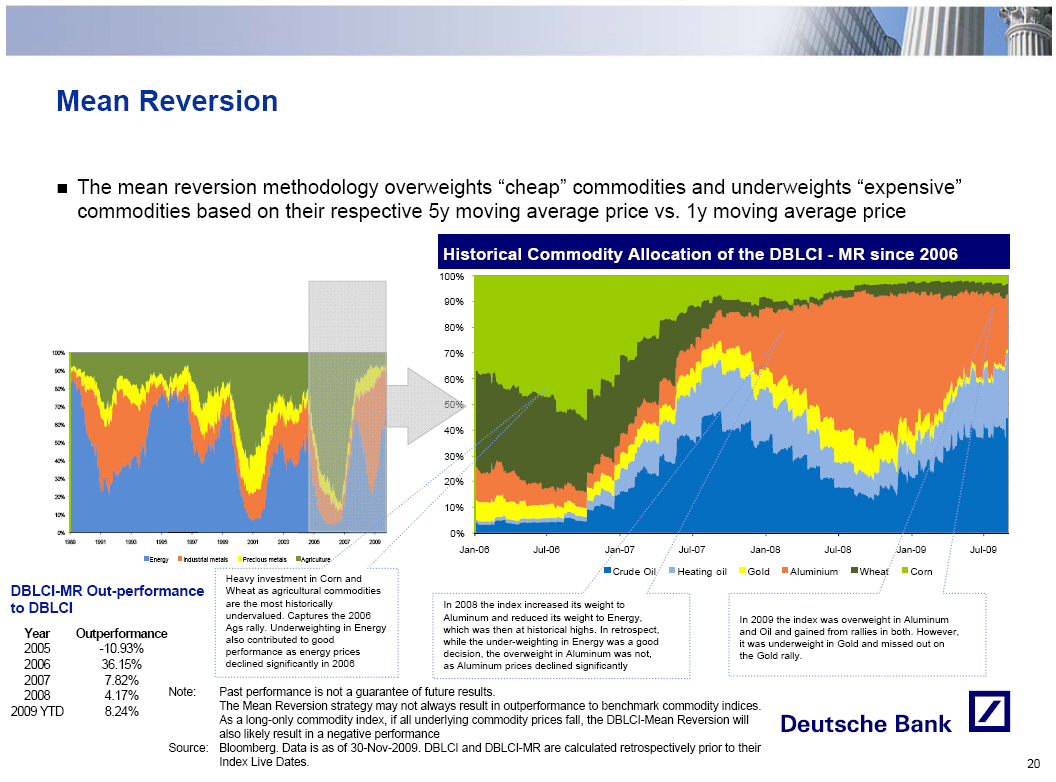
o The mean reversion methodology overweights "cheap" commodities and
underweights "expensive" commodities based on their respective 5y moving
average price vs. 1y moving average price
[GRAPHIC OMITTED]
Historical Commodity Allocation of the DBLCI - MR since 2006
[GRAPHIC OMITTED]
DBLCI-MR Out-performance
to DBLCI
Year Outperformance
2005 -10.93%
2006 36.15%
2007 7.82%
Heavy investment in Corn and Wheat as agricultural commodities are the most
historically undervalued. Captures the 2006 Ags rally. Underweighting in Energy
also contributed to good performance as energy prices declined significantly in
2006
In 2008 the index increased its weight to Aluminum and reduced its weight to
Energy, which was then at historical highs. In retrospect, while the
under-weighting in Energy was a good decision, the overweight in Aluminum was
not, as Aluminum prices declined significantly
In 2009 the index was overweight in Aluminum and Oil and gained from rallies in
both. However, it was underweight in Gold and missed out on the Gold rally.
Note:
Past performance is not a guarantee of future results. The Mean Reversion
strategy may not always result in outperformance to benchmark commodity indices.
As a long-only commodity index, if all underlying commodity prices fall, the
DBLCI-Mean Reversion will also likely result in a negative performance
Source:
Bloomberg. Data is as of 30-Nov-2009. DBLCI and DBLCI-MR are calculated
retrospectively prior to their Index Live Dates.
20
|
 |
Momentum
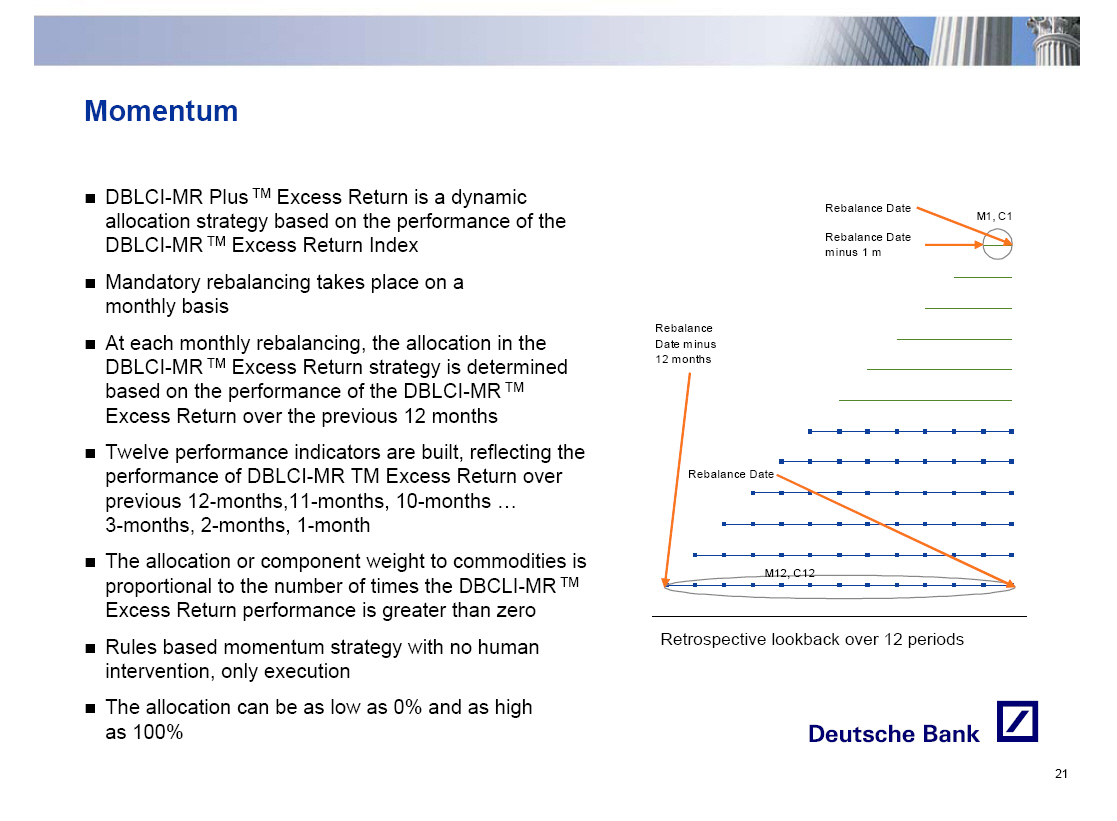
o DBLCI-MR Plus TM Excess Return is a dynamic allocation strategy based on
the performance of the DBLCI-MR TM Excess Return Index
o Mandatory rebalancing takes place on a monthly basis
o At each monthly rebalancing, the allocation in the DBLCI-MR TM Excess
Return strategy is determined based on the performance of the DBLCI-MR TM
Excess Return over the previous 12 months
o Twelve performance indicators are built, reflecting the performance of
DBLCI-MR TM Excess Return over previous 12-months,11-months, 10-months ...
3-months, 2-months, 1-month
o The allocation or component weight to commodities is proportional to the
number of times the DBCLI-MR TM Excess Return performance is greater than
zero
o Rules based momentum strategy with no human intervention, only execution
o The allocation can be as low as 0% and as high as 100%
[GRAPHIC OMITTED]
21
|
 |
Optimized Yield
Contract selection to create an "Optimum Yield"
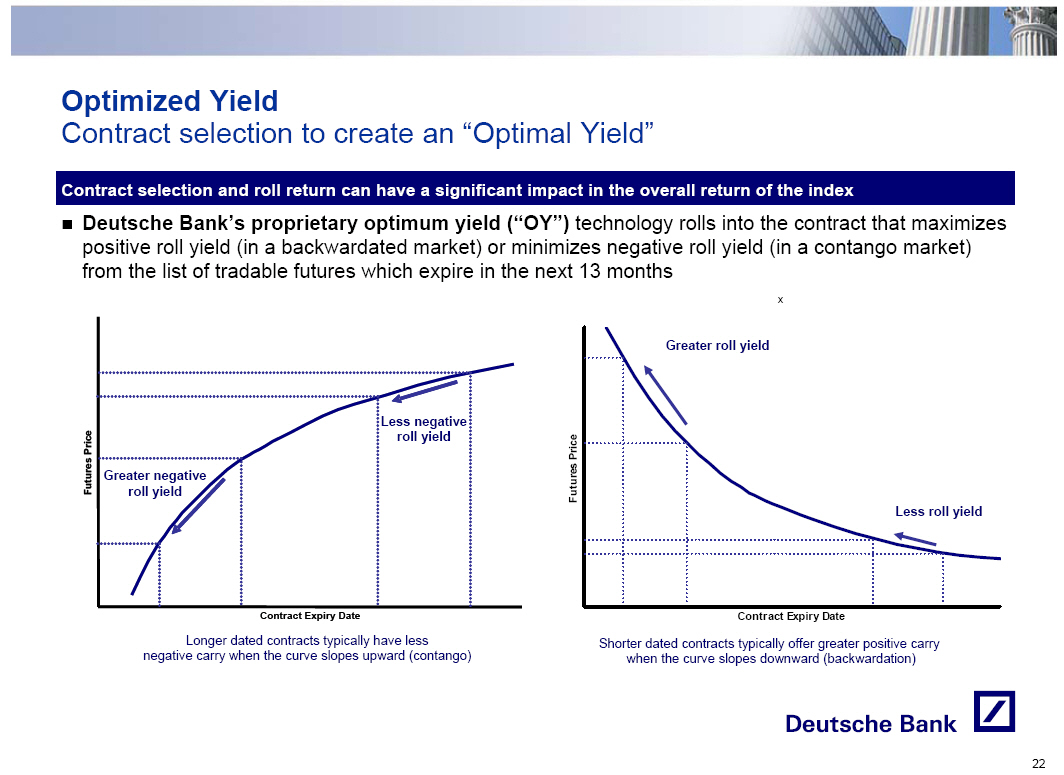
Contract selection and roll return can have a significant impact in the overall
return of the index
o Deutsche Bank's proprietary optimum yield ("OY") technology rolls into the
contract that maximizes positive roll yield (in a backwardated market) or
minimizes negative roll yield (in a contango market) from the list of
tradable futures which expire in the next 13 months
[GRAPHIC OMITTED]
Longer dated contracts typically have less negative carry when the curve slopes
upward (contango)
[GRAPHIC OMITTED]
Shorter dated contracts typically offer greater positive carry when the curve
slopes downward (backwardation)
22
|
 |
Optimized Yield (Cont'd)
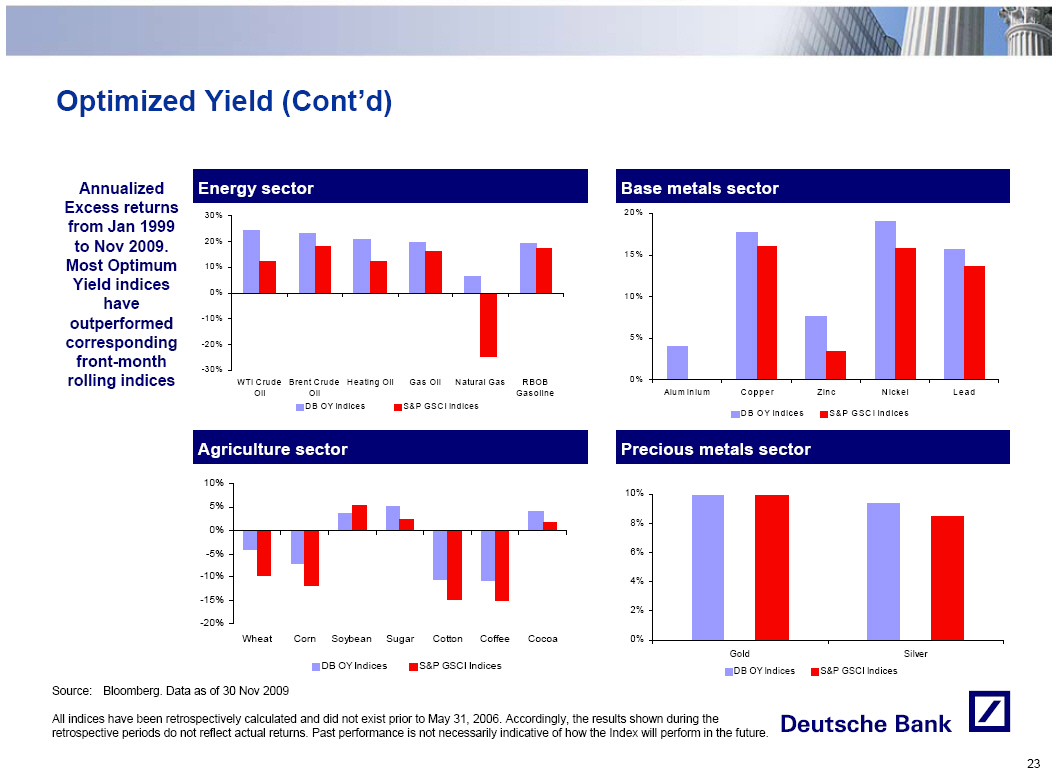
Annualized Excess returns from Jan 1999 to Nov 2009. Most Optimum Yield indices
have outperformed corresponding front-month rolling indices
Energy sector
[GRAPHIC OMITTED]
Base metals sector
[GRAPHIC OMITTED]
Agriculture sector
[GRAPHIC OMITTED]
Precious metals sector
[GRAPHIC OMITTED]
Source: Bloomberg. Data as of 30 Nov 2009
All indices have been retrospectively calculated and did not exist prior to May
31, 2006. Accordingly, the results shown during the retrospective periods do not
reflect actual returns. Past performance is not necessarily indicative of how
the Index will perform in the future.
23
|
 |
Optimized Yield
Available Indices
     Commodity              Contract Expiry Date            Bloomberg Ticker
                                     Energy
   WTI crude oil                  22-Jun-10                  DBLCOCLE Index
  Brent crude oil                 15-Sep-10                  DBLCYECO Index
    Heating oil                   28-May-10                  DBLCOHOE Index
   RBOB gasoline                  29-Oct-10                  DBLCYERB Index
       Gasoil                     12-Jul-10                  DBLCYEGO Index
    Natural gas                   27-Aug-10                  DBLCYENG Index
                                   Base Metals
      Aluminum                    17-Nov-10                  DBLCOALE Index
       Copper                     17-Mar-10                  DBLCYECU Index
        Zinc                      19-May-10                  DBLCYEZN Index
       Nickel                     18-Aug-10                  DBLCYENI Index
        Lead                      18-Aug-10                  DBLCYEPB Index
                                 Precious Metals
        Gold                      28-Apr-10                  DBLCOGCE Index
       Silver                     28-Dec-10                  DBLCYESI Index
                                   Agriculture
       Wheat                      14-Jul-10                  DBLCOWTE Index
    Kansas Wheat                  14-Jul-10                  DBLCYEKW Index
        Corn                      14-Dec-10                  DBLCOCNE Index
      Soybean                     12-Nov-10                  DBLCYESS Index
       Cotton                     7-Oct-10                   DBLCYECE Index
       Sugar                      30-Jun-10                  DBLCYESB Index
       Coffee                     19-Mar-10                  DBLCYEKC Index
       Cocoa                      16-Mar-10                  DBLCYECC Index
Source:    DBIQ, Data as of 30-Nov-2009

Bloomberg Tickers shown are for Excess Return version of the indices

                                                                              24
|
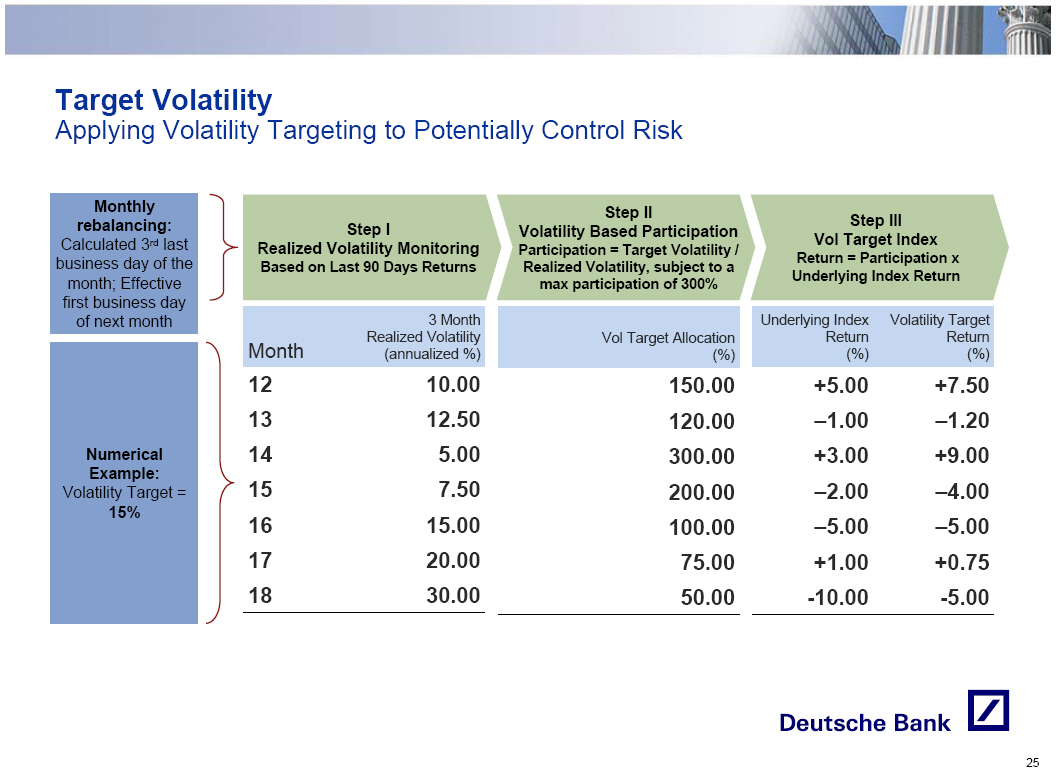 |
Target Volatility
Applying Volatility Targeting to Potentially Control Risk

            Monthly
          rebalancing:                                  Step I
      Calculated 3rd last            Realized Volatility Monitoring
      business day of the            Based on Last 90 Days Returns
        month; Effective
       first business day                                         3 Month
         of next month          Month                 Realized Volatility
                                                           (annualized %)
                                12                                  10.00
                                13                                  12.50
           Numerical            14                                   5.00
            Example:            15                                   7.50
      Volatility Target = 15%   16                                  15.00
                                17                                  20.00
                                18                                  30.00
                                ------------------------------------------

                 Step II                                   Step III
     Volatility Based Participation                   Vol Target Index
   Participation = Target Volatility /             Return = Participation x
    Realized Volatility, subject to a               Underlying Index Return
        max participation of 300%             Underlying Index Volatility Target
            Vol Target Allocation                  Return             Return
                              (%)                     (%)                (%)
                           150.00                   +5.00              +7.50
                           120.00                   -1.00              -1.20
                           300.00                   +3.00              +9.00
                           200.00                   -2.00              -4.00
                           100.00                   -5.00              -5.00
                            75.00                   +1.00              +0.75
                            50.00                  -10.00              -5.00
- ---------------------------------- ------------------------------------------

                                                                              25
|
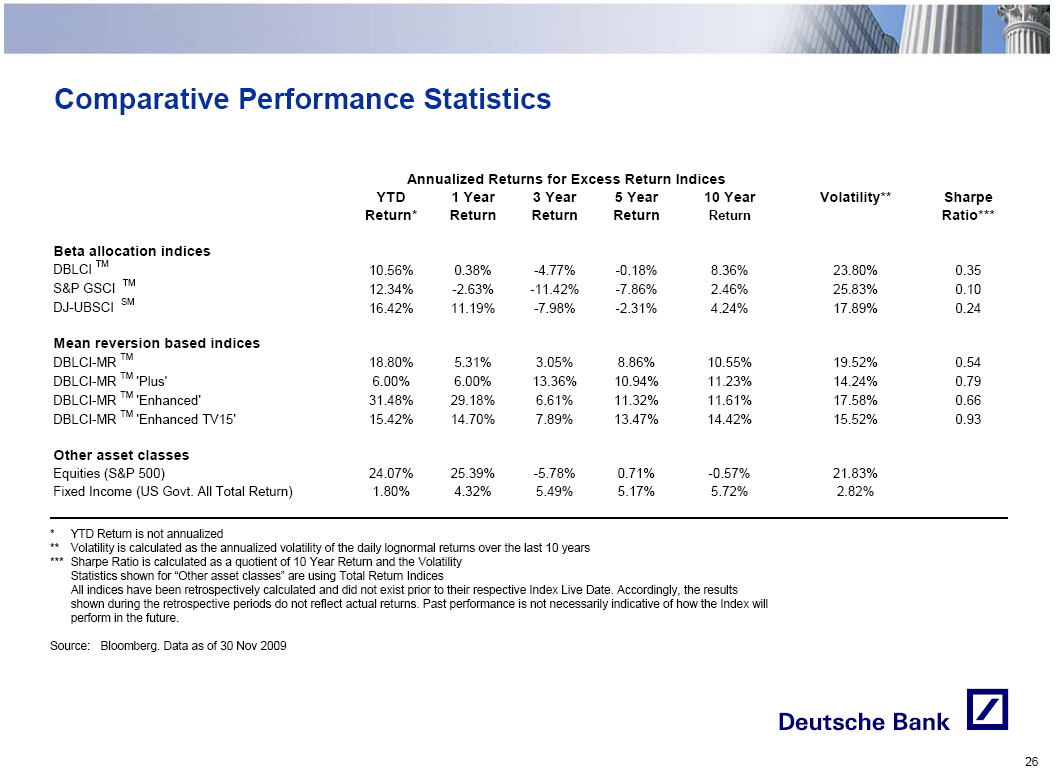 |
Comparative Performance Statistics

                                              Annualized Returns for Excess Return Indices
                                                YTD        1 Year       3 Year        5 Year      10 Year  Volatility**     Sharpe
                                              Return*      Return       Return        Return       Return                  Ratio***
Beta allocation indices
DBLCI TM   TM                                  10.56%          0.38%     -4.77%        -0.18%   8.36%    23.80%     0.35
S&P GSCI                                       12.34%         -2.63%    -11.42%        -7.86%   2.46%    25.83%     0.10
           SM
DJ-UBSCI                                       16.42%         11.19%     -7.98%        -2.31%   4.24%    17.89%     0.24

Mean reversion based indices
DBLCI-MR TM                                    18.80%          5.31%     3.05%          8.86%   10.55%   19.52%     0.54
DBLCI-MR TM 'Plus'                             6.00%           6.00%     13.36%        10.94%   11.23%   14.24%     0.79
DBLCI-MR TM 'Enhanced'                         31.48%         29.18%     6.61%         11.32%   11.61%   17.58%     0.66
DBLCI-MR TM 'Enhanced TV15'                    15.42%         14.70%     7.89%         13.47%   14.42%   15.52%     0.93
Other asset classes
Equities (S&P 500)                             24.07%         25.39%     -5.78%         0.71%   -0.57%   21.83%
Fixed Income (US Govt. All Total Return)       1.80%           4.32%     5.49%          5.17%   5.72%     2.82%

*    YTD Return is not annualized

**   Volatility is calculated as the annualized volatility of the daily
     lognormal returns over the last 10 years

***  Sharpe Ratio is calculated as a quotient of 10 Year Return and the
     Volatility Statistics shown for "Other asset classes" are using Total
     Return Indices

     All indices have been retrospectively calculated and did not exist prior to
     their respective Index Live Date. Accordingly, the results shown during the
     retrospective periods do not reflect actual returns. Past performance is
     not necessarily indicative of how the Index will perform in the future.

 Source:   Bloomberg. Data as of 30 Nov 2009

                                                                              26
|
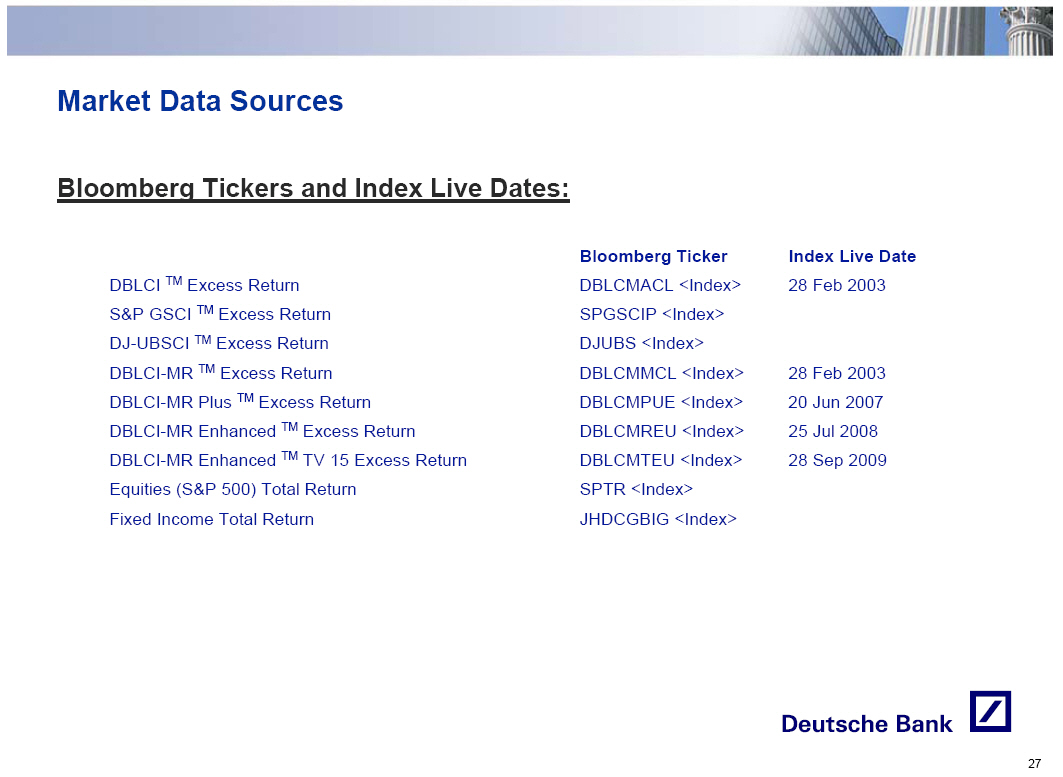 |
[GRAPHIC OMITTED]

Market Data Sources
Bloomberg Tickers and Index Live Dates:
                                           Bloomberg Ticker    Index Live Date
DBLCI TM Excess Return                     DBLCMACL (Index)    28 Feb 2003
S&P GSCI TM Excess Return                  SPGSCIP (Index)
DJ-UBSCI TM Excess Return                  DJUBS (Index)
DBLCI-MR TM Excess Return                  DBLCMMCL (Index)    28 Feb 2003
DBLCI-MR Plus TM Excess Return             DBLCMPUE (Index)    20 Jun 2007
DBLCI-MR Enhanced TM Excess Return         DBLCMREU (Index)    25 Jul 2008
DBLCI-MR Enhanced TM TV 15 Excess Return   DBLCMTEU (Index)    28 Sep 2009
Equities (S&P 500) Total Return            SPTR (Index)
Fixed Income Total Return                  JHDCGBIG (Index)

                                                                              27
|
 |
Important Considerations

The information contained in this presentation does not provide personal
investment advice. You should consult with independent accounting, tax, legal
and regulatory counsel regarding such matters as they may apply to your
particular circumstances.

Strategy Risk

The Mean Reversion strategy described herein aims to underweight relatively
expensive commodities and overweight relatively inexpensive commodities based on
historical commodity prices. However, indices employing the Mean Reversion
strategy may not be successful in achieving this desired objective.

The Optimal Roll Yield strategy described herein aims to maximize the potential
roll benefits in backwardated markets and minimize potential roll losses in
contango markets by purchasing the relevant new futures contracts that would
generate the maximum implied roll yield. However, indices employing the Optimal
Roll Yield strategy may not be successful in achieving this desired objective.

The Target Volatility strategy described herein aims to achieve a specified
realized volatility in the base index by adjusting the level of participation
based on the historical realized volatility of the base index. However, indices
employing the Target

Volatility strategy may not be successful in achieving this desired objective.

Commodities are speculative and highly volatile, and the risk of loss from
investing in financial instruments linked to commodities or commodity indices
can be substantial.

Past Performance

An index's performance is unpredictable, and past performance is not indicative
of future performance. We give no representation or warranty as to the future
performance of any index or investment.

Some of the indices described herein have very limited performance history.

                                                                              28
|
 |
Important Considerations (Cont'd)

Backtesting

Backtested, hypothetical or simulated performance results discussed herein have
inherent limitations. Unlike an actual historical performances, simulated
results are achieved by means of the retroactive application of a backtested
model itself designed with the benefit of hindsight. Taking into account
historical events, the backtesting of performance also differs from actual
account performance because an actual investment strategy may be adjusted any
time, for any reason, including a response to material, economic or market
factors. The backtested performance includes hypothetical results that do not
reflect the deduction of advisory fees, brokerage or other commissions, and any
other expenses that a client would have paid or actually paid. Past
hypothetical backtest results are neither an indicator nor guarantee of future
returns. Actual results will vary, perhaps materially, from the analysis
contained herein.

Free Writing Prospectus

Deutsche Bank AG has filed a registration statement (including a prospectus)
with the Securities and Exchange Commission, or SEC, for the offering to which
this communication relates. Before you invest, you should read the prospectus in
that registration statement and other documents that Deutsche Bank AG has filed
with the SEC for more complete information about Deutsche Bank AG and only such
offering. You may obtain these documents without cost by visiting EDGAR on the
SEC website at www.sec.gov. Alternatively, Deutsche Bank AG, any agent or any
dealer participating in the offering will arrange to send you the prospectus if
you so request by calling toll-free 1-800-311-4409.


                                                                              29
|