 |
Issuer Free Writing Prospectus
Filed pursuant to Rule 433
Registration Statement No. 333-162195
Dated: January 7, 2010

          X - Alpha
          Alpha from investment style in a market-independent, non-
          directional and low-volatility framework

          December 31, 2009


Deutsche Bank's X-Alpha USD Excess Return & Total Return Indices have
existed since October 3, 2006. Accordingly, the Index performance from
October 22, 1996 to September 29, 2006 shown in this presentation does
not reflect the performance of the actual Indices or any investable
product, but has been back-calculated on a retrospective basis. The
Indices did not exist during the period of retrospective calculation,
and past performance is not necessarily indicative of how the Indices
will perform in the future. On July 17, 2007, DB made a technical
change to the X-Alpha Index calculation methodology. X-Alpha Index
levels prior to July 17, 2007 were not restated. Further information
is available in the X-Alpha Index Description.
|
 |
DB X-Alpha Indices
Portable alpha with a competitive advantage

O   X-Alpha seeks to offer uncorrelated absolute return by extracting excess
    return from existing DB Regional Style Indices versus their market
    Benchmarks
O   An attractive alternative to hedge funds
    -   Low fees
    -   Daily liquidity
    -   Transparency
    -   No performance fees
O   An attractive alternative to excess cash
O   X-Alpha serves a variety of investment strategies

                                     page 2
|
 |
DB Regional Style Indices
Live since October 2002

O   DB launched 6 regional style indices in 2002
    -   US Value, US Growth, Euro Value, Euro Growth, Japan Value, UK Value
    -   US and Euro style funds were launched in Europe
    -   Morningstar Fund Ratings for the Euro and US DB Style Funds averaged 4
        stars in 2005 and 5 stars in 2006 and 2007
O   Indices to provide relative outperformance versus equity market benchmarks
    -   Excess returns (positive and negative) were not highly correlated across
        regions and styles
O   Because of uncorrelated excess returns, it made sense to combine indices to
    diversify risk and try to stabilise returns
O   As there was no UK or Japan Growth Index launched in 2002, these were
    created in order to offer consistent diversification across styles/regions
O   By extracting the relative performance between the DB Style Index and the
    Benchmark in each market (an Index Pair), uncorrelated alpha can be created

                                     page 3
|
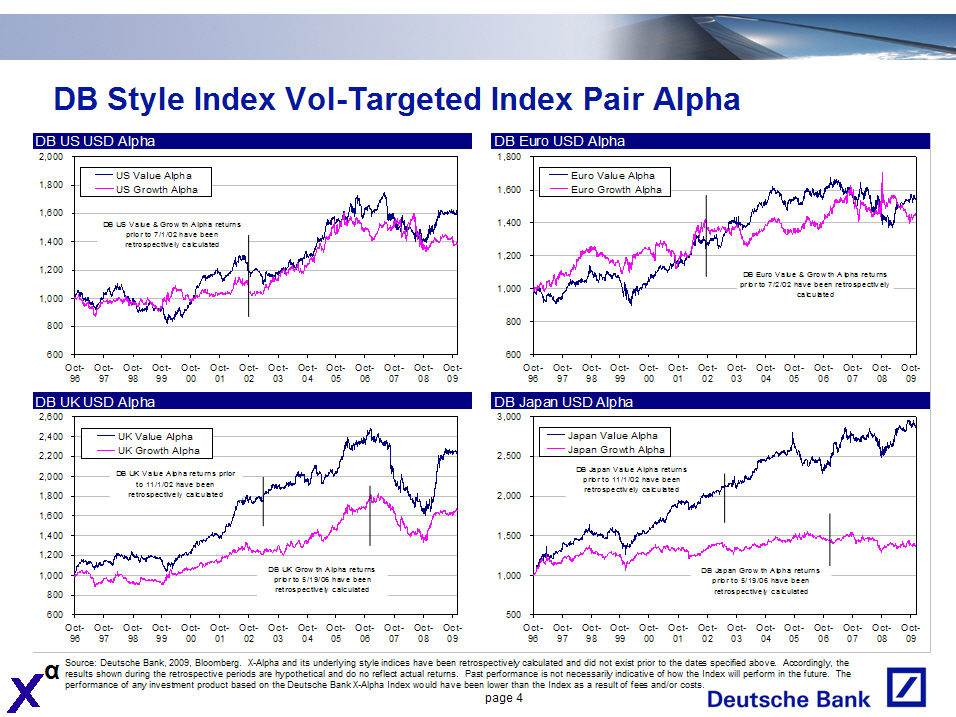 |
DB Style Index Vol-Targeted Index Pair Alpha
DB US USD Alpha
2,000
1,800         US Value Alpha
               US Growth Alpha
1,600
            DB US Value & Grow th Alpha
                      returns
                prior to 7/1/02 have
1,400              been
                  retrospectively
                     calculated
1,200
1,000
  800
  600
      Oct-Oct- Oct- Oct- Oct- Oct- Oct- Oct- Oct- Oct- Oct- Oct-  Oct-      Oct-
        96   97     98  99    00   01   02    03   04   05    06   07   08   09

       DB UK USD Alpha
DB Euro USD Alpha
1,800
         Euro Value Alpha
1,600    Euro Growth Alpha
1,400
1,200
                                      DB Euro Value & Grow th Alpha
                                                 returns
                                        prior to 7/2/02 have been
1,000                                        retrospectively
                                                calculated
  800
  600
      Oct-Oct- Oct- Oct- Oct- Oct- Oct- Oct- Oct- Oct- Oct- Oct-  Oct-      Oct-
        96  97     98   99    00   01   02    03   04   05    06   07   08   09

DB Japan USD Alpha
2,600
2,400UK Value Alpha
2,200UK Growth Alpha
3,000
2,500
Japan Value Alpha
Japan Growth Alpha
           B UK Value Alpha returns
2,000D         prior
             to 11/1/02 have been
1,800     retrospectively calculated
2,000
DB Japan Value Alpha returns prior to 11/1/02 have been retrospectively calculated
1,600
1,400
1,200
                                    DB UK Grow th Alpha
1,000                               returns
                                    prior to 5/19/06 have
                                    been
                                    retrospectively
  800                               calculated
  600
   Oct-Oct- Oct- Oct- Oct- Oct- Oct- Oct- Oct- Oct- Oct- Oct-  Oct- Oct-
   96   97   98    99   00   01   0203       04    05   06   07   08   09

1,500
                                 DB Japan Grow th Alpha
1,000                                    returns
                                rior to 5/19/06 have
                               p        been
                                  retrospectively
                                     calculated
00
      Oct-Oct- Oct- Oct- Oct- Oct- Oct- Oct- Oct- Oct- Oct- Oct-  Oct-      Oct-
        96   97   98    99   00   01   02    03   04    05   06   07   08   09

        Source:  Deutsche  Bank,  2009,  Bloomberg.   X-Alpha  and  its  underlying  style  indices  have  been
retrospectively  calculated  and did not exist  prior to the dates  specified  above.  Accordingly,  the results
shown during the  retrospective  periods are hypothetical and do no reflect actual returns.  Past performance is
not  necessarily  indicative  of how the Index will perform in the future.  The  performance  of any  investment
product  based on the  Deutsche  Bank  X-Alpha  Index  would  have been lower than the Index as a result of fees
and/or costs.

                                     page 4
|
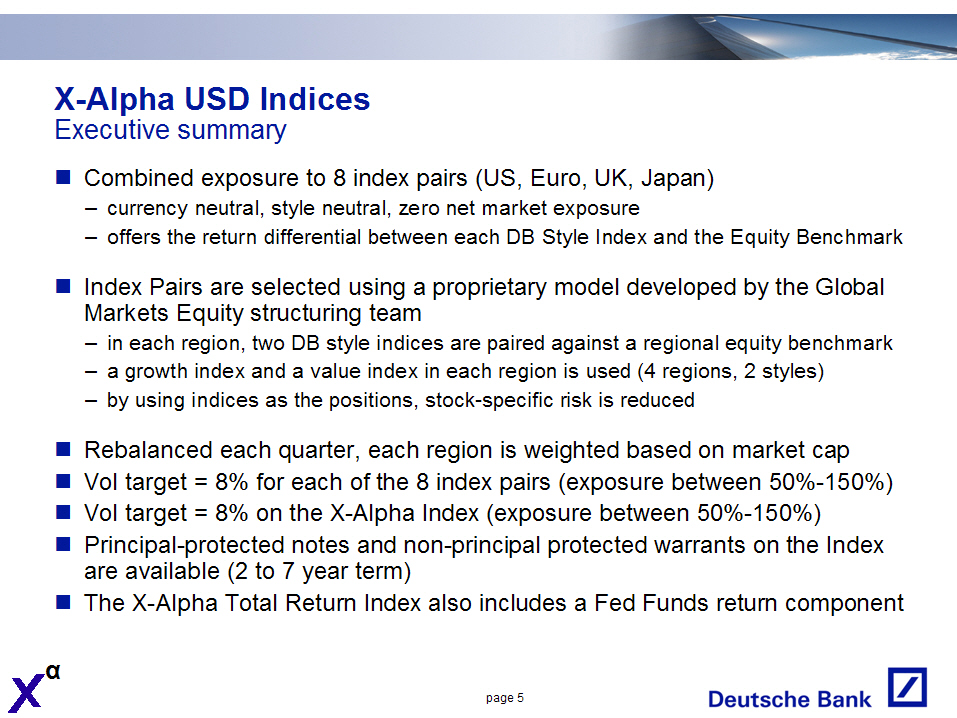 |
X-Alpha USD Indices
Executive summary

O   Combined exposure to 8 index pairs (US, Euro, UK, Japan)
    -   currency neutral, style neutral, zero net market exposure
    -   offers the return differential between each DB Style Index and the
        Equity Benchmark
O   Index Pairs are selected using a proprietary model developed by the Global
    Markets Equity structuring team
    -   in each region, two DB style indices are paired against a regional
        equity benchmark
    -   a growth index and a value index in each region is used (4 regions, 2
        styles)
    -   by using indices as the positions, stock-specific risk is reduced
O   Rebalanced each quarter, each region is weighted based on market cap
O   Vol target = 8% for each of the 8 index pairs (exposure between 50%-150%)
O   Vol target = 8% on the X-Alpha Index (exposure between 50%-150%)
O   Principal-protected notes and non-principal protected warrants on the Index
    are available (2 to 7 year term)
O   The X-Alpha Total Return Index also includes a Fed Funds return component

                                     page 5
|
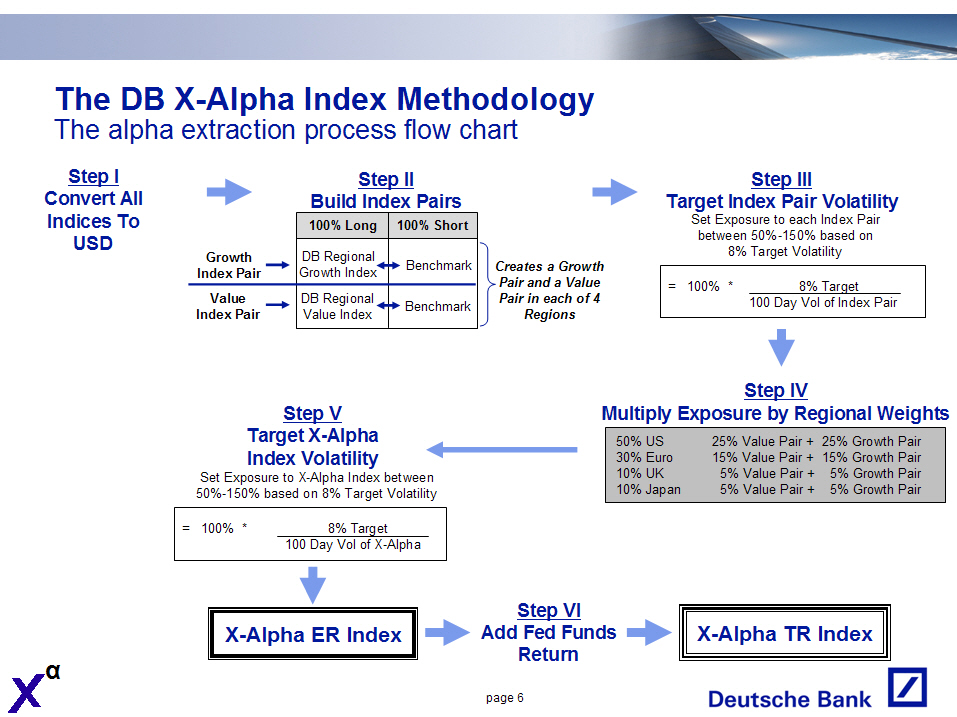 |
The DB X-Alpha Index Methodology
The alpha extraction process flow chart

           Step I                                                          Step III
        Convert All                 Step II                       Target Index Pair Volatility
         Indices To             Build Index Pairs                Set Exposure to each Index Pair
            USD          ----------------------------------        between 50%-150% based on
                            100% Long       100% Short                8% Target Volatility
                      ----------------------------------
     Growth             DB Regional     Benchmark                Creates a Growth
     Index Pair         Growth Index                             Pair and a Value
                        DB Regional     Benchmark                Pair in each of 4
     Value              Value Index                                             Regions
   Index Pair
                                                                            -------------------------------
                                                                              =   100%  *      8% Target
                                                                                    --------------------------
                                                                                     100 Day Vol of Index Pair

                                                                              Step IV
                                                                           -------------
                           Step V                                  Multiply Exposure by Regional Weights
                                                       ---------------------------------------------------------------
               Target X-Alpha                          50% US         25% Value Pair +  25% Growth Pair
              Index Volatility                         30% Euro       15% Value Pair +  15% Growth Pair
     Set Exposure to X-Alpha Index between             10% UK         5% Value Pair  +  5% Growth Pair
     50%-150% based on 8% Target Volatility            10% Japan      5% Value Pair  +  5% Growth Pair
                                                       ---------------------------------------------------------------
 -------------------------------
   =   100%  *      8% Target
         --------------------------
          100 Day Vol of Index Pair

                                     page 6
|
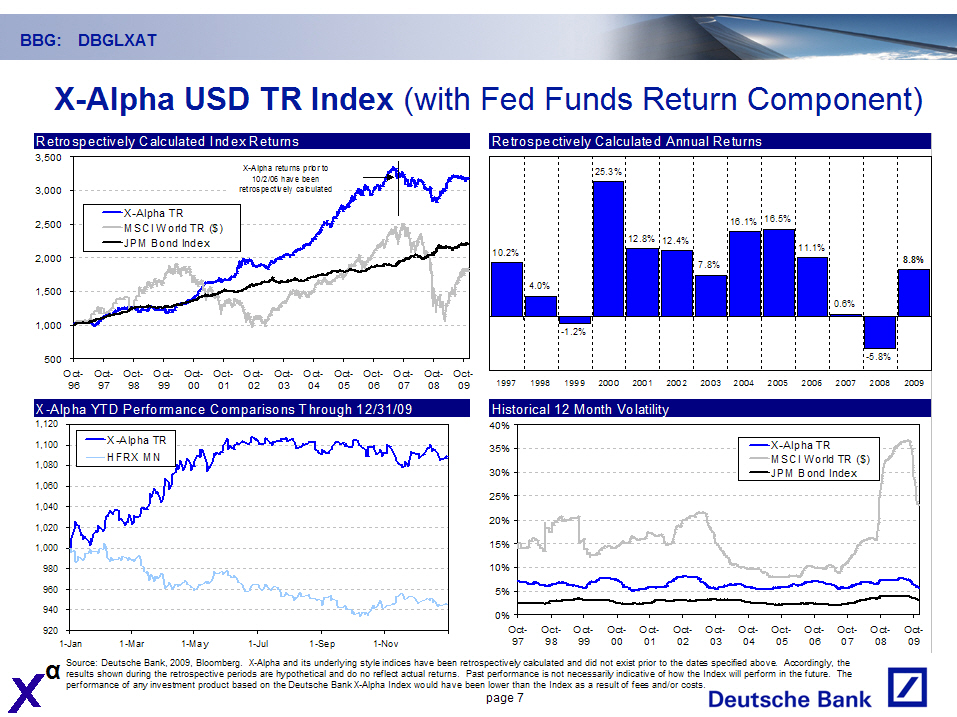 |
BBG:    DBGLXAT

X-Alpha USD TR Index (with Fed Funds Return Component)

Retrospectively Calculated Index Returns

3,500          X-Alpha returns prior to
                  10/2/06 have been
3,000         retrospectively calculated
2,500          X-Alpha TR
                    MSCI World TR ($)
               JPM Bond Index
2,000
1,500
1,000
  500
      Oct-Oct- Oct- Oct- Oct- Oct- Oct- Oct- Oct- Oct- Oct- Oct-  Oct-  Oct-
      96   97   98  99   00    01   02    03   04    05   06   07  08  09

X-Alpha YTD Performance Comparisons Through 12/31/09
1,120
1,100            X-Alpha TR

 Retrospectively Calculated Annual Returns

                    25.3%
                                             16.1%  16.5%
                         12.8%  12.4%
                                                        11.1%
10.2%                                                                 8.8%
                                     7.8%
       4.0%
                                                           0.6%
           -1.2%
                                                               -5.8%
1997  1998  1999  2000  2001  2002   2003  2004  2005 2006 2007 2008 2009

                    Historical 12 Month Volatility

                            X-Alpha TR
1,080
1,060
1,040
1,020
1,000
  980
  960
  940
  920

Oct-  Oct-   Oct-   Oct-  Oct-  Oct-  Oct-  Oct-  Oct-  Oct-  Oct- Oct-
   97   98     99    00    01    02    03    04    05    06    07    08  09

HFRX MN

                MSCI World TR ($)
40%             JPM Bond Index
35%
30%
25%
20%
15%
10%
  5%
  0%
Oct-  Oct-   Oct-   Oct-  Oct-  Oct-  Oct-  Oct-  Oct-  Oct-  Oct- Oct-
1-Jan      1-Mar      1-May        1-Jul      1-Sep       1-Nov

Source: Deutsche Bank, 2009, Bloomberg. X-Alpha and its underlying style indices
have been retrospectively calculated and did not exist prior to the dates
specified above. Accordingly, the results shown during the retrospective periods
are hypothetical and do no reflect actual returns. Past performance is not
necessarily indicative of how the Index will perform in the future. The
performance of any investment product based on the Deutsche Bank X-Alpha Index
would have been lower than the Index as a result of fees and/or costs.

                                     page 7
|
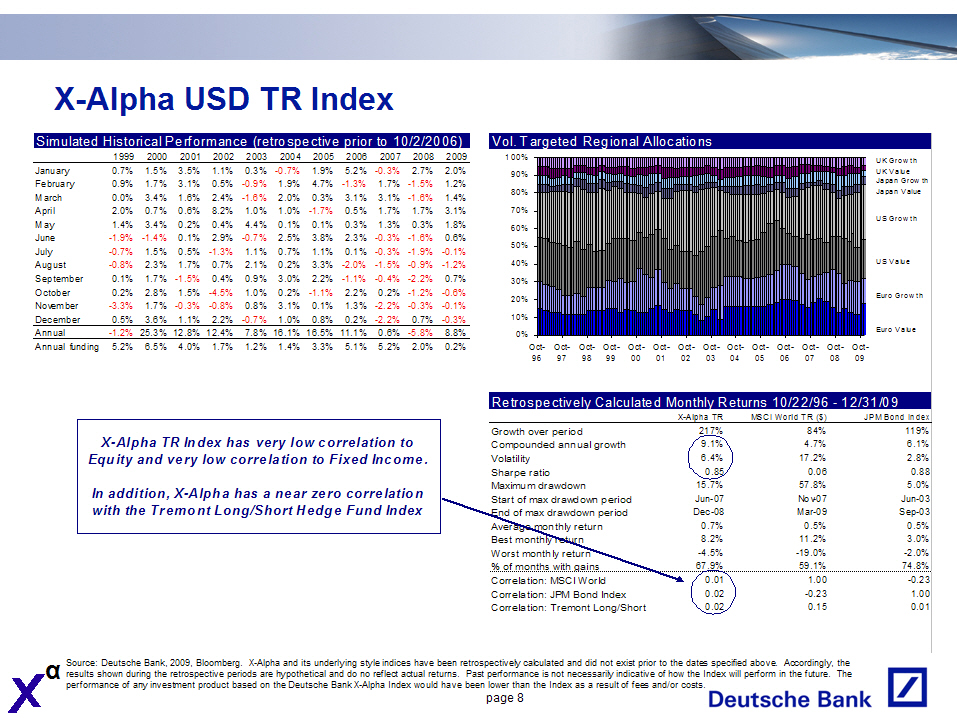 |
X-Alpha USD TR Index

Simulated Historical Performance (retrospective prior to 10/2/2006)

                1999  2000  2001  2002  2003  2004  2005  2006   2007  2008 2009
- ---------------------------------------------------------------------------------
January         0.7%  1.5%  3.5%  1.1%  0.3% -0.7%  1.9%  5.2%  -0.3%  2.7% 2.0%
February        0.9%  1.7%  3.1%  0.5% -0.9%  1.9%  4.7%  -1.3%  1.7% -1.5% 1.2%
March           0.0%  3.4%  1.6%  2.4% -1.6%  2.0%  0.3%  3.1%   3.1% -1.6% 1.4%
April           2.0%  0.7%  0.6%  8.2%  1.0%  1.0% -1.7%  0.5%   1.7%  1.7% 3.1%
May             1.4%  3.4%  0.2%  0.4%  4.4%  0.1%  0.1%  0.3%   1.3%  0.3% 1.8%
June           -1.9%  -1.4% 0.1%  2.9% -0.7%  2.5%  3.8%  2.3%  -0.3% -1.6% 0.6%
July           -0.7%  1.5%  0.5% -1.3%  1.1%  0.7%  1.1%  0.1%  -0.3% -1.9%-0.1%
August         -0.8%  2.3%  1.7%  0.7%  2.1%  0.2%  3.3% -2.0%  -1.5% -0.9%-1.2%
September       0.1%  1.7% -1.5%  0.4%  0.9%  3.0%  2.2% -1.1%  -0.4% -2.2% 0.7%
October         0.2%  2.8%  1.5% -4.5%  1.0%  0.2% -1.1%  2.2%   0.2% -1.2%-0.6%
November       -3.3%  1.7% -0.3% -0.8%  0.8%  3.1%  0.1%  1.3%  -2.2% -0.3%-0.1%
December        0.5%  3.6%  1.1%  2.2% -0.7%  1.0%  0.8%  0.2%  -2.2%  0.7%-0.3%
- ---------------------------------------------------------------------------------
Annual         -1.2% 25.3% 12.8% 12.4%  7.8% 16.1% 16.5% 11.1%   0.6% -5.8% 8.8%
- ---------------------------------------------------------------------------------
Annual funding  5.2%  6.5%  4.0%  1.7%  1.2%  1.4%  3.3%  5.1%   5.2%  2.0% 0.2%

Vol. Targeted Regional Allocations

   100%                       UK Growth
    90%                       UK Value
    80%                       Japan Growth
    70%                       Japan Value
    60%
    50%                       US Growth
    40%
    30%                       US Value
    20%
    10%                       Euro Growth
     0%
                              Euro Value
Oct-  Oct-   Oct-   Oct-  Oct-  Oct-  Oct-  Oct-  Oct-  Oct-  Oct- Oct-  Oct- Oct-
96    97     98     99    00     01    02    03    04    05    06   07   08  09

X-Alpha TR Index has very low correlation to Equity and very low correlation to
Fixed Income.

In addition, X-Alpha has a near zero correlation with the Trem ont Long/Short
Hedge Fund Index

 Retrospectively Calculated Monthly Returns 10/22/96 - 12/31/09
                                    X-Alpha TR   MSCI World TR ($) JPM Bond Index
- ----------------------------------------------------------------------------------
Growth  over period                       217%                 84%           119%
Compounded annual growth                  9.1%                4.7%           6.1%
Volatility                                6.4%               17.2%           2.8%
Sharpe ratio                              0.85                0.06           0.88
Maximum drawdown                         15.7%               57.8%           5.0%
Start of max drawdown period            Jun-07              Nov-07         Jun-03
End  of max drawdown  period            Dec-08              Mar-09         Sep-03
Average monthly return                    0.7%                0.5%           0.5%
Best monthly return                       8.2%               11.2%           3.0%
Worst monthly return                     -4.5%              -19.0%          -2.0%
% of months with  gains                  67.9%               59.1%          74.8%
- ----------------------------------------------------------------------------------
Correlation: MSCI World                   0.01                1.00          -0.23
Correlation: JPM Bond  Index              0.02               -0.23           1.00
Correlation: Tremont Long/Short           0.02                0.15           0.01

Source: Deutsche Bank, 2009, Bloomberg. X-Alpha and its underlying style indices
have been retrospectively calculated and did not exist prior to the dates
specified above. Accordingly, the results shown during the retrospective periods
are hypothetical and do no reflect actual returns. Past performance is not
necessarily indicative of how the Index will perform in the future. The
performance of any investment product based on the Deutsche Bank X-Alpha Index
would have been lower than the Index as a result of fees and/or costs.

                                     page 8
|
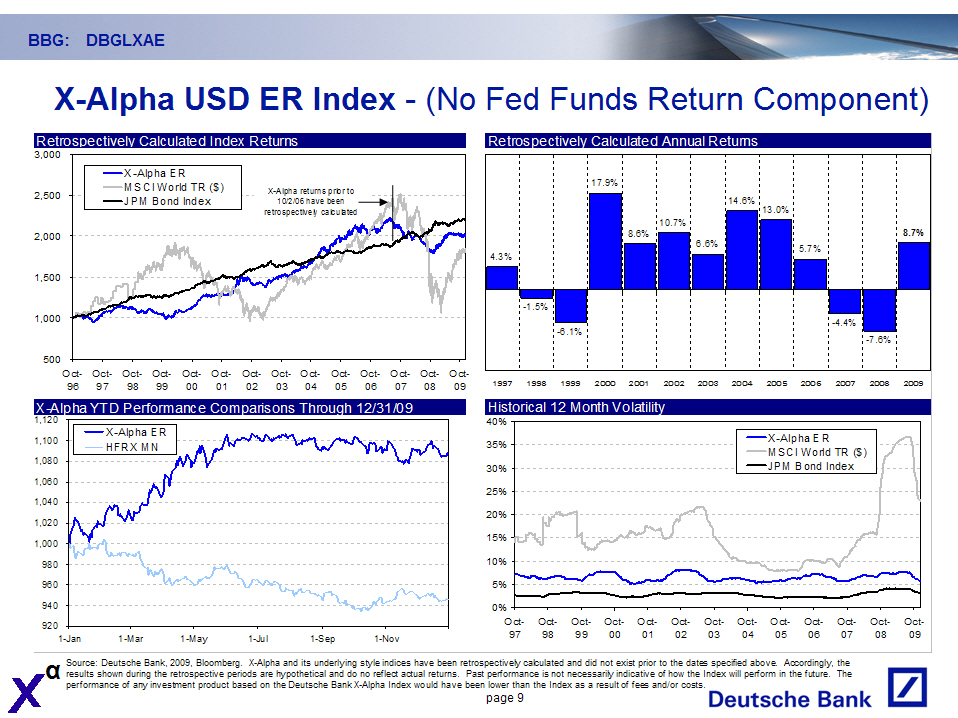 |
BBG:    DBGLXAE


     X-Alpha USD ER Index - (No Fed Funds Return Component)

  Retrospectively Calculated Index Returns
3,000
              X-Alpha ER
               SCI World TR ($)             -Alpha returns
2,500         M                            X   prior to
              JPM Bond Index
                                             10/2/06 have
                                                 been
                                        retrospectively
                                           calculated

2,000
1,500
1,000
500

Oct-  Oct- Oct-  Oct-  Oct-  Oct-  Oct-  Oct-  Oct-  Oct- Oct-  Oct- Oct-
  96  97    98   99    00    01    02     03   04     05   06    07   08

   Retrospectively Calculated Annual Returns

                     17.9%
                                           14.6%
                                                 13.0%
                                 10.7%
                            8.6%                                       8.7%
                                     6.6%
    4.3%                                              5.7%

         -1.5%
              -6.1%                                        -4.4%
                                                                -7.6%
    1997  1998  1999  2000 2001 2002 2003  2004  2005 2006  2007 2008  2009


  X-Alpha YTD Performance Comparisons Through 12/31/09
  1,120           X-Alpha ER
  1,100

                HFRX MN

  1,080
  1,060
  1,040
  1,020
  1,000
  980
  960
  940
  920
  1-Jan          1-Mar      1-May      1-Jul            1-Sep1-Nov


     Historical 12 Month Volatility

  40%
                                                X-Alpha ER
  35%
                                                MSCI World TR ($)
  30%                                           JPM Bond Index
  25%
  20%
  15%
  10%
   5%
   0%
 Oct-  Oct-  Oct- Oct-   Oct-  Oct-   Oct- Oct- Oct-     Oct-Oct-  Oct-  Oct-
   97    98    99    00    01    02     03    04    05     06 07    08      09

Source: Deutsche Bank, 2009, Bloomberg. X-Alpha and its underlying style indices
have been retrospectively calculated and did not exist prior to the dates
specified above. Accordingly, the results shown during the retrospective periods
are hypothetical and do no reflect actual returns. Past performance is not
necessarily indicative of how the Index will perform in the future. The
performance of any investment product based on the Deutsche Bank X-Alpha Index
would have been lower than the Index as a result of fees and/or costs.

                                     page 9
|
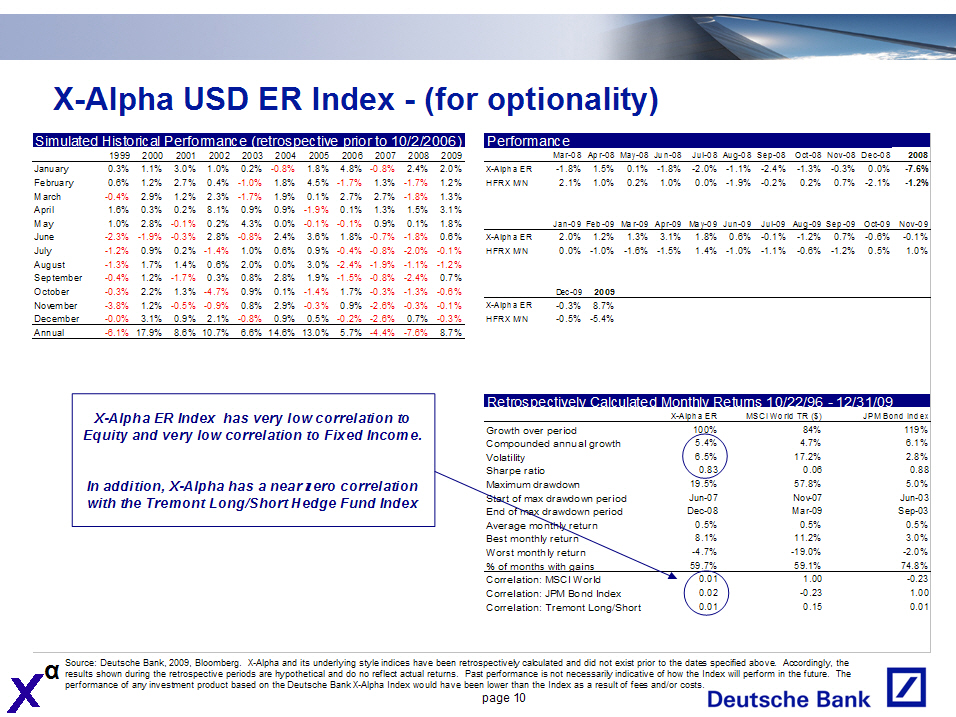 |
X-Alpha USD ER Index - (for optionality)

 Simulated Historical Performance (retrospective prior to 10/2/2006)

               1999  2000  2001   2002 2003   2004  2005  2006  2007  2008  2009
- ---------------------------------------------------------------------------------
January        0.3%  1.1%  3.0%   1.0% 0.2%  -0.8%  1.8%  4.8% -0.8%  2.4%  2.0%
February       0.6%  1.2%  2.7%   0.4%-1.0%   1.8%  4.5%  -1.7% 1.3% -1.7%  1.2%
March         -0.4%  2.9%  1.2%   2.3%-1.7%   1.9%  0.1%  2.7%  2.7% -1.8%  1.3%
April          1.6%  0.3%  0.2%   8.1% 0.9%   0.9% -1.9%  0.1%  1.3%  1.5%  3.1%
May            1.0%  2.8% -0.1%   0.2% 4.3%   0.0% -0.1% -0.1%  0.9%  0.1%  1.8%
June          -2.3% -1.9% -0.3%   2.8%-0.8%   2.4%  3.6%  1.8% -0.7% -1.8%  0.6%
July          -1.2%  0.9%  0.2%  -1.4% 1.0%   0.6%  0.9% -0.4% -0.8% -2.0% -0.1%
August        -1.3%  1.7%  1.4%   0.6% 2.0%   0.0%  3.0% -2.4% -1.9% -1.1% -1.2%
September     -0.4%  1.2% -1.7%   0.3% 0.8%   2.8%  1.9% -1.5% -0.8% -2.4%  0.7%
October       -0.3%  2.2%  1.3%  -4.7% 0.9%   0.1% -1.4%  1.7% -0.3% -1.3% -0.6%
November      -3.8%  1.2% -0.5%  -0.9% 0.8%   2.9% -0.3%  0.9% -2.6% -0.3% -0.1%
December      -0.0%  3.1%  0.9%   2.1%-0.8%   0.9%  0.5% -0.2% -2.6%  0.7% -0.3%
- ---------------------------------------------------------------------------------
Annual       -6.1%  17.9%  8.6%  10.7% 6.6%  14.6% 13.0%  5.7% -4.4% -7.6%  8.7%
- ---------------------------------------------------------------------------------

Performance

             Mar-08  Apr-08  May-08 Jun-08 Jul-08  Aug-08  Sep-08 Oct-08  Nov-08 Dec-08  2008
- ----------------------------------------------------------------------------------------------
X-Alpha ER    -1.8%   1.5%   0.1%  -1.8%   -2.0%  -1.1%   -2.4%    -1.3%  -0.3%  0.0%    -7.6%
HFRX M/N       2.1%   1.0%   0.2%   1.0%    0.0%  -1.9%   -0.2%     0.2%   0.7% -2.1%    -1.2%


                Jan-09  Feb-09  Mar-09 Apr-09 May-09 Jun-09 Jul-09 Aug-09 Sep-09 Oct-09 Nov-09
- ----------------------------------------------------------------------------------------------
X-Alpha ER      2.0%    1.2%    1.3%   3.1%    1.8%  0.6%   -0.1%   -1.2%  0.7%   -0.6% -0.1%
                          -1.0%
HFRX M/N       0.0%       -1.6%  -1.5%  1.4% -1.0%  -1.1% -0.6%  -1.2%  0.5%  1.0%

              Dec-09   2009
- -----------------------------------------------------------------------------------
X-Alpha ER    -0.3%   8.7%
HFRX M/N      -0.5%  -5.4%

X-Alpha ER Index has very low correlation to Equity and very low correlation to
Fixed Income.

In addition, X-Alpha has a near zero correlation with the Tremont Long/Short
Hedge Fund Index

Retrospectively Calculated Monthly Returns 10/22/96 - 12/31/09

                                    X-Alpha ER   MSCI World TR ($)  JPM Bond Index
- -----------------------------------------------------------------------------------
Growth over period                        100%                 84%            119%
Compounded annual growth                  5.4%                4.7%            6.1%
Volatility                                6.5%               17.2%            2.8%
Sharpe ratio                              0.83                0.06            0.88
Maximum drawdown                         19.5%               57.8%            5.0%
Start of max drawdown period            Jun-07              Nov-07          Jun-03
End of max drawdown period              Dec-08              Mar-09          Sep-03
Average monthly return                    0.5%                0.5%            0.5%
Best monthly return                       8.1%               11.2%            3.0%
Worst monthly return                     -4.7%              -19.0%           -2.0%
% of months with gains                   59.7%               59.1%           74.8%
- -----------------------------------------------------------------------------------
Correlation: MSCI World                   0.01                1.00           -0.23
Correlation: JPM Bond Index               0.02               -0.23            1.00
Correlation: Tremont Long/Short           0.01                0.15            0.01

Source: Deutsche Bank, 2009, Bloomberg. X-Alpha and its underlying style indices
have been retrospectively calculated and did not exist prior to the dates
specified above. Accordingly, the results shown during the retrospective periods
are hypothetical and do no reflect actual returns. Past performance is not
necessarily indicative of how the Index will perform in the future. The
performance of any investment product based on the Deutsche Bank X-Alpha Index
would have been lower than the Index as a result of fees and/or costs.

                                    page 10
|
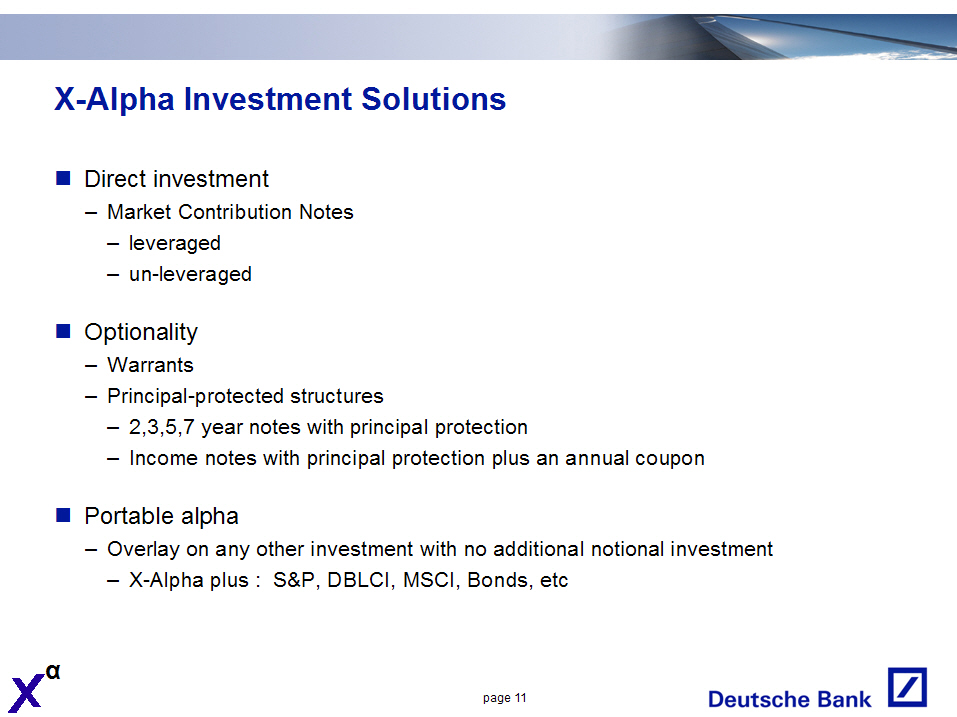 |
X-Alpha Investment Solutions

o   Direct investment
    -   Market Contribution Notes - leveraged
    -   un-leveraged
o   Optionality
    -   Warrants
    -   Principal-protected structures
    -   2,3,5,7 year notes with principal protection
    -   Income notes with principal protection plus an annual coupon
o   Portable alpha
    -   Overlay on any other investment with no additional notional investment
        -   X-Alpha plus : S & P, DBLCI, MSCI, Bonds, etc

                                    page 11
|
 | X - Alpha DB Style Indices Methodology and Historical Performance |
 |
Style Investing
Value vs. Growth

O   Value Shares
    -   Mature, established companies with lower earnings volatility
    -   Sell at lower multiples
    -   Expected to offer a steady stream of cash flows to shareholders
        (dividends)
O   Growth Shares
    -   Relatively young companies with higher earnings volatility
    -   Sell at higher multiples
    -   Offer little or no stream of cash flows to shareholders (dividends)
    -   Expected to offer above average earnings growth
    -   Companies with higher earnings growth are not always limited to typical
        "growth" sectors (Technology, Pharmaceuticals)
O   Growth and Value are not necessarily mutually exclusive
    -   Each style has consistent periods of outperformance versus the market
        but at varying amounts and difficult to predict when one style will
        dominate
    -   Some stocks may be growth AND value (low PE and high EPS growth)

                                    page 13
|
 |
DB Regional Value Indices
Selection strategy

O   Deutsche Bank Value Index Methodology for UK, Japan, US
    -   Stocks selected from the large cap benchmark (FTSE 100, EURO STOXX(R)
        Large, TOPIX 100 or S & P 500 top 251 by market cap)
    -   Selected according to lowest trailing twelve-month reported P/E ratios
    -   The price-earnings ratios (P/E) have historically identified undervalued
        companies that provided superior performance
O   Deutsche Bank Value Index Methodology for Eurozone
    -   20 stocks selected from the Dow Jones EURO STOXX(R) Large Index
    -   Stocks selected according to highest current dividend yield (no more
        than five companies from one country)
    -   In the Eurozone, determining value has been more dependant on dividend
        yield
    -   Yield is believed to be an assessment of shareholder value in three
        different ways
        -   Confidence of management to provide future performance
        -   Commitment of management to provide earnings stability
        -   Providing an additional component of return to shareholders

                                    page 14
|
 |
DB Regional Growth Indices
Selection strategy

O   Deutsche Bank Growth Index Methodology
    -   Stocks selected from the large cap benchmark (FTSE 100, EURO STOXX(R)
        Large, TOPIX 100 or S & P 500 top 251 by market cap)
    -   The index consists of stocks that show the highest growth in reported
        earnings over the past twelve months
    -   Typically, growth stocks are thought to be from technology or
        pharmaceutical industries
    -   However, the market rewards those companies that demonstrate above
        average earnings growth, irrespective of which industry group they may
        belong to
    -   This reflects the possibility that investors may focus more on
        demonstrated earnings growth rather than promised earnings growth
O   A maximum of five companies per Eurozone country is permitted, no limits for
    US, UK and Japan Growth Indices

                                    page 15
|
 |
DB Regional Style Indices
Methodology summary


- -------------------------------------------------------------------------------------------------------------------------
                                                     Number of
Deutsche Bank Index          Selection Pool           Stocks             Selection Criteria             Benchmark
- -------------------------------------------------------------------------------------------------------------------------
US Value Index             Top 251 of S & P 500           30             Low Trailing 12 mos. PE           S & P 500
- -------------------------------------------------------------------------------------------------------------------------
US Growth Index            Top 251 of S & P 500           30         High Trailing 12 mo EPS Growth        S & P 500
- -------------------------------------------------------------------------------------------------------------------------
Euro Value Index        Dow Jones EuroSTOXX Large       20       High Trailing 12 mo Dividend Yield    EuroSTOXX 50
- -------------------------------------------------------------------------------------------------------------------------
Euro Growth Index       Dow Jones EuroSTOXX Large       20         High Trailing 12 mo EPS Growth      EuroSTOXX 50
- -------------------------------------------------------------------------------------------------------------------------
UK Value Index                  FTSE 100                20             Low Trailing 12 mos. PE           FTSE 100
- -------------------------------------------------------------------------------------------------------------------------
UK Growth Index                 FTSE 100                20         High Trailing 12 mo EPS Growth        FTSE 100
- -------------------------------------------------------------------------------------------------------------------------
Japan Value Index               TOPIX 100               20             Low Trailing 12 mos. PE          TOPIX 100
- -------------------------------------------------------------------------------------------------------------------------
Japan Growth Index              TOPIX 100               20         High Trailing 12 mo EPS Growth       TOPIX 100
- -------------------------------------------------------------------------------------------------------------------------
                                                                                              Source: Deutsche Bank, 2008

O   Common characteristics of DB Growth and Value Indices
    -   Companies with negative earnings over the past 12 months are excluded
    -   Indices are rebalanced quarterly
    -   Indices are equal-weighted
    -   All but two indices have been live since October, 2002 (UK & Japan
        Growth Indices are live since August, 2006)
    -   Rules-based investment strategy

                                    page 16
|
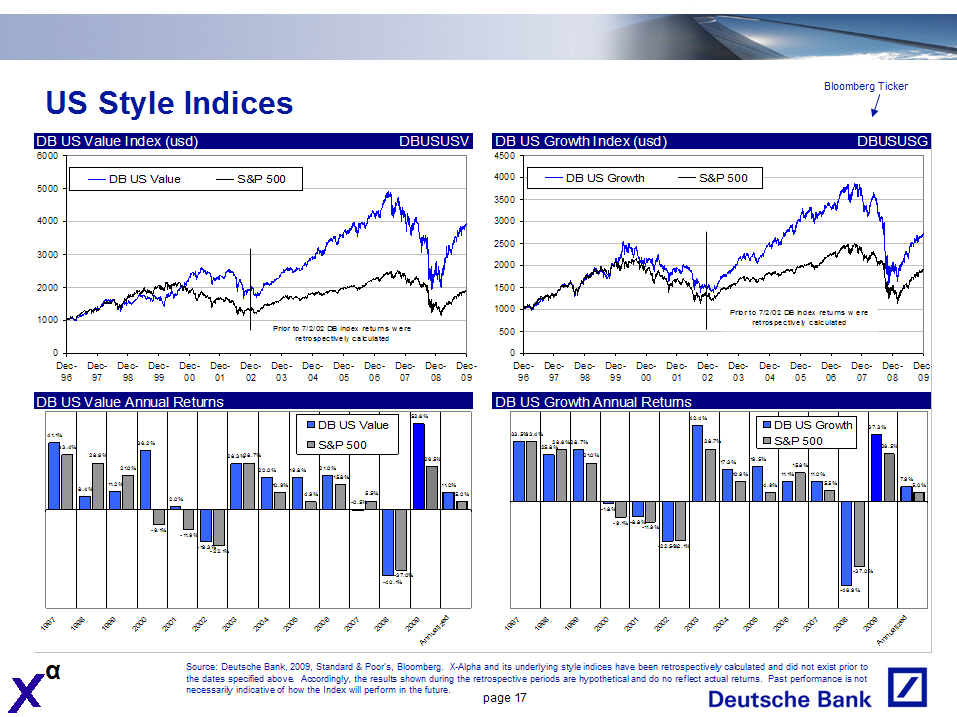 |
US Style Indices

Bloomberg Ticker

DB US Value Index (usd)                                                DBUSUSV
 6000
 5000     DB US Value                   S & P 500
 4000
 3000
 2000
 1000
                                      Prior to 7/2/02 DB Index returns were
                                               retrospectively
                                                  calculated
    0
   Dec- Dec- Dec-  Dec- Dec-  Dec- Dec-Dec- Dec- Dec- Dec- Dec-  Dec-
   96   97   98    99   00    01   02  03    04  05   06   07    08


   DB US Growth Index (usd)                                                  DBUSUSG
        4500
        4000            DB US Growth     S & P 500
        3500
        3000
        2500
        2000
        1500
                                                Prior to 7/2/02 DB Index
        1000                                          returns w ere
                                                  retrospectively
         500                                         calculated

Dec- Dec- Dec-  Dec- Dec-  Dec- Dec- Dec- Dec- Dec- Dec- Dec-  Dec-  Dec-  Dec-
 09  96   97     98   99   00    01   02   03   04   05   06    07    08    09


DB US Value Annual Returns
                                                       DB US Value     52.6%

     41.1%                                            S & P 500
  33.4%               36.2%

          28.6%                   28.3%28.7%                           26.5%
                21.0%                  20.0% 19.8%     21.0%
                                                       15.8%
          11.2%                          10.9%                                11.0%
           8.4%                                   4.9%        5.5%             5.0%
                            2.0%
                                                             -0.5%
                      -9.1%-11.9%
                               -19.3%
                                -22.1%
                                                                  -37.0%
                                                                -40.1%
 1997 1998 1999  2000  2001 2002 2003   2004  20052006  2007  2008  2009 Annualized

DB US Growth Annual Returns
                                       42.4%     DB US Growth
    33.5%33.4%                                                          37.3%
                                      28.7%           S & P 500
          28.6%28.7%                                                    26.5%
         25.8%
                 21.0%                            19.5%
                                            17.3%      15.8%
                                            10.9%  11.1%     11.0%
                                                                             7.9%
                                                  4.9%        5.5%           5.0%
                       -1.8%
                       -9.1%-8.8%
                            -11.9%
                            -22.5%-22.1%
                                                                   -37.0%
                                                                 -46.9%
     1997 199819992000  2001 2002 20032004   20052006    2007 2008 2009 Annualized

Source: Deutsche Bank, 2009, Standard & Poor's, Bloomberg. X-Alpha and its
underlying style indices have been retrospectively calculated and did not exist
prior to the dates specified above. Accordingly, the results shown during the
retrospective periods are hypothetical and do no reflect actual returns. Past
performance is not necessarily indicative of how the Index will perform in the
future.

                                    page 17
|
 |
Eurozone Style Indices

Bloomberg Ticker


DB Euro Value Index (euro)                                                 DBEEEUVA
  7000
  6000   DB Euro Value          Euro STOXX 50
  5000
             Prior to 7/1/02 DB Index
                       returns  w ere
               retrospectively
  4000         calculated
  3000
  2000
  1000
     0
Dec-  Dec-  Dec-  Dec-  Dec- Dec-  Dec-  Dec- Dec- Dec- Dec- Dec- Dec- Dec-
 96    97   98    99     00   01    02    03   04   05   06   07  08   09


         DB  Euro Growth Index (euro)                                    DBEEEUGR
 6000
 5000             DB Euro Growth     Euro STOXX 50
 4000
 3000
 2000
                                             Prior to 7/1/02 DB Index
 1000                                              returns w ere
                                                 retrospectively
                                                    calculated
    0
   Dec- Dec- Dec- Dec- Dec- Dec- Dec-  Dec- Dec-  Dec-  Dec- Dec- Dec-  Dec-
    96   97  98    99   00   01   02    03   04    05    06   07    08  09


Source: Deutsche Bank, 2009, Standard & Poor's, Bloomberg. X-Alpha and its
underlying style indices have been retrospectively calculated and did not exist
prior to the dates specified above. Accordingly, the results shown during the
retrospective periods are hypothetical and do no reflect actual returns. Past
performance is not necessarily indicative of how the Index will perform in the
future.

                                    page 18
|
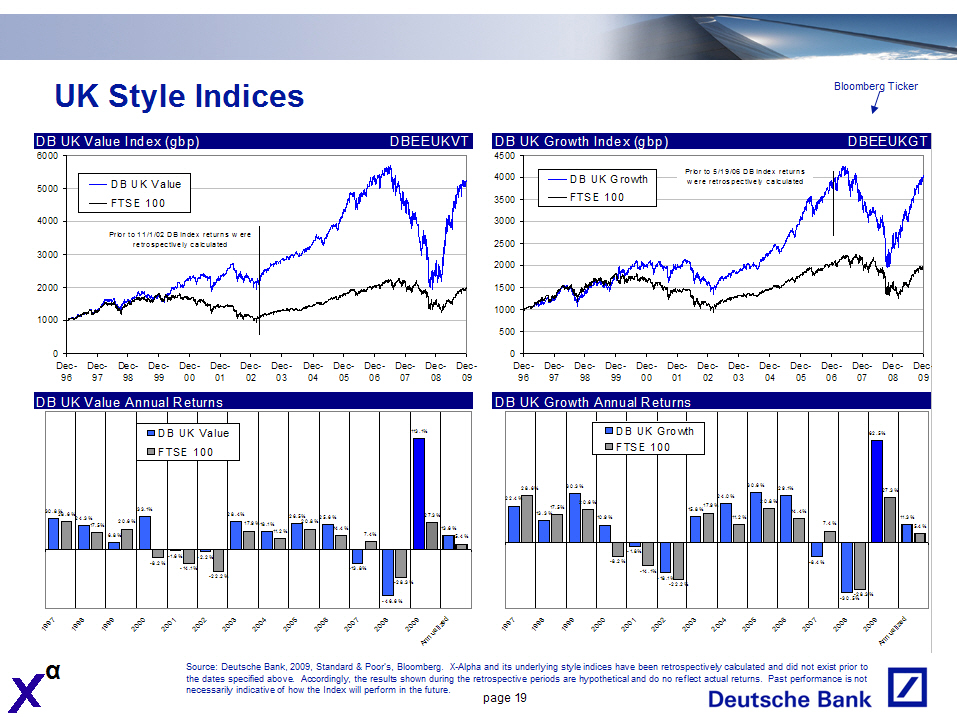 |
    UK Style Indices

DB UK  Value Index (gbp)                        DBEEUKVT
6000
5000     DB UK Value
         FTSE 100
4000
              Prior to 11/1/02 DB Index  returns  w ere
                  retrospectively  calculated
3000
2000
1000
    0
    Dec- Dec-   Dec- Dec- Dec-  Dec-  Dec- Dec-  Dec-  Dec- Dec-  Dec-Dec-   Dec-
     96    97    98   99      00  01   02   03       04 05   06     07     08  09

                                  Bloomberg Ticker
DB  UK  Growth Index (gbp)        DBEEUKGT
4500
4000     DB UK Growth             Prior to 5/19/06 DB Index  returns
                                  were retrospectively  calculated
3500     FTSE 100
3000
2500
2000
1500
1000
 500
   0
      Dec-Dec-   Dec-Dec- Dec-  Dec-  Dec- Dec-  Dec-  Dec- Dec-  Dec-Dec-   Dec-
        96  97 98      99   00  01       02 03    04    05    06    07     08  09

Source: Deutsche Bank, 2009, Standard & Poor's, Bloomberg. X-Alpha and its
underlying style indices have been retrospectively calculated and did not exist
prior to the dates specified above. Accordingly, the results shown during the
retrospective periods are hypothetical and do no reflect actual returns. Past
performance is not necessarily indicative of how the Index will perform in the
future.

                                    page 19
|
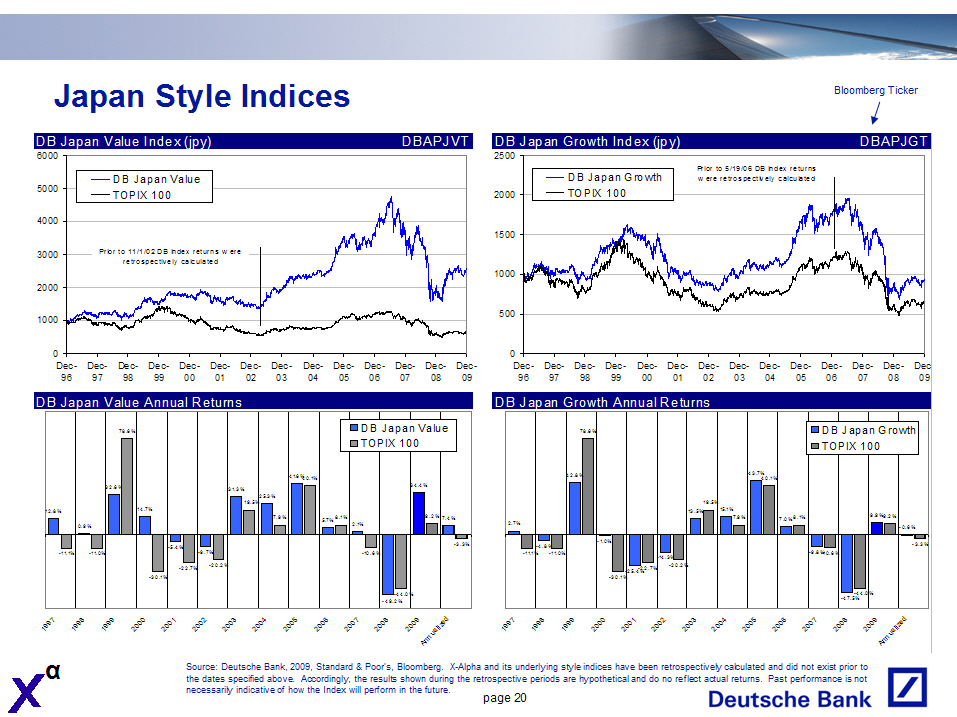 |
Japan Style Indices
Bloomberg Ticker


Source: Deutsche Bank, 2009, Standard & Poor's, Bloomberg. X-Alpha and its
underlying style indices have been retrospectively calculated and did not exist
prior to the dates specified above. Accordingly, the results shown during the
retrospective periods are hypothetical and do no reflect actual returns. Past
performance is not necessarily indicative of how the Index will perform in the
future.

                                    page 20
|
 |
Risk Factors

  LIMITED HISTORY OF THE X-ALPHA INDICES - Publication of each X-Alpha Index began on October 3, 2006.
  Therefore, the X-Alpha Indices have very limited performance history, and no actual investments which allowed
  a tracking of the performance of the X-Alpha Indices was possible before that date. In addition, effective
  July 17, 2007, the methodology for the calculation of the X-Alpha Indices was changed by the Index Sponsor.
  For this reason, the actual performance history of the X-Alpha Indices for the dates between October 3, 2006
  and July 17, 2007 does not reflect the methodology currently in use for the calculation of the X-Alpha
  Indices.

  AN INVESTMENT LINKED OR RELATED TO AN X-ALPHA INDEX WILL NOT NECESSARILY BE THE SAME AS AN INVESTMENT IN ANY
  DB REGIONAL STYLE INDEX, THE BENCHMARK INDEX WITH WHICH IT IS PAIRED OR IN ANY OF THEIR UNDERLYING COMPONENTS

  - The X-Alpha Index closing level on any trading day will depend on the performance, in relation to each
  pair of Index Constituents which consists of a DB Regional Style Index and a Benchmark Index (each, an
  "Index Constituent Pair"), of each DB Regional Style Index compared to the Benchmark Index with which it is
  paired. If the overall performance of the DB Regional Style Indices compared to the Benchmark Indices, when
  measured by reference to each Index Constituent Pair, is positive, the X-Alpha Index closing level will
  rise. Conversely, if the overall performance of the DB Regional Style Indices compared to the Benchmark
  Indices, when measured by reference to each Index Constituent Pair, is negative, the X-Alpha Index closing
  level will fall. Therefore, whether or not the X-Alpha Index closing level rises or falls depends not only
  on whether or not the levels of any of the DB Regional Style Indices and/or the Benchmark Indices rise or
  fall but rather on the overall comparative performance of the DB Regional Style Indices to the relevant
  Benchmark Indices when measured by reference to each Index Constituent Pair. You should, therefore,
  carefully consider the composition and calculation of each DB Regional Style Index and each Benchmark Index
  which together form each Index Constituent Pair.

  THE VALUE OF EACH X-ALPHA INDEX IS BASED UPON THE RETURN OF EACH INDEX CONSTITUENT PAIR. IF THE RETURN OF A
  DB REGIONAL STYLE INDEX IS POSITIVE BUT IS LESS THAN THE RETURN OF A BENCHMARK INDEX WITH WHICH IT IS
  PAIRED, THE OVERALL RETURN OF THE RELEVANT INDEX CONSTITUENT PAIR WILL BE NEGATIVE - The value of the
  X-Alpha Index is based upon the performance of each DB Regional Style Index relative to that of the
  Benchmark Index with which it is paired. Even if a DB Regional Style Index achieves a positive return, the
  Index Constituent Pair of which it is a member could achieve a negative return if the Benchmark Index
  included in such Index Constituent Pair achieves a greater positive return.

  THE INDEX CONSTITUENT PAIRS ARE NOT EQUALLY WEIGHTED IN THE X-ALPHA MODEL - The Index Constituent Pairs
  are assigned different geographical weightings in the X-Alpha Model as described in "The Deutsche Bank
  X-Alpha USD Excess Return(R) Index - Index Constituent Pairs" in Underlying Supplement No. 14A filed by
  Deutsche Bank AG with the SEC on February 28, 2008. One consequence of the unequal weighting of the Index
  Constituent Pairs is that the same return generated by two Index Constituent Pairs, whether positive or
  negative, may have a different effect on the performance of the Index.

                                    page 21
|
 |
Risk Factors

  RETURNS GENERATED BY THE INDEX CONSTITUENT PAIRS MAY OFFSET EACH OTHER - At a time when some of the Index
  Constituent Pairs generate positive returns, other Index Constituent Pairs may generate positive returns that
  are smaller or they may generate returns that are negative. As a result, positive returns generated by one or
  more Index Constituent Pairs may be moderated or more than offset by smaller positive returns or negative
  returns generated by the other Index Constituent Pairs, particularly if the Index Constituent Pairs that
  generate positive returns are assigned relatively low weightings in the X-Alpha Model.

  THE RETURNS OF THE INDEX CONSTITUENT PAIRS WILL BE EXPOSED TO FLUCTUATIONS IN EXCHANGE RATES - For the
  purposes of determining the returns of the Index Constituent Pairs, the currency in which any DB Regional
  Style Index or Benchmark Index is expressed (if such currency is not U.S. dollars) will be converted into
  U.S. dollars at the relevant spot exchange rate on each trading day. As a result, any positive or negative
  return that is generated as a result of the performance of a DB Regional Style Index compared to that of a
  Benchmark Index with which it is paired is exposed to fluctuations in the exchange rate between the U.S.
  dollar and the currency in which such DB Regional Style Index and such Benchmark Index are publicly quoted.
  In addition, appreciation of the U.S. dollar against the currencies of such indices would have the effect of
  reducing the impact of positive excess returns from the relevant Index Constituent Pairs.

  THE ACTUAL EXPERIENCED VOLATILITY OF EACH INDEX CONSTITUENT PAIR AND THE X-ALPHA MODEL MAY NOT EQUAL TARGET
  VOLATILITY, WHICH MAY HAVE A NEGATIVE IMPACT ON THE PERFORMANCE OF THE INDEX - As described in "The Deutsche
  Bank X- Alpha USD Excess Return(R) Index - Calculation and Reconstitution of the Index" in Underlying
  Supplement No. 14A filed by Deutsche Bank AG with the SEC on February 28, 2008, the weighting of each Index
  Constituent Pair in the X-Alpha Model is adjusted to target a volatility level of 8%. Because this
  adjustment is based on recently experienced volatility and is subject to a minimum of 50% and a maximum of
  150%, the actual volatility realized on the Index Constituent Pairs and the X-Alpha Model will not
  necessarily equal the volatility target. If returns on the Index Constituent Pairs or the X-Alpha Model
  coincide with volatility higher than the target, the Index would be exposed less to such returns than if the
  volatility targeting had not been done. If returns on Index Constituent Pairs or the X-Alpha Model coincide
  with volatility lower than the target, the Index would be exposed more to such returns than if the
  volatility targeting had not been done. Such adjustments may have a negative impact on the performance of
  the Index.

  THE CALCULATION OF THE INDEX CLOSING LEVEL WILL INCLUDE A DEDUCTION OF THE BORROW FEE - On each trading day,
  the calculation of the Index closing level will include a deduction of the Borrow Fee to defray transaction
  costs incurred in relation to the Index on such day, as described in "The Deutsche Bank X-Alpha USD Excess
  Return(R) Index - Index Costs" in Underlying Supplement No. 14A filed by Deutsche Bank AG with the SEC on
  February 28, 2008.

                                    page 22
|
 |
Risk Factors

  WE ARE ONE OF THE COMPANIES THAT MAKE UP THE DOW JONES EURO STOXX 50 TOTAL RETURN INDEX(TM), AND OUR COMMON
  STOCK MAY BE INCLUDED IN TWO OF THE DB REGIONAL STYLE INDICES, BUT WE ARE NOT AFFILIATED WITH ANY OTHER
  COMPANY INCLUDED IN THE DOW JONES EURO STOXX 50 TOTAL RETURN INDEX(TM), ANY OTHER BENCHMARK INDEX OR ANY DB
  REGIONAL STYLE INDEX - We are one of the companies that make up the Dow Jones EURO STOXX 50 Total Return
  Index(TM), and our common stock may be included in two of the DB Regional Style Indices, but we are not
  affiliated with any of the other companies whose stocks are included in the Dow Jones EURO STOXX 50 Total
  Return Index(TM), any of the other Benchmark Indices or any of the DB Regional Style Indices. As a result, we
  will have no ability to control the actions of such other companies, including actions that could affect the
  value of the stocks underlying any of the Benchmark Indices, the DB Regional Style Indices or the securities
  or options linked to the X-Alpha Indices. None of the money you pay us will go to the respective sponsors of
  the Benchmark Indices (the "Benchmark Index Sponsors") or to any of the other companies included in the
  Benchmark Indices or the DB Regional Style Indices, and none of those companies will be involved in the
  offering of the securities or options linked to an X-Alpha Index in any way. Neither those companies nor the
  Benchmark Index Sponsors will have any obligation to consider your interests as a holder of securities or
  options linked to an X-Alpha Index in taking any corporate actions that might affect the value of such
  securities or options.

  DEUTSCHE BANK AG, LONDON BRANCH, AS THE SPONSOR OF EACH DB REGIONAL STYLE INDEX, AND EACH BENCHMARK INDEX
  SPONSOR MAY ADJUST THE RELEVANT INDEX IN A WAY THAT AFFECTS ITS LEVEL - Deutsche Bank AG, London Branch, as
  the sponsor of each DB Regional Style Index (the "DB Regional Style Index Sponsor") and each Benchmark Index
  Sponsor are responsible for calculating and maintaining the DB Regional Style Indices and the Benchmark
  Indices, respectively. The DB Regional Style Index Sponsor and any Benchmark Index Sponsor can add, delete
  or substitute a component stock of a DB Regional Style Index or a Benchmark Index, as the case may be, or
  make methodological changes that could affect the level of the relevant index. You should realize that any
  changes in the DB Regional Style Index components or the Benchmark Index components may affect the relevant
  DB Regional Style Index or Benchmark Index, as the case may be, and may therefore affect the X-Alpha Index,
  as any newly added component stock may perform significantly better or worse than the component stock it
  replaces. Additionally, the DB Regional Style Index Sponsor and any Benchmark Index Sponsor may alter,
  discontinue or suspend calculation or dissemination of the relevant index. Any of these actions could
  adversely affect the value of your securities or options linked to an X-Alpha Index. The DB Regional Style
  Index Sponsor and the Benchmark Index Sponsors have no obligation to consider your interests in calculating
  or revising the relevant indices.

                                    page 23
|
 |
Risk Factors

  POTENTIAL CONFLICTS OF INTEREST EXIST BECAUSE THE ISSUER OF SECURITIES LINKED TO AN X-ALPHA INDEX, THE
  CALCULATION AGENT FOR THE SECURITIES LINKED TO AN X-ALPHA INDEX, THE X-ALPHA INDEX SPONSOR AND THE DB
  REGIONAL STYLE INDEX SPONSOR ARE THE SAME LEGAL ENTITY - Deutsche Bank AG is the Issuer of securities linked
  to the X-Alpha indices, the calculation agent for securities linked to the X-Alpha indices, the X-Alpha Index
  Sponsor and the DB Regional Style Index Sponsor. As the X-Alpha Index Sponsor and the DB Regional Style Index
  Sponsor, Deutsche Bank AG carries out calculations necessary to promulgate each X-Alpha Index and each of the
  DB Regional Style Indices and maintains some discretion as to how such calculations are made. In particular,
  the X-Alpha Index Sponsor and the DB Regional Style Index Sponsor have discretion in selecting among methods
  for calculating each X-Alpha Index and each of the DB Regional Style Indices, respectively, in the event that
  the regular means of determining the values of the components of each X-Alpha Index or any of the DB Regional
  Style Indices, as the case may be, are unavailable at the time such determinations are scheduled to take
  place. The X-Alpha Index Sponsor also has discretion to make changes in the reconstitution periods for each
  X-Alpha Index, and the DB Regional Style Index Sponsor has discretion under certain circumstances in
  selecting the component stocks of each DB Regional Style Index. There can be no assurance that any
  determinations made by Deutsche Bank AG in these various capacities will not affect the levels of each
  X-Alpha Index or any DB Regional Style Indices or the value of securities or options linked to an X-Alpha
  Index. Because determinations made by Deutsche Bank AG in these roles may affect the payments made on options
  and securities linked to the X-Alpha Indices, potential conflicts of interest may exist between Deutsche Bank
  AG and you.

                                    page 24
|
 |
Important notes

Prospective investors should understand and discuss with their professional tax, legal, accounting and other
advisors the effect of a transaction they may enter into. Before entering into any transaction you should take
steps to ensure that you understand and have assessed with your financial advisor, or made an independent
assessment of, the appropriateness of the transaction in the light of your own objectives and circumstances,
including the possible risks and benefits of entering into such a transaction.

Structured notes are not suitable for all investors due to illiquidity, optionality, time to redemption, and
payoff nature of the strategy.

We or our affiliates or persons associated with us or such affiliates ("Associated Persons") may: make a
market in, trade in instruments economically related to, or have an investment banking or other relationship
with one or more of the issuers of the component securities of the underlying index. We or our affiliates
may: maintain a long or short position in securities referenced herein or in related futures or options;
purchase, sell, or maintain inventory; engage in any other transaction involving such securities; and earn
brokerage or other compensation.

Any payout information, scenario analysis, and hypothetical calculations should in no case be construed
as an indication of expected payout on an actual investment and/or expected behavior of an actual
structured product.

Calculations of returns on the instruments may be linked to a referenced index or interest rate. As such,
the investments may not be suitable for persons unfamiliar with such index or interest rate, or unwilling or
unable to bear the risks associated with the transaction. Products denominated in a currency, other than the
investor's home currency, will be subject to changes in exchange rates, which may have an adverse effect on
the value, price or income return of the products. These products may not be readily realizable investments
and are not traded on any regulated market. The securities referred to herein involve risk, which may
include interest rate, index, currency, credit, political, liquidity, time value, commodity and market risk
and are not suitable for all investors.

The past performance of an index, securities or other instruments does not guarantee or predict future
performance. The distribution of this document and availability of these products and services in certain
jurisdictions may be restricted by law.

Deutsche Bank does not provide accounting, tax or legal advice.

BEFORE  ENTERING  INTO ANY  TRANSACTION  YOU SHOULD  TAKE STEPS TO ENSURE THAT YOU  UNDERSTAND  AND HAVE MADE AN
INDEPENDENT  ASSESSMENT  OF THE  APPROPRIATENESS  OF THE  TRANSACTION  IN  LIGHT  OF  YOUR  OWN  OBJECTIVES  AND
CIRCUMSTANCES,  INCLUDING  THE POSSIBLE  RISKS AND BENEFITS OF ENTERING INTO SUCH  TRANSACTION.  YOU SHOULD ALSO
CONSIDER MAKING SUCH INDEPENDENT INVESTIGATIONS AS YOU CONSIDER NECESSARY OR APPROPRIATE FOR SUCH PURPOSE.

"Deutsche Bank" means Deutsche Bank AG and its affiliated companies, as the context requires. Deutsche Bank
Private Wealth Management refers to Deutsche Bank's wealth management activities for high-net- worth clients
around the world. Deutsche Bank Alex Brown is a division of Deutsche Bank Securities Inc.

Deutsche Bank AG has filed a registration statement (including a prospectus) with the SEC for the offerings to
which this communication relates. Before you invest, you should read the prospectus in that registration
statement and other documents the issuer has filed with the SEC for more complete information about the issuer
and this offering. You may get these documents for free by visiting EDGAR on the SEC Web site at www.sec.gov.
Alternatively, the issuer, any underwriter or any dealer participating in the offering will arrange to send
you the prospectus if you request it by calling toll-free 1-800-311-4409.

Backtested, hypothetical or simulated performance results presented herein have inherent limitations. Unlike
an actual performance record based on trading actual client portfolios, simulated results are achieved by
means of the retroactive application of a backtested model itself designed with the benefit of hindsight.
Taking into account historical events the backtesting of performance also differs from actual account
performance because an actual investment strategy may be adjusted any time, for any reason, including a
response to material, economic or market factors. The backtested performance includes hypothetical results
that do not reflect the reinvestment of dividends and other earnings or the deduction of advisory fees,
brokerage or other commissions, and any other expenses that a client would have paid or actually paid. No
representation is made that any trading strategy or account will or is likely to achieve profits or losses
similar to those shown. Alternative modeling techniques or assumptions might produce significantly different
results and prove to be more appropriate. Past hypothetical backtest results are neither an indicator nor
guarantee of future returns. Actual results will vary, perhaps materially, from the analysis.

Instruments relating to the indices discussed herein are not insured by the Federal Deposit Insurance
Corporation (FDIC) or any other US governmental agency. These instruments are not insured by any
statutory scheme or governmental agency of the United Kingdom.

These investments typically involve a high degree of risk, are not readily transferable and typically will
not be listed or traded on any exchange and are intended for sale only to investors who are capable of
understanding and assuming the risks involved. The market value of any structured security may be affected
by changes in economic, financial and political factors (including, but not limited to, spot and forward
interest and exchange rates), time to maturity, market conditions and volatility and the equity prices and
credit quality of any issuer or reference issuer.

Additional information may be available upon request. Any results shown do not reflect the impact of
commission and/or fees, unless stated.

                                    page 25
|
 |
Disclaimers

 Dow Jones EURO STOXX 50 IndexTM

 Any securities which may be linked to DB Euro USD Alpha (the  "securities") are not sponsored,  endorsed,  sold
 or  promoted  by STOXX  Limited,  including  its  affiliates.  We refer to  STOXX  Limited  and its  affiliates
 collectively as STOXX Limited.  STOXX Limited has not passed on the legality or suitability of, or the accuracy
 or adequacy of descriptions and disclosures  relating to the securities.  STOXX Limited makes no representation
 or  warranty,  express or implied to the owners of the  securities  or any member of the public  regarding  the
 advisability of investing in securities generally or in the securities particularly,  or the ability of the Dow
 Jones EURO STOXX 50 IndexTM to track general stock market  performance.  The Dow Jones EURO STOXX 50 IndexTM is
 determined,  composed and  calculated by STOXX Limited  without  regard to Deutsche Bank AG or the  securities.
 STOXX  Limited and Dow Jones have no  obligation  to take the needs of  Deutsche  Bank AG or the holders of the
 securities into  consideration  in  determining,  composing or calculating the Dow Jones EURO STOXX 50 IndexTM.
 STOXX Limited and Dow Jones are not  responsible  for and have not  participated  in the  determination  of the
 timing of, prices at, or quantities of the  securities to be issued or in the  determination  or calculation of
 the  equation  by which the  securities  are to be  converted  into cash.  STOXX  Limited and Dow Jones have no
 liability in connection with the administration, marketing or trading of the securities.

 STOXX LIMITED AND DOW JONES DO NOT GUARANTEE THE ACCURACY  AND/OR THE  COMPLETENESS OF THE DOW JONES EURO STOXX
 50 INDEXTM OR ANY DATA  INCLUDED  THEREIN  AND STOXX  LIMITED  AND DOW JONES  SHALL HAVE NO  LIABILITY  FOR ANY
 ERRORS,  OMISSIONS OR INTERRUPTIONS THEREIN. STOXX LIMITED AND DOW JONES MAKE NO WARRANTY,  EXPRESS OR IMPLIED,
 AS TO RESULTS TO BE OBTAINED BY DEUTSCHE BANK AG, HOLDERS OF THE  SECURITIES,  OR ANY OTHER PERSON OR ENTITY IN
 CONNECTION WITH THE USE OF THE DOW JONES EURO STOXX 50 INDEXTM OR ANY DATA INCLUDED THEREIN.  STOXX LIMITED AND
 DOW JONES MAKE NO EXPRESS OR IMPLIED  WARRANTIES,  AND EXPRESSLY  DISCLAIM ALL WARRANTIES OF MERCHANTABILITY OR
 FITNESS  FOR A  PARTICULAR  PURPOSE  OR USE WITH  RESPECT  TO THE DOW JONES  EURO  STOXX 50 INDEXTM OR ANY DATA
 INCLUDED THEREIN.  WITHOUT LIMITING ANY OF THE FOREGOING, IN NO EVENT SHALL STOXX LIMITED OR DOW JONES HAVE ANY
 LIABILITY FOR ANY LOST PROFITS OR SPECIAL,  INCIDENTAL,  PUNITIVE,  INDIRECT, OR CONSEQUENTIAL DAMAGES, EVEN IF
 NOTIFIED OF THE POSSIBILITY  THEREOF.  THE LICENSING  AGREEMENT  BETWEEN DEUTSCHE BANK AG AND STOXX LIMITED AND
 DOW JONES ARE SOLELY FOR THEIR  BENEFIT  AND NOT FOR THE BENEFIT OF THE OWNERS OF THE  SECURITIES  OR ANY THIRD
 PARTIES.

 "DOW JONES EURO STOXX 50" AND "STOXX"  ARE THE  INTELLECTUAL  PROPERTY OF STOXX  LIMITED AND DOW JONES AND HAVE
 BEEN LICENSED FOR CERTAIN  PURPOSES BY DEUTSCHE BANK AG. THE SECURITIES ARE NOT  SPONSORED,  ENDORSED,  SOLD OR
 PROMOTED BY STOXX LIMITED AND DOW JONES, AND STOXX LIMITED AND DOW JONES MAKES NO REPRESENTATION  REGARDING THE
 ADVISABILITY OF INVESTING IN THE SECURITIES.

 Any securities which may be linked to DB US USD Alpha (the "securities") are not sponsored,  endorsed,  sold or
 promoted by Standard & Poor's,  a division of the McGraw-Hill  Companies,  Inc.,  which we refer to as S & P. S & P
 makes no representation or warranty,  express or implied,  to the owners of the securities or any member of the
 public regarding the advisability of investing in securities  generally or in the securities  particularly,  or
 the ability of the S & P 500(R) Index to track general stock market performance.  S & P has no obligation to take the
 needs of Deutsche Bank AG or the holders of the securities  into  consideration  in  determining,  composing or
 calculating the S & P 500(R) Index.  S & P is not responsible for and has not  participated in the  determination  of
 the timing,  price or quantity of the  securities to be issued or in the  determination  or  calculation of the
 amount  due at  maturity  of the  securities.  S & P has no  obligation  or  liability  in  connection  with  the
 administration, marketing or trading of the securities.

 S & P DOES NOT GUARANTEE THE ACCURACY AND/OR THE  COMPLETENESS OF THE S & P 500(R) INDEX OR ANY DATA INCLUDED THEREIN
 AND S & P SHALL HAVE NO LIABILITY  FOR ANY ERRORS,  OMISSIONS OR  INTERRUPTIONS  THEREIN.  S & P MAKES NO WARRANTY,
 EXPRESS OR IMPLIED,  AS TO RESULTS TO BE OBTAINED BY DEUTSCHE BANK AG,  HOLDERS OF THE  SECURITIES OR ANY OTHER
 PERSON OR ENTITY  FROM THE USE OF THE S & P 500(R)  INDEX OR ANY DATA  INCLUDED  THEREIN.  S & P MAKES NO  EXPRESS OR
 IMPLIED  WARRANTIES,  AND EXPRESSLY  DISCLAIMS ALL  WARRANTIES OF  MERCHANTABILITY  OR FITNESS FOR A PARTICULAR
 PURPOSE OR USE WITH RESPECT TO THE S & P 500(R) INDEX OR ANY DATA  INCLUDED  THEREIN.  WITHOUT  LIMITING ANY OF THE
 FOREGOING,  IN NO EVENT SHALL S & P HAVE ANY  LIABILITY  FOR ANY  SPECIAL,  PUNITIVE,  INDIRECT OR  CONSEQUENTIAL
 DAMAGES (INCLUDING LOST PROFITS), EVEN IF NOTIFIED OF THE POSSIBILITY OF SUCH DAMAGES.

 "STANDARD & POOR'S",  "S & P",  "S & P 500" AND "500" ARE THE INTELLECTUAL  PROPERTY OF THE MCGRAW-HILL  COMPANIES,
 INC. AND HAVE BEEN LICENSED FOR USE BY DEUTSCHE BANK AG. THE SECURITIES ARE NOT  SPONSORED,  ENDORSED,  SOLD OR
 PROMOTED BY S & P AND S & P MAKES NO REPRESENTATION REGARDING THE ADVISABILITY OF PURCHASING ANY OF THE SECURITIES.

                                    page 26
|
 |
Disclaimers

 Any securities which may be linked to DB Japan USD Alpha (the "securities") are not sponsored,  endorsed,  sold
 or promoted by the Tokyo Stock Exchange,  Inc.,  which we refer to as the TSE. The TSE makes no  representation
 or warranty,  express or implied,  to the owners of the  securities  or any member of the public  regarding the
 advisability  of investing in securities  generally or in the  securities  particularly,  or the ability of the
 TOPIX Index to track general stock market performance.  The TSE has no obligation to take the needs of Deutsche
 Bank AG or the holders of the securities into consideration in determining,  composing or calculating the TOPIX
 Index.  The TSE is not responsible for and has not participated in the  determination  of the timing,  price or
 quantity of the  securities to be issued or in the  determination  or calculation of the amount due at maturity
 of the securities.  The TSE has no obligation or liability in connection with the administration,  marketing or
 trading of the securities.

 THE TSE DOES NOT  GUARANTEE  THE  ACCURACY  AND/OR THE  COMPLETENESS  OF THE TOPIX  INDEX OR ANY DATA  INCLUDED
 THEREIN AND THE TSE SHALL HAVE NO LIABILITY FOR ANY ERRORS,  OMISSIONS OR INTERRUPTIONS  THEREIN. THE TSE MAKES
 NO WARRANTY,  EXPRESS OR IMPLIED,  AS TO RESULTS TO BE OBTAINED BY DEUTSCHE BANK AG,  HOLDERS OF THE SECURITIES
 OR ANY OTHER PERSON OR ENTITY FROM THE USE OF THE TOPIX INDEX OR ANY DATA  INCLUDED  THEREIN.  THE TSE MAKES NO
 EXPRESS OR IMPLIED  WARRANTIES,  AND EXPRESSLY  DISCLAIMS ALL  WARRANTIES OF  MERCHANTABILITY  OR FITNESS FOR A
 PARTICULAR  PURPOSE OR USE WITH RESPECT TO THE TOPIX INDEX OR ANY DATA INCLUDED  THEREIN.  WITHOUT LIMITING ANY
 OF THE  FOREGOING,  IN NO EVENT  SHALL  THE TSE HAVE ANY  LIABILITY  FOR ANY  SPECIAL,  PUNITIVE,  INDIRECT  OR
 CONSEQUENTIAL DAMAGES (INCLUDING LOST PROFITS), EVEN IF NOTIFIED OF THE POSSIBILITY OF SUCH DAMAGES.

 "TOPIX", "TOPIX 100" AND "TOPIX CORE 30" ARE THE INTELLECTUAL PROPERTY OF THE TSE AND HAVE BEEN LICENSED FOR
 USE BY DEUTSCHE BANK AG. THE SECURITIES ARE NOT SPONSORED, ENDORSED, SOLD OR PROMOTED BY THE TSE AND THE TSE
 MAKES NO REPRESENTATION REGARDING THE ADVISABILITY OF PURCHASING ANY OF THE SECURITIES.

 Any securities which may be linked to DB UK USD Alpha (the "securities") are not sponsored,  endorsed,  sold or
 promoted by FTSE International  Limited, which we refer to as FTSE, a company owned equally by the London Stock
 Exchange and The Financial Times Limited, which we refer to as the LSE and FT, respectively.  FTSE, the LSE and
 FT make no  representation  or warranty,  express or implied,  to the owners of the securities or any member of
 the public regarding the advisability of investing in securities  generally or in the securities  particularly,
 or the ability of the FTSE 100(R) Index to track general stock market  performance.  FTSE, the LSE and FT have no
 obligation  to take the needs of  Deutsche  Bank AG or the  holders of the  securities  into  consideration  in
 determining,  composing or calculating  the FTSE 100(R) Index.  FTSE, the LSE and FT are not  responsible for and
 have not participated in the  determination of the timing,  price or quantity of the securities to be issued or
 in the determination or calculation of the amount due at maturity of the securities.  FTSE, the LSE and FT have
 no obligation or liability in connection with the administration, marketing or trading of the securities.

 FTSE, THE LSE AND FT DO NOT GUARANTEE THE ACCURACY  AND/OR THE  COMPLETENESS OF THE FTSE 100(R) INDEX OR ANY DATA
 INCLUDED  THEREIN AND FTSE, THE LSE AND FT SHALL HAVE NO LIABILITY FOR ANY ERRORS,  OMISSIONS OR  INTERRUPTIONS
 THEREIN.  FTSE, THE LSE AND FT MAKE NO WARRANTY,  EXPRESS OR IMPLIED,  AS TO RESULTS TO BE OBTAINED BY DEUTSCHE
 BANK AG,  HOLDERS OF THE  SECURITIES  OR ANY OTHER  PERSON OR ENTITY FROM THE USE OF THE FTSE 100(R) INDEX OR ANY
 DATA INCLUDED THEREIN.  FTSE, THE LSE AND FT MAKE NO EXPRESS OR IMPLIED WARRANTIES,  AND EXPRESSLY DISCLAIM ALL
 WARRANTIES OF  MERCHANTABILITY  OR FITNESS FOR A PARTICULAR  PURPOSE OR USE WITH RESPECT TO THE FTSE 100(R) INDEX
 OR ANY DATA INCLUDED  THEREIN.  WITHOUT  LIMITING ANY OF THE FOREGOING,  IN NO EVENT SHALL FTSE, THE LSE AND FT
 HAVE ANY LIABILITY FOR ANY SPECIAL, PUNITIVE,  INDIRECT OR CONSEQUENTIAL DAMAGES (INCLUDING LOST PROFITS), EVEN
 IF NOTIFIED OF THE POSSIBILITY OF SUCH DAMAGES.

 "FTSE" AND "FTSE 100 INDEX" ARE THE  INTELLECTUAL  PROPERTY OF FTSE AND HAVE BEEN  LICENSED FOR USE BY DEUTSCHE
 BANK AG. THE SECURITIES ARE NOT SPONSORED,  ENDORSED, SOLD OR PROMOTED BY FTSE, THE LSE OR FT AND FTSE, THE LSE
 AND FT MAKE NO REPRESENTATION REGARDING THE ADVISABILITY OF PURCHASING ANY OF THE SECURITIES.

                                    page 27
|