 |
Bloomberg Ticker                           Issuer Free Writing Prospectus
ER  DBCRUSI                                Filed pursuant to Rule 433
                                           Registration Statement No. 333-162195
                                           Dated: August 5, 2010


DB Currency Returns Index
July 2010

                               [GRAPHIC OMITTED]

Deutsche Bank's Currency Returns Index has existed since February 2007.
Accordingly, any index performance shown in this presentation preceding that
inception date does not reflect the performance of an actual index, but has
been retrospectively calculated, as described herein.

Deutsche Bank AG has filed a registration statement (including a prospectus)
with the SEC for the offerings to which this communication may relate. Before
you invest, you should read the prospectus in that registration statement and
other documents Deutsche Bank AG has filed with the SEC for more complete
information about Deutsche Bank AG and this offering. You may get these
documents for free by visiting EDGAR on the SEC website at www.sec.gov.
Alternatively, Deutsche Bank AG, any underwriter or any dealer participating in
the offering will arrange to send you the prospectus if you request it by
calling toll-free 1-800-311-4409.
                                       0
|
 |
DB Currency Returns Index
Introduction
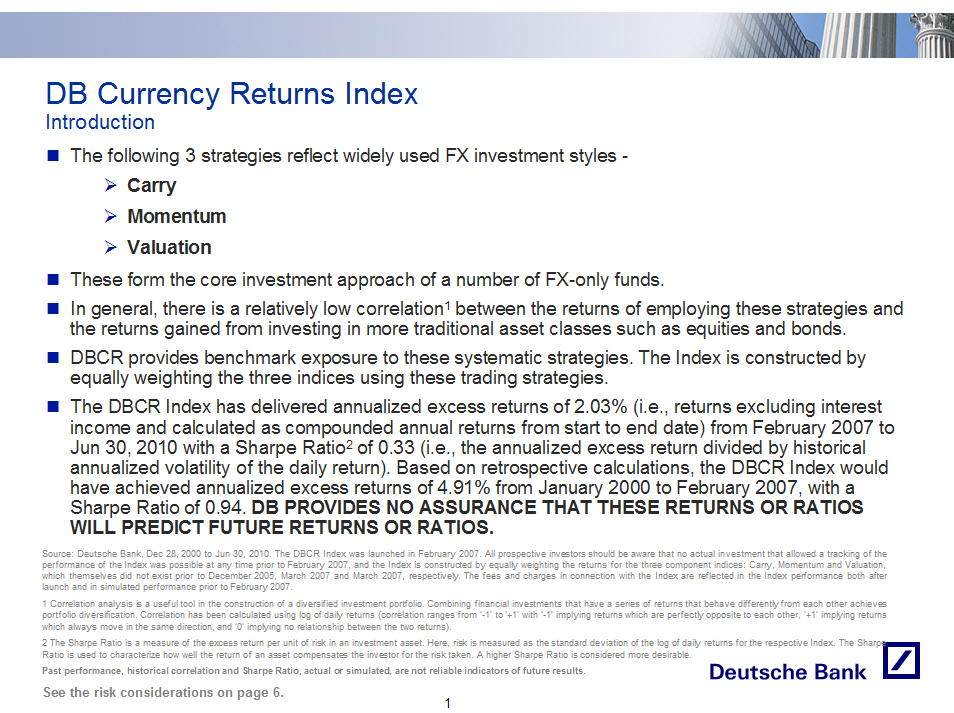
[] The following 3 strategies reflect widely used FX investment styles -
[] Carry
[] Momentum
[] Valuation
[] These form the core investment approach of a number of FX-only funds.
[] In general, there is a relatively low correlation (1) between the returns
of employing these strategies and the returns gained from investing in more
traditional asset classes such as equities and bonds.
[] DBCR provides benchmark exposure to these systematic strategies. The Index
is constructed by equally weighting the three indices using these trading
strategies.
[] The DBCR Index has delivered annualized excess returns of 2.03% (i. e. ,
returns excluding interest income and calculated as compounded annual
returns from start to end date) from February 2007 to Jun 30, 2010 with a
Sharpe Ratio(2) of 0.33 (i. e. , the annualized excess return divided by
historical annualized volatility of the daily return). Based on
retrospective calculations, the DBCR Index would have achieved annualized
excess returns of 4.91% from January 2000 to February 2007, with a Sharpe
Ratio of 0.94. DB PROVIDES NO ASSURANCE THAT THESE RETURNS OR RATIOS WILL
PREDICT FUTURE RETURNS OR RATIOS.
Source: Deutsche Bank, Dec 28, 2000 to Jun 30, 2010. The DBCR Index was
launched in February 2007. All prospective investors should be aware that no
actual investment that allowed a tracking of the performance of the Index was
possible at any time prior to February 2007, and the Index is constructed by
equally weighting the returns for the three component indices: Carry, Momentum
and Valuation, which themselves did not exist prior to December 2005, March
2007 and March 2007, respectively. The fees and charges in connection with the
Index are reflected in the Index performance both after launch and in simulated
performance prior to February 2007.
1 Correlation analysis is a useful tool in the construction of a diversified
investment portfolio. Combining financial investments that have a series of
returns that behave differently from each other achieves portfolio
diversification. Correlation has been calculated using log of daily returns
(correlation ranges from '-1' to '+1' with '-1' implying returns which are
perfectly opposite to each other, '+1' implying returns which always move in
the same direction, and '0' implying no relationship between the two returns).
2 The Sharpe Ratio is a measure of the excess return per unit of risk in an
investment asset. Here, risk is measured as the standard deviation of the log
of daily returns for the respective Index. The Sharpe
Ratio is used to characterize how well the return of an asset compensates the
investor for the risk taken. A higher Sharpe Ratio is considered more
desirable.
Past performance, historical correlation and Sharpe Ratio, actual or simulated,
are not reliable indicators of future results.
See the risk considerations on page 6.
1
|
 |
DB Currency Returns Index
The Three Strategies
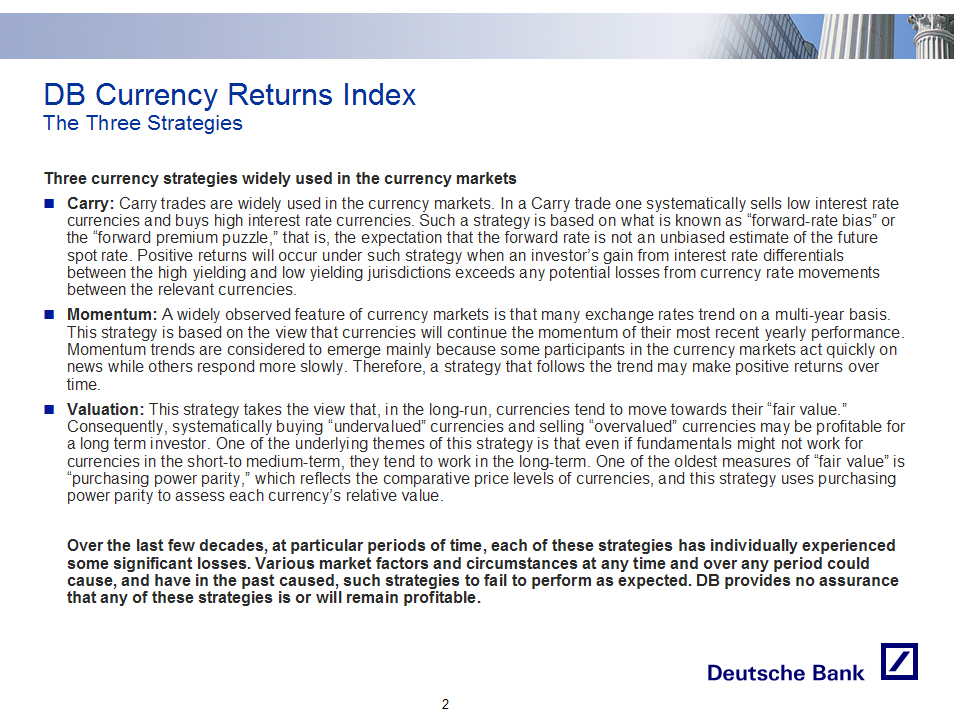
Three currency strategies widely used in the currency markets
[] Carry: Carry trades are widely used in the currency markets. In a Carry
trade one systematically sells low interest rate currencies and buys high
interest rate currencies. Such a strategy is based on what is known as
"forward-rate bias" or the "forward premium puzzle," that is, the
expectation that the forward rate is not an unbiased estimate of the future
spot rate. Positive returns will occur under such strategy when an
investor's gain from interest rate differentials between the high yielding
and low yielding jurisdictions exceeds any potential losses from currency
rate movements between the relevant currencies.
[] Momentum: A widely observed feature of currency markets is that many
exchange rates trend on a multi-year basis. This strategy is based on the
view that currencies will continue the momentum of their most recent yearly
performance. Momentum trends are considered to emerge mainly because some
participants in the currency markets act quickly on news while others
respond more slowly. Therefore, a strategy that follows the trend may make
positive returns over time.
[] Valuation: This strategy takes the view that, in the long-run, currencies
tend to move towards their "fair value. " Consequently, systematically
buying "undervalued" currencies and selling "overvalued" currencies may be
profitable for a long term investor. One of the underlying themes of this
strategy is that even if fundamentals might not work for currencies in the
short-to medium-term, they tend to work in the long-term. One of the oldest
measures of "fair value" is "purchasing power parity," which reflects the
comparative price levels of currencies, and this strategy uses purchasing
power parity to assess each currency's relative value.
Over the last few decades, at particular periods of time, each of these
strategies has individually experienced some significant losses. Various market
factors and circumstances at any time and over any period could cause, and have
in the past caused, such strategies to fail to perform as expected. DB provides
no assurance that any of these strategies is or will remain profitable.
2
|
 |
DB Currency Returns Index
Construction
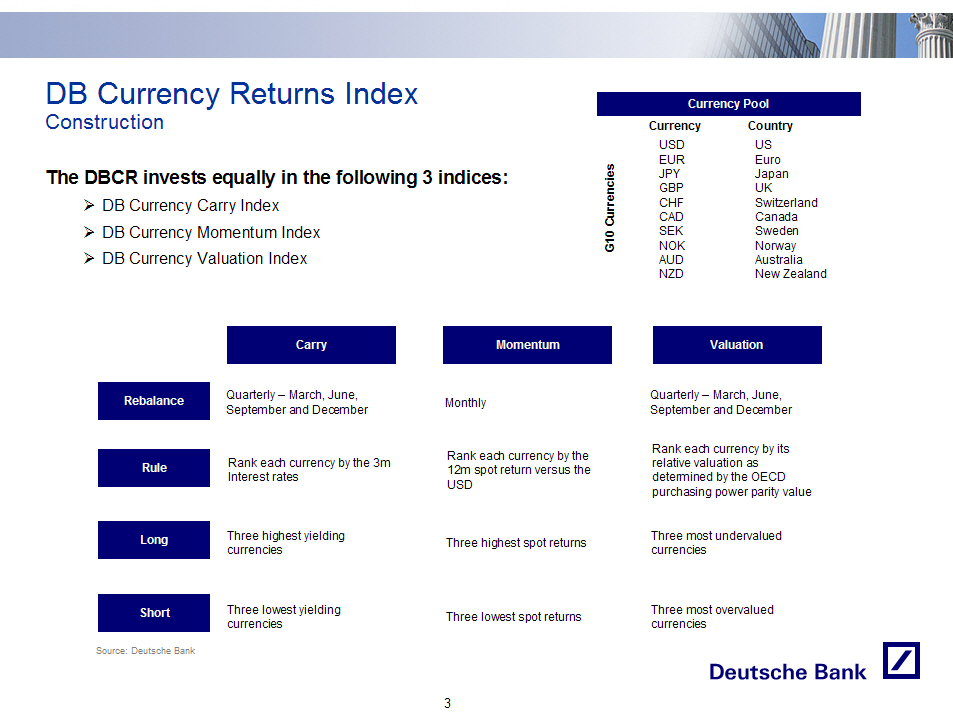
The DBCR invests equally in the following 3 indices:
[] DB Currency Carry Index
[] DB Currency Momentum Index
[] DB Currency Valuation Index
- -------------------------
Currency Pool
- -------------------------
Currency Country
USD US
EUR Euro
JPY Japan
GBP UK
CHF Switzerland
CAD Canada
SEK Sweden
NOK Norway
AUD Australia
NZD New Zealand
Carry Momentum Valuation
- -------------------------------------------------------------------------------------------------
Quarterly -- March, June, Quarterly -- March, June,
Rebalance September and December Monthly September and December
Rank each currency by the Rank each currency by its
Rule Rank each currency by the 3m 12m spot return versus the relative valuation as
Interest rates USD determined by the OECD
USD purchasing power parity value
Long Three highest yielding Three highest spot returns Three most undervalued
currencies currencies
Short Three lowest yielding Three lowest spot returns Three most overvalued
currencies currencies
- -------------------------------------------------------------------------------------------------
Source: Deutsche Bank
3
|
 |
DB Currency Returns Index
Historical Performance
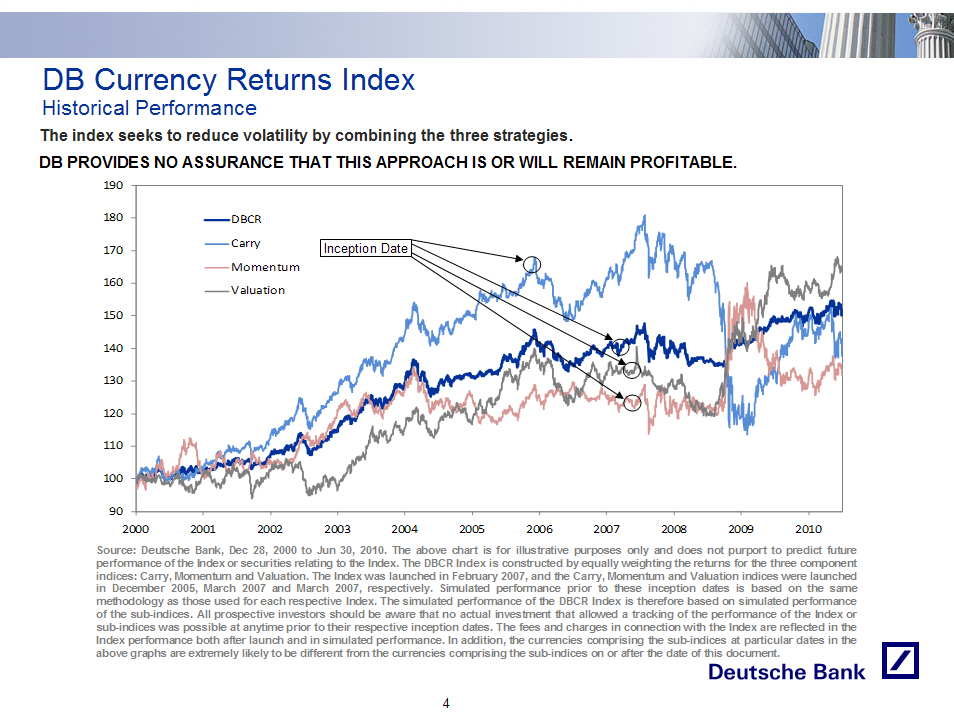
The index seeks to reduce volatility by combining the three strategies.
DB PROVIDES NO ASSURANCE THAT THIS APPROACH IS OR WILL REMAIN PROFITABLE.
[GRAPHIC OMITTED]
Source: Deutsche Bank, Dec 28, 2000 to Jun 30, 2010. The above chart is for
illustrative purposes only and does not purport to predict future performance
of the Index or securities relating to the Index. The DBCR Index is constructed
by equally weighting the returns for the three component indices: Carry,
Momentum and Valuation. The Index was launched in February 2007, and the Carry,
Momentum and Valuation indices were launched in December 2005, March 2007 and
March 2007, respectively. Simulated performance prior to these inception dates
is based on the same methodology as those used for each respective Index. The
simulated performance of the DBCR Index is therefore based on simulated
performance of the sub-indices. All prospective investors should be aware that
no actual investment that allowed a tracking of the performance of the Index or
sub-indices was possible at anytime prior to their respective inception dates.
The fees and charges in connection with the Index are reflected in the Index
performance both after launch and in simulated performance. In addition, the
currencies comprising the sub-indices at particular dates in the above graphs
are extremely likely to be different from the currencies comprising the
sub-indices on or after the date of this document.
4
|
 |
DB Currency Returns Index
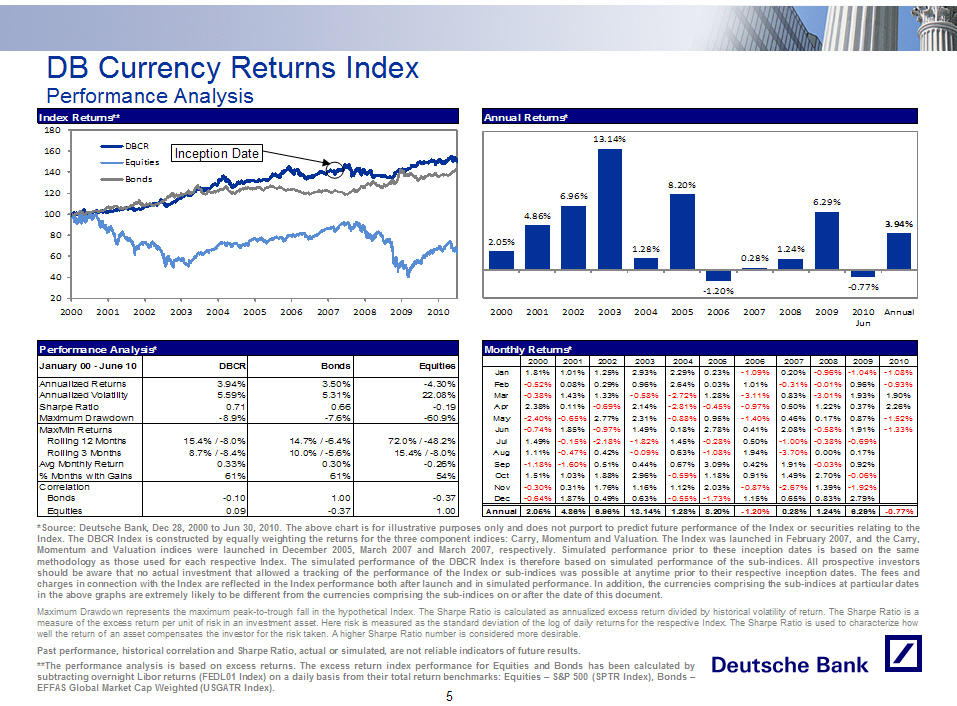
Performance Analysis
Index Returns**
- ---------------
[GRAPHIC OMITTED]
- --------------------------------------------------------------------------------
Performance Analysis*
- --------------------------------------------------------------------------------
January 00 - June 10 DBCR Bonds Equities
- --------------------------------------------------------------------------------
Annualized Returns 3.94% 3.50% -4.30%
Annualized Volatility 5.59% 5.31% 22.08%
Sharpe Ratio 0.71 0.66 -0.19
Maximum Drawdown12 -8.9% -7.6% -60.9%
- --------------------------------------------------------------------------------
Max/Min Returns
Rolling 12 Months 15.4% / -8.0% 14.7% / -6.4% 72.0% / -48.2%
Rolling 3 Months 8.7% / -8.4% 10.0% / -5.6% 15.4% / -8.0%
Avg Monthly Return 0.33% 0.30% -0.26%
% Months with Gains 61% 61% 54%
- --------------------------------------------------------------------------------
Correlation
Bonds -0.10 1.00 -0.37
Equities 0.09 -0.37 1.00
- --------------------------------------------------------------------------------
Annual Returns*
- ---------------
[GRAPHIC OMITTED]
- --------------------------------------------------------------------------------
Monthly Returns*
- -----------------------------------------------------------------------------------
2000 2001 2002 2003 2004 2005 2006 2007 2008 2009 2010
- -----------------------------------------------------------------------------------
Jan 1.81% 1.01% 1.25% 2.93% 2.29% 0.23% -1.09% 0.20% -0.96% -1.04% -1.08%
Feb -0.52% 0.08% 0.29% 0.96% 2.64% 0.03% 1.01% -0.31% -0.01% 0.96% -0.93%
Mar -0.38% 1.43% 1.33% -0.58% -2.72% 1.28% -3.11% 0.83% -3.01% 1.93% 1.90%
Apr 2.38% 0.11% -0.69% 2.14% -2.81% -0.45% -0.97% 0.50% 1.22% 0.37% 2.26%
May -2.40% -0.65% 2.77% 2.31% -0.88% 0.95% -1.40% 0.46% 0.17% 0.87% -1.52%
Jun -0.74% 1.85% -0.97% 1.49% 0.18% 2.78% 0.41% 2.08% -0.58% 1.91% -1.33%
Jul 1.49% -0.15% -2.18% -1.82% 1.45% -0.28% 0.50% -1.00% -0.38% -0.69%
Aug 1.11% -0.47% 0.42% -0.09% 0.63% -1.08% 1.94% -3.70% 0.00% 0.17%
Sep -1.18% -1.60% 0.51% 0.44% 0.67% 3.09% 0.42% 1.91% -0.03% 0.92%
Oct 1.51% 1.03% 1.88% 2.96% -0.59% 1.18% 0.91% 1.49% 2.70% -0.06%
Nov -0.30% 0.31% 1.76% 1.16% 1.12% 2.03% -0.87% -2.67% 1.39% -1.92%
Dec -0.64% 1.87% 0.49% 0.63% -0.55% -1.73% 1.15% 0.65% 0.83% 2.79%
===================================================================================
Annual 2.05% 4.86% 6.96% 13.14% 1.28% 8.20% -1.20% 0.28% 1.24% 6.29% -0.77%
- -----------------------------------------------------------------------------------
*Source: Deutsche Bank, Dec 28, 2000 to Jun 30, 2010. The above chart is for
illustrative purposes only and does not purport to predict future performance
of the Index or securities relating to the Index. The DBCR Index is constructed
by equally weighting the returns for the three component indices: Carry,
Momentum and Valuation. The Index was launched in February 2007, and the Carry,
Momentum and Valuation indices were launched in December 2005, March 2007 and
March 2007, respectively. Simulated performance prior to these inception dates
is based on the same methodology as those used for each respective Index. The
simulated performance of the DBCR Index is therefore based on simulated
performance of the sub-indices. All prospective investors should be aware that
no actual investment that allowed a tracking of the performance of the Index or
sub-indices was possible at anytime prior to their respective inception dates.
The fees and charges in connection with the Index are reflected in the Index
performance both after launch and in simulated performance. In addition, the
currencies comprising the sub-indices at particular dates in the above graphs
are extremely likely to be different from the currencies comprising the
sub-indices on or after the date of this document.
Maximum Drawdown represents the maximum peak-to-trough fall in the hypothetical
Index. The Sharpe Ratio is calculated as annualized excess return divided by
historical volatility of return. The Sharpe Ratio is a measure of the excess
return per unit of risk in an investment asset. Here risk is measured as the
standard deviation of the log of daily returns for the respective Index. The
Sharpe Ratio is used to characterize how well the return of an asset
compensates the investor for the risk taken. A higher Sharpe Ratio number is
considered more desirable.
Past performance, historical correlation and Sharpe Ratio, actual or simulated,
are not reliable indicators of future results.
**The performance analysis is based on excess returns. The excess return index
performance for Equities and Bonds has been calculated by subtracting overnight
Libor returns (FEDL01 Index) on a daily basis from their total return
benchmarks: Equities -- S and P 500 (SPTR Index), Bonds --EFFAS Global Market Cap
Weighted (USGATR Index).
5
|
 |
Certain Risks Relating to the DB Currency Returns Index

[]   DBCR HAS LIMITED PERFORMANCE HISTORY -- Publication of DBCR began in
     February 2007. Therefore, DBCR has very limited performance history. No
     actual investment which allowed tracking of the performance of DBCR was
     possible before that date. In addition, each of the sub-indices comprising
     the DBCR has limited performance history. The retrospective data contained
     herein is based on simulated results for the DBCR Index, which, in turn, is
     based on simulated results for each of the sub-indices.

[]   THE RISK OF INVESTING IN CURRENCIES CAN BE SUBSTANTIAL -- The prices of the
     currencies which comprise the sub-indices may be affected by numerous
     market factors, including events in the equity markets, the bond market and
     the foreign exchange market, fluctuations in interest rates, and world
     economic, political and regulatory events. A rise in the value of one
     currency may be offset by a fall in the value of one or more of the other
     currencies comprising a sub-index.

[]   STRATEGY RISK -- The strategy reflected in each sub-index takes the view
     that taking long positions in certain currencies and short positions in
     other currencies will result in a net gain. However, there is no assurance
     that any of these strategies will be successful. Various market factors and
     circumstances at any time and over any period could cause, and have in the
     past caused, such strategies to fail to perform as expected.

[]   GAINS IN COMPONENTS OF THE DBCR INDEX MAY BE OFFSET BY LOSSES IN OTHER DBCR
     INDEX COMPONENTS -- The DBCR Index is composed of multiple currency
     positions, and therefore a positive return in one position may be offset,
     in whole or in part, by a negative return of a lesser, equal or greater
     magnitude in another position, resulting in an aggregate DBCR Index return
     equal to or less than zero.

[]   CURRENCY MARKETS MAY BE HIGHLY VOLATILE -- Currency markets may be highly
     volatile. Significant changes, including changes in liquidity and prices,
     can occur in such markets within very short periods of time. Foreign
     currency rate risks include, but are not limited to, convertibility risk
     and market volatility and potential interference by foreign governments
     through regulation of local markets, foreign investment or particular
     transactions in foreign currency. These factors may affect the values of
     the components reflected in the DBCR Index in varying ways, and different
     factors may cause the DBCR Index's components and the volatility of their
     prices to move in inconsistent directions at inconsistent rates.

[]   LEGAL AND REGULATORY RISKS -- Legal and regulatory changes could adversely
     affect currency rates. In addition, many governmental agencies and
     regulatory organizations are authorized to take extraordinary actions in
     the event of market emergencies. It is not possible to predict the effect
     of any future legal or regulatory action relating to currency rates, but
     any such action could cause unexpected volatility and instability in
     currency markets, with a substantial and adverse effect on the performance
     of the DBCR Index.

[]   POTENTIAL CONFLICTS OF INTEREST EXIST BECAUSE DEUTSCHE BANK AG IS THE
     CALCULATION AGENT FOR THE DBCR INDEX, AND TRADING ACTIVITIES BY DEUTSCHE
     BANK AG IN THE ELIGIBLE CURRENCIES MAY AFFECT THE DBCR INDEX LEVEL --
     Deutsche Bank AG is the calculation agent for the DBCR Index. Deutsche Bank
     AG carries out calculations necessary to calculate the DBCR Index and
     maintains some discretion as to how such calculations are made, in
     particular if the spot rate for any of the Eligible Currencies is not
     available. The determinations made by Deutsche Bank AG in this capacity may
     affect the level of the DBCR Index. Deutsche Bank AG or its affiliates may
     engage in trading in instruments linked to the Eligible Currencies or any
     of the strategies contained in the DCBR Index on a regular basis as part of
     their general broker-dealer and other businesses, for proprietary accounts,
     for other accounts under management or to facilitate transactions for
     customers, including block transactions. Deutsche Bank AG or its affiliates
     may also issue or underwrite securities or financial or derivative
     instruments with returns linked or related to the Eligible Currencies or
     any of the strategies contained in the DBCR Index. Any of these activities
     could adversely affect the level of the DBCR Index and may reflect trading
     strategies that differ from, or are in direct opposition to, the trading
     strategies contained in the DBCR Index.

[]   LIMITED ACCESS TO INDEX, AND ASSOCIATED COSTS -- Access to the index may be
     available only through the use of an investment vehicle. In such instances,
     the performance of any investment product based on the DBCR Index will be
     lower than the performance of the DBCR Index because of fees, costs, and
     product features. In such offerings, investors should rely on the
     information provided in the offering memorandum or prospectus. Past
     performance, including any performance based on retrospective calculations,
     of the DBCR Index and its sub-indices is not necessarily indicative of
     future results.
                                       6
|
 |
Appendix 1:
The Underlying Indices

                               [GRAPHIC OMITTED]
                                       7
|
 |
DB Currency Carry Index
Bloomberg Ticker : DBHTG10E

[]   The Carry Index seeks to generate returns by capturing the interest rate
     differential or "carry" between baskets of high-yielding and low-yielding
     currencies.

[]   The Carry Index strategy is based on the view that foreign currency forward
     rates are biased estimators of future foreign currency spot rates, and that
     currencies that trade at a forward discount often outperform currencies
     that trade at a forward premium.

[]   This strategy takes the view that by taking long positions in high-yielding
     currencies and short positions in low-yielding currencies, an investor's
     gain from interest rate differentials in the high- yielding jurisdictions
     will exceed any potential losses from currency exchange rate risk.

[]   Over the last few decades, at particular periods of time, this strategy has
     individually experienced some significant losses. Various market factors
     and circumstances at any time and over any period could cause, and have in
     the past caused, this strategy to fail to perform as expected.

[]   The DB Currency Carry Index strategy is implemented as follows:
     []   Re-balance every 3 months
     []   Rank each currency by its 3-month interest rate
     []   Allocate a 1/3 long position to each of the three currencies with the
          highest 3-month interest rate
     []   Allocate a 1/3 short position to each of the three currencies with the
          lowest 3-month interest rate
     []   Transact forward contracts in each currency to reflect the above

                                       8
|
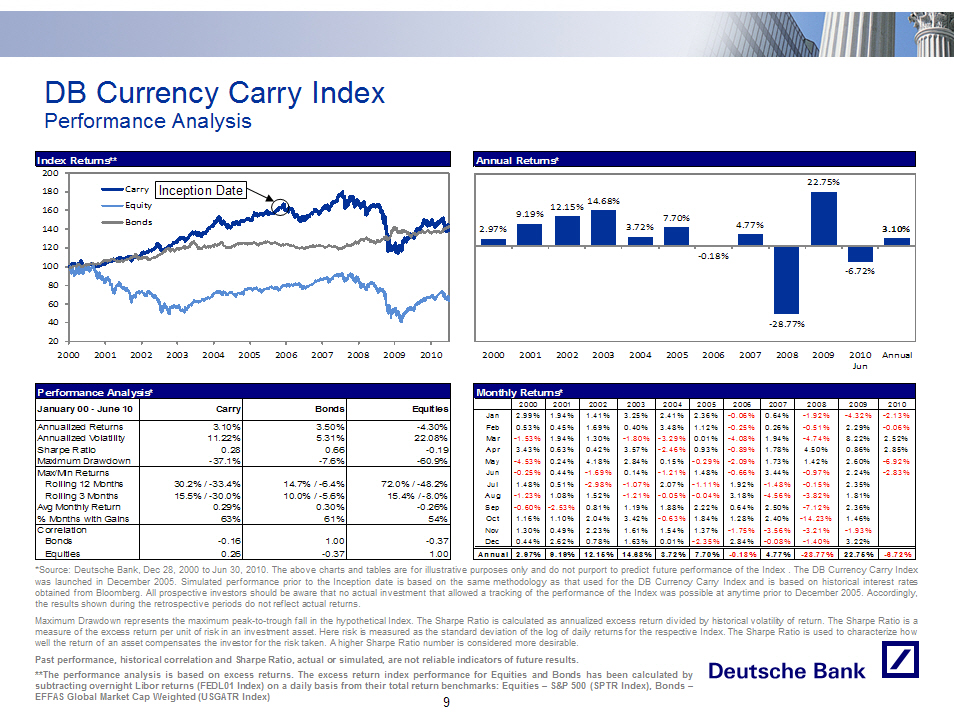 |
DB Currency Carry Index
Performance Analysis

Index Returns**
- ---------------
[GRAPHIC OMITTED]


- --------------------------------------------------------------------------------
Performance Analysis*
- --------------------------------------------------------------------------------
January 00 - June 10           Carry       Bonds         Equities
- --------------------------------------------------------------------------------
Annualized Returns            3.10%         3.50%         -4.30%
Annualized Volatility        11.22%         5.31%         22.08%
Sharpe Ratio                   0.28          0.66          -0.19
Maximum Drawdown             -37.1%         -7.6%         -60.9%
- --------------------------------------------------------------------------------
Max/Min Returns
 Rolling 12 Months    30.2% / -33.4% 14.7% / -6.4% 72.0% / -48.2%
 Rolling 3 Months     15.5% / -30.0% 10.0% / -5.6% 15.4% /  -8.0%
Avg Monthly Return             0.29%         0.30%         -0.26%
% Months with Gains              63%           61%            54%
- --------------------------------------------------------------------------------
Correlation
 Bonds                         -0.16          1.00          -0.37
 Equities                       0.26         -0.37           1.00
- --------------------------------------------------------------------------------


Annual Returns*
- ---------------
[GRAPHIC OMITTED]


- ------------------------------------------------------------------------------------
Monthly Returns*
- ------------------------------------------------------------------------------------
        2000  2001    2002   2003   2004   2005   2006   2007   2008    2009   2010
- ------------------------------------------------------------------------------------
  Jan  2.99%  1.94%  1.41%  3.25%  2.41%  2.36%  -0.06%  0.64%  -1.92% -4.32% -2.13%
  Feb  0.53%  0.45%  1.69%  0.40%  3.48%  1.12%  -0.25%  0.26%  -0.51%  2.29% -0.06%
  Mar -1.53%  1.94%  1.30% -1.80% -3.29%  0.01%  -4.08%  1.94%  -4.74%  8.22%  2.52%
  Apr  3.43%  0.63%  0.42%  3.57% -2.46%  0.93%  -0.89%  1.78%   4.50%  0.86%  2.85%
  May -4.53%  0.24%  4.18%  2.84%  0.15% -0.29%  -2.09%  1.73%   1.42%  2.60% -6.92%
  Jun -0.25%  0.44% -1.69%  0.14% -1.21%  1.48%  -0.66%  3.44%  -0.97%  2.24% -2.83%
  Jul  1.48%  0.51% -2.98% -1.07%  2.07% -1.11%   1.92% -1.48%  -0.15%  2.35%
  Aug -1.23%  1.08%  1.52% -1.21% -0.05% -0.04%   3.18% -4.56%  -3.82%  1.81%
  Sep -0.60% -2.53%  0.81%  1.19%  1.88%  2.22%   0.64%  2.50%  -7.12%  2.36%
  Oct  1.16%  1.10%  2.04%  3.42% -0.63%  1.84%   1.28%  2.40% -14.23%  1.46%
  Nov  1.30%  0.49%  2.23%  1.61%  1.54%  1.37%  -1.75% -3.56%  -3.21% -1.93%
  Dec  0.44%  2.62%  0.78%  1.63%  0.01% -2.35%   2.84% -0.08%  -1.40%  3.22%
====================================================================================
Annual 2.97%  9.19%  12.15% 14.68% 3.72%  7.70%  -0.18% 4.77%  -28.77% 22.75% -6.72%
- ------------------------------------------------------------------------------------
*Source: Deutsche Bank, Dec 28, 2000 to Jun 30, 2010. The above charts and
tables are for illustrative purposes only and do not purport to predict future
performance of the Index. The DB Currency Carry Index was launched in December
2005. Simulated performance prior to the Inception date is based on the same
methodology as that used for the DB Currency Carry Index and is based on
historical interest rates obtained from Bloomberg. All prospective investors
should be aware that no actual investment that allowed a tracking of the
performance of the Index was possible at anytime prior to December 2005.
Accordingly, the results shown during the retrospective periods do not reflect
actual returns.

Maximum Drawdown represents the maximum peak-to-trough fall in the hypothetical
Index. The Sharpe Ratio is calculated as annualized excess return divided by
historical volatility of return. The Sharpe Ratio is a measure of the excess
return per unit of risk in an investment asset. Here risk is measured as the
standard deviation of the log of daily returns for the respective Index. The
Sharpe Ratio is used to characterize how well the return of an asset
compensates the investor for the risk taken. A higher Sharpe Ratio number is
considered more desirable.

Past performance, historical correlation and Sharpe Ratio, actual or simulated,
are not reliable indicators of future results.

**The performance analysis is based on excess returns. The excess return index
performance for Equities and Bonds has been calculated by subtracting overnight
Libor returns (FEDL01 Index) on a daily basis from their total return
benchmarks: Equities -- S and P 500 (SPTR Index), Bonds --EFFAS Global Market Cap
Weighted (USGATR Index)
                                       9
|
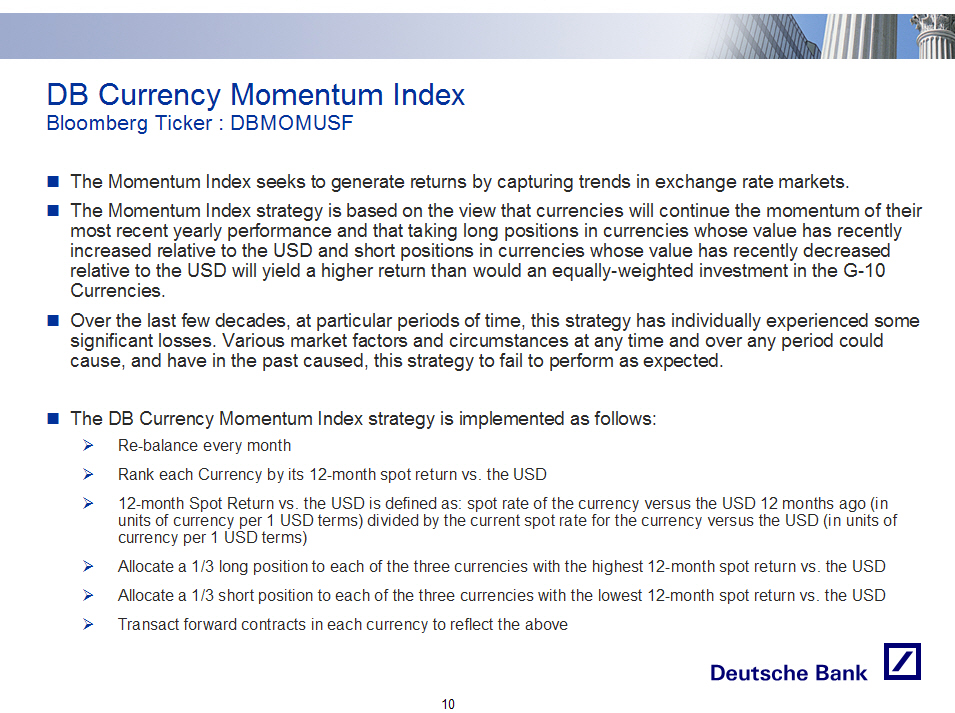 |
DB Currency Momentum Index
Bloomberg Ticker : DBMOMUSF

[]   The Momentum Index seeks to generate returns by capturing trends in
     exchange rate markets.

[]   The Momentum Index strategy is based on the view that currencies will
     continue the momentum of their most recent yearly performance and that
     taking long positions in currencies whose value has recently increased
     relative to the USD and short positions in currencies whose value has
     recently decreased relative to the USD will yield a higher return than
     would an equally-weighted investment in the G-10 Currencies.

[]   Over the last few decades, at particular periods of time, this strategy has
     individually experienced some significant losses. Various market factors
     and circumstances at any time and over any period could cause, and have in
     the past caused, this strategy to fail to perform as expected.

[]   The DB Currency Momentum Index strategy is implemented as follows
     []   Re-balance every month
     []   Rank each Currency by its 12-month spot return vs. the USD
     []   12-month Spot Return vs. the USD is defined as: spot rate of the
          currency versus the USD 12 months ago (in units of currency per 1 USD
          terms) divided by the current spot rate for the currency versus the
          USD (in units of currency per 1 USD terms
     []   Allocate a 1/3 long position to each of the three currencies with the
          highest 12-month spot return vs. the USD
     []   Allocate a 1/3 short position to each of the three currencies with the
          lowest 12-month spot return vs. the USD
     []   Transact forward contracts in each currency to reflect the above

                                       10
|
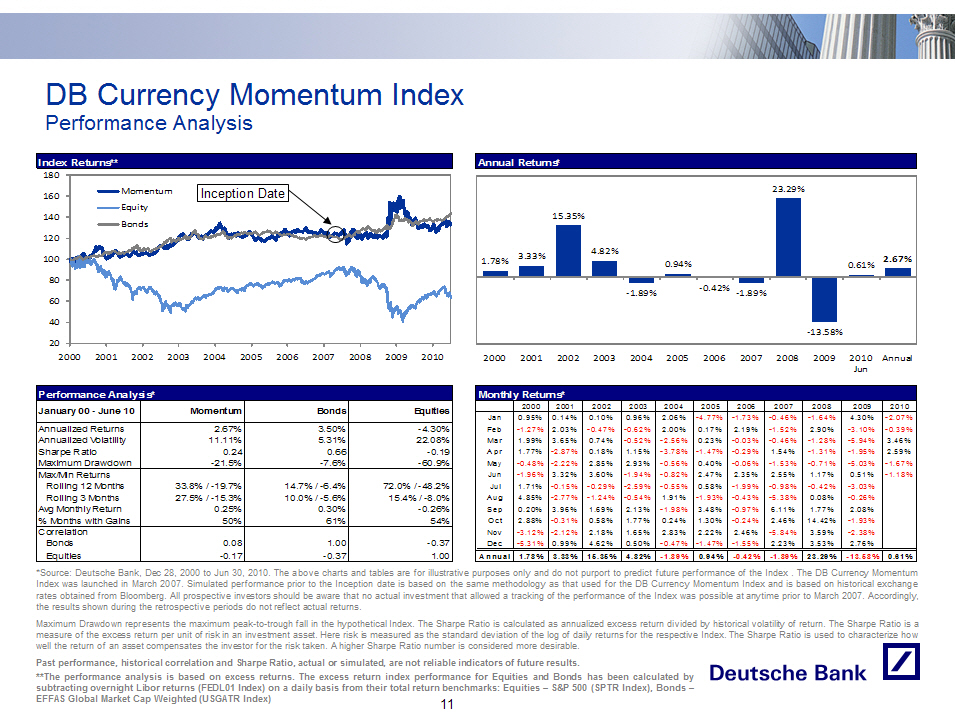 |
DB Currency Momentum Index
Performance Analysis

Index Returns**
- ---------------
[GRAPHIC OMITTED]


- --------------------------------------------------------------------------------
Performance Analysis*
- --------------------------------------------------------------------------------
January 00 - June 10     Momentum          Bonds         Equities
- --------------------------------------------------------------------------------
Annualized Returns            2.67%         3.50%         -4.30%
Annualized Volatility        11.11%         5.31%         22.08%
Sharpe Ratio                   0.24          0.66          -0.19
Maximum Drawdown             -21.5%         -7.6%         -60.9%
- --------------------------------------------------------------------------------
Max/Min Returns
 Rolling 12 Months    33.8% / -19.7% 14.7% / -6.4% 72.0% / -48.2%
 Rolling 3 Months     27.5% / -15.3% 10.0% / -5.6% 15.4% /  -8.0%
Avg Monthly Return             0.25%         0.30%         -0.26%
% Months with Gains              50%           61%            54%
- --------------------------------------------------------------------------------
Correlation
 Bonds                          0.08          1.00          -0.37
 Equities                      -0.17         -0.37           1.00
- --------------------------------------------------------------------------------


Annual Returns*
- ---------------
[GRAPHIC OMITTED]


- ------------------------------------------------------------------------------------
Monthly Returns*
- ------------------------------------------------------------------------------------
        2000   2001   2002   2003  2004    2005   2006   2007   2008   2009    2010
- ------------------------------------------------------------------------------------
  Jan  0.95%  0.14%  0.10%  0.96%  2.06%  -4.77% -1.73% -0.46% -1.64%  4.30%  -2.07%
  Feb -1.27%  2.03% -0.47% -0.62%  2.00%   0.17%  2.19% -1.52%  2.90% -3.10%  -0.39%
  Mar  1.99%  3.65%  0.74% -0.52% -2.56%   0.23% -0.03% -0.46% -1.28% -5.94%   3.46%
  Apr  1.77% -2.87%  0.18%  1.15% -3.78%  -1.47% -0.29%  1.54% -1.31% -1.95%   2.59%
  May -0.48% -2.22%  2.85%  2.93% -0.56%   0.40% -0.06% -1.53% -0.71% -5.03%  -1.67%
  Jun -1.96%  3.32%  3.60% -1.94% -0.82%   2.47%  2.35%  2.55%  1.17%  0.51%  -1.18%
  Jul  1.71% -0.15% -0.29% -2.59% -0.55%   0.58% -1.99% -0.98% -0.42% -3.03%
  Aug  4.85% -2.77% -1.24% -0.54%  1.91%  -1.93% -0.43% -5.38%  0.08% -0.26%
  Sep  0.20%  3.96%  1.69%  2.13% -1.98%   3.48% -0.97%  6.11%  1.77%  2.08%
  Oct  2.88% -0.31%  0.58%  1.77%  0.24%   1.30% -0.24%  2.46% 14.42% -1.93%
  Nov -3.12% -2.12%  2.18%  1.65%  2.83%   2.22%  2.46% -5.84%  3.59% -2.38%
  Dec -5.31%  0.99%  4.62%  0.50% -0.47%  -1.47% -1.55%  2.23%  3.53%  2.76%
====================================================================================
Annual 1.78%  3.33%  15.35% 4.82%  -1.89% 0.94%  -0.42% -1.89% 23.29% -13.58% 0.61%
- ------------------------------------------------------------------------------------
*Source: Deutsche Bank, Dec 28, 2000 to Jun 30, 2010. The above charts and
tables are for illustrative purposes only and do not purport to predict future
performance of the Index . The DB Currency Momentum Index was launched in March
2007. Simulated performance prior to the Inception date is based on the same
methodology as that used for the DB Currency Momentum Index and is based on
historical exchange rates obtained from Bloomberg. All prospective investors
should be aware that no actual investment that allowed a tracking of the
performance of the Index was possible at anytime prior to March 2007.
Accordingly, the results shown during the retrospective periods do not reflect
actual returns.

Maximum Drawdown represents the maximum peak-to-trough fall in the hypothetical
Index. The Sharpe Ratio is calculated as annualized excess return divided by
historical volatility of return. The Sharpe Ratio is a measure of the excess
return per unit of risk in an investment asset. Here risk is measured as the
standard deviation of the log of daily returns for the respective Index. The
Sharpe Ratio is used to characterize how well the return of an asset
compensates the investor for the risk taken. A higher Sharpe Ratio number is
considered more desirable.

Past performance, historical correlation and Sharpe Ratio, actual or simulated,
are not reliable indicators of future results.
**The performance analysis is based on excess returns. The excess return index
performance for Equities and Bonds has been calculated by subtracting overnight
Libor returns (FEDL01 Index) on a daily basis from their total return
benchmarks: Equities -- S and P 500 (SPTR Index), Bonds --EFFAS Global Market Cap
Weighted (USGATR Index)
                                       11
|
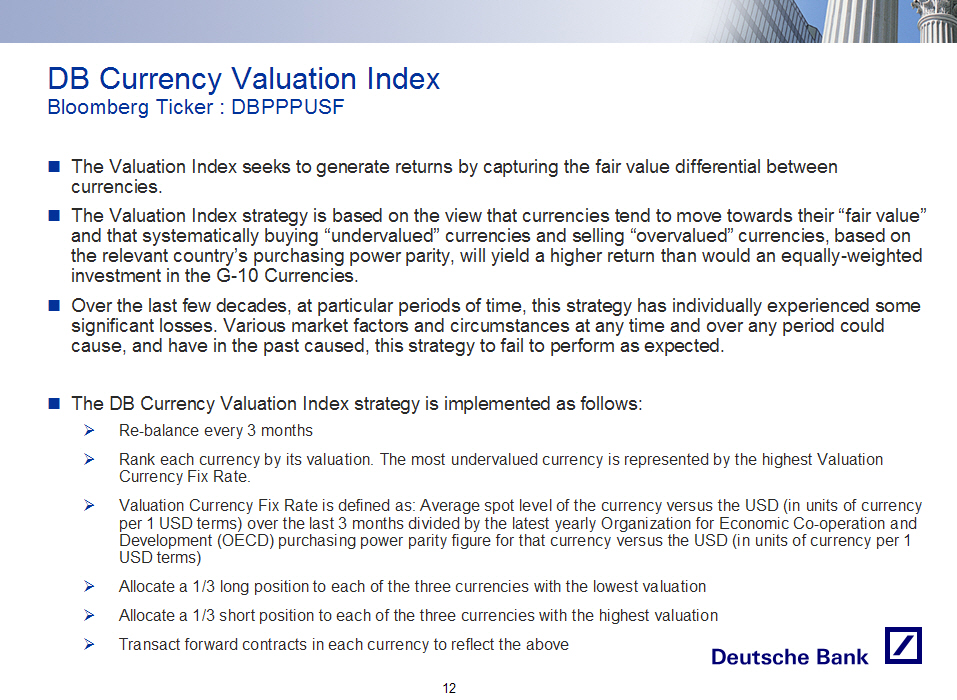 |
DB Currency Valuation Index
Bloomberg Ticker : DBPPPUSF

[]   The Valuation Index seeks to generate returns by capturing the fair value
     differential between currencies.

[]   The Valuation Index strategy is based on the view that currencies tend to
     move towards their "fair value" and that systematically buying
     "undervalued" currencies and selling "overvalued" currencies, based on the
     relevant country's purchasing power parity, will yield a higher return than
     would an equally-weighted investment in the G-10 Currencies.

[]   Over the last few decades, at particular periods of time, this strategy has
     individually experienced some significant losses. Various market factors
     and circumstances at any time and over any period could cause, and have in
     the past caused, this strategy to fail to perform as expected.

[]   The DB Currency Valuation Index strategy is implemented as follows:
     []   Re-balance every 3 months
     []   Rank each currency by its valuation. The most undervalued currency is
          represented by the highest Valuation Currency Fix Rate.
     []   Valuation Currency Fix Rate is defined as: Average spot level of the
          currency versus the USD (in units of currency per 1 USD terms) over
          the last 3 months divided by the latest yearly Organization for
          Economic Co-operation and Development (OECD) purchasing power parity
          figure for that currency versus the USD (in units of currency per 1
          USD terms)
     []   Allocate a 1/3 long position to each of the three currencies with the
          lowest valuation
     []   Allocate a 1/3 short position to each of the three currencies with the
          highest valuation
     []   Transact forward contracts in each currency to reflect the above

                                       12
|
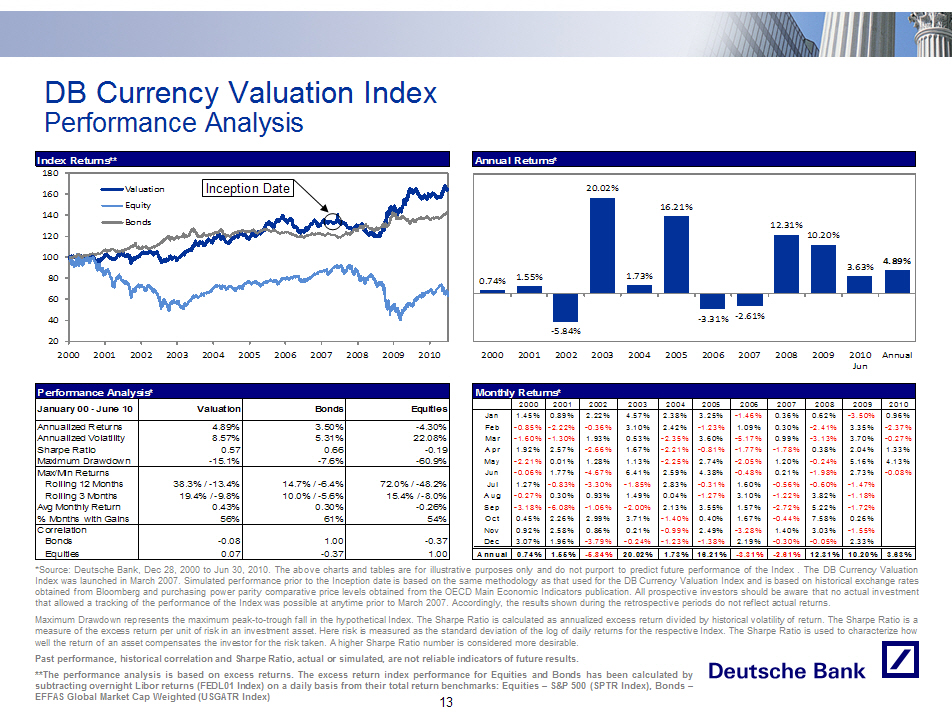 |
DB Currency Valuation Index
Performance Analysis

Index Returns**
- ---------------
[GRAPHIC OMITTED]


- --------------------------------------------------------------------------------
Performance Analysis*
- --------------------------------------------------------------------------------
January 00 - June 10       Valuation       Bonds         Equities
- --------------------------------------------------------------------------------
Annualized Returns            4.89%         3.50%         -4.30%
Annualized Volatility         8.57%         5.31%         22.08%
Sharpe Ratio                   0.57          0.66          -0.19
Maximum Drawdown             -15.1%         -7.6%         -60.9%
- --------------------------------------------------------------------------------
Max/Min Returns
 Rolling 12 Months    38.3% / -13.4% 14.7% / -6.4% 72.0% / -48.2%
 Rolling 3 Months      19.4% / -9.8% 10.0% / -5.6%  15.4% / -8.0%
Avg Monthly Return             0.43%         0.30%         -0.26%
% Months with Gains              56%           61%             54%
- --------------------------------------------------------------------------------
Correlation
 Bonds                         -0.08          1.00          -0.37
 Equities                       0.07         -0.37           1.00
- --------------------------------------------------------------------------------


Annual Returns*
- ---------------
[GRAPHIC OMITTED]


- --------------------------------------------------------------------------------
Monthly Returns*
- --------------------------------------------------------------------------------
        2000   2001  2002    2003   2004   2005   2006  2007    2008   2009   2010
- --------------------------------------------------------------------------------
  Jan   1.45%  0.89%  2.22%  4.57%  2.38%  3.25% -1.46%  0.36%  0.62% -3.50%  0.96%
  Feb  -0.85% -2.22% -0.36%  3.10%  2.42% -1.23%  1.09%  0.30% -2.41%  3.35% -2.37%
  Mar  -1.60% -1.30%  1.93%  0.53% -2.35%  3.60% -5.17%  0.99% -3.13%  3.70% -0.27%
  Apr   1.92%  2.57% -2.66%  1.67% -2.21% -0.81% -1.77% -1.78%  0.38%  2.04%  1.33%
  May  -2.21%  0.01%  1.28%  1.13% -2.25%  2.74% -2.05%  1.20% -0.24%  5.16%  4.13%
  Jun  -0.06%  1.77% -4.67%  6.41%  2.59%  4.38% -0.48%  0.21% -1.98%  2.73% -0.08%
  Jul   1.27% -0.83% -3.30% -1.85%  2.83% -0.31%  1.60% -0.56% -0.60% -1.47%
  Aug  -0.27%  0.30%  0.93%  1.49%  0.04% -1.27%  3.10% -1.22%  3.82% -1.18%
  Sep  -3.18% -6.08% -1.06% -2.00%  2.13%  3.55%  1.57% -2.72%  5.22% -1.72%
  Oct   0.45%  2.26%  2.99%  3.71% -1.40%  0.40%  1.67% -0.44%  7.58%  0.26%
  Nov   0.92%  2.58%  0.86%  0.21% -0.99%  2.49% -3.28%  1.40%  3.03% -1.55%
  Dec   3.07%  1.96% -3.79% -0.24% -1.23% -1.38%  2.19% -0.30% -0.05%  2.33%
================================================================================
Annual 0.74%  1.55%  -5.84% 20.02% 1.73%  16.21% -3.31% -2.61% 12.31% 10.20% 3.63%
- --------------------------------------------------------------------------------
*Source: Deutsche Bank, Dec 28, 2000 to Jun 30, 2010. The above charts and
tables are for illustrative purposes only and do not purport to predict future
performance of the Index . The DB Currency Valuation Index was launched in
March 2007. Simulated performance prior to the Inception date is based on the
same methodology as that used for the DB Currency Valuation Index and is based
on historical exchange rates obtained from Bloomberg and purchasing power
parity comparative price levels obtained from the OECD Main Economic Indicators
publication. All prospective investors should be aware that no actual
investment that allowed a tracking of the performance of the Index was possible
at anytime prior to March 2007. Accordingly, the results shown during the
retrospective periods do not reflect actual returns.

Maximum Drawdown represents the maximum peak-to-trough fall in the hypothetical
Index. The Sharpe Ratio is calculated as annualized excess return divided by
historical volatility of return. The Sharpe Ratio is a measure of the excess
return per unit of risk in an investment asset. Here risk is measured as the
standard deviation of the log of daily returns for the respective Index. The
Sharpe Ratio is used to characterize how well the return of an asset
compensates the investor for the risk taken. A higher Sharpe Ratio number is
considered more desirable.

Past performance, historical correlation and Sharpe Ratio, actual or simulated,
are not reliable indicators of future results.
**The performance analysis is based on excess returns. The excess return index
performance for Equities and Bonds has been calculated by subtracting overnight
Libor returns (FEDL01 Index) on a daily basis from their total return
benchmarks: Equities -- S and P 500 (SPTR Index), Bonds --EFFAS Global Market Cap
Weighted (USGATR Index)
                                       13
|