Deutsche Bank | ||
Annual Report 2022 | ||
Exhibit 99.1

Annual Report
Deutsche Bank | ||
Annual Report 2022 | ||
Deutsche Bank
Financial Summary
2022 | 2021 | |||
Group financial targets | ||||
Post-tax return on average tangible shareholders' equity1 | 9.4% | 3.8% | ||
Common Equity Tier 1 capital ratio | 13.4% | 13.2% | ||
Leverage ratio2 | 4.6% | 4.9% | ||
Statement of Income | ||||
Total net revenues, in € bn. | 27.2 | 25.4 | ||
Provision for credit losses, in € bn. | 1.2 | 0.5 | ||
Total noninterest expenses, in € bn. | 20.4 | 21.5 | ||
Adjusted costs ex-transformation charges, in € bn.3 | 19.8 | 19.6 | ||
Profit (loss) before tax, in € bn. | 5.6 | 3.4 | ||
Profit (loss), in € bn. | 5.7 | 2.5 | ||
Profit (loss) attributable to Deutsche Bank shareholders, in € bn. | 5.0 | 1.9 | ||
Dec 31, 2022 | Dec 31, 2021 | |||
Balance Sheet | ||||
Total assets, in € bn. | 1,337 | 1,324 | ||
Net assets (adjusted), in € bn.4 | 1,019 | 1,002 | ||
Average interest earning assets, in € bn. | 983 | 938 | ||
Loans (gross of allowance for loan losses), in € bn. | 489 | 476 | ||
Average loans (gross of allowance for loan losses), in € bn. | 489 | 446 | ||
Deposits, in € bn. | 621 | 604 | ||
Allowance for loan losses, in € bn. | 4.8 | 4.8 | ||
Shareholders’ equity, in € bn. | 62 | 58 | ||
Resources | ||||
Risk-weighted assets, in € bn. | 360 | 352 | ||
Thereof: operational risk RWA, in € bn. | 58 | 62 | ||
Leverage exposure, in € bn. | 1,240 | 1,125 | ||
Tangible shareholders' equity (tangible book value), in € bn.4 | 56 | 52 | ||
High-quality liquid assets (HQLA), in € bn. | 219 | 207 | ||
Liquidity reserves, in € bn. | 256 | 241 | ||
Employees (full-time equivalent) | 84,930 | 82,969 | ||
Branches | 1,536 | 1,709 | ||
Ratios | ||||
Post-tax return on average shareholders’ equity1 | 8.4% | 3.4% | ||
Cost/income ratio5 | 74.9% | 84.6% | ||
Provision for credit losses as bps of average loans | 25.1 | 11.5 | ||
Loan-to-deposit ratio | 78.6% | 78.9% | ||
Leverage ratio (reported/phase-in) | 4.6% | 4.9% | ||
Liquidity coverage ratio | 142% | 133% | ||
Per Share information | ||||
Basic earnings per share | € 2.42 | € 0.96 | ||
Diluted earnings per share | € 2.37 | € 0.93 | ||
Book value per basic share outstanding4 | € 29.74 | € 27.62 | ||
Tangible book value per basic share outstanding4 | € 26.70 | € 24.73 | ||
1Based on profit (loss) attributable to Deutsche Bank shareholders after AT1 coupon; for further information, please refer to “Supplementary Information (Unaudited): Non-GAAP Financial Measures” of this report
2Starting with the first quarter of 2022, leverage numbers are presented as reported as the fully loaded definition has been eliminated as resulting only in an immaterial difference; comparative information for earlier periods is still based on Deutsche Bank’s earlier fully loaded definition
3The reconciliation of adjusted costs is provided in section “Supplementary Information (Unaudited): Non-GAAP Financial Measures/ Adjusted costs” of this document
4For further information please refer to “Supplementary Information (Unaudited): Non-GAAP Financial Measures” of this report
5Total noninterest expenses as a percentage of net interest income before provision for credit losses, plus noninterest income
Due to rounding, numbers presented throughout this document may not sum precisely to the totals provided and percentages may not precisely reflect the absolute figures.
Deutsche Bank | ||
Annual Report 2022 | ||
Content
1 – | ||||||
Combined Management Report | ||||||
| Operating and Financial Review | ||||||
| Outlook | ||||||
| Risks and Opportunities | ||||||
| Risk Report | ||||||
| Sustainability | ||||||
| Employees | ||||||
| Internal Control over Financial Reporting | ||||||
| Information pursuant to Section 315a (1) of the German Commercial Code and Explanatory Report | ||||||
| Corporate Governance Statement pursuant to Sections 289f and 315d of the German Commercial Code | ||||||
| Standalone parent company information (HGB) | ||||||
| Report on equal treatment and equal pay | ||||||
2 – | ||||||
Consolidated Financial Statements | ||||||
| Consolidated Statement of Income | ||||||
| Consolidated Statement of Comprehensive Income | ||||||
| Consolidated Balance Sheet | ||||||
| Consolidated statement of changes in equity | ||||||
| Consolidated Statement of Cash Flows | ||||||
| Notes to the consolidated financial statements | ||||||
| Notes to the consolidated income statement | ||||||
| Notes to the consolidated balance sheet | ||||||
| Additional Notes | ||||||
| Confirmations | ||||||
3 – | ||||||
Compensation Report | ||||||
| Compensation of the Management Board | ||||||
| Compensation of members of the Supervisory Board | ||||||
| Comparative presentation of compensation and earnings trends | ||||||
| Compensation of the employees (unaudited) | ||||||
4 – | ||||||
Corporate Governance Statement according to sections §289f and §315d of the German Commercial Code/Corporate Governance Report | ||||||
| Management Board and Supervisory Board | ||||||
| Reporting and Transparency | ||||||
| Related Party Transactions | ||||||
| Auditing and Controlling | ||||||
| Compliance with the German Corporate Governance Code | ||||||
5 – | ||||||
Supplementary Information (Unaudited) | ||||||
| Non-GAAP Financial Measures | ||||||
| Declaration of Backing | ||||||
| Group Five-Year Record | ||||||
| Imprint / Publications | ||||||
Deutsche Bank | ||
Annual Report 2022 | ||
Deutsche Bank | ||
Annual Report 2022 | ||
Letter from the Chief Executive Officer
Dear Shareholders,
2022 will be remembered as a sad year by many of us, the year that brought great suffering to many people, in particular in Ukraine, and in which the illusion of a European peace order shattered. It was also a year in which challenges accumulated in a way that we have not seen for decades. Prices for gas and other energy sources surged considerably, the capital markets were, at times, wildly volatile, and inflation escalated in many parts of the world. These are just a few of the main challenges; the list goes on.
In this kind of environment, our clients look to us as a bank to help them hedge their risks, maintain their liquidity and preserve their assets. At the same time, our clients seek our partnership and our advice to be able to continue investing in strategic projects for the future, despite the uncertainty.
Our results for the past year prove that we succeeded at this task. Our clients sought our expertise and did significantly more business with us. Our bank's full-year revenues rose by 7% to € 27.2 billion, a level we have not reached since 2016. Our non-interest expenses once again decreased by 5% to € 20.4 billion, despite inflation-related cost pressure in many areas.
As a result, we increased our pre-tax profit by 65% year on year to € 5.6 billion. This is Deutsche Bank's best result in 15 years and is testament to our resilience in difficult times. Other financial indicators equally underscore this resilience; for example, we succeeded at limiting loan loss provisions to € 1.2 billion, equivalent to 25 basis points of the average loan volume and exactly in the range we had predicted immediately after Russia's invasion of Ukraine. In a volatile year like 2022 especially, this first-class risk management was crucial. In addition, we kept our Common Equity Tier 1 ratio almost consistently above 13%. This gives us the leeway this year to propose a dividend of 30 cents per share to the Annual General Meeting. That would be an increase of 50% over 2021.
Transformation goals achieved by the end of 2022
With the results for 2022, we have demonstrated that our bank is robust and sustainably profitable. This was precisely what we aimed to do when we announced our transformation back in July 2019. We can only focus fully on our clients if our bank is strong and successful.
To get there, we have completed an ambitious programme over the past three and a half years. We have aligned our four business divisions according to their strengths and consistently exited non-strategic business areas. At the same time, we have become much more efficient; we have reduced running costs by more than € 3 billion since 2018.
Nonetheless, our cost-cutting did not come at the expense of investments into our future business. During our transformation, we spent a total of € 15 billion on technology in order to accelerate progress in this essential field. We have invested a further € 4 billion in our control functions, strengthening them and clearing out previous weaknesses. We have made important progress as a result, although we know that there is still work to be done.
We funded all investments in technology and controls from our own resources, as well as the costs of restructuring our bank. Nevertheless, we had sufficient capital buffers at all times during the transformation. Our Common Equity Tier 1 capital ratio exceeded our target of at least 12.5 percent for the entire three and a half years of our transformation. At the end of 2022, it was 13.4%, which means that we met the target we set ourselves in 2019.
The same applies to our other key goals:
- – At 9.4%, our post-tax return on tangible equity at the end of 2022 significantly exceeded our target of 8.0%, which includes a positive valuation effect on deferred tax assets.
- – At 75%, our cost/income ratio was 18 percentage points lower than in 2018 and within the range we announced during the year 2022.
- – Our leverage ratio was 4.6% compared to a target of 4.5%.
II |
Deutsche Bank | ||
Annual Report 2022 | ||
Our business is built on four strong pillars
Besides meeting our financial targets, another ambition was at the heart of our strategic realignment; to make our bank more differentiated and balanced so that each of our four business areas can make a significant contribution to the group's business success. Here, too, we made very good progress. Almost two-thirds of our revenues last year came from the areas that we describe as stable owing to the fact that they are less subject to cyclical fluctuations, the Corporate Bank, the Private Bank and Asset Management.
The biggest growth spurt in 2022 was recorded by the Corporate Bank, which increased its revenues by 23 percent to € 6.3 billion, the highest value since the division was founded. The Corporate Bank benefited from the overall higher interest rate levels, but at the same time it also increased the volume of business. It was especially pleasing to see that all business areas of the Corporate Bank grew significantly.
The Private Bank also had a very successful year. Revenues increased by 11 percent to € 9.2 billion, driven by significant net inflows into assets under management and net new loans in the client business. Even if one-off effects such as the profit from the sale of our financial advisors' network in Italy and the impact of Germany's Federal Court of Justice (BGH) ruling on pricing agreements in 2021 are excluded, earnings still grew by 6 percent. The Private Bank Germany and our International Private Bank contributed in equal measures to this success.
In our Asset Management business, revenues fell by 4 percent to 2.6 billion euros. In view of the extremely challenging market conditions, however, this is a remarkable result. The decline in earnings is primarily attributable to a decline in performance-related fees as a result of price slumps in many markets. By contrast, income from management fees rose slightly. This shows that our clients continued to choose to invest in DWS products despite the negative market environment.
The Investment Bank's results were also impacted by market uncertainty. In the Origination & Advisory business, clients across the world were very restrained. This weighed on the entire financial sector and also caused our earnings in this segment to fall sharply. However, we were able to more than offset this with significantly higher revenues in our Fixed Income & Currencies (FIC) sales and trading business. Overall, the Investment Bank was able to increase its revenues by 4 percent to 10 billion euros.
In addition to these four businesses, our Capital Release Unit (CRU) also made good progress over the past year by further de-risking and significantly reducing our leverage exposure. Since its inception in mid-2019, it has reduced its leverage exposure by more than 90 percent and risk-weighted assets (RWAs) by over 80 percent, excluding operational risk RWAs. The unit has thus fulfilled its mandate over the course of the transformation. From 2023, we will no longer report the CRU as a separate segment as it continues to reduce the remaining positions, one more step that will improve our bank's position among peers.
Outlook
In 2023, we aim to continue to improve and are therefore planning further steps along this path. We aim to increase revenues in 2023 to between € 28 billion and € 29 billion, loan loss provisions and costs are expected to remain essentially flat, which will allow us to continue investing in technology and controls. This year, too, we will have to deal with another volatile and challenging economic and geopolitical environment. While the determined crisis response of the government and the resilience of our companies means that it now looks a lot less likely that a recession will hit Germany or the rest of Europe, the risks are far from over.
Our bank has proven that it has the resilience and stability to survive in difficult times and deliver the best possible performance for our clients. We are once again sustainably profitable, significantly more efficient and have a well-differentiated business model.
Our ambition remains unchanged: we strive to be our clients' Global Hausbank. As their financial partner, risk manager and advisor, we want to support them in whatever way they need, wherever they are in the world. We want to provide the solutions they need to protect against volatility and uncertainties. We want to work with them to develop the blueprint for the digital and sustainable economy of the future.
III |
Deutsche Bank | ||
Annual Report 2022 | ||
The mid-term targets we set ourselves in March 2022 also remain unchanged; by the end of 2025, we are aiming for compound annual revenue growth of 3.5 to 4.5 percent, which should lead us to revenues in excess of € 30 billion. We also want to reduce our cost-income ratio to below 62.5 percent and increase our return on tangible equity to more than 10 percent.
Higher and sustainable profitability should enable us to gradually increase our payouts to you, our shareholders. Last year, we promised you that we would distribute a total of € 8 billion in capital from 2021 to 2025 through dividends and share buybacks, a promise we intend to keep.
We do not consider our progress towards these goals to be an end in itself; this strategy is what enables us to be part of the solution for our clients. It is what allows us to make a positive economic and societal impact. It will be the reason why we will be able to reward our shareholders who have been unswervingly loyal to us.
That is why we come to work every day, to steer our Deutsche Bank towards a successful future. Thank you for placing your trust in us.
Best regards,
 |
Christian Sewing
Chief Executive Officer
Deutsche Bank AG
Frankfurt am Main, March 2023
IV |
Deutsche Bank | ||
Annual Report 2022 | ||
Management Board
Management Board in the reporting year: | |
Christian Sewing, *1970 since January 1, 2015 Chief Executive Officer James von Moltke *1969 since July 1, 2017 President (since March 25, 2022) Chief Financial Officer Karl von Rohr, *1965 since November 1, 2015 President and Head of Private Bank and Asset Management Fabrizio Campelli, *1973 since November 1, 2019 Head of Corporate Bank and Investment Bank Bernd Leukert, *1967 since January 1, 2020 Chief Technology, Data and Innovation Officer Alexander von zur Mühlen, *1975 since August 1, 2020 Regional CEO for Asia Christiana Riley, *1978 since January 1, 2020 Regional CEO for America Rebecca Short, *1974 since May 1, 2021 Chief Transformation Officer Stefan Simon, *1969 since August 1, 2020 Chief Administrative Officer Olivier Vigneron *1971 since May 20, 2022 Risk Officer | Christian Sewing Chief Executive Officer James von Moltke President (since March, 25, 2022) Karl von Rohr President Fabrizio Campelli Bernd Leukert Stuart Lewis (until May 19, 2022) Alexander von zur Mühlen Christiana Riley Rebecca Short Stefan Simon Olivier Vigneron (since May 20, 2022) |
V |
Deutsche Bank | ||
Annual Report 2022 | ||
Letter from the Chairman of the Supervisory Board
Dear Shareholders,
It is a great pleasure for me to present your Supervisory Board’s Annual Report for the first time. 2022 was an intense year for me. After taking over as Chairman in May, I had many discussions with investors, clients, employees, supervisors and politicians, and I was convinced of the strong support for our bank and its strategy. But above all, it was a very successful year for Deutsche Bank: the highest pre-tax result in 15 years and the substantial increase in revenues show that the bank’s consistent transformation and a stronger focus on clients is paying off. We are pleased that the Supervisory Board and the Management Board can propose to you a dividend increase of 50% to € 0.30 per share at this year’s Annual General Meeting. It is a further step towards the substantial distributions that the Management Board is planning for the coming years.
The economic environment in 2022 was marked by major uncertainties, especially due to Russia's war against Ukraine which also contributed to significant economic dislocations - from energy and commodity shortages to high inflation. The Supervisory Board made it a priority to convince ourselves of our bank’s resilience and prudent risk management. The fact that the risk-related costs and provisions in 2022 remain very limited despite all the challenges is evidence of the stability of Deutsche Bank, the high quality of its credit book and the robust management of market risks.
We have also closely followed the further development of the strategy presented by the Management Board in March 2022, together with financial targets for the years to 2025. The Supervisory Board strongly supports the even greater focus on the role of Global Hausbank as it focuses on a holistic partnership with our clients. This is a partnership based on a global network that very few European banks can offer and which is of strategic importance for Europe's economic competitiveness.
Another key element of the future orientation is the bank’s contribution to the sustainable transformation of the economy. Environmental and social issues as well as issues of good corporate governance, summarized with the abbreviation ESG, will continue to shape the financial sector. This is why we decided to discuss sustainability topics together with strategic topics in the future and to extend the mandate of the former Strategy Committee of the Supervisory Board accordingly.
In doing so, we refocused the existing Integrity Committee as a Regulatory Oversight Committee. It oversees the Management Board’s actions with regard to complying with legislation, administrative regulations and internal policies. Deutsche Bank has made significant remediation progress in recent years, but does not meet all of its own and its regulators’ expectations in certain areas yet. For more details on these important issues, see Deutsche Bank‘s Non-Financial Report published in parallel with this Annual Report.
Last year, the Supervisory Board also dealt with personnel decisions. At the Annual General Meeting in 2022, long-standing Management Board member Stuart Lewis stood down and was succeeded by Olivier Vigneron, a high-profile risk manager with many years of experience at US bank JP Morgan and on the Board of Directors of the French institution Natixis. In March last year, the Supervisory Board also decided to appoint a second Deputy Chairman of the Management Board: CFO James von Moltke, alongside Karl von Rohr. This reflects his crucial role in transforming the bank. There were two changes on the Supervisory Board: the Annual General Meeting elected Yngve Slyngstad and me to the Supervisory Board, and the Supervisory Board then appointed me as its Chairman.
At the Annual General Meeting in 2023, four seats designated for shareholder representatives on the Supervisory Board will be voted on. Given the competent and diverse composition of the Board, I am pleased to inform you that there are signs of continuity: the four members whose term of office expires this year will stand for re-election. They are Mayree Clark, John Thain, Michele Trogni and Norbert Winkeljohann. All four have earned a great deal of credit on our Supervisory Board over the past few years and each currently chairs one of our committees, which are crucial to dealing with all the issues in the necessary depth. I would be very pleased to continue working with these esteemed colleagues in the interests of our bank, and I would ask you to support our election proposal at the Annual General Meeting.
This AGM will take place again in digital form. Given that, until the last few months, it was uncertain whether we would face another wave of the Covid pandemic, this seemed to us the most reliable way to provide planning certainty for all sides. At the same time, the experience of the past three years has shown that a virtual AGM has advantages. In particular, it facilitates the participation of shareholders, who might otherwise have to make an expensive journey and is more sustainable.
VI |
Deutsche Bank | ||
Annual Report 2022 | ||
When organizing the digital Annual General Meeting, it goes without saying that we safeguard all shareholders' rights and enable extensive dialog. For example, we will again publish the speeches in advance, and, for the first time, also written answers from the management to questions submitted in advance. This will provide shareholders with additional transparency even before the event and thus form the basis for an in-depth debate at the AGM. And for the future we want to retain the possibility of taking advantage of further virtual events for you. We will therefore ask for your approval at the AGM to allow this option for the next two years. We will inform you about the details in the invitation documents.
Dear Shareholders, in recent years Deutsche Bank has created the right foundation to navigate its clients through geopolitical changes and to support the transformation to a sustainable and digitized economy. We now need to continue to consistently implement the bank’s strategy and to further improve the control systems - but above all to provide comprehensive and holistic support to our clients. The Supervisory Board will continue to support and encourage the Management Board along this path.
As usual, the following Report of the Supervisory Board contains information on how actively the Supervisory Board has been supporting the bank as well as the key issues we worked on in 2022.
VII |
Deutsche Bank | ||
Annual Report 2022 | ||
Report of the Supervisory Board
In the 2022 financial year, the Supervisory Board performed all tasks assigned to it by law, regulatory requirements, Articles of Association and Terms of Reference.
The Management Board reported to us regularly, without delay and comprehensively on all matters with relevance for our bank, and in particular on business policies and strategy, in addition to other fundamental issues relating to the company’s management and culture, corporate planning and control, compliance and compensation systems. It reported to us on the financial development, earnings and risk situation, the bank’s liquidity, capital and risk management, the technical and organizational resources as well as business and events that were of significant importance to the bank. We were involved in decisions of fundamental importance. As in previous years, the Management Board provided us, in accordance with our requests, with enhanced reporting on several topic areas. The Management Board regularly reported to us in this context on the prevention of money laundering and the related controls. We deliberated on these matters intensively and regularly, together with the Management Board and also with external experts. Furthermore, the Supervisory Board received reports on the progress made on the bank’s sustainability strategy and its contribution to achieving global climate objectives. The Supervisory Board Chairman and the committee chairs maintained regular contact with the Management Board between the meetings. They also consulted each other on the agendas of the meetings of the committees they chair and discussed topics of overarching importance for the Supervisory Board. Furthermore, upcoming decisions were deliberated on and prepared in discussions conducted regularly between the Management Board and the Chairman of the Supervisory Board as well as the chairs of the Supervisory Board committees.
There were a total of 59 meetings of the Supervisory Board and its committees. When necessary, resolutions were passed by circulation voting procedure between the meetings. When meetings were convened as video conferences, a room was also available for all members to participate on the bank’s premises in Frankfurt.
Meetings of the Supervisory Board in plenum
The Supervisory Board held eight meetings. Seven were conducted as regularly scheduled, and one was held as an extraordinary meeting. Three meetings were conducted on-site, and five were held as video conferences.
Over the past year, for geopolitical reasons, we focused in particular on the development of the war in Ukraine and its effects on the bank and the economy. Furthermore, we discussed inflation as well as the interest rate policy decisions and their potential impacts on the bank and the overall state of the economy. In addition, we attached special importance again in 2022 to the effective implementation and further development of the bank’s strategy and, together with the Management Board, we deliberated in numerous meetings on these reports and on the regular progress reports we received on the individual business divisions, infrastructure areas and regions. Also, we regularly discussed regulatory topics and proceedings that affect our bank around the world, significant litigation cases and the progress made in the remediation of findings. Furthermore, we addressed appointments of members to the committees as well as the committees’ tasks and adopted the relevant resolutions in this context.
At our first meeting of the year, convened to take place on January 26 and February 2, we analyzed the actual key figures that were submitted and compared them with the plan figures as well as analysts’ consensus estimates. Deviations were discussed in detail. We discussed the reactions of the capital market and analysts to the publication of our preliminary results for 2021 as well as the bank’s progress on its transformation and sustainability, and we agreed with the Management Board’s preliminary proposal for the dividend, while also taking into account the regulatory requirements for capital funding. We noted the Corporate Governance Statement pursuant to Section 289f of the German Commercial Code (HGB) with approval. Furthermore, we agreed to the issuance of Additional Tier 1 capital instruments on the basis of the authorization granted by the General Meeting on May 24, 2018. We addressed topics of the forthcoming investor day event and received a report on current developments in the business divisions, the infrastructure functions and the regions North America and Asia-Pacific. While taking into account recommendations of the Compensation Control Committee as well as following consultations with the bank’s Compensation Officer and independent external compensation consultants, we determined the level of the variable compensation for the Management Board members for the 2021 financial year. In this context, we also discussed the respective Management Board members’ achievement levels for 2021 and set long-term objectives for the Management Board along with criteria to measure the variable compensation for 2022. We also discussed the possible topics for the Supervisory Board’s training measures for the ongoing financial year.
VIII |
Deutsche Bank | ||
Annual Report 2022 | ||
At our second meeting, which was convened for March 10 and 25, we addressed the strategic financial and capital planning at the Group level for the years 2022 to 2026. After the Management Board’s reporting and a discussion with the auditor and based on the Audit Committee’s recommendation, we approved the Consolidated Financial Statements and Annual Financial Statements for 2021 and agreed to the Management Board’s proposal for the appropriation of distributable profit. We addressed the financial accounting system, the system of internal controls and the risk management system and discussed the assessments of the Management Board and auditor of their appropriateness and effectiveness. The Management Board agreed to report regularly to the Audit Committee on the planned measures for further improvement. Based on the Audit Committee’s recommendation, we determined that there are no objections to be raised regarding the Group’s separate Non-Financial Report in accordance with Section 315b of the German Commercial Code (HGB) and the Non-Financial Statement in accordance with Section 289b HGB, also based on the final results of the Supervisory Board’s own inspections. The Management Board presented a report to us on the structure of the compensation systems and the Human Resources Report for 2021, and we discussed and approved the Report of the Supervisory Board and received a follow-up report on the bank’s operations in Russia, including an assessment of the business and risk. Furthermore, we addressed the topics for the General Meeting, approved proposals for the agenda and for accommodating shareholder rights, and agreed to the concept for the virtual General Meeting. We received a report on the progress made on executing the bank’s strategy, an overview of the priorities for 2022 and a summary of the investor day event, including feedback from stakeholders, analysts and the market. In addition, the Management Board reported on the progress made in the Asia-Pacific region. We analyzed the development of financial crime risks and reviewed the appropriateness of our monitoring activities in this context, in particular in connection with the remediation of findings in the area of the prevention of financial crime. Our external advisors stated that we engaged in an appropriately intensive handling of this matter and established appropriate structural measures to supervise the remediation of findings on financial crime and money laundering risks. Based on the recommendation of the shareholder representatives of the Nomination Committee, we resolved to nominate Mr. Alexander Wynaendts and Mr. Yngve Slyngstad for election to the Supervisory Board at the General Meeting, in each case for the period until the end of the General Meeting that resolves on the ratification of the acts of management for the 2025 financial year. Furthermore, we addressed the Management Board’s compensation and the objectives of the individual Management Board members for 2022.
At our meeting on May 18, representatives of the Joint Supervisory Team responsible for the bank reported to us on the Supervisory Review and Evaluation Process (SREP) 2021 along with the key observations from this process for our bank. We discussed the regulatory priorities for the years 2022-2024 as well as the bank’s progress in its transformation and the existing challenges. In addition, we addressed the forthcoming General Meeting including the intended subsequent election of Mr. Alexander Wynaendts as Chairman of the Supervisory Board. We noted the report of the Management Board on changes in the regional advisory councils in Germany in accordance with Section 8 of the Articles of Association.
At our meeting on May 19 directly following the General Meeting, we elected Mr. Alexander Wynaendts as Chairman of the Supervisory Board. In accordance with the Terms of Reference, as the Chairman of the Supervisory Board he also became Chairman of the Chairman’s Committee, Compensation Control Committee and Mediation Committee. Furthermore, he became a member of the Audit Committee, Risk Committee, Nomination Committee, Integrity Committee, Technology, Data and Innovation Committee, as well as the Strategy Committee. Furthermore, we elected Professor Dr. Norbert Winkeljohann, with effect from the effectiveness of the amendment to the Articles of Association approved by resolution of the General Meeting 2022, as second Deputy Chairman of the Supervisory Board. Furthermore, we resolved to issue the audit mandate to Ernst & Young (EY), who had been elected by the General Meeting as the auditor of the annual and consolidated financial statements. In addition, we resolved to amend the Business Allocation Plan for the Management Board on the basis of its changed composition.
At an extraordinary meeting held on June 27, we received a summarizing presentation of recent developments at DWS, the measures taken and the special circumstances of the legal entity structure. We intensively discussed the situation at the time and made arrangements to deliberate again on the facts of the matter in detail at a later date.
At our meeting on July 28, we analyzed feedback from the market, analysts and stakeholders on the publication of the interim report on the first half of the year. We intensively addressed the strategy and the progress in the bank’s transformation. Furthermore, the Management Board reported on the results of the employee survey 2022, various regulatory and legal topics as well as observations from the new Chief Risk Officer after his first 100 days in office. We discussed current developments at DWS, the development of its business, its governance and measures taken by its management relating to the ongoing investigations. In addition, we deliberated on the sustainability strategy and the bank’s planned sustainability day event. Moreover, the shareholder representatives on the Supervisory Board adopted the resolutions necessary in accordance with Section 32 of the Co-Determination Act (MitbestG). We noted the adjustment to the Directors and Officers’ (D&O) insurance through the removal of the deductible for Supervisory Board members in the context of the amendment to the bank’s Articles of Association, and we adopted changes to the Business Allocation Plan and adjustments to the topics the committees focus on as well as their terms of reference. In this context, we approved the renaming of the Integrity Committee to “Regulatory Oversight Committee”, also to sharpen the focus of its tasks. We also approved the inclusion of Environmental, Social and Governance (ESG) criteria among the Strategy Committee’s tasks in advising and monitoring the Management Board in setting out the bank’s business strategies. Furthermore, we reassigned the regular review of the utility and effectiveness of measures available in the compensation system in connection with breaches of legal norms as well as internal and external rules and policies from the Integrity Committee, now the Regulatory Oversight Committee, to the Compensation Control Committee. In addition, we added the promotion of talent development and diversity to the Terms of Reference for the Nomination Committee, with a special focus in this context on succession planning for the Management Board and the development of proposals for appointments to Supervisory Board committees. The Supervisory Board elected Mr. Frank Witter as Chairman of the Audit Committee, Professor Dr. Norbert Winkeljohann as Chairman of the Compensation Control Committee, and Mr. Alexander Wynaendts as Chairman of the Nomination Committee. Furthermore, we elected Ms. Manja Eifert as member of the Audit Committee and Mr. Stefan Viertel as member of the Strategy Committee. We elected Mr. Yngve Slyngstad as member of the Technology, Data and Innovation Committee, while Mr. Frank Witter and Mr. Timo Heider left this same Committee. Furthermore, we addressed the Management Board’s compensation.
IX |
Deutsche Bank | ||
Annual Report 2022 | ||
On October 26 and 27, we intensively addressed the bank’s strategy and the status of its transformation from the perspective of the individual business divisions. We discussed the current global economic situation, mid-term outlook and effects on the bank and deliberated on the strategic priorities up to 2025 as well as the draft of strategic planning for the years 2023-2027. In addition, we received a report on the reactions of the market, stakeholders and analysts to the publication of our business figures and we discussed key people and succession planning for the Management Board. We addressed the development of business at DWS as well as the current status of investigations and proceedings. Furthermore, we noted with approval the presented structured approach for the interaction and communications between the Management Board and Supervisory Board and regulators, and we approved communicating with regulators in accordance with the presented structured approach to communications. In addition, we approved the Declaration of Conformity pursuant to Section 161 of the German Stock Corporation Act (AktG).
At our meeting on December 15, we again intensively addressed key people and succession planning for the Management Board. Furthermore, we received a report on the current development of the bank’s business and noted with approval the updated strategic financial and capital plan for the years 2023-2027. We received a report from the Management Board on the development of the key performance indicators for the Deutsche Bank share, the interactions with capital market participants and the feedback received. We also agreed to the proposal of a virtual General Meeting in 2023 and addressed progress in the bank’s Capital Release Unit (CRU). We addressed the independence of the members of the Audit Committee and stated who our Audit Committee financial experts are and who our Compensation Control Committee compensation experts are. We extensively reviewed our internal policies and procedures as well as the position descriptions for the Management Board and Supervisory Board and adjusted the Terms of Reference for the Audit Committee and Chairman’s Committee. Furthermore, we changed the name of the Strategy Committee to “Strategy and Sustainability Committee”, in order to make the additional focus on sustainability as one of its tasks clearer externally.
Committees of the Supervisory Board
The members of the individual committees and the changes during the financial year are specified in the Annual Report in the Corporate Governance Statement.
The Chairman’s Committee met 13 times in 2022. Three meetings were conducted on-site, and ten were held as video conferences. The Committee addressed Management Board and Supervisory Board matters in depth, in addition to corporate governance and ongoing topics between the meetings of the Supervisory Board as well as the preparations for them. This included comprehensive handling of the extension of Management Board appointments in consultation with the Nomination Committee, the preparation of the revised versions of our terms of reference as well as topics in preparation for the General Meeting. The Chairman’s Committee also addressed the meeting schedule, our training measures, the introduction of the new dataroom for the Supervisory Board as well as a range of special issues. The Committee furthermore addressed the mandates of the Management Board members, the assumption of the expenses of (former) members of the Management Board and the bank’s issuing of Tier 1 capital instruments.
At its six meetings in 2022, three conducted as on-site meetings and three as video conferences, the Risk Committee continued its regional review of the risk appetite in alignment to the bank’s strategy and it focused in particular on the regions China and Latin America. As another focal point, it addressed the ongoing war between Russia and Ukraine that started at the beginning of 2022. With regard to the resulting risks, the Committee looked into, in particular, credit, market, treasury, cyber, operational, technological and Anti-Financial Crime (AFC)-related risks. Macroeconomic developments and the energy supply of Germany and its companies were also in focus in this context. Furthermore, the Committee addressed the most important core transformation initiatives of the bank relating to the Risk function. With regard to the regulators’ priorities, the Committee focused on the bank’s risk management in general, its risk culture, prudent valuation, non-financial risks and the topic of sustainability. The latter was also addressed extensively in the context of the regulatory stress testing of climate risks by the European Banking Authority (EBA). Furthermore, the Committee addressed the general framework for risk-related policies and procedures and the capital planning for individual business divisions. The Committee also had reports given to it on selected topics, including the Leveraged Lending business and the bank’s Capital Release Unit (CRU).
X |
Deutsche Bank | ||
Annual Report 2022 | ||
The Audit Committee met six times in 2022. Two meetings were conducted on-site, and four meetings were held as video conferences. The focal points of the Committee’s work were, in particular, on addressing the impacts of the war in Ukraine on accounting matters and in particular in this context the level of the provision for credit losses and the measurement of financial instruments. Furthermore, the Committee regularly addressed the monitoring of the effectiveness of the control functions (in particular, Compliance, Anti-Money Laundering function, Group Audit). Monitoring the Management Board in the remediation of findings related to the Know-Your-Customer (KYC) processes was another focal point of the Committee’s work, in addition to the Findings Management program for the accelerated reduction of critical findings. In addition, the Committee addressed, against the backdrop of Wirecard’s insolvency, the implications for the auditor of our financial statements, in particular with regard to the auditor’s independence.
The Nomination Committee met six times. One meeting was conducted on-site, and five meetings were held as video conferences. In 2022, the Nomination Committee extensively addressed succession planning for the Management Board and Supervisory Board in consideration of the statutory and regulatory requirements. In this context, it prepared in consultation with the Chairman’s Committee the renewal of Management Board appointments pending in 2022. Furthermore, the Committee resolved to recommend, based on recommendations of the shareholder representatives, that the Supervisory Board propose Mr. Yngve Slyngstad for election to the Supervisory Board at the General Meeting. In addition, the Committee addressed the composition of the Supervisory Board committees, the induction of new members of the Supervisory Board and of the Management Board, the further development of the Management Board’s training measures, the regular review of our internal policies and procedures, as well as topics related to the (“fit and proper”) suitability of members of the Supervisory Board and Management Board. Other topics included the annual assessment of the Supervisory Board and Management Board, the statutory changes related to the target value for the percentage of women on the Management Board and the advancement of diversity among the bank’s senior managers.
The Compensation Control Committee met six times in 2022. Two meetings were conducted on-site, and four meetings were held as video conferences. At its meetings, the Committee focused in particular on monitoring the structure of the compensation systems for the Management Board and for employees. The Committee submitted proposals for the objectives for the year 2022 and for determining the variable compensation of the Management Board for the year 2021. The Committee also addressed one personnel-related change on the Management Board with a corresponding adjustment of the individual objectives. Furthermore, it dealt with the regulatory developments and regulatory findings on compensation topics and addressed the examination of the existence of the preconditions for the suspension, forfeiture or claw-back of elements of the variable compensation of (former) members of the Management Board. To the extent required, it adopted resolutions and developed recommendations on resolution proposals for the Supervisory Board plenum. Through the adjustment to the Terms of Reference in July 2022, the Committee also took on the topic of Consequence Management. Another focal point was addressing the Compensation Report on the compensation of the Management Board and Supervisory Board. Based on changed statutory requirements pursuant to the Shareholder Rights Directive Implementation Act II (ARUG II) and Section 162 of the German Stock Corporation Act (AktG), this was to be submitted – for the first time – for approval by the General Meeting 2022 and was subsequently to be published along with the auditor’s opinion. Furthermore, the Committee monitored the identification of Material Risk Takers and the determination of the total amount of variable compensation for the 2021 financial year as well as the decisions on the compensation for the heads of the Compliance and Risk functions.
The Integrity Committee met four times in the period from January 1, 2022, to July 27, 2022. All of these meetings took place on-site. The Committee’s work focused on the topics of corporate culture, Environmental, Social and Governance (ESG) issues, preventive compliance control, legal and regulatory proceedings, as well as Human Resources practices and Consequence Management.
On July 28, 2022, we resolved to change the name of the Integrity Committee to Regulatory Oversight Committee and to revise some of the tasks set out in its Terms of Reference. The Committee met twice in 2022 with its newly defined tasks. One meeting took place on-site and the other as a video conference. The tasks addressed by the Regulatory Oversight Committee no longer include the topics of corporate culture, Environmental, Social and Governance (ESG) issues, Human Resources practices and Consequence Management. In accordance with the Committee’s new name, the Regulatory Oversight Committee was informed by the Management Board on an ongoing basis about contacts with regulators with a significant relevance for the bank’s business activities and especially about special audits, substantial complaints and other exceptional measures on the part of German and foreign bank regulatory authorities, to the extent they do not relate to financial reports or audit matters. In addition, reports were given to the Committee at its meetings on significant internal investigations and their progress. In parallel, the Regulatory Oversight Committee continues to deal with preventive compliance controls and litigation cases with the highest risks from the bank’s perspective.
XI |
Deutsche Bank | ||
Annual Report 2022 | ||
The Strategy and Sustainability Committee (until December 15, 2022: the Strategy Committee) met three times. Two meetings were conducted on-site, and one meeting was held as a video conference. At its meetings, the Committee intensively addressed the bank’s strategic transformation and further development. In this context, it tracked the progress made on the strategic objectives set for the end of the year 2022 as well as the strategic and financial plans up to the year 2025 that were presented at the investor day event in March 2022. The Committee received reports on the strategic alignment of the Group and the competitive environment, the portfolio of key business units as well as the progress made on the most important core transformation initiatives. Other topics in focus were addressing the bank’s digital strategy and its strategy with regard to financial technology companies (fintechs), the strategies for the regions North America and Asia-Pacific as well as the strategic view of DWS.
The Technology, Data and Innovation Committee met five times. Three meetings were conducted on-site, and two meetings were held as video conferences. Due to the war in Ukraine, the Committee regularly addressed in 2022 the technology centers in Russia, the potential impacts on cyber and information security, the transfer of employees to the Technology Center in Berlin as well as the impact of these developments on the bank’s technology-related change-the-bank portfolio. Also, the Committee had reports given to it, besides the ones on these political developments, on the progress in strategy execution and the testing concept in the cybersecurity area. Other areas of focus in 2022 were on data management topics, the cloud transformation and the retail banking platform. In March, an extensive data workshop took place in which a new strategy to achieve the bank’s data objectives was discussed. Building on this, the Committee had reports given to it regularly on the progress made and newly identified challenges. With regard to the cloud transformation program, the Committee received reports regularly on the applications transferred to and the newly generated capabilities in the cloud. Furthermore, the adjusted business plan was presented to the Committee at the end of the year. With regard to the retail banking platform, the Committee extensively discussed the progress of the migration and the challenges related to the timetable. In addition, the Committee discussed the technology in the Anti-Financial Crime (AFC), Risk, Finance and Treasury areas as well as the sales and distribution technology across all client segments. Other topics addressed were developments in the Payments area, including strategic changes along with the remediation of audit findings, the bank’s front-to-back initiatives, with a special focus on loans, as well as the modernization of the IT platform and the related benefits. Furthermore, the Committee addressed the technology and data roadmap of the legal entities in the USA and its integration into the Group-wide IT strategy.
Meetings of the Mediation Committee, established pursuant to the provisions of Germany’s Co-Determination Act (MitbestG), were not necessary.
XII |
Deutsche Bank | ||
Annual Report 2022 | ||
Participation in meetings
The Supervisory Board members participated in the meetings of the Supervisory Board and of the committees in which they were members as shown in the following. Participation was either in person or per video conference. There was no case of participation by telephone.
| Plenum | Chairman’s | Risk | Audit | Nomination | |||||
No. of meetings / | Number / in % | Number / in % | Number / in % | Number / in % | Number / in % | |||||
Dr. Paul Achleitner | 3 / 3 | 100% | 6 / 7 | 86% | 3 / 3 | 100% | 3 / 3 | 100% | 3 / 3 | 100% |
Alexander Wynaendts | 5 / 5 | 100% | 6 / 6 | 100% | 3 / 3 | 100% | 3 / 3 | 100% | 3 / 3 | 100% |
Ludwig Blomeyer-Bartenstein | 8 / 8 | 100% | 6 / 6 | 100% | ||||||
Mayree Clark | 8 / 8 | 100% | 6 / 6 | 100% | 6 / 6 | 100% | ||||
Jan Duscheck | 8 / 8 | 100% | 6 / 6 | 100% | ||||||
Manja Eifert | 6 / 6 | 100% | 2 / 2 | 100% | ||||||
Dr. Gerhard Eschelbeck | 3 / 3 | 100% | ||||||||
Sigmar Gabriel | 8 / 8 | 100% | ||||||||
Timo Heider | 8 / 8 | 100% | ||||||||
Martina Klee | 8 / 8 | 100% | ||||||||
Henriette Mark | 2 / 2 | 100% | 2 / 2 | 100% | ||||||
Gabriele Platscher | 7 / 8 | 88% | 6 / 6 | 100% | ||||||
Detlef Polaschek | 6 / 8 | 75% | 11 / 13 | 85% | 6 / 6 | 100% | 6 / 6 | 100% | ||
Bernd Rose | 7 / 8 | 88% | 5 / 6 | 83% | ||||||
Yngve Slyngstad | 5 / 5 | 100% | ||||||||
John Thain | 8 / 8 | 100% | ||||||||
Michele Trogni | 8 / 8 | 100% | 6 / 6 | 100% | ||||||
Dr. Dagmar Valcárcel | 8 / 8 | 100% | 6 / 6 | 100% | ||||||
Stefan Viertel | 7 / 8 | 88% | 5 / 6 | 83% | 5 / 6 | 83% | ||||
Dr. Theodor Weimer | 8 / 8 | 100% | 6 / 6 | 100% | ||||||
Frank Werneke | 8 / 8 | 100% | 12 / 13 | 92% | 6 / 6 | 100% | ||||
Professor Dr. Norbert Winkeljohann | 8 / 8 | 100% | 11 / 13 | 85% | 6 / 6 | 100% | 6 / 6 | 100% | 6 / 6 | 100% |
Frank Witter | 8 / 8 | 100% | 5 / 6 | 83% | ||||||
Total | 97% | 88% | 98% | 95% | 100% | |||||
XIII |
Deutsche Bank | ||
Annual Report 2022 | ||
| Compensation | Regulatory Oversight Committee | Strategy and Sustainability Committee | Technology, Data and Innovation Committee | Total | |||||
No. of meetings / | Number / in % | Number / in % | Number / in % | Number / in % | Number / in % | |||||
Dr. Paul Achleitner | 4 / 4 | 100% | 3 / 3 | 100% | 1 / 1 | 100% | 2 / 2 | 100% | 28 / 29 | 97% |
Alexander Wynaendts | 2 / 2 | 100% | 3 / 3 | 100% | 2 / 2 | 100% | 3 / 3 | 100% | 30 / 30 | 100% |
Ludwig Blomeyer-Bartenstein | 6 / 6 | 100% | 20 / 20 | 100% | ||||||
Mayree Clark | 3 / 3 | 100% | 23 / 23 | 100% | ||||||
Jan Duscheck | 5 / 5 | 100% | 19 / 19 | 100% | ||||||
Manja Eifert | 8 / 8 | 100% | ||||||||
Dr. Gerhard Eschelbeck | 2 / 2 | 100% | 5 / 5 | 100% | ||||||
Sigmar Gabriel | 6 / 6 | 100% | 14 / 14 | 100% | ||||||
Timo Heider | 6 / 6 | 100% | 3 / 3 | 100% | 17 / 17 | 100% | ||||
Martina Klee | 5 / 5 | 100% | 13 / 13 | 100% | ||||||
Henriette Mark | 1 / 1 | 100% | 5 / 5 | 100% | ||||||
Gabriele Platscher | 6 / 6 | 100% | 19 / 20 | 95% | ||||||
Detlef Polaschek | 6 / 6 | 100% | 3 / 3 | 100% | 38 / 42 | 90% | ||||
Bernd Rose | 5 / 6 | 83% | 4 / 5 | 80% | 21 / 25 | 84% | ||||
Yngve Slyngstad | 2 / 2 | 100% | 7 / 7 | 100% | ||||||
John Thain | 3 / 3 | 100% | 11 / 11 | 100% | ||||||
Michele Trogni | 3 / 3 | 100% | 5 / 5 | 100% | 22 / 22 | 100% | ||||
Dr. Dagmar Valcárcel | 6 / 6 | 100% | 6 / 6 | 100% | 26 / 26 | 100% | ||||
Stefan Viertel | 1 / 1 | 100% | 18 / 21 | 86% | ||||||
Dr. Theodor Weimer | 14 / 14 | 100% | ||||||||
Frank Werneke | 6 / 6 | 100% | 3 / 3 | 100% | 35 / 36 | 97% | ||||
Professor Dr. Norbert Winkeljohann | 2 / 2 | 100% | 39 / 41 | 95% | ||||||
Frank Witter | 13 / 14 | 93% | ||||||||
Total | 97% | 100% | 100% | 97% | 96% | |||||
XIV |
Deutsche Bank | ||
Annual Report 2022 | ||
Corporate Governance
The composition of the Supervisory Board and its committees is in accordance with the requirements of the law as well as regulatory governance standards. The European Central Bank reviews and confirmed the professional qualifications and the personal reliability of our members within the framework of its “fit and proper” assessment. The suitability assessment covers the expertise, reliability and time available of each individual member. In addition, there was an assessment of the entire Supervisory Board’s knowledge, skills and experience that are necessary for the performance of its tasks (collective suitability). The European Central Bank’s Joint Supervisory Team (JST) and the Nomination Committee continually monitor the suitability of the Supervisory Board members.
The Chairman of the Supervisory Board and the chairpersons of all the committees coordinated their work continually and consulted each other regularly and – as required – on an ad hoc basis between the meetings in order to ensure the exchange of information necessary to capture and assess all relevant case matters and risks in the performance of their tasks. The cooperation in the committees was marked by an open and trustful atmosphere.
The committee chairpersons reported regularly at the meetings of the Supervisory Board on the work of the individual committees. Regularly before the meetings of the Supervisory Board, the representatives of the employees and the representatives of the shareholders conducted preliminary discussions separately. At the beginning or end of the meetings of the Supervisory Board and its committees, discussions were regularly held in “Executive Sessions” without the participation of the Management Board.
The Chairman of the Supervisory Board and the chairpersons of the committees engaged regularly in discussions with representatives of various regulators and informed them about the work of the Supervisory Board and its committees and about the cooperation with the Management Board.
Together with the bank’s Investor Relations Department, the Supervisory Board Chairman conducted discussions with investors, proxy advisors and shareholders’ associations. The subjects of the discussions were governance and strategy topics from the Supervisory Board’s perspective, questions of appointments and succession planning, the bank’s control processes, Management Board compensation, and the Supervisory Board’s view of the bank’s Environmental, Social and Governance (ESG) strategy.
At several meetings of the Nomination Committee and of the Supervisory Board in plenum, we addressed the assessment prescribed by law of the Management Board and the Supervisory Board for the 2022 financial year, which also comprises the self-assessment according to the German Corporate Governance Code. The final discussion of the results took place at a meeting of the Supervisory Board plenum on February 1, 2023, and the results were set out in a final report.
For further information, for example, on the Audit Committee financial experts, the compensation experts and the independence of the individual members, we refer to the “Supervisory Board” section in the Corporate Governance Statement.
The Declaration of Conformity pursuant to Section 161 of the Stock Corporation Act (AktG), which we had last issued with the Management Board in October 2021, was reissued in October 2022. The text of the Declaration of Conformity, along with a comprehensive presentation of the bank’s corporate governance, can be found in the Annual Report and on the bank’s website at https://www.db.com/ir/en/documents.htm. Our Declarations of Conformity and Corporate Governance Statements of the past five years are also available there, in addition to the currently applicable versions of the Terms of Reference for the Supervisory Board and its committees as well as for the Management Board.
Training and further education measures
We held several training sessions in 2022, as in the prior years. They were conducted in most cases by external subject matter experts, but also by internal experts. In accordance with our adjusted Profile of Requirements for Supervisory Board members, the training topics we focused on in 2022 were cybersecurity, combating of financial crime, introduction of the digital euro and sustainability management in global banks. Furthermore, we received an update on global macroeconomic developments as well as regulatory requirements.
For the new members that joined the Supervisory Board, extensive induction courses tailored to them individually were developed and carried out to facilitate their induction into office.
XV |
Deutsche Bank | ||
Annual Report 2022 | ||
Conflicts of interest and their handling
To prevent a potential conflict of interest with his function as Chief Executive Officer of Deutsche Börse AG, Dr. Theodor Weimer did not participate in discussions regarding the topic of euro clearing.
Mr. Frank Witter had informed us in 2021 that he was party to a class action against Ernst & Young (EY) to assert claims to compensation for damages due to losses incurred from a Wirecard bond. Through in-depth discussions with Mr. Frank Witter, the Supervisory Board was able to assure itself that the resulting potential conflict of interest does not stand in the way of an unrestricted participation on the Supervisory Board and Audit Committee. Over the course of 2022, Mr. Frank Witter withdrew from the legal action, so that the potential conflict of interest no longer exists.
Annual Financial Statements, Consolidated Financial Statements, and the combined separate Non-Financial Report and Compensation Report
EY audited the Annual Financial Statements, including the accounting and the Combined Management Report for the Annual Financial Statements and Consolidated Financial Statements for the 2022 financial year and issued in each case an unqualified audit opinion on March 13, 2023. The Auditor’s Reports were signed jointly by the Auditors Mr. Mai and Mr. Lösken.
Furthermore, EY performed a limited assurance review in the context of the combined separate Non-Financial Report as well as the Non-Financial Statement (Non-Financial Reporting) and in each case issued an unqualified opinion. EY issued a separate unqualified opinion for the Compensation Report.
The Audit Committee examined the documents for the Annual Financial Statements 2022 and Consolidated Financial Statements 2022 as well as the Non-Financial Reporting 2022 at its meeting on March 14, 2023. Representatives of EY provided the final report on the audit results. The Chairman of the Audit Committee reported to us on this at the meeting of the Supervisory Board. Based on the recommendation of the Audit Committee, and after inspecting the Annual Financial Statements and Consolidated Financial Statements documents as well as the documents for the Non-Financial Reporting and following an extensive discussion on the Supervisory Board as well as with the representatives of the auditor, we noted the results of the audits with approval. We determined that, also based on the final results of our inspections, there are no objections to be raised.
Today, we approved the Annual Financial Statements and Consolidated Financial Statements prepared by the Management Board. The Annual Financial Statements are thus established. We agree to the proposal for the appropriation of distributable profit.
Personnel issues
As of April 7, 2022, Ms. Manja Eifert was appointed by the court as an employee representative on the Supervisory Board. She replaced Ms. Henriette Mark, who had resigned from her Supervisory Board mandate as of March 31, 2022. With effect from the end of the General Meeting on May 19, 2022, the appointment periods of Dr. Paul Achleitner and Dr. Gerhard Eschelbeck ended as scheduled. In accordance with our proposal, the General Meeting elected as their successors Mr. Alexander Wynaendts and Mr. Yngve Slyngstad as members of the Supervisory Board for a term of office of roughly four years.
On February 2, 2022, we resolved to extend the Management Board appointments of Ms. Christiana Riley and Mr. Bernd Leukert for three years in each case, up to December 31, 2025. To ensure an orderly transition in the position of Chief Risk Officer, Mr. Olivier Vigneron already joined the bank as General Manager (Generalbevollmächtigter) with effect from March 1, 2022, and became a member of the Management Board as of May 20, 2022. Mr. Stuart Lewis resigned from the Management Board with effect from May 19, 2022, and left the bank effective as of May 31, 2022. On March 25, 2022, we resolved to appoint Mr. James von Moltke as Deputy Chairman of the Management Board. On December 15, 2022, we resolved to extend the appointment of Mr. James von Moltke by three years, up to June 30, 2026, and to extend the appointments of Professor Dr. Stefan Simon and Mr. Alexander von zur Mühlen by three years, up to July 31, 2026.
All resolutions were based on the recommendations of the Nomination Committee and the Chairman’s Committee.
XVI |
Deutsche Bank | ||
Annual Report 2022 | ||
We sincerely thank the members of the Management Board and the Supervisory Board as well as the members who left last year for their dedicated work and their constructive assistance to the company during the past years.
Furthermore, we would also like to express our deep appreciation and thanks to the bank’s employees for their great personal dedication.
Frankfurt am Main, March 16, 2023

The Supervisory Board
Alexander Wynaendts
Chairman
XVII |
Deutsche Bank | ||
Annual Report 2022 | ||
Supervisory Board
Alexander Wynaendts Martina Klee*
- - Chairman Frankfurt am Main
since May 19, 2022 Germany
Ommen
Netherlands Henriette Mark*
until March 31, 2022
Dr. Paul Achleitner Munich
- Chairman Germany
until May 19, 2022
Munich Gabriele Platscher*
Germany Braunschweig
Germany
Detlef Polaschek*
- Deputy Chairman Bernd Rose*
Essen Menden
Germany Germany
Professor Dr. Norbert Winkeljohann Yngve Slyngstad
- - Deputy Chairman since May 19, 2022
since July 20, 2022 Oslo
Osnabrück Norge
Germany
John Alexander Thain
Ludwig Blomeyer Bartenstein* Rye
Bremen USA
Germany
Michele Trogni
Mayree Clark Riverside
New Canaan USA
USA
Dr. Dagmar Valcárcel
Jan Duscheck* Madrid
Berlin Spain
Germany
Stefan Viertel*
Manja Eifert* Kelkheim im Taunus
since April 7, 2022 Germany
Berlin
Germany Dr. Theodor Weimer
Wiesbaden
Dr. Gerhard Eschelbeck Germany
until May 19, 2022
Cupertino Frank Werneke*
USA Berlin
Germany
Sigmar Gabriel
Goslar Frank Witter
Germany Braunschweig
Germany
Timo Heider*
Emmerthal
Germany
*employee representatives
XVIII |
Deutsche Bank | ||
Annual Report 2022 | ||
Committees
Chairman’s Committee
Alexander Wynaendts, Chairman (since May 19, 2022), Dr. Paul Achleitner, Chairman (until May 19, 2022)
Detlef Polaschek*, Frank Werneke*, Professor Dr. Norbert Winkeljohann
Nomination Committee
Alexander Wynaendts, Chairman) (since July 28, 2022), Member (since May 19, 2022 till July 28, 2022), Mayree Clark, Chairperson(until July 28,2022), Member (since July 28, 2022)
Dr. Paul Achleitner (until May 19, 2022), Detlef Polaschek*, Frank Werneke*, Professor Dr. Norbert Winkeljohann
Audit Committee
Frank Witter, Chairman (since July 28, 2022), Professor Dr. Norbert Winkeljohann, Chairman (until July 28, 2022), Member (since July 28, 2022)
Dr. Paul Achleitner (until May 19, 2022), Manja Eifert* (since July 28, 2022), Henriette Mark* (until March 31, 2022), Gabriele Platscher*, Detlef Polaschek*, Bernd Rose*, Dr. Dagmer Valcárcel, Stefan Viertel*, Dr. Theodor Weimer, Frank Witter (until July 28, 2022), Alexander Wynaendts (since May 19, 2022)
Risk Committee
Mayree Clark, Chairperson
Dr. Paul Achleitner (until May 19, 2022), Ludwig Blomeyer-Bartenstein*, Jan Duscheck*, Michele Trogni, Stefan Viertel*, Professor Dr. Norbert Winkeljohann, Alexander Wynaendts (since May 19, 2022)
Regulatory Oversight Committee (since July 28, 2022) (former Integrity Committee)
Dr. Dagmar Valcárcel, Chairperson
Dr. Paul Achleitner (until May 19, 2022), Ludwig Blomeyer-Bartenstein*, Sigmar Gabriel, Timo Heider*, Gabriele Platscher*, Alexander Wynaendts (since May 19, 2022)
Compensation Control Committee
Prof. Dr. Norbert Winkeljohann, Chairman (since July 28, 2022), Alexander Wynaendts, Chairman (since May 19, 2022 till July 28, 2022), Member (since July 28, 2022), Dr. Paul Achleitner, Chairman (until May 19, 2022)
Dr. Gerhard Eschelbeck (until May 19, 2022)), Detlef Polaschek*, Bernd Rose*, Dr. Dagmar Valcárcel, Frank Werneke*,
XIX |
Deutsche Bank | ||
Annual Report 2022 | ||
Strategy and Sustainability Committee (since December 15, 2022) (former Strategy Committee)
John Alexander Thain, Chairman
Dr. Paul Achleitner (until May 19, 2022), Mayree Clark, Timo Heider* Henriette Mark* (until March 31, 2022), Detlef Polaschek*, Michele Trogni, Stefan Viertel* (since July 28, 2022), Frank Werneke*, Alexander Wynaendts (since May 19, 2022)
Technology, Data and Innovation Committee
Michele Trogni, Chairperson
Dr. Paul Achleitner (until May 19, 2022), Jan Duscheck*, Dr. Gerhard Eschelbeck (until May 19, 2022), Timo Heider* (until July 28, 2022), Martina Klee*, Bernd Rose*, Yngve Slyngstad (since July 28, 2022), Frank Witter (until July 28, 2022), Alexander Wynaendts (since May 19, 2022)
Mediation Committee
Alexander Wynaendts, Chairman (since May 19, 2022), Dr. Paul Achleitner, Chairman (until May 19, 2022)
Detlef Polaschek*, Frank Werneke*, Professor Dr. Norbert Winkeljohann
*Employees representatives

XX |
Deutsche Bank | ||
Annual Report 2022 | ||
XXI |
Deutsche Bank | ||
Annual Report 2022 | ||
Strategy
XXII |
Deutsche Bank | ||
Annual Report 2022 | ||
“Compete to Win”
In July 2019, the Group announced its plans for a fundamental transformation of Deutsche Bank and set key financial targets to be met by the end of 2022. Despite facing unforeseen and significant challenges from the COVID-19 pandemic and the war in Ukraine, the bank has undergone a fundamental transformation and has achieved key financial targets.
Deutsche Bank believes the five decisive actions contributing to the bank’s successful transformation are:
- – The Group created four client-centric divisions delivering stable growth. These divisions complement each other and provide well-diversified earnings streams
- – Deutsche Bank exited businesses and activities which were not core to its strategy. The Group exited equities trading, transferred its Global Prime Finance business, re-focused the Rates business and downsized or disposed other non-strategic assets. The Capital Release Unit reduced leverage exposure from non-strategic activities by 91% and risk weighted assets by 83% excluding risk-weighted assets from operational risk enabling the Group to re-deploy capital into its core businesses
- – Deutsche Bank cut costs compared to the pre-transformation level in 2018. The Group reduced its cost/income ratio by 18 percentage points, which was achieved while absorbing € 8.5 billion transformation related effects, including € 1.0 billion goodwill impairment, € 1.9 billion restructuring and severance, € 0.6 billion real estate charges, € 1.4 billion software impairment and accelerated amortization, € 2.8 billion deferred tax asset valuation adjustments as well as € 0.8 billion other transformation related effects
- – Deutsche Bank committed to and invested in controls and technology to support growth. The Group signed state of the art agreements with Google Cloud and other partners including a multi-year innovation partnership with NVIDIA in order to accelerate artificial intelligence usage and machine learning. The bank’s focus on technology has allowed it to grow revenues through a closer interface with clients, reduce costs by removing complexity in its technology and improve the control environment
- – Deutsche Bank managed and freed up capital. The Group kept its CET1 ratio above its minimum target of 12.5% through all fourteen quarters of its transformation, despite an impact of around 170 basis points from regulatory changes and of 100 basis points from transformation related impacts.
The fundamental transformation has led to a strong foundation for the Group to continue its journey and successful completion of the bank’s “Compete to Win” strategy.
Deutsche Bank’s key performance indicators 2022
Financial targets for 2022
- – Post-tax Return on Average Tangible Equity of 8% for the Group
- – Post-tax Return on Average Tangible Equity of more than 9% for the Core Bank
- – Common Equity Tier 1 capital ratio of above 12.5%
- – Leverage ratio of approximately 4.5%
Deutsche Bank’s financial results in 2022
Sustaining revenue growth in the Core Bank
Deutsche Bank’s strategic transformation was designed to refocus its Core Bank around its market leading businesses, which operate in growing markets with attractive return potential. The Group’s Core Bank comprises its four core operating divisions, namely the Corporate Bank, the Investment Bank, the Private Bank and Asset Management, together with the segment Corporate & Other.
Revenues at both the Group level and in the Core Bank amounted to € 27.2 billion in 2022, an increase of 7.1% and 7.0%, respectively, compared to 2021.
XXIII |
Deutsche Bank | ||
Annual Report 2022 | ||
Continuing to deliver on efficiency measures
Noninterest expenses were € 20.4 billion in 2022, a decrease of 5.2% versus 2021, driven by lower restructuring and severance and lower transformation charges. Adjusted costs excluding transformation charges increased by 1.1% to € 19.8 billion compared to 2021. Increases in compensation and benefits were mostly offset by reductions in noncompensation costs. These reductions in noncompensation expenses reflect continued cost management efforts, specifically from reduced costs for outsourced operations and lower occupancy related spend. If adjusted for foreign exchange impacts, adjusted costs excluding transformation charges decreased by 1.6% versus 2021.
Successful achievement against targets by the Capital Release Unit
In 2022, having outperformed against the Capital Release Unit’s targets for leverage exposure and RWAs, the Capital Release Unit also successfully met its target of less than € 800 million for adjusted costs excluding transformation charges. Noninterest expenses were € 922 million.
The Capital Release Unit reduced its loss before tax by a third, recording a loss before tax of € 932 million for the full year 2022, an improvement of € 431 million from the prior year period.
At year-end 2022, risk weighted assets (RWAs) were reduced to € 24 billion, ahead of Deutsche Bank’s year-end 2022 target of € 32 billion, and down from € 28 billion at the end of 2021. At December 31, 2022, the unit’s RWAs included operational risk RWAs of € 19 billion.
Leverage exposure was € 22 billion at the end of 2022, ahead of its target of € 51 billion for 2022, and down from € 39 billion at the end of 2021.
Since inception in the second quarter of 2019, the Capital Release Unit has reduced risk weighted assets by 63%, or 83% excluding operational risk RWA, and leverage exposure by 91%.
Having fulfilled its de-risking and cost reduction mandate from 2019 through the end of 2022, the Capital Release Unit will cease to be reported as a separate segment with effect from the first quarter of 2023. Its remaining portfolio, resources and employees will be reported within the Corporate & Other segment.
Conservative balance sheet management
The Group remains committed to managing its balance sheet conservatively as the bank continues to navigate through the challenges posed by the war in Ukraine, inflation and the dynamic interest rate environment. At the end of the fourth quarter of 2022, the Group’s CET 1 ratio was 13.4%, 10 basis points higher compared to year end 2021. Deutsche Bank aims for a Common Equity Tier 1 capital ratio of around 13% and to end 2023 with a CET 1 ratio of 200 basis points above the bank’s Maximum Distributable Amount threshold.
Leverage ratio was 4.6% in 2022, 30 basis points lower compared to year end 2021.
Average one day value-at-risk (VaR) amounted to € 47 million at the end of 2022 confirming Deutsche Bank’s conservative risk levels.
Provisions for credit losses were € 1.2 billion for the full year 2022, significantly higher compared to 2021. For the full year 2023, the Group expects provision for credit losses to be essentially flat compared to 2022 in a range of 25 to 30 basis points of average loans, reflecting persistent macro-economic and geopolitical uncertainties. As such and given the recent improvement in the macro-economic outlook, the bank now foresees provision for credit losses in 2023 at the low end of this range. The bank expects provision for credit losses in 2023, unlike in 2022, to be driven by single-name losses rather than a deterioration of macro-economic forward-looking indicators. Deutsche Bank remains committed to its stringent underwriting standards and tight risk management framework. Further details on the calculation of expected credit losses are provided in the section “Management Report: Risk Report”.
XXIV |
Deutsche Bank | ||
Annual Report 2022 | ||
“Global Hausbank”
The Group believes that the progress made in transforming Deutsche Bank leaves the bank well positioned to deliver sustainable growth through 2025. In March 2022, the Group outlined its strategic and financial roadmap through 2025, which aims to position Deutsche Bank as a “Global Hausbank”, and communicated Deutsche Bank’s 2025 financial targets and capital objectives.
The ‘Global Hausbank’ strategy is underpinned by key themes which have become even more important in the light of the geopolitical and macro-economic upheavals of 2022. In this environment, Deutsche Bank aims to leverage a more favorable interest rate environment, deploy its risk management expertise to support clients, and allocate capital to high-return growth opportunities. As sustainability becomes ever more important, the bank aims to deepen its dialogue with and support for clients and broaden the agenda in respect of its own operations. As technology continues to evolve, the bank aims to reap further cost savings, accelerate the transition to a digital bank, and expand upon strategic partnerships which are already creating substantial value.
Furthermore, the Group has also announced several key pillars of efficiency measures contributing to Deutsche Bank’s 2025 targets, which are expected to deliver structural cost savings of more than € 2 billion between 2022 and 2025. These include:
- – Germany platform optimization: Branch reductions and technology integration of the IT platform aimed at creating efficiencies by simplifying the Group’s infrastructure. The bank recently completed the conversion of around 8 million additional Postbank contracts to the Deutsche Bank IT platform
- – Re-architecture and simplification of the Group’s application landscape: In 2022, 9% of the bank’s software applications were decommissioned and more than 400 additional applications are expected to be decommissioned by 2025. Supported by the Group’s cloud-based infrastructure, the bank has also migrated key applications to the cloud and will continue to build on its progress
- – Front-to-back process re-design: More automated processes have already delivered tangible results supported by improved controls. The bank plans to continue automating controls and processes, including its front-to-back loans processing, risk management and reporting processes
- – The bank has identified additional cost savings in infrastructure efficiency, including optimization of its real estate portfolio, management of its infrastructure workforce as well as other measures. In line with plans announced in March 2022, the bank has optimized office space resulting in a significant reduction of 170,000 square meters in 2022, representing around 6% of the total global footprint. Going forward, Deutsche Bank aims to continue to focus on optimizing the bank’s workforce management
Deutsche Bank’s key performance indicators 2025
Financial targets and capital objectives for 2025
Financial targets:
- – Post-tax Return on Average Tangible Equity of above 10% for the Group
- – Compounded annual growth rate of revenues of 3.5 to 4.5%
- – Cost/income ratio of less than 62.5%
Capital objectives:
- – Common Equity Tier 1 capital ratio of approximately 13%
- – 50% Total payout ratio from 2025
Deutsche Bank reaffirms its financial targets to be achieved by 2025 of a post-tax return on tangible equity of above 10%, a compound annual revenue growth in revenues of between 3.5% and 4.5% and a cost/income ratio of below 62.5%. The bank also confirms its capital objectives of a CET1 capital ratio of around 13% and a payout ratio of 50% from 2025 onwards.
Adjusted costs, Adjusted costs excluding transformation charges as well as Post-tax Return on Average Tangible Equity are non-GAAP financial measures. Please refer to “Supplementary Information (Unaudited): Non-GAAP Financial Measures” of this report for the definitions of such measures and reconciliations to the IFRS measures on which they are based.
XXV |
Deutsche Bank | ||
Annual Report 2022 | ||
Capital distribution
Deutsche Bank is committed to delivering sustainably growing cash dividends and, over time, returning to shareholders excess capital that is over and above what is required to support profitable growth and upcoming regulatory changes through share buybacks, subject to regulatory approval, shareholder authorization and meeting German corporate law requirements. To that end, subject to meeting the Group’s strategic targets, the Management Board intends to grow the cash dividend per share by 50% per annum in the next 3 years, starting from the € 0.20 per share paid for the financial year 2021. This would translate into approximately € 3.3 billion of cumulative dividend payments by 2025 with respect to financial years 2021-2024. In relation to the financial year 2024 the bank intends to achieve a total payout ratio of 50% from a combination of dividends paid and share buybacks executed in 2025; and the bank intends to maintain a 50% total payout ratio in subsequent years. In addition to the share buyback of € 0.3 billion already concluded in 2022, successfully executing the Group’s financial and strategic plans through 2025 would therefore support the previously announced cumulative distributions to shareholders in the form of dividends paid or share buybacks executed of approximately € 8 billion in respect of financial years 2021-2025. Deutsche Bank’s ambition to return capital to shareholders is further underpinned by the bank’s aim to maintain a robust Common Equity Tier 1 (CET 1) capital ratio of approximately 13%, i.e., to operate with a buffer of 200 basis points above the Maximum Distributable Amount (MDA) threshold the Group currently assumes to prevail over time.
Sustainability
Deutsche Bank has seen sustainability as an opportunity for many years. Consequently sustainability, which encompasses environmental, social, and governance (ESG) aspects, is a central component of the “Global Hausbank” strategy. Continuing this strategy, the bank strengthened its sustainability governance by creating the position of the Chief Sustainability Officer in September 2022. The Chief Sustainability Officer has the mandate to develop the bank’s sustainability strategy and advance its implementation.
The bank has made significant progress in implementing its sustainability strategy and continued to embed sustainability into its products, policies, and processes, focusing on the following four pillars: Sustainable Finance, Policies & Commitments, People & Own Operations as well as Thought Leadership & Stakeholder Engagement.
- – Sustainable finance: It is the bank’s objective to be a reliable financial partner for its clients and to support them in their transition.
- – Policies and commitments: To ensure that the bank’s business activities are ESG-compliant and avoid negative impacts.
- – People and operations: To be the partner of choice, the bank also must lead by example. It means ensuring that it operates in a sustainable way and fosters a culture of diversity and inclusion.
- – Thought leadership and stakeholder engagement: The bank needs to engage with lawmakers, regulators, investors and the entire society in order to agree on the right standards and frameworks to maximize its positive impact.
By implementing Deutsche Bank’s sustainability strategy, the bank aims to maximize its contribution to the Paris Climate Agreement and the United Nations’ Sustainable Development Goals. The bank formally endorses universal sustainability frameworks and initiatives, such as the UN’s Environment Programme Finance Initiative, the UN Global Compact, and the Principles for Responsible Banking.
To implement the Group’s sustainability strategy, Deutsche Bank has set the following sustainability targets to:
- – Achieve cumulative sustainable financing and investment volumes since January 2020 of over € 200 billion by the end of 2022 and € 500 billion until by the end of 2025 (excluding DWS)
- – Fulfill Deutsche Bank’s net zero commitments for key carbon intensive sectors by accompanying clients in their transformation (Transition Dialogue)
- – Strengthen policies and controls to guide the bank’s actions and ensure compliance
- – Sourcing of external ESG data, automation, and standardization of reporting
- – Empower employees and establish sustainability as core value of the bank’s culture
XXVI |
Deutsche Bank | ||
Annual Report 2022 | ||
In 2022, the bank continued to deliver on these targets and further pillars of its sustainability strategy. For example, the bank:
- – Published the carbon footprint of its corporate loan portfolio and net-zero aligned targets for 2030 and 2050. These targets cover the carbon-intensive sectors of Oil and Gas (Upstream), Power Generation, Automotive (light duty vehicles) and Steel and will significantly reduce the amounts of financed emissions (Scope 3) by 2030, reflecting the bank’s commitments as a founding member of the Net-Zero Banking Alliance
- – Launched “How we live”, a new Corporate Social Responsibility program for environmental impact, aiming to mobilize communities to protect and restore the environment
- – Became an official network partner for the German Ocean Decade Committee, after signing a memorandum of understanding to actively support the United Nations Decade of Ocean Science and Sustainable Development
- – Announced the new endowed professorship for Sustainable Finance together with the European School of Management and Technology in Berlin, Germany
To reinforce the bank’s sustainability ambition, the Management Board’s, and other top-executives’ variable compensation is tied to sustainability objectives, including the volume for sustainable financing and investments and a sustainability rating index.
Deutsche Bank Businesses
Corporate Bank
Corporate banking is an integral part of Deutsche Bank’s business. Firstly, the Corporate Bank’s capabilities in Cash Management, Trade Finance and Lending, as well as Foreign Exchange delivered in close collaboration with the Investment Bank, enables the division to serve the core needs of corporate clients. As a leading bank serving multinational and German corporates domestically and abroad, the Corporate Bank helps clients in optimizing their working capital and liquidity, securing global supply chains and distribution channels and managing their risks. Secondly, the Corporate Bank acts as a specialized provider of services to financial institutions, offering Correspondent Banking, Trust and Agency and Securities Services. Finally, the division provides business banking services to small corporate and entrepreneur clients in Germany through a largely standardized product suite.
The Corporate Bank has defined a number of specific initiatives to capitalize on its core competencies across these different areas and grow revenues to achieve its targets. In particular, the division’s investments in new initiatives and experience in managing complex situations, such as impacts of COVID-19 pandemics, the war in Ukraine or rising energy costs, for clients has allowed the Corporate Bank to prove its advisory and solution capabilities.
In 2022, the Corporate Bank delivered its best-ever profit before tax of over € 2 billion, with a cost/income ratio of 62% and return on tangible equity of 12%, in line with the division’s commitment for 2022. Post-tax return on average shareholders equity was 11.6%. The Corporate Bank continued to make progress on its strategic objectives set out in 2019. The division offset negative interest rates with deposit charging, implemented until mid-2022, followed by carefully managing the transition to a positive interest rate environment. The Corporate Bank expanded its lending proposition with corporate clients across all regions compared to pre-COVID-19 levels with loans at € 122 billion at the end of 2022, increasing selectiveness of its balance sheet deployment at the same time. The division laid foundations for future growth in payments, launching Merchant Solutions products and growing its business with platforms, FinTechs and eCommerce payment providers. Finally, the division focused on the continuous scaling-up of its ESG-related transition dialogue with clients and engagements with external ESG stakeholders in various industry initiatives. The Corporate Bank extended its ESG-enabled product suite and service for MidCorps and Business Banking clients and established a sustainable supply chain finance program to support its clients to drive greater ESG accountability and transparency across their supply chain.
Looking ahead, the Corporate Bank is expected to act as an integral part of the Global Hausbank strategy and contribute to Deutsche Bank’s 2025 objectives. The division sees growth opportunities across all core client groups (Corporate, Institutional, Business Banking), both from existing Corporate Bank strengths and from new products. The Corporate Bank's global network across 151 countries combined with profound local knowledge, comprehensive product suite and tailored client offering, should continue to be its differentiator from competitors for global multinational corporates. The Corporate Bank continues working towards its strategic ambitions, leveraging its strong brand and deep client relationships and aiming to offer a full range of advisory and financing solutions for corporate treasurers. The division wants to remain the trusted partner for the German economy and build on its standing as the leading Corporate Bank in its home market. The division is also committed to connect financial institutions worldwide, a business where it is one of the market leaders.
The Corporate Bank’s initiatives will target revenue growth with corporate clients across cash management and payments, including growing its fee-based business with institutional clients and expanding lending. As the division seeks to grow its business with clients globally, it commits to applying sound risk management principles in order to maintain its high quality loan portfolio and strict lending standards. Equally, the division sees further potential to reduce its cost base from technology and front-to-back process optimization, as well as automation and location strategy.
XXVII |
Deutsche Bank | ||
Annual Report 2022 | ||
The Corporate Bank’s ambition is also to become a leader in ESG and drive the transition to a sustainable economy by supporting its corporate clients globally. Further developing ESG offerings will be an integral part of the Corporate Bank’s approach, building on its tradition on innovations for corporate clients. Additionally, the division expects investments into new products enabling new business models of the real economy, like merchant solutions, to contribute to future sustainable growth.
Investment Bank
The Investment Bank remains core to Deutsche Bank’s business. Across Fixed Income, Currency, Sales & Trading and Origination and Advisory, corporate and institutional clients access a comprehensive range of services, encompassing, financing, market making/liquidity provision, risk management solutions, advisory, debt and equity issuance. The division regionally encompasses EMEA, Americas and APAC, with a strategy that is focused upon operating in areas of competitive strength.
In 2022, the Investment Bank continued to execute against its strategic priorities set out in 2019. The Investment Bank’s strategy has been focused on controlled revenue growth, capital and cost efficiency and client intensity. During this period, significant progress has been made establishing a well-controlled and balanced portfolio of business, resulting in the strength of financial performance delivered.
The transformation of Investment Bank’s Fixed Income & Currencies business has been pronounced, with the growth in revenue and market share reflecting the successful delivery against strategic objectives. A highly competent and experienced management team has been established, which combined with the development of internal resources and strategic hires has created a strong platform and culture focused on conduct in the Investment Bank. Investment into technology has enabled multiple benefits. The reduction of duplicative platforms and applications has decreased complexity and across a significant part of the business, Investment Bank has streamlined multiple data sources into a single system, improving pricing whilst enhancing its control environment. Technology has also been critical in ensuring Investment Bank can monetize pre and post trade activities and has enabled the development of valuable client workflow solutions. Alongside this, a clear and focused client strategy has been developed, with enhancements to Investment Bank’s coverage model delivered across its institutional and corporate client bases. The focus upon disciplined risk management has also materially benefitted clients. During the periods of extreme market volatility witnessed over the past three years, the Investment Bank was able to consistently make markets, provide liquidity and act as a critical partner as they navigate increasingly uncertain markets. As a result of Deutsche Bank’s recent rating upgrades and the broader strength of the bank, the Investment Bank has seen significant client re-engagement and growth in its associated revenues.
Within Origination & Advisory, the business has made targeted hires to support business in key sectors and regions and has maintained a full-service offering. The focus has been on its core client base, successfully developing deeper strategic relationships, which has resulted in an increased market share of the division with its priority clients in Mergers and Acquisitions and Debt Capital Markets. Importantly, the Investment Bank has also improved its business mix with these clients, with the percentage of advisory revenues increasing. Whilst 2022 was challenging due to the industry wide fee pool decline, the division was able to demonstrate year on year gains in Mergers and Acquisitions market share and has also returned to the #1 rank in its home market according to Dealogic.
As the Investment Bank builds upon the successful execution its strategy since 2019, its strategic objectives remain consistent, with the focus upon targeting specified growth areas. This will continue the enhancement and diversification of the product portfolio and will be aligned with developments in client coverage where the Investment Bank is targeting increased resource efficiency. Within Fixed Income and Currencies, the enhancement of its flow products is ongoing, with investment into product technology development and adjacent businesses. The development of innovative workflow solutions will continue to enhance the risk managing offering for clients. Within Origination & Advisory, investment will be targeted upon specific sectors and the ongoing the development of the Merger & Acquisition franchise, while the division will continue to provide a full capital markets offering across both Debt and Equity Origination. The strategic priorities of cost and capital resource optimization is underpinned by a focus on the control environment.
Finally, ESG remains a priority across the Investment Bank. Although 2022 ESG debt volumes were adversely impacted by market volatility, the Investment Bank continued supporting the division’s clients globally. The Investment Bank provided holistic support to the RWE acquisition of Con Edison Clean Energy Businesses for a base purchase price of U.S.$ 6.8 billion. This was the largest M&A transaction by a German corporate into the U.S. since 2019 (MergerMarket) and the largest equity-linked transaction in 2022 (Dealogic). The Investment Bank also supported sovereigns in inaugural green bond issuances. For example, Deutsche Bank was joint bookrunner for the Republic of Singapore’s inaugural SGD 2.4 billion green bond and a joint lead manager and joint structuring advisor for New Zealand’s inaugural NZD 3.0 billion green Bond.
XXVIII |
Deutsche Bank | ||
Annual Report 2022 | ||
Private Bank
The Private Bank is organized along two businesses: Private Bank Germany and International Private Bank. The Private Bank serves personal and private clients, wealthy individuals, entrepreneurs and families. The international businesses also focus on commercial clients. Since 2019, the Private Bank contributed major achievements towards the completion of the ‘Compete to Win’ strategy at Deutsche Bank. The division refocused its business towards growth leading to new business volumes in 2022 that were nearly three times as high as in 2019. Private Bank was able to restructure its franchise via two legal entity mergers and a significantly reduced branch network. Additionally, the Private Bank reinvigorated its culture by improving the employee feedback while strengthening control systems at the same time. By concluding these steps, Private Bank reached its financial targets as the division reports a significantly improved cost/income ratio of 72% and a return on tangible equity of more than 10% in 2022. Post-tax return on average shareholders equity was 9.6%. These accomplishments were jointly reached by executing the division’s strategic agenda in both business units.
Private Bank Germany is Germany’s leading private retail bank with two complementary brands, Deutsche Bank and Postbank. The business unit targets clients seeking advisory solutions with Deutsche Bank brand offerings and those looking for convenience through the Postbank proposition. Private Bank Germany serves clients with an omni-channel distribution model, including a nationwide branch network, direct sales, mobile sales and a portfolio of distribution partners.
In Private Bank Germany, the main focus of ‘Compete to Win’ was to increase the efficiency of its business model. The business unit continued the optimization of its distribution network with the consolidation of more than 100 Postbank branches in 2022. Furthermore, it consolidated head office functions across brands and legal entities. In operations, further synergies were realized through automation and harmonization of processes. Moreover, Private Bank Germany advanced in the consolidation of Deutsche Bank’s and Postbank’s IT infrastructure through the completion of two significant steps and the migration of approximately 8 million contracts in 2022. Private Bank Germany’s profitability was also driven by growth in its customer business in a changed interest rate environment. In deposits, Private Bank Germany sees higher margins and a returning demand for related offerings. In mortgages, the business unit sees a slow-down in housing markets while demand for financing of ESG-compliant modernization is expected to grow.
International Private Bank’s vision is to be the house of choice for family entrepreneurs globally. In order to achieve this vision, three strategic propositions were established as part of ‘Compete to Win’: being the Bank for Entrepreneurs, the partner for ultra high net worth families globally and being the leading premium bank for affluent clients across Europe with a digitally-led model.
In 2022, the International Private Bank continued to execute against its strategic objectives, despite unprecedented market conditions. The International Private Bank has strong momentum in attracting client inflows with now twelve consecutive quarters of positive net inflows in assets under management. In particular, its flagship strategic asset allocation and strategic income allocation solutions have significantly contributed towards the International Private Bank’s net new assets growth. The International Private Bank has increased cost efficiency through a greater focus on the business model. This includes the sale of the Deutsche Bank Financial Advisors business in Italy in 2022 to fund its core business growth. Furthermore, transformation of its branch footprint, consolidation of office space, head office optimization and improvements in IT via platform enhancements and automation have also contributed to reducing costs. The International Private Bank has continued to grow its WM coverage and product teams in key markets supported by entrepreneur-focused strategic hires. Furthermore, the International Private Bank has successfully continued its Premium Banking transformation with investment advisory personalization at scale evolving its business towards an increased demand for digital access to services.
The Private Bank also further substantiated its ESG value proposition for the next years by enhancing the product portfolio and emphasizing its continuous support of clients towards their sustainable transition. Consequently, the Private Bank established a dedicated Chief Investment Office ESG to implement a holistic perspective and positioning across its division. Within its business units, Private Bank Germany finalized the rollout of its ESG advisory concept to all 400 Deutsche Bank branches and seven regional advisory centers. In 2023, it will set focus on energy efficient refurbishment to enable clients to align their properties with the low-emission economy of the future. In the International Private Bank, product realignment and new launches of ESG-specific solutions were key topics throughout the year, with the ESG transition of its flagship ‘Strategic Asset Allocation’ as a major step towards a more sustainable product offering. In 2023, the International Private Bank will focus on expanding its ESG product range even further with impact, thematic and asset class solutions which meet client needs.
The Private Bank’s achievements throughout 2022 and the ‘Compete to win’ journey enabled the division to further strengthen its position towards its 2025 ambition to achieve a cost/income ratio of 60-65% and an annual revenue growth ex specific items of 4-5%.
XXIX |
Deutsche Bank | ||
Annual Report 2022 | ||
Asset Management
Asset Management principally consists of DWS Group GmbH & Co. KGaA. DWS aspires to be one of the world's leading asset managers with € 821 billion in assets under management as of December 31, 2022.
With approximately 3,800 employees operating globally, DWS provides a range of active, passive and alternative investment capabilities to clients worldwide. Investment offerings span all major asset classes including active equity, fixed income, cash and multi asset and systematic and quantitative investments as well as alternative and passive investments including the Xtrackers range. Product offerings are distributed across EMEA, the Americas and APAC through a global distribution network, also leveraging third party distribution channels. DWS serves a diverse client base of retail and institutional investors globally, with a strong presence in its home market in Germany. Clients include government institutions, corporations and foundations as well as individual investors.
With the market environment becoming increasingly uncertain and client expectations evolving, DWS has refined its strategy with a goal of growing long-term shareholder value. It aims to maintain its leading position in Germany and further capture upside in Europe by building additional partnerships, growing its Passive business and leveraging its Alternatives capabilities to participate in the European transformation. In the Americas DWS aims to expand its Passive and Alternatives businesses and in Asia Pacific focus on its strategic partnerships. Within its strategy, DWS remains committed to sustainability with a focus on climate and stakeholder engagement.
DWS has reassessed its opportunities and has assigned its lines of business into four key strategic clusters categorized by the differentiation of its capabilities and the market growth potential: Growth (expanding areas of strength in Passive, built around the Xtrackers brand, and Alternatives), Value (build and grow capabilities in Equity, Multi-Asset and Fixed Income), Build (leverage digital trends and translate into new digital products and solutions) and Reduce (reallocate financial resources to fund investments into Growth areas).
DWS has identified five key enablers to support the execution of its strategic objectives. These are: expanding distribution partnerships, continuing to leverage collaboration with DB Group, enabling business by migrating to cloud and streamlining data management, creating a diverse culture to drive strong performance for clients and building on a diversified management team with focus on execution.
In December 2022 and as part of the refined strategy, DWS announced new medium-term financial targets to be delivered over the next three years: DWS is committed to creating shareholder value, reflected in the introduction of an earnings per share target of € 4.50. DWS remains disciplined on cost, to be measured and controlled by the adjusted cost/income ratio target of below 59% by 2025. Reflecting its AuM growth strategy, DWS has set for assets under management a compound annual growth rate target of greater than 12% for Passive including Xtrackers and greater than 10% for Alternatives.
DWS is further refining its approach regarding sustainability to better meet the evolving needs of its stakeholders – most importantly its clients. In this context, DWS remains committed to sustainability with a focus on climate and stakeholder engagement. As an integral part of its overarching strategy, its sustainability strategy is anchored around four strategic priorities; 1) Corporate Transformation: continue to seek to increase the level of sustainability associated with its activities throughout its organization, 2) ESG in the Investment Process: to seek to further embed ESG considerations into its investment process, that are designed to improve the assessment of the future expected risk and return of an investment, 3) Innovative and Sustainable Investment Solutions: to seek to launch new and innovative ESG products and solutions across asset classes to meet the requirements of its clients and 4) Stakeholder Engagement: to seek to take a holistic and systematic approach to engagement with key stakeholders across the entire investment value-chain.
XXX |
Deutsche Bank | ||
Annual Report 2022 | ||
1-
Combined Management Report
Operating and Financial Review | |||
Executive summary | |||
Deutsche Bank Group | |||
Results of Operations | |||
Financial Position | |||
Liquidity and Capital Resources | |||
Outlook | |||
Risks and Opportunities | |||
Risk Report | |||
Risk and capital overview | |||
Risk and capital framework | |||
Risk and Capital Management | |||
Risk and capital performance | |||
Sustainability | |||
Employees | |||
Internal Control over Financial Reporting | |||
Information pursuant to Section 315a (1) of the German Commercial Code and Explanatory Report | |||
Corporate Governance Statement pursuant to Sections 289f and 315d of the German Commercial Code | |||
Standalone parent company information (HGB) | |||
Report on equal treatment and equal pay |
30 |
Deutsche Bank | ||
Annual Report 2022 | ||
Operating and Financial Review
The following discussion and analysis should be read in conjunction with the consolidated financial statements and the related notes. Deutsche Bank’s Operating and Financial Review includes qualitative and quantitative disclosures on Segmental Results of Operations and entity wide disclosures on net revenue components as required by International Financial Reporting Standard (IFRS) 8, “Operating Segments”. For additional Business Segment disclosure under IFRS 8 please refer to Note 4 “Business Segments and Related Information” of the Consolidated Financial Statements. Forward-looking statements are disclosed in the Outlook section.
Executive summary
Global economy
Economic growth (in %)¹ | 2022² | 2021³ | Main driver | |||
Global Economy | 3.3 | 6.2 | The global economy proved robust in the second half of 2022. Industrial production and trade expanded, albeit with a loss of momentum towards the end of the year. The economic impact of the war in Ukraine remained a headwind, while the improvement in the pandemic situation provided support. Consumer prices rose strongly, in some regions to historic levels. However, the peak may have passed by the end 2022. | |||
Of which: | 2.7 | 5.3 | The industrialized countries were resilient, but with slowing momentum toward the end of the year. Although the sharp rise in consumer prices dampened private consumption, easing supply bottlenecks and falling freight costs supported GDP growth. In Europe in particular, the spillovers from the war in Ukraine contributed to price pressure. To counter inflation, the central banks tightened their monetary policy significantly. | |||
Emerging markets | 3.7 | 6.9 | Emerging market economies expanded robustly in the second half of 2022, particularly in Asia but also in Latin America. Falling energy prices were a tailwind, as was the robust demand from industrialized countries. Central banks continued to tighten monetary policy | |||
Eurozone Economy | 3.5 | 5.3 | Eurozone economies made a robust start to the second half of 2022, but momentum slowed towards the end of the year. Energy prices pushed the inflation rate to a record high in the fourth quarter. The loss of purchasing power slowed private consumption and high energy costs dampened industrial production. Expansionary fiscal policy provided support. The ECB raised key interest rates to break the inflation momentum. | |||
Of which: German economy | 1.8 | 2.6 | The German economy adapted to geopolitically driven shifts in the supply of fossil fuels. Gas rationing did not occur, and storage levels developed favorably. Consumer price inflation rose sharply and marked an all-time high during the second half of 2022. However, fiscal measures prevented a more severe slump in growth, although momentum slowed toward the end of 2022. The labor market was a factor of stability. | |||
U.S. Economy | 2.1 | 5.9 | The US economy expanded robustly in the second half of the year. The labor market remained very tight and, along with energy prices, contributed to a sharp rise in inflation. The US Fed repeatedly raised the key interest rate considerably to break the inflation momentum. GDP growth has slowed by the end of 2022, due to of headwinds from prices, waning fiscal support, and tighter monetary and financial conditions | |||
Japanese Economy | 1.1 | 2.2 | After the government eased the strict pandemic measures, domestic demand gained momentum. With the easing of entry regulations, tourism also picked up again. The Bank of Japan supported the recovery with its expansionary monetary policy. Inflation picked up, but nowhere near as strongly as in other industrialized countries. | |||
Asian Economy4 | 4.2 | 7.3 | The Asian economies continued to expand, benefiting in particular from the recovery of the Chinese economy. The quite favorable development of overseas trading partners also had a positive impact. Consumer prices rose sharply but are expected to have peaked at the end of 2022. Central banks continued to tighten monetary policy | |||
Of which: Chinese Economy | 3.0 | 8.4 | The Chinese economy recovered slowly in the course of the second half of 2022. The significant easing of COVID-related restrictions provided positive momentum at the end of the year. However, the property market still was an additional headwind. Fiscal as well as monetary policy measures supported GDP growth. | |||
1Annual Real GDP Growth (% YoY). Sources: National Authorities unless stated otherwise.
2Sources: Deutsche Bank Research.
3Some economic data for 2021 was revised by public statistics authorities due to the economic effects of the pandemic. As a result, this data may differ from that previously published.
4 Includes China, Hong Kong, India, Indonesia, Malaysia, Philippines, Singapore, Sri Lanka, South Korea, Taiwan, Thailand and Vietnam; excludes Japan.
31 |
Deutsche Bank | ||
Annual Report 2022 | ||
Banking Industry
| Dec 31, 2022 | |||||||||
Growth year-over-year (in %) | Corporate | Retail | Corporate | Retail | Main driver | |||||
Eurozone | 5.5 | 4.0 | 4.6 | 3.3 | Corporate loan growth accelerated strongly in 2022, before moderating towards yearend. Household lending peaked in summer, before the surge in interest rates pulled down the main driver, mortgage growth. The expansion of customer deposits both corporate and retail, slowed over the course of the year. | |||||
Of which: Germany | 10.4 | 4.4 | 8.4 | 2.5 | Corporate loan volumes grew at the highest rate on record in 2022, driven by working capital needs due to surging inflation and demand for liquidity as a result of the war in Ukraine and surging energy prices. Retail lending moderately slowed as the jump in interest rates put the brakes on mortgage financing. Deposit growth remained elevated with companies, but for households it fell to the lowest level on record during 2022. | |||||
U.S. | 13.3 | 9.7 | (1.0)1 | (1.0)1 | Private-sector lending picked up strongly in 2022, across the board. Outstanding corporate loans have broadly doubled over the past decade. Following two years of mostly double-digit growth throughout the pandemic, the expansion in total deposits came to a halt in 2022, with outstanding deposits essentially stagnating, but having almost doubled since 2012. | |||||
China | 13.1 | 5.4 | 6.7 | 17.3 | Retail lending slowed massively in 2022, to the lowest pace on record, while lending to companies ticked up again. The deposit business with households gained significant momentum, while it remained largely stable with corporates. | |||||
1Total U.S. deposits as segment breakdown is not available.
In 2022, the global Origination & Advisory industry fee pool was 36% lower than the 2021 record, which marked the end of a decade-long growth cycle. Furthermore this drop was partially masked by the M&A fee pool, which benefitted from the closure of record announced volumes from 2021. The Debt and Equity Origination decline was materially lower again. The key driver was market uncertainty and volatility caused by the sharp increase in inflation due to the global energy crisis, labor shortages and supply chain disruption and the war in Ukraine. These factors combined to push primary and secondary Equity Capital Markets issuances to record lows, while the leveraged loan and high yield markets were also impacted, seeing the lowest fee pool since 2010. The Merger & Acquisition industry fee pool remained robust in 2022, but announced volumes declined throughout the year, which will impact booked fees in first half of 2023. Key drivers of the U.S. market, for example large M&A deals, private equity, and Technology/Healthcare (among others) were most impacted, dropping the U.S.’s contribution to the global fee pool from 54% to 46%. Conversely, Fixed Income & Currencies revenue pools increased materially in 2022, with the heightened levels of volatility and uncertainty that negatively impacted primary origination, driving secondary market activity higher. Activity increased across ten of the most traded currencies globally, rates, emerging markets and commodities. In contrast, credit flow was more challenging with a general trend of spread widening through the year, although the fourth quarter 2022 did see a slight reversal of this trend. Financing products largely maintained the momentum from a strong second half of 2021 through 2022. Client demand remained strong, although the fourth quarter 2022 did start to see a slowdown in capital market activity.
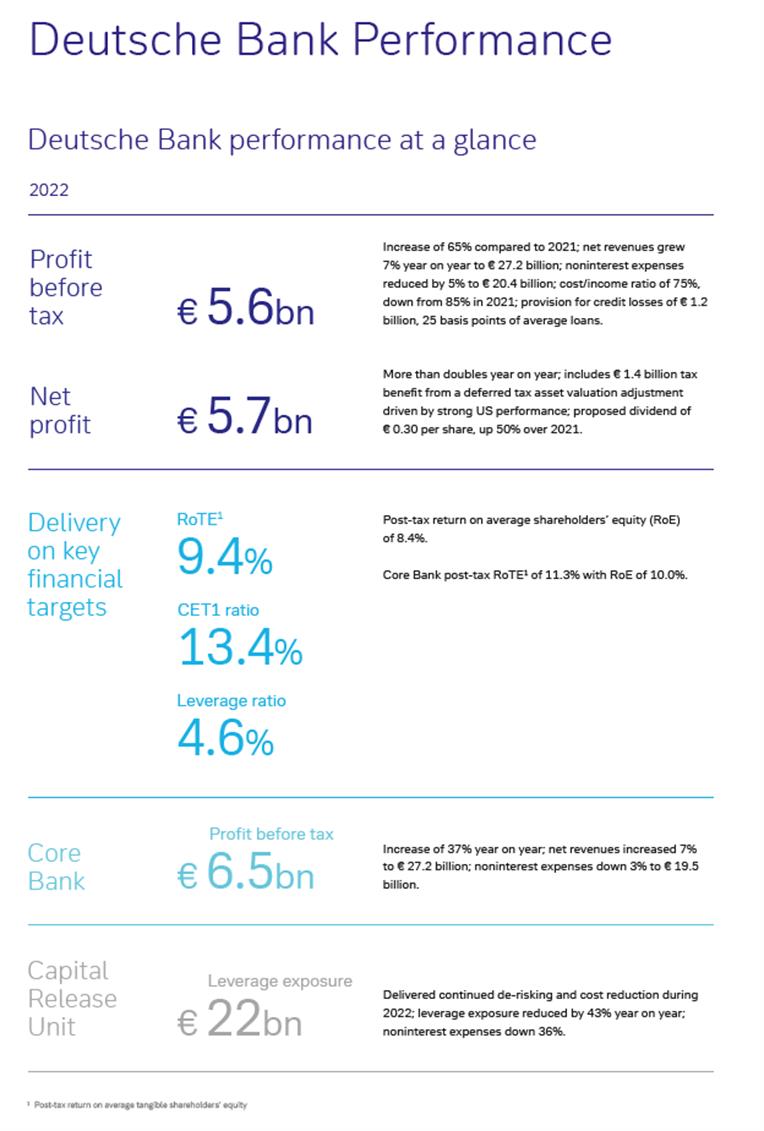
32 |
Deutsche Bank | ||
Annual Report 2022 | ||
33 |
Deutsche Bank | ||
Annual Report 2022 | ||
Deutsche Bank reported a net profit of € 5.7 billion for the full year 2022. Net profit was more than double the prior year and the highest since 2007. Net profit in 2022 includes a positive year-end deferred tax valuation adjustment of € 1.4 billion, compared to € 274 million in the prior year, which reflects continued strong performance in the bank’s U.S. operations. The bank believes that the results demonstrate the benefits of Deutsche Bank’s transformation and that the bank has become significantly more profitable, better balanced and more cost efficient by refocusing business around its core strengths. The bank delivered revenue growth in its core businesses and continued cost reductions. Provision for credit losses were in line with the guidance provided despite challenging conditions during the year. Focused de-risking of the balance sheet contributed to a solid capital ratio, and the Capital Release Unit fulfilling its de-risking and cost reduction mandate from 2019 through the end of 2022 marks a major milestone in the bank’s transformation execution. Accordingly, Capital Release Unit will cease to be reported as a separate segment with effect from the first quarter of 2023. Deutsche Bank’s management intends to recommend to the Annual General Meeting a cash dividend of € 0.30 per share for the financial year 2022, up from € 0.20 per share for the financial year 2021.
The Group’s pre-tax profit was € 5.6 billion in 2022, up 65% over 2021. This reflected 7% growth in net revenues with a 5% year-on-year reduction in noninterest expenses, resulting in a cost/income ratio of 75%, in line with the updated guidance of a cost/income ratio of mid-to-low 70s percent for 2022, down from 85% in 2021. The Core Bank, which excludes the Capital Release Unit reported a pre-tax profit of € 6.5 billion in 2022 versus € 4.8 billion in 2021, up 37% year on year and the highest since the Core Bank’s formation in 2019. Profit growth in the Core Bank was driven by 7% growth in net revenues to € 27.2 billion and a reduction in noninterest expenses of 3%, despite an increase in bank levies of € 210 million compared with 2021. Post-tax return on average tangible shareholders' equity in Core Bank was 11.3% in 2022, up from 6.4% in 2021, in line with a target of above 9%. Post-tax return on average shareholder’s equity in Core Bank was 10.0% in 2022, up from 5.7% in 2021.The Core Bank’s cost/income ratio improved to 71%, from 79% in 2021.
Group Key Performance Indicators
| Targets 2022 | Status end of 2022 | Status end of 2021 | |||
Group Post-tax return on average tangible shareholders’ equity¹ | 8.0% | 9.4% | 3.8% | |||
Core Bank Post-tax return on average tangible shareholders' equity2 | above 9.0% | 11.3% | 6.4% | |||
Common Equity Tier 1 capital ratio4 | above 12.5% | 13.4% | 13.2% | |||
Leverage ratio3,4,5 | ~ 4.5% | 4.6% | 4.9% | |||
1Based on Net Income attributable to Deutsche Bank shareholders. For further information, please refer to “Supplementary Information (Unaudited): Non-GAAP Financial Measures” of this report
2Based on Core Bank Net Income attributable to Deutsche Bank shareholders. For further information, please refer to “Supplementary Information (Unaudited): Non-GAAP Financial Measures” of this report
3Since April 1, 2022, Deutsche Bank no longer excludes certain central bank exposures (amounting to € 99 billion as of December 31, 2021), based on Article 429a (1) (n) CRR and the ECB Decision 2021/1074 as this temporary exemption during the COVID-19 pandemic ended on March 31, 2022; not applying the temporary exclusion of certain central bank exposures the leverage exposure was € 1,223 billion as of December 31, 2021, corresponding to a leverage ratio of 4.5%
4Further detail on the calculation of this ratio is provided in the Risk Report
5Starting with first quarter of 2022, leverage numbers are presented as reported as the fully loaded definition has been eliminated as resulting only in an immaterial difference; comparative information for earlier periods is still based on Deutsche Bank’s earlier fully loaded definition
Net revenues were € 27.2 billion in 2022, an increase of € 1.8 billion, or 7% compared to 2021, the highest since 2016, despite business perimeter reductions as part of the bank’s transformation launched in 2019. Net Revenues in the Core Bank increased by 7% to € 27.2 billion, reflecting revenue increases in Corporate Bank, Investment Bank and Private Bank, partly offset by lower revenues in Asset Management and Corporate & Other. The Capital Release Unit’s net revenues were negative € 28 million as compared to positive € 26 million in the previous year.
Provision for credit losses were € 1.2 billion in 2022, up from € 515 million in 2021. The year-on-year development reflected more challenging macro-economic conditions during most of 2022 against the backdrop of the war in Ukraine, while 2021 benefited from economic recovery following the easing of COVID-19 restrictions. Provision for credit losses was 25 basis points of average loans, up from 12 basis points in 2021.
Noninterest expenses were € 20.4 billion, down 5% year on year. The development partly reflected a significant decline in transformation charges as Deutsche Bank completed the transformation initiatives announced in 2019. This decline more than offset a year-on-year rise in bank levies of 38%, or € 210 million and an impairment of an intangible asset of € 68 million relating to a retail investment management agreement in Asset Management. Litigation provisions increased slightly year on year as a result of settlements and other developments in certain litigation and regulatory enforcement matters. Adjusted costs ex-transformation charges and bank levies were € 19.0 billion, essentially flat compared to the prior year. A 3% rise in compensation and benefits expenses was offset by lower noncompensation expenses, including lower information and technology and professional services expenses.
Income tax benefit was € 64 million in 2022, compared to income tax expense of € 880 million in the prior year. The effective tax rate in 2022 of (1)% benefited from the abovementioned positive deferred tax asset valuation adjustment of € 1.4 billion, reflecting continued strong performance in Deutsche Bank’s U.S. operations.
34 |
Deutsche Bank | ||
Annual Report 2022 | ||
The Common Equity Tier 1 (CET 1) capital ratio was 13.4% at the end of 2022, an increase of 13bps compared to 2021. Leverage ratio was 4.6% at the end of 2022 compared to 4.9% at the end of 2021
Revenues excluding specific items, Adjusted costs, Adjusted costs excluding transformation charges, Adjusted costs excluding transformation charges and bank levies, Adjusted profit (loss) before tax, Post-tax return on average tangible shareholders’ equity and Net Assets (adjusted) are non-GAAP financial measures. Please refer to “Supplementary Information (Unaudited): Non-GAAP Financial Measures” of this annual report for the definitions of such measures and reconciliations to the IFRS measures on which they are based.
Core Bank results at a glance
in € m. | 2022 | 2021 | 2020 | ||||
Net revenues: | |||||||
Corporate Bank (CB) | 6,335 | 5,151 | 5,146 | ||||
Investment Bank (IB) | 10,016 | 9,631 | 9,286 | ||||
Private Bank (PB) | 9,155 | 8,234 | 8,126 | ||||
Asset Management (AM) | 2,608 | 2,708 | 2,229 | ||||
Corporate & Other (C&O) | (877) | (340) | (534) | ||||
Total net revenues | 27,238 | 25,384 | 24,253 | ||||
Provision for credit losses | 1,243 | 557 | 1,763 | ||||
Noninterest expenses: | |||||||
Compensation and benefits | 10,652 | 10,290 | 10,303 | ||||
General and administrative expenses | 8,864 | 9,515 | 8,485 | ||||
Impairment of goodwill and other intangible assets | 68 | 5 | 0 | ||||
Restructuring activities | (116) | 263 | 480 | ||||
Total noninterest expenses | 19,468 | 20,073 | 19,269 | ||||
Noncontrolling interests | 0 | 0 | 0 | ||||
Profit (loss) before tax | 6,527 | 4,754 | 3,221 | ||||
Total assets (in € bn) | 1,275 | 1,192 | 1,128 | ||||
Loans (gross of allowance for loan losses, in € bn) | 487 | 474 | 429 | ||||
Employees (full-time equivalent) | 84,736 | 82,702 | 84,187 | ||||
Prior year segmental information presented in the current structure
35 |
Deutsche Bank | ||
Annual Report 2022 | ||
Deutsche Bank Group
Deutsche Bank’s Organization
Headquartered in Frankfurt am Main, Germany, Deutsche Bank is the largest bank in Germany and one of the largest financial institutions in the world, as measured by total assets of € 1,337 billion as of December 31, 2022. As of that date, the bank had 84,930 full-time equivalent internal employees and operated in 58 countries with 1,536 branches, of which 66% were located in Germany. The bank offers a wide variety of investment, financial and related products and services to private individuals, corporate entities and institutional clients around the world.
As of December 31, 2022, the bank was organized into the following segments:
- – Corporate Bank
- – Investment Bank
- – Private Bank
- – Asset Management
- – Capital Release Unit
- – Corporate & Other
The Group refers to Corporate Bank, Investment Bank, Private Bank, Asset Management and Corporate & Other as the Core Bank.
Having fulfilled its de-risking and cost reduction mandate from 2019 through the end of 2022, the Capital Release Unit will no longer be reported as a separate segment effective from the first quarter of 2023. The financial impact of the Capital Release Unit will be reported within the Corporate & Other segment. This change does not involve the transfer of assets to or from the Core businesses. Most of the remaining Capital Release Unit assets will roll off over time. These are mostly interest rate derivatives but also include the Polish FX mortgage portfolio and certain other FIC Sales & Trading and Equities assets. In line with that change, the Core Bank, which represents the Group excluding the Capital Release Unit, will cease to be reported as well, and from the first quarter of 2023 the Group will consist of the segments Corporate Bank, Investment Bank, Private Bank, Asset Management and Corporate & Other.
In addition, Deutsche Bank has a country and regional organizational layer to facilitate a consistent implementation of global strategies.
The bank has operations or dealings with existing and potential customers in most countries in the world. These operations and dealings include working through:
- – Subsidiaries and branches
- – Representative offices
- – One or more representatives assigned to serve customers
Capital expenditures or divestitures related to the divisions are included in the respective corporate division overview.
36 |
Deutsche Bank | ||
Annual Report 2022 | ||
Management Structure
The Management Board has structured the Group as a matrix organization, comprising corporate divisions and infrastructure functions operating in legal entities and branches across geographic locations.
The Management Board is responsible for the management of the company in accordance with the law, the Articles of Association and the Terms of Reference for the Management Board with the objective of creating sustainable value in the interests of the company. It considers the interests of shareholders, employees and other company-related stakeholders. The Management Board manages Deutsche Bank Group in accordance with uniform guidelines; it exercises general control over all Group companies.
The Management Board decides on all matters prescribed by law and the Articles of Association and ensures compliance with the legal requirements and internal guidelines (compliance). It also takes the necessary measures to ensure that adequate internal guidelines are developed and implemented. The Management Board's responsibilities include, in particular, the bank’s strategic management and direction, the allocation of resources, financial accounting and reporting, control and risk management, as well as corporate control and a properly functioning business organization. The members of the Management Board are collectively responsible for managing the bank’s business.
The allocation of functional responsibilities to the individual members of the Management Board is described in the Business Allocation Plan for the Management Board, which sets the framework for the delegation of responsibilities to senior management below the Management Board. The Management Board endorses individual accountability of senior position holders as opposed to joint decision-taking in committees. At the same time, the Management Board recognizes the importance of having comprehensive and robust information across all businesses in order to take well informed decisions and established, the “Group Management Committee” which aims to improve the information flow across the corporate divisions and between the corporate divisions and the Management Board along with the Infrastructure Committees, Business Executive Committees and Regional Committees. The Group Management Committee is a senior platform, which is not required by the German Stock Corporation Act, and is composed of all Management Board members, and the most senior business representatives to exchange information and discuss business, growth and profitability.
Corporate Bank
Corporate Division Overview
Corporate Bank is primarily focused on serving corporate clients, including the German “Mittelstand”, larger and smaller sized commercial and business banking clients in Germany as well as multinational companies. It is also a partner to financial institutions with regards to certain Transaction Banking services.
Commencing from the first quarter of 2021, Corporate Bank reports revenues based on three client categories: Institutional Client Services, Corporate Treasury Services and Business Banking. Institutional Client Services comprises of Cash Management for Institutional clients, Trust and Agency Services, as well as Securities Services. Corporate Treasury Services provides the full suite of Trade Finance and Lending, as well as Corporate Cash Management for multinational and German large and mid-sized corporate clients. Business Banking covers small corporates and entrepreneur clients in Germany and offers a holistic, largely standardized product suite.
There have been no significant capital expenditures or divestitures since January 1, 2020.
Products and Services
Corporate Bank is a global provider of risk management solutions, cash management, lending, trade finance, trust and agency services as well as securities services. Cash management services include integrated payments and FX solutions. Trade finance and lending offering spans from documentary and guarantee business to structured trade finance and lending. Trust and agency services cover depository receipts, corporate trust and document custody. Focusing on the finance departments of corporate and commercial clients and financial institutions in Germany and across the globe, its holistic expertise and global network allows the bank to offer integrated solutions.
In addition to Corporate Bank’s product suite, coverage teams provide clients with access to the expertise of Investment Bank.
37 |
Deutsche Bank | ||
Annual Report 2022 | ||
Distribution Channels and Marketing
The global coverage function of Corporate Bank focuses on international large corporate clients and is organized into two units: Coverage and Risk Management Solutions. Coverage includes multi-product generalists covering headquarter level and subsidiaries via global, regional and local coverage teams. Risk Management Solutions includes Foreign Exchange, Emerging Markets and Rates product specialists. This unit is managed regionally in APAC, Americas and EMEA to ensure close connectivity to clients.
Corporate clients in Germany are served out of two units: Corporate Treasury Services and Business Banking. Corporate Treasury Services covers mid and large corporate clients across two brands, Deutsche Bank and Postbank, and offers the whole range of solutions across cash, trade financing, lending and risk management for the corporate treasurer. Business Banking covers small corporates and entrepreneur clients and offers a largely standardized product suite and selected contextual-banking partner offerings (e.g. accounting solutions).
Investment Bank
Corporate Division Overview
Investment Bank combines Deutsche Bank’s Fixed Income & Currencies (FIC) Sales & Trading and Origination & Advisory businesses, as well as Deutsche Bank Research. It focuses on its traditional strengths in these markets, bringing together wholesale banking expertise across risk management, sales and trading, investment banking and infrastructure. This enables the Investment Bank to align resourcing and capital across its client and product perimeter to effectively support the banks strategic goals.
There have been no significant capital expenditures or divestitures since January 1, 2020.
Products and Services
FIC Sales & Trading brings together institutional sales, trading and structuring expertise across Foreign Exchange, Rates, Emerging markets, Credit trading and Financing. The FIC Sales & Trading business operates globally and provides both corporate and institutional clients liquidity, market making services and a range of specialized risk management solutions across a broad range of FIC products, complemented by a comprehensive financing offering. The application of technology and continued innovation of transaction lifecycle processes is enabling Deutsche Bank to increase automation / electronification in order to respond to all client and regulatory requirements.
Origination & Advisory is responsible for the division’s debt origination business, mergers and acquisitions, and a focused equity advisory and origination platform. It is comprised of regional and industry-focused coverage teams, co-led from the bank’s hubs in Europe, the U.S. and Asia Pacific. This facilitates the delivery of a range of financial products and services to the bank’s corporate clients.
Distribution Channels and Marketing
Coverage of the Investment Bank’s clients is provided principally by three groups working in conjunction with each other: The Institutional Client Group, which houses its debt sales team. Risk Management Solutions in Corporate Bank, which covers capital markets and treasury solutions and Investment Banking Coverage within Origination & Advisory. The close cooperation between these groups help to create enhanced synergies leading to increased cross selling of products/solutions to clients.
38 |
Deutsche Bank | ||
Annual Report 2022 | ||
Private Bank
Corporate Division Overview
Private Bank serves personal and private clients, wealthy individuals, entrepreneurs and families. The international businesses also focus on commercial clients. Private Bank is organized along the businesses Private Bank Germany and International Private Bank.
Private Bank was involved in the following significant capital divestitures since January 1, 2020:
In November 2020, Deutsche Bank signed an agreement to sell its share in Postbank Systems AG to Tata Consultancy Services. The transaction was closed after regulatory and governmental approvals on December 31, 2020.
In August 2021, Deutsche Bank SpA signed an agreement to sell its Deutsche Bank Financial Advisors business in Italy to Zurich Insurance Group (Zurich Italy). The transaction was closed after regulatory approval on October 17, 2022.
There have been no significant capital expenditures since January 1, 2020.
Products and Services
Private Bank’s product range includes payment and account services, credit and deposit products as well as investment advice. These product offerings include a range of ESG products, which enable clients to access ESG-compliant lending and investment products in line with the values and according to specified ESG strategies, scores and exclusionary criteria.
Private Bank Germany pursues a differentiated, customer-focused approach with two strong and complementary main brands: Deutsche Bank and Postbank. With the Deutsche Bank brand, the business focuses on providing their private customers with banking and financial products and services that include sophisticated and individual advisory solutions. The focus of Postbank brand is on providing its retail customers with standard products and daily retail banking services supported by direct banking capabilities. In cooperation with Deutsche Post DHL AG, Private Bank Germany also offers postal and parcel services in the Postbank brand branches.
International Private Bank also has a differentiated, customer-focused approach with two client segments, “Premium Banking” and “Wealth Management & Bank for Entrepreneurs”. International Private Bank provides its clients with banking and other financial services including support in planning, managing and investing wealth, financing personal and business interests and servicing institutional and corporate needs.
By year end 2022 International Private Bank materially completed the wind-down of the majority of legacy assets and liabilities associated with Sal. Oppenheim. Remaining assets or liabilities are not expected to have material financial impacts going forward and will be included in the normal course of the client segment Wealth Management & Bank for Entrepreneurs. The associated disclosure of “specific revenues items” will be discontinued starting in the first quarter 2023.
Distribution Channels and Marketing
Private Bank pursues an omni-channel approach and customers can flexibly choose between different possibilities to access services and products.
The distribution channels include branch networks in Private Bank Germany and International Private Bank, supported by advisory and customer call centers, self-service terminals as well as digital offerings including online and mobile banking. Private Bank also has collaborations with self-employed financial advisors and other sales and cooperation partners, including various cooperations with Business-to-Business-to-Consumer partners in Germany. For the Wealth Management & Bank for Entrepreneurs client segment, International Private Bank has a distinct client coverage team approach with relationship and investment managers supported by client service executives assisting clients with wealth management services and open-architecture products. In addition, in Germany, Deutsche Oppenheim Family Offices AG provides family office services, discretionary funds and advisory solutions.
The expansion of digital capabilities remains a strong focus across the businesses as a significant change in client behavior towards digital channels is observed. The Private Bank will continue to optimize the omni-channel mix in the future in order to provide customers with the most convenient access to products and services.
39 |
Deutsche Bank | ||
Annual Report 2022 | ||
Asset Management
Corporate Division Overview
With € 821 billion of assets under management as of December 31, 2022, the Asset Management division, which operates under the brand DWS, aspires to be one of the world’s leading asset management organizations. DWS serves a diverse client base of retail and institutional investors worldwide, with a strong presence in the bank’s home market in Germany. These clients include government institutions, corporations and foundations as well as individual investors. As a regulated asset manager, DWS acts as a fiduciary for clients and is conscious of its societal impact. Responsible investing has been a key part of DWS’s heritage for more than twenty years.
Deutsche Bank retains 79.49% ownership interest in DWS, and asset management remains a core business for the Group. The shares of DWS are listed on the Frankfurt stock exchange.
In 2022 DWS completed the transfer of its digital investment platform into a joint venture with Blackfin. DWS holds a 30% stake in the newly established company MorgenFund GmbH.
There have been no significant capital expenditures since January 1, 2020.
Products and Services
DWS offers individuals and institutions access to its investment capabilities across all major asset classes including active equity, fixed income, cash and multi asset and systematic and quantitative investments as well as passive including Xtrackers and alternative investments. The alternative investments include real estate, infrastructure, liquid real assets and sustainable investments. In addition, DWS’s solution strategies are targeted to client needs that cannot be addressed by traditional asset classes alone. Such services include insurance and pension solutions, asset-liability management, portfolio management solutions and asset allocation advisory.
Distribution Channels and Marketing
DWS product offerings are distributed across EMEA (Europe, Middle East and Africa), the Americas and Asia Pacific through a global distribution network. DWS also leverages third-party distribution channels, including other divisions of Deutsche Bank Group.
Capital Release Unit
The Capital Release Unit was created in July 2019. Its principal objective is to liberate capital consumed by low return assets and businesses that earn insufficient returns or that are no longer core to the bank’s strategy, by winding those down in an opportunistic manner. In addition, the Capital Release Unit is focused on reducing costs.
Having fulfilled its de-risking and cost reduction mandate from 2019 through the end of 2022, the Capital Release Unit will no longer be reported as a separate segment effective from the first quarter of 2023. The financial impact of the Capital Release Unit will be reported within the Corporate & Other segment. This change does not involve the transfer of assets to or from the Core businesses. Most of the remaining Capital Release Unit assets will roll off over time. These are mostly interest rate derivatives but also include the Polish FX mortgage portfolio and certain other FIC Sales & Trading and Equities assets.
The Capital Release Unit recorded the following significant capital divestiture since January 1, 2020:
In the fourth quarter of 2021, the Capital Release Unit concluded its transition of Deutsche Bank’s Prime Finance and Electronic Equities platform to BNP Paribas resulting in the transfer of technology, clients and staff. This achievement marked the end of a two-year transition period, which formally commenced in the fourth quarter of 2019.
40 |
Deutsche Bank | ||
Annual Report 2022 | ||
Infrastructure
The Infrastructure functions perform control and service activities for the businesses, including tasks relating to Group-wide, cross-divisional resource-planning, steering and control, as well as tasks relating to risk, liquidity and capital management.
The Infrastructure functions are organized into the following areas of responsibility linked to a dedicated member of the Management Board:
- – Finance
- – Risk
- – Chief Administration Office which includes Legal, Business Selection and Conflicts Office, Compliance and Anti Financial Crime
- – Technology, Data and Innovation
- – Chief Transformation Office and Global Procurement
Infrastructure also includes Communications, Chief Sustainability Office, Regional Management, Human Resources, Global Real Estate and Group Audit which report to the Chief Executive Officer.
Costs originating in the Infrastructure functions are currently allocated to the corporate divisions based on the planned allocations, except for technology development costs which are charged to divisions based on actual expenditures.
As part of the focus on cost management and improving bank-wide efficiency, Deutsche Bank over the last few years has been rolling out driver-based cost management methodologies to allocate infrastructure costs to the businesses. The recent methodology rollout will be effective from the first quarter of 2023 and aims to provide greater transparency over the drivers of infrastructure costs and links costs more closely to service consumption. While the Group’s cost/income ratio and return on tangible equity metrics will be unaffected by the change in internal allocations, the respective divisional metrics will change going forward.
Significant Capital Expenditures and Divestitures
Information on each Corporate Division’s significant capital expenditures and divestitures for the last three financial years has been included in the above descriptions of the Corporate Divisions.
Since January 1, 2020, there have been no public takeover offers by third parties with respect to the Group’s shares and the bank has not made any public takeover offers for its own account in respect of any other company’s shares.
41 |
Deutsche Bank | ||
Annual Report 2022 | ||
Results of Operations
Consolidated Results of Operations
You should read the following discussion and analysis in conjunction with the consolidated financial statements.
Condensed Consolidated Statement of Income
in € m. | 2022 increase (decrease) | 2021 increase (decrease) | ||||||||||||
(unless stated otherwise) | 2022 | 2021 | 2020 | in € m. | in % | in € m. | in % | |||||||
Net interest income | 13,650 | 11,155 | 11,526 | 2,495 | 22 | (371) | (3) | |||||||
Provision for credit losses | 1,226 | 515 | 1,792 | 710 | 138 | (1,276) | (71) | |||||||
Net interest income after provision for credit losses | 12,425 | 10,640 | 9,734 | 1,785 | 17 | 906 | 9 | |||||||
Commissions and fee income¹ | 9,838 | 10,934 | 9,424 | (1,096) | (10) | 1,510 | 16 | |||||||
Net gains (losses) on financial assets/liabilities at fair value through profit or loss¹ | 2,999 | 3,045 | 2,465 | (45) | (1) | 580 | 24 | |||||||
Net gains (losses) on financial assets at fair value through other comprehensive income | (216) | 237 | 323 | (453) | N/M | (86) | (27) | |||||||
Net gains (losses) on financial assets at amortized cost | (2) | 1 | 311 | (3) | N/M | (311) | (100) | |||||||
Net income (loss) from equity method investments | 152 | 98 | 120 | 54 | 56 | (23) | (19) | |||||||
Other income (loss) | 789 | (58) | (141) | 848 | N/M | 83 | (59) | |||||||
Total noninterest income | 13,560 | 14,255 | 12,503 | (695) | (5) | 1,752 | 14 | |||||||
Total net revenues² | 25,985 | 24,895 | 22,237 | 1,090 | 4 | 2,658 | 12 | |||||||
Compensation and benefits | 10,712 | 10,418 | 10,471 | 294 | 3 | (53) | (1) | |||||||
General and administrative expenses | 9,728 | 10,821 | 10,259 | (1,093) | (10) | 561 | 5 | |||||||
Impairment of goodwill and other intangible assets | 68 | 5 | 0 | 64 | N/M | 4 | N/M | |||||||
Restructuring activities | (118) | 261 | 485 | (379) | N/M | (224) | (46) | |||||||
Total noninterest expenses | 20,390 | 21,505 | 21,216 | (1,115) | (5) | 289 | 1 | |||||||
Profit (loss) before tax | 5,594 | 3,390 | 1,021 | 2,205 | 65 | 2,369 | N/M | |||||||
Income tax expense (benefit) | (64) | 880 | 397 | (945) | N/M | 483 | 122 | |||||||
Profit (loss) | 5,659 | 2,510 | 624 | 3,149 | 125 | 1,886 | N/M | |||||||
Profit (loss) attributable to noncontrolling interests | 134 | 144 | 129 | (10) | (7) | 15 | 12 | |||||||
Profit (loss) attributable to Deutsche Bank shareholders and additional equity components | 5,525 | 2,365 | 495 | 3,159 | 134 | 1,870 | N/M | |||||||
Profit (loss) attributable to additional equity components | 500 | 426 | 382 | 74 | 17 | 44 | 12 | |||||||
Profit (loss) attributable to Deutsche Bank shareholders | 5,025 | 1,940 | 113 | 3,085 | 159 | 1,826 | N/M | |||||||
N/M – Not meaningful
1For further detail please refer to Note 1 “Significant Accounting Policies and Critical Accounting Estimates” of this annual report
2After provision for credit losses
Net Interest Income
in € m. | 2022 increase (decrease) | 2021 increase (decrease) | ||||||||||||
(unless stated otherwise) | 2022 | 2021 | 2020 | in € m. | in % | in € m. | in % | |||||||
Total interest and similar income | 24,299 | 16,599 | 17,806 | 7,700 | 46 | (1,207) | (7) | |||||||
Total interest expenses | 10,649 | 5,444 | 6,280 | 5,205 | 96 | (836) | (13) | |||||||
Net interest income | 13,650 | 11,155 | 11,526 | 2,495 | 22 | (371) | (3) | |||||||
Average interest-earning assets1 | 982,709 | 937,947 | 920,444 | 44,762 | 5 | 17,503 | 2 | |||||||
Average interest-bearing liabilities1 | 725,268 | 690,656 | 685,830 | 34,612 | 5 | 4,826 | 1 | |||||||
Gross interest yield2 | 2.33% | 1.56% | 1.82% | 0.77 ppt | 50 | (0.26) ppt | (14) | |||||||
Gross interest rate paid3 | 1.27% | 0.50% | 0.76% | 0.77 ppt | 155 | (0.26) ppt | (34) | |||||||
Net interest spread4 | 1.06% | 1.06% | 1.06% | (0.00) ppt | (0) | (0.00) ppt | (0) | |||||||
Net interest margin5 | 1.39% | 1.19% | 1.25% | 0.20 ppt | 17 | (0.06) ppt | (5) | |||||||
ppt – Percentage points
1Average balances for each year are calculated in general based upon month-end balances
2Gross interest yield is the average interest rate earned on average interest-earning assets
3Gross interest rate paid is the average interest rate paid on average interest-bearing liabilities
4Net interest spread is the difference between the average interest rate earned on average interest-earning assets and the average interest rate paid on average interest-bearing liabilities
5Net interest margin is net interest income expressed as a percentage of average interest-earning assets
42 |
Deutsche Bank | ||
Annual Report 2022 | ||
2022
Net interest income was € 13.6 billion in 2022 compared to € 11.2 billion in 2021, an increase of € 2.5 billion, or 22%, driven by higher interest rates and strong underlying business performance partly offset by lower benefits from the Targeted Longer-Term Refinancing Operations III (TLTRO III) program. Interest income included € 211 million related to EU government grants under the TLTRO III program in 2022, whereas 2021 included € 494 million under this program. Overall, the bank’s net interest margin was 1.39% in 2022, an increase of 20 basis points compared to the prior year.
2021
Net interest income was € 11.2 billion in 2021 compared to € 11.5 billion in 2020, a decrease of € 371 million, or 3%, as the negative effects from interest rate headwinds were in part offset by increased interest income from business growth as well as higher benefits from deposit repricing and the TLTRO III program. Interest income included € 494 million related to EU government grants under the TLTRO III program in 2021, whereas 2020 included € 86 million under this program and € 43 million related to EU government grants under the TLTRO II program. Overall, the bank’s net interest margin was 1.19% in 2021, a decline of 6 basis points compared to the prior year.
Net Gains (Losses) on Financial Assets/Liabilities at Fair Value through Profit or Loss
in € m. | 2022 increase (decrease) | 2021 increase (decrease) | ||||||||||||
(unless stated otherwise) | 2022 | 2021 | 2020 | in € m. | in % | in € m. | in % | |||||||
Trading income | 2,782 | 1,859 | 2,230 | 923 | 50 | (370) | (17) | |||||||
Net gains (losses) on non-trading | (61) | 1,106 | 276 | (1,167) | N/M | 831 | N/M | |||||||
Net gains (losses) on financial | 277 | 79 | (40) | 198 | N/M | 119 | N/M | |||||||
Total net gains (losses) on financial | 2,999 | 3,045 | 2,465 | (45) | (1) | 580 | 24 | |||||||
N/M – Not meaningful
2022
Net gains on financial assets/liabilities at fair value through profit or loss were essentially flat at € 3.0 billion in 2022 and 2021. The decrease of € 45 million, or 1%, was driven by negative impacts from interest rate hedges in Corporate & Other as well as an unfavorable change in the fair value of guarantees in Asset Management which had a corresponding effect in other income. The overall decrease was partly offset by positive mark-to-market impacts on derivatives in Investment Bank driven by the ongoing heightened market activity and strong client flows as well as mark-to-market gains from hedge activities in Private Bank which had a corresponding offsetting effect in other income.
2021
Net gains on financial assets/liabilities at fair value through profit or loss were € 3.0 billion in 2021, compared to € 2.5 billion in 2020. The increase of € 580 million, or 24%, was driven by a positive impact from interest rate hedges in Corporate & Other as well as favorable change in the fair value of guarantees and an increase in mark-to-market valuation for illiquid products in Asset Management. The overall increase was partly offset by negative mark-to-market impacts on derivatives in Investment Bank reflecting more challenging market conditions compared to a very favorable trading environment in 2020.
43 |
Deutsche Bank | ||
Annual Report 2022 | ||
Net Interest Income and Net Gains (Losses) on Financial Assets/Liabilities at Fair Value through Profit or Loss
The bank’s trading and risk management activities include interest rate instruments and related derivatives. Under IFRS, interest and similar income earned from trading instruments and financial instruments designated at fair value through profit or loss (i.e., coupon and dividend income) and the costs of funding net trading positions are part of net interest income. The bank’s trading activities can periodically shift income between net interest income and net gains (losses) on financial assets/liabilities at fair value through profit or loss depending on a variety of factors, including risk management strategies.
In order to provide a more business-focused discussion, the following table presents net interest income and net gains (losses) on financial assets/liabilities at fair value through profit or loss by corporate division.
in € m. | 2022 increase (decrease) | 2021 increase (decrease) | ||||||||||||
(unless stated otherwise) | 2022 | 2021 | 2020 | in € m. | in % | in € m. | in % | |||||||
Net interest income | 13,650 | 11,155 | 11,526 | 2,495 | 22 | (371) | (3) | |||||||
Total net gains (losses) on financial assets/liabilities | 2,999 | 3,045 | 2,465 | (45) | (1) | 580 | 24 | |||||||
Total net interest income and net gains (losses) on | 16,649 | 14,200 | 13,991 | 2,450 | 17 | 209 | 1 | |||||||
Breakdown by Corporate Division:1 | ||||||||||||||
Corporate Bank | 3,720 | 2,666 | 2,939 | 1,055 | 40 | (273) | (9) | |||||||
Investment Bank | 8,265 | 6,891 | 7,193 | 1,374 | 20 | (302) | (4) | |||||||
Private Bank | 6,612 | 4,847 | 4,648 | 1,765 | 36 | 198 | 4 | |||||||
Asset Management | (250) | 246 | (98) | (496) | N/M | 345 | N/M | |||||||
Capital Release Unit | (61) | (18) | (33) | (43) | N/M | 15 | (45) | |||||||
Corporate & Other | (1,637) | (432) | (658) | (1,205) | N/M | 226 | (34) | |||||||
Total net interest income and net gains (losses) on | 16,649 | 14,200 | 13,991 | 2,450 | 17 | 209 | 1 | |||||||
N/M – Not meaningful
Prior year’s comparatives aligned to presentation in the current year
1This breakdown reflects net interest income and net gains (losses) on financial assets/liabilities at fair value through profit or loss only; for a discussion of the corporate divisions’ total revenues by product please refer to Note 4 “Business Segments and Related Information”
2022
Total net interest income and net gains (losses) on financial assets/liabilities at fair value through profit or loss were € 16.6 billion in 2022, compared to € 14.2 billion in 2021, an increase of € 2.4 billion. This was primarily due to higher net interest income driven by an improved interest rate environment and solid underlying business performance. Total net interest income and net gains (losses) on financial assets/liabilities at fair value through profit or loss increased by € 1.8 billion in Private Bank. This impact was largely attributable to higher mark-to-market gains from hedge activities which had a corresponding offsetting effect in other income. Higher interest rates and continued business growth also had a positive impact on the year-on-year increase; these were also the main drivers for the increase in Corporate Bank by € 1.1 billion. Total net interest income and net gains (losses) on financial assets/liabilities at fair value through profit or loss in Investment Bank increased by € 1.4 billion due to higher positive mark-to-market impacts on derivatives in FIC Sales & Trading driven by the ongoing heightened market activity and strong clients flows. These overall positive effects were partially offset by valuation and timing differences on derivatives in Corporate & Other and a less favorable change in the fair value of guarantees in Asset Management.
2021
Total net interest income and net gains (losses) on financial assets/liabilities at fair value through profit or loss were € 14.2 billion in 2021, compared to € 14.0 billion in 2020, an increase of € 209 million. This was primarily due to a favorable change in fair value of guarantees, an increase in mark-to-market valuation for illiquid products and a favorable impact from the valuation of consolidated guaranteed mutual funds which has a corresponding offset in Other Income in Asset Management. The development further benefited from a positive impact from interest rate hedges in Corporate & Other. In Private Bank, net interest income increased including positive effects from business growth and higher benefits from TLTRO, partly offset by negative effects from interest rate headwinds. These overall positive effects were partially offset by negative mark-to-market impacts on derivatives in Investment Bank reflecting more challenging market conditions compared to a very favorable trading environment in 2020. Revenues in Corporate Bank also declined primarily as negative effects from interest rate headwinds more than offset the benefits from TLTRO, deposit re-pricing and business growth.
44 |
Deutsche Bank | ||
Annual Report 2022 | ||
Provision for Credit Losses
2022
Provision for credit losses was € 1.2 billion in 2022, up from € 515 million in 2021. The year-on-year development reflected more challenging macro-economic conditions during most of 2022 against the backdrop of the war in Ukraine, while 2021 benefited from an economic recovery following the easing of COVID-19 restrictions. Provisions were 25 basis points of average loans. Provisions for non-performing loans related to Stage 3 was € 1.0 billion, spread across regions and segments. Stage 1 and Stage 2 provision for performing loans was € 204 million, driven by deteriorating macro-economic forecasts through most of the year.
2021
Provision for credit losses was € 515 million in 2021, a decrease of € 1.3 billion, or 71%, versus 2020, reflecting a supportive credit environment and a strong economic recovery due to the easing of COVID-19 related restrictions. The management overlay to reduce the weight of short-term forecasts in the standard model and base forward looking information on longer term averages during the height of the COVID-19 crisis was no longer applied in 2021. The lower level of provision for credit losses also included a positive effect from the release of a management overlay to account for uncertainties in the macro-economic outlook at the end of 2020 as the expected uncertainties did not materialize. This was partially offset by a new management overlay to address macro-economic variables outside the calibrated range of the IFRS 9 model. Provision for credit losses was 12 basis points of loans supported by strong balance sheet and disciplined risk management.
The sections “Segment Results of Operations” and “Risk Report” provide further details on provision for credit losses.
Remaining Noninterest Income
in € m. | 2022 increase (decrease) | 2021 increase (decrease) | ||||||||||||
(unless stated otherwise) | 2022 | 2021 | 2020 | in € m. | in % | in € m. | in % | |||||||
Commissions and fee income1 | 9,838 | 10,934 | 9,424 | (1,096) | (10) | 1,510 | 16 | |||||||
Net gains (losses) on financial assets at fair value | (216) | 237 | 323 | (453) | N/M | (86) | (27) | |||||||
Net gains (losses) on financial assets at amortized | (2) | 1 | 311 | (3) | N/M | (311) | (100) | |||||||
Net income (loss) from equity method investments | 152 | 98 | 120 | 54 | 56 | (23) | (19) | |||||||
Other income (loss) | 789 | (58) | (141) | 848 | N/M | 83 | (59) | |||||||
Total remaining noninterest income | 10,561 | 11,210 | 10,038 | (649) | (6) | 1,172 | 12 | |||||||
1 includes: | ||||||||||||||
Commissions and fees from fiduciary activities: | ||||||||||||||
Commissions for administration | 300 | 357 | 347 | (57) | (16) | 10 | 3 | |||||||
Commissions for assets under management | 3,792 | 3,734 | 3,208 | 58 | 2 | 526 | 16 | |||||||
Commissions for other securities business | 490 | 398 | 341 | 91 | 23 | 57 | 17 | |||||||
Total | 4,582 | 4,489 | 3,896 | 92 | 2 | 594 | 15 | |||||||
Commissions, broker’s fees, mark-ups on securities | ||||||||||||||
Underwriting and advisory fees | 1,283 | 2,162 | 1,625 | (879) | (41) | 537 | 33 | |||||||
Brokerage fees | 540 | 752 | 637 | (212) | (28) | 115 | 18 | |||||||
Total | 1,824 | 2,914 | 2,262 | (1,091) | (37) | 652 | 29 | |||||||
Fees for other customer services | 3,432 | 3,530 | 3,266 | (97) | (3) | 264 | 8 | |||||||
Total commissions and fee income | 9,838 | 10,934 | 9,424 | (1,096) | (10) | 1,510 | 16 | |||||||
N/M – Not meaningful
Prior year’s comparatives aligned to presentation in the current year
Commissions and fee income
2022
Commissions and fee income was € 9.8 billion in 2022, a decrease of € 1.1 billion, or 10%, compared to 2021. The decrease was driven by significantly lower Origination & Advisory revenues in Investment Bank reflecting continued challenging industry environment, lower Leveraged Debt Capital Management revenues and a materially reduced fee pool relative to the previous year. In addition, commission and fee income in Private Bank declined reflecting a more challenging macroeconomic environment. In Asset Management performance fees were significantly lower than the previous year due to the absence of a large Multi Asset performance fee reported then. These were partly offset by an increase in commissions and fee income in Corporate Bank driven by solid underlying business performance.
45 |
Deutsche Bank | ||
Annual Report 2022 | ||
2021
Commissions and fee income was € 10.9 billion in 2021, an increase of € 1.5 billion, or 16%, compared to 2020. The increase was driven by € 537 million higher underwriting and advisory fees due to strong growth in equity origination revenues from record Special Purpose Acquisition Company activity, significant growth in mergers and acquisition activity and higher volumes during the year. Commissions for assets under management increased by € 526 million due to higher management fees from favorable markets and net inflows combined with favorable effects from a Multi Asset performance fee as well as increased real estate performance and transaction fees in Asset Management. Fees for other customer services improved by € 264 million driven by strong performance in Leveraged Debt Capital Markets partly offset by a negative impact of € 154 million on revenues in Private Bank subsequent to the BGH ruling. Brokerage fees increased by € 115 million mainly driven by a significant increase in revenues from investment products in Private Bank.
Net gains (losses) on financial assets at fair value through other comprehensive income
2022
Net gains on financial assets at fair value through other comprehensive income were € (216) million in 2022 and € 237 million in 2021, with the result in both periods driven by the sale of bonds and securities from the strategic liquidity reserve.
2021
Net gains on financial assets at fair value through other comprehensive income were € 237 million in 2021, a decrease of € 86 million, or 27% compared to 2020, driven by lower gains from sale of bonds and securities from the strategic liquidity reserve.
Net gains (losses) on financial assets at amortized cost
2022
Net gains (losses) on financial assets at amortized cost were € (2) million in 2022 compared to € 1 million in 2021, driven by the hold-to-collect portfolio.
2021
Net gains (losses) on financial assets at amortized cost were € 1 million in 2021 compared to € 311 million in 2020, driven by the absence of a 2020 gain from sale of assets from the hold-to-collect portfolio.
Net income (loss) from equity method investments
2022
Net income from equity method investments was € 152 million in 2022 compared to € 98 million in 2021, an increase of € 54 million, or 56%, related to lower impairments for Huarong Rongde Asset Management Company Limited in 2022 as compared to 2021.
2021
Net income from equity method investments was € 98 million in 2021 compared to € 120 million in 2020, a decrease of € 23 million, or 19%, related to impairments for Huarong Rongde Asset Management Company Limited in 2021 as compared to nil impairment in 2020.
Other income (loss)
2022
Other income (loss) was € 789 million in 2022 compared to € (58) million in 2021. The improvement was driven by favorable impact from valuation adjustments on fair value of guarantees in Asset Management, which had a corresponding offsetting effect in net gains (losses) on financial assets/liabilities at fair value through profit or loss, as well as from gain on disposal of assets held for sale, including gain from the sale of the Deutsche Bank Financial Advisors business in Italy. This was partly offset by decrease in income in Private Bank driven by the countereffect of the aforementioned positive impacts in net gains (losses) on financial assets/liabilities at fair value through profit or loss.
2021
Other income (loss) was € (58) million in 2021 compared to € (141) million in 2020. The improvement was driven by positive impacts associated with fair value hedge accounting adjustments. Further, favorable year-on-year movements in the Capital Release Unit were driven by lower de-risking impacts. This was partly offset by a negative impact from valuation adjustments on liabilities of guaranteed mutual funds in Asset Management that offsets the aforementioned positive impact in net gains (losses) on financial assets/liabilities at fair value through profit or loss.
46 |
Deutsche Bank | ||
Annual Report 2022 | ||
Noninterest Expenses
in € m. | 2022 increase (decrease) | 2021 increase (decrease) | ||||||||||||
(unless stated otherwise) | 2022 | 2021 | 2020 | in € m. | in % | in € m. | in % | |||||||
Compensation and benefits | 10,712 | 10,418 | 10,471 | 294 | 3 | (53) | (1) | |||||||
General and administrative expenses¹ | 9,728 | 10,821 | 10,259 | (1,093) | (10) | 561 | 5 | |||||||
Impairment of goodwill and other intangible | 68 | 5 | 0 | 64 | N/M | 4 | N/M | |||||||
Restructuring activities | (118) | 261 | 485 | (379) | N/M | (224) | (46) | |||||||
Total noninterest expenses | 20,390 | 21,505 | 21,216 | (1,115) | (5) | 289 | 1 | |||||||
N/M – Not meaningful | ||||||||||||||
1 includes: | ||||||||||||||
Information Technology | 3,680 | 4,321 | 3,862 | (641) | (15) | 459 | 12 | |||||||
Occupancy, furniture and equipment | 1,429 | 1,727 | 1,724 | (298) | (17) | 3 | 0 | |||||||
Regulatory, tax & insurance2 | 1,285 | 1,395 | 1,407 | (110) | (8) | (12) | (1) | |||||||
Professional services3 | 858 | 924 | 977 | (66) | (7) | (53) | (5) | |||||||
Banking Services and outsourced operations3 | 881 | 946 | 967 | (64) | (7) | (21) | (2) | |||||||
Market Data and Research services | 378 | 347 | 376 | 31 | 9 | (28) | (8) | |||||||
Travel expenses | 110 | 46 | 76 | 64 | 140 | (31) | (40) | |||||||
Marketing expenses | 165 | 178 | 174 | (13) | (7) | 3 | 2 | |||||||
Other expenses4 | 943 | 938 | 697 | 5 | 0 | 241 | 35 | |||||||
Total general and administrative expenses | 9,728 | 10,821 | 10,259 | (1,093) | (10) | 561 | 5 | |||||||
2Includes bank levy of € 762 million in 2022, € 553 million in 2021 and € 633 million in 2020
3Prior years' comparatives aligned to presentation in the current year
4Includes litigation related expenses of € 413 million in 2022, € 466 million in 2021 and € 158 million in 2020. See Note 27 “Provisions”, for more detail on litigation
Compensation and benefits
2022
Compensation and benefits increased by € 294 million, or 3% to € 10.7 billion in 2022 compared to € 10.4 billion in 2021. The increase was primarily driven by adverse foreign exchange movements, with higher salary costs.
2021
Compensation and benefits decreased by € 53 million, or 1% to € 10.4 billion in 2021 compared to € 10.5 billion in 2020. The decrease was primarily driven by lower fixed compensation expenses resulting from workforce reductions offset by an increase in variable compensation costs.
General and administrative expenses
2022
General and administrative expenses decreased by € 1.1 billion, or 10%, to € 9.7 billion in 2022 compared to € 10.8 billion in 2021. The decrease was driven by a significant decline in transformation charges as the bank completed the transformation initiatives announced in 2019. Further reductions were across major cost categories, reflecting the bank’s continued cost reduction efforts. Litigation expenses decreased by € 53 million, partly related to a provision release related to the BGH ruling on pricing arrangements. The declines were partly offset by a year-on-year rise in bank levies of € 210 million.
2021
General and administrative expenses increased by € 561 million, or 5%, to € 10.8 billion in 2021 compared to € 10.3 billion in 2020. The increase was driven by € 513 million higher transformation charges, which included increased information technology costs partly related to a contract settlement and software impairments, partly triggered by the bank’s migration to cloud technology. Litigation expenses increased by € 308 million, partly related to the BGH ruling on pricing arrangements. Apart from these, general and administrative expenses decreased compared to the prior year with reductions across major cost categories including professional service fees as well as travel and market data and research expenses.
Impairment of goodwill and other intangible assets
2022
Impairment of goodwill and other intangible assets was € 68 million relating to a historic acquisition of an unamortized intangible asset associated with U.S mutual fund retail contracts in Asset Management in 2022, compared to € 5 million in the Corporate Bank in 2021.
2021
Impairment of goodwill and other intangible assets was € 5 million in the Corporate Bank in 2021. No impairment charges were reported for 2020.
47 |
Deutsche Bank | ||
Annual Report 2022 | ||
Restructuring
2022
Restructuring activities were a release of € (118) million in 2022 compared to charges of € 261 million in 2021. The development in both periods was primarily driven by Private Bank in the context of the execution of strategic objectives.
2021
Expenses for restructuring activities were € 261 million in 2021 compared to € 485 million in 2020. The decrease was primarily due to lower restructuring costs in Private Bank.
Income Tax Expense
2022
Income tax benefit in 2022 was € 64 million compared to an income tax expense of € 880 million in 2021. The effective tax rate in 2022 of (1)% benefited from a positive deferred tax asset valuation adjustment of € 1.4 billion, reflecting continued strong performance in Deutsche Bank’s U.S. operations.
2021
Income tax expense in 2021 was € 880 million compared to € 397 million in 2020. The effective tax rate in 2021 of 26% benefited from a positive deferred tax asset valuation adjustment of € 274 million related to the strong U.S. performance in 2021.
Net profit (loss)
2022
Net profit in 2022 was € 5.7 billion, compared to € 2.5 billion in the prior year. The increase in net profit was primarily driven by strong revenue performance across core businesses, reduced noninterest expenses and the aforementioned tax benefit from a deferred tax asset valuation adjustment. Partly offsetting was an increase in provision for credit losses.
2021
Net profit in 2021 was € 2.5 billion, compared to € 624 million in the prior year. The increase in net profit was primarily driven by higher revenues across core businesses and reduced levels of provision for credit losses largely due to favorable credit environment and high-quality loan book. This was partly offset by a slight increase in noninterest expenses.
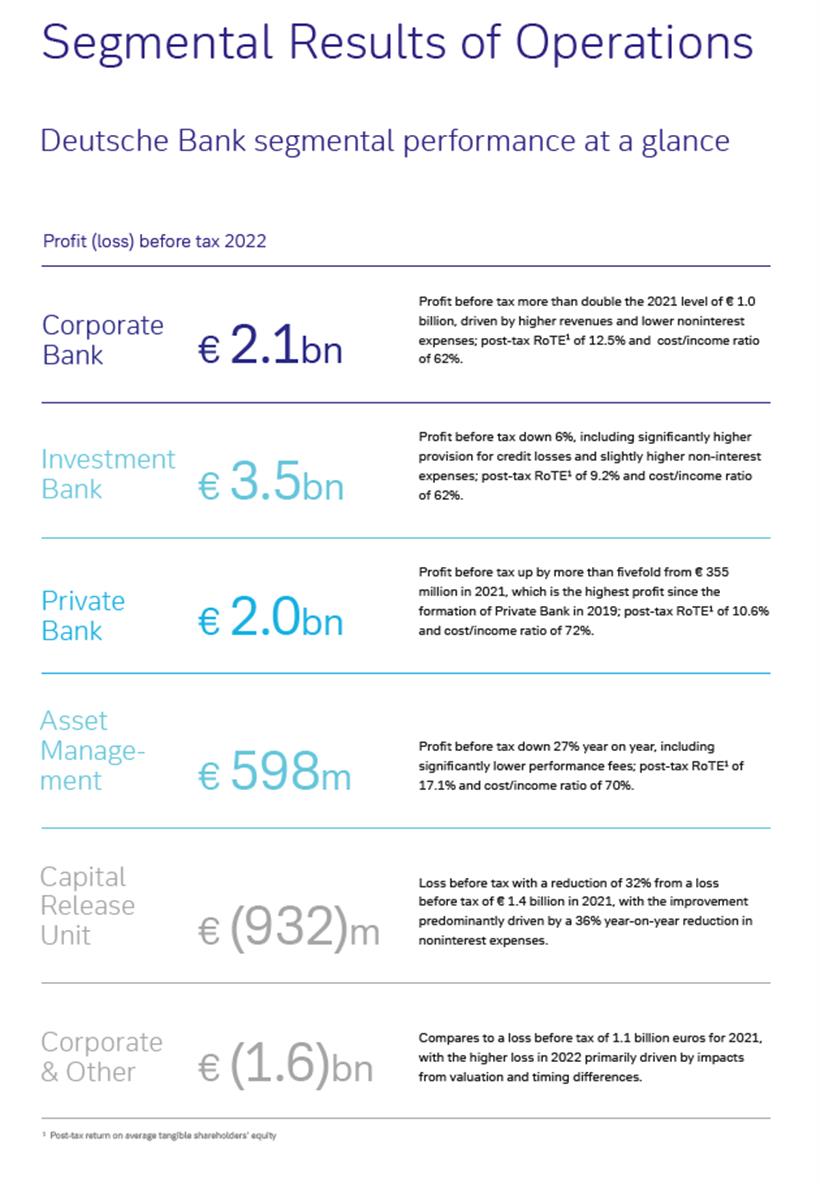
48 |
Deutsche Bank | ||
Annual Report 2022 | ||
49 |
Deutsche Bank | ||
Annual Report 2022 | ||
The following is a discussion of the results of the business segments. See Note 4 “Business Segments and Related Information” to the consolidated financial statements for information regarding:
- – Changes in the format of the bank’s segment disclosure
- – The framework of the bank’s management reporting systems
The Group’s segment reporting follows the organizational structure as reflected in its internal management reporting systems, which are the basis for assessing the financial performance of the business segments and for allocating resources to the business segments. The criterion for segmentation into divisions is the bank’s organizational structure as it existed at December 31, 2022. Prior years comparatives aligned to presentation in the current year.
2022 | |||||||||||||||
in € m. | Corporate | Investment | Private | Asset | Capital | Corporate & | Total | ||||||||
Net revenues1 | 6,335 | 10,016 | 9,155 | 2,608 | (28) | (877) | 27,210 | ||||||||
Provision for credit losses | 335 | 319 | 583 | (2) | (17) | 8 | 1,226 | ||||||||
Noninterest expenses | |||||||||||||||
Compensation and benefits | 1,421 | 2,376 | 2,791 | 899 | 60 | 3,165 | 10,712 | ||||||||
General and administrative expenses | 2,547 | 3,805 | 3,915 | 869 | 864 | (2,272) | 9,728 | ||||||||
Impairment of goodwill and other intangible assets | 0 | 0 | 0 | 68 | 0 | 0 | 68 | ||||||||
Restructuring activities | (19) | 15 | (113) | 0 | (2) | 0 | (118) | ||||||||
Total noninterest expenses | 3,949 | 6,196 | 6,593 | 1,836 | 922 | 893 | 20,390 | ||||||||
Noncontrolling interests | 0 | 15 | 0 | 174 | 0 | (190) | 0 | ||||||||
Profit (loss) before tax | 2,051 | 3,487 | 1,979 | 598 | (932) | (1,589) | 5,594 | ||||||||
Cost/income ratio | 62% | 62% | 72% | 70% | N/M | N/M | 75% | ||||||||
Assets2 | 257,900 | 676,714 | 332,524 | 10,150 | 61,823 | (2,322) | 1,336,788 | ||||||||
Additions to non-current assets | 3 | 4 | 177 | 41 | 0 | 2,269 | 2,494 | ||||||||
Risk-weighted assets | 74,303 | 139,442 | 87,602 | 12,864 | 24,284 | 21,508 | 360,003 | ||||||||
Leverage exposure3 | 320,767 | 529,506 | 344,396 | 9,462 | 22,028 | 14,325 | 1,240,483 | ||||||||
Average allocated shareholders' equity | 11,901 | 26,032 | 13,584 | 5,459 | 3,018 | 0 | 59,994 | ||||||||
Post-tax return on average shareholders’ equity4 | 12% | 9% | 10% | 7% | (23)% | N/M | 8% | ||||||||
Post-tax return on average tangible shareholders’ equity4 | 12% | 9% | 11% | 17% | (24)% | N/M | 9% | ||||||||
1 includes: | |||||||||||||||
Net interest income | 3,628 | 3,467 | 5,223 | (65) | (227) | 1,625 | 13,650 | ||||||||
Net income (loss) from equity method investments | 4 | 50 | 27 | 66 | 6 | 0 | 152 | ||||||||
2 includes: | |||||||||||||||
Equity method investments | 90 | 501 | 99 | 415 | 16 | 4 | 1,124 | ||||||||
N/M – Not meaningful
3The leverage ratio exposure is calculated according to CRR as applicable at the reporting date; starting with September 30, 2020, the Group was allowed to exclude certain Euro-based exposures facing Eurosystem central banks from the leverage ratio exposure based on the ECB-decision (EU) 2020/1306 and EU 2021/1074; this exclusion applied until March 31, 2022; the segmental leverage exposures are presented without that exclusion
4The post-tax return on average tangible shareholders’ equity and average shareholders’ equity at the Group level reflects the reported effective tax rate for the Group, which was (1)% for the year ended December 31, 2022; for the post-tax return on average tangible shareholders’ equity and average shareholders’ equity of the segments, the Group effective tax rate was adjusted to exclude the impact of permanent differences not attributed to the segments, so that the segment tax rates were 28% for the year ended December 31, 2022; for further information, please refer to “Supplementary Information (Unaudited): Non-GAAP Financial Measures” of this Annual Report
50 |
Deutsche Bank | ||
Annual Report 2022 | ||
2021 | |||||||||||||||
in € m. | Corporate | Investment | Private | Asset | Capital | Corporate & | Total | ||||||||
Net revenues1 | 5,151 | 9,631 | 8,234 | 2,708 | 26 | (340) | 25,410 | ||||||||
Provision for credit losses | (3) | 104 | 446 | 5 | (42) | 5 | 515 | ||||||||
Noninterest expenses | |||||||||||||||
Compensation and benefits | 1,447 | 2,197 | 2,813 | 822 | 128 | 3,012 | 10,418 | ||||||||
General and administrative expenses | 2,649 | 3,587 | 4,447 | 840 | 1,306 | (2,009) | 10,821 | ||||||||
Impairment of goodwill and other intangible assets | 5 | 0 | 0 | 0 | 0 | 0 | 5 | ||||||||
Restructuring activities | 42 | 47 | 173 | 2 | (2) | (0) | 261 | ||||||||
Total noninterest expenses | 4,143 | 5,831 | 7,433 | 1,664 | 1,432 | 1,002 | 21,505 | ||||||||
Noncontrolling interests | 0 | (17) | 0 | 223 | 0 | (206) | 0 | ||||||||
Profit (loss) before tax | 1,011 | 3,714 | 355 | 816 | (1,364) | (1,142) | 3,390 | ||||||||
Cost/income ratio | 80% | 61% | 90% | 61% | N/M | N/M | 85% | ||||||||
Assets2 | 245,716 | 615,906 | 310,496 | 10,387 | 131,775 | 9,713 | 1,323,993 | ||||||||
Additions to non-current assets | 17 | 6 | 149 | 32 | 1 | 1,734 | 1,939 | ||||||||
Risk-weighted assets | 65,406 | 140,600 | 85,366 | 14,415 | 28,059 | 17,783 | 351,629 | ||||||||
Leverage exposure (fully loaded)3 | 299,892 | 530,361 | 320,692 | 10,678 | 38,830 | 22,761 | 1,124,667 | ||||||||
Average allocated shareholders' equity | 10,301 | 24,181 | 12,663 | 4,815 | 4,473 | 0 | 56,434 | ||||||||
Post-tax return on average shareholders’ equity4 | 6% | 10% | 1% | 12% | (23)% | N/M | 3% | ||||||||
Post-tax return on average tangible shareholders’ equity4 | 7% | 11% | 1% | 30% | (23)% | N/M | 4% | ||||||||
1 includes: | |||||||||||||||
Net interest income | 2,605 | 3,332 | 4,601 | (5) | 58 | 564 | 11,155 | ||||||||
Net income (loss) from equity method investments | 3 | (34) | 40 | 81 | 7 | 1 | 98 | ||||||||
2 includes: | |||||||||||||||
Equity method investments | 72 | 462 | 180 | 349 | 25 | 4 | 1,091 | ||||||||
N/M – Not meaningful
Prior years comparatives aligned to presentation in the current year
3The leverage ratio exposure is calculated according to CRR as applicable at the reporting date; starting with September 30, 2020, the Group was allowed to exclude certain Euro-based exposures facing Eurosystem central banks from the leverage ratio exposure based on the ECB-decision (EU) 2020/1306 and EU 2021/1074; this exclusion applied until March 31, 2022; the segmental leverage exposures are presented without that exclusion
4 The post-tax return on average tangible shareholders’ equity and average shareholders’ equity at the Group level reflects the reported effective tax rate for the Group, which was 26% for the year ended December 31, 2021; for the post-tax return on average tangible shareholders’ equity and average shareholders’ equity of the segments, the Group effective tax rate was adjusted to exclude the impact of permanent differences not attributed to the segments, so that the segment tax rates were 28% for the year ended December 31, 2021; for further information, please refer to “Supplementary Information (Unaudited): Non-GAAP Financial Measures” of this Annual Report
51 |
Deutsche Bank | ||
Annual Report 2022 | ||
2020 | |||||||||||||||
in € m. | Corporate | Investment | Private | Asset | Capital | Corporate & | Total | ||||||||
Net revenues1 | 5,146 | 9,286 | 8,126 | 2,229 | (225) | (534) | 24,028 | ||||||||
Provision for credit losses | 364 | 690 | 711 | 2 | 29 | (4) | 1,792 | ||||||||
Noninterest expenses | |||||||||||||||
Compensation and benefits | 1,402 | 2,079 | 2,867 | 740 | 168 | 3,215 | 10,471 | ||||||||
General and administrative expenses | 2,805 | 3,325 | 4,242 | 763 | 1,774 | (2,651) | 10,259 | ||||||||
Impairment of goodwill and other intangible assets | 0 | 0 | 0 | 0 | 0 | 0 | 0 | ||||||||
Restructuring activities | 28 | 14 | 413 | 22 | 5 | 3 | 485 | ||||||||
Total noninterest expenses | 4,235 | 5,418 | 7,522 | 1,526 | 1,947 | 568 | 21,216 | ||||||||
Noncontrolling interests | 0 | 11 | 0 | 157 | (0) | (169) | 0 | ||||||||
Profit (loss) before tax | 547 | 3,166 | (108) | 544 | (2,200) | (929) | 1,021 | ||||||||
Cost/income ratio | 82% | 58% | 93% | 68% | N/M | N/M | 88% | ||||||||
Assets2 | 237,675 | 573,536 | 296,596 | 9,453 | 197,667 | 10,333 | 1,325,259 | ||||||||
Additions to non-current assets | 10 | 4 | 202 | 32 | 0 | 3,174 | 3,423 | ||||||||
Risk-weighted assets | 57,483 | 128,292 | 77,074 | 9,997 | 34,415 | 21,690 | 328,951 | ||||||||
Leverage exposure (fully loaded)3 | 273,959 | 476,097 | 307,746 | 4,695 | 71,726 | 29,243 | 1,078,268 | ||||||||
Average allocated shareholders' equity | 9,945 | 22,911 | 11,553 | 4,757 | 6,166 | 0 | 55,332 | ||||||||
Post-tax return on average shareholders’ equity4 | 3% | 9% | (1)% | 8% | (26)% | N/M | 0% | ||||||||
Post-tax return on average tangible shareholders’ equity4 | 3% | 10% | (2)% | 21% | (27)% | N/M | 0% | ||||||||
1 includes: | |||||||||||||||
Net interest income | 2,883 | 3,325 | 4,499 | 1 | 61 | 756 | 11,526 | ||||||||
Net income (loss) from equity method investments | 3 | 22 | 23 | 63 | 9 | 1 | 120 | ||||||||
2 includes: | |||||||||||||||
Equity method investments | 69 | 399 | 60 | 304 | 67 | 4 | 901 | ||||||||
N/M – Not meaningful
Prior years comparatives aligned to presentation in the current year.
3The leverage ratio exposure is calculated according to CRR as applicable at the reporting date; starting with September 30, 2020, the Group was allowed to exclude certain Euro-based exposures facing Eurosystem central banks from the leverage ratio exposure based on the ECB-decision (EU) 2020/1306 and EU 2021/1074; this exclusion applied until March 31, 2022; the segmental leverage exposures are presented without that exclusion
4The post-tax return on average tangible shareholders’ equity and average shareholders’ equity at the Group level reflects the reported effective tax rate for the Group, which was 39% for the year ended December 31, 2020; for the post-tax return on average tangible shareholders’ equity and average shareholders’ equity of the segments, the Group effective tax rate was adjusted to exclude the impact of permanent differences not attributed to the segments, so that the segment tax rates were 28% for the year ended December 31, 2020; for further information, please refer to “Supplementary Information (Unaudited): Non-GAAP Financial Measures” of this Annual Report
52 |
Deutsche Bank | ||
Annual Report 2022 | ||
Corporate Bank
2022 increase (decrease) | 2021 increase (decrease) | |||||||||||||
in € m. | 2022 | 2021 | 2020 | in € m. | in % | in € m. | in % | |||||||
Net revenues | ||||||||||||||
Corporate Treasury Services | 3,886 | 3,125 | 3,119 | 761 | 24 | 6 | 0 | |||||||
Institutional Client Services | 1,586 | 1,299 | 1,280 | 287 | 22 | 19 | 1 | |||||||
Business Banking | 863 | 726 | 747 | 136 | 19 | (21) | (3) | |||||||
Total net revenues | 6,335 | 5,151 | 5,146 | 1,185 | 23 | 5 | 0 | |||||||
of which: | ||||||||||||||
Net interest income | 3,628 | 2,605 | 2,883 | 1,022 | 39 | (278) | (10) | |||||||
Commissions and fee income | 2,354 | 2,203 | 2,078 | 151 | 7 | 125 | 6 | |||||||
Remaining income | 354 | 343 | 185 | 11 | 3 | 158 | 86 | |||||||
Provision for credit losses | 335 | (3) | 364 | 338 | N/M | (367) | N/M | |||||||
Noninterest expenses | ||||||||||||||
Compensation and benefits | 1,421 | 1,447 | 1,402 | (25) | (2) | 45 | 3 | |||||||
General and administrative expenses | 2,547 | 2,649 | 2,805 | (103) | (4) | (156) | (6) | |||||||
Impairment of goodwill and other intangible assets | 0 | 5 | 0 | (5) | N/M | 5 | N/M | |||||||
Restructuring activities | (19) | 42 | 28 | (61) | N/M | 13 | 47 | |||||||
Total noninterest expenses | 3,949 | 4,143 | 4,235 | (193) | (5) | (92) | (2) | |||||||
Noncontrolling interests | 0 | 0 | 0 | 0 | N/M | 0 | N/M | |||||||
Profit (loss) before tax | 2,051 | 1,011 | 547 | 1,040 | 103 | 464 | 85 | |||||||
Total assets (in € bn.)1 | 258 | 246 | 238 | 12 | 5 | 8 | 3 | |||||||
Loans (gross of allowance for loan losses, in € bn.) | 122 | 122 | 115 | (1) | (1) | 8 | 7 | |||||||
Total employees (directly-managed, full-time equivalent) | 13,980 | 13,292 | 13,393 | 688 | 5 | (102) | (1) | |||||||
N/M – Not meaningful
Prior year’s comparatives aligned to presentation in the current year
1Segment assets represent consolidated view, i.e. the amounts do not include intersegment balances
2022
Profit before tax of the Corporate Bank was € 2.1 billion for the full year 2022, up from € 1.0 billion in 2021, driven by higher revenues and lower noninterest expenses, partly offset by increased provision for credit losses. Adjusted for transformation charges, restructuring and severance expenses, impairments of goodwill and other intangible assets and specific revenue items, profit before tax was also € 2.1 billion, 74% above the prior year. Post-tax return on average tangible shareholders’ equity was 12.5%, up from 6.8% in the prior year. Post-tax return on average shareholders’ equity was 11.6%, up from 6.3% in the prior year. The cost/income ratio was 62%, down from 80% in 2021.
Full year net revenues were € 6.3 billion, 23% higher year on year. Revenue growth was driven by increased interest rates and continued pricing discipline, higher commission and fee income as well as deposit growth and favorable foreign exchange rate movements. Deposits grew by € 18 billion, or 7%, during the year while loan volume decreased by € 1 billion, or 1%. All of the Corporate Bank’s businesses contributed to revenue growth.
Corporate Treasury Services net revenues were € 3.9 billion, up 24% year on year, driven by increased interest rates across all markets, growth in commission and fee income and higher deposits. Institutional Client Services net revenues were € 1.6 billion, 22% higher year on year, benefitting from higher interest rates and favorable foreign exchange movements. Business Banking net revenues were € 863 million, 19% higher year on year, reflecting transition to a positive interest rate environment in Germany in the second half of 2022 and higher commission and fee income from account repricing.
Provision for credit losses increased to € 335 million in the year, or 27 basis points of average loans, from essentially nil in the prior year reflecting the weakened macroeconomic environment.
Noninterest expenses were € 3.9 billion, down 5% year on year, as a positive contribution from noncompensation initiatives and lower nonoperating costs, were partly offset by foreign exchange rate movements. Adjusted costs ex-transformation charges were € 3.9 billion, down 1%, reflecting the aforementioned noncompensation initiatives and foreign exchange movements.
53 |
Deutsche Bank | ||
Annual Report 2022 | ||
2021
Profit before tax of the Corporate Bank was € 1.0 billion for the full year 2021, up from € 547 million in 2020, driven by a decrease in provision for credit losses as well as lower noninterest expenses. Adjusted for transformation charges, restructuring and severance expenses, impairments of goodwill and other intangible assets and specific revenue items, profit before tax was € 1.2 billion, 69% above the prior year. This increase was primarily driven by lower provision for credit losses, lower litigation charges as well as lower adjusted costs, partly offset by higher severance and restructuring.
Full year net revenues were € 5.2 billion, flat versus 2020, as business volume growth and deposit repricing offset interest rate headwinds.
Corporate Treasury Services revenues of € 3.1 billion were essentially unchanged compared to prior year, as the benefits of the deposit repricing, ECB’s TLTRO III program and other business initiatives offset interest rate headwinds. Institutional Client Services net revenues of € 1.3 billion were € 19 million or 1% higher than prior year driven by underlying business performance. Business Banking net revenues of € 0.7 billion decreased by 3%, as interest rate headwinds more than offset business growth and progress on repricing agreements.
Provision for credit losses was a net release of € 3 million, compared to provisions of € 364 million in 2020, reflecting low levels of impairments and releases of Stage 1 and 2 provisions compared to the prior year.
Noninterest expenses were € 4.1 billion, down 2% year on year, partly reflecting a non-recurrence of litigation expenses in the prior year. Adjusted costs ex-transformation charges were € 4.0 billion, down 1%, driven by headcount reduction and other initiatives. Severance and restructuring expenses rose 42% year on year, reflecting headcount reductions in support of the bank’s transformation program.
54 |
Deutsche Bank | ||
Annual Report 2022 | ||
Investment Bank
2022 increase (decrease) | 2021 increase (decrease) | |||||||||||||
in € m. | 2022 | 2021 | 2020 | in € m. | in % | in € m. | in % | |||||||
Net revenues | ||||||||||||||
Fixed Income, Currency (FIC) Sales & Trading | 8,935 | 7,063 | 7,074 | 1,871 | 26 | (11) | (0) | |||||||
Debt Origination | 412 | 1,573 | 1,500 | (1,161) | (74) | 73 | 5 | |||||||
Equity Origination | 101 | 544 | 369 | (443) | (81) | 174 | 47 | |||||||
Advisory | 485 | 491 | 244 | (6) | (1) | 247 | 101 | |||||||
Origination & Advisory | 998 | 2,608 | 2,114 | (1,610) | (62) | 494 | 23 | |||||||
Other | 84 | (40) | 99 | 124 | N/M | (139) | N/M | |||||||
Total net revenues | 10,016 | 9,631 | 9,286 | 385 | 4 | 345 | 4 | |||||||
Provision for credit losses | 319 | 104 | 690 | 215 | N/M | (587) | (85) | |||||||
Noninterest expenses | ||||||||||||||
Compensation and benefits | 2,376 | 2,197 | 2,079 | 179 | 8 | 118 | 6 | |||||||
General and administrative expenses | 3,805 | 3,587 | 3,325 | 218 | 6 | 262 | 8 | |||||||
Impairment of goodwill and other intangible assets | 0 | 0 | 0 | 0 | N/M | 0 | N/M | |||||||
Restructuring activities | 15 | 47 | 14 | (32) | (68) | 33 | N/M | |||||||
Total noninterest expenses | 6,196 | 5,831 | 5,418 | 365 | 6 | 413 | 8 | |||||||
Noncontrolling interests | 15 | (17) | 11 | 32 | N/M | (29) | N/M | |||||||
Profit (loss) before tax | 3,487 | 3,714 | 3,166 | (227) | (6) | 547 | 17 | |||||||
Total assets (in € bn.)1 | 677 | 616 | 574 | 61 | 10 | 42 | 7 | |||||||
Loans (gross of allowance for loan losses, in € bn.) | 103 | 93 | 69 | 10 | 11 | 24 | 34 | |||||||
Total employees (directly-managed, full-time equivalent) | 7,657 | 7,152 | 7,492 | 505 | 7 | (341) | (5) | |||||||
N/M – Not meaningful
Prior year’s comparatives aligned to presentation in the current year
1Segment assets represent consolidated view, i.e. the amounts do not include intersegment balances
2022
Profit before tax was € 3.5 billion in 2022, a decrease of € 227 million versus a very strong prior year. Slightly higher revenues were more than offset by significantly higher provision for credit losses and slightly higher noninterest expenses.
Net revenues were € 10.0 billion in 2022, an increase of € 385 million, or 4% compared to 2021.
Revenues in FIC Sales & Trading were € 8.9 billion, an increase of € 1.9 billion, or 26%, versus the prior year, with strong year-on-year growth across the majority of the franchise. Rates, Foreign Exchange and Emerging Markets revenues were all significantly higher, reflecting heightened levels of market activity, increased client flows and disciplined risk management. Financing revenues were higher, driven primarily by higher net interest income, as a result of increased lending activity. Revenues in Credit Trading were significantly lower due to the non-recurrence of the contribution from a concentrated distressed credit position in the prior year and a challenging market environment.
Origination & Advisory net revenues were € 1.0 billion, a decrease of € 1.6 billion, or 62%, compared to the prior year. Debt Origination revenues were € 412 million, significantly lower than the prior year driven principally by Leveraged Debt Capital Markets, where revenues were impacted by a material decline in the industry fee pool and loan markdowns, which were seen across the industry. Investment Grade debt revenues were also lower, however decreased by less than the industry average (source: Dealogic). Equity Origination revenues of € 101 million were significantly lower, reflecting a material decline in primary equity issuance during the year. Advisory revenues of € 485 million were essentially flat to 2021, in a fee pool that was down approximately 15% (source: Dealogic).
Other revenues were positive € 84 million, compared to negative € 40 million in 2021. The year–on-year increase was materially driven by a gain of € 49 million relating to the impact of debt valuation adjustments (DVA) on certain derivative liabilities versus a loss of € 28 million in 2021. Additionally, 2021 was negatively impacted by the reversal of previously recorded Collateralized Loan Obligation hedge gains, which had resulted from the release of underlying provisions for credit losses. These did not re-occur in 2022.
Provision for credit losses was € 319 million or 32 basis points of average loans, an increase of € 215 million primarily driven by a weakened macroeconomic environment whilst the prior year benefitted from a post COVID-19 recovery.
Noninterest expenses in 2022 were € 6.2 billion, an increase of € 365 million or 6% compared to the prior year, reflecting the impact of foreign exchange translation and increased bank levies.
55 |
Deutsche Bank | ||
Annual Report 2022 | ||
2021
Profit before tax was € 3.7 billion in 2021, an increase of € 547 million compared to the prior year. The increase was mainly driven by slightly higher revenues, as well as significantly lower provision for credit losses, partly offset by higher noninterest expenses.
Net revenues were € 9.6 billion in 2021, an increase of € 345 million or 4% compared to 2020.
Revenues in FIC Sales & Trading were € 7.1 billion, essentially flat versus the prior year. Financing revenues were significantly higher, driven by increased net interest income, as a result of increased lending activity, with solid performance across all businesses. Revenues in Credit Trading were significantly higher due to strength in the distressed business. Rates and Foreign Exchange revenues were significantly lower, reflecting more challenging market conditions compared to a more favorable trading environment in 2020. Revenues in Emerging Markets were lower due to a decline in Asia, which did not benefit from the heightened levels of activity seen in 2020. This was partially offset by growth in the Central and Eastern Europe, Middle East and Africa region, with Latin America broadly flat.
Origination and Advisory net revenues were € 2.6 billion, a € 494 million or 23% increase compared to the prior year. Debt Origination revenues were € 1.6 billion, slightly higher than the prior year driven principally by strong performance in Leveraged Debt Capital Markets, which more than offset normalized Investment Grade debt issuances versus the prior year. Equity Origination revenues of € 544 million were significantly higher, reflecting record Special Purpose Acquisition Company (SPAC) activity in the first quarter and subsequent SPAC merger (de-SPAC) revenues through the year. Advisory revenues of € 491 million were significantly higher reflecting the growth in M&A activity and record announced volumes during the year.
Other revenues were negative € 40 million, compared to positive € 99 million in 2020. The year–on-year decrease was materially driven by a reversal of previously recorded Collateralized Loan Obligation hedge gains, resulting from the release of underlying provisions for credit losses, with an overall net neutral impact to profit before tax.
Provision for credit losses was € 104 million or 14 basis points of average loans, with the decrease of € 587 million compared to 2020 primarily driven by the non-recurrence of COVID-19 related impairments.
Noninterest expenses in 2021 were € 5.8 billion, an increase of € 413 million or 8% compared to the prior year, reflecting higher compensation costs, increased bank levy and infrastructure service cost allocations.
56 |
Deutsche Bank | ||
Annual Report 2022 | ||
Private Bank
2022 increase (decrease) | 2021 increase (decrease) | |||||||||||||
in € m. | 2022 | 2021 | 2020 | in € m. | in % | in € m. | in % | |||||||
Net revenues: | ||||||||||||||
Private Bank Germany | 5,327 | 5,008 | 4,989 | 319 | 6 | 19 | 0 | |||||||
International Private Bank | 3,828 | 3,226 | 3,136 | 601 | 19 | 90 | 3 | |||||||
Premium Banking | 953 | 945 | 905 | 8 | 1 | 41 | 4 | |||||||
Wealth Management & Bank for Entrepreneurs | 2,874 | 2,281 | 2,232 | 594 | 26 | 49 | 2 | |||||||
Total net revenues | 9,155 | 8,234 | 8,126 | 921 | 11 | 109 | 1 | |||||||
of which: | ||||||||||||||
Net interest income | 5,223 | 4,601 | 4,499 | 622 | 14 | 102 | 2 | |||||||
Commissions and fee income | 3,157 | 3,207 | 3,052 | (50) | (2) | 155 | 5 | |||||||
Remaining income | 775 | 426 | 574 | 349 | 82 | (148) | (26) | |||||||
Provision for credit losses | 583 | 446 | 711 | 137 | 31 | (265) | (37) | |||||||
Noninterest expenses: | ||||||||||||||
Compensation and benefits | 2,791 | 2,813 | 2,867 | (22) | (1) | (54) | (2) | |||||||
General and administrative expenses | 3,915 | 4,447 | 4,242 | (533) | (12) | 205 | 5 | |||||||
Impairment of goodwill and other intangible assets | 0 | 0 | 0 | 0 | N/M | 0 | N/M | |||||||
Restructuring activities | (113) | 173 | 413 | (285) | N/M | (240) | (58) | |||||||
Total noninterest expenses | 6,593 | 7,433 | 7,522 | (840) | (11) | (89) | (1) | |||||||
Noncontrolling interests | 0 | 0 | 0 | 0 | N/M | (0) | (87) | |||||||
Profit (loss) before tax | 1,979 | 355 | (108) | 1,624 | N/M | 463 | N/M | |||||||
Total assets (in € bn.)1 | 333 | 310 | 297 | 22 | 7 | 14 | 5 | |||||||
Loans (gross of allowance for loan losses, in € bn.) | 265 | 254 | 237 | 10 | 4 | 17 | 7 | |||||||
Assets under management (in € bn.)2 | 518 | 554 | 495 | (36) | (6) | 59 | 12 | |||||||
Net flows (in € bn.) | 30 | 30 | 16 | (0) | (1) | 14 | 85 | |||||||
Total employees (directly-managed, full-time equivalent) | 26,951 | 28,084 | 29,748 | (1,132) | (4) | (1,665) | (6) | |||||||
N/M – Not meaningful
Prior years comparatives aligned to presentation in the current year
1Segment assets represent consolidated view, i.e. the amounts do not include intersegment balances
2The Group defines assets under management as (a) assets held on behalf of customers for investment purposes and/or (b) client assets that are managed by the bank; assets under management are managed on a discretionary or advisory basis, or these assets are deposited with the bank; deposits are considered assets under management if they serve investment purposes; in the Private Bank Germany and Premium Banking, this includes term deposits and savings deposits; in Wealth Management & Bank for Entrepreneurs, it is assumed that all customer deposits are held with the bank primarily for investment purposes
2022
Private Bank recorded a profit before tax of € 2.0 billion in 2022, up more than fivefold compared to € 355 million in the prior year. This is the highest profit before tax since the formation of Private Bank in 2019. Post-tax return on average tangible shareholders’ equity rose to 10.6%, up from 1.4% in the prior year, with post-tax return on average shareholders’ equity of 9.6%, up from 1.3%. The cost/income ratio improved to 72%, down from 90% in the prior year, reflecting growth of 11% in revenues combined with a reduction of 11% in noninterest expenses.
Net revenues grew to € 9.2 billion, up 11% year on year. The increase partly reflected higher specific revenue items, mainly a gain of approximately € 310 million from the sale of the Deutsche Bank Financial Advisors business in Italy, as well as the positive impact of reduced forgone revenues related to the 2021 German Federal Court of Justice (BGH) ruling on pricing agreements. Adjusted for these impacts, net revenues grew by 6% year on year, driven by higher net interest income, foreign exchange rate movements and continued business growth. Business growth was € 41 billion in 2022 and reflected net inflows into assets under management of € 30 billion, including net inflows into investment products of € 25 billion and deposits of € 5 billion, as well as net new client loans of € 11 billion.
Private Bank Germany generated net revenues of € 5.3 billion, up 6% year on year, partly reflecting the reduction in forgone revenues from the BGH ruling. Adjusted for this impact, revenues were up 4% as higher net interest income from deposit products more than offset the impacts of lower loan revenues and fee income in a more challenging macro-economic environment.
In International Private Bank, net revenues were € 3.8 billion, up 19% year on year, and up 9% if adjusted for the aforementioned gain on sale, and for Sal. Oppenheim workout activities. Revenue growth was mainly attributable to higher deposit revenues due to interest rate increases, continued loan book expansion and positive foreign exchange rate movements. Revenues from investment products benefitted from net inflows, but were also impacted by a more challenging market environment. International Private Bank attracted net new volumes of € 29 billion across loans and assets under management in the full year, the highest since its formation.
Assets under management in Private Bank declined by € 36 billion to € 518 billion at year end. This development reflected € 56 billion in negative impacts from market developments and a € 15 billion disposal net effect after the sale of the Financial Advisors business in Italy, partly offset by € 30 billion net inflows and a € 6 billion positive impact from foreign exchange rate movements.
57 |
Deutsche Bank | ||
Annual Report 2022 | ||
Provision for credit losses was € 583 million, 22 basis points of average loans, partly driven by certain single exposures in the international franchise. Excluding these, the development of the overall portfolio continued to reflect the high quality of the loan book and ongoing tight risk discipline. This compares to € 446 million provision for credit losses in the prior year, which benefitted from a more stable macroeconomic environment.
Noninterest expenses were € 6.6 billion, a reduction of 11% year on year. This development reflected a positive impact from the release of litigation provisions recorded in the prior year related to the BGH ruling, lower restructuring expenses in the context of the execution of strategic objectives and a year-on-year reduction in adjusted costs of 5%. The latter was driven by incremental savings from transformation initiatives including workforce reductions and the closure of more than 170 branches. Ongoing cost management and lower internal service cost allocations also contributed to the reduction in adjusted costs. These effects were partly offset by a negative impact from foreign exchange rate movements.
2021
In 2021, Private Bank made significant progress in the execution of its transformation strategy and in its priority to grow business volumes. Net new business volumes were € 46 billion across assets under management and loans. Profit before tax of € 355 million in 2021 was impacted by transformation related effects of € 458 million including € 237 million restructuring and severance expenses as well as € 221 million transformation charges. This compares to a loss before tax of € 108 million in 2020, which included a € 88 million negative impact from the sale of Postbank Systems AG and transformation related effects of € 642 million. Adjusted for transformation related effects and for specific revenue items related to Sal. Oppenheim workout activities in International Private Bank, profit before tax was € 711 million in 2021 despite negative impacts of € 284 million from the BGH ruling. This compares to an adjusted profit before tax of € 509 million in 2020. The year over year improvement mainly reflected lower provision for credit losses and revenue growth.
Net revenues of € 8.2 billion in 2021 increased by € 109 million, or 1%, compared to 2020. Revenues were up 2% year on year if adjusted for the aforementioned loss of € 88 million in the prior year from the sale of Postbank Systems AG and a negative revenue impact of € 154 million in 2021 related to the BGH ruling. Business growth in investment products and loans in a normalizing market environment more than offset significant interest rate headwinds. Revenues also benefited from the ECB’s TLTRO III program.
In Private Bank Germany, net revenues were € 5.0 billion and remained stable year on year. Excluding the impact of the BGH ruling and the aforementioned negative impact from the sale of Postbank Systems AG in prior year, revenues were up 2%. Continued strong business growth in investment and mortgage products mitigated significant deposit margin compression impacts. Revenue growth also benefited from the ECB’s TLTRO III program.
Net revenues in International Private Bank of € 3.2 billion increased by € 90 million, or 3% year on year. Headwinds from lower interest rates and negative impacts from foreign currency translation were more than offset by sustained business growth in investment products and lending supported by continued hiring of relationship managers. Revenue growth also benefited from the ECB’s TLTRO III program.
Assets under management of € 554 billion increased by € 59 billion compared to December 31, 2020. The increase was mainly attributable to € 30 billion net inflows as well as € 23 billion market appreciation and € 8 billion positive impact from foreign exchange rate movements. Net inflows of € 30 billion during 2021 were mainly in investment products.
Provision for credit losses amounted to € 446 million in 2021 compared to € 711 million in 2020. The year-on-year decrease of 37% reflected a more benign macroeconomic environment, tight risk discipline and a high-quality loan book.
Noninterest expenses were € 7.4 billion, down € 89 million, or 1% year on year, reflecting lower transformation related effects partly offset by higher litigation charges, which included a € 128 million negative impact related to the BGH ruling. Adjusted costs excluding transformation charges of € 6.8 billion increased by € 43 million, or 1% year on year. Incremental savings from transformation initiatives were offset by higher spend for technology and internal services, higher costs for deposit protection schemes and higher variable compensation driven by improved business performance. The increase also reflected the non-recurrence of a one-time benefit in the prior year associated with pension obligations.
58 |
Deutsche Bank | ||
Annual Report 2022 | ||
Asset Management
2022 increase (decrease) | 2021 increase (decrease) | |||||||||||||
in € m. | 2022 | 2021 | 2020 | in € m. | in % | in € m. | in % | |||||||
Net revenues | ||||||||||||||
Management fees | 2,458 | 2,370 | 2,136 | 88 | 4 | 233 | 11 | |||||||
Performance and transaction fees | 125 | 212 | 90 | (86) | (41) | 122 | 135 | |||||||
Other | 24 | 126 | 3 | (102) | (81) | 123 | N/M | |||||||
Total net revenues | 2,608 | 2,708 | 2,229 | (100) | (4) | 478 | 21 | |||||||
Provision for credit losses | (2) | 5 | 2 | (6) | N/M | 3 | 148 | |||||||
Noninterest expenses | ||||||||||||||
Compensation and benefits | 899 | 822 | 740 | 77 | 9 | 82 | 11 | |||||||
General and administrative expenses | 869 | 840 | 763 | 29 | 3 | 77 | 10 | |||||||
Impairment of goodwill and other intangible assets | 68 | 0 | 0 | 68 | N/M | (0) | N/M | |||||||
Restructuring activities | 0 | 2 | 22 | (2) | (95) | (20) | (92) | |||||||
Total noninterest expenses | 1,836 | 1,664 | 1,526 | 173 | 10 | 138 | 9 | |||||||
Noncontrolling interests | 174 | 223 | 157 | (49) | (22) | 66 | 42 | |||||||
Profit (loss) before tax | 598 | 816 | 544 | (217) | (27) | 272 | 50 | |||||||
Total assets (in € bn.)1 | 10 | 10 | 9 | (0) | (2) | 1 | 10 | |||||||
Assets under management (in € bn.) | 821 | 928 | 793 | (106) | (11) | 135 | 17 | |||||||
Net flows (in € bn.) | (20) | 48 | 30 | (68) | N/M | 17 | N/M | |||||||
Total employees (directly-managed, full-time equivalent) | 4,283 | 4,072 | 3,926 | 211 | 5 | 146 | 4 | |||||||
N/M – Not meaningful
Prior years comparatives aligned to presentation in the current year
1Segment assets represent consolidated view, i.e. the amounts do not include intersegment balances
2022
Profit before tax was € 598 million, down 27%, mainly driven by significantly lower performance fees and other income, and an impairment of intangibles assets. Adjusted for restructuring and severance expenses and impairments of goodwill and other intangible assets, profit before tax was € 703 million, down 16%.
Net revenues for 2022 were € 2.6 billion, down 4%, as higher management fees were more than offset by significantly lower performance fees, reflecting the non-recurrence of a performance fee of € 89 million from an Active Asset fund recognized in 2021, and significantly lower other revenues.
Noninterest expenses were € 1.8 billion in 2022, up 10%. Adjusted costs increased by 4%, mainly due to higher compensation and benefits driven by a rise in headcount to support transformation and growth. Non-operating costs include a € 68 million impairment of an unamortized intangible asset related to U.S. mutual fund retail contracts. The cost/income ratio was 70%, up 9 percentage points compared to the prior year.
Net flows were negative € 20 billion, primarily in lower margin products Fixed Income, Cash and Passive, impacted by industry-wide pressure on flows. This was partly offset by net inflows in higher-margin products Multi Asset and Alternatives. ESG products attracted net inflows of € 1 billion in 2022 despite the adverse environment.
Assets under Management decreased by € 106 billion, or 11%, to € 821 billion during 2022, mainly driven by negative market developments and net outflows, while foreign exchange rate movements had a positive impact.
The following table provides the development of assets under management during 2022, broken down by product type as well as the respective management fee margins:
in € bn. | Active | Active | Active | Active | Active | Passive | Alternatives | Assets under | ||||||||
Balance as of December 31, 2021 | 116 | 227 | 70 | 77 | 84 | 238 | 115 | 928 | ||||||||
Inflows | 16 | 39 | 16 | 10 | 562 | 81 | 17 | 741 | ||||||||
Outflows | (17) | (51) | (10) | (11) | (568) | (88) | (16) | (761) | ||||||||
Net Flows | (1) | (12) | 6 | (0) | (6) | (7) | 1 | (20) | ||||||||
FX impact | 2 | 7 | 0 | 0 | 2 | 7 | 4 | 22 | ||||||||
Performance | (18) | (28) | (8) | (13) | 0 | (38) | (2) | (108) | ||||||||
Other | (0) | 1 | 0 | (0) | (0) | (1) | 0 | 0 | ||||||||
Balance as of December 31, 2022 | 99 | 194 | 68 | 64 | 80 | 199 | 118 | 821 | ||||||||
Management fee margin (in bps) | 71 | 12 | 31 | 29 | 3 | 18 | 50 | 28 | ||||||||
59 |
Deutsche Bank | ||
Annual Report 2022 | ||
2021
Profit before tax was € 816 million, up 50%, while adjusted profit before tax was € 840 million, up 43%. The strong increase was driven by significantly higher revenues.
Net revenues for 2021 were € 2.7 billion, up 21%, mainly due to increased management fees and supported by higher performance fees and other revenues, partly reflecting seven consecutive quarters of net inflows and growth in assets under management.
Noninterest expenses were € 1.7 billion in 2021, up 9%. Adjusted costs excluding transformation charges increased by 10%, reflecting higher compensation and benefits costs and increased costs for services in connection with higher assets under management and volumes. The cost/income ratio was 61%, an improvement of 7 percentage points over the prior year.
Net inflows were € 48 billion, primarily driven by Passive and Active (excluding cash) and further supported by Alternatives and Cash products. ESG dedicated funds accounted for 40% of total annual net inflows.
Assets under Management grew by € 135 billion, or 17%, to € 928 billion during 2021, driven by a combination of record net inflows, supportive market developments and positive exchange rate movements.
The following table provides the development of assets under management during 2021, broken down by product type as well as the respective management fee margins:
in € bn. | Active | Active | Active | Active | Active | Passive | Alternatives | Assets under | ||||||||
Balance as of December 31, 2020 | 97 | 220 | 59 | 69 | 75 | 179 | 93 | 793 | ||||||||
Inflows | 16 | 47 | 13 | 14 | 510 | 95 | 14 | 708 | ||||||||
Outflows | (16) | (43) | (9) | (11) | (504) | (69) | (9) | (660) | ||||||||
Net Flows | (1) | 5 | 4 | 2 | 6 | 26 | 6 | 48 | ||||||||
FX impact | 2 | 8 | 0 | 0 | 4 | 8 | 3 | 26 | ||||||||
Performance | 18 | (4) | 6 | 5 | (0) | 25 | 11 | 60 | ||||||||
Other | (0) | (0) | 1 | 0 | (0) | (1) | 1 | 1 | ||||||||
Balance as of December 31, 2021 | 116 | 227 | 70 | 77 | 84 | 238 | 115 | 928 | ||||||||
Management fee margin (in bps) | 72 | 13 | 33 | 28 | 3 | 18 | 49 | 28 | ||||||||
60 |
Deutsche Bank | ||
Annual Report 2022 | ||
Capital Release Unit
2022 increase (decrease) | 2021 increase (decrease) | |||||||||||||
in € m. | 2022 | 2021 | 2020 | in € m. | in % | in € m. | in % | |||||||
Net revenues | (28) | 26 | (225) | (54) | N/M | 251 | N/M | |||||||
Provision for credit losses | (17) | (42) | 29 | 25 | (59) | (70) | N/M | |||||||
Noninterest expenses | ||||||||||||||
Compensation and benefits | 60 | 128 | 168 | (68) | (53) | (40) | (24) | |||||||
General and administrative expenses | 864 | 1,306 | 1,774 | (442) | (34) | (468) | (26) | |||||||
Impairment of goodwill and other intangible assets | 0 | 0 | 0 | 0 | N/M | 0 | N/M | |||||||
Restructuring activities | (2) | (2) | 5 | 0 | (21) | (7) | N/M | |||||||
Total noninterest expenses | 922 | 1,432 | 1,947 | (510) | (36) | (515) | (26) | |||||||
Noncontrolling interests | – | 0 | (0) | 0 | N/M | 0 | N/M | |||||||
Profit (loss) before tax | (932) | (1,364) | (2,200) | 431 | (32) | 836 | (38) | |||||||
Total assets (in € bn.)1 | 62 | 132 | 198 | (70) | (53) | (66) | (33) | |||||||
Total employees (directly-managed, full-time equivalent) | 194 | 267 | 472 | (73) | (27) | (205) | (43) | |||||||
N/M – Not meaningful
Prior year’s comparatives aligned to presentation in the current year
1Segment assets represent consolidated view, i.e. the amounts do not include intersegment balances
2022
Capital Release Unit reported a loss before tax of € 932 million in 2022, a reduction of 32% from a loss of € 1.4 billion in 2021, primarily reflecting year on year cost reductions.
Net revenues were negative € 28 million in 2022, compared to positive € 26 million in the prior year, with lower revenues due to the non-recurrence of the Prime Finance cost recovery that more than offset lower de-risking and funding impacts.
Noninterest expenses declined by 36% compared to prior year, primarily driven by a 35% reduction in adjusted costs, reflecting lower internal service charges and a decline in direct compensation and noncompensation costs.
Provision for credit losses were a net release of € 17 million in 2022, compared to a net release of € 42 million in 2021. The net release in both years were driven by recoveries across shipping and other legacy portfolios.
At the end of 2022, leverage exposure was reduced to € 22 billion, down 43% from the end of 2021 and down 91% since the creation of the Capital Release Unit in mid-2019.
Risk-weighted assets (RWA) were € 24 billion at the end of 2022, down by 13% year on year and by 63%, or 83% excluding Operational Risk RWA since the Capital Release Unit’s creation. As at year-end 2022, risk-weighted assets of € 24 billion included € 19 billion of Operational Risk RWA.
Having fulfilled its de-risking and cost reduction mandate from 2019 through the end of 2022, the Capital Release Unit will no longer be reported as a separate segment effective from the first quarter of 2023. The financial impact of the Capital Release Unit will be reported within the Corporate & Other segment. This change does not involve the transfer of assets to or from the Core businesses. Most of the remaining Capital Release Unit assets will roll off over time. These are mostly interest rate derivatives but also include the Polish FX mortgage portfolio and certain other FIC Sales & Trading and Equities assets.
2021
Capital Release Unit reported a loss before tax of € 1.4 billion in 2021, a reduction of 38% versus a loss of € 2.2 billion in 2020, primarily reflecting year on year cost reductions.
Net revenues were € 26 million in 2021, versus negative € 225 million in the prior year, as revenues from Prime Finance cost recovery and the loan portfolio were only partly offset by funding, risk management and de-risking impacts.
Provision for credit losses were a net release of € 42 million, compared to a provision of € 29 million in 2020. The net release was driven by the legacy real estate and shipping portfolios.
Noninterest expenses were € 1.4 billion, down 26% year on year. This development was primarily driven by a 37% reduction in adjusted costs, reflecting lower internal service charges and bank levy allocations as well as lower direct expenses.
Leverage exposure was € 39 billion at year end 2021, down from € 72 billion at the end of 2020, and ahead of the division's latest year-end 2022 target from the 2020 Investor Deep Dive of € 51 billion. This progress partly reflected the transfer of Deutsche Bank’s Global Prime Finance and Electronic Equities businesses, which was successfully completed by the end of 2021, in line with the target timeline.
Risk-weighted assets were € 28 billion at the end of 2021, down from € 34 billion at the end of 2020 and ahead of the bank’s year-end 2022 target of € 32 billion.
61 |
Deutsche Bank | ||
Annual Report 2022 | ||
Corporate & Other
| 2022 increase (decrease) | 2021 increase (decrease) | ||||||||||||
in € m. | 2022 | 2021 | 2020 | in € m. | in % | in € m. | in % | |||||||
Net revenues | (877) | (340) | (534) | (537) | 158 | 194 | (36) | |||||||
Provision for credit losses | 8 | 5 | (4) | 3 | 53 | 9 | N/M | |||||||
Noninterest expenses | ||||||||||||||
Compensation and benefits | 3,165 | 3,012 | 3,215 | 153 | 5 | (204) | (6) | |||||||
General and administrative expenses | (2,272) | (2,009) | (2,651) | (263) | 13 | 641 | (24) | |||||||
Impairment of goodwill and other intangible assets | 0 | 0 | 0 | 0 | N/M | 0 | N/M | |||||||
Restructuring activities | 0 | (0) | 3 | 0 | N/M | (3) | N/M | |||||||
Total noninterest expenses | 893 | 1,002 | 568 | (109) | (11) | 435 | 77 | |||||||
Noncontrolling interests | (190) | (206) | (169) | 16 | (8) | (37) | 22 | |||||||
Profit (loss) before tax | (1,589) | (1,142) | (929) | (447) | 39 | (213) | 23 | |||||||
Employees (full-time equivalent) | 31,865 | 30,103 | 29,627 | 1,762 | 6 | 476 | 2 | |||||||
N/M – not meaningful
Prior year’s comparatives aligned to presentation in the current year
2022
Corporate & Other reported a loss before tax of € 1.6 billion in 2022 compared to a loss before tax of 1.1 billion in 2021, primarily reflecting lower net revenues.
Net revenues were negative € 877 million in 2022, compared to negative € 340 million in 2021. Revenues related to valuation and timing differences were negative € 119 million in 2022, compared to € 158 million in 2021. Net revenues relating to funding and liquidity were negative € 311 million in 2022, versus negative € 242 million in 2021.
Noninterest expenses were € 893 million in 2022, a reduction of € 109 million, or 11%, compared to 2021. The reduction was primarily driven by € 603 million of transformation related expenses booked in 2021, partly related to a contract settlement and software impairments, mainly triggered by the bank’s migration to the cloud technology. The decline in transformation related expenses more than offset the increase from certain higher than planned infrastructure expenses in 2022 that were retained centrally in Corporate & Other. Expenses associated with shareholder activities as defined in the OECD Transfer Pricing guidelines not allocated to the business divisions were € 506 million in 2022, versus € 460 million in 2021.
Noncontrolling interests are deducted from the profit before tax of the divisions and reversed in Corporate & Other. These amounted to € 190 million in 2022, compared to € 206 million in 2021, mainly related to DWS.
2021
Corporate & Other reported a loss before tax of € 1.1 billion in 2021 compared to a loss before tax of € 929 million in 2020, primarily reflecting higher noninterest expenses.
Net revenues were negative € 340 million in 2021, compared to negative € 534 million in 2020. Revenues related to valuation and timing differences were € 158 million in 2021, compared to negative € 85 million in 2020. This improvement was driven by the positive mark-to-market impact from interest rate hedging activities in connection with the bank’s funding arrangements where hedge accounting cannot be applied. Net revenues relating to funding and liquidity were negative € 242 million in 2021, versus negative € 235 million in 2020.
Noninterest expenses were € 1.0 billion in 2021, an increase of € 435 million, or 77%, compared to 2020. 2021 noninterest expenses included € 603 million of transformation related expenses, partly related to a contract settlement and software impairments, partly triggered by the bank’s migration to the cloud technology. Expenses associated with shareholder activities as defined in the OECD Transfer Pricing guidelines not allocated to the business divisions were € 460 million in 2021, versus € 403 million in 2020.
Noncontrolling interests are deducted from the profit before tax of the divisions and reversed in Corporate & Other. These amounted to € 206 million in 2021, compared to € 169 million in 2020, mainly related to DWS.
62 |
Deutsche Bank | ||
Annual Report 2022 | ||
Financial Position
Assets
in € m. | Dec 31, 2022 | Dec 31, 2021 | Absolute | Change | ||||
Cash, central bank and interbank balances | 186,091 | 199,363 | (13,272) | (7) | ||||
Central bank funds sold, securities purchased under resale agreements and securities borrowed | 11,478 | 8,432 | 3,047 | 36 | ||||
Financial assets at fair value through profit or loss | 482,376 | 491,233 | (8,857) | (2) | ||||
Of which: Trading assets | 92,867 | 102,396 | (9,529) | (9) | ||||
Of which: Positive market values from derivative financial instruments | 299,686 | 299,732 | (45) | (0) | ||||
Of which: Non-trading financial assets mandatory at fair value through profit and loss | 89,654 | 88,965 | 689 | 1 | ||||
Financial assets at fair value through other comprehensive income | 31,675 | 28,979 | 2,696 | 9 | ||||
Loans at amortized cost | 483,700 | 471,319 | 12,381 | 3 | ||||
Remaining assets | 141,468 | 124,668 | 16,800 | 13 | ||||
Of which: Brokerage and securities related receivables | 71,250 | 71,495 | (245) | (0) | ||||
Total assets | 1,336,788 | 1,323,993 | 12,796 | 1 | ||||
Liabilities and Equity
in € m. | Dec 31, 2022 | Dec 31, 2021 | Absolute | Change | ||||
Deposits | 621,456 | 603,750 | 17,706 | 3 | ||||
Central bank funds purchased, securities sold under repurchase | 585 | 772 | (187) | (24) | ||||
Financial liabilities at fair value through profit or loss | 388,072 | 400,857 | (12,784) | (3) | ||||
Of which: Trading liabilities | 50,616 | 54,718 | (4,102) | (7) | ||||
Of which: Negative market values from derivative financial instruments | 282,353 | 287,108 | (4,756) | (2) | ||||
Of which: Financial liabilities designated at fair value through profit or loss | 54,634 | 58,468 | (3,834) | (7) | ||||
Other short-term borrowings | 5,122 | 4,034 | 1,089 | 27 | ||||
Long-term debt | 131,525 | 144,485 | (12,959) | (9) | ||||
Remaining liabilities | 117,700 | 102,066 | 15,634 | 15 | ||||
Of which: Brokerage and securities related payables | 82,711 | 70,165 | 12,546 | 18 | ||||
Total liabilities | 1,264,460 | 1,255,962 | 8,498 | 1 | ||||
Total equity | 72,328 | 68,030 | 4,298 | 6 | ||||
Total liabilities and equity | 1,336,788 | 1,323,993 | 12,796 | 1 | ||||
Movements in Assets and Liabilities
As of December 31, 2022, the total balance sheet of € 1.3 trillion was essentially flat compared to year-end 2021.
In the fourth quarter 2022, Deutsche Bank partially prepaid TLTRO funding in respect of the tranche maturing in June 2023, in line with the bank’s communicated strategy to actively manage the maturity profile of its TLTRO participation. This prepayment was the main driver for the decrease in cash, central bank and interbank balances by € 13.3 billion and in long term debt by € 13.0 billion, respectively.
Trading assets and trading liabilities decreased by € 9.5 billion and by € 4.1 billion, respectively, primarily driven by debt securities, mainly due to managed reductions and decreased bond positions in Europe and U.S. rates business due to volatile market conditions.
Positive and negative market values of derivative financial instruments are largely flat year on year. The increase in positive and negative market values during the first three quarters was offset by a corresponding decrease in the fourth quarter, mainly driven by moves in foreign exchange products in the Investment Bank due to a weakening of the U.S. dollar versus the euro and moves in interest rate curves.
Loans at amortized cost increased by € 12.4 billion, primarily driven by higher origination across the financing businesses in the Investment Bank as well as continued growth in collateralized lending and mortgages in the Private Bank.
Deposits increased by € 17.7 billion. Given the current macro environment, corporate clients are holding higher cash reserves in the Corporate Bank along with higher inflows in the Private Bank and Global Emerging Markets in the Investment Bank.
Remaining assets increased by € 16.8 billion, mainly driven by growth in debt securities classified as hold to collect in line with the bank’s strategic initiative to optimize return on excess liquidity. Remaining liabilities increased by € 15.6 billion mainly attributable to an increase in cash margin payables driven by increased client volume and trading activity.
63 |
Deutsche Bank | ||
Annual Report 2022 | ||
The overall movement of the balance sheet included an increase of € 20.8 billion due to foreign exchange rate movements, mainly driven by a strengthening of the U.S. dollar against the euro. The effects from foreign exchange rate movements are embedded in the movement of the balance sheet line items discussed in this section.
Liquidity
Total High Quality Liquid Assets (HQLA) as defined by the Commission Delegated Regulation (EU) 2015/61 and amended by Regulation (EU) 2018/1620 were € 219 billion as of December 31, 2022, a € 12 billion increase from € 207 billion as of December 31, 2021. The Group maintains additional highly liquid central bank eligible assets, not qualifying as HQLA or subject to transfer restrictions under the HQLA definition. These additional liquid assets were € 37 billion as at the end of December 31, 2022, such that the Group’s total Liquidity Reserves were € 256 billion. The increase is primarily driven by higher deposits and new capital market issuances partially offset by increased lending activity and partial repayment of the ECB’s TLTRO. The Liquidity Coverage Ratio was 142% at the end fourth quarter of 2022, a surplus to regulatory requirements of € 64 billion as compared to 133% as at the end of fourth quarter of 2021, a surplus to regulatory requirements of € 52 billion.
Equity
Total equity as of December 31, 2022 increased by € 4.3 billion compared to December 31, 2021. This change was driven by a number of factors including the profit reported for the period of € 5.5 billion and an issuance of additional equity components (Additional Tier 1 securities, treated as equity in accordance with IFRS) of € 2 billion (issued € 750 million on April 4, 2022 and € 1.3 billion on November 14, 2022). Further contributing to the increase were a positive impact from remeasurement gains related to defined benefit plans of € 553 million, net of tax, a positive impact from foreign currency translation of € 452 million, net of tax, mainly resulting from the strengthening of the U.S. dollar against the Euro, as well as a change in noncontrolling interests of € 94 million, net of tax. This was partly offset by a repayment of additional equity components (Additional Tier 1 securities, treated as equity in accordance with IFRS) of € 1.8 billion on May 2, 2022, unrealized net losses of financial assets at fair value through other comprehensive income of € 867 million, net of tax, and unrealized net losses on derivatives hedging variability of cashflows of € 537 million, net of tax. Further factors were coupons paid on additional equity components of € 479 million, cash dividends paid to Deutsche Bank shareholders of € 406 million as well as net purchases of treasury shares of € 325 million.
Own Funds
Deutsche Bank’s CRR/CRD Common Equity Tier 1 capital as of December 31, 2022, increased by € 1.6 billion to € 48.1 billion, compared to € 46.5 billion as of December 31, 2021.The Risk-weighted assets (RWA) increased by € 8.4 billion to € 360.0 billion as of December 31, 2022, compared to € 351.6 billion as of December 31, 2021. The CET 1 capital ratio increased to 13.4% on December 31, 2022, from 13.2% on December 31, 2021, as a result of an increase in CET 1 capital of 0.5%, which was partially offset by an increase in RWA of 0.3%.
The Bank’s Tier 1 capital as of December 31, 2022, amounted to € 56.6 billion, consisting of a CET 1 capital of € 48.1 billion and Additional Tier 1 capital of € 8.5 billion. The Tier 1 capital was € 1.2 billion higher than at the end of December 31, 2021, driven by an increase in CET 1 capital of € 1.6 billion and decrease in AT1 capital of € 0.4 billion since year end 2021. The Tier 1 capital ratio as of December 31, 2022, remains unchanged at 15.7% compared to December 31, 2021.
Total Regulatory capital as of December 31, 2022, amounted to € 66.1 billion compared to € 62.7 billion at the end of December 31, 2021. The Total capital increase was driven by an increase in Tier 1 capital of € 1.2 billion and an increase in Tier 2 capital of € 2.2 billion since year end 2021. The Total capital ratio as of December 31, 2022, increased to 18.4% compared to 17.8% on December 31, 2021.
64 |
Deutsche Bank | ||
Annual Report 2022 | ||
Liquidity and Capital Resources
For a detailed discussion of our liquidity risk management, see our Risk Report.
Credit Ratings
Deutsche Bank is rated by Moody’s France SAS (“Moody’s”), S&P Global Ratings UK Limited (“S&P”), Fitch Ratings, a branch of Fitch Ratings Ireland Limited (“Fitch”), and DBRS Ratings GmbH (“DBRS Morningstar”, together with Moody’s, S&P and Fitch, the “rating agencies”).
Moody’s, Fitch and DBRS Morningstar are established in the European Union and have been registered in accordance with Regulation (EC) No 1060/2009 of the European Parliament and of the Council of September 16, 2009, as amended, on credit rating agencies (“CRA Regulation”). With respect to S&P, the credit ratings are endorsed by S&P’s office in Ireland (S&P Global Ratings Europe Limited) in accordance with Article 4(3) of the CRA Regulation.
Credit Ratings Development
The rating agencies recognized the continued progress the bank has made towards its targets over the course of 2022, specifically further improvements in profitability. This was reflected in an upgrade by Moody’s, an outlook revision by DBRS Morningstar and the affirmation of ratings and outlook by Fitch over the course of the year.
On July 1, 2022, DBRS Morningstar revised its outlook on Deutsche Bank’s long-term ratings to positive from stable. DBRS Morningstar reflected the significant progress made by Deutsche Bank in its transformation program, which in their view has strengthened the bank’s franchise and started to lead to higher and more sustainable profitability, while maintaining solid capital ratios and a well-managed risk profile. In addition, the outlook change highlights the expectation that Deutsche Bank will continue to improve its profitability.
On September 13, 2022, Fitch affirmed Deutsche Bank’s ratings as well as the positive outlook. The affirmation reflects the bank’s good restructuring progress and the stabilization of its business model, with most significant revenue improvement and franchise stabilization in the Investment Bank. In addition, the ratings also reflect Deutsche Bank’s sound asset quality, funding and liquidity as well as adequate capitalization.
On October 12, 2022, Moody’s upgraded Deutsche Bank’s long-term ratings by one notch. The bank’s long-term deposit and long-term senior unsecured (senior preferred) debt ratings as well as the Issuer Rating have been upgraded to A1 from A2. The outlook on these ratings has been changed to stable from positive. In addition, the bank’s junior senior unsecured (senior non-preferred) debt ratings were raised to Baa1 from Baa2 as well as its Baseline Credit Assessment (BCA) to baa2 from baa3. Moody’s highlighted Deutsche Bank’s continued progress towards meeting its medium-term targets, in particular through the improvement in profitability. Moody’s expects Deutsche Bank’s meaningfully reduced expense base to allow the bank to safeguard operating leverage in times of temporarily higher inflation and thereby maintain its regained earnings strength.
All rating agencies will closely monitor further progress made towards the bank’s 2022 targets, with a focus on further improvements in profitability. Moreover, the rating agencies are looking for sustainable profitability beyond 2022, while maintaining a prudent risk management and strong asset quality.
65 |
Deutsche Bank | ||
Annual Report 2022 | ||
Potential Impacts of Ratings Downgrades
Deutsche Bank calculates both the contractual and hypothetical potential impact of a one-notch and two-notch downgrade by the rating agencies (Moody’s, S&P and Fitch) on its liquidity position and includes this impact in its daily liquidity stress test and Liquidity Coverage Ratio calculations. The LCR and liquidity stress test results by scenario are disclosed separately.
In terms of contractual obligations, the hypothetical impact on derivative liquidity stress outflows of a one-notch downgrade across the three rating agencies Moody’s, S&P and Fitch amounts to approximately € 0.4 billion, mainly driven by increased contractual derivatives funding and/or margin requirements. The hypothetical impact of a two-notch downgrade amounts to approximately € 0.4 billion, mainly driven by increased contractual derivatives funding and/or margin requirements.
The above analysis assumes a simultaneous downgrade by the three rating agencies Moody’s, S&P and Fitch that would consequently reduce Deutsche Bank’s funding capacity in the stated amounts. This specific contractual analysis feeds into the bank’s idiosyncratic liquidity stress test scenario.
The actual impact of a downgrade to Deutsche Bank is unpredictable and may differ from potential funding and liquidity impacts described above.
Selected rating categories
Counterparty Risk | Senior preferred/ | Senior | Short-term rating | |||||
Moody’s Investors Service, New York | A1 (cr) | A1 | Baa1 | P-1 | ||||
Standard & Poor’s, New York | - | A- | BBB- | A-2 | ||||
Fitch Ratings, New York | A- (dcr) | A- | BBB+ | F2 | ||||
DBRS, Toronto | A (high) | A (low) | BBB (high) | R-1 (low) | ||||
1Defined as senior unsecured bank rating at Moody‘s, senior unsecured debt at Standard & Poor’s, senior preferred debt rating at Fitch and senior debt rating at DBRS. All agencies provide separate ratings for deposits and ‘senior preferred’ debt, but at the same rating level.
2Defined as junior senior debt rating at Moody's, as senior subordinated debt at Standard & Poor’s and as senior non-preferred debt at Fitch and DBRS.
Each rating reflects the view of the rating agency only at the time the rating was issued, and each rating should be separately evaluated, and the rating agencies should be consulted for any explanations of the significance of their ratings. The rating agencies can change their ratings at any time if they believe that circumstances so warrant. The long-term credit ratings should not be viewed as recommendations to buy, hold or sell Deutsche Bank’s securities.
Tabular Disclosure of Contractual Obligations
Cash payment requirements outstanding as of December 31, 2022.
Contractual obligations | Payment due | |||||||||
in € m. | Total | Less than 1 year | 1–3 years | 3–5 years | More than 5 years | |||||
Long-term debt obligations¹ | 145,695 | 50,053 | 36,581 | 32,747 | 26,314 | |||||
Trust preferred securities1,2 | 514 | 514 | 0 | 0 | 0 | |||||
Long-term financial liabilities designated at fair value through profit or loss3 | 5,351 | 2,208 | 1,545 | 742 | 855 | |||||
Future cash outflows not reflected in the measurement of Lease liabilities4 | 5,889 | 14 | 207 | 406 | 5,263 | |||||
Lease liabilities1 | 5,460 | 632 | 807 | 807 | 3,214 | |||||
Purchase obligations | 4,221 | 781 | 1,622 | 897 | 921 | |||||
Long-term deposits¹ | 26,126 | 0 | 12,314 | 4,077 | 9,735 | |||||
Other long-term liabilities | 787 | 513 | 62 | 30 | 181 | |||||
Total | 194,042 | 54,716 | 53,138 | 39,706 | 46,482 | |||||
1Includes interest payments.
2Contractual payment date or first call date.
3Long-term debt and long-term deposits designated at fair value through profit or loss.
4 For further detail please refer to Note 22 “Leases”.
Purchase obligations for goods and services include future payments for, among other things, information technology services and facility management. Some figures above for purchase obligations represent minimum contractual payments and actual future payments may be higher. Long-term deposits exclude contracts with a remaining maturity of less than one year. Under certain conditions future payments for some long-term financial liabilities designated at fair value through profit or loss may occur earlier. See the following notes to the consolidated financial statements for further information: Note 5 “Net Interest Income and Net Gains (Losses) on Financial Assets/Liabilities at Fair Value through Profit or Loss”, Note 22 “Leases”, Note 26 “Deposits” and Note 30 “Long-Term Debt and Trust Preferred Securities”.
66 |
Deutsche Bank | ||
Annual Report 2022 | ||
Outlook
The following section provides an overview of Deutsche Bank’s outlook for the Group and business divisions for the financial year 2023. The outlook for the global economy and banking industry in the following chapter reflects the Group’s general expectations regarding future economic and industry developments. Economic assumptions used in the bank’s models are laid out separately in the respective sections.
Global economy
The Global Economy Outlook
Economic growth (in %)¹ | 2023² | 2022 | Main driver | |||
Global Economy | At the beginning of 2023, some economic parameters are showing signs of improvement. The easing of the energy shock in Europe and withdrawal of China's zero COVID-19-related policy are expected to provide tailwinds, while the expected U.S. recession is expected to be a drag. Various central banks will continue to fight inflation with further tightening steps in 2023. Lower energy prices combined with base effects are expected to dampen inflation momentum. | |||||
GDP | 2.7 | 3.3 | ||||
Inflation | 6.5 | 8.7 | ||||
Of which: | ||||||
Developed countries | In developed countries, growth momentum is expected to slow at the beginning of 2023. A recovery in the course of the year could be dampened by a U.S. recession emerging in the second half of the year. The normalization of energy prices and are expected to support growth, and the further easing of supply bottlenecks. Inflation is likely to remain above the central banks' target rates. | |||||
GDP | 0.7 | 2.7 | ||||
Inflation | 4.4 | 7.4 | ||||
Emerging markets | Emerging markets economies are expected to expand in 2023, albeit at a somewhat slower pace. The European regions in particular are affected by the economic spillovers of the war in Ukraine. In Asia, on the other hand, the reopening of China is likely to be the determining factor. Lower energy prices are likely to cause inflationary momentum to ease further. Central banks are expected to have passed the peak of their monetary tightening. | |||||
GDP | 3.9 | 3.7 | ||||
Inflation | 7.9 | 9.5 | ||||
Eurozone Economy | GDP growth in the Eurozone is expected to slow down in 2023. In particular, the fading energy shock and favorable gas storage levels should help avoid a deeper downturn. Fiscal support and easing of supply bottlenecks are cushioning the real income shock. Nevertheless, inflation is likely to be well above the ECB target. Continued monetary tightening is expected in the first half of the year. Headwinds from a U.S. recession would be an additional drag. | |||||
GDP | 0.5 | 3.5 | ||||
Inflation | 5.8 | 8.4 | ||||
Of which: German economy | German GDP is expected to stagnate in 2023. Due to favorable gas storage levels and broad fiscal support, the slowdown at the start of the year is expected to be relatively mild. Weakening global trade and the expected U.S. recession are likely to become headwinds to the recovery. Inflation is expected to decline, not least due to lower energy prices and strong base effects, but to still remain at an elevated level on average for the year 2023. | |||||
GDP | 0.0 | 1.8 | ||||
Inflation | 6.5 | 7.9 | ||||
U.S. Economy | As a result of the Fed's monetary tightening, the growth momentum of the U.S. economy is expected to slow down significantly in 2023. At least a slight recession cannot be ruled out in the second half of the year. Inflation is likely to have peaked but will still be above the Fed's target in 2023. A weaker labor market should play a key role in moderating inflation pressures. | |||||
GDP | 1.0 | 2.1 | ||||
Inflation | 3.6 | 8.0 | ||||
Japanese Economy | GDP growth is expected to slow somewhat in 2023 on the overseas slowdown but should remain relatively firm. Domestic demand has the potential to recover, as pandemic restrictions were only eased late in 2022. The cross-industry wage bargaining cycle could result in strong wage gains. The BoJ adjusted its policy framework, but it should maintain an accommodative policy stance. | |||||
GDP | 1.0 | 1.1 | ||||
Inflation | 2.1 | 2.5 | ||||
Asian Economy³ | The Asian economies should benefit noticeably from the expected recovery in China. However, headwinds are expected from the economic slowdown in the industrialized countries. As a result, exports – Asia's main growth engine – could weaken. Inflation is likely to have peaked. However, government measures, which vary from region to region, are likely to lead to a volatile decline. | |||||
GDP | 5.3 | 4.2 | ||||
Inflation | 3.4 | 3.8 | ||||
Of which: Chinese Economy | In 2023, China's economy is expected to recover noticeably as it has finally relieved itself of the burden of strict COVID-19 policy. Reopening will likely also help boost housing demand. Property policies have already eased substantially and are no longer constraining the recovery. Both fiscal and monetary policy are likely continued to ease in 2023. | |||||
GDP | 6.0 | 3.0 | ||||
Inflation | 2.5 | 2.0 | ||||
1Annual Real GDP Growth (% YoY). Sources: National Authorities unless stated otherwise
2Sources: Deutsche Bank Research
3Includes China, Hong Kong, India, Indonesia, Malaysia, Philippines, Singapore, Sri Lanka, South Korea, Taiwan, Thailand and Vietnam; excludes Japan
There are a number of risks to the bank’s global economic outlook. Geopolitical risks remain elevated in Ukraine, and U.S. versus China strategic competition could possibly continue to intensify. Although there is tentative evidence of a peak, inflation is still at undesirably high levels, and both the Fed and ECB are unlikely to tolerate higher inflation. If inflation fails to recede, it could lead to central banks taking a more aggressive tightening stance, potentially causing a sharply negative reaction in financial markets and most likely an economic recession. A U.S. recession is expected in the second half of 2023, but there is a risk it will come earlier.
67 |
Deutsche Bank | ||
Annual Report 2022 | ||
Banking industry
The global banking industry may continue to benefit from normalized and further rising interest rates in 2023. This should continue to strengthen net interest margins, despite funding costs also creeping up. Likewise, inflation dynamics will have an impact on growth in operating expenses. Following a lending surge last year, credit demand both for mortgages as well as corporate loans may abate due to higher rates and subdued economic growth in most major economies. Asset quality could weaken slightly but is expected to remain very robust overall. Loan loss provisions continue to edge up, from low levels. Absent further shocks, capital market volatility and trading activity could decrease, while corporate finance momentum could pick up following headwinds in the past year. Overall, banking sector profitability, and returns to shareholders are expected to remain strong.
Banks in Europe are expected to benefit more than peers in other regions from the abolishment of negative rates and from interest rates still rising more and for longer than elsewhere and hence are not expected to come down in 2023. On the other hand, downside risks from the war in Ukraine and the energy crisis are also more pronounced. Banks’ funding position should normalize further, with the expiration in June 2023 of a large tranche of the ECB’s TLTRO III program and banks’ greater reliance on market and customer funding. Capitalization levels are likely to stay strong even though fully loaded regulatory requirements could increase once EU policymakers have agreed on the implementation of final Basel III rules.
In the U.S., the benefits of higher interest rates could taper off earlier than in Europe but are expected to still be meaningful in 2023. A rebound in capital market issuance and mergers and acquisitions activity could potentially support investment banks particularly.
Banks in China and Japan will probably lack Western banks’ tailwind from rising interest rates. The accelerating recovery of the Chinese economy from the coronavirus pandemic may help Chinese banks’ performance.
After the United Kingdom (UK) left the European Union, the immediate future of their economic relationship is governed by a trade agreement, which does not cover cross-border financial services. Such services will be governed by either local regulatory requirements or ad-hoc agreements between regulatory bodies in the two jurisdictions. The Bank of England and the UK Financial Conduct Authority (FCA) have signed a Memorandum of Understanding with the European Securities and Markets Authority (ESMA) concerning the supervision of market infrastructure entities. A Memorandum of Understanding establishing a structured framework for regulatory cooperation and the process for adoption, suspension and withdrawal of equivalence decision between the UK and EU has been agreed in principle but is yet to be ratified by the European Parliament. To date, one time-limited equivalence decisions are active. The European Commission extended the exemption addressing continued access of European firms to UK central counterparties until June 2025. The European Commission also published revisions for further discussion on European Market Infrastructure Regulation. This will also impact the future set-up of clearing in Europe.
2023 will be the last full year of legislation in Europe before the European Parliament elections in May 2024. This means that if the negotiations on outstanding legislative files, like implementation of the Final Basel III package, EU Green Bond, Instant Payments and MiFID are not closed, these files can only be picked up again after the European Parliament elections. The UK will push ahead with reforming their own financial service framework through the Edinburgh reforms. More detailed proposals on specific areas will be published during the course of 2023. This will lead to divergence of the UK versus the European financial services framework.
68 |
Deutsche Bank | ||
Annual Report 2022 | ||
Deutsche Bank Group
The Group believes that the fundamental transformation announced in 2019 and completed at year-end 2022 has led to a strong foundation for the Group and positioned it to build and maintain a trajectory of sustainable growth. In March 2022, Deutsche Bank outlined its strategic and financial road map through 2025, referred to as Global Hausbank, and communicated its 2025 financial targets and capital objectives.
Deutsche Bank’s key performance indicators are shown in the table below.
Key performance indicators
Financial targets | Dec 31, 2022 | Financial targets and capital objectives | ||
Post-tax return on average tangible equity1 | 9.4% | Above 10.0% | ||
Compound annual growth rate of revenues2 | N/M | 3.5 to 4.5% | ||
Cost/income ratio3 | 74.9% | Less than 62.5% | ||
Capital objectives | ||||
Common Equity Tier 1 capital ratio4 | 13.4% | ~ 13.0% | ||
Total payout ratio5 | 36% | 50% | ||
1 Based on Net Income attributable to Deutsche Bank shareholders. For further information, please refer to “Supplementary Information (Unaudited): Non-GAAP Financial Measures” of this Annual Report.
2Based on net revenues.
3Noninterest expenses as a percentage of total net revenues, which are defined as net interest income before provision for credit losses plus noninterest income.
4Further detail on the calculation of this ratio is provided in the Risk Report.
52022 distributions in the form of common share dividend paid and share buybacks for cancellation executed in 2022 in relation to 2021 net income attributable to shareholders.
Deutsche Bank reaffirms its financial targets to be achieved by 2025 of a post-tax return on average tangible equity of above 10%, a compound annual revenue growth in revenues of between 3.5% and 4.5% for 2021 to 2025 and a cost/income ratio of below 62.5%. The bank also confirms its capital objectives of a CET1 capital ratio of around 13% and a payout ratio of 50% from 2025 onwards. All forward-looking projections below are based on January 31, 2023, foreign exchange rates.
In 2023, Group revenues are expected to be slightly higher compared to the prior year. Deutsche Bank expects revenues to be in the middle of the range of € 28 billion to € 29 billion at Group level supported by the resilience and growth potential of its businesses and continued business momentum. Corporate Bank revenues are expected to be higher in 2023 driven by its growth initiatives and further improvements in the interest rate environment. Investment Bank revenues are expected to be essentially flat in 2023 driven by lower revenues in FIC Sales & Trading offset by significantly higher revenues in Origination & Advisory mainly from an expected recovery in the Debt Origination business. Private Bank net revenues are expected to remain essentially flat. The division should benefit from the rising interest rate environment and from continued business growth while beneficial impacts of specific revenue items and releases in certain provisions are not expected to repeat in 2023. In Asset Management, revenues are expected to be slightly lower assuming market stabilization.
Deutsche Bank is managing the Group’s cost base towards its 2025 cost/income ratio target. The Group remains highly focused on cost discipline and delivery of the initiatives underway. The bank expects noninterest expenses as well as adjusted costs in 2023 to be essentially flat compared to 2022. Costs in 2023 are expected to benefit from the bank’s structural efficiency measures. These include the optimization of its Germany platform, the upgrade of its technology architecture, the front-to-back redesign of processes and measures to increase infrastructure efficiency. These effects are expected to counterbalance inflationary headwinds and help funding selected investments in business growth and in the control environment.
As part of the focus on cost management and improving bank-wide efficiency, Deutsche Bank over the last few years has been rolling out driver-based cost management methodologies (DBCM) to allocate infrastructure costs to the businesses. The recent methodology rollout will be effective from the first quarter of 2023 and aims to provide greater transparency over the drivers of infrastructure costs and links costs more closely to service consumption. While the Group’s cost/income ratio and return on average tangible equity metrics will be unaffected by the change in internal allocations, the respective divisional metrics will change going forward. Prior periods will be restated accordingly. The divisional Outlook sections regarding the statements on noninterest expenses and adjusted costs presented below do therefore include the trends before and after the methodology change.
69 |
Deutsche Bank | ||
Annual Report 2022 | ||
For the full year 2023, the Group expects provision for credit losses to be essentially flat compared to 2022 in a range of 25 to 30 basis points of average loans, reflecting persistent macro-economic and geopolitical uncertainties. As such and given the recent improvement in the macro- economic outlook, the bank now foresees provision for credit losses in 2023 at the low end of this range. The bank expects provision for credit losses in 2023, unlike in 2022, to be driven by single-name losses rather than a deterioration of macro-economic forward-looking indicators. Deutsche Bank remains committed to its stringent underwriting standards and tight risk management framework. Further details on the calculation of expected credit losses are provided in the section “Management Report: Risk Report”.
Common Equity Tier 1 ratio (CET 1 ratio) by year-end 2023 is expected to remain essentially flat compared to 2022. The Group expects several regulatory decisions on internal credit and market risk models in 2023. On a net basis, risk weighted assets are expected to stay essentially flat when considering model impacts, respective mitigation initiatives and business growth. Deutsche Bank aims for a Common Equity Tier 1 capital ratio of around 13% and to end 2023 with a CET 1 ratio of 200 basis points above the Maximum Distributable Amount (MDA) threshold. The timing of model decisions might drive CET1 ratio variability within the year.
Deutsche Bank is committed to delivering sustainably grown cash dividends and, over time, returning to excess capital that is over and above what is required to support profitable growth and upcoming regulatory changes shareholders through share buybacks, subject to regulatory approval, shareholder authorization and meeting German corporate law requirements. To that end, subject to meeting the Group’s strategic targets, the Management Board intends to grow the cash dividend per share by 50% per annum in the next 3 years, starting from the € 0.20 per share paid for the financial year 2021. This would translate into approximately € 3.3 billion of cumulative dividend payments by 2025 with respect to financial years 2021-2024. In relation to the financial year 2024 the bank intends to achieve a total payout ratio of 50% from a combination of dividends paid and share buybacks executed in 2025; and the bank intends to maintain a 50% total payout ratio in subsequent years. In addition to the share buyback of € 0.3 billion already concluded in 2022, successfully executing the Group’s financial and strategic plans through 2025 would therefore support the previously announced cumulative distributions to shareholders in the form of dividends paid or share buybacks executed of approximately € 8 billion in respect of financial years 2021-2025.
By the nature of its business, Deutsche Bank is involved in litigation, arbitration and regulatory proceedings and investigations in Germany and in a number of jurisdictions outside Germany, including in the United States. Such matters are subject to many uncertainties. While the Group has resolved a number of important legal matters and made progress on others, it expects the litigation and enforcement environment to remain challenging. For 2023, and with a caveat that forecasting litigation charges is subject to many uncertainties, Deutsche Bank expects net litigation charges to be lower than the levels experienced in the previous year.
Risks to the Group’s outlook include potential impacts on the business model from macroeconomic as well as geopolitical uncertainties, including uncertainties associated with the war in Ukraine, possible intensification of U.S. versus China strategic competition, global inflationary pressures due to higher energy and commodity prices as well as ongoing supply chain disruptions, slower economic growth in the major operating countries including the risk of a deeper and longer recession, impact from changes in foreign exchange rates, and lower client activity. In addition, uncertainty around central bank policies, e.g., the interest rate environment, ongoing regulatory developments, e.g., the finalization of the Basel III framework as well as other geopolitical event risks may also have an adverse impact.
Adjusted costs as well as Post-tax Return on Average Tangible Equity are non-GAAP financial measures. Please refer to “Supplementary Information (Unaudited): Non-GAAP Financial Measures” of this report for the definitions of such measures and reconciliations to the IFRS measures on which they are based.
70 |
Deutsche Bank | ||
Annual Report 2022 | ||
Deutsche Bank Business segments
Corporate Bank
Corporate Bank expects the interest rate environment and its progress on its initiatives to support the performance in 2023, despite macro-economic uncertainties. Revenues are expected to be higher compared to the prior year, driven by the growth initiatives and further improvements in the interest rates.
Corporate Treasury Services revenues are anticipated to be higher due to strong momentum in the Corporate Cash Management business and growth in structured and flow trade finance solutions and lending. Institutional Client Services revenues are expected to be essentially flat, supported by business growth and higher deposit volumes. In Business Banking, revenues are expected to be significantly higher compared to the prior year, principally due to higher interest rates in Germany.
Provision for credit losses is expected to be essentially flat in 2023 in a range of 25 to 30 basis points of average loans.
Noninterest expenses and adjusted costs are expected to be higher in 2023 compared to 2022, mainly reflecting higher internal service cost allocations. Regulatory compliance, know-your-client (KYC) and client on-boarding process enhancements, system stability and control and conduct continue to remain an area of strong focus. Adjusting the prior year for the aforementioned DBCM methodology change, Corporate Bank expects noninterest expenses and adjusted costs to be essentially flat versus 2022.
RWA in the Corporate Bank are anticipated to remain essentially flat in 2023 as increases from lending activities are expected to be offset by favorable model changes.
Risks to the division’s outlook include potential impacts on its business model from macroeconomic and global geopolitical uncertainties, including uncertainties associated with the war in Ukraine, lower economic growth in the major operating countries from ongoing supply chain disruptions, higher energy and commodity prices as well as uncertainty around central bank policies (e.g., the interest rate environment). In addition, ongoing regulatory developments (e.g., the finalization of the Basel III framework) and lower levels of client activity may also have an adverse impact.
Investment Bank
Investment Bank revenues are expected to be essentially flat in 2023 compared to prior year. 2022 was another strong year for the Investment Bank driven by FIC Sales & Trading seeing its strongest revenue performance in a decade. This managed to offset the significant decline in Origination and Advisory revenues, which saw the industry fee pool drop by 36% year-on-year combined with loan markdowns across the market. While the division expects a partial recovery in Origination and Advisory in 2023, this is likely to be largely offset by a normalization in FIC Sales & Trading.
FIC Sales & Trading revenues are expected to be lower compared to 2022. Rates plans to target and build out certain areas in the business where it sees opportunities, but expects a normalization in the market, meaning the business is unlikely to repeat the revenue performance seen in 2022. The Foreign Exchange business is expected to continue the momentum from the prior year, which saw a return to the #1 ranking in the Euromoney FX survey. Global Emerging Markets business will continue to develop its onshore footprint and client workflow solutions further, though no repeat of the RUB asset volatility and associated revenue seen in 2022 is expected. Credit Trading intends to invest in targeted areas of the business where growth opportunities are present, and expects to see a certain improvement in the overall industry environment that was challenging throughout the prior year. The Financing business will continue to take a disciplined and selective approach to the deployment of resources and look to benefit from the increase in interest rates seen in 2022.
Origination & Advisory revenues are expected to be significantly higher in 2023 compared to 2022 primarily due to an expected recovery in the Debt Origination business. The Leveraged Debt and High Yield markets were largely inactive in the second half of 2022, and the division expects to see a partial recovery this year, as the macro-economic environment starts to normalize. Additionally, the division does not expect a recurrence of the loan markdowns that occurred across the industry in 2022. The Investment Grade Debt business should maintain its robust performance from the prior year and further develop its ESG capabilities for clients. Equity Origination will continue to provide a competitive offering across products and expects to see the market start to open up again throughout the year. Advisory plans to build on the momentum of investment and market share gains in the prior year, though the division expects the fee pool to be impacted by the reduced levels of announced volumes seen in the second half of 2022.
Provisions for credit losses are expected to be essentially flat in 2023 in a range of 30 to 35 basis points of average loans.
In 2023, noninterest expenses as well as adjusted costs are expected to be slightly higher compared to the previous year driven by inflation, higher bank levy costs, strategic growth initiatives including investments in people and technology, along with increased regulatory related costs within infrastructure support and higher internal service allocations. Adjusting the prior year for the aforementioned DBCM methodology change, Investment Bank expects noninterest expenses and adjusted costs to be essentially flat versus 2022.
71 |
Deutsche Bank | ||
Annual Report 2022 | ||
For 2023, RWA in the Investment Bank is expected to be slightly higher driven by credit risk RWA from targeted business growth; regulatory inflation is expected to be largely offset by mitigating business actions.
There are several risks to the outlook of the Investment Bank in 2023, including potential impacts on the business model from macroeconomic changes, including uncertainties associated with the war in Ukraine, while the second order effects on energy and food prices will continue to have a significant impact on financial markets. Central bank policies, specifically around interest rates and further tapering of asset purchases, create risks, as does the current period of high inflation. In addition, the evolving regulatory framework could lead to unforeseen regulatory compliance costs and possible delays in the implementation of the division’s efficiency measures, which could adversely impact its cost base. More broadly, other unforeseen geopolitical event risks may also have an adverse impact.
Private Bank
In 2023, the Private Bank expects to benefit from the rising interest rate environment and from continued business growth. Private Bank also expects that beneficial impacts of specific revenue items and releases in certain provisions will not repeat in the same magnitude as in 2022. Noninterest expenses in 2023 are expected to be burdened by continued inflationary impacts and investments as well as higher internal service cost allocations, which will in part be offset by continued savings from transformation initiatives.
Net revenues in 2023 are anticipated to remain essentially flat compared to 2022. The year-on-year comparison will be impacted by the non-recurrence of a gain on the sale of the Deutsche Bank Financial Advisors business in Italy and by lower revenues from workout activities in Sal. Oppenheim. Revenues excluding these specific items are expected to be slightly higher compared to 2022 driven by net positive effects from the rising interest rate environment and by continued business growth despite an expected slowdown of the growth of the German mortgage book.
In the Private Bank Germany, revenues are expected to be slightly higher compared to 2022. Net interest income is expected to grow driven by higher deposit revenues which will be largely offset by reduced funding benefits including from the ECB’s TLTRO program. Fee income is expected to remain essentially flat with increases in investment product revenues in part offset by impacts from changes in contractual and regulatory conditions.
Net revenues in the International Private Bank are expected to be slightly lower compared to 2022 driven by the non-recurrence of the aforementioned gain in Italy of approximately € 310 million and Sal. Oppenheim workout revenues of approximately € 130 million. Excluding these specific items, revenues are anticipated to be slightly higher year-on-year reflecting continued business growth supported by prior relationship manager hiring. Positive impacts from rising interest rates are expected to more than compensate for the impact of reduced benefits from the ECB’s TLTRO program.
Private Bank assumes continued business growth in 2023 across loans and assets under management with corresponding volumes in assets under management expected to be higher compared to year-end 2022. As usual, the overall development of volumes will highly depend on market parameters, including equity indices and foreign exchange rates.
Provision for credit losses is forecasted to be slightly higher in 2023 in a range of 20 to 25 basis points of average loans.
RWA are expected to be essentially flat in 2023 with selected growth in the loan book being partially offset by portfolio optimizations and updates in the implementation of regulatory requirements.
Noninterest expenses are expected to be higher in 2023 compared to 2022, driven by higher internal service cost allocations, the non-recurrence of provision releases recorded in 2022 and higher restructuring expenses for continued transformation initiatives in 2023. Adjusted costs are expected to be slightly higher year-on-year as continued savings from transformation initiatives will not fully offset the impacts of inflation and higher internal service cost allocations. Adjusting the prior year for the aforementioned DBCM methodology change, Private Bank expects noninterest expenses to be slightly higher and adjusted costs to remain essentially flat versus 2022.
72 |
Deutsche Bank | ||
Annual Report 2022 | ||
Risks to Private Bank’s outlook include potential impacts on the business model from macroeconomic changes, including uncertainties associated with the war in Ukraine, global inflationary pressures due to higher energy and commodity prices as well as ongoing supply chain disruptions, uncertainty on interest rates, slower economic growth in the major operating countries and lower client activity. Client activity could be impacted by market uncertainties including higher than expected volatility in equity and credit markets. The implementation of regulatory requirements including consumer protection measures and delays in the implementation of strategic projects or changes resulting from contract renegotiations could also have a negative impact on revenues, capital consumption and costs.
Asset Management
The Asset Management segment principally consists of the consolidated financial results of DWS Group GmbH & Co. KGaA, of which Deutsche Bank AG owns a controlling interest.
Given the current macroeconomic outlook and the asset management industry’s challenges, DWS intends to focus on innovative products and services where it can differentiate and best serve clients, while also maintaining a disciplined cost approach as it invests in growth and transformation. DWS expects its diversified asset base to continue to provide some protection against current market challenges. DWS committed to a new set of medium-term financial targets in December 2022 as part of its refined strategy.
Asset Management expects Assets under Management to be higher at the end of 2023, compared to the year end of 2022, with net inflows expected into growth areas like Passive and Alternatives. This should be further enhanced by strategic partnerships and product innovations, including further ESG offerings. Total revenues are expected to be slightly lower in 2023 compared to 2022. Management fees are expected to be slightly lower in 2023 compared to 2022, with significantly higher expected performance and transactions fees to offset significantly lower other revenues. Moreover, the division expects further investment into growth and platform transformation, which will be partly compensated by ongoing cost discipline. Noninterest expenses are expected to be broadly flat and adjusted costs to be higher in 2023 compared to 2022. The aforementioned DBCM methodology change had no material impact on Asset Management.
Risks to Asset Management’s outlook include macro-economic and market conditions, growth prospects and continued economic impact from the war in Ukraine, which could adversely affect its business, results of operations or strategic plans. Elevated levels of economic and political uncertainty worldwide, and protectionist and anti-trade policies, could have unpredictable consequences in the economy, market volatility and investors’ confidence, which may lead to declines in business and could affect revenues and profits. In addition, the evolving regulatory framework could lead to unforeseen regulatory compliance costs and possible delays in the implementation of the efficiency measures, which could adversely impact the division’s cost base.
Capital Release Unit
Having fulfilled its de-risking and cost reduction mandate from 2019 through the end of 2022, the Capital Release Unit will cease to be reported as a separate segment with effect from the first quarter of 2023. Its remaining portfolio, resources and employees will be reported within the Corporate & Other segment. The remaining Capital Release Unit assets will roll off over time. These are mostly interest rate derivatives but also include the Polish FX mortgage portfolio and certain other FIC & Equities assets.
Corporate & Other
As mentioned above, Corporate & Other will include the financial impact of the Capital Release Unit from 2023 onwards.
Corporate & Other will continue to retain certain transitional costs related to the Group's transfer pricing framework. In addition, there will be charges related to legacy activities relating to the merger of DB Privat- und Firmenkundenbank AG into Deutsche Bank AG. In aggregate, both items are expected to have negative impacts in C&O of approximately € 0.3 billion in 2023. Corporate & Other will also continue to retain shareholder expenses, which are expected to be around € 0.5 billion for the full year 2023, and to record the reversal of Noncontrolling interests, primarily from DWS. In addition, results in Corporate & Other will continue to be impacted by valuation and timing differences on positions that are economically hedged, but do not meet the hedge accounting requirements. In total, Corporate & Other is expected to generate a pre-tax loss in 2023.
73 |
Deutsche Bank | ||
Annual Report 2022 | ||
Risks and Opportunities
The following section focuses on future trends or events that may result in downside risk or upside potential from what the Group has anticipated in its “Outlook”.
The Group’s aspirations are subject to various external and internal factors, some of which it cannot influence. Timely and successful achievement of its strategic targets or aspirations may be adversely impacted by reduced revenue-generating capacities of some of its core businesses should downside macro-economic and market risks crystallize. These risks include but are not limited to the persistent inflationary and rising policy interest rate trends, the continuing war in Ukraine, a deteriorating macroeconomic environment, elevated geopolitical risks, the ongoing headwinds posed by regulatory reforms and the effects on the bank’s legal and regulatory proceedings. A key focus in 2022 was the risk of a more pronounced economic downturn in Europe as a result of gas shortages, although pressures have materially eased in recent months. However, the inflationary impacts of higher energy prices have put the cost structure of firms’, including the Group’s under additional pressure and it is likely that demand for increased wages will remain elevated for the time being. Overall, these trends continue to drive high levels of uncertainty and could result in fluctuations in the results of the Group’s operations, strategic plans and financial targets.
Opportunities may arise if macroeconomic conditions and the inflation and interest rate environment improve beyond currently forecasted levels, leading to higher revenues and improving the Group’s ability to meet its financial targets. At the same time, higher inflation and interest rate levels and market volatility could lead to increased revenues from trading flows and higher net interest income and lending margins. By focusing on and investing in Deutsche Bank’s areas of core strengths, the implementation of its strategy may create further opportunities if implemented to a greater extent or under more favorable conditions than currently anticipated.
Risks
Macroeconomic and market conditions
A number of macro and market related risks, including weaker economic activity, the interest rate environment and higher competition in the financial services industry, could negatively affect Deutsche Bank’s business environment and results of operation.
The continued war in Ukraine and related increases in global inflationary pressures due to higher energy prices as well as supply chain disruptions have led to a significant downward revision in global growth forecasts for 2023 and 2024. Major central banks have responded by tightening monetary policy and market interest rates increased significantly during 2022 amid periods of very high market volatility. The likelihood of at least a moderate economic downturn remains elevated as these effects and tighter financial conditions weigh on economic activity, including in the U.S. economy as the Federal Reserve leads the global tightening cycle. Some of the major European economies slipped into economic contraction in the fourth quarter of 2022, mainly due to the cost-of-living shock to private consumption from the strong increase in energy and food prices. Bond yields resumed their upward path in the fourth quarter as market participants raised expectations of the terminal policy interest rates by the Fed and the ECB. This could potentially drive increased losses, including higher provisions for credit losses, and may substantially and adversely affect Deutsche Bank’s planned results of operations, financial targets and costs. More persistent inflation and higher terminal interest rates could also dampen consumer spending and private client investments and lead to a reduction in new lending for consumer finance and/or private mortgages lending.
Higher interest rates may also lead to refinancing risks and potential downgrades across the bank’s client franchise and corporate default rates are likely to rise in 2023 and 2024 as clients’ earnings fall. Such an environment may also lead to higher instances of idiosyncratic defaults. In addition, inflation, interest rates and market volatility (including secondary effects due to supply chain issues) could lead to collateral value reductions with risks related to recoveries in case of liquidation and therefore higher impacts on provisions for credit losses. This is particularly relevant in instances where financing is asset based and without recourse to a third party. The bank could therefore experience higher than expected provisions for credit losses.
74 |
Deutsche Bank | ||
Annual Report 2022 | ||
Thanks to the relatively mild weather and better preparedness, the risk of a renewed spike in energy prices or physical shortages diminished in the fourth quarter of 2022 but remains a downside risk for European corporates and households for 2023 and 2024. Prior to the war in Ukraine, Russia accounted for around 40% of the EU’s supply of natural gas, with reliance higher for Germany and selected other countries. By the end of 2022, the EU’s dependency from Russian gas has been reduced to around 9% of total supply. Despite the sharp drop in Russian gas deliveries, Germany and overall EU gas storage levels have continued to rise in the fourth quarter of 2022, amid reduced usage by large corporate and private households. Natural gas prices in Europe dropped back to levels observed before the war in Ukraine. Amidst the recently improved outlook, the bank also views the risk of a potential gas shortage or need for energy rationing in the winter of 2023/2024 as lower, but downside risks cannot be fully discounted and could have a material impact on the bank due to direct impacts on client defaults and second order effects on economic growth.
Industries which could be affected by energy rationing, in combination with existing supply chain constraints and high commodity prices, include but are not limited to manufacturing, automotive, construction, chemicals, steel, metals and mining as well as critical infrastructure such as utilities, transportation and agriculture. While the majority of Deutsche Bank’s clients, especially the larger ones, consider themselves adequately positioned, certain clients are seeing more acute pressure on sales and margins. Also, private clients and households have yet to feel the full impact of energy price increases due to government support measures and could face increasing repayment difficulties should energy prices and broader inflation remain elevated.
Another key area of uncertainty relates to China. The government has announced a rapid easing of COVID-19 restrictions which led to a notable surge in COVID-19 cases. Economic activity is expected to improve significantly post COVID-19 but some headwinds remain. Recently announced far-reaching U.S. export controls on high-tech goods including advanced semiconductors to China could dent the country’s longer term growth potential. Also, there are ongoing concerns over the potential for a broad and persistent deterioration of China’s highly leveraged property sector, despite recently announced government support measures. There have been numerous rating actions by external agencies, noting that some of the names which have seen significant rating deterioration, were up until recently rated investment-grade, and widespread liquidity shortages for the sector. Stabilizing the economy has become a key priority for the Chinese government, but risks of ongoing liquidity constraints and selected defaults in the property sector remain elevated. In a severe downside, this may lead to broader contagion across weaker enterprises which could drive higher credit provisions.
Throughout 2022, market and rates developments impacted the Group’s ability to distribute, and de-risk capital markets commitments, making pricing, hedging and distribution of transactions more challenging. While the Group actively manages systemic risks, it has experienced delays in de-risking individual commitments and taken related mark-to-market losses in 2022, driven by widening in credit spreads and higher interest rates. The Group could see additional losses in 2023 should markets deteriorate, leading to lower market liquidity and risk aversion of investors. However, downside risk to revenues and capital are considered manageable and the Group continues to deploy hedging strategies to manage the business within its risk appetite.
Overall, either in isolation or in combination with other risk factors such as an escalation of the China/Taiwan tensions, the aforementioned risks could lead to a deterioration in the Group’s portfolio quality and higher than expected credit and market losses. This could also lead to rating declines among clients, leading to increasing provisioning levels as well as increased numbers of clients drawing down on credit facilities which would lead to higher capital requirements and liquidity demands. There would also be a higher risk of idiosyncratic defaults. Higher volatility in financial markets could lead to increased margin calls, higher market risk RWA and elevated valuation reserves.
These aforementioned developments can also impact Deutsche Bank’s revenue generating capabilities and costs, while market declines and volatility could negatively impact the value of financial instruments, drive volatility in the bank’s valuation and timing differences and result in impairments of non-financial assets. This is particularly relevant as a decline in financial market liquidity would exacerbate price volatility and the risk of broader market stress. Market volatility, which can be also triggered by unexpected policy decisions or policy mistakes, and the challenging macro environment could also lead to increased inherent risks in several non-financial risks including transaction processing, internal and external fraud and conduct risks including attempts to conceal losses and increased litigation attempts from clients.
Another area of focus are private credit markets which include certain activities from non-bank financial institutions. The non-bank financial institutions sector is extremely broad with no consistent definition as well as diverse risk profiles and vulnerabilities. A failure of one or multiple larger non-bank financial institutions has the potential to drive direct losses for banks including Deutsche Bank and other creditors / capital providers. Broader market instability with rising rates, risk aversion, market illiquidity and economic slowdown all increase the likelihood of failures occurring as returns drop and investors reallocate capital. Internal risk management approaches are commensurate to the risk profile of underlying counterparty and concentration risk exposures and although the bank has not experienced any noteworthy losses in the past, the bank may do so in the future.
75 |
Deutsche Bank | ||
Annual Report 2022 | ||
The crypto-assets ecosystem experienced significant volatility in 2022 and continues to carry significant inherent risks. Risks to the financial sector include potential losses from elevated financial crime, regulatory, legal and information security and technology risks amongst others. In addition, crypto-assets carry extreme price volatility risk, often lack price transparency, have underdeveloped liquidity and may be susceptible to market manipulation. Deutsche Bank’s crypto related activities and direct risk exposures are extremely limited and the risk of broader contagion to financial markets is still considered to be limited. Despite the risks currently posed by crypto-assets, the bank is cognizant of the innovation that is occurring in this space and is considering possible opportunities to leverage the benefits of the underlying technology and address customer needs.
A substantial proportion of the assets and liabilities on the Group’s balance sheet comprise of financial instruments that are carried at fair value, with changes in fair value recognized in its income statement. As a result of such changes, the Group has incurred losses in the past, and may incur further losses in the future. The Group is exposed to risks related to movements from foreign exchange rates, most notably related to the USD and GBP. The bank also accounts for a substantial portion of assets and liabilities at amortized costs. The fair value of these assets may be lower than its carrying value and could result in realized losses if the asset is sold prior to maturity.
Similarly, liquidity risk could arise from lower value and marketability of Deutsche Bank’s liquidity reserves, impacting the amount of proceeds available for covering cash outflows during a stress event. Additional haircuts may be incurred on top of already impaired asset values. Moreover, securities might lose their eligibility as collateral necessary for accessing Central Bank facilities, as well as their value in the repo/wholesale funding market. At the same time, the Group’s liquidity position may also be impaired in situations where its counterparty on e.g. a derivative contract is not current on an obligation to post collateral, in which case the bank has to cover for the shortfall through other means.
The Group is exposed to pension risks which can materially impact the measurement of Deutsche Bank’s pension obligations, including interest rate, inflation and longevity risks that can materially impact its earnings.
If multiple key downside risks simultaneously materialize and/or occur in combination with a more pronounced economic slowdown, the negative impact on Deutsche Bank’s business environment could be more severe than currently expected.
Political risks
A number of political and geopolitical risks and events could negatively affect Deutsche Bank’s business environment, including weaker economic activity, financial market corrections, compliance risks or a lower interest rate level.
On February 24, 2022, Russia commenced large-scale military action against Ukraine. In response to this action, the West has moved to impose broad-based sanctions (including asset-freeze / blocking sanctions) targeting Russia and Belarus. The sanctions environment remains dependent on the development of the war in Ukraine, and it is possible that new direct or indirect secondary sanctions could be imposed at short notice. It is also likely that current, significant sanctions remain in place and that further restrictions may be introduced, though the bank believes that those most directly affecting financial institutions have already been imposed. The unprecedented scale of sanctions announced to date, not all of which are fully aligned across jurisdictions, has significantly increased operational complexity including the risk of making errors in managing day-to-day business activities within the rapidly evolving sanctions environment. New sanctions as well as countermeasures by the Russian government could also result in differences between the local application / implementation of relevant requirements by Deutsche Bank Moscow and the Deutsche Bank Group (Deutsche Bank Moscow would have to adhere to local law). Subsequently, this would create conflict of law situations and certain exemptions would have to be applied. Sanctions and Russian countermeasures may also complicate the wind-down of transactions and / or relationships that the bank may wish or need to exit as a result of the war in Ukraine within the timeframe provided by licenses or authorizations. More broadly, there is an increasing risk that Russia will turn to asymmetric warfare and that Russia or proxy actors will take retaliatory action against the West which could directly or indirectly affect the bank and its operations.
Deutsche Bank utilizes inhouse technology resources in Russia, which contribute to the development of a number of the bank’s critical applications, while Deutsche Bank Moscow also relies on certain resources from the Group. The Group is subject to the risk that its ability to utilize these technology resources could be impaired or lost, for instance due to additional sanctions from the West, Russian state-initiated actions or management actions. Also, the provision of corporate banking services to local subsidiaries of international companies could be negatively affected if its operating subsidiary in Russia is impacted.
76 |
Deutsche Bank | ||
Annual Report 2022 | ||
In 2022, Deutsche Bank utilized dedicated governance structures including Global and Regional Crisis Management to manage the crisis. The impact of the ongoing situation, from both a financial and non-financial risk perspective, remains uncertain and, while its direct financial exposures to Russia and Ukraine are contained and have been reduced throughout 2022, higher-order effects may materialize in a downside scenario, impacting the Group’s ability to meet its stated targets. The regulatory environment or other restrictions including sanctions imposed may result in its business activities related to Russia becoming unviable or that it loses control over its assets. Despite the business continuity and crisis management policies currently in place, the conflict also poses challenges related to personnel as well as loss of business continuity, which may disrupt its business and lead to material losses.
The broader geopolitical implications of the war in Ukraine remain uncertain . Over the medium to long term, the International Monetary Fund among others has highlighted the potential impact of deglobalization on living standards and growth. Against this backdrop, tensions between the U.S. and China remain elevated across a wide range of areas, including trade and technology-related issues, Hong Kong, Taiwan, human rights, and cybersecurity. The U.S. has imposed selected sanctions as well as export and investment restrictions on Chinese companies and officials, and China has imposed sanctions on certain U.S. companies and officials and introduced a framework for blocking regulations aimed at the extraterritorial application of sanctions against China. Likewise, the EU has imposed sanctions on China in relation to human rights issues, which were reciprocated by China. Such measures raise potential regulatory compliance and conflicts of law challenges, and the impacts could be material and adverse. While the Group does not consider a China/Taiwan military conflict as its base case in the near-term, potential downside impacts from an escalation are significant and could substantially and adversely affect Deutsche Bank’s planned results of operations and financial targets. Likewise, similarly to what was observed in the context of Russia, the intensifying tensions could drive further economic polarization with emergence of distinct China vs. US-led blocks with potential impacts difficult to predict.
Other geopolitical risks, which could negatively impact the bank’s business environment and its financial targets include an escalation of the war in Ukraine and/or rising political tensions in the Middle East which could drive energy prices even higher. Iran has blamed foreign countries for stoking the ongoing anti-government protests while their violent repression and Tehran’s closer alignment with Russia diminish the likelihood of a successful revival of the Iran nuclear deal. These developments could increase the risk of conflict in the region.
In many democratic countries, domestic political challenges have arisen from growing political polarization, rising social discontent and higher inflation. These challenges may impede political decision-making processes, forestall necessary structural reforms and lead to negative economic outcomes which could directly or indirectly impact the bank’s risk profile. In the U.S., Congress needs to increase the debt limit later this year to avert an unprecedented sovereign technical default. With a divided Congress, another showdown could be looming which may lead to heightened market volatility even if a technical default can be averted. In Europe, the energy price shock could threaten the international competitiveness of energy-intensive industries. While labor markets have remained robust so far, pressure on government finances could increase as rising spending needs on climate protection policies and military equipment to ward off external threats come on top of measures to fund social cohesion policies while energy prices remain high and economic growth lacklustre.
Uncertainty and associated economic downside risks have declined over the three years since the UK left the EU’s single market and customs union. Deutsche Bank has been able to continue to service EEA (European Economic Area) based clients thanks to its program to move booking of EEA clients to Deutsche Bank AG Frankfurt which was completed before the end of 2020. Sales and coverage staff are in place in the EU member states to ensure all regulated activity relating to EEA clients is performed within the new licensing laws post Brexit. However, some uncertainty remains as negotiations between the UK and the EU have continued, with regard to financial services not extensively covered by the existing deal. Announcements in the first half of 2022 from the EU commission confirming an extension to the current temporary equivalence arrangements for UK CCPs (Central Clearing Counterparties) until June 2025 has removed the risk that access to UK clearing would be withheld from EU firms from June 2022 (when the previous extension expired). Without equivalence between EU and UK regimes for Financial Services, the bank will be restricted in its ability to provide financial services to and from the UK. Discussions on the nature of this extension and the final outcome in June 2025 will continue in 2023. The commission has advised that firms should not expect a further extension to the temporary equivalence in 2025 and should plan accordingly. With effect from December 19, 2022, Deutsche Bank is authorized by the Prudential Regulation Authority and subject to regulation by the Financial Conduct Authority and limited regulation by the Prudential Regulation Authority.
77 |
Deutsche Bank | ||
Annual Report 2022 | ||
Strategy
The Group strategy laid out in the Investor Deep Dive on March 10, 2022 provided Group and divisional financial targets and objectives for the period until 2025. While the Group continuously plans and adapts to changing situations, it runs the risk that a significant deterioration in the global operating environment could lead it to miss its publicly communicated targets, incur unexpected losses including further impairments and provisions, experience lower than planned profitability or an erosion of its capital base and broader financial condition, leading to a material adverse effect on Deutsche Bank’s results of operations and share price. This also includes the risk that Deutsche Bank will not be able to make desired distributions of profits to its shareholders, which are subject to Deutsche Bank AG’s capacity under standalone financial statements in accordance with German accounting rules (HGB). Where such targets reflect commitments to regulators, missing them may also trigger action from such regulators or rating agencies. In these situations, the Group would need to take action to ensure it meets its minimum capital objectives. These actions or measures may result in adverse effects on the Group’s business, results of operations or strategic plans and targets.
The war in Ukraine and its continuing impact on the global economy as well as other macroeconomic developments, including global supply chain disruptions, uncertainty around the inflation outlook and policy rates may affect the Group’s ability to meet its financial and non-financial targets. While monetary tightening by central banks might support interest margin development, client volumes in selected market segments could decrease. A further escalation of geopolitical tensions could result in increased market volatility, adversely affect the economic outlook for key markets and increase complexity for cross-border businesses. Governmental support measures could reduce the impact of a potential economic downturn in key markets of the Group.
Deutsche Bank operates in highly competitive markets in all divisions. The ability to deploy capital and fund investments is an important success factor. The Group continuously monitors and responds to competitive developments to protect its market position and realize growth opportunities. Competitors in that context include large, international banks, smaller domestic banks as well as emerging, non-banking competitors.
Labor market conditions have significantly tightened and were particularly competitive in India and the U.S. Attrition rates in 2022 were above 2021 across all regions. These effects, coupled with requests from regulators to demonstrate moderation in the levels of compensation that the Group can offer, may put the Group at a disadvantage in attracting and retaining talented employees. More broadly, higher global inflation, which is only expected to moderate slowly in 2023 and 2024, may lead to pressure on noninterest expenses and the ability of the Group to meet cost targets.
The Group has communicated various capital objectives in the section “Strategy”. One of them relates to the CET 1 ratio, where Deutsche Bank has the objective to preserve a CET 1 ratio of no less than 200 basis points above the bank’s Maximum Distributable Amount (MDA) threshold – with some variability possible in 2023. The Group’s capital ratio development reflects among other things: the operating performance of core businesses; the extent of its restructuring costs and the delivery of associated benefits from change initiatives including for example front-to-back optimization programs; cost related to potential litigation and regulatory enforcement actions; growth in the balance sheet usage of the core businesses; changes in the bank’s tax and pensions accounts; impacts on Other Comprehensive Income; and changes in regulation and regulatory technical standards.
The bank may also have difficulties selling businesses or assets at favorable prices or at all and may experience material losses from these assets and other investments irrespective of market developments or may fail to close on transactions under contract.
The Group enters into contracts and letters of intent in connection with its ongoing transformation as well as in the ordinary course of business. When these are preliminary in nature or conditional, the Group is exposed to the risk that they do not result in execution of the final agreement or consummation of the proposed arrangement, putting associated benefits with such agreements at risk.
All of the above could have a material impact on the Group’s CET 1 ratio as well as other target ratios. It is therefore possible that the bank will fall below e.g. CET 1 ratio objective of no less than 200 basis points above the bank’s MDA threshold, the cost/income ratio target, or the Post-tax Return on Average Tangible Equity target, as highlighted in the section “Strategy” in this report.
78 |
Deutsche Bank | ||
Annual Report 2022 | ||
Liquidity and funding risks
On October 12, 2022, Moody’s upgraded all Deutsche Bank’s ratings by one notch, including its long-term deposit ratings to A1 (from A2) with Stable outlook, the highest level since 2012. In September 2022, Fitch affirmed Deutsche Bank AG's Long-Term Issuer Default Rating at 'BBB+' and its Viability Rating at 'bbb+' with Positive outlook for all ratings. DB’s long-term credit ratings for other two rating agencies remain A+ (with Stable outlook) at S&P and A high (with Positive outlook) at DBRS Morningstar.
Despite strong credit ratings, Deutsche Bank’s potential risks remain that its liquidity, business activities and profitability may be adversely affected by inability to access the debt capital market and funds from its subsidiaries or to sell assets during periods of market-wide or firm-specific liquidity constraints. This situation may arise due to circumstances unrelated to its businesses such as current geopolitical or macroeconomic conditions and hence outside of its control. For example, the current geopolitical and economic environment had an adverse impact on Deutsche Bank’s credit spread levels, with higher levels of interest rates leading to elevated borrowing costs (especially for short term funding).
Quantitative tightening by central banks, as a way of managing inflation has led to rising interest rates. This in turn, is reducing money supply, increasing the pressure on funding markets and can impact the valuations of liquid assets. If inflation persists, this could necessitate even further Central Bank tightening, which could trigger a significant economic slowdown in Europe and the US and could lead to a rise of defaults across corporates. As a result, disruptions in the financial markets, or circumstances specific to the Group, such as a reluctance of counterparties to finance the bank’s operations due to perceptions of the bank’s financial strength resulting from litigation, regulatory matters, actual or perceived weaknesses in the bank’s businesses, business model or strategy, as well as in the bank’s resilience in countering negative economic and market conditions, could occur. The ECB may also amend the terms of its monetary policy tools which could adversely impact Deutsche Bank’s revenue development, change the bank’s interest rate sensitivity and may affect broader market pricing.
Additionally, persistently high inflation and consumer price levels could lead to a decline in levels of deposits in Deutsche Bank’s core retail markets as consumers use their savings to compensate for higher expenses. This might foster price competition among banks for retail deposits increasing Deutsche Bank’s funding costs, as well as putting further pressure on the volume of its retail deposits, which are one of the main funding sources for the bank.
Deutsche Bank continues to monitor the situation in Ukraine as well as any secondary economic impacts resulting from various drivers (including energy sourcing and economic sanctions) which could have an impact on Deutsche Bank’s financial and liquidity position. Currently, the Group liquidity metrics remain robust and are largely unaffected, providing a strong basis to manage through the ongoing crisis.
Uncertain macroeconomic developments could negatively affect Deutsche Bank’s ability to transact FX trades due to volatility in the FX markets or if counterparties are concerned about its ability to fulfil agreed transaction terms and therefore seek to limit their exposure. Additionally, increased FX mismatches on the bank’s balance sheet may lead to increased collateral outflows where the euro (its local currency) materially depreciates against other major currencies and may lead to difficulties to support liquidity needs in different currencies.
As part of emerging risks, digital payments and blockchain are assessed as areas which could impact the depth and volatility of market liquidity and funding and may temporarily impact cost of funding and thereby adversely affect profitability.
Deutsche Bank’s Liquidity Coverage Ratio and Net Stable Funding Ratio remain well above the regulatory minimum, however the risk factors such as geopolitical or macroeconomic developments and their related economic impacts may put pressure on liquidity metrics and lead to liquidity and funding outflows.
79 |
Deutsche Bank | ||
Annual Report 2022 | ||
Regulatory supervisory reforms, assessments and proceedings
The regulatory reforms enacted and proposed in response to weaknesses identified during the last financial crisis together with increased regulatory scrutiny and discretion will impose material costs on the bank, create significant uncertainty and may adversely affect the Group’s business plans as well as its ability to execute its strategic plans in the medium-term. Those changes that require the bank to maintain increased capital may significantly affect the bank’s business model, financial condition, and results of operation as well as the competitive environment more generally.
Several future changes will impact the Group’s business. One is the implementation of Final Basel III reforms (through CRR III). Implementation of these changes are however still heavily debated in all key jurisdictions by policymakers. The bank currently expect its capital requirements to increase in 2025 from the implementation of Final Basel III in the EU, in particular from higher risk weights for its exposure in most risk areas. The bank expect a further increase in risk-weights for its exposures from 2028/2029 from the introduction of the new output floor included in Final Basel III. Regulatory reforms in respect of resolvability, resolution measures and the macroprudential framework may also impact business operations. In addition, regulatory changes may impact how key entities are funded which could affect how businesses operate and negatively impact results. Regulatory actions may also require the bank to change its business model or result in some business activities becoming unviable.
The European Commission has also announced a review of the EU macroprudential regime and a review of the EU securitization regime, and more technical aspects of securitization, for 2023. These changes could result in an increase of its level of capital requirements, including capital buffers, additional capital for securitizations or increase in RWA.
Supervisors can also impose capital surcharges or regulatory adjustments, for example, as a result of the regular Supervisory Review and Evaluation Process (SREP). Such adjustments may, for example, reflect additional risks posed by deficiencies in the Group’s control environment, or come as a result of supervisory inspections concerning the treatment of specific products or transactions. One of these areas in focus of the ECB with regards to risk taking is leveraged lending, for which the ECB clarified their expectations in a March 28, 2022 letter to all banks under the Single Supervisory Mechanism and announced their intent to consider quantitative measures in future SREP decisions for institutions which the ECB assesses as non-compliant with these expectations. Following the 2022 SREP, Deutsche Bank has been informed by the ECB of its decision regarding prudential capital requirements to be maintained from January 1, 2023 onwards, that Deutsche Bank’s Pillar 2 requirement will increase by 20bps. The increase is driven by the ECB's newly introduced separate assessment of risks stemming from leveraged finance activities. More broadly, the SREP decision also includes conclusions the ECB draws from regulatory stress tests conducted by the EBA or the ECB. The ECB evaluates each bank’s performance from a qualitative angle to inform the decision on the level of Pillar 2 Requirement and a quantitative outcome which is one aspect when assessing the level of Pillar 2 guidance. The ECB has already used these powers in its SREP decisions in the past and it may continue to do so to address findings from onsite inspections. In extreme cases, they can even suspend certain activities or permission to operate within their jurisdictions and impose monetary fines for failures to comply with rules applicable to it.
Supervisors can also impose other capital surcharges, such as the increase of macroprudential capital buffers including the Countercyclical Conservation Buffer and the Systemic Risk Buffer. Germany’s Federal Financial Supervisory Authority (BaFin) has already announced increases to take place in February 2023.
Regulators across the world can also impose capital surcharges to address macroeconomic risks, through the use of macroprudential tools. These include CET1 buffer increases that could apply group-wide or only for local activities at national level or for specific types of exposures (e.g. mortgages). The use of these tools is governed by the applicable macroprudential framework in the EU or any other relevant jurisdiction and are typically decided by national macroprudential authorities, such as BaFin, often on the basis of Central Bank analysis for macroeconomic risks.
80 |
Deutsche Bank | ||
Annual Report 2022 | ||
The potential financial stability risk for the EU due to central clearing arrangements outside of the EU will continue to feature through 2023. On February 8, 2022, the European Commission published an extension to the temporary equivalence decision for UK Central Counterparties to June 30, 2025. In these three years, until the expiry of the temporary equivalence decision, the European Commission will continue to focus on measures to channel clearing services in EUR-denominated products to EU Central Counterparties (CCPs). In this context, on November 7, 2022, the Commission published a legislative proposal for a refit of the European Market Infrastructure Regulation. The package aims to make EU CCPs more competitive, to channel clearing in EUR denominated instruments to EU CCPs and enhance EU-level supervision of third country CCPs. Furthermore, the European Commission continues to work on outstanding equivalence decisions for third-country CCPs to continue to provide services to EU clients and the European Securities and Markets Authority, the European securities regulator, continues to work on recognition for certain third-country CCPs where equivalence decisions already exist in order for these CCPs to be classified or continue to be classified as Qualifying CCPs for capital allocation purposes. Also, Indian and EU authorities need to sign a Memorandum of Understanding (MoU) which would allow EU clearing members to continue to clear via Indian CCPs. The discussions are ongoing on the MoU. ESMA has set a deadline of April 30, 2023 before which this MoU needs to be signed. If not signed, Indian CCPs will be derecognized. Depending on the outcome of these equivalence and recognition decisions as well as potential mitigating actions, these decisions can have a negative impact on the bank’s regulatory capital and increase its operating costs.
In 2022, the bank has seen political pressure arising across European member states regarding the possibility of introducing additional levies or taxes as a means to finance potential transfers to households, to ease the impact of rising prices. Certain countries have introduced such levies or publicized initial proposals. If effectuated, such taxes or levies could negatively impact the profitability and organic capital generation of the bank.
While Deutsche Bank continues to develop and implement its approach to climate risk assessment and management and promote the integration of climate-related factors across its entire platform, both rapidly changing regulatory as well as stakeholder demands may materially affect its business, results of operations or strategic plans if the Group fail to adopt or implement its measures to transition to a low-carbon economy.
Legal and regulatory enforcement proceedings and tax examinations
The Group is subject to a number of legal and regulatory enforcement proceedings and tax examinations. The outcome of these proceedings is difficult to predict and may substantially and adversely affect the Group’s planned results of operations, financial condition and reputation. If these matters are resolved on terms that are more adverse to the Group than expected, in terms of their costs or necessary changes to the Group’s businesses or operations, or if related negative perceptions concerning the Group’s business and prospects and related business impacts increase, the Group may not be able to achieve its strategic objectives or may be required to change these objectives.
Compliance and Anti-Financial Crime risks
Combatting financial crime and complying with applicable laws and regulations is vital to ensuring the stability of banks, such as Deutsche Bank, and the integrity of the international financial system.
A robust and effective internal control environment and adequate infrastructure (comprising people, policies and procedures, controls testing, and IT systems) are necessary to ensure that the bank conducts its business in compliance with the laws, regulations, and associated supervisory expectations.
The bank’s Compliance controls and surveillance processes, as well as other internal control processes that are aimed at ensuring the proper conduct of its businesses and services as well at preventing market abuse, insider dealing, and conduct breaches, are from time to time subject to regulatory reviews and/or inquiries in certain jurisdictions.
Furthermore, the bank’s anti-money laundering (AML) and know-your client (KYC) processes and controls aimed at preventing misuse of its products and services to commit financial crime, continue to be the subject of regulatory reviews, investigations, and enforcement actions in several jurisdictions. The bank continually seeks to enhance the efficacy of its internal control environment and improve its infrastructure to revised regulatory requirements and to close gaps identified by the bank and/or by regulators and monitors.
81 |
Deutsche Bank | ||
Annual Report 2022 | ||
The BaFin ordered Deutsche Bank in September 2018 to take appropriate internal safeguards and comply with general due diligence obligations to prevent money laundering and terrorist financing, in February 2019 to review its group-wide risk management processes in correspondence banking and adjust them where necessary, and in April 2021 to adopt further appropriate internal safeguards and comply with due diligence obligations, with regards to regular client file reviews. This expansion also applies to correspondent relationships and transaction monitoring. On September 28, 2022, BaFin ordered Deutsche Bank AG to take specific measures aimed at preventing money laundering and terrorist financing in order to implement the orders that BaFin issued on September 21, 2018 and February 15, 2019. The BaFin has appointed a special representative to monitor the implementation of the ordered measures as well as to assess and report on the progress of the implementation to the BaFin.
If the bank is unable to significantly improve its infrastructure and control environment in a timely manner, the bank may be subject to fines or penalties, as well as to regulatory intervention in aspects of its businesses. In particular, the bank is engaged in ongoing regulatory discussions to resolve matters concerning adherence to prior orders and settlements related to sanctions and embargoes and AML compliance, and remedial agreements and obligations related to risk management issues.
In July 2022, the bank accepted a fine of € 7 million for the administrative offence of delayed filing of two Suspicious Activity Reports (SAR) in a historic matter thereby ending the Frankfurt public prosecutor’s investigation into this matter, in relation to which a search took place at DB’s headquarters on April 29, 2022.
More generally, the bank operates in a highly and increasingly regulated and litigious environment, potentially exposing us to liability and other costs, the amounts of which may be substantial and difficult to estimate, as well as to legal and regulatory sanctions and reputational harm. The bank continues to maintain a regular dialogue with our supervisory authorities who expect the bank to deliver control improvements at a faster pace and in a higher quality manner. Deutsche Bank understands this criticism and is committed to meeting these expectations.
Should any of the legal proceedings be resolved against the bank, or any investigations result in a finding that the bank failed to comply with applicable law, the bank could be exposed to material damages, fines, limitations on business, remedial undertakings, criminal prosecution, or other material adverse effects on our financial condition, as well as risk to its reputation and potential loss of business because of extensive media attention. Guilty pleas by or convictions of the bank or its affiliates in criminal proceedings, or regulatory or enforcement orders, settlements, or agreements to which the bank or its affiliates become subject, may have consequences that have adverse effects on certain of its businesses.
As discussed in greater detail elsewhere in this document, the war in Ukraine led to a significant increase in sanctions against Russian state entities, companies and individuals linked to Russia. Deutsche Bank manages these sanctions with enhanced communications, guidance, and operational support led by AFC’s Sanctions & Embargoes team.
Risk management policies, procedures and methods as well as operational risks
The Group has devoted significant resources to develop its risk management policies, procedures and methods, including with respect to market, credit, liquidity, operational as well as reputational and model risk. However, the bank may not be fully effective in mitigating its risk exposures in all economic or market environments or against all types of risk, including risks that the bank fails to identify or anticipate. Where the Group uses models to calculate risk-weighted assets for regulatory purposes, potential deficiencies may also lead regulators to impose a recalibration of input parameters or a complete review of the model.
Deutsche Bank may face operational risks arising from failures in its internal control environment or errors in the performance of its processes, e.g. in transaction processing, as well as loss of business continuity, which may disrupt its business and lead to material losses. At the same time, the bank may also face risks of material losses or reputational damage if services that third parties facilitate are not provided as agreed or in line with its internal standards.
As a global bank, Deutsche Bank is often in the news. Deutsche Bank conducts its media dialogue through official teams. However, members of the media sometimes approach Deutsche Bank staff outside of these channels and Deutsche Bank internal information, including confidential matters have been subject to external news media coverage. Leaks to the media can have severe consequences for Deutsche Bank, particularly when they involve inaccurate statements, rumors, speculation or unsanctioned opinions. This can result in financial consequences such as the loss of confidence or business with clients and may impact the bank’s share price or its capital instruments by undermining investor confidence. While the bank has processes in place to manage these risks, its ability to protect itself against these risks is limited.
In addition, the Group is also exposed to conduct risk, comprising risks relating to inappropriate business practices, including selling products that are not suitable for a particular customer, fraud, unauthorized trading and failure to comply with applicable regulations, laws and internal policies. For example, an employee’s misconduct reflecting fraudulent intent may lead to not only material losses but also reputational damage.
82 |
Deutsche Bank | ||
Annual Report 2022 | ||
The continuing move across global industries to conduct business from home and away from primary office locations, is driving a more accelerated evolution of business practices compared to historic trends. The demand on the bank’s technology infrastructure and the risk of cyber-attacks could lead to technology failures, security breaches, unauthorized access, loss or destruction of data or unavailability of services, as well as increase the likelihood of conduct breaches.
Any of these events could potentially result in litigation, a financial loss, disruption of business activities and liability to its customers, regulatory scrutiny, government intervention or damage to its reputation. At the same time, managing these cyber, information security and other risks requires continual adaptation of its controls.
Delays in the implementation of regulatory requirements, including consumer protection measures and of its strategic projects could also have a negative impact on its revenues and costs, while a return of higher market volatility has led, and could continue to lead to increased demand on markets surveillance monitoring and processing. The bank’s vendors and service providers are facing similar challenges with the risk that these counterparties could be unable to fulfil their contractual obligations, putting the benefits the bank seek to obtain from such contracts at risk.
In order to manage financial and non-financial risk impacts from e.g. geopolitical or other fast developing events, Deutsche Bank utilizes dedicated governance structures including Global and Regional Crisis Management. Where relevant, additional controls and processes have been and would be employed. This would also entail additional reporting to ensure relevant senior stakeholders including the Management Board are up-to date. Against the backdrop of a rapidly deteriorating risk environment in 2022, Deutsche Bank continues to expect 2023 to be demanding from a risk management perspective.
Third Party Risk
Third parties are integral to the successful daily operation of any financial services firm, including Deutsche Bank. In support of the Group’s business and operations, the use of and dependence upon third parties in the sector has increased over the years, necessitating a corresponding increase in capabilities to manage them. There continues to be significant regulatory interest in third party concentration risk and adequate governance and oversight over critical third parties. In addition, environmental, social and governance (ESG) related risks are under scrutiny in order to ensure that risks across the value chain are understood and managed.
The nature of what the bank uses third parties for has also evolved and now includes more fundamental aspects of services, including the use of Cloud and other advanced technologies. This presents new risks and requires robust risk assessments, appropriate contracting and ongoing oversight commensurate with those risks. It has also led to a steady increase in regulation and regulatory scrutiny over not just how the bank manages third parties’ day to day, but also assessing the levels of resiliency needed that is proportional to the importance of the business services supported by the third party.
Deutsche Bank has a well-established approach to Third Party Risk Management; from a clear policy and procedure through to centralized risk process for businesses to use when engaging with third parties. However, services provided by third parties pose risks to the bank comparable to those the Group bears when it performs the services itself and remains ultimately responsible. Deutsche Bank depends on its third parties to conduct their delivery of services in compliance with applicable laws, regulations and in accordance with the contractual terms and service levels they have agreed with the bank. If third parties do not conduct business in accordance with these standards, Deutsche Bank may be exposed to material losses and could be subject to regulatory action or litigation as well as be exposed to reputational damage. More generally, if a third party relationship does not meet the group’s expectations, the bank could be exposed to financial risks, such as the costs and expenses associated with migration of the services to another third party and business and operational risks related to the transition, and the bank could fail to achieve the benefits it sought from the relationship. To enhance the bank’s current control environment, the bank has implemented a new technology platform to support the third party risk management framework and also taken advantage of the change, to improve its processes and controls in the fourth quarter of 2022. There are further enhancements planned in 2023 and beyond.
Due to the geopolitical events of 2022, the bank implemented enhanced oversight of third parties potentially impacted by the war in Ukraine and resulting sanctions imposed against Russia.
In situations where Deutsche Bank is the third party service provider, the bank may be exposed to financial risks, such as lost revenues, costs and expenses associated with the cancellation of the service agreement, if Deutsche Bank were no longer able to benefit from the relationship.
83 |
Deutsche Bank | ||
Annual Report 2022 | ||
Impairment of Goodwill and other intangible assets
Goodwill is reviewed annually for impairment or more frequently if there are indications that impairment may have occurred.
Other intangible assets are recognized separately from goodwill when they are separable or arise from contractual or other legal rights and their fair value can be measured reliably. These assets are tested for impairment or their useful lives reaffirmed at least annually. This includes the testing in relation to software impairments.
The determination of the recoverable amount in the impairment assessment of non-financial assets requires estimates based on quoted market prices, prices of comparable businesses, present value or other valuation techniques, or a combination thereof, necessitating management to make subjective judgments and assumptions. These estimates and assumptions could result in significant differences to the amounts reported if underlying circumstances were to change. Impairments of goodwill and other intangible assets have had and may have a material adverse effect on profitability and results of operations.
Pension Obligations
Deutsche Bank sponsors a number of post-employment benefit plans on behalf of its employees, including defined benefit plans. To the extent that the factors that drive its pension liabilities move in a manner adverse to it, or that the bank’s assumptions regarding key variables prove incorrect, or that its funding of the pension liabilities does not sufficiently hedge those liabilities, the bank could be required to make additional contributions or be exposed to actuarial or accounting losses in respect of the bank’s pension plans.
Deferred Tax Assets
The bank recognizes deferred tax assets for future tax consequences attributable to temporary differences between the financial statement carrying amounts of existing assets and liabilities and their respective tax bases, unused tax losses and unused tax credits. To the extent that it is no longer probable that sufficient taxable profits will be available to allow all or a portion of the deferred tax assets to be utilized, the bank must reduce the carrying amounts. Each quarter, the bank re-evaluates its estimate related to deferred tax assets, which can change from period to period and requires significant management judgment. Reductions in the amount of deferred tax assets from a change in estimate have had and may in the future have material adverse effects on its profitability, equity and financial condition.
Technology, Data and Innovation
Digital Innovation offers market entry opportunities for new competitors such as cross-industry entrants, global high-tech companies or financial technology companies. Therefore, the bank expects its businesses to have an increased need for investment in digital product and process resources to mitigate the risk of a potential loss of market share.
To be able to respond to market developments, respond more quickly to clients need faster and to have more flexibility, and to improve IT resiliency, the bank has decided to migrate a large number of applications to the Public Cloud through a strategic partnership with Google Cloud. This partnership with Google Cloud is a major milestone in the bank’s digital journey and shows a commitment to embrace new technologies. The objective is to enhance the client experience through improved products and services, system resiliency and security as well as reducing the cost inefficiencies of running legacy platforms. Such a major technology migration requires robust governance and planning, including required allocation of funding, to manage the risk of security and stability issues. Additionally, there is significant regulatory interest in this program. Also, as with any external service providers, the bank must ensure the highest standards of data privacy and security controls to safeguard client and bank information. Failure to do so can compromise client trust, lead to financial losses and, in severe cases, regulatory penalties, litigation and the obligation to compensate individuals for damage.
Deutsche Bank operates in an environment with increasing levels of digitization and a continually evolving threat landscape related to information security. Information Security remains a material area of focus for the bank. Financially motivated and other sophisticated cyber-attacks, including ransomware, can be observed as a persistent threat across industries and are anticipated to become more frequent. Additional threats are posed by supply chain attacks, an increasing frequency of high-rated zero-day exploits and an expanding threat surface introduced by e.g., remote ways of working or the use of cloud services.
Deutsche Bank may face operational risks arising from failures in the control environment including errors in the performance of its processes or security controls, as well as loss of data, which may disrupt its business and lead to material losses. At the same time, the bank may also face risks of material losses or reputational damage if services are not provided as agreed or in line with internal standards.
84 |
Deutsche Bank | ||
Annual Report 2022 | ||
Reliance on third parties’ products and services that support critical operations can affect the bank’s risk posture, because it can be the target of new and evolving information security attacks. This risk, along with increased regulatory requirements, has necessitated detailed oversight and continuous monitoring of third-party security as well as the continued maturing of our technology driven third party security capabilities. Deutsche Bank manages information security third-party risk by means of its global third-party risk management program, which includes requisite obligations of information security controls, as applicable.
Deutsche Bank’s systems are subject to an increasing risk of cyber-attacks and other internet crime, which could result in material losses of client or customer information, damage its reputation and lead to regulatory penalties and financial losses. Accordingly, Deutsche Bank continues to invest toward the protection of its computer systems against such breaches and toward ensuring that its vendors employ appropriate cybersecurity safeguards. These measures, however, may not be effective against the many security threats Deutsche Bank group faces. Deutsche Bank and other financial institutions have experienced attacks on computer systems, including attacks aimed at obtaining unauthorized access to confidential company or customer information or damaging or interfering with company data, resources, or business activities, or otherwise exploiting vulnerabilities in its infrastructure. Deutsche Bank group expects to continue to be the target of such attacks in the future. Although to date the bank has not experienced any material business impact from these attacks, the group may not be able to effectively anticipate and prevent more material attacks from occurring in the future.
Deutsche Bank is still maturing its overall data management strategy against its core processes and data sets such as transactional, client and reference data. This includes the development and implementation of the bank’s enterprise architecture principles across the core technology infrastructure. This is central to Deutsche Bank’s wider technology and data strategy, enabling business growth and efficiencies, while also enhancing the control environment. Deutsche Bank’s regulators are actively engaged in ensuring the bank progresses with this component of its strategy. Furthermore, the bank also faces challenges with respect to embracing and incorporating new and disruptive technologies in conjunction with existing technological architecture in order to ensure industry standards of information security and customer experience.
Major technology transformations in the bank’s business and infrastructure areas are executed via dedicated initiatives. The benefits of these include IT and business cost reduction, control improvements, revenue growth through provision of new client features or targeted client growth. One of these initiatives, UNITY, which aims at simplifying its IT environment through the migration of IT systems from the former Postbank into those of Deutsche Bank, faces important milestones before its completion in 2023. Program execution risks, including resource shortage, dependencies to other programs and key deliverables (also referred to as KDs), extended implementation timelines or impact of the change related activity on the control environment or functionality issues in the upgraded applications or underlying technology are carefully managed to partially mitigate the risk of not fully achieving expected benefits.
Environmental, social and governance risk
The impacts of rising global temperatures, and the enhanced focus on climate change and the transition to a net-zero economy from society, regulators and the banking sector have led to new sources of financial and non-financial risks. For example, these include the physical risks arising from extreme weather events, which are growing in frequency and severity, as well as transition risks as carbon intensive sectors are faced with higher taxation, reduced demand and potentially restricted access to financing or stranded assets. These risks can impact Deutsche Bank across a broad range of financial and non-financial risk types.
Financial institutions are facing increased scrutiny as well as regulatory reporting requirements on climate and broader ESG-related issues from governments, regulators, shareholders and other bodies, leading to reputational risks if the bank is not seen to support the transition to a lower carbon economy, to protect biodiversity and manage other environmental risks (e.g. forest- and water-related risks), and to prevent human rights abuse within supply chains. There may be material impacts on the Group’s businesses if it fails to adopt such demands or appropriately implement its strategic plans. Furthermore, data and methodologies for measuring and assessing such climate and other environmental risks are still evolving. A lack of comprehensive and consistent climate and other environmental risk disclosures by its clients means that the bank, in line with the wider industry, is heavily reliant on proxy estimates for its own climate-related risk management disclosures.
Deutsche Bank is committed to managing its business activities and operations in a sustainable manner, including aligning its portfolios with net zero emissions by 2050. Net zero aligned targets for four key carbon intensive sectors were published in October 2022, with targets fully integrated into internal risk management frameworks and processes. While the bank do not expect to see a linear reduction in portfolio emissions / emission intensities, significant deviations from the net zero aligned reduction pathway may open the bank up to reputational risks. The bank will announce targets for a broader range of sectors in 2023. The bank is continuing to develop and implement its approach to climate and environmental risk management in order to promote the integration of environmental-related factors across its business activities supported by the development of scenario analysis and stress testing.
85 |
Deutsche Bank | ||
Annual Report 2022 | ||
Opportunities
Macroeconomic and market conditions
Should economic conditions, such as GDP growth, levels of unemployment, the interest rate environment and competitive conditions in the financial services industry improve beyond currently forecasted levels, this could result in higher revenues. These impacts may only be partially offset by additional costs, therefore improving the Group’s ability to meet its financial targets. At the same time, higher inflation, interest rates and market volatility could present a number of opportunities, such as increased revenues from higher trading flows amid private, corporate and institutional customers repositioning their portfolios, higher net interest income as well as higher margins on lending across the Group’s balance sheet. In 2022, net interest margins improved across the Group, supported by increases in EUR and USD rates, while trading revenues benefitted from higher customer flows in volatile market conditions.
A substantial proportion of the assets and liabilities on the Group’s balance sheet comprises of financial instruments that the bank carry at fair value, with changes in fair value recognized in its income statement. As a result of such changes, the Group may realize gains in the future.
Regulatory change
Regulatory change can encourage banks to provide better products or services that can offer opportunities for differentiation in the marketplace. For example, as reporting standards continue to develop for sustainable finance, the market may evolve to embrace sustainable finance initiatives more broadly. As clients and the market adopt sustainable finance related initiatives, the Group may have the opportunity to further differentiate the bank by enhancing the services provided to its clients.
Strategy
Deutsche Bank’s strategy was presented at the Investor Deep Dive on March 10th, 2022, outlining the Group’s approach to materially improve returns to shareholders over time and best deploy the balance sheet as well as other resources, in a way that is consistent with the client franchise and risk appetite of the bank. As such, the implementation of the Group’s strategy may create further opportunities if implemented to a greater extent or under more favorable conditions than anticipated. This includes potential benefits from better than planned macroeconomic, market and geopolitical conditions or advantageous changes in the competitive environment, such as the retreat of traditional and emerging, non-banking competitors in selected markets.
If businesses and processes improve beyond Deutsche Bank’s planned assumptions and cost efficiencies can be realized sooner or to a greater extent than forecasted, this could also positively impact the results of operations. The progress could be further stimulated if markets react favorably to Deutsche Bank’s ongoing transformation efforts, rating upgrades and sustained revenue performance. This could in turn reduce funding costs and further amplify the bank’s profitability.
By investing in areas of core strengths, the bank expects to pursue the Group strategy of targeted growth and to become the first point of call for all clients of Deutsche Bank, addressing the full range of their financial needs – as their “Global Hausbank”. Deutsche Bank’s expects its over 150-year heritage, global network, market expertise, comprehensive product range and outstanding risk management, to aid in setting the Group up for the next phase of its evolution. This will focus on becoming sustainably profitable by further growing businesses while increasing efficiencies and maintaining capital discipline.
Within the Corporate Bank, Deutsche Bank sees multi-faceted opportunities across a market leading franchise that leverages Corporate Bank’s global footprint and coverage model. Deutsche Bank expects to grow revenues by combining risk management solutions with new treasury platform capabilities and establishing the Corporate Bank as a key partner to support its clients’ energy transformation, building on its position in Europe and expanding further into APAC.
The Investment Bank continues to be a global leader in fixed income and financing products, and Deutsche Bank is focused on consolidating this position and maintaining the market share gained. To achieve this, combined with the strength of the Origination and Advisory platform, the focus of the division is targeted on specific investment into areas of growth adjacent to current businesses to enhance and diversify the product offering. This will be complemented by the continued optimization of cost and capital across the portfolio, and additional enhancements to the control environment. In addition, an increased focus upon the efficiency of the division’s client coverage and further developments in the service offering provided intends to increase the strength and depth of relationships across the global client base.
For the Private Bank, focus remains on German retail, international retail and business clients, and on seeking growth predominantly within advisory areas. With respect to wealth management activities, the Group sees growth opportunities particularly in EMEA and APAC.
86 |
Deutsche Bank | ||
Annual Report 2022 | ||
For Asset Management, comprising the DWS legal entities, a strategy was outlined at DWS’ Capital Markets Day on December 7, 2022 to maintain leadership in mature asset classes and selectively grow other regions and products, to cement its status as a leading asset manager. Growth areas include revenue opportunities from further asset shifts towards Passive investments and Alternative products.
Deutsche Bank continues to focus on sustainability throughout the bank and has seen opportunities for growth in this space across all the bank’s core businesses as clients’ response to climate change gains further traction. Given strong client appetite, Deutsche Bank continues to see sustainable finance as a key opportunity and area of investment. As part of the broader efforts to develop a risk appetite strategy to manage climate risk, the bank sees opportunities to support clients, for example, in developing credible decarbonization strategies and support their transition.
Individuals and institutions, including clients and non-clients of the bank, increasingly view ESG-related opportunities as significant for long-term returns and the bank believes this could become a key differentiator. In this this regard, inclusion of ESG factors in the investment processes or decision-making process for awarding business mandates across businesses is growing. As such, Deutsche Bank plans to develop and provide financial products or investment possibilities that can help both the bank and its clients to achieve common ESG goals and advance Deutsche Bank’s holistic ESG strategy. More broadly, the bank believes that advancing ESG activities can lead to both additional revenues opportunities as well as an improved brand and stakeholder perception.
Overall, there are opportunities for Deutsche Bank to gain market share and grow its client base via supporting client needs for financing, advice, and risk management.
The operating environment provides opportunities, as clients and competitors adapt to the “new normal” with the COVID-19 pandemic levels receding. In this regard, Deutsche Bank is now focusing on further optimization of its operating model, such as aiming to sustainably reduce costs, including real estate cost through delivery of the Future of Work program.
Deferred Tax Assets
Deutsche Bank recognizes deferred tax assets for future tax consequences attributable to temporary differences between the financial statement carrying amounts of existing assets and liabilities and their respective tax bases, unused tax losses and unused tax credits. To the extent that it is no longer probable that sufficient taxable profits will be available to allow all or a portion of deferred tax assets to be utilized, the Group must reduce the carrying amounts and recognize valuation adjustments. Each quarter, the bank re-evaluates its estimate related to deferred tax assets, which can change from period to period and requires significant management judgment. In 2019, the Group recognized valuation adjustments of € 2.8 billion related to deferred tax assets in jurisdictions affected by the transformation, such as the UK and the United States. Since 2019, the carrying amount of the bank’s deferred tax assets partially recovered and the bank recognized positive deferred tax asset valuation adjustments with respect to its deferred tax assets in the United States of € 1.4 billion in the fourth quarter of 2022 and € 274 million in the fourth quarter of 2021 as profitability has significantly improved since 2019 due to the successful transformation of the US business. Depending upon the Group´s performance in affected jurisdictions going forward the carrying value of deferred tax assets for which the bank recognized valuation adjustments in connection with the transformation or prior to that may continue to recover over time. This may result in positive valuation adjustments in the future that would reduce the effective tax rate.
87 |
Deutsche Bank | ||
Annual Report 2022 | ||
Technology, Data and Innovation
Digital Innovation offers various revenue opportunities to increase monetization on existing customers and acquire new customer groups by expanding the Group’s own portfolio of products and engaging in product partnerships with third parties, thereby potentially benefiting from a shorter time-to-market. Market trends such as the platform economy, matching internal and external products with customer demands and transacting through one central platform, and open banking provide a clear opportunity for the bank to position itself as a strong player in these ecosystems. The goal is to develop an ecosystem of comprehensive services, with different components developed by different firms for areas like the retail deposit marketplace, automated financial planning services (robo-advisor), or insurance recommendation services leveraging Deutsche Bank’s banking platform. Other opportunities include the potential industry transformation effect driven by the token economy. Long-term potential exists in Distributed Ledger Technology (DLT) and associated use cases. For example, asset tokenization presents an opportunity to make illiquid assets tradable. Furthermore, the Group has an opportunity to expand its data capabilities, to improve personalized services for a better customer experience as well as to embrace disruptive technologies such as artificial intelligence to build out the bank’s service offering. The Group’s global reach allows it to scale products quickly and efficiently across geographies.
To drive change, accelerate the adoption of technologies into the bank and monetize on the above-mentioned market opportunities, the bank has one Technology, Data and Innovation (TDI) division which includes all technology units of the bank’s business and infrastructure divisions. In TDI all units, no matter which business or infrastructure area they serve, work according to the same standards and leverage shared technologies. This centralized approach enables bank to address key strategic challenges in a focused set-up, drive a culture of engineering and innovation and invest in mid to long term digital services and new business models.
On the cost side, digitization offers business divisions an opportunity for significant efficiency gains. By investing in digital applications such as digital client self-boarding, front-to-back processes can be automated, and productivity increased. Development of strong data capabilities should enhance the bank’s ability to make accurate predictions about client and market behavior, reducing fraud and pricing products more efficiently, while complying with regulatory obligations using latest technologies. Again, the TDI organization is intended to serve as a focal point to accelerate selected strategic initiatives and to bring overall cost down.
Deutsche Bank and Google Cloud formed a strategic partnership in late 2020. The multi-year cooperation aims to accelerate the bank’s transition to the cloud and to co-innovate new products and services. Via the partnership, Deutsche Bank benefits from a standardized and technically always up-to-date environment in which capacity can be increased and decreased as needed. It also enables the bank to access emerging technologies directly in the cloud and use them in the development of new applications. The bank’s customers will benefit from products and services being developed and brought to market more quickly in the future.
In December 2022, the bank also announced a multi-year innovation partnership with NVIDIA to accelerate the use of artificial intelligence (AI) and machine learning (ML) within the scope of its ongoing technology transformation. The partnership aims to enrich the bank’ leadership in risk management, improve efficiency and enhance customer service by leveraging a broad range of applications, including intelligent avatars, speech AI, and fraud detection.
The collaboration followed months of exploratory work in which the companies tested a number of potential use cases. These include enabling faster risk calculations at scale, using large language models to extract key information from unstructured data to achieve outcomes such as early warning signs on the counterparty of a financial transactions, as well as developing an early concept of a 3D virtual avatar aimed at helping employees navigate internal systems and respond to HR-related questions.
88 |
Deutsche Bank | ||
Annual Report 2022 | ||
Risk Report
| Risk and capital overview | |||||
| Risk and capital framework | |||||
| Risk and Capital Management | |||||
89 |
Deutsche Bank | ||
Annual Report 2022 | ||
Introduction
Disclosures in line with IFRS 7
The following Risk Report provides qualitative and quantitative disclosures about credit, market and other risks in line with the requirements of International Financial Reporting Standard 7 (IFRS 7) Financial Instruments: Disclosures. It also considers the underlying classification and measurement and impairment requirements in IFRS 9 with further details to be found in the “Credit Risk Management and Asset quality” section, in the “Asset quality” section, in the “Credit risk mitigation” section and in Note 1 “Significant accounting policies and critical accounting estimates” to the consolidated financial statements. Information which forms part of and is incorporated by reference into the financial statements of this report is marked by a light blue shading throughout this Risk Report.
European Regulation (EU) 2019/876 and Directive (EU) 2019/878 introduced amendments to the CRR/CRD with various changes to the regulatory framework that became applicable for June 30, 2021: A new standardized approach for counterparty credit risk (SA-CCR) was introduced that replaces the mark-to-market method to determine the exposure value for derivatives that are not in scope of the internal model method. In addition, a new framework to determine the risk weight for banking book investments in collective investment undertakings and default fund contributions to central counterparties was introduced. Moreover, a minimum regulatory leverage ratio of 3% is determined as the ratio of Tier 1 capital and the regulatory leverage exposure. In addition, a minimum Net Stable Funding Ratio (NSFR) of 100% was introduced that requires banks to maintain a stable funding profile in relation to their on and off balance sheet exposures.
Deutsche Bank applies the definition of default based on the EBA technical standard regarding the materiality threshold for credit obligations past due (implemented with ECB regulation (EU) 2018/1845) and the guideline on the application of the definition of default. The ECB’s approval was received in August 2021 and Deutsche Bank introduced the new requirements subsequently in 2021. The new requirements replaced the default definition under Basel II and is applied to all key risk metrics throughout the Annual Report including as a trigger to Stage 3 under IFRS 9.
Since June 30, 2020, the Group applies the transitional arrangements in relation to IFRS 9 as provided in the current CRR/CRD for all CET1 measures.
Disclosures according to Pillar 3 of the Basel 3 Capital Framework
Deutsche Bank’s disclosures according to Pillar 3 of the Basel 3 Capital Framework, which are implemented in the European Union by the Regulation (EU) No 575/2013 on prudential requirements for credit institutions (Capital Requirements Regulation or CRR), including recent amendments; and supported by the EBA guideline “Final draft implementing technical standards on public disclosures by institutions of the information referred to in Titles II and III of Part Eight of Regulation (EU) No 575/2013“ and related guidelines applicable to Pillar 3 disclosures, are published in the Group’s Pillar 3 Report, which can be found on Deutsche Bank’s website.
Disclosures according to principles and recommendations of the Enhanced Disclosure Task Force
In 2012 the Enhanced Disclosure Task Force (EDTF) was established as a private sector initiative under the auspices of the Financial Stability Board (FSB), with the primary objective to develop fundamental principles for enhanced risk disclosures and to recommend improvements to existing risk disclosures. Deutsche Bank adheres to the disclosure recommendations in this Risk Report and also in its Pillar 3 report.
90 |
Deutsche Bank | ||
Annual Report 2022 | ||
Risk and capital overview
Key risk metrics
As mentioned in the section Risks and Opportunities above, the bank is exposed to a variety of financial and non-financial risk factors. Over the course of 2022, the economic growth prospects have deteriorated driven by persistent and rising inflation, the interest rate environment and supply chain disruptions as the global economy experienced high levels of uncertainty from the ongoing war in Ukraine. Potential downside risks to economic activity and financial markets remain elevated.
The following selected key risk ratios and corresponding metrics form part of Deutsche Bank´s holistic risk management across individual risk types. The Common Equity Tier 1 ratio, Economic Capital Adequacy Ratio, Leverage ratio, Total Loss Absorbing Capacity, Minimum Requirement for Own Funds and Eligible Liabilities, Liquidity Coverage Ratio, Net Stable Funding Ratio and Stressed Net Liquidity Position serve as high-level metrics and are fully integrated across strategic planning, risk appetite framework, and recovery and resolution planning practices, which are reviewed and approved by the Management Board at least annually.
Common Equity Tier 1 Ratio | ||
31.12.2022 | 13.4% | |
31.12.2021 | 13.2% | |
Economic Capital Adequacy Ratio | ||
31.12.2022 | 239% | |
31.12.2021 | 206% | |
Leverage Ratio | ||
31.12.2022¹ | 4.6% | |
31.12.2021 (fully loaded)² ³ | 4.9% | |
Total loss absorbing capacity (TLAC) | ||
31.12.2022 (Risk Weighted Asset based) | 32.2% | |
31.12.2022 (Leverage Exposure based) | 9.3% | |
31.12.2021 (Risk Weighted Asset based) | 31.0% | |
31.12.2021 (Leverage Exposure based) | 9.7% | |
Liquidity Coverage Ratio | ||
31.12.2022 | 142% | |
31.12.2021 | 133% | |
Risk-Weighted Assets | ||
31.12.2022 | € 360.0 bn | |
31.12.2021 | € 351.6 bn | |
Economic Capital | ||
31.12.2022 | € 20.9 bn | |
31.12.2021 | € 23.5 bn | |
Leverage Exposure | ||
31.12.2022 | € 1,240 bn | |
31.12.2021³ | € 1,125 bn | |
Minimum requirement for own funds and eligible liabilities (MREL) | ||
31.12.2022 | 34.4% | |
31.12.2021 | 32.7% | |
Stressed Net Liquidity Position (sNLP) | ||
31.12.2022 | € 48.1 bn | |
31.12.2021⁴ | € 43.3 bn | |
Net Stable Funding Ratio (NSFR) | ||
31.12.2022 | 120% | |
31.12.2021 | 121% | |
1Starting with first quarter of 2022 leverage numbers are presented as reported as the fully loaded definition has been eliminated as resulting only in an immaterial difference
2Comparative information for earlier periods is based on Deutsche Bank’s earlier fully loaded definition
3Since April 1, 2022, Deutsche Bank no longer excludes certain central bank exposures (amounting to € 99 billion as of December 31, 2021), based on Article 429a (1) (n) CRR and the ECB Decision 2021/1074 as this temporary exemption during the COVID-19 pandemic ended on March 31, 2022; not applying the temporary exclusion of certain central bank exposures the leverage exposure was € 1,223 billion as of December 31, 2021, corresponding to a leverage ratio of 4.5%
3December 2021 sNLP has been updated from € 47.6 billion to € 43.3 billion due to a model change for a product variant in the Investment bank portfolio
Deutsche Bank regularly assess the potential impacts of risks on its balance sheet and profitability through portfolio reviews and stress tests. Stress tests are also used to test the resilience of Deutsche Bank’s strategic plans. The results of these tests indicate that the currently available capital and liquidity reserves, in combination with available mitigation measures, are sufficient to withstand periods of potential stress.
The Group concludes that the risks, as described above or in the following sections, to which Deutsche Bank is exposed to, including potential impacts on its business strategy, provide a true and fair picture of its risk profile.
For further details please refer to sections “Risk profile”, “Risk appetite and capacity”, “Risk and capital plan”, “Stress testing”, “Recovery and resolution planning”, “Risk and capital management”, “Capital, leverage ratio, TLAC and MREL”, “Liquidity coverage ratio”, and “Stress testing and scenario analysis”.
91 |
Deutsche Bank | ||
Annual Report 2022 | ||
Risk profile
The table below shows Deutsche Bank’s overall risk position as measured by the economic capital demand calculated for credit, market, operational and strategic risk for the dates specified. Deutsche Bank’s overall economic risk position also considers diversification benefits across risk types.
Overall risk position as measured by economic capital demand by risk type
| 2022 increase (decrease) | |||||||
in € m. | Dec 31, 2022 | Dec 31, 2021 | in € m. | in % | ||||
Credit risk | 11,802 | 11,725 | 76 | 1 | ||||
Market risk | 6,355 | 7,920 | (1,565) | (20) | ||||
Trading market risk | 1,387 | 2,292 | (904) | (39) | ||||
Non-trading market risk | 4,968 | 5,628 | (660) | (12) | ||||
Operational risk | 4,668 | 4,937 | (270) | (5) | ||||
Strategic risk | 1,854 | 3,173 | (1,319) | (42) | ||||
Diversification benefit¹ | (3,778) | (4,213) | 435 | (10) | ||||
Total economic capital demand | 20,900 | 23,542 | (2,642) | (11) | ||||
1Diversification benefit across credit, market, operational and strategic risk
As of December 31, 2022, Deutsche Bank’s economic capital demand amounted to € 20.9 billion, which was € 2.6 billion or 11% lower than € 23.5 billion economic capital demand as of December 31, 2021, which was driven by decreases in economic capital demand market risk, strategic risk and operational risk partly offset by diversification benefit.
The economic capital demand for market risk totaled € 6.4 billion as of December 31, 2022, which was € 1.6 billion or 20% lower compared to year-end 2021. The decrease was mainly driven by reduction of credit and wholesale loan inventory in the Investment Bank and reduced credit exposure in the Group’s defined benefit pension plan assets, lower equity risk arising from the share-based compensation plans and a decrease in rates exposure from Treasury funding activities.
The strategic risk category captures the economic capital arising from earnings volatility risk (which also includes potential losses from software assets), tax redetermination risk, and a capital charge for the risk related to deferred tax assets on temporary differences. The economic capital for strategic risk decreased to € 1.9 billion as of December 31, 2022, which was € 1.3 billion or 42% lower compared to December 31, 2021. This reduction reflects the implementation of a model enhancement for software assets, lower deferred tax assets on temporary differences and a decrease in tax re-determination risk.
The operational risk economic capital usage totaled € 4.7 billion as of December 31, 2022, which was € 0.3 billion or 5% lower than the € 4.9 billion economic capital usage as of December 31, 2021. In line with the development of the Group’s RWA for operational risk, the decrease was largely driven by a lighter internal loss profile, in particular lower loss frequency feeding into Group’s capital model. For a detailed description see the section “Operational risk management”.
The inter-risk diversification benefit of the economic capital demand across credit, market, operational and strategic risk totaled € 3.8 billion as of December 31, 2022, which was € 0.4 billion or 10% lower compared to year-end 2021. This decrease mainly reflects changes in the underlying risk type profile.
Deutsche Bank’s mix of business activities results in diverse risk taking by the business divisions. The Group also measures the key risks inherent in the respective business models through the total economic capital metric, which mirrors each business division’s risk profile and considers cross-risk effects at group level.
Risk profile of Deutsche Bank’s business divisions as measured by economic capital
| Dec 31, 2022 | |||||||||||||||
in € m. (unless | Corporate Bank | Investment Bank | Private Bank | Asset Management | Capital Release Unit | Corporate & Other | Total | Total | ||||||||
Credit risk | 2,760 | 4,259 | 2,344 | 53 | 194 | 2,192 | 11,802 | 56 | ||||||||
Market risk | 343 | 1,177 | 662 | 180 | 108 | 3,886 | 6,355 | 30 | ||||||||
Operational risk | 424 | 1,852 | 611 | 273 | 1,507 | 0 | 4,668 | 22 | ||||||||
Strategic risk | 0 | 0 | 0 | 0 | 0 | 1,854 | 1,854 | 9 | ||||||||
Diversification benefit¹ | (440) | (1,308) | (543) | (162) | (758) | (567) | (3,778) | (18) | ||||||||
Total EC | 3,088 | 5,980 | 3,073 | 344 | 1,051 | 7,365 | 20,900 | 100 | ||||||||
Total EC in % | 15 | 29 | 15 | 2 | 5 | 35 | 100 | N/M | ||||||||
N/M – Not meaningful
1Diversification benefit across credit, market, operational and strategic risk
92 |
Deutsche Bank | ||
Annual Report 2022 | ||
| Dec 31, 2021 | |||||||||||||||
in € m. (unless | Corporate Bank | Investment Bank | Private Bank | Asset Management | Capital Release Unit | Corporate & Other | Total | Total | ||||||||
Credit risk | 2,984 | 4,869 | 2,519 | 60 | 376 | 917 | 11,725 | 50 | ||||||||
Market risk | 306 | 2,094 | 570 | 83 | 140 | 4,728 | 7,920 | 34 | ||||||||
Operational risk | 446 | 2,002 | 602 | 269 | 1,619 | 0 | 4,937 | 21 | ||||||||
Strategic risk | 242 | 10 | 32 | 0 | 1 | 2,888 | 3,173 | 13 | ||||||||
Diversification benefit¹ | (478) | (1,533) | (540) | (145) | (826) | (693) | (4,213) | (18) | ||||||||
Total EC | 3,500 | 7,442 | 3,183 | 267 | 1,309 | 7,840 | 23,542 | 100 | ||||||||
Total EC in % | 15 | 32 | 14 | 1 | 6 | 33 | 100 | N/M | ||||||||
N/M – Not meaningful
1Diversification benefit across credit, market, operational and strategic risk
Corporate Bank’s risk profile is dominated by its Trade Finance, Commercial Banking and Cash Management products and services offered. Economic capital demand largely arises from credit risk and is predominantly driven by the Trade Finance and Commercial Clients businesses. The economic capital demand for the Corporate Bank decreased by € 0.4 billion in comparison to year-end 2021 mainly driven by strategic risk due to changes in the business allocation process and a reduction in credit risk exposures.
Investment Bank’s risk profile is dominated by its financing and trading activities, which give rise to all major risk types. Credit risk in the Investment Bank is broadly distributed across business units but most prominent in Global Credit Trading, Rates and Leveraged Debt Capital Markets. Market risk arises mainly from trading and market making activities. The economic capital demand for the Investment Bank decreased by € 1.5 billion in comparison to year-end 2021 as a result of lower market and credit risk. Economic capital demand for market risk decreased by € 0.9 billion mainly due to lower levels of corporate bond inventory and a reduction on the Leverage Lending and Commercial Real Estate pipeline. The reduction in credit risk economic capital demand of € 0.6 billion was driven by lower counterparty risk in areas such as Commercial Real Estate and Leverage Lending portfolio.
Private Bank’s risk profile comprises business with German retail, international retail and business clients as well as wealth management clients generating credit risks as well as non-trading market risks from investment risk, modelling of client deposits and credit spread risk. The economic capital demand for the Private Bank decreased by € 0.1 billion in comparison to year-end 2021 mainly driven by € 0.2 billion lower credit risk due to diversification effects and improved book quality. This was partially offset by higher market risk of € 0.1 billion from the changed interest rate environment affecting private client’s loans and deposits.
Asset Management, as a fiduciary asset manager, invests money on behalf of clients. As such, the main risk drivers are non-financial. The economic capital demand for market risk is mainly driven by non-trading market risks, which arise from guaranteed products and co-investments in the funds. The economic capital demand for Asset Management increased by € 0.1 billion compared to previous year primarily driven by reduced diversification impact.
Capital Release Unit continued to exit and run down non-strategic assets over 2022. The de-risking across risk types achieved throughout the year led to a reduction in economic capital demand of € 0.3 billion compared to year-end 2021. This decrease was partially offset by a lower diversification benefit from the portfolio reduction.
Corporate & Other’s risk profile mainly comprises non-trading market risk from structural foreign exchange risk, pension risk, equity compensation risk and interest rate risk from Treasury, credit risk from Treasury’s investments, as well as strategic risk from tax redetermination risk, software assets-related risks and a capital charge related IFRS deferred tax assets on temporary differences. The economic capital demand for Corporate & Other decreased by € 0.5 billion in comparison to year-end 2021 due to reduction in market risk and strategic risk partly offset by increase in credit risk. The economic capital demand for strategic risk decreased by € 1 billion due to the implementation of a model enhancement for software assets, lower deferred tax assets on temporary differences and a decrease in tax re-determination risk. The economic capital demand for market risk decreased by € 0.8 billion driven by reduced credit exposure in the Group’s defined benefit pension plan assets, lower equity risk arising from the share-based compensation plans and a reduction in cross currency basis risk. This was partially offset by increase in credit risk of € 1.3 billion mainly driven by higher exposures in Deutsche Bank’s government bond portfolio.
93 |
Deutsche Bank | ||
Annual Report 2022 | ||
Risk and capital framework
Risk management principles
Deutsche Bank’s business model inherently involves taking risks. Risks can be financial and non-financial and include on and off-balance sheet risks. Deutsche Bank’s objective is to create sustainable value in the interests of the company taking into consideration shareholders, employees and other company related stakeholders. The risk management framework contributes to this by aligning planned and actual risk taking with risk appetite as expressed by the Management Board, while being in line with available capital and liquidity.
Deutsche Bank’s risk management framework consists of various components, which include the established internal control mechanisms. Principles and standards are set for each component:
- – Organizational structures must follow the Three Lines of Defense (“3LoD”) model with a clear definition of roles and responsibilities for all risk types
- – The 1st Line of Defense (“1st LoD”) refers to those roles in the Bank whose activities generate risks, whether financial or non-financial, and who own and are accountable for these risks. The 1st LoD manages these risks within the defined risk appetite, establishes an appropriate risk governance and risk culture, and adheres to the risk type frameworks defined by the 2nd Line of Defense (“2nd LoD”)
- – The 2nd LoD refers to the roles in the Bank who define the risk management framework for a specific risk type. The 2nd LoD independently assesses and challenges the implementation of the risk type framework and adherence to the risk appetite, and acts as an advisor to the 1st LoD on how to identify, assess and manage risks.
- – The 3rd Line of Defense (“3rd LoD”) is Group Audit, which is accountable for providing independent and objective assurance on the adequacy of the design, operating effectiveness and efficiency of the risk management system and systems of internal control
- – Every employee must act as a risk manager consistent with the bank’s risk appetite, risk management standards and values
- – The Management Board approved risk appetite must be cascaded and adhered to across all dimensions of the Group, with appropriate consequences in the event of a breach
- – Risks must be identified and assessed
- – Risks must be actively managed including appropriate risk mitigation and effective internal control systems
- – Risks must be measured and reported using accurate, complete and timely data using approved models
- – Regular stress tests must be performed against adverse scenarios and appropriate crisis response planning must be established
The Group promotes a strong risk culture where every employee must fully understand and take a holistic view of the risks which could result from their actions, understand the consequences and manage them appropriately against the risk appetite of the bank. The bank expects employees to exhibit behaviors that support a strong risk culture in line with the bank’s Code of Conduct. To promote this, Deutsche Bank’s policies require that risks taken (including against risk appetite) must be taken into account during the bank’s performance assessment and compensation processes. This expectation continues to be reinforced through communications campaigns and mandatory training courses for all DB employees. In addition, Management Board members and senior management frequently communicate the importance of a strong risk culture to support a consistent tone from the top.
Deutsche Bank’s risk management and internal control system is described in more detail in Deutsche Bank’s Pillar 3 report (specifically in the section “Risk management objectives and policies, Enterprise Risk”). The risk management and internal control system also covers sustainability-related objectives (as outlined in the Non-Financial Report 2022, specifically in the chapters “Sustainability strategy and implementation” and “Climate risk”).
The Management Board is of the opinion that a risk management framework and internal control system has been established which is, in its entirety, appropriate and effective for the bank’s business model and risk profile.
94 |
Deutsche Bank | ||
Annual Report 2022 | ||
Risk governance
Deutsche Bank’s operations throughout the world are regulated and supervised by relevant authorities in each of the jurisdictions in which the bank conducts business. Such regulation focuses on licensing, capital adequacy, liquidity, risk concentration, conduct of business as well as organizational and reporting requirements. The European Central Bank (ECB) in connection with the competent authorities of EU countries which joined the Single Supervisory Mechanism via the Joint Supervisory Team act in cooperation as Deutsche Bank’s primary supervisors to monitor the bank’s compliance with the German Banking Act and other applicable laws and regulations.
Several layers of management provide cohesive risk governance:
- – Deutsche Bank’s Supervisory Board is informed regularly on the risk situation, risk management and risk controlling, including reputational risk related items as well as material litigation cases; it has formed various committees to handle specific topics (for a detailed description of these committees, please see the “Corporate Governance Report” under “Management Board and Supervisory Board”, “Standing Committees”)
- – At the meetings of the Risk Committee, the Management Board reports on current and forward-looking risk exposures, portfolios, on risk appetite and strategy and on matters deemed relevant for the assessment and oversight of the risk situation of Deutsche Bank AG; it also reports on loans requiring a Supervisory Board resolution pursuant to law or the Articles of Association; the Risk Committee advises on issues related to the overall risk appetite, aggregate risk position and the risk strategy and keeps the Supervisory Board informed of its activities
- – The Regulatory Oversight Committee, among other responsibilities, monitors the Management Board’s measures that promote the company’s compliance with legal requirements, authorities’ regulations and the company’s own policies; it also reviews the bank’s codes of conduct and ethics as well as its policy framework, and, upon request, supports the Risk Committee in monitoring and analyzing the bank’s legal and reputational risks; the Management Board informs the committee about contacts with regulators with a significant relevance for the business activity
- – The Audit Committee, among other matters, supports the Supervisory Board in monitoring the effectiveness of the risk management system, particularly the internal control system and the internal audit system, as well as the Management Board’s remediation of deficiencies identified
- – The Management Board is responsible for managing Deutsche Bank Group in accordance with the law, the Articles of Association and its Terms of Reference with the objective of creating sustainable value in the interest of the company, thus taking into consideration the interests of the shareholders, employees and other company related stakeholders; the Management Board is responsible for ensuring a proper business organization, encompassing appropriate and effective risk management, as well as compliance with legal requirements and internal guidelines; the Management Board established the Group Risk Committee as the central forum for review and decision on material risk and capital-related topics; the Group Risk Committee generally meets once a week; it has delegated some of its duties to individuals and sub-committees; the Group Risk Committee and its sub-committees are described in more detail below
95 |
Deutsche Bank | ||
Annual Report 2022 | ||
Risk management governance structure of the Deutsche Bank Group
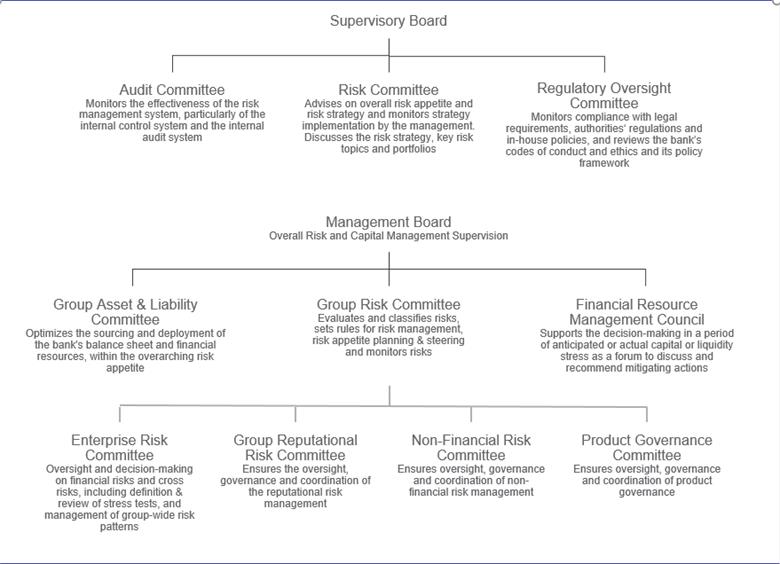

The following functional committees are central to the management of risk at Deutsche Bank:
- – The Group Risk Committee has various duties and dedicated authority, including approval of new or changed material risk and capital models and review of the inventory of risks, high-level risk portfolios, risk exposure developments, and internal and regulatory Group-wide stress testing results; in addition, the Group Risk Committee reviews and recommends items for Management Board approval, such as key risk management principles, the Group risk appetite statement, the Group recovery plan and the contingency funding plan, over-arching risk appetite parameters, and recovery and escalation indicators; the Group Risk Committee also supports the Management Board during Group-wide risk and capital planning processes
- – The Non-Financial Risk Committee oversees, governs and coordinates the management of non-financial risks in Deutsche Bank Group and establishes a cross-risk and holistic perspective of the key non-financial risks of the Group, including conduct and financial crime risk; it is tasked to define the non-financial risk appetite tolerance framework, to monitor and control the effectiveness of the non-financial risk operating model (including interdependencies between business divisions and control functions), and to monitor the development of emerging non-financial risks relevant for the Group
- – The Group Reputational Risk Committee is responsible for the oversight, governance and coordination of reputational risk management and provides for a look-back and a lessons learnt process; matters are referred to the Group Reputational Risk Committee in exceptional circumstances – this may be the case if a matter is declined by the Regional Reputational Risk Committee and appealed by the business division, or if the Regional Reputational Risk Committee cannot reach a two-thirds majority decision; it provides guidance on Group-wide reputational risk matters, including communication of sensitive topics, to the appropriate levels of Deutsche Bank Group; the Regional Reputational Risk Committees which are sub-committees of the Group Reputational Risk Committee, are responsible for the oversight, governance and coordination of the management of reputational risk in the respective regions on behalf of the Management Board
96 |
Deutsche Bank | ||
Annual Report 2022 | ||
- – The Financial Resource Management Council is an ad-hoc governance body, chaired by the Chief Financial Officer and the Chief Risk Officer, with delegated authority from the Management Board, to oversee financial crisis management at the bank; the Financial Resource Management Council provides a single forum to oversee execution of both the contingency funding plan and the Group recovery plan; the council recommends upon mitigating actions to be taken in a time of anticipated or actual capital or liquidity stress; specifically, the Financial Resource Management Council is tasked with analyzing the bank’s capital and liquidity position, in anticipation of a stress scenario recommending proposals for capital and liquidity related matters and overseeing the execution of decisions
- – The Group Asset & Liability Committee has been established by the Management Board with the mandate to optimize the sourcing and deployment of the bank’s balance sheet and financial resources within the overarching risk appetite set by the Management Board
Deutsche Bank’s Chief Risk Officer, who is a member of the Management Board, has Group-wide, supra-divisional responsibility for establishing a risk management framework with appropriate identification, measurement, monitoring, mitigation and reporting of liquidity, credit, market, enterprise, model and non-financial risks (including operational and reputational); however, frameworks for certain risks are established by other functions as per the business allocation plan.
The Chief Risk Officer has direct management responsibility for the Chief Risk Office function. Risk management and control duties in the Chief Risk Office function are generally assigned to specialized risk management units focusing on the management of
- – Specific risk types
- – Risks within a specific business
- – Risks in a specific region.
These specialized risk management units generally handle the following core tasks:
- – Foster consistency with the risk appetite set by the Management Board and applied to business divisions and their business units
- – Determine and implement risk and capital management policies, procedures and methodologies that are appropriate to the businesses within each division
- – Establish and approve risk limits
- – Conduct periodic portfolio reviews to keep the portfolio of risks within acceptable parameters
- – Develop and implement risk and capital management infrastructures and systems that are appropriate for each division
Chief Risk Officers for each business division as well as each region, having a holistic view of the respective business, challenge and influence the divisional and regional strategies, risk awareness and ownership as well as their adherence to risk appetite.
While operating independently from each other and the business divisions, the Finance and Risk functions have the joint responsibility to quantify and verify the risk that the bank assumes.
97 |
Deutsche Bank | ||
Annual Report 2022 | ||
Risk appetite and capacity
Risk appetite expresses the aggregate level and types of risk that Deutsche Bank is willing to assume to achieve strategic objectives, as defined by a set of quantitative metrics and qualitative statements. Risk capacity is defined as the maximum level of risk that can be assumed given Deutsche Bank’s capital and liquidity base, risk management and control capabilities, and regulatory constraints.
Risk appetite is an integral element in business planning processes via risk strategy and plan, to promote the appropriate alignment of risk, capital and performance targets, while at the same time considering risk capacity and appetite constraints from both financial and non-financial risks. Compliance of the plan with risk appetite and capacity is also tested under stressed market conditions. Top-down risk appetite serves as the limit for risk-taking for the bottom-up planning from the business functions.
The Management Board reviews and approves risk appetite and capacity on an annual basis, or more frequently in the event of unexpected changes to the risk environment, with the aim of ensuring that they are consistent with the Group’s strategy, business and regulatory environment and stakeholders’ requirements.
In order to determine risk appetite and capacity, different group level triggers and thresholds on a forward-looking basis are set and the escalation requirements for further action are defined. Deutsche Bank assigns risk metrics that are sensitive to the material risks to which Deutsche Bank is exposed and which function as indicators of financial health. In addition to that, the risk and recovery management framework is linked with the risk appetite framework.
Reports relating to risk profile as compared to Deutsche Bank’s risk appetite and strategy and the monitoring thereof are presented regularly up to the Management Board. In the event that desired risk appetite is breached, a predefined escalation governance matrix is applied so these breaches are highlighted to the appropriate governance bodies.
Risk and capital plan
Strategic and capital plan
Deutsche Bank conduct annually an integrated strategic planning process which lays out the development of our future strategic direction for the Group and for the business areas. The strategic plan aims to create a holistic perspective on capital, funding and risk under risk-return considerations. This process translates long-term strategic targets into measurable short- to medium-term financial targets and enables intra-year performance monitoring and management. Thereby the Group aims to identify growth options by considering the risks involved and the allocation of available capital resources to drive sustainable performance. Risk-specific portfolio strategies complement this framework and allow for an in-depth implementation of the risk strategy on portfolio level, addressing risk specifics including risk concentrations.
The strategic planning process consists of two phases: a top-down target setting and a bottom-up substantiation.
In a first phase – the top-down target setting – Deutsche Bank’s key targets for profit and loss (including revenues and costs), capital supply, capital demand as well as leverage, funding and liquidity are discussed for the group and the key business areas. In this process, the targets for the next five years are based on the global macro-economic outlook and the expected regulatory framework. Subsequently, the targets are approved by the Management Board.
In a second phase, the top-down objectives are substantiated bottom-up by detailed business unit plans, which consist of a month by month operative plan for year one; years two and three are planned per quarter and years four and five are annual plans. The proposed bottom-up plans are reviewed and challenged by Finance and Risk and are discussed individually with the business heads. Thereby, the specifics of the business are considered and concrete targets decided in line with the bank’s strategic direction. The bottom-up plans include targets for key legal entities to review local risk and capitalization levels. Stress tests complement the strategic plan to also consider stressed market conditions.
The resulting Strategic and Capital Plan is presented to the Management Board for discussion and approval. The final plan is presented to the Supervisory Board.
98 |
Deutsche Bank | ||
Annual Report 2022 | ||
The Strategic and Capital Plan is designed to support our vision of being a leading German bank with strong European roots and a global network and aims to ensure:
- – Balanced risk adjusted performance across business areas and units
- – High risk management standards with focus on risk concentrations
- – Compliance with regulatory requirements
- – Strong capital and liquidity position
- – Stable funding and liquidity strategy allowing for business planning within the liquidity risk appetite and regulatory requirements
The Strategic and Capital Planning process allows us to:
- – Set earnings and key risk and capital adequacy targets considering the bank’s strategic focus and business plans
- – Assess our capital adequacy with regard to internal and external requirements (i.e., economic capital and regulatory capital)
- – Apply appropriate stress test analyses’ to assess the impact on capital demand, capital supply and liquidity
All externally communicated financial targets are monitored on an ongoing basis in appropriate management committees. Any projected shortfall versus targets is discussed together with potential mitigating strategies with the aim to ensure that we remain on track to achieve our targets. Amendments to the strategic and capital plan must be approved by the Management Board. Achieving our externally communicated solvency targets ensures that we also comply with the solvency ratio-related Group Supervisory Review and Evaluation Process (SREP) requirements as articulated by our home supervisor.
In February 2022, the ECB informed Deutsche Bank of its decision effective March 1, 2022 that the bank’s Pillar 2 requirement remains unchanged compared to 2021. This results in ECB’s Pillar 2 requirement to 2.50% of RWA. As of December 31, 2022, Deutsche Bank needs to maintain on a consolidated basis a CET 1 ratio of at least 10.48%, a Tier 1 ratio of at least 12.45% and a Total Capital ratio of at least 15.07%. The CET 1 requirement comprises the Pillar 1 minimum capital requirement of 4.50%, the Pillar 2 requirement (SREP add-on) of 1.41%, the capital conservation buffer of 2.50%, the countercyclical buffer (subject to changes throughout the year) of 0.07% and the higher of our G-SII/O-SII buffer of 2.00%. Correspondingly, the Tier 1 capital requirement includes additionally a Tier 1 minimum capital requirement of 1.50% plus a Pillar 2 requirement of 0.47%, and the Total Capital requirement includes further a Tier 2 minimum capital requirement of 2.00% and a Pillar 2 requirement of 0.63%. Also, the ECB communicated to Deutsche Bank that its individual expectation to hold a further Pillar 2 CET 1 capital add-on, commonly referred to as ‘Pillar 2 guidance’ will be seen as guidance only and until at least year-end 2022, a breach of this guidance will not trigger the need to provide a capital restoration plan or a need to execute measures to re-build CET 1 capital.
On December 22, 2022, Deutsche Bank was informed by the ECB of its decision regarding prudential minimum capital requirements for 2023 that applied from January 1, 2023 onwards, following the results of the 2022 SREP. The decision set ECB’s Pillar 2 requirement to 2.70% of RWA, effective as of January 1, 2023, of which at least 1.52% must be covered by CET 1 capital and 2.03% by Tier 1 capital.
In January 2022, the BaFin announced a countercyclical buffer of 0.75% for Germany effective February 1, 2023, which translates into approximately 30bps CET 1 capital requirement for Deutsche Bank Group given the current share of German credit exposures. Additionally, the BaFin announced a sectoral systemic risk buffer of 2% for German residential real estate exposures effective February 1, 2023, which translates into approximately 20bps CET 1 capital requirement for Deutsche Bank Group considering our current German residential real estate exposure.
99 |
Deutsche Bank | ||
Annual Report 2022 | ||
Internal capital adequacy assessment process
Deutsche Bank’s internal capital adequacy assessment process (ICAAP) consists of several well-established components which ensure that Deutsche Bank maintains sufficient capital to cover the risks to which the bank is exposed on an ongoing basis:
- – Risk identification and assessment: The risk identification process forms the basis of the ICAAP and results in an inventory of risks for the Group; all risks identified are assessed for their materiality; further details can be found in section “Risk identification and assessment”
- – Capital demand/risk measurement: Risk measurement models are applied to quantify the regulatory and economic capital demand which is required to cover all material risks except for those which cannot be adequately limited by capital e.g. liquidity risk; further details can be found in sections “Risk profile” and “Capital, Leverage Ratio, TLAC and MREL”
- – Capital supply: Capital supply quantification refers to the definition of available capital resources to absorb unexpected losses; further details can be found in sections “Capital, Leverage Ratio, TLAC and MREL” and “Economic Capital Adequacy”
- – Risk appetite: Deutsche Bank has established a set of qualitative statements, quantitative metrics and thresholds which express the level of risk that Deutsche Bank is willing to assume to achieve strategic objectives; threshold breaches are subject to a dedicated governance framework triggering management actions aimed to safeguard capital adequacy; further details can be found in sections “Risk appetite and capacity” and “Key risk metrics”
- – Capital planning: The risk appetite thresholds for capital adequacy metrics constitute boundaries which have to be met in the capital plan to safeguard capital adequacy on a forward-looking basis; further details can be found in section “Strategic and capital plan”
- – Stress testing: Capital plan figures are also considered under various stress test scenarios to prove resilience and overall viability of the bank; regulatory and economic capital adequacy metrics are also subject to regular stress tests throughout the year to constantly evaluate Deutsche Bank’s capital position in hypothetical stress scenarios and to detect vulnerabilities under stress; further details can be found in section “Stress testing”
- – Capital adequacy assessment: Although capital adequacy is constantly monitored throughout the year, the ICAAP concludes with a dedicated annual capital adequacy statement (CAS); the assessment consists of a Management Board statement about Deutsche Bank’s capital adequacy, which is linked to specific conclusions and management actions to be taken to safeguard capital adequacy on a forward-looking basis
As part of its ICAAP, Deutsche Bank distinguishes between a normative and economic internal perspective. The normative internal perspective refers to a multi-year assessment of the ability to fulfil all capital-related legal requirements and supervisory demands on an ongoing basis under a baseline and adverse scenario. The economic internal perspective refers to an internal process using internal economic capital demand models and an internal economic capital supply definition. Both perspectives focus on maintaining the continuity of Deutsche Bank on an ongoing basis.
100 |
Deutsche Bank | ||
Annual Report 2022 | ||
Stress testing
Deutsche Bank has implemented a stress test framework to satisfy internal as well as external stress test requirements. The internal stress tests are based on in-house developed methods and inform a variety of risk management use cases (risk type specific as well as cross risk). Internal stress tests form an integral part of Deutsche Bank’s risk management framework complementing traditional risk measures. The cross-risk stress test framework, the Group Wide Stress Test Framework (GWST), serves a variety of bank management processes, in particular the strategic planning process, the ICAAP, the risk appetite framework and capital allocation. Capital plan stress testing is performed to assess the viability of the bank’s capital plan in adverse circumstances and to demonstrate a clear link between risk appetite, business strategy, capital plan and stress testing. The regulatory stress tests, e.g. the EBA stress test and the US-based CCAR (Comprehensive Capital Analysis and Review) stress tests, are strictly following the processes and methodologies as prescribed by the regulatory authorities.
Deutsche Bank’s internal stress tests are performed on a regular basis in order to assess the impact of a severe economic downturn as well as adverse bank-specific events on the bank’s risk profile and financial position. The bank’s stress testing framework comprises regular sensitivity-based and scenario-based approaches addressing different severities and regional hotspots. All material risk types are included in the stress testing activities. These activities are complemented by portfolio- and country-specific downside analysis as well as further regulatory requirements, such as annual reverse stress tests and additional stress tests requested by regulators on group or legal entity level. The applied methodologies undergo regular scrutiny from Deutsche Bank’s internal validation team (Model Risk Management) whether they correctly capture the impact of a given stress scenario.
The initial phase of Deutsche Bank’s cross-risk stress test consists of defining a macroeconomic downturn scenario by ERM Risk Research in cooperation with business specialists through a formal governance forum Scenario Design Council. ERM Risk Research monitors the political and economic development around the world and maintains a macro-economic heat map that identifies potentially harmful scenarios. Based on quantitative models and expert judgments, economic parameters such as foreign exchange rates, interest rates, GDP growth or unemployment rates are set accordingly to reflect the impact on the bank’s business. The scenario parameters are translated into specific risk drivers by subject matter experts in the risk units. Based on the bank’s internal model framework for stress testing, the following major metrics are calculated under stress: risk-weighted assets, impacts on profit and loss and economic capital by risk type. These results are aggregated at the Group level, and key metrics such as the CET 1 ratio, ECA ratio, MREL ratio and Leverage Ratio under stress are derived. Stress impacts on the Liquidity Coverage Ratio (LCR) and the Liquidity Reserve are also considered. The time-horizon of internal stress tests is between one and five years, depending on the use case and scenario assumptions. The Enterprise Risk Committee (ERC) reviews the final stress results. After comparing these results against the bank’s defined risk appetite, the ERC also discusses specific mitigation actions to remediate the stress impact in alignment with the overall strategic and capital plan if certain limits are breached. The results also feed into the recovery planning which is crucial for the recoverability of the bank in times of crisis. The outcome is presented to senior management up to the Management Board to raise awareness on the highest level as it provides key insights into specific business vulnerabilities and contributes to the overall risk profile assessment of the bank.
The group wide stress tests performed in 2022 indicated that the bank’s capitalization together with available mitigation measures as defined in the Group Recovery Plan allow it to reach the internally set stress exit level.
The cross-risk reverse stress test leverages the GWST framework and is typically performed annually in order to challenge Deutsche Bank’s business model by determining scenarios which would cause the bank to become unviable. Such a reverse stress test is based on a hypothetical macroeconomic scenario enriched by idiosyncratic events based on the top risks monitored by each risk type. Comparing the non-viability scenario to the current economic environment, the probability of occurrence of such a hypothetical stress scenario is considered to be extremely low. Given this, it is the bank’s view that its business continuity is not at risk.
Starting end of 2020, Deutsche Bank has further strengthened its framework by increasing the frequency of the Risk Appetite scenario to monthly thereby enabling a more rigorous risk appetite monitoring.
In addition to the GWST that includes all material risk types and major revenue streams, Deutsche Bank has individual stress test programs in place for all relevant risk metrics in line with regulatory requirements. The relevant stress test programs are described in the sections about the individual risk management methods.
101 |
Deutsche Bank | ||
Annual Report 2022 | ||
GWST framework of Deutsche Bank Group

Deutsche Bank also took part in the US-based CCAR stress test, as implemented pursuant to the US Dodd-Frank Act. The Federal Reserve (FRB) publicly disclosed the stress capital depletion for DB USA Corporation and DWS USA Corporation; this showed that each entity remains very well-capitalized even after withstanding a hypothetical severe stress environment.
In 2022, the bank participated in the inaugural ECB Climate risk Stress Test (CST22) aiming to assess European banks’ climate risk stress test capabilities and their vulnerabilities to transition and physical risks under certain assumptions and a range of climate scenarios. The result of CST22 had no direct capital implications but feeds into the annual SREP assessment in a qualitative way.
Risk measurement and reporting systems
Deutsche Bank’s risk measurement systems support regulatory reporting and external disclosures, as well as internal management reporting across credit, market, liquidity, operational, reputational, enterprise and model risks. The risk infrastructure incorporates the relevant legal entities and business divisions and provides the basis for reporting on risk positions, capital adequacy and limit, threshold or target utilization to the relevant functions on a regular and ad-hoc basis. Established units within the CFO and CRO-Function assume responsibility for measurement, analysis and reporting of risk while promoting sufficient quality and integrity of risk-related data. The Group’s risk management systems are reviewed by Group Audit following a risk-based audit approach.
Deutsche Bank’s reporting is an integral part of Deutsche Bank’s risk management approach and as such aligns with the organizational setup by delivering consistent information on Group level and for material legal entities as well as breakdowns by risk types, business division and material business units.
The following principles guide Deutsche Bank’s “risk measurement and reporting” practices:
- – Deutsche Bank monitors risks taken against risk appetite and risk-reward considerations on various levels across the Group, e.g. Group, business divisions, material business units, material legal entities, risk types, material asset classes, portfolio and counterparty levels
- – Risk reporting is required to be accurate, clear, useful and complete and must convey reconciled and validated risk data to communicate information in a concise manner to ensure, across material Financial and Non-Financial Risks, the bank’s risk profile is clearly understood
- – Senior risk committees, such as the Enterprise Risk Committee and the Group Risk Committee, as well as the Management Board who are responsible for risk and capital management receive regular reporting (as well as ad-hoc reporting as required)
- – Dedicated teams within Deutsche Bank proactively manage material Financial and Non-Financial Risks and must ensure that required management information is in place to enable proactive identification and management of risks and avoid undue concentrations within a specific Risk Type and across risks (Cross-Risk view)
102 |
Deutsche Bank | ||
Annual Report 2022 | ||
In applying the previously mentioned principles, Deutsche Bank maintains a common basis for all risk reports and aims to minimize segregated reporting efforts to allow Deutsche Bank to provide consistent information, which only differs by granularity and audience focus.
The Bank identifies a large number of metrics within its risk measurement systems which support regulatory reporting and external disclosures, as well as internal management reporting across risks and for material risk types. Deutsche Bank designates a subset of those as “Key Risk Metrics” that represent the most critical ones for which the Bank places an appetite, limit, threshold or target at Group level and / or are reported routinely to senior management for discussion or decision making. The identified Key Risk Metrics include Capital Adequacy and Liquidity metrics; further details can be found in the section “Key risk metrics”.
While a large number of reports are used across the Bank, Deutsche Bank designates a subset of these as “Key Risk Reports” that are critical to support Deutsche Bank’s Risk Management Framework through the provision of risk information to senior management and therefore enable the relevant governing bodies to monitor, steer and control the Bank’s risk taking activities effectively. To ensure that Key Risk Reports meet recipients’ requirements, report producing functions regularly check whether the Key Risk Reports are clear and useful.
The main reports on risk and capital management that are used to provide Deutsche Bank’s central governance bodies with information relating to the Group risk profile are the following:
- – The monthly Risk and Capital Profile report is a Cross-Risk report, provides a comprehensive view of Deutsche Bank’s risk profile and is used to inform the ERC, the Group Risk Committee as well as the Management Board and subsequently the Risk Committee of the Supervisory Board; the Risk and Capital Profile includes Risk Type specific and Business-Aligned overviews and Enterprise-wide risk topics; it also includes updates on Key Group Risk Appetite Metrics and other Key Portfolio Risk Type Control Metrics as well as updates on Key Risk Developments, highlighting areas of particular interest with updates on corresponding risk management strategies
- – The Weekly Risk Report is a weekly briefing covering high-level topical issues across key risk areas and is submitted every Friday to the Members of the Enterprise Risk Committee, the Group Risk Committee and the Management Board and subsequently to the Members of the Risk Committee of the Supervisory Board; the Weekly Risk Report is characterized by the ad-hoc nature of its commentary as well as coverage of themes and focuses on more volatile risk metrics
- – Deutsche Bank runs several Group-wide macroeconomic stress tests. A monthly Risk Appetite scenario serves the purpose to set and regularly monitor the bank’s stress loss appetite; in addition, there are topical scenarios which are reported to and discussed in the Enterprise Risk Committee and escalated to the Group Risk Committee if deemed necessary; the stressed key performance indicators are benchmarked against the Group Risk Appetite thresholds
While the above reports are used at a Group level to monitor and review the risk profile of Deutsche Bank holistically, there are other, supplementing standard and ad-hoc management reports, including for Risk Types or Focus Portfolios, which are used to monitor and control the risk profile.
Recovery and resolution planning
In the EU, the Single Resolution Mechanism Regulation (SRM Regulation) and the Bank Recovery and Resolution Directive (BRRD) aim at reducing the likelihood of another financial crisis, enhance the resilience of institutions under stress, and eventually support the long-term stability of the financial systems without exposing taxpayers’ money to losses.
In line with the provisions of the SRM Regulation and the BRRD (which were mainly implemented in Germany by the German Recovery and Resolution Act (Sanierungs- und Abwicklungsgesetz – SAG)), Deutsche Bank maintains a recovery and resolution planning framework designed to identify and manage the impact of adverse events in a timely and coordinated manner.
The bank drafts and maintains a Group recovery plan which is approved by the Management Board. The latest submission in 2022 includes, inter alia:
- – Updated overall recovery capacity which has been assessed against four severe stress scenarios and is deemed sufficient to withstand severe capital and liquidity stress
- – All Recovery metrics levels have been aligned to the new Group risk appetite and new early warning metrics have been added
103 |
Deutsche Bank | ||
Annual Report 2022 | ||
The Group resolution plan on the other hand is prepared by the resolution authorities, rather than by the bank itself. Deutsche Bank works closely with the Single Resolution Board and the Bundesanstalt für Finanzdienstleistungsaufsicht (BaFin) who establish the Group resolution plan for Deutsche Bank, which is currently based on a single point of entry bail-in as the preferred resolution strategy. Under the single point of entry bail-in strategy, the parent entity Deutsche Bank AG would be recapitalized through a write-down and/or conversion to equity of capital instruments (Common Equity Tier 1, Additional Tier 1, Tier 2) and other eligible liabilities in order to stabilize the Group. Within one month after the application of the bail-in tool to recapitalize an institution, the BRRD (as implemented in the SAG) requires such institution to prepare a business reorganization plan, addressing the causes of failure and aiming to restore the institution's long-term viability. To further support and improve operational continuity of the bank for resolution planning purposes, DB has largely completed additional preparations, such as adding termination stay clauses into client financial agreements governed by non-EU law and including continuity provisions into key service agreements. Financial contracts and service agreements governed by EU law are already covered by statutory laws which prevent termination solely due to any resolution measure.
The BRRD requires banks in EU member states to maintain minimum requirements for own funds and eligible liabilities to make resolution credible by establishing sufficient loss absorption and recapitalization capacity. Apart from MREL-requirements, Deutsche Bank, as a global systemically important bank, is subject to global minimum standards for Total Loss-Absorbing Capacity, which set out strict requirements for the amount and eligibility of instruments to be maintained for bail-in purposes. In particular, TLAC instruments must be subordinated (including so-called senior non-preferred debt, but also in the form of regulatory capital instruments) to other senior liabilities. This ensures that a bail-in would be applied first to equity and TLAC instruments, which must be exhausted before a bail-in may affect other senior (preferred) liabilities such as senior preferred plain vanilla bonds, debt instruments that are structured, deposits and derivatives.
In the United States, Deutsche Bank AG is required under Title I of the Dodd-Frank Wall Street Reform and Consumer Protection Act of 2010 (the Dodd-Frank Act), as amended, to prepare and submit to the Federal Reserve Board and the Federal Deposit Insurance Corporation (FDIC) either a full or targeted resolution plan (the U.S. Resolution Plan) on a timeline prescribed by such agencies. The U.S. Resolution Plan must demonstrate that the Deutsche Bank AG has the ability to execute and implement a strategy for the orderly resolution of its designated U.S. material entities and operations. For foreign-based companies subject to these resolution planning requirements such as Deutsche Bank AG, the U.S. Resolution Plan relates only to subsidiaries, branches, agencies and businesses that are domiciled in or whose activities are carried out in whole or in material part in the United States. Deutsche Bank’s U.S. Resolution Plan describes the single point of entry strategy for Deutsche Bank’s U.S. material entities and operations and prescribes that DB USA Corporation, one of the bank’s intermediate holding companies, would provide liquidity and capital support to its U.S. material entity subsidiaries and ensure their solvent wind-down outside of applicable resolution proceedings.
By December 17, 2021, Deutsche Bank filed its first ‘targeted’ 2021 U.S. Resolution Plan, which described the core elements of Deutsche Bank’s U.S. resolution strategy — such as capital, liquidity, and recapitalization strategies — as well as how Deutsche Bank has integrated lessons learned from its response to the COVID-19 pandemic into its resolution planning process. On December 16, 2022, the Federal Reserve Board and the FDIC announced the results of their review of Deutsche Bank’s 2021 U.S. Resolution Plan, as well as those of other banks, and did not find any shortcomings or deficiencies in Deutsche Bank’s plan. In their feedback letter to Deutsche Bank, the agencies noted areas where further progress will help improve resolvability, which Deutsche Bank must address in its next full resolution plan submission, which is due on July 1, 2024.
104 |
Deutsche Bank | ||
Annual Report 2022 | ||
Risk and Capital Management
Capital management
Deutsche Bank’s Treasury function manages solvency, capital adequacy, leverage, and bail-in capacity ratios at Group level and locally in each region, as applicable. Treasury implements Deutsche Bank’s capital strategy, which itself is developed by the Group Risk Committee and approved by the Management Board. Treasury, directly or through the Group Asset and Liability Committee, manages, among other things, issuance and repurchase of shares and capital instruments, hedging of capital ratios against foreign exchange swings, setting capacities for key financial resources, the design of shareholders’ equity allocation, and regional capital planning. The bank is fully committed to maintaining Deutsche Bank’s sound capitalization both from an economic and regulatory perspective considering both book equity based on IFRS accounting standards, regulatory and economic capital as well as specific capital requirements from rating agencies. The bank continuously monitors and adjusts Deutsche Bank’s overall capital demand and supply to always achieve an appropriate balance.
Treasury manages the issuance and repurchase of capital instruments, namely Common Equity Tier 1, Additional Tier 1 and Tier 2 capital instruments as well as TLAC/MREL eligible debt instruments. Treasury constantly monitors the market for liability management trades. Such trades represent a countercyclical opportunity to create Common Equity Tier 1 capital by buying back Deutsche Bank’s issuances below par.
Treasury manages the sensitivity of Deutsche Bank’s CET 1 ratio and capital towards swings in foreign currency exchange rates against the euro. For this purpose, Treasury develops and executes suitable hedging strategies within the constraints of a Management Board approved Risk Appetite. Capital invested into Deutsche Bank’s foreign subsidiaries and branches is either not hedged, partially hedged or fully hedged. Thereby, Treasury aims to balance effects from foreign exchange rate movements on capital, capital deduction items and risk weighted assets in foreign currency. In addition, Treasury also accounts for associated hedge cost and implications on market risk weighted assets.
Resource limit setting
Usage of key financial resources is influenced through the following governance processes and incentives.
Target resource capacities are reviewed in Deutsche Bank’s annual strategic plan in line with Deutsche Bank’s CET 1 and Leverage Ratio ambitions. As a part of Deutsche Bank’s quarterly process, the Group Asset and Liability Committee approves divisional resource limits for total capital demand (defined as the sum of RWA and certain RWA equivalents of Capital Deduction Items) and leverage exposure that are based on the strategic plan but adjusted for market conditions and the short-term outlook. Limits are enforced through a close monitoring process and an excess charging mechanism.
Overall regulatory capital requirements are principally driven by either Deutsche Bank’s CET 1 ratio (solvency) or leverage ratio (leverage) requirements, whichever is the more binding constraint. For the internal capital allocation, the combined contribution of each segment to the Group’s Common Equity Tier 1 ratio, the Group’s Leverage ratio and the Group’s Capital Loss under Stress are weighted to reflect their relative importance and level of constraint to the Group. Contributions to the Common Equity Tier 1 ratio and the Leverage ratio are measured through RWA and Leverage Ratio Exposure (LRE). The Group’s Capital Loss under Stress is a measure of the Group’s overall economic risk exposure under a defined stress scenario. Goodwill, other intangible assets, and business-related regulatory capital deduction items included in total capital demand are directly allocated to the respective segments, supporting the calculation of the allocated tangible shareholders equity and the respective rate of return.
Most of Deutsche Bank’s subsidiaries and several of Deutsche Bank’s branches are subject to legal and regulatory capital requirements. In developing, implementing, and testing Deutsche Bank’s capital and liquidity position, the bank fully takes such legal and regulatory requirements into account. Any material capital requests of Deutsche Bank’s branches and subsidiaries across the globe are presented to and approved by the Group Investment Committee prior to execution.
Further, Treasury is a member of Deutsche Bank’s Pensions Committee and represented in relevant Investment Committees overseeing the management of the assets of the largest Deutsche Bank pension funds in Germany. These investment committees set the investment strategy for these funds in line with the bank’s investment objective to protect the capital base and distribution capacity of the bank.
105 |
Deutsche Bank | ||
Annual Report 2022 | ||
Risk identification and assessment
Risks to Deutsche Bank’s businesses and infrastructure functions, including under stressed conditions, are regularly identified. This assessment incorporates input from both 1st LoD and 2nd LoD, with the identified risks assessed for materiality based on their severity and likelihood of materialization. The assessment of risks is complemented by a view on emerging risks applying a forward-looking perspective. This risk identification and assessment process results in the risk inventory which captures the material risks for the Group, and where relevant, across businesses, entities and branches.
Regular updates to the risk inventory are reported to senior management for review and challenge, and subsequently inform key risk management processes. These include the development of stress scenarios tailored to Deutsche Bank’s risk profile, and informing risk appetite setting and monitoring. Risks in the inventory are also mapped to risks in the risk type taxonomy.
Credit Risk Management and Asset Quality
Credit risk framework
Credit risk arises from all transactions where actual, contingent or potential claims against any counterparty, borrower, obligor or issuer (which Deutsche Bank refers to collectively as “counterparties”) exist, including those claims that Deutsche Bank plans to distribute; these transactions are typically part of the bank’s non-trading lending activities (such as loans and contingent liabilities) as well as the bank's direct trading activity with clients (such as OTC derivatives); these also include traded bonds and debt securities; carrying values of equity investments are also disclosed in the bank’s Credit Risk section. Deutsche Bank manages the respective positions within the bank’s market risk and credit risk frameworks.
Based on the Risk Type Taxonomy, credit risk is grouped into four material categories, namely default / migration risk, transaction / settlement risk (exposure risk), mitigation risk and credit concentration risk. This is complemented by a regular risk identification and materiality assessment.
- – Default / migration risk as the main element of credit risk, is the risk that a counterparty defaults on its payment obligations or experiences material credit quality deterioration increasing the likelihood of a default
- – Transaction / settlement risk (exposure risk) is the risk that arises from any existing, contingent or potential future positive exposure
- – Mitigation risk is the risk of higher losses due to risk mitigation measures not performing as anticipated
- – Credit concentration risk is the risk of an adverse development in a specific single counterparty, country, industry or product leading to a disproportionate deterioration in the risk profile of Deutsche Bank’s credit exposures to that counterparty, country, industry or product
Deutsche Bank manages its credit risk using the following philosophy and principles:
106 |
Deutsche Bank | ||
Annual Report 2022 | ||
- – Credit Risk Management (CRM) forms part of the 2nd LoD within DB Group’s three Lines of Defense model. Business as primary risk taker and owner forms the 1st LoD and Group Audit the 3rd LoD
- – Compliance is reporting to a different Management Board Member and hence the credit risk function is independent from the compliance function up to Management Board level
- – In each of the bank’s divisions, credit decision standards, processes and principles are consistently applied
- – A key principle of credit risk management is client credit due diligence; Deutsche Bank’s client selection is achieved in collaboration with the bank’s business division counterparts who stand as a first line of defense
- – Deutsche Bank aims to prevent undue concentration and tail-risks (large, unexpected losses) by maintaining a diversified credit portfolio;. client, industry, country and product-specific concentrations are assessed and managed against the bank’s risk appetite
- – Deutsche Bank maintains underwriting standards aiming to avoid large undue credit risk on a counterparty and portfolio level; in this regard Deutsche Bank extends also unsecured cash positions and actively use hedging for risk mitigation purposes; additionally, Deutsche Bank strives to secure its derivative portfolio through collateral agreements and may additionally hedge concentration risks to further mitigate credit risks from underlying market movements
- – Every new credit facility and every extension (such as exposure limit increase) to any counterparty requires credit approval at the appropriate authority level in line with the minimum required credit authority calculation within an established credit authority grid. Deutsche Bank assigns credit approval authorities to individuals according to their qualifications and experience, and Deutsche Bank reviews these periodically
- – Deutsche Bank manages all its credit exposures to each obligor across the bank’s consolidated Group on the basis of the “one obligor principle” (as required under Article 4(1)(39) CRR and related regulatory guidance), under which all facilities to a group of borrowers which are linked to each other (for example by one entity holding a majority of the voting rights or capital of another) are consolidated under one group
- – Deutsche Bank has established within Credit Risk Management – where appropriate – specialized teams for deriving internal client ratings, analyzing and approving transactions, monitoring the specific portfolios or covering workout clients; for transaction approval purposes, structured credit risk management teams are aligned to the respective lending business areas to ascertain adequate product expertise.
- – Where required, Deutsche Bank has established processes to manage credit exposures at a legal entity level
- – To meet the requirements of Article 190 CRR, DB Group has allocated the various control requirements for the credit processes to 2nd LoD units that are best suited to perform such controls
Measuring Credit Risk
Credit risk is measured by credit rating, regulatory and internal capital demand and key components mentioned below.
The credit rating is an essential part of the bank’s underwriting and credit process and provides – amongst others – a cornerstone for risk appetite determination on a counterparty and portfolio level, credit decision and transaction pricing as well the determination of regulatory capital demand for credit risk. Each counterparty must be rated and each rating has to be reviewed at least annually. Ongoing monitoring of counterparties helps to keep ratings up-to-date. A credit rating is a prerequisite for any credit limit established/ approved. For each credit rating the appropriate rating approach has to be applied and the derived credit rating has to be established in the relevant systems. Different rating approaches have been established to best reflect the specific characteristics of exposure classes, including specific product types, central governments and central banks, institutions, corporates and retail.
Counterparties in the bank’s non-homogenous portfolios are rated by Deutsche Bank’s independent Credit Risk Management function. Country risk related ratings are provided by ERM Risk Research.
Deutsche Bank’s rating analysis is based on a combination of qualitative and quantitative factors. When rating a counterparty Deutsche Bank applies in-house assessment methodologies, scorecards and the bank’s 21-grade rating scale for evaluating the creditworthiness of the bank’s counterparties.
Changes to existing credit models and introduction of new models are approved by the Regulatory Credit Risk Model Committee (RCRMC) chaired by the Head of Credit Risk Management before the models are used for credit decisions and capital calculation for the first time or before they are significantly changed. Separately, for all material model changes and for new models an approval by Model Risk Management is required. Proposals with high impact are recommended for approval to the Group Risk Committee. Furthermore regulatory approval may also be required. The model validation is performed independently of model development by Model Risk Management. The results of the regular validation processes as stipulated by internal policies are brought to the attention of the RCRMC, even if the validation results do not lead to a change.
Deutsche Bank measures risk-weighted assets to determine the regulatory capital demand for credit risk using “advanced”, “foundation” and “standard” approaches of which “advanced” and “foundation” are approved by the bank’s regulator.
The advanced Internal Ratings Based Approach (IRBA) is the most sophisticated approach available under the regulatory framework for credit risk and allows Deutsche Bank to make use of the bank’s internal credit rating methodologies as well as internal estimates of specific further risk parameters. These methods and parameters represent long-used key components of the internal risk measurement and management process supporting the credit approval process, the economic capital and expected loss calculation and the internal monitoring and reporting of credit risk. The relevant parameters include the probability of default (PD), the loss given default (LGD) and the maturity (M) driving the regulatory risk-weight and the credit conversion factor (CCF) as part of the regulatory exposure at default (EAD) estimation. For the majority of derivative counterparty exposures as well as securities financing transactions (SFT), Deutsche Bank makes use of the internal model method (IMM) in accordance with CRR and SolvV to calculate EAD. For most of the bank’s internal rating systems more than seven years of historical information is available to assess these parameters. Deutsche Bank’s internal rating methodologies aim at point-in-time rather than a through-the-cycle rating, but in line with regulatory solvency requirements, they are calibrated based on long-term averages of observed default rates.
The foundation IRBA is an approach available under the regulatory framework for credit risk allowing institutions to make use of their internal rating methodologies while using pre-defined regulatory values for all other risk parameters. Parameters subject to internal estimates include the PD while the LGD and the CCF are defined in the regulatory framework. Foundation IRBA remains in place for some exposures stemming from ex-Postbank.
107 |
Deutsche Bank | ||
Annual Report 2022 | ||
Deutsche Bank applies the standardized approach to a subset of its credit risk exposures. The standardized approach measures credit risk either pursuant to fixed risk weights, which are predefined by the regulator, or through the application of external ratings. Deutsche Bank assigns certain credit exposures permanently to the standardized approach in accordance with Article 150 CRR. These are predominantly exposures to the Federal Republic of Germany and other German public sector entities as well as exposures to central governments of other European Member States that meet the required conditions. These exposures make up the majority of the exposures carried in the standardized approach and receive predominantly a risk weight of zero percent. For internal purposes, however, these exposures are subject to an internal credit assessment and fully integrated in the risk management and economic capital processes.
In addition to the above-described regulatory capital demand, Deutsche Bank determines the internal capital demand for credit risk via an economic capital model.
Deutsche Bank calculates economic capital for the default risk, country risk and settlement risk as elements of credit risk. In line with the bank’s economic capital framework, economic capital for credit risk is set at a level to absorb with a probability of 99.9% very severe aggregate unexpected losses within one year. Deutsche Bank’s economic capital for credit risk is derived from the loss distribution of a portfolio via Monte Carlo Simulation of correlated rating migrations. The loss distribution is modeled in two steps. First, individual credit exposures are specified based on parameters for the probability of default, exposure at default and loss given default. In a second step, the probability of joint defaults is modeled through the introduction of economic factors, which correspond to geographic regions and industries. The simulation of portfolio losses is then performed by an internally developed model, which takes rating migration and maturity effects into account. Effects due to wrong-way derivatives risk (i.e., the credit exposure of a derivative in the default case is higher than in non-default scenarios) are modeled by applying the bank’s own alpha factor when deriving the exposure at default for derivatives and securities financing transactions under the CRR. Deutsche Bank allocates expected losses and economic capital derived from loss distributions down to transaction level to enable management on transaction, customer and business level.
Besides the credit rating, which is a key component Deutsche Bank applies for managing the bank’s credit portfolio, including transaction approval and the setting of risk appetite, Deutsche Bank establishes credit limits for all credit exposures. Credit limits set forth maximum credit exposures Deutsche Bank is willing to assume over specified periods. In determining the credit limit for a counterparty, Deutsche Bank considers the counterparty’s credit quality by reference to its internal credit rating. Credit limits and credit exposures are both measured on a gross and net basis where net is derived by deducting hedges and certain collateral from respective gross figures. For derivatives, Deutsche Bank looks at current market values and the potential future exposure over the relevant time horizon which is based upon the bank’s legal agreements with the counterparty. Deutsche Bank also takes into consideration the risk-return characteristics of individual transactions and portfolios. Risk-return metrics explain the development of client revenues as well as capital consumption.
IFRS 9 Impairment
In the following chapter, the Group provides an overview of the IFRS 9 impairment framework and how it is embedded into Deutsche Bank‘s credit risk management activities. The first section provides a description of the Group‘s IFRS 9 model and methodology, along with the key model assumptions. In light of the current macroeconomic environment, the disclosure continues by highlighting key areas of focus in 2022 and how Deutsche Bank assessed the latest developments in its ECL calculation, and in particular, how the model properly took into account the impacts of the uncertainties noted in 2022 and at year end, along with the impact from reasonable changes in the Group’s key assumptions. These credit risk management activities are embedded in the bank’s overall control and governance framework for credit risk and governance over its ECL model. These activities include, but are not limited to, regular emerging risk reviews as well as portfolio deep dives, day to day risk management on the level of individual borrowers, as well as regular model validations. In the section Management overlays applied to the IFRS 9 model, the Group presents how it performed reviews of relevant assumptions and inputs to the ECL calculation, including the above key assumptions, and how as part of the model reviews, it assessed potential model imprecision and whether any corrective measures in the form of overlays was necessary. The Group also presents an overview and background on each of the management overlays recorded throughout 2022 and at year end. To provide additional transparency on the impact of reasonable changes to the key assumptions, the Group presents model sensitivities in a separate section, and concludes with the key drivers for the IFRS 9 model results.
108 |
Deutsche Bank | ||
Annual Report 2022 | ||
Description of IFRS 9 Model and Methodology
The impairment requirements of IFRS 9 apply to all credit exposures that are measured at amortized cost or fair value through other comprehensive income and to off balance sheet lending commitments, such as loan commitments and financial guarantees. For purposes of the bank’s impairment approach, the Group refers to these instruments as financial assets.
The Group determines its allowance for credit losses in accordance with IFRS 9 as follows:
- – Stage 1 reflects financial assets where it is assumed that credit risk has not increased significantly after initial recognition
- – Stage 2 contains all financial assets, that are not defaulted, but have experienced a significant increase in credit risk since initial recognition
- – Stage 3 consists of financial assets which deemed to be in default in accordance with Deutsche Bank’s policies, which are based on the Capital Requirements Regulation (CRR) Article 178. The Group defines these financial assets as impaired, non-performing and defaulted
- – Significant increase in credit risk is determined using quantitative and qualitative information based on the Group’s historical experience, credit risk assessment and forward-looking information
- – Purchased or Originated Credit-Impaired (POCI) financial assets are assets where at the time of initial recognition there is objective evidence of impairment
The IFRS 9 impairment approach is an integral part of the Group’s credit risk management procedures. The estimation of expected credit losses (ECLs) is either performed via the automated, parameter based ECL calculation using the Group’s ECL model or determined by credit officers. In both cases, the calculation takes place for each financial asset individually. Similarly, the determination of the need to transfer between stages is made on an individual asset basis. The Group’s ECL model is used to calculate the allowance for credit losses for all financial assets in Stage 1 and Stage 2, as well as for Stage 3 in the homogeneous portfolio (i.e. retail and small business loans with similar credit risk characteristics). For financial assets in the bank’s non-homogeneous portfolio in Stage 3 and for POCI assets, the allowance for credit losses is determined individually by credit officers.
The Group uses three main components to measure ECL. These are Probability of Default (PD), Loss Given Default (LGD) and Exposure at Default (EAD). The Group leverages existing parameters used for determination of capital demand under the Basel Internal Ratings Based Approach (IRBA) and internal risk management practices as much as possible to calculate ECL. These parameters are adjusted where necessary to comply with IFRS 9 requirements (e.g. use of point in time ratings and removal of downturn add-ons in the regulatory parameters). Incorporating forecasts of future economic variables into the measurement of ECL influences the allowance for credit losses in Stage 1 and 2. In order to calculate lifetime ECL, the Group’s calculation derives the corresponding lifetime PDs from migration matrices that reflect economic forecasts.
Stage Determination and Significant Increase in Credit Risk
At initial recognition, financial assets are reflected in Stage 1, unless the financial assets are POCI. If there is a significant increase in credit risk, the financial asset is transferred to Stage 2. A significant increase in credit risk is determined by using rating-related and process-related indicators. The assignment of financial assets to Stage 3 is based on the status of the borrower being in default. If a borrower is in default, then all financial assets of the borrower are transferred to Stage 3.
Rating-related Stage 2 indicators: The Group compares a borrower’s lifetime PD at the reporting date with lifetime PD expectations at the date of initial recognition to determine if there has been a significant change in the borrower’s PDs and consequently to any of the borrower’s transaction in the scope of IFRS 9 impairment. Based on historically observed migration behavior and a sampling of different economic scenarios, a lifetime PD distribution is obtained. A quantile of this distribution, which is defined for each counterparty class, is chosen as the lifetime PD threshold. If the remaining lifetime PD of a transaction according to current expectations exceeds this threshold, the financial asset has incurred a significant increase in credit risk and is transferred to Stage 2. The quantiles used to define Stage 2 thresholds are determined using expert judgment, are validated annually and have not changed since implementation of IFRS 9. The thresholds applied vary depending on the original credit quality of the borrower, elapsed lifetime, remaining lifetime and counterparty class. Management believes that the defined approach and quantiles represent a meaningful indicator that a financial asset has incurred a significant increase in credit risk.
Process-related Stage 2 indicators are derived via the use of existing risk management indicators, which in the bank’s view represent situations where the credit risk of financial assets has significantly increased. These include borrowers being added to a credit watchlist, being transferred to workout status, payments being 30 days or more past due or being in forbearance. As long as the conditions for one or more of the process-related or rating-related indicators is fulfilled and the borrower of the financial asset has not met the definition of default, the asset will remain in Stage 2. If the Stage 2 indicators are no longer fulfilled and the financial asset has not defaulted, the financial asset transfers back to Stage 1. In case of performing forborne financial assets, the probation period is 2 years before the financial asset is reclassified to Stage 1, which is aligned with regulatory guidance.
109 |
Deutsche Bank | ||
Annual Report 2022 | ||
If the borrower defaults, all transactions of the borrower are allocated to Stage 3. If at a later date the borrower is no longer in default, the curing criteria according to regulatory guidance is applied (including probation periods), which are at least 3 months or 1 year in case of distressed restructurings. Once the regulatory cure period or criteria has been met, the borrower will cease to be classified as defaulted and will be transferred back to Stage 2 or Stage 1.
The ECL calculation for Stage 3 distinguishes between transactions in homogeneous and non-homogenous portfolios, and POCI financial assets. For transactions that are in Stage 3 and in a homogeneous portfolio, the Group uses a parameter based automated approach to determine the credit loss allowance per transaction. For these transactions, the LGD parameters are partially modelled to be time dependent, i.e. consider the declining recovery expectation as time elapses after default. The allowance for credit losses for financial assets in the bank’s non-homogeneous portfolios in Stage 3, as well as for POCI assets are determined by credit officers and have to be approved along an established authority grid up to and including the Management Board. This allows credit officers to consider currently available information and recovery expectations specific to the borrowers and the financial assets at the reporting date.
Estimation Techniques for Key Input Factors
The first key input factor in the Group ECL calculation is the one-year PD for borrowers which is derived from the bank’s internal rating systems. The Group assigns a PD to each borrower credit exposure based on a 21-grade master rating scale for all of the Group’s exposure.
The borrower ratings assigned are derived based on internally developed rating models which specify consistent and distinct customer-relevant criteria and assign a rating grade based on a specific set of criteria as given for a certain customer. The set of criteria is generated from information sets relevant for the respective customer segments including general customer behavior, financial and external data (e.g. credit bureau). The methods in use range from statistical scoring models to expert-based models taking into account the relevant available quantitative and qualitative information. Expert-based models are usually applied for borrowers in the exposure classes “Central governments and central banks”, “Institutions” and “Corporates” with the exception of those “Corporates” for which a sufficient data basis is available for statistical scoring models. For the latter as well as for the retail segment statistical scoring or hybrid models combining both approaches are commonly used. Quantitative rating methodologies are developed based on applicable statistical modelling techniques, such as logistic regression.
One-year PDs are extended to multi-year PD curves using through-the-cycle matrices and macroeconomic forecasts. Based on economic scenarios centered around the macroeconomic baseline forecast, through-the-cycle matrices are first transformed into point-in-time rating migration matrices, typically for a two-year period. The calculation of the point-in-time matrices leverages a link between macroeconomic variables and the default and rating behavior of borrowers, which is derived from historical macroeconomic variables (MEVs) and rating time series through regression techniques. In a final step, multi-year PD curves are derived from point-in-time rating migration matrices for periods where reasonable and supportable forecasts are available and extrapolated based on through-the-cycle rating migration matrices beyond those periods.
The second key input into the ECL calculation is the LGD parameter, which is defined as the likely loss intensity in case of a borrower’s default. It provides an estimation of the exposure that cannot be recovered in a default event and therefore captures the severity of a loss. Conceptually, LGD estimates are independent of a borrower’s probability of default. The LGD models applied in stages 1 and 2, which are based on regulatory LGD models, but adjusted for IFRS 9 requirements (i.e. removal of downturn-add-on and removal of indirect costs of workout), ensure that the main drivers for losses (i.e. different levels and quality of collateralization and customer or product types or seniority of facility) are reflected as risk drivers in LGD estimates. In the bank’s LGD models, the Group assigns collateral type specific LGD parameters to the collateralized exposure (collateral value after application of haircuts). The LGD setting for defaulted homogeneous portfolios are partially dependent on time after default and are either calibrated based on the Group’s multi-decade loss and recovery experience using statistical methods or for less significant portfolios certain LGD model input parameters (e.g. cure rates) are determined by expert judgement.
The third key input is the exposure at default over the lifetime of a financial asset which is modelled taking into account expected repayment profiles (e.g. linear amortization, annuities, bullet loan structures). Prepayment options are not modelled for all portfolios as they are not deemed material. The bank applies specific credit conversion factors (CCFs) in order to calculate an EAD value. Conceptually, the EAD is defined as the expected amount of the credit exposure to a borrower at the time of its default. In instances where a transaction involves an unused limit, a percentage share of this unused limit is added to the outstanding amount in order to appropriately reflect the expected outstanding amount in case of a borrower’s default. This reflects the assumption that for commitments, the utilization at the time of default might be higher than the current outstanding balance. In case a transaction involves an additional contingent component (i.e., guarantees) a further percentage share is applied as part of the CCF model in order to estimate the amount of guarantees drawn in case of default. The calibrations of such parameters are based on internal historical data and are either based on empirical analysis or supported by expert judgement and consider borrower and product type specifics. Where supervisory CCF values need to be applied for regulatory purposes, internal estimates are used for IFRS 9.
110 |
Deutsche Bank | ||
Annual Report 2022 | ||
Expected Lifetime
IFRS 9 requires the determination of lifetime ECL for which the expected lifetime of a financial asset is a key input factor. Lifetime ECL represent default events over the expected life of a financial asset. The Group measures ECL considering the risk of default over the maximum contractual period (including any borrower’s extension options) over which the Group is exposed to credit risk.
Retail overdrafts, credit card facilities and certain corporate revolving facilities typically include both a loan and an undrawn commitment component. The expected lifetime of such on-demand facilities exceeds their contractual life as they are typically cancelled only when the Group becomes aware of an increase in credit risk. The expected lifetime is estimated by taking into consideration historical information and the Group’s credit risk management actions such as credit limit reductions and facility cancellation. Where such facilities are subject to an individual review by credit risk management, the lifetime for calculating ECL is 12 months. For facilities not subject to individual review by credit risk management, the bank applies a lifetime for calculating ECL of 24 months.
Interest Rate used in the IFRS 9 model
In the context of the ECL calculation, the Group applies in line with IFRS 9 an approximation of the effective interest rate (EIR), which is usually the contractual interest rate. The contractual interest rate is deemed to be an appropriate approximation, as the interest rate is consistently used in the ECL model, interest recognition and for discounting of the ECL and does not materially differ from the EIR.
Consideration of Collateralization in IFRS 9 Expected Credit Loss Calculation
The ECL model projects the level of collateralization for each point in time in the life of a financial asset. At the reporting date, the model uses the existing collateral distribution process applied in Deutsche Bank’s economic capital model. In this model, the liquidation value of each eligible collateral is allocated to relevant financial assets to distinguish between collateralized and uncollateralized parts of each financial asset. In the ECL calculation, the Group subsequently applies the aforementioned LGDs for secured and unsecured exposures to derive the ECL for the secured and unsecured part of the exposure separately.
For personal collateral (e.g. guarantees), the ECL model assumes that the relative level of collateralization remains stable over time. In the case of an amortizing loan, the outstanding exposure and collateral values decrease together over time. For physical collateral (e.g. real estate property), the ECL shall assume that the absolute collateral value remains constant. In case of an amortizing loan, the collateralized part of the exposure increases over time and the loan-to-value decreases accordingly.
Certain financial guarantee contracts are integral to the financial assets guaranteed. In such cases, the financial guarantee is considered as collateral for the financial asset and the benefit of the guarantee is used to mitigate the ECL of the guaranteed financial asset.
Forward Looking Information
Under IFRS 9, the allowance for credit losses is based on reasonable and supportable forward-looking information available without undue cost or effort, which takes into consideration past events, current conditions and forecasts of future economic conditions.
To incorporate forward looking information into the Group’s allowance for credit losses, the bank uses two key elements:
- – As its base scenario, the Group uses external survey-based macroeconomic forecasts (e.g. consensus views on GDP and unemployment rates). In addition, the scenario expansion model, which has been initially developed for stress testing, is used for forecasting macroeconomic variables that are not covered by external consensus data. All forecasts are assumed to reflect the most likely development of the respective variables. The Group regularly updates its forecasts for macro-economic factors during the quarter and reviews aspects of potential model imprecision (e.g., MEV parameters outside the historic range used for model calibration, if not already included in the model) as part of an MEV monitoring framework to assess if an overlay is required.
- – Statistical techniques are then applied to transform the base scenario projections into a probability distribution of the macroeconomic variables. These scenarios specify deviations from the baseline forecasts. The scenario distribution is then used for deriving multi-year PD curves for different rating and counterparty classes, which are applied in the ECL calculation and in the identification of significant deterioration in credit quality of financial assets as described above in the rating-related Stage 2 indicators
The Group's Risk and Finance Credit Loss Provision Forum monitors the impact of forward-looking information, including the latest macroeconomic variables, on a monthly basis and determines if any additional overlays are required. Although interest rates and inflation are not separately included in the MEVs, the economic impact of these risks is reflected in GDP growth rates, unemployment, equities and credit spreads as higher rates and inflation filter through these forecasts. As of December 31, 2022, the consensus data applied in the ECL model was deemed to have reflected the latest macroeconomic developments and uncertainties in the MEVs and no additional overlays were required.
111 |
Deutsche Bank | ||
Annual Report 2022 | ||
As described earlier, the Group’s approach to reflect macroeconomic variables in the calculation of ECLs is to incorporate forecasts for the next two years, using eight discrete quarterly observations. After the period of eight quarters, the Group constructs forecasts based on macro-economic variables and its historic trends.
The tables below contain the macroeconomic variables included in the application of forward-looking information in the IFRS 9 model as of December 31, 2022 and as of December 31, 2021.
Forward-looking information applied
December 31, 2022¹ ² | |||||
Year 1 | Year 2 | ||||
Commodity - Gold | 1,745.84 | 1,797.74 | |||
Commodity - WTI | 90.19 | 88.79 | |||
Credit - CDX Emerging Markets | 260.99 | 239.03 | |||
Credit - CDX High Yield | 489.77 | 476.53 | |||
Credit - CDX IG | 85.33 | 84.94 | |||
Credit - High Yield Index | 4.46 | 4.31 | |||
Credit - ITX Europe 125 | 101.26 | 96.50 | |||
Equity - MSCI Asia | 1,178 | 1,176 | |||
Equity - Nikkei | 28,427 | 29,287 | |||
Equity - S&P500 | 3,933 | 4,011 | |||
GDP - Developing Asia | 3.95% | 4.60% | |||
GDP - Emerging Markets | 3.31% | 3.94% | |||
GDP - Eurozone | 0.87% | 0.53% | |||
GDP - Germany | (0.26)% | 1.00% | |||
GDP - Italy | 0.32% | 0.68% | |||
GDP - USA | 0.62% | 0.61% | |||
Real Estate Prices - US CRE Index | 352.41 | 343.97 | |||
Unemployment - Eurozone | 7.03% | 7.15% | |||
Unemployment - Germany | 3.22% | 3.33% | |||
Unemployment - Italy | 8.24% | 8.53% | |||
Unemployment - Japan | 2.56% | 2.42% | |||
Unemployment - Spain | 13.06% | 12.98% | |||
Unemployment - USA | 4.05% | 4.75% | |||
1MEV as of December 12, 2022 which barely changed until December 30, 2022
2Year 1 equals fourth quarter of 2022 to third quarter of 2023, Year 2 equals fourth quarter of 2023 to third quarter of 2024.
| December 31. 2021¹ ² | ||||
Year 1 | Year 2 | ||||
Commodity - Gold | 1,764.58 | 1,696.51 | |||
Commodity - WTI | 73.19 | 68.21 | |||
Credit - CDX Emerging Markets | 231.80 | 268.64 | |||
Credit - CDX High Yield | 353.42 | 399.62 | |||
Credit - CDX IG | 59.53 | 63.98 | |||
Credit - High Yield Index | 3.95 | 4.46 | |||
Credit - ITX Europe 125 | 61.37 | 69.93 | |||
Equity - MSCI Asia | 1,543 | 1,514 | |||
Equity - Nikkei | 29,673 | 30,764 | |||
Equity - S&P500 | 4,777 | 5,033 | |||
GDP - Developing Asia | 3.78% | 6.26% | |||
GDP - Emerging Markets | 3.72% | 5.38% | |||
GDP - Eurozone | 4.67% | 2.91% | |||
GDP - Germany | 3.35% | 2.86% | |||
GDP - Italy | 5.17% | 2.33% | |||
GDP - USA | 4.46% | 2.79% | |||
Real Estate Prices - US CRE Index | 348.86 | 377.26 | |||
Unemployment - Eurozone | 7.41% | 7.07% | |||
Unemployment - Germany | 3.13% | 2.83% | |||
Unemployment - Italy | 9.18% | 8.92% | |||
Unemployment - Japan | 2.73% | 2.53% | |||
Unemployment - Spain | 14.26% | 13.66% | |||
Unemployment - USA | 4.05% | 3.68% | |||
1MEV as of 31 December 2021; MEV outside the calibrated range were adjusted either in the model or via a management overlay as discussed further below.
2Year 1 equals fourth quarter of 2021 to third quarter of 2022, Year 2 equals fourth quarter of 2022 to third quarter of 2023.
112 |
Deutsche Bank | ||
Annual Report 2022 | ||
Focus areas in 2022
Deutsche Bank’s macroeconomic environment in 2022 was influenced by geopolitical uncertainty and a substantial increase in energy prices, supply chain disruptions, rising interest rates, inflation, and a deteriorating economic outlook for major economies. However, by the end of fourth quarter 2022, the economic outlook had stabilized as a mild winter reduced energy concerns in Europe, energy prices receded, and expectations that inflation may have peaked in Europe and the U.S. were observed. While the outlook remains challenging, risk of a severe further deterioration has eased significantly.
To ensure that Deutsche Bank’s ECL model was taking into account all the uncertainties in the macroeconomic environment throughout 2022, the Group reviewed emerging risks to assess its potential downside and to manage the bank’s credit strategy and risk appetite. Overall, the actions taken as a result of these reviews ensured the bank was adequately provisioned for its expected credit losses as of December 31, 2022.
Areas of focus in 2022 included several deep dives into first and second order risks resulting from the war in Ukraine. This included comprehensive analysis of the bank’s exposure in Russia and Ukraine, along with the impact of increasing energy prices and inflation on wider portfolios. In the first and second quarter of 2022, most exposures to Russian clients were moved to the watchlist and transferred to Stage 2. The Group’s net loan exposure to Ukraine is immaterial (€ 64 million as of December 31, 2022 and € 42 million as of December 31, 2021).
Risks related to the increase in energy prices were managed by closely monitoring industries and geographies sensitive to energy prices (e.g. utilities), along with enhanced engagement with clients in the most vulnerable sectors via surveys and detailed discussions to assess their respective risk profile and the overall impact in such sectors. As a result of these actions, the Group was able to identify if any of these vulnerable exposures experienced a significant increase in credit risk in a timely and pro-active manner. As a result, some client relationships were moved onto the watchlist and into Stage 2.
Overall, Deutsche Bank has a conservative risk profile based on a diversified loan book across geographic regions, businesses and sectors. Deutsche Bank’s loan book in Germany amounts to € 235 billion as of December 31, 2022 and the bank’s confidence in the portfolio’s quality is driven by conservative lending standards and well-diversified exposures. Around 75% of the German loan book is within the Private Bank and nearly 90% thereof relates to low-risk German retail mortgages. In the German mortgage market, clients typically lock in fixed rates for 10 or more years, which is reflected in the bank’s long-term, fixed rate mortgage portfolio with a loan-to-value of 66% based on current market values. The bank also benefits from structural elements as e.g., a low maturity profile in 2023 reduces refinancing pressure in Leveraged Lending.
The Group’s German corporate loan book is € 63 billion as of December 31, 2022, consisting mainly of trade finance and commercial lending and is diversified across a large number of clients (i.e. the top 15 names account for only 6% of the portfolio). Credit quality in the German corporate portfolio is high with 71% of loans rated investment grade and with only 2% of loan exposures in Stage 3 as of December 31, 2022. The Group believes the ECL model has adequately provisioned for the German retail and corporate loan portfolios as the IFRS 9 model has captured rating downgrades, significant increases in credit risk, e.g. by moving borrowers to the watchlist (Stage 2) when the criteria was met or identified those counterparties meeting the definition of default.
The Group also performed reviews in the Corporate Bank and Investment Bank focusing on vulnerable portfolios and/or counterparties determined as potentially vulnerable to rising interest rates due to higher debt levels and/or low interest coverage ratios. The reviews have been designed to build-in an additional layer of portfolio/counterparty reviews supporting the strong credit governance and processes. In particular, credit officers assessed the potential need for additional structural enhancements or collateralization and whether additional counterparties needed to be added to the credit watchlist based on the above mentioned concerns. These exercises included among others, but not exclusively, Commercial Real Estate (CRE) and the Leveraged Lending portfolios. Deutsche Bank’s in focus CRE portfolio amounts to € 33 billion or 7% of the bank’s total loan book and comprises non-recourse lending within the core CRE business units in the Investment Bank and Corporate Bank. The bank’s CRE lending activities are mainly first lien mortgage-secured and structured with moderate loan-to-values. 51% of CRE exposures are in the US, 36% in Europe and 13% in Asia and loan originations are primarily focused on assets in liquid regional locations such as top-tier gateway cities. The portfolio is diversified by property type, with the largest concentration of 34% in office space, while hospitality and retail account for only 12% and 11%, respectively. Weighted average LTV is around 61% in the Investment Bank and 53% in the Corporate Bank.
The Group’s Leveraged Lending Leveraged Debt Capital Market exposure in the Investment Bank’s Origination & Advisory portfolio is € 4 billion, representing just 1% of the bank’s total loan book, is well diversified across industry sectors without any undue concentration risks with the top 10 names accounting for 11% of the portfolio on a gross notional basis. Around 79% of the exposure is in the form of first lien secured credit facilities, mostly of revolving nature and the remaining 2 1% is asset based lending, which is almost entirely US based and has a negligible loss history. Where relevant, CRE and Leverage Lending clients were transferred to Stage 2 (e.g. watchlist criteria met) or Stage 3 if in default situation, in line with our well established credit processes.
113 |
Deutsche Bank | ||
Annual Report 2022 | ||
The Group’s loan book exposure to China as of December 31, 2022 was € 6.1 billion or 1% of the total loan book of which only 7% and 3% are in Stage 2 and Stage 3, respectively. The Group reviewed the exposures in China on a more regular basis due to the elevated geopolitical risks and resulted in a further tightening of the Bank’s risk appetite to Chinese clients in the most vulnerable sectors and enhanced monitoring where deemed necessary.
Results from the above reviews have been discussed in relevant governance forums such as the Enterprise Risk Committee and the Credit Risk Appetite and Management Forum and relevant actions and measures were taken to mitigate the risks and ensure appropriate ECLs were provisioned. For example, where necessary clients‘ ratings were updated to reflect the latest macroeconomic developments, clients were moved to the watchlist (Stage 2), forbearance measures have been negotiated, credit limits were reduced and where possible collateralization was increased. Overall, the Group believes based on its day-to-day risk management activities and the deep dives described above it has adequately provided for its ECL provision as of December 31, 2022. However, the section below further considers whether any additional overlays were required as of year end 2022.
Management overlays applied to the IFRS 9 model output
The Group regularly reviews key inputs into the ECL calculation and discusses potential model imprecision to assess the need for corrective measures in the form of overlays. Due to the challenging geopolitical environment in 2022, the Group also considered if there were any uncertainties in the macroeconomic environment not included in the model. In the following section, the Group provides details on its management overlays recorded as of December 31, 2021 and its developments to December 31, 2022.
Development of overlays from December 31, 2021 to December 31, 2022
in € m. (unless stated otherwise) | Overlays as of December 31, 2021 | New Overlays | Discontinued overlays | Overlays as of December 31, 2022 | ||||||
Overlay description | Impact on | |||||||||
Construction Risk following increased prices for building materials | Mortgage portfolios in the Private Bank in Stage 1 and 2 | 15 | 0 | (15) | 0 | |||||
Model calibration (MEV outside calibrated range of the FLI model) | Financial assets in Stage 1 and 2 | 56 | 0 | (56) | 0 | |||||
Recalibrations required due to the new Definition of Default | Financial assets primarily in the Private Bank in Stage 3 | (57) | (35) | 0 | (92) | |||||
Uncertainty related to Russia/Ukraine¹ | All financial assets in Stage 1 and 2 | 0 | 127 | (127) | 0 | |||||
Model calibration (WTI oil price Index disabled for one portfolio) | Financial assets in Stage 1 and 2 in the Investment Bank | 0 | 39 | (39) | 0 | |||||
Total | 14 | 131 | (237) | (92) | ||||||
1The overlay recorded with regards to the uncertainty related to Russia/Ukraine in the first quarter of 2022 in the amount of € 44 million was released in the second quarter 2022; the overlay recorded with regards to the uncertainty related to Russia/Ukraine in the second quarter of 2022 in the amount of € 83 million was released in the third quarter 2022
The Group applied the following overlays to the IFRS 9 model output as of December 31, 2021 until the end of December 31, 2022.
Construction Risk following increased prices for building materials
In 2021, the Group record a € 15 million overlay to address the risk of budget overruns due to unavailable or significantly more expensive building materials. The overlay was released in first quarter 2022 as the risk no longer existed and construction risk was factored into the lending criteria.
Model calibration (MEV outside the calibrated range)
The Group applied a management overlay to address the model uncertainty associated with extreme year on year MEV projections throughout the COVID-19 pandemic, in particular GDPs, which were identified as being outside the calibrated range of the FLI model. Since the model was not calibrated based on such extreme MEV movements, the Group was concerned that the model underestimated expected credit losses in such situations. As of December 31, 2021, the overlay was € 56 million and as the MEVs moved into the calibrated range in the first half of 2022, the overlay was fully released. The releases resulted in a decrease of the Group’s allowance for credit losses.
114 |
Deutsche Bank | ||
Annual Report 2022 | ||
Recalibrations required due to the new definition of default
In 2021, the Group implemented the new definition of default which is the trigger for Stage 3. The implementation of the new definition of default mainly affected the Private Bank, where the Stage 3 population in homogeneous portfolios increased. As the change in definition does not materially impact the total loss expectation of these portfolios, this change resulted in an overstatement of Stage 3 provisions as the related LGD parameters were not updated in the model. The next LGD recalibration has been rescheduled to the second half of 2023 as additional empirical data is needed for the statistical recalibration. The overlay will remain until the recalibration is completed. The estimate of the recalibration effect has been refined in the first quarter 2022 and was increased to € 92 million and remains the same as of December 31, 2022. The € 92 million overlay results in a decrease in the Group’s allowance for credit losses but is offset by the overstatement of Stage 3 provisions calculated in the ECL model.
Uncertainty related to Russia/Ukraine
In the first quarter 2022, the Group introduced a management overlay amounting to € 44 million which was specific to the overall uncertainty associated with the economic outlook from the war in Ukraine and was released in second quarter 2022 once the uncertainty was included in the MEVs. However, towards the end of June 2022 the macro-economic outlook weakened further. The main reason was the growing concerns over the gas supply from Russia to Europe (Germany in particular) and market expectation of significantly more aggressive monetary tightening in the U.S. and other markets to combat persistent inflation. Both developments accelerated in late June and due to timing was not reflected in the consensus forecast. As a result, the bank recorded an overlay to increase the allowance for credit losses by € 83 million and was released in third quarter 2022 once reflected in the MEV forecasts.
During the third quarter of 2022, the Group carefully monitored the suspension of Russian gas to Germany via the Nord Stream 1 pipeline in early September and the attacks on Nord Stream 1 and Nord Stream 2 pipelines in late September. As uncertainty related to gas supplies was included in the consensus data as of September 30, 2022, no overlay was recorded in the third quarter.
As mentioned in the Forward-Looking Information section above, no overlays were deemed necessary as of December 31, 2022 for uncertainties related to the war in Ukraine, geopolitical events, rising interest rates or inflation as these uncertainties were reflected in the MEVs.
Model calibration (WTI oil price Index)
The Group introduced a management overlay to address model implications related to the incorporation of forward-looking information for oil prices in the ECL calculation. In the past, increases in oil prices were typically demand driven and reflective of a positive economic environment, which is why the IFRS 9 model was designed to release ECL provisions in this scenario. The increase in oil prices in first quarter 2022 was driven by supply risks and impacts from the war in Ukraine. Although higher oil prices have a positive effect on industries such as oil and gas producers, higher oil prices driven by supply issues have a negative impact on other industries and portfolios. Therefore a € 42 million overlay was recorded as of March 31, 2022 to reverse the release of provisions certain industries based on the increase in the WTI Oil price Index. The overlay was reduced to € 39 million for the period ended June 30, 2022, to € 27 million for the period ended September 30, 2022.and was fully released at the end of 2022. The overlay increased the Group’s allowance for credit losses.
Overall assessment
In assessing whether the Group requires any additional overlays, it regularly reviews for evolving or emerging risks, especially in the current geopolitical environment. Similar to the measures included above in the Focus areas in 2022, these measures include client surveys and interviews, along with analysis of portfolios across businesses, regions and sectors. In addition, the Group regularly reviews and validates key model inputs and assumptions (including those in feeder models) and ensures where expert judgement is applied, it is in line with the Group’s risk management framework. As of December 31, 2022, the Group did not identify any additional downside risks not reflected in the IFRS 9 ECL model and did not identify any model weaknesses that would require an additional overlay other than the existing overlay related to the new definition of default.
Model Sensitivity
The Group has identified three key model assumptions included in the IFRS 9 model. These include forward looking macroeconomic variables, the quantitative criteria for determining if a borrower has incurred a significant increase in credit risk and transferred to Stage 2, and the LGD setting on homogenous portfolios in Stage 3. Below the bank provides sensitivity analysis on the potential impact if these key assumptions applied in the ECL model were to deviate from the bank’s base case expectations.
115 |
Deutsche Bank | ||
Annual Report 2022 | ||
Macroeconomic Variables
The sensitivity of the ECL model with respect to potential changes in projections for key MEVs is shown in the tables below, which provides ECL impacts for Stages 1 and 2 from one sigma downward and upward shifts applied separately to each group of MEV as of December 31, 2022 and December 31, 2021. A sigma shift is a standard deviation used in statistics and probability calculations and is a measure of the dispersion of the values of a random variable. Each of these groups consists of MEVs from the same category:
- – GDP growth rates: includes USA, Eurozone, Germany, Italy, Developing Asia, Emerging Markets
- – Unemployment rates: includes USA, Eurozone, Germany, Italy, Japan, Spain
- – Equities: S&P500, Nikkei, MSCI Asia
- – Credit spreads: ITX Europe 125, High Yield Index, CDX IG, CDX High Yield, CDX Emerging Markets
- – Real Estate: Commercial Real Estate Price Index
- – Commodities: WTI oil price, Gold price
Although interest rates and inflation are not separately included in the MEVs above, the economic impact of these risks is adequately reflected in other macroeconomic variables, such as GDP growth rates, unemployment, equities and credit spreads as higher rates and inflation would filter through these forecasts and be included in the ECL model and sensitivity analysis below.
In addition, the sensitivity analysis only includes the impact of the aggregated MEV group (i.e. potential correlation between different MEV groups or the impact of management overlays is not taken into consideration). ECLs for Stage 3 are not affected and not reflected in the following tables as its calculation is independent of the macroeconomic scenarios.
Sensitivity impact is significantly higher as of December 31, 2022 compared to December 31, 2021, due to the overall higher level of ECL on which basis the sensitivity analysis was performed, taking into account the continued economic uncertainty from the effects of the war in Ukraine, geopolitical environment, rising interest rates and inflation as of December 31, 2022.
IFRS 9 – Sensitivities of Forward-Looking Information applied on Stage 1 and Stage 2 – Group Level
December 31, 2022 | ||||||||
Upward sensitivity | Downward sensitivity | |||||||
Upward shift | ECL impact | Downward shift | ECL impact | |||||
GDP growth rates | 1pp | (83.3) | (1)pp | 101.4 | ||||
Unemployment rates | (0.5)pp | (40.8) | 0.5pp | 58.0 | ||||
Real estate prices | 5% | (5.6) | (5)% | 6.0 | ||||
Equities | 10% | (15.8) | (10)% | 19.6 | ||||
Credit spreads | (40)% | (37.9) | 40% | 42.6 | ||||
Commodities¹ | 10% | (14.8) | (10)% | 15.6 | ||||
1Here the sign of the shift applies to oil prices changes. Gold price changes have the opposite sign. 1pp (percentage point), e.g. GDP shifts from 3% to 4% // 1% (percentage change), e.g. Real estate price shifts from 100 to 101.
December 31, 2021 | ||||||||
Upward sensitivity | Downward sensitivity | |||||||
Upward shift | ECL impact | Downward shift | ECL impact | |||||
GDP growth rates | 1pp | (49.4) | (1)pp | 55.5 | ||||
Unemployment rates | (0.5)pp | (23.8) | 0.5pp | 25.4 | ||||
Real estate prices | 5% | (3.9) | (5)% | 4.2 | ||||
Equities | 10% | (7.2) | (10)% | 9.4 | ||||
Credit spreads | (40)% | (20.9) | 40% | 23.5 | ||||
Commodities | 10% | (15.0) | (10)% | 16.2 | ||||
In the second and third quarter of 2022, the Group conducted a variety of scenarios to assess the downside impact should the cessation of Russia gas supplies to Europe lead to a sharper than expected economic slowdown and the emergence of more widespread defaults across European corporate and household exposures. Based on such factors, the Group estimated that such an event would potentially result in an additional allowance for credit losses of up to approximately 20 basis points over an 18-month period. As of yearend 2022, the Group acknowledged that the aforementioned scenario did not materialize and is no longer deemed plausible. Germany’s gas storage was sufficiently filled to supply businesses and households over the winter, energy prices significantly declined, and alternate energy sources were identified.
The Group considered whether there were any other specific downside scenarios it should consider in its sensitivity analysis, but as the uncertainty related to interest rates and inflation is already included in the MEVs and the bank did not observe any specific vulnerable credit risk concentrations in its portfolios, the Group believes the one standard sigma shift provides the best information on the model’s ECL sensitivity.
116 |
Deutsche Bank | ||
Annual Report 2022 | ||
At the divisional level, the sensitivity analysis below was performed for the year ended December 31, 2022 and 2021, respectively, and revealed GDP growth rates, credit spreads and commodities prices to be the dominant factors for the Investment Bank, whereas the model sensitivity for the Corporate Bank and Private Bank is mainly associated with changes in GDP growth rates and unemployment rates. The model sensitivity table for the Private Bank shows GDP growth rates and unemployment rates only, as the key MEVs relevant to the underlying portfolios.
IFRS 9 – Sensitivities of Forward-Looking Information applied on Stage 1 and Stage 2 - Corporate Bank
December 31, 2022 | |||||||||
Upward sensitivity | Downward sensitivity | ||||||||
Upward shift | ECL impact | Downward shift | ECL impact | ||||||
GDP growth rates | 1pp | (21.7) | (1)pp | 24.6 | |||||
Unemployment rates | (0.5)pp | (12.2) | 0.5pp | 14.0 | |||||
Real estate prices | 5% | (1.1) | (5)% | 1.1 | |||||
Credit spreads | (40)% | (7.5) | 40% | 9.1 | |||||
Commodities¹ | 10% | (4.3) | (10)% | 4.6 | |||||
¹Here the sign of the shift applies to oil prices changes. Gold price changes have the opposite sign.
| December 31, 2021 | |||||||
Upward sensitivity | Downward sensitivity | |||||||
Upward shift | ECL impact | Downward shift | ECL impact | |||||
GDP growth rates | 1pp | (12.5) | (1)pp | 13.7 | ||||
Unemployment rates | (0.5)pp | (8.9) | 0.5pp | 9.6 | ||||
Real estate prices | 5% | (0.5) | (5)% | 0.5 | ||||
Credit spreads | (40)% | (4.3) | 40% | 4.9 | ||||
Commodities | 10% | (4.5) | (10)% | 5.0 | ||||
IFRS 9 – Sensitivities of Forward-Looking Information applied on Stage 1 and Stage 2 - Investment Bank
December 31, 2022 | ||||||||
Upward sensitivity | Downward sensitivity | |||||||
Upward shift | ECL impact | Downward shift | ECL impact | |||||
GDP growth rates | 1pp | (35.3) | (1)pp | 36.9 | ||||
Unemployment rates | (0.5)pp | (5.3) | 0.5pp | 6.1 | ||||
Real estate prices | 5% | (4.5) | (5)% | 4.8 | ||||
Equities | 10% | (5.8) | (10)% | 7.3 | ||||
Credit spreads | (40)% | (26.3) | 40% | 28.5 | ||||
Commodities¹ | 10% | (9.8) | (10)% | 10.3 | ||||
¹Here the sign of the shift applies to oil prices changes. Gold price changes have the opposite sign.
| December 31, 2021 | |||||||
Upward sensitivity | Downward sensitivity | |||||||
Upward shift | ECL impact | Downward shift | ECL impact | |||||
GDP growth rates | 1pp | (24.5) | (1)pp | 27.7 | ||||
Unemployment rates | (0.5)pp | (3.7) | 0.5pp | 4.2 | ||||
Real estate prices | 5% | (3.4) | (5)% | 3.6 | ||||
Equities | 10% | (2.4) | (10)% | 3.1 | ||||
Credit spreads | (40)% | (14.4) | 40% | 15.8 | ||||
Commodities | 10% | (10.1) | (10)% | 10.8 | ||||
IFRS 9 – Sensitivities of Forward-Looking Information applied on Stage 1 and Stage 2 - Private Bank
December 31, 2022 | ||||||||
Upward sensitivity | Downward sensitivity | |||||||
Upward shift | ECL impact | Downward shift | ECL impact | |||||
GDP growth rates | 1pp | (21.8) | (1)pp | 34.5 | ||||
Unemployment rates | (0.5)pp | (20.7) | 0.5pp | 34.9 | ||||
| December 31, 2021 | |||||||
Upward sensitivity | Downward sensitivity | |||||||
Upward shift | ECL impact | Downward shift | ECL impact | |||||
GDP growth rates | 1pp | (10.0) | (1)pp | 10.7 | ||||
Unemployment rates | (0.5)pp | (9.7) | 0.5pp | 9.8 | ||||
117 |
Deutsche Bank | ||
Annual Report 2022 | ||
Impact of Lifetime Expected Credit Losses for Stage 1 borrowers
As described earlier, the Group uses a mixture of quantitative and qualitative criteria to determine significant increase in credit risk which require, for affected borrowers, a move to lifetime ECL (Stage 2). If for all Stage 1 borrowers Deutsche Bank were to record lifetime expected credit losses, the Group’s allowance for credit losses amounting to € 5.6 billion as of December 31, 2022 and € 5.4 billion as of December 31, 2021 would increase by approximately 44% as of yearend 2022 and as of yearend 2021.
Stage 3 LGD setting
The Group’s allowance for credit losses in Stage 3 for the homogeneous portfolios amounts to € 1.9 billion as of December 31, 2022 and € 2.2 billion as of December 31, 2021. The key driver in determining the ECL provision is the loss given default estimate, which differs by individual portfolios. Loss given default is influenced by recovery rates, proceeds from the sale of collateral, and cure rates. Some of the drivers for different portfolios include elements of expert judgment and in particular on expected cure rates. If the LGD for all homogeneous portfolios were to increase by 1%, then Stage 3 ECL would increase as of December 31, 2022 by approximately € 19 million (thereof € 11 million in Germany, € 5 million in Italy and € 2 million in Spain), and by approximately € 22 million as of December 31, 2021 (thereof € 11 million in Germany, € 7 million in Italy and € 2 million in Spain).
IFRS 9 Model results
In 2022, provision for credit losses was € 1.2 billion which is significantly higher than the € 515 million recorded for the year ended 2021. The increase is reflecting a deterioration of the macroeconomic environment following the war in Ukraine and increased number of impairment events compared to an overall more benign environment in 2021. The total provisions in 2022 includes € 114 million related to clients in Russia and Ukraine compared to € 10 million in 2021.
In 2022, € 204 million provision for credit losses were related to Stage 1 and 2 and € 1.0 billion to Stage 3, this compares to € 218 million release of Stage 1 and 2 provisions and an € 734 million in stage 3 in 2021. The increase of Stage 1 and 2 provisions was primarily driven by the deterioration of macroeconomic parameters, the increase of Stage 3 provisions was affecting all regions and sectors.
In regards to the Business Divisions, the Corporate Bank recorded an increase of provisions for credit losses of € 335 million in 2022 versus a € 3 million release in 2021. The year-over-year increase was primarily driven by Stage 1 and 2 provisions following a deteriorated macro-economic outlook, an increased number of impairments compared to a very benign development of provisions in the prior year. The Investment Bank recorded an increase of provisions for credit losses of € 319 million in 2022 versus € 104 million in 2021. The increase was mainly driven by an increased number of new impairments, whilst the prior year benefitted from a low number of impairment events which were further mitigated by larger Stage 3 releases. The Private Bank recorded an increase of provisions for credit losses of € 583 million in 2022 versus € 446 million reported in 2021. The increase was mainly driven by Stage 1 and 2 provisions following a deteriorated macro-economic outlook whilst previous year’s period was benefitting from an overall benign macroeconomic environment.
The amounts recognized in the allowance for credit losses in relation to climate-related risks are deemed to be immaterial at the end of December 31, 2021 and as of December 31, 2022.
For details on the Group’s accounting policy related to IFRS 9 Impairment, please refer to Note 1 - Significant Accounting Policies and Critical Accounting Estimates of the Consolidated Financial Statements.
118 |
Deutsche Bank | ||
Annual Report 2022 | ||
Exposure to Russia
One of management’s key focus areas in 2022 was the identification, assessment and management of direct and indirect impacts of the war in Ukraine. Since 2014, the Group has significantly reduced its footprint in Russia due to the heightened risk of sanctions and potential countermeasures. The bank has continued to reduce its risk positions through 2022 as a result of active exposure management, client repayments and roll-offs from guarantees.
As of December 31, 2022, the Group’s loan exposure to Russia amounted to € 806 million on a gross basis (€ 1,397 million as of December 31, 2021), which represents approximately 0.2% of the total loan book (0.3% as of December 31, 2021). On a net basis, after risk mitigants such as Export Credit Agency insurance and Private Risk Insurance, the loan exposure amounted to € 379 million (€ 594 million as of December 31, 2021). Additional undrawn commitments amounted to € 78 million (€ 961 million as of December 31, 2021) and are subject to contractual drawdown protection and parental guarantees for multinational corporates (“MNCs”). The majority of loan exposure relates to large Russian companies with material operations and cash-flow outside of Russia. Such existing loans may be provided onshore by DB Moscow, or offshore by other Group entities outside of Russia. Wealth Management has granted offshore loans to counterparties with a Russian nexus, collateralized in line with the Group’s policies. In line with the overall group strategy, exposures to Russian nexus clients have been reduced significantly during the course of 2022.
As of December 31, 2022, the Group had € 76 million contingent exposure to Russia via written financial and trade guarantees (€ 541 million as of December 31, 2021). Residual derivative exposures to Russia are small as all major positions have been unwound with the Group being a net payer on a mark-to-market basis.
The bank’s overall net loan exposure to Ukraine is € 64 million as of December 31, 2022 (€ 42 million as of December 31, 2021.
Some of the aforementioned factors have resulted in immediate portfolio impacts in 2022, including negative rating migration on Russian names, resulting in higher credit risk weighted assets, as well as moderate increases in provisions for credit losses and higher impacts from prudential valuation. More broadly, in instances where there is a concern that counterparty credit quality has deteriorated or appears likely to deteriorate, the respective exposure has been placed on the “watchlist” and included in Stage 2. The objective of this early warning system is to address potential problems while adequate options for action are still available. As of December 31, 2022, beyond Russian names which have been added to the watchlist, the Group has not observed any material structural credit deterioration across other portfolios or industries related to Russia.
The following table provides an overview of total Russian exposures, including overnight deposits with the Central Bank of Russia in the amount of € 0.8 billion as of December 31, 2022 (€ 0.5 billion as of December 31, 2021) and other receivables, which are subject to IFRS 9 impairment, and correspondent allowance for credit losses by stages as of December 31, 2022 and December 31, 2021.
Breakdown of total exposure and allowance for credit losses by stages
Dec 31, 2022 | Dec 31, 2021 | ||||||||||||
in € m. | Total Exposure | Allowance for Credit Losses1 | Total collateral and guarantees | Total Exposure | Allowance for Credit Losses1 | Total collateral and guarantees | |||||||
Stage 1 | 209 | 0 | 59 | 3,198 | 1 | 648 | |||||||
Stage 2 | 1,182 | 10 | 375 | 332 | 2 | 263 | |||||||
Stage 3 | 336 | 68 | 152 | 3 | 0 | 2 | |||||||
Total | 1,726 | 79 | 586 | 3,534 | 3 | 913 | |||||||
1Allowance for credit losses do not include allowance for country risk amounting to € 11 million as of December 31, 2022 and € 0 million as of December 31, 2021
Total exposure of € 1.7 billion consists of above mentioned € 0.8 billion loan exposure to Russia, € 78 million of undrawn commitments and € 0.8 billion of unsecured overnight deposits in Rubles with the Central Bank of Russia (which continues to be reflected in Stage 2 as of December 31, 2022); the residual unsecured exposure, excluding the unsecured overnight deposits in Rubles with the Central Bank of Russia, is mainly driven by undrawn commitments which are subject to ECA coverage and contractual drawdown protection.
119 |
Deutsche Bank | ||
Annual Report 2022 | ||
Market Risk
The Group has managed its market risk to Russia by performing regular risk assessments of its risk profile. To mitigate a broader contagion risk, action was taken in second quarter of 2022 to reduce direct exposure prior to and immediately after events unfolded. This was achieved by entering into additional hedges and selective de-risking. The Group continues to closely monitor the situation by performing further contagion stress testing on different scenarios. On September 12, 2022 Russia CDS auction was completed and the recovery rate was set at 56% with the settlement process completed on September 23, 2022. As of December 31, 2022, Deutsche Bank continues to maintain overall low levels of direct market risk exposure to Russia.
Russian operations
The Group has an operating subsidiary in Russia, OOO "Deutsche Bank" (DB Moscow), which provides corporate banking services to local subsidiaries of international companies. As of December 31, 2022, the Group’s total capital position in Russia was € 0.3 billion (€ 0.2 billion as of December 31, 2021) and ~ 40% of this capital was hedged against FX risk (~ 80% as of December 31, 2021). Total assets of DB Moscow amounted to € 1.1 billion (€ 1.5 billion as of December 31, 2021), of which approximately € 0.8 billion (Russian Ruble equivalent, € 0.5 billion as of December 31, 2021) was deposited with the Central Bank of Russia. Local operations are fully self-funded with no cross-border Group funding required.
The Group also operates a technology service centre in Russia, OOO Deutsche Bank TechCentre (DBTC), which is one of several technology centers around the world. DBTC is focused on delivering “change-the-bank” activities for the Investment Bank and the Corporate Bank. The Group continues to de-risk its operations in DBTC by reassigning tasks to other technology centers around the world. The Group have stress-tested the ability of the bank’s other technology centers around the world, including in Asia, to cover the Russian service center’s development capabilities. There is no data or code maintained in the Russian Tech-Centre.
In 2022, the Group established its next Technology Centre in Berlin, Germany. The center will primarily support the ambitions of the Investment Bank and the Corporate Bank through application development and the integration of new technologies. While the Group will continue to grow the Berlin Technology Centre with local hires, there have also been transfers of resources from its Tech Centre in Russia to Berlin as it consolidates the hub for Artificial Intelligence and Machine Learning expertise, which represents a key opportunity for the Group to create significant value for its clients and further enhance the efficient running of its operations.
The Group has accrued for the committed relocation costs of certain resources from DBTC.
Compliance and Anti Financial Crime risks
The Group continues to rapidly adapt to the sanctions landscape that has and continues to evolve after the invasion of Ukraine. After the implementation of sanctions, the Bank has reacted with several actions including but not limited to prompt updates of the Bank’s relevant lists for Name List Screening and Transaction Filtering, the formulation and dissemination of guidance to the businesses, engagement with governmental bodies on interpretive issues and the seeking of special licenses to allow for orderly wind-downs of open positions. The AFC function, and specifically its Sanctions & Embargoes department, plays a crucial role in the current situation given the rapidly changing regulatory environment and provides, where needed, up-to-date guidance to the businesses.
120 |
Deutsche Bank | ||
Annual Report 2022 | ||
IFRS 9 - Application of EBA guidance regarding Default, Forbearance and IFRS 9 in light of COVID-19 measures
EBA’s “Statement on the application of the prudential framework regarding Default, Forbearance and IFRS 9 in light of COVID‑19 measures” published on March 25, 2020 states that institutions are expected to use a degree of judgement and distinguish between borrowers whose credit standing would not be significantly affected by the current situation in the long term, and those who would be unlikely to restore their creditworthiness. The Bank performed portfolio reviews and applied this regulatory guidance to a number of clients mainly in the Investment Bank and Corporate Bank.
EBA is further of the view that the public and private moratoria, as a response to COVID-19 pandemic, do not have to be automatically classified as forbearance if the moratoria are not borrower specific, based on the applicable national law or on an industry or sector-wide private initiative agreed and applied broadly by relevant credit institutions. Deutsche Bank has introduced this guidance into its internal risk management processes.
Legislative and non-legislative moratoria and public guarantee schemes in light of COVID-19 pandemic
In 2020, the European Banking Association (EBA) issued a “Statement on the application of the prudential framework regarding Default, Forbearance and IFRS 9 in light of COVID-19 measures”, along with guidance on legislative and non-legislative moratoria.
The following table provides an overview of expired loans and advances subject to EBA-compliant moratoria, loans and advances subject to COVID-19 related forbearance measures and newly originated loans and advances subject to a public guarantee scheme as of December 31, 2022 and December 31, 2021. There have been no newly originated loans and advances subject COVID-19 related forbearance measures and public guarantee scheme since December 31, 2021.
Breakdown of COVID-19 related measures by stages
Dec 31, 2022 | ||||||||||||
Legislative and non-legislative Moratoria | COVID-19 related forbearance measures | Public guarantee schemes | ||||||||||
in € m. | Gross Carrying Amount | Expected Credit Losses | Gross Carrying Amount | Expected Credit Losses | Gross Carrying Amount | Expected Credit Losses | ||||||
Stage 1 | 4,377 | (6) | 1,835 | (2) | 2,159 | (3) | ||||||
Stage 2 | 1,060 | (22) | 1,027 | (16) | 816 | (9) | ||||||
Stage 3 | 541 | (152) | 337 | (77) | 190 | (37) | ||||||
Total | 5,978 | (180) | 3,199 | (95) | 3,165 | (49) | ||||||
| Dec 31, 2021 | |||||||||||
Legislative and non-legislative Moratoria | COVID-19 related forbearance measures | Public guarantee schemes | ||||||||||
in € m. | Gross Carrying Amount | Expected Credit Losses | Gross Carrying Amount | Expected Credit Losses | Gross Carrying Amount | Expected Credit Losses | ||||||
Stage 1 | 5,381 | (10) | 3,330 | (6) | 3,079 | (2) | ||||||
Stage 2 | 1,288 | (30) | 2,602 | (31) | 770 | (9) | ||||||
Stage 3 | 698 | (162) | 965 | (122) | 103 | (14) | ||||||
Total | 7,368 | (202) | 6,897 | (158) | 3,952 | (25) | ||||||
COVID-19 related forbearance measures: As of December 31, 2022, COVID-19 forbearance measures have been granted to € 3.2 billion outstanding loans and advances. As of December 31, 2022, over 88%of clients are still performing and the Bank continues to remain at a stable ECL level. All forborne loans and advances are required to be classified as forborne until a 24-months’ probation period has been reached.
EBA-compliant moratoria can be divided into legislative moratoria, which are instituted by the Government and non-legislative moratoria granted by a group of financial institutions.
Moratoria were mainly granted in Germany, Italy and Spain and expired by year end 2020 resp. 2021. More than 95% of these clients who took advantage of moratoria have resumed their payments. As of December 31, 2021, less than € 30 million were still active. During 2022, the number of clients and volumes under moratoria have further significantly reduced due to repayments. As of December 31, 2022, nearly all moratoria have expired, those that are still active are € 4.5 million.
121 |
Deutsche Bank | ||
Annual Report 2022 | ||
Newly originated loans and advances subject to a public guarantee scheme: The Group has originated approximately € 3.4 billion of loans under the public guarantee scheme as of December 31, 2022. Approximately € 1.7 billion of loans were granted in Germany via programs sponsored by KfW, of which, € 0.2 billion were derecognized as the terms of the loan and guarantee met the criteria for derecognition under IFRS 9, and € 1.7 billion were originated in Spain. As of December 31, 2022, 94% of the loans that were granted public guarantees continue to make regular repayments.
Asset Quality
The Asset Quality section under IFRS 9 describes the quality of debt instruments subject to impairment, which under IFRS 9 consist of debt instruments measured at amortized cost, financial instruments at fair value through other comprehensive income (FVOCI) as well as off balance sheet lending commitments such as loan commitments and financial guarantees (hereafter collectively referred to as “Financial Assets”).
Overview of financial assets subject to impairment
The following tables provide an overview of the exposure amount and allowance for credit losses by financial asset class broken down into stages as per IFRS 9 requirements.
Overview of financial assets subject to impairment
Dec 31, 2022 | Dec 31, 2021 | |||||||||||||||||||
in € m. | Stage 1 | Stage 2 | Stage 3 | Stage 3 | Total | Stage 1 | Stage 2 | Stage 3 | Stage 3 | Total | ||||||||||
Amortized cost¹ | ||||||||||||||||||||
Gross carrying amount | 721,546 | 45,335 | 11,379 | 1,041 | 779,300 | 710,271 | 40,653 | 11,326 | 1,297 | 763,548 | ||||||||||
Allowance for credit losses² | 533 | 626 | 3,656 | 180 | 4,995 | 440 | 532 | 3,740 | 182 | 4,895 | ||||||||||
of which Loans | ||||||||||||||||||||
Gross carrying amount | 433,081 | 43,711 | 10,686 | 1,027 | 488,504 | 425,342 | 38,809 | 10,653 | 1,272 | 476,077 | ||||||||||
Allowance for credit losses² | 507 | 619 | 3,491 | 174 | 4,790 | 421 | 530 | 3,627 | 177 | 4,754 | ||||||||||
Fair value through OCI | ||||||||||||||||||||
Fair value | 31,123 | 482 | 70 | 0 | 31,675 | 28,609 | 326 | 44 | 0 | 28,979 | ||||||||||
Allowance for credit losses | 14 | 12 | 43 | 0 | 69 | 15 | 10 | 16 | 0 | 41 | ||||||||||
Off-balance sheet | ||||||||||||||||||||
Notional amount | 296,062 | 18,478 | 2,625 | 8 | 317,173 | 276,1574 | 14,498 | 2,582 | 11 | 293,2484 | ||||||||||
Allowance for credit losses³ | 144 | 97 | 310 | 0 | 551 | 108 | 111 | 225 | 0 | 443 | ||||||||||
1 Financial assets at amortized cost consist of: loans at amortized cost, cash and central bank balances, interbank balances (w/o central banks), central bank funds sold and securities purchased under resale agreements, securities borrowed and certain subcategories of other assets.
2 Allowance for credit losses do not include allowance for country risk amounting to € 14 million as of December 31, 2022 and € 4 million as of December 31, 2021.
3 Allowance for credit losses do not include allowance for country risk amounting to € 9 million as of December 31, 2022 and € 6 million as of December 31, 2021.
4 Prior year’s comparatives aligned to presentation in the current year.
Country risk allowance
The Group records country risk allowances for transfer risks, where clients are unable to transfer funds cross border to service an obligation in another jurisdiction due to direct sovereign intervention (e.g. a debt moratorium or capital controls). To quantify the transfer risks the bank uses an expected loss calculation, whereby the PD reflects the country risk rating provided by Risk Research. As of the year end 2022, the Group recorded country risk allowance amounting to € 23 million for on- and off-balance sheet items, which is an increase of € 13 million versus the year end 2021 primarily driven by exposures to clients domiciled in Russia.
Financial assets at amortized cost
The following tables provide an overview of development of financial assets at amortized cost and related allowance for credit losses in each of the relevant reporting periods broken down into stages as per IFRS 9 requirements.
122 |
Deutsche Bank | ||
Annual Report 2022 | ||
Development of exposures in the current reporting period
| Dec 31, 2022 | |||||||||
Gross carrying amount | ||||||||||
in € m. | Stage 1 | Stage 2 | Stage 3 | Stage 3 POCI | Total | |||||
Balance, beginning of year | 710,271 | 40,653 | 11,326 | 1,297 | 763,548 | |||||
Movements in financial assets including new business and credit extensions | 106,702 | 5,554 | 923 | (1) | 113,177 | |||||
Transfers due to changes in creditworthiness | (2,101) | 666 | 1,435 | 0 | ||||||
Changes due to modifications that did not result in | 0 | (0) | (6) | 0 | (6) | |||||
Changes in models | 0 | 0 | 0 | 0 | 0 | |||||
Financial assets that have been derecognized during the period | (103,660) | (2,177) | (2,583) | (258) | (108,679) | |||||
Recovery of written off amounts | 0 | 0 | 68 | 3 | 71 | |||||
Foreign exchange and other changes | 10,334 | 639 | 216 | 0 | 11,189 | |||||
Balance, end of reporting period | 721,546 | 45,335 | 11,379 | 1,041 | 779,300 | |||||
Financial assets at amortized cost subject to impairment increased by € 16 billion or 2% in 2022, which was largely driven by stage 1:
Stage 1 exposures increased by € 11 billion or 2% primarily due to the increases in debt securities held to collect as well as loans at amortized cost in Investment Bank and Private Bank, which were partly offset by a reduction in central bank balances.
Stage 2 exposures increased by € 5 billion or 12% largely driven by loans at amortized cost in Private Bank due to the deterioration of the macroeconomic environment.
Stage 3 exposures slightly decreased by € 203 million or 2% in 2022, which was driven by reductions in Private Bank and the POCI loan portfolio. This was partly offset by the increase in Corporate Bank due to new defaults.
Development of exposures in the previous reporting period
| Dec 31, 2021 | |||||||||
Gross carrying amount | ||||||||||
in € m. | Stage 1 | Stage 2 | Stage 3 | Stage 3 POCI | Total | |||||
Balance, beginning of year | 651,941 | 35,372 | 10,655 | 1,729 | 699,697 | |||||
Movements in financial assets including new business and credit extensions | 78,565 | 7,507 | 305 | (102) | 86,277 | |||||
Transfers due to changes in creditworthiness | (155) | (1,109) | 1,264 | 0 | 0 | |||||
Changes due to modifications that did not result in | (1) | (0) | (16) | 0 | (17) | |||||
Changes in models | 0 | 0 | 0 | 0 | 0 | |||||
Financial assets that have been derecognized during the period | (34,157) | (1,891) | (1,271) | (372) | (37,691) | |||||
Recovery of written off amounts | 0 | 0 | 55 | 23 | 78 | |||||
Foreign exchange and other changes | 14,078 | 774 | 333 | 19 | 15,204 | |||||
Balance, end of reporting period | 710,271 | 40,653 | 11,326 | 1,297 | 763,548 | |||||
123 |
Deutsche Bank | ||
Annual Report 2022 | ||
Financial assets at amortized cost subject to impairment increased by € 64 billion or 9% in 2021, which was largely driven by stage 1:
Stage 1 exposures increased by € 58 billion or 9% primarily due to the increase in loans at amortized cost in Investment Bank and Private Bank as well as the increase in central bank balances.
Stage 2 exposures increased by € 5 billion or 15% largely driven by the Investment Bank due to enhancements in the process related Stage 2 triggers, discussed in the IFRS 9 impairment section of the Annual Report 2021.
Stage 3 exposures slightly increased by € 240 million or 2% in 2021, which was driven by the new defaults in the Private Bank as well as in the Investment Bank. This was partly offset by the reductions in our POCI loan portfolio as well as Corporate Bank and Capital Release Unit.
Development of allowance for credit losses in the current reporting period
| Dec 31, 2022 | |||||||||
Allowance for Credit Losses² | ||||||||||
in € m. | Stage 1 | Stage 2 | Stage 3 | Stage 3 POCI⁴ | Total | |||||
Balance, beginning of year | 440 | 532 | 3,740 | 182 | 4,895 | |||||
Movements in financial assets including new business and credit extensions | (32) | 204 | 887 | 22 | 1,081 | |||||
Transfers due to changes in creditworthiness | 122 | (121) | (0) | N/M | 0 | |||||
Changes due to modifications that did not result in | N/M | N/M | N/M | N/M | N/M | |||||
Changes in models | 0 | 0 | 0 | 0 | 0 | |||||
Financial assets that have been derecognized during the period³ | 0 | 0 | (1,014) | (28) | (1,043) | |||||
Recovery of written off amounts | 0 | 0 | 68 | 3 | 71 | |||||
Foreign exchange and other changes | 2 | 12 | (25) | 1 | (10) | |||||
Balance, end of reporting period | 533 | 626 | 3,656 | 180 | 4,995 | |||||
Provision for Credit Losses excluding country risk¹ | 90 | 82 | 886 | 22 | 1,081 | |||||
1Movements in financial assets including new business, transfers due to changes in creditworthiness and changes in models add up to Provision for Credit Losses excluding country risk.
2Allowance for credit losses does not include allowance for country risk amounting to € 14 million as of December 31, 2022.
3This position includes charge offs of allowance for credit losses.
4The total amount of undiscounted expected credit losses at initial recognition on financial assets that are purchased or originated credit-impaired initially recognized during the reporting period was € 46 million in 2022 and € 0 million in 2021.
Allowance for credit losses against financial assets at amortized cost subject to impairment increased by € 100 million or 2% in 2022, which was driven by Stages 1 and 2:
Stage 1 allowances increased by € 93 million or 21% driven by the deteriorating macroeconomic environment, as explained earlier.
Stage 2 allowances increased by € 94 million or 18% due to the deterioration of macroeconomic outlook, as explained earlier.
Stage 3 allowances decreased by € 87 million or 2% mainly driven by reductions due to non-performing portfolio sales in Private Bank, which were partly offset by the new bookings in Investment Bank and Corporate Bank.
The Group’s stage 3 coverage ratio (defined as allowance for credit losses in stage 3 (excluding POCI) divided by financial assets at amortized cost in stage 3 (excluding POCI)) amounted to 32% in the current fiscal year, compared to 33% in the prior year.
Due to the deteriorated macroeconomic environment, the net transfers in stage 1 due to changes in creditworthiness slightly decreased in 2022 on a year-over-year basis. The net outflows from stage 2 due to changes in creditworthiness reduced in the full year 2022 as well, which was mainly due to lower allowance levels in stage 2 in the prior year, following the recovery from the COVID-19 pandemic.
In 2022, the net transfers in stage 3 (excluding POCI) went down compared to 2021. The immaterial amount of net transfers due to creditworthiness in stage 3 in 2022 resulted from the offset of the outflows from stage 3 by the lower inflows. This was attributable to lower allowances in stage 1 and stage 2 in the prior year period, as discussed above.
124 |
Deutsche Bank | ||
Annual Report 2022 | ||
Development of allowance for credit losses in the previous reporting period
| Dec 31, 2021 | |||||||||
Allowance for Credit Losses² | ||||||||||
in € m. | Stage 1 | Stage 2 | Stage 3 | Stage 3 POCI⁴ | Total | |||||
Balance, beginning of year | 544 | 648 | 3,614 | 139 | 4,946 | |||||
Movements in financial assets including new business and credit extensions | (245) | 85 | 615 | 26 | 480 | |||||
Transfers due to changes in creditworthiness | 138 | (197) | 58 | N/M | 0 | |||||
Changes due to modifications that did not result in | N/M | N/M | N/M | N/M | N/M | |||||
Changes in models | 0 | 0 | 0 | 0 | 0 | |||||
Financial assets that have been derecognized during the period³ | 0 | 0 | (561) | (5) | (566) | |||||
Recovery of written off amounts | 0 | 0 | 55 | 23 | 78 | |||||
Foreign exchange and other changes | 3 | (4) | (41) | (0) | (43) | |||||
Balance, end of reporting period | 440 | 532 | 3,740 | 182 | 4,895 | |||||
Provision for Credit Losses excluding country risk¹ | (107) | (112) | 673 | 26 | 480 | |||||
1 Movements in financial assets including new business, transfers due to changes in creditworthiness and changes in models add up to Provision for Credit Losses excluding country risk.
2Allowance for credit losses does not include allowance for country risk amounting to € 4 million as of December 31,2021.
3 This position includes charge offs of allowance for credit losses.
4The total amount of undiscounted expected credit losses at initial recognition on financial assets that are purchased or originated credit-impaired initially recognized during the reporting period was € 0 million in 2021 and € 46 million in 2020 (Prior year’s comparative aligned to presentation in the current year).
Allowance for credit losses against financial assets at amortized cost subject to impairment slightly decreased by € 51 million or 1% in 2021 mainly driven by stages 1 and 2:
Stage 1 allowances decreased by € 104 million or 19%, due to the update of macroeconomic outlook, as explained in the Annual Report 2021.
Stage 2 allowances decreased by € 117 million or 18% driven by the update of macroeconomic outlook, as explained in the Annual Report 2021.
Stage 3 allowances increased by € 169 million or 5% driven by new defaults in Private Bank and Investment Bank as well as the increase in allowance against the existing POCI loan portfolio, which were partly offset by the reductions in Corporate Bank and Capital Release Unit.
Financial assets at amortized cost by business division
| Dec 31, 2022 | |||||||||||||||||||
Gross Carrying Amount¹ | Allowance for Credit Losses | |||||||||||||||||||
in € m. | Stage 1 | Stage 2 | Stage 3 | Stage 3 | Total | Stage 1 | Stage 2 | Stage 3 | Stage 3 | Total | ||||||||||
Corporate Bank | 114,983 | 11,030 | 2,879 | 0 | 128,892 | 91 | 99 | 963 | 0 | 1,153 | ||||||||||
Investment Bank | 164,443 | 10,288 | 2,375 | 1,041 | 178,147 | 145 | 89 | 491 | 180 | 904 | ||||||||||
Private Bank | 243,896 | 22,609 | 5,870 | 0 | 272,375 | 283 | 433 | 2,167 | 0 | 2,883 | ||||||||||
Asset Management | 1,861 | 49 | 0 | 0 | 1,910 | 0 | 0 | 0 | 0 | 0 | ||||||||||
Capital Release Unit | 1,769 | 115 | 115 | 0 | 2,000 | 1 | 2 | 34 | 0 | 36 | ||||||||||
Corporate & Other | 194,594 | 1,244 | 140 | 0 | 195,978 | 13 | 4 | 1 | 0 | 18 | ||||||||||
Total | 721,546 | 45,335 | 11,379 | 1,041 | 779,300 | 533 | 626 | 3,656 | 180 | 4,995 | ||||||||||
1Gross Carrying Amount numbers per business division are reported after a reallocation of cash balances from business divisions to Corporate & Other.
| Dec 31, 2021 | |||||||||||||||||||
Gross Carrying Amount¹ | Allowance for Credit Losses | |||||||||||||||||||
in € m. | Stage 1 | Stage 2 | Stage 3 | Stage 3 | Total | Stage 1 | Stage 2 | Stage 3 | Stage 3 | Total | ||||||||||
Corporate Bank | 116,332 | 10,165 | 2,113 | 0 | 128,611 | 56 | 83 | 901 | 0 | 1,040 | ||||||||||
Investment Bank | 147,177 | 9,783 | 2,487 | 1,264 | 160,711 | 106 | 78 | 356 | 182 | 723 | ||||||||||
Private Bank | 235,067 | 19,526 | 6,496 | 33 | 261,122 | 269 | 365 | 2,383 | 0 | 3,018 | ||||||||||
Asset Management | 2,218 | 58 | 0 | 0 | 2,276 | 1 | 1 | 0 | 0 | 2 | ||||||||||
Capital Release Unit | 2,743 | 210 | 212 | 0 | 3,165 | 2 | 1 | 99 | 0 | 103 | ||||||||||
Corporate & Other | 206,734 | 910 | 18 | 0 | 207,663 | 6 | 3 | 1 | 0 | 10 | ||||||||||
Total | 710,271 | 40,653 | 11,326 | 1,297 | 763,548 | 440 | 532 | 3,740 | 182 | 4,895 | ||||||||||
1Gross Carrying Amount numbers per business division are reported after a reallocation of cash balances from business divisions to Corporate & Other.
125 |
Deutsche Bank | ||
Annual Report 2022 | ||
Financial assets at amortized cost by industry sector
The below table gives an overview of the Group’s asset quality by industry and is based on the NACE code of the counterparty. NACE (Nomenclature des Activités Économiques dans la Communauté Européenne) is a standard European industry classification system.
| Dec 31, 2022 | |||||||||||||||||||
Gross Carrying Amount | Allowance for Credit Losses | |||||||||||||||||||
in € m. | Stage 1 | Stage 2 | Stage 3 | Stage 3 | Total | Stage 1 | Stage 2 | Stage 3 | Stage 3 | Total | ||||||||||
Agriculture, forestry and fishing | 425 | 76 | 23 | 0 | 525 | 1 | 1 | 8 | 0 | 10 | ||||||||||
Mining and quarrying | 2,227 | 137 | 70 | 0 | 2,434 | 4 | 5 | 23 | 0 | 32 | ||||||||||
Manufacturing | 25,151 | 4,670 | 1,163 | 84 | 31,068 | 35 | 64 | 519 | 3 | 620 | ||||||||||
Electricity, gas, steam and air conditioning supply | 6,226 | 563 | 51 | 0 | 6,839 | 4 | 5 | 33 | 0 | 42 | ||||||||||
Water supply, sewerage, waste management and remediation activities | 624 | 63 | 39 | 0 | 726 | 1 | 1 | 6 | 0 | 8 | ||||||||||
Construction | 3,453 | 540 | 203 | 87 | 4,282 | 5 | 9 | 91 | 10 | 115 | ||||||||||
Wholesale and retail trade, repair of motor vehicles and motorcycles | 18,710 | 2,530 | 733 | 31 | 22,004 | 20 | 30 | 383 | 3 | 437 | ||||||||||
Transport and storage | 5,233 | 642 | 225 | 28 | 6,127 | 9 | 8 | 65 | (0) | 83 | ||||||||||
Accommodation and food service activities | 1,385 | 466 | 112 | 6 | 1,969 | 2 | 5 | 59 | 1 | 67 | ||||||||||
Information and communication | 7,096 | 614 | 127 | 17 | 7,854 | 14 | 13 | 94 | 0 | 122 | ||||||||||
Financial and insurance activities | 356,491 | 8,991 | 1,999 | 402 | 367,883 | 129 | 73 | 472 | 46 | 720 | ||||||||||
Real estate activities | 41,450 | 6,345 | 896 | 238 | 48,929 | 30 | 22 | 116 | 71 | 239 | ||||||||||
Professional, scientific and technical activities | 6,147 | 721 | 218 | 1 | 7,087 | 6 | 9 | 104 | 0 | 119 | ||||||||||
Administrative and support service activities | 8,429 | 1,003 | 383 | 18 | 9,833 | 9 | 13 | 94 | 6 | 121 | ||||||||||
Public administration and defense, compulsory social security | 30,984 | 418 | 923 | 0 | 32,325 | 15 | 0 | 17 | 0 | 33 | ||||||||||
Education | 205 | 41 | 4 | 0 | 251 | 0 | 1 | 2 | 0 | 3 | ||||||||||
Human health services and social work activities | 4,188 | 351 | 83 | 0 | 4,622 | 8 | 12 | 12 | 0 | 32 | ||||||||||
Arts, entertainment and recreation | 922 | 185 | 28 | 1 | 1,137 | 1 | 5 | 2 | 0 | 9 | ||||||||||
Other service activities | 7,198 | 818 | 226 | 123 | 8,365 | 10 | 6 | 133 | 25 | 174 | ||||||||||
Activities of households as employers, undifferentiated goods- and services-producing activities of households for own use | 194,959 | 16,160 | 3,874 | 6 | 215,000 | 229 | 343 | 1,423 | 15 | 2,010 | ||||||||||
Activities of extraterritorial organizations and bodies | 41 | 0 | 0 | 0 | 41 | 0 | 0 | 0 | 0 | 0 | ||||||||||
Total | 721,546 | 45,335 | 11,379 | 1,041 | 779,300 | 533 | 626 | 3,656 | 180 | 4,995 | ||||||||||
126 |
Deutsche Bank | ||
Annual Report 2022 | ||
| Dec 31, 2021 | |||||||||||||||||||
Gross Carrying Amount | Allowance for Credit Losses | |||||||||||||||||||
in € m. | Stage 1 | Stage 2 | Stage 3 | Stage 3 | Total | Stage 1 | Stage 2 | Stage 3 | Stage 3 | Total | ||||||||||
Agriculture, forestry and fishing | 544 | 73 | 29 | 0 | 646 | 1 | 1 | 11 | 0 | 12 | ||||||||||
Mining and quarrying | 2,771 | 95 | 63 | 0 | 2,929 | 3 | 0 | 13 | 0 | 17 | ||||||||||
Manufacturing | 31,776 | 3,466 | 957 | 97 | 36,296 | 24 | 361 | 481 | 3 | 543 | ||||||||||
Electricity, gas, steam and air conditioning supply | 4,414 | 174 | 117 | 0 | 4,705 | 2 | 2 | 41 | 0 | 45 | ||||||||||
Water supply, sewerage, waste management and remediation activities | 580 | 51 | 50 | 0 | 680 | 1 | 2 | 8 | 0 | 11 | ||||||||||
Construction | 3,672 | 375 | 271 | 128 | 4,446 | 8 | 5 | 178 | (1) | 190 | ||||||||||
Wholesale and retail trade, repair of motor vehicles and motorcycles | 19,582 | 1,355 | 747 | 32 | 21,717 | 18 | 19 | 397 | 3 | 436 | ||||||||||
Transport and storage | 4,513 | 862 | 378 | 29 | 5,782 | 12 | 12 | 72 | (0) | 96 | ||||||||||
Accommodation and food service activities | 1,356 | 769 | 122 | 18 | 2,265 | 1 | 9 | 62 | (2) | 70 | ||||||||||
Information and communication | 6,431 | 257 | 157 | 16 | 6,860 | 10 | 4 | 98 | 0 | 112 | ||||||||||
Financial and insurance activities | 359,874 | 6,711 | 1,756 | 491 | 368,832 | 94 | 48 | 245 | 541 | 442 | ||||||||||
Real estate activities | 34,827 | 5,339 | 1,115 | 271 | 41,551 | 16 | 22 | 97 | 55 | 190 | ||||||||||
Professional, scientific and technical activities | 6,017 | 751 | 225 | 34 | 7,027 | 6 | 9 | 107 | 0 | 122 | ||||||||||
Administrative and support service activities | 9,477 | 1,767 | 467 | 24 | 11,736 | 11 | 21 | 132 | 4 | 167 | ||||||||||
Public administration and defense, compulsory social security | 18,174 | 2,073 | 49 | 0 | 20,295 | 5 | 11 | 5 | 0 | 21 | ||||||||||
Education | 190 | 34 | 5 | 0 | 228 | 0 | 1 | 2 | 0 | 3 | ||||||||||
Human health services and social work activities | 3,620 | 331 | 105 | 0 | 4,056 | 4 | 6 | 18 | 0 | 28 | ||||||||||
Arts, entertainment and recreation | 690 | 371 | 11 | 1 | 1,073 | 2 | 3 | 3 | 1 | 8 | ||||||||||
Other service activities | 8,564 | 920 | 225 | 140 | 9,850 | 6 | 12 | 1161 | 49 | 183 | ||||||||||
Activities of households as employers, undifferentiated goods- and services- producing activities of households for own use | 193,159 | 14,880 | 4,477 | 16 | 212,532 | 218 | 309 | 1,653 | 16 | 2,196 | ||||||||||
Activities of extraterritorial organizations and bodies | 40 | 0 | 1 | 0 | 41 | 0 | 0 | 1 | 0 | 1 | ||||||||||
Total | 710,271 | 40,653 | 11,326 | 1,297 | 763,548 | 440 | 532 | 3,740 | 182 | 4,895 | ||||||||||
1 Prior year’s comparative aligned to presentation in the current year.
Financial assets at amortized cost by region
| Dec 31, 2022 | |||||||||||||||||||
Gross Carrying Amount | Allowance for Credit Losses | |||||||||||||||||||
in € m. | Stage 1 | Stage 2 | Stage 3 | Stage 3 | Total | Stage 1 | Stage 2 | Stage 3 | Stage 3 | Total | ||||||||||
Germany | 317,241 | 19,904 | 3,689 | 0 | 340,835 | 201 | 333 | 1,619 | 13 | 2,166 | ||||||||||
Western Europe | 141,935 | 9,828 | 3,171 | 712 | 155,646 | 178 | 194 | 1,224 | 162 | 1,758 | ||||||||||
Eastern Europe | 8,050 | 1,174 | 386 | 0 | 9,609 | 3 | 7 | 97 | 0 | 107 | ||||||||||
North America | 173,084 | 10,504 | 1,628 | 149 | 185,366 | 81 | 55 | 289 | 5 | 431 | ||||||||||
Central and South America | 4,525 | 253 | 82 | 5 | 4,865 | 6 | 2 | 5 | 0 | 12 | ||||||||||
Asia/Pacific | 58,621 | 2,967 | 1,475 | 112 | 63,174 | 40 | 28 | 330 | 3 | 400 | ||||||||||
Africa | 3,144 | 177 | 843 | 0 | 4,164 | 8 | 0 | 7 | 0 | 15 | ||||||||||
Other | 14,946 | 527 | 105 | 63 | 15,642 | 16 | 6 | 86 | (4) | 105 | ||||||||||
Total | 721,546 | 45,335 | 11,379 | 1,041 | 779,300 | 533 | 626 | 3,656 | 180 | 4,995 | ||||||||||
127 |
Deutsche Bank | ||
Annual Report 2022 | ||
| Dec 31, 2021 | |||||||||||||||||||
Gross Carrying Amount | Allowance for Credit Losses | |||||||||||||||||||
in € m. | Stage 1 | Stage 2 | Stage 3 | Stage 3 | Total | Stage 1 | Stage 2 | Stage 3 | Stage 3 | Total | ||||||||||
Germany | 316,467 | 17,941 | 3,581 | 33 | 338,023 | 191 | 298 | 1,653 | 14 | 2,156 | ||||||||||
Western Europe | 134,187 | 9,224 | 3,652 | 937 | 148,000 | 134 | 156 | 1,533 | 150 | 1,973 | ||||||||||
Eastern Europe | 6,818 | 494 | 99 | 0 | 7,412 | 2 | 4 | 53 | 0 | 59 | ||||||||||
North America | 174,574 | 8,853 | 2,131 | 145 | 185,703 | 53 | 55 | 180 | 16 | 304 | ||||||||||
Central and South America | 3,908 | 206 | 197 | 7 | 4,318 | 3 | 0 | 13 | 2 | 18 | ||||||||||
Asia/Pacific | 58,984 | 2,351 | 1,518 | 137 | 62,990 | 45 | 8 | 227 | 2 | 282 | ||||||||||
Africa | 2,081 | 1,319 | 39 | 0 | 3,439 | 3 | 11 | 1 | 0 | 16 | ||||||||||
Other | 13,252 | 263 | 110 | 38 | 13,664 | 10 | 0 | 791 | (2) | 88 | ||||||||||
Total | 710,271 | 40,653 | 11,326 | 1,297 | 763,548 | 440 | 532 | 3,740 | 182 | 4,895 | ||||||||||
1Prior year’s comparatives aligned to presentation in the current year.
Financial assets at amortized cost by rating class
| Dec 31, 2022 | |||||||||||||||||||
Gross Carrying Amount | Allowance for Credit Losses | |||||||||||||||||||
in € m. | Stage 1 | Stage 2 | Stage 3 | Stage 3 | Total | Stage 1 | Stage 2 | Stage 3 | Stage 3 | Total | ||||||||||
iAAA–iAA | 251,598 | 228 | 0 | 0 | 251,826 | 3 | 0 | 0 | 0 | 3 | ||||||||||
iA | 106,548 | 580 | 0 | 14 | 107,142 | 9 | 1 | 0 | 0 | 10 | ||||||||||
iBBB | 172,643 | 6,246 | 0 | 0 | 178,889 | 63 | 21 | 0 | 0 | 84 | ||||||||||
iBB | 152,063 | 14,891 | 0 | 0 | 166,954 | 212 | 91 | 0 | 0 | 302 | ||||||||||
iB | 35,626 | 17,717 | 0 | 14 | 53,358 | 218 | 276 | 0 | 6 | 501 | ||||||||||
iCCC and below | 3,068 | 5,672 | 11,379 | 1,013 | 21,132 | 28 | 237 | 3,656 | 174 | 4,095 | ||||||||||
Total | 721,546 | 45,335 | 11,379 | 1,041 | 779,300 | 533 | 626 | 3,656 | 180 | 4,995 | ||||||||||
| Dec 31, 2021 | |||||||||||||||||||
Gross Carrying Amount | Allowance for Credit Losses | |||||||||||||||||||
in € m. | Stage 1 | Stage 2 | Stage 3 | Stage 3 | Total | Stage 1 | Stage 2 | Stage 3 | Stage 3 | Total | ||||||||||
iAAA–iAA | 257,805 | 471 | 0 | 0 | 258,276 | 2 | 0 | 0 | 0 | 2 | ||||||||||
iA | 99,418 | 1,325 | 0 | 9 | 100,753 | 6 | 1 | 0 | 0 | 7 | ||||||||||
iBBB | 163,434 | 3,938 | 0 | 0 | 167,371 | 39 | 12 | 0 | 0 | 51 | ||||||||||
iBB | 151,290 | 11,898 | 0 | 0 | 163,188 | 150 | 71 | 0 | 0 | 221 | ||||||||||
iB | 33,572 | 17,942 | 0 | 16 | 51,530 | 205 | 253 | 0 | 6 | 463 | ||||||||||
iCCC and below | 4,752 | 5,079 | 11,326 | 1,272 | 22,430 | 39 | 195 | 3,740 | 177 | 4,151 | ||||||||||
Total | 710,271 | 40,653 | 11,326 | 1,297 | 763,548 | 440 | 532 | 3,740 | 182 | 4,895 | ||||||||||
The Group’s existing commitments to lend additional funds to debtors with stage 3 financial assets at amortized cost amounted to € 621 million as of December 31, 2022 and € 384 million as of December 31, 2021.
Collateral held against financial assets at amortized cost in stage 3
| Dec 31, 2022 | Dec 31, 2021 | ||||||||||
in € m. | Gross Carrying | Collateral | Guarantees | Gross Carrying | Collateral | Guarantees | ||||||
Financial Assets at Amortized Cost (Stage 3)¹ | 11,379 | 3,431 | 1,439 | 11,326 | 4,140 | 496 | ||||||
1 Stage 3 consists here only of non-POCI assets
In 2022, collateral and guarantees held against financial assets at amortized cost in stage 3 increased by € 234 million, or 5% mainly driven by Investment Bank as well as by Private Bank.
Due to full collateralization the Group did not recognize an allowance for credit losses against financial assets at amortized cost in stage 3 for € 916 million in 2022 and € 1,130 million in 2021.
128 |
Deutsche Bank | ||
Annual Report 2022 | ||
Modified Assets at Amortized Cost
A financial asset is considered modified when its contractual cash flows are renegotiated or otherwise modified. Renegotiation or modification may or may not lead to derecognition of the old and recognition of the new financial instrument. This section covers modified financial assets that have not been derecognized.
Under IFRS 9, when the terms of a Financial Asset are renegotiated or modified and the modification does not result in derecognition, a gain or loss is recognized in the income statement as the difference between the original contractual cash flows and the modified cash flows discounted at the original effective interest rate (EIR). For modified financial assets the determination of whether the asset’s credit risk has increased significantly reflects the comparison of:
- – The remaining lifetime probability of default (PD) at the reporting date based on the modified terms; with
- – The remaining lifetime PD estimated based on data at initial recognition and based on the original contractual terms.
The following table provides the overview of modified financial assets at amortized cost in the reporting periods broken down into IFRS 9 stages.
Modified Assets at Amortized Cost
Dec 31, 2022 | Dec 31, 2021 | |||||||||||||||||||
in € m. | Stage 1 | Stage 2 | Stage 3 | Stage 3 | Total | Stage 1 | Stage 2 | Stage 3 | Stage 3 | Total | ||||||||||
Amortized cost carrying amount prior to modification | 0 | 0 | 47 | 0 | 47 | 0 | 22 | 17 | 0 | 40 | ||||||||||
Net modification gain/losses recognized | 0 | (0) | (6) | 0 | (6) | (1) | 0 | (16) | 0 | (16) | ||||||||||
In 2022, the bank has observed the increase of € 7 million or 17% in modified assets at amortized cost due credit related modifications. The Group did not include any COVID-19 driven modifications into the above table. For further details related to COVID-19 driven modifications, please refer to “Legislative and non-legislative moratoria and public guarantee schemes in light of COVID-19 pandemic”
In 2022, the Group has not observed any amounts of modified assets that have been upgraded to stage 1. The bank has not observed any subsequent re-deterioration of those assets into stages 2 and 3.
In 2021, the Group has observed immaterial amounts of modified assets that have been upgraded to stage 1. The bank has not observed any subsequent re-deterioration of those assets into stages 2 and 3.
Financial Assets at Fair value through Other Comprehensive Income
The fair value of financial assets at Fair value through Other Comprehensive Income (FVOCI) subject to impairment was € 32 billion at December 31, 2022, compared to € 29 billion at December 31, 2021. Allowance for credit losses against these assets remained at very low levels (€ 69 million as of December 31, 2022 and € 41 million as of December 31, 2021). Due to immateriality no further breakdown is provided for financial assets at FVOCI.
Off-balance sheet lending commitments and guarantee business
The following tables provide an overview of the nominal amount and credit loss allowance for the Group’s off-balance sheet financial asset class broken down into stages as per IFRS 9 requirements.
Development of nominal amount in the current reporting period
Dec 31, 2022 | ||||||||||
Nominal Amount | ||||||||||
in € m. | Stage 1 | Stage 2 | Stage 3 | Stage 3 POCI | Total | |||||
Balance, beginning of year | 276,157 | 14,498 | 2,582 | 11 | 293,248 | |||||
Movements including new business | 16,078 | 361 | 62 | (3) | 16,498 | |||||
Transfers due to changes in creditworthiness | (3,047) | 3,166 | (119) | 0 | 0 | |||||
Changes in models | 0 | 0 | 0 | 0 | 0 | |||||
Foreign exchange and other changes | 6,874 | 452 | 100 | (0) | 7,427 | |||||
Balance, end of reporting period | 296,062 | 18,478 | 2,625 | 8 | 317,173 | |||||
of which: Financial guarantees | 61,083 | 5,283 | 971 | 0 | 67,337 | |||||
129 |
Deutsche Bank | ||
Annual Report 2022 | ||
Development of nominal amount in the previous reporting period
Dec 31, 2021 | ||||||||||
Nominal Amount | ||||||||||
in € m. | Stage 1 | Stage 2 | Stage 3 | Stage 3 POCI | Total | |||||
Balance, beginning of year | 251,7951 | 8,723 | 2,587 | 1 | 263,1061 | |||||
Movements including new business | 18,247 | 3,236 | (273) | 10 | 21,220 | |||||
Transfers due to changes in creditworthiness | (2,177) | 2,019 | 158 | 0 | 0 | |||||
Changes in models | 0 | 0 | 0 | 0 | 0 | |||||
Foreign exchange and other changes | 8,292 | 521 | 110 | 0 | 8,923 | |||||
Balance, end of reporting period | 276,1571 | 14,498 | 2,582 | 11 | 293,2481 | |||||
of which: Financial guarantees | 55,477 | 2,975 | 1,036 | 0 | 59,488 | |||||
1Prior year’s comparatives aligned to presentation in the current year.
Development of allowance for credit losses in the current reporting period
Dec 31, 2022 | ||||||||||
Allowance for Credit Losses2 | ||||||||||
in € m. | Stage 1 | Stage 2 | Stage 3 | Stage 3 POCI | Total | |||||
Balance, beginning of year | 108 | 111 | 225 | 0 | 443 | |||||
Movements including new business | 21 | (1) | 78 | 0 | 99 | |||||
Transfers due to changes in creditworthiness | 12 | (15) | 3 | 0 | 0 | |||||
Changes in models | 0 | 0 | 0 | 0 | 0 | |||||
Foreign exchange and other changes | 4 | 3 | 3 | 0 | 9 | |||||
Balance, end of reporting period | 144 | 97 | 310 | 0 | 551 | |||||
of which: Financial guarantees | 95 | 56 | 226 | 0 | 378 | |||||
Provision for Credit Losses excluding country risk1 | 33 | (16) | 82 | 0 | 99 | |||||
1The above table breaks down the impact on provision for credit losses from movements in financial assets including new business, transfers due to changes in creditworthiness and changes in models.
2Allowance for credit losses does not include allowance for country risk amounting to € 9 million as of December 31, 2022.
Development of allowance for credit losses in the previous reporting period
Dec 31, 2021 | ||||||||||
Allowance for Credit Losses2 | ||||||||||
in € m. | Stage 1 | Stage 2 | Stage 3 | Stage 3 POCI | Total | |||||
Balance, beginning of year | 144 | 74 | 200 | 0 | 419 | |||||
Movements including new business | (43) | 38 | 18 | 0 | 13 | |||||
Transfers due to changes in creditworthiness | 3 | (5) | 2 | 0 | 0 | |||||
Changes in models | 0 | 0 | 0 | 0 | 0 | |||||
Foreign exchange and other changes | 3 | 3 | 6 | 0 | 12 | |||||
Balance, end of reporting period | 108 | 111 | 225 | 0 | 443 | |||||
of which: Financial guarantees | 69 | 64 | 164 | 0 | 297 | |||||
Provision for Credit Losses excluding country risk1 | (40) | 33 | 19 | 0 | 13 | |||||
1The above table breaks down the impact on provision for credit losses from movements in financial assets including new business, transfers due to changes in creditworthiness and changes in models.
2Allowance for credit losses does not include allowance for country risk amounting to € 6 million as of December 31, 2021.
Legal Claims
Assets subject to enforcement activity consist of assets, which have been fully or partially written off and the Group still continues to pursue recovery of the asset. Such enforcement activity comprises for example cases where the bank continues to devote resources (e.g. our Legal Department/CRM workout unit) towards recovery, either via legal channels or third party recovery agents. Enforcement activity also applies to cases where the Bank maintains outstanding and unsettled legal claims. This is irrespective of whether amounts are expected to be recovered and the recovery timeframe. It may be common practice in certain jurisdictions for recovery cases to span several years.
Amounts outstanding on financial assets that were written off during the reporting period and are still subject to enforcement activity amounted to € 175 million in fiscal year 2022, mainly in Corporate Bank as well as in Private Bank. In 2021, legal claims amounted to € 234 million, mainly in Corporate Bank, Investment Bank and Private Bank.
Renegotiated and forborne assets at amortized costs
For economic or legal reasons the bank might enter into a forbearance agreement with a borrower who faces or will face financial difficulties in order to ease the contractual obligation for a limited period of time. A case-by-case approach is applied for corporate clients considering each transaction and client-specific facts and circumstances. For consumer loans the bank offers forbearances for a limited period of time, in which the total or partial outstanding or future instalments are deferred to a later point of time. However, the amount not paid including accrued interest during this period must be re-compensated at a later point of time. Repayment options include distribution over residual tenor, a one-off payment or a tenor extension. Forbearances are restricted and depending on the economic situation of the client, the Group’s risk management strategies and the local legislation. In case a forbearance agreement is entered into, an impairment measurement is conducted as described below, an impairment charge is taken if necessary and the loan is subsequently recorded as impaired.
130 |
Deutsche Bank | ||
Annual Report 2022 | ||
In the Group’s management and reporting of forborne assets at amortized costs, the bank follows the EBA definition for forbearances and non-performing loans (Implementing Technical Standards (ITS) on Supervisory reporting on forbearance and non-performing exposures under article 99(4) of Regulation (EU) No 575/2013). Once the conditions mentioned in the ITS are met, the Group reports the loan as being forborne; removes the asset from the bank’s forbearance reporting, once the discontinuance criteria in the ITS are met (i.e., the contract is considered as performing, a minimum two year probation period has passed, regular payments of more than an insignificant aggregate amount of principal or interest have been made during at least half of the probation period, and none of the exposures to the debtor is more than 30 days past-due at the end of the probation period).
In 2020, forbearance measures granted as a consequence of the COVID-19 pandemic have been added to the above regulations and are included in the following table, even if these measures, in accordance with EBA guidance, do in general not trigger a stage transition. COVID-19 related moratoria in contrast are not relevant for the below table. For further details please refer to the section “Legislative and non-legislative moratoria and public guarantee schemes in light of COVID-19 pandemic”.
Forborne financial assets at amortized cost
Dec 31, 2022 | Dec 31, 2021 | |||||||||||||||||||||||
Performing | Non-performing | Total | Performing | Non-performing | Total | |||||||||||||||||||
in € m. | Stage 1 | Stage 2 | Stage 1 | Stage 2 | Stage 3 | Stage 1 | Stage 2 | Stage 1 | Stage 2 | Stage 3 | ||||||||||||||
German | 729 | 1,563 | 0 | 21 | 1,066 | 3,379 | 690 | 1,903 | 0 | 17 | 1,056 | 3,665 | ||||||||||||
Non-German | 1,254 | 3,139 | 60 | 13 | 3,299 | 7,764 | 2,478 | 3,489 | 135 | 25 | 3,949 | 10,076 | ||||||||||||
Total | 1,983 | 4,702 | 60 | 34 | 4,365 | 11,143 | 3,168 | 5,391 | 135 | 42 | 5,004 | 13,741 | ||||||||||||
Development of forborne financial assets at amortized cost
in € m. | Dec 31, 2022 | Dec 31, 2021 | ||
Balance beginning of period | 13,741 | 13,459 | ||
Classified as forborne during the year | 3,196 | 4,945 | ||
Transferred to non-forborne during the year (including repayments) | (5,899) | (4,934) | ||
Charge-offs | (142) | (43) | ||
Exchange rate and other movements | 248 | 313 | ||
Balance end of period | 11,143 | 13,741 | ||
Forborne assets at amortized cost decreased by € 2.6 billion, or 19% in 2022. This was driven by the reduction in the COVID-19 related forbearance measures, which was partly offset by the increase in Investment Bank and Corporate Bank.
Forborne assets at amortized cost slightly increased by € 282 million, or 2% in 2021.
Collateral Obtained
The Group obtains collateral on the balance sheet only in certain cases by either taking possession of collateral held as security or by calling upon other credit enhancements. Collateral obtained is made available for sale in an orderly fashion or through public auctions, with the proceeds used to repay or reduce outstanding indebtedness. Generally the bank does not occupy obtained properties for its business use.
Collateral Obtained during the reporting period
in € m. | 2022 | 2021 | ||
Commercial real estate | 2 | 0 | ||
Residential real estate1 | 1 | 2 | ||
Other | 0 | 0 | ||
Total collateral obtained during the reporting period | 4 | 2 | ||
1Carrying amount of foreclosed residential real estate properties amounted to € 62 million as of December 31, 2022 and € 67 million as of December 31,2021.
The collateral obtained, as shown in the table above, excludes collateral recorded as a result of consolidating securitization trusts under IFRS 10. In 2022 the Group did not obtain any collateral related to these trusts, compared to € 46 million in 2021.
131 |
Deutsche Bank | ||
Annual Report 2022 | ||
Derivatives – Credit Valuation Adjustment
The bank establishes counterparty Credit Valuation Adjustment (CVA) for OTC derivative transactions to cover expected credit losses. The adjustment amount is determined by assessing the potential credit exposure to a given counterparty and taking into account any collateral held, the effect of any relevant netting arrangements, expected loss given default and the credit risk, based on available market information, including CDS spreads.
Treatment of default situations under derivatives
Unlike standard loan assets, the bank generally has more options to manage the credit risk in its derivatives transactions when movement in the current replacement costs or the behavior of its counterparty indicate that there is the risk that upcoming payment obligations under the transactions might not be honored. In these situations, the bank is frequently able under the relevant derivatives agreements to obtain additional collateral or to terminate and close-out the derivative transactions at short notice.
The master agreements and associated collateralization agreements for OTC derivative transactions executed with its clients typically result in the majority of its credit exposure being secured by collateral. It also provides for a broad set of standard or bespoke termination rights, which allows the bank to respond swiftly to a counterparty’s default or to other circumstances which indicate a high probability of failure.
The banks contractual termination rights are supported by internal policies and procedures with defined roles and responsibilities which ensure that potential counterparty defaults are identified and addressed in a timely fashion. These procedures include necessary settlement and trading restrictions. When its decision to terminate derivative transactions results in a residual net obligation owed by the counterparty, the bank restructures the obligation into a non-derivative claim and manage it through its regular work-out process. As a consequence, for accounting purposes the bank typically does not show any nonperforming derivatives.
Wrong-way risk occurs when exposure to a counterparty is adversely correlated with the credit quality of that counterparty. In compliance with Article 291(2) and (4) CRR the bank has a monthly process to monitor several layers of wrong-way risk (specific wrong-way risk, general explicit wrong-way risk at country/industry/region levels and general implicit wrong-way risk, whereby relevant exposures arising from transactions subject to wrong-way risk are automatically selected and presented for comment to the responsible credit officer). A wrong-way risk report is then sent to Credit Risk senior management on a monthly basis. In addition, the bank utilized its established process for calibrating its own alpha factor (as defined in Article 284 (9) CRR) to estimate the overall wrong-way risk in its derivatives and securities financing transactions portfolio. The Private Bank Germany’s derivative counterparty risk is immaterial to the Group and collateral held is typically in the form of cash.
Managing and mitigation of credit risk
Managing credit risk on counterparty level
Credit-related counterparties are principally allocated to credit officers within credit teams which are organized by type of counterparty (such as financial institutions, corporates or private individuals), economic area (e.g., Emerging Markets) or product (Structured Credit) and supported by dedicated rating analyst teams where deemed necessary. The individual credit officers have the relevant expertise and experience to manage the credit risks associated with these counterparties and their associated credit related transactions. For retail clients, credit decision making and credit monitoring is highly automated for efficiency reasons. Credit Risk Management has full oversight of the respective processes and tools used in these highly automated retail credit processes. It is the responsibility of each credit officer to undertake ongoing credit monitoring for their allocated portfolio of counterparties. Deutsche Bank also has procedures in place intended to identify at an early-stage credit exposures for which there may be an increased risk of increased risk/ loss.
In instances where Deutsche Bank has identified counterparties where there is a concern that the credit quality has deteriorated or appears likely to deteriorate to the point where they present a heightened risk of default / loss, the respective counterparty is generally placed on the “Watchlist”. Deutsche Bank aims to identify those counterparties well in advance that, on the basis of the application of the bank’s risk management tools, demonstrate the likelihood of problems well in advance in order to effectively manage the credit exposure and minimize potential losses. The objective of this early warning system is to address potential problems while adequate options for action are still available. This early risk detection is a tenet of Deutsche Bank’s credit culture and is designed to raise management awareness of these positions.
Credit limits are established by the Credit Risk Management function via the execution of assigned credit authorities. This also applies to settlement risk that must fall within limits pre-approved by Credit Risk Management considering risk appetite and in a manner that reflects expected settlement patterns for the subject counterparty. Credit approvals are documented by the signing of the credit report by the respective credit authority holders and are retained for future reference.
132 |
Deutsche Bank | ||
Annual Report 2022 | ||
Credit authority is generally assigned to individuals as personal credit authority according to the individual’s professional qualification and experience. All assigned credit authorities are reviewed on a periodic basis to help ensure that they are commensurate with the individual performance of the authority holder.
Where an individual’s personal authority is insufficient to establish required credit limits, the transaction is referred to a higher credit authority holder or where necessary to an appropriate credit committee. Where personal and committee authorities are insufficient to establish appropriate limits, the case is referred to the Management Board for approval.
Mitigation of credit risk on counterparty level
In addition to determining counterparty credit quality and the alignment of the exposure with the bank’s concentration risk appetite, Deutsche Bank also uses various credit risk mitigation techniques to optimize credit exposure and reduce potential credit losses. Credit risk mitigants are applied in the following forms:
- – Comprehensive and enforceable credit documentation with adequate terms and conditions
- – Collateral in its various forms to reduce losses by increasing the recovery of obligations; key principles for collateral management include legal effectiveness and enforceability, prudent and realistic collateral valuations, risk and regulatory capital reduction, as well as cost efficiency
- – Risk transfers, which shift the risk of default of an obligor to a third-party including hedging executed by the bank’s Strategic Corporate Lending (SCL); other de-risking tools such as securitizations etc. may also be employed
- – Netting and collateral arrangements which reduce the credit exposure from derivatives and securities financing transactions (e.g. repo transactions)
- – Hedging of derivatives counterparty risk including CVA, using primarily CDS contracts via the bank’s Counterparty Portfolio Management desk
Collateral
Deutsche Bank regularly agrees on collateral to be received from customers that are subject to credit risk or to be provided by third parties agreed by legally effective and enforceable contracts as documented by a written and reasoned legal opinion. Collateral is credit protection in the form of (funded) assigned or pledged assets or (unfunded) third-party obligations that serves to mitigate the inherent risk of credit loss in an exposure, by either substituting the counterparty default risk or improving recoveries in the event of a default. Deutsche Bank generally takes all types of valuable and eligible collateral for its respective businesses but may limit accepted collateral types for specific businesses or regions as customary in the respective market or driven by purpose of efficiency. While collateral can be an alternative source of repayment, it does not replace the necessity of high-quality underwriting standards and a thorough assessment of the debt service ability of the counterparty in line with Article 194 (9) CRR.
Deutsche Bank distinguishes following two types of collateral received:
- – Financial and other collateral, which enables Deutsche Bank to recover all or part of the outstanding exposure by liquidating the collateral asset provided, in cases where the counterparty is unable or unwilling to fulfill its primary obligations. Cash collateral, securities (equity, bonds), collateral pledges or assignments of other claims or inventory, movable assets (i.e., plant, machinery, ships and aircraft) and real estate typically fall into this category. All financial collateral is regularly, mostly daily, revalued and measured against the respective credit exposure. The value of other collateral, including real estate, is monitored based upon established processes that includes regular reviews or revaluations by internal and/or external experts
- – Guarantee collateral, which complements the counterparty’s ability to fulfill its obligation under the legal contract and as such is provided by uncorrelated third parties. Letters of credit, insurance contracts, export credit insurance, guarantees, credit derivatives and risk participations typically fall into this category. Guarantees and strong letters of comfort provided by correlated group members of customers (generally the parent company) are also accepted and used for risk transfer in approved rating scorecards. Guarantee collateral with a non-investment grade rating of the guarantor is limited
Deutsche Bank’s processes seek to ensure that the collateral accepted for risk mitigation purposes is of high quality. This includes processes to generally ensure legally effective and enforceable documentation for realizable and measurable collateral assets which are evaluated within the on-boarding process by dedicated internal appraisers or teams with the respective qualification, skills and experience or adequate external valuers mandated in regulated processes. The applied valuations follow generally accepted valuation methods or models. Ongoing correctness of values is monitored by collateral type specific appropriate frequent and event-driven reviews considering relevant risk parameters. Revaluations are applied in cases of identified probable material deterioration and future monitoring may be adjusted respectively. The assessment of the suitability of collateral for a specific transaction is part of the credit decision and must be undertaken in a conservative way, including collateral haircuts that are applied. Deutsche Bank has collateral type specific haircuts in place which are regularly reviewed and approved. In this regard, Deutsche Bank strives to avoid “wrong-way” risk characteristics where the counterparty’s risk is positively correlated with the risk of deterioration in the collateral value. For guarantee collateral, the process for the analysis of the guarantor’s creditworthiness is aligned to the credit assessment process for counterparties.
The valuation of collateral is considered under a liquidation scenario. The liquidation value is equal to the expected proceeds of collateral monetization/realization in a base case scenario, wherein a fair price is achieved through careful preparation and orderly liquidation of the collateral. Collateral can either move in value over time (dynamic value) or not (static value). The dynamic liquidation value generally includes a safety margin or haircut over realizable value to address liquidity and marketability aspects.
133 |
Deutsche Bank | ||
Annual Report 2022 | ||
The Group assigns a liquidation value to eligible collateral, based on, among other things:
- – The market value and / or lending value, notional amount or face value of a collateral as a starting point
- – The type of collateral; the currency mismatch, if any, between the secured exposure and the collateral; and a maturity mismatch, if any
- – The applicable legal environment or jurisdiction (onshore versus offshore collateral)
- – The market liquidity and volatility in relation to agreed termination clauses
- – The correlation between the performance of the borrower and the value of the collateral, e.g., in the case of the pledge of a borrower’s own shares or securities (in this case generally full correlation leads to no liquidation value)
- – The quality of physical collateral and potential for litigation or environmental risks; and
- – A determined collateral type specific haircut (0 – 100%) reflecting collection risks (i.e. price risks over the average liquidation period and processing/utilization/sales costs) as specified in the respective policies
Collateral haircut settings are typically based on available historic internal and/or external recovery data (expert opinions may also be used, where appropriate). They also incorporate a forward-looking component in the form of collection and valuation forecast provided by experts within Risk Management. Considering the expected proceeds from the liquidation of the different collateral types, respective value fluctuations, market specific liquidation costs and time applied haircuts vary between 0 to 100%. When data is not sufficiently available or inconclusive, more conservative haircuts than otherwise used must be applied. Haircut settings are reviewed at least annually.
Risk transfers
Risk transfers to third parties form a key part of the bank’s overall risk management process and are executed in various forms, including outright sales, single name and portfolio hedging, and securitizations. Risk transfers are conducted by the respective business units and by Strategic Corporate Lending, in accordance with specifically approved mandates.
Strategic Corporate Lending manages the residual credit risk of loans and lending-related commitments of the institutional and corporate credit portfolio, the leveraged portfolio and the medium-sized German companies’ portfolio across the bank’s Corporate Bank and Investment Bank divisions.
Acting as a central pricing reference, Strategic Corporate Lending provides the businesses with an observed or derived capital market rate for loan applications; however, the decision of whether or not the business can enter into the credit risk remains exclusively with Credit Risk Management.
Strategic Corporate Lending concentrates on two primary objectives within the credit risk framework to enhance risk management discipline, improve returns and use capital more efficiently:
- – To reduce single-name credit risk concentrations within the credit portfolio and
- – To manage credit exposures by utilizing techniques including loan sales, securitization via collateralized loan obligations, sub-participations and single-name and portfolio credit default swaps
Netting and collateral arrangements for derivatives and securities financing transactions
Netting is applicable to both exchange traded derivatives and OTC derivatives. Netting is also applied to securities financing transactions (e.g. repurchase, securities lending and margin lending transactions) as far as documentation, structure and nature of the risk mitigation allow netting with the underlying credit risk in accordance with applicable law and the bank’s Financial Contracts Netting and Collateral Policy and Procedures – Legal (collectively, “Netting Policies”). While cross-product netting between derivatives and securities financing transactions may be used in certain cases, the bank does not make use of cross-product netting for regulatory purposes.
All exchange traded derivatives are cleared through central counterparties (CCPs), which interpose themselves between the trading entities by becoming the counterparty to each of the entities. Where legally required or where available and to the extent agreed with the bank’s counterparties, Deutsche Bank also uses CCP clearing for its OTC derivative transactions.
134 |
Deutsche Bank | ||
Annual Report 2022 | ||
The Dodd-Frank Act and related Commodity Futures Trading Commission (CFTC) rules require CCP clearing in the United States for certain standardized OTC derivative transactions, including certain interest rate swaps and index credit default swaps, subject to limited exceptions when facing certain counterparties. The European Regulation (EU) No 648/2012 on OTC Derivatives, Central Counterparties and Trade Repositories (EMIR) and the Commission Delegated Regulations (EU) 2015/2205, (EU) 2015/592 and (EU) 2016/1178 based thereupon introduced mandatory CCP clearing in the EU for certain standardized OTC derivatives transactions. Mandatory CCP clearing in the EU began for certain interest rate derivatives on June 21, 2016 and for certain iTraxx-based credit derivatives and additional interest rate derivatives on February 9, 2017. Article 4 (2) of EMIR authorizes competent authorities to exempt intragroup transactions from mandatory CCP clearing, provided certain requirements, such as full consolidation of the intragroup transactions and the application of an appropriate centralized risk evaluation, measurement and control procedure are met. The bank successfully applied for the clearing exemption for a number of its regulatory-consolidated subsidiaries with intragroup derivatives, including e.g., Deutsche Bank Securities Inc. and Deutsche Bank Luxembourg S.A. As of December 31, 2022, the bank is allowed to make use of intragroup exemptions from the EMIR clearing obligation for 58 bilateral intragroup relationships. The extent of the exemptions differs as not all entities enter into relevant transaction types subject to the clearing obligation. Of the 58 intragroup relationships, 14 are relationships where both entities are established in the Union (EU) for which a full exemption has been granted, and 44 are relationships where one is established in a third country (“Third Country Relationship”). Third Country Relationships required repeat applications for each new asset class being subject to the clearing obligation; the process took place in the course of 2017. Due to “Brexit”, the status of some group entities has changed from an EU entity to a third country entity, but there has been no impact for the bank in respect clearing exemptions.
The rules and regulations of CCPs typically provide for the bilateral set off of all amounts payable on the same day and in the same currency (“payment netting”) thereby reducing the bank’s settlement risk. Depending on the business model applied by the CCP, this payment netting applies either to all of the bank’s derivatives cleared by the CCP or at least to those that form part of the same class of derivatives. Many CCPs’ rules and regulations also provide for the termination, close-out and netting of all cleared transactions upon the CCP’s default (“close-out netting”), which reduces the bank’s credit risk. In its risk measurement and risk assessment processes Deutsche Bank applies close-out netting only to the extent Deutsche Bank believes that the relevant CCP’s close-out netting provisions are legally valid and enforceable and have been approved in accordance with the bank’s Netting Policies.
In order to reduce the credit risk resulting from OTC derivative transactions, where CCP clearing is not available, Deutsche Bank regularly seeks the execution of standard master agreements (such as master agreements for derivatives published by the International Swaps and Derivatives Association, Inc. (ISDA) or the German Master Agreement for Financial Derivative Transactions) with the bank’s counterparties. A master agreement allows for the close-out netting of rights and obligations arising under derivative transactions that have been entered into under such a master agreement upon the counterparty’s default, resulting in a single net claim owed by or to the counterparty. Payment netting may be agreed from time to time with the bank’s counterparties for multiple transactions having the same payment dates (e.g., foreign exchange transactions) pursuant to the terms of master agreements which can, reduce the bank’s settlement risk. In its risk measurement and risk assessment processes Deutsche Bank applies close-out netting only to the extent Deutsche Bank has concluded that the master agreement is legally valid and enforceable in all relevant jurisdictions and the recognition of close-out netting has been approved in accordance with the bank’s Netting Policies.
Deutsche Bank also enters into credit support annexes (CSAs) to master agreements in order to further reduce the bank’s derivatives-related credit risk. These annexes generally provide risk mitigation through periodic, usually daily, margining of the covered exposure. The CSAs also provide for the right to terminate the related derivative transactions upon the counterparty’s failure to honor a margin call. As with netting, when Deutsche Bank believes the annex is enforceable, Deutsche Bank reflects this in its exposure measurement.
Certain CSAs to master agreements provide for rating-dependent triggers, where additional collateral must be pledged if a party’s rating is downgraded. Deutsche Bank also enters into master agreements that provide for an additional termination event upon a party’s rating downgrade. These downgrade provisions in CSAs and master agreements usually apply to both parties but in some agreements may apply to Deutsche Bank only. Deutsche Bank analyzes and monitor its potential contingent payment obligations resulting from a rating downgrade in its stress testing and liquidity coverage ratio approach for liquidity risk on an ongoing basis. For an assessment of the quantitative impact of a downgrading of the bank’s credit rating please refer to table “Stress Testing Results” in the section “Liquidity Risk”.
135 |
Deutsche Bank | ||
Annual Report 2022 | ||
The Dodd-Frank Act and CFTC rules thereunder, including CFTC rule § 23.504, as well as EMIR and Commission Delegated Regulation based thereon, namely Commission Delegated Regulation (EU) 2016/2251, introduced the mandatory use of master agreements and related CSAs, which must be executed prior to or contemporaneously with entering into an uncleared OTC derivative transaction. Certain documentation is also required by the U.S. margin rules adopted by U.S. prudential regulators. Under the U.S. prudential regulators’ margin rules, Deutsche Bank is required to post and collect initial margin for its derivatives exposures with other derivatives dealers, as well as with the bank’s counterparties that (a) are “financial end users,” as that term is defined in the U.S. margin rules, and (b) have an average daily aggregate notional amount of uncleared swaps, uncleared security-based swaps, foreign exchange forwards and foreign exchange swaps exceeding U.S.$ 8 billion in June, July and August of the previous calendar year. The U.S. margin rules additionally requires Deutsche Bank to post and collect variation margin for its derivatives with other derivatives dealers and certain financial end user counterparties. These margin requirements are subject to a U.S.$ 50 million threshold for initial margin, but no threshold for variation margin, with a combined U.S.$ 500,000 minimum transfer amount. The U.S. margin requirements have been in effect for large banks since September 2016, with additional variation margin requirements having come into effect March 1, 2017 and additional initial margin requirements are being phased in from September 2017 through September 2022.
Under Commission Delegated Regulation (EU) 2016/2251, which implements the EMIR margin requirements, the CSA must provide for daily valuation and daily variation margining based on a zero threshold and a minimum transfer amount of not more than € 500,000. For large derivative exposures exceeding € 8 billion, initial margin has to be posted as well. The variation margin requirements under EMIR apply as of March 1, 2017; the initial margin requirements originally were subject to a staged phase-in until September 1, 2021. However, legislative changes published on February 17, 2021 extended deadlines into 2022. Under Article 31 of Commission Delegated Regulation (EU) 2016/2251, an EU party may decide to not exchange margin with counterparties in certain non-netting jurisdictions provided certain requirements are met. Pursuant to Article 11 (5) to (10) of EMIR, competent authorities are authorized to exempt intragroup transactions from the margining obligation, provided certain requirements are met. While some of those requirements are the same as for the EMIR clearing exemptions (see above), there are additional requirements such as the absence of any current or foreseen practical or legal impediment to the prompt transfer of funds or repayment of liabilities between intragroup counterparties. The bank is making use of this exemption. The bank has successfully applied for the collateral exemption for some of its regulatory-consolidated subsidiaries with intragroup derivatives, including, e.g., Deutsche Bank Securities Inc. and Deutsche Bank Luxembourg S.A. As of December 31, 2022, the bank is allowed to use intragroup exemptions from the EMIR collateral obligation for a number of bilateral intragroup relationships which are published under db.com/legal-resources/european-market-infrastructure-regulation/intra-group-exemptions-margining. For some bilateral intragroup relationships, the EMIR margining exemption may be used based on Article 11 (5) of EMIR, i.e. without the need for any application or publication, because both entities are established in the same EU Member State. For third country subsidiaries, the intragroup exemption was originally limited until the earlier of June 30, 2022 and four months after the publication of an equivalence decision by the EU Commission under Article 13(2) EMIR, unless, in the case of an equivalence decision being applicable, a follow-up exemption application is made and granted. On February 13, 2023, an amendment to Regulation (EU) 2016/2251 has been published in the Official Journal, which amendment relates to the extension of the exemption end date until June 30, 2025. While the application requirement may be abolished with “EMIR 3.0” (see European Commission proposal COM (2022) 697 final), Deutsche Bank continues to have processes in place ensuring readiness for intragroup margining should the need arise.
Concentrations within credit risk mitigation
Concentrations within credit risk mitigations taken may occur if a number of guarantors and credit derivative providers with similar economic characteristics are engaged in comparable activities with changes in economic or industry conditions affecting their ability to meet contractual obligations. Concentration risk may also occur in collateral portfolios (e.g. multiple claims and receivables against third parties) which are considered conservatively within the valuation process and/or on-site inspections where applicable. Deutsche Bank uses a range of tools and metrics to monitor its credit risk mitigating activities and potential concentrations.
For more qualitative and quantitative details in relation to the application of credit risk mitigation and potential concentration effects please refer to the section “Maximum exposure to credit risk”.
136 |
Deutsche Bank | ||
Annual Report 2022 | ||
Managing credit risk on portfolio level
Enterprise Risk & Credit Risk Portfolio Management sets the framework for the management of concentration risks at a portfolio level. This includes strategically setting, monitoring, reviewing, reporting, and controlling credit risk appetites across various dimensions such as group, division, business unit, legal entity, branch, country, and industry level that need to be considered in the context of credit approvals. In addition, Enterprise Risk & Credit Risk Portfolio Management also provides a comprehensive and holistic view of the bank’s risk profile across risk types.
On a portfolio level, significant concentrations of credit risk could result from having material exposures to a number of counterparties with similar economic characteristics, or who are engaged in comparable activities, where these similarities may cause their ability to meet contractual obligations to be affected in the same manner by changes in economic or industry conditions.
Deutsche Bank’s portfolio management framework supports a comprehensive assessment of concentrations within its credit risk portfolio in order to keep concentrations within acceptable levels.
Risk and portfolio developments are regularly discussed at the Credit Risk Appetite and Portfolio Management Forum which includes representation from across the Credit Risk Management function including the Head of Credit Risk Management.
Industry risk management
To manage industry risk, Deutsche Bank has grouped its corporate and financial institutions counterparties into various industry sub-portfolios. Portfolios are regularly reviewed with the frequency of review dependent on portfolio size and risk profile as well as risk developments. Larger / riskier portfolios are reviewed at least on an annual basis. Reviews highlight industry developments and risks to the bank’s credit portfolio, review cross-risk concentration risks, analyze the risk/reward profile of the portfolio and incorporate the results of an economic downside stress test. Finally, this analysis is used to define the credit strategies for the portfolio in question.
In the bank’s industry limit framework, thresholds are established for aggregate credit limits to counterparties within each industry sub-portfolio. For risk management purposes, the aggregation of limits across industry sectors follows an internal risk view that does not have to be congruent with NACE (Nomenclature des Activities Economiques dans la Communate Europeenne) code-based view applied elsewhere in this report. Regular industry portfolio overviews are prepared for the Enterprise Risk Committee to discuss recent developments and to agree on actions where necessary.
Beyond credit risk, the bank’s industry risk framework comprises of thresholds for Traded Credit Positions while key industry relevant non-financial risks are closely monitored.
Country risk management
Avoiding undue concentrations from a regional and country perspective is also an integral part of the bank’s credit risk management framework. In order to achieve this, country risk thresholds are applied to countries in Non-Japan Asia, Central Eastern Europe, Middle East & Africa and Latin America as well as selected Developed Markets countries (based on internal country risk ratings). Similar to industry risk, country portfolios are regularly reviewed with the frequency of review dependent on portfolio size and risk profile as well as risk developments. Larger/riskier portfolios are reviewed at least on an annual basis. These reviews assess amongst other factors, key macroeconomic and political risk developments and outlook; portfolio composition, quality and cross-risk concentrations under normal and stress conditions; analyze the risk/reward profile of the portfolio. Based on this and taking into account the Group’s Risk Appetite and strategy, country risk appetite and strategies are set.
In the bank’s country risk framework, thresholds are established for counterparty credit risk exposures in each country to manage the aggregate credit risk subject to country-specific economic and political events. These thresholds cover exposures to entities incorporated locally and subsidiaries of foreign multinational corporations as well as companies with significant economic or operational dependence on a specific country even though they are incorporated externally. In addition, gap risk thresholds are set to control the risk of loss due to intra-country wrong-way risk exposure. As such, for risk management purposes, the aggregation of exposures across countries follows an internal risk view that may differ from the geographical exposure view applied elsewhere in this report. Beyond credit risk, the bank’s country risk framework comprises thresholds for trading positions that measure the aggregate market value of traded credit risk positions. For Emerging Markets, thresholds are also set to measure the profit and loss impact under specific country stress scenarios on trading positions across the bank’s portfolio. Furthermore, thresholds are set for capital and intra-group funding exposure of Deutsche Bank entities in above countries given the transfer risk inherent in these cross-border positions. Key non-financial risks are closely monitored. Deutsche Bank’s country risk ratings represents a key tool in its management of country risk. They include:
137 |
Deutsche Bank | ||
Annual Report 2022 | ||
- – Sovereign rating (set and managed by ERM): A measure of the probability of the sovereign defaulting on its foreign or local currency obligations
- – Transfer risk rating (set and managed by ERM): A measure of the probability of a “transfer risk event”, i.e., the risk that an otherwise solvent debtor is unable to meet its obligations due to inability to obtain foreign currency or to transfer assets as a result of direct sovereign intervention
All sovereign and transfer risk ratings are reviewed, at least on an annual basis.
Product/Asset class specific risk management
Complementary to the bank’s counterparty, industry and country risk approach, Deutsche Bank focuses on certain product/asset class specific risk concentrations and set limits or thresholds where required for risk management purposes. Specific risk limits are set in particular if a concentration of transactions of a specific type might lead to significant losses under certain conditions. In this respect, correlated losses might result from disruptions in the functioning of financial markets, significant moves in market parameters to which the respective product or asset class is sensitive to, or other risk drivers common to the asset class.
Underwriting of capital markets transactions
Specific focus is placed on transactions with underwriting risks where Deutsche Bank underwrites commitments with the intention to sell down or distribute part of the risk to third parties. These commitments include the undertaking to provide bank loans for syndication into the debt capital market and bridge loans for the issuance of notes. The inherent risks of being unsuccessful in the distribution of the facilities or the placement of the notes, comprise of a delayed distribution, funding of the underlying loans as well as a pricing risk as some underwriting commitments are additionally exposed to market risk in the form of widening credit spreads. Where applicable, Deutsche Bank dynamically hedges this credit spread risk to be within the approved market risk limit framework.
A major product, in which Deutsche Bank is active in underwriting, is leverage lending, which Deutsche Bank mainly executes through its Leveraged Debt Capital Markets business unit. The business model is a fee-based‚ originate to distribute approach focused on the distribution of largely unfunded underwriting commitments into the capital market. The afore mentioned risks regarding distribution and credit spread movement apply to this business unit, however, are managed under a range of specific notional as well as market risk limits. The latter require the business to also hedge its underwriting pipeline against market dislocations. The fee-based model of the bank’s Leveraged Debt Capital Markets business unit includes a restrictive approach to single-name risk concentrations retained on Deutsche Bank‘s balance sheet, which results in a diversified overall portfolio without any material concentrations. The resulting longer-term on-balance sheet portfolio is also subject to a comprehensive credit limit and hedging framework.
Deutsche Bank also assumes underwriting risk with respect to Commercial Real Estate loans, primarily in the Commercial Real Estate business unit in the Investment Bank where loans may be originated with the intent to securitize in the capital markets or syndicate to other lenders. The afore mentioned inherent underwriting risks such as delayed distribution and pricing risk are managed through notional caps, market risk limits and hedging against the risk of market dislocations.
In addition to underwriting risk, Deutsche Bank also focuses on concentration of transactions with specific risk dynamics (including risk to commercial real estate and risk from securitization positions).
In addition, the bank’s Private Bank and certain Corporate Bank businesses are managed via product-specific strategies setting the bank’s risk appetite for portfolios with similar credit risk characteristics, such as the retail portfolios of mortgages and consumer finance products as well as products for business clients. Here risk analyses are performed on portfolio level including further breakdown into business units as well as countries/regions. Analysis for individual clients is of secondary importance. In Wealth Management, target levels are set for global concentrations along products as well as based on type and liquidity of collateral.
138 |
Deutsche Bank | ||
Annual Report 2022 | ||
Market Risk Management
Market Risk framework
The vast majority of Deutsche Bank’s businesses are subject to market risk, defined as the potential for change in the market value of the Group’s trading and invested positions. Risk can arise from changes in interest rates, credit spreads, foreign exchange rates, equity prices, commodity prices and other relevant parameters, such as market volatility and market implied default probabilities. The market risk can affect accounting, economic and regulatory views of the exposure.
Market Risk Management is part of Deutsche Bank’s independent Risk function and sits within the Market and Valuations Risk Management group. One of the primary objectives of Market Risk Management is to ensure that the business units’ risk exposure is within the approved risk appetite commensurate with its defined strategy. To achieve this objective, Market Risk Management works closely together with risk takers (“the business units”) and other control and support groups.
The Group distinguishes between three substantially different types of market risk:
- – Trading market risk arises primarily through the market-making and client facilitation activities of the Investment Bank and Corporate Bank divisions. This involves taking positions in debt, equity, foreign exchange, other securities and commodities as well as in equivalent derivatives
- – Traded default risk arising from defaults and rating migrations relating to trading instruments
- – Non-trading market risk arises from market movements, primarily outside the activities of the trading units, in the banking book and from off-balance sheet items; this includes interest rate risk, credit spread risk, investment risk and foreign exchange risk as well as market risk arising from pension schemes, guaranteed funds and equity compensation; non-trading market risk also includes risk from the modeling of client deposits as well as savings and loan products
Market Risk Management governance is designed and established to promote oversight of all market risks, effective decision-making and timely escalation to senior management.
Market Risk Management defines and implements a framework to systematically identify, assess, monitor and report the Group’s market risk. Market risk managers identify market risks through active portfolio analysis and engagement with the business units.
Market Risk measurement
The Group aims to accurately measure all types of market risks by a comprehensive set of risk metrics embedding accounting, economic and regulatory considerations.
The market risks are measured by several internally developed key risk metrics and regulatory defined market risk approaches.
Trading Market Risk
The Group’s primary mechanism to manage trading market risk is the application of risk appetite framework of which the limit framework is a key component. The Management Board, supported by Market Risk Management, sets group-wide value-at-risk, economic capital and portfolio stress testing limits for market risk in the trading book. Market Risk Management allocates this overall appetite to the Corporate Divisions and their individual business units based on established and agreed business plans. Deutsche Bank also has business aligned heads within Market Risk Management who establish business unit limits, by allocating the limit down to individual portfolios, geographical regions and types of market risks.
Value-at-risk, economic capital and portfolio stress testing limits are used for managing all types of market risk at an overall portfolio level. As an additional and important complementary tool for managing certain portfolios or risk types, Market Risk Management performs risk analysis and business specific stress testing. Limits are also set on sensitivity and concentration/liquidity, exposure, business-level stress testing and event risk scenarios, taking into consideration business plans and the risk vs return assessment.
Business units are responsible for adhering to the limits against which exposures are monitored and reported. The market risk limits set by Market Risk Management are monitored on a daily, weekly and monthly basis, dependent on the risk management tool being used.
139 |
Deutsche Bank | ||
Annual Report 2022 | ||
Internally developed Market Risk Models
Value-at-Risk (VaR)
VaR is a quantitative measure of the potential loss (in value) of Fair Value positions due to market movements that should not be exceeded in a defined period of time and with a defined confidence level.
The Group’s value-at-risk for the trading businesses is based on internal model approach. In October 1998, the German Banking Supervisory Authority (now the BaFin) approved the bank’s internal model for calculating the regulatory market risk capital for general and specific market risks based on a sensitivity based Monte Carlo approach. In October 2020, the ECB approved a significant change to the VaR model, now a Historical Simulation approach predominantly utilizing full revaluation, although some portfolios remain on a sensitivity based approach. The new approach is used for both Risk Management and capital requirements.
The new approach provides more accurate modelling of the risks, enhances the Group’s analysis capabilities and provides a more effective tool for risk management. Aside from enabling a more accurate view of market risk, the implementation of Historical Simulation VaR has brought about an even closer alignment of the market risk systems and models to the end of day pricing.
Risk management VaR is calibrated to a 99% confidence level and a one day holding period. This means we estimate there is a 1 in 100 chance that a mark-to-market loss from our trading positions will be at least as large as the reported VaR. For regulatory capital purposes, the VaR model is calibrated to a 99% confidence interval and a ten day holding period.
The calculation employs a Historical Simulation technique that uses one year of historical market data as input and observed correlations between the risk factors during this one year period.
The VaR model is designed to take into account a comprehensive set of risk factors across all asset classes. Key risk factors are swap/government curves, index and issuer-specific credit curves, single equity and index prices, foreign exchange rates, commodity prices as well as their implied volatilities. To help ensure completeness in the risk coverage, second order risk factors, e.g. money market basis, implied dividends, option-adjusted spreads and precious metals lease rates are also considered in the VaR calculation. The list of risk factors include in the VaR model is reviewed regularly and enhanced as part of ongoing model performance reviews.
The model incorporates both linear and, especially for derivatives, nonlinear impacts predominantly through a full revaluation approach but it also utilizes a sensitivity-based approach for certain portfolios. The full revaluation approach uses the historical changes to risk factors as input to pricing functions. Whilst this approach is computationally expensive, it does yield a more accurate view of market risk for nonlinear positions, especially under stressed scenarios. The sensitivity based approach uses sensitivities to underlying risk factors in combination with historical changes to those risk factors.
For each business unit a separate VaR is calculated for each risk type, e.g. interest rate risk, credit spread risk, equity risk, foreign exchange risk and commodity risk. “Diversification effect” reflects the fact that the total VaR on a given day will be lower than the sum of the VaR relating to the individual risk types. Simply adding the VaR figures of the individual risk types to arrive at an aggregate VaR would imply the assumption that the losses in all risk types occur simultaneously.
The VaR enables the Group to apply a consistent measure across the fair value exposures. It allows a comparison of risk in different businesses, and also provides a means of aggregating and netting positions within a portfolio to reflect correlations and offsets between different asset classes. Furthermore, it facilitates comparisons of the market risk both over time and against the daily trading results.
When using VaR results a number of considerations should be taken into account. These include:
- – The use of historical market data may not be a good indicator of potential future events, particularly those that are extreme in nature; this “backward-looking” limitation can cause VaR to understate future potential losses (as in 2008), but can also cause it to be overstated immediately following a period of significant stress (as in COVID-19 pandemic)
- – The one day holding period does not fully capture the market risk arising during periods of illiquidity, when positions cannot be closed out or hedged within one day
- – VaR does not indicate the potential loss beyond the 99th quantile
- – Intra-day risk is not reflected in the end of day VaR calculation
- – There may be risks in the trading or banking book that are not fully captured in the VaR model (either partially captured or missing entirely)
140 |
Deutsche Bank | ||
Annual Report 2022 | ||
The process of systematically capturing and evaluating risks currently not captured in the bank’s VaR model has been further developed and improved. An assessment is made to determine the level of materiality of these risks and material risks are prioritized for inclusion in the bank’s internal model. Risks not in VaR are monitored and assessed on a regular basis through the Risk Not In VaR (RNIV) framework. This framework has also undergone a significant overhaul in 2020. This includes aligning the methodologies with the Historical Simulation approach which in turn yields a more accurate estimate of the contribution of these missing items and their potential capitalization.
Deutsche Bank is committed to the ongoing development of the internal risk models, and substantial resources are allocated to review, validate and improve them.
Stressed Value-at-Risk
Stressed Value-at-Risk (SVaR) calculates a stressed value-at-risk measure based on a one year period of significant market stress. The Group calculates a stressed value-at-risk measure using a 99% confidence level. Stressed VaR is calculated with a holding period of ten days. The SVaR calculation utilizes the same systems, trade information and processes as those used for the calculation of value-at-risk. The only difference is that historical market data and observed correlations from a period of significant financial stress (i.e., characterized by high volatilities) is used as an input for the Historical Simulation.
The stress period selection process for the stressed value-at-risk calculation is based on the comparison of VaR calculated using historical time windows compared to the current SVaR. If a historical window produces a VaR which is higher than the current SVaR, it is further investigated and the SVaR window can then subsequently be updated accordingly. This process runs on a quarterly basis.
During 2022, the stress period selection process for DB Group was conducted as outlined above. As a result, the SVaR window used at various periods in 2022 included the Financial credit crisis of 2008/09 and the more recent COVID-19 stress period of 2020.
Incremental Risk Charge
Incremental Risk Charge captures default and credit rating migration risks for credit-sensitive positions in the trading book. The Group uses a Monte Carlo Simulation for calculating incremental risk charge as the 99.9% quantile of the portfolio loss distribution over a one-year capital horizon under a constant position approach and for allocating contributory incremental risk charge to individual positions.
The model captures the default and migration risk in an accurate and consistent quantitative approach for all portfolios. Important parameters for the incremental risk charge calculation are exposures, recovery rates, maturities, ratings with corresponding default and migration probabilities and parameters specifying issuer correlations.
Market Risk Standardized Approach
The Market Risk Standardized Approach (“MRSA”) is used to determine the regulatory capital charge for the specific market risk of trading book securitizations, for certain types of investment funds and for longevity risk as set out in CRR/CRD regulations.
Longevity risk is the risk of adverse changes in life expectancies resulting in a loss in value on longevity linked policies and transactions. For risk management purposes, stress testing and economic capital allocations are also used to monitor and manage longevity risk.
Market Risk Stress Testing
Stress testing is a key risk management technique, which evaluates the potential effects of extreme market events and movements in individual risk factors. It is one of the core quantitative tools used to assess the market risk of Deutsche Bank’s positions and complements VaR and Economic Capital. Market Risk Management performs several types of stress testing to capture the variety of risks (Portfolio Stress Testing, individual specific stress tests and Event Risk Scenarios) and also contributes to Group-wide stress testing. These stress tests cover a wide range of severities designed to test the earnings stability and capital adequacy of the bank.
141 |
Deutsche Bank | ||
Annual Report 2022 | ||
Trading Market Risk Economic Capital
Deutsche Bank’s trading market risk economic capital model-scaled Stressed VaR based EC (SVaR based EC) - comprises two core components, the “common risk” component covering risk drivers across all businesses and the “business-specific risk” component, which enriches the Common Risk via a suite of Business Specific Stress Tests. Both components are calibrated to historically observed severe market shocks. Common risk is calculated using a scaled version of the SVaR framework while Business Specific Stress Tests are designed to capture more product/business-related bespoke risks (e.g. complex basis risks) as well as higher order risks not captured in the common risk component. The SVaR based EC uses the Monte Carlo SVaR framework.
Traded Default Risk Economic Capital
The Traded Default Risk Economic Capital captures the relevant credit exposures across our trading and fair value banking books. Trading book exposures are monitored by Market Risk Management via single name concentration and portfolio thresholds which are set based upon rating, size and liquidity. Single name concentration risk thresholds are set for two key metrics: Default Exposure, i.e., the P&L impact of an instantaneous default at the current recovery rate, and bond equivalent Market Value, i.e. default exposure at 0% recovery. In order to capture diversification and concentration effects we perform a joint calculation for traded default risk economic capital and credit risk economic capital. Important parameters for the calculation of traded default risk are exposures, recovery rates and default probabilities as well as maturities. The probability of joint rating downgrades and defaults is determined by the default and rating correlations of the portfolio model. These correlations are specified through systematic factors that represent countries, geographical regions and industries.
Trading Market Risk Reporting
Market Risk Management reporting creates transparency on the risk profile and facilitates the understanding of core market risk drivers to all levels of the organization. The Management Board and Senior Governance Committees receive regular reporting, as well as ad hoc reporting as required, on market risk, regulatory capital and stress testing. Senior Risk Committees receive risk information at a number of frequencies, including weekly or monthly.
Additionally, Market Risk Management produces daily and weekly Market Risk specific reports and daily limit utilization reports for each business owner.
Regulatory prudent valuation of assets carried at fair value
Pursuant to Article 34 CRR, institutions shall apply the prudent valuation requirements of Article 105 CRR to all assets measured at fair value and shall deduct from CET 1 capital the amount of any additional value adjustments necessary.
We determined the amount of the additional value adjustments based on the methodology defined in the Commission Delegated Regulation (EU) 2016/101.
As of December 31, 2022 the amount of the additional value adjustments was € 2.02 billion. The December 31, 2021 amount was € 1.8 billion. The increase was predominantly due to the diversification benefit factor reverting back to normal levels after the amendment via Commission Delegated Regulation (EU) 2020/866 that provided temporary relief to account for the extreme market volatility due to the COVID-19 pandemic.
As of December 31, 2022 the reduction of the expected loss from subtracting the additional value adjustments was € 123 million, which partly mitigated the negative impact of the additional value adjustments on our CET 1 capital.
142 |
Deutsche Bank | ||
Annual Report 2022 | ||
Non-trading Market Risk
Non-trading market risk arises primarily from activities outside of the trading units, in the banking book, including pension schemes and guarantees, and embedding considerations of different accounting treatments of transactions. Significant market risk factors the Group is exposed to and are overseen by risk management groups in that area are interest rate risk (including risk from embedded optionality and changes in behavioral patterns for certain product types), credit spread risk, foreign exchange risk (including structural foreign exchange risk), equity risk (including equity compensation related risk and investments in public and private equity as well as real estate, infrastructure and fund assets).
As for trading market risks the Group’s risk appetite and limit framework is also applied to manage our exposure to non-trading market risk. On group level those are captured by the management board set limits for market risk economic capital capturing exposures to all market risks across asset classes as well as earnings and economic value based limits for interest rate risk in the banking books. Those limits are cascaded down by market risk management to the divisional or portfolio level. The limit framework for non-trading market risk exposure is further complemented by a set of business specific stress tests, value-at-risk & sensitivity limits monitored on a daily or monthly basis dependent on the risk measure being used.
Interest Rate Risk in the Banking Book
Interest rate risk in the banking book (IRRBB) is the current or prospective risk, to both the Group's capital and earnings, arising from movements in interest rates, which affect the Group's banking book exposures. This includes gap risk, which arises from the term structure of banking book instruments, basis risk, which describes the impact of relative changes in interest rates for financial instruments that are priced using different interest rate curves, as well as option risk, which arises from option derivative positions or from optional elements embedded in financial instruments.
The Group manages its IRRBB exposures using economic value as well as earnings based measures. The Group Treasury function is mandated to manage the interest rate risk centrally, with Market Risk Management acting as “2nd Line of Defense” (LoD) independently assessing and challenging the implementation of the framework and adherence to the risk appetite. Group Audit in its role as the “3rd LoD” is accountable for providing independent and objective assurance on the adequacy of the design, operating effectiveness and efficiency of the risk management system and systems of internal control. The Group Asset & Liability Committee (“ALCo”) oversees and steers the Group’s structural interest risk position with particular focus on banking book risks and the management of the net interest income. The ALCo monitors the sensitivity of financial resources and associated metrics to key market parameters such as interest rate curves and oversees adherence to divisional/business financial resource limits.
Economic value based measures look at the change in economic value of banking book assets, liabilities and off-balance sheet exposures resulting from interest rate movements, independent of the accounting treatment. Thereby the Group measures the change in economic value of equity (∆EVE) as the maximum decrease of the banking book economic value under the six standard scenarios defined by the EBA in addition to internal stress scenarios for risk steering purposes. For the reporting of internal stress scenarios and risk appetite the Group applies a few different modelling assumptions as used in this disclosure. When aggregating the economic value of equity ∆EVE across different currencies, DB adds up negative and positive changes without applying weight factors for positive changes. Furthermore, the Group is using behavioral model assumptions about the interest rate duration of own equity capital as well as non-maturity deposits from financial institutions.
Earnings-based measures look at the expected change in net interest income (NII) resulting from interest rate movements over a defined time horizon, compared to a defined benchmark scenario. Thereby the Group measures net interest income ∆NII as the maximum reduction under the six standard scenarios defined by the EBA in addition to internal stress scenarios for risk steering purposes, compared to a market implied curve scenario, over a period of 12 months.
The Group employs mitigation techniques to hedge the interest rate risk arising from non-trading positions within given limits. The interest rate risk arising from non-trading asset and liability positions is managed through Treasury Markets & Investments. Thereby the Group uses derivatives and applies different hedge accounting techniques such as fair value hedge accounting or cash flow hedge accounting. For fair value hedges, the Group uses interest rate swaps and options contracts to manage the fair value movements of fixed rate financial instruments due to changes in benchmark interest. For hedges in the context of the cash flow hedge accounting, the Group uses interest rate swaps to manage the exposure to cash flow variability of the variable rate instruments as a result of changes in benchmark interest rates.
The Group assesses and measures hedge effectiveness of a hedging relationship based on the change in the fair value or cash flows of the derivative hedging instrument relative to the change in the fair value or cash flows of the hedged item attributable to the hedged risk.
143 |
Deutsche Bank | ||
Annual Report 2022 | ||
The “Model Risk Management” function performs independent validation of models used for IRRBB measurement, as per all market risk models, in line with Deutsche Bank’s group-wide risk governance framework.
The calculation of VaR and sensitivities of interest rate risk is performed daily, whereas the measurement and reporting of economic value interest rate and earnings risk is performed on a monthly basis. The Group generally uses the same metrics in its internal management systems as it applies for the disclosure in this report.
Deutsche Bank’s key modelling assumptions are applied to the positions in the Private Bank and Corporate Bank divisions. Those positions are subject to risk of changes in client’s behavior with regard to their deposits as well as loan products. The Group regularly tests the assumptions and updates them where appropriate following a defined governance process. In particular, the Group has made changes to its assumptions during the early phase of rising interest rates where a slower repricing in deposits was observed than it was anticipated.
The Group manages the interest rate risk exposure of its non-maturity deposits through a replicating portfolio approach to determine the average repricing maturity of the portfolio. For the purpose of constructing the replicating portfolio, the portfolio of non-maturity deposits is clustered by dimensions such as business unit, currency, product and geographical location. The main dimensions influencing the repricing maturity are elasticity of deposit rates to market interest rates, volatility of deposit balances and observable client behavior. For the reporting period the average repricing maturity assigned across all such replicating portfolios is 1.98 years and Deutsche Bank uses 15 years as the longest repricing maturity.
In the loan and some of the term deposit products Deutsche Bank considers early prepayment/withdrawal behavior of its customers. The parameters are based on historical observations, statistical analyses and expert assessments.
Furthermore, the Group generally calculates IRRBB related metrics in contractual currencies and aggregates the resulting metrics for reporting purposes. When calculating economic value based metrics the commercial margin is excluded for material parts of the balance sheet.
Credit Spread Risk in the Banking Book
Deutsche Bank is exposed to credit spread risk of bonds held in the banking book, mainly as part of the Treasury Liquidity Reserves portfolio. The credit spread risk in the banking book is managed by the businesses, with Market Risk Management acting as an independent oversight function ensuring that the exposure is within the approved risk appetite. This risk category is closely associated with interest rate risk in the banking book as changes in the perceived credit quality of individual instruments may result in fluctuations in spreads relative to underlying interest rates. The calculation of credit spread sensitivities and value-at-risk for credit spread exposure is in general performed on a daily basis, the measurement and reporting of economic capital and stress tests are performed on a monthly basis.
Foreign exchange risk
Foreign exchange risk arises from non-trading asset and liability positions that are denominated in currencies other than the functional currency of the respective entity. The majority of this foreign exchange risk is transferred through internal hedges to trading books within the Investment Bank and is therefore reflected and managed via the value-at-risk figures in the trading books. The remaining foreign exchange risks that have not been transferred are mitigated through match funding the investment in the same currency, so that only residual risk remains in the portfolios. Small exceptions to above approach follow the general Market Risk Management monitoring and reporting process, as outlined for the trading portfolio.
The bulk of non-trading open foreign exchange risk arises from the foreign exchange translation of local capital into the reporting currency of DB Group and related capital hedge positions. Thereby structural open long positions are taken for a selected number of relevant currencies to immunize the sensitivity of the capital ratio of the Group against changes in the exchange rates.
144 |
Deutsche Bank | ||
Annual Report 2022 | ||
Equity and investment risk
Non-trading equity risk is arising predominantly from our non-consolidated investment holdings in the banking book and from our equity compensation plans.
Deutsche Bank’s non-consolidated equity investment holdings in the banking book are categorized into strategic and alternative investment assets. Strategic investments typically relate to acquisitions made to support the bank’s business franchise and are undertaken with a medium to long-term investment horizon. Alternative assets are comprised of principal investments and other non-strategic investment assets. Principal investments are direct investments in private equity, real estate, venture capital, hedge or mutual funds whereas assets recovered in the workout of distressed positions or other legacy investment assets in private equity and real estate are of a non-strategic nature.
Investment proposals for strategic investments as well as monitoring of progress and performance against committed targets are evaluated by the Group Investment Committee. Depending on size, strategic investments may require approval from the Group Investment Committee, the Management Board or the Supervisory Board.
Credit Risk Management Principal Investments is responsible for the risk-related governance and monitoring of our alternative asset activities. The review of new or increased principal investment commitments is the task of the Principal Investment Commitment Approval Group, established by the Enterprise Risk Committee as a risk management forum for alternative asset investments. The Principal Investment Commitment Approval Group approves investments under its authority or recommends decisions above its authority to the Management Board for approval. The Management Board also sets investment limits for business divisions and various portfolios of risk upon recommendation by the Enterprise Risk Committee.
The equity investment holdings are included in regular group wide stress tests and the monthly market risk economic capital calculations.
Pension risk
The Group is exposed to market risks from defined benefit pension schemes for past and current employees. Market risks in pension plans materialize due to a potential decline in the market value of plan assets or an increase in the present value of the pension liability of each of the pension plans. Market Risk Management is responsible for a regular measurement, monitoring, reporting and control of market risks of the asset and liability side of the defined benefit pension plans. Thereby, market risks in pension plans include but are not restricted to interest rate risk, inflation risk, credit spread risk, equity risk, and longevity risk. For further details on the Group’s defined benefit pension obligations and their management, please refer to Note 33 “Employee Benefits” in the “Notes to the Consolidated Financial Statements” section.
Other risks in the Banking Book
Market risks in the Asset Management business primarily result from principal guaranteed funds or accounts, but also from co-investments in the bank’s funds.
Non-trading Market Risk Economic Capital
Non-trading market risk economic capital is calculated either by applying the standard traded market risk EC methodology or through the use of non-traded market risk models that are specific to each risk class and which consider, among other factors, historically observed market moves, the liquidity of each asset class, and changes in client’s behavior in relation to products with behavioral optionalities.
145 |
Deutsche Bank | ||
Annual Report 2022 | ||
Operational risk management
Operational Risk Management Framework
Deutsche Bank applies the European Banking Authority’s Single Rulebook definition of operational risk: “Operational risk means the risk of losses stemming from inadequate or failed internal processes, people and systems or from external events. Operational risk includes legal risks but excludes business and reputational risk and is embedded in all banking products and activities.” Operational risk forms a subset of the bank’s non-financial risks.
Deutsche Bank’s operational risk appetite sets out the amount of operational risk it is willing to accept as a consequence of doing business. The bank takes on operational risks consciously, both strategically as well as in day-to-day business. While the bank may have no appetite for certain types of operational risk events (such as violations of laws or regulations and misconduct), in other cases a certain amount of operational risk must be accepted if the bank is to achieve its business objectives. In case a residual risk is assessed to be outside risk appetite, risk reducing actions must be undertaken, including remediating the risks, insuring risks or ceasing business.
The Operational Risk Management Framework is a set of interrelated tools and processes that are used to identify, assess, measure, monitor and mitigate the bank’s operational risks. Its components have been designed to operate together to provide a comprehensive, risk-based approach to managing the bank’s most material operational risks. Operational Risk Management Framework components include the Group’s approach to setting and adhering to operational risk appetite, the operational risk type and control taxonomies, the minimum standards for operational risk management processes including the respective tools, and the bank’s operational risk capital model.
Organizational & governance structure
While the day-to-day management of operational risk is the primary responsibility of business divisions and infrastructure functions, where these risks are generated, Non-Financial Risk Management (NFRM) oversees the Group-wide management of operational risks, identifies and reports risk concentrations, and promotes a consistent application of the Operational Risk Management Framework across the bank. NFRM is part of the Group risk function, the Chief Risk Office, which is headed by the Chief Risk Officer.
The Chief Risk Officer appoints the Head of NFRM, who is accountable for the design, oversight and maintenance of an effective, efficient and regulatory compliant Operational Risk Management Framework, including the operational risk capital model. The Head of NFRM monitors and challenges the Operational Risk Management Framework’s Group wide implementation and monitors overall risk levels against the bank’s operational risk appetite.
The Non-Financial Risk Committee, which is chaired by the Chief Risk Officer, is responsible for the oversight, governance and coordination of the management of operational risk in the Group on behalf of the Management Board, by establishing a cross-risk perspective of the key operational risks of the Group. Its decision-making authorities include the review, advice and management of all operational risk issues that may impact the risk profile of business divisions and infrastructure functions. Several sub-fora with attendees from both the 1st LoD and 2nd LoD support the Non-Financial Risk Committee to effectively fulfil its mandate. In addition to the Group level Non-Financial Risk Committee, business divisions have established 1st LoD non-financial risk fora for the oversight and management of operational risks on various levels of the organization.
The governance of operational risks follows the bank’s 3LoD approach to managing all of its financial and non-financial risks. The Operational Risk Management Framework establishes the operational risk governance standards including the core 1st and 2nd LoD roles and their responsibilities, to ensure effective risk management and appropriate independent challenge.
Operational risk requirements for the 1st LoD: Risk owners as the 1st LoD have full accountability for their operational risks and manage these against a defined risk appetite.
Risk owners are those roles in the bank whose activities generate - or who are exposed to - operational risks. As heads of business divisions and infrastructure functions, they must determine the appropriate organizational structure to identify their operational risk profile, actively manage these risks within their organization, take business decisions on the mitigation or acceptance of operational risks to ensure they remain within risk appetite, and establish and maintain 1st LoD controls.
Operational risk requirements for the 2nd LoD: Risk Type Controllers act as the 2nd LoD control functions for all sub-risk types under the overarching risk type “operational risk”.
146 |
Deutsche Bank | ||
Annual Report 2022 | ||
Risk Type Controllers establish the framework and define Group level risk appetite statements for the specific operational risk type they oversee. Risk Type Controllers define the minimum risk management and control standards and independently monitor and challenge risk owners’ implementation of these standards in their day-to-day processes, as well as their risk-taking and risk management activities. Risk Type Controllers provide independent operational risk oversight and prepare aggregated risk type profile reporting. Risk Type Controllers monitor the risk type’s profile against risk appetite and have a right to veto risk decisions leading to foreseeable risk appetite breaches. As risk type experts, Risk Type Controllers define the risk type and its taxonomy and support and facilitate the implementation of the risk type framework in the 1st LoD. To maintain their independence, Risk Type Controller roles are located only in infrastructure functions.
Operational risk requirements for NFRM as the Risk Type Controller for the overarching risk type “operational risk”: As the Risk Type Controller / risk control function for operational risk, NFRM establishes and maintains the overarching Operational Risk Management Framework and determines the appropriate level of capital to underpin the Group’s operational risk.
- – As the 2nd LoD risk control function, NFRM defines the bank’s approach to operational risk appetite and monitors its adherence, breaches and consequences; NFRM is the independent reviewer and challenger of the 1st LoD’s risk and control assessments and risk management activities relating to the holistic operational risk profile of a unit (while Risk Type Controllers monitor and challenge activities related to their specific risk types); NFRM provides the oversight of risk and control mitigation plans to return the bank’s operational risk to its risk appetite, where required; it also establishes and regularly reports the bank’s operational risk profile and operational top risks, i.e. the bank’s material operational risks which are outside of risk appetite
- – As the subject matter expert for operational risk, NFRM provides independent risk views to facilitate forward-looking management of operational risks, actively engages with risk owners (1st LoD) and facilitates the implementation of risk management and control standards across the bank
- – NFRM is accountable for the design, implementation and maintenance of the approach to determine the adequate level of capital required for operational risk, for recommendation to the Management Board; this includes the calculation and allocation of operational risk capital demand and expected loss under the Advanced Measurement Approach (AMA)
Managing operational risk
To manage the broad range of sub-risk types underlying operational risk, the Operational Risk Management Framework provides a set of tools and processes that apply to all operational risk types across the bank. These enable the bank to determine its operational risk profile in relation to risk appetite for operational risk, to systematically identify operational risk themes and concentrations, and to define risk mitigating measures and priorities.
In 2022, the bank continued to mature the management of operational risks by further integrating and simplifying the risk management processes, by enhancing the bank’s central controls inventory, by upgrading systems to capture and analyze operational risk loss events, by enhancing governance around risk appetite, and by strengthening control activities conducted by both 1st LoD and 2nd LoD functions at various levels across the bank.
Loss data collection: Data on internal and relevant external operational risk events (with a P&L impact ≥ €10,000) is independently validated a in a timely manner. Material operational risk events trigger clearly defined lessons learned and read-across analyses, which are performed in the 1st LoD in close collaboration between business partners, risk control and other infrastructure functions. Lessons learned reviews analyze the reasons for significant operational risk events, identify their root causes, and document appropriate remediation actions to reduce the likelihood of their reoccurrence. Read across reviews take the conclusions of the lessons learned process and seek to analyze whether similar risks and control weaknesses identified in a lessons learned review exist in other areas of the bank, even if they have not yet resulted in problems. This allows preventative actions to be undertaken. In 2022, the bank implemented a new system (Event Management Application ‘EMApp’) for capturing and managing operational risk events to replace dbIRS. The historical data on loss events has been migrated from dbIRS to EMApp, and its completeness and potential impacts on the operational risk model were tested and documented.
Scenario analysis: The operational risk profile is complemented by incorporating exploratory scenario analysis into day-to-day risk management activities. Scenario analysis is used as a risk identification and management tool that enables risk owners and Risk Type Controllers to explore potential exposure to risk as the basis for identifying potential gaps in the banks existing operational risk profile. Scenario storylines build on internal losses, emerging risk reviews, top risk concentrations, and the review of external peer operational risk loss events. Information from actual and potential future loss events are systematically utilized to identify thematic susceptibilities and actively seek to reduce the likelihood of similar incidents, for example through deep dive analyses or risk profile reviews. In 2022, the scenario analysis process has been strengthened by further tightening the roles and responsibilities within the 1st LoD and 2nd LoD in executing scenarios. Furthermore, scenario analysis continues to play an important role in operational resilience exercises particularly in assessing impacts on emerging risk themes such as the Ukraine/Russia conflict, energy shortage etc., to assist the bank to prepare for crisis management decisions.
147 |
Deutsche Bank | ||
Annual Report 2022 | ||
Risk & Control Assessment: The risk and control assessment process comprises of a series of bottom-up assessments of the risks generated by business divisions and infrastructure functions (1st LoDs), the effectiveness of the controls in place to manage them, and the remediation actions required to bring the risks outside of risk appetite back into risk appetite. This enables both the 1st and 2nd LoDs to have a clear view of the bank’s material operational risks. In 2022, the bank continued to embed the dynamic, trigger-based approach to the risk and control assessment to review the bank’s risk profile on a real time basis through non-financial risk governance meetings. In addition, the bank has continued to mature its central control inventory as well as assurance and assessment activities to provide greater transparency to the risk owners on the effectiveness of the control environments mitigating their risks.
Top risks: The bank regularly reports and performs analyses on top risks to establish that they are appropriately mitigated. As all risks, top risks are rated in terms of both the likelihood that they could occur and the impact on the bank should they do so, and through this assessment they are identified to be particularly material for the bank. The reporting provides a forward-looking perspective on the impact of planned remediation and control enhancements. It also contains emerging risks and themes that have the potential to evolve as top risks in the future. Top risk reduction programs comprise the most significant risk reduction activities that are key to bringing operational top risk themes back within risk appetite. In 2022, the frequency of Group top risk reporting was changed from monthly to quarterly to align with divisional top risk reporting cadence, noting that any risk and remediation updates may be reflected dynamically via the risk and control assessment process.
Transformation Risk Assessment: To appropriately identify and manage risks from material change initiatives within the bank, a transformation risk assessment process is in place to assess the impact of transformations on the bank’s risk profile and control environment. This process considers impacts to both financial and non-financial risk types and is applicable to initiatives including regulatory initiatives, technology migrations, risk remediation projects, strategy changes, organizational changes, and real estate moves within the bank. In 2022, a number of changes were introduced in order to improve the robustness of the assessment. To that end, the timeframe to finalize the assessment has been extended, the template has been enhanced, and the role of 2nd LoD functions to challenge and input into the assessment was further strengthened.
Risk appetite: Non-financial risk appetite is the amount of non-financial risk the bank is willing to accept as a consequence of doing business. The non-financial risk appetite framework provides a common approach to measure and monitor the level of risk appetite across the firm. NFR appetite metrics are used to monitor the operational risk profile against the bank’s defined risk appetite, and to alert the organization to impending problems in a timely fashion. In 2022, the design of an enhanced risk appetite framework was developed and tested for a subset or risk types. Further refinements to the approach and a fuller implementation plan will be a focus for 2023.
Findings and issue management: The findings and issue management process facilitates the bank in mitigating the risks associated with known control weaknesses and deficiencies, and enables management to make risk-based decisions over the need for further remediation or risk acceptance. Outputs from the findings management process must be able to demonstrate to internal and external stakeholders that the bank is actively identifying its control weaknesses and taking steps to manage associated risks within acceptable levels of risk appetite.
Operational risk type frameworks
Operational risk is a risk type on the Group’s Risk Type Taxonomy. Together with Reputational Risk it forms Non-Financial risk. The Operational Risk Management Framework is a set of interrelated tools and processes that are used to identify, assess, measure, monitor and mitigate Deutsche Bank Group’s operational risks according to regulatory and industry-established definition of operational risk. It applies to the operational sub-risk types on a more granular level and enables the bank to aggregate and monitor its operational risk profile. These operational sub-risk types are controlled by various infrastructure functions and include the following:
- – The Compliance department performs an independent 2nd level control function that protects the bank’s license to operate by promoting and enforcing compliance with the law and driving a culture of compliance and ethical conduct in the bank; the Compliance department assists and challenges the business divisions and works with other infrastructure functions and regulators to establish and maintain a risk-based approach to the management of the bank’s compliance risks in accordance with the bank’s risk appetite and to help the bank detect, mitigate and prevent breaches of laws and regulations; the Compliance department performs the following principal activities: the identification, assessment, mitigation, monitoring and reporting on compliance risk; performs second level controls; the results of these assessments and controls are regularly reported to the Management Board and Supervisory Board. The Compliance department also assists the Regulatory Management team with regulatory engagement
148 |
Deutsche Bank | ||
Annual Report 2022 | ||
- – Financial crime risks are managed by the Anti-Financial Crime (AFC) function via maintenance and development of a dedicated program; the AFC program is based on regulatory and supervisory requirements; AFC has defined roles and responsibilities and established dedicated functions for the identification and management of financial crime risks resulting from money laundering, terrorism financing, compliance with sanctions and embargoes, the facilitation of tax evasion as well as other criminal activities including fraud, bribery and corruption and other crimes; AFC updates its strategy for financial crime prevention via regular development of internal policies processes and controls, institution-specific risk assessment and staff training
- – The Legal department (including Group Governance and Group Data Privacy) is an independent infrastructure function mandated to provide legal advice to the Management Board, the Supervisory Board (to the extent it does not give rise to conflict of interest), business divisions and infrastructure functions, and to support the Management Board in setting up and guarding the Group’s governance and control frameworks in respect of the bank’s legal, internal corporate governance and data privacy risks; this includes in particular, but is not limited to:
- – Advising the Management Board and Supervisory Board on legal aspects of their activities
- – Providing legal advice to all Deutsche Bank units to facilitate adherence to legal and regulatory requirements in relation to their activities respectively, including to support their interactions with regulatory authorities
- – Engaging and managing external lawyers used by Deutsche Bank Group
- – Managing Deutsche Bank Group’s litigation and contentious regulatory matters, (including contentious HR matters), and managing Deutsche Bank Group’s response to external regulatory enforcement investigations
- – Advising on legal aspects of internal investigations
- – Setting the global governance framework for Deutsche Bank Group, facilitating its cross-unit application and assessing its implementation
- – Developing and safeguarding efficient corporate governance structures suitable to support efficient decision-making, to align risk and accountability based on clear and consistent roles and responsibilities
- – Maintaining Deutsche Bank Group’s framework for policies, procedures and framework documents and acting as guardian for Group policies and procedures as well as framework documents
- – Advising on data privacy laws, rules and regulation and maintaining Deutsche Bank Group´s data privacy risk and control framework
- – Ensuring appropriate quality assurance in relation to all of the above
- – NFRM Product Governance oversees Product Lifecycle risk and manages the New Product Approval (NPA) and Systematic Product Review (SPR) cross-risk processes. These processes are central to the control framework designed to manage risks associated with the implementation of new products and services, and changes in products and services during their lifecycles. Applicable bank-wide, the cross-risk processes cover different stages of the product lifecycle with NPA focusing on pre-implementation and Systematic Product Review on post-implementation; pre-implementation, the primary objective of the NPA process is to ensure proper assessment of all risks, both financial and non-financial, in NPA relevant products and services, as well as related processes and infrastructure; post-implementation, the Systematic Product Review process focuses on the periodic review of all products to determine if they are to remain live or need to be modified or withdrawn. In 2022, NFRM Product Governance has continued to develop its Future State operating model, an ongoing multi-year program to improve the risk management of new products. NFRM Product Governance also continues to monitor emerging risks, such as ESG, to ensure their appropriate consideration.
- – NFRM is the Risk Type Controller for a number of operational resilience risks; its mandate includes second line oversight of controls over transaction processing activities, as well as infrastructure risks to prevent technology or process disruption, maintain the confidentiality, integrity and availability of data, records and information security, and ensure business divisions and infrastructure functions have robust plans in place to recover critical business processes and functions in the event of disruption including technical or building outage, or the effects of cyber-attack or natural disaster as well as any physical security or safety risk; NFRM Risk Type Controller also manages the risks arising from the bank’s internal and external vendor engagements via the provision of a comprehensive third party risk management framework
149 |
Deutsche Bank | ||
Annual Report 2022 | ||
Measuring Operational Risks
Deutsche Bank calculates and measures the regulatory and economic capital requirements for operational risk using the AMA methodology. The AMA capital calculation is based upon the loss distribution approach. Gross losses from historical internal and external loss data (Operational Riskdata eXchange Association consortium data) complemented by scenario data are used to estimate the risk profile (i.e., a loss frequency and a loss severity distribution). The loss distribution approach model includes conservatism by recognizing losses on events that arise over multiple years as single events in the historical loss profile.
Within the loss distribution approach model, the frequency and severity distributions are combined in a Monte Carlo simulation to generate potential losses over a one-year time horizon. Finally, the risk mitigating benefits of insurance are applied to each loss generated in the Monte Carlo simulation. Correlation and diversification benefits are applied to the net losses in a manner compatible with regulatory requirements to arrive at a net loss distribution at Group level, covering expected and unexpected losses. Capital is then allocated to each of the business divisions considering qualitative adjustments after deducting expected loss.
The regulatory and economic capital requirements for operational risk is derived from the 99.9% percentile; see the section “Internal Capital Adequacy” for details. Both regulatory and economic capital requirements are calculated for a time horizon of one year.
The regulatory and economic capital demand calculations are performed on a quarterly basis. NFRM establishes and maintains the approach for capital demand quantification and ensures that appropriate development, validation and change governance processes are in place, whereby the validation is performed by an independent validation function and in line with the Group’s model risk management process.
Drivers for operational risk capital development
As of December 31, 2022, operational losses for the Group were €528 million. Losses from “Clients, Products and Business Practices” and “Others” contributed to 80% of operational risk regulatory and economic capital demand.
In view of the relevance of legal risks within the bank’s operational risk profile, specific attention is dedicated to the management and measurement of open civil litigation and regulatory enforcement matters where the bank relies both on information from internal as well as external data sources to consider developments in legal matters that affect the bank specifically but also the banking industry as a whole. Reflecting the multi-year nature of legal proceedings the measurement of these risks furthermore takes into account changing levels of certainty by capturing the risks at various stages throughout the lifecycle of a legal matter.
Conceptually, the bank measures operational risk including legal risk by determining the annual operational risk loss that will not be exceeded with a given probability. This loss amount is driven by a component that due to the IFRS criteria is reflected in the bank’s financial statements and a component beyond the amount reflected as provisions within the bank’s financial statements.
The legal losses which the bank expects with a likelihood of more than 50% are already reflected in the IFRS group financial statements. These losses include net changes in provisions for existing and new cases in a specific period where the loss is deemed probable and is reliably measurable in accordance with IAS 37.
Uncertain legal losses which are not reflected in the bank’s financial statements as provisions because they do not meet the recognition criteria under IAS 37 are considered within “regulatory or economic capital demand”.
To quantify the litigation losses in the AMA model, the bank takes into account historical losses, provisions, contingent liabilities and legal forecasts. Legal forecasts generally comprise ranges of potential losses from legal matters that are not deemed probable but are reasonably possible. Reasonably possible losses may result from ongoing and new legal matters which are reviewed at least quarterly by the attorneys handling the legal matters.
The legal forecasts are included in the “relevant loss data” used in the AMA model. The projection range of the legal forecasts is not restricted to the one year capital time horizon but goes beyond and conservatively assumes early settlement of the underlying losses in the reporting period - thus considering the multi-year nature of legal matters.
150 |
Deutsche Bank | ||
Annual Report 2022 | ||
Liquidity risk management
Liquidity risk arises from DB Group’s potential inability to meet payment obligations when they come due or without incurring excessive costs. The Group’s liquidity risk management framework ensures that all necessary guidance and controls are established within the Group to fulfil its payment obligations at all times (including intraday) and to manage its liquidity and funding risks within the MB approved risk appetite, when executing the strategic plan. The framework considers relevant and significant drivers of liquidity risk, whether on-balance sheet or off-balance sheet.
Liquidity risk management framework
The Group’s liquidity risk management principles are documented in the global Liquidity Risk Management Policy” (LRMP) and the framework is described in the Liquidity Risk Management Framework” document. They adhere to the eight key risk management practices, namely risk governance, risk organization (3 LoD), risk culture, risk appetite and -strategy, risk identification and -assessment, risk mitigation and controls, risk measurement and reporting, stress planning and -execution. All additional policies and procedures (both global and local) issued by the liquidity risk management functions further define the requirements specific to liquidity risk practices. They are subordinate to the LRMP and are subject to the standards the LRMP sets forth. The liquidity managing functions are organized in alignment with the three lines of defense structure, which is described in the Risk Management Policy”. The lines of business and Treasury comprise the 1LoD is responsible for executing the steps needed to manage the bank’s liquidity position. Risk comprises the 2LoD, responsible for providing independent risk oversight, challenge, and validation of activities conducted by the 1LoD including establishing the risk appetite and Group level control standards. Group Audit comprises the 3LoD, responsible for overseeing the activities of both the 1LoD and 2LoD. The individual roles and responsibilities within the liquidity risk management framework are laid out and documented in the global responsibility matrix, which provides further clarity and transparency across all involved stakeholders.
In accordance with the ECB’s SREP (and revised ILAAP requirement issued in November 2018), the Group has implemented an Internal Liquidity Adequacy Assessment Process (ILAAP), which is reviewed at least annually and approved by the MB. Liquidity Risk Management undertakes ongoing oversight on activities conducted within the mandate of Treasury Liquidity Management to most effectively manage the liquidity of the Group and steer business activities, while ensuring the bank’s risk appetite is adhered to. The Internal Liquidity Adequacy Assessment Process provides comprehensive documentation and assessment of the bank’s liquidity risk management framework, which includes the identification of key liquidity and funding risks to which the Group is exposed; describing how these risks are identified, monitored and measured; and describing the techniques and resources used to manage and mitigate these risks.
The MB defines the liquidity and funding risk strategy for the Group as well as the risk appetite, based on recommendations made by the Group Asset and Liability Committee (ALCO) and Group Risk Committee. The MB reviews and approves the risk appetite at least annually. The risk appetite is applied to the Group and its key liquidity entities e.g., DB AG to monitor and control liquidity risk as well as the Group’s long-term funding and issuance plan.
The Group’s liquidity risk appetite, which is defined through qualitative principles and supporting quantitative metrics, is laid out in the Risk Appetite Statement” and is subject to the standards defined in the Risk Appetite Policy”. This Risk Appetite Statement is further underpinned by the liquidity risk controls framework consisting of risk appetite limits, as well as a suite of non-risk appetite limits, thresholds and early warning indicators, which are defined in the Liquidity Risk Controls Policy”.
Deutsche Bank implemented a dedicated stress testing and risk appetite Framework defined by Liquidity Risk Management, which ensures its liquidity position is balanced across the Group, its KLEs and across currencies.
Treasury manages liquidity and funding, in accordance with the MB-approved risk appetite across a range of relevant metrics and implements several tools including business level limits, to ensure compliance. As such, Treasury works closely with Liquidity Risk Management and the business divisions to identify, analyze and monitor underlying liquidity risk characteristics within business portfolios. These parties are engaged in regular dialogue regarding changes in the Group’s liquidity position arising from business activities and market circumstances.
Furthermore, the Group ensures at the level of each liquidity relevant entity that all local liquidity metrics are managed in compliance with the defined risk appetite. Local liquidity surpluses are pooled in DB AG hubs and local liquidity shortfalls can be met through support from DB AG hubs. Transfers of liquidity capacity between entities are subject to the approval framework outlined in the Intercompany Funding Policy” involving the Group’s liquidity steering function as well as the local liquidity managers considering the compliance of metrics like LCR, NSFR (Pillar 1) and sNLP (Pillar 2). Available surplus that resides in entities with restriction to transfer liquidity to other Group entities, for example due to regulatory lending requirements, is treated as trapped and as such not considered in the calculation of the consolidated group liquidity surplus.
151 |
Deutsche Bank | ||
Annual Report 2022 | ||
The MB is informed about the Group’s performance against the key liquidity metrics, including the risk appetite and internal and market indicators, via a weekly liquidity dashboard. Liquidity & Treasury Reporting & Analysis (LTRA) has overall accountability for the accurate and timely production of both external regulatory liquidity reporting (Pillar 1) as well as internal management reporting (Pillar 2) for liquidity risk of the Group. In addition, LTRA is responsible for the development of management information systems and the related analysis to support the liquidity risk framework and its governance for Treasury and LRM.
As part of the annual strategic planning process, Treasury projects the development of the key liquidity and funding metrics including the USD currency exposure based on anticipated business activities to ensure that the strategic plan can be executed in accordance with the Group’s risk appetite.
Deutsche Bank has a wide range of funding sources, including retail and institutional deposits, unsecured and secured wholesale funding, as well as debt issuance in the capital markets. Group ALCo is the Group’s decisive governing body mandated by the MB to optimize the sourcing and deployment of the Group’s balance sheet and financial resources in line with the MB’s risk appetite and strategy. The Group ALCo has the overarching responsibility to define, approve and optimize the Group’s funding strategy.
Deutsche Bank’s Group Contingency Funding Plan outlines, how the Group would respond to an actual or anticipated liquidity stress event. It includes a decisive set of actions that can be taken to raise cash and recover the Group’s key liquidity metrics in times of liquidity stress. The Contingency Funding Plan includes a clear governance structure and well-defined liquidity risk indicators to ensure timely escalation and effective decision-making, communication, and coordination during a liquidity stress event. Deutsche Bank has established the Financial Resource Management Council, which is responsible for oversight of capital and liquidity across contingency, recovery, and resolution scenarios in a defined crisis situation.
Short-term liquidity and wholesale funding
The Group tracks all contractual cash flows from wholesale funding sources on a daily basis, over a twelve-month horizon. For this purpose, the Group considers wholesale funding to include unsecured liabilities largely raised by Treasury Markets Pool, as well as secured liabilities primarily raised by the Investment Bank division. Wholesale funding counterparties typically include corporates, banks and other financial institutions, governments, and sovereigns.
The Group has implemented a set of limits and thresholds to restrict its exposure to wholesale counterparties, which have historically demonstrated the most susceptibility to market stress. Wholesale funding limits are monitored daily and apply to the total outstanding volume of wholesale funding across all currencies, for both secured and unsecured funding with specific tenor limits. Liquidity reserves constitute the primary mitigant against potential stress in the short-term.
The tables in the section Liquidity Risk Exposure: Funding Diversification” show the contractual maturity of the Group’s short-term wholesale funding and capital markets issuance.
Liquidity stress testing and scenario analysis
Global internal liquidity stress testing and scenario analysis is used for measuring liquidity risk and evaluating the Group’s short-term liquidity position within the liquidity framework. This complements the daily operational cash management process. The long-term liquidity strategy based on contractual and behavioral modelled cash flow information is represented by a long-term metric known as the Funding Matrix (refer to Funding Risk Management below).
The global liquidity stress testing process is managed by Treasury in accordance with the MB approved risk appetite. Treasury is responsible for the design of the overall methodology, the choice of liquidity risk drivers and the determination of appropriate assumptions (parameters) to translate input data into stress testing output. Liquidity Risk Management is responsible for the definition of the stress scenarios. Under the principles and policy requirements laid out by Model Risk Management, Liquidity Risk Management and Model Risk Management perform the independent validation of liquidity risk models and non-model estimates. LTRA is responsible for implementing these methodologies and performing the stress test calculation in conjunction with Treasury, Liquidity Risk Management and IT.
Stress testing and scenario analysis are used to describe and evaluate the impact of sudden and severe stress events on the Group’s liquidity position. Deutsche Bank has selected four scenarios to calculate the Group’s stressed Net Liquidity Position (sNLP”). These scenarios are designed to capture potential outcomes which may be experienced by the Group. The most severe scenario assesses the potential consequences of a combined market-wide and idiosyncratic stress event, including downgrades of our credit rating. Under each of the scenarios, the impact of a liquidity stress event over different time horizons and across multiple liquidity risk drivers, covering all business lines and product areas is considered. The output from this scenario analysis feeds the Group Wide Stress Test, which considers the impact of scenarios across all risk stripes.
152 |
Deutsche Bank | ||
Annual Report 2022 | ||
In addition, potential funding requirements from contingent liquidity risks which can arise under stress, including drawdowns on facilities, increased collateral requirements under derivative agreements, and outflows from deposits with a contractual rating linked trigger are included in the analysis. Subsequently, countermeasures, which are the actions the Group would take to counterbalance the outflows incurred during a stress event, are taken into consideration. Those countermeasures include the usage of the Group’s Liquidity Reserve and generating liquidity from other unencumbered, marketable assets without causing any material impact on the Group’s business model.
Stress testing is conducted at a global level and for defined entities relevant for liquidity risk management. The stress analysis covers an eight-week stress horizon which is considered to be the most critical time span during a liquidity crisis requiring that liquidity is actively assessed and steered on a Group level. In addition to the consolidated currency stress test, further stress tests are performed for material currencies (EUR, USD and GBP). On a global level and in the U.S. liquidity stress tests a twelve-months period is covered. Additionally, stress test results are monitored over a twelve-month period with specific risk limits, if required by local regulators. Ad-hoc analysis may be conducted to reflect the impact of potential downside events that could affect the Group such as climate / ESG-related events. Relevant stress assumptions are applied to reflect liquidity flows from risk drivers and on-balance sheet and off-balance sheet products. The suite of stress testing scenarios and assumptions are reviewed on a regular basis and are updated when enhancements are made to stress testing methodologies.
Complementing the daily liquidity stress testing, the Group also conducts regular group-wide stress tests run by Enterprise Risk Management, which analyze liquidity risks in conjunction with the other defined risk types and evaluate their impact and interplay to both capital and liquidity positions as described in Risk and Capital Framework Stress testing.
The tables in the section Liquidity Risk Exposure: Stress Testing and Scenario Analysis” show the results of the internal global liquidity stress test under the various scenarios.
Liquidity Coverage Ratio
In addition to the internal stress test results, the Group implemented a MB-approved risk appetite for its Liquidity Coverage Ratio (LCR). The LCR is intended to promote the short-term resilience of a bank’s liquidity risk profile over a 30-day stress scenario. The ratio is defined as the amount of High-Quality Liquid Assets (HQLA) that could be used to raise liquidity in a stressed scenario, measured against the total volume of net cash outflows, arising from both contractual and modelled exposures over a 30-day time horizon.
The LCR complements the internal stress testing framework. By maintaining a ratio in excess of the minimum regulatory requirements, the LCR seeks to ensure that the Group holds adequate liquidity resources to mitigate a short-term liquidity stress.
Key differences between the internal liquidity stress test and the LCR include the time horizon (eight weeks versus 30 days), the classification and haircut differences between Liquidity Reserves and the LCR HQLA, outflow rates for various categories of funding, as well as inflow assumption for various assets (for example, loan repayments). The Group’s internal liquidity stress test also includes outflows related to intraday liquidity assumptions, which are not explicitly reflected in the LCR.
Funding Risk Management and Funding Diversification
In line with regulatory guidelines, Deutsche Bank has developed a set of internal indicators to measure its inherent funding risks. These are considered for steering purposes in addition to the regulatory metric Net Stable Funding Ratio (NSFR).
The Group’s primary internal tool for monitoring and managing structural funding risk is the Funding Matrix. The Funding Matrix assesses the Group’s structural funding profile over a time horizon beyond one year. To produce the Funding Matrix, all funding-relevant assets and liabilities are mapped into time buckets corresponding to their contractual or modeled maturities. This allows the Group to identify expected excesses and shortfalls in term liabilities over assets in each time bucket, facilitating the management of potential liquidity exposures.
The liquidity profile is based on contractual cash flow information. If the contractual maturity profile of a product does not adequately reflect the liquidity profile, it is replaced by modeling assumptions. Short-term balance sheet items (<1yr) or matched funded structures (asset and liabilities directly matched with no liquidity risk) are excluded from the term analysis.
The bottom-up assessment by individual business line is combined with a top-down reconciliation against the Group’s IFRS balance sheet. From the cumulative term profile of assets and liabilities beyond 1 year, long-funded surpluses or short-funded gaps in the Group’s maturity structure can be identified. The cumulative profile is thereby built up starting from the greater than ten-year” bucket down to the greater than one-year” bucket. The Funding Matrix is also undertaken for material foreign currencies (USD and GBP).
153 |
Deutsche Bank | ||
Annual Report 2022 | ||
The Group relies on a vast range of funding sources. These protect its liquidity position twofold. Firstly, since stress events may impact funding markets differently, maintaining a well-diversified funding portfolio will lower the average impact for the Group. Secondly, when experiencing liquidity stress, having access to a wide range of funding sources significantly improves the Group’s ability to tap different funding markets. The diversification across products is complemented by explicit thresholds for selected, less stable products. Additionally, insufficient counterparty diversification can adversely impact the stability of the Group’s liquidity and funding position, in particular when those funds have a shorter duration. As such, Treasury monitors the development of the Group’s top funding counterparties.
The stability of DB Group’s funding position can be negatively impacted by various forms of industry risks. These are typically medium to long term structural trends with potentially significant long-term impact on the economy and consequently on banks’ balance sheets. DB is performing ad-hoc analyses on such emerging risks to assess the impact of such trends on its funding position to ensure that mitigating measures will be taken well in time when deemed necessary. In addition, Treasury evaluates current market access information in its significant funding markets on a regular basis. Market access information is compiled quarterly and presented to Group ALCo.
To diversify our refinancing activities, Deutsche Bank holds a license to issue mortgage Pfandbriefe and maintains a program to issue structured covered bonds. Additionally, the Group continues to run a program for the purpose of issuing covered bonds under Spanish law (Cedulas). The Group has also participated in ECB’s TLTRO III program. Additionally, the Group expanded its potential investor base through the introduction of its Green Bond framework in 2020. Following the inaugural green issuances in 2020, the Group has continuously expanded its Green Bond issuance activity. Furthermore, multiple green structured notes, first green deposits and first green repurchase agreements (repos) were executed. Various teams within DB continue to work on expanding the Group’s green footprint on the asset as well the liability side.
The chart Liquidity Risk Exposure: Funding Diversification” shows the composition of external funding sources that contribute to the liquidity risk position, both in EUR billion and as a percentage of our total external funding sources.
Net Stable Funding Ratio
The Net Stable Funding Ratio (NSFR) is a regulatory metric for assessing a Bank’s structural funding profile. The NSFR is intended to reduce medium to long-term funding risks by requiring banks to maintain a stable funding profile in relation to their on- and off-balance sheet activities. The ratio is defined as the amount of Available Stable Funding (the portion of capital and liabilities expected to be a stable source of funding), relative to the amount of Required Stable Funding (a function of the liquidity characteristics of various assets held).
A NFSR risk appetite has been set for Group as well as for the entity DB AG to ensure compliance with this regulatory requirement.
Capital Markets Issuance
Debt issuance, encompassing senior unsecured bonds, covered bonds, and capital securities, is a key source of term funding for the Group and is managed directly by Treasury. At least once a year, following endorsement by ALCO, Treasury submits an annual long-term funding plan to the GRC for recommendation and then to MB for approval. This plan is driven by global and local funding and liquidity requirements based on expected business development. The Group’s capital markets issuance portfolio is dynamically managed through annual issuance plans to avoid excessive maturity concentrations.
Funds Transfer Pricing
The funds transfer pricing framework applies to all businesses and regions and promotes pricing of (i) assets in accordance with their underlying liquidity risk, (ii) liabilities in accordance with their liquidity value and (iii) contingent liquidity exposures in accordance with the cost of providing for appropriate Liquidity Reserves.
Within this framework funding and liquidity risk costs and benefits are allocated to the Group’s business units based on rates which reflect the economic costs of liquidity for Deutsche Bank. Treasury might set further financial incentives in line with the Group’s liquidity risk guidelines. While the framework promotes a diligent Group-wide allocation of its funding costs to the liquidity users, it also provides an incentive-based framework for businesses generating stable long-term and stress compliant funding.
Throughout 2022, the Bank continued to deliver against improvements of the changes to the internal FTP framework started in 2019 aimed at enhancing its effectiveness as a management tool, as well as better supporting funding cost optimization. Additional details are included in Note 4 Business segments and related information of the consolidated financial statements.
154 |
Deutsche Bank | ||
Annual Report 2022 | ||
Liquidity Reserves
Liquidity Reserves comprise available cash and cash equivalents, unencumbered highly liquid securities (including government and agency bonds and government guarantees) and other unencumbered central bank eligible assets. Certain intraday requirements and mandatory minimum reserves are directly deducted in the calculation of the Liquidity Reserves while other intraday outflows are represented in the Group’s internal liquidity model.
The vast majority of the Group’s liquidity reserves are held centrally across major currencies at the central bank accounts of the parent entity and foreign branches in the key locations in which we are active and in a dedicated Treasury-owned Strategic Liquidity Reserve (SLR), set up exclusively to serve as a mitigant during periods of stress. To ensure a prudent composition of liquidity reserves across asset classes, minimum cash thresholds for the material currencies are maintained. In-line with our communication to the market, going forward the Bank aims at focusing on its amount of High-quality Liquid Assets, replacing the Liquidity Reserve measure, as it provides greater comparability across the industry.
Asset Encumbrance
Encumbered assets primarily comprise those on- and off-balance sheet assets that are pledged as collateral against secured funding, collateral swaps, and other collateralized obligations. Generally, loans are encumbered to support long-term capital markets secured issuance such as covered bonds or other self-securitization structures, while financing debt and equity inventory on a secured basis is a regular activity for the Investment Bank business. Additionally, in line with the EBA technical standards on regulatory asset encumbrance reporting, assets pledged with settlement systems are considered encumbered assets, including default funds and initial margins, as well as other assets pledged which cannot be freely withdrawn such as mandatory minimum reserves at central banks. Derivative margin receivable assets as encumbered under these EBA guidelines are also included.
Enterprise risk management
Enterprise Risk Management (ERM) is a cross-risk function that drives active portfolio management across all businesses and geographies, including management of risk appetite for industry, country and credit risk. Key responsibilities include:
- – Delivering insight through emerging risks and trends analysis, forward-looking stress tests, portfolio concentration, deep-dive analyses and ad-hoc event reporting.
- – Overseeing the Bank’s internal capital adequacy process, including capital risk appetite.
- – Coordinating and implementing the group recovery plan.
- – Developing and managing the climate risk management framework.
- – Providing risk reporting and analytics to key stakeholders, including senior management and regulators.
- – Acting as risk controlling function for credit risk.
Strategic risk
Strategic risk is the risk of a shortfall in earnings (excluding other material risks) due to incorrect business plans (owing to flawed assumptions), ineffective plan execution or a lack of responsiveness to material plan deviations. Strategic risk arises from the exposure of the bank to the macroeconomic environment, changes in the competitive landscape, and regulatory and technological developments. Additionally, it could occur due to errors in strategic positioning, the bank’s failure to execute its planned strategy and/or a failure to effectively address underperformance versus plan targets.
The strategic plan is developed annually and presented to the Management Board for discussion and approval. The final plan is presented to the Supervisory Board. The plan is challenged in an iterative process with respect to its assumptions, credibility and integrity. During the year, execution of business strategies is regularly monitored to assess the performance against targets. A more comprehensive description of this process is detailed in the section ‘Strategic and Capital Plan’.
Strategic risk is measured through a dedicated risk model that quantifies potential losses caused by unexpected pre-tax earnings shortfalls that cannot be offset by cost reductions under extreme but plausible market conditions over a 12-month period.
The 2nd LoD for strategic risk is the Risk Governance & Strategy function. Finance, together with the divisions, is the 1st LoD and acts as key risk managers of the associated risk.
155 |
Deutsche Bank | ||
Annual Report 2022 | ||
Capital risk
Capital risk is defined as the risk that Deutsche Bank has an insufficient level or composition of capital supply to support its current and planned business activities and associated risks during normal and stressed conditions.
The bank’s capital risk framework consists of several elements which aim to ensure that Deutsche Bank maintains on an ongoing basis an adequate capitalization to cover the risks to which is exposed. The framework is strongly integrated with the bank-wide strategic planning process and closely linked to Deutsche Bank’s internal capital adequacy assessment process (see section “Internal Capital Adequacy Assessment Process” for further details). Treasury together with the divisions is the key risk manager of the associated risks and represents the 1st LoD. ERM acts as the 2nd LoD for capital risk.
Treasury function manages capital risk at group level and locally in each region, as applicable. This includes managing issuances and repurchases of capital instruments (see section on “Capital management” for details). Additionally, divisional limits for key capital resources are approved by the Group Asset and Liability Committee to ensure alignment with the capital risk appetite (see section on “Resource limit setting” for details).
ERM sets the capital risk framework, assesses the capital risk profile and provides independent challenge. This includes setting of risk appetite thresholds for key capital ratios. Threshold breaches are subject to a dedicated governance framework triggering management actions up to the execution of Deutsche Bank’s recovery plan. Thresholds also provide boundaries to the capital plan and are fully integrated into the regular assessment of capital risk under stress scenarios.
Portfolio concentration risk
Risk concentrations refer to clusters of the same or similar risk drivers within specific risk types (intra-risk concentrations in credit, market, operational and strategic risks) as well as across different risk types (inter-risk concentrations). They occur within and across counterparties, businesses, regions/countries, industries and products. The management and monitoring of risk concentrations is achieved through a quantitative and qualitative approach, as follows:
- – Intra-risk concentrations are assessed, monitored and mitigated by the individual risk functions (enterprise, credit, market, operational, liquidity and strategic risk management). This is supported by limit setting on different levels and/or management according to each risk type
- – Inter-risk concentrations are managed through quantitative top-down stress-testing and qualitative bottom-up reviews, identifying and assessing risk themes independent of any risk type and providing a holistic view across the bank. The diversification effects between credit, market, operational and strategic risk are measured through a dedicated risk model that quantifies the diversification benefit caused by non-perfect correlations between these risk types. The calculation of the risk type diversification benefit is intended to ensure that the standalone economic capital figures for the individual risk types are aggregated in an economically meaningful way
The most senior governance body for the oversight of risk concentrations throughout 2022 was the Group Risk Committee (GRC).
Environmental, social and governance risk
The impacts of rising global temperatures, the enhanced focus on climate change and the transition to a net-zero economy from society, regulators and the banking sector have led to the emergence of new and increasing sources of financial and non-financial risks. These include the physical risks arising from extreme weather events, which are growing in frequency and severity, as well as transition risks as carbon intensive sectors are faced with higher taxation, reduced demand and potentially restricted access to financing. These risks can impact Deutsche Bank across a broad range of financial and non-financial risk types.
Financial institutions are facing increased scrutiny on climate and broader ESG-related issues from governments, regulators, shareholders and other bodies, leading to reputational risks if the Group is not seen to support the transition to a lower carbon economy, to protect biodiversity and human rights. Deutsche Bank is reviewing and enhancing its ESG risk management frameworks in alignment with regulatory guidance and to ensure that we actively manage ESG risks and prevent greenwashing. There is a lack of consistent and comprehensive ESG data and methodologies available today which means that the bank is heavily reliant on proxy estimates and qualitative approaches when assessing these risks and introduce a high degree of uncertainty into climate-related disclosures.
Deutsche Bank is committed to managing business activities and operations in a sustainable manner, including aligning its portfolios with net zero emissions by 2050. In October 2022 Deutsche Bank announced net zero aligned interim (2030) and final (2050) targets for four key carbon intensive sectors: Oil and Gas (upstream), Power Generation, Automotives (light duty vehicles) and Steel. Targets are fully embedded into internal risk management frameworks and processes.
156 |
Deutsche Bank | ||
Annual Report 2022 | ||
Deutsche Bank’s Group Sustainability Committee, which is chaired by the Chief Executive Officer, decides on all important sustainability initiatives. In 2022 the bank appointed its first Chief Sustainability Officer and established a Sustainability Steering Committee responsible for ESG transformation management and oversight. The Group Risk Committee, chaired by the Chief Risk Officer, is established by the Management Board to serve as the central forum for review and decision making on matters related to risk, capital, and liquidity. This includes the responsibility for developing the bank’s Climate and broader ESG Risk Frameworks. A dedicated ESG Risk Forum oversees the integration of ESG risks into the bank’s existing financial and non-financial risk management frameworks.
Deutsche Bank’s business activities are governed by a dedicated Climate and Environmental Risk Policy outlining roles, responsibilities as well as qualitative risk appetite principles and quantitative risk-appetite thresholds and KPIs. In addition, the bank’s Environmental and Social policy outlines specific restrictions for certain sectors. Deutsche Bank uses a number of complementary tools to identify and assess risks including the Group’s risk identification process, an internal climate risk taxonomy and regular internal reporting of portfolio financed emissions and intensities and progress against net zero targets.
Model Risk Management
Introduction
Model risk is the potential for adverse consequences from decisions based on incorrect or misused model (and non-model estimate) outputs. Model risk can lead to financial loss, poor business or strategic decision making, or damage to its reputation. Deutsche Bank recognizes the use of models and non-model estimates (collectively known as ‘estimation approaches’) can affect other risk-types, and that model risk is a distinct risk that can increase or decrease aggregate risk across other risk-types.
Deutsche Bank uses estimation approaches for a broad range of decision-making activities, such as: underwriting credits; valuing exposures, instruments, and positions; measuring risk; managing and safeguarding client assets and determining capital and reserve adequacy. The term ‘estimation approach’ refers to a ‘model’ or ‘non-model estimate’ that is a quantitative or qualitative method, system, or approach that applies expert judgement, statistical, economic, financial, or mathematical theories, techniques, and assumptions to process input data into quantitative estimates. Estimation approaches are simplified representations of real-world relationships and are based on assumptions and judgment. Accordingly, the bank is exposed to model risk, which must be identified, measured, and controlled appropriately.
Model risk management oversight is provided by all levels of management, including the Management Board. Management of model risk is underpinned by a framework designed and monitored by 2nd Line of Defence.
Model Risk Management Framework and Governance
Model risk is one of the bank’s level 1 risks, and is overseen by the Chief Risk Officer through the setting of a quantitative and qualitative risk appetite statement, and managed through:
- – The model risk policy and procedure, and supporting documents aligned to risk appetite, regulatory requirements, and industry best practice, with clear roles and responsibilities for stakeholders
- – Inventorization of all sources of model risk, supporting ongoing model risk framework components including risk assessments and attestations
- – Key controls for all sources of model risk from development through to decommissioning, including validation, approval, deployment and monitoring
- – Independent Validations, and subsequent 2LoD approvals, verify that models and non-model estimates have been appropriately designed and implemented for their intended scope and purpose, and that respective controls are in place to assure that they continue to perform as expected during their use
- – The controls identify limitations and weaknesses, resulting in findings and compensating controls, these may be conditions for use, such as adjustments or overlays and
- – Model risk governance, including senior forums for monitoring and escalation of model risk related topics, as well as monthly updates to the Management Board on the model risk appetite metrics, and periodic model risk updates to the Supervisory Board.
157 |
Deutsche Bank | ||
Annual Report 2022 | ||
Developments during the reporting period:
In 2022, Deutsche Bank implemented a new model risk management policy covering all aspects of the model risk framework and aligning practices across the bank, including identification, measurement, monitoring, reporting, controls, and mitigation of model risks.
This new framework is supported by the development of an enhanced Model Inventory System which will be the sole strategic bank-wide model risk platform, replacing all other current inventories. The system continues to be enhanced to ensure effective and efficient management of model risk across the bank.
Reputational Risk Management
Within the group’s risk management process, reputational risk is defined as the risk of possible damage to Deutsche Bank’s brand and reputation, and the associated risk to earnings, capital or liquidity arising from any association, action or inaction which could be perceived by stakeholders to be inappropriate, unethical or inconsistent with the Deutsche Bank’s values and beliefs.
Deutsche Bank has limited appetite for transactions or relationships with material reputational risk or in areas which inherently pose a higher reputational risk such as the defence, gaming, or adult entertainment sectors, or where there are certain environmental concerns. Reputational risk cannot be precluded as it can be driven by unforeseeable changes in perception of its practices by its various stakeholders (e.g. public, clients, shareholders and regulators). Deutsche Bank strives to promote sustainable standards that will enhance profitability and minimize reputational risk.
The Reputational Risk Framework (the Framework) is in place to manage the process through which active decisions are taken on matters which may pose a reputational risk, before the event, and in doing so to prevent damage to Deutsche Bank’s reputation wherever possible. The Framework provides consistent standards for the identification, assessment and management of reputational risk issues. Reputational impacts which may arise as a consequence of a failure from another risk type, control or process are addressed separately via the associated risk type framework and are therefore not addressed in this section.
The reputational risk could arise from multiple sources including, but not limited to, potential issues with the profile of the counterparty, the business purpose / economic substance of the transaction or product, high risk industries, environmental and social considerations, and the nature of the transaction or product or its structure and terms.
The modelling and quantitative measurement of reputational risk internal capital is implicitly covered in the bank’s economic capital framework primarily within strategic risk.
Governance and Organizational Structure
The Framework is applicable across all Business Divisions and Regions. DWS-specific matters are reviewed by a DWS-dedicated reputational risk committee and escalated to the DWS Executive Board where required.
Whilst every employee has a responsibility to protect the bank’s reputation, the primary responsibility for the identification, assessment, management, monitoring and, if necessary, referring or reporting of reputational risk matters lies with Deutsche Bank’s Business Divisions as the primary risk owners. Each Business Division has an established process through which matters, which are deemed to be a moderate or greater reputational risk are assessed, the Unit Reputational Risk Assessment Process.
The Unit RRAP is required to refer any material reputational risk matters to the respective Regional Reputational Risk Committee. The Framework also sets out a number of matters which are considered inherently higher risk from a reputational risk perspective and are therefore mandatory referrals to the Regional Reputational Risk Committees. The Regional Reputational Risk Committees, which are 2nd LoD Committees, are responsible for ensuring the oversight, governance and coordination of the management of reputational risk in the respective region of Deutsche Bank. The Regional Reputational Risk Committees meet, as a minimum, on a quarterly basis with ad hoc meetings as required. The Group Reputational Risk Committee (GRRC) is responsible for ensuring the oversight, governance and coordination of the management of reputational risk at Deutsche Bank on behalf of the Group Risk Committee and the Management Board. Additionally, the Group Reputational Risk Committee reviews cases with a Group wide impact and in exceptional circumstances, those that could not be resolved at a regional level.
158 |
Deutsche Bank | ||
Annual Report 2022 | ||
Risk and capital performance
Capital, Leverage Ratio, TLAC and MREL
Own Funds
The calculation of Deutsche Bank’s own funds incorporates the capital requirements following the “Regulation (EU) No 575/2013 on prudential requirements for credit institutions” CRR and the “Directive 2013/36/EU on access to the activity of credit institutions and the prudential supervision of credit institutions” “CRD”, which have been further amended with subsequent Regulations and Directives. The CRD has been implemented into German law. The information in this section as well as in the section “Development of risk-weighted assets” is based on the regulatory principles of consolidation.
This section refers to the capital adequacy of the group of entities consolidated for banking regulatory purposes pursuant to the CRR and the German Banking Act (“Kreditwesengesetz” or “KWG”). Therein not included are insurance companies or companies outside the finance sector.
The total own funds pursuant to the effective regulations as of year-end 2022 comprises Tier 1 and Tier 2 capital. Tier 1 capital is subdivided into Common Equity Tier 1 capital and Additional Tier 1 capital.
CET 1 capital consists primarily of common share capital (reduced by own holdings) including related share premium accounts, retained earnings (including losses for the financial year, if any) and accumulated other comprehensive income, subject to regulatory adjustments (i.e., prudential filters and deductions), as well as minority interests qualifying for inclusion in consolidated CET 1 capital. Prudential filters for CET 1 capital, according to Articles 32 to 35 CRR, include (i) securitization gains on sale, (ii) cash flow hedges and changes in the value of own liabilities, and (iii) additional value adjustments. CET 1 capital deductions for instance includes (i) intangible assets (exceeding their prudential value), (ii) deferred tax assets that rely on future profitability, (iii) negative amounts resulting from the calculation of expected loss amounts, (iv) net defined benefit pension fund assets, (v) reciprocal cross holdings in the capital of financial sector entities and, (vi) significant and non-significant investments in the capital (CET 1, AT1, Tier 2) of financial sector entities above certain thresholds. All items not deducted (i.e., amounts below the threshold) are subject to risk-weighting.
Additional Tier 1 capital consists of AT1 capital instruments and related share premium accounts as well as noncontrolling interests qualifying for inclusion in consolidated AT1 capital. To qualify as AT1 capital under CRR/CRD, instruments must have principal loss absorption through a conversion to common shares or a write-down mechanism allocating losses at a trigger point and must also meet further requirements (perpetual with no incentive to redeem; institution must have full dividend/coupon discretion at all times, etc.).
Tier 2 capital comprises eligible capital instruments, the related share premium accounts and subordinated long-term debt, certain loan loss provisions and noncontrolling interests that qualify for inclusion in consolidated Tier 2 capital. To qualify as Tier 2 capital, capital instruments or subordinated debt must have an original maturity of at least five years. Moreover, eligible capital instruments may inter alia not contain an incentive to redeem, a right of investors to accelerate repayment, or a credit sensitive dividend feature.
In the comparison period of this report Deutsche Bank presents certain figures based on the CRR definition of own fund instruments applicable for Additional Tier 1 and Tier 2 instruments.
Starting with the first quarter of 2022, CET 1, Tier 1 Capital and Total Capital is presented as reported. The fully loaded definition has been discontinued in the first quarter 2022 due to immaterial differences.
159 |
Deutsche Bank | ||
Annual Report 2022 | ||
Capital instruments
The Management Board received approval from the 2021 Annual General Meeting to buy back up to 206.7 million shares before the end of April 2026. Thereof 103.3 million shares can be purchased by using derivatives, this includes 41.3 million derivatives with a maturity exceeding 18 months. During the period from the 2021 Annual General Meeting until the 2022 Annual General Meeting (May 19, 2022), 59.8 million shares were purchased. A total amount of 33.3 million shares was purchased for equity compensation purposes in the same period or upcoming periods. The remaining amount of 26.5 million shares was bought back for cancellation with the purpose of distributing capital to shareholders. In addition, 48.8 million call options were purchased for equity compensation purposes in upcoming periods. The number of shares held in Treasury from buybacks amounted to 34.8 million as of the 2022 Annual General Meeting, thereof 26.5 million shares for cancellation and 8.3 million shares for equity compensation purposes.
The 2022 Annual General Meeting granted the Management Board the approval to buy back up to 206.7 million shares before the end of April 2027. Thereof 103.3 million shares can be purchased by using derivatives, this includes 41.3 million derivatives with a maturity exceeding 18 months. These authorizations substitute the authorizations of the previous year. During the period from the 2022 Annual General Meeting until December 31, 2022, no shares or call options were purchased. The number of shares held in Treasury from buybacks amounted to 28.9 million as of December 31, 2022. Thereof 26.5 million relate to shares bought back for cancellation. The remaining amount of 2.4 million relates to shares to be used for equity compensation purposes in upcoming periods.
Since the 2017 Annual General Meeting, renewed at the 2021 Annual General Meeting, and as of December 31, 2022, authorized capital available to the Management Board is € 2,560 million (1,000 million shares). On 30 April 2022, the conditional capital against cash of € 512 million (200 million shares) and for equity compensation of € 51.2 million (20 million shares) expired unused.
Further, the 2022 Annual General Meeting authorized the issuance of participatory notes and other hybrid debt securities that fulfill the regulatory requirements to qualify as Additional Tier 1 capital with an equivalent value of € 9.0 billion on or before April 30, 2027.
Transitional agreements for AT1 and Tier 2 instruments were applicable until 1 January 2022. Capital instruments issued on or prior to December 31, 2011, that no longer qualify as AT1 or Tier 2 capital under the fully loaded CRR/CRD as currently applicable were subject to grandfathering rules during the transitional period and were phased out from 2013 to 2022 with their recognition capped at 20% in 2020 and 10% in 2021 (in relation to the portfolio eligible for grandfathering which was outstanding on December 31, 2012). The grandfathering no longer applies as of January 1, 2022.
The current CRR as applicable since June 27, 2019, provides further grandfathering rules for AT1 and Tier 2 instruments issued prior to June 27, 2019. AT1 and Tier 2 instruments issued through special purpose entities were grandfathered until December 31, 2021. In 2022, transitional arrangements only exist for AT1 and Tier 2 instruments which continue to qualify until June 26, 2025, even if they do not meet certain new requirements that apply since June 27, 2019. Deutsche Bank had an immaterial amount of instruments that qualified during 2022, which resulted in there being no material difference between the “fully loaded” and “transitional” amounts.
Based on the current CRR, the Group has eligible AT1 instruments of € 8.6 billion outstanding as of December 2022. In 2022, the bank issued AT1 notes amounting to € 2.0 billion and redeemed AT1 instruments with a notional of € 1.75 billion.
As of December 31, 2022, Tier 2 capital instruments amounted to € 9.5 billion (nominal value of € 11.7 billion). In 2022, the bank issued Tier 2 capital instruments with a nominal value of € 1.5 billion and U.S. $ 1.25 billion (equivalent amount of € 1.2 billion) and a notional of € 15 million Tier 2 capital instruments matured.
Minimum capital requirements and additional capital buffers
The Pillar 1 CET 1 minimum capital requirement applicable to the Group is 4.50% of RWA. The Pillar 1 total capital requirement of 8.00% demands further resources that may be met with up to 1.50% Additional Tier 1 capital and up to 2.00% Tier 2 capital.
Failure to meet minimum capital requirements can result in supervisory measures such as restrictions of profit distributions or limitations on certain businesses such as lending. Deutsche Bank complied with the minimum regulatory capital adequacy requirements in 2022.
In addition to these minimum capital requirements, the following combined capital buffer requirements were fully effective beginning 2022 onwards. These buffer requirements must be met in addition to the Pillar 1 minimum capital requirements but can be drawn down in times of economic stress.
160 |
Deutsche Bank | ||
Annual Report 2022 | ||
The capital conservation buffer is implemented in Section 10c German Banking Act, based on Article 129 CRD and equals a requirement of 2.50% CET 1 capital of RWA in 2022 and onwards.
The countercyclical capital buffer is deployed in a jurisdiction when excess credit growth is associated with an increase in system-wide risk. It may vary between 0% and 2.50% CET 1 capital of RWA. In exceptional cases, it could also be higher than 2.50%. The institution-specific countercyclical buffer that applies to Deutsche Bank is the weighted average of the countercyclical capital buffers that apply in the jurisdictions where our relevant credit exposures are located. As per December 31, 2022, the institution-specific countercyclical capital buffer was at 0.07%.
In addition to the aforementioned buffers, national authorities, such as the BaFin, may require a systemic risk buffer to prevent and mitigate long-term non-cyclical systemic or macro-prudential risks that are not covered by the CRR. They can require an additional buffer of up to 5.00% CET 1 capital of RWA. As of the year end 2022, no systemic risk buffer applied to Deutsche Bank.
Deutsche Bank continues to be designated as a global systemically important institution (G-SII) by the BaFin in agreement with the Deutsche Bundesbank, resulting in a G-SII buffer requirement of 1.50% CET 1 capital of RWA in 2022 based on the indicators as published in 2019. This assessment has been confirmed by the FSB in 2022. Further, BaFin has announced that the G-SII buffer requirement for Deutsche Bank will remain unchanged for the years 2023 and 2024. Deutsche Bank continues to publish the indicators on the bank’s website.
Additionally, Deutsche Bank has been classified by BaFin in agreement with the Deutsche Bundesbank as an “other systemically important institution” (O-SII) with an additional capital buffer requirement of 2.00% in 2022 that has to be met on a consolidated level. Hence, for Deutsche Bank, the O-SII buffer amounts to 2.00% in 2022. BaFin has announced O-SII buffer requirement for Deutsche bank remain unchanged for the year 2023.The higher of the buffers for systemically important institutions (G-SII buffer or O-SII buffer) must be applied.
In addition, pursuant to the Pillar 2 SREP, the ECB may impose capital requirements on individual banks which are more stringent than statutory requirements (so-called Pillar 2 requirement).
In February 2022, the ECB informed the Deutsche Bank of its decision effective 1 March 2022 that the bank’s Pillar 2 requirement remains unchanged compared to 2021. This result in ECB’s Pillar 2 requirement to 2.50% of RWA. As of December 31, 2022, Deutsche Bank needs to maintain on a consolidated basis a CET 1 ratio of at least 10.48%, a Tier 1 ratio of at least 12.45% and a Total Capital ratio of at least 15.07%. The CET 1 requirement comprises the Pillar 1 minimum capital requirement of 4.50%, the Pillar 2 requirement (SREP add-on) of 1.41%, the capital conservation buffer of 2.50%, the countercyclical buffer (subject to changes throughout the year) of 0.07% and the higher of our G-SII/O-SII buffer of 2.00%. Correspondingly, the Tier 1 capital requirement includes additionally a Tier 1 minimum capital requirement of 1.50% plus a Pillar 2 requirement of 0.47%, and the Total Capital requirement includes further a Tier 2 minimum capital requirement of 2.00% and a Pillar 2 requirement of 0.63%. Also, the ECB communicated to Deutsche Bank that its individual expectation to hold a further Pillar 2 CET 1 capital add-on, commonly referred to as ‘Pillar 2 guidance’ will be seen as guidance only and until at least year-end 2022, a breach of this guidance will not trigger the need to provide a capital restoration plan or a need to execute measures to re-build CET 1 capital.
On December 22, 2022, Deutsche Bank was informed by the ECB of its decision regarding prudential minimum capital requirements for 2023 that applied from January 1, 2023 onwards, following the results of the 2022 SREP. The decision set ECB’s Pillar 2 requirement to 2.70% of RWA, effective as of January 1, 2023, of which at least 1.52% must be covered by CET 1 capital and 2.03% by Tier 1 capital.
In January 2022, the BaFin announced a countercyclical buffer of 0.75% for Germany effective February 1, 2023, which translates into approximately 30bps CET 1 capital requirement for Deutsche Bank Group given the current share of German credit exposures. Additionally, the BaFin announced a sectoral systemic risk buffer of 2% for German residential real estate exposures effective February 1, 2023, which translates into approximately 20bps CET 1 capital requirement for Deutsche Bank Group considering our current German residential real estate exposure.
161 |
Deutsche Bank | ||
Annual Report 2022 | ||
The following table gives an overview of the different Pillar 1 and Pillar 2 minimum capital requirements (but excluding the Pillar 2 guidance) as well as capital buffer requirements applicable to Deutsche Bank for years 2022 and 2023.
Overview total capital requirements and capital buffers
2022 | 2023 | |||
Pillar 1 | ||||
Minimum CET 1 requirement | 4.50% | 4.50% | ||
Combined buffer requirement | 4.57% | 5.07% | ||
Capital Conservation Buffer | 2.50% | 2.50% | ||
Countercyclical Buffer¹ | 0.07% | 0.37% | ||
Systemic Risk Buffer² | 0.00% | 0.20% | ||
Maximum of: | 2.00% | 2.00% | ||
G-SII Buffer | 1.50% | 1.50% | ||
O-SII Buffer | 2.00% | 2.00% | ||
Pillar 2 | ||||
Pillar 2 SREP Add-on of CET 1 capital (excluding the "Pillar 2" guidance) | 2.50% | 2.70% | ||
of which covered by CET 1 capital | 1.41% | 1.52% | ||
of which covered by Tier 1 capital | 1.88% | 2.03% | ||
of which covered by Tier 2 capital | 0.63% | 0.68% | ||
Total CET 1 requirement from Pillar 1 and 2³ | 10.48% | 11.09% | ||
Total Tier 1 requirement from Pillar 1 and 2 | 12.45% | 13.10% | ||
Total capital requirement from Pillar 1 and 2 | 15.07% | 15.77% | ||
1Deutsche Bank’s countercyclical buffer requirement is subject to country-specific buffer rates decreed by EBA and the Basel Committee of Banking Supervision (BCBS) as well as Deutsche Bank’s relevant credit exposures as per respective reporting date; the countercyclical buffer rate for 2023 has been calculated to be 0.37% based on known countercyclical buffer changes in 2023. The countercyclical buffer is subject to changes throughout the year depending on its constituents
2The systemic risk buffer has been calculated at 0.20% for the projected year 2023, subject to changes based on further directives
3 The total Pillar 1 and Pillar 2 CET 1 requirement (excluding the “Pillar 2” guidance) is calculated as the sum of the SREP requirement, the systemic risk buffer requirement, the capital conservation buffer requirement and countercyclical buffer requirement as well as the higher of the G-SII, O-SII
Development of Own Funds
Deutsche Bank’s Total Regulatory capital as of December 31, 2022, amounted to € 66.1 billion compared to € 62.7 billion at the end of December 31, 2021. Tier 1 capital as of December 31, 2022, amounted to € 56.6 billion, consisting of CET 1 capital of € 48.1 billion and AT1 capital of € 8.5 billion. The Tier 1 capital was € 1.2 billion higher than at the end of December 31, 2021, driven by an increase in CET 1 capital of € 1.6 billion and decrease in AT1 capital of € 0.4 billion since year end 2021. Tier 2 Capital as of December 31,2022 amounted to € 9.5 billion compared to € 7.4 billion at the end of December 31, 2021.
The CET 1 capital increase of € 1.6 billion was largely the result of the positive net profit of € 5.5 billion for the year ended December 31, 2022, which includes a positive year end deferred tax valuation adjustment of € 1.4 billion. This was partially offset by regulatory deductions for future common share dividend and AT1 coupon payments of € 1.3 billion which is in line with the ECB Decision (EU) (2015/656) on the recognition of interim or year-end profits in CET 1 capital in accordance with the Article 26(2) of Regulation (EU) No 575/2013 (ECB/2015/4). In addition, CET 1 capital increased as a result of positive effects from currency translation adjustments of € 0.8 billion net of foreign exchange counter-effects of capital deduction items of € 0.2 billion and actuarial gains of € 0.6 billion due to mark-to-market movements.
These positive impacts were partially offset by deductions from deferred tax assets of € 1.8 billion which include a positive deferred tax asset valuation adjustment of € 1.4 billion in the US, as well as unrealized losses from financial instruments at fair value through other comprehensive income of € 1.3 billion (€ 0.8 billion driven mainly by rising EUR and USD interest rates and € 0.5 billion driven by fair value loss on cash flow hedges as USD rates went up), share buyback of € 0.3 billion, increased regulatory adjustments from prudential filters of € 0.2 billion (additional value adjustments) predominantly from market price dispersions and risk profile changes and pension plans of € 0.2 billion mainly due to rising discount rates.
The AT1 capital decrease of € 0.4 billion was mainly due to the redemption of an AT1 capital instrument with a notional amount of € 1.75 billion during the first quarter of 2022 and € 0.6 billion grandfathered AT1 instruments not eligible from January 1, 2022, partially offset by a newly issued AT1 capital instrument with a notional amount of € 0.75 billion in the second quarter of 2022 and another AT1 capital instrument with a notional amount of € 1.25 billion in the fourth quarter.
The Tier 2 capital increase of € 2.2 billion was mainly due to the issue of new Tier 2 capital instruments with a notional amount of € 2.7 billion in the first quarter of 2022 and € 0.3 billion due to foreign exchange effects partially offset by amortization of € 0.8 billion Tier 2 capital instruments.
162 |
Deutsche Bank | ||
Annual Report 2022 | ||
Own Funds Template (including RWA and capital ratios)
Dec 31, 2022 ³ | Dec 31, 2021 | |||||
in € m. | CRR/CRD | CRR/CRD | CRR/CRD | |||
Common Equity Tier 1 (CET 1) capital: instruments and reserves | ||||||
Capital instruments, related share premium accounts and other reserves | 45,458 | 45,864 | 45,864 | |||
Retained earnings | 12,305 | 10,506 | 10,506 | |||
Accumulated other comprehensive income (loss), net of tax | (1,314) | (444) | (444) | |||
Independently reviewed interim profits net of any foreseeable charge or dividend1 | 4,183 | 1,379 | 1,379 | |||
Other | 1,002 | 910 | 910 | |||
Common Equity Tier 1 (CET 1) capital before regulatory adjustments | 61,634 | 58,215 | 58,215 | |||
Common Equity Tier 1 (CET 1) capital: regulatory adjustments | ||||||
Additional value adjustments (negative amount) | (2,026) | (1,812) | (1,812) | |||
Other prudential filters (other than additional value adjustments) | 600 | (14) | (14) | |||
Goodwill and other intangible assets (net of related tax liabilities) (negative amount) | (5,024) | (4,897) | (4,897) | |||
Deferred tax assets that rely on future profitability excluding those arising from | (3,244) | (1,466) | (1,466) | |||
Negative amounts resulting from the calculation of expected loss amounts | (466) | (573) | (573) | |||
Defined benefit pension fund assets (net of related tax liabilities) (negative amount) | (1,149) | (991) | (991) | |||
Direct, indirect and synthetic holdings by an institution of own CET 1 instruments (negative amount) | (0) | 0 | 0 | |||
Direct, indirect and synthetic holdings by the institution of the CET 1 instruments of financial sector entities where the institution has a significant investment in those entities (amount above the 10% / 15% thresholds and net of eligible short positions) (negative amount) | 0 | 0 | 0 | |||
Deferred tax assets arising from temporary differences (net of related tax liabilities where the conditions in Art. 38 (3) CRR are met) (amount above the 10% / 15% thresholds) (negative amount) | 0 | (151) | (151) | |||
Other regulatory adjustments2 | (2,225) | (1,805) | (1,805) | |||
Total regulatory adjustments to Common Equity Tier 1 (CET 1) capital | (13,536) | (11,709) | (11,709) | |||
Common Equity Tier 1 (CET 1) capital | 48,097 | 46,506 | 46,506 | |||
Additional Tier 1 (AT1) capital: instruments | ||||||
Capital instruments and the related share premium accounts | 8,578 | 8,328 | 8,328 | |||
Amount of qualifying items referred to in Art. 484 (4) CRR and the related share | 0 | N/M | 600 | |||
Additional Tier 1 (AT1) capital before regulatory adjustments | 8,578 | 8,328 | 8,928 | |||
Additional Tier 1 (AT1) capital: regulatory adjustments | ||||||
Direct, indirect and synthetic holdings by an institution of own AT1 instruments | (60) | (60) | (60) | |||
Residual amounts deducted from AT1 capital with regard to deduction from CET 1 capital during the transitional period pursuant to Art. 472 CRR | ||||||
Other regulatory adjustments | 0 | 0 | 0 | |||
Total regulatory adjustments to Additional Tier 1 (AT1) capital | (60) | (60) | (60) | |||
Additional Tier 1 (AT1) capital | 8,518 | 8,268 | 8,868 | |||
Tier 1 capital (T1 = CET 1 + AT1) | 56,616 | 54,775 | 55,375 | |||
Tier 2 (T2) capital | 9,531 | 7,328 | 7,358 | |||
Total capital (TC = T1 + T2) | 66,146 | 62,102 | 62,732 | |||
Total risk-weighted assets | 360,003 | 351,629 | 351,629 | |||
| ||||||
Common Equity Tier 1 capital ratio (as a percentage of risk-weighted assets) | 13.4 | 13.2 | 13.2 | |||
Tier 1 capital ratio (as a percentage of risk-weighted assets) | 15.7 | 15.6 | 15.7 | |||
Total capital ratio (as a percentage of risk-weighted assets) | 18.4 | 17.7 | 17.8 | |||
N/M – Not meaningful
1Full year profit is recognized as per ECB Decision (EU) 2015/656 in accordance with the Article 26(2) of Regulation (EU) No 575/2013 (ECB/2015/4)
2 Includes capital deductions of € 1.2 billion (Dec 2021: € 1.1 billion) based on ECB guidance on irrevocable payment commitments related to the Single Resolution Fund and the Deposit Guarantee Scheme, € 1.0 billion (Dec 2021: € 0.7 billion) based on ECB's supervisory recommendation for a prudential provisioning of non-performing exposures, € 7.4 million (Dec 2021: € 17 million) resulting from minimum value commitments as per Article 36 (1)(n) of the CRR and CET 1 decrease of € 14.7 million (Dec 2021: € 39 million) from IFRS 9 transitional provision as per Article 473a of the CRR
3Starting with the first quarter of 2022, information is presented as reported as the fully loaded definition has been eliminated as resulting only in an immaterial difference; comparative information for earlier periods is unchanged and based on Deutsche Bank’s earlier fully loaded definition
4Numbers may not add up due to rounding
163 |
Deutsche Bank | ||
Annual Report 2022 | ||
Reconciliation of shareholders’ equity to Own Funds
CRR/CRD | ||||
in € m. | Dec 31, 2022 | Dec 31, 2021 | ||
Total shareholders’ equity per accounting balance sheet | 61,959 | 58,027 | ||
Deconsolidation/Consolidation of entities | 29 | 265 | ||
Of which: | ||||
Additional paid-in capital | 0 | 0 | ||
Retained earnings | 29 | 265 | ||
Accumulated other comprehensive income (loss), net of tax | 0 | 0 | ||
Total shareholders' equity per regulatory balance sheet | 61,988 | 58,292 | ||
Minority Interests (amount allowed in consolidated CET 1) | 1,002 | 910 | ||
AT1 coupon and shareholder dividend deduction1 | (1,342) | (987) | ||
Capital instruments not eligible under CET 1 as per CRR 28(1) | (14) | 0 | ||
Common Equity Tier 1 (CET 1) capital before regulatory adjustments | 61,634 | 58,215 | ||
Additional value adjustments | (2,026) | (1,812) | ||
Other prudential filters (other than additional value adjustments) | 600 | (14) | ||
Goodwill and other intangible assets (net of related tax liabilities) (negative amount) | (5,024) | (4,897) | ||
Deferred tax assets that rely on future profitability | (3,244) | (1,617) | ||
Defined benefit pension fund assets (net of related tax liabilities) (negative amount) | (1,149) | (991) | ||
Direct, indirect and synthetic holdings by the institution of the CET 1 instruments of financial sector entities | 0 | 0 | ||
Other regulatory adjustments2 | (2,691) | (2,378) | ||
Common Equity Tier 1 capital³ | 48,097 | 46,506 | ||
1Full year profit is recognized as per ECB Decision (EU) 2015/656 in accordance with the Article 26(2) of Regulation (EU) No 575/2013 (ECB/2015/4)
2Includes capital deductions of € 1.2 billion (Dec 2021: € 1.1 billion) based on ECB guidance on irrevocable payment commitments related to the Single Resolution Fund and the Deposit Guarantee Scheme, € 1.0 billion (Dec 2021: € 0.7 billion) based on ECB's supervisory recommendation for a prudential provisioning of non-performing exposures, € 7.4 million (Dec 2021: € 17 million) resulting from minimum value commitments as per Article 36 (1)(n) of the CRR and CET 1 decrease of € 14.7 million (Dec 2021: € 39 million) from IFRS 9 transitional provision as per Article 473a of the CRR
3Numbers may not add up due to rounding
Development of Own Funds
CRR/CRD | ||||
in € m. | twelve months | twelve months | ||
Common Equity Tier 1 (CET 1) capital - opening amount | 46,506 | 44,885 | ||
Common shares, net effect | (2) | 0 | ||
Additional paid-in capital | (79) | (26) | ||
Retained earnings | 5,945 | 2,834 | ||
Common shares in treasury, net effect/(+) sales (–) purchase | (325) | 1 | ||
Movements in accumulated other comprehensive income | (870) | 675 | ||
AT1 coupon and shareholder dividend deduction ¹ | (1,342) | (987) | ||
Additional value adjustments | (215) | (381) | ||
Goodwill and other intangible assets (net of related tax liabilities) (negative amount) | (127) | (262) | ||
Deferred tax assets that rely on future profitability (excluding those arising from temporary differences) | (1,779) | (113) | ||
Negative amounts resulting from the calculation of expected loss amounts | 107 | (474) | ||
Defined benefit pension fund assets (net of related tax liabilities) (negative amount) | (158) | (219) | ||
Direct, indirect and synthetic holdings by the institution of the CET 1 instruments of financial sector entities | 0 | 0 | ||
Deferred tax assets arising from temporary differences (amount above 10% and 15% threshold, | 151 | (77) | ||
Other, including regulatory adjustments | 285 | 650 | ||
Common Equity Tier 1 (CET 1) capital - closing amount | 48,097 | 46,506 | ||
Additional Tier 1 (AT1) Capital – opening amount | 8,868 | 6,848 | ||
New Additional Tier 1 eligible capital issues | 1,967 | 2,487 | ||
Matured and called instruments | (2,350) | (500) | ||
Other, including regulatory adjustments | 33 | 33 | ||
Additional Tier 1 (AT1) Capital – closing amount | 8,518 | 8,868 | ||
Tier 1 capital | 56,616 | 55,375 | ||
Tier 2 (T2) capital – closing amount | 9,531 | 7,358 | ||
Total regulatory capital² | 66,146 | 62,732 | ||
1Full year profit is recognized as per ECB Decision (EU) 2015/656 in accordance with the Article 26(2) of Regulation (EU) No 575/2013 (ECB/2015/4)
2 Numbers may not add up due to rounding
164 |
Deutsche Bank | ||
Annual Report 2022 | ||
Minimum loss coverage for Non Performing Exposure (NPE)
In April 2019, the EU published requirements Regulation (EU) 2019/630 amending the CRR (Regulation (EU) No 575/2013) for a prudential backstop reserve for non-performing exposure (NPE). This regulation results in a Pillar 1 deduction from CET 1 capital when a minimum loss coverage requirement is not met. It is applied to exposures originated and defaulted after April 25, 2019.
In addition, in March 2018, the ECB published its “Addendum to the ECB Guidance to banks on non-performing loans: supervisory expectations for prudential provisioning of non-performing exposures” and in August 2019, its “Communication on supervisory coverage expectations for NPEs”.
The ECB guidance issued is applicable to all newly defaulted loans after April 1, 2018 (ECB - new NPE’s after April 1, 2018) and, similar to the EU rules, it requires banks to take measures in case a minimum impairment coverage requirement is not met. Within the annual SREP discussions ECB may impose Pillar 2 measures on banks in case ECB is not confident with measure taken by the individual bank.
For the year end 2020, we introduced a framework to determine the prudential provisioning of non-performing exposure as a Pillar 2 measure as requested in the before mentioned ECB’s guidance and SREP recommendation.
For the minimum loss coverage expectation for NPE´s arising from clients defaulted before April 1, 2018 (ECB – NPE Stock) a phase-in path to 100% coverage expectation was envisaged with an annual increase of 10%. In a first step, banks were allocated to three comparable groups on the basis of the bank’s net NPL ratios as of end-2017 and in a second step an assessment of capacity regarding the potential impact was carried out for each individual bank with a horizon of end-2026. Deutsche Bank has been assigned to Group 1 which requires a full applicability of 100% minimum loss coverage by year end 2024 for secured loans respectively by year end 2023 for unsecured loans.
The shortfall between the minimum loss coverage requirements for non-performing exposure and the risk reserves recorded in line with the IFRS 9 for defaulted (Stage 3) assets amounted to € 1.048 million as of December 31, 2022 and was deducted from CET 1. This additional CET 1 charge can be considered as additional loss reserve and leads to a € 933 million RWA relief.
Non-performing exposure loss coverage
Dec 31, 2022 | ||||||||
in € m. (unless | Exposure value¹ | Total minimum coverage requirement | Available coverage | Applicable amount of insufficient coverage | ||||
Corporate Bank | 4,378 | 795 | 1,176 | 316 | ||||
Investment Bank | 14,665 | 8,182 | 10,117 | 383 | ||||
Private Bank | 6,101 | 1,250 | 2,202 | 315 | ||||
Asset Management | 0 | 0 | 0 | 0 | ||||
Capital Release Unit | 142 | 64 | 41 | 32 | ||||
Corporate & Other | 140 | 2 | 0 | 2 | ||||
Total | 25,426 | 10,294 | 13,535 | 1,048 | ||||
1Exposure value in accordance with Article 47c CRR
| Dec 31, 2021 | |||||||
in € m. (unless | Exposure value¹ | Total minimum coverage requirement | Available coverage | Applicable amount of insufficient coverage | ||||
Corporate Bank | 3,746 | 626 | 1,109 | 119 | ||||
Investment Bank | 14,671 | 7,823 | 10,155 | 273 | ||||
Private Bank | 7,119 | 1,263 | 2,449 | 311 | ||||
Asset Management | 0 | 0 | 0 | 0 | ||||
Capital Release Unit | 253 | 120 | 102 | 42 | ||||
Corporate & Other | 22 | 3 | 0 | 3 | ||||
Total | 25,811 | 9,835 | 13,816 | 748 | ||||
1Exposure value in accordance with Article 47c CRR
165 |
Deutsche Bank | ||
Annual Report 2022 | ||
Development of risk-weighted assets
The table below provides an overview of RWA broken down by risk type and business division. It includes the aggregated effects of the segmental reallocation of infrastructure related positions, if applicable, as well as reallocations between the segments.
Risk-weighted assets by risk type and business division
Dec 31, 2022 | ||||||||||||||
in € m. | Corporate | Investment | Private | Asset | Capital | Corporate & | Total | |||||||
Credit Risk | 68,022 | 93,184 | 79,865 | 9,417 | 3,141 | 15,585 | 269,214 | |||||||
Settlement Risk | 0 | 63 | 0 | 0 | 0 | 61 | 124 | |||||||
Credit Valuation Adjustment (CVA) | 130 | 5,144 | 29 | 4 | 812 | 65 | 6,184 | |||||||
Market Risk | 847 | 17,895 | 72 | 28 | 1,493 | 5,796 | 26,131 | |||||||
Operational Risk | 5,304 | 23,155 | 7,637 | 3,414 | 18,839 | 0 | 58,349 | |||||||
Total | 74,303 | 139,442 | 87,602 | 12,864 | 24,284 | 21,508 | 360,003 | |||||||
Dec 31, 2021 | ||||||||||||||
in € m. | Corporate | Investment | Private | Asset | Capital | Corporate & | Total | |||||||
Credit Risk | 59,588 | 93,125 | 77,632 | 11,017 | 5,426 | 16,964 | 263,752 | |||||||
Settlement Risk | 0 | 1 | 0 | 0 | 10 | 49 | 60 | |||||||
Credit Valuation Adjustment (CVA) | 120 | 4,879 | 167 | 9 | 1,098 | 55 | 6,327 | |||||||
Market Risk | 128 | 17,565 | 40 | 33 | 1,293 | 715 | 19,773 | |||||||
Operational Risk | 5,571 | 25,031 | 7,527 | 3,357 | 20,232 | 0 | 61,718 | |||||||
Total | 65,406 | 140,600 | 85,366 | 14,415 | 28,059 | 17,783 | 351,629 | |||||||
The RWA of Deutsche Bank were € 360.0 billion as of December 31, 2022, compared to € 351.6 billion at the end of 2021. The increase of € 8.4 billion was driven by market risk RWA and credit risk RWA, and was partially offset by operational risk RWA. Higher market risk RWA by € 6.4 billion was primarily driven by increases in the VaR and SVaR components through a combination of a higher capital multiplier, following backtesting outliers and higher VaR due to more volatile data in the last one-year window. The increase in credit risk RWA by € 5.5 billion was primarily driven by foreign exchange movements, ECB mandated model adjustments and other methodological updates, impacts on the back of market uncertainties and business growth within Core businesses. This was partially offset by RWA decreases within the Capital Release Unit and Asset Management as well as an updated treatment for hedged exposures and equity investments. The operational risk RWA reduction of € 3.4 billion was mainly driven by a more favorable development of Deutsche Bank´s internal loss profile feeding into the capital model.
The tables below provide an analysis of key drivers for risk-weighted asset movements observed for credit risk, credit valuation adjustments as well as market and operational risk in the reporting period. They also show the corresponding movements in capital requirements, derived from the RWA by an 8% capital ratio.
Development of risk-weighted assets for Credit Risk including Counterparty Credit Risk
Dec 31, 2022 | Dec 31, 2021 | |||||||
in € m. | Credit risk RWA | Capital | Credit risk RWA | Capital | ||||
Credit risk RWA balance, beginning of year | 263,752 | 21,100 | 222,708 | 17,817 | ||||
Book size | (6,254) | (500) | 4,719 | 378 | ||||
Book quality | (478) | (38) | (899) | (72) | ||||
Model updates | (179) | (14) | (97) | (8) | ||||
Methodology and policy | 8,244 | 659 | 30,172 | 2,414 | ||||
Acquisition and disposals | 0 | 0 | 131 | 10 | ||||
Foreign exchange movements | 5,320 | 426 | 6,431 | 514 | ||||
Other | (1,191) | (95) | 587 | 47 | ||||
Credit risk RWA balance, end of year | 269,214 | 21,537 | 263,752 | 21,100 | ||||
166 |
Deutsche Bank | ||
Annual Report 2022 | ||
Of which: Development of risk-weighted assets for Counterparty Credit Risk
Dec 31, 2022 | Dec 31, 2021 | |||||||
in € m. | Counterparty | Capital | Counterparty | Capital | ||||
Counterparty credit risk RWA balance, beginning of year | 24,780 | 1,982 | 23,814 | 1,905 | ||||
Book size | (1,734) | (139) | (4,527) | (362) | ||||
Book quality | (41) | (3) | (422) | (34) | ||||
Model updates | 0 | 0 | 125 | 10 | ||||
Methodology and policy | 0 | 0 | 4,805 | 384 | ||||
Acquisition and disposals | 0 | 0 | 0 | 0 | ||||
Foreign exchange movements | 584 | 47 | 986 | 79 | ||||
Other | 0 | 0 | 0 | 0 | ||||
Counterparty credit risk RWA balance, end of year | 23,589 | 1,887 | 24,780 | 1,982 | ||||
The classifications of key drivers for the RWA credit risk development table are fully aligned with the recommendations of the Enhanced Disclosure Task Force (EDTF). Organic changes in the Group´s portfolio size and composition are considered in the category “book size”. The category “book quality” mainly represents the effects from portfolio rating migrations, loss given default, model parameter recalibrations as well as collateral and netting coverage activities. “Model updates” include model refinements and advanced model roll out. RWA movements resulting from externally, regulatory-driven changes, e.g. applying new regulations, are considered in the “methodology and policy” section. “Acquisition and disposals” is reserved to show significant exposure movements which can be clearly assigned to new businesses or disposal-related activities. Changes that cannot be attributed to the above categories are reflected in the category “other”.
The increase in RWA for credit risk by 2.1% or € 5.5 billion since December 31, 2021, is mainly driven by the categories “methodology and policy” and FX related movements. This is partially offset by changes shown in the categories “book size”, “other”, “book quality” and “model updates”. The category “methodology and policy” mainly reflects impacts driven by the introduction of the EBA Guidelines, partly offset by an updated treatment for equity investments. These increases were partly offset by a decrease in category “book size”, which reflects a change in composition of Deutsche Bank´s portfolio, as an effect of balance sheet management. The decrease in the category “book quality” reflects an updated treatment for hedged exposures and impacts for rating changes, partly offset by impacts on the back of market uncertainties and an updated treatment for certain guarantees. Additionally, the decrease in category “other” reflects a reduction in RWA for deferred tax assets. Furthermore, the reduction in category “model updates” is driven by refinements on Deutsche Bank´s IRBA model.
The decrease in RWA for counterparty credit risk by 4.8% or € 1.2 billion since December 31, 2021, is mainly driven by the decrease in category “book size” driven by a reduction in trading activities as part of balance sheet management as well as a decrease in category “book quality” particularly stemming from rating change impacts. This was partly offset by FX movements over the year.
Based on the CRR/CRD regulatory framework, we are required to calculate RWA using the CVA which takes into account the credit quality of our counterparties. RWA for CVA covers the risk of mark-to-market losses on the expected counterparty risk in connection with OTC derivative exposures. We calculate the majority of the CVA based on our own internal model as approved by the BaFin.
Development of risk-weighted assets for Credit Valuation Adjustment
Dec 31, 2022 | Dec 31, 2021 | |||||||
in € m. | CVA RWA | Capital | CVA RWA | Capital | ||||
CVA RWA balance, beginning of year | 6,327 | 506 | 8,392 | 671 | ||||
Movement in risk levels | 1,217 | 97 | (450)1 | (36) | ||||
Market data changes and recalibrations | (200) | (16) | (1,581) | (126) | ||||
Model updates | (1,160) | (93) | 0 | 0 | ||||
Methodology and policy | 0 | 0 | 0 | 0 | ||||
Acquisitions and disposals | 0 | 0 | (33) | (3)1 | ||||
Foreign exchange movements | 0 | 0 | 0 | 0 | ||||
CVA RWA balance, end of year | 6,184 | 495 | 6,3271 | 506 | ||||
1 Prior year’s (or: years’) comparatives aligned to presentation in the current year.
The development of CVA RWA is broken down into a number of categories: “Movement in risk levels”, which includes changes to the portfolio size and composition; “Market data changes and calibrations”, which includes changes in market data levels and volatilities as well as recalibrations; “Model updates” refers to changes to either the IMM credit exposure models or the value-at-risk models that are used for CVA RWA; “Methodology and policy” relates to changes to the regulation. Any significant business acquisitions or disposals would be presented in the category with that name.
167 |
Deutsche Bank | ||
Annual Report 2022 | ||
As of December 31, 2022, the RWA for CVA amounted to € 6.2 billion, representing a decrease of € 0.1 billion (-2%) compared to December 31, 2021.The small decrease is primarily a net effect of methodology refinements resulting in a decrease in Q2 offset by an increase from business activities throughout the year.
Development of risk-weighted assets for Market Risk
| Dec 31, 2022 | |||||||||||
in € m. | VaR | SVaR | IRC | Other | Total RWA | Total capital | ||||||
Market risk RWA balance, beginning of year | 3,538 | 9,360 | 3,657 | 3,219 | 19,773 | 1,582 | ||||||
Movement in risk levels | (175) | 1,986 | (17) | 266 | 2,061 | 165 | ||||||
Market data changes and recalibrations | 2,651 | (617) | 0 | (593) | 1,441 | 115 | ||||||
Model updates/changes | 100 | (650) | 0 | 0 | (550) | (44) | ||||||
Methodology and policy | 1,299 | 2,142 | 0 | 0 | 3,441 | 275 | ||||||
Acquisitions and disposals | 0 | 0 | 0 | 0 | 0 | 0 | ||||||
Foreign exchange movements | 0 | 0 | 0 | 113 | 113 | 9 | ||||||
Other | 0 | 0 | 0 | 0 | 0 | 0 | ||||||
Market risk RWA balance, end of year | 7,413 | 12,221 | 3,639 | 2,857 | 26,131 | 2,091 | ||||||
| Dec 31, 2021 | |||||||||||
in € m. | VaR | SVaR | IRC | Other | Total RWA | Total capital | ||||||
Market risk RWA balance, beginning of year | 12,109 | 6,983 | 7,005 | 2,799 | 28,897 | 2,312 | ||||||
Movement in risk levels | (1,067) | 537 | (3,349) | 28 | (3,850) | (308) | ||||||
Market data changes and recalibrations | (4,943) | 0 | 0 | 334 | (4,609) | (369) | ||||||
Model updates/changes | (2,196) | 2,675 | 0 | 0 | 479 | 38 | ||||||
Methodology and policy | (366) | (835) | 0 | 0 | (1,201) | (96) | ||||||
Acquisitions and disposals | 0 | 0 | 0 | 0 | 0 | 0 | ||||||
Foreign exchange movements | 0 | 0 | 0 | 57 | 57 | 5 | ||||||
Other | 0 | 0 | 0 | 0 | 0 | 0 | ||||||
Market risk RWA balance, end of year | 3,538 | 9,360 | 3,657 | 3,219 | 19,773 | 1,582 | ||||||
The analysis for market risk covers movements in the bank’s internal models for value-at-risk (VaR), stressed value-at-risk (SVaR), incremental risk charge (IRC) as well as results from the market risk standardized approach (MRSA), which is captured in the table under the category “Other”. MRSA is used to determine the regulatory capital charge for the specific market risk of trading book securitizations, for certain types of investment funds and for longevity risk as set out in CRR/CRD regulations.
The market risk RWA movements due to changes in market data levels, volatilities, correlations, liquidity and ratings are included under the “Market data changes and recalibrations” category. Changes to our market risk RWA internal models, such as methodology enhancements or risk scope extensions, are included in the category of “Model updates”. In the “Methodology and policy” category we reflect regulatory driven changes to our market risk RWA models and calculations. Significant new businesses and disposals would be assigned to the line item “Acquisition and disposals”. The impacts of “Foreign exchange movements” are only calculated for the CRM and Standardized approach methods.
As of December 31, 2022 the RWA for market risk was € 26.1 billion which has grown by € 6.4 billion (+32%) since December 31, 2021. The growth was driven by the “Methodology and policy” category following an increase in the capital multiplier on the back of an increase in backtesting outliers during the year; and by the “Market data changes and recalibrations” category impacting value-at-risk due to inclusion of increased market volatility in the rolling 1yr period. Additionally, stressed value-at-risk increased due to a change in the 1-year window used in the calculation following the regular stress period selection review.
Development of risk-weighted assets for operational risk
Dec 31, 2022 | Dec 31, 2021 | |||||||
in € m. | Operational risk | Capital | Operational risk | Capital | ||||
Operational risk RWA balance, beginning of year | 61,718 | 4,937 | 68,899 | 5,512 | ||||
Loss profile changes (internal and external) | (3,405) | (272) | (8,000) | (640) | ||||
Expected loss development | (166) | (13) | (113) | (9) | ||||
Forward looking risk component | 794 | 63 | (278) | (22) | ||||
Model updates | (669) | (54) | 1,210 | 97 | ||||
Methodology and policy | 78 | 6 | 0 | 0 | ||||
Acquisitions and disposals | 0 | 0 | 0 | 0 | ||||
Operational risk RWA balance, end of year | 58,349 | 4,668 | 61,718 | 4,937 | ||||
168 |
Deutsche Bank | ||
Annual Report 2022 | ||
Changes in internal and external loss events are reflected in the category “Loss profile changes”. The category “Expected loss development” is based on divisional business plans as well as historical losses and is deducted from the AMA capital figure within certain constraints. The category “Forward looking risk component” reflects qualitative adjustments and, as such, the effectiveness and performance of the day-to-day operational risk management activities via NFR appetite metrics and RCA scores, focusing on the business environment and internal control factors. The category “Model updates” covers model refinements, such as the implementation of model changes. The category “Methodology and policy” represents externally driven changes such as regulatory add-ons. The category “Acquisition and disposals” represents significant exposure movements which can be clearly assigned to new or disposed businesses.
The overall decrease of the RWA for operational risk by € 3.4 billion was mainly driven by lower loss frequencies feeding into our capital model.
A minor loss deductible increase led to an RWA decrease of € 0.2 billion while the forward-looking component was impacted by small changes to RCA scores, resulting in an RWA increase of € 0.8 billion.
The RWA decrease of € 0.7 billion from model updates was driven by two process changes. The first one comprised a refined reflection of the input into the forward-looking risk component. The second change was a consequence of the enhanced scenario analysis component within the bank’s risk management process.
Economic Capital
Economic capital adequacy
Deutsche Bank’s internal capital adequacy assessment process (ICAAP) aims at maintaining the continuity of the bank on an ongoing basis. Internal capital adequacy is assessed from an economic perspective as the ratio of economic capital supply divided by economic capital demand as shown in the table below.
Total economic capital supply and demand
in € m. | Dec 31, 2022 | Dec 31, 2021 | ||
Components of economic capital supply | ||||
Shareholders' equity | 61,959 | 58,027 | ||
Noncontrolling interests¹ | 897 | 858 | ||
AT1 coupons deduction | (319) | (298) | ||
Gain on sale of securitizations, cash flow hedges | 790 | 42 | ||
Fair value gains on own debt and debt valuation adjustments, subject to own credit risk | (190) | (56) | ||
Additional valuation adjustments | (2,026) | (1,812) | ||
Intangible assets | (3,677) | (3,583) | ||
IFRS deferred tax assets excl. temporary differences | (3,937) | (1,653) | ||
Expected loss shortfall | (466) | (573) | ||
Defined benefit pension fund assets | (1,176) | (991) | ||
Other adjustments | (1,864) | (1,492) | ||
Economic capital supply | 49,989 | 48,470 | ||
Components of economic capital demand | ||||
Credit risk | 11,802 | 11,725 | ||
Market risk | 6,355 | 7,920 | ||
Operational risk | 4,668 | 4,937 | ||
Strategic risk | 1,854 | 3,173 | ||
Diversification benefit | (3,778) | (4,213) | ||
Total economic capital demand | 20,900 | 23,542 | ||
Economic capital adequacy ratio | 239% | 206% | ||
1Includes noncontrolling interest up to the economic capital requirement for each subsidiary
The economic capital adequacy ratio was 239% as of December 31, 2022, compared with 206% as of December 31, 2021. The improvement in the ratio was due to a decrease in economic capital demand and an increase in economic capital supply. The economic capital supply increased by € 1.5 billion compared to year-end 2021 mainly driven by higher shareholders’ equity of € 3.9 billion. The increase in shareholders’ equity was due to net income of € 5.5 billion, which was partly offset by higher unrealized losses of € 1.3 billion and share buybacks of € 0.3 billion. This positive impact was partly offset by higher capital deduction of € 2.3 billion related to a valuation adjustment for IFRS deferred tax assets excl. temporary differences. The decrease in economic capital demand is explained in the section “Risk Profile”.
169 |
Deutsche Bank | ||
Annual Report 2022 | ||
Leverage Ratio
Deutsche Bank manages its balance sheet on a Group level and, where applicable, locally in each region. In the allocation of financial resources, the Group favors business portfolios with the highest positive impact on its profitability and shareholder value. The Group monitors and analyzes balance sheet developments and tracks certain market-observed balance sheet ratios. Based on this the Group triggers discussion and management action by the Group Risk Committee.
Leverage Ratio according to CRR/CRD framework
The non-risk-based leverage ratio is intended to act as a supplementary measure to the risk-based capital requirements. Its objectives are to constrain the build-up of leverage in the banking sector, helping avoid destabilizing deleveraging processes which can damage the broader financial system and the economy, and to reinforce the risk-based requirements with a simple, non-risk based “backstop” measure.
A minimum leverage ratio requirement of 3% was introduced effective starting with June 28, 2021. From January 1, 2023, an additional leverage ratio buffer requirement of 50% of the applicable G-SII buffer rate will apply. This additional requirement will equal 0.75% for Deutsche Bank.
Deutsche Bank calculates its leverage ratio exposure in accordance with Articles 429 to 429g of the CRR.
The Group’s total leverage ratio exposure includes derivatives, securities financing transactions (SFTs), off-balance sheet exposure and other on-balance sheet exposure (excluding derivatives and SFTs).
The leverage exposure for derivatives is calculated by using a modified version of the standardized approach for counterparty credit risk (SA-CCR), comprising the current replacement cost plus a regulatory defined add-on for the potential future exposure. The effective notional amount of written credit derivatives, i.e., the notional reduced by any negative fair value changes that have been incorporated in Tier 1 capital is included in the leverage ratio exposure measure; the resulting exposure measure is further reduced by the effective notional amount of purchased credit derivative protection on the same reference name provided certain conditions are met.
The SFT component includes the gross receivables for SFTs, which are netted with SFT payables if specific conditions are met. In addition to the gross exposure a regulatory add-on for the counterparty credit risk is included.
The off-balance sheet exposure component follows the credit risk conversion factors (CCF) of the standardized approach for credit risk (0%, 20%, 50%, or 100%), which depend on the risk category subject to a floor of 10%.
The on-balance sheet exposures (excluding derivatives and SFTs) component reflects the accounting values of the assets (excluding derivatives, SFTs and regular-way purchases and sales awaiting settlement) as well as regulatory adjustments for asset amounts deducted in determining Tier 1 capital. The exposure value of regular-way purchases and sales awaiting settlement is determined as offset between those cash receivables and cash payables where the related regular-way sales and purchases are both settled on a delivery-versus payment basis.
The following tables show the leverage ratio exposure and the leverage ratio. The Leverage ratio common disclosure table provides the leverage ratio on a fully loaded and phase-in basis with the fully loaded and phase-in Tier 1 Capital, respectively, in the numerator. For further details on Tier 1 capital please also refer to the section “Development of Own Funds”.
Summary reconciliation of accounting assets and leverage ratio exposures
in € bn. | Dec 31, 2022 | Dec 31, 2021 ¹ | ||
Total assets as per published financial statements | 1,337 | 1,324 | ||
Adjustment for entities which are consolidated for accounting purposes but are outside the scope of | 2 | 1 | ||
Adjustments for derivative financial instruments | (171) | (163) | ||
Adjustment for securities financing transactions (SFTs) | 1 | 2 | ||
Adjustment for off-balance sheet items (i.e. conversion to credit equivalent amounts of off-balance | 128 | 115 | ||
Other adjustments | (57) | (154) | ||
Leverage ratio total exposure measure | 1,240 | 1,125 | ||
1Since April 1, 2022, Deutsche Bank no longer excludes certain central bank exposures (amounting to € 99 billion as of December 31, 2021), based on Article 429a (1) (n) CRR and the ECB decision 2021/1074 as this temporary exemption during the COVID-19 pandemic ended on March 31, 2021; not applying the temporary exclusion of certain central bank exposures the leverage exposure was € 1,223 billion as of December 31, 2021
170 |
Deutsche Bank | ||
Annual Report 2022 | ||
Leverage ratio common disclosure
in € bn. | Dec 31, 2022 | Dec 31, 2021 ¹ | ||
Total derivative exposures | 130 | 138 | ||
Total securities financing transaction exposures | 96 | 91 | ||
Total off-balance sheet exposures | 128 | 115 | ||
Other Assets | 897 | 791 | ||
Asset amounts deducted in determining Tier 1 capital | (11) | (9) | ||
Tier 1 capital (fully loaded)² | N/M | 54.8 | ||
Leverage ratio total exposure measure² | N/M | 1,125 | ||
Leverage ratio (fully loaded, in %)² | N/M | 4.9 | ||
Tier 1 capital (phase-in) | 56.6 | 55.4 | ||
Leverage ratio total exposure measure | 1,240 | 1,125 | ||
Leverage ratio (phase-in, in %) | 4.6 | 4.9 | ||
1Since April 1, 2022, Deutsche Bank no longer excludes certain central bank exposures (amounting to € 99 billion as of December 31, 2021), based on Article 429a (1) (n) CRR and the ECB decision 2021/1074 as this temporary exemption during the COVID-19 pandemic ended on March 31, 2021; not applying the temporary exclusion of certain central bank exposures the leverage exposure was € 1,223 billion as of December 31, 2021, corresponding to a leverage ratio of 4.5%.
2Starting with first quarter of 2022, leverage numbers are presented as reported as the fully loaded definition has been eliminated as resulting only in an immaterial difference; comparative information of earlier periods is based on Deutsche Bank’s earlier fully loaded definition.
Description of the factors that had an impact on the leverage ratio in 2022
Since April 1, 2022, Deutsche Bank no longer excludes certain central bank exposures from its leverage exposure. This temporary exemption during the COVID-19 pandemic, which was based on Article 429a (1) (n) CRR and the ECB Decision 2021/1074, ended on March 31, 2022. As a consequence, also the applicable minimum leverage ratio no longer has to be increased and is therefore at 3.0%.
As of December 31, 2022, the leverage ratio was 4.6% compared to 4.9% as of December 31, 2021. This takes into account a Tier 1 capital of € 56.6 billion over an applicable exposure measure of € 1,240 billion as of December 31, 2022 (€ 55.4 billion and € 1,125 billion as of December 31, 2021, respectively). Not applying the temporary exclusion of certain central bank exposures amounting to € 99 billion the leverage exposure was € 1,223 billion as of December 31, 2021, corresponding to a leverage ratio of 4.5%.
Not considering the temporary exclusion of certain central bank balance for December 31, 2021, over the year 2022 the leverage exposure increased by € 17 billion to € 1,240 billion, largely driven by off-balance sheet leverage exposures which increased by € 13 billion corresponding to higher notional amounts for irrevocable lending commitments. The leverage exposure for the asset items not related to derivatives and SFTs increased by € 8 billion. This reflects the development of the balance sheet (for additional information please refer to section “Movements in assets and liabilities” in this report): loans grew by € 14 billion, cash and central bank/interbank balances decreased by € 13 billion and non-derivative trading assets decreased by € 7 billion. Pending settlements decreased by € 1 billion on a net basis in line with the € 1 billion decrease on a on a gross basis. The remaining asset items increased by € 15 billion, largely related to Held-to-collect debt securities. Furthermore, SFT-related items (securities purchased under resale agreements, securities borrowed and receivables from prime brokerage) increased by € 6 billion, in line with the development on the balance sheet. In addition, the leverage exposure related to derivatives decreased by € 8 billion. The € 2 billion reduction in Asset amounts deducted in determining Tier 1 capital mainly reflects higher capital deductions for deferred tax assets.
The increase in leverage exposure in 2022 included a positive foreign exchange impact of € 22 billion mainly due to the strengthening of the U.S. Dollar versus the Euro. The effects from foreign exchange rate movements are embedded in the movement of the leverage exposure items discussed in this section.
For main drivers of the Tier 1 capital development please refer to section “Development of Own Funds”.
171 |
Deutsche Bank | ||
Annual Report 2022 | ||
Minimum Requirement of Own Funds and Eligible Liabilities and Total Loss Absorbing Capacity
MREL Requirements
The minimum requirement for own funds and eligible liabilities (MREL) requirement was introduced by the European Union’s Regulation establishing uniform rules and a uniform procedure for the resolution of credit institutions (Single Resolution Mechanism Regulation or SRMR) and the European Union’s Directive establishing a framework for the recovery and resolution of credit institutions (Bank Recovery and Resolution Directive or BRRD) as implemented into German law by the German Recovery and Resolution Act.
The currently required level of MREL is determined by the competent resolution authorities for each supervised bank individually on a case-by-case basis, depending on the respective preferred resolution strategy. In the case of Deutsche Bank AG, MREL is determined by the Single Resolution Board. While there is no statutory minimum level of MREL, the SRMR, BRRD and a delegated regulation set out criteria which the resolution authority must consider when determining the relevant required level of MREL. Guidance is provided through an MREL policy published annually by the SRB. Any binding MREL ratio determined by the SRB is communicated to Deutsche Bank via the German Federal Financial Supervisory Authority (BaFin).
The SRB has revised Deutsche Bank AG’s binding MREL ratio requirement in the last quarter of 2021 applicable immediately. These new requirements for the first time reflect the legal changes of the banking reform package via amendments to the SRMR and the BRRD provided in June 2019 with the publication of Regulation (EU) 2019/877 and Directive (EU) 2019/879. As a result, the MREL and subordinated MREL requirement will no longer be expressed as a percentage of TLOF but as a percentage of RWA and LRE. The MREL ratio requirement on a consolidated basis was set at 24.05% of RWA and 6.88% of LRE of which 20.27% of RWA and 6.88% of LRE must be met with own funds and subordinated instruments.
As a result of its regular annual review and based on an extraordinary assessment of the impact on the MREL requirements from the European Central Bank ending its temporary relief measure to exclude certain exposures to central banks from LRE, the SRB has updated Deutsche Bank AG’s binding MREL ratio requirements in the second quarter of 2022 applicable immediately. The MREL ratio requirement on a consolidated basis is now 24.89% of RWA and 7.01% of LRE of which 20.28% of RWA and 7.01% of LRE must be meet with own funds and subordinated instruments.
The combined buffer requirements of 4.57% as of December 31, 2022 must be met in addition to the RWA based MREL and subordinated MREL requirements.
TLAC Requirements
Since June 27, 2019, Deutsche Bank, as a global systemically important bank, has also become subject to global minimum standards for its Total Loss-Absorbing Capacity (TLAC). The TLAC requirement was implemented via amendments to the Capital Requirements Regulation and the Capital Requirements Directive provided in June 2019 with the publication of Regulation (EU) 2019/876 and Directive (EU) 2019/878.
This TLAC requirement is based on both risk-based and non-risk-based denominators and set at the higher-of 16% of RWA plus the combined buffer requirements and 6.00% of LRE for a transitional period until December 31, 2021. Since January 1, 2022, the requirement is set at the higher-of 18% of RWA plus the combined buffer requirements and 6.75% of LRE.
MREL ratio development
As of December 31, 2022, available MREL were € 123.7 billion, corresponding to a ratio of 34.35% of RWA. This means that Deutsche Bank has a comfortable MREL surplus of € 17.6 billion above Deutsche Bank’s MREL requirement of € 106.1 billion (i.e. 29.46% of RWA including combined buffer requirement). € 115.9 billion of Deutsche Bank’s available MREL were own funds and subordinated liabilities, corresponding to a MREL subordination ratio of 32.20% of RWA, a buffer of € 26.4 billion over Deutsche Bank’s subordination requirement of € 89.5 billion (i.e. 24.85% of RWA including combined buffer requirements). Compared to December 31, 2021 the surpluses above both Deutsche Bank’s MREL requirement and Deutsche Bank’s subordinated MREL requirement have increased mainly driven by both higher own funds and higher eligible liabilities. This was partially offset by increases in Deutsche Bank’s MREL requirement. These developments also impacted Deutsche Bank’s TLAC ratio. Both Deutsche Bank’s MREL and MREL subordination surplus over the requirement remain constrained by RWA.
172 |
Deutsche Bank | ||
Annual Report 2022 | ||
TLAC ratio development
As of December 31, 2022, TLAC was € 115.9 billion and the corresponding TLAC ratios were 32.20% of RWA and 9.34% of LRE. This means that Deutsche Bank has a comfortable TLAC surplus of € 32.2 billion over its TLAC requirement of € 83.7 billion (6.75% of LRE).
MREL and TLAC disclosure
in € m. | Dec 31, 2022 | Dec 31, 2021 | ||
Regulatory capital elements of TLAC/MREL | ||||
Common Equity Tier 1 capital (CET 1) | 48,097 | 46,506 | ||
Additional Tier 1 (AT1) capital instruments eligible under TLAC/MREL | 8,518 | 8,868 | ||
Tier 2 (T2) capital instruments eligible under TLAC/MREL | ||||
Tier 2 (T2) capital instruments before TLAC/MREL adjustments | 9,531 | 7,358 | ||
Tier 2 (T2) capital instruments adjustments for TLAC/MREL | 1,898 | 1,208 | ||
Tier 2 (T2) capital instruments eligible under TLAC/MREL | 11,429 | 8,566 | ||
Total regulatory capital elements of TLAC/MREL | 68,045 | 63,941 | ||
Other elements of TLAC/MREL | ||||
Senior non-preferred plain vanilla | 47,862 | 45,153 | ||
Holdings of eligible liabilities instruments of other G-SIIs (TLAC only) | 0 | 0 | ||
Total Loss Absorbing Capacity (TLAC) | 115,907 | 109,094 | ||
Add back of holdings of eligible liabilities instruments of other G-SIIs (TLAC only) | 0 | 0 | ||
Available Own Funds and subordinated Eligible Liabilities (subordinated MREL) | 115,907 | 109,094 | ||
Senior preferred plain vanilla | 4,552 | 5,759 | ||
Senior preferred structured products | 3,215 | 0 | ||
Available Minimum Own Funds and Eligible Liabilities (MREL) | 123,674 | 114,853 | ||
Risk Weighted Assets (RWA) | 360,003 | 351,629 | ||
Leverage Ratio Exposure (LRE) | 1,240,483 | 1,124,667 | ||
TLAC ratio | ||||
TLAC ratio (as percentage of RWA) | 32.20 | 31.03 | ||
TLAC requirement (as percentage of RWA) | 22.57 | 20.53 | ||
TLAC ratio (as percentage of Leverage Exposure) | 9.34 | 9.70 | ||
TLAC requirement (as percentage of Leverage Exposure) | 6.75 | 6.00 | ||
TLAC surplus over RWA requirement | 34,638 | 36,919 | ||
TLAC surplus over LRE requirement | 32,174 | 41,614 | ||
MREL subordination | ||||
MREL subordination ratio (as percentage of RWA) | 32.20 | 31.03 | ||
MREL subordination requirement (as percentage of RWA) | 24.85 | 24.79 | ||
Surplus over MREL subordination requirement | 26,430 | 21,909 | ||
MREL ratio | ||||
MREL ratio (as percentage of RWA) | 34.35 | 32.66 | ||
MREL requirement (as percentage of RWA) | 29.46 | 28.58 | ||
MREL surplus over requirement | 17,600 | 14,372 | ||
173 |
Deutsche Bank | ||
Annual Report 2022 | ||
Own Funds and Eligible Liabilities
To meet the MREL and TLAC requirement, Deutsche Bank needs to ensure that enough eligible liabilities instruments are maintained. Instruments eligible for MREL and TLAC are regulatory capital instruments (own funds) and liabilities that meet certain criteria, which are referred to as eligible liabilities.
Own funds used for MREL and TLAC include the full amount of Tier 2 capital instruments with a remaining maturity of greater than 1 year and less than 5 years which are reflected in regulatory capital on a pro-rata basis only.
Eligible liabilities are liabilities issued out of the resolution entity Deutsche Bank AG that meet eligibility criteria which are supposed to ensure that they are structurally suited as loss-absorbing capital. As a result, eligible liabilities exclude deposits which are covered by an insurance deposit protection scheme or which are preferred under German insolvency law (e.g., deposits from private individuals as well as small and medium-sized enterprises). Among other things, secured liabilities and derivatives liabilities are generally excluded as well. Debt instruments with embedded derivative features can be included under certain conditions (e.g. a known and fixed or increasing principal). In addition, eligible liabilities must have a remaining time to maturity of at least one year and must either be issued under the law of a Member State of the European Union or must include a bail-in clause in their contractual terms to make write-down or conversion effective. The SRB has granted a transitional period for liabilities issued under UK law on or before November 15, 2018, which do not include an enforceable and effective bail-in clause but can still be included in eligible liabilities after Brexit until June 28, 2025.
In addition, eligible liabilities need to be subordinated to be counted against the TLAC and MREL subordination requirements. Effective January 1, 2017, the German Banking Act provided for a new class of statutorily subordinated debt securities that rank as senior non-preferred below the bank’s other senior liabilities (but in priority to the bank’s contractually subordinated liabilities, such as those qualifying as Tier 2 instruments). Following a harmonization effort by the European Union implemented in Germany effective July 21, 2018, banks are permitted to now decide if a specific issuance of eligible senior debt will be in the non-preferred or in the preferred category. Any such senior non-preferred debt instruments issued by Deutsche Bank AG under such rules rank on parity with its outstanding debt instruments that were classified as senior non-preferred under the prior rules. All these senior non-preferred issuances meet the TLAC and MREL subordination criteria.
174 |
Deutsche Bank | ||
Annual Report 2022 | ||
Credit Risk Exposure
Deutsche Bank defines its credit exposure by taking into account all transactions where losses might occur due to the fact that counterparties may not fulfill their contractual payment obligations as defined under ‘Credit Risk Framework’.
Maximum Exposure to Credit Risk
The maximum exposure to credit risk table shows the direct exposure before consideration of associated collateral held and other credit enhancements (netting and hedges) that do not qualify for offset in the financial statements for the periods specified. The netting credit enhancement component includes the effects of legally enforceable netting agreements as well as the offset of negative mark-to-markets from derivatives against pledged cash collateral. The collateral credit enhancement component mainly includes real estate, collateral in the form of cash as well as securities-related collateral. In relation to collateral, the Group applies internally determined haircuts and additionally cap all collateral values at the level of the respective collateralized exposure.
Maximum Exposure to Credit Risk
| Dec 31, 2022 | |||||||||||
Credit Enhancements | ||||||||||||
in € m. | Maximum | Subject to | Netting | Collateral | Guarantees | Total credit | ||||||
Financial assets at amortized cost³ | ||||||||||||
Cash and central bank balances | 178,897 | 178,897 | − | 0 | − | 0 | ||||||
Interbank balances (w/o central banks) | 7,199 | 7,199 | − | 0 | 0 | 0 | ||||||
Central bank funds sold and securities purchased under resale agreements | 11,479 | 11,479 | 700 | 10,771 | − | 11,471 | ||||||
Securities borrowed | 0 | 0 | − | 0 | − | 0 | ||||||
Loans | 488,504 | 488,504 | − | 269,428 | 38,899 | 308,327 | ||||||
Other assets subject to credit risk4,5 | 98,505 | 93,221 | 29,232 | 888 | 317 | 30,437 | ||||||
Total financial assets at amortized cost³ | 784,584 | 779,300 | 29,933 | 281,087 | 39,216 | 350,236 | ||||||
Financial assets at fair value through profit or loss6 | ||||||||||||
Trading assets | 90,180 | − | − | 1,573 | 1,264 | 2,837 | ||||||
Positive market values from derivative financial instruments | 299,686 | − | 227,299 | 53,273 | 6 | 280,579 | ||||||
Non-trading financial assets mandatory at fair value through profit or loss | 88,799 | − | 2,480 | 78,920 | 69 | 81,469 | ||||||
Of which: | ||||||||||||
Securities purchased under resale agreement | 63,855 | − | 2,480 | 61,376 | 0 | 63,855 | ||||||
Securities borrowed | 17,414 | − | − | 17,300 | 0 | 17,300 | ||||||
Loans | 1,037 | − | − | 78 | 46 | 124 | ||||||
Financial assets designated at fair value through profit or loss | 168 | − | − | 0 | 94 | 94 | ||||||
Total financial assets at fair value through profit or loss | 478,833 | − | 229,779 | 133,767 | 1,433 | 364,978 | ||||||
Financial assets at fair value through OCI | 31,675 | 31,675 | 0 | 2,622 | 879 | 3,500 | ||||||
Of which: | ||||||||||||
Securities purchased under resale agreement | 2,156 | 2,156 | − | 1,732 | 0 | 1,732 | ||||||
Securities borrowed | 0 | 0 | − | 0 | 0 | 0 | ||||||
Loans | 4,069 | 4,069 | − | 11 | 879 | 890 | ||||||
Total financial assets at fair value through OCI | 31,675 | 31,675 | − | 2,622 | 879 | 3,500 | ||||||
Financial guarantees and other credit related contingent liabilities⁷ | 67,214 | 67,214 | − | 4,738 | 7,482 | 12,220 | ||||||
Revocable and irrevocable lending commitments and other credit related commitments⁷ | 251,021 | 249,959 | − | 24,769 | 5,694 | 30,463 | ||||||
Total off-balance sheet | 318,234 | 317,173 | − | 29,507 | 13,176 | 42,683 | ||||||
Maximum exposure to credit risk | 1,613,327 | 1,128,148 | 259,712 | 446,982 | 54,704 | 761,398 | ||||||
1Does not include credit derivative notional sold (€ 738,733 million) and credit derivative notional bought protection
2Bought Credit protection is reflected with the notional of the underlying
3All amounts at gross value before deductions of allowance for credit losses
4All amounts at amortized cost (gross) except for qualifying hedge derivatives, which are reflected at Fair value through P&L
5Includes Asset Held for Sale regardless of accounting classification
6Excludes equities, other equity interests and commodities
7Figures are reflected at notional amounts
175 |
Deutsche Bank | ||
Annual Report 2022 | ||
| Dec 31, 2021 | |||||||||||
Credit Enhancements | ||||||||||||
in € m. | Maximum | Subject to | Netting | Collateral | Guarantees | Total credit | ||||||
Financial assets at amortized cost³ | ||||||||||||
Cash and central bank balances | 192,025 | 192,025 | − | 0 | − | 0 | ||||||
Interbank balances (w/o central banks) | 7,345 | 7,345 | − | 0 | 0 | 0 | ||||||
Central bank funds sold and securities purchased under resale agreements | 8,370 | 8,370 | − | 8,070 | − | 8,070 | ||||||
Securities borrowed | 63 | 63 | − | 63 | − | 63 | ||||||
Loans | 476,077 | 476,077 | − | 247,109 | 33,353 | 280,462 | ||||||
Other assets subject to credit risk4,5 | 83,314 | 79,361 | 30,639 | 709 | 206 | 31,555 | ||||||
Total financial assets at amortized cost³ | 767,193 | 763,240 | 30,639 | 255,951 | 33,559 | 320,150 | ||||||
Financial assets at fair value through profit or loss⁶ | ||||||||||||
Trading assets | 97,080 | − | − | 2,217 | 1,091 | 3,308 | ||||||
Positive market values from derivative financial instruments | 299,732 | − | 238,411 | 41,692 | 37 | 280,140 | ||||||
Non-trading financial assets mandatory at fair value through profit or loss | 87,873 | − | 2,176 | 75,960 | 187 | 78,324 | ||||||
Of which: | ||||||||||||
Securities purchased under resale agreement | 59,931 | − | 2,176 | 57,755 | 0 | 59,931 | ||||||
Securities borrowed | 18,355 | − | − | 17,978 | 0 | 17,978 | ||||||
Loans | 895 | − | − | 190 | 187 | 378 | ||||||
Financial assets designated at fair value through profit or loss | 140 | − | − | 0 | 82 | 82 | ||||||
Total financial assets at fair value through profit or loss | 484,825 | − | 240,587 | 119,869 | 1,398 | 361,854 | ||||||
Financial assets at fair value through OCI | 28,979 | 28,979 | 0 | 2,0978 | 891 | 2,988 | ||||||
Of which: | ||||||||||||
Securities purchased under resale agreement | 1,231 | 1,231 | − | 1,1868 | 0 | 1,186 | ||||||
Securities borrowed | 0 | 0 | − | 0 | 0 | 0 | ||||||
Loans | 4,370 | 4,370 | − | 208 | 891 | 911 | ||||||
Total financial assets at fair value through OCI | 28,979 | 28,979 | − | 2,097 | 891 | 2,988 | ||||||
Financial guarantees and other credit related contingent liabilities⁷ | 59,394 | 59,394 | − | 3,077 | 6,857 | 9,934 | ||||||
Revocable and irrevocable lending commitments and other credit related commitments⁷ | 234,4328 | 233,7548 | − | 18,545 | 5,888 | 24,433 | ||||||
Total off-balance sheet | 293,825 | 293,148 | − | 21,622 | 12,746 | 34,368 | ||||||
Maximum exposure to credit risk | 1,574,822 | 1,085,367 | 271,227 | 399,539 | 48,593 | 719,359 | ||||||
1Does not include credit derivative notional sold (€ 491,407 million) and credit derivative notional bought protection
2Bought Credit protection is reflected with the notional of the underlying
3All amounts at gross value before deductions of allowance for credit losses
4All amounts at amortized cost (gross) except for qualifying hedge derivatives, which are reflected at Fair value through P&L
5Includes Asset Held for Sale regardless of accounting classification
6Excludes equities, other equity interests and commodities
7Figures are reflected at notional amounts
8Prior year’s comparatives aligned to presentation in the current year
The overall increase in maximum exposure to credit risk for December 31, 2022 was € 38.5 billion mainly driven by an increase of € 12.4 billion in loans at amortized cost, € 15.2 billion in other assets subject to credit risk, € 7.0 billion in central bank funds sold, securities purchased under resale agreements and securities borrowed across all applicable measurement categories and € 24.4 billion in irrevocable commitments and financial guarantees. These increases were partly offset by reductions in cash and central bank and interbank balances by € 13.3 billion and trading assets by € 6.9 billion.
Trading assets as of December 31, 2022, includes traded bonds of € 80.2 billion (€ 85.5 billion as of December 31, 2021) of which over 83% were investment-grade (over 83% as of December 31, 2021).
Credit Enhancements are split into three categories: netting, collateral and guarantees / credit derivatives. Haircuts, parameter setting for regular margin calls as well as expert judgments for collateral valuation are employed to prevent market developments from leading to a build-up of uncollateralized exposures. All categories are monitored and reviewed regularly. Overall credit enhancements received are diversified and of adequate quality being largely cash, highly rated government bonds and third-party guarantees mostly from well rated banks and insurance companies. These financial institutions are domiciled mainly in European countries and the United States. Furthermore, the Bank has collateral pools of highly liquid assets and mortgages (principally consisting of residential properties mainly in Germany) for the homogeneous retail portfolio.
176 |
Deutsche Bank | ||
Annual Report 2022 | ||
Main Credit Exposure Categories
The tables in this section show details about several of Deutsche Bank’s main credit exposure categories, namely Loans, Revocable and Irrevocable Lending Commitments, Contingent Liabilities, Over-The-Counter (“OTC”) Derivatives, Debt Securities and Repo and repo-style transactions:
- – “Loans” are gross loans as reported on our balance sheet at amortized cost, loans at fair value through profit and loss and loans at fair value through other comprehensive income before deduction of allowance for credit losses. This includes “Traded loans” that are bought and held for the purpose of selling them in the near term, or the material risks of which have all been hedged or sold. From a regulatory perspective the latter category principally covers trading book positions.
- – “Revocable and irrevocable lending commitments” consist of the undrawn portion of revocable and irrevocable lending-related commitments.
- – “Contingent liabilities” consist of financial and performance guarantees, standby letters of credit and other similar arrangements (mainly indemnity agreements).
- – “OTC derivatives” are the bank’s credit exposures from over-the-counter derivative transactions that the Group has entered into, after netting and cash collateral received. On the bank’s balance sheet, these are included in financial assets at fair value through profit or loss or, for derivatives qualifying for hedge accounting, in other assets, in either case only applying cash collateral received and netting eligible under IFRS.
- – “Debt securities” include debentures, bonds, deposits, notes or commercial paper, which are issued for a fixed term and redeemable by the issuer, as reported on our balance sheet within accounting categories at amortized cost and at fair value through other comprehensive income before deduction of allowance for credit losses, it also includes category at fair value through profit and loss. This includes “Traded bonds”, which are bonds, deposits, notes or commercial paper that are bought and held for the purpose of selling them in the near term. From a regulatory perspective the latter category principally covers trading book positions.
- – “Repo and repo-style transactions” consist of reverse repurchase transactions, as well as securities or commodities borrowing transactions, only applying collateral received and netting eligible under IFRS.
Although considered in the monitoring of maximum credit exposures, the following are not included in the details of the Group’s main credit exposure: brokerage and securities related receivables, cash and central bank balances, interbank balances (without central banks), assets held for sale, accrued interest receivables, traditional securitization positions.
Unless stated otherwise, the tables below reflect credit exposure before the consideration of collateral and risk mitigation or structural enhancements, except for OTC derivatives wherein they are post credit enhancements
Main Credit Exposure Categories by Business Divisions
| Dec 31, 2022 | |||||||||||||
Loans | Off-balance sheet | OTC derivatives | ||||||||||||
in € m. | at amortized cost¹ | trading - | Designated / | at fair value | Revocable and | Contingent | at fair value | |||||||
Corporate Bank | 121,543 | 497 | 312 | 3,797 | 155,299 | 61,134 | 72 | |||||||
Investment Bank | 103,072 | 7,198 | 883 | 272 | 51,299 | 3,515 | 24,353 | |||||||
Private Bank | 264,893 | 7 | 7 | 0 | 43,737 | 2,503 | 388 | |||||||
Asset Management | 23 | 0 | 0 | 0 | 92 | 9 | 0 | |||||||
Capital Release Unit | 1,753 | 253 | 3 | 0 | 39 | 25 | 3,767 | |||||||
Corporate & Other | (2,781)8 | 0 | 0 | 0 | 555 | 27 | 387 | |||||||
Total | 488,504 | 7,955 | 1,205 | 4,069 | 251,021 | 67,214 | 28,967 | |||||||
| Dec 31, 2022 | |||||||||||||
Debt Securities | Repo and repo-style transactions⁷ | Total | ||||||||||||
in € m. | at amortized cost⁵ | at fair value | at fair value | at amortized cost | at fair value | at fair value | ||||||||
Corporate Bank | 617 | 12 | 0 | 1,042 | 0 | 0 | 344,326 | |||||||
Investment Bank | 4,800 | 82,947 | 1,606 | 10,437 | 74,662 | 0 | 365,044 | |||||||
Private Bank | 804 | 3 | 2 | 0 | 0 | 0 | 312,345 | |||||||
Asset Management | 0 | 3,728 | 80 | 0 | 0 | 0 | 3,932 | |||||||
Capital Release Unit | 0 | 141 | 0 | 0 | 103 | 0 | 6,083 | |||||||
Corporate & Other | 19,375 | 1,193 | 23,763 | 0 | 6,504 | 2,156 | 51,180 | |||||||
Total | 25,596 | 88,025 | 25,450 | 11,479 | 81,270 | 2,156 | 1,082,910 | |||||||
1Includes stage 3 and stage 3 POCI loans at amortized cost amounting to € 12.2 billion as of December 31, 2022
2Includes stage 3 and stage 3 POCI loans at fair value through OCI amounting to € 54.9 million as of December 31, 2022
3Includes stage 3 and stage 3 POCI off-balance sheet exposure amounting to € 2.6 billion as of December 31, 2022
4Includes the effect of netting agreements and cash collateral received where applicable. Excludes derivatives qualifying for hedge accounting
5Includes stage 3 and stage 3 POCI debt securities at amortized cost amounting to € 327.6 million as of December 31, 2022
6Includes stage 3 and stage 3 POCI debt securities at fair value through OCI amounting to € 15.1 million as of December 31, 2022
7Before reflection of collateral and limited to securities purchased under resale agreements and securities borrowed
8Negative balance in Corporate and Other business loans at amortized cost is due to portfolio hedge accounting program principally related to Private Bank’s mortgages business
177 |
Deutsche Bank | ||
Annual Report 2022 | ||
| Dec 31, 2021 | |||||||||||||
Loans | Off-balance sheet | OTC derivatives | ||||||||||||
in € m. | at amortized cost¹ | trading - | Designated / | at fair value | Revocable and | Contingent | at fair value | |||||||
Corporate Bank | 122,310 | 255 | 311 | 4,169 | 143,2448 | 55,560 | 190 | |||||||
Investment Bank | 92,966 | 8,590 | 702 | 202 | 50,768 | 1,764 | 17,415 | |||||||
Private Bank | 254,439 | 0 | 7 | 0 | 39,660 | 1,883 | 524 | |||||||
Asset Management | 23 | 0 | 1 | 0 | 110 | 9 | 0 | |||||||
Capital Release Unit | 2,222 | 344 | 15 | 0 | 41 | 31 | 5,813 | |||||||
Corporate & Other | 4,117 | 0 | 0 | 0 | 608 | 146 | 203 | |||||||
Total | 476,077 | 9,189 | 1,035 | 4,370 | 234,432 | 59,394 | 24,146 | |||||||
| Dec 31, 2021 | |||||||||||||
Debt Securities | Repo and repo-style transactions⁷ | Total | ||||||||||||
in € m. | at amortized cost⁵ | at fair value | at fair value | at amortized cost | at fair value | at fair value | ||||||||
Corporate Bank | 839 | 15 | 0 | 862 | 0 | 0 | 327,754 | |||||||
Investment Bank | 3,332 | 88,692 | 1,045 | 6,692 | 74,441 | 0 | 346,608 | |||||||
Private Bank | 525 | 1 | 2 | 0 | 0 | 0 | 297,041 | |||||||
Asset Management | 0 | 3,582 | 154 | 0 | 0 | 0 | 3,879 | |||||||
Capital Release Unit | 0 | 625 | 0 | 0 | 3,397 | 0 | 12,489 | |||||||
Corporate & Other | 10,154 | 2,452 | 22,177 | 879 | 448 | 1,231 | 42,415 | |||||||
Total | 14,849 | 95,367 | 23,377 | 8,433 | 78,286 | 1,231 | 1,030,186 | |||||||
1Includes stage 3 and stage 3 POCI loans at amortized cost amounting to € 12.4 billion as of December 31, 2021
2Includes stage 3 and stage 3 POCI loans at fair value through OCI amounting to € 28.1 million as of December 31, 2021
3Includes stage 3 and stage 3 POCI off-balance sheet exposure amounting to € 2.6 billion as of December 31, 2021
4Includes the effect of netting agreements and cash collateral received where applicable. Excludes derivatives qualifying for hedge accounting
5Includes stage 3 and stage 3 POCI debt securities at amortized cost amounting to € 368.2 million as of December 31, 2021
6Includes stage 3 and stage 3 POCI debt securities at fair value through OCI amounting to € 15.8 million as of December 31, 2021
7Before reflection of collateral and limited to securities purchased under resale agreements and securities borrowed
8Prior year’s comparatives aligned to presentation in the current year
Deutsche Bank’s total main credit exposure increased by € 52.7 billion year-on-year.
- – In terms of business divisions, total main credit exposure increased by € 18.4 billion in the Investment Bank, € 16.6 billion in the Corporate Bank, € 15.3 billion in the Private Bank and € 8.8 billion in Corporate & Other partially offset by decrease in the Capital Release Unit by € 6.4 billion. The business division Corporate & Other primarily contains exposures in Treasury.
- – From a product perspective, exposure increases have been observed for all the products included in main credit exposures by business divisions.
178 |
Deutsche Bank | ||
Annual Report 2022 | ||
Main Credit Exposure Categories by Industry Sectors
The below tables give an overview of the bank’s credit exposure by industry based on the NACE code of the counterparty. NACE (Nomenclature des Activités Économiques dans la Communauté Européenne) is a standard European industry classification system and does not have to be congruent with an internal risk based view applied elsewhere in this report.
| Dec 31, 2022 | |||||||||||||
Loans | Off-balance sheet | OTC derivatives | ||||||||||||
in € m. | at amortized cost¹ | trading - | Designated / | at fair value | Revocable and | Contingent | at fair value | |||||||
Agriculture, forestry and fishing | 524 | 2 | 0 | 0 | 275 | 17 | 2 | |||||||
Mining and quarrying | 2,392 | 248 | 40 | 0 | 5,636 | 2,644 | 41 | |||||||
Manufacturing | 30,534 | 380 | 7 | 1,431 | 58,584 | 13,053 | 1,863 | |||||||
Electricity, gas, steam and air conditioning supply | 4,893 | 107 | 75 | 28 | 6,479 | 3,779 | 145 | |||||||
Water supply, sewerage, waste management and remediation activities | 725 | 0 | 0 | 0 | 457 | 158 | 245 | |||||||
Construction | 4,239 | 233 | 0 | 21 | 3,198 | 2,927 | 75 | |||||||
Wholesale and retail trade, repair of motor vehicles and motorcycles | 21,535 | 224 | 39 | 806 | 16,947 | 6,795 | 570 | |||||||
Transport and storage | 5,547 | 409 | 22 | 90 | 6,254 | 1,061 | 170 | |||||||
Accommodation and food service activities | 1,965 | 7 | 0 | 0 | 1,137 | 110 | 14 | |||||||
Information and communication | 7,002 | 489 | 62 | 231 | 14,567 | 3,317 | 960 | |||||||
Financial and insurance activities⁸ | 116,558 | 3,186 | 620 | 969 | 74,787 | 28,173 | 22,881 | |||||||
Real estate activities⁹ | 47,973 | 1,556 | 101 | 41 | 7,251 | 192 | 452 | |||||||
Professional, scientific and technical activities | 7,013 | 124 | 0 | 0 | 5,070 | 2,309 | 108 | |||||||
Administrative and support service activities | 7,470 | 199 | 192 | 62 | 5,101 | 1,062 | 413 | |||||||
Public administration and defense, compulsory social security | 5,287 | 552 | 10 | 128 | 6,767 | 60 | 398 | |||||||
Education | 249 | 0 | 0 | 0 | 125 | 53 | 169 | |||||||
Human health services and social work activities | 4,523 | 31 | 0 | 0 | 1,898 | 146 | 36 | |||||||
Arts, entertainment and recreation | 1,128 | 1 | 0 | 50 | 1,507 | 106 | 83 | |||||||
Other service activities | 4,152 | 206 | 39 | 210 | 4,037 | 793 | 68 | |||||||
Activities of households as employers, undifferentiated goods- and services-producing activities of households for own use | 214,795 | 0 | 0 | 1 | 30,943 | 455 | 189 | |||||||
Activities of extraterritorial organizations and bodies | 1 | 0 | 0 | 0 | 0 | 2 | 85 | |||||||
Total | 488,504 | 7,955 | 1,205 | 4,069 | 251,021 | 67,214 | 28,967 | |||||||
179 |
Deutsche Bank | ||
Annual Report 2022 | ||
| Dec 31, 2022 | |||||||||||||
Debt Securities | Repo and repo-style transactions⁷ | Total | ||||||||||||
in € m. | at amortized cost⁵ | at fair value | at fair value | at amortized cost | at fair value | at fair value | ||||||||
Agriculture, forestry and fishing | 0 | 8 | 0 | 0 | 0 | 0 | 828 | |||||||
Mining and quarrying | 34 | 362 | 2 | 0 | 0 | 0 | 11,398 | |||||||
Manufacturing | 64 | 983 | 41 | 0 | 0 | 0 | 106,939 | |||||||
Electricity, gas, steam and air conditioning supply | 78 | 732 | 35 | 1,515 | 0 | 0 | 17,867 | |||||||
Water supply, sewerage, waste management and remediation activities | 0 | 23 | 0 | 0 | 0 | 0 | 1,609 | |||||||
Construction | 29 | 621 | 1 | 0 | 0 | 0 | 11,344 | |||||||
Wholesale and retail trade, repair of motor vehicles and motorcycles | 0 | 357 | 2 | 0 | 0 | 0 | 47,275 | |||||||
Transport and storage | 117 | 537 | 14 | 0 | 0 | 0 | 14,220 | |||||||
Accommodation and food service activities | 0 | 26 | 0 | 0 | 0 | 0 | 3,259 | |||||||
Information and communication | 108 | 579 | 2 | 0 | 0 | 0 | 27,317 | |||||||
Financial and insurance activities⁸ | 4,669 | 18,440 | 4,421 | 9,965 | 75,497 | 2,156 | 362,322 | |||||||
Real estate activities⁹ | 405 | 1,703 | 548 | 0 | 0 | 0 | 60,222 | |||||||
Professional, scientific and technical activities | 27 | 206 | 115 | 0 | 0 | 0 | 14,973 | |||||||
Administrative and support service activities | 39 | 268 | 5 | 0 | 0 | 0 | 14,811 | |||||||
Public administration and defense, compulsory social security | 19,782 | 59,291 | 19,991 | 0 | 5,768 | 0 | 118,034 | |||||||
Education | 0 | 113 | 17 | 0 | 0 | 0 | 727 | |||||||
Human health services and social work activities | 88 | 49 | 12 | 0 | 0 | 0 | 6,783 | |||||||
Arts, entertainment and recreation | 0 | 125 | 0 | 0 | 0 | 0 | 3,001 | |||||||
Other service activities | 115 | 2,636 | 18 | 0 | 4 | 0 | 12,277 | |||||||
Activities of households as employers, undifferentiated goods- and services-producing activities of households for own use | 0 | 0 | 0 | 0 | 0 | 0 | 246,383 | |||||||
Activities of extraterritorial organizations and bodies | 40 | 964 | 229 | 0 | 0 | 0 | 1,322 | |||||||
Total | 25,596 | 88,025 | 25,450 | 11,479 | 81,270 | 2,156 | 1,082,910 | |||||||
1Includes stage 3 and stage 3 POCI loans at amortized cost amounting to € 12.2 billion as of December 31, 2022
2Includes stage 3 and stage 3 POCI loans at fair value through OCI amounting to € 54.9 million as of December 31, 2022
3Includes stage 3 and stage 3 POCI off-balance sheet exposure amounting to € 2.6 billion as of December 31, 2022
4Includes the effect of netting agreements and cash collateral received where applicable. Excludes derivatives qualifying for hedge accounting
5Includes stage 3 and stage 3 POCI debt securities at amortized cost amounting to € 327.6 million as of December 31, 2022
6Includes stage 3 and stage 3 POCI debt securities at fair value through OCI amounting to € 15.1 million as of December 31, 2022
7Before reflection of collateral and limited to securities purchased under resale agreements and securities borrowed
8Includes exposure to Corporates including Holding Companies of € 85 billion, Asset-Backed Securities of € 43 billion, Banks of € 54 billion, Insurance of € 15 billion, Financial Intermediaries of € 22 billion and Public Sector of € 13 billion, all based on internal client classification
9Non-recourse Commercial Real Estate ‘focus’ portfolio is € 33 billion
180 |
Deutsche Bank | ||
Annual Report 2022 | ||
| Dec 31, 2021 | |||||||||||||
Loans | Off-balance sheet | OTC derivatives | ||||||||||||
in € m. | at amortized cost¹ | trading - | Designated / | at fair value | Revocable and | Contingent | at fair value | |||||||
Agriculture, forestry and fishing | 645 | 2 | 0 | 0 | 593 | 36 | 3 | |||||||
Mining and quarrying | 2,783 | 190 | 0 | 33 | 5,220 | 1,893 | 32 | |||||||
Manufacturing | 35,404 | 348 | 26 | 1,042 | 51,706 | 11,612 | 5,034 | |||||||
Electricity, gas, steam and air conditioning supply | 4,548 | 226 | 46 | 0 | 5,068 | 2,807 | 360 | |||||||
Water supply, sewerage, waste management and remediation activities | 681 | 0 | 0 | 0 | 484 | 175 | 67 | |||||||
Construction | 4,374 | 234 | 2 | 40 | 2,939 | 2,714 | 256 | |||||||
Wholesale and retail trade, repair of motor vehicles and motorcycles | 21,285 | 196 | 34 | 930 | 16,368 | 7,135 | 298 | |||||||
Transport and storage | 5,330 | 334 | 87 | 316 | 5,729 | 947 | 515 | |||||||
Accommodation and food service activities | 2,259 | 5 | 0 | 8 | 1,308 | 136 | 7 | |||||||
Information and communication | 6,363 | 286 | 80 | 658 | 13,837 | 2,896 | 924 | |||||||
Financial and insurance activities | 106,343 | 3,219 | 578 | 1,099 | 68,41410 | 24,361 | 13,369 | |||||||
Real estate activities⁹ | 40,629 | 2,478 | 30 | 83 | 6,486 | 208 | 822 | |||||||
Professional, scientific and technical activities | 6,959 | 63 | 0 | 0 | 5,245 | 2,147 | 85 | |||||||
Administrative and support service activities | 9,759 | 472 | 71 | 22 | 5,114 | 816 | 496 | |||||||
Public administration and defense, compulsory social security | 6,183 | 757 | 12 | 124 | 6,51910 | 105 | 1,037 | |||||||
Education | 225 | 0 | 0 | 0 | 132 | 56 | 255 | |||||||
Human health services and social work activities | 3,869 | 111 | 25 | 0 | 1,646 | 141 | 157 | |||||||
Arts, entertainment and recreation | 1,062 | 6 | 0 | 0 | 1,899 | 88 | 56 | |||||||
Other service activities | 4,941 | 262 | 44 | 14 | 4,790 | 810 | 91 | |||||||
Activities of households as employers, undifferentiated goods- and services-producing activities of households for own use | 212,434 | 0 | 0 | 1 | 30,934 | 311 | 253 | |||||||
Activities of extraterritorial organizations and bodies | 1 | 0 | 0 | 0 | 0 | 2 | 31 | |||||||
Total | 476,077 | 9,189 | 1,035 | 4,370 | 234,432 | 59,394 | 24,146 | |||||||
181 |
Deutsche Bank | ||
Annual Report 2022 | ||
| Dec 31, 2021 | |||||||||||||
Debt Securities | Repo and repo-style transactions⁷ | Total | ||||||||||||
in € m. | at amortized cost⁵ | at fair value | at fair value | at amortized cost | at fair value | at fair value | ||||||||
Agriculture, forestry and fishing | 0 | 12 | 0 | 0 | 0 | 0 | 1,291 | |||||||
Mining and quarrying | 4 | 371 | 2 | 0 | 0 | 0 | 10,529 | |||||||
Manufacturing | 4 | 1,746 | 37 | 0 | 0 | 0 | 106,960 | |||||||
Electricity, gas, steam and air conditioning supply | 15 | 601 | 1 | 0 | 0 | 0 | 13,669 | |||||||
Water supply, sewerage, waste management and remediation activities | 0 | 22 | 0 | 0 | 0 | 0 | 1,429 | |||||||
Construction | 60 | 456 | 10 | 0 | 0 | 0 | 11,086 | |||||||
Wholesale and retail trade, repair of motor vehicles and motorcycles | 6 | 335 | 2 | 0 | 0 | 0 | 46,589 | |||||||
Transport and storage | 306 | 888 | 1 | 0 | 0 | 0 | 14,452 | |||||||
Accommodation and food service activities | 0 | 91 | 0 | 0 | 0 | 0 | 3,814 | |||||||
Information and communication | 78 | 1,007 | 9 | 0 | 0 | 0 | 26,137 | |||||||
Financial and insurance activities⁸ | 3,542 | 18,588 | 4,511 | 8,428 | 76,317 | 1,231 | 330,001 | |||||||
Real estate activities⁹ | 381 | 2,405 | 129 | 0 | 0 | 0 | 53,650 | |||||||
Professional, scientific and technical activities | 28 | 176 | 157 | 0 | 0 | 0 | 14,860 | |||||||
Administrative and support service activities | 27 | 323 | 3 | 0 | 0 | 0 | 17,103 | |||||||
Public administration and defense, compulsory social security | 10,185 | 63,108 | 18,216 | 0 | 1,957 | 0 | 108,203 | |||||||
Education | 0 | 275 | 0 | 0 | 0 | 0 | 942 | |||||||
Human health services and social work activities | 0 | 468 | 0 | 0 | 0 | 0 | 6,417 | |||||||
Arts, entertainment and recreation | 0 | 131 | 0 | 0 | 0 | 0 | 3,241 | |||||||
Other service activities | 174 | 2,693 | 14 | 5 | 12 | 0 | 13,849 | |||||||
Activities of households as employers, undifferentiated goods- and services-producing activities of households for own use | 0 | 0 | 0 | 0 | 0 | 0 | 243,933 | |||||||
Activities of extraterritorial organizations and bodies | 40 | 1,671 | 287 | 0 | 0 | 0 | 2,032 | |||||||
Total | 14,849 | 95,367 | 23,377 | 8,433 | 78,286 | 1,231 | 1,030,186 | |||||||
1Includes stage 3 and stage 3 POCI loans at amortized cost amounting to € 12.4 billion as of December 31, 2021
2Includes stage 3 and stage 3 POCI loans at fair value through OCI amounting to € 28.1 million as of December 31, 2021
3Includes stage 3 and stage 3 POCI off-balance sheet exposure amounting to € 2.6 billion as of December 31, 2021
4Includes the effect of netting agreements and cash collateral received where applicable. Excludes derivatives qualifying for hedge accounting
5Includes stage 3 and stage 3 POCI debt securities at amortized cost amounting to € 368.2 million as of December 31, 2021
6Includes stage 3 and stage 3 POCI debt securities at fair value through OCI amounting to € 15.8 million as of December 31, 2021
7Before reflection of collateral and limited to securities purchased under resale agreements and securities borrowed
8Includes exposure to Corporates including Holding Companies of € 79 billion, Asset-Backed Securities of € 37 billion, Banks of € 49 billion, Insurance of € 11 billion, Financial Intermediaries of € 23 billion and Public Sector of € 11 billion, all based on internal client classification
9Non-recourse Commercial Real Estate ‘focus’ portfolio is € 31 billion
10 Prior year’s comparatives aligned to presentation in the current year
182 |
Deutsche Bank | ||
Annual Report 2022 | ||
The portfolio is subject to the same credit underwriting requirements stipulated in the bank’s “Principles for Managing Credit Risk”, including various controls according to single name, country, industry and product/asset class-specific concentration.
Material transactions, such as loans underwritten with the intention to sell down or distribute part of the risk to third parties, are subject to review and approval by senior credit risk management professionals and (depending upon size) an underwriting committee and/or the Management Board. High emphasis is placed on structuring and pricing such transactions so that de-risking can be achieved in a timely manner and – where Deutsche Bank takes market price risk – to mitigate such market risk.
The Group’s amortized cost loan exposure within above categories is mostly to good quality borrowers. Moreover, with the focus on the Corporate Bank and Investment Bank, loan exposure is subject to further risk mitigation through the bank’s e.g. Strategic Corporate Lending unit.
Deutsche Bank’s household loan exposure is principally associated with Private Bank portfolios.
The bank’s amortized cost loan exposure of € 48.0 billion to Real Estate activities above is based on NACE code classification. The Commercial Real Estate (“CRE”) ‘focus’ portfolio of € 33 billion included in the bank’s loan portfolio is comprised of non-recourse CRE lending in the core CRE business units within the Investment Bank and Corporate Bank.
The Group’s commercial real estate loans, primarily originated in the U.S. and Europe, are generally secured by first mortgages on the underlying real estate property. Deutsche Bank originates fixed and floating rate loans and selectively acquires (generally at substantial discount) sub- /non-performing loans sold by financial institutions. The underwriting process is stringent and the exposure is managed under separate portfolio limits. Credit underwriting policy guidelines provide that LTV ratios of generally less than 75% are adhered to at loan origination. Additionally, given the significance of the underlying collateral, independent external appraisals are commissioned for all secured loans by a valuation team (part of the independent Credit Risk Management function) which is also responsible for reviewing and challenging the reported real estate values regularly. Deutsche Bank originates loans for distribution in the banking market or via securitization. In this context Deutsche Bank frequently retains a portion of the syndicated loans while securitized positions may be entirely sold (except where regulation requires retention of economic risk). Mezzanine or other junior tranches of debt are retained only in exceptional cases. The bank also participates in conservatively underwritten unsecured lines of credit to well-capitalized real estate investment trusts and other real estate operating companies.
Commercial real estate property valuations and rental incomes can be significantly impacted by macro-economic conditions and idiosyncratic events affecting the underlying properties. Accordingly, the portfolio is categorized as higher risk and hence subject to the aforementioned tight restrictions on concentration.
The Group’s credit exposure to ten largest counterparties accounted for 11% of the bank’s aggregated total credit exposure in these categories as of December 31, 2022, compared with 8% as of December 31, 2021. The top ten counterparty exposures were well-rated counterparties or otherwise related to structured trades which show high levels of risk mitigation.
Deutsche Bank’s exposure to Financial and Insurance Activities is € 362.3 billion as of December 31, 2022 which also includes exposures to Asset Backed Securities, Banks, Insurance, Financial intermediaries, Public Sector as well as to Corporates including Holding Companies. Exposures are managed using bespoke risk management frameworks, trade-by-trade approvals and relevant risk appetite metrics. Total loans across all applicable measurement categories amounted to € 121.3 billion, total repo and repo style transactions across all applicable measurement categories amounted to € 87.6 billion and off-balance sheet activities amounted to € 103.0 billion as of December 31, 2022 and were principally associated with Investment Bank and Corporate Bank portfolios, which were majorly held in North America and Europe.
183 |
Deutsche Bank | ||
Annual Report 2022 | ||
Main credit exposure categories by geographical region
Dec 31, 2022 | ||||||||||||||
Loans | Off-balance sheet | OTC derivatives | ||||||||||||
in € m. | at amortized cost¹ | trading - | Designated / | at fair value | Revocable | Contingent | at fair value | |||||||
Europe | 338,920 | 2,647 | 724 | 1,708 | 142,035 | 41,773 | 19,293 | |||||||
Of which: | ||||||||||||||
Germany | 234,705 | 444 | 42 | 462 | 80,857 | 16,364 | 4,872 | |||||||
United Kingdom | 7,937 | 184 | 229 | 329 | 9,759 | 4,067 | 6,673 | |||||||
France | 3,696 | 99 | 75 | 70 | 7,264 | 2,095 | 1,364 | |||||||
Luxembourg | 15,472 | 400 | 67 | 124 | 7,525 | 747 | 855 | |||||||
Italy | 24,578 | 145 | 8 | 25 | 3,709 | 5,354 | 291 | |||||||
Netherlands | 9,009 | 165 | 45 | 200 | 8,279 | 2,519 | 1,404 | |||||||
Spain | 17,429 | 326 | 8 | 107 | 3,460 | 4,037 | 503 | |||||||
Ireland | 5,234 | 125 | 234 | 129 | 3,234 | 266 | 565 | |||||||
Switzerland | 6,772 | 32 | 0 | 117 | 7,277 | 2,897 | 294 | |||||||
Poland | 2,324 | 0 | 0 | 26 | 758 | 190 | 7 | |||||||
Belgium | 1,532 | 12 | 0 | 77 | 1,730 | 571 | 193 | |||||||
Russian Federation⁸ | 537 | 18 | 0 | 41 | 75 | 64 | 0 | |||||||
Ukraine⁸ | 44 | 2709 | 0 | 0 | 3 | 5 | 0 | |||||||
Other Europe⁸ | 9,650 | 428 | 16 | 0 | 8,105 | 2,598 | 2,274 | |||||||
North America | 101,736 | 2,998 | 350 | 1,687 | 98,137 | 11,766 | 5,542 | |||||||
Of which: | ||||||||||||||
U.S. | 87,794 | 2,713 | 290 | 1,520 | 92,551 | 10,585 | 4,485 | |||||||
Cayman Islands | 5,202 | 103 | 4 | 23 | 2,026 | 445 | 419 | |||||||
Canada | 1,919 | 78 | 2 | 118 | 1,884 | 463 | 372 | |||||||
Other North America | 6,821 | 104 | 54 | 25 | 1,676 | 274 | 266 | |||||||
Asia/Pacific | 39,502 | 1,517 | 109 | 602 | 9,268 | 12,507 | 3,910 | |||||||
Of which: | ||||||||||||||
Japan | 1,349 | 120 | 46 | 22 | 589 | 487 | 374 | |||||||
Australia | 2,964 | 196 | 0 | 0 | 2,478 | 769 | 259 | |||||||
India | 7,861 | 27 | 3 | 23 | 1,154 | 3,408 | 179 | |||||||
China | 4,189 | 3 | 12 | 3 | 407 | 1,583 | 591 | |||||||
Singapore | 5,402 | 390 | 22 | 164 | 1,408 | 1,258 | 277 | |||||||
Hong Kong | 2,525 | 84 | 0 | 40 | 695 | 846 | 357 | |||||||
Other Asia/Pacific | 15,213 | 698 | 25 | 351 | 2,537 | 4,154 | 1,873 | |||||||
Other geographical areas | 8,346 | 793 | 22 | 72 | 1,580 | 1,168 | 222 | |||||||
Total | 488,504 | 7,955 | 1,205 | 4,069 | 251,021 | 67,214 | 28,967 | |||||||
184 |
Deutsche Bank | ||
Annual Report 2022 | ||
Dec 31, 2022 | ||||||||||||||
Debt Securities | Repo and repo-style transactions⁷ | Total | ||||||||||||
in € m. | at amortized cost⁵ | at fair value | at fair value | at amortized cost | at fair value | at fair value | ||||||||
Europe | 10,218 | 40,948 | 7,321 | 4,912 | 26,494 | 418 | 637,411 | |||||||
Of which: | ||||||||||||||
Germany | 701 | 7,968 | 672 | 1,795 | 3,035 | 12 | 351,927 | |||||||
United Kingdom | 1,212 | 8,399 | 708 | 585 | 8,519 | 0 | 48,598 | |||||||
France | 0 | 6,161 | 870 | 6 | 7,337 | 0 | 29,038 | |||||||
Luxembourg | 0 | 1,816 | 702 | 0 | 549 | 0 | 28,257 | |||||||
Italy | 4,868 | 3,570 | 953 | 200 | 480 | 0 | 44,180 | |||||||
Netherlands | 0 | 2,057 | 24 | 177 | 212 | 0 | 24,091 | |||||||
Spain | 1,486 | 3,390 | 1 | 1,485 | 24 | 0 | 32,256 | |||||||
Ireland | 1,270 | 1,543 | 4 | 0 | 1,346 | 0 | 13,948 | |||||||
Switzerland | 0 | 491 | 2 | 0 | 215 | 0 | 18,096 | |||||||
Poland | 0 | 113 | 2,944 | 0 | 149 | 0 | 6,511 | |||||||
Belgium | 40 | 2,271 | 342 | 0 | 1 | 0 | 6,769 | |||||||
Russian Federation⁸ | 0 | 15 | 0 | 0 | 0 | 0 | 750 | |||||||
Ukraine⁸ | 0 | 17 | 0 | 0 | 0 | 0 | 339 | |||||||
Other Europe⁸ | 643 | 3,139 | 99 | 664 | 4,628 | 406 | 32,651 | |||||||
North America | 12,359 | 24,416 | 14,616 | 4,365 | 43,893 | 0 | 321,863 | |||||||
Of which: | ||||||||||||||
U.S. | 12,340 | 23,644 | 14,359 | 976 | 21,484 | 0 | 272,741 | |||||||
Cayman Islands | 0 | 276 | 0 | 3,389 | 17,904 | 0 | 29,790 | |||||||
Canada | 0 | 350 | 180 | 0 | 4,494 | 0 | 9,859 | |||||||
Other North America | 19 | 146 | 77 | 0 | 11 | 0 | 9,473 | |||||||
Asia/Pacific | 2,878 | 19,347 | 3,344 | 2,126 | 10,652 | 1,301 | 107,063 | |||||||
Of which: | ||||||||||||||
Japan | 25 | 2,759 | 481 | 284 | 6,374 | 0 | 12,909 | |||||||
Australia | 1,989 | 1,328 | 315 | 0 | 946 | 0 | 11,243 | |||||||
India | 481 | 4,856 | 49 | 0 | 6 | 1,012 | 19,058 | |||||||
China | 0 | 1,384 | 209 | 0 | 292 | 0 | 8,675 | |||||||
Singapore | 0 | 847 | 159 | 0 | 210 | 0 | 10,136 | |||||||
Hong Kong | 186 | 559 | 254 | 0 | 64 | 0 | 5,611 | |||||||
Other Asia/Pacific | 196 | 7,613 | 1,877 | 1,842 | 2,761 | 290 | 39,430 | |||||||
Other geographical areas | 141 | 3,314 | 170 | 77 | 232 | 437 | 16,573 | |||||||
Total | 25,596 | 88,025 | 25,450 | 11,479 | 81,270 | 2,156 | 1,082,910 | |||||||
1Includes stage 3 and stage 3 POCI loans at amortized cost amounting to € 12.2 billion as of December 31, 2022
2Includes stage 3 and stage 3 POCI loans at fair value through OCI amounting to € 54.9 million as of December 31, 2022
3Includes stage 3 and stage 3 POCI off-balance sheet exposure amounting to € 2.6 billion as of December 31, 2022
4Includes the effect of netting agreements and cash collateral received where applicable. Excludes derivatives qualifying for hedge accounting
5Includes stage 3 and stage 3 POCI debt securities at amortized cost amounting to € 327.6 million as of December 31, 2022
6Includes stage 3 and stage 3 POCI debt securities at fair value through OCI amounting to € 15.1 million as of December 31, 2022
7Before reflection of collateral and limited to securities purchased under resale agreements and securities borrowed
8 Thematic addition on back of the ongoing border conflict between the Russian Federation and Ukraine
9Ukraine trading loan exposure driven by financing, materially guaranteed by supranational development bank. Net exposure considering broader risk mitigation structure is deminimis
185 |
Deutsche Bank | ||
Annual Report 2022 | ||
Dec 31, 2021 | ||||||||||||||
Loans | Off-balance sheet | OTC derivatives | ||||||||||||
in € m. | at amortized cost¹ | trading - | Designated / | at fair value | Revocable | Contingent | at fair value | |||||||
Europe | 341,429 | 3,411 | 702 | 1,365 | 136,446 | 35,814 | 13,525 | |||||||
Of which: | ||||||||||||||
Germany | 235,389 | 407 | 20 | 173 | 79,78710 | 14,388 | 1,535 | |||||||
United Kingdom | 6,331 | 529 | 243 | 297 | 8,851 | 2,796 | 4,480 | |||||||
France | 3,581 | 59 | 2 | 55 | 6,840 | 2,179 | 925 | |||||||
Luxembourg | 14,195 | 517 | 82 | 53 | 7,74310 | 713 | 646 | |||||||
Italy | 24,316 | 227 | 9 | 0 | 3,484 | 4,510 | 398 | |||||||
Netherlands | 9,383 | 137 | 102 | 384 | 8,391 | 2,237 | 1,226 | |||||||
Spain | 16,283 | 246 | 0 | 43 | 3,215 | 3,464 | 668 | |||||||
Ireland | 4,652 | 262 | 234 | 72 | 2,687 | 210 | 549 | |||||||
Switzerland | 13,083 | 34 | 0 | 110 | 6,156 | 2,710 | 145 | |||||||
Poland | 2,293 | 0 | 0 | 16 | 401 | 116 | 14 | |||||||
Belgium | 1,426 | 5 | 0 | 76 | 1,724 | 578 | 212 | |||||||
Russian Federation | 806 | 54 | 0 | 51 | 629 | 209 | 27 | |||||||
Ukraine⁸ | 109 | 4419 | 0 | 0 | 3 | 22 | 0 | |||||||
Other Europe⁸ ¹¹ | 9,583 | 492 | 10 | 37 | 6,535 | 1,683 | 2,700 | |||||||
North America | 87,628 | 3,904 | 132 | 2,060 | 87,422 | 9,411 | 7,853 | |||||||
Of which: | ||||||||||||||
U.S. | 73,007 | 3,156 | 91 | 1,836 | 83,05010 | 8,685 | 6,839 | |||||||
Cayman Islands | 5,709 | 157 | 3 | 0 | 1,555 | 80 | 396 | |||||||
Canada | 935 | 291 | 0 | 200 | 1,977 | 419 | 218 | |||||||
Other North America | 7,976 | 301 | 37 | 24 | 839 | 227 | 401 | |||||||
Asia/Pacific | 40,093 | 944 | 185 | 874 | 9,151 | 12,786 | 2,605 | |||||||
Of which: | ||||||||||||||
Japan | 1,921 | 62 | 108 | 48 | 608 | 519 | 656 | |||||||
Australia | 2,112 | 264 | 25 | 0 | 2,248 | 532 | 257 | |||||||
India | 7,948 | 4 | 6 | 18 | 920 | 3,440 | 95 | |||||||
China | 5,606 | 9 | 0 | 42 | 480 | 1,913 | 554 | |||||||
Singapore | 5,750 | 127 | 23 | 135 | 1,157 | 1,566 | 157 | |||||||
Hong Kong | 3,146 | 89 | 0 | 51 | 1,258 | 752 | 181 | |||||||
Other Asia/Pacific | 13,610 | 390 | 23 | 581 | 2,480 | 4,064 | 706 | |||||||
Other geographical areas | 6,926 | 931 | 16 | 71 | 1,414 | 1,383 | 163 | |||||||
Total | 476,077 | 9,189 | 1,035 | 4,370 | 234,432 | 59,394 | 24,146 | |||||||
186 |
Deutsche Bank | ||
Annual Report 2022 | ||
Dec 31, 2021 | ||||||||||||||
Debt Securities | Repo and repo-style transactions⁷ | Total | ||||||||||||
in € m. | at amortized cost⁵ | at fair value | at fair value | at amortized cost | at fair value | at fair value | ||||||||
Europe | 3,464 | 45,063 | 7,578 | 2,745 | 32,525 | 484 | 624,550 | |||||||
Of which: | ||||||||||||||
Germany | 548 | 7,152 | 932 | 274 | 3,301 | 32 | 343,936 | |||||||
United Kingdom | 951 | 8,604 | 1,151 | 571 | 8,824 | 0 | 43,628 | |||||||
France | 0 | 6,482 | 1,411 | 5 | 12,910 | 0 | 34,448 | |||||||
Luxembourg | 57 | 2,471 | 497 | 0 | 971 | 0 | 27,944 | |||||||
Italy | 314 | 3,655 | 315 | 85 | 729 | 0 | 38,042 | |||||||
Netherlands | 212 | 2,157 | 51 | 29 | 38 | 0 | 24,347 | |||||||
Spain | 74 | 7,193 | 199 | 1,126 | 500 | 0 | 33,012 | |||||||
Ireland | 1,143 | 1,264 | 3 | 2 | 3,158 | 0 | 14,237 | |||||||
Switzerland | 3 | 583 | 4 | 0 | 140 | 0 | 22,968 | |||||||
Poland | 0 | 73 | 1,870 | 0 | 76 | 0 | 4,859 | |||||||
Belgium | 33 | 1,932 | 805 | 0 | 7 | 0 | 6,798 | |||||||
Russian Federation⁸ | 0 | 14 | 36 | 0 | 0 | 0 | 1,826 | |||||||
Ukraine⁸ | 0 | 2 | 29 | 0 | 0 | 0 | 606 | |||||||
Other Europe⁸ ¹¹ | 130 | 3,481 | 274 | 653 | 1,870 | 452 | 27,900 | |||||||
North America | 8,618 | 26,899 | 10,363 | 2,551 | 38,688 | 0 | 285,528 | |||||||
Of which: | ||||||||||||||
U.S. | 8,600 | 25,959 | 10,059 | 517 | 26,173 | 0 | 247,972 | |||||||
Cayman Islands | 0 | 238 | 0 | 2,034 | 11,679 | 0 | 21,851 | |||||||
Canada | 0 | 476 | 235 | 0 | 834 | 0 | 5,586 | |||||||
Other North America | 18 | 225 | 69 | 0 | 3 | 0 | 10,119 | |||||||
Asia/Pacific | 2,718 | 21,369 | 5,053 | 2,868 | 7,000 | 508 | 106,154 | |||||||
Of which: | ||||||||||||||
Japan | 25 | 2,951 | 556 | 0 | 3,672 | 0 | 11,127 | |||||||
Australia | 1,597 | 1,726 | 510 | 0 | 515 | 0 | 9,787 | |||||||
India | 617 | 5,067 | 944 | 0 | 253 | 360 | 19,670 | |||||||
China | 16 | 1,576 | 560 | 0 | 594 | 0 | 11,349 | |||||||
Singapore | 9 | 860 | 246 | 0 | 107 | 0 | 10,136 | |||||||
Hong Kong | 213 | 742 | 246 | 0 | 184 | 0 | 6,861 | |||||||
Other Asia/Pacific | 242 | 8,447 | 1,990 | 2,868 | 1,675 | 147 | 37,224 | |||||||
Other geographical areas | 49 | 2,037 | 384 | 268 | 72 | 240 | 13,954 | |||||||
Total | 14,849 | 95,367 | 23,377 | 8,433 | 78,286 | 1,231 | 1,030,186 | |||||||
1Includes stage 3 and stage 3 POCI loans at amortized cost amounting to € 12.4 billion as of December 31, 2021
2Includes stage 3 and stage 3 POCI loans at fair value through OCI amounting to € 28.1 million as of December 31, 2021
3Includes stage 3 and stage 3 POCI off-balance sheet exposure amounting to € 2.6 billion as of December 31, 2021
4Includes the effect of netting agreements and cash collateral received where applicable. Excludes derivatives qualifying for hedge accounting
5Includes stage 3 and stage 3 POCI debt securities at amortized cost amounting to € 368.2 million as of December 31, 2021
6Includes stage 3 and stage 3 POCI debt securities at fair value through OCI amounting to € 15.8 million as of December 31, 2021
7Before reflection of collateral and limited to securities purchased under resale agreements and securities borrowed
8Thematic addition on back of the ongoing border conflict between the Russian Federation and Ukraine
9Ukraine trading loan exposure driven by financing, materially guaranteed by supranational development bank. Net exposure considering broader risk mitigation structure is deminimis
10 Prior year’s comparatives aligned to presentation in the current year
11 Other Europe includes Belarus with a total exposure of less than € 2 million
The tables above give an overview of Deutsche Bank’s credit exposure by geographical region, allocated based on the counterparty’s country of domicile. Aforementioned domicile view does not have to be congruent with an internal risk based view applied elsewhere in this report
The Group’s largest concentration of credit risk within loans from a regional perspective is in its home market Germany, with a significant share in households, which includes the majority of the mortgage lending and home loan business.
Within OTC derivatives, tradable assets as well as repo and repo-style transactions, the largest concentrations from a regional perspective were in Europe and North America.
187 |
Deutsche Bank | ||
Annual Report 2022 | ||
Credit Exposure Classification
Deutsche Bank also classifies its credit exposure along business divisions, which is in line with the divisionally aligned chief risk officer mandates. The section below discloses the credit exposure of the Corporate Bank and the Investment Bank together. The subsequent section provides the credit exposure for the Private Bank.
Corporate Bank and Investment Bank credit exposure
The tables below show the main Corporate Bank and Investment Bank Credit Exposure by product types and internal rating bands. Please refer to section "Measuring Credit Risk" for more details about the bank’s internal ratings.
Main Corporate Bank and Investment Bank credit exposure categories according to the bank’s internal creditworthiness categories of the counterparties – gross
| Dec 31, 2022 | |||||||||||||||
in € m. | Loans | Off-balance sheet | OTC derivatives | |||||||||||||
Ratingband | Probability | at amortized cost | trading - | Designated / | at fair value | Revocable | Contingent | at fair value | ||||||||
iAAA–iAA | > 0.00 ≤ 0.04 | 22,753 | 179 | 128 | 137 | 32,252 | 6,145 | 8,138 | ||||||||
iA | > 0.04 ≤ 0.11 | 43,603 | 344 | 282 | 1,481 | 56,873 | 28,877 | 9,535 | ||||||||
iBBB | > 0.11 ≤ 0.5 | 58,909 | 974 | 249 | 1,476 | 64,674 | 17,103 | 4,040 | ||||||||
iBB | > 0.5 ≤ 2.27 | 59,719 | 2,446 | 143 | 744 | 30,618 | 7,168 | 2,179 | ||||||||
iB | > 2.27 ≤ 10.22 | 30,926 | 2,196 | 101 | 141 | 19,330 | 3,589 | 478 | ||||||||
iCCC and below | > 10.22 ≤ 100 | 8,706 | 1,555 | 291 | 89 | 2,851 | 1,767 | 55 | ||||||||
Total | 224,616 | 7,694 | 1,195 | 4,069 | 206,598 | 64,649 | 24,425 | |||||||||
| Dec 31, 2022 | |||||||||||||||
in € m. | Debt Securities | Repo and repo-style transactions | ||||||||||||||
Ratingband | Probability | at amortized cost | at fair value | at fair value | at amortized cost | at fair value | at fair value | Total | ||||||||
iAAA–iAA | > 0.00 ≤ 0.04 | 1,565 | 45,619 | 150 | 1,110 | 33,990 | − | 152,166 | ||||||||
iA | > 0.04 ≤ 0.11 | 1,850 | 10,753 | 217 | 3,366 | 14,134 | − | 171,315 | ||||||||
iBBB | > 0.11 ≤ 0.5 | 661 | 11,597 | 75 | 2,884 | 9,435 | − | 172,078 | ||||||||
iBB | > 0.5 ≤ 2.27 | 664 | 12,999 | 727 | 2,714 | 16,825 | − | 136,946 | ||||||||
iB | > 2.27 ≤ 10.22 | 347 | 1,502 | 421 | 1,404 | 279 | − | 60,714 | ||||||||
iCCC and below | > 10.22 ≤ 100 | 331 | 489 | 15 | 0 | 0 | − | 16,150 | ||||||||
Total | 5,417 | 82,960 | 1,606 | 11,479 | 74,662 | − | 709,370 | |||||||||
1Reflects the probability of default for a one year time horizon
2Includes the effect of netting agreements and cash collateral received where applicable
Main Corporate Bank and Investment Bank credit exposure categories according to the bank’s internal creditworthiness categories of the counterparties – net
Dec 31, 2022¹ | ||||||||||||||||
in € m. | Loans | Off-balance sheet | OTC derivatives | |||||||||||||
Ratingband | Probability | at amortized cost | trading - | Designated / | at fair value | Revocable | Contingent | at fair value | ||||||||
iAAA–iAA | > 0.00 ≤ 0.04 | 12,790 | 179 | 100 | 24 | 31,486 | 4,128 | 3,414 | ||||||||
iA | > 0.04 ≤ 0.11 | 32,026 | 87 | 282 | 1,354 | 55,080 | 26,877 | 7,069 | ||||||||
iBBB | > 0.11 ≤ 0.5 | 29,648 | 592 | 134 | 1,020 | 60,166 | 13,600 | 2,779 | ||||||||
iBB | > 0.5 ≤ 2.27 | 24,889 | 1,479 | 101 | 538 | 27,922 | 5,724 | 1,831 | ||||||||
iB | > 2.27 ≤ 10.22 | 9,078 | 1,553 | 51 | 132 | 17,751 | 2,262 | 424 | ||||||||
iCCC and below | > 10.22 ≤ 100 | 4,025 | 1,047 | 123 | 89 | 2,765 | 984 | 49 | ||||||||
Total | 112,456 | 4,936 | 791 | 3,157 | 195,169 | 53,576 | 15,565 | |||||||||
188 |
Deutsche Bank | ||
Annual Report 2022 | ||
Dec 31, 2022¹ | ||||||||||||||||
in € m. | Debt Securities | Repo and repo-style transactions | ||||||||||||||
Ratingband | Probability | at amortized cost | at fair value | at fair value | at amortized cost | at fair value | at fair value | Total | ||||||||
iAAA–iAA | > 0.00 ≤ 0.04 | 1,565 | 45,619 | 150 | 11 | 0 | − | 99,465 | ||||||||
iA | > 0.04 ≤ 0.11 | 1,850 | 10,753 | 217 | 180 | 47 | − | 135,823 | ||||||||
iBBB | > 0.11 ≤ 0.5 | 661 | 11,263 | 75 | 0 | 174 | − | 120,113 | ||||||||
iBB | > 0.5 ≤ 2.27 | 391 | 12,687 | 202 | 171 | 1,909 | − | 77,845 | ||||||||
iB | > 2.27 ≤ 10.22 | 143 | 922 | 368 | 0 | 0 | − | 32,682 | ||||||||
iCCC and below | > 10.22 ≤ 100 | 120 | 394 | 15 | 0 | 0 | − | 9,611 | ||||||||
Total | 4,730 | 81,638 | 1,028 | 362 | 2,130 | − | 475,538 | |||||||||
1Net of eligible collateral, guarantees and hedges based on IFRS requirements
2Reflects the probability of default for a one year time horizon
The tables below show the main Corporate Bank and Investment Bank credit exposure for 2021 by product types and internal rating bands.
Main Corporate Bank and Investment Bank credit exposure categories according to the bank’s internal creditworthiness categories of the counterparties – gross
| Dec 31, 2021 | |||||||||||||||
in € m. | Loans | Off-balance sheet | OTC derivatives | |||||||||||||
Ratingband | Probability | at amortized cost | trading - | Designated / | at fair value | Revocable | Contingent | at fair value | ||||||||
iAAA–iAA | > 0.00 ≤ 0.04 | 23,066 | 130 | 13 | 159 | 26,7533 | 3,545 | 4,008 | ||||||||
iA | > 0.04 ≤ 0.11 | 41,041 | 138 | 202 | 1,151 | 57,5573 | 27,267 | 4,502 | ||||||||
iBBB | > 0.11 ≤ 0.5 | 61,562 | 789 | 192 | 1,967 | 57,3003 | 14,362 | 2,710 | ||||||||
iBB | > 0.5 ≤ 2.27 | 51,617 | 4,058 | 296 | 857 | 26,794 | 6,799 | 5,923 | ||||||||
iB | > 2.27 ≤ 10.22 | 29,606 | 2,333 | 111 | 207 | 22,360 | 3,479 | 373 | ||||||||
iCCC and below | > 10.22 ≤ 100 | 8,385 | 1,397 | 198 | 29 | 3,247 | 1,872 | 90 | ||||||||
Total | 215,276 | 8,845 | 1,013 | 4,370 | 194,011 | 57,324 | 17,606 | |||||||||
| Dec 31, 2021 | |||||||||||||||
in € m. | Debt Securities | Repo and repo-style transactions | ||||||||||||||
Ratingband | Probability | at amortized cost | at fair value | at fair value | at amortized cost | at fair value | at fair value | Total | ||||||||
iAAA–iAA | > 0.00 ≤ 0.04 | 1,253 | 49,214 | 0 | 473 | 35,615 | − | 144,229 | ||||||||
iA | > 0.04 ≤ 0.11 | 1,433 | 11,698 | 108 | 1,127 | 17,831 | − | 164,055 | ||||||||
iBBB | > 0.11 ≤ 0.5 | 439 | 11,786 | 90 | 2,035 | 9,144 | − | 162,378 | ||||||||
iBB | > 0.5 ≤ 2.27 | 265 | 13,621 | 225 | 1,844 | 11,363 | − | 123,659 | ||||||||
iB | > 2.27 ≤ 10.22 | 357 | 1,745 | 590 | 1,475 | 361 | − | 62,995 | ||||||||
iCCC and below | > 10.22 ≤ 100 | 423 | 643 | 32 | 600 | 128 | − | 17,045 | ||||||||
Total | 4,171 | 88,707 | 1,045 | 7,554 | 74,441 | − | 674,362 | |||||||||
1Reflects the probability of default for a one year time horizon
2Includes the effect of netting agreements and cash collateral received where applicable
3Prior year’s comparatives aligned to presentation in the current year
189 |
Deutsche Bank | ||
Annual Report 2022 | ||
Main Corporate Bank and Investment Bank credit exposure categories according to the bank’s internal creditworthiness categories of the counterparties – net
Dec 31, 2021¹ | ||||||||||||||||
in € m. | Loans | Off-balance sheet | OTC derivatives | |||||||||||||
Ratingband | Probability | at amortized cost | trading - | Designated / | at fair value | Revocable | Contingent | at fair value | ||||||||
iAAA–iAA | > 0.00 ≤ 0.04 | 16,959 | 130 | 13 | 45 | 25,5623 | 2,664 | 2,518 | ||||||||
iA | > 0.04 ≤ 0.11 | 31,570 | 53 | 202 | 998 | 55,4213 | 24,751 | 3,087 | ||||||||
iBBB | > 0.11 ≤ 0.5 | 32,646 | 633 | 89 | 1,752 | 54,1263 | 12,207 | 2,287 | ||||||||
iBB | > 0.5 ≤ 2.27 | 26,315 | 2,451 | 208 | 435 | 24,316 | 5,343 | 5,843 | ||||||||
iB | > 2.27 ≤ 10.22 | 10,221 | 1,551 | 45 | 167 | 21,138 | 2,236 | 370 | ||||||||
iCCC and below | > 10.22 ≤ 100 | 4,336 | 961 | 67 | 29 | 3,079 | 1,095 | 90 | ||||||||
Total | 122,047 | 5,779 | 624 | 3,427 | 183,642 | 48,295 | 14,195 | |||||||||
Dec 31, 2021¹ | ||||||||||||||||
in € m. | Debt Securities | Repo and repo-style transactions | ||||||||||||||
Ratingband | Probability | at amortized cost | at fair value | at fair value | at amortized cost | at fair value | at fair value | Total | ||||||||
iAAA–iAA | > 0.00 0.04 | 1,253 | 49,214 | 0 | 16 | 0 | − | 98,375 | ||||||||
iA | > 0.04 ≤ 0.11 | 1,433 | 11,698 | 108 | 0 | 22 | − | 129,344 | ||||||||
iBBB | > 0.11 ≤ 0.5 | 439 | 11,773 | 90 | 67 | 22 | − | 116,130 | ||||||||
iBB | > 0.5 ≤ 2.27 | 260 | 13,583 | 225 | 14 | 259 | − | 79,252 | ||||||||
iB | > 2.27 ≤ 10.22 | 334 | 1,745 | 590 | 0 | 0 | − | 38,397 | ||||||||
iCCC and below | > 10.22 ≤ 100 | 361 | 621 | 32 | 0 | 0 | − | 10,672 | ||||||||
Total | 4,080 | 88,635 | 1,045 | 97 | 304 | − | 472,169 | |||||||||
1Net of eligible collateral, guarantees and hedges based on IFRS requirements
2Reflects the probability of default for a one year time horizon
3Prior year’s comparatives aligned to presentation in the current year
The above tables show an overall increase in the Corporate Bank and Investment Bank gross exposure in 2022 of € 35.0 billion or 5%. Loans at amortized cost increased by € 9.3 billion mainly driven by growth across businesses. Off-balance sheet positions increased by € 19.9 billion mainly driven by new commitments and guarantees issued during the period. OTC derivatives increased by € 6.8 billion mainly in interest rate products and Repo and repo-style transactions increased by € 4.1 billion in Investment Bank. From a regional perspective, the increase was primarily attributable to counterparties domiciled in the United States, Germany and United Kingdom. These increases were partly offset by a decrease in Debt securities of € 3.9 billion due to reduction in long bond inventory position.
The Group uses risk mitigation techniques as described above to optimize Corporate Bank and Investment Bank credit exposures and reduce potential credit losses. The tables for “net” exposure disclose the development of the bank’s Corporate Bank and Investment Bank credit exposures net of collateral, guarantees and hedges.
Risk Mitigation for Credit Exposure
Strategic Corporate Lending (“SCL”) unit helps mitigate the risk of the bank’s corporate credit exposures. The notional amount of SCL’s risk reduction activities increased from € 31.7 billion as of December 31, 2021, to € 33.9 billion as of December 31, 2022, mainly driven by new issuance activity in Origination & Advisory business.
As of year-end 2022, SCL mitigated the credit risk of € 27.5 billion of loans and lending-related commitments, through synthetic collateralized loan obligations supported predominantly by financial guarantees. This position totaled € 27.0 billion as of December 31, 2021.
SCL also held credit derivatives with an underlying notional amount of € 6.4 billion as of December 31, 2022. The position totaled € 4.7 billion as of December 31, 2021. The credit derivatives used for the bank’s portfolio management activities are accounted for at fair value.
The bank makes use of hedging also in other businesses to reduce single name concentration risks and utilizes private risk insurance and export credit agency cover to manage noncollateralized exposures.
190 |
Deutsche Bank | ||
Annual Report 2022 | ||
Private Bank credit exposure
Private Bank credit exposure, credit exposure in stage 3 and net credit costs
Total exposure | of which loan book | Credit exposure stage 3 | Net credit costs | |||||||||||||
Dec 31, 2022 | Dec 31, 2021 | Dec 31, 2022 | Dec 31, 2021 | Dec 31, 2022 | Dec 31, 2021 | Dec 31, 2022 | Dec 31, 2021 | |||||||||
PB Germany | 198,102 | 194,486 | 174,611 | 169,639 | 2,632 | 2,668 | 0.11% | 0.12% | ||||||||
Consumer Finance | 29,529 | 29,638 | 15,594 | 15,360 | 1,373 | 1,446 | 0.80% | 0.77% | ||||||||
Mortgage | 163,611 | 159,825 | 155,249 | 150,082 | 1,163 | 1,187 | (0.01%) | 0.00% | ||||||||
Business Finance | 1,292 | 1,310 | 898 | 905 | 6 | 7 | 0.04% | 0.07% | ||||||||
Other | 3,670 | 3,713 | 2,870 | 3,291 | 90 | 27 | 0% | 0.01% | ||||||||
International Private Bank | 114,243 | 102,556 | 90,283 | 84,800 | 3,401 | 4,037 | 0.32% | 0.21% | ||||||||
Consumer Finance | 10,972 | 11,007 | 8,894 | 8,940 | 378 | 435 | 1.11% | 0.71% | ||||||||
Mortgage | 12,133 | 12,950 | 12,033 | 12,889 | 431 | 701 | (0.05%) | 0.21% | ||||||||
Business Finance | 15,130 | 13,226 | 12,898 | 11,320 | 1,048 | 968 | 0.76% | 0.83% | ||||||||
Wealth Management | 75,214 | 64,553 | 56,425 | 51,570 | 1,543 | 1,933 | 0.17% | 0.00% | ||||||||
Other | 794 | 819 | 33 | 81 | 0 | 0 | 0.02% | (0.01%) | ||||||||
Total | 312,345 | 297,041 | 264,893 | 254,439 | 6,033 | 6,705 | 0.19% | 0.15% | ||||||||
1Net credit costs for the twelve months period ended at the respective balance sheet date divided by the total exposure at that balance sheet date.
Consumer Finance is divided into personal instalment loans, credit lines and credit cards. Consumer Finance business is uncollateralized, loan risk depends on client quality. Various lending requirements are stipulated, including (but not limited to) client rating, maximum loan amounts and maximum tenors, and are adapted to regional conditions and/or circumstances of the borrower (i.e., for consumer loans a maximum loan amount taking into account customer net income). Given the largely homogeneous nature of this portfolio, counterparty credit-worthiness and ratings are predominately derived by utilizing an automated decision engine.
Mortgage business is the financing of residential properties (primarily owner-occupied) sold by various business channels in Europe, primarily in Germany but also in Spain and Italy. The level of credit risk of the mortgage loan portfolio is determined by assessing the quality of the client and the underlying collateral. The loan amounts are generally larger than Consumer Finance loans and they are extended for longer time horizons. Based on the bank’s underwriting criteria and processes and the diversified portfolio (customers/properties) with respective collateralization, the mortgage portfolio is categorized as lower risk, while consumer finance is categorized as high risk.
Business Finance represents credit products for small businesses, SME up to large corporates. Products range from current accounts and credit lines to investment loans or revolving facilities, factoring, leasing and derivatives. Clients are located primarily in Italy and Spain, but credit can also be extended to subsidiaries abroad, mostly in Europe.
Wealth Management offers customized wealth management solutions and private banking services including discretionary portfolio management and traditional and alternative investment solutions, complemented by structured risk management, wealth planning, lending and family office services for wealth, high-net-worth (HNW) and ultra-high-net-worth (UHNW) individuals and family offices. Wealth Management’s total exposure is divided into Lombard Lending (against readily marketable liquid collateral / securities) and Structured Lending (against less liquid collateral). While the level of credit risk for the Lombard portfolio is determined by assessing the quality of the underlying collateral, the level of credit risk for the structured portfolio is determined by assessing both the quality of the client and the collateral. Products range from secured Lombard and mortgage loans to current accounts (Europe only), credit lines and other loans; to a lesser extent derivatives and contingencies. Clients are located globally.
Private Bank mortgage loan-to-value1
| Dec 31, 2022 | Dec 31, 2021 | ||
≤ 50% | 63% | 64% | ||
> 50 ≤ 70% | 17% | 17% | ||
> 70 ≤ 90% | 11% | 10% | ||
> 90 ≤ 100% | 3% | 3% | ||
> 100 ≤ 110% | 2% | 2% | ||
> 110 ≤ 130% | 2% | 2% | ||
> 130% | 2% | 2% | ||
1When assigning the exposure to the corresponding LTV buckets, the exposure amounts are distributed according to their relative share of the underlying assessed real estate value.
The LTV expresses the amount of exposure as a percentage of the underlying real estate value.
191 |
Deutsche Bank | ||
Annual Report 2022 | ||
Our LTV ratios are calculated using the total exposure divided by the current determined value of the respective properties. These values are monitored and updated if necessary, on a regular basis. The exposure of transactions that are additionally backed by liquid collateral is reduced by the respective collateral values, whereas any prior charges increase the corresponding total exposure. The LTV calculation includes exposure which is secured by real estate collateral. Any mortgage lending exposure that is collateralized exclusively by any other type of collateral is not included in the LTV calculation.
The creditor’s creditworthiness, the LTV and the quality of collateral is an integral part of our risk management when originating loans and when monitoring and steering our credit risks. In general, we are willing to accept higher LTV’s, the better the creditor’s creditworthiness is. Nevertheless, restrictions of LTV apply e.g. for countries with negative economic outlook or expected declines of real estate values.
As of December 31, 2022, 63% of our exposure related to the mortgage lending portfolio had an LTV ratio below or equal to 50%, slightly lower compared to the prior year.
Credit Exposure from Derivatives
All exchange traded derivatives are cleared through central counterparties (“CCPs”), the rules and regulations of which provide for daily margining of all current and future credit risk positions emerging out of such transactions. To the extent possible, the bank also uses CCP services for OTC derivative transactions (“OTC clearing”); thereby the bank benefits from the credit risk mitigation achieved through the CCP’s settlement system.
The Dodd-Frank Act provides for an extensive framework for the regulation of OTC derivatives, including mandatory clearing, platform trading and transaction reporting of certain OTC derivatives, as well as rules regarding registration, capital, margin, business conduct standards, recordkeeping and other requirements for swap dealers, security-based swap dealers, major swap participants and major security-based swap participants. The Dodd-Frank Act and related CFTC rules require OTC clearing in the United States for certain standardized OTC derivative transactions, including certain interest rate swaps and index credit default swaps. Margin requirements for non-cleared derivative transactions in the US started in September 2016. The European Regulation (EU) No 648/2012 on OTC Derivatives, Central Counterparties and Trade Repositories (“EMIR”) introduced a number of risk mitigation techniques for non-centrally cleared OTC derivatives in 2013 and the reporting of OTC and exchange traded derivatives in 2014. Mandatory clearing of certain standardized OTC derivatives transactions in the EU began in June 2016, and margin requirements for un-cleared OTC derivative transactions in the EU started in February 2017. Deutsche Bank implemented the exchange of both initial and variation margin in the EU from February 2017 for the first category of counterparties subject to the EMIR margin for un-cleared derivatives requirements.
The CFTC has adopted rules implementing the most significant provisions of the Dodd-Frank Act. More recently, in September 2020, the CFTC issued a final rule on the cross-border application of U.S. swap rules, which builds on, and in some cases supersedes the CFTC’s cross-border guidance from 2013 and related no-action relief letters. In October 2020, also pursuant to the Dodd-Frank Act, the CFTC finalized regulations to impose position limits on certain commodities and economically equivalent swaps, futures and options.
The SEC has also finalized rules regarding registration, trade reporting, capital, margin, risk mitigation techniques, business conduct standards, trade acknowledgement and verification, recordkeeping and financial reporting, and cross-border requirements for security-based swap dealers and major security-based swap participants. Compliance with these requirements was generally required as of November 2021.
Finally, U.S. prudential regulators (the Federal Reserve, the FDIC, the Office of the Comptroller of the Currency, the Farm Credit Administration and the Federal Housing Finance Agency) have adopted final rules establishing margin requirements for non-cleared swaps and security-based swaps that are applicable to swap dealers and security-based swap dealers that are subject to U.S. prudential regulations (such as Deutsche Bank) in lieu of the CFTC’s and the SEC’s margin rules. Deutsche Bank implemented the exchange of both initial and variation margin for uncleared derivatives in the U.S. from September 2016, for the first category of counterparties subject to the U.S. prudential regulators’ margin requirements. Additional initial margin requirements for smaller counterparties have been phased in from September 2017 through September 2022, with the relevant compliance dates depending in each case on the transactional volume of the parties and their affiliates.
192 |
Deutsche Bank | ||
Annual Report 2022 | ||
The following table shows a breakdown of notional amounts and gross market values for assets and liabilities of exchange traded and OTC derivative transactions on the basis of clearing channel.
Notional amounts of derivatives on basis of clearing channel and type of derivative
| Dec 31, 2022 | |||||||||||||
Notional amount maturity distribution | ||||||||||||||
in € m. | Within 1 year | > 1 and | After 5 years | Total | Positive | Negative | Net | |||||||
Interest rate related: | ||||||||||||||
OTC | 14,487,820 | 10,421,941 | 7,332,258 | 32,242,019 | 144,155 | 132,350 | 11,805 | |||||||
Bilateral (Amt) | 1,422,223 | 2,200,127 | 1,501,758 | 5,124,107 | 118,768 | 107,854 | 10,914 | |||||||
CCP (Amt) | 13,065,597 | 8,221,814 | 5,830,501 | 27,117,911 | 25,387 | 24,496 | 891 | |||||||
Exchange-traded | 515,543 | 117,763 | 45 | 633,351 | 663 | 624 | 39 | |||||||
Total Interest rate related | 15,003,362 | 10,539,704 | 7,332,304 | 32,875,370 | 144,818 | 132,974 | 11,844 | |||||||
Currency related: | ||||||||||||||
OTC | 6,368,113 | 1,007,862 | 403,215 | 7,779,190 | 141,531 | 135,670 | 5,861 | |||||||
Bilateral (Amt) | 6,246,281 | 998,771 | 403,037 | 7,648,090 | 140,039 | 134,420 | 5,619 | |||||||
CCP (Amt) | 121,831 | 9,090 | 178 | 131,100 | 1,492 | 1,250 | 242 | |||||||
Exchange-traded | 19,869 | 0 | 0 | 19,869 | 17 | 20 | (3) | |||||||
Total Currency related | 6,387,981 | 1,007,862 | 403,215 | 7,799,058 | 141,548 | 135,690 | 5,858 | |||||||
Equity/index related: | ||||||||||||||
OTC | 14,769 | 8,447 | 1,021 | 24,236 | 598 | 2,012 | (1,414) | |||||||
Bilateral (Amt) | 14,769 | 8,447 | 1,021 | 24,236 | 598 | 2,012 | (1,414) | |||||||
CCP (Amt) | 0 | 0 | 0 | 0 | 0 | 0 | 0 | |||||||
Exchange-traded | 156,839 | 44,868 | 1,078 | 202,784 | 3,213 | 2,978 | 234 | |||||||
Total Equity/index related | 171,607 | 53,315 | 2,099 | 227,021 | 3,811 | 4,991 | (1,179) | |||||||
Credit derivatives related | ||||||||||||||
OTC | 193,047 | 1,238,463 | 91,903 | 1,523,414 | 9,899 | 8,311 | 1,589 | |||||||
Bilateral (Amt) | 101,699 | 87,969 | 30,933 | 220,600 | 3,611 | 2,078 | 1,533 | |||||||
CCP (Amt) | 91,348 | 1,150,495 | 60,970 | 1,302,813 | 6,288 | 6,233 | 55 | |||||||
Exchange-traded | 0 | 0 | 0 | 0 | 0 | 0 | 0 | |||||||
Total Credit derivatives related | 193,047 | 1,238,463 | 91,903 | 1,523,414 | 9,899 | 8,311 | 1,589 | |||||||
Commodity related: | ||||||||||||||
OTC | 1,827 | 16,546 | 1,492 | 19,865 | 86 | 231 | (144) | |||||||
Bilateral (Amt) | 1,827 | 16,546 | 1,492 | 19,865 | 86 | 230 | (145) | |||||||
CCP (Amt) | 0 | 0 | 0 | 0 | 0 | 0 | 0 | |||||||
Exchange-traded | 21,943 | 1,860 | 0 | 23,803 | 177 | 186 | (9) | |||||||
Total Commodity related | 23,770 | 18,405 | 1,492 | 43,668 | 263 | 416 | (154) | |||||||
Other: | ||||||||||||||
OTC | 48,427 | 4,877 | 106 | 53,410 | 752 | 747 | 5 | |||||||
Bilateral (Amt) | 48,427 | 4,877 | 106 | 53,410 | 752 | 747 | 5 | |||||||
CCP (Amt) | 0 | 0 | 0 | 0 | 0 | 0 | 0 | |||||||
Exchange-traded | 5,250 | 0 | 0 | 5,250 | 12 | 11 | 1 | |||||||
Total Other | 53,676 | 4,877 | 106 | 58,660 | 764 | 758 | 6 | |||||||
Total OTC business | 21,114,002 | 12,698,136 | 7,829,996 | 41,642,134 | 297,022 | 279,320 | 17,702 | |||||||
Total bilateral business | 7,835,226 | 3,316,737 | 1,938,347 | 13,090,309 | 263,854 | 247,341 | 16,513 | |||||||
Total CCP business | 13,278,776 | 9,381,399 | 5,891,650 | 28,551,825 | 33,168 | 31,979 | 1,189 | |||||||
Total exchange-traded business | 719,442 | 164,491 | 1,123 | 885,056 | 4,081 | 3,819 | 262 | |||||||
Total | 21,833,444 | 12,862,626 | 7,831,119 | 42,527,190 | 301,103 | 283,139 | 17,964 | |||||||
Positive market values after netting | − | − | − | − | 29,744 | − | − | |||||||
193 |
Deutsche Bank | ||
Annual Report 2022 | ||
| Dec 31, 2021 | |||||||||||||
Notional amount maturity distribution | ||||||||||||||
in € m. | Within 1 year | > 1 and | After 5 years | Total | Positive | Negative | Net | |||||||
Interest rate related: | ||||||||||||||
OTC | 13,625,153 | 10,672,998 | 6,717,198 | 31,015,349 | 167,037 | 154,392 | 12,645 | |||||||
Bilateral (Amt) | 1,541,797 | 1,976,392 | 1,542,479 | 5,060,668 | 156,247 | 143,526 | 12,721 | |||||||
CCP (Amt) | 12,083,356 | 8,696,606 | 5,174,718 | 25,954,681 | 10,790 | 10,865 | (76) | |||||||
Exchange-traded | 730,798 | 286,032 | 514 | 1,017,344 | 174 | 131 | 43 | |||||||
Total Interest rate related | 14,355,951 | 10,959,030 | 6,717,712 | 32,032,693 | 167,211 | 154,523 | 12,688 | |||||||
Currency related: | ||||||||||||||
OTC | 5,323,845 | 847,188 | 420,701 | 6,591,734 | 108,030 | 108,282 | (252) | |||||||
Bilateral (Amt) | 5,220,578 | 843,099 | 420,511 | 6,484,189 | 107,244 | 107,347 | (103) | |||||||
CCP (Amt) | 103,267 | 4,088 | 190 | 107,545 | 786 | 934 | (148) | |||||||
Exchange-traded | 20,765 | 0 | 0 | 20,765 | 2 | 8 | (6) | |||||||
Total Currency related | 5,344,610 | 847,188 | 420,701 | 6,612,499 | 108,032 | 108,289 | (258) | |||||||
Equity/index related: | ||||||||||||||
OTC | 25,341 | 9,272 | 2,881 | 37,493 | 5,595 | 3,666 | 1,929 | |||||||
Bilateral (Amt) | 25,341 | 9,272 | 2,881 | 37,493 | 5,595 | 3,666 | 1,929 | |||||||
CCP (Amt) | 0 | 0 | 0 | 0 | 0 | 0 | 0 | |||||||
Exchange-traded | 184,194 | 44,141 | 2,286 | 230,621 | 3,455 | 4,723 | (1,267) | |||||||
Total Equity/index related | 209,535 | 53,413 | 5,167 | 268,115 | 9,050 | 8,388 | 661 | |||||||
Credit derivatives related | ||||||||||||||
OTC | 129,185 | 823,005 | 85,102 | 1,037,292 | 15,611 | 16,359 | (748) | |||||||
Bilateral (Amt) | 78,553 | 71,414 | 34,561 | 184,529 | 2,102 | 2,466 | (364) | |||||||
CCP (Amt) | 50,632 | 751,591 | 50,540 | 852,763 | 13,509 | 13,892 | (384) | |||||||
Exchange-traded | 0 | 0 | 0 | 0 | 0 | 0 | 0 | |||||||
Total Credit derivatives related | 129,185 | 823,005 | 85,102 | 1,037,292 | 15,611 | 16,359 | (748) | |||||||
Commodity related: | ||||||||||||||
OTC | 2,764 | 3,419 | 1,421 | 7,605 | 105 | 107 | (2) | |||||||
Bilateral (Amt) | 2,764 | 3,419 | 1,421 | 7,605 | 105 | 107 | (2) | |||||||
CCP (Amt) | 0 | 0 | 0 | 0 | 0 | 0 | 0 | |||||||
Exchange-traded | 27,241 | 1,356 | 0 | 28,598 | 218 | 225 | (6) | |||||||
Total Commodity related | 30,006 | 4,776 | 1,421 | 36,203 | 323 | 332 | (8) | |||||||
Other: | ||||||||||||||
OTC | 40,047 | 3,565 | 157 | 43,769 | 606 | 675 | (69) | |||||||
Bilateral (Amt) | 40,047 | 3,565 | 157 | 43,769 | 606 | 675 | (69) | |||||||
CCP (Amt) | 0 | 0 | 0 | 0 | 0 | 0 | 0 | |||||||
Exchange-traded | 8,786 | 186 | 0 | 8,971 | 5 | 9 | (5) | |||||||
Total Other | 48,832 | 3,751 | 157 | 52,741 | 610 | 684 | (74) | |||||||
Total OTC business | 19,146,335 | 12,359,447 | 7,227,460 | 38,733,243 | 296,983 | 283,480 | 13,503 | |||||||
Total bilateral business | 6,909,080 | 2,907,161 | 2,002,011 | 11,818,253 | 271,899 | 257,787 | 14,111 | |||||||
Total CCP business | 12,237,255 | 9,452,286 | 5,225,448 | 26,914,990 | 25,084 | 25,692 | (608) | |||||||
Total exchange-traded business | 971,784 | 331,716 | 2,800 | 1,306,300 | 3,854 | 5,095 | (1,241) | |||||||
Total | 20,118,119 | 12,691,163 | 7,230,260 | 40,039,542 | 300,837 | 288,575 | 12,262 | |||||||
Positive market values after netting | − | − | − | − | 25,518 | − | − | |||||||
Equity Exposure
The table below presents the carrying values of equity investments according to IFRS definition split by trading and non-trading for the respective reporting dates. Deutsche Bank manages its respective positions within market risk and other appropriate risk frameworks.
Composition of Equity Exposure
in € m. | Dec 31, 2022 | Dec 31, 2021 | ||
Trading Equities | 2,374 | 5,094 | ||
Non-trading Equities¹ | 2,077 | 2,644 | ||
Total Equity Exposure | 4,451 | 7,739 | ||
1Includes equity investment funds amounting to € 101 million as of December 31, 2022 and € 87 million as of December 31, 2021.
As of December 31, 2022, € 2.1 billion of the Group’s trading equities exposure was held by Investment Bank. Overall trading equities decreased by € 2.7 billion year on year driven mainly due to market volatility, option expiry and increased securitizations.
194 |
Deutsche Bank | ||
Annual Report 2022 | ||
Trading Market Risk Exposures
Value-at-Risk Metrics of Trading Units of Deutsche Bank Group
The tables and graph below present the Historic Simulation value-at-risk metrics calculated with a 99% confidence level and a one-day holding period for the Group’s trading units.
Value-at-Risk of Trading Units by Risk Type¹
Total | Diversification | Interest rate | Credit spread | Equity price | Foreign exchange | Commodity price | ||||||||||||||||||||||
in € m. | 2022 | 2021 | 2022 | 2021 | 2022 | 2021 | 2022 | 2021 | 2022 | 2021 | 2022 | 2021 | 2022 | 2021 | ||||||||||||||
Average | 44.0 | 37.5 | (43.3) | (37.2) | 29.4 | 23.1 | 35.4 | 27.9 | 11.4 | 13.0 | 9.7 | 9.5 | 1.5 | 1.1 | ||||||||||||||
Maximum | 71.4 | 69.0 | (21.7) | (21.0) | 48.1 | 38.5 | 58.7 | 60.3 | 21.7 | 20.1 | 15.0 | 25.2 | 4.3 | 7.9 | ||||||||||||||
Minimum | 24.9 | 27.7 | (67.1) | (76.9) | 13.4 | 11.3 | 19.3 | 17.5 | 5.4 | 6.8 | 5.8 | 4.4 | 0.3 | 0.3 | ||||||||||||||
Period-end | 38.3 | 31.1 | (43.3) | (27.0) | 26.0 | 16.6 | 35.0 | 24.1 | 6.4 | 8.3 | 13.6 | 8.1 | 0.5 | 1.0 | ||||||||||||||
1Figures for 2022 as of December 31, 2022. Figures for 2021 as of December 31, 2021.
2Includes value-at-risk from gold and other precious metal positions.
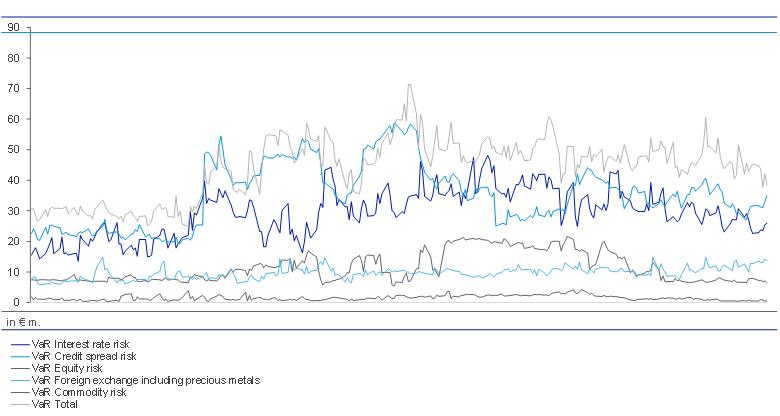
Development of historic simulation value-at-risk by risk types in 2022
The average value-at-risk over 2022 was € 44 million, which increased by € 6.5 million (+17%) compared to the average for 2021; this was primarily driven by inclusion of increased market volatility in the rolling 1yr period mainly impacting interest rates exposures.
195 |
Deutsche Bank | ||
Annual Report 2022 | ||
For regulatory reporting purposes, the incremental risk charge for the respective reporting dates represents the higher of the spot value at the reporting dates, and their preceding 12-week average calculation.
Average, Maximum and Minimum Incremental Risk Charge of Trading Units (with a 99.9% confidence level and one-year capital horizon)1,2,3,
| Total | Credit Trading | Core Rates | Emerging Markets | Other4 | ||||||||||||||||
in € m. | 2022 | 2021 | 2022 | 2021 | 2022 | 2021 | 2022 | 2021 | 2022 | 2021 | |||||||||||
Average | 319.0 | 436.6 | 54.5 | 118.1 | 137.0 | 211.4 | 110.2 | 188.3 | 17.4 | (81.2) | |||||||||||
Maximum | 414.0 | 604.1 | 130.6 | 154.6 | 305.0 | 574.5 | 332.4 | 267.9 | 51.2 | 59.1 | |||||||||||
Minimum | 272.4 | 292.5 | (33.2) | 62.5 | 53.2 | 60.1 | 39.3 | 84.4 | (31.7) | (224.9) | |||||||||||
Period-end | 291.2 | 292.5 | 11.6 | 85.4 | 161.9 | 78.0 | 100.2 | 133.1 | 17.4 | (4.0) | |||||||||||
1Amounts show the bands within which the values fluctuated during the 12-weeks preceding December 31, 2022 and December 31, 2021, respectively.
2Business line breakdowns have been updated for 2022 reporting to better reflect the current business structure.
3All liquidity horizons are set to 12 months.
4Other includes Capital Release Unit.
The incremental risk charge as at the end of 2022 was € 291 million, broadly in line with year-end 2021. The average of the incremental risk charge as at the end of 2022 was € 319 million and thus € 118 million (-27%) lower compared with the average for the period ended December 31, 2021. The decrease in the average incremental risk charge for 2022 was driven by changes in European government bond positions and reduction in long credit index exposure under Fixed Income and Currencies Trading business.
Results of Regulatory Backtesting of Trading Market Risk
In 2022, the Group observed a number of outliers where the Group’s loss on a buy-and-hold basis exceeded the value-at-risk of the Trading books. This was driven by a sharp increase in market volatility in interest rates and credit spreads leading to market moves that were larger than those within the preceding one-year period used in the value-at-risk calculation.
Based on the backtesting results, the analysis of the underlying reasons for outliers and enhancements included in the value-at-risk methodology, the Group continues to believe that the value-at-risk model will remain an appropriate measure for the trading market risk under normal market conditions. The following graph shows the trading units daily buy-and-hold income in comparison to the value-at-risk as of the close of the previous business day for the trading days of the reporting period. The value-at-risk is presented in negative amounts to visually compare the estimated potential loss of the trading positions with the buy and hold income. Figures are shown in millions of euro. The chart shows that the trading units achieved a positive buy and hold income for 84% of the trading days in 2022 as well as displays the global outliers experienced in 2022.
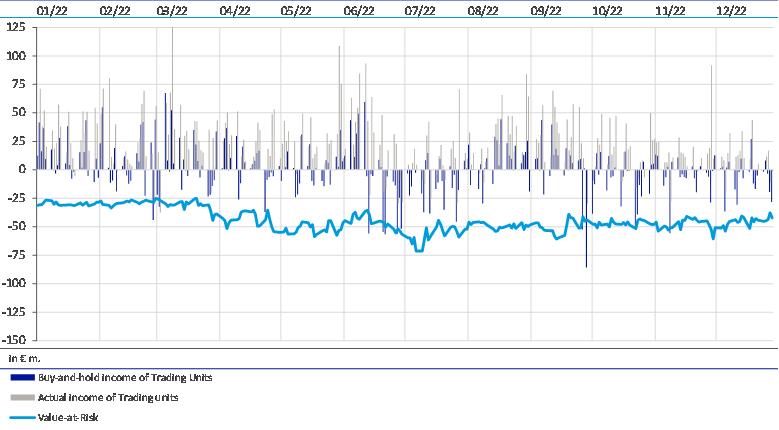
EU MR4 – Comparison of VAR estimates with gains/losses
196 |
Deutsche Bank | ||
Annual Report 2022 | ||
Daily Income of Deutsche Bank Group Trading Units
The following histogram shows the distribution of daily income of Group trading units. Daily income is defined as total income which consists of new trades, fees & commissions, buy & hold income, reserves, carry and other income. It displays the number of trading days on which the Group reached each level of trading income shown on the horizontal axis in millions of euro.
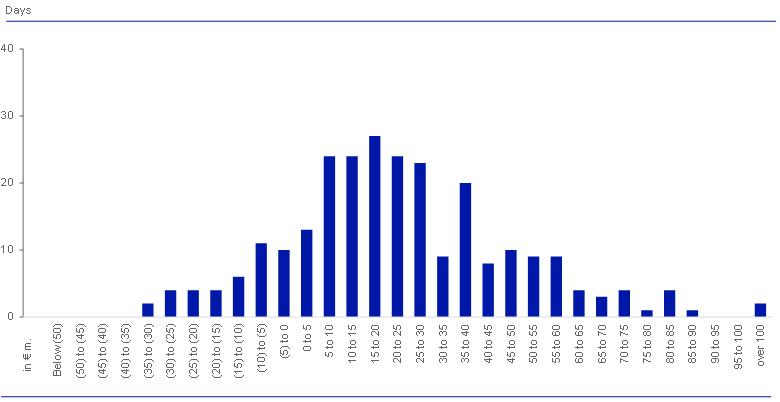
Distribution of daily income of Group’s trading units in 2022
The trading units achieved a positive revenue for 84% of the trading days in 2022 which is same as for the full year 2021.
197 |
Deutsche Bank | ||
Annual Report 2022 | ||
Non-trading Market Risk Exposures
Economic Capital Usage for Non-trading Market Risk
The following table shows the Non-trading Market Risk economic capital usage by risk type:
Economic Capital Usage by risk type.
Economic capital usage | ||||
in € m. | Dec 31, 2022 | Dec 31, 2021 | ||
Interest rate risk | 1,752 | 1,853 | ||
Credit spread risk | 29 | 21 | ||
Equity and Investment risk | 841 | 1,031 | ||
Foreign exchange risk | 1,460 | 1,509 | ||
Pension risk | 803 | 1,128 | ||
Guaranteed funds risk | 82 | 85 | ||
Total non-trading market risk portfolios | 4,968 | 5,628 | ||
The economic capital figures do take into account diversification benefits between the different risk types.
Economic Capital Usage for Non-trading Market Risk totaled € 5.0 billion as of December 31, 2022, which is € 0.6 billion below the economic capital usage at year-end 2021.
- – Interest rate risk. Economic capital charge for interest rate risk in the banking book, including gap risk, basis risk and option risk, such as the risk of a change in client behavior embedded in modelled non-maturity deposits or prepayment risk. In total the economic capital usage for December 31, 2022 was € 1,752 million, compared to € 1,853 million for December 31, 2021.
- – Credit spread risk. Economic capital charge for portfolios in the banking book subject to credit spread risk. Economic capital usage was € 29 million as of December 31, 2022, versus € 21 million as of December 31, 2021.
- – Equity and Investment risk. Economic capital charge for equity risk from a structural short position in the bank’s own share price arising from the Group’s equity compensation plans, and from the non-consolidated investment holdings, such as strategic investments and alternative assets. The economic capital usage was € 841 million as of December 31, 2022, compared with € 1,031 million as of December 31, 2021. The decrease in economic capital contribution was predominately driven by a reduction in the equity compensation short position caused by increasing hedge volumes.
- – Foreign exchange risk. Foreign exchange risk predominantly arises from the Group’s structural position taken to immunize the sensitivity of the bank’s capital ratio against changes in the exchange rates. The economic capital usage was € 1,460 million as of December 31, 2022, versus € 1,509 million as of December 31, 2021.
- – Pension risk. This risk arises from the Group’s defined benefit obligations, including interest rate risk and inflation risk, credit spread risk, equity risk and longevity risk. The economic capital usage was € 803 million and € 1,128 million as of December 31, 2022 and December 31, 2021 respectively. The economic capital usage decrease was mainly driven by reduced credit exposure caused by increasing interest rates.
- – Guaranteed funds risk. Economic capital usage was € 82 million as of December 31, 2022, versus € 85 million as of December 31, 2021.
198 |
Deutsche Bank | ||
Annual Report 2022 | ||
Interest Rate Risk in the Banking Book
The following table shows the impact on the Group’s net interest income in the banking book as well as the change of the economic value for the banking book positions from interest rate changes under the six standard scenarios defined by the EBA:
Economic value & net interest income interest rate risk in the banking book by EBA scenario
Delta EVE | Delta NII¹ | |||||||
in € bn. | Dec 31, 2022 | Dec 31, 2021 | Dec 31, 2022 | Dec 31, 2021 | ||||
Parallel up | (4.6) | (3.5) | 1.9 | 1.4 | ||||
Parallel down | 1.3 | 0.1 | (1.1) | (0.9) | ||||
Steepener | (0.1) | (0.0) | (0.4) | (0.7) | ||||
Flattener | (1.4) | (1.3) | 1.5 | 1.1 | ||||
Short rates up | (2.4) | (1.7) | 2.3 | 1.7 | ||||
Short rates down | 1.2 | 0.4 | (1.2) | (0.9) | ||||
Maximum | (4.6) | (3.5) | (1.2) | (0.9) | ||||
in € bn. | Dec 31, 2022 | Dec 31, 2021 | ||||||
Tier 1 Capital | 56.6 | 55.4 | ||||||
1Delta Net Interest Income (NII) reflects the difference between projected NII in the respective scenario with shifted rates vs. market implied rates. Sensitivities are based on a static balance sheet at constant exchange rates, excluding trading positions and DWS. Figures do not include Mark-to-Market (MtM) / Other Comprehensive Income (OCI) effects on centrally managed positions not eligible for hedge accounting
The maximum economic value of equity loss was € (4.6) billion as of December 2022, compared to € (3.5) billion as of December 2021. As per December 2022 the maximum EVE loss represents 8.1% of Tier 1 Capital.
The maximum economic value of equity (EVE) loss due to a +200 basis points parallel shift of the yield curve across all currencies as defined by the BaFin was € (4.6) billion as of December 2022, representing 6.9% of Total Capital.
The increase in the maximum economic value of equity loss for the ‘Parallel up’ interest rate scenario was mainly driven by changes in risk positions in Deutsche Bank’s Treasury. Those risks are part of the IRRBB framework and are managed via defined risk management.
The maximum one-year loss in net interest income (NII) was € (1.2) billion as of December 2022, compared to € (0.9) billion as of December 2021.
The maximum loss for the 12M net interest income sensitivity for the interest rate down scenario was increased by circa € (0.3) billion.
The increase in the maximum net interest income loss in the short rate down scenario was mainly driven by the increase in Euro interest rates observed in 2022. The increase leads to higher interest rate downward shocks that are applied in floored regulatory standard scenarios with corresponding higher net interest income losses.
Additionally, the higher interest rate environment resulted in a more normalized NIM (Net Interest Margin) in the base scenario compared to a compressed margin in the downwards shock scenario.
The following table shows the variation of the economic value for Deutsche Bank’s banking book positions resulting from downward and upward interest rate shocks by currency:
Economic value interest rate risk in the banking book by currency
Dec 31, 2022 | ||||
in € bn. | Parallel up | Parallel down | ||
EUR | (3.5) | 1.2 | ||
USD | (1.2) | 0.6 | ||
Other | 0.1 | (0.5) | ||
Total | (4.6) | 1.3 | ||
199 |
Deutsche Bank | ||
Annual Report 2022 | ||
Operational risk exposure
Operational risk – risk profile
Operational risk losses by event type (profit and loss view)
in € m. | 2022 | 2021¹ | ||
Clients, Products and Business Practices | 263 | 347 | ||
Others | 158 | 78 | ||
Execution, Delivery and Process Management | 65 | 38 | ||
External Fraud | 28 | 12 | ||
Internal Fraud | 7 | 72 | ||
Natural Disasters and Public Safety | 7 | 6 | ||
Group | 528 | 553 | ||
12021 loss figures revised from prior year presentation due to subsequent capture of losses and reclassification. Losses are reported after offsetting insurance.
As of December 31, 2022, operational losses reduced by € 25 million to € 528 million. The overall reduction in losses was driven by the event type “Internal Fraud” offset partially by increases in “Execution, Delivery and Process Management” and “External Fraud”. Legal losses were broadly stable when aggregating settled matters and changes in litigation reserves for unsettled matters across “Clients, Products and Business Practices” and “Others”.

Operational losses by event type occurred in the period 2022 (2017 - 2021)1
1Percentages in brackets correspond to loss frequency respectively to loss amount for losses occurred in 2017-2021 period. Frequency and amounts can change subsequently.
“Distribution of Operational Losses” (above left) summarizes the proportion of operational risk loss postings by event type using the P&L value in 2022, against the average for the comparative five-year period 2017-2021 (in brackets). The event type “Clients, Products and Business Practices” represents 50% of operational losses and is largely made up of settled matters and changes in litigation reserves for unsettled matters.
“Frequency of Operational Losses” (above right) summarizes the proportion of operational risk events by event type (based on a count of events where losses were first recognized in 2022), against the average for the comparative five-year period 2017-2021 (in brackets). The highest event type frequency, “External Fraud” made up 54% of all observed loss events. Although this event type contributed majorly to the frequency distribution of event losses in 2022, the size of losses experienced were minor compared with other event types.
Whilst the bank seeks to ensure the comprehensive capture of all operational risk loss events with a P&L impact of € 10,000 or greater, the totals shown in this section may be underestimated due to delayed detection and recording of loss events.
200 |
Deutsche Bank | ||
Annual Report 2022 | ||
Liquidity Risk Exposure
Funding Markets and Capital Markets Issuance
The macro environment remained challenging in 2022 with the war in Ukraine and global inflation concerns weighing on markets and negatively impacting credit spreads. Notwithstanding this backdrop, the Bank navigated markets well and successfully executed the 2022 Issuance Plan of € 15-20 billion by year-end.
Looking at the performance of the Bank’s credit in the market, the Bank’s Senior Non-Preferred cash bonds widened vs peers until October-22 but then started to outperform the peer group in EUR and in USD. This outperformance was supported by an upgrade in the Deutsche Bank’s credit rating from Moody’s in October.
This funding was spread across the funding sources as follows: AT1 issuance (€ 2 billion), Tier 2 issuance (€ 2.6 billion), Senior non-preferred issuance (€ 8.8 billion), senior preferred (non-structured) issuance (€ 2.8 billion) and covered bonds (€ 3.5 billion). In addition, the Group issued € 4.3 billion of structured notes, not planned for in the € 15-20 billion 2022 issuance plan. Excluding these structured notes, the Group’s total issuance came to € 19.7 billion. The € 24 billion total 2022 issuance is divided into Euro (€ 13.5 billion), USD (€ 8.9 billion), GBP (€ 0.8 billion) and other currencies aggregated (€ 0.5 billion).
The Group’s investor base for 2022 issuances comprised asset managers and pension funds (40%), retail customers (7%), banks (18%), governments and agencies (1%), insurance companies (9%) and other institutional investors (25%). The geographical distribution was split between Germany (24%), rest of Europe (41%), U.S. (19%), Asia/Pacific (14%) and Other (2%). The average spread of issuance over 3-months-Euribor / risk free rate was 194 basis points for the full year. The average tenor was 5.7 years. Volume-wise, the bank’s issuance activity was evenly split between the first half of 2022 and the second half of 2022. The Group issued the following volumes over each quarter during 2022: first quarter: € 7.3 billion, second quarter: € 4.8 billion, third quarter: € 7.1 billion and fourth quarter: € 4.8 billion.
Deutsche Bank’s issuance plan for 2023 is lower than for 2022 at € 13-18 billion and comprises capital instruments, senior non-preferred, senior preferred and covered bonds. The Group also plans to raise a portion of this funding in U.S. dollar and may enter into cross currency swaps to manage any residual requirements. The Bank has total capital markets maturities, excluding legally exercisable calls, of approximately € 12 billion in 2023.
Funding Diversification
In 2022, total external funding increased by € 18.0 billion from € 937.7 billion at December 31, 2021 to € 955.7 billion at December 31, 2022. The increase was primarily driven by inflows in the Corporate Bank, where deposits increased by € 19.8 billion. DB’s most stable deposits in the Private Bank increased by € 3.9 billion predominately within the International Private Bank. The unsecured Wholesale Funding portfolio increased by € 3.0 billion driven by Deposit inflows. In addition, Capital Markets and Equity increased by € 12.3 billion driven by an increase of € 4.3 billion in Equity and € 7.8 billion in long-term Debt Issuances. The € 19.9 billion decrease of Secured funding and shorts relates to DB’s prepayment of TLTRO of € 11.0 billion as well as a decrease of € 4.1 billion in trading liabilities and € 4.8 billion in repurchase operations.
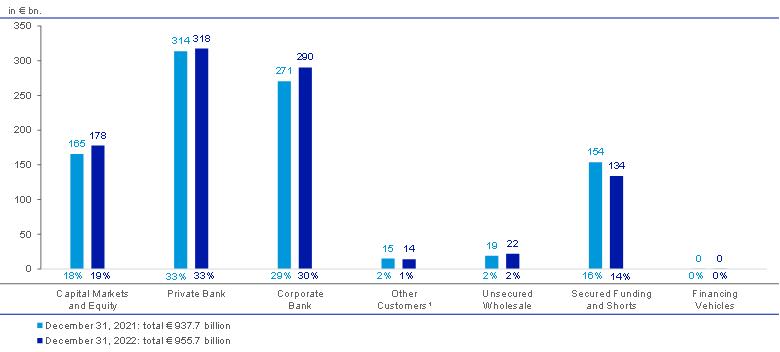
Composition of External Funding Sources
1Other Customers includes fiduciary deposits, X-markets notes and margin/Prime Brokerage cash balances (shown on a net basis).
201 |
Deutsche Bank | ||
Annual Report 2022 | ||
Reference: Reconciliation to total balance sheet of € 1,336.8 billion (€ 1,324.0 billion): Derivatives & settlement balances € 296.5 billion (€ 306.8 billion), add-back for netting effect for margin/Prime Brokerage cash balances (shown on a net basis) € 50.4 billion (€ 49.0 billion), other non-funding liabilities € 34.2 billion (€ 30.5 billion) for December 31, 2022 and December 31, 2021, respectively.
Maturity of unsecured wholesale funding, ABCP and capital markets issuance1
| Dec 31, 2022 | |||||||||||||||
in € m. | Not more | Over | Over | Over | Sub-total | Over | Over | Total | ||||||||
Deposits from banks | 549 | 156 | 528 | 1,200 | 2,432 | 0 | 526 | 2,958 | ||||||||
Deposits from other | 4,477 | 4,448 | 3,502 | 1,690 | 14,118 | 869 | 927 | 15,915 | ||||||||
CDs and CP | 88 | 801 | 1,438 | 782 | 3,109 | 0 | 9 | 3,118 | ||||||||
ABCP | 0 | 0 | 0 | 0 | 0 | 0 | 0 | 0 | ||||||||
Senior non-preferred | 2,271 | 285 | 1,920 | 823 | 5,299 | 13,284 | 33,478 | 52,061 | ||||||||
Senior preferred | 19 | 0 | 125 | 1,077 | 1,221 | 3,610 | 3,897 | 8,727 | ||||||||
Senior structured | 143 | 542 | 1,392 | 940 | 3,017 | 1,958 | 11,064 | 16,040 | ||||||||
Covered bonds/ABS | 518 | 0 | 599 | 389 | 1,506 | 3,084 | 11,799 | 16,389 | ||||||||
Subordinated liabilities | 0 | 10 | 2,581 | 307 | 2,899 | 1,723 | 16,151 | 20,773 | ||||||||
Other | 0 | 0 | 0 | 0 | 0 | 0 | 0 | 0 | ||||||||
Total | 8,066 | 6,242 | 12,086 | 7,208 | 33,601 | 24,528 | 77,851 | 135,980 | ||||||||
Of which: | ||||||||||||||||
Secured | 518 | 0 | 599 | 389 | 1,506 | 3,084 | 11,799 | 16,389 | ||||||||
Unsecured | 7,548 | 6,242 | 11,487 | 6,818 | 32,095 | 21,444 | 66,051 | 119,591 | ||||||||
1Includes additional Tier 1 notes reported as additional equity components in the financial statements. Liabilities with call features are shown at earliest legally exercisable call date. No assumption is made as to whether such calls would be exercised.
Secured funding volume reported post own debt elimination.
202 |
Deutsche Bank | ||
Annual Report 2022 | ||
The total volume of unsecured wholesale liabilities, ABCP and capital markets issuance maturing within one year amount to € 32 billion as of December 31, 2022, and should be viewed in the context of our total Liquidity Reserves of € 256 billion.
| Dec 31, 2021 | |||||||||||||||
in € m. | Not more | Over | Over | Over | Sub-total | Over | Over | Total | ||||||||
Deposits from banks | 1,556 | 572 | 447 | 490 | 3,065 | 63 | 52 | 3,180 | ||||||||
Deposits from other | 4,577 | 3,944 | 1,178 | 2,276 | 11,975 | 617 | 957 | 13,549 | ||||||||
CDs and CP | 242 | 288 | 1,009 | 1,014 | 2,553 | 0 | 0 | 2,553 | ||||||||
ABCP | 0 | 0 | 0 | 0 | 0 | 0 | 0 | 0 | ||||||||
Senior non-preferred | 1,375 | 2,932 | 1,836 | 2,590 | 8,733 | 6,259 | 37,858 | 52,850 | ||||||||
Senior preferred | 3 | 39 | 38 | 9 | 89 | 3,394 | 2,520 | 6,003 | ||||||||
Senior structured | 105 | 487 | 546 | 1,471 | 2,610 | 2,325 | 10,162 | 15,096 | ||||||||
Covered bonds/ABS | 110 | 151 | 723 | 361 | 1,345 | 1,509 | 11,356 | 14,210 | ||||||||
Subordinated liabilities | 0 | 0 | 2,016 | 280 | 2,296 | 1,336 | 13,949 | 17,581 | ||||||||
Other | 213 | 0 | 0 | 0 | 213 | 0 | 0 | 213 | ||||||||
Total | 8,180 | 8,413 | 7,794 | 8,491 | 32,878 | 15,503 | 76,854 | 125,234 | ||||||||
Of which: | ||||||||||||||||
Secured | 110 | 151 | 723 | 361 | 1,345 | 1,509 | 11,356 | 14,210 | ||||||||
Unsecured | 8,070 | 8,262 | 7,070 | 8,130 | 31,533 | 13,994 | 65,497 | 111,024 | ||||||||
The following table shows the currency breakdown of our short-term unsecured wholesale funding, of our ABCP funding and of our capital markets issuance.
Unsecured wholesale funding, ABCP and capital markets issuance (currency breakdown)
| Dec 31,2022 | Dec 31,2021 | ||||||||||||||||||
in € m. | in EUR | in USD | in GBP | in other | Total | in EUR | in USD | in GBP | in other | Total | ||||||||||
Deposits from | 1,216 | 963 | 47 | 732 | 2,958 | 986 | 797 | 414 | 984 | 3,180 | ||||||||||
Deposits from | 4,437 | 9,047 | 278 | 2,152 | 15,915 | 3,346 | 7,946 | 201 | 2,055 | 13,549 | ||||||||||
CDs and CP | 1,035 | 1,423 | 133 | 527 | 3,118 | 1,370 | 837 | 0 | 345 | 2,553 | ||||||||||
ABCP | 0 | 0 | 0 | 0 | 0 | 0 | 0 | 0 | 0 | 0 | ||||||||||
Senior non-preferred | 24,052 | 21,826 | 2,735 | 3,448 | 52,061 | 25,583 | 21,244 | 2,297 | 3,726 | 52,850 | ||||||||||
Senior preferred | 3,125 | 5,415 | 0 | 186 | 8,727 | 1,989 | 3,838 | 0 | 176 | 6,003 | ||||||||||
Senior structured | 6,712 | 7,517 | 24 | 1,785 | 16,040 | 6,720 | 6,395 | 12 | 1,970 | 15,096 | ||||||||||
Covered bonds/ | 16,387 | 2 | 0 | 0 | 16,389 | 14,210 | 0 | 0 | 0 | 14,210 | ||||||||||
Subordinated | 10,070 | 9,597 | 917 | 189 | 20,773 | 8,396 | 8,216 | 774 | 195 | 17,581 | ||||||||||
Other | 0 | 0 | 0 | 0 | 0 | 213 | 0 | 0 | 0 | 213 | ||||||||||
Total | 67,035 | 55,792 | 4,134 | 9,019 | 135,980 | 62,813 | 49,272 | 3,698 | 9,451 | 125,234 | ||||||||||
Of which: | ||||||||||||||||||||
Secured | 16,387 | 2 | 0 | 0 | 16,389 | 14,210 | 0 | 0 | 0 | 14,210 | ||||||||||
Unsecured | 50,648 | 55,790 | 4,134 | 9,019 | 119,591 | 48,603 | 49,272 | 3,698 | 9,451 | 111,024 | ||||||||||
203 |
Deutsche Bank | ||
Annual Report 2022 | ||
Liquidity Reserves
Composition of the Group’s liquidity reserves by parent company (including branches) and subsidiaries
Dec 31, 2022 | Dec 31, 2021 | |||||||
in € bn. | Carrying Value | Liquidity Value | Carrying Value | Liquidity Value | ||||
Available cash and cash equivalents (held primarily at central banks) | 166 | 166 | 181 | 181 | ||||
Parent (incl. foreign branches) | 138 | 138 | 144 | 144 | ||||
Subsidiaries | 28 | 28 | 37 | 37 | ||||
Highly liquid securities (includes government, government | 56 | 56 | 40 | 40 | ||||
Parent (incl. foreign branches) | 35 | 35 | 20 | 20 | ||||
Subsidiaries | 21 | 21 | 20 | 20 | ||||
Other unencumbered central bank eligible securities | 34 | 31 | 20 | 18 | ||||
Parent (incl. foreign branches) | 29 | 26 | 15 | 13 | ||||
Subsidiaries | 5 | 5 | 5 | 5 | ||||
Total liquidity reserves | 256 | 253 | 241 | 239 | ||||
Parent (incl. foreign branches) | 202 | 199 | 179 | 177 | ||||
Subsidiaries | 54 | 54 | 62 | 62 | ||||
As of December 31, 2022, the Group’s liquidity reserves amounted to € 256 billion compared with € 241 billion as of December 31, 2021. The increase of € 15 billion comprised approximately a € 16 billion increase in highly liquid securities and € 14 billion increase in other unencumbered securities, offset by a decrease of € 15 billion in cash and cash equivalents. The development was primarily driven by higher deposits, new capital market issuances, partially offset by ECB’s TLTRO repayment and increased lending activity. The quarterly average of the Group’s Liquidity Reserves for this year is € 252 billion compared with € 247 billion during 2021. In the table above the carrying value represents the market value of the Liquidity Reserves while the liquidity value reflects the bank’s assumption of the value that could be obtained, primarily through secured funding, taking into account the experience observed in secured funding markets at times of stress.
Liquidity Coverage Ratio
The year-end LCR as of December 31, 2022 stands at 141.6% compared to 133.1% as of December 31, 2021.
The Group’s twelve month weighted average LCR was 135%. This has been calculated in accordance with the Commission Delegated Regulation (EU) 2015/61 and the EBA Guidelines on LCR disclosure to complement the disclosure of liquidity risk management under Article 435 CRR.
LCR components
| Dec 31, 2022 | Dec 31, 2021 | ||
in € bn. (unless stated otherwise) | Total adjusted | Total adjusted | ||
Number of data points used in the calculation of averages | 12 | 12 | ||
High Quality Liquid Assets | 218 | 220 | ||
Total net cash outflows | 161 | 155 | ||
Liquidity Coverage Ratio (LCR) in % | 135% | 142% | ||
Funding Risk Management
Structural Funding
All funding matrices (the aggregate currency, the USD and the GBP funding matrix) were in line with the respective risk appetite as of year ends 2022 and 2021.
204 |
Deutsche Bank | ||
Annual Report 2022 | ||
Stress Testing and Scenario Analysis
At the end of 2022 the Group’s stressed Net Liquidity Position stood at € 48 billion compared to €43 billion as at the end of 2021. The predominant driver of the increase was business activities partly offset by methodology changes.
Global All Currency Daily Stress Testing Results
| Dec 31, 2022 | Dec 31, 2021 | ||||||||||
in € bn. | Funding | Gap | Net Liquidity | Funding | Gap | Net Liquidity | ||||||
Systemic market risk | 120 | 234 | 114 | 100 | 215 | 115 | ||||||
1 notch downgrade (DB specific) | 90 | 234 | 145 | 78 | 215 | 137 | ||||||
Severe downgrade (DB specific) | 154 | 251 | 97 | 152 | 235 | 84 | ||||||
Combined³ ⁴ | 205 | 254 | 48 | 195 | 239 | 43 | ||||||
1Funding gap caused by impaired rollover of liabilities and other projected outflows
2Based on liquidity generation through Liquidity Reserves and other business mitigants
3Combined impact of systemic market risk and severe downgrade
4December 2021 sNLP has been updated from € 47.6 billion to € 43.3 billion due to a model change for a product variant in the Investment bank portfolio; this primarily impacts the EUR SNLP which was restated from €21 billion to €18 billion
Global EUR Daily Stress Testing Results
| Dec 31, 2022 | Dec 31, 2021 | ||||||||||
in € bn. | Funding | Gap | Net Liquidity | Funding | Gap | Net Liquidity | ||||||
Combined³ | 95 | 109 | 14 | 91 | 109 | 18 | ||||||
1Funding gap caused by impaired rollover of liabilities and other projected outflows
2Based on liquidity generation through Liquidity Reserves and other business mitigants
3Combined impact of systemic market risk and severe downgrade
Global USD Daily Stress Testing Results
Dec 31, 2022 | Dec 31, 2021 | |||||||||||
in € bn. | Funding | Gap | Net Liquidity | Funding | Gap | Net Liquidity | ||||||
Combined³ | 81 | 103 | 22 | 78 | 88 | 10 | ||||||
1Funding gap caused by impaired rollover of liabilities and other projected outflows
2Based on liquidity generation through Liquidity Reserves and other business mitigants
3Combined impact of systemic market risk and severe downgrade
Global GBP Daily Stress Testing Results
Dec 31, 2022 | Dec 31, 2021 | |||||||||||
in € bn. | Funding Gap¹ | Gap Closure² | Net Liquidity Position | Funding | Gap | Net Liquidity Position | ||||||
Combined³ | 6 | 11 | 5 | 4 | 8 | 4 | ||||||
1Funding gap caused by impaired rollover of liabilities and other projected outflows
2Based on liquidity generation through Liquidity Reserves and other business mitigants
3Combined impact of systemic market risk and severe downgrade
The following table presents the amount needed to meet collateral requirements from contractual obligations in the event of a one- or two-notch downgrade by rating agencies for all currencies.
Contractual Obligations
| Dec 31, 2022 | Dec 31, 2021 | ||||||
in € m. | One-notch | Two-notch | One-notch | Two-notch | ||||
Contractual derivatives funding or margin requirements | 389 | 434 | 205 | 294 | ||||
Other contractual funding or margin requirements | 0 | 0 | 0 | 0 | ||||
205 |
Deutsche Bank | ||
Annual Report 2022 | ||
Net stable funding ratio
The Net Stable Funding Ratio was 120% at the end the fourth quarter of 2022, a surplus to regulatory requirements of € 99 billion as compared to 121% as at the end of the fourth quarter of 2021, a surplus to regulatory requirements of € 105 billion. The decrease was primarily driven by ECB’s TLTRO repayment and increased lending activity, partially offset by higher deposits, new capital market issuances.
Dec 31, 2022 | Dec 31, 2021 | |||
in € bn. (unless stated otherwise) | Total adjusted | Total adjusted | ||
Available stable funding (ASF) | 606 | 602 | ||
Required stable funding (RSF) | 507 | 498 | ||
Net Stable Funding Ratio (NSFR) in % | 120% | 121% | ||
Asset Encumbrance
This section refers to asset encumbrance in the group of institutions consolidated for banking regulatory purposes pursuant to the German Banking Act. Therefore this excludes insurance companies or companies outside the finance sector. Assets pledged by our insurance subsidiaries are included in Note 20 “Assets Pledged and Received as Collateral” of the consolidated financial statements, and restricted assets held to satisfy obligations to insurance companies’ policy holders are included within Note 37 “Information on Subsidiaries” of the consolidated financial statements.
Encumbered assets primarily comprise those on- and off-balance sheet assets that are pledged as collateral against secured funding, collateral swaps, and other collateralized obligations. Additionally, in line with EBA technical standards on regulatory asset encumbrance reporting, assets placed with settlement systems, including default funds and initial margins, as well as other assets pledged which cannot be freely withdrawn such as mandatory minimum reserves at central banks, are considered encumbered. We also include derivative margin receivable assets as encumbered under these EBA guidelines.
Readily available assets are those on- and off-balance sheet assets that are not otherwise encumbered, and which are in freely transferrable form. Unencumbered financial assets at fair value, other than securities borrowed or purchased under resale agreements and positive market value from derivatives, and available for sale investments are all assumed to be readily available.
The readily available value represents the on- and off-balance sheet carrying amount or fair value rather than any form of stressed liquidity value (see the “Liquidity Reserves” for an analysis of unencumbered liquid assets available under a liquidity stress scenario). Other unencumbered on- and off-balance sheet assets are those assets that have not been pledged as collateral against secured funding or other collateralized obligations, or are otherwise not considered to be readily available. Included in this category are securities borrowed or purchased under resale agreements and positive market value from derivatives. Similarly, for loans and other advances to customers, these would only be viewed as readily available to the extent they are already in a pre-packaged transferrable format, and have not already been used to generate funding. This represents the most conservative view given that an element of such loans currently shown in Other assets could be packaged into a format that would be suitable for use to generate funding.
Encumbered and unencumbered assets
| Dec 31, 2022 | |||||||
Carrying value | ||||||||
Unencumbered assets | ||||||||
in € m. | Assets | Encumbered | Readily | Other | ||||
Debt securities | 136 | 59 | 77 | 0 | ||||
Equity instruments | 3 | 1 | 2 | 0 | ||||
Other assets: | ||||||||
Cash and due from banks & Interest earning deposits with Banks | 186 | 14 | 172 | 0 | ||||
Securities borrowed or purchased under resale agreements¹ | 11 | 0 | 0 | 11 | ||||
Financial assets at fair value through profit and loss² | ||||||||
Trading assets | 8 | 0 | 8 | 0 | ||||
Positive market value from derivative financial instruments | 300 | 0 | 0 | 300 | ||||
Securities borrowed or purchased under resale agreements¹ | 82 | 0 | 0 | 82 | ||||
Other financial assets at fair value through profit or loss | 1 | 0 | 1 | 0 | ||||
Financial assets at fair value through other comprehensive income² | 6 | 0 | 4 | 2 | ||||
Loans | 525 | 74 | 14 | 438 | ||||
Other assets | 80 | 47 | 0 | 33 | ||||
Total | 1,339 | 194 | 279 | 866 | ||||
1Securities borrowed and securities purchased under resale agreements are all shown as other unencumbered. The use of the underlying collateral is separately captured in the off-balance sheet table below.
2Excludes Debt securities and Equity instruments (separately disclosed above).
206 |
Deutsche Bank | ||
Annual Report 2022 | ||
| Dec 31, 2022 | |||||||
Fair value of collateral received | ||||||||
Unencumbered assets | ||||||||
in € m. | Assets | Encumbered | Readily | Other | ||||
Collateral received: | 310 | 254 | 48 | 6 | ||||
Debt securities | 299 | 250 | 48 | 0 | ||||
Equity instruments | 2 | 1 | 0 | 0 | ||||
Other collateral received | 9 | 3 | 0 | 6 | ||||
| Dec 31, 2021 | |||||||
Carrying value | ||||||||
Unencumbered assets | ||||||||
in € m. | Assets | Encumbered | Readily | Other | ||||
Debt securities | 131 | 66 | 65 | 0 | ||||
Equity instruments | 7 | 2 | 5 | 0 | ||||
Other assets: | ||||||||
Cash and due from banks & Interest earning deposits with Banks | 199 | 14 | 186 | 0 | ||||
Securities borrowed or purchased under resale agreements¹ | 8 | 0 | 0 | 8 | ||||
Financial assets at fair value through profit and loss² | ||||||||
Trading assets | 10 | 0 | 10 | 0 | ||||
Positive market value from derivative financial instruments | 300 | 0 | 0 | 300 | ||||
Securities borrowed or purchased under resale agreements¹ | 78 | 0 | 0 | 78 | ||||
Other financial assets at fair value through profit or loss | 1 | 0 | 1 | 0 | ||||
Financial assets at fair value through other comprehensive income² | 6 | 0 | 4 | 1 | ||||
Loans | 513 | 86 | 6 | 420 | ||||
Other assets | 73 | 45 | 0 | 28 | ||||
Total | 1,325 | 212 | 277 | 836 | ||||
1Securities borrowed and securities purchased under resale agreements are all shown as other unencumbered. The use of the underlying collateral is separately captured in the off-balance sheet table below.
2Excludes Debt securities and Equity instruments (separately disclosed above).
| Dec 31, 2021 | |||||||
Fair value of collateral received | ||||||||
Unencumbered assets | ||||||||
in € m. | Assets | Encumbered | Readily | Other | ||||
Collateral received: | 260 | 223 | 35 | 2 | ||||
Debt securities | 254 | 219 | 35 | 0 | ||||
Equity instruments | 4 | 4 | 0 | 0 | ||||
Other collateral received | 2 | 0 | 0 | 2 | ||||
Maturity Analysis of Assets and Financial Liabilities
Treasury manages the maturity analysis of assets and liabilities. Modeling of assets and liabilities is necessary in cases where the contractual maturity does not adequately reflect the liquidity risk position. The most significant example in this context would be immediately repayable deposits from retail and transaction banking customers which have consistently displayed high stability throughout even the most severe financial crises.
The modeling profiles are part of the overall liquidity risk management framework (see section “Liquidity Stress Testing and Scenario Analysis” for short-term liquidity positions 1 year and section “Structural Funding” for long-term liquidity positions > 1 year) which is defined and approved by the Management Board.
The following tables present a maturity analysis of total assets based on carrying value and upon earliest legally exercisable maturity as of December 31, 2022 and 2021, respectively.
207 |
Deutsche Bank | ||
Annual Report 2022 | ||
Analysis of the earliest contractual maturity of assets
| Dec 31, 2022 | |||||||||||||||||||
in € m. | On | Up to | Over | Over | Over | Over | Over | Over | Over | Total | ||||||||||
Cash and central bank | 164,090 | 13,138 | 1,639 | 0 | 0 | 29 | 0 | 0 | 0 | 178,897 | ||||||||||
Interbank balances | 6,315 | 265 | 181 | 83 | 166 | 181 | 0 | 0 | 6 | 7,195 | ||||||||||
Central bank funds sold | 0 | 0 | 0 | 0 | 0 | 0 | 0 | 0 | 0 | 0 | ||||||||||
Securities purchased under | 9 | 2,646 | 3,990 | 356 | 519 | 895 | 1,721 | 1,342 | 0 | 11,478 | ||||||||||
With banks | 3 | 305 | 869 | 22 | 5 | 600 | 1,626 | 1,322 | 0 | 4,750 | ||||||||||
With customers | 6 | 2,342 | 3,121 | 334 | 514 | 295 | 95 | 21 | 0 | 6,728 | ||||||||||
Securities borrowed | 0 | 0 | 0 | 0 | 0 | 0 | 0 | 0 | 0 | 0 | ||||||||||
With banks | 0 | 0 | 0 | 0 | 0 | 0 | 0 | 0 | 0 | 0 | ||||||||||
With customers | 0 | 0 | 0 | 0 | 0 | 0 | 0 | 0 | 0 | 0 | ||||||||||
Financial assets at fair value | 410,982 | 47,537 | 6,495 | 3,577 | 3,381 | 3,973 | 2,130 | 655 | 3,646 | 482,376 | ||||||||||
Trading assets | 91,150 | 0 | 0 | 0 | 0 | 1,437 | 0 | 0 | 280 | 92,867 | ||||||||||
Fixed-income securities | 88,153 | 0 | 0 | 0 | 0 | 0 | 0 | 0 | 4 | 88,156 | ||||||||||
Equities and other variable- | 2,098 | 0 | 0 | 0 | 0 | 1,437 | 0 | 0 | 276 | 3,811 | ||||||||||
Other trading assets | 900 | 0 | 0 | 0 | 0 | 0 | 0 | 0 | 0 | 900 | ||||||||||
Positive market values from | 299,686 | 0 | 0 | 0 | 0 | 0 | 0 | 0 | 0 | 299,686 | ||||||||||
Non-trading financial assets mandatory at fair value through profit or loss | 20,145 | 47,537 | 6,495 | 3,577 | 3,381 | 2,443 | 2,130 | 582 | 3,365 | 89,654 | ||||||||||
Securities purchased under | 7,623 | 42,880 | 4,868 | 2,274 | 3,142 | 1,647 | 1,207 | 215 | 0 | 63,855 | ||||||||||
Securities borrowed | 12,445 | 3,594 | 1,167 | 202 | 0 | 0 | 7 | 0 | 0 | 17,414 | ||||||||||
Fixed-income securities | 77 | 390 | 460 | 1,096 | 239 | 153 | 810 | 328 | 2,842 | 6,396 | ||||||||||
Other non-trading financial assets mandatory at fair value through profit or loss | 0 | 673 | 0 | 4 | 0 | 643 | 106 | 39 | 523 | 1,989 | ||||||||||
Financial assets designated at fair value through profit or loss | 0 | 0 | 0 | 0 | 0 | 94 | 0 | 74 | 1 | 168 | ||||||||||
Positive market values from | 0 | 260 | 441 | 225 | 88 | 49 | 15 | 65 | 275 | 1,417 | ||||||||||
Financial assets at fair value | 3 | 3,857 | 1,557 | 803 | 696 | 380 | 1,606 | 11,093 | 11,681 | 31,675 | ||||||||||
Securities purchased under resale agreements | 0 | 2,156 | 0 | 0 | 0 | 0 | 0 | 0 | 0 | 2,156 | ||||||||||
Securities borrowed | 0 | 0 | 0 | 0 | 0 | 0 | 0 | 0 | 0 | 0 | ||||||||||
Debt securities | 0 | 1,305 | 883 | 426 | 413 | 184 | 1,088 | 9,570 | 11,581 | 25,450 | ||||||||||
Loans | 3 | 396 | 673 | 377 | 283 | 195 | 518 | 1,523 | 100 | 4,069 | ||||||||||
Other | 0 | 0 | 0 | 0 | 0 | 0 | 0 | 0 | 0 | 0 | ||||||||||
Loans | 18,559 | 29,007 | 28,590 | 19,767 | 10,310 | 12,875 | 39,165 | 99,180 | 226,246 | 483,700 | ||||||||||
To banks | 199 | 530 | 415 | 490 | 154 | 178 | 2,157 | 2,119 | 906 | 7,148 | ||||||||||
To customers | 18,360 | 28,477 | 28,175 | 19,277 | 10,156 | 12,697 | 37,008 | 97,061 | 225,340 | 476,552 | ||||||||||
Retail | 3,040 | 1,475 | 5,077 | 1,760 | 1,344 | 1,389 | 5,222 | 16,190 | 176,847 | 212,344 | ||||||||||
Corporates and other | 15,320 | 27,001 | 23,098 | 17,517 | 8,813 | 11,308 | 31,786 | 80,871 | 48,493 | 264,208 | ||||||||||
Other financial assets | 66,077 | 9,465 | 2,339 | 3,385 | 1,155 | 3,549 | 3,488 | 4,134 | 16,595 | 110,187 | ||||||||||
Total financial assets | 666,034 | 106,175 | 45,231 | 28,196 | 16,316 | 21,931 | 48,124 | 116,469 | 258,448 | 1,306,924 | ||||||||||
Other assets | 9,158 | 754 | 2 | 3,592 | 5 | 3,442 | 231 | 1,270 | 11,410 | 29,865 | ||||||||||
Total assets | 675,193 | 106,929 | 45,232 | 31,788 | 16,321 | 25,373 | 48,355 | 117,740 | 269,858 | 1,336,788 | ||||||||||
1The positions “Cash and central bank balances” and “Interbank balances (w/o central banks)” include € 761 million cash held with Russian Banks, predominantly with the Central Bank of Russia.
208 |
Deutsche Bank | ||
Annual Report 2022 | ||
| Dec 31, 2021 | |||||||||||||||||||
in € m. | On | Up to | Over | Over | Over | Over | Over | Over | Over | Total | ||||||||||
Cash and central bank | 186,020 | 5,513 | 488 | 0 | 0 | 0 | 0 | 0 | 0 | 192,021 | ||||||||||
Interbank balances | 6,153 | 641 | 191 | 120 | 119 | 114 | 0 | 0 | 4 | 7,342 | ||||||||||
Central bank funds sold | 0 | 0 | 0 | 0 | 0 | 0 | 0 | 0 | 0 | 0 | ||||||||||
Securities purchased under | 178 | 1,979 | 2,042 | 569 | 992 | 144 | 831 | 1,633 | 0 | 8,368 | ||||||||||
With banks | 168 | 1,375 | 740 | 303 | 277 | 8 | 629 | 1,611 | 0 | 5,111 | ||||||||||
With customers | 10 | 604 | 1,302 | 266 | 715 | 136 | 202 | 23 | 0 | 3,257 | ||||||||||
Securities borrowed | 0 | 63 | 0 | 0 | 0 | 0 | 0 | 0 | 0 | 63 | ||||||||||
With banks | 0 | 0 | 0 | 0 | 0 | 0 | 0 | 0 | 0 | 0 | ||||||||||
With customers | 0 | 63 | 0 | 0 | 0 | 0 | 0 | 0 | 0 | 63 | ||||||||||
Financial assets at fair value | 420,971 | 47,776 | 7,155 | 2,514 | 1,190 | 3,577 | 747 | 1,966 | 5,336 | 491,233 | ||||||||||
Trading assets | 100,079 | 0 | 76 | 0 | 0 | 1,815 | 0 | 4 | 423 | 102,396 | ||||||||||
Fixed-income securities | 94,607 | 0 | 0 | 0 | 0 | 0 | 0 | 0 | 130 | 94,737 | ||||||||||
Equities and other variable- | 4,801 | 0 | 76 | 0 | 0 | 1,815 | 0 | 4 | 293 | 6,989 | ||||||||||
Other trading assets | 671 | 0 | 0 | 0 | 0 | 0 | 0 | 0 | 0 | 671 | ||||||||||
Positive market values from | 299,732 | 0 | 0 | 0 | 0 | 0 | 0 | 0 | 0 | 299,732 | ||||||||||
Non-trading financial assets mandatory at fair value through profit or loss | 21,155 | 47,776 | 7,079 | 2,514 | 1,142 | 1,762 | 663 | 1,962 | 4,912 | 88,965 | ||||||||||
Securities purchased under | 6,373 | 44,027 | 5,850 | 1,934 | 895 | 202 | 56 | 594 | 0 | 59,931 | ||||||||||
Securities borrowed | 14,777 | 2,829 | 663 | 86 | 0 | 0 | 0 | 0 | 0 | 18,355 | ||||||||||
Fixed-income securities | 5 | 198 | 374 | 415 | 242 | 726 | 437 | 1,228 | 4,125 | 7,750 | ||||||||||
Other non-trading financial assets mandatory at fair value through profit or loss | 0 | 722 | 193 | 79 | 4 | 834 | 170 | 140 | 787 | 2,929 | ||||||||||
Financial assets designated at fair value through profit or loss | 6 | 0 | 0 | 0 | 48 | 0 | 84 | 1 | 1 | 140 | ||||||||||
Positive market values from | 0 | 124 | 57 | 103 | 11 | 92 | 25 | 223 | 469 | 1,106 | ||||||||||
Financial assets at fair value | 0 | 2,188 | 1,897 | 1,281 | 890 | 738 | 2,236 | 5,970 | 13,778 | 28,979 | ||||||||||
Securities purchased under resale agreements | 0 | 1,231 | 0 | 0 | 0 | 0 | 0 | 0 | 0 | 1,231 | ||||||||||
Securities borrowed | 0 | 0 | 0 | 0 | 0 | 0 | 0 | 0 | 0 | 0 | ||||||||||
Debt securities | 0 | 502 | 950 | 689 | 532 | 626 | 1,772 | 4,560 | 13,746 | 23,377 | ||||||||||
Loans | 0 | 455 | 947 | 593 | 358 | 112 | 464 | 1,410 | 32 | 4,370 | ||||||||||
Other | 0 | 0 | 0 | 0 | 0 | 0 | 0 | 0 | 0 | 0 | ||||||||||
Loans | 16,962 | 39,291 | 27,993 | 23,939 | 11,882 | 12,449 | 29,518 | 89,735 | 219,550 | 471,319 | ||||||||||
To banks | 282 | 885 | 899 | 503 | 274 | 183 | 441 | 3,387 | 753 | 7,607 | ||||||||||
To customers | 16,680 | 38,406 | 27,095 | 23,436 | 11,609 | 12,265 | 29,077 | 86,348 | 218,796 | 463,712 | ||||||||||
Retail | 2,782 | 5,143 | 4,262 | 2,092 | 1,071 | 2,209 | 4,337 | 16,256 | 171,602 | 209,754 | ||||||||||
Corporates and other | 13,898 | 33,263 | 22,833 | 21,343 | 10,537 | 10,056 | 24,740 | 70,093 | 47,195 | 253,958 | ||||||||||
Other financial assets | 65,378 | 7,742 | 1,223 | 1,206 | 1,322 | 3,306 | 4,879 | 3,968 | 8,022 | 97,046 | ||||||||||
Total financial assets | 695,661 | 105,317 | 41,047 | 29,732 | 16,406 | 20,420 | 38,237 | 103,496 | 247,160 | 1,297,477 | ||||||||||
Other assets | 8,445 | 1,258 | 1 | 2,118 | 31 | 2,576 | 130 | 1,372 | 10,585 | 26,516 | ||||||||||
Total assets | 704,106 | 106,575 | 41,048 | 31,851 | 16,437 | 22,996 | 38,367 | 104,868 | 257,744 | 1,323,993 | ||||||||||
1The positions “Cash and central bank balances” and “Interbank balances (w/o central banks)” include € 526 million cash held with Russian Banks, predominantly with the Central Bank of Russia
209 |
Deutsche Bank | ||
Annual Report 2022 | ||
The following tables present a maturity analysis of total liabilities based on carrying value and upon earliest legally exercisable maturity as of December 31, 2022 and 2021, respectively.
Analysis of the earliest contractual maturity of liabilities
| Dec 31, 2022 | |||||||||||||||||||
in € m. | On | Up to | Over | Over | Over | Over | Over | Over | Over | Total | ||||||||||
Deposits | 378,174 | 34,971 | 97,284 | 55,043 | 16,398 | 14,629 | 7,638 | 7,975 | 9,344 | 621,456 | ||||||||||
Due to banks | 41,570 | 1,052 | 9,089 | 8,984 | 6,248 | 1,592 | 2,965 | 5,699 | 7,853 | 85,053 | ||||||||||
Due to customers | 336,605 | 33,919 | 88,196 | 46,059 | 10,150 | 13,038 | 4,673 | 2,276 | 1,491 | 536,404 | ||||||||||
Retail | 155,180 | 5,491 | 58,382 | 28,637 | 1,334 | 1,273 | 943 | 579 | 84 | 251,903 | ||||||||||
Corporates and other | 181,425 | 28,428 | 29,813 | 17,422 | 8,816 | 11,764 | 3,730 | 1,697 | 1,407 | 284,500 | ||||||||||
Trading liabilities | 332,969 | 0 | 0 | 0 | 0 | 0 | 0 | 0 | 0 | 332,969 | ||||||||||
Trading securities | 49,860 | 0 | 0 | 0 | 0 | 0 | 0 | 0 | 0 | 49,860 | ||||||||||
Other trading liabilities | 756 | 0 | 0 | 0 | 0 | 0 | 0 | 0 | 0 | 756 | ||||||||||
Negative market values from | 282,353 | 0 | 0 | 0 | 0 | 0 | 0 | 0 | 0 | 282,353 | ||||||||||
Financial liabilities designed at fair value through profit or loss | 9,686 | 27,208 | 10,285 | 2,175 | 774 | 388 | 852 | 2,355 | 911 | 54,634 | ||||||||||
Securities sold under repurchase agreements | 7,484 | 27,026 | 10,131 | 2,028 | 658 | 228 | 554 | 351 | 55 | 48,517 | ||||||||||
Long-term debt | 1,740 | 60 | 64 | 116 | 113 | 115 | 292 | 1,895 | 854 | 5,250 | ||||||||||
Other financial liabilities | 462 | 122 | 90 | 31 | 2 | 45 | 6 | 109 | 2 | 868 | ||||||||||
Investment contract liabilities | 0 | 0 | 0 | 0 | 0 | 469 | 0 | 0 | 0 | 469 | ||||||||||
Negative market values from | 0 | 144 | 182 | 94 | 78 | 16 | 46 | 47 | 181 | 787 | ||||||||||
Central bank funds purchased | 0 | 0 | 0 | 0 | 0 | 0 | 0 | 0 | 0 | 0 | ||||||||||
Securities sold under repurchase agreements | 170 | 182 | 144 | 20 | 0 | 0 | 25 | 16 | 15 | 573 | ||||||||||
Due to banks | 59 | 101 | 122 | 3 | 0 | 0 | 0 | 0 | 9 | 293 | ||||||||||
Due to customers | 111 | 81 | 23 | 17 | 0 | 0 | 25 | 16 | 6 | 279 | ||||||||||
Securities loaned | 12 | 0 | 0 | 0 | 0 | 0 | 0 | 0 | 0 | 13 | ||||||||||
Due to banks | 1 | 0 | 0 | 0 | 0 | 0 | 0 | 0 | 0 | 1 | ||||||||||
Due to customers | 12 | 0 | 0 | 0 | 0 | 0 | 0 | 0 | 0 | 12 | ||||||||||
Other short term borrowings | 3,002 | 1,878 | 135 | 34 | 9 | 61 | 0 | 0 | 0 | 5,118 | ||||||||||
Long-term debt | 0 | 3,085 | 27,434 | 6,756 | 4,994 | 4,355 | 17,537 | 43,826 | 23,539 | 131,525 | ||||||||||
Debt securities - senior | 0 | 3,050 | 2,068 | 2,510 | 3,206 | 3,791 | 13,091 | 35,427 | 15,413 | 78,556 | ||||||||||
Debt securities - subordi- | 0 | 0 | 25 | 1,309 | 0 | 0 | 36 | 7,095 | 2,670 | 11,135 | ||||||||||
Other long-term debt - senior | 0 | 34 | 25,340 | 2,882 | 1,770 | 501 | 4,385 | 1,242 | 5,433 | 41,588 | ||||||||||
Other long-term debt - | 0 | 0 | 0 | 55 | 18 | 63 | 25 | 62 | 23 | 245 | ||||||||||
Trust Preferred Securities | 0 | 0 | 0 | 500 | 0 | 0 | 0 | 0 | 0 | 500 | ||||||||||
Other financial liabilities | 90,316 | 776 | 996 | 470 | 160 | 1,779 | 723 | 1,136 | 2,517 | 98,873 | ||||||||||
Total financial liabilities | 814,329 | 68,243 | 136,461 | 65,092 | 22,411 | 21,697 | 26,821 | 55,355 | 36,507 | 1,246,916 | ||||||||||
Other liabilities | 17,544 | 0 | 0 | 0 | 0 | 0 | 0 | 0 | 0 | 17,544 | ||||||||||
Total equity | 0 | 0 | 0 | 0 | 0 | 0 | 0 | 0 | 72,328 | 72,328 | ||||||||||
Total liabilities and equity | 831,874 | 68,243 | 136,461 | 65,092 | 22,411 | 21,697 | 26,821 | 55,355 | 108,835 | 1,336,788 | ||||||||||
Off-balance sheet commitments | 45,318 | 11,115 | 15,621 | 22,407 | 12,160 | 24,447 | 43,057 | 105,306 | 38,803 | 318,234 | ||||||||||
Banks | 1,150 | 1,021 | 1,561 | 1,886 | 1,894 | 2,366 | 2,748 | 2,634 | 4,955 | 20,214 | ||||||||||
Retail | 15,916 | 820 | 1,005 | 335 | 608 | 2,212 | 875 | 727 | 8,900 | 31,398 | ||||||||||
Corporates and other | 28,253 | 9,274 | 13,055 | 20,186 | 9,659 | 19,869 | 39,434 | 101,945 | 24,948 | 266,622 | ||||||||||
210 |
Deutsche Bank | ||
Annual Report 2022 | ||
| Dec 31, 2021 | |||||||||||||||||||
in € m. | On | Up to | Over | Over | Over | Over | Over | Over | Over | Total | ||||||||||
Deposits | 393,371 | 23,033 | 95,474 | 49,687 | 10,775 | 9,937 | 4,726 | 7,095 | 9,652 | 603,750 | ||||||||||
Due to banks | 42,195 | 2,312 | 8,091 | 9,328 | 5,619 | 1,637 | 2,374 | 5,105 | 7,652 | 84,315 | ||||||||||
Due to customers | 351,176 | 20,721 | 87,383 | 40,359 | 5,156 | 8,299 | 2,352 | 1,989 | 1,999 | 519,435 | ||||||||||
Retail | 158,038 | 3,040 | 59,964 | 28,293 | 889 | 745 | 416 | 495 | 127 | 252,006 | ||||||||||
Corporates and other | 193,138 | 17,681 | 27,419 | 12,066 | 4,267 | 7,555 | 1,936 | 1,494 | 1,873 | 267,429 | ||||||||||
Trading liabilities | 341,827 | 0 | 0 | 0 | 0 | 0 | 0 | 0 | 0 | 341,827 | ||||||||||
Trading securities | 54,235 | 0 | 0 | 0 | 0 | 0 | 0 | 0 | 0 | 54,235 | ||||||||||
Other trading liabilities | 483 | 0 | 0 | 0 | 0 | 0 | 0 | 0 | 0 | 483 | ||||||||||
Negative market values from | 287,108 | 0 | 0 | 0 | 0 | 0 | 0 | 0 | 0 | 287,108 | ||||||||||
Financial liabilities designed at fair value through profit or loss | 12,038 | 22,809 | 4,219 | 648 | 13,987 | 2,114 | 376 | 1,497 | 780 | 58,468 | ||||||||||
Securities sold under repurchase agreements | 10,802 | 22,069 | 4,077 | 548 | 13,855 | 1,950 | 1 | 3 | 58 | 53,364 | ||||||||||
Long-term debt | 1,008 | 0 | 35 | 36 | 87 | 59 | 368 | 1,439 | 667 | 3,699 | ||||||||||
Other financial liabilities | 228 | 740 | 106 | 64 | 44 | 105 | 7 | 54 | 56 | 1,404 | ||||||||||
Investment contract liabilities | 0 | 0 | 0 | 0 | 0 | 562 | 0 | 0 | 0 | 562 | ||||||||||
Negative market values from | 0 | 317 | 362 | 187 | 188 | 48 | 34 | 252 | 79 | 1,467 | ||||||||||
Central bank funds purchased | 0 | 0 | 0 | 0 | 0 | 0 | 0 | 0 | 0 | 0 | ||||||||||
Securities sold under repurchase agreements | 226 | 2 | 30 | 39 | 1 | 0 | 440 | 2 | 8 | 747 | ||||||||||
Due to banks | 218 | 1 | 28 | 37 | 1 | 0 | 440 | 0 | 3 | 727 | ||||||||||
Due to customers | 8 | 2 | 2 | 2 | 0 | 0 | 0 | 2 | 5 | 21 | ||||||||||
Securities loaned | 24 | 0 | 0 | 0 | 0 | 0 | 0 | 0 | 0 | 24 | ||||||||||
Due to banks | 6 | 0 | 0 | 0 | 0 | 0 | 0 | 0 | 0 | 6 | ||||||||||
Due to customers | 18 | 0 | 0 | 0 | 0 | 0 | 0 | 0 | 0 | 18 | ||||||||||
Other short term borrowings | 2,676 | 639 | 114 | 536 | 2 | 67 | 0 | 0 | 0 | 4,034 | ||||||||||
Long-term debt | 0 | 1,838 | 31,616 | 10,889 | 1,452 | 3,637 | 17,832 | 48,166 | 29,054 | 144,485 | ||||||||||
Debt securities - senior | 0 | 1,772 | 3,287 | 2,934 | 1,345 | 2,849 | 12,901 | 34,760 | 21,780 | 81,629 | ||||||||||
Debt securities - subordi- | 0 | 0 | 14 | 0 | 0 | 0 | 1,231 | 4,879 | 2,479 | 8,603 | ||||||||||
Other long-term debt - senior | 0 | 66 | 28,315 | 7,955 | 93 | 788 | 3,597 | 8,397 | 4,749 | 53,960 | ||||||||||
Other long-term debt - | 0 | 0 | 0 | 0 | 15 | 0 | 103 | 130 | 46 | 293 | ||||||||||
Trust Preferred Securities | 0 | 0 | 0 | 264 | 0 | 264 | 0 | 0 | 0 | 528 | ||||||||||
Other financial liabilities | 78,320 | 1,358 | 1,988 | 329 | 171 | 284 | 762 | 1,235 | 1,828 | 86,274 | ||||||||||
Total financial liabilities | 828,483 | 49,996 | 133,803 | 62,580 | 26,576 | 16,912 | 24,169 | 58,245 | 41,401 | 1,242,165 | ||||||||||
Other liabilities | 13,797 | 0 | 0 | 0 | 0 | 0 | 0 | 0 | 0 | 13,797 | ||||||||||
Total equity | 0 | 0 | 0 | 0 | 0 | 0 | 0 | 0 | 68,030 | 68,030 | ||||||||||
Total liabilities and equity | 842,280 | 49,996 | 133,803 | 62,580 | 26,576 | 16,912 | 24,169 | 58,245 | 109,432 | 1,323,993 | ||||||||||
Off-balance sheet commitments | 42,737 | 11,379 | 15,969 | 18,800 | 8,712 | 24,010 | 34,770 | 99,808 | 37,641 | 293,825 | ||||||||||
Banks | 1,243 | 1,538 | 2,018 | 2,115 | 1,502 | 2,555 | 2,180 | 3,167 | 4,592 | 20,910 | ||||||||||
Retail | 16,057 | 783 | 683 | 163 | 165 | 2,058 | 257 | 822 | 10,258 | 31,244 | ||||||||||
Corporates and other | 25,437 | 9,058 | 13,267 | 16,523 | 7,045 | 19,397 | 32,334 | 95,819 | 22,790 | 241,670 | ||||||||||
1Prior year’s comparatives aligned to presentation in the current year.
211 |
Deutsche Bank | ||
Annual Report 2022 | ||
Sustainability
Sustainability is a central component of the Deutsche Bank’s “Global Hausbank” strategy. In 2022, the bank continued to implement its sustainability strategy, focusing on four pillars: Sustainable Finance, Policies & Commitments, People & Own Operations as well as Thought Leadership & Stakeholder Engagement. Making progress along these four pillars will enable the bank to maximize its contribution to the achievement of the Paris Climate Agreement’s targets and the United Nations Sustainable Development Goals. The bank formally endorsed universal sustainability frameworks and initiatives, e. g. the bank is a member of the United Nations’ Environment Programme Finance Initiative and signatory to the ten principles of the UN Global Compact, the Principles for Responsible Banking and joined the Net-Zero Banking Alliance. This chapter does not cover DWS which sets its own sustainability strategy
In 2022, Deutsche Bank further strengthened its sustainability governance by appointing a Chief Sustainability Officer, reporting to the Chief Executive Officer, and established a Sustainability Strategy Steering Committee responsible for sustainability transformation management and supervision. This will help the bank to further manage, measure, and control its sustainability activities across its business divisions, infrastructure functions and regions and allow for compliance with environmental and social regulations. The bank’s sustainability governance now includes three forums devoted entirely to sustainability. The most senior forum is the Group Sustainability Committee. Chaired by the bank’s Chief Executive Officer, the committee’s acts as senior decision-making body for sustainability-related matters on group level. Besides the Group Sustainability Committee and Sustainability Strategy Steering Committee a third forum, the Sustainability Council is mandated to foster knowledge exchange in the bank, in order to stimulate bank-wide change and to identify new topics. Furthermore, the bank supplemented its existing Group Sustainability team with a dedicated Strategy & Regional Governance team, responsible for the development of the bank’s sustainability strategy, and an Execution, Data & Regulatory team, responsible for managing the transformation at a day-to-day basis as well as the identification and assessment of relevant regulations. All three teams form the bank’s new Chief Sustainability Office. Group Sustainability retains its responsibility for advancing the bank’s sustainability framework, overseeing adherence to group-wide sustainability policies and commitments, and providing transparency to the bank’s stakeholders. In addition to the Chief Sustainability Office, the bank’s business divisions and infrastructure functions each have its own ESG experts to ensure a swift response to business opportunities and risks. The degree to which ESG targets are met is among the assessment criteria used to calculate the bank’s top executives’ performance-based compensation.
Sustainable Finance
Deutsche Bank set the target to achieve cumulative sustainable financing and investment volumes since January 2020 of over € 200 billion by the end of 2022 and a cumulative € 500 billion by the end of 2025. The ESG assets managed by DWS are not included in this figure.
Policies and Commitments
In 2022, Deutsche Bank continued to implement its comprehensive Climate Risk Framework, in line with the recommendations of the Task Force for Climate-Related Financial Disclosures. Deutsche Bank published the carbon footprint of its corporate loan exposure to and financed emissions of key carbon-intensive industries and net-zero aligned targets for 2030 and 2050. These targets cover the carbon-intensive sectors of Oil and Gas (Upstream), Power Generation, Automotive (light duty vehicles) and Steel and will significantly reduce the amounts of financed emissions (Scope 3) by 2030, reflecting the bank’s commitments as a founding member of the Net-Zero Banking Alliance.
People and Operations
Deutsche Bank further implemented its commitment to source 100% renewable electricity by 2025. In 2022, the bank received 95.7% of its own global power consumption from renewable sources and reduced its total energy consumption by 13.3%. Furthermore, the bank made vendor sustainability ratings mandatory. For new contracts worth more than € 500,000 a year, the bank will only work with vendors with an ESG rating provided by a reputable sustainability rating agency. The bank also launched “How we live”, the Group’s new Corporate Social Responsibility program for environmental impact, aiming to address nature conservation and environmental protection as well as related social issues in collaboration with environmental and non-profit organizations.
212 |
Deutsche Bank | ||
Annual Report 2022 | ||
Thought Leadership and Stakeholder Engagement
As part of their cooperation, Deutsche Bank and the European School of Management and Technology in Berlin announced the new endowed professorship for Sustainable Finance. In addition, Deutsche Bank was represented at the UN Climate Change Conference (COP 27) in collaboration with the Resilience Hub and hosted the second Annual dbAccess Global ESG Conference, which intended to be an engagement forum for companies to address relevant environmental, social and governance considerations that are important to stakeholders.
More information on sustainability is published in the bank’s Non-Financial Report 2022. It includes Deutsche Bank’s Non-Financial Statement in accordance with § 315 (3) of the German Commercial Code. A PDF of the Non-Financial Report is published on our Investor Relations website (db.com/annual-report).
213 |
Deutsche Bank | ||
Annual Report 2022 | ||
Employees
Group Headcount
As of December 31, 2022, the bank employed a total of 84,930 staff members compared to 82,969 as of December 31, 2021.
The bank calculates its employee figures on a full-time equivalent basis, meaning it includes proportionate numbers of part-time employees.
The following table shows the bank’s numbers of full-time equivalent employees as of December 31, 2022, 2021 and 2020.
Employees1 | Dec 31, 2022 | Dec 31, 2021 | Dec 31, 2020 | |||
Germany | 35,594 | 35,741 | 37,315 | |||
Europe (outside Germany), Middle East and Africa | 18,379 | 19,311 | 19,617 | |||
Asia/Pacific | 23,236 | 20,215 | 19,430 | |||
North America2 | 7,534 | 7,556 | 8,149 | |||
Latin America | 187 | 145 | 148 | |||
Total employees | 84,930 | 82,969 | 84,659 | |||
1Full-time equivalent employees, numbers may not add up due to rounding
2Primarily the United States
In 2022, the number of the bank’s employees increased by 1,961 or 2.4% mainly due to business growth, strengthening the IT function and internalizations.
- – Germany (-147; -0.4%) driven by the implementation of restructuring measures, primarily in Private Bank partly offset by transfers of workforce from Russia
- – North America (-23; -0.3%) mainly driven by reductions in the Corporate Bank
- – Latin America (+42; +29.0%) mainly driven by increases in Brazil
- – EMEA ex Germany (-933; -4.8%) mainly driven by the reduction of the bank’s presence in Russia
- – Asia/Pacific (+3,021; +14.9%) primarily driven by increases in India and its Operations Center
The following table shows the distribution of full-time equivalent employees by division as of December 31, 2022, 2021 and 2020.
Employees | Dec 31, 2022 | Dec 31, 2021 | Dec 31, 2020 | ||||
Corporate Bank (CB) | 16.5% | 16.0% | 15.8% | ||||
Investment Bank (IB) | 9.0% | 8.6% | 8.9% | ||||
Private Bank (PB) | 31.7% | 33.8% | 35.1% | ||||
Asset Management (AM) | 5.0% | 4.9% | 4.6% | ||||
Capital Release Unit (CRU) | 0.2% | 0.3% | 0.6% | ||||
Infrastructure | 37.5% | 36.3% | 35.0% | ||||
1Numbers may not add up due to rounding
- – Corporate Bank (+688; +5.2%) mainly driven by increases in Operations and Control Functions
- – Investment Bank (+505; +7.1%) mainly driven by increases in Operations and Control Functions as well as in Fixed Income
- – Private Bank (-1,132; -4.0%) mainly driven by reductions in Germany
- – Asset Management (+211; +5.2%) primarily driven by increases in UK, Germany and in Asia/Pacific
- – Capital Release Unit (-73; -27.2%) mainly driven by reductions in UK
- – Infrastructure functions (+1,762; +5.9%) primarily driven by increases in Technology Data & Innovation (+1,168) mainly driven by insourcing of business critical external roles
214 |
Deutsche Bank | ||
Annual Report 2022 | ||
Post-Employment Benefit Plans
The Group sponsors a number of post-employment benefit plans on behalf of the Group’s employees, both defined contribution plans and defined benefit plans.
In the Group’s globally coordinated accounting process covering defined benefit plans with a defined benefit obligation exceeding € 2 million the Group’s global actuary reviews the valuations provided by locally appointed actuaries in each country.
By applying the Group’s global principles for determining the financial and demographic assumptions the Group ensures that the assumptions are best-estimate, unbiased and mutually compatible, and that they are globally consistent.
For a further discussion on the Group’s employee benefit plans see Note 33 “Employee Benefits” to the Group’s consolidated financial statements.
Talent acquisition
Voluntary staff turnover rates declined in 2020 mainly driven by COVID-19 pandemic. In 2021 voluntary staff turnover rates returned almost back to pre-COVID-19 level. In 2022, labor market conditions have significantly tightened, and voluntary leaver rates were above pre-COVID levels. Deutsche Bank observed extremely competitive markets, particularly in the U.S. and India. On group level, voluntary staff turnover rate was at 10.1% (2021: 7.9%, 2020: 5.9%). The increase of 2.2 percentage points versus prior year was mainly driven by a higher voluntary staff turnover rate in Asia/Pacific (2022: 18.4%. 2021: 14.6%) and the Americas (2022: 18.2%, 2021: 17.0%).
Recruiting talent remains a key priority for the bank. In 2022, the main focus was on filling the front office roles in growth areas (such as International Private Bank and Asset Management). In addition, focus was on strengthening operation-centres mainly in India and hiring talent to meet the growing demand in regulatory roles (such as Client Lifecycle Management and Anti-Financial Crime).
The bank remains committed to its strategic priority of hiring university graduates, as they help propel the change agenda. In 2022, the bank hired 793 university graduates (2021: 890). The bank also insourced 1,806 external roles (2021: 1,697), particularly in IT.
Promoting internal career mobility
Internal mobility plays a vital role in developing and retaining qualified, talented employees and ensuring that the bank continues to benefit from their expertise and experience. The bank fosters mobility between divisions, which enables employees to broaden their skills and experience. Moreover, internal mobility helps reduce the bank’s redundancy and recruitment costs.
In 2022, Deutsche Bank continued to implement its internal mobility strategy and live up to its commitment to filling one-third of all vacant positions with suitable candidates from within the organization. Vacant positions are typically first advertised inside the group for at least two weeks. Prioritizing internal candidates helps employees affected by restructuring find new roles in the bank.
In 2022, 27.3% (2021: 31.0%) of all job vacancies were filled internally (excluding Postbank). On average, it took 86 days to fill vacant positions (2021: 81 days).
Diversity and Inclusion
Diversity and Inclusion are the foundations on which the bank’s values are built and are pre-requisites for its Global Hausbank ambitions. The bank aims to attract, develop, and retain talented employees from all cultures, countries, races, ethnicities, genders, sexual orientations, disabilities, beliefs, backgrounds, and experiences. The bank wants all its employees to feel a sense of belonging by creating an inclusive work environment where everyone feels welcomed, respected, listened to, treated fairly and can contribute and grow.
215 |
Deutsche Bank | ||
Annual Report 2022 | ||
Throughout 2022 the bank continued to embed diversity, equity and inclusion in its culture and employee practices by supporting the advancement of women and members of other under-represented groups. The steps the bank takes include targeted outreach to attract and hire, enhanced career planning, leadership development, exposure opportunities, and senior leader sponsorship. The bank continues to equip its people with resources to practice inclusion and understand how to make equitable people-related decisions.
At year-end 2022, six or 30% of Supervisory Board members were women (2021: 30%). This met the statutory requirement of 30% for publicly listed and codetermined German companies pursuant to gender quota legislation that took effect in 2015.
The Supervisory Board’s goal, set in 2017, is to have at least 20% women on the Management Board by June 30, 2022. Two women would be required to achieve this goal on a Management Board with between eight and twelve members. With Christiana Riley and Rebecca Short on the Management Board, this goal was met on June 30, 2022. The current German Gender Quota Law (Zweites Führungspositionen-Gesetz, FüPoG II) requires appointing at least one woman and one man to a management board with more than three members, no additional goals must be laid down. The bank exceeded this requirement as of December 31, 2022.
As part of the bank’s 35 by 25 commitment, the bank aims to have women to represent at least 35% of its Managing Director, Director, and Vice President population by 2025 (excluding Asset Management and Capital Release Unit). The bank also plans to have at least 30% women in the positions one and two levels below the Management Board (excluding Asset Management and Capital Release Unit).
The bank is committed to increasing the proportion of women in senior leadership positions across the organization, but it is the bank’s individual businesses that deliver on this commitment. Since cultures and social challenges vary by country and type of business, each of the bank’s regions and business has its own diversity, equity, and inclusion efforts. The Management Board is committed to these targets, and the bank has put in place targeted initiatives to accelerate change. These initiatives have been implemented across the entire employee life cycle, from attracting and hiring talent to developing, retaining, and promoting it.
Key employee figures
A few selected employee figures and KPIs are set forth below. For full details on Deutsche Bank’s people metrics, as well as its strategic HR priorities and achievements, please refer to the bank’s Human Resources Report 2022.
Dec 31, 2022 | Dec 31, 2021 | Dec 31, 2020 | ||||
Female staff (in %, Headcount)1 | ||||||
Female Managing Directors | 20.9% | 19.3% | 18.4% | |||
Female Directors | 26.7% | 25.7% | 25.1% | |||
Female Vice Presidents | 33.5% | 32.8% | 32.4% | |||
Female Assistant Vice Presidents & Associates | 41.8% | 41.3% | 40.6% | |||
Female Non Officers | 59.7% | 60.4% | 59.9% | |||
Total female staff | 46.4% | 46.6% | 46.4% | |||
Age (in %, headcount)2 | ||||||
15 - 29 years | 15.4% | 14.7% | 14.9% | |||
30 - 39 years | 28.1% | 28.1% | 28.4% | |||
40 - 49 years | 26.7% | 27.1% | 27.1% | |||
50 - 59 years | 25.0% | 25.7% | 25.2% | |||
over 59 years | 4.8% | 4.5% | 4.4% | |||
Part-time employment (in % of total staff) | ||||||
Germany | 26.0% | 26.8% | 27.2% | |||
Europe (outside Germany), Middle East and Africa | 5.4% | 5.6% | 5.8% | |||
Americas | 0.3% | 0.3% | 0.2% | |||
Asia/Pacific | 0.1% | 0.2% | 0.1% | |||
Total part-time employment | 12.9% | 13.8% | 14.3% | |||
Apprentices ratio in Germany | 3.5% | 4.1% | 4.2% | |||
2022 | 2021 | 2020 | ||||
Commitment index | 69% | 71% | 69% | |||
Enablement index | 73% | 73% | 76% | |||
Voluntary staff turnover rate | ||||||
Germany | 3.7% | 2.2% | 2.6% | |||
Europe (outside Germany), Middle East and Africa | 9.7% | 7.9% | 5.6% | |||
Americas | 18.2% | 17.0% | 10.1% | |||
Asia/Pacific | 18.4% | 14.6% | 11.3% | |||
Total voluntary staff turnover rate | 10.1% | 7.9% | 5.9% | |||
Health rate (in %)³ | 91.8% | 93.1% | 92.7% | |||
1Declared corporate titles of Postbank (incl. subsidiaries) are only alternative, technically derived, and not contractually defined or agreed
2Numbers may not add up due to rounding
3Health rate: 100 - ((total sickness days x 100)/total regular working days), Germany
216 |
Deutsche Bank | ||
Annual Report 2022 | ||
Internal Control over Financial Reporting
General
Management of Deutsche Bank and its consolidated subsidiaries is responsible for establishing and maintaining adequate Internal Control over Financial Reporting (ICOFR). Our internal control over financial reporting is a process designed under the supervision of our Chairman of the Supervisory Board and our Chief Financial Officer to provide reasonable assurance regarding the reliability of financial reporting. In addition to the preparation of the company’s consolidated financial statements for external reporting purposes in accordance with International Financial Reporting Standards (IFRS) as issued by the International Accounting Standards Board (IASB) and endorsed by the European Union (EU). Our Internal control over financial reporting includes our disclosure controls and procedures designed to prevent misstatements.
Risks in Financial Reporting
The primary risks in financial reporting are that either financial statements do not present a true and fair view due to inadvertent or intentional errors (fraud) or the publication of financial statements is not performed on a timely basis. These risks may reduce investor confidence or cause reputational damage and may have legal consequences including banking regulatory interventions. A lack of fair presentation arises when one or more financial statement amounts, or disclosures contain misstatements (or omissions) that are material. Misstatements are deemed material if they could, individually or in aggregate, influence economic decisions that users make because of the financial statements.
To confine those risks of financial reporting, management of the Group has established internal control over financial reporting with the aim of providing reasonable but not absolute assurance against material misstatements. In addition, an assessment was conducted of the effectiveness of the Group’s internal control over financial reporting. This was based on the Internal Control Integrated Framework (2013) issued by the Committee of Sponsoring Organizations of the Treadway Commission (COSO). COSO recommends the establishment of specific objectives to facilitate the design and evaluate adequacy of a control system. As a result, in establishing internal control over financial reporting, management has adopted the following financial statement objectives:
- – Existence - assets and liabilities exist and transactions have occurred;
- – Completeness - all transactions are recorded and account balances are included in the financial statements;
- – Valuation - assets, liabilities and transactions are recorded in the financial statements at the appropriate amounts;
- – Rights, Obligations and Ownership – rights, obligations and ownership are appropriately recorded as assets and liabilities;
- – Presentation and Disclosures - classification, disclosure and presentation of financial reporting is appropriate;
- – Safeguarding of assets - unauthorized acquisition, use or disposition of assets is prevented or detected in a timely manner.
However, any internal control system, including internal control over financial reporting, no matter how well conceived and operated, can provide only reasonable, but not absolute assurance that the objectives of that control system are met. As such, disclosure controls and procedures or systems for internal control over financial reporting may not prevent all errors; inadvertent or intentional errors (fraud). Furthermore, projections of any evaluation of effectiveness to future periods, are subject to the risk that controls may become inadequate because of changes in conditions, or that the degree of compliance with policies or procedures may deteriorate over time. In addition, the design of a control system must reflect the fact that there are resource constraints, and the benefits of controls must be considered relative to their costs.
Controls to Minimize the Risk of Financial Reporting Misstatement
The system of internal control over financial reporting includes those policies and procedures that:
- – Pertain to the maintenance of records, that, in reasonable detail accurately and fairly reflect the transactions and dispositions of the company’s assets;
- – Provide reasonable assurance that transactions are recorded as necessary to permit preparation of financial statements in accordance with generally accepted accounting principles, and that receipts and expenditures of the company are made only in accordance with authorizations of the company’s management and;
- – Provide reasonable assurance regarding prevention or timely detection of unauthorized acquisition, use or disposition of the company’s assets that could have a material effect on the financial statements.
217 |
Deutsche Bank | ||
Annual Report 2022 | ||
Measuring Effectiveness of Internal Control
Each year, management of the Group undertakes a formal evaluation of the adequacy and effectiveness of the system of internal control over financial reporting. This evaluation incorporates an assessment of the effectiveness of the control environment as well as individual controls which make up the system of internal control over financial reporting and considers:
- – The financial misstatement risk of the financial statement line items, considering such factors as materiality and the susceptibility of the financial statement item to misstatement; and,
- – The susceptibility of identified controls to failure, considering such factors as the degree of automation, complexity, and risk of management override, competence of personnel and the level of judgment required.
These factors determine in their entirety the type and scope of the evidence required by § 315 HGB, which the management needs to assess whether or not the established internal control over financial reporting is effective. The evidence itself is generated from procedures integrated within the daily responsibilities of staff or from procedures implemented specifically for purposes of the internal control over financial reporting evaluation. Information from other sources also form an important component of the evaluation since such evidence may either bring additional control issues to the attention of management or may corroborate findings. Such information sources may include:
- – Reports on audits carried out by or on behalf of regulatory authorities;
- – External Auditor reports; and,
- – Reports commissioned to evaluate the effectiveness of outsourced processes to third parties.
In addition, Group Audit evaluates the design and operating effectiveness of internal control over financial reporting by performing periodic and ad-hoc risk-based audits. Reports are produced summarizing the results from each audit which are distributed to the responsible managers for the activities concerned. These reports also provide evidence to support the annual evaluation by management of the overall operating effectiveness of internal control over financial reporting.
As a result of the evaluation, management has concluded that internal control over financial reporting is appropriately designed and operating effectively as of December 31, 2022.
218 |
Deutsche Bank | ||
Annual Report 2022 | ||
Information pursuant to Section 315a (1) of the German Commercial Code and Explanatory Report
Structure of the Share Capital including Authorized and Conditional Capital
For information regarding Deutsche Bank’s share capital please refer to Note 32 “Common Shares” to the Consolidated Financial Statements.
Restrictions on Voting Rights or the Transfer of Shares
Under Section 136 of the German Stock Corporation Act the voting right of the affected shares is excluded by law. As far as the bank or its subsidiaries held own shares during the year of 2022 in its portfolio according to Section 71b of the German Stock Corporation Act no rights could be exercised. The bank is not aware of any other restrictions on voting rights or the transfer of shares.
Shareholdings which Exceed 10% of the Voting Rights
The German Securities Trading Act (Wertpapierhandelsgesetz) requires that any investor whose share of voting rights reaches, exceeds or falls below certain thresholds as the result of purchases, disposals or otherwise, must notify the bank and the German Federal Financial Supervisory Authority (BaFin) thereof. The lowest threshold is 3%. The bank is not aware of any shareholder holding directly or indirectly 10% or more of the voting rights.
Shares with Special Control Rights
Shares which confer special control rights have not been issued.
System of Control of any Employee Share Scheme where the Control Rights are not Exercised Directly by the Employees
The employees, who hold Deutsche Bank shares, exercise their control rights as other shareholders in accordance with applicable law and the Articles of Association (Satzung).
219 |
Deutsche Bank | ||
Annual Report 2022 | ||
Rules Governing the Appointment and Replacement of Members of the Management Board
Pursuant to the German Stock Corporation Act (Section 84) and the Articles of Association of Deutsche Bank (Section 6) the members of the Management Board are appointed by the Supervisory Board. The number of Management Board members is determined by the Supervisory Board. According to the Articles of Association, the Management Board has at least three members. The Supervisory Board may appoint one or two members of the Management Board as Chairpersons of the Management Board. Members of the Management Board may be appointed for a maximum term of up to five years. They may be reappointed or have their term extended for one or more terms of up to a maximum of five years each. The German Co-Determination Act (Mitbestimmungsgesetz; Section 31) requires a majority of at least two thirds of the members of the Supervisory Board to appoint members of the Management Board. If such majority is not achieved, the Mediation Committee shall give, within one month, a recommendation for the appointment to the Management Board. The Supervisory Board will then appoint the members of the Management Board with the majority of its members. If such appointment fails, the Chairperson of the Supervisory Board shall have two votes in a new vote. If a required member of the Management Board has not been appointed, the Local Court (Amtsgericht) in Frankfurt am Main shall, in urgent cases, make the necessary appointments upon motion by any party concerned (Section 85 of the Stock Corporation Act).
Pursuant to the German Banking Act (Kreditwesengesetz) and Regulation (EU) No 468/2014 of the European Central Bank (SSM Framework Regulation) evidence must be provided to the European Central Bank (ECB), the German Federal Financial Supervisory Authority (BaFin) and the Deutsche Bundesbank that the member of the Management Board has adequate theoretical and practical experience of the businesses of the Bank as well as managerial experience before the member is appointed (Sections 24 (1) No. 1 and 25c (1) of the Banking Act, Article 93 of the SSM Framework Regulation).
The Supervisory Board may revoke the appointment of an individual as member of the Management Board or as Chairperson of the Management Board for good cause. Such cause includes in particular a gross breach of duties, the inability to manage the Bank properly or a vote of no-confidence by the shareholders’ meeting (Hauptversammlung, referred to as the General Meeting), unless such vote of no-confidence was made for obviously arbitrary reasons.
The ECB or the BaFin may appoint a special representative and transfer to such special representative the responsibility and powers of individual members of the Management Board if such members are not trustworthy or do not have the required competencies or if the credit institution does not have the required number of Management Board members. In any such case, the responsibility and powers of the Management Board members concerned are suspended (Section 45c (1) through (3) of the Banking Act, Article 93 (2) of the SSM Framework Regulation).
Rules Governing the Amendment of the Articles of Association
Any amendment of the Articles of Association requires a resolution of the General Meeting (Section 179 of the Stock Corporation Act). The authority to amend the Articles of Association in so far as such amendments merely relate to the wording, such as changes of the share capital as a result of the issuance out of authorized capital, has been assigned to the Supervisory Board by the Articles of Association of Deutsche Bank (Section 20 (3)). Pursuant to the Articles of Association, the resolutions of the General Meeting are taken by a simple majority of votes and, in so far as a majority of capital stock is required, by a simple majority of capital stock, except where law or the Articles of Association determine otherwise (Section 20 (1)). Amendments to the Articles of Association become effective upon their entry in the Commercial Register (Section 181 (3) of the Stock Corporation Act).
220 |
Deutsche Bank | ||
Annual Report 2022 | ||
Powers of the Management Board to Issue or Buy Back Shares
The Annual General Meeting of May 27, 2021 authorized the Management Board pursuant to Section 71 (1) No. 7 of the Stock Corporation Act to buy and sell, for the purpose of securities trading, own shares of Deutsche Bank AG on or before April 30, 2026, at prices which do not exceed or fall short by more than 10% of the average of the share prices (closing auction prices of the Deutsche Bank share in Xetra trading and/or in a comparable successor system on the Frankfurt Stock Exchange) on the respective three preceding stock exchange trading days. In this context, the shares acquired for this purpose may not, at the end of any day, exceed 5% of the share capital of Deutsche Bank AG.
The Annual General Meeting of May 19, 2022 authorized the Management Board pursuant to Section 71 (1) No. 8 of the Stock Corporation Act to buy, on or before April 30, 2027, own shares of Deutsche Bank AG in a total volume of up to 10% of the share capital at the time the resolution was taken or – if the value is lower – of the share capital at the time this authorization is exercised. Together with own shares acquired for trading purposes and/or for other reasons and which are from time to time in the company’s possession or attributable to the company pursuant to Sections 71a et seq. of the Stock Corporation Act, the own shares purchased on the basis of this authorization may not at any time exceed 10% of the company’s respectively applicable share capital. The own shares may be bought through the stock exchange or by means of a public purchase offer to all shareholders. The consideration for the purchase of shares (excluding ancillary purchase costs) through the stock exchange may not be more than 10% higher or more than 20% lower than the average of the share prices (closing auction prices of the Deutsche Bank share in Xetra trading and/or in a comparable successor system on the Frankfurt Stock Exchange) on the last three stock exchange trading days before the obligation to purchase. In the case of a public purchase offer, it may not be more than 10% higher or more than 20% lower than the average of the share prices (closing auction prices of the Deutsche Bank share in Xetra trading and/or in a comparable successor system on the Frankfurt Stock Exchange) on the last three stock exchange trading days before the day of publication of the offer. If the volume of shares offered in a public purchase offer exceeds the planned buyback volume, acceptance must be in proportion to the shares offered in each case. The preferred acceptance of small quantities of up to 50 of the company’s shares offered for purchase per shareholder may be defined.
The Management Board has also been authorized to dispose of the purchased shares and of any shares purchased on the basis of previous authorizations pursuant to Section 71 (1) No. 8 of the Stock Corporation Act on the stock exchange or by an offer to all shareholders. The Management Board has been authorized to dispose of the purchased shares against contribution-in kind and with the exclusion of shareholders’ pre-emptive rights for the purpose of acquiring companies or shareholdings in companies or other assets that serve the company’s business operations. In addition, the Management Board has been authorized, in case it disposes of such own shares by offer to all shareholders, to grant to the holders of the option rights, convertible bonds and convertible participatory rights issued by the company and its affiliated companies pre-emptive rights to the shares to the extent that they would be entitled to such rights if they exercised their option and/or conversion rights. Shareholders’ pre-emptive rights are excluded for these cases and to this extent.
The Management Board has also been authorized to use shares purchased on the basis of authorizations pursuant to § 71 (1) No. 8 Stock Corporation Act to issue staff shares, with the exclusion of shareholders’ pre-emptive rights, to employees and retired employees of the company and its affiliated companies or to use them to service option rights on shares of the company and/or rights or duties to purchase shares of the company granted to employees or members of executive or non-executive management bodies of the company and of affiliated companies.
Furthermore, the Management Board has been authorized, with the exclusion of shareholders’ pre-emptive rights, to sell such own shares to third parties against cash payment if the purchase price is not substantially lower than the price of the shares on the stock exchange at the time of sale. Use may only be made of this authorization if it has been ensured that the number of shares sold on the basis of this authorization does not exceed 10% of the company’s share capital at the time this authorization becomes effective or – if the amount is lower – at the time this authorization is exercised. Shares that are issued or sold during the validity of this authorization with the exclusion of pre-emptive rights, in direct or analogous application of Section 186 (3) sentence 4 Stock Corporation Act, are to be included in the maximum limit of 10% of the share capital. Also to be included are shares that are to be issued to service option and/or conversion rights from convertible bonds, bonds with warrants, convertible participatory rights or participatory rights, if these bond or participatory rights are issued during the validity of this authorization with the exclusion of pre-emptive rights in corresponding application of Section 186 (3) sentence 4 Stock Corporation Act.
The Management Board has also been authorized to cancel shares acquired on the basis of this or a preceding authorization without the execution of this cancellation process requiring a further resolution by the General Meeting.
221 |
Deutsche Bank | ||
Annual Report 2022 | ||
The Annual General Meeting of May 19, 2022 authorized the Management Board pursuant to Section 71 (1) No. 8 of the Stock Corporation Act to execute the purchase of shares under the resolved authorization also with the use of put and call options or forward purchase contracts. The company may accordingly sell to third parties put options based on physical delivery and buy call options from third parties if it is ensured by the option conditions that these options are fulfilled only with shares which themselves were acquired subject to compliance with the principle of equal treatment. All share purchases based on put or call options are limited to shares in a maximum volume of 5% of the actual share capital at the time of the resolution by the General Meeting on this authorization. The term of the options must be selected such that the share purchase upon exercising the option is carried out at the latest on April 30, 2027.
The purchase price to be paid for the shares upon exercise of the put options or upon the maturity of the forward purchase may not exceed more than 10% or fall below 10% of the average of the share prices (closing auction prices of the Deutsche Bank share in Xetra trading and/or in a comparable successor system on the Frankfurt Stock Exchange) on the last three stock exchange trading days before conclusion of the respective transaction in each case excluding ancillary purchase costs but taking into account the option premium received. The call options may only be exercised if the purchase price to be paid does not exceed by more than 10% or fall below 10% of the average of the share prices (closing auction prices of the Deutsche Bank share in Xetra trading and/or in a comparable successor system on the Frankfurt Stock Exchange) on the last three stock exchange trading days before the acquisition of the shares.
To the sale and cancellation of shares acquired with the use of derivatives the general rules established by the General Meeting apply.
Own shares may continue to be purchased using existing derivatives that were agreed on the basis and during the existence of previous authorizations.
Significant Agreements which Take Effect, Alter or Terminate upon a Change of Control of the Company Following a Takeover Bid
Significant agreements which take effect, alter or terminate upon a change of control of the company following a takeover bid have not been entered into.
Agreements for Compensation in Case of a Takeover Bid
If a member of the Management Board leaves the bank within the scope of a change of control, she or he receives a one-off compensation payment described in greater detail in the Compensation Report.
Corporate Governance Statement pursuant to Sections 289f and 315d of the German Commercial Code
The entire Corporate Governance Statement according to sections 289f and 315d of the German Commercial Code is available on the Group’s website under https://www.db.com/ir/en/reports.htm as well as in the chapter “4 – Corporate Governance Statement according to Sections 289f, 315d of the German Commercial Code / Corporate Governance Report”.
222 |
Deutsche Bank | ||
Annual Report 2022 | ||
Standalone parent company information (HGB)
Introduction
Deutsche Bank AG is the parent company of Deutsche Bank Group and is its most material component. The management of Deutsche Bank Group is based on IFRS results of our corporate divisions. Deutsche Bank AG is fully integrated in the initiatives and target setting of Deutsche Bank Group. The performance of the Group is ultimately driving the performance of Deutsche Bank AG. Further, the bank has utilized the option under Section 2a of the German Banking Act (KWG) with respect to regulatory capital so that regulatory capital ratios are only applicable on Group level.
Therefore, information that has been provided regarding Deutsche Bank Group in this combined management report in general also is relevant and applies to Deutsche Bank AG. Additional information that facilitates an understanding of Deutsche Bank AG is contained in this section. The financial information in this section has been prepared in accordance with the German Commercial Code (“Handelsgesetzbuch”, HGB), unless stated otherwise. Further details on financial information prepared in accordance with HGB can be found in the notes to the financial statements for Deutsche Bank AG in a separate report.
Deutsche Bank AG Performance
One parameter to evaluate the performance of the Group is the ability to make distributions to shareholders. This ability depends on the availability of distributable profits of Deutsche Bank AG determined in accordance with HGB. Beyond that the financial information of Deutsche Bank AG prepared in accordance with HGB is generally less relevant to assess or steer the Group’s financial performance due to the circumstances set forth in the introduction above.
In 2022, Deutsche Bank AG recorded a net profit of € 5.5 billion compared to net profit of € 1.9 billion in 2021. The operating result of negative € 217 million was lower by € 338 million as a result of several positive and negative effects caused by higher interest rate levels and the war in Ukraine. Rising interest rate levels lead to higher net interest income and improved trading results, but also to lower valuations of pension plan assets and securities of the liquidity reserve. The increased uncertainty driven by the war in Ukraine lead to a reduced client demand for certain services and higher credit risk provisioning. Administrative expenses were largely unchanged.
The result outside operating profit was mainly driven by net positive valuation adjustments of investments in affiliated companies of € 4.2 billion, largely attributable to a partial reversal of prior years’ impairments. In addition, a tax benefit of € 1.8 billion contributed to the net income of € 5.5 billion.
The Management Board and the Supervisory Board will propose to the Annual General Meeting to pay a dividend of € 0.30 per share, appropriate € 2.5 billion to the revenue reserves and to carry forward the remaining distributable profit.
223 |
Deutsche Bank | ||
Annual Report 2022 | ||
Income Statement
Condensed income statement
Change | ||||||||
in € m. | 2022 | 2021 | in € m. | in % | ||||
Interest income1 | 23,911 | 12,959 | 10,952 | 85 | ||||
Current income2 | 1,840 | 1,443 | 398 | 28 | ||||
Total interest income | 25,751 | 14,402 | 11,350 | 79 | ||||
Interest expenses | 15,550 | 5,369 | 10,181 | 190 | ||||
Net interest income | 10,201 | 9,033 | 1,169 | 13 | ||||
Commission income | 8,767 | 9,052 | (285) | (3) | ||||
Commission expenses | 2,672 | 2,240 | 431 | 19 | ||||
Net commission income | 6,095 | 6,811 | (716) | (11) | ||||
Net trading result | 2,898 | 1,266 | 1,633 | 129 | ||||
thereof release of trading-related special reserve | 0 | 0 | 0 | N/M | ||||
Total revenues | 19,195 | 17,110 | 2,085 | 12 | ||||
Wages and salaries | 4,687 | 4,758 | (71) | (1) | ||||
Compulsory social security contributions3 | 2,032 | 1,246 | 786 | 63 | ||||
Staff expenses | 6,720 | 6,005 | 715 | 12 | ||||
Other administrative expenses4 | 9,788 | 10,419 | (631) | (6) | ||||
Administrative expenses | 16,508 | 16,424 | 83 | 1 | ||||
Balance of other operating income/expenses | (1,308) | (560) | (748) | 134 | ||||
Risk provisioning | 1,596 | 4 | 1,591 | N/M | ||||
Operating profit | (217) | 121 | (338) | N/M | ||||
Balance of other ordinary income/expenses | 3,816 | (658) | 4,474 | N/M | ||||
Extraordinary result | 95 | (145) | 240 | N/M | ||||
Releases from/(Additions) to the fund for general banking risks | 0 | 2,200 | (2,200) | N/M | ||||
Income before taxes | 3,694 | 1,518 | 2,176 | 143 | ||||
Taxes | (1,813) | (400) | (1,412) | N/M | ||||
Net income (loss) | 5,506 | 1,919 | 3,588 | 187 | ||||
Profit carried forward from the previous year | 562 | 0 | 562 | N/M | ||||
Withdrawal from capital reserves | 0 | 0 | 0 | N/M | ||||
Allocations to revenue reserves | 2,500 | 950 | 1,550 | 163 | ||||
– to other revenue reserves | 2,500 | 950 | 1,550 | 163 | ||||
Distributable profit | 3,569 | 969 | 2,600 | N/M | ||||
N/M - Not meaningful
1From lending and money market business, fixed-income securities, and government inscribed debt
2From equity shares and other variable-yield securities, participating interests, investments in affiliated companies (including profit transfer agreements)
3Including expenses for pensions and other employee benefits
4Including depreciation on tangible and intangible assets
Net interest income increased by € 1.2 billion to € 10.2 billion in 2022. Current income, up by € 398 million, benefitted from contributions from affiliated companies. The net interest result from lending and securities less interest expenses increased by € 769 million, mainly driven by the favorable impact of the interest rate environment.
Net commission income of € 6.1 billion decreased by € 716 million compared to the prior year, primarily driven by a reduction of € 378 million from net commission income from securities business, reflecting weaker primary market activity.
Net trading result in 2022 was € 2.9 billion, an increase of € 1.6 billion compared to prior year. This increase was mainly driven by ongoing elevated market activity and strong client flows.
Staff expenses were € 6.7 billion, an increase of € 715 million compared to 2021, mainly driven by higher expenses for defined benefit plans.
Geographical breakdown of our staff (full-time-equivalent)
Staff (full-time equivalents)1 | Dec 31, 2022 | Dec 31, 2021 | Change | |||
Germany | 22,201 | 21,589 | +612 | |||
Europe excl. Germany | 7,522 | 7,703 | (181) | |||
Americas | 447 | 454 | (7) | |||
Africa/Asia/Australia | 5,115 | 5,113 | +2 | |||
Total | 35,285 | 34,859 | +426 | |||
1Staff (full-time equivalent) = total headcount adjusted proportionately for part time staff, excluding apprentices and interns
224 |
Deutsche Bank | ||
Annual Report 2022 | ||
The number of employees in Germany increased mainly driven by transfers of workforce from Russia partly offset by the implementation of restructuring measures, primarily in the Private Bank. In Europe excluding Germany the number of employees decreased primarily in U.K.
Other administrative costs were € 9.8 billion in 2022, a decrease of € 631 million from € 10.4 billion in 2021. Other administrative expenses (excluding depreciation and amortization on tangible and intangible assets) decreased by € 541 million to € 8.6 billion. This development was mainly driven by lower costs for IT equipment, down € 351 million, and lower expenses for premises, down € 132 million, partly offset by higher bank levies, which increased by € 179 million. Scheduled depreciation and amortization of tangible and intangible assets were € 1.1 billion in 2022, down by € 90 million.
The balance of other operating income/expenses amounted to negative € 1.3 billion in 2022 after negative € 560 million in 2021. This development was mainly driven by higher net expenses on pension plan assets and staff related provisions, up by € 1.0 billion, partially offset by expenses for civil damages, penalties and fines, down by € 156 million.
In 2022, total net risk provisioning, consisting of changes in credit related risk provisioning and the net result from securities held in the liquidity reserve, amounted to € 1.6 billion, up by € 1.6 billion compared to 2021. This development was attributable to higher risk provisioning in the loan business, up by € 710 million, and higher losses from securities held in the liquidity reserve, up by € 881 million. The development of risk provisioning in the loan business reflected more challenging macro-economic conditions against the backdrop of the war in Ukraine, while 2021 benefited from economic recovery following the easing of COVID-19 restrictions. The negative net result from securities held in the liquidity reserve was caused by the significant increase in interest rate levels during 2022, leading to lower valuations. This valuation decrease included partial mitigation by the close-out gain of € 1.1 billion from interest rate swaps which were used to economically hedge securities held in the liquidity reserve.
The balance of other ordinary income and expenses was positive € 3.8 billion (2021: negative € 658 million), consisting of valuation adjustments of investments in affiliated companies, write-downs and non-scheduled depreciation of tangible and intangible assets and expenses from loss take-over.
Net valuation adjustments of investments in affiliated companies amounted to positive € 4.2 billion (2021: negative € 298 million), largely relating to one investment in the United States. For this investment, impairments recorded in prior periods were partially reversed, based on sustainably improved future prospects on profitability which reflect continued strong performance in the bank’s U.S. operations.
In addition, write-downs and non-scheduled depreciation of tangible and intangible assets amounted to € 92 million in 2022, mainly related to furniture and equipment (2021: € 216 million). Prior year impairments related primarily to self-developed software.
Expenses from loss take-over amounted to € 281 million in 2022 (2021: € 145 million).
Net extraordinary income and expenses were positive € 95 million (2021: negative € 145 million).
In the current year, the fund for general banking risks according to section 340g HGB remained unchanged after a partial release of € 2.2 billion in the prior year.
In 2022, the bank recorded a tax benefit of € 1.8 billion compared to a benefit of € 400 million in the prior year. The current year’s tax benefit was mainly driven by changes in the recognition and measurement of deferred tax assets as well as tax exempt income.
Deutsche Bank AG recorded a net profit of € 5.5 billion in 2022, compared to a net profit of € 1.9 billion in 2021.
After an addition to revenue reserves of € 2.5 billion, the 2022 distributable profit amounted to € 3.6 billion. The Bank will propose to the Annual General Meeting a dividend of € 0.30 per share. This will reduce the distributable profit by up to € 612 million, depending on the number of shares outstanding at the record date. It will also be proposed to appropriate additional € 2.5 billion to revenue reserves and to carry forward the remaining distributable profit.
225 |
Deutsche Bank | ||
Annual Report 2022 | ||
Balance Sheet
Change | ||||||||
in € m. | Dec 31, 2022 | Dec 31, 2021 | in € m. | in % | ||||
Assets | ||||||||
Receivables from banks and customers incl. balances with central banks and debt instruments of public-sector entities | 694,455 | 666,732 | 27,722 | 4 | ||||
Participating interests and investments in affiliated companies | 30,927 | 26,519 | 4,407 | 17 | ||||
Bonds and other securities and equity shares | 70,912 | 60,479 | 10,433 | 17 | ||||
Trading Assets | 234,670 | 246,705 | (12,036) | (5) | ||||
Remaining other assets | 21,379 | 19,673 | 1,706 | 9 | ||||
Total assets | 1,052,343 | 1,020,109 | 32,234 | 3 | ||||
Liabilities and Shareholders' Equity | ||||||||
Liabilities to banks and customers | 673,859 | 644,803 | 29,056 | 5 | ||||
Liabilities in certificate form | 87,090 | 79,681 | 7,409 | 9 | ||||
Trading liabilities | 178,394 | 197,069 | (18,675) | (9) | ||||
Provisions | 7,457 | 5,972 | 1,485 | 25 | ||||
Capital and reserves | 39,625 | 34,913 | 4,712 | 13 | ||||
Subordinated liabilities, Participation rights capital, Instruments for Additional Tier 1 Regulatory Capital and Fund for general banking risks | 24,747 | 21,333 | 3,414 | 16 | ||||
Remaining other liabilities | 41,171 | 36,338 | 4,833 | 13 | ||||
Total liabilities and shareholders' equity | 1,052,343 | 1,020,109 | 32,234 | 3 | ||||
Total assets of Deutsche Bank AG amounted to € 1,052 billion as of December 31, 2022. The 3% increase compared to December 31, 2021 was mainly driven by increases in Receivables from banks and customers including balances with central banks and debt instruments of public-sector entities. The net growth was mainly funded by higher liabilities to banks and customers.
Total credit extended (excluding reverse repos and securities spot deals)
Change | ||||||||
in € bn. | Dec 31, 2022 | Dec 31, 2021 | in € bn. | in % | ||||
Claims on customers | 434 | 421 | 13 | 3 | ||||
with a residual period of | ||||||||
up to 5 years1 | 318 | 305 | 13 | 4 | ||||
over 5 years | 116 | 116 | 0 | 0 | ||||
Loans to banks | 48 | 43 | 5 | 12 | ||||
with a residual period of | ||||||||
up to 5 years1 | 36 | 34 | 2 | 7 | ||||
over 5 years | 12 | 9 | 3 | 32 | ||||
Total | 482 | 463 | 18 | 4 | ||||
1Including those repayable on demand and those with an indefinite period
Total credit extended (excluding reverse repos and securities spot deals) increased by € 18.5 billion (4%), to € 481.8 billion. This development was primarily driven by an increase in Claims on customers by € 13.4 billion (3%) to € 434.0 billion and an increase in Loans to banks, which are reported under total credit extended, by € 5.1 billion (12%) to € 47.8 billion.
Receivables from banks (excluding loans) outside trading increased by € 93.5 billion to € 172.8 billion compared to December 31, 2021.
The bank’s securities portfolio (excluding trading assets) increased by € 10.4 billion to € 70.9 billion, mainly driven by an increase in bonds.
Trading assets amounted to € 234.7 billion, a decrease of € 12.0 billion (5%) compared to December 31, 2021. This was mainly driven by a decrease in receivables qualifying as trading, which declined by € 21.2 billion (22%) to € 73.2 billion, as well by a decrease of securities qualifying as trading, lower by 9.4 billion (13%) to € 64.5 billion, partly offset by an increase of € 18.4 billion (24%) to 96.3 billion in positive market values from trading derivatives.
Investments in affiliated companies increased by € 4.4 billion to € 30.8 billion. The increase was attributable to write-ups of € 4.4 billion and a positive impact of foreign currency translation of € 0.3 billion, partly offset by write-downs of € 0.3 billion. Capital increases of € 0.4 billion were compensated by capital repayments of the same amount.
226 |
Deutsche Bank | ||
Annual Report 2022 | ||
Further details of Liabilities to banks, Liabilities to customers and Liabilities in certificate form are provided in the following table:
Breakdown of liabilities
Change | ||||||||
in € bn. | Dec 31, 2022 | Dec 31, 2021 | in € bn. | in % | ||||
Liabilities to banks | 149 | 152 | (3) | (2) | ||||
repayable on demand | 64 | 58 | 6 | 10 | ||||
with agreed period or notice period | 85 | 94 | (9) | (9) | ||||
Liabilities to customers | 525 | 493 | 32 | 7 | ||||
savings deposits | 60 | 62 | (3) | (4) | ||||
other liabilities | ||||||||
repayable on demand | 345 | 334 | 11 | 3 | ||||
with agreed period or notice period | 121 | 97 | 24 | 24 | ||||
Liabilities in certificate form | 87 | 80 | 7 | 9 | ||||
bonds and notes issued | 84 | 77 | 7 | 9 | ||||
other liabilities in certificate form | 3 | 3 | 1 | 29 | ||||
thereof: money market instruments | 3 | 2 | 1 | 48 | ||||
Trading liabilities amounted to € 178.4 billion, a decrease of 18.7 billion (9%) in comparison to December 31, 2021. This was mainly driven by decreases in other liabilities qualifying as trading by € 21.4 billion (28%) to € 55.7 billion and in securities (short positions) of € 7.4 bn (16%) to € 37.7 billion, partly offset by an increase of € 10.2 billion (14%) in negative market values from trading derivatives to € 85 billion.
Instruments for additional Tier 1 Regulatory Capital amounted to € 9.0 billion compared to € 8.6 billion last year. The year-on-year movement is the result of new AT1 instruments issued in 2022 as well as currency translation effects.
Capital and reserves of Deutsche Bank AG amounted to € 39.6 billion. The increase of € 4.7 billion is mainly attributable to the distributable profit generated in 2022 as well as an increase in other revenue reserves.
Consistent with prior years, the Bank has utilized the option available under Section 2a of the German Banking Act (KWG) with respect to its regulatory capital and presents capital requirements for Deutsche Bank Group only.
In summary: The bank maintained its stable funding, high liquidity base and solid regulatory capital position which is based on Group capital. For further details, please refer to the liquidity risk and capital adequacy sections in the Risk Report.
227 |
Deutsche Bank | ||
Annual Report 2022 | ||
Management of Deutsche Bank AG within the Group
The content in this chapter should be read in conjunction with the respective group sections in this Annual Report, especially “Risk Report”, “Outlook”, “Risks and Opportunities” and “Internal control over financial reporting”.
Risk Management
The impact of the risks on Deutsche Bank AG cannot be isolated from the effects on Deutsche Bank’s other legal entities, mainly driven by:
- – The Group’s management structure, including its Corporate Divisions follows its customers’ needs. The legal structure is determined by local legislation and therefore does not necessarily follow the management structure. For example, local legislation can determine whether the Group’s business in a certain country is conducted by a branch of Deutsche Bank AG or by a separate subsidiary. However, the management has to monitor the risks in the bank’s business – irrespective of whether it is transacted by a branch or a subsidiary.
- – Adequate risk monitoring and management requires knowledge of the extent to which the Group’s profit situation depends on the development of certain risk factors, i.e. on the creditworthiness of individual customers or securities issuers or on movements in market prices. The respective exposures therefore need to be analyzed across legal entities. Especially for the credit risk attached to a borrower, as it is irrelevant whether the credit exposure to a company is spread over several Group companies or concentrated on Deutsche Bank AG. Separate monitoring of the risk affecting Deutsche Bank AG alone would neglect the potential exposure facing the Group and, indirectly, Deutsche Bank AG – as the parent – if the company became insolvent.
- – Individual risk factors are sometimes correlated, and in some cases they are independent of each other. If estimates of the nature and extent of this correlation are available, the Group’s management can significantly reduce the overall risk by diversifying its businesses across customer groups, issuers and countries. The risk correlation is also independent of the Group’s legal and divisional structure. Therefore, management can only optimize the risk-mitigating effects of diversification if it manages them Group-wide and across legal entities.
For the reasons mentioned, the identification, monitoring and management of all risks in Deutsche Bank AG are integrated into the Group-wide risk management process. Following Group policies, Deutsche Bank AG adheres to the respective legal and regulatory requirements.
The Liquidity Coverage Ratio (LCR) of Deutsche Bank AG stands at 130.8% as of December 31, 2022 compared to 121% as of December 31, 2021. The Net Stable Funding Ratio (NSFR) amounts to 109% as of December 31, 2022 unchanged to 109% as of December 31, 2021. Both ratios are calculated separately to ensure an appropriate level of liquidity and stable funding at Deutsche Bank AG.
Outlook and Strategy
Deutsche Bank AG as the parent company of the Group defines the strategy and planning for the individual Group Divisions. Deutsche Bank AG participates in the results of the Group Divisions through own activities and profit distribution from subsidiaries. Therefore, the Group’s outlook encompasses all Group Divisions and is not limited to the parent company. In addition, financial key performance indicators are solely defined on Group level, except for the amount of distributable profit.
228 |
Deutsche Bank | ||
Annual Report 2022 | ||
Risks and Opportunities
Risks
Deutsche Bank AG as a solo entity reporting under HGB faces additional risks compared to the Group in that certain transactions in a given year may lead to higher or lower losses than in the Group financial statements prepared under IFRS. The following items carry significant risk in this respect:
- – Potential valuation adjustments of investments in affiliated companies, driven by local political and economic environment, increased local regulatory requirements, restructuring or changes of share prices of listed investments.
- – Increase in long-term provisions, especially pension obligations, despite rises in interest rate levels caused by the discounting with average interest rates according to section 253 par. 2 German Commercial Code.
- – Negative valuation adjustments to plan assets, especially in an environment of rising interest rate levels. Due to the above mentioned valuation methodology, there might be no offsetting effect from lower pension obligations if interest rates are rising.
- – Potential requirement to set up a provision according to German accounting pronouncement IDW RS BFA 3 in case the interest bearing banking book does not generate an interest margin sufficient to cover expected credit risk costs and administrative expenses. A persisting low interest rate environment and the treatment of coupon payments related to the AT1 instruments as expenses under HGB increase this risk.
In addition, profits or retained earnings from affiliated companies might not allow for sufficient dividend payments to Deutsche Bank AG to facilitate dividend payments by Deutsche Bank AG as targeted.
Opportunities
Deutsche Bank AG as a solo entity reporting under HGB may have additional opportunities compared to the Group in that respect that certain transactions in a given year are reported in a more beneficial manner than for the Group under IFRS, such as realized gains which may be recognized in the income statement under IFRS in an earlier period.
In addition, there is the possibility that Deutsche Bank AG as parent entity shows profits in a given year that are higher than its contribution to the Group’s net income, resulting from increased profit distributions from affiliated companies.
Internal control over financial reporting
The controls that are performed for our Group Annual Statements under IFRS apply to our financial statements under HGB accordingly. In addition to these controls, specific HGB related controls are implemented which include:
- – Inter-branch reconciliation and elimination are performed for HGB specific balances; and,
- – Analytical reviews of revaluation and reclassification items between IFRS and HGB on the level of foreign branches and the German headquarters.
Non-financial Statement for Deutsche Bank AG
The details pursuant to § 340a (1a) German Commercial Code (HGB) in conjunction with § 289b (3) HGB can be found as a combined separate non-financial report under https://investor-relations.db.com/reports-and-events/annual-reports/.
229 |
Deutsche Bank | ||
Annual Report 2022 | ||
Report on equal treatment and equal pay
Pursuant to section 21 and 22 of the German Remuneration Transparency Act (Entgelttransparenzgesetz) and as an employer bound by a collective agreement, every five years and as an appendix to its management report, Deutsche Bank AG is required to report on its measures to promote the equal treatment of and establish equal pay for men and women. Deutsche Bank AG must also report the effects of these measures. The first report was produced as an annex to the 2017 management report for the 2016 reporting year. In contrast to annual financial statements and management reporting, changes over the five years are reported for the purpose of remaining in accordance with the forementioned statutory requirement.
Measures to promote equal treatment of men and women
Throughout the required reporting period of the fiscal years 2017 to 2021, Deutsche Bank AG continued its long-standing “Diversity, Equity & Inclusion” activities as part of its corporate and human resources strategy, including the integral component of supporting women in management positions.
As part of the bank’s sustainability strategy (ESG) and in accordance with German Gender quota legislation, in May of 2021, the Management Board renewed its aspirational goals concerning the representation of women at the two management levels below the Management Board. The bank plans to have at least 30% of the positions that are one and two levels below the Management Board held by women by December 31st, 2025. In addition to statutory requirements, Deutsche Bank has set group-wide goals for the representation of women in leadership positions since 2011. The Management Board also renewed the bank’s voluntary goals for the representation of women in leadership positions. As part of the bank’s goal, titled “35 by 25,” women should represent at least 35% of Deutsche Bank AG’s Managing Director, Director and Vice President population by 2025. These goals are part of the Management Board and Group Management Committee’s “Balanced Scorecard” assessments.
Deutsche Bank AG employs a wide range of talent acquisition, development and promotion initiatives, impacting the full employee life cycle and advancing equal opportunity within the organization. These measures include:
- - Visible support from members of the Management Board and Group Executive Committee on five key global initiatives designed to influence everyday behavior and achieve measurable impact. A specific agenda is set for Germany, which is regularly discussed by the German Management Committee and adapted as necessary
- - The bank’s internal “Women Global Leaders” (WGL) and “Accomplished Top Leaders Advancement Strategy” (ATLAS) programs, which helps high-performing Directors and Managing Director women to take on a broader range of responsibility and realize specific advancement opportunities
- - The global, internal “Schneider-Lenné Cadre” network for top female executives, which aims to sustainably promote diversity, equality, and inclusion at the most senior levels of the organization. Schneider-Lenné Cadre network members drive cultural change and support talent from across the bank
- - Cross-divisional and group-wide coaching and mentorship programs designed for high-performing women at all corporate title levels to take on leadership positions and higher professional responsibility.
- - Training and communication formats on how to deal with unconscious bias provided for all staff, and especially for managers
- - Targeted campaigns to hire female talent for Deutsche Bank AG. Example hiring areas include graduates across the bank, Technology and Data Innovation
- - Systematic integration of our “Diversity, Equality & Inclusion” principles into HR processes, including hiring, promotions, regular reporting and a wide range of training and information opportunities for managers at all levels – from newly appointed to highly experienced managers
In a broader sense, these activities and measures also comprise wide-ranging support for employees in meeting demands at work and in their private lives. Examples include support for familial obligations from childcare to nursing care, well-being benefits, flexible working models in terms of time and place of work, opportunities to take a sabbatical, coaching for parents entering and returning to work from parental leave, and other programs concerning specific areas of need.
Deutsche Bank AG is making progress on the proportion of women in management positions and has also repeatedly been recognized as a top employer for women. Evidence of the positive effect of the range of activities and measures implemented is reflected in the increase in the proportion of women in management positions at Deutsche Bank AG.
230 |
Deutsche Bank | ||
Annual Report 2022 | ||
Deutsche Bank AG's implementation of the German statutory gender quota in accordance with section 96 (2), section 111 (5) und section 76 (4) of the German Stock Corporation Act in the reporting period from 2017 to 20211
2021 | 2020 | 2019 | 2018 | 2017 | ||||||
Proportion of women on the Supervisory Board of Deutsche Bank AG | 30.0% | 30.0% | 35.0% | 35.0% | 35.0% | |||||
Number of women on the Management Board of Deutsche Bank AG: | 2 | 1 | 0 | 2 | 3 | |||||
Proportion of women at first management level below the | 20.0% | 20.0% | 19.7% | 20.8% | 18.0% | |||||
Proportion of women at second management level below the | 27.5% | 23.9% | 19.5% | 20.9% | 19.6% | |||||
1All figures refer to the reporting date of December 31 in the reporting year
For further details on group-wide activities, measures, and indicators, please refer to our comprehensive HR Reports from 2017 to 2021.
Measures to establish equal pay for men and women
The total remuneration of Deutsche Bank AG employees consists mainly of a basic remuneration and a variable component. The basic remuneration is measured primarily based on the tasks, responsibilities, qualifications and experience an employee holds. In many cases, the basic remuneration is based on collective regulations such as collective bargaining agreements, company agreements or other specifications. These specifications determine the classification of an employee’s function and the determination of the related basic salary, and that salary’s continued development. These agreements and specifications are the basis for equal pay between men and women.
Since 2017, the new, globally applicable compensation framework, initially introduced for non-tariff employees in 2016, has been extended to tariff employees. This ensures a more transparent remuneration approach by introducing reference rates for the ratio of fixed to variable remuneration depending on the hierarchy level and the business area, which now applies to all employees. In addition, employees are equally involved in the bank's financial results through a uniform group factor applied to variable compensation. As a result of the introduction of group variable compensation, the proportion of individual’s discretionary variable remuneration compared to their total remuneration was reduced overall. These measures significantly limit the possibility of any unequal treatment.
In the years that followed, this approach has continuously developed. Against this background, the bank also endeavored to further sharpen the connection between the role of employees and their remuneration, and to make this relationship more transparent. In 2020, a new role-based remuneration approach for non-tariff employees was introduced, in which each role was assigned a specific fixed pay range.
In 2020, the merger of Privat- und Firmenkunden AG with Deutsche Bank AG expanded our group of employees to include those who are subject to the remuneration systems of the former Deutsche Postbank AG. Most of these employees fall under the Deutsche Postbank AG collective wage agreement, while the wages of non-tariff employees are governed by a general works agreement. The salaries of included civil servants are based on federal salary law.
Please refer to our comprehensive HR Reports from 2017 to 2021 for further details.
Statistics
Average number of employees at Deutsche Bank AG in Germany (excluding foreign branches):
2021 | 20201 | 2019 | 2018 | 2017 | ||||||
Women | 12,816 | 10,459 | 4,973 | 5,091 | 5,198 | |||||
Full-time | 6,800 | 5,709 | 3,133 | 3,232 | 3,320 | |||||
Part-time | 6,016 | 4,750 | 1,840 | 1,859 | 1,878 | |||||
Men | 12,810 | 11,027 | 7,018 | 7,227 | 7,325 | |||||
Full-time | 12,127 | 10,479 | 6,784 | 6,962 | 7,076 | |||||
Part-time | 683 | 548 | 234 | 265 | 249 | |||||
1The employees of the former DB Privat- und Firmenkundenbank AG have been included in the average values since the merger in May of 2020.
231 |
Deutsche Bank | ||
Annual Report 2022 | ||
2- Consolidated Financial Statements
Consolidated Statement of Income | 23 – | |||||||||||||||||||||||||||||
Consolidated Statement of Comprehensive Income | 24 – | |||||||||||||||||||||||||||||
Consolidated Balance Sheet | 25 – | |||||||||||||||||||||||||||||
Consolidated statement of changes in equity | 26 – | |||||||||||||||||||||||||||||
Consolidated Statement of Cash Flows | 27 – | |||||||||||||||||||||||||||||
Notes to the consolidated financial statements | 28 – | |||||||||||||||||||||||||||||
1 – | 29 – | |||||||||||||||||||||||||||||
2 – | 30 – | |||||||||||||||||||||||||||||
3 – | 31 – | |||||||||||||||||||||||||||||
4 – | ||||||||||||||||||||||||||||||
Notes to the consolidated income statement | ||||||||||||||||||||||||||||||
5 – | Additional Notes | |||||||||||||||||||||||||||||
32 – | ||||||||||||||||||||||||||||||
6 – | 33 – | |||||||||||||||||||||||||||||
7 – | 34 – | |||||||||||||||||||||||||||||
8 – | 35 – | |||||||||||||||||||||||||||||
9 – | 36 – | |||||||||||||||||||||||||||||
10 – | 37 – | |||||||||||||||||||||||||||||
11 – | 38 – | |||||||||||||||||||||||||||||
39 – | ||||||||||||||||||||||||||||||
Notes to the consolidated balance sheet | 40 – | |||||||||||||||||||||||||||||
12 – | 41 – | |||||||||||||||||||||||||||||
13 – | 42 – | |||||||||||||||||||||||||||||
14 – | 43 – | |||||||||||||||||||||||||||||
15 – | 44 – | |||||||||||||||||||||||||||||
16 – | 45 – | |||||||||||||||||||||||||||||
17 – | 46 – | |||||||||||||||||||||||||||||
18 – | Confirmations | |||||||||||||||||||||||||||||
19 – | ||||||||||||||||||||||||||||||
20 – | ||||||||||||||||||||||||||||||
21 – | ||||||||||||||||||||||||||||||
22 – | ||||||||||||||||||||||||||||||
232 |
Deutsche Bank | ||
Annual Report 2022 | ||
Consolidated Statement of Income
in € m. | Notes | 2022 | 2021 | 2020 | ||||
Interest and similar income1 | 5 | 24,299 | 16,599 | 17,806 | ||||
Interest expense | 5 | 10,649 | 5,444 | 6,280 | ||||
Net interest income | 5 | 13,650 | 11,155 | 11,526 | ||||
Provision for credit losses | 19 | 1,226 | 515 | 1,792 | ||||
Net interest income after provision for credit losses | 12,425 | 10,640 | 9,734 | |||||
Commissions and fee income | 6 | 9,838 | 10,934 | 9,424 | ||||
Net gains (losses) on financial assets/liabilities at fair value through | 5 | 2,999 | 3,045 | 2,465 | ||||
Net gains (losses) from derecognition of financial assets measured at amortized cost | 7 | (2) | 1 | 311 | ||||
Net gains (losses) on financial assets at fair value through other | (216) | 237 | 323 | |||||
Net income (loss) from equity method investments | 16 | 152 | 98 | 120 | ||||
Other income (loss) | 8 | 789 | (58) | (141) | ||||
Total noninterest income | 13,560 | 14,255 | 12,503 | |||||
Compensation and benefits | 33 | 10,712 | 10,418 | 10,471 | ||||
General and administrative expenses | 9 | 9,728 | 10,821 | 10,259 | ||||
Impairment of goodwill and other intangible assets | 23 | 68 | 5 | 0 | ||||
Restructuring activities | 10 | (118) | 261 | 485 | ||||
Total noninterest expenses | 20,390 | 21,505 | 21,216 | |||||
Profit (loss) before income taxes | 5,594 | 3,390 | 1,021 | |||||
Income tax expense (benefit) | 34 | (64) | 880 | 397 | ||||
Profit (loss) | 5,659 | 2,510 | 624 | |||||
Profit (loss) attributable to noncontrolling interests | 134 | 144 | 129 | |||||
Profit (loss) attributable to Deutsche Bank shareholders and additional | 5,525 | 2,365 | 495 | |||||
1Interest and similar income included € 19.6 billion, € 13.2 billion and € 13.9 billion for the year ended December 31, 2022, 2021 and 2020, respectively, calculated based on effective interest method.
Earnings per Share
| Notes | 2022 | 2021 | 2020 | ||||
Earnings per share:1 | 11 | |||||||
Basic | € 2.42 | € 0.96 | € 0.07 | |||||
Diluted | € 2.37 | € 0.93 | € 0.07 | |||||
Number of shares in million: | ||||||||
Denominator for basic earnings per share – | 2,084.9 | 2,096.5 | 2,108.2 | |||||
Denominator for diluted earnings per share – | 2,125.6 | 2,143.2 | 2,170.1 | |||||
1Earnings were adjusted by € 479 million, € 363 million and € 349 million before tax for the coupons paid on Additional Tier 1 Notes in April 2022, April 2021 and April 2020. In accordance with IAS 33 the coupons paid on Additional Tier 1 Notes are not attributable to Deutsche Bank shareholders and therefore need to be deducted in the calculation.
The accompanying notes are an integral part of the Consolidated Financial Statements.
233 |
Deutsche Bank | ||
Annual Report 2022 | ||
Consolidated Statement of Comprehensive Income
in € m. | 2022 | 2021 | 2020 | |||
Profit (loss) recognized in the income statement | 5,659 | 2,510 | 624 | |||
Other comprehensive income | ||||||
Items that will not be reclassified to profit or loss | ||||||
Remeasurement gains (losses) related to defined benefit plans, before tax | 1,203 | 804 | 149 | |||
Net fair value gains (losses) attributable to credit risk related to financial | 91 | (15) | (24) | |||
Total of income tax related to items that will not be reclassified to profit or loss | (667) | (202) | 82 | |||
Items that are or may be reclassified to profit or loss | ||||||
Financial assets at fair value through other comprehensive income | ||||||
Unrealized net gains (losses) arising during the period, before tax | (1,285) | (344) | 676 | |||
Realized net (gains) losses arising during the period (reclassified to profit or loss), | 216 | (237) | (323) | |||
Derivatives hedging variability of cash flows | ||||||
Unrealized net gains (losses) arising during the period, before tax | (819) | 1 | (14) | |||
Realized net (gains) losses arising during the period (reclassified to profit or loss), | 71 | (54) | 4 | |||
Assets classified as held for sale | ||||||
Unrealized net gains (losses) arising during the period, before tax | 0 | 0 | 0 | |||
Realized net (gains) losses arising during the period (reclassified to profit or loss), | 0 | 0 | 0 | |||
Foreign currency translation | ||||||
Unrealized net gains (losses) arising during the period, before tax | 329 | 1,117 | (1,819) | |||
Realized net (gains) losses arising during the period (reclassified to profit or loss), | (20) | (14) | 6 | |||
Equity Method Investments | ||||||
Net gains (losses) arising during the period | 20 | (5) | 1 | |||
Total of income tax related to items that are or may be reclassified to profit or loss | 596 | 285 | (122) | |||
Other comprehensive income (loss), net of tax | (267) | 1,334 | (1,385) | |||
Total comprehensive income (loss), net of tax | 5,392 | 3,844 | (762) | |||
Attributable to: | ||||||
Noncontrolling interests | 185 | 212 | 59 | |||
Deutsche Bank shareholders and additional equity components | 5,207 | 3,632 | (821) | |||
The accompanying notes are an integral part of the Consolidated Financial Statements.
234 |
Deutsche Bank | ||
Annual Report 2022 | ||
Consolidated Balance Sheet
in € m. | Notes | Dec 31, 2022 | Dec 31, 2021 | |||
Assets: | ||||||
Cash and central bank balances | 178,896 | 192,021 | ||||
Interbank balances (w/o central banks) | 7,195 | 7,342 | ||||
Central bank funds sold and securities purchased under resale agreements | 20 | 11,478 | 8,368 | |||
Securities borrowed | 20 | (0) | 63 | |||
Financial assets at fair value through profit or loss | ||||||
Trading assets | 92,867 | 102,396 | ||||
Positive market values from derivative financial instruments | 299,686 | 299,732 | ||||
Non-trading financial assets mandatory at fair value through profit and loss | 89,654 | 88,965 | ||||
Financial assets designated at fair value through profit or loss | 168 | 140 | ||||
Total financial assets at fair value through profit or loss | 12, 13, 20, 35 | 482,376 | 491,233 | |||
Financial assets at fair value through other comprehensive income | 15 | 31,675 | 28,979 | |||
Equity method investments | 16 | 1,124 | 1,091 | |||
Loans at amortized cost | 18, 19, 20 | 483,700 | 471,319 | |||
Property and equipment | 21, 22 | 6,103 | 5,536 | |||
Goodwill and other intangible assets | 23 | 7,092 | 6,824 | |||
Other assets 1 | 24, 25 | 118,293 | 103,785 | |||
Assets for current tax | 1,584 | 1,214 | ||||
Deferred tax assets | 34 | 7,272 | 6,218 | |||
Total assets | 1,336,788 | 1,323,993 | ||||
Liabilities and equity: | ||||||
Deposits | 26 | 621,456 | 603,750 | |||
Central bank funds purchased and securities sold under repurchase agreements | 20 | 573 | 747 | |||
Securities loaned | 20 | 13 | 24 | |||
Financial liabilities at fair value through profit or loss | ||||||
Trading liabilities | 50,616 | 54,718 | ||||
Negative market values from derivative financial instruments | 282,353 | 287,108 | ||||
Financial liabilities designated at fair value through profit or loss | 54,634 | 58,468 | ||||
Investment contract liabilities | 469 | 562 | ||||
Total financial liabilities at fair value through profit or loss | 12, 13, 20, 35 | 388,072 | 400,857 | |||
Other short-term borrowings | 29 | 5,122 | 4,034 | |||
Other liabilities 1 | 22, 24, 25 | 113,714 | 97,796 | |||
Provisions | 19, 27 | 2,449 | 2,641 | |||
Liabilities for current tax | 388 | 600 | ||||
Deferred tax liabilities | 34 | 650 | 501 | |||
Long-term debt | 30 | 131,525 | 144,485 | |||
Trust preferred securities | 30 | 500 | 528 | |||
Total liabilities | 1,264,460 | 1,255,962 | ||||
Common shares, no par value, nominal value of € 2.56 | 32 | 5,291 | 5,291 | |||
Additional paid-in capital | 40,513 | 40,580 | ||||
Retained earnings | 17,800 | 12,607 | ||||
Common shares in treasury, at cost | 32 | (331) | (6) | |||
Accumulated other comprehensive income (loss), net of tax | (1,314) | (444) | ||||
Total shareholders’ equity | 61,959 | 58,027 | ||||
Additional equity components | 8,578 | 8,305 | ||||
Noncontrolling interests | 1,791 | 1,698 | ||||
Total equity | 72,328 | 68,030 | ||||
Total liabilities and equity | 1,336,788 | 1,323,993 | ||||
1Includes non-current assets and disposal groups held for sale.
The accompanying notes are an integral part of the Consolidated Financial Statements.
235 |
Deutsche Bank | ||
Annual Report 2022 | ||
Consolidated statement of changes in equity
Unrealized net gains (losses) | ||||||||||||||||||||||||||||||
in € m. | Common shares | Additional | Retained | Common shares | On financial | Attributable to | On | On assets | Foreign | Unrealized | Accumula- | Total | Additional | Noncontrolling | Total equity | |||||||||||||||
Balance as of December 31, 2019 | 5,291 | 40,505 | 9,644 | (4) | 45 | 25 | 14 | 0 | 336 | 0 | 421 | 55,857 | 4,665 | 1,638 | 62,160 | |||||||||||||||
Total comprehensive income (loss), net of tax1 | 0 | 0 | 495 | 0 | 233 | (18) | (7) | 0 | (1,747) | (1) | (1,539) | (1,044) | 0 | 57 | (987) | |||||||||||||||
Gains (losses) attributable to equity instruments designated as at fair value through other comprehensive income, net of tax | 0 | 0 | 0 | 0 | 0 | 0 | 0 | 0 | 0 | 0 | 0 | 0 | 0 | 0 | 0 | |||||||||||||||
Gains (losses) upon early extinguishment attributable to change in own credit risk of financial liabilities designated as at fair value through profit and loss, net of tax | 0 | 0 | 0 | 0 | 0 | 0 | 0 | 0 | 0 | 0 | 0 | 0 | 0 | 0 | 0 | |||||||||||||||
Cash dividends paid | 0 | 0 | 0 | 0 | 0 | 0 | 0 | 0 | 0 | 0 | 0 | 0 | 0 | (77) | (77) | |||||||||||||||
Coupon on additional equity components, before tax | 0 | 0 | (349) | 0 | 0 | 0 | 0 | 0 | 0 | 0 | 0 | (349) | 0 | 0 | (349) | |||||||||||||||
Remeasurement gains (losses) related to defined benefit plans, net of tax | 0 | 0 | 223 | 0 | 0 | 0 | 0 | 0 | 0 | 0 | 0 | 223 | 0 | 2 | 225 | |||||||||||||||
Net change in share awards in the reporting period | 0 | (131) | 0 | 0 | 0 | 0 | 0 | 0 | 0 | 0 | 0 | (131) | 0 | (4) | (135) | |||||||||||||||
Treasury shares distributed under share-based compensation plans | 0 | 0 | 0 | 208 | 0 | 0 | 0 | 0 | 0 | 0 | 0 | 208 | 0 | 0 | 208 | |||||||||||||||
Tax benefits related to share-based compensation plans | 0 | 11 | 0 | 0 | 0 | 0 | 0 | 0 | 0 | 0 | 0 | 11 | 0 | 0 | 11 | |||||||||||||||
Option premiums and other effects from options on common shares | 0 | 0 | 0 | 0 | 0 | 0 | 0 | 0 | 0 | 0 | 0 | 0 | 0 | 0 | 0 | |||||||||||||||
Purchases of treasury shares | 0 | 0 | 0 | (279) | 0 | 0 | 0 | 0 | 0 | 0 | 0 | (279) | 0 | 0 | (279) | |||||||||||||||
Sale of treasury shares | 0 | 0 | 0 | 68 | 0 | 0 | 0 | 0 | 0 | 0 | 0 | 68 | 0 | 0 | 68 | |||||||||||||||
Net gains (losses) on treasury shares sold | 0 | 0 | 0 | 0 | 0 | 0 | 0 | 0 | 0 | 0 | 0 | 0 | 0 | 0 | 0 | |||||||||||||||
Other | 0 | 221 | 0 | 0 | 0 | 0 | 0 | 0 | 0 | 0 | 0 | 221 | 1,1594 | (28) | 1,352 | |||||||||||||||
Balance as of December 31, 2020 | 5,291 | 40,606 | 10,014 | (7) | 278 | 7 | 7 | 0 | (1,411) | (1) | (1,118) | 54,786 | 5,824 | 1,587 | 62,196 | |||||||||||||||
Total comprehensive income (loss), net of tax1 | 0 | 0 | 2,365 | 0 | (398) | (13) | (40) | 0 | 1,129 | (5) | 672 | 3,038 | 0 | 207 | 3,245 | |||||||||||||||
Gains (losses) attributable to equity instruments designated as at fair value through other comprehensive income, net of tax | 0 | 0 | 0 | 0 | 0 | 0 | 0 | 0 | 0 | 0 | 0 | 0 | 0 | 0 | 0 | |||||||||||||||
Gains (losses) upon early extinguishment attributable to change in own credit risk of financial liabilities designated as at fair value through profit and loss, net of tax | 0 | 0 | (2) | 0 | 0 | 2 | 0 | 0 | 0 | 0 | 2 | 0 | 0 | 0 | 0 | |||||||||||||||
Cash dividends paid | 0 | 0 | 0 | 0 | 0 | 0 | 0 | 0 | 0 | 0 | 0 | 0 | 0 | (85) | (85) | |||||||||||||||
Coupon on additional equity components, before tax | 0 | 0 | (363) | 0 | 0 | 0 | 0 | 0 | 0 | 0 | 0 | (363) | 0 | 0 | (363) | |||||||||||||||
Remeasurement gains (losses) related to defined benefit plans, net of tax | 0 | 0 | 592 | 0 | 0 | 0 | 0 | 0 | 0 | 0 | 0 | 592 | 0 | 4 | 597 | |||||||||||||||
Net change in share awards in the reporting period | 0 | (99) | 0 | 0 | 0 | 0 | 0 | 0 | 0 | 0 | 0 | (99) | 0 | (2) | (101) | |||||||||||||||
Treasury shares distributed under share-based compensation plans | 0 | 0 | 0 | 312 | 0 | 0 | 0 | 0 | 0 | 0 | 0 | 312 | 0 | 0 | 312 | |||||||||||||||
Tax benefits related to share-based compensation plans | 0 | 29 | 0 | 0 | 0 | 0 | 0 | 0 | 0 | 0 | 0 | 29 | 0 | 0 | 29 | |||||||||||||||
Option premiums and other effects from options on common shares | 0 | (50) | 0 | 0 | 0 | 0 | 0 | 0 | 0 | 0 | 0 | (50) | 0 | 0 | (50) | |||||||||||||||
Purchases of treasury shares | 0 | 0 | 0 | (346) | 0 | 0 | 0 | 0 | 0 | 0 | 0 | (346) | 0 | 0 | (346) | |||||||||||||||
Sale of treasury shares | 0 | 0 | 0 | 35 | 0 | 0 | 0 | 0 | 0 | 0 | 0 | 35 | 0 | 0 | 35 | |||||||||||||||
Net gains (losses) on treasury shares sold | 0 | 0 | 0 | 0 | 0 | 0 | 0 | 0 | 0 | 0 | 0 | 0 | 0 | 0 | 0 | |||||||||||||||
Other | 0 | 94 | 0 | 0 | 0 | 0 | 0 | 0 | 0 | 0 | 0 | 94 | 2,4814 | (13) | 2,562 | |||||||||||||||
Balance as of December 31, 2021 | 5,291 | 40,580 | 12,607 | (6) | (120) | (3) | (33) | 0 | (282) | (6) | (444) | 58,027 | 8,305 | 1,698 | 68,030 | |||||||||||||||
Total comprehensive income (loss), net of tax1 | 0 | 0 | 5,525 | 0 | (867) | 65 | (537) | 0 | 452 | 16 | (870) | 4,655 | 0 | 177 | 4,832 | |||||||||||||||
Gains (losses) attributable to equity instruments designated as at fair value through other comprehensive income, net of tax | 0 | 0 | 0 | 0 | 0 | 0 | 0 | 0 | 0 | 0 | 0 | 0 | 0 | 0 | 0 | |||||||||||||||
Gains (losses) upon early extinguishment attributable to change in own credit risk of financial liabilities designated as at fair value through profit and loss, net of tax | 0 | 0 | 0 | 0 | 0 | 0 | 0 | 0 | 0 | 0 | 0 | 0 | 0 | 0 | 0 | |||||||||||||||
Cash dividends paid | 0 | 0 | (406) | 0 | 0 | 0 | 0 | 0 | 0 | 0 | 0 | (406) | 0 | (96) | (502) | |||||||||||||||
Coupon on additional equity components, before tax | 0 | 0 | (479) | 0 | 0 | 0 | 0 | 0 | 0 | 0 | 0 | (479) | 0 | 0 | (479) | |||||||||||||||
Remeasurement gains (losses) related to defined benefit plans, net of tax | 0 | 0 | 553 | 0 | 0 | 0 | 0 | 0 | 0 | 0 | 0 | 553 | 0 | 8 | 561 | |||||||||||||||
Net change in share awards in the reporting period | 0 | (48) | 0 | 0 | 0 | 0 | 0 | 0 | 0 | 0 | 0 | (48) | 0 | (1) | (49) | |||||||||||||||
Treasury shares distributed under share-based compensation plans | 0 | 0 | 0 | 370 | 0 | 0 | 0 | 0 | 0 | 0 | 0 | 370 | 0 | 0 | 370 | |||||||||||||||
Tax benefits related to share-based compensation plans | 0 | 17 | 0 | 0 | 0 | 0 | 0 | 0 | 0 | 0 | 0 | 17 | 0 | 0 | 17 | |||||||||||||||
Option premiums and other effects from options on common shares | 0 | (58) | 0 | 0 | 0 | 0 | 0 | 0 | 0 | 0 | 0 | (58) | 0 | 0 | (58) | |||||||||||||||
Purchases of treasury shares | 0 | 0 | 0 | (695) | 0 | 0 | 0 | 0 | 0 | 0 | 0 | (695) | 0 | 0 | (695) | |||||||||||||||
Sale of treasury shares | 0 | 0 | 0 | 0 | 0 | 0 | 0 | 0 | 0 | 0 | 0 | 0 | 0 | 0 | 0 | |||||||||||||||
Net gains (losses) on treasury shares sold | 0 | 0 | 0 | 0 | 0 | 0 | 0 | 0 | 0 | 0 | 0 | 0 | 0 | 0 | 0 | |||||||||||||||
Other | 0 | 22 | 1 | 0 | 0 | 0 | 0 | 0 | 0 | 0 | 0 | 24 | 2734 | 5 | 301 | |||||||||||||||
Balance as of December 31, 2022 | 5,291 | 40,513 | 17,800 | (331 ) | (986) | 62 | (570) | 0 | 171 | 10 | (1,314 ) | 61,959 | 8,578 | 1,791 | 72,328 | |||||||||||||||
1Excluding remeasurement gains (losses) related to defined benefit plans, net of tax.
2Excluding unrealized net gains (losses) from equity method investments.
3 Includes Additional Tier 1 Notes, which constitute unsecured and subordinated notes of Deutsche Bank and are classified as equity in accordance with IFRS.
4Includes net proceeds from issuance, purchase and sale of Additional Equity Components.
236 |
Deutsche Bank | ||
Annual Report 2022 | ||
Consolidated Statement of Cash Flows
in € m. | 2022 | 2021 | 2020 | |||
Net Income (loss) | 5,659 | 2,510 | 624 | |||
Cash flows from operating activities: | ||||||
Adjustments to reconcile net income to net cash provided by (used in) operating activities: | ||||||
Provision for credit losses | 1,226 | 515 | 1,792 | |||
Restructuring activities | (118) | 261 | 485 | |||
Gain on sale of financial assets at fair value through other comprehensive income, equity method investments and other | 128 | (276) | (665) | |||
Deferred income taxes, net | (852) | 19 | (296) | |||
Impairment, depreciation and other amortization, and accretion | 3,529 | 3,568 | 2,192 | |||
Share of net income from equity method investments | (129) | (197) | (103) | |||
Income (loss) adjusted for noncash charges, credits and other items | 9,443 | 6,400 | 4,030 | |||
Adjustments for net change in operating assets and liabilities: | ||||||
Interest-earning time deposits with central banks and banks | 102 | 97 | (1,202) | |||
Central bank funds sold, securities purchased under resale agreements, securities borrowed | (3,046) | 102 | 5,688 | |||
Non-Trading financial assets mandatory at fair value through profit and loss | 1,511 | (12,124) | 8,597 | |||
Financial assets designated at fair value through profit or loss | (31) | 309 | (430) | |||
Loans at amortized cost | (5,101) | (41,628) | (1,098) | |||
Other assets | (459) | 8,046 | (11,743) | |||
Deposits | 11,686 | 33,269 | (2,154) | |||
Financial liabilities designated at fair value through profit or loss and investment contract liabilities1 | (6,046) | 11,144 | (3,233) | |||
Central bank funds purchased, securities sold under repurchase agreements, securities loaned | (187) | (3,249) | 678 | |||
Other short-term borrowings | 1,065 | 477 | (1,638) | |||
Other liabilities | 12,377 | (17,823) | 7,030 | |||
Senior long-term debt2 | (17,019) | (6,191) | 13,282 | |||
Trading assets and liabilities, positive and negative market values from derivative financial instruments, net | 2,249 | 19,559 | 9,892 | |||
Other, net | (8,658) | (1,341) | 3,036 | |||
Net cash provided by (used in) operating activities | (2,113) | (2,952) | 30,736 | |||
Cash flows from investing activities: | ||||||
Proceeds from: | ||||||
Sale of financial assets at fair value through other comprehensive income | 15,450 | 52,131 | 38,325 | |||
Maturities of financial assets at fair value through other comprehensive income | 21,557 | 21,424 | 32,964 | |||
Sale of debt securities held to collect at amortized cost | 0 | 67 | 10,110 | |||
Maturities of debt securities held to collect at amortized cost | 6,519 | 5,468 | 4,890 | |||
Sale of equity method investments | 118 | 23 | 69 | |||
Sale of property and equipment | 22 | 114 | 24 | |||
Purchase of: | ||||||
Financial assets at fair value through other comprehensive income | (42,991) | (46,801) | (82,709) | |||
Debt Securities held to collect at amortized cost | (16,696) | (7,166) | (4,011) | |||
Equity method investments | (171) | (100) | (3) | |||
Property and equipment | (337) | (550) | (512) | |||
Net cash received in (paid for) business combinations/divestitures | 439 | (5) | 5 | |||
Other, net | (1,086) | (1,010) | (1,045) | |||
Net cash provided by (used in) investing activities | (17,175) | 23,595 | (1,892) | |||
Cash flows from financing activities: | ||||||
Issuances of subordinated long-term debt | 2,7163 | 1,146 | 1,684 | |||
Repayments and extinguishments of subordinated long-term debt | (90)3 | (42) | (1,169) | |||
Issuances of trust preferred securities | 04 | 0 | 0 | |||
Repayments and extinguishments of trust preferred securities | 04 | (504) | (676) | |||
Principal portion of lease payments | (607) | (679) | (653) | |||
Common shares issued | 0 | 0 | 0 | |||
Purchases of treasury shares | (695) | (346) | (279) | |||
Sale of treasury shares | 0 | 35 | 76 | |||
Additional Equity Components (AT1) issued | 2,000 | 2,500 | 1,153 | |||
Additional Equity Components (AT1) repaid | (1,750) | 0 | 0 | |||
Purchases of Additional Equity Components (AT1) | (4,058) | (2,662) | (792) | |||
Sale of Additional Equity Components (AT1) | 4,074 | 2,642 | 798 | |||
Coupon on additional equity components, pre tax | (479) | (363) | (349) | |||
Dividends paid to noncontrolling interests | (96) | (85) | (77) | |||
Net change in noncontrolling interests | 5 | (13) | (28) | |||
Cash dividends paid to Deutsche Bank shareholders | (406) | 0 | 0 | |||
Other, net | 0 | 0 | 0 | |||
Net cash provided by (used in) financing activities | 614 | 1,630 | (311) | |||
Net effect of exchange rate changes on cash and cash equivalents | 4,354 | 1,345 | (1,074) |
237 |
Deutsche Bank | ||
Annual Report 2022 | ||
Net increase (decrease) in cash and cash equivalents | (14,320) | 23,618 | 27,459 | |||
Cash and cash equivalents at beginning of period | 179,946 | 156,328 | 128,869 | |||
Cash and cash equivalents at end of period | 165,626 | 179,946 | 156,328 | |||
Net cash provided by (used in) operating activities include | ||||||
Income taxes paid (received), net | 1,288 | 1,031 | 805 | |||
Interest paid | 9,468 | 5,557 | 6,937 | |||
Interest received | 22,667 | 15,807 | 18,498 | |||
Dividends received | 87 | 364 | 307 | |||
Cash and cash equivalents comprise | ||||||
Cash and central bank balances5 | 159,876 | 174,089 | 149,323 | |||
Interbank balances (w/o central banks)6 | 5,749 | 5,857 | 7,006 | |||
Total | 165,626 | 179,946 | 156,328 | |||
1 Included are senior long-term debt issuances of € 2.5 billion and € 1.3 billion and repayments and extinguishments of € 738 million and € 1.0 billion through December 31, 2022 and December 31, 2021, respectively.
2Included are issuances of € 36.4 billion and € 33.6 billion and repayments and extinguishments of € 44.2 billion and € 39.5 billion through December 31, 2022 and December 31, 2021, respectively.
3 Non-cash changes for Subordinated Long Term Debt are € (141) million in total and mainly driven by Fair Value changes of € (464) million and Foreign Exchange movements of € 321 million.
4Non-cash changes for Trust Preferred Securities are € (28) million in total and mainly driven by Fair Value changes of € (33) million.
5Not included: Interest-earning time deposits with central banks of € 19.0 billion as of December 31, 2022, € 17.9 as of December 2021 and € 16.9 billion as of December 31, 2020.
6Not included: Interest-earning time deposits with banks of € 1.4 billion as of December 31, 2022, € 1.5 billion as of December 31, 2021 and € 2.1 billion as of December 31, 2020.
Cash and central bank balances include time and demand deposits at the Russian Central Bank of € 759 million as of December 31, 2022. These are subject to foreign exchange restrictions. Thereof, demand deposits of € 40 million qualify as Cash and cash equivalents at end of period.
The accompanying notes are an integral part of the Consolidated Financial Statements.
238 |
Deutsche Bank | ||
Annual Report 2022 | ||
Notes to the consolidated financial statements
01 – Significant accounting policies and critical accounting estimates
Basis of accounting
Deutsche Bank Aktiengesellschaft, Taunusanlage 12, 60325 Frankfurt am Main, Germany (“Deutsche Bank” or the “Parent”) is a stock corporation organized under the laws of the Federal Republic of Germany. Deutsche Bank together with all entities in which Deutsche Bank has a controlling financial interest (collectively the “Group”, or “Deutsche Bank”) is a global provider of a full range of corporate and investment banking, private clients and asset management products and services.
The accompanying consolidated financial statements are stated in euros, the presentation currency of the Group. All financial information presented in million euros has been rounded to the nearest million. The consolidated financial statements have been prepared in accordance with International Financial Reporting Standards (“IFRS”) as issued by the International Accounting Standards Board (“IASB”) and endorsed by the European Union (EU).
Prior to publication on March 17, 2023, the Supervisory Board approved the Consolidated Financial Statements 2022 of the Group on March 16, 2023, which were drawn up by the Management Board on March 9, 2023.
EU carve-out
The Group applies fair value hedge accounting for portfolio hedges of interest rate risk (fair value macro hedges) in accordance with the EU carve-out version of IAS 39. The purpose of applying the EU carve-out version of IAS 39 is to align the Group’s hedge accounting approach with its risk management practice and the accounting practice of its major European peers. Under the EU carve-out version of IAS 39, fair value macro hedge accounting may be applied to core deposits and hedge ineffectiveness is generally only recognized when the revised estimate of the amount of cash flows in scheduled time buckets falls below the original designated amount of that bucket. If the revised amount of cash flows in scheduled time buckets is more than the original designated amount then there is no hedge ineffectiveness. Under IFRS as issued by the IASB, hedge accounting for fair value macro hedges cannot be applied to core deposits. In addition, under IFRS as issued by the IASB hedge ineffectiveness arises for all fair value macro hedge accounting relationships whenever the revised estimate of the amount of cash flows in scheduled time buckets is either more or less than the original designated amount of that bucket.
For the financial year ended December 31, 2022, the application of the EU carve-out version of IAS 39 had a positive impact of € 147 million on profit before tax and of € 105 million on profit after tax. For the financial year ended December 31, 2021, the application of the EU carve-out had a negative impact of € 128 million on profit before taxes and of € 85 million on profit post taxes.
The Group’s regulatory capital and ratios thereof are also reported on the basis of the EU carve-out version of IAS 39. The impact on profit also impacts the calculation of the CET1 capital ratio. For the financial year ended December 31, 2022, application of the EU carve-out had a positive impact on the CET1 capital ratio of about 3 basis points and a negative impact of about 2 basis points for the financial year ended December 31, 2021.
239 |
Deutsche Bank | ||
Annual Report 2022 | ||
IFRS 7 disclosures (including war in Ukraine and climate risk related disclosures)
Disclosures about the nature and the extent of risks arising from financial instruments as required by IFRS 7, “Financial Instruments: Disclosures” are set forth in the Risk Report section of the Management Report and are an integral part of the Consolidated Financial Statements.
Details on related risks, exposures and the impact on financial instrument impairment (including the use of overlays) from the war in Ukraine disclosures can be found in the sections, “IFRS 9 impairment” and “Exposure to Russia” in the Risk Report.
Disclosures on climate related risk can be found in the sections, “Enterprise Risk Management”, line item “Environmental, social and governance risk” in the Risk Report.
These audited disclosures are marked in light blue in the Risk Report.
Change in accounting estimates
In the second quarter 2022, a recalibration of the discount curve for defined benefit plans was applied to the Eurozone curve in order to better align to market data which resulted in a benefit recognized in Other Comprehensive Income of € 310 million.
In the third quarter of 2022, the Group implemented a refinement to its methodology for the own credit adjustment calculation. The refinement means that all of the spread above the benchmark rate is regarded as own credit following its implementation. Previously, the spread was parameterized into a market level of funding component (recognition as a gain or loss in the Group’s Consolidated Statement of Income) and an idiosyncratic own credit component (taken through Other Comprehensive Income). The impact from this change in estimate in 2022 was a loss of € 55 million before tax recognized in the Group’s Consolidated Statement of Income. The refined approach is expected to result in an own credit valuation methodology that is more consistent with that of peer banks.
Critical accounting estimates
The preparation of financial statements under IFRS requires management to make estimates and assumptions for certain categories of assets and liabilities. These estimates and assumptions affect the reported amounts of assets and liabilities and disclosure of contingent assets and liabilities at the balance sheet date, and the reported amounts of revenue and expenses during the reporting period. Actual results could differ from management’s estimates. The Group’s significant accounting policies are described in “Significant Accounting Policies”.
Certain of the Group’s accounting policies require critical accounting estimates that involve complex and subjective judgments and the use of assumptions, some of which may be for matters that are inherently uncertain and susceptible to change. Such critical accounting estimates could change from period to period and may have a material impact on the Group’s financial condition, changes in financial condition or results of operations. Critical accounting estimates could also involve estimates where management could have reasonably used another estimate in the current accounting period. The Group has identified the following significant accounting policies that involve critical accounting estimates:
- – Impairment of associates (see “Associates” below)
- – Impairment of financial assets at fair value through other comprehensive income (see “Impairment of Loans and Provision for Off-balance Sheet Positions” below)
- – Determination of fair value (see “Determination of Fair Value” below)
- – Recognition of trade date profit (see “Recognition of Trade Date Profit” below)
- – Impairment of loans and provisions for off-balance sheet positions (see “Impairment of Loans and Provision for Off-balance Sheet Positions” below)
- – Impairment of goodwill and other intangibles (see “Goodwill and Other Intangible Assets” below)
- – Recognition and measurement of deferred tax assets (see “Income Taxes” below)
- – Accounting for legal and regulatory contingencies and uncertain tax positions (see “Provisions” below)
240 |
Deutsche Bank | ||
Annual Report 2022 | ||
Significant accounting policies
The following is a description of the significant accounting policies of the Group. Except for the changes in accounting policies and changes in accounting estimates described previously and noted below these policies have been consistently applied for 2020, 2021 and 2022.
Principles of consolidation
The financial information in the Consolidated Financial Statements includes the parent company, Deutsche Bank AG, together with its consolidated subsidiaries, including certain structured entities presented as a single economic unit.
Subsidiaries
The Group’s subsidiaries are those entities which it directly or indirectly controls. Control over an entity is evidenced by the Group’s ability to exercise its power in order to affect any variable returns that the Group is exposed to through its involvement with the entity.
The Group sponsors the formation of structured entities and interacts with structured entities sponsored by third parties for a variety of reasons, including allowing clients to hold investments in separate legal entities, allowing clients to invest jointly in alternative assets, for asset securitization transactions, and for buying or selling credit protection.
When assessing whether to consolidate an entity, the Group evaluates a range of control factors, namely:
- – Purpose and design of the entity
- – Relevant activities and how these are determined
- – Whether the Group’s rights result in the ability to direct the relevant activities
- – Whether the Group has exposure or rights to variable returns
- – Whether the Group has the ability to use its power to affect the amount of its returns
Where voting rights are relevant, the Group is deemed to have control where it holds, directly or indirectly, more than half of the voting rights over an entity unless there is evidence that another investor has the practical ability to unilaterally direct the relevant activities.
Potential voting rights that are deemed to be substantive are also considered when assessing control.
Likewise, the Group also assesses existence of control where it does not control the majority of the voting power but has the practical ability to unilaterally direct the relevant activities. This may arise in circumstances where the size and dispersion of holdings of the shareholders give the Group the power to direct the activities of the investee.
The Group reassesses the consolidation status at least at every quarterly reporting date. Therefore, any changes in the structure leading to a change in one or more of the control factors, require reassessment when they occur. This includes changes in decision making rights, changes in contractual arrangements, changes in the financing, ownership or capital structure as well as changes following a trigger event which was anticipated in the original documentation.
All intercompany transactions, balances and unrealized gains on transactions between Group companies are eliminated on consolidation.
Consistent accounting policies are applied throughout the Group for the purposes of consolidation. Issuances of a subsidiary’s stock to third parties are treated as noncontrolling interests. Profit or loss attributable to noncontrolling interests are reported separately in the Consolidated Statement of Income and Consolidated Statement of Comprehensive Income.
At the date that control of a subsidiary is lost, the Group: a) derecognizes the assets (including attributable goodwill) and liabilities of the subsidiary at their carrying amounts, b) derecognizes the carrying amount of any noncontrolling interests in the former subsidiary, c) recognizes the fair value of the consideration received and any distribution of the shares of the subsidiary, d) recognizes any investment retained in the former subsidiary at its fair value and e) recognizes any resulting difference of the above items as a gain or loss in the income statement. Any amounts recognized in prior periods in other comprehensive income in relation to that subsidiary would be reclassified to the Consolidated Statement of Income or transferred directly to retained earnings if required by other IFRSs.
241 |
Deutsche Bank | ||
Annual Report 2022 | ||
Associates
Investments in associates are accounted for under the equity method of accounting. An associate is an entity in which the Group has significant influence, but not a controlling interest, over the operating and financial management policy decisions of the entity. Significant influence is generally presumed when the Group holds between 20% and 50% of the voting rights. The existence and effect of potential voting rights that are currently exercisable or convertible are considered in assessing whether the Group has significant influence. Among the other factors that are considered in determining whether the Group has significant influence are representation on the board of directors (supervisory board in the case of German stock corporations) and material intercompany transactions. The existence of these factors could require the application of the equity method of accounting for a particular investment even though the Group’s investment is less than 20% of the voting stock.
Under the equity method of accounting, the Group’s investments in associates and jointly controlled entities are initially recorded at cost including any directly related transaction costs incurred in acquiring the associate, and subsequently increased (or decreased) to reflect both the Group’s pro-rata share of the post-acquisition net income (or loss) of the associate or jointly controlled entity and other movements included directly in the equity of the associate or jointly controlled entity. The Group’s share of the results of associates is adjusted to conform to the accounting policies of the Group and is reported in the Consolidated Statement of Income as Net income (loss) from equity method investments. The Group’s share in the associate’s profits and losses resulting from intercompany sales is eliminated on consolidation. Goodwill arising on the acquisition of an associate or a jointly controlled entity is included in the carrying value of the investment. As goodwill is not reported separately it is not specifically tested for impairment. Rather, the entire equity method investment is tested for impairment at each balance sheet date.
If there is objective evidence of impairment, an impairment test is performed by comparing the investment’s recoverable amount, which is the higher of its value in use and fair value less costs to sell, with its carrying amount. An impairment loss recognized in prior periods is only reversed if there has been a positive change in the estimates used to determine the investment’s recoverable amount since the last impairment loss was recognized. If this is the case the carrying amount of the investment is increased to its higher recoverable amount. The increased carrying amount of the investment in the associate attributable to a reversal of an impairment loss shall not exceed the carrying amount that would have been determined had no impairment loss been recognized for the investment in prior years.
At the date that the Group ceases to have significant influence over the associate or jointly controlled entity the Group recognizes a gain or loss on the disposal of the equity method investment equal to the difference between the sum of the fair value of any retained investment and the proceeds from disposing of the associate and the carrying amount of the investment. Amounts recognized in prior periods in other comprehensive income in relation to the associate are accounted for on the same basis as would have been required if the investee had directly disposed of the related assets or liabilities.
Critical accounting estimates: The assessment of whether there is objective evidence of impairment may require significant management judgment and the estimates for impairment could change from period to period based on future events that may or may not occur. The Group considers this to be a critical accounting estimate.
Foreign currency translation
The Consolidated Financial Statements are prepared in euro, which is the presentation currency of the Group. Various entities in the Group use a different functional currency, being the currency of the primary economic environment in which the entity operates.
An entity records foreign currency revenues, expenses, gains and losses in its functional currency using the exchange rates prevailing at the dates of recognition.
Monetary assets and liabilities denominated in currencies other than the entity’s functional currency are translated at the period end closing rate. Foreign exchange gains and losses resulting from the translation and settlement of these items are recognized in the Consolidated Statement of Income as net gains (losses) on financial assets/liabilities at fair value through profit or loss in order to align the translation amounts with those recognized from foreign currency related transactions (derivatives) which hedge these monetary assets and liabilities.
Non-monetary items that are measured at historical cost are translated using the historical exchange rate at the date of the transaction. Translation differences on non-monetary items which are held at fair value through profit or loss are recognized in profit or loss.
242 |
Deutsche Bank | ||
Annual Report 2022 | ||
For purposes of translation into the presentation currency, assets and liabilities of foreign operations are translated at the period end closing rate and items of income and expense are translated into euros at the rates prevailing on the dates of the transactions, or average rates of exchange where these approximate actual rates. The exchange differences arising on the translation of a foreign operation are included in other comprehensive income. For foreign operations that are subsidiaries, the amount of exchange differences attributable to any noncontrolling interests is recognized in noncontrolling interests.
Upon disposal of a foreign subsidiary and associate (which results in loss of control or significant influence over that operation) the total cumulative exchange differences recognized in other comprehensive income are reclassified to profit or loss.
Upon partial disposal of a foreign operation that is a subsidiary and which does not result in loss of control, the proportionate share of cumulative exchange differences is reclassified from other comprehensive income to noncontrolling interests as this is deemed a transaction with equity holders. For a partial disposal of an associate which does not result in a loss of significant influence, the proportionate share of cumulative exchange differences is reclassified from other comprehensive income to profit or loss.
Interest, commissions and fees
Net interest income – Interest income and expense from all interest-bearing assets and liabilities is recognized as net interest income using the effective interest rate method. The effective interest rate (EIR) is a method of calculating the amortized cost of a financial asset or a financial liability and of allocating the interest income or expense over the relevant period using the estimated future cash flows.
The estimated future cash flows used in the EIR calculation include those determined by all of the contractual terms of the asset or liability, all fees (including commissions) that are considered to be integral to the effective interest rate, direct and incremental transaction costs and all other premiums or discounts. However, if the financial instrument is carried at fair value through profit or loss, any associated fees are recognized in trading income when the instrument is initially recognized, provided there are no significant unobservable inputs used in determining its fair value.
If a financial asset is credit-impaired, interest revenue is calculated by applying the effective interest rate to the amortized cost amount. The amortized cost amount of a financial asset is the gross carrying amount of a financial asset after adjusting for any impairment allowance. For assets which are initially recognized as purchased or credit-impaired, interest revenue is calculated through the use of a credit-adjusted effective interest rate which takes into consideration expected credit losses.
The Group presents negative interest paid on interest-bearing assets as interest expense, and interest revenue received from interest-bearing liabilities as interest income.
The Group presents interest income and expense calculated using the EIR method separately in the Group’s consolidated statement of income.
Commissions and fee income –The Group applies the IFRS 15, “Revenue from Contracts with Customers” five-step revenue recognition model to the recognition of Commissions and Fee Income, under which income must be recognized when control of goods and services is transferred, hence the contractual performance obligations to the customer has been satisfied.
Accordingly, after a contract with a customer has been identified in the first step, the second step is to identify the performance obligation – or a series of distinct performance obligations – provided to the customer. The Group must examine whether the service is capable of being distinct and is actually distinct within the context of the contract. A promised service is distinct if the customer can benefit from the service either on its own or together with other resources that are readily available to the customer, and the promise to transfer the service to the customer is separately identifiable from other promises in the contract. The amount of income is measured on the basis of the contractually agreed transaction price for the performance obligation defined in the contract. If a contract includes a variable consideration, the Group estimates the amount of consideration to which it will be entitled in exchange for transferring the promised goods or services to a customer. Income is recognized in profit and loss when the identified performance obligation has been satisfied. The Group does not present information about its remaining performance obligations if it is part of a contract that has an original expected duration of one year or less.
243 |
Deutsche Bank | ||
Annual Report 2022 | ||
The Group determines the stand-alone selling price at contract inception of a distinct service underlying each performance obligation in the contract and allocates the transaction price in proportion to those stand-alone selling prices. The stand-alone selling price is the price at which DB would sell a promised service separately to a customer on an unbundled basis. The best evidence of a stand-alone selling price is the observable price of a service when the Group sells that service separately in similar circumstances and to similar customers. If the Group does not sell the service to a customer separately, it estimates the stand-alone selling price at an amount using a suitable method, for example, in loan syndication transactions the Group applies the requirements for recognition of trade day profit and considers the price at which other market participants provide the same service on an unbundled basis. As such when estimating a stand-alone selling price, the Group considers all information (including market conditions) that is reasonably available to it. In doing so, the Group maximizes the use of observable inputs and applies estimation methods consistently in similar circumstances.
The Group provides asset management services that give rise to asset management and performance fees and constitute a single performance obligation. The asset management and performance fee components are variable considerations such that at each reporting date the Group estimates the fee amount to which it will be entitled in exchange for transferring the promised services to the customer. The benefits arising from the asset management services are simultaneously received and consumed by the customer over time. The Group recognizes revenue over time by measuring the progress towards complete satisfaction of that performance obligation, subject to the removal of any uncertainty as to whether it is highly probable that a significant reversal in the cumulative amount of revenue recognized would occur or not. For the management fee component this is the end of the monthly or quarterly service period. For performance fees this date is when any uncertainty related to the performance component has been fully removed.
Loan commitment fees related to commitments that are accounted for off balance sheet are recognized in commissions and fee income over the life of the commitment if it is unlikely that the Group will enter into a specific lending arrangement. If it is probable that the Group will enter into a specific lending arrangement, the loan commitment fee is deferred until the origination of a loan and recognized as an adjustment to the loan’s effective interest rate.
Commissions and Fee Income predominantly earned from services that are received and consumed by the customer over time: Administration, assets under management, foreign commercial business, loan processing and guarantees sundry other customer services. The Group recognizes revenue from these services over time by measuring the progress towards complete satisfaction of that performance obligation, subject to the removal of any uncertainty as to whether it is highly probable that a significant reversal in the cumulative amount of revenue recognized would occur or not.
Commissions and Fee Income predominantly earned from providing services at a point in time or transaction-type services include: other securities, underwriting and advisory fees, brokerage fees, local payments, foreign currency/ exchange business and intermediary fees.
Expenses that are directly related and incremental to the generation of Commissions and Fee Income are presented net in Commissions and Fee Income in the Consolidated Statement of Income. This includes income and associated expense where the Group contractually owns the performance obligation (i.e. as Principal) in relation to the service that gives rise to the revenue and associated expense. In contrast, it does not include situations where the Group does not contractually own the performance obligation and is acting as agent. The determination of whether the Group is acting as principal or agent is based on the contractual terms of the underlying service arrangement. The gross Commissions and Fee Income and Expense amounts are disclosed in “Note 6 – Commissions and Fee Income”.
Financial assets
The Group classifies financial assets in line with the classification and measurement requirements of IFRS 9, where financial assets are classified based on both the business model used for managing the financial assets and the contractual cash flow characteristics of the financial asset (known as Solely Payments of Principal and Interest or “SPPI”). There are three business models available:
- – Hold to Collect - Financial assets held with the objective to collect contractual cash flows. They are subsequently measured at amortized cost and are recorded in multiple lines on the Group’s consolidated balance sheet.
- – Hold to Collect and Sell - Financial assets held with the objective of both collecting contractual cash flows and selling financial assets. They are recorded as Financial assets at Fair Value through Other Comprehensive Income on the Group’s consolidated balance sheet.
- – Other - Financial assets that do not meet the criteria of either “Hold to Collect” or “Hold to Collect and Sell”. They are recorded as Financial Assets at Fair Value through Profit or Loss on the Group’s consolidated balance sheet.
244 |
Deutsche Bank | ||
Annual Report 2022 | ||
The assessment of business model requires judgment based on facts and circumstances upon initial recognition. As part of this assessment, the Group considers quantitative factors (e.g., the expected frequency and volume of sales) and qualitative factors such as how the performance of the business model and the financial assets held within that business model are evaluated and reported to the Group’s key management personnel. In addition to taking into consideration the risks that affect the performance of the business model and the financial assets held within that business model, in particular, the way in which those market and credit risks are managed; and how managers of the business are compensated (e.g., whether the compensation is based on the fair value of the assets managed or on the contractual cash flows collected). This assessment results in an asset being classified in either a Hold to Collect, Hold to Collect and Sell or Other business model.
If the Group holds a financial asset either in a Hold to Collect or a Hold to Collect and Sell business model, then an assessment at initial recognition to determine whether the contractual cash flows of the financial asset are Solely Payments of Principal and Interest on the principal amount outstanding is required to determine the financial asset classification. Contractual cash flows, that are SPPI on the principal amount outstanding, are consistent with a basic lending arrangement. Interest in a basic lending arrangement is consideration for the time value of money and the credit risk associated with the principal amount outstanding during a particular period of time. It can also include consideration for other basic lending risks (e.g., liquidity risk) and costs (e.g., administrative costs) associated with holding the financial asset for a particular period of time; and a profit margin that is consistent with a basic lending arrangement.
Financial assets at fair value through profit or loss
Financial assets are classified at fair value through profit or loss if they are held in the Other business model because they are either held for trading or because they do not meet the criteria for Hold to Collect or Hold to Collect and Sell. In addition, it includes financial assets that meet the criteria for Hold to Collect or Hold to Collect and Sell business model, but the financial asset fails SPPI or where the Group designated the financial assets under the fair value option.
Financial assets classified as Financial assets at fair value through profit or loss are measured at fair value with realized and unrealized gains and losses included in Net gains (losses) on financial assets/liabilities at fair value through profit or loss. Interest on interest earning assets such as trading loans and debt securities and dividends on equity instruments are presented in Interest and Similar Income.
Financial assets classified at fair value through profit or loss are recognized or derecognized on trade date. Trade date is the date on which the Group commits to purchase or sell the asset.
Trading assets – Financial assets are classified as held for trading if they have been originated, acquired or incurred principally for the purpose of selling or repurchasing them in the near term, or they form part of a portfolio of identified financial instruments that are managed together and for which there is evidence of a recent actual pattern of short-term profit-taking. Trading assets include debt and equity securities, derivatives held for trading purposes, and trading loans. This also includes loan commitments that are allocated to the Other business model and that are presented as derivatives held for trading.
Non-trading financial assets mandatory at fair value through profit and loss –The Group assigns any non-trading financial asset that does not fall into the Hold to Collect nor Hold to Collect and Sell business models into the Other business model and classifies them as Non-Trading Financial Assets mandatory at Fair Value through Profit and Loss. This includes predominately reverse repurchase agreements which are managed on a fair value basis. Additionally, any financial asset that falls into the Hold to Collect or Hold to Collect and Sell business models for which the contractual cash flow characteristics are not SPPI is classified by the Group as Non-Trading Financial Assets Mandatory at Fair Value through Profit and Loss.
Financial assets designated at fair value through profit or loss – Certain financial assets that would otherwise be measured subsequently at amortized cost or at fair value through other comprehensive income, may be designated at Fair Value through Profit or Loss if the designation eliminates or significantly reduces a measurement or recognition inconsistency. The Group allows the fair value option to be designated only for those financial instruments for which a reliable estimate of fair value can be obtained.
245 |
Deutsche Bank | ||
Annual Report 2022 | ||
Financial assets at fair value through other comprehensive income
A financial asset shall be classified and measured at Fair Value through Other Comprehensive Income (“FVOCI”), if the financial asset is held in a Hold to Collect and Sell business model and the contractual cash flows are SPPI, unless designated under the fair value option.
Under FVOCI, a financial asset is measured at its fair value with any changes being recognized in Other Comprehensive Income (”OCI”) and is assessed for impairment under the IFRS 9 expected credit loss model where provisions are recorded through profit or loss (based on expectations of potential credit losses). The Group’s impairment policy is described further in the section “Impairment of Loans and Provision for Off-Balance Sheet Positions (IFRS 9)”. The foreign currency translation effect for FVOCI assets is recognized in profit or loss, as is the interest component by using the effective interest method. The amortization of premiums and accretion of discounts are recorded in net interest income. Realized gains and losses are reported in net gains (losses) on financial assets at FVOCI. Generally, the weighted-average cost method is used to determine the cost of FVOCI financial assets.
Financial assets classified as FVOCI are recognized or derecognized on trade date. Trade date is the date on which the Group commits to purchase or sell the asset.
It is possible to designate non-trading equity instruments as FVOCI. However, this category is expected to have limited usage by the Group and has not been used to date.
Financial assets at amortized cost
A financial asset is classified and subsequently measured at amortized cost if the financial asset is held in a Hold to Collect business model and the contractual cash flows are SPPI.
Under this measurement category, the financial asset is measured at fair value at initial recognition. Subsequently the carrying amount is reduced for principal payments, plus or minus the cumulative amortization using the effective interest method. The financial asset is assessed for impairment under the IFRS 9 expected credit loss model where provisions are recognized based on expectations of potential credit losses. The Group’s impairment of financial instruments policy is described further in the section “Impairment of Loans and Provision for Off-Balance Sheet Positions (IFRS 9)”. Financial assets measured at amortized cost are recognized on a settlement date basis.
Financial Assets at amortized cost include predominately Loans at amortized cost, Central bank funds sold and securities purchased under resale agreements, Securities borrowed and certain receivables presented in Other Assets.
Modification of financial assets and financial liabilities
When the terms of a financial asset are renegotiated or modified and the modification does not result in derecognition, a gain or loss is recognized in the income statement as the difference between the original contractual cash flows and the modified cash flows discounted at the original effective interest rate. The modified financial asset will continue to accrued interest at its original EIR. When a modification results in derecognition the original instrument is derecognized and the new instrument recognized at fair value.
Non-credit related or commercial renegotiations where an obligor has not experienced a significant increase in credit risk since origination, and has a readily exercisable right to early terminate the financial asset results in derecognition of the original agreement and recognition of a new financial asset based on the newly negotiated commercial terms.
For credit related modifications (i.e. those modifications due to significant increase in credit risk since inception) or those where the obligor does not have the readily exercisable right to early terminate, the Group assesses whether the modified terms result in the financial asset being significantly modified and therefore derecognized. This assessment includes a quantitative assessment of the impact of the change in cash flows from the modification of contractual terms and additionally, where necessary, a qualitative assessment of the impact of the change in the contractual terms. Where these modifications are not concluded to be significant, the financial asset is not derecognized and is accounted for as a modification as described above.
If the changes are concluded to be significant, the old instrument is derecognized and a new instrument recognized. The Group then recognizes a credit loss allowance based on 12-month expected credit losses. However, if following a modification that results in a derecognition of the original financial asset, there is evidence that the new financial asset is credit-impaired on initial recognition; then the new financial asset should be recognized as an originated credit-impaired financial asset and initially classified in Stage 3 (refer to section “Impairment of Loans and Provision for Off-Balance Sheet Positions” below).
246 |
Deutsche Bank | ||
Annual Report 2022 | ||
When the terms of a financial liability are renegotiated or modified then the Group assesses whether the modified terms result in the financial liability being significantly modified and therefore derecognized. This assessment includes a quantitative assessment of the impact of the change in cash flows from the modification of contractual terms and additionally, where necessary, a qualitative assessment of the impact of the change in the contractual terms. Where these modifications are not concluded to be significant, the financial liability is not derecognized and a gain or loss is recognized in the income statement as the difference between the original contractual cash flows and the modified cash flows discounted at the original effective interest rate. Where there is derecognition the original financial liability is derecognized and the new liability recognized at its fair value.
Loan commitments
Loan commitments remain off-balance sheet, unless allocated to the Other business model and presented as derivatives held for trading. The Group does not recognize and measure changes in fair value of off-balance sheet loan commitments that result from changes in market interest rates or credit spreads. However, as specified in the sections “Impairment of Loans and Provision for Off-Balance Sheet Positions” below, these off-balance sheet loan commitments are in scope of the IFRS 9 impairment model.
Financial liabilities
Under IFRS 9 financial liabilities are measured at amortized cost using the effective interest method, except for financial liabilities at fair value through profit or loss.
Financial liabilities at fair value through profit or loss
Financial liabilities at fair value through profit or loss include Trading Liabilities, Financial Liabilities Designated at Fair Value through Profit or Loss and Non-Participating Investment Contracts (“Investment Contracts”). Under IFRS 9 they are carried at fair value with realized and unrealized gains and losses included in net gains (losses) on financial assets and liabilities at fair value through profit or loss. For financial liabilities designated at fair value through profit and loss the fair value movements attributable to the Group’s own credit component for fair value movements is recognized in Other Comprehensive Income.
Financial liabilities classified at fair value through profit or loss are recognized or derecognized on trade date. Trade date is the date on which the Group commits to issue or repurchase the financial liability.
Interest on interest paying liabilities are presented in interest expense for financial instruments at fair value through profit or loss.
Trading liabilities - Financial liabilities that arise from debt issued are classified as held for trading if they have been originated or incurred principally for the purpose of repurchasing them in the near term. Trading liabilities consist primarily of derivative liabilities (including certain loan commitments) and short positions. This also includes loan commitments where the resulting loan upon funding is allocated to the other business model such that the undrawn loan commitment is classified as derivatives held for trading.
Financial liabilities designated at fair value through profit or loss - Certain financial liabilities that do not meet the definition of trading liabilities are designated at fair value through profit or loss using the fair value option. To be designated at fair value through profit or loss, financial liabilities must meet one of the following criteria: (1) the designation eliminates or significantly reduces a measurement or recognition inconsistency; (2) a group of financial liabilities is managed and its performance is evaluated on a fair value basis in accordance with a documented risk management or investment strategy; or (3) the instrument contains one or more embedded derivatives unless: (a) the embedded derivative does not significantly modify the cash flows that otherwise would be required by the contract; or (b) it is clear with little or no analysis that separation is prohibited. In addition, the Group allows the fair value option to be designated only for those financial instruments for which a reliable estimate of fair value can be obtained. Financial liabilities which are designated at fair value through profit or loss, under the fair value option, include repurchase agreements, loan commitments and structured note liabilities.
Investment contracts - All of the Group’s investment contracts are unit-linked contracts that match specific assets held by the Group. The contracts oblige the Group to use these assets to settle investment contract liabilities. They do not contain significant insurance risk or discretionary participation features. The contract liabilities are determined using current unit prices multiplied by the number of units attributed to the contract holders as of the balance sheet date. As this amount represents fair value, the liabilities have been classified as financial liabilities at fair value through profit or loss. Deposits collected under investment contracts are accounted for as an adjustment to the investment contract liabilities. Investment income attributable to investment contracts is included in the consolidated statement of Income. Investment contract claims reflect the excess of amounts paid over the account balance released. Investment contract policyholders are charged fees for policy administration, investment management, surrenders or other contract services.
247 |
Deutsche Bank | ||
Annual Report 2022 | ||
Embedded derivatives
Some hybrid financial liability contracts contain both a derivative and a non-derivative component. In such cases, the derivative component is termed an embedded derivative, with the non-derivative component representing the host financial liability contract. If the economic characteristics and risks of embedded derivatives are not closely related to those of the host financial liability contract and the hybrid financial liability contract itself is not carried at fair value through profit or loss, the embedded derivative is bifurcated and reported at fair value, with gains and losses recognized in net gains (losses) on financial assets/liabilities at fair value through profit or loss. The host financial liability contract will continue to be accounted for in accordance with the appropriate accounting standard. The carrying amount of an embedded derivative is reported in the same Consolidated balance sheet line item as the host financial liability contract. Certain hybrid financial liability instruments have been designated at fair value through profit or loss using the fair value option.
Financial liabilities at amortized cost
Financial liabilities measured at amortized cost include long-term and short-term debt issued which are initially measured at fair value, which is the consideration received, net of transaction costs incurred. Repurchases of issued debt in the market are treated as extinguishments and any related gain or loss is recorded in the Consolidated Statement of Income. A subsequent sale of own bonds in the market is treated as a reissuance of debt. Financial liabilities measured at amortized cost are recognized on a settlement date basis.
Offsetting of financial instruments
Financial assets and liabilities are offset, with the net amount presented in the Consolidated balance sheet, only if the Group holds a currently enforceable legal right to set off the recognized amounts and there is an intention to settle on a net basis or to realize an asset and settle the liability simultaneously. The legal right to set off the recognized amounts must be enforceable in both the normal course of business and in the event of default, insolvency or bankruptcy of both the Group and its counterparty. In all other situations they are presented gross. When financial assets and financial liabilities are offset in the Consolidated balance sheet, the associated income and expense items will also be offset in the Consolidated Statement of Income, unless specifically prohibited by an applicable accounting standard.
The majority of the offsetting applied by the Group relates to derivatives and repurchase and reverse repurchase agreements. A significant portion of offsetting is applied to interest rate derivatives and related cash margin balances, which are cleared through central clearing parties. For further information please refer to Note 17 “Offsetting Financial Assets and Financial Liabilities”.
Determination of fair value
Fair value is defined as the price that would be received to sell an asset or paid to transfer a liability in an arm’s length transaction between market participants at the measurement date. The fair value of instruments that are quoted in active markets is determined using the quoted prices where they represent those at which regularly and recently occurring transactions take place.
The Group measures certain portfolios of financial assets and financial liabilities on the basis of their net risk exposures when the following criteria are met:
- – The group of financial assets and liabilities is managed on the basis of its net exposure to a particular market risk (or risks) or to the credit risk of a particular counterparty, in accordance with a documented risk management strategy,
- – The fair values are provided to key management personnel, and
- – The financial assets and liabilities are measured at fair value through profit or loss.
This portfolio valuation approach is consistent with how the Group manages its net exposures to market and counterparty credit risks.
Critical accounting estimates – The Group uses valuation techniques to establish the fair value of instruments where prices quoted in active markets are not available. Therefore, where possible, parameter inputs to the valuation techniques are based on observable data derived from prices of relevant instruments traded in an active market. These valuation techniques involve some level of management estimation and judgment, the degree of which will depend on the price transparency for the instrument or market and the instrument’s complexity.
248 |
Deutsche Bank | ||
Annual Report 2022 | ||
In reaching estimates of fair value management judgment needs to be exercised. The areas requiring significant management judgment are identified, documented and reported to senior management as part of the valuation control process and the standard monthly reporting cycle. The specialist model validation and valuation control groups focus attention on the areas of subjectivity and judgment.
The level of management judgment required in establishing fair value of financial instruments for which there is a quoted price in an active market is usually minimal. Similarly there is little subjectivity or judgment required for instruments valued using valuation models which are standard across the industry and where all parameter inputs are quoted in active markets.
The level of subjectivity and degree of management judgment required is more significant for those instruments valued using specialized and sophisticated models and where some or all of the parameter inputs are less liquid or less observable. Management judgment is required in the selection and application of appropriate parameters, assumptions and modelling techniques. In particular, where data are obtained from infrequent market transactions then extrapolation and interpolation techniques must be applied. Where no market data are available for a particular instrument then pricing inputs are determined by assessing other relevant sources of information such as historical data, fundamental analysis of the economics of the transaction and proxy information from similar transactions, and making appropriate adjustment to reflect the actual instrument being valued and current market conditions. Where different valuation techniques indicate a range of possible fair values for an instrument then management has to decide what point within the range of estimates appropriately represents the fair value. Further, some valuation adjustments may require the exercise of management judgment to achieve fair value.
Financial assets and liabilities carried at fair value are required to be disclosed according to the inputs to the valuation method that are used to determine their fair value. Specifically, segmentation is required between those valued using quoted market prices in an active market (level 1), valuation techniques based on observable parameters (level 2) and valuation techniques using significant unobservable parameters (level 3). Management judgment is required in determining the category to which certain instruments should be allocated. This specifically arises when the valuation is determined by a number of parameters, some of which are observable and others are not. Further, the classification of an instrument can change over time to reflect changes in market liquidity and therefore price transparency.
The Group provides a sensitivity analysis of the impact upon the level 3 financial instruments of using a reasonably possible alternative for the unobservable parameter. The determination of reasonably possible alternatives requires significant management judgment.
For financial instruments measured at amortized cost (which include loans, deposits and short and long term debt issued) the Group discloses the fair value. Generally there is limited or no trading activity in these instruments and therefore the fair value determination requires significant management judgment.
For further discussion of the valuation methods and controls and quantitative disclosures with respect to the determination of fair value, please refer to Note 13 “Financial Instruments carried at Fair Value” and Note 14 “Fair Value of Financial Instruments not carried at Fair Value”.
Recognition of trade date profit
Trade date profit is recognized if the fair value of the financial instrument measured at fair value through profit or loss is obtained from a quoted market price in an active market, or otherwise evidenced by comparison to other observable current market transactions or based on a valuation technique incorporating observable market data. If there are significant unobservable inputs used in the valuation technique, the financial instrument is recognized at the transaction price and any profit implied from the valuation technique at trade date is deferred.
Using systematic methods, the deferred amount is recognized over the period between trade date and the date when the market is expected to become observable, or over the life of the trade (whichever is shorter). Such methodology is used because it reflects the changing economic and risk profile of the instrument as the market develops or as the instrument itself progresses to maturity. Any remaining trade date deferred profit is recognized in the Consolidated Statement of Income when the transaction becomes observable. In the rare circumstances that a trade date loss arises, it would be recognized at inception of the transaction to the extent that it is probable that a loss has been incurred and a reliable estimate of the loss amount can be made.
Critical Accounting Estimates – Management judgment is required in determining whether there exist significant unobservable inputs in the valuation technique of the underlying financial instrument (refer to section “Determination of Fair Value” for management judgment required in establishing fair value of financial instruments). Once deferred, the decision to subsequently recognize the trade date profit requires a careful assessment of the then current facts and circumstances supporting observability of parameters and/or risk mitigation.
249 |
Deutsche Bank | ||
Annual Report 2022 | ||
Derivatives and hedge accounting
Derivatives are used to manage exposures to interest rate, foreign currency, credit and other market price risks, including exposures arising from forecast transactions. All freestanding contracts that are considered derivatives for accounting purposes are carried at fair value on the Consolidated balance sheet regardless of whether they are held for trading or non-trading purposes.
The changes in fair value on derivatives held for trading are included in net gains (losses) on financial assets/liabilities at fair value through profit or loss.
Hedge accounting
IFRS 9 includes an accounting policy choice to defer the adoption of IFRS 9 hedge accounting and to continue with IAS 39 hedge accounting. The Group decided to exercise this accounting policy choice and did not adopt IFRS 9 hedge accounting as of January 1, 2018. The Group applies fair value hedge accounting for portfolio hedges of interest rate risk (fair value macro hedges) in accordance with the EU carve-out version of IAS 39. Under the EU IAS 39 carve-out, fair value macro hedge accounting may be applied to core deposits and hedge ineffectiveness for all fair value macro hedge accounting applications is only recognized when the revised estimate of the amount of cash flows in scheduled time buckets falls below the original designated amount of that bucket and is not recognized when the revised amount of cash flows in scheduled time buckets is more than the original designated amount.
For accounting purposes there are three possible types of hedges: (1) hedges of changes in the fair value of assets, liabilities or unrecognized firm commitments (fair value hedges); (2) hedges of the variability of future cash flows from highly probable forecast transactions and floating rate assets and liabilities (cash flow hedges); and (3) hedges of the translation adjustments resulting from translating the functional currency financial statements of foreign operations into the presentation currency of the parent (hedges of net investments in foreign operations).
When hedge accounting is applied, the Group designates and documents the relationship between the hedging instrument and the hedged item as well as its risk management objective and strategy for undertaking the hedging transactions and the nature of the risk being hedged. This documentation includes a description of how the Group will assess the hedging instrument’s effectiveness in offsetting the exposure to changes in the hedged item’s fair value or cash flows attributable to the hedged risk. Hedge effectiveness is assessed at inception and throughout the term of each hedging relationship. Hedge effectiveness is always assessed, even when the terms of the derivative and hedged item are matched.
For hedges of changes in fair value, the changes in the fair value of the hedged asset, liability or unrecognized firm commitment, or a portion thereof, attributable to the risk being hedged, are recognized in the Consolidated Statement of Income along with changes in the entire fair value of the derivative. When hedging interest rate risk, any interest accrued or paid on both the derivative and the hedged item is reported in interest income or expense and the unrealized gains and losses from the hedge accounting fair value adjustments are reported in other revenue. Hedge ineffectiveness is reported in other revenue and is measured as the net effect of changes in the fair value of the hedging instrument and changes in the fair value of the hedged item arising from changes in the market rate or price related to the risk(s) being hedged.
If a fair value hedge of a debt instrument is discontinued prior to the instrument’s maturity because the derivative is terminated or the relationship is de-designated, any remaining interest rate-related fair value adjustments made to the carrying amount of the debt instrument (basis adjustments) are amortized to interest income or expense over the remaining term of the original hedging relationship. For other types of fair value adjustments and whenever a fair value hedged asset or liability is sold or otherwise derecognized, any basis adjustments are included in the calculation of the gain or loss on derecognition.
For hedges of variability in future cash flows, there is no change to the accounting for the hedged item and the derivative is carried at fair value, with changes in value reported initially in other comprehensive income to the extent the hedge is effective. These amounts initially recorded in other comprehensive income are subsequently reclassified into the Consolidated Statement of Income in the same periods during which the forecast transaction affects the Consolidated Statement of Income. Thus, for hedges of interest rate risk, the amounts are amortized into interest income or expense at the same time as the interest is accrued on the hedged transaction.
Hedge ineffectiveness is recorded in other income and is measured as changes in the excess (if any) in the absolute cumulative change in fair value of the actual hedging derivative over the absolute cumulative change in the fair value of the hypothetically perfect hedge.
250 |
Deutsche Bank | ||
Annual Report 2022 | ||
When hedges of variability in cash flows attributable to interest rate risk are discontinued, amounts remaining in accumulated other comprehensive income are amortized to interest income or expense over the remaining life of the original hedge relationship, unless the hedged transaction is no longer expected to occur in which case the amount will be reclassified into other income immediately. When hedges of variability in cash flows attributable to other risks are discontinued, the related amounts in accumulated other comprehensive income are reclassified into either the same Consolidated Statement of Income caption and period as profit or loss from the forecast transaction, or into other income when the forecast transaction is no longer expected to occur.
For hedges of the translation adjustments resulting from translating the functional currency financial statements of foreign operations (hedges of net investments in foreign operations) into the functional currency of the parent, the portion of the change in fair value of the derivative due to changes in the spot foreign exchange rates is recorded as a foreign currency translation adjustment in other comprehensive income to the extent the hedge is effective; the remainder is recorded as other income in the Consolidated Statement of Income.
Changes in fair value of the hedging instrument relating to the effective portion of the hedge are subsequently recognized in profit or loss on disposal of the foreign operations.
Hedging derivatives are reported as other assets and other liabilities. In the event that a derivative is subsequently de-designated from a hedging relationship, it is transferred to financial assets/liabilities at fair value through profit or loss.
Impairment of loans and provision for off-balance sheet positions
The impairment requirements of IFRS 9 apply to all credit exposures that are measured at amortized cost or FVOCI, and to off balance sheet lending commitments such as loan commitments and financial guarantees. For purposes of the impairment policy below, these instruments are referred to as (“Financial Assets”)
The determination of impairment losses under IFRS 9 uses an expected credit loss (“ECL”) model, where allowances are taken upon initial recognition of the Financial Asset, based on expectations of potential credit losses at the time of initial recognition.
Staged approach to the determination of expected credit losses
IFRS 9 states a three stage approach to impairment for Financial Assets that are not credit-impaired at the date of origination or purchase. This approach is summarized as follows:
- – Stage 1: The Group recognizes a credit loss allowance at an amount equal to 12-month expected credit losses for all Financial Assets. This represents the portion of lifetime expected credit losses from default events that are expected within 12 months of the reporting date, assuming that credit risk has not increased significantly after initial recognition.
- – Stage 2: The Group recognizes a credit loss allowance at an amount equal to lifetime expected credit losses for those Financial Assets which are considered to have experienced a significant increase in credit risk since initial recognition. This requires the determination of the ECL based on lifetime probability of default, lifetime loss given default and lifetime exposure at default that represents the probability of default occurring over the remaining lifetime of the Financial Asset. Allowance for credit losses are higher in this stage because of an increase in credit risk since origination or purchase and the impact of a longer time horizon being considered compared to 12 months in Stage 1.
- – Stage 3: The Group recognizes a loss allowance at an amount equal to lifetime expected credit losses, reflecting a Probability of Default of 100%, via the expected recoverable cash flows for the asset, for those Financial Assets that are credit-impaired. The Group’s definition of default is aligned with the regulatory definition of default. Financial Assets that are credit-impaired upon initial recognition are categorized within Stage 3 with a carrying value already reflecting the lifetime expected credit losses. The accounting treatment for these purchased or originated credit-impaired (“POCI”) assets is discussed further below.
251 |
Deutsche Bank | ||
Annual Report 2022 | ||
Significant increase in credit risk
When determining whether the credit risk (i.e., risk of default) of a Financial Asset has increased significantly since initial recognition, the Group considers reasonable and supportable information that is relevant and available without undue cost or effort. This includes quantitative and qualitative information based on the Group’s historical experience, credit risk assessment and forward-looking information (including macro-economic factors). The assessment of significant credit deterioration is key in determining when to move from measuring an allowance based on 12-month ECLs to one that is based on lifetime ECLs (i.e., transfer from Stage 1 to Stage 2).
The Group’s framework for determining if there has been a significant increase in credit risk aligns with the internal Credit Risk Management (“CRM”) process and utilizes:
- – Rating related indicators – based on a model that compares lifetime PDs at the reporting date with the lifetime PD expectations at the date of initial recognition and subsequently applies a quantile approach to determine a threshold to define the trigger point for a financial asset’s transition into Stage 2; and
- – Process related indicators – which uses existing risk management indicators, that in Management’s view represent situations where the credit risk of financial assets has significantly increased. These include obligors being added to a credit watchlist, being mandatorily transferred to workout status, payments being 30 days or more past due or in forbearance.
These indicators are discussed further in section “IFRS 9 Impairment Approach” in the Risk Report.
Credit-impaired financial assets in Stage 3
The Group has aligned its definition of credit-impaired under IFRS 9 to when a Financial Asset has defaulted for regulatory purposes, according to the Capital Requirements Regulation under Art. 178.
The determination of whether a Financial Asset is credit-impaired and therefore in Stage 3 focusses exclusively on default risk, without taking into consideration the effects of credit risk mitigants such as collateral or guarantees. Specifically, a Financial Asset is credit-impaired and in Stage 3 when:
- – The Group considers the obligor is unlikely to pay its credit obligations to the Group. Determination may include forbearance actions, where a concession has been granted to the borrower or economic or legal reasons that are qualitative indicators of credit impairment; or
- – Contractual payments of either principal or interest by the obligor are past due by more than 90 days.
For Financial Assets considered to be credit-impaired, the ECL allowance covers the amount of loss the Group is expected to suffer. The estimation of ECLs is undertaken on a case-by-case basis for non-homogeneous portfolios, or by applying portfolio based parameters to individual Financial Assets in these portfolios via the Group’s ECL model for homogeneous portfolios. This estimate includes the use of discounted cash flows that are adjusted for scenarios.
Forecasts of future economic conditions when calculating ECLs are considered. The lifetime expected losses are estimated based on the probability-weighted present value of the difference between the contractual cash flows that are due to the Group under the contract; and the cash flows that the Group expects to receive.
A Financial Asset can be classified as credit-impaired in Stage 3 but without an allowance for credit losses (i.e., no impairment loss is expected). This may be due to the value of collateral. The Group’s engine based ECL calculation is conducted on a monthly basis, whereas the case-by-case assessment of ECL in Stage 3 for non-homogeneous portfolio has to be performed at least on a quarterly basis.
Purchased or originated credit-impaired financial assets in Stage 3
A Financial Asset is considered purchased or originated credit-impaired if there is objective evidence of impairment at the time of initial recognition. Such credit-impaired Financial Assets are termed POCI Financial Assets. POCI Financial Assets are measured to reflect lifetime expected credit losses, and all subsequent changes in lifetime expected credit losses, whether positive or negative, are recognized in the income statement as a component of the provision for credit losses. POCI Financial Assets can only be classified in Stage 3 over the life of the Financial Asset.
252 |
Deutsche Bank | ||
Annual Report 2022 | ||
Write-offs
The Group reduces the gross carrying amount of a Financial Asset when there is no reasonable expectation of recovery. Write-offs can relate to a Financial Asset in its entirety, or to a portion of it, and constitute a derecognition event. The Group considers all relevant information in making this determination, including but not limited to:
- – Foreclosure actions taken by the Group which have not been successful or have a high probability of not being successful
- – Collateral liquidation which has not, or will not lead to further considerable recoveries
- – Situations where no further recoveries are reasonably expected
Write-offs can take place before legal actions against the borrower to recover the debt have been concluded, and a write-off does not involve the Group forfeiting its legal right to recover the debt.
Interest Rate used in the IFRS 9 model
In the context of the ECL calculation, the Group applies in line with IFRS 9 an approximation of the EIR, which is usually the contractual interest rate (“CIR”) and which does not materially differ from the EIR. The CIR is deemed to be an appropriate approximation, as the interest rate is consistently used in the ECL model, interest recognition and for discounting of the ECL.
Collateral for financial assets considered in the impairment analysis
IFRS 9 requires cash flows expected from collateral and other credit enhancement to be reflected in the ECL calculation. The following are key aspects with respect to collateral and guarantees:
- – Eligibility of collateral, i.e. which collateral should be considered in the ECL calculation;
- – Collateral evaluation, i.e. what collateral (liquidation) value should be used; and
- – Projection of the available collateral amount over the life of a transaction.
These concepts are outlined in more detail in section “IFRS 9 Impairment Approach” in the Risk Report.
Critical accounting estimates – The accounting estimates and judgments related to the impairment of Financial Assets is a critical accounting estimate because the underlying assumptions used can change from period to period and may significantly affect the Group’s results of operations.
In assessing assets for impairments, management judgment is required, particularly in projecting forward looking information and scenarios in particular in circumstances of economic and financial uncertainty, when developments and changes to expected cash flows can occur both with greater rapidity and less predictability. The actual amount of the future cash flows and their timing may differ from the estimates used by management and consequently may cause actual losses to differ from reported allowances.
For those non-homogeneous loans in Stage 3 the determination of the impairment allowance often requires the use of considerable judgment concerning such matters as local economic conditions, the financial performance of the counterparty and the value of any collateral held, for which there may not be a readily accessible market.
The determination of the expected credit losses in Stages 1 and 2 and for homogeneous loans in Stage 3 is calculated using the Group’s ECL model. The model incorporates numerous estimates and judgments. The Group performs a regular review of the model and underlying data and assumptions. The probability of defaults, loss recovery rates and judgments concerning ability of borrowers in foreign countries to transfer the foreign currency necessary to comply with debt repayments, amongst other things, are incorporated into this review. Management judgement over the following critical accounting estimates has increased since early 2020 as a result of the COVID-19 pandemic and the war in Ukraine:
- – Forward-Looking Information: Forward-Looking Information is incorporated into the measurement of the Group Allowance for Credit Losses in terms of adjustments to multi-year PD curves based on macro-economic forecasts. The identification of key macro-economic variables (MEVs) reflects a balance of quantitative and qualitative judgements. Statistical analysis, including for example, back-testing and model sensitivities, are performed to assess the explanatory power of MEVs, while expert input from credit officers ensures management comfort in the overall model behavior. The final model parameterization is based on a review and challenge of impacts in internal governance forums and an independent validation performed by the Model Risk Management function. Furthermore, conceptual soundness of the estimation approach is ensured by model testing analysis prepared as part of model changes and an ongoing monitoring framework in order for the ECL provision to reflect management’s best estimate in the calculation of expected credit losses.
253 |
Deutsche Bank | ||
Annual Report 2022 | ||
- – Significant Increase in Credit Risk: In line with the section “IFRS 9 Impairment Approach” in the Risk Report, the Group uses rating-related indicators to determine whether a financial asset’s credit risk has significantly increased since inception. For financial assets in non-homogeneous portfolios the ratings are determined for every counterparty individually based on credit officer’s expert judgement. For financial assets in the homogeneous portfolios (due to the large number of client relationships) the rating process is significantly automated with less judgement required by credit officers on individual counterparties. For both homogeneous and non-homogenous portfolios the rating-related indicators to determine whether the credit risk for a financial asset has significantly increased are based on a model that compares lifetime PDs at the reporting date with the lifetime PD expectations at the date of initial recognition and subsequently applying a quantile approach to determine a threshold which defines the trigger point for a financial asset’s transition into Stage 2. The determination of the quantile to define Stage 2 thresholds are determined by subject matter experts in the Group’s Risk function. This represents one of the key critical judgments in the Group’s IFRS 9 framework and is validated on an annual basis based on detailed stage-mover analyses, benchmarking with historical behaviors and peer comparisons.
- – Stage 3 LGD Setting for Homogeneous Portfolios: The allowance for credit losses in Stage 3 is determined for the Group’s homogeneous portfolios by an automated process based on partially time dependent LGDs reflecting the lower recovery expectation the longer the client is in default, thereby differentiating between secured and unsecured exposures. The LGDs are calibrated using the Group’s loss history built up over preceding decades, experienced market prices of non-performing portfolios sold and expert judgement. In the case of less material portfolios, the empirical calibration of the LGD is partially supported by expert credit officer judgements, especially for determining the client cure rates as one of the key inputs. The LGD settings are validated on an annual basis and are regularly reviewed by the Group’s independent model validation process which is part of the Model Risk Management function.
The quantitative disclosures are provided in Note 18 “Loans” and Note 19 “Allowance for credit losses” as well as the Risk Report, section “IFRS 9 Impairment”, sub-section “Model Sensitivity”.
Derecognition of financial assets and liabilities
Financial asset derecognition
A financial asset is considered for derecognition when the contractual rights to the cash flows from the financial asset expire, or the Group has either transferred the contractual right to receive the cash flows from that asset, or has assumed an obligation to pay those cash flows to one or more recipients, subject to certain criteria.
The Group derecognizes a transferred financial asset if it transfers substantially all the risks and rewards of ownership.
The Group enters into transactions in which it transfers previously recognized financial assets but retains substantially all the associated risks and rewards of those assets; for example, a sale to a third party in which the Group enters into a concurrent total return swap with the same counterparty. These types of transactions are accounted for as secured financing transactions.
In transactions in which substantially all the risks and rewards of ownership of a financial asset are neither retained nor transferred, the Group derecognizes the transferred asset if control over that asset is not retained, i.e., if the transferee has the practical ability to sell the transferred asset. The rights and obligations retained in the transfer are recognized separately as assets and liabilities, as appropriate. If control over the asset is retained, the Group continues to recognize the asset to the extent of its continuing involvement, which is determined by the extent to which it remains exposed to changes in the value of the transferred asset.
The derecognition criteria are also applied to the transfer of part of an asset, rather than the asset as a whole, or to a group of similar financial assets in their entirety, when applicable. If transferring a part of an asset, such part must be a specifically identified cash flow, a fully proportionate share of the asset, or a fully proportionate share of a specifically-identified cash flow.
If an existing financial asset is replaced by another asset from the same counterparty on substantially different terms, or if the terms of the financial asset are substantially modified (due to forbearance measures or otherwise), the existing financial asset is derecognized and a new asset is recognized. Any difference between the respective carrying amounts is recognized in the Consolidated Statement of Income.
254 |
Deutsche Bank | ||
Annual Report 2022 | ||
Securitization
The Group securitizes various consumer and commercial financial assets, which is achieved via the transfer of these assets to a structured entity, which issues securities to investors to finance the acquisition of the assets. Financial assets awaiting securitization are classified and measured as appropriate under the policies in the “Financial Assets and Liabilities” section. If the structured entity is not consolidated then the transferred assets may qualify for derecognition in full or in part, under the policy on derecognition of financial assets. Synthetic securitization structures typically involve derivative financial instruments for which the policies in the “Derivatives and Hedge Accounting” section would apply. Those transfers that do not qualify for derecognition may be reported as secured financing or result in the recognition of continuing involvement liabilities. The investors and the securitization vehicles generally have no recourse to the Group’s other assets in cases where the issuers of the financial assets fail to perform under the original terms of those assets.
Interests in the securitized financial assets may be retained in the form of senior or subordinated tranches, interest only strips or other residual interests (collectively referred to as “retained interests”). Provided the Group’s retained interests do not result in consolidation of a structured entity, nor in continued recognition of the transferred assets, these interests are typically recorded in financial assets at fair value through profit or loss and carried at fair value. Consistent with the valuation of similar financial instruments, the fair value of retained tranches or the financial assets is initially and subsequently determined using market price quotations where available or internal pricing models that utilize variables such as yield curves, prepayment speeds, default rates, loss severity, interest rate volatilities and spreads. The assumptions used for pricing are based on observable transactions in similar securities and are verified by external pricing sources, where available. Where observable transactions in similar securities and other external pricing sources are not available, management judgment must be used to determine fair value. The Group may also periodically hold interests in securitized financial assets and record them at amortized cost.
In situations where the Group has a present obligation (either legal or constructive) to provide financial support to an unconsolidated securitization entity a provision will be created if the obligation can be reliably measured and it is probable that there will be an outflow of economic resources required to settle it.
When an asset is derecognized a gain or loss equal to the difference between the consideration received and the carrying amount of the transferred asset is recorded. When a part of an asset is derecognized, gains or losses on securitization depend in part on the carrying amount of the transferred financial assets, allocated between the financial assets derecognized and the retained interests based on their relative fair values at the date of the transfer.
Derecognition of financial liabilities
A financial liability is derecognized when the obligation under the liability is discharged or cancelled or expires. If an existing financial liability is replaced by another from the same lender on substantially different terms, or the terms of the existing liability are substantially modified, such an exchange or modification is treated as a derecognition of the original liability and the recognition of a new liability, and the difference in the respective carrying amounts is recognized in the Consolidated Statement of Income.
Repurchase and reverse repurchase agreements
Securities purchased under resale agreements (“reverse repurchase agreements”) and securities sold under agreements to repurchase (“repurchase agreements”) are treated as collateralized financings and are recognized initially at fair value, being the amount of cash disbursed and received, respectively. The party disbursing the cash takes possession of the securities serving as collateral for the financing and having a market value equal to, or in excess of, the principal amount loaned. The securities received under reverse repurchase agreements and securities delivered under repurchase agreements are not recognized on, or derecognized from, the balance sheet, because the risks and rewards of ownership are not obtained nor relinquished. Securities delivered under repurchase agreements which are not derecognized from the balance sheet and where the counterparty has the right by contract or custom to sell or repledge the collateral are disclosed in Note 20 “Transfer of Financial Assets, Assets Pledged and Received as Collateral”.
The Group allocates reverse repurchase portfolios that are managed on a fair value basis to the other business model under IFRS 9 and classifies them as “Non-trading financial assets mandatory at fair value through profit or loss”.
Interest earned on reverse repurchase agreements and interest incurred on repurchase agreements is reported as interest income and interest expense, respectively.
255 |
Deutsche Bank | ||
Annual Report 2022 | ||
Securities borrowed and securities loaned
Securities borrowed transactions generally require the Group to deposit cash with the securities lender. In a securities loaned transaction, the Group generally receives either cash collateral, in an amount equal to or in excess of the market value of securities loaned, or securities. The Group monitors the fair value of securities borrowed and securities loaned and additional collateral is disbursed or obtained, if necessary.
The securities borrowed are not themselves recognized in the financial statements. If they are sold to third parties, the obligation to return the securities is recorded as a financial liability at fair value through profit or loss and any subsequent gain or loss is included in the Consolidated Statement of Income in net gains (losses) on financial assets/liabilities at fair value through profit or loss. Securities lent to counterparties are also retained on the Consolidated balance sheet.
The Group records the amount of cash advanced or received as securities borrowed and securities loaned, respectively, in the Consolidated balance sheet.
Fees received or paid are reported in interest income and interest expense, respectively. Securities lent to counterparties which are not derecognized from the Consolidated balance sheet and where the counterparty has the right by contract or custom to sell or repledge the collateral are disclosed in Note 20 “Transfer of Financial Assets, Assets Pledged and Received as Collateral”.
Goodwill and other intangible assets
Goodwill arises on the acquisition of subsidiaries and associates and represents the excess of the aggregate of the cost of an acquisition and any noncontrolling interests in the acquiree over the fair value of the identifiable net assets acquired at the date of the acquisition.
For the purpose of calculating goodwill, fair values of acquired assets, liabilities and contingent liabilities are determined by reference to market values or by discounting expected future cash flows to present value. This discounting is either performed using market rates or by using risk-free rates and risk-adjusted expected future cash flows. Any noncontrolling interests in the acquiree are measured either at fair value or at the noncontrolling interests’ proportionate share of the acquiree’s identifiable net assets (this is determined for each business combination).
Goodwill on the acquisition of subsidiaries is capitalized and reviewed for impairment annually or more frequently if there are indications that impairment may have occurred. For the purposes of impairment testing, goodwill acquired in a business combination is allocated to cash-generating units (“CGUs”), which are the smallest identifiable groups of assets that generate cash inflows largely independent of the cash inflows from other assets or groups of assets and that are expected to benefit from the synergies of the combination and considering the business level at which goodwill is monitored for internal management purposes. In identifying whether cash inflows from an asset (or a group of assets) are largely independent of the cash inflows from other assets (or groups of assets) various factors are considered, including how management monitors the entity’s operations or makes decisions about continuing or disposing of the entity’s assets and operations.
If goodwill has been allocated to a CGU and an operation within that unit is disposed of, the attributable goodwill is included in the carrying amount of the operation when determining the gain or loss on its disposal.
Corporate assets are allocated to a CGU when the allocation can be done on a reasonable and consistent basis. If this is not possible, the individual CGU is tested without the corporate assets. They are then tested on the level of the minimum collection of CGUs to which they can be allocated on a reasonable and consistent basis.
Intangible assets are recognized separately from goodwill when they are separable or arise from contractual or other legal rights and their fair value can be measured reliably. Intangible assets that have a finite useful life are stated at cost less any accumulated amortization and accumulated impairment losses. Customer-related intangible assets that have a finite useful life are amortized over periods of between 1 and 20 years on a straight-line basis based on their expected useful life. These assets are tested for impairment and their useful lives reaffirmed at least annually.
Certain intangible assets have an indefinite useful life and hence are not amortized, but are tested for impairment at least annually or more frequently if events or changes in circumstances indicate that impairment may have occurred.
256 |
Deutsche Bank | ||
Annual Report 2022 | ||
Costs related to software developed or obtained for internal use are capitalized if it is probable that future economic benefits will flow to the Group and the cost can be measured reliably. Capitalized costs are amortized using the straight-line method over the asset’s useful life which is deemed to be either three, five or ten years. Eligible costs include external direct costs for materials and services, as well as payroll and payroll-related costs for employees directly associated with an internal-use software project. Overhead costs, as well as costs incurred during the research phase or after software is ready for use, are expensed as incurred. Capitalized software costs are tested for impairment either annually if still under development or any time when there is an indication of impairment once the software is in use.
Critical accounting estimates – The determination of the recoverable amount in the impairment assessment of non-financial assets requires estimates based on quoted market prices, prices of comparable businesses, present value or other valuation techniques (such as the cost approach), or a combination thereof, necessitating management to make subjective judgments and assumptions. Because these estimates and assumptions could result in significant differences to the amounts reported if underlying circumstances were to change, the Group considers these estimates to be critical.
The quantitative disclosures are provided in Note 23 “Goodwill and other intangible assets”.
Provisions
Provisions are recognized if the Group has a present legal or constructive obligation as a result of past events, if it is probable that an outflow of resources will be required to settle the obligation, and a reliable estimate can be made of the amount of the obligation.
The amount recognized as a provision is the best estimate of the consideration required to settle the present obligation as of the balance sheet date, taking into account the risks and uncertainties surrounding the obligation.
If the effect of the time value of money is material, provisions are discounted and measured at the present value of the expenditure expected to be required to settle the obligation, using a pre-tax rate that reflects the current market assessments of the time value of money and the risks specific to the obligation. The increase in the provision due to the passage of time is recognized as interest expense.
When some or all of the economic benefits required to settle a provision are expected to be recovered from a third party (for example, because the obligation is covered by an insurance policy), an asset is recognized if it is virtually certain that reimbursement will be received.
If the Group has a contract that is onerous, the present obligation under the contract is recognized and measured as a provision. An onerous contract is a contract in which the unavoidable costs of meeting the obligations under the contract exceed the economic benefits expected to be received under it.
Critical accounting estimates –The use of estimates is important in determining provisions for potential losses that may arise from litigation and regulatory proceedings. The Group estimates and provides for potential losses that may arise out of litigation and regulatory proceedings to the extent that such losses are probable and can be estimated, in accordance with IAS 37, “Provisions, Contingent Liabilities and Contingent Assets”. Significant judgment is required in making these estimates and the Group’s final liabilities may ultimately be materially different.
Contingencies in respect of legal matters are subject to many uncertainties and the outcome of individual matters is not predictable with assurance. Significant judgment is required in assessing probability and making estimates in respect of contingencies, and the Group’s final liability may ultimately be materially different. The Group’s total liability in respect of litigation, arbitration and regulatory proceedings is determined on a case-by-case basis and represents an estimate of probable losses after considering, among other factors, the progress of each case, the Group’s experience and the experience of others in similar cases, and the opinions and views of legal counsel. Predicting the outcome of the Group’s litigation matters is inherently difficult, particularly in cases in which claimants seek substantial or indeterminate damages. See Note 27 “Provisions” for further information on the uncertainties from the Group’s judicial, regulatory and arbitration proceedings.
257 |
Deutsche Bank | ||
Annual Report 2022 | ||
Income taxes
The Group recognizes the current and deferred tax consequences of transactions that have been included in the consolidated financial statements using the provisions of the respective jurisdictions’ tax laws. Current and deferred taxes are recognized in profit or loss except to the extent that the tax relates to items that are recognized directly in equity or other comprehensive income in which case the related tax is recognized either directly in equity or other comprehensive income accordingly.
Deferred tax assets and liabilities are recognized for future tax consequences attributable to temporary differences between the financial statement carrying amounts of existing assets and liabilities and their respective tax bases, unused tax losses and unused tax credits. Deferred tax assets are recognized only to the extent that it is probable that sufficient taxable profit will be available against which those unused tax losses, unused tax credits and deductible temporary differences can be utilized.
Deferred tax assets and liabilities are measured based on the tax rates that are expected to apply in the period that the asset is realized or the liability is settled, based on tax rates and tax laws that have been enacted or substantively enacted at the balance sheet date.
Current tax assets and liabilities are offset when (1) they arise from the same tax reporting entity or tax group of reporting entities, (2) the legally enforceable right to offset exists and (3) they are intended to be settled net or realized simultaneously.
Deferred tax assets and liabilities are offset when the legally enforceable right to offset current tax assets and liabilities exists and the deferred tax assets and liabilities relate to income taxes levied by the same taxing authority on either the same tax reporting entity or tax group of reporting entities.
Deferred tax liabilities are provided on taxable temporary differences arising from investments in subsidiaries, branches and associates and interests in joint ventures except when the timing of the reversal of the temporary difference is controlled by the Group and it is probable that the difference will not reverse in the foreseeable future. Deferred income tax assets are provided on deductible temporary differences arising from such investments only to the extent that it is probable that the differences will reverse in the foreseeable future and sufficient taxable income will be available against which those temporary differences can be utilized.
Deferred tax related to fair value remeasurement of financial assets classified as FVTOCI, cash flow hedges and other items, which are charged or credited directly to other comprehensive income, is also credited or charged directly to other comprehensive income and subsequently recognized in the Consolidated Statement of Income once the underlying transaction or event to which the deferred tax relates is recognized in the Consolidated Statement of Income.
For share-based payment transactions, the Group may receive a tax deduction related to the compensation paid in shares. The amount deductible for tax purposes may differ from the cumulative compensation expense recorded. At any reporting date, the Group must estimate the expected future tax deduction based on the current share price. The associated current and deferred tax consequences are recognized as income or expense in the consolidated statement of Income for the period. If the amount deductible, or expected to be deductible, for tax purposes exceeds the cumulative compensation expense, the excess tax benefit is recognized directly in equity.
Critical accounting estimates – In determining the amount of deferred tax assets, the Group uses historical tax capacity and profitability information and, if relevant, forecasted operating results based upon approved business plans, including a review of the eligible carry-forward periods, available tax planning opportunities and other relevant considerations. The analysis of the historical tax capacity includes the determination as to whether a period of past profits or a history of recent losses exists at the reporting date. The determination of a period of past profits or a history of recent losses is based on the pre-tax results adjusted for permanent differences and typically covers the current and the two preceding financial years. Each quarter, the Group re-evaluates its estimate related to deferred tax assets.
The Group believes that the accounting estimate related to the deferred tax assets is a critical accounting estimate because the underlying assumptions can change from period to period and requires significant management judgment. For example, tax law changes, changes in the historical tax capacity or variances in future projected operating performance could result in a change of the carrying amount of a deferred tax asset. If the Group was not able to realize all or part of its net deferred tax assets in the future, an adjustment to its deferred tax assets would be charged to income tax expense or directly to equity in the period such determination was made. If the Group was to recognize previously unrecognized deferred tax assets in the future, an adjustment to its deferred tax asset would be credited to income tax expense or directly to equity in the period such determination was made.
258 |
Deutsche Bank | ||
Annual Report 2022 | ||
The use of estimates is also important in determining provisions for potential losses that may arise from uncertain income tax positions. The Group estimates and provides for potential losses that may arise out of uncertain income tax positions, in accordance with IAS 12, “Income Taxes” and IFRIC 23, “Uncertainty over Income Tax Treatment”. Significant judgment is required in making these estimates and the Group’s final liabilities may ultimately be materially different.
For further information on the Group’s deferred taxes (including quantitative disclosures on recognized deferred tax assets) see Note 34 “Income Taxes”.
Business combinations and noncontrolling Interests
The Group uses the acquisition method to account for business combinations. At the date the Group obtains control of the subsidiary, the cost of an acquisition is measured at the fair value of the consideration given, including any cash or non-cash consideration (equity instruments) transferred, any contingent consideration, any previously held equity interest in the acquiree and liabilities incurred or assumed. The excess of the aggregate of the cost of an acquisition and any noncontrolling interests in the acquiree over the Group’s share of the fair value of the identifiable net assets acquired is recorded as goodwill. If the aggregate of the acquisition cost and any noncontrolling interests is below the fair value of the identifiable net assets (negative goodwill), a gain is reported in other income. Acquisition-related costs are recognized as expenses in the period in which they are incurred.
In business combinations achieved in stages (“step acquisitions”), a previously held equity interest in the acquiree is remeasured to its acquisition-date fair value and the resulting gain or loss, if any, is recognized in profit or loss. Amounts recognized in prior periods in other comprehensive income associated with the previously held investment would be recognized on the same basis as would be required if the Group had directly disposed of the previously held equity interest.
Noncontrolling interests are shown in the consolidated balance sheet as a separate component of equity, which is distinct from the Group’s shareholders’ equity. The net income attributable to noncontrolling interests is separately disclosed on the face of the Consolidated Statement of Income. Changes in the ownership interest in subsidiaries which do not result in a change of control are treated as transactions between equity holders and are reported in additional paid-in capital (“APIC”).
Non-current assets held for sale
Individual non-current assets (and disposal groups) are classified as held for sale if they are available for immediate sale in their present condition subject only to the customary sales terms of such assets (and disposal groups) and their sale is considered highly probable. For a sale to be highly probable, management must be committed to a sales plan and be actively looking for a buyer and has no substantive regulatory approvals outstanding. Furthermore, the assets (and disposal groups) must be actively marketed at a reasonable sales price in relation to their current fair value and the sale should be expected to be completed within one year. Non-current non-financial assets (and disposal groups) which meet the criteria for held for sale classification are measured at the lower of their carrying amount and fair value less costs of disposal and are presented within “Other assets” and “Other liabilities” in the balance sheet. Financial assets and liabilities meeting the criteria continue to be measured in accordance with IFRS 9. The comparatives are not represented when non-current assets (and disposal groups) are classified as held for sale.
Property and equipment
Property and equipment includes own-use properties, leasehold improvements, furniture and equipment and software (operating systems only). Right-of-use assets are presented together with property and equipment on the Group’s consolidated balance sheet. Own-use properties are carried at cost less accumulated depreciation and accumulated impairment losses. Depreciation is generally recognized using the straight-line method over the estimated useful lives of the assets. The range of estimated useful lives is 25 to 50 years for property and 3 to 10 years for furniture and equipment (including initial improvements to purchased buildings). Leasehold improvements are capitalized and subsequently depreciated on a straight-line basis over the shorter of the term of the lease and the estimated useful life of the improvement, which generally ranges from 3 to 25 years. Depreciation of property and equipment is included in general and administrative expenses. Maintenance and repairs are also charged to general and administrative expenses. Gains and losses on disposals are included in other income.
Property and equipment are assessed for any indication of impairment at each quarterly reporting date. If such indication exists, the recoverable amount, which is the higher of fair value less costs of disposal and value in use, must be estimated and an impairment charge is recorded to the extent the recoverable amount is less than the carrying amount. Value in use is the present value of the future cash flows expected to be derived from the asset. After the recognition of impairment of an asset, the depreciation charge is adjusted in future periods to reflect the asset’s revised carrying amount. If an impairment is later reversed, the depreciation charge is adjusted prospectively.
259 |
Deutsche Bank | ||
Annual Report 2022 | ||
Financial guarantees
Financial guarantee contracts are contracts that require the issuer to make specified payments to reimburse the holder for a loss it incurs because a specified debtor fails to make payments when due in accordance with the terms of a debt instrument.
Financial guarantees written
The Group has chosen to apply the fair value option to certain written financial guarantees that are managed on a fair value basis. Financial guarantees that the Group has not designated at fair value are initially recognized at fair value on the date the guarantee is given. Subsequent to initial recognition, the Group’s liabilities under such guarantees are measured at the higher of the amount initially recognized, less cumulative amortization, and the best estimate of the expenditure required to settle any financial obligation as of the balance sheet date. These estimates are determined by management based on experience with similar transactions and history of past losses.
Any increase in the liability relating to guarantees is recorded in the Consolidated Statement of Income in provision for credit losses.
Financial guarantees purchased
Purchased financial guarantees result in reimbursements under IAS 37 to the extent that the financial guarantee is entered into to mitigate the credit exposure from debt instruments with HTC or HTC&S business models. This results in recognition of a reimbursement asset for subsequent increases in the expected credit losses, to the extent it is virtually certain that the purchased financial guarantee will reimburse the Group for the loss incurred. Accordingly, when the credit risk of the borrower significantly deteriorates a reimbursement asset is recognized equal to the life-time expected credit losses and is presented as Other Assets in the Group’s Consolidated Balance Sheet. The corresponding reimbursement gain is recognized as a reduction in the Provision for credit losses in the Group’s Consolidated Statement of Income.
Purchased financial guarantees entered into to mitigate credit exposure from debt instruments allocated to HTC or HTC&S business models may also be embedded in Collateralized Loan Obligations (CLO’s) issued by the Group. Such embedded guarantees are not accounted for separately as a reimbursement asset and are instead accounted as part of the CLO’s liability held at amortized cost. The Group regularly revises its estimated contractual redemption payment (including the benefit of such embedded guarantees) from the CLO when the credit risk of a borrower covered by the embedded financial guarantee in the CLO significantly deteriorates. The revision is based on the life-time expected credit losses of the debt instrument (to the extent covered by the CLO).
Purchased financial guarantees entered into to mitigate credit exposure from debt instruments included in the Other business model are accounted for at fair value through profit or loss.
Leasing transactions
The Group enters into lease contracts, predominantly for land and buildings, as a lessee. Other categories are company cars and technical/IT equipment.
The Group assesses at contract inception whether a contract is, or contains, a lease. That is, if the contract conveys the right to control the use of an identified asset for a period of time in exchange for consideration.
The Group applies a single recognition and measurement approach for all leases with a term of more than 12 months, unless the underlying asset is of low value. As a lessee, at the lease commencement date, the Group recognizes a right-of-use asset representing its right to use the underlying leased asset and a lease liability representing its obligation to make lease payments.
The right-of-use asset is measured at cost, less any accumulated depreciation and impairment losses, and adjusted for any re-measurement of lease liabilities. The cost of right-of-use assets includes the amount of lease liabilities, adjusted for any lease payments made at or before the commencement date, plus any initial direct costs incurred and an estimate of costs to dismantle and remove the underlying asset or to restore the site on which it is located, less any lease incentives received. Right-of-use assets are depreciated on a straight-line basis over the lease term.
The lease liability is measured at the present value of lease payments to be made over the lease term. The lease payments include fixed payments (including in substance fixed payments) less any lease incentives receivable and variable lease payments that depend on an index or a rate. Variable lease payments that do not depend on an index or a rate are recognized as expenses in the period in which the event or condition that triggers the payment occurs.
260 |
Deutsche Bank | ||
Annual Report 2022 | ||
In calculating the present value of lease payments, the Group uses its incremental borrowing rate at the lease commencement date because the interest rate implicit in the lease is not readily determinable. After the commencement date, the amount of lease liabilities is increased to reflect the accretion of interest and reduced for the lease payments made. In addition, the carrying amount of lease liabilities is re-measured if there is a modification, a change in the lease term or a change in the lease payments (e.g., changes to future payments resulting from a change in an index or rate used to determine such lease payments).
Right-of-use assets are assessed for any indication of impairment at each quarterly reporting date. If such indication exists, the recoverable amount, which is the fair value less costs of disposal, must be estimated and an impairment charge is recorded to the extent the recoverable amount is less than the carrying amount. As right-of-use assets do not have independently generated cash flows to calculate its value in use, the Group considers any sublease income that could reasonably be earned. After the recognition of impairment of an asset, the depreciation charge is adjusted in future periods to reflect the asset’s revised carrying amount. If an impairment is later reversed, the depreciation charge is adjusted prospectively.
The Group presents right-of-use assets in “Property and Equipment” and lease liabilities in “Other Liabilities”.
The Group applies the short-term lease recognition exemption to its short-term leases, i.e., those leases that have a lease term of 12 months or less from the commencement date. It also applies the lease of low-value assets recognition exemption to leases of technical/IT equipment that are considered to be low value. Lease payments on short-term leases and leases of low value assets are recognized as expense on a straight-line basis over the lease term.
Employee benefits
Pension benefits
The Group provides a number of pension plans. In addition to defined contribution plans, there are retirement benefit plans accounted for as defined benefit plans. The assets of all the Group’s defined contribution plans are held in independently administered funds. Contributions are generally determined as a percentage of salary and are expensed based on employee services rendered, generally in the year of contribution.
All retirement benefit plans accounted for as defined benefit plans are valued using the projected unit-credit method to determine the present value of the defined benefit obligation and the related service costs. Under this method, the determination is based on actuarial calculations which include assumptions about demographics, salary increases and interest and inflation rates. Actuarial gains and losses are recognized in other comprehensive income and presented in equity in the period in which they occur. The majority of the Group’s benefit plans is funded.
For the Group’s most significant pension plans in the key countries, the discount rate used at each measurement date is set based on a high-quality corporate bond yield curve – derived based on bond universe information sourced from reputable third-party index data providers and rating agencies – reflecting the timing, amount and currency of the future expected benefit payments for the respective plan.
Other post-employment benefits
In addition, the Group maintains unfunded contributory post-employment medical plans for a number of current and retired employees who are mainly located in the United States. These plans pay stated percentages of eligible medical and dental expenses of retirees after a stated deductible has been met. The Group funds these plans on a cash basis as benefits are due. Analogous to retirement benefit plans these plans are valued using the projected unit-credit method. Actuarial gains and losses are recognized in full in the period in which they occur in other comprehensive income and presented in equity.
Refer to Note 33 “Employee benefits” for further information on the accounting for pension benefits and other post-employment benefits.
Termination benefits
Termination benefits arise when employment is terminated by the Group before the normal retirement date or whenever an employee accepts voluntary redundancy in exchange for these benefits. The Group recognizes termination benefits as a liability and an expense if the Group is demonstrably committed to a detailed formal plan without realistic possibility of withdrawal. In the case of an offer made to encourage voluntary redundancy, termination benefits are measured based on the number of employees expected to accept the offer. Benefits falling due more than twelve months after the end of the reporting period are discounted to their present value. The discount rate is determined by reference to market yields on high-quality corporate bonds.
261 |
Deutsche Bank | ||
Annual Report 2022 | ||
Share-based compensation
Compensation expense for awards classified as equity instruments is measured at the grant date based on the fair value of the share-based award. For share awards, the fair value is the quoted market price of the share reduced by the present value of the expected dividends that will not be received by the employee and adjusted for the effect, if any, of restrictions beyond the vesting date. In case an award is modified such that its fair value immediately after modification exceeds its fair value immediately prior to modification, a remeasurement takes place and the resulting increase in fair value is recognized as additional compensation expense.
The Group records the offsetting amount to the recognized compensation expense in additional paid-in capital (“APIC”). Compensation expense is recorded on a straight-line basis over the period in which employees perform services to which the awards relate or over the period of the tranches for those awards delivered in tranches. Estimates of expected forfeitures are periodically adjusted in the event of actual forfeitures or for changes in expectations. The timing of expense recognition relating to grants which, due to early retirement provisions, include a nominal but non-substantive service period are accelerated by shortening the amortization period of the expense from the grant date to the date when the employee meets the eligibility criteria for the award, and not the vesting date. For awards that are delivered in tranches, each tranche is considered a separate award and amortized separately.
Compensation expense for share-based awards payable in cash is remeasured to fair value at each balance sheet date and recognized over the vesting period in which the related employee services are rendered. The related obligations are included in other liabilities until paid.
Government Grants
The Group recognizes income from government grants when there is reasonable assurance that it will receive the grant and will comply with the conditions attached to the grant. The benefit is recognized in the period in which the grant is intended to compensate the Group for related costs and presented as a reduction of the related expense.
The Group considers the benefits that arise from borrowing under TLTRO III as government grant from a below-market loan under IAS 20. The income from the government grant is recognized in interest income in the period in which the grant is intended to compensate the Group for the related borrowing costs. The Group previously accounted for all TLTRO III related benefits as government grant in the scope of IAS 20. In March 2022 the IASB approved the IFRS Interpretations Committee (IFRS IC) final agenda decision on accounting for TLTRO which clarified the accounting for below-market loans in the scope of IAS 20. The agenda decision stated that the component that is subject to IAS 20 is limited to the difference between the initial carrying amount of the financial liability that arises from borrowing under TLTRO III and the proceeds received. The initial carrying amount of the TLTRO III related financial liability differs from the proceeds received where at the time of initial recognition the Group has established reasonable assurance about the future receipt of the related benefits. Any residual benefits are accounted for in line with IFRS 9 under the financial liability’s effective interest rate. Implementation of the IFRS IC agenda decision resulted in an adjustment in the Group’s accounting treatment such that the benefits that arise from the base rate discount continue to be accounted for as government grant under IAS 20, while the benefits that arise from meeting the new lending discounts described above are accounted for under IFRS 9. This is because the Group was unable to establish reasonable assurance of meeting the net lending thresholds under the new lending discounts at the time of initial borrowing.
For further information on the benefit recognized by the Group from the TLTRO III refinancing program see Note 5 “Net interest income and net gains (losses) on financial assets/liabilities at fair value through profit or loss”.
262 |
Deutsche Bank | ||
Annual Report 2022 | ||
Obligations to purchase common shares
Forward purchases of Deutsche Bank shares and written put options where Deutsche Bank shares are the underlying, are reported as obligations to purchase common shares if the number of shares is fixed and physical settlement for a fixed amount of cash is required. At inception, the obligation is recorded at the present value of the settlement amount of the forward or option. For forward purchases and written put options of Deutsche Bank shares, a corresponding charge is made to shareholders’ equity and reported as equity classified as an obligation to purchase common shares.
The liabilities are accounted for on an accrual basis, and interest costs, which consist of time value of money and dividends, on the liability are reported as interest expense. Upon settlement of such forward purchases and written put options, the liability is extinguished and the charge to equity is reclassified to common shares in treasury.
Deutsche Bank common shares subject to such forward contracts are not considered to be outstanding for purposes of basic earnings per share calculations but are for dilutive earnings per share calculations to the extent that they are, in fact, dilutive.
Option and forward contracts on Deutsche Bank shares are classified as equity if the number of shares is fixed and physical settlement is required. All other contracts in which Deutsche Bank shares are the underlying are recorded as financial assets or liabilities at fair value through profit or loss.
Consolidated statement of cash flows
For purposes of the consolidated statement of cash flows, the Group’s cash and cash equivalents include highly liquid investments that are readily convertible into cash and which are subject to an insignificant risk of change in value. Such investments include cash and balances at central banks and demand deposits with banks.
There are various circumstances in which cash and cash equivalent balances held by an entity are not available for use by the Group. Examples include cash and cash equivalent balances held by a subsidiary that operates in a country where exchange controls or other legal restrictions apply such that the balances are not available for general use by the Group or its subsidiaries.
The Group’s assignment of cash flows to the operating, investing or financing category depends on the business model (“management approach”). For the Group the primary operating activity is to manage financial assets and financial liabilities. Therefore, the issuance and management of long-term borrowings is a core operating activity which is different than for a non-financial company, where borrowing is not a principal revenue producing activity and thus is part of the financing category.
The Group views the issuance of senior long-term debt as an operating activity. Senior long-term debt comprises structured notes and asset-backed securities, which are designed and executed by the Corporate Bank and Investment Bank business line segments and which are revenue generating activities. The other component is debt issued by Treasury, which is considered interchangeable with other funding sources. All funding costs are allocated to business activities to establish their profitability.
Cash flows related to subordinated long-term debt and trust preferred securities are viewed differently than those related to senior-long term debt because they are managed as an integral part of the Group’s capital, primarily to meet regulatory capital requirements. As a result, they are not interchangeable with other operating liabilities, but can only be interchanged with equity and thus are considered part of the financing category.
The amounts shown in the consolidated statement of cash flows do not precisely match the movements in the consolidated balance sheet from one period to the next as they exclude non-cash items such as movements due to foreign exchange translation and movements due to changes in the group of consolidated companies.
Movements in balances carried at fair value through profit or loss represent all changes affecting the carrying value. This includes the effects of market movements and cash inflows and outflows. The movements in balances carried at fair value are usually presented in operating cash flows.
263 |
Deutsche Bank | ||
Annual Report 2022 | ||
02 – Recently adopted and new accounting pronouncements
Recently adopted accounting pronouncements
The following are those accounting pronouncements which are relevant to the Group and which have been adopted during 2022 in the preparation of these consolidated financial statements.
IAS 37 “Provisions, Contingent Liabilities and Contingent Assets”
On January 1, 2022, the Group adopted amendments to IAS 37, “Provisions, Contingent Liabilities and Contingent Assets” which clarified what costs an entity considers in assessing whether a contract is onerous. The amendments specified that the ‘cost of fulfilling’ a contract comprises the ‘costs that relate directly to the contract’. Costs that relate directly to a contract can either be incremental costs of fulfilling that contract or an allocation of other costs that relate directly to fulfilling contracts. The amendments did not have a material impact on the Group’s consolidated financial statements.
Improvements to IFRS 2018-2020 Cycles
On January 1, 2022, the Group adopted amendments to multiple IFRS standards, which resulted from the IASB’s annual improvement project for the 2018-2020 cycles. This comprised amendments that resulted in accounting changes for presentation, recognition or measurement purposes as well as terminology or editorial amendments related to IFRS 1 “First-time Adoption of International Financial Reporting Standards”, IFRS 9 “Financial Instruments”, IFRS 16 “Leases” and IAS 41 “Agriculture”. The amendments to IFRS 9 clarified which fees an entity includes when assessing whether to derecognize a financial liability. The amendments did not have a material impact on the Group’s consolidated financial statements.
New accounting pronouncements
The following accounting pronouncements were not effective as of December 31, 2022 and therefore have not been applied in preparing these consolidated financial statements.
IFRS 16 “Leases”
In September 2022, the IASB issued amendments to IFRS 16 “Leases” that clarify how a seller-lessee subsequently measures sale and leaseback transactions that satisfy the IFRS 15 requirements to be accounted for as a sale. The amendments are effective for annual periods beginning on or after January 1, 2024 with early adoption permitted. The amendment is not expected to have a material impact on the Group’s consolidated financial statements. These amendments have yet to be endorsed by the EU.
IFRS 17 “Insurance Contracts”
In May 2017, the IASB issued IFRS 17, “Insurance Contracts”, which establishes the principles for the recognition, measurement, presentation and disclosure of insurance contracts within the scope of the standard. IFRS 17 replaces IFRS 4 which has given companies dispensation to carry on accounting for insurance contracts using national accounting standards, resulting in a multitude of different approaches. IFRS 17 solves the comparison problems created by IFRS 4 by requiring all insurance contracts to be accounted for in a consistent manner, benefiting both investors and insurance companies. Insurance obligations will be accounted for using current values – instead of historical cost. The information will be updated regularly, providing more useful information to users of financial statements. IFRS 17 is effective for annual periods beginning on or after January 1, 2023. Based on the Group’s current business activities IFRS 17 will not have a material impact on the Group’s consolidated financial statements.
In June 2020, the IASB issued amendments to IFRS 17 “Insurance Contracts” that address concerns and implementation challenges that were identified after IFRS 17 was published in 2017. The amendments are effective for annual periods beginning on or after January 1, 2023 with early adoption permitted.
In December 2021, the IASB issued amendments to IFRS 17 “Insurance Contracts” that are narrow-scope amendments to the transition requirements of IFRS 17 for entities that first apply IFRS 17 and IFRS 9 at the same time. The amendments (if elected) will be applicable when IFRS 17 is first applied.
264 |
Deutsche Bank | ||
Annual Report 2022 | ||
IAS 12 “Income Taxes”
In May 2021, the IASB issued amendments to IAS 12 “Income Taxes”. These amendments change the deferred tax treatment related to assets and liabilities in a single transaction such that they introduce an exemption from the initial recognition exemption provided in IAS 12.15(b) and IAS 12.24. Accordingly, the initial recognition exemption does not apply to transactions in which both deductible and taxable temporary differences arise on initial recognition that result in the recognition of equal deferred tax assets and liabilities. The amendments will be effective for annual periods beginning on or after January 1, 2023 with early adoption permitted. Neither of these amendments will have a material impact on the Group’s consolidated financial statements.
IAS 1 “Presentation of Financial Statements”
In January 2020 and July 2020, the IASB issued amendments to IAS 1 “Presentation of Financial Statements: Classification of Liabilities as Current or Non-Current”. They clarify that the classification of liabilities as current or non-current should be based on rights that are in existence at the end of the reporting period. They also clarify that the classification is unaffected by expectations about whether an entity will exercise its right to defer settlement of a liability and make clear that settlement refers to the transfer to the counterparty of cash, equity instruments, other assets or services. The amendments are expected to be effective for annual periods beginning on or after January 1, 2024 with early adoption permitted. They will not have a material impact on the Group’s consolidated financial statements. The amendments have yet to be endorsed by the EU.
In October 2022, the IASB issued a further amendment to IAS 1 that modifies the requirements described above on how an entity classifies debt and other financial liabilities as current or non-current in particular circumstance. Accordingly, it clarifies that only covenants with which an entity is required to comply on or before the reporting date affect the classification of a liability as current or non-current. In line with the previous amendments, the new amendments are expected to be effective for annual periods beginning on or after January 1, 2024 with early adoption permitted. They will not have a material impact on the Group’s consolidated financial statements. The amendments have yet to be endorsed by the EU.
In February 2021, the IASB issued amendments to IAS 1 and “IFRS Practice Statement 2” that are intended to provide guidance on deciding which accounting policies to disclose in the financial statements. Accordingly, an entity is now required to disclose its material accounting policies instead of its significant accounting policies. This will be effective for annual periods beginning on or after January 1, 2023 with early adoption permitted. The amendments will not have an impact on the Group’s results but will lead to changes to the Group’s disclosure of its accounting policies.
265 |
Deutsche Bank | ||
Annual Report 2022 | ||
03 – Acquisitions and dispositions
Business combinations
During the years 2022 and 2020, the Group did not undertake any acquisitions accounted for as business combinations.
In the third quarter 2021, the Group had completed the acquisition of 100% of the shares in Better Payment Germany GmbH, a Berlin-based early-stage payment service provider. Through this acquisition, the Group intended to expand its market share in payment processing and acceptance. The fair value of the purchase price paid for the acquisition consisted of € 5 million cash and an earn-out consideration of € 3 million contingent upon a number of KPIs to be achieved within 3 years following the acquisition. As part of the preliminary purchase price allocation, the Group recorded goodwill of € 5 million assigned to the Corporate Bank cash-generating unit (CGU). Given the value of the Corporate Bank CGU, the new goodwill was considered impaired and immediately written off in 2021 (refer to Note 23 “Goodwill and Other Intangible Assets”).
Dispositions
The Group finalized several dispositions of subsidiaries/businesses during 2022, 2021 and 2020. These disposals were mainly comprised of businesses the Group had previously classified as held for sale, including the completion of the transfer of the digital investment platform of DWS as part of its partnership with BlackFin and the sale of the Italian financial advisors business to Zurich Italy in 2022, the transfer of the Global Prime Finance & Electronic Equities platform to BNP Paribas in 2021 and the sale of Postbank Systems AG in 2020. For more detail, please refer to Note 24 “Non-Current Assets and Disposal Groups Held for Sale”. The total consideration received for these dispositions (thereof in cash) in 2022, 2021 and 2020 was € 488 million (cash € 439 million), € 34 million (cash € 0 million) and € 7 million (cash € 7 million), respectively. The table below shows the assets and liabilities that were included in these disposals.
in € m. | 2022 | 2021 | 2020 | |||
Cash and cash equivalents | 1,126 | 0 | 2 | |||
All remaining assets | 659 | 3,507 | 7 | |||
Total assets disposed | 1,785 | 3,507 | 9 | |||
Total liabilities disposed | 1,676 | 8,102 | 79 | |||
266 |
Deutsche Bank | ||
Annual Report 2022 | ||
04 – Business segments and related information
The Group’s segmental information has been prepared in accordance with the “management approach”, which requires presentation of the segments on the basis of the internal management reports of the entity which are regularly reviewed by the chief operating decision maker, which is the Deutsche Bank Management Board, in order to allocate resources to a segment and to assess its financial performance.
Business segments
The Group’s segment reporting follows the organizational structure as reflected in its internal management reporting systems, which are the basis for assessing the financial performance of the business segments and for allocating resources to the business segments.
The bank’s business operations are organized under the divisional structure comprising the following corporate divisions:
- – Corporate Bank
- – Investment Bank
- – Private Bank
- – Asset Management
- – Capital Release Unit
- – Corporate & Other
Compared to the prior year, the segmental information for the corporate divisions Corporate Bank, Investment Bank, Asset Management, Capital Release Unit and Corporate & Other remained unchanged in its scope, while the presentation of revenues in the Private Bank was changed. The related segment information is outlined below.
Corporate Bank reports revenues in the categories Corporate Treasury Services, Institutional Client Services and Business Banking.
Investment Bank reports revenues in the categories Fixed Income, Currency Sales & Trading and, Origination & Advisory, as well as other.
Private Bank reports revenues in the categories Private Bank Germany and International Private Bank. Commencing from the second quarter 2022 reporting, the breakdown of revenues within the International Private Bank was refined to further align the reporting structure to the client coverage model. International Private Bank revenues are now categorized into the client segments “Wealth Management & Bank for Entrepreneurs” and “Premium Banking”. “Wealth Management & Bank for Entrepreneurs” combines the coverage of private banking, high-net-worth and ultra-high-net-worth clients, as well as business clients that are covered as part of the Bank for Entrepreneurs proposition. “International Private Bank Premium Banking” includes retail and affluent customers as well as commercial banking clients (i.e., all small business clients and small sized corporate clients that are not covered as part of the Bank for Entrepreneurs). Prior year comparatives are presented in the current structure.
Asset Management reports revenues in the categories Management Fees, Performance and Transaction Fees and Other.
Capital Release Unit includes the remaining assets transferred in from Equities Sales & Trading business, lower yielding fixed income positions, particularly in Rates, former Corporate & Investment Bank Non-Strategic portfolio as well as a legacy loan portfolio from the former Private & Commercial Bank in Poland.
Corporate & Other includes revenues, costs and resources held centrally that are not allocated to the individual business segments as well as valuation and timing differences that arise on derivatives used to hedge the Group’s balance sheet. These are accounting impacts, and the valuation losses are expected to be recovered over time as the underlying instruments approach maturity.
In addition, based on management decisions during the reporting period further divisional changes were introduced. The prior years' segmental information is presented in the current structure.
267 |
Deutsche Bank | ||
Annual Report 2022 | ||
Measurement of segment profit or loss
Segment reporting requires a presentation of the segment results based on management reporting methods, including a reconciliation between the results of the business segments and the consolidated financial statements, which is presented in the “Segmental Results of Operations” section within this note. The information provided about each segment is based on internal management reporting about segment profit or loss, assets and other information which is regularly reviewed by the chief operating decision maker. Segment assets are presented in the Group’s internal management reporting based on a consolidated view, i.e., the amounts do not include intersegment balances. The Group`s internal management reporting does not consider segment liabilities or interest expense separately. Similarly, depreciation and amortization, tax expenses and other comprehensive income are not presented separately internally and are therefore not disclosed here.
Non-IFRS compliant accounting methods used in the Group’s management reporting represent either valuation or classification differences. The largest valuation differences relate to measurement at fair value in management reporting versus measurement at amortized cost under IFRS and to the recognition of trading results from own shares in revenues in management reporting (in Investment Bank) and in equity under IFRS. The major classification difference relates to noncontrolling interest, which represents the net share of minority shareholders in revenues, provision for credit losses, noninterest expenses and income tax expenses. Noncontrolling interest is reported as a component of the profit before tax of the businesses in management reporting (with a reversal in Corporate & Other) and a component of net income appropriation under IFRS.
Since the Group’s business activities are diverse in nature and its operations are integrated, certain estimates and judgments have been made to apportion revenue and expense items among the business segments.
The management reporting systems allocate the Group’s external net interest income according to the value of funding consumed or provided by each business segment’s activities, in accordance with the bank’s internal funds transfer pricing framework. Furthermore, to retain comparability with those competitors that have legally independent units with their own equity funding, the Group allocates a net notional interest benefit on its consolidated capital, in line with each segment’s proportion of average shareholders’ equity.
Management uses certain measures for equity and related ratios as part of its internal reporting system because it believes that these measures provide it with a useful indication of the financial performance of the business segments. The Group discloses such measures to provide investors and analysts with further insight into how management operates the Group’s businesses and to enable them to better understand the Group’s results.
Allocation of Average Shareholder’s Equity
Shareholders’ equity is fully allocated to the Group’s segments based on the regulatory capital demand of each segment. Regulatory capital demand reflects the combined contribution of each segment to the Groups’ Common Equity Tier 1 (CET1) ratio, the Groups’ leverage ratio and the Group’s capital loss under stress. Contributions in each of the three dimensions are weighted to reflect their relative importance and level of constraint for the Group. Contributions to the CET1 ratio and the leverage ratio are measured through risk-weighted assets and leverage ratio exposure. The Group’s capital loss under stress is a measure of the Group’s overall economic risk exposure under a defined stress scenario. Goodwill and other intangible assets are directly attributed to the Group’s segments in order to allow the determination of allocated tangible shareholders’ equity and the respective returns. Shareholders’ equity and tangible shareholders’ equity is allocated on a monthly basis and averaged across quarters and for the full year.
Strategic Liquidity Reserve Profit and Loss Allocation
Commencing from the first quarter of 2022, the methodology for divisional intra-year allocations of profit or loss earned on the Strategic Liquidity Reserves has been refined. As part of the introduction of the new methodology, the intra-year profit and loss volatility is held centrally in Corporate & Other in order to better reflect the underlying performance of the business divisions. The implementation of the new methodology does not impact the overall group revenues or the annual business allocations, therefore the full year results for 2022, 2021 and 2020 are not impacted.
268 |
Deutsche Bank | ||
Annual Report 2022 | ||
US Tax Exempt Securities
Net interest income as a component of net revenues, profit (loss) before tax and related ratios are presented on a fully taxable-equivalent basis for US tax-exempt securities for the Investment Bank. This enables management to measure performance of taxable and tax-exempt securities on a comparable basis. This presentation resulted in an increase in Investment Bank net interest income of € 33 million for full year 2022, € 40 million for full year 2021 and € 45 million for full year 2020. This increase is offset in Group consolidated figures through a reversal in Corporate & Other. The tax rate used in determining the fully taxable-equivalent of net interest income in respect of the majority of the U.S. tax-exempt securities is 21% for 2022, 2021 and 2020.
Infrastructure Full-time Employees realignment
In the third quarter of 2021, approximately 9,000 FTEs moved from Corporate & Other to the operating business segments driven by the bank’s decision that the Chief Operating Office will no longer be a separate Management Board function. Accordingly, business-related parts of Chief Operating Office that support the Investment Bank and the Corporate Bank, which were previously run in Infrastructure, moved to those divisions. Comparative segmental financial information is presented accordingly. This change did not result in a material financial impact at a segment level, as costs are allocated from Corporate & Other to the operating business segments that are using the service of the respective infrastructure functions and with this move the costs are directly incurred by the divisions rather than being charged from Corporate & Other.
269 |
Deutsche Bank | ||
Annual Report 2022 | ||
Segmental results of operations
The following tables present the results of the Group’s business segments, including the reconciliation to the consolidated results of operations under IFRS.
| 2022 | ||||||||||||||
in € m. | Corporate | Investment | Private | Asset | Capital | Corporate & | Total | ||||||||
Net revenues1 | 6,335 | 10,016 | 9,155 | 2,608 | (28) | (877) | 27,210 | ||||||||
Provision for credit losses | 335 | 319 | 583 | (2) | (17) | 8 | 1,226 | ||||||||
Noninterest expenses | |||||||||||||||
Compensation and benefits | 1,421 | 2,376 | 2,791 | 899 | 60 | 3,165 | 10,712 | ||||||||
General and administrative expenses | 2,547 | 3,805 | 3,915 | 869 | 864 | (2,272) | 9,728 | ||||||||
Impairment of goodwill and other intangible assets | 0 | 0 | 0 | 68 | 0 | 0 | 68 | ||||||||
Restructuring activities | (19) | 15 | (113) | 0 | (2) | 0 | (118) | ||||||||
Total noninterest expenses | 3,949 | 6,196 | 6,593 | 1,836 | 922 | 893 | 20,390 | ||||||||
Noncontrolling interests | 0 | 15 | 0 | 174 | 0 | (190) | 0 | ||||||||
Profit (loss) before tax | 2,051 | 3,487 | 1,979 | 598 | (932) | (1,589) | 5,594 | ||||||||
Cost/income ratio | 62% | 62% | 72% | 70% | N/M | N/M | 75% | ||||||||
Assets2 | 257,900 | 676,714 | 332,524 | 10,150 | 61,823 | (2,322) | 1,336,788 | ||||||||
Additions to non-current assets | 3 | 4 | 177 | 41 | 0 | 2,269 | 2,494 | ||||||||
Risk-weighted assets | 74,303 | 139,442 | 87,602 | 12,864 | 24,284 | 21,508 | 360,003 | ||||||||
Leverage exposure3 | 320,767 | 529,506 | 344,396 | 9,462 | 22,028 | 14,325 | 1,240,483 | ||||||||
Average allocated shareholders' equity | 11,901 | 26,032 | 13,584 | 5,459 | 3,018 | 0 | 59,994 | ||||||||
Post-tax return on average shareholders’ equity4 | 12% | 9% | 10% | 7% | (23)% | N/M | 8% | ||||||||
Post-tax return on average tangible shareholders’ equity4 | 12% | 9% | 11% | 17% | (24)% | N/M | 9% | ||||||||
1 includes: | |||||||||||||||
Net interest income | 3,628 | 3,467 | 5,223 | (65) | (227) | 1,625 | 13,650 | ||||||||
Net income (loss) from equity method investments | 4 | 50 | 27 | 66 | 6 | 0 | 152 | ||||||||
2 includes: | |||||||||||||||
Equity method investments | 90 | 501 | 99 | 415 | 16 | 4 | 1,124 | ||||||||
N/M – Not meaningful
3The leverage ratio exposure is calculated according to CRR as applicable at the reporting date; starting with September 30, 2020, the Group was allowed to exclude certain Euro-based exposures facing Eurosystem central banks from the leverage ratio exposure based on the ECB-decision (EU) 2020/1306 and EU 2021/1074; this exclusion applied until March 31, 2022; the segmental leverage exposures are presented without that exclusion.
4The post-tax return on average tangible shareholders’ equity and average shareholders’ equity at the Group level reflects the reported effective tax rate for the Group, which was (1)% for the year ended December 31, 2022; for the post-tax return on average tangible shareholders’ equity and average shareholders’ equity of the segments, the Group effective tax rate was adjusted to exclude the impact of permanent differences not attributed to the segments, so that the segment tax rates were 28% for the year ended December 31, 2022; for further information, please refer to “Supplementary Information (Unaudited): Non-GAAP Financial Measures” of this Annual Report.
270 |
Deutsche Bank | ||
Annual Report 2022 | ||
| 2021 | ||||||||||||||
in € m. | Corporate | Investment | Private | Asset | Capital | Corporate & | Total | ||||||||
Net revenues1 | 5,151 | 9,631 | 8,234 | 2,708 | 26 | (340) | 25,410 | ||||||||
Provision for credit losses | (3) | 104 | 446 | 5 | (42) | 5 | 515 | ||||||||
Noninterest expenses | |||||||||||||||
Compensation and benefits | 1,447 | 2,197 | 2,813 | 822 | 128 | 3,012 | 10,418 | ||||||||
General and administrative expenses | 2,649 | 3,587 | 4,447 | 840 | 1,306 | (2,009) | 10,821 | ||||||||
Impairment of goodwill and other intangible assets | 5 | 0 | 0 | 0 | 0 | 0 | 5 | ||||||||
Restructuring activities | 42 | 47 | 173 | 2 | (2) | (0) | 261 | ||||||||
Total noninterest expenses | 4,143 | 5,831 | 7,433 | 1,664 | 1,432 | 1,002 | 21,505 | ||||||||
Noncontrolling interests | 0 | (17) | 0 | 223 | 0 | (206) | 0 | ||||||||
Profit (loss) before tax | 1,011 | 3,714 | 355 | 816 | (1,364) | (1,142) | 3,390 | ||||||||
Cost/income ratio | 80% | 61% | 90% | 61% | N/M | N/M | 85% | ||||||||
Assets2 | 245,716 | 615,906 | 310,496 | 10,387 | 131,775 | 9,713 | 1,323,993 | ||||||||
Additions to non-current assets | 17 | 6 | 149 | 32 | 1 | 1,734 | 1,939 | ||||||||
Risk-weighted assets | 65,406 | 140,600 | 85,366 | 14,415 | 28,059 | 17,783 | 351,629 | ||||||||
Leverage exposure (fully loaded)3 | 299,892 | 530,361 | 320,692 | 10,678 | 38,830 | 22,761 | 1,124,667 | ||||||||
Average allocated shareholders' equity | 10,301 | 24,181 | 12,663 | 4,815 | 4,473 | 0 | 56,434 | ||||||||
Post-tax return on average shareholders’ equity4 | 6% | 10% | 1% | 12% | (23)% | N/M | 3% | ||||||||
Post-tax return on average tangible shareholders’ equity4 | 7% | 11% | 1% | 30% | (23)% | N/M | 4% | ||||||||
1 includes: | |||||||||||||||
Net interest income | 2,605 | 3,332 | 4,601 | (5) | 58 | 564 | 11,155 | ||||||||
Net income (loss) from equity method investments | 3 | (34) | 40 | 81 | 7 | 1 | 98 | ||||||||
2 includes: | |||||||||||||||
Equity method investments | 72 | 462 | 180 | 349 | 25 | 4 | 1,091 | ||||||||
N/M – Not meaningful
Prior year’s comparatives aligned to presentation in the current year
3The leverage ratio exposure is calculated according to CRR as applicable at the reporting date; starting with September 30, 2020, the Group was allowed to exclude certain Euro-based exposures facing Eurosystem central banks from the leverage ratio exposure based on the ECB-decision (EU) 2020/1306 and EU 2021/1074; this exclusion applied until March 31, 2022; the segmental leverage exposures are presented without that exclusion.
4The post-tax return on average tangible shareholders’ equity and average shareholders’ equity at the Group level reflects the reported effective tax rate for the Group, which was 26% for the year ended December 31, 2021; for the post-tax return on average tangible shareholders’ equity and average shareholders’ equity of the segments, the Group effective tax rate was adjusted to exclude the impact of permanent differences not attributed to the segments, so that the segment tax rates were 28% for the year ended December 31, 2021; for further information, please refer to “Supplementary Information (Unaudited): Non-GAAP Financial Measures” of this Annual Report.
271 |
Deutsche Bank | ||
Annual Report 2022 | ||
| 2020 | ||||||||||||||
in € m. | Corporate | Investment | Private | Asset | Capital | Corporate & | Total | ||||||||
Net revenues1 | 5,146 | 9,286 | 8,126 | 2,229 | (225) | (534) | 24,028 | ||||||||
Provision for credit losses | 364 | 690 | 711 | 2 | 29 | (4) | 1,792 | ||||||||
Noninterest expenses | |||||||||||||||
Compensation and benefits | 1,402 | 2,079 | 2,867 | 740 | 168 | 3,215 | 10,471 | ||||||||
General and administrative expenses | 2,805 | 3,325 | 4,242 | 763 | 1,774 | (2,651) | 10,259 | ||||||||
Impairment of goodwill and other intangible assets | 0 | 0 | 0 | 0 | 0 | 0 | 0 | ||||||||
Restructuring activities | 28 | 14 | 413 | 22 | 5 | 3 | 485 | ||||||||
Total noninterest expenses | 4,235 | 5,418 | 7,522 | 1,526 | 1,947 | 568 | 21,216 | ||||||||
Noncontrolling interests | 0 | 11 | 0 | 157 | (0) | (169) | 0 | ||||||||
Profit (loss) before tax | 547 | 3,166 | (108) | 544 | (2,200) | (929) | 1,021 | ||||||||
Cost/income ratio | 82% | 58% | 93% | 68% | N/M | N/M | 88% | ||||||||
Assets2 | 237,675 | 573,536 | 296,596 | 9,453 | 197,667 | 10,333 | 1,325,259 | ||||||||
Additions to non-current assets | 10 | 4 | 202 | 32 | 0 | 3,174 | 3,423 | ||||||||
Risk-weighted assets | 57,483 | 128,292 | 77,074 | 9,997 | 34,415 | 21,690 | 328,951 | ||||||||
Leverage exposure (fully loaded)3 | 273,959 | 476,097 | 307,746 | 4,695 | 71,726 | 29,243 | 1,078,268 | ||||||||
Average allocated shareholders' equity | 9,945 | 22,911 | 11,553 | 4,757 | 6,166 | 0 | 55,332 | ||||||||
Post-tax return on average shareholders’ equity4 | 3% | 9% | (1)% | 8% | (26)% | N/M | 0% | ||||||||
Post-tax return on average tangible shareholders’ equity4 | 3% | 10% | (2)% | 21% | (27)% | N/M | 0% | ||||||||
1 includes: | |||||||||||||||
Net interest income | 2,883 | 3,325 | 4,499 | 1 | 61 | 756 | 11,526 | ||||||||
Net income (loss) from equity method investments | 3 | 22 | 23 | 63 | 9 | 1 | 120 | ||||||||
2 includes: | |||||||||||||||
Equity method investments | 69 | 399 | 60 | 304 | 67 | 4 | 901 | ||||||||
N/M – Not meaningful
Prior year’s comparatives aligned to presentation in the current year.
3The leverage ratio exposure is calculated according to CRR as applicable at the reporting date; starting with September 30, 2020, the Group was allowed to exclude certain Euro-based exposures facing Eurosystem central banks from the leverage ratio exposure based on the ECB-decision (EU) 2020/1306 and EU 2021/1074; this exclusion applied until March 31, 2022; the segmental leverage exposures are presented without that exclusion.
4The post-tax return on average tangible shareholders’ equity and average shareholders’ equity at the Group level reflects the reported effective tax rate for the Group, which was 39% for the year ended December 31, 2020; for the post-tax return on average tangible shareholders’ equity and average shareholders’ equity of the segments, the Group effective tax rate was adjusted to exclude the impact of permanent differences not attributed to the segments, so that the segment tax rates were 28% for the year ended December 31, 2020; for further information, please refer to “Supplementary Information (Unaudited): Non-GAAP Financial Measures” of this Annual Report.
272 |
Deutsche Bank | ||
Annual Report 2022 | ||
Corporate Bank
2022 increase (decrease) | 2021 increase (decrease) | |||||||||||||
in € m. | 2022 | 2021 | 2020 | in € m. | in % | in € m. | in % | |||||||
Net revenues | ||||||||||||||
Corporate Treasury Services | 3,886 | 3,125 | 3,119 | 761 | 24 | 6 | 0 | |||||||
Institutional Client Services | 1,586 | 1,299 | 1,280 | 287 | 22 | 19 | 1 | |||||||
Business Banking | 863 | 726 | 747 | 136 | 19 | (21) | (3) | |||||||
Total net revenues | 6,335 | 5,151 | 5,146 | 1,185 | 23 | 5 | 0 | |||||||
of which: | ||||||||||||||
Net interest income | 3,628 | 2,605 | 2,883 | 1,022 | 39 | (278) | (10) | |||||||
Commissions and fee income | 2,354 | 2,203 | 2,078 | 151 | 7 | 125 | 6 | |||||||
Remaining income | 354 | 343 | 185 | 11 | 3 | 158 | 86 | |||||||
Provision for credit losses | 335 | (3) | 364 | 338 | N/M | (367) | N/M | |||||||
Noninterest expenses | ||||||||||||||
Compensation and benefits | 1,421 | 1,447 | 1,402 | (25) | (2) | 45 | 3 | |||||||
General and administrative expenses | 2,547 | 2,649 | 2,805 | (103) | (4) | (156) | (6) | |||||||
Impairment of goodwill and other intangible assets | 0 | 5 | 0 | (5) | N/M | 5 | N/M | |||||||
Restructuring activities | (19) | 42 | 28 | (61) | N/M | 13 | 47 | |||||||
Total noninterest expenses | 3,949 | 4,143 | 4,235 | (193) | (5) | (92) | (2) | |||||||
Noncontrolling interests | 0 | 0 | 0 | 0 | N/M | 0 | N/M | |||||||
Profit (loss) before tax | 2,051 | 1,011 | 547 | 1,040 | 103 | 464 | 85 | |||||||
Total assets (in € bn.)1 | 258 | 246 | 238 | 12 | 5 | 8 | 3 | |||||||
Loans (gross of allowance for loan losses, in € bn.) | 122 | 122 | 115 | (1) | (1) | 8 | 7 | |||||||
Total employees (directly-managed, full-time equivalent) | 13,980 | 13,292 | 13,393 | 688 | 5 | (102) | (1) | |||||||
N/M – Not meaningful
Prior year’s comparatives aligned to presentation in the current year.
1Segment assets represent consolidated view, i.e., the amounts do not include intersegment balances.
Investment Bank
2022 increase (decrease) | 2021 increase (decrease) | |||||||||||||
in € m. | 2022 | 2021 | 2020 | in € m. | in % | in € m. | in % | |||||||
Net revenues | ||||||||||||||
Fixed Income, Currency (FIC) Sales & Trading | 8,935 | 7,063 | 7,074 | 1,871 | 26 | (11) | (0) | |||||||
Debt Origination | 412 | 1,573 | 1,500 | (1,161) | (74) | 73 | 5 | |||||||
Equity Origination | 101 | 544 | 369 | (443) | (81) | 174 | 47 | |||||||
Advisory | 485 | 491 | 244 | (6) | (1) | 247 | 101 | |||||||
Origination & Advisory | 998 | 2,608 | 2,114 | (1,610) | (62) | 494 | 23 | |||||||
Other | 84 | (40) | 99 | 124 | N/M | (139) | N/M | |||||||
Total net revenues | 10,016 | 9,631 | 9,286 | 385 | 4 | 345 | 4 | |||||||
Provision for credit losses | 319 | 104 | 690 | 215 | N/M | (587) | (85) | |||||||
Noninterest expenses | ||||||||||||||
Compensation and benefits | 2,376 | 2,197 | 2,079 | 179 | 8 | 118 | 6 | |||||||
General and administrative expenses | 3,805 | 3,587 | 3,325 | 218 | 6 | 262 | 8 | |||||||
Impairment of goodwill and other intangible assets | 0 | 0 | 0 | 0 | N/M | 0 | N/M | |||||||
Restructuring activities | 15 | 47 | 14 | (32) | (68) | 33 | N/M | |||||||
Total noninterest expenses | 6,196 | 5,831 | 5,418 | 365 | 6 | 413 | 8 | |||||||
Noncontrolling interests | 15 | (17) | 11 | 32 | N/M | (29) | N/M | |||||||
Profit (loss) before tax | 3,487 | 3,714 | 3,166 | (227) | (6) | 547 | 17 | |||||||
Total assets (in € bn.)1 | 677 | 616 | 574 | 61 | 10 | 42 | 7 | |||||||
Loans (gross of allowance for loan losses, in € bn.) | 103 | 93 | 69 | 10 | 11 | 24 | 34 | |||||||
Total employees (directly-managed, full-time equivalent) | 7,657 | 7,152 | 7,492 | 505 | 7 | (341) | (5) | |||||||
N/M – Not meaningful
Prior year’s comparatives aligned to presentation in the current year
1Segment assets represent consolidated view, i.e., the amounts do not include intersegment balances.
273 |
Deutsche Bank | ||
Annual Report 2022 | ||
Private Bank
2022 increase (decrease) | 2021 increase (decrease) | |||||||||||||
in € m. | 2022 | 2021 | 2020 | in € m. | in % | in € m. | in % | |||||||
Net revenues: | ||||||||||||||
Private Bank Germany | 5,327 | 5,008 | 4,989 | 319 | 6 | 19 | 0 | |||||||
International Private Bank | 3,828 | 3,226 | 3,136 | 601 | 19 | 90 | 3 | |||||||
Premium Banking | 953 | 945 | 905 | 8 | 1 | 41 | 4 | |||||||
Wealth Management & Bank for Entrepreneurs | 2,874 | 2,281 | 2,232 | 594 | 26 | 49 | 2 | |||||||
Total net revenues | 9,155 | 8,234 | 8,126 | 921 | 11 | 109 | 1 | |||||||
of which: | ||||||||||||||
Net interest income | 5,223 | 4,601 | 4,499 | 622 | 14 | 102 | 2 | |||||||
Commissions and fee income | 3,157 | 3,207 | 3,052 | (50) | (2) | 155 | 5 | |||||||
Remaining income | 775 | 426 | 574 | 349 | 82 | (148) | (26) | |||||||
Provision for credit losses | 583 | 446 | 711 | 137 | 31 | (265) | (37) | |||||||
Noninterest expenses: | ||||||||||||||
Compensation and benefits | 2,791 | 2,813 | 2,867 | (22) | (1) | (54) | (2) | |||||||
General and administrative expenses | 3,915 | 4,447 | 4,242 | (533) | (12) | 205 | 5 | |||||||
Impairment of goodwill and other intangible assets | 0 | 0 | 0 | 0 | N/M | 0 | N/M | |||||||
Restructuring activities | (113) | 173 | 413 | (285) | N/M | (240) | (58) | |||||||
Total noninterest expenses | 6,593 | 7,433 | 7,522 | (840) | (11) | (89) | (1) | |||||||
Noncontrolling interests | 0 | 0 | 0 | 0 | N/M | (0) | (87) | |||||||
Profit (loss) before tax | 1,979 | 355 | (108) | 1,624 | N/M | 463 | N/M | |||||||
Total assets (in € bn.)1 | 333 | 310 | 297 | 22 | 7 | 14 | 5 | |||||||
Loans (gross of allowance for loan losses, in € bn.) | 265 | 254 | 237 | 10 | 4 | 17 | 7 | |||||||
Assets under management (in € bn.)2 | 518 | 554 | 495 | (36) | (6) | 59 | 12 | |||||||
Net flows (in € bn.) | 30 | 30 | 16 | (0) | (1) | 14 | 85 | |||||||
Total employees (directly-managed, full-time equivalent) | 26,951 | 28,084 | 29,748 | (1,132) | (4) | (1,665) | (6) | |||||||
N/M – Not meaningful
Prior year’s comparatives aligned to presentation in the current year
1Segment assets represent consolidated view, i.e., the amounts do not include intersegment balances.
2The Group defines assets under management as (a) assets held on behalf of customers for investment purposes and/or (b) client assets that are managed by the bank; assets under management are managed on a discretionary or advisory basis, or these assets are deposited with the bank; deposits are considered assets under management if they serve investment purposes; in the Private Bank Germany and Premium Banking, this includes term deposits and savings deposits; in Wealth Management & Bank for Entrepreneurs, it is assumed that all customer deposits are held with the bank primarily for investment purposes.
Asset Management
2022 increase (decrease) | 2021 increase (decrease) | |||||||||||||
in € m. | 2022 | 2021 | 2020 | in € m. | in % | in € m. | in % | |||||||
Net revenues | ||||||||||||||
Management Fees | 2,458 | 2,370 | 2,136 | 88 | 4 | 233 | 11 | |||||||
Performance and transaction fees | 125 | 212 | 90 | (86) | (41) | 122 | 135 | |||||||
Other | 24 | 126 | 3 | (102) | (81) | 123 | N/M | |||||||
Total net revenues | 2,608 | 2,708 | 2,229 | (100) | (4) | 478 | 21 | |||||||
Provision for credit losses | (2) | 5 | 2 | (6) | N/M | 3 | 148 | |||||||
Noninterest expenses | ||||||||||||||
Compensation and benefits | 899 | 822 | 740 | 77 | 9 | 82 | 11 | |||||||
General and administrative expenses | 869 | 840 | 763 | 29 | 3 | 77 | 10 | |||||||
Impairment of goodwill and other intangible assets | 68 | 0 | 0 | 68 | N/M | (0) | N/M | |||||||
Restructuring activities | 0 | 2 | 22 | (2) | (95) | (20) | (92) | |||||||
Total noninterest expenses | 1,836 | 1,664 | 1,526 | 173 | 10 | 138 | 9 | |||||||
Noncontrolling interests | 174 | 223 | 157 | (49) | (22) | 66 | 42 | |||||||
Profit (loss) before tax | 598 | 816 | 544 | (217) | (27) | 272 | 50 | |||||||
Total assets (in € bn.)1 | 10 | 10 | 9 | (0) | (2) | 1 | 10 | |||||||
Assets under management (in € bn.) | 821 | 928 | 793 | (106) | (11) | 135 | 17 | |||||||
Net flows (in € bn.) | (20) | 48 | 30 | (68) | N/M | 17 | N/M | |||||||
Total employees (directly-managed, full-time equivalent) | 4,283 | 4,072 | 3,926 | 211 | 5 | 146 | 4 | |||||||
N/M – Not meaningful
Prior year’s comparatives aligned to presentation in the current year.
1Segment assets represent consolidated view, i.e., the amounts do not include intersegment balances.
274 |
Deutsche Bank | ||
Annual Report 2022 | ||
Capital Release Unit
2022 increase (decrease) | 2021 increase (decrease) | |||||||||||||
in € m. | 2022 | 2021 | 2020 | in € m. | in % | in € m. | in % | |||||||
Net revenues | (28) | 26 | (225) | (54) | N/M | 251 | N/M | |||||||
Provision for credit losses | (17) | (42) | 29 | 25 | (59) | (70) | N/M | |||||||
Noninterest expenses | ||||||||||||||
Compensation and benefits | 60 | 128 | 168 | (68) | (53) | (40) | (24) | |||||||
General and administrative expenses | 864 | 1,306 | 1,774 | (442) | (34) | (468) | (26) | |||||||
Impairment of goodwill and other intangible assets | 0 | 0 | 0 | 0 | N/M | 0 | N/M | |||||||
Restructuring activities | (2) | (2) | 5 | 0 | (21) | (7) | N/M | |||||||
Total noninterest expenses | 922 | 1,432 | 1,947 | (510) | (36) | (515) | (26) | |||||||
Noncontrolling interests | – | 0 | (0) | 0 | N/M | 0 | N/M | |||||||
Profit (loss) before tax | (932) | (1,364) | (2,200) | 431 | (32) | 836 | (38) | |||||||
Total assets (in € bn.)1 | 62 | 132 | 198 | (70) | (53) | (66) | (33) | |||||||
Total employees (directly-managed, full-time equivalent) | 194 | 267 | 472 | (73) | (27) | (205) | (43) | |||||||
N/M – Not meaningful
Prior year’s comparatives aligned to presentation in the current year.
1Segment assets represent consolidated view, i.e., the amounts do not include intersegment balances.
Corporate & Other
| 2022 increase (decrease) | 2021 increase (decrease) | ||||||||||||
in € m. | 2022 | 2021 | 2020 | in € m. | in % | in € m. | in % | |||||||
Net revenues | (877) | (340) | (534) | (537) | 158 | 194 | (36) | |||||||
Provision for credit losses | 8 | 5 | (4) | 3 | 53 | 9 | N/M | |||||||
Noninterest expenses | ||||||||||||||
Compensation and benefits | 3,165 | 3,012 | 3,215 | 153 | 5 | (204) | (6) | |||||||
General and administrative expenses | (2,272) | (2,009) | (2,651) | (263) | 13 | 641 | (24) | |||||||
Impairment of goodwill and other intangible assets | 0 | 0 | 0 | 0 | N/M | 0 | N/M | |||||||
Restructuring activities | 0 | (0) | 3 | 0 | N/M | (3) | N/M | |||||||
Total noninterest expenses | 893 | 1,002 | 568 | (109) | (11) | 435 | 77 | |||||||
Noncontrolling interests | (190) | (206) | (169) | 16 | (8) | (37) | 22 | |||||||
Profit (loss) before tax | (1,589) | (1,142) | (929) | (447) | 39 | (213) | 23 | |||||||
Employees (full-time equivalent) | 31,865 | 30,103 | 29,627 | 1,762 | 6 | 476 | 2 | |||||||
N/M – Not meaningful.
Prior year’s comparatives aligned to presentation in the current year.
275 |
Deutsche Bank | ||
Annual Report 2022 | ||
Entity-wide disclosures
The Group’s entity-wide disclosures include net revenues from internal and external counterparties. Excluding revenues from internal counterparties would require disproportionate IT investment and is not in line with the Bank's management approach. For details of the net revenue components please see “Management Report: Operating and Financial Review: Results of Operations: Corporate Divisions”.
The following table presents total net revenues (before provisions for credit losses) by geographic area for the years ended December 31, 2022, 2021 and 2020 respectively. The information presented for Corporate Bank, Investment Bank, Private Bank, Asset Management and Capital Release Unit has been classified based primarily on the location of the Group’s office in which the revenues are recorded. The information for Corporate & Other is presented on a global level only, as management responsibility for Corporate & Other is held centrally.
in € m. | 2022 | 2021 | 2020 | |||
Germany: | ||||||
Corporate Bank | 3,164 | 2,593 | 2,538 | |||
Investment Bank | 587 | 450 | 431 | |||
Private Bank | 5,878 | 5,481 | 5,456 | |||
Asset Management | 1,266 | 1,385 | 992 | |||
Capital Release Unit | 7 | 4 | 23 | |||
Total Germany | 10,902 | 9,914 | 9,441 | |||
UK: | ||||||
Corporate Bank | 143 | 144 | 110 | |||
Investment Bank | 4,343 | 3,642 | 3,552 | |||
Private Bank | 3 | (2) | 31 | |||
Asset Management | 356 | 336 | 292 | |||
Capital Release Unit | 14 | (122) | (383) | |||
Total UK | 4,858 | 3,997 | 3,602 | |||
Rest of Europe, Middle East and Africa: | ||||||
Corporate Bank | 1,162 | 900 | 934 | |||
Investment Bank | 383 | 255 | 358 | |||
Private Bank | 2,191 | 1,783 | 1,682 | |||
Asset Management | 275 | 286 | 344 | |||
Capital Release Unit | 13 | 26 | 35 | |||
Total Rest of Europe, Middle East and Africa | 4,024 | 3,249 | 3,355 | |||
Americas (primarily United States): | ||||||
Corporate Bank | 974 | 750 | 768 | |||
Investment Bank | 3,033 | 3,904 | 3,285 | |||
Private Bank | 466 | 364 | 362 | |||
Asset Management | 580 | 537 | 465 | |||
Capital Release Unit | (55) | 41 | 50 | |||
Total Americas | 4,998 | 5,596 | 4,929 | |||
Asia/Pacific: | ||||||
Corporate Bank | 892 | 764 | 796 | |||
Investment Bank | 1,671 | 1,381 | 1,660 | |||
Private Bank | 617 | 608 | 594 | |||
Asset Management | 131 | 163 | 136 | |||
Capital Release Unit | (6) | 77 | 49 | |||
Total Asia/Pacific | 3,305 | 2,993 | 3,236 | |||
Corporate & Other | (877) | (339) | (534) | |||
Consolidated net revenues1 | 27,210 | 25,410 | 24,028 | |||
1Consolidated net revenues comprise interest and similar income, interest expenses and total noninterest income (including net commission and fee income); revenues are attributed to countries based on the location in which the Group’s booking office is located; the location of a transaction on the Group’s books is sometimes different from the location of the headquarters or other offices of a customer and different from the location of the Group’s personnel who entered into or facilitated the transaction; where the Group records a transaction involving its staff and customers and other third parties in different locations frequently depends on other considerations, such as the nature of the transaction, regulatory considerations and transaction processing considerations.
276 |
Deutsche Bank | ||
Annual Report 2022 | ||
Notes to the consolidated income statement
05 – Net interest income and net gains (losses) on financial assets/liabilities at fair value through profit or loss
Net interest income
in € m. | 2022 | 2021 | 2020 | |||
Interest and similar income: | ||||||
Interest income on cash and central bank balances | 1,936 | 160 | 321 | |||
Interest income on interbank balances (w/o central banks) | 352 | 67 | 325 | |||
Central bank funds sold and securities purchased under resale agreements | 504 | 273 | 318 | |||
Loans | 14,088 | 10,477 | 11,439 | |||
Other | 1,969 | 1,747 | 896 | |||
Total Interest and similar income from assets measured at amortized cost | 18,849 | 12,724 | 13,298 | |||
Interest income on financial assets at fair value through other comprehensive income | 798 | 501 | 635 | |||
Total interest and similar income calculated using the effective interest method | 19,647 | 13,225 | 13,933 | |||
Financial assets at fair value through profit or loss | 4,652 | 3,374 | 3,873 | |||
Total interest and similar income | 24,299 | 16,599 | 17,806 | |||
Thereof: negative interest expense on financial liabilities | 959 | 1,217 | 636 | |||
Interest expense: | ||||||
Interest-bearing deposits | 3,902 | 1,244 | 1,941 | |||
Central bank funds purchased and securities sold under repurchase agreements | 304 | 148 | 169 | |||
Other short-term borrowings | 111 | 71 | 62 | |||
Long-term debt | 2,409 | 1,484 | 1,612 | |||
Trust preferred securities | 13 | 3 | 42 | |||
Other | 1,119 | 876 | 807 | |||
Total interest expense measured at amortized cost | 7,858 | 3,825 | 4,633 | |||
Financial liabilities at fair value through profit or loss | 2,791 | 1,619 | 1,648 | |||
Total interest expense | 10,649 | 5,444 | 6,280 | |||
Thereof: negative interest income on financial assets | 461 | 786 | 582 | |||
Net interest income | 13,650 | 11,155 | 11,526 | |||
Other interest income for the year ended December 31, 2022, 2021 and 2020 included € 0 million, € 0 million, € 43 million respectively, which were related to government grants under the Targeted Longer-term Refinancing Operations II (TLTRO II)-program.
Impact of ECB Targeted Longer-term Refinancing Operations (TLTRO III program)
The Governing Council of the ECB decided on a number of modifications to the terms and conditions of its TLTRO III-refinancing program in order to support funding of credit to households and firms and the current economic disruption.
The base interest rate under the TLTRO III-refinancing program is the average of the main refinancing operations rate with the exception of the period from June 24, 2020 to June 23, 2022, when a discount of 50 basis points applies (“base rate discount”). The applicable interest rate under the TLTRO III-refinancing program can further reduce by “new lending discounts” that apply if certain net lending thresholds are met. Accordingly, banks whose eligible net lending exceeds 0% between March 1, 2020 and March 31, 2021 pay a rate 0.5% lower than the average deposit facility rate for borrowings between June 24, 2020 and June 23, 2021. The interest rate outside of the period from June 24, 2020 to June 23, 2021 will be the average interest rate on the deposit facility with exception of the period from June 24, 2021 to June 23, 2022 when banks pay a rate 0.5% lower than the average deposit facility rate for borrowings provided their eligible net lending exceeds 0% between October 1, 2020 and December 31, 2021. On October 27, 2022 the ECB announced a change to interest calculation. Accordingly, the existing interest rate calculation equal to the average deposit facility rate ceased on November 22, 2022. From November 23, 2022, interest rate on all remaining TLTRO III operations is indexed on the average applicable key ECB interest rates from that date onward.
The Group considers the initial benefits that arise from borrowing under TLTRO III as government grant from a below-market loan under IAS 20 and recognizes subsequent benefits in accordance IFRS 9. The bank’s accounting policy for government grants is detailed in the “Significant accounting policies and critical accounting estimates” section of this report.
As of December 31, 2022, the Group has borrowed € 33.7 billion (December 31, 2021: € 44.7 billion) under the TLTRO III-refinancing program. The resulting net interest income includes € 211 million for the 12 months ended December 31, 2022 (December 31, 2021: € 494 million) under the TLTRO III program.
277 |
Deutsche Bank | ||
Annual Report 2022 | ||
Net gains (losses) on financial assets/liabilities at fair value through profit or loss
in € m. | 2022 | 2021 | 2020 | |||
Trading income (loss): | ||||||
FIC Sales and Trading | 5,353 | 2,780 | 3,457 | |||
Other trading income (loss) | (2,571) | (921) | (1,228) | |||
Total trading income (loss) | 2,782 | 1,859 | 2,230 | |||
Net gains (losses) on non-trading financial assets mandatory at fair value through profit or loss: | ||||||
Breakdown by financial assets category: | ||||||
Debt Securities | (43 ) | 95 | 5 | |||
Equity Securities | 47 | 812 | 114 | |||
Loans and loan commitments | (5 ) | 18 | (38) | |||
Deposits | 14 | 2 | (9) | |||
Others non-trading financial assets mandatory at fair value through profit and loss | (73 ) | 180 | 203 | |||
Total net gains (losses) on non-trading financial assets mandatory at fair value through profit or loss: | (61) | 1,106 | 276 | |||
Net gains (losses) on financial assets/liabilities designated at fair value through profit or loss: | ||||||
Breakdown by financial asset/liability category: | ||||||
Loans and loan commitments | (2) | 11 | 15 | |||
Deposits | 4 | 5 | (1) | |||
Long-term debt | 265 | 48 | (71) | |||
Other financial assets/liabilities designated at fair value through profit or loss | 11 | 15 | 16 | |||
Total net gains (losses) on financial assets/liabilities designated at fair value through profit or loss | 277 | 79 | (40) | |||
Total net gains (losses) on financial assets/liabilities at fair value through profit or loss | 2,999 | 3,045 | 2,465 | |||
Combined net interest income and net gains (losses) on financial assets/liabilities at fair value through profit or loss
in € m. | 2022 | 2021 | 2020 | |||
Net interest income | 13,650 | 11,155 | 11,526 | |||
Trading income (loss)1 | 2,782 | 1,859 | 2,230 | |||
Net gains (losses) on non-trading financial assets mandatory at fair value through profit or loss | (61) | 1,106 | 276 | |||
Net gains (losses) on financial assets/liabilities designated at fair value through profit or loss | 277 | 79 | (40) | |||
Total net gains (losses) on financial assets/liabilities at fair value through profit or loss | 2,999 | 3,045 | 2,465 | |||
Total net interest income and net gains (losses) on financial assets/liabilities at fair value | 16,649 | 14,200 | 13,991 | |||
Corporate Treasury Services | 2,503 | 1,812 | 2,071 | |||
Institutional Client Services | 572 | 328 | 313 | |||
Business Banking | 645 | 526 | 555 | |||
Corporate Bank | 3,720 | 2,666 | 2,939 | |||
FIC Sales & Trading | 8,697 | 6,917 | 6,991 | |||
Remaining Products | (432) | (26) | 202 | |||
Investment Bank | 8,265 | 6,891 | 7,193 | |||
Private Bank Germany | 4,619 | 3,114 | 2,956 | |||
International Private Bank | 1,993 | 1,733 | 1,693 | |||
Private Bank | 6,612 | 4,847 | 4,648 | |||
Asset Management | (250) | 246 | (98) | |||
Capital Release Unit | (61) | (18) | (33) | |||
Corporate & Other | (1,637) | (432) | (658) | |||
Total net interest income and net gains (losses) on financial assets/liabilities at fair value | 16,649 | 14,200 | 13,991 | |||
1Trading income (loss) includes gains and losses from derivatives not qualifying for hedge accounting.
2Prior year segmental information presented in the current structure.
The Group’s trading and risk management businesses include significant activities in interest rate instruments and related derivatives. Under IFRS, interest and similar income earned from trading instruments and financial instruments designated at fair value through profit or loss (i.e., coupon and dividend income), and the costs of funding net trading positions, are part of net interest income. The Group’s trading activities can periodically shift income to either net interest income or to net gains (losses) of financial assets/liabilities at fair value through profit or loss depending on a variety of factors, including risk management strategies. The above table combines net interest income and net gains (losses) of financial assets/liabilities at fair value through profit or loss by business division.
278 |
Deutsche Bank | ||
Annual Report 2022 | ||
06 – Commissions and fee income
in € m. | 2022 | 2021 | 2020 | |||
Commission and fee income and expense: | ||||||
Commission and fee income | 12,512 | 13,730 | 12,044 | |||
Commission and fee expense | 2,675 | 2,796 | 2,620 | |||
Net commissions and fee income | 9,838 | 10,934 | 9,424 | |||
Disaggregation of revenues by product type and business segment
Dec 31,2022 | ||||||||||||||
in € m. | Corporate | Investment | Private | Asset | Capital | Corporate & | Total | |||||||
Major type of services: | ||||||||||||||
Commissions for administration | 218 | 33 | 254 | 17 | 0 | (3) | 520 | |||||||
Commissions for assets under management | 18 | 1 | 363 | 3,642 | (0) | 0 | 4,024 | |||||||
Commissions for other securities | 512 | (0) | 47 | 0 | 0 | 0 | 559 | |||||||
Underwriting and advisory fees | 35 | 1,373 | 12 | 0 | 0 | (52) | 1,368 | |||||||
Brokerage fees | 19 | 253 | 1,164 | 65 | (1) | 0 | 1,501 | |||||||
Commissions for local payments | 479 | 3 | 1,006 | 0 | 0 | 8 | 1,497 | |||||||
Commissions for foreign commercial business | 466 | 33 | 62 | 0 | 0 | (5) | 556 | |||||||
Commissions for foreign currency/exchange business | 15 | 0 | 5 | 0 | 0 | (0) | 19 | |||||||
Commissions for loan processing and guarantees | 618 | 298 | 292 | 0 | 3 | 2 | 1,213 | |||||||
Intermediary fees | 23 | 2 | 523 | 0 | 0 | 13 | 562 | |||||||
Fees for sundry other customer services | 282 | 277 | 10 | 122 | 3 | 1 | 695 | |||||||
Total fee and commissions income | 2,684 | 2,273 | 3,739 | 3,847 | 6 | (36) | 12,512 | |||||||
Gross expense | (2,675) | |||||||||||||
Net fees and commissions | 9,838 | |||||||||||||
279 |
Deutsche Bank | ||
Annual Report 2022 | ||
| Dec 31,2021 | |||||||||||||
in € m. | Corporate | Investment | Private | Asset | Capital | Corporate & | Total | |||||||
Major type of services: | ||||||||||||||
Commissions for administration | 231 | 27 | 259 | 21 | 4 | (2) | 539 | |||||||
Commissions for assets under management | 16 | 1 | 369 | 3,570 | (0) | 0 | 3,956 | |||||||
Commissions for other securities | 423 | (0) | 43 | 1 | 0 | 0 | 467 | |||||||
Underwriting and advisory fees | 35 | 2,258 | 12 | 0 | (0) | (41) | 2,264 | |||||||
Brokerage fees | 22 | 246 | 1,302 | 96 | 118 | (0) | 1,784 | |||||||
Commissions for local payments | 441 | 4 | 864 | 0 | 0 | 10 | 1,320 | |||||||
Commissions for foreign commercial business | 456 | 23 | 95 | 0 | (0) | (2) | 572 | |||||||
Commissions for foreign currency/exchange business | 11 | 0 | 5 | 0 | 0 | (0) | 16 | |||||||
Commissions for loan processing and guarantees | 564 | 279 | 305 | 0 | 5 | 5 | 1,157 | |||||||
Intermediary fees | 12 | 3 | 617 | 0 | 0 | 11 | 644 | |||||||
Fees for sundry other customer services | 282 | 562 | 40 | 121 | 4 | 2 | 1,011 | |||||||
Total fee and commissions income | 2,494 | 3,403 | 3,910 | 3,809 | 132 | (18) | 13,730 | |||||||
Gross expense | (2,796) | |||||||||||||
Net fees and commissions | 10,934 | |||||||||||||
| Dec 31,2020 | |||||||||||||
in € m. | Corporate | Investment | Private | Asset | Capital | Corporate & | Total | |||||||
Major type of services: | ||||||||||||||
Commissions for administration | 245 | 17 | 235 | 23 | 1 | (3) | 518 | |||||||
Commissions for assets under management | 19 | 1 | 319 | 3,090 | (0) | 0 | 3,429 | |||||||
Commissions for other securities | 365 | 0 | 35 | 0 | 0 | 0 | 401 | |||||||
Underwriting and advisory fees | 29 | 1,688 | 13 | 0 | 1 | (42) | 1,688 | |||||||
Brokerage fees | 21 | 357 | 1,103 | 72 | 113 | (1) | 1,665 | |||||||
Commissions for local payments | 436 | (2) | 951 | (0) | 0 | 8 | 1,394 | |||||||
Commissions for foreign commercial business | 409 | 25 | 104 | 0 | 0 | (3) | 536 | |||||||
Commissions for foreign currency/exchange business | 4 | 0 | 6 | 0 | 0 | (0) | 11 | |||||||
Commissions for loan processing and guarantees | 529 | 210 | 305 | 0 | 7 | 7 | 1,058 | |||||||
Intermediary fees | 9 | 2 | 579 | 1 | 1 | 12 | 604 | |||||||
Fees for sundry other customer services | 276 | 289 | 39 | 131 | 4 | 1 | 741 | |||||||
Total fee and commissions income | 2,344 | 2,588 | 3,689 | 3,317 | 127 | (20) | 12,044 | |||||||
Gross expense | (2,620) | |||||||||||||
Net fees and commissions | 9,424 | |||||||||||||
Fee and commission income and gross expense have been restated by € 182 million for 2020. The reclassifications did not affect net fee and commission income.
Revenue is recognized when performance obligations are satisfied. Performance obligation is satisfied by fund performance exceeding a hurdle rate (an agreed minimum annual return provided to investors). As of 31 December 2022, there were performance obligations to be satisfied of € 267 million with a time band of three years from 2024 to 2026 (as of 31 December 2021, € 244 million with a time band of five years from 2023 to 2027) from alternative funds. The increase of performance obligations to be satisfied was mainly driven by fund valuations and asset sales.
280 |
Deutsche Bank | ||
Annual Report 2022 | ||
As of December 31, 2022, and December 31, 2021, the Group’s balance of receivables from commission and fee income was € 798 million and € 834 million respectively. As of December 31, 2022, and December 31, 2021, the Group’s balance of contract liabilities associated to commission and fee income was € 63 million and € 70 million, respectively. Contract liabilities arise from the Group’s obligation to provide future services to a customer for which it has received consideration from the customer prior to completion of the services. The balances of receivables and contract liabilities do not vary significantly from period to period reflecting the fact that they predominately relate to recurring service contracts with service periods of less than one year such as monthly current account services and quarterly asset management services. As a result, prior period balances of contract liabilities are generally recognized in revenue in the subsequent period. Customer payment in exchange for services provided are generally subject to performance by the Group over the specific service period such that the Group’s right to payment arises at the end of the service period when its performance obligations are fully completed. Therefore, no material balance of contract asset is reported.
07 – Net gains (losses) from derecognition of financial assets measured at amortized cost
For the twelve months ended December 31, 2022, the Group sold financial assets measured at amortized cost of € 473 million (December 31, 2021: € 539 million and December 31, 2020: € 10 billion). The sales in the comparative period 2020 related primarily to a Hold to Collect (HTC) portfolio in Postbank as well as sales made from a HTC portfolio in Treasury. A decision was made to divest the Postbank bond portfolio as part of the integration of Postbank into the Group. The Treasury sales were made as part of a strategy realignment for managing the interest rate risk in the banking book. As a result of these sales, the HTC business model is no longer valid for future acquisitions of assets in this portfolio.
The table below presents the gains and (losses) arising from derecognition of these securities.
in € m. | 2022 | 2021 | 2020 | |||
Gains | 11 | 15 | 344 | |||
Losses | (13) | (15) | (33) | |||
Net gains (losses) from derecognition of financial assets measured at amortized cost | (2) | 1 | 311 | |||
08 – Other income (loss)
in € m. | 2022 | 2021 | 2020 | |||
Other income (loss): | ||||||
Insurance premiums | 3 | 3 | 3 | |||
Net income (loss) from hedge relationships qualifying for hedge accounting | (151) | 124 | (306) | |||
Remaining other income (loss)1 | 937 | (185) | 163 | |||
Total other income (loss) | 789 | (58) | (141) | |||
1Includes net gains (losses) of € 404 million, € 10 million and € (59) million for the years ended December 31, 2022, 2021 and 2020, respectively, that are related to non-current assets and disposal groups held for sale.
09 – General and administrative expenses
in € m. | 2022 | 2021 | 2020 | |||
General and administrative expenses: | ||||||
Information Technology | 3,680 | 4,321 | 3,862 | |||
Occupancy, furniture and equipment expenses | 1,429 | 1,727 | 1,724 | |||
Regulatory, Tax & Insurance1 | 1,285 | 1,395 | 1,407 | |||
Professional services | 858 | 924 | 977 | |||
Banking Services and outsourced operations | 881 | 946 | 967 | |||
Market Data and Research Services | 378 | 347 | 376 | |||
Travel expenses | 110 | 46 | 76 | |||
Marketing expenses | 165 | 178 | 174 | |||
Other expenses2 | 943 | 938 | 697 | |||
Total general and administrative expenses | 9,728 | 10,821 | 10,259 | |||
1Includes bank levy of € 762 million in 2022, € 553 million in 2021 and € 633 million in 2020.
2Includes litigation related expenses of € 413 million in 2022, € 466 million in 2021 and € 158 million in 2020. See Note 27 “Provisions”, for more details on litigation.
281 |
Deutsche Bank | ||
Annual Report 2022 | ||
10 – Restructuring
Restructuring is primarily driven by the implementation of the Group’s strategic changes as announced in the third quarter 2019. The Group has defined and implemented measures that aimed to strengthen the bank, position it for growth and simplify its organizational set-up. The measures also aimed to reduce adjusted costs through higher efficiency, by optimizing and streamlining processes, and by exploiting synergies.
Restructuring expense is comprised of termination benefits, additional expenses covering the acceleration of deferred compensation awards not yet amortized due to the discontinuation of employment and contract termination costs related to real estate.
In 2022, the Group reached a significant milestone in the strategic transformation announced in July 2019, many of the restructuring programs were concluded and the underlying assumptions for the remaining restructuring provisions were reviewed resulting in a partial release of provisions. Overall in 2022, the Group recognized a credit of € 118 million in the Consolidated Statement of Income.
Net restructuring expense by division
in € m. | 2022 | 2021 | 2020 | |||
Corporate Bank | (19) | 42 | 28 | |||
Investment Bank | 15 | 47 | 14 | |||
Private Bank | (113) | 173 | 413 | |||
Asset Management | 0 | 2 | 22 | |||
Capital Release Unit | (2) | (2) | 5 | |||
Corporate & Other | 0 | (0) | 3 | |||
Total Net Restructuring Charges | (118) | 261 | 485 | |||
Net restructuring by type
in € m. | 2022 | 2021 | 2020 | |||
Restructuring – Staff related | (117) | 241 | 479 | |||
thereof: | ||||||
Termination Benefits | (132) | 224 | 441 | |||
Retention Acceleration | 15 | 16 | 36 | |||
Social Security | 0 | 1 | 1 | |||
Restructuring – Non Staff related | (1) | 21 | 6 | |||
Total Net Restructuring Charges | (118) | 261 | 485 | |||
Provisions for restructuring amounted to € 248 million, € 582 million and € 676 million as of December 31, 2022, December 31, 2021 and December 31, 2020, respectively. The majority of the current provisions for restructuring are expected to be utilized in the next year.
During 2022, 903 full-time equivalent staff was reduced through restructuring (2021: 1,362 and 2020: 1,447).
Organizational changes
Full-time equivalent staff | 2022 | 2021 | 2020 | |||
Corporate Bank | 113 | 228 | 303 | |||
Investment Bank | 54 | 149 | 100 | |||
Private Bank | 594 | 776 | 630 | |||
Asset Management | 1 | 10 | 48 | |||
Capital Release Unit | 0 | 13 | 69 | |||
Infrastructure | 141 | 186 | 297 | |||
Total full-time equivalent staff | 903 | 1,362 | 1,447 | |||
282 |
Deutsche Bank | ||
Annual Report 2022 | ||
11 – Earnings per share
Basic earnings per share amounts are computed by dividing net income (loss) attributable to Deutsche Bank shareholders by the average number of common shares outstanding during the year. The average number of common shares outstanding is defined as the average number of common shares issued, reduced by the average number of shares in treasury and by the average number of shares that will be acquired under physically-settled forward purchase contracts, and increased by undistributed vested shares awarded under deferred share plans.
Diluted earnings per share assumes the conversion into common shares of outstanding securities or other contracts to issue common stock, such as share options, convertible debt, unvested deferred share awards and forward contracts. The aforementioned instruments are only included in the calculation of diluted earnings per share if they are dilutive in the respective reporting period.
Computation of basic and diluted earnings per share
in € m. | 2022 | 2021 | 2020 | |||
Net income (loss) attributable to Deutsche Bank shareholders and additional equity components | 5,525 | 2,365 | 495 | |||
Coupons paid on additional equity components | (479) | (363) | (349) | |||
Net income (loss) attributable to Deutsche Bank shareholders – | 5,046 | 2,002 | 146 | |||
Effect of dilutive securities | 0 | 0 | 0 | |||
Net income (loss) attributable to Deutsche Bank shareholders after assumed | 5,046 | 2,002 | 146 | |||
Number of shares in million | ||||||
Weighted-average shares outstanding – denominator for basic earnings per share | 2,084.9 | 2,096.5 | 2,108.2 | |||
Effect of dilutive securities: | ||||||
Forwards | 0.0 | 0.0 | 0.0 | |||
Employee stock compensation options | 0.0 | 0.0 | 0.0 | |||
Deferred shares | 40.7 | 46.6 | 62.0 | |||
Other (including trading options) | 0.0 | 0.0 | 0.0 | |||
Dilutive potential common shares | 0.0 | 0.0 | 0.0 | |||
Adjusted weighted-average shares after assumed conversions – | 2,125.6 | 2,143.2 | 2,170.1 | |||
Earnings per share
in € | 2022 | 2021 | 2020 | |||
Basic earnings per share | 2.42 | 0.96 | 0.07 | |||
Diluted earnings per share | 2.37 | 0.93 | 0.07 | |||
There were no instruments outstanding that could potentially dilute basic earnings per share and are not included in the calculation of diluted earnings per share as of December 31, 2022.
283 |
Deutsche Bank | ||
Annual Report 2022 | ||
Notes to the consolidated balance sheet
12 – Financial assets/liabilities at fair value through profit or loss
in € m. | Dec 31, 2022 | Dec 31, 2021 | ||
Financial assets classified as held for trading: | ||||
Trading assets: | ||||
Trading securities | 84,012 | 92,536 | ||
Other trading assets1 | 8,855 | 9,860 | ||
Total trading assets | 92,867 | 102,396 | ||
Positive market values from derivative financial instruments | 299,686 | 299,732 | ||
Total financial assets classified as held for trading | 392,553 | 402,128 | ||
Non-trading financial assets mandatory at fair value through profit or loss: | ||||
Securities purchased under resale agreements | 63,855 | 59,931 | ||
Securities borrowed | 17,414 | 18,355 | ||
Loans | 1,037 | 895 | ||
Other financial assets mandatory at fair value through profit or loss | 7,348 | 9,784 | ||
Total Non-trading financial assets mandatory at fair value through profit or loss | 89,654 | 88,965 | ||
Financial assets designated at fair value through profit or loss: | ||||
Loans | 168 | 139 | ||
Other financial assets designated at fair value through profit or loss | 0 | 0 | ||
Total financial assets designated at fair value through profit or loss | 168 | 140 | ||
Total financial assets at fair value through profit or loss | 482,376 | 491,233 | ||
1Includes traded loans of € 8.0 billion and € 9.2 billion at December 31, 2022 and 2021 respectively.
in € m. | Dec 31, 2022 | Dec 31, 2021 | ||
Financial liabilities classified as held for trading: | ||||
Trading liabilities: | ||||
Trading securities | 49,860 | 54,235 | ||
Other trading liabilities | 756 | 483 | ||
Total trading liabilities | 50,616 | 54,718 | ||
Negative market values from derivative financial instruments | 282,353 | 287,108 | ||
Total financial liabilities classified as held for trading | 332,969 | 341,827 | ||
Financial liabilities designated at fair value through profit or loss: | ||||
Securities sold under repurchase agreements | 48,517 | 53,364 | ||
Loan commitments | 12 | 7 | ||
Long-term debt | 5,250 | 3,699 | ||
Other financial liabilities designated at fair value through profit or loss | 856 | 1,397 | ||
Total financial liabilities designated at fair value through profit or loss | 54,634 | 58,468 | ||
Investment contract liabilities | 469 | 562 | ||
Total financial liabilities at fair value through profit or loss | 388,072 | 400,857 | ||
Financial assets & liabilities designated at fair value through profit or loss
The Group has designated various lending relationships at fair value through profit or loss. Lending facilities consist of drawn loan assets and undrawn irrevocable loan commitments. The maximum exposure to credit risk on a drawn loan is its fair value. The Group’s maximum exposure to credit risk on drawn loans was € 168 million and € 139 million as of December 31, 2022, and 2021, respectively. Exposure to credit risk also exists for undrawn irrevocable loan commitments and is predominantly counterparty credit risk.
The credit risk on the securities purchased under resale agreements and securities borrowed designated under the fair value option is mitigated by the holding of collateral. The valuation of these instruments takes into account the credit enhancement in the form of the collateral received. As such there is no material movement during the year or cumulatively due to movements in counterparty credit risk on these instruments.
Changes in fair value of financial assets attributable to movements in counterparty credit risk
in € m. | Dec 31, 2022 | Dec 31, 2021 | ||
Notional value of financial assets exposed to credit risk | 168 | 136 | ||
Annual change in the fair value reflected in the Statement of Income | 0 | 1 | ||
Cumulative change in the fair value | 1 | 0 | ||
Notional of credit derivatives used to mitigate credit risk | 90 | 98 | ||
Annual change in the fair value reflected in the Statement of Income | 0 | 0 | ||
Cumulative change in the fair value | 0 | 0 | ||
284 |
Deutsche Bank | ||
Annual Report 2022 | ||
Changes in fair value of financial liabilities attributable to movements in the Group’s credit risk1
in € m. | Dec 31, 2022 | Dec 31, 2021 | ||
Presented in Other comprehensive Income | ||||
Cumulative change in the fair value | 77 | 7 | ||
Presented in Statement of income | ||||
Annual change in the fair value reflected in the Statement of Income | 0 | 0 | ||
Cumulative change in the fair value | 0 | 0 | ||
1The fair value of a financial liability incorporates the credit risk of that financial liability. Changes in the fair value of financial liabilities issued by consolidated structured entities have been excluded as this is not related to the Group’s credit risk but to that of the legally isolated structured entity, which is dependent on the collateral it holds.
Transfers of the cumulative gains or losses within equity during the period
in € m. | Dec 31, 2022 | Dec 31, 2021 | ||
Cumulative gains or losses within equity during the period | 0 | 0 | ||
Amounts realized on derecognition of liabilities designated at fair value through profit or loss
in € m. | Dec 31, 2022 | Dec 31, 2021 | ||
Amount presented in other comprehensive income realized at derecognition | 0 | 0 | ||
The excess of the contractual amount repayable at maturity over the carrying value of financial liabilities1
in € m. | Dec 31, 2022 | Dec 31, 2021 | ||
Including undrawn loan commitments² | 3,308 | 2,943 | ||
Excluding undrawn loan commitments | 892 | 607 | ||
1Assuming the liability is extinguished at the earliest contractual maturity that the Group can be required to repay. When the amount payable is not fixed, it is determined by reference to conditions existing at the reporting date.
2The contractual cash flows at maturity for undrawn loan commitments assume full drawdown of the facility.
285 |
Deutsche Bank | ||
Annual Report 2022 | ||
13 – Financial Instruments carried at Fair Value
Valuation Methods and Control
The Group has an established valuation control framework which governs internal control standards, methodologies, and procedures over the valuation process.
Prices Quoted in Active Markets – The fair value of instruments that are quoted in active markets are determined using the quoted prices where they represent prices at which regularly and recently occurring transactions take place.
Valuation Techniques – The Group uses valuation techniques to establish the fair value of instruments where prices, quoted in active markets, are not available. Valuation techniques used for financial instruments include modelling techniques, the use of indicative quotes for proxy instruments, quotes from recent and less regular transactions and broker quotes.
For some financial instruments a rate or other parameter, rather than a price, is quoted. Where this is the case then the market rate or parameter is used as an input to a valuation model to determine fair value. For some instruments, modelling techniques follow industry standard models, for example, discounted cash flow analysis and standard option pricing models. These models are dependent upon estimated future cash flows, discount factors and volatility levels. For more complex or unique instruments, more sophisticated modelling techniques are required, and may rely upon assumptions or more complex parameters such as correlations, prepayment speeds, default rates and loss severity.
Frequently, valuation models require multiple parameter inputs. Where possible, parameter inputs are based on observable data or are derived from the prices of relevant instruments traded in active markets. Where observable data is not available for parameter inputs, then other market information is considered. For example, indicative broker quotes and consensus pricing information are used to support parameter inputs where they are available. Where no observable information is available to support parameter inputs then they are based on other relevant sources of information such as prices for similar transactions, historic data, economic fundamentals, and research information, with appropriate adjustment to reflect the terms of the actual instrument being valued and current market conditions.
Valuation Adjustments – Valuation adjustments are an integral part of the valuation process. In making appropriate valuation adjustments, the Group follows methodologies that consider factors such as bid-offer spreads, counterparty/own credit and funding risk. Bid-offer spread valuation adjustments are required to adjust mid-market valuations to the appropriate bid or offer valuation. The bid or offer valuation is the best representation of the fair value for an instrument, and therefore its fair value. The carrying value of a long position is adjusted from mid to bid, and the carrying value of a short position is adjusted from mid to offer. Bid-offer valuation adjustments are determined from bid-offer prices observed in relevant trading activity and in quotes from other broker-dealers or other knowledgeable counterparties. Where the quoted price for the instrument is already a bid-offer price then no additional bid-offer valuation adjustment is necessary. Where the fair value of financial instruments is derived from a modelling technique, then the parameter inputs into that model are normally at a mid-market level. Such instruments are generally managed on a portfolio basis and, when specified criteria are met, valuation adjustments are taken to reflect the cost of closing out the net exposure the Bank has to individual market or counterparty risks. These adjustments are determined from bid-offer prices observed in relevant trading activity and quotes from other broker-dealers.
Where complex valuation models are used, or where less-liquid positions are being valued, then bid-offer levels for those positions may not be available directly from the market, and therefore for the close-out cost of these positions, models and parameters must be estimated. When these adjustments are designed, the Group closely examines the valuation risks associated with the model as well as the positions themselves, and the resulting adjustments are closely monitored on an ongoing basis.
Counterparty Credit Valuation Adjustments (CVAs) are required to cover expected credit losses to the extent that the valuation technique does not already include an expected credit loss factor relating to the non-performance risk of the counterparty. The CVA amount is applied to all relevant over-the-counter (OTC) derivatives, and is determined by assessing the potential credit exposure to a given counterparty and taking into account any collateral held, the effect of any relevant netting arrangements, expected loss given default and the probability of default, based on available market information, including Credit Default Swap (CDS) spreads. Where counterparty CDS spreads are not available, relevant proxies are used.
286 |
Deutsche Bank | ||
Annual Report 2022 | ||
The fair value of the Group’s financial liabilities at fair value through profit or loss (i.e., OTC derivative liabilities and issued note liabilities designated at fair value through profit or loss) incorporates valuation adjustments to measure the change in the Group’s own credit risk (i.e. Debt Valuation Adjustments (DVA) for Derivatives and Own Credit Adjustment (OCA) for structured notes). For derivative liabilities the Group considers its own creditworthiness by assessing all counterparties’ expected future exposure to the Group, taking into account any collateral posted by the Group, the effect of relevant netting arrangements, the probability of default of the Group, based on the Group’s market CDS level and the expected loss given default, taking into account the seniority of derivative claims under resolution (statutory subordination). Issued note liabilities are discounted utilizing the spread at which similar instruments would be issued or bought back at the measurement date as this reflects the value from the perspective of a market participant who holds the identical item as an asset. Under IFRS 9 the change in the own credit component is reported under Other Comprehensive Income (OCI).
In the third quarter of 2022, the Group implemented refinements to its methodology for the own credit adjustment calculation. The refinement means all of the spread above the benchmark rate is now regarded as own credit. Previously, the spread was split into a market level of funding component (recognition as a gain or loss in the Group’s Consolidated Statement of Income) and an idiosyncratic own credit component (taken through Other Comprehensive Income). The impact from this change in estimate in the third quarter of 2022 was a loss of € 55 million before tax recognized in the Group’s Consolidated Statement of Income and a corresponding increase in the Group’s Consolidated Statement of Comprehensive Income. The revised approach is expected to result in a more consistent own credit valuation with peer banks.
When determining CVA and DVA, additional adjustments are made where appropriate to achieve fair value, due to the expected loss estimate of a particular arrangement, or where the credit risk being assessed differs in nature to that described by the available CDS instrument.
Funding Valuation Adjustments (FVA) are required to incorporate the market implied funding costs into the fair value of derivative positions. The FVA reflects a discounting spread applied to uncollateralized and partially collateralized derivatives and is determined by assessing the market-implied funding costs on both assets and liabilities.
Where there is uncertainty in the assumptions used within a modelling technique, an additional adjustment is taken to calibrate the model price to the expected market price of the financial instrument. Typically, such transactions have bid-offer levels which are less observable, and these adjustments aim to estimate the bid-offer by computing the liquidity-premium associated with the transaction. Where a financial instrument is of sufficient complexity that the cost of closing it out would be higher than the cost of closing out its component risks, then an additional adjustment is taken to reflect this.
IFRS requires the Group to use the assumptions that market participants would use when pricing the asset or liability. Where relevant, these assumptions may include assumptions about climate change. The Group has not made material adjustment to fair value for climate change beyond that already priced into market inputs.
Valuation Control – The Group has an independent specialized valuation control group within the Risk function which governs and develops the valuation control framework and manages the valuation control processes. The mandate of this specialist function includes the performance of the independent valuation control process for all businesses, the continued development of valuation control methodologies and techniques, as well as devising and governing the formal valuation control policy framework. Special attention of this independent valuation control group is directed to areas where management judgment forms part of the valuation process.
Results of the valuation control process are collected and analyzed as part of a standard monthly reporting cycle. Variances of differences outside of preset and approved tolerance levels are escalated both within the Finance function and with Senior Business Management for review, resolution and, if required, adjustment.
For instruments where fair value is determined from valuation models, the assumptions and techniques used within the models are independently validated by an independent specialist model validation group that is part of the Group’s Risk Management function.
Quotes for transactions and parameter inputs are obtained from a number of third party sources including exchanges, pricing service providers, firm broker quotes and consensus pricing services. Price sources are examined and assessed to determine the quality of fair value information they represent, with greater emphasis given to those possessing greater valuation certainty and relevance. The results are compared against actual transactions in the market to ensure the model valuations are calibrated to market prices.
Price and parameter inputs to models, assumptions and valuation adjustments are verified against independent sources. Where they cannot be verified to independent sources due to lack of observable information, the estimate of fair value is subject to procedures to assess its reasonableness. Such procedures include performing revaluation using independently generated models (including where existing models are independently recalibrated), assessing the valuations against appropriate proxy instruments and other benchmarks, and performing extrapolation techniques. Assessment is made as to whether the valuation techniques produce fair value estimates that are reflective of market levels by calibrating the results of the valuation models against market transactions where possible.
287 |
Deutsche Bank | ||
Annual Report 2022 | ||
Fair Value Hierarchy
The financial instruments carried at fair value have been categorized under the three levels of the IFRS fair value hierarchy as follows:
Level 1 – Instruments valued using quoted prices in active markets are instruments where the fair value can be determined directly from prices which are quoted in active, liquid markets and where the instrument observed in the market is representative of that being priced in the Group’s inventory.
These include: government bonds, exchange-traded derivatives and equity securities traded on active, liquid exchanges.
Level 2 – Instruments valued with valuation techniques using observable market data are instruments where the fair value can be determined by reference to similar instruments trading in active markets, or where a technique is used to derive the valuation but where all inputs to that technique are observable.
These include: many OTC derivatives; many investment-grade listed credit bonds; some CDS; many collateralized debt obligations (CDO); and many less-liquid equities.
Level 3 – Instruments valued using valuation techniques using market data which is not directly observable are instruments where the fair value cannot be determined directly by reference to market-observable information, and some other pricing technique must be employed. Instruments classified in this category have an element which is unobservable and which has a significant impact on the fair value.
These include: more-complex OTC derivatives; distressed debt; highly-structured bonds; illiquid asset-backed securities (ABS); illiquid CDO’s (cash and synthetic); some private equity placements; many commercial real estate (CRE) loans; illiquid loans; and some municipal bonds.
Carrying value of the financial instruments held at fair value1
Dec 31, 2022 | Dec 31, 2021 | |||||||||||
in € m. | Quoted | Valuation | Valuation | Quoted | Valuation | Valuation | ||||||
Financial assets held at fair value: | ||||||||||||
Trading assets | 42,035 | 42,285 | 8,547 | 51,020 | 42,561 | 8,815 | ||||||
Trading securities | 41,826 | 39,133 | 3,053 | 50,814 | 38,108 | 3,614 | ||||||
Other trading assets | 209 | 3,152 | 5,494 | 206 | 4,453 | 5,201 | ||||||
Positive market values from derivative financial instruments | 4,914 | 285,208 | 9,564 | 4,347 | 286,343 | 9,042 | ||||||
Non-trading financial assets mandatory at fair value through profit or loss | 1,605 | 82,259 | 5,790 | 2,764 | 81,304 | 4,896 | ||||||
Financial assets designated at fair value through profit or loss | 0 | 75 | 94 | 0 | 91 | 49 | ||||||
Financial assets at fair value through other comprehensive income | 15,892 | 13,108 | 2,676 | 13,375 | 13,302 | 2,302 | ||||||
Other financial assets at fair value | 1,706 | (294)2 | 5 | 105 | 9222 | 78 | ||||||
Total financial assets held at fair value | 66,153 | 422,640 | 26,675 | 71,611 | 424,524 | 25,182 | ||||||
Financial liabilities held at fair value: | ||||||||||||
Trading liabilities | 43,163 | 7,419 | 34 | 48,364 | 6,272 | 83 | ||||||
Trading securities | 43,162 | 6,667 | 30 | 48,363 | 5,838 | 33 | ||||||
Other trading liabilities | 2 | 752 | 3 | 0 | 434 | 49 | ||||||
Negative market values from derivative financial instruments | 3,256 | 270,596 | 8,500 | 5,208 | 272,120 | 9,781 | ||||||
Financial liabilities designated at fair value through profit or loss | 0 | 51,843 | 2,792 | 0 | 56,728 | 1,740 | ||||||
Investment contract liabilities | 0 | 469 | 0 | 0 | 562 | 0 | ||||||
Other financial liabilities at fair value | 240 | 1,7532 | (511)3 | 5 | 3,0262 | (179)3 | ||||||
Total financial liabilities held at fair value | 46,660 | 332,080 | 10,815 | 53,576 | 338,707 | 11,424 | ||||||
1Amounts in this table are generally presented on a gross basis, in line with the Group’s accounting policy regarding offsetting of financial instruments, as described in Note 1 “Significant Accounting Policies and Critical Accounting Estimates”.
2Predominantly relates to derivatives qualifying for hedge accounting.
3Relates to derivatives which are embedded in contracts where the host contract is held at amortized cost but for which the embedded derivative is separated. The separated embedded derivatives may have a positive or a negative fair value but have been presented in this table to be consistent with the classification of the host contract. The separated embedded derivatives are held at fair value on a recurring basis and have been split between the fair value hierarchy classifications.
Until December 31, 2022 there were transfers from Level 1 to Level 2 on trading securities (€ 1.0 billion of assets), non-trading financial assets mandatory at fair value through profit or loss (€ 770 million of assets) and there were transfers from Level 2 to Level 1 on trading securities (€ 700 million of assets). The assessment of level 1 versus level 2 is based on liquidity testing procedures.
288 |
Deutsche Bank | ||
Annual Report 2022 | ||
Valuation Techniques
The Group has an established valuation control framework which governs internal control standards, methodologies, valuation techniques and procedures over the valuation process and fair value measurement. The global economic and geopolitical environment including the war in Russia continues to be characterized by determined inflation, rising interest rates and volatility in global financial markets, this required additional focus and review in certain areas, including assessment of bid-offer spreads to ensure they were representative of fair value.
The following is an explanation of the valuation techniques used in establishing the fair value of the different types of financial instruments that the Group trades.
Sovereign, Quasi-sovereign and Corporate Debt and Equity Securities – Where there are no recent transactions then fair value may be determined from the last market price adjusted for all changes in risks and information since that date. Where a close proxy instrument is quoted in an active market then fair value is determined by adjusting the proxy value for differences in the risk profile of the instruments. Where close proxies are not available then fair value is estimated using more complex modelling techniques. These techniques include discounted cash flow models using current market rates for credit, interest, liquidity and other risks. For equity securities modeling techniques may also include those based on earnings multiples.
Mortgage- and Other Asset-Backed Securities (MBS/ABS) include residential and commercial MBS and other ABS including CDOs. ABS have specific characteristics as they have different underlying assets and the issuing entities have different capital structures. The complexity increases further where the underlying assets are themselves ABS, as is the case with many of the CDO instruments.
Where no reliable external pricing is available, ABS are valued, where applicable, using either relative value analysis which is performed based on similar transactions observable in the market, or industry-standard valuation models making largest possible use of available observable inputs. The industry standard models calculate principal and interest payments for a given deal based on assumptions that can be independently price tested. The inputs include prepayment speeds, loss assumptions (timing and severity) and a discount rate (spread, yield or discount margin). These inputs/assumptions are derived from actual transactions, external market research and market indices where appropriate.
Loans – For certain loans fair value may be determined from the market price on a recently occurring transaction adjusted for all changes in risks and information since that transaction date. Where there are no recent market transactions then broker quotes, consensus pricing, proxy instruments or discounted cash flow models are used to determine fair value. Discounted cash flow models incorporate parameter inputs for credit risk, interest rate risk, foreign exchange risk, loss given default estimates and amounts utilized given default, as appropriate. Credit risk, loss given default and utilization given default parameters are determined using information from the loan or other credit markets, where available and appropriate.
Leveraged loans can have transaction-specific characteristics which can limit the relevance of market-observed transactions. Where similar transactions exist for which observable quotes are available from external pricing services then this information is used with appropriate adjustments to reflect the transaction differences. When no similar transactions exist, a discounted cash flow valuation technique is used with credit spreads derived from the appropriate leveraged loan index, incorporating the industry classification, subordination of the loan, and any other relevant information on the loan and loan counterparty.
Over-The-Counter Derivative Financial Instruments – Market standard transactions in liquid trading markets, such as interest rate swaps, foreign exchange forward and option contracts in G7 currencies, and equity swap and option contracts on listed securities or indices are valued using market standard models and quoted parameter inputs. Parameter inputs are obtained from pricing services, consensus pricing services and recently occurring transactions in active markets wherever possible.
More complex instruments are modeled using more sophisticated modeling techniques specific for the instrument and are calibrated to available market prices. Where the model output value does not calibrate to a relevant market reference then valuation adjustments are made to the model output value to adjust for any difference. In less active markets, data is obtained from less frequent market transactions, broker quotes and through extrapolation and interpolation techniques. Where observable prices or inputs are not available, management judgment is required to determine fair values by assessing other relevant sources of information such as historical data, fundamental analysis of the economics of the transaction and proxy information from similar transactions.
289 |
Deutsche Bank | ||
Annual Report 2022 | ||
Financial Liabilities Designated at Fair Value through Profit or Loss under the Fair Value Option – The fair value of financial liabilities designated at fair value through profit or loss under the fair value option incorporates all market risk factors including a measure of the Group’s credit risk relevant for that financial liability. The financial liabilities include structured note issuances, structured deposits, and other structured securities issued by consolidated vehicles, which may not be quoted in an active market. The fair value of these financial liabilities is determined by discounting the contractual cash flows using the relevant credit-adjusted yield curve. The market risk parameters are valued consistently to similar instruments held as assets, for example, any derivatives embedded within the structured notes are valued using the same methodology discussed in the “Over-The-Counter Derivative Financial Instruments” section above.
Where the financial liabilities designated at fair value through profit or loss under the fair value option are collateralized, such as securities loaned and securities sold under repurchase agreements, the credit enhancement is factored into the fair valuation of the liability.
Investment Contract Liabilities – Assets which are linked to the investment contract liabilities are owned by the Group. The investment contract obliges the Group to use these assets to settle these liabilities. Therefore, the fair value of investment contract liabilities is determined by the fair value of the underlying assets (i.e., amount payable on surrender of the policies).
Analysis of Financial Instruments with Fair Value Derived from Valuation Techniques Containing Significant Unobservable Parameters (Level 3)
Some of the financial assets and financial liabilities in Level 3 of the fair value hierarchy have identical or similar offsetting exposures to the unobservable input. However, according to IFRS they are required to be presented gross.
Trading Securities – Certain illiquid emerging market corporate bonds and illiquid highly structured corporate bonds are included in this level of the hierarchy. In addition, some of the holdings of notes issued by securitization entities, commercial and residential MBS, collateralized debt obligation securities and other ABS are reported here. The decrease in the period is mainly due to sales, settlements, losses and transfers between Level 2 and Level 3 due to changes in the observability of input parameters used to value these instruments, partially offset by purchases and issuances.
Positive and Negative Market Values from Derivative Instruments categorized in this level of the fair value hierarchy are valued based on one or more significant unobservable parameters. The unobservable parameters may include certain correlations, certain longer-term volatilities, certain prepayment rates, credit spreads and other transaction-specific parameters.
Level 3 derivatives include certain options where the volatility is unobservable; certain basket options in which the correlations between the referenced underlying assets are unobservable; longer-term interest rate option derivatives; multi-currency foreign exchange derivatives; and certain credit default swaps for which the credit spread is not observable.
The increase in assets during the period are driven by transfers between Level 2 and Level 3 due to changes in the observability of input parameters used to value these instruments, partially offset by settlements and losses. The decrease in liabilities during the period are driven by settlements and losses partially offset by transfers between Level 2 and Level 3 due to changes in the observability of input parameters used to value these instruments.
Other Trading Instruments classified in Level 3 of the fair value hierarchy mainly consist of traded loans valued using valuation models based on one or more significant unobservable parameters. Level 3 loans comprise illiquid leveraged loans and illiquid residential and commercial mortgage loans. The increase in the period refers to purchases, issuances and transfers between Level 2 and Level 3 due to changes in the observability of input parameters used to value these instruments partially offset by sales, settlements and losses.
Non-trading financial assets mandatory at fair value through profit or loss classified in Level 3 of fair value hierarchy consist of any non-trading financial asset that does not fall into the Hold to Collect nor Hold to Collect and Sell business models. This includes predominately reverse repurchase agreements which are managed on a fair value basis. Additionally, any financial asset that falls into the Hold to Collect or Hold to Collect and Sell business models for which the contractual cash flow characteristics are not SPPI. The increase in the period is driven by gains, issuances, purchases sales and transfers between Level 2 and Level 3 due to changes in the observability of input parameters used to value these instruments, partially offset by settlements and sales.
Financial Assets/Liabilities designated at Fair Value through Profit or Loss – Certain corporate loans and structured liabilities which were designated at fair value through profit or loss under the fair value option were categorized in this level of the fair value hierarchy. The corporate loans are valued using valuation techniques which incorporate observable credit spreads, recovery rates and unobservable utilization parameters. Revolving loan facilities are reported in the third level of the hierarchy because the utilization in the event of the default parameter is significant and unobservable.
290 |
Deutsche Bank | ||
Annual Report 2022 | ||
In addition, certain hybrid debt issuances designated at fair value through profit or loss containing embedded derivatives are valued based on significant unobservable parameters. These unobservable parameters include single stock volatility correlations. The increase in assets during the period is driven by transfers between Level 2 and Level 3 due to changes in the observability of input parameters used to value these instruments and gains, partially offset by settlements. The increase in liabilities during the period is driven by issuances and transfers between Level 2 and Level 3 due to changes in the observability of input parameters used to value these instruments, partially offset by settlements and gains.
Financial assets at fair value through other comprehensive income include non-performing loan portfolios where there is no trading intent and the market is very illiquid. The increase in the period is driven by purchases, issuances and transfers between Level 2 and Level 3 due to changes in the observability of input parameters used to value these instruments, partially offset by sales, settlements and losses.
Reconciliation of financial instruments classified in Level 3
Reconciliation of financial instruments classified in Level 3
Dec 31, 2022 | ||||||||||||||||||||
in € m. | Balance, | Changes | Total | Purchases | Sales | Issu- | Settle- | Transfers | Transfers | Balance, | ||||||||||
Financial assets held at | ||||||||||||||||||||
Trading securities | 3,614 | 0 | (380) | 2,226 | (1,974) | 80 | (344) | 606 | (776) | 3,053 | ||||||||||
Positive market values | 9,042 | 0 | (4,755) | 0 | 0 | 0 | (423) | 8,011 | (2,310) | 9,564 | ||||||||||
Other trading assets | 5,201 | (0) | (178) | 748 | (1,945) | 2,998 | (1,419) | 875 | (785) | 5,494 | ||||||||||
Non-trading financial assets mandatory at fair value through profit or loss | 4,896 | (0) | 332 | 652 | (142) | 1,373 | (1,430) | 702 | (593) | 5,790 | ||||||||||
Financial assets designated at fair value through profit or loss | 49 | 0 | 2 | 0 | 0 | 0 | (45) | 88 | 0 | 94 | ||||||||||
Financial assets at fair value through other comprehensive income | 2,302 | 0 | (107)5 | 79 | (338) | 977 | (752) | 549 | (36) | 2,676 | ||||||||||
Other financial assets at | 78 | 0 | 0 | 0 | 0 | 0 | 0 | 0 | (74) | 5 | ||||||||||
Total financial assets held | 25,182 | (0) | (5,087)6,7 | 3,706 | (4,399) | 5,428 | (4,413) | 10,831 | (4,573) | 26,675 | ||||||||||
Financial liabilities held | ||||||||||||||||||||
Trading securities | 33 | 0 | (3) | 0 | 0 | 0 | (0) | 0 | 0 | 30 | ||||||||||
Negative market values | 9,781 | 0 | (3,256) | 0 | 0 | 0 | (633) | 4,454 | (1,845) | 8,500 | ||||||||||
Other trading liabilities | 49 | 0 | (51) | 0 | 0 | 0 | 5 | 0 | 0 | 3 | ||||||||||
Financial liabilities | 1,740 | 0 | (55) | 0 | 0 | 1,140 | (202) | 178 | (10) | 2,792 | ||||||||||
Other financial liabilities | (179) | 0 | (380) | 0 | 0 | 0 | 64 | 16 | (31) | (511) | ||||||||||
Total financial liabilities | 11,424 | 0 | (3,746)6,7 | 0 | 0 | 1,140 | (766) | 4,649 | (1,887) | 10,815 | ||||||||||
1Total gains and losses predominantly relate to net gains (losses) on financial assets/liabilities at fair value through profit or loss reported in the consolidated statement of income. The balance also includes net gains (losses) on financial assets at fair value through other comprehensive income reported in the consolidated statement of income and unrealized net gains (losses) on financial assets at fair value through other comprehensive income and exchange rate changes reported in other comprehensive income, net of tax. Further, certain instruments are hedged with instruments in level 1 or level 2 but the table above does not include the gains and losses on these hedging instruments. Additionally, both observable and unobservable parameters may be used to determine the fair value of an instrument classified within level 3 of the fair value hierarchy; the gains and losses presented below are attributable to movements in both the observable and unobservable parameters.
2Issuances relate to the cash amount received on the issuance of a liability and the cash amount paid on the primary issuance of a loan to a borrower.
3Settlements represent cash flows to settle the asset or liability. For debt and loan instruments this includes principal on maturity, principal amortizations and principal repayments. For derivatives all cash flows are presented in settlements.
4Transfers in and transfers out of Level 3 are related to changes in observability of input parameters. During the year they are recorded at their fair value at the beginning of year. For instruments transferred into Level 3 the table shows the gains and losses and cash flows on the instruments as if they had been transferred at the beginning of the year. Similarly, for instruments transferred out of Level 3 the table does not show any gains or losses or cash flows on the instruments during the year since the table is presented as if they have been transferred out at the beginning of the year.
5Total gains and losses on financial assets at fair value through other comprehensive income include a loss of € 189 million recognized in other comprehensive income, net of tax and a loss of € 2 million recognized in the income statement presented in net gains (losses).
6This amount includes the effect of exchange rate changes. For total financial assets held at fair value this effect is a gain of € 425 million and for total financial liabilities held at fair value this is a loss of € 35 million.
7For assets positive balances represent gains, negative balances represent losses. For liabilities positive balances represent losses, negative balances represent gains.
291 |
Deutsche Bank | ||
Annual Report 2022 | ||
Dec 31, 2021 | ||||||||||||||||||||
in € m. | Balance, | Changes | Total | Purchases | Sales | Issu- | Settle- | Transfers | Transfers | Balance, | ||||||||||
Financial assets held at | ||||||||||||||||||||
Trading securities | 3,066 | (2) | (263) | 3,183 | (2,445) | 0 | (106) | 766 | (585) | 3,614 | ||||||||||
Positive market values | 8,725 | 0 | 890 | 0 | 0 | 0 | (727) | 2,938 | (2,783) | 9,042 | ||||||||||
Other trading assets | 5,117 | 0 | 237 | 500 | (2,194) | 2,868 | (1,635) | 714 | (406) | 5,201 | ||||||||||
Non-trading financial assets mandatory at fair value through profit or loss | 4,618 | 0 | 425 | 493 | (288) | 243 | (733) | 1,064 | (926) | 4,896 | ||||||||||
Financial assets designated at fair value through profit or loss | 0 | 0 | (0) | 0 | 0 | 48 | 0 | 0 | 0 | 49 | ||||||||||
Financial assets at fair value through other comprehensive income | 2,037 | 0 | 615 | 53 | (150) | 662 | (560) | 350 | (150) | 2,302 | ||||||||||
Other financial assets at | 20 | 0 | 2 | 0 | 0 | 0 | (17) | 0 | 74 | 78 | ||||||||||
Total financial assets held | 23,583 | (2) | 1,3516,7 | 4,229 | (5,076) | 3,821 | (3,777) | 5,831 | (4,777) | 25,182 | ||||||||||
Financial liabilities held at | ||||||||||||||||||||
Trading securities | 2 | 0 | 0 | 0 | 0 | 0 | (0) | 33 | (2) | 33 | ||||||||||
Negative market values | 8,200 | 0 | 509 | 0 | 0 | 0 | (367) | 3,059 | (1,620) | 9,781 | ||||||||||
Other trading liabilities | 0 | 0 | (15) | 0 | 0 | 0 | 0 | 64 | 0 | 49 | ||||||||||
Financial liabilities | 960 | 0 | 158 | 0 | 0 | 9928 | (314) | 198 | (112) | 1,740 | ||||||||||
Other financial liabilities | (294) | 0 | (12) | 0 | 0 | 0 | 33 | 13 | 81 | (179) | ||||||||||
Total financial liabilities | 8,867 | 0 | 4986,7,8 | 0 | 0 | 9928 | (647) | 3,367 | (1,652) | 11,424 | ||||||||||
1Total gains and losses predominantly relate to net gains (losses) on financial assets/liabilities at fair value through profit or loss reported in the consolidated statement of income. The balance also includes net gains (losses) on financial assets at fair value through other comprehensive income reported in the consolidated statement of income and unrealized net gains (losses) on financial assets at fair value through other comprehensive income and exchange rate changes reported in other comprehensive income, net of tax. Further, certain instruments are hedged with instruments in level 1 or level 2 but the table above does not include the gains and losses on these hedging instruments. Additionally, both observable and unobservable parameters may be used to determine the fair value of an instrument classified within level 3 of the fair value hierarchy; the gains and losses presented below are attributable to movements in both the observable and unobservable parameters.
2Issuances relate to the cash amount received on the issuance of a liability and the cash amount paid on the primary issuance of a loan to a borrower.
3Settlements represent cash flows to settle the asset or liability. For debt and loan instruments this includes principal on maturity, principal amortizations and principal repayments. For derivatives all cash flows are presented in settlements.
4Transfers in and transfers out of Level 3 are related to changes in observability of input parameters. During the year they are recorded at their fair value at the beginning of year. For instruments transferred into Level 3 the table shows the gains and losses and cash flows on the instruments as if they had been transferred at the beginning of the year. Similarly, for instruments transferred out of Level 3 the table does not show any gains or losses or cash flows on the instruments during the year since the table is presented as if they have been transferred out at the beginning of the year.
5Total gains and losses on financial assets at fair value through other comprehensive income include a loss of € 13 million recognized in other comprehensive income, net of tax.
6This amount includes the effect of exchange rate changes. For total financial assets held at fair value this effect is a gain of € 447 million and for total financial liabilities held at fair value this is a loss of € 44 million.
7For assets positive balances represent gains, negative balances represent losses. For liabilities positive balances represent losses, negative balances represent gains.
8Prior year’s comparatives aligned to presentation in the current year.
Sensitivity Analysis of Unobservable Parameters
Where the value of financial instruments is dependent on unobservable parameter inputs, the precise level for these parameters at the balance sheet date might be drawn from a range of reasonably possible alternatives. In preparing the financial statements, appropriate levels for these unobservable input parameters are chosen so that they are consistent with prevailing market evidence and in line with the Group’s approach to valuation control detailed above.
Where the Group to have marked the financial instruments concerned using parameter values drawn from the extremes of the ranges of reasonably possible alternatives, as of December 31, 2022 it could have increased fair value by as much as € 2.0 billion or decreased fair value by as much as € 1.4 billion. As of December 31, 2021 it could have increased fair value by as much as € 1.7 billion or decreased fair value by as much as € 1.2 billion.
The changes in sensitive amounts from December 31, 2021 to December 31, 2022 were an increase in positive fair value movement of € 220 million, and an increase in negative fair value movement of € 142 million.
292 |
Deutsche Bank | ||
Annual Report 2022 | ||
The increase in positive and negative fair value movements are largely in line with the increase in Group Level 3 in the period, with Level 3 assets increasing from € 25.2 billion at December 31 2021 to € 26.7 billion at December 31 2022 and Group Level 3 liabilities decreasing from € 11.4 billion at December 31 2021 to € 10.8 billion at December 31 2022. These moves represent a percentage increase in gross Level 3 assets and liabilities of approximately 3%.
The change in positive fair value movements from December 31, 2021 to December 31, 2022 represents an 13% increase and the change in negative fair value movements represents an 12% increase. Both the upside and the downside increases are proportionally larger than the 3% increase in Group Level 3, due to increased volatility in the wider macro-economic environment, predominantly relating to interest rates and inflation.
The Group’s sensitivity calculation of unobservable parameters for Level 3 aligns to the approach used to assess valuation uncertainty for Prudent Valuation purposes. Prudent Valuation is a capital requirement for assets held at fair value. It provides a mechanism for quantifying and capitalizing valuation uncertainty in accordance with the European Commission Delegated Regulation (EU) 2016/101, which supplements Article 34 of Regulation (EU) No. 2019/876 (CRR), requiring institutions to apply as a deduction from CET 1 for the amount of any additional valuation adjustments on all assets measured at fair value calculated in accordance with Article 105 (14). This utilizes exit price analysis performed for the relevant assets and liabilities in the Prudent Valuation assessment. The downside sensitivity may be limited in some cases where the fair value is already demonstrably prudent.
This disclosure is intended to illustrate the potential impact of the relative uncertainty in the fair value of financial instruments for which valuation is dependent on unobservable input parameters. However, it is unlikely in practice that all unobservable parameters would be simultaneously at the extremes of their ranges of reasonably possible alternatives. Hence, the estimates disclosed above are likely to be greater than the true uncertainty in fair value at the balance sheet date. Furthermore, the disclosure is neither predictive nor indicative of future movements in fair value.
For many of the financial instruments considered here, in particular derivatives, unobservable input parameters represent only a subset of the parameters required to price the financial instrument, the remainder being observable. Hence for these instruments the overall impact of moving the unobservable input parameters to the extremes of their ranges might be relatively small compared with the total fair value of the financial instrument. For other instruments, fair value is determined based on the price of the entire instrument, for example, by adjusting the fair value of a reasonable proxy instrument. In addition, all financial instruments are already carried at fair values which are inclusive of valuation adjustments for the cost to close out that instrument and hence already factor in uncertainty as it reflects itself in market pricing. Any negative impact of uncertainty calculated within this disclosure, then, will be over and above that already included in the fair value contained in the financial statements.
Breakdown of the sensitivity analysis by type of instrument1
Dec 31, 2022 | Dec 31, 2021 | |||||||
in € m. | Positive fair value | Negative fair value | Positive fair value | Negative fair value | ||||
Securities: | ||||||||
Debt securities | 239 | 274 | 267 | 256 | ||||
Commercial mortgage-backed securities | 15 | 20 | 18 | 15 | ||||
Mortgage and other asset-backed securities | 20 | 26 | 13 | 9 | ||||
Corporate, sovereign and other debt securities | 204 | 228 | 236 | 233 | ||||
Equity securities | 114 | 80 | 94 | 65 | ||||
Derivatives: | ||||||||
Credit | 218 | 125 | 163 | 109 | ||||
Equity | 70 | 63 | 105 | 100 | ||||
Interest related | 605 | 217 | 409 | 232 | ||||
Foreign Exchange | 37 | 30 | 34 | 31 | ||||
Other | 59 | 110 | 98 | 82 | ||||
Loans: | ||||||||
Loans | 618 | 459 | 570 | 340 | ||||
Other | 0 | 0 | 0 | 0 | ||||
Total | 1,959 | 1,357 | 1,739 | 1,215 | ||||
1Where the exposure to an unobservable parameter is offset across different instruments then only the net impact is disclosed in the table.
293 |
Deutsche Bank | ||
Annual Report 2022 | ||
Quantitative Information about the Sensitivity of Significant Unobservable Inputs
The behavior of the unobservable parameters on Level 3 fair value measurement is not necessarily independent, and dynamic relationships often exist between the other unobservable parameters and the observable parameters. Such relationships, where material to the fair value of a given instrument, are explicitly captured via correlation parameters, or are otherwise controlled via pricing models or valuation techniques. Frequently, where a valuation technique utilizes more than one input, the choice of a certain input will bound the range of possible values for other inputs. In addition, broader market factors (such as interest rates, equity, credit or commodity indices or foreign exchange rates) can also have effects.
The range of values shown below represents the highest and lowest inputs used to value the significant exposures within Level 3. The diversity of financial instruments that make up the disclosure is significant and therefore the ranges of certain parameters can be large. For example, the range of credit spreads on mortgage backed securities represents performing, more liquid positions with lower spreads than the less liquid, non-performing positions which will have higher credit spreads. As Level 3 contains the less liquid fair value instruments, the wide ranges of parameters seen is to be expected, as there is a high degree of pricing differentiation within each exposure type to capture the relevant market dynamics. There follows a brief description of each of the principal parameter types, along with a commentary on significant interrelationships between them.
Credit Parameters are used to assess the creditworthiness of an exposure, by enabling the probability of default and resulting losses of a default to be represented. The credit spread is the primary reflection of creditworthiness and represents the premium or yield return above the benchmark reference instrument (typically LIBOR, or relevant Treasury Instrument, depending upon the asset being assessed), that a bond holder would require to allow for the credit quality difference between that entity and the reference benchmark. Higher credit spreads will indicate lower credit quality, and lead to a lower value for a given bond, or other loan-asset that is to be repaid to the Bank by the borrower. Recovery Rates represent an estimate of the amount a lender would receive in the case of a default of a loan, or a bond holder would receive in the case of default of the bond. Higher recovery rates will give a higher valuation for a given bond position, if other parameters are held constant. Constant Default Rate and Constant Prepayment Rate allow more complex loan and debt assets to be assessed, as these parameters estimate the ongoing defaults arising on scheduled repayments and coupons, or whether the borrower is making additional (usually voluntary) prepayments. These parameters are particularly relevant when forming a fair value opinion for mortgage or other types of lending, where repayments are delivered by the borrower through time, or where the borrower may pre-pay the loan (seen for example in some residential mortgages). Higher Constant Default Rate will lead to lower valuation of a given loan or mortgage as the lender will ultimately receive less cash.
Interest rates, credit spreads, inflation rates, foreign exchange rates and equity prices are referenced in some option instruments, or other complex derivatives, where the payoff a holder of the derivative will receive is dependent upon the behavior of these underlying references through time. Volatility parameters describe key attributes of option behavior by enabling the variability of returns of the underlying instrument to be assessed. This volatility is a measure of probability, with higher volatilities denoting higher probabilities of a particular outcome occurring. The underlying references (interest rates, credit spreads etc.) have an effect on the valuation of options, by describing the size of the return that can be expected from the option. Therefore the value of a given option is dependent upon the value of the underlying instrument, and the volatility of that instrument, representing the size of the payoff, and the probability of that payoff occurring. Where volatilities are high, the option holder will see a higher option value as there is greater probability of positive returns. A higher option value will also occur where the payoff described by the option is significant.
Correlations are used to describe influential relationships between underlying references where a derivative or other instrument has more than one underlying reference. Behind some of these relationships, for example commodity correlation and interest rate-foreign exchange correlations, typically lie macroeconomic factors such as the impact of global demand on groups of commodities, or the pricing parity effect of interest rates on foreign exchange rates. More specific relationships can exist between credit references or equity stocks in the case of credit derivatives and equity basket derivatives, for example. Credit correlations are used to estimate the relationship between the credit performance of a range of credit names, and stock correlations are used to estimate the relationship between the returns of a range of equities. A derivative with a correlation exposure will be either long- or short-correlation. A high correlation suggests a strong relationship between the underlying references is in force, and this will lead to an increase in value of a long-correlation derivative. Negative correlations suggest that the relationship between underlying references is opposing, i.e., an increase in price of one underlying reference will lead to a reduction in the price of the other.
An EBITDA (‘earnings before interest, tax, depreciation and amortization’) multiple approach can be used in the valuation of less liquid securities. Under this approach the enterprise value (‘EV’) of an entity can be estimated via identifying the ratio of the EV to EBITDA of a comparable observable entity and applying this ratio to the EBITDA of the entity for which a valuation is being estimated. Under this approach a liquidity adjustment is often applied due to the difference in liquidity between the generally listed comparable used and the company under valuation. A higher EV/EBITDA multiple will result in a higher fair value.
294 |
Deutsche Bank | ||
Annual Report 2022 | ||
Financial instruments classified in Level 3 and quantitative information about unobservable inputs
Dec 31, 2022 | ||||||||||||
Fair value | ||||||||||||
in € m. | Assets | Liabilities | Valuation technique(s)¹ | Significant unobservable | Range | |||||||
Financial instruments held at fair value – | ||||||||||||
Mortgage and other asset backed | ||||||||||||
Commercial mortgage-backed | 22 | 0 | Price based | Price | 0% | 100% | ||||||
Discounted cash flow | Credit spread (bps) | 182 | 1,720 | |||||||||
Mortgage- and other asset-backed | 128 | 0 | Price based | Price | 0% | 99% | ||||||
Discounted cash flow | Credit spread (bps) | 169 | 2,672 | |||||||||
Recovery rate | 16% | 95% | ||||||||||
Constant default rate | 0% | 16% | ||||||||||
Constant prepayment rate | 3% | 29% | ||||||||||
Total mortgage- and other asset-backed | 151 | 0 | ||||||||||
Debt securities and other | 4,720 | 2,625 | Price based | Price | 0% | 181% | ||||||
Held for trading | 2,741 | 30 | Discounted cash flow | Credit spread (bps) | 62 | 1,369 | ||||||
Corporate, sovereign and | 2,741 | |||||||||||
Non-trading financial assets mandatory at fair value through profit or loss | 1,844 | |||||||||||
Designated at fair value through profit or loss | 0 | 2,594 | ||||||||||
Financial assets at fair value through other comprehensive income | 135 | |||||||||||
Equity securities | 787 | 0 | Market approach | Price per net asset value | 0% | 100% | ||||||
Held for trading | 161 | 0 | Enterprise value/EBITDA | 5 | 13 | |||||||
Non-trading financial assets mandatory at fair value through profit or loss | 626 | Discounted cash flow | Weighted average cost capital | 8% | 20% | |||||||
Designated at fair value through profit or loss | 0 | Price based | Price | 0% | 150% | |||||||
Loans | 8,819 | 3 | Price based | Price | 0% | 122% | ||||||
Held for trading | 5,298 | 3 | Discounted cash flow | Credit spread (bps) | 133 | 1,520 | ||||||
Non-trading financial assets mandatory at fair value through profit or loss | 925 | |||||||||||
Designated at fair value through profit or loss | 94 | 0 | Recovery rate | 40% | 75% | |||||||
Financial assets at fair value through other comprehensive income | 2,502 | |||||||||||
Loan commitments | 0 | 12 | Discounted cash flow | Credit spread (bps) | 94 | 925 | ||||||
Recovery rate | 35% | 76% | ||||||||||
Loan pricing model | Utilization | 0% | 100% | |||||||||
Other financial instruments | 2,6292 | 1863 | Discounted cash flow | IRR | 7% | 13% | ||||||
Repo rate (bps) | 2 | 525 | ||||||||||
Total non-derivative financial | 17,106 | 2,825 | ||||||||||
1Valuation technique(s) and subsequently the significant unobservable input(s) relate to the respective total position.
2Other financial assets include € 196 million of other trading assets, € 2.4 billion of other non-trading financial assets mandatory at fair value, and € 38 million other financial assets at fair value through other comprehensive income.
3Other financial liabilities include € 141 million of securities sold under repurchase agreements designated at fair value and € 45 million other financial liabilities designated at fair value.
295 |
Deutsche Bank | ||
Annual Report 2022 | ||
Dec 31, 2022 | ||||||||||||
Fair value | ||||||||||||
in € m. | Assets | Liabilities | Valuation technique(s) | Significant unobservable | Range | |||||||
Financial instruments held at fair value: | ||||||||||||
Market values from derivative | ||||||||||||
Interest rate derivatives | 6,360 | 4,546 | Discounted cash flow | Swap rate (bps) | (1,748) | 1,301 | ||||||
Inflation swap rate | (1)% | 14% | ||||||||||
Constant default rate | 0% | 15% | ||||||||||
Constant prepayment rate | 0% | 19% | ||||||||||
Option pricing model | Inflation volatility | 1% | 6% | |||||||||
Interest rate volatility | 0% | 43% | ||||||||||
IR - IR correlation | (1)% | 99% | ||||||||||
Hybrid correlation | (90)% | 90% | ||||||||||
Credit derivatives | 577 | 517 | Discounted cash flow | Credit spread (bps) | 1 | 4,885 | ||||||
Recovery rate | 0% | 40% | ||||||||||
Correlation pricing | Credit correlation | 25% | 69% | |||||||||
Equity derivatives | 452 | 1,155 | Option pricing model | Stock volatility | 0% | 75% | ||||||
Index volatility | 13% | 30% | ||||||||||
Index - index correlation | 88% | 96% | ||||||||||
Stock - stock correlation | 0% | 0% | ||||||||||
Stock Forwards | 1% | 11% | ||||||||||
Index Forwards | 0% | 6% | ||||||||||
FX derivatives | 1,646 | 1,976 | Option pricing model | Volatility | (12)% | 48% | ||||||
Quoted Vol | 0% | 0% | ||||||||||
Discounted cash flow | Swap rate (bps) | (6) | 46 | |||||||||
Other derivatives | 534 | (205)1 | Discounted cash flow | Credit spread (bps) | – | – | ||||||
Option pricing model | Index volatility | 0% | 91% | |||||||||
Commodity correlation | 0% | 85% | ||||||||||
Total market values from derivative | 9,569 | 7,989 | ||||||||||
1Includes derivatives which are embedded in contracts where the host contract is held at amortized cost but for which the embedded derivative is separated.
296 |
Deutsche Bank | ||
Annual Report 2022 | ||
| Dec 31, 2021 | |||||||||||
Fair value | ||||||||||||
in € m. | Assets | Liabilities | Valuation technique(s)¹ | Significant unobservable | Range | |||||||
Financial instruments held at fair value – | ||||||||||||
Mortgage and other asset backed | ||||||||||||
Commercial mortgage-backed | 47 | 0 | Price based | Price | 0% | 114% | ||||||
Discounted cash flow | Credit spread (bps) | 81 | 1,235 | |||||||||
Mortgage- and other asset-backed | 81 | 0 | Price based | Price | 0% | 112% | ||||||
Discounted cash flow | Credit spread (bps) | 85 | 1,495 | |||||||||
Recovery rate | 0% | 85% | ||||||||||
Constant default rate | 0% | 2% | ||||||||||
Constant prepayment rate | 0% | 27% | ||||||||||
Total mortgage- and other asset-backed | 128 | 0 | ||||||||||
Debt securities and other debt | 5,074 | 1,654 | Price based | Price | 0% | 212% | ||||||
Held for trading | 3,383 | 33 | Discounted cash flow | Credit spread (bps) | 12 | 571 | ||||||
Corporate, sovereign and other | 3,383 | |||||||||||
Non-trading financial assets mandatory at fair value through profit or loss | 1,568 | |||||||||||
Designated at fair value through profit or loss | 0 | 1,621 | ||||||||||
Financial assets at fair value through other comprehensive income | 123 | |||||||||||
Equity securities | 660 | 0 | Market approach | Price per net asset value | 0% | 101% | ||||||
Held for trading | 103 | 0 | Enterprise value/EBITDA | 5 | 17 | |||||||
Non-trading financial assets mandatory at fair value through profit or loss | 557 | Discounted cash flow | Weighted average cost capital | 6% | 20% | |||||||
Designated at fair value through profit or loss | 0 | Price based | Price | 0% | 139% | |||||||
Loans | 8,184 | 49 | Price based | Price | 0% | 275% | ||||||
Held for trading | 5,188 | 49 | Discounted cash flow | Credit spread (bps) | 34 | 2,117 | ||||||
Non-trading financial assets mandatory at fair value through profit or loss | 769 | |||||||||||
Designated at fair value through profit or loss | 48 | 0 | Recovery rate | 40% | 85% | |||||||
Financial assets at fair value through other comprehensive income | 2,179 | |||||||||||
Loan commitments | 0 | 7 | Discounted cash flow | Credit spread (bps) | 128 | 906 | ||||||
Recovery rate | 40% | 75% | ||||||||||
Loan pricing model | Utilization | 0% | 100% | |||||||||
Other financial instruments | 2,0162 | 1123 | Discounted cash flow | IRR | 7% | 16% | ||||||
Repo rate (bps) | (27) | 400 | ||||||||||
Total non-derivative financial | 16,062 | 1,823 | ||||||||||
1Valuation technique(s) and subsequently the significant unobservable input(s) relate to the respective total position.
2Other financial assets include € 13 million of other trading assets and € 2.0 billion other financial assets mandatory at fair value.
3Other financial liabilities include € 112 million of securities sold under repurchase agreements designated at fair value.
297 |
Deutsche Bank | ||
Annual Report 2022 | ||
Dec 31, 2021 | ||||||||||||
Fair value | ||||||||||||
in € m. | Assets | Liabilities | Valuation technique(s) | Significant unobservable | Range | |||||||
Financial instruments held at fair value: | ||||||||||||
Market values from derivative | ||||||||||||
Interest rate derivatives | 4,725 | 4,724 | Discounted cash flow | Swap rate (bps) | (80) | 817 | ||||||
Inflation swap rate | 1% | 5% | ||||||||||
Constant default rate | 0% | 20% | ||||||||||
Constant prepayment rate | 4% | 24% | ||||||||||
Option pricing model | Inflation volatility | 0% | 9% | |||||||||
Interest rate volatility | 0% | 31% | ||||||||||
IR - IR correlation | (1)% | 99% | ||||||||||
Hybrid correlation | (70)% | 100% | ||||||||||
Credit derivatives | 686 | 827 | Discounted cash flow | Credit spread (bps) | 2 | 6,630 | ||||||
Recovery rate | 0% | 40% | ||||||||||
Correlation pricing | Credit correlation | 30% | 63% | |||||||||
Equity derivatives | 766 | 1,749 | Option pricing model | Stock volatility | 25% | 68% | ||||||
Index volatility | 11% | 80% | ||||||||||
Index - index correlation | 88% | 91% | ||||||||||
Stock - stock correlation | 0% | 0% | ||||||||||
Stock Forwards | 0% | 9% | ||||||||||
Index Forwards | 0% | 5% | ||||||||||
FX derivatives | 1,816 | 1,913 | Option pricing model | Volatility | (33)% | 59% | ||||||
Quoted Vol | 0% | 0% | ||||||||||
Other derivatives | 1,127 | 3881 | Discounted cash flow | Credit spread (bps) | – | – | ||||||
Option pricing model | Index volatility | 0% | 131% | |||||||||
Commodity correlation | 15% | 86% | ||||||||||
Total market values from derivative | 9,120 | 9,601 | ||||||||||
1Includes derivatives which are embedded in contracts where the host contract is held at amortized cost but for which the embedded derivative is separated.
Unrealized Gains or Losses on Level 3 Instruments held or in Issue at the Reporting Date
Instruments classified as Level 3 have an unobservable input which has a significant impact on the fair value of the instrument. However, the other inputs into the instrument may be observable i.e. Level 1 or 2. Therefore unrealized gains or losses on Level 3 Instruments are not due solely to unobservable parameters. Additionally, many of the positions in this level of the hierarchy are economically hedged by instruments which are categorized in Level 1 or 2 of the fair value hierarchy. The offsetting gains and losses that have been recorded on all such hedges are not included in the table below, which only shows the gains and losses related to the Level 3 classified instruments themselves held at the reporting date in accordance with IFRS 13. The unrealized gains and losses on Level 3 instruments are included in both net interest income and net gains on financial assets/liabilities at fair value through profit or loss in the consolidated income statement.
in € m. | Dec 31, 2022 | Dec 31, 2021 | ||
Financial assets held at fair value: | ||||
Trading securities | (298) | (332) | ||
Positive market values from derivative financial instruments | (2,907) | 1,556 | ||
Other trading assets | (251) | 93 | ||
Non-trading financial assets mandatory at fair value through profit or loss | 247 | 241 | ||
Financial assets designated at fair value through profit or loss | (0) | (0) | ||
Other financial assets at fair value | 0 | 3 | ||
Total financial assets held at fair value | (3,209) | 1,560 | ||
Financial liabilities held at fair value: | ||||
Trading securities | 3 | (0) | ||
Negative market values from derivative financial instruments | 1,634 | (1,292) | ||
Other trading liabilities | 2 | 15 | ||
Financial liabilities designated at fair value through profit or loss | 55 | 11 | ||
Other financial liabilities at fair value | 358 | 8 | ||
Total financial liabilities held at fair value | 2,053 | (1,269)1 | ||
Total | (1,156) | 2911 | ||
1Prior year’s comparatives aligned to presentation in the current year. |
298 |
Deutsche Bank | ||
Annual Report 2022 | ||
Recognition of Trade Date Profit
If there are significant unobservable inputs used in a valuation technique, the financial instrument is recognized at the transaction price and any trade date profit is deferred. The table below presents the year-to-year movement of the trade date profits deferred due to significant unobservable parameters for financial instruments classified at fair value through profit or loss. The balance is predominantly related to derivative instruments.
in € m. | 2022 | 2021 | ||
Balance, beginning of year | 462 | 454 | ||
New trades during the period | 265 | 212 | ||
Amortization | (111) | (142) | ||
Matured trades | (60) | (61) | ||
Subsequent move to observability | (9) | (4) | ||
Exchange rate changes | 3 | 2 | ||
Balance, end of year | 550 | 462 | ||
299 |
Deutsche Bank | ||
Annual Report 2022 | ||
14 – Fair Value of Financial Instruments not carried at Fair Value
Financial instruments not carried at fair value are not managed on a fair value basis. For these instruments fair values are calculated for disclosure purposes only and do not impact the Group balance sheet or income statement. Additionally, since the instruments generally do not trade there is significant management judgment required to determine these fair values.
For the following financial instruments which are predominantly short-term the carrying value represents a reasonable estimate of the fair value:
Assets | Liabilities |
Cash and central bank balances | Deposits |
Interbank balances (w/o central banks) | Central bank funds purchased and securities sold under repurchase agreements |
Central bank funds sold and securities purchased under resale agreements | Securities loaned |
Securities borrowed | Other short-term borrowings |
Other financial assets | Other financial liabilities |
For retail lending portfolios with a large number of homogenous loans (e.g. residential mortgages), the fair value is calculated for each product type by discounting the portfolio’s contractual cash flows using the Group’s new loan rates for lending to issuers of similar credit quality. Key inputs for retail mortgages are the difference between historic and current product margins and the estimated prepayment rates. Capitalized broker fees included in the carrying value are considered to also be at fair value.
The fair value of the corporate lending portfolio is estimated by discounting the loan till its maturity based on loan specific credit spreads and funding costs for the Group.
For long-term debt and trust preferred securities, fair value is determined from quoted market prices, where available. Where quoted market prices are not available, fair value is estimated using a valuation technique that discounts the remaining contractual cash flows at a rate at which an instrument with similar characteristics is quoted in the market.
Estimated fair value of financial instruments not carried at fair value on the balance sheet1
Dec 31, 2022 | ||||||||||
in € m. | Carrying value | Fair value | Quoted | Valuation | Valuation | |||||
Financial assets: | ||||||||||
Cash and central bank balances | 178,896 | 178,896 | 178,896 | 0 | 0 | |||||
Interbank balances (w/o central banks) | 7,195 | 7,195 | 0 | 7,194 | 0 | |||||
Central bank funds sold and securities | 11,478 | 11,505 | 0 | 10,363 | 1,142 | |||||
Securities borrowed | 0 | 0 | 0 | 0 | 0 | |||||
Loans | 483,700 | 461,070 | 0 | 12,038 | 449,032 | |||||
Other financial assets | 110,066 | 107,878 | 16,046 | 90,842 | 989 | |||||
Financial liabilities: | ||||||||||
Deposits | 621,456 | 629,629 | 1,736 | 627,893 | 0 | |||||
Central bank funds purchased and securities | 573 | 572 | 0 | 572 | 0 | |||||
Securities loaned | 13 | 13 | 0 | 13 | 0 | |||||
Other short-term borrowings | 5,122 | 5,121 | 0 | 5,115 | 7 | |||||
Other financial liabilities | 93,135 | 93,135 | 2,007 | 91,127 | 0 | |||||
Long-term debt | 131,525 | 127,743 | 0 | 123,525 | 4,219 | |||||
Trust preferred securities | 500 | 426 | 0 | 426 | 0 | |||||
300 |
Deutsche Bank | ||
Annual Report 2022 | ||
Dec 31, 2021 | ||||||||||
in € m. | Carrying value | Fair value | Quoted | Valuation | Valuation | |||||
Financial assets: | ||||||||||
Cash and central bank balances | 192,021 | 192,021 | 192,021 | 0 | 0 | |||||
Interbank balances (w/o central banks) | 7,342 | 7,342 | 0 | 7,342 | 0 | |||||
Central bank funds sold and securities | 8,368 | 8,429 | 0 | 7,651 | 778 | |||||
Securities borrowed | 63 | 63 | 0 | 63 | 0 | |||||
Loans | 471,319 | 476,674 | 0 | 13,682 | 462,991 | |||||
Other financial assets | 97,2822 | 97,4262 | 9,048 | 88,0292 | 349 | |||||
Financial liabilities: | ||||||||||
Deposits | 603,750 | 604,645 | 307 | 604,338 | 0 | |||||
Central bank funds purchased and securities | 747 | 745 | 0 | 745 | 0 | |||||
Securities loaned | 24 | 24 | 0 | 24 | 0 | |||||
Other short-term borrowings | 4,034 | 4,035 | 0 | 4,010 | 25 | |||||
Other financial liabilities | 81,047 | 81,047 | 2,023 | 79,023 | 0 | |||||
Long-term debt | 144,485 | 146,871 | 0 | 141,189 | 5,683 | |||||
Trust preferred securities | 528 | 587 | 0 | 587 | 0 | |||||
1Amounts generally presented on a gross basis, in line with the Group’s accounting policy regarding offsetting of financial instruments as described in Note 1 “Significant Accounting Policies and Critical Accounting Estimates”.
2 Prior year’s comparatives aligned to presentation in the current year.
As of December 31, 2022, for loans, the difference between fair value and carrying value is primarily driven by the current interest rates on long-dated retail mortgages in Germany compared to the contractual rate. As of year-end 2022, the deposits fair value was greater than the carrying value, as the carrying value included macro hedge accounting adjustments under the EU carve-out version of IAS 39, which allows the bank to apply fair value hedge accounting for a portfolio of core demand deposits. For long-term debt and trust preferred securities, the difference between fair value and carrying value is due to the change in interest rates at which the Group could issue debt with similar maturity and subordination at the balance sheet date compared to the rate the instrument was issued at. The decrease in the fair values as of December 31, 2022 is consistent with the rising interest rate environment compared to December 31, 2021. The carrying values included in the table do not include any impacts from economic hedges.
15 – Financial assets at fair value through other comprehensive income
in € m. | Dec 31, 2022 | Dec 31, 2021 | ||
Securities purchased under resale agreement | 2,156 | 1,231 | ||
Debt securities: | ||||
German government | 602 | 876 | ||
U.S. Treasury and U.S. government agencies | 12,334 | 8,770 | ||
U.S. local (municipal) governments | 392 | 253 | ||
Other foreign governments | 9,960 | 10,965 | ||
Corporates | 708 | 604 | ||
Other asset-backed securities | 0 | 0 | ||
Mortgage-backed securities, including obligations of U.S. federal agencies | 486 | 714 | ||
Other debt securities | 969 | 1,194 | ||
Total debt securities | 25,450 | 23,377 | ||
Loans | 4,069 | 4,370 | ||
Total financial assets at fair value through other comprehensive income | 31,675 | 28,979 | ||
301 |
Deutsche Bank | ||
Annual Report 2022 | ||
16 – Equity Method Investments
Investments in associates and jointly controlled entities are accounted for using the equity method of accounting.
The Group holds interests in 53 associates and 9 jointly controlled entities as of December 31, 2022 (59 and 10, respectively, as of December 31, 2021). Two associates are considered to be material to the Group.
Significant investments as of December 31, 20221
Investment | Principal place of business | Nature of relationship | Ownership percentage | |||
Huarong Rongde Asset Management Company Limited | Beijing,China | Strategic investment | 40.7% | |||
Harvest Fund Management Co., Ltd. | Shanghai,China | Strategic investment | 30.0% | |||
1The Group has significant influence over these investees through its holding percentage and representation on the board seats.
Summarized financial information on Huarong Rongde Asset Management Company Limited1
in € m. | Dec 31, 2021 | Dec 31, 2020 | ||
Total net revenues | (138) | 76 | ||
Net income | (102) | 54 | ||
Other comprehensive income | 0 | 0 | ||
Total comprehensive income2 | (102) | 54 | ||
in € m. | Dec 31, 2021 | Dec 31, 2020 | ||
Current assets | 2,738 | 2,979 | ||
Non-Current assets | 568 | 247 | ||
Total assets | 3,306 | 3,226 | ||
Current liabilities | 2,132 | 1,273 | ||
Non-Current liabilities | 460 | 1,180 | ||
Total liabilities | 2,592 | 2,453 | ||
Noncontrolling Interest | 0 | 0 | ||
Net assets of the equity method investee | 714 | 773 | ||
1Due to the difference in reporting timelines for the Group and Huarong Rongde Asset Management Company Limited Equity method accounting was performed for December 2022 based on December 2021 PRC GAAP audited financials and for December 2021 based on December 2020 PRC GAAP audited financials.
2The Group received dividends from Huarong Rongde Asset Management Company Limited of € 0 million during the reporting period 2022 (2021: € 0 million). The Group is entitled to declared dividends of € 9 million for the financial year of 2021.
Reconciliation of total net assets of Huarong Rongde Asset Management Company Limited to the Group’s carrying amount1
in € m. | Dec 31, 2021 | Dec 31, 2020 | ||
Net assets of the equity method investee | 714 | 773 | ||
Group's ownership percentage on the investee's equity | 40.7% | 40.7% | ||
Group's share of net assets | 291 | 315 | ||
Goodwill | 0 | 0 | ||
Intangible Assets | 0 | 0 | ||
Other adjustments2 | (64) | (97) | ||
Carrying amount | 227 | 218 | ||
1Due to the difference in reporting timelines for the Group and Huarong Rongde Asset Management Company Limited Equity method accounting was performed for December 2022 based on December 2021 PRC GAAP audited financials and for December 2021 based on December 2020 PRC GAAP audited financials.
2There is life to date impairment loss of € 73 million in 2022 (€ 97 million in 2021). The loss was driven by impairment write downs from underperforming credit balances in the weaker Chinese real estate sector since 2021.
Summarized financial information on Harvest Fund Management Co., Ltd.
in € m. | Dec 31, 2022¹ | Dec 31, 2021² | ||
Total net revenues | 982 | 1,190 | ||
Net income | 234 | 305 | ||
Other comprehensive income | 7 | (2) | ||
Total comprehensive income3 | 241 | 304 | ||
in € m. | Dec 31, 2022 | Dec 31, 2021 | ||
Current assets | 1,319 | 1,372 | ||
Non-Current assets | 945 | 982 | ||
Total assets | 2,264 | 2,354 | ||
Current liabilities | 967 | 1,080 | ||
Non-Current liabilities | 169 | 207 | ||
Total liabilities | 1,136 | 1,287 | ||
Noncontrolling Interest | 47 | 40 | ||
Net assets of the equity method investee | 1,081 | 1,027 | ||
1December 31, 2022 numbers are based on 2022 unaudited financials.
2December 31, 2021 numbers are based on 2021 audited financials.
3The Group received dividends from Harvest Fund Management Co., Ltd. of € 45 million during the reporting period 2022 (2021: € 68 million).
302 |
Deutsche Bank | ||
Annual Report 2022 | ||
Reconciliation of total net assets of Harvest Fund Management Co., Ltd.to the Group’s carrying amount
in € m. | Dec 31, 2022¹ | Dec 31, 2021² | ||
Net assets of the equity method investee | 1,081 | 1,027 | ||
Group's ownership percentage on the investee's equity | 30% | 30% | ||
Group's share of net assets | 324 | 308 | ||
Goodwill | 18 | 17 | ||
Intangible Assets | 15 | 15 | ||
Other adjustments | 4 | 1 | ||
Carrying amount3 | 361 | 341 | ||
1December 31, 2022 numbers are based on 2022 unaudited financials.
2December 31, 2021 numbers are based on 2021 audited financials.
3There is no impairment loss in 2022 (€ 0 million in 2021).
Aggregated financial information on the Group’s share in associates and joint ventures that are individually immaterial
in € m. | Dec 31, 2022 | Dec 31, 2021 | ||
Carrying amount of all associates that are individually immaterial to the Group | 536 | 532 | ||
Aggregated amount of the Group's share of profit (loss) from continuing operations | 100 | 87 | ||
Aggregated amount of the Group's share of post-tax profit (loss) from discontinued operations | 0 | 0 | ||
Aggregated amount of the Group's share of other comprehensive income | 15 | (6) | ||
Aggregated amount of the Group's share of total comprehensive income | 115 | 81 | ||
17 – Offsetting Financial Assets and Financial Liabilities
The Group is eligible to present certain financial assets and financial liabilities on a net basis on the balance sheet pursuant to criteria described in Note 1 “Significant Accounting Policies and Critical Accounting Estimates: Offsetting Financial Instruments”.
The following tables provide information on the impact of offsetting on the consolidated balance sheet, as well as the financial impact of netting for instruments subject to an enforceable master netting arrangement or similar agreement as well as available cash and financial instrument collateral.
Assets
Dec 31, 2022 | ||||||||||||||
Net | Amounts not set off on the balance sheet | |||||||||||||
in € m. | Gross | Gross | Impact of | Cash | Financial | Net amount | ||||||||
Central bank funds sold and securities purchased | 20,068 | (8,621) | 11,447 | (700) | 0 | (10,746) | 1 | |||||||
Central bank funds sold and securities purchased | 31 | 0 | 31 | 0 | 0 | (25) | 6 | |||||||
Securities borrowed (enforceable) | 0 | 0 | 0 | 0 | 0 | 0 | 0 | |||||||
Securities borrowed (non-enforceable) | 0 | 0 | 0 | 0 | 0 | 0 | 0 | |||||||
Financial assets at fair value through profit or loss (enforceable) | 506,114 | (141,991) | 364,123 | (229,779) | (41,907) | (80,591) | 11,846 | |||||||
Of which: Positive market values from derivative financial instruments (enforceable) | 306,192 | (16,087) | 290,106 | (227,299) | (41,904) | (9,076) | 11,826 | |||||||
Financial assets at fair value through profit or loss (non-enforceable) | 118,253 | 0 | 118,253 | 0 | (1,101) | (10,167) | 106,984 | |||||||
Of which: Positive market values from derivative financial instruments (non-enforceable) | 9,581 | 0 | 9,581 | 0 | (966) | (1,327) | 7,288 | |||||||
Total financial assets at fair value through profit | 624,366 | (141,991) | 482,376 | (229,779) | (43,008) | (90,759) | 118,830 | |||||||
Loans at amortized cost | 483,700 | 0 | 483,700 | 0 | (12,278) | (66,762) | 404,660 | |||||||
Other assets | 130,663 | (12,370) | 118,293 | (29,232) | (95) | (14) | 88,952 | |||||||
Of which: Positive market values from derivatives qualifying for hedge accounting (enforceable) | 3,704 | (2,287) | 1,417 | (1,089) | (95) | (14) | 220 | |||||||
Remaining assets subject to netting | 2,156 | 0 | 2,156 | 0 | 0 | 0 | 2,156 | |||||||
Remaining assets not subject to netting | 238,785 | 0 | 238,785 | 0 | (111) | (2,995) | 235,680 | |||||||
Total assets | 1,499,770 | (162,982) | 1,336,788 | (259,712) | (55,492) | (171,299) | 850,285 | |||||||
1Excludes real estate and other non-financial instrument collateral.
303 |
Deutsche Bank | ||
Annual Report 2022 | ||
Liabilities
Dec 31, 2022 | ||||||||||||||
Net | Amounts not set off on the balance sheet | |||||||||||||
in € m. | Gross | Gross | Impact of | Cash | Financial | Net amount | ||||||||
Deposits | 621,456 | 0 | 621,456 | 0 | 0 | 0 | 621,456 | |||||||
Central bank funds purchased and securities sold | 9,032 | (8,621) | 411 | 0 | 0 | (410) | 0 | |||||||
Central bank funds purchased and securities sold | 162 | 0 | 162 | 0 | 0 | (51) | 111 | |||||||
Securities loaned (enforceable) | 7 | 0 | 7 | 0 | 0 | (7) | 0 | |||||||
Securities loaned (non-enforceable) | 6 | 0 | 6 | 0 | 0 | (6) | 0 | |||||||
Financial liabilities at fair value through profit or loss (enforceable) | 508,275 | (141,849) | 366,426 | (230,359) | (26,319) | (44,516) | 65,232 | |||||||
Of which: Negative market values from derivative financial instruments (enforceable) | 287,402 | (16,382) | 271,019 | (227,766) | (26,319) | (2,319) | 14,615 | |||||||
Financial liabilities at fair value through profit or loss (non-enforceable) | 21,646 | 0 | 21,646 | 0 | (880) | (4,245) | 16,521 | |||||||
Of which: Negative market values from derivative financial instruments (non-enforceable) | 11,333 | 0 | 11,333 | 0 | (736) | (209) | 10,388 | |||||||
Total financial liabilities at fair value through profit | 529,921 | (141,849) | 388,072 | (230,359) | (27,199) | (48,761) | 81,753 | |||||||
Other liabilities | 126,226 | (12,512) | 113,714 | (44,114) | (76) | (2) | 69,522 | |||||||
Of which: Negative market values from derivatives qualifying for hedge accounting (enforceable) | 837 | (51) | 787 | (622) | (76) | (2) | 87 | |||||||
Remaining liabilities not subject to netting | 140,633 | 0 | 140,633 | 0 | (0) | 0 | 140,632 | |||||||
Total liabilities | 1,427,442 | (162,982) | 1,264,460 | (274,473) | (27,275) | (49,238) | 913,475 | |||||||
Assets
Dec 31, 2021 | ||||||||||||||
Net | Amounts not set off on the balance sheet | |||||||||||||
in € m. | Gross | Gross | Impact of | Cash | Financial | Net amount | ||||||||
Central bank funds sold and securities purchased | 14,449 | (8,532) | 5,917 | 0 | 0 | (5,667) | 251 | |||||||
Central bank funds sold and securities purchased | 2,451 | 0 | 2,451 | 0 | 0 | (2,403) | 48 | |||||||
Securities borrowed (enforceable) | 63 | 0 | 63 | 0 | 0 | (63) | 0 | |||||||
Securities borrowed (non-enforceable) | 0 | 0 | 0 | 0 | 0 | 0 | 0 | |||||||
Financial assets at fair value through profit or loss (enforceable) | 471,122 | (117,007) | 354,115 | (240,587) | (33,953) | (71,766) | 7,808 | |||||||
Of which: Positive market values from derivative financial instruments (enforceable) | 296,520 | (11,959) | 284,561 | (238,411) | (33,950) | (4,516) | 7,685 | |||||||
Financial assets at fair value through profit or loss (non-enforceable) | 137,118 | 0 | 137,118 | 0 | (2,026) | (12,124) | 122,968 | |||||||
Of which: Positive market values from derivative financial instruments (non-enforceable) | 15,170 | 0 | 15,170 | 0 | (1,963) | (1,263) | 11,944 | |||||||
Total financial assets at fair value through profit | 608,240 | (117,007) | 491,233 | (240,587) | (35,978) | (83,890) | 130,777 | |||||||
Loans at amortized cost | 471,319 | 0 | 471,319 | 0 | (12,271) | (60,794) | 398,254 | |||||||
Other assets | 109,182 | (5,398) | 103,785 | (30,639) | (101) | (63) | 72,981 | |||||||
Of which: Positive market values from derivatives qualifying for hedge accounting (enforceable) | 1,211 | (106) | 1,106 | (881) | (101) | (63) | 61 | |||||||
Remaining assets subject to netting | 1,231 | 0 | 1,231 | 0 | 0 | 0 | 1,231 | |||||||
Remaining assets not subject to netting | 247,994 | 0 | 247,994 | 0 | (141) | (2,320) | 245,532 | |||||||
Total assets | 1,454,930 | (130,937) | 1,323,993 | (271,227) | (48,492) | (155,200) | 849,074 | |||||||
1Excludes real estate and other non-financial instrument collateral.
304 |
Deutsche Bank | ||
Annual Report 2022 | ||
Liabilities
Dec 31, 2021 | ||||||||||||||
Net | Amounts not set off on the balance sheet | |||||||||||||
in € m. | Gross | Gross | Impact of | Cash | Financial | Net amount | ||||||||
Deposits | 603,750 | 0 | 603,750 | 0 | 0 | 0 | 603,750 | |||||||
Central bank funds purchased and securities sold | 9,275 | (8,532) | 743 | 0 | 0 | (743) | 0 | |||||||
Central bank funds purchased and securities sold | 4 | 0 | 4 | 0 | 0 | 0 | 4 | |||||||
Securities loaned (enforceable) | 22 | 0 | 22 | 0 | 0 | (22) | 0 | |||||||
Securities loaned (non-enforceable) | 2 | 0 | 2 | 0 | 0 | (2) | 0 | |||||||
Financial liabilities at fair value through profit or loss (enforceable) | 497,045 | (117,101) | 379,944 | (240,380) | (27,607) | (50,690) | 61,267 | |||||||
Of which: Negative market values from derivative financial instruments (enforceable) | 288,685 | (12,551) | 276,134 | (237,915) | (27,607) | (4,063) | 6,549 | |||||||
Financial liabilities at fair value through profit or loss (non-enforceable) | 20,913 | 0 | 20,913 | 0 | (1,261) | (4,658) | 14,994 | |||||||
Of which: Negative market values from derivative financial instruments (non-enforceable) | 10,975 | 0 | 10,975 | 0 | (1,261) | (157) | 9,556 | |||||||
Total financial liabilities at fair value through profit | 517,958 | (117,101) | 400,857 | (240,380) | (28,868) | (55,347) | 76,261 | |||||||
Other liabilities | 103,100 | (5,304) | 97,796 | (38,678) | (49) | (2) | 59,067 | |||||||
Of which: Negative market values from derivatives qualifying for hedge accounting (enforceable) | 2,174 | (708) | 1,467 | (1,378) | (49) | (2) | 37 | |||||||
Remaining liabilities not subject to netting | 152,788 | 0 | 152,788 | 0 | 0 | 0 | 152,788 | |||||||
Total liabilities | 1,386,900 | (130,937) | 1,255,962 | (279,058) | (28,918) | (56,117) | 891,870 | |||||||
The column ‘Gross amounts set off on the balance sheet’ discloses the amounts offset in accordance with all the criteria described in Note 1 “Significant Accounting Policies and Critical Accounting Estimates: Offsetting Financial Instruments”.
The column ‘Impact of Master Netting Agreements’ discloses the amounts that are subject to master netting agreements but were not offset because they did not meet the net settlement/simultaneous settlement criteria; or because the rights of set off are conditional upon the default of the counterparty only. The amounts presented for other assets and other liabilities include cash margin receivables and payables respectively.
The columns ‘Cash collateral’ and ‘Financial instrument collateral’ disclose the cash and financial instrument collateral amounts received or pledged in relation to the total amounts of assets and liabilities, including those that were not offset.
Non-enforceable master netting agreements or similar agreements refer to contracts executed in jurisdictions where the rights of set off may not be upheld under the local bankruptcy laws.
The cash collateral received against the positive market values of derivatives and the cash collateral pledged towards the negative mark-to-market values of derivatives are booked within the ‘Other liabilities’ and ‘Other assets’ balances respectively.
The Cash and Financial instrument collateral amounts disclosed reflect their fair values. The rights of set off relating to the cash and financial instrument collateral are conditional upon the default of the counterparty.
305 |
Deutsche Bank | ||
Annual Report 2022 | ||
18 – Loans
The entire loan book presented includes loans classified at amortized cost, loans at fair value through other comprehensive income and loans at fair value through profit and loss.
The below table gives an overview of the Group’s loan exposure by industry, and is based on the NACE code of the counterparty. NACE (Nomenclature des Activités Économiques dans la Communauté Européenne) is a standard European industry classification system.
Loans by industry classification
in € m. | Dec 31, 2022 | Dec 31, 2021 | ||
Agriculture, forestry and fishing | 526 | 647 | ||
Mining and quarrying | 2,679 | 3,006 | ||
Manufacturing | 32,352 | 36,820 | ||
Electricity, gas, steam and air conditioning supply | 5,103 | 4,819 | ||
Water supply, sewerage, waste management and remediation activities | 725 | 681 | ||
Construction | 4,494 | 4,651 | ||
Wholesale and retail trade, repair of motor vehicles and motorcycles | 22,605 | 22,444 | ||
Transport and storage | 6,067 | 6,067 | ||
Accommodation and food service activities | 1,972 | 2,272 | ||
Information and communication | 7,783 | 7,387 | ||
Financial and insurance activities | 121,333 | 111,239 | ||
Real estate activities | 49,671 | 43,220 | ||
Professional, scientific and technical activities | 7,137 | 7,022 | ||
Administrative and support service activities | 7,922 | 10,324 | ||
Public administration and defense, compulsory social security | 5,977 | 7,076 | ||
Education | 249 | 225 | ||
Human health services and social work activities | 4,554 | 4,005 | ||
Arts, entertainment and recreation | 1,180 | 1,068 | ||
Other service activities | 4,606 | 5,261 | ||
Activities of households as employers, undifferentiated goods- and services-producing activities of households for own use | 214,796 | 212,436 | ||
Activities of extraterritorial organizations and bodies | 1 | 1 | ||
Gross loans | 501,732 | 490,671 | ||
(Deferred expense)/unearned income | 131 | 227 | ||
Loans less (deferred expense)/unearned income | 501,601 | 490,444 | ||
Less: Allowance for loan losses | 4,848 | 4,779 | ||
Total loans | 496,754 | 485,665 | ||
19 – Allowance for Credit Losses
The allowance for credit losses consists of allowance for financial assets at amortized cost, financial assets at fair value through OCI and off-balance sheet lending commitments and guarantee business.
Development of allowance for credit losses for financial assets at amortized cost
Dec 31, 2022 | ||||||||||
Allowance for Credit Losses² | ||||||||||
in € m. | Stage 1 | Stage 2 | Stage 3 | Stage 3 POCI | Total | |||||
Balance, beginning of year | 440 | 532 | 3,740 | 182 | 4,895 | |||||
Movements in financial assets including new business and credit extensions | (32) | 204 | 887 | 22 | 1,081 | |||||
Transfers due to changes in creditworthiness | 122 | (121) | (0) | N/M | 0 | |||||
Changes due to modifications that did not result in | N/M | N/M | N/M | N/M | N/M | |||||
Changes in models | 0 | 0 | 0 | 0 | 0 | |||||
Financial assets that have been derecognized during the period³ | 0 | 0 | (1,014) | (28) | (1,043) | |||||
Recovery of written off amounts | 0 | 0 | 68 | 3 | 71 | |||||
Foreign exchange and other changes | 2 | 12 | (25) | 1 | (10) | |||||
Balance, end of reporting period | 533 | 626 | 3,656 | 180 | 4,995 | |||||
Provision for Credit Losses excluding country risk¹ | 90 | 82 | 886 | 22 | 1,081 | |||||
1Movements in financial assets including new business, transfers due to changes in creditworthiness and changes in models add up to Provision for Credit Losses excluding country risk.
2Allowance for credit losses does not include allowance for country risk amounting to € 14 million as of December 31, 2022.
3This position includes charge offs of allowance for credit losses.
4The total amount of undiscounted expected credit losses at initial recognition on financial assets that are purchased or originated credit-impaired initially recognized during the reporting period was € 46 million in 2022 and € 0 million in 2021.
306 |
Deutsche Bank | ||
Annual Report 2022 | ||
Development of allowance for credit losses for financial assets at amortized cost
Dec 31, 2021 | ||||||||||
Allowance for Credit Losses² | ||||||||||
in € m. | Stage 1 | Stage 2 | Stage 3 | Stage 3 POCI | Total | |||||
Balance, beginning of year | 544 | 648 | 3,614 | 139 | 4,946 | |||||
Movements in financial assets including new business and credit extensions | (245) | 85 | 615 | 26 | 480 | |||||
Transfers due to changes in creditworthiness | 138 | (197) | 58 | N/M | 0 | |||||
Changes due to modifications that did not result in | N/M | N/M | N/M | N/M | N/M | |||||
Changes in models | 0 | 0 | 0 | 0 | 0 | |||||
Financial assets that have been derecognized during the period³ | 0 | 0 | (561) | (5) | (566) | |||||
Recovery of written off amounts | 0 | 0 | 55 | 23 | 78 | |||||
Foreign exchange and other changes | 3 | (4) | (41) | (0) | (43) | |||||
Balance, end of reporting period | 440 | 532 | 3,740 | 182 | 4,895 | |||||
Provision for Credit Losses excluding country risk¹ | (107) | (112) | 673 | 26 | 480 | |||||
1Movements in financial assets including new business, transfers due to changes in creditworthiness and changes in models add up to Provision for Credit Losses excluding country risk.
2Allowance for credit losses does not include allowance for country risk amounting to € 4 million as of December 31, 2021.
3This position includes charge offs of allowance for credit losses.
4The total amount of undiscounted expected credit losses at initial recognition on financial assets that are purchased or originated credit-impaired initially recognized during the reporting period was € 0 million in 2021 and € 46 million in 2020 (Prior year’s comparatives aligned to presentation in the current year).
Development of allowance for credit losses for financial assets at amortized cost
Dec 31, 2020 | ||||||||||
Allowance for Credit Losses² | ||||||||||
in € m. | Stage 1 | Stage 2 | Stage 3 | Stage 3 POCI⁴ | Total | |||||
Balance, beginning of year | 549 | 492 | 3,015 | 36 | 4,093 | |||||
Movements in financial assets including new business and credit extensions | (44) | 309 | 1,348 | 72 | 1,686 | |||||
Transfers due to changes in creditworthiness | 77 | (125) | 49 | 0 | ||||||
Changes due to modifications that did not result in | N/M | N/M | N/M | N/M | N/M | |||||
Changes in models | 0 | 0 | 0 | 0 | 0 | |||||
Financial assets that have been derecognized during the period³ | 0 | 0 | (781) | 0 | (781) | |||||
Recovery of written off amounts | 0 | 0 | 58 | 0 | 58 | |||||
Foreign exchange and other changes | (38) | (28) | (75) | 31 | (110) | |||||
Balance, end of reporting period | 544 | 648 | 3,614 | 139 | 4,946 | |||||
Provision for Credit Losses excluding country risk¹ | 33 | 184 | 1,397 | 72 | 1,686 | |||||
1Movements in financial assets including new business, transfers due to changes in creditworthiness and changes in models add up to Provision for Credit Losses excluding country risk.
2Allowance for credit losses does not include allowance for country risk amounting to € 5 million as of December 31, 2020.
3This position includes charge offs of allowance for credit losses.
4The total amount of undiscounted expected credit losses at initial recognition on financial assets that are purchased or originated credit-impaired initially recognized during the reporting period was € 46 million in 2020 (Prior year’s comparatives aligned to presentation in the current year).
Allowance for credit losses for financial assets at fair value through OCI1
| Dec 31, 2022 | |||||||||
Allowance for Credit Losses | ||||||||||
in € m. | Stage 1 | Stage 2 | Stage 3 | Stage 3 POCI | Total | |||||
Fair Value through OCI | 14 | 12 | 43 | 0 | 69 | |||||
1Allowance for credit losses against financial assets at fair value through OCI remained at very low levels (€ 41 million at December 31, 2021 and € 69 million as of December 31, 2022). Due to immateriality, we do not provide any details on the year-over-year development.
| Dec 31, 2021 | |||||||||
Allowance for Credit Losses | ||||||||||
in € m. | Stage 1 | Stage 2 | Stage 3 | Stage 3 POCI | Total | |||||
Fair Value through OCI | 15 | 10 | 16 | 0 | 41 | |||||
1Allowance for credit losses against financial assets at fair value through OCI were almost unchanged at very low levels (€ 20 million at December 31, 2020 and € 41 million as of December 31, 2021). Due to immateriality, we do not provide any details on the year-over-year development.
| Dec 31, 2020 | |||||||||
Allowance for Credit Losses | ||||||||||
in € m. | Stage 1 | Stage 2 | Stage 3 | Stage 3 POCI | Total | |||||
Fair Value through OCI | 12 | 6 | 2 | 0 | 20 | |||||
1Allowance for credit losses against financial assets at fair value through OCI were almost unchanged at very low levels (€ 35 million at December, 31, 2019 and € 20 million as of December 31, 2020, respectively). Due to immateriality, we do not provide any details on the year-over-year development.
307 |
Deutsche Bank | ||
Annual Report 2022 | ||
Development of allowance for credit losses for off-balance sheet positions
Dec 31, 2022 | ||||||||||
Allowance for Credit Losses2 | ||||||||||
in € m. | Stage 1 | Stage 2 | Stage 3 | Stage 3 POCI | Total | |||||
Balance, beginning of year | 108 | 111 | 225 | 0 | 443 | |||||
Movements including new business | 21 | (1) | 78 | 0 | 99 | |||||
Transfers due to changes in creditworthiness | 12 | (15) | 3 | 0 | 0 | |||||
Changes in models | 0 | 0 | 0 | 0 | 0 | |||||
Foreign exchange and other changes | 4 | 3 | 3 | 0 | 9 | |||||
Balance, end of reporting period | 144 | 97 | 310 | 0 | 551 | |||||
of which: Financial guarantees | 95 | 56 | 226 | 0 | 378 | |||||
Provision for Credit Losses excluding country risk1 | 33 | (16) | 82 | 0 | 99 | |||||
1The above table breaks down the impact on provision for credit losses from movements in financial assets including new business, transfers due to changes in creditworthiness and changes in models.
2Allowance for credit losses does not include allowance for country risk amounting to € 9 million as of December 31, 2022.
Development of allowance for credit losses for off-balance sheet positions
Dec 31, 2021 | ||||||||||
Allowance for Credit Losses2 | ||||||||||
in € m. | Stage 1 | Stage 2 | Stage 3 | Stage 3 POCI | Total | |||||
Balance, beginning of year | 144 | 74 | 200 | 0 | 419 | |||||
Movements including new business | (43) | 38 | 18 | 0 | 13 | |||||
Transfers due to changes in creditworthiness | 3 | (5) | 2 | 0 | 0 | |||||
Changes in models | 0 | 0 | 0 | 0 | 0 | |||||
Foreign exchange and other changes | 3 | 3 | 6 | 0 | 12 | |||||
Balance, end of reporting period | 108 | 111 | 225 | 0 | 443 | |||||
of which: Financial guarantees | 69 | 64 | 164 | 0 | 297 | |||||
Provision for Credit Losses excluding country risk1 | (40) | 33 | 19 | 0 | 13 | |||||
1The above table breaks down the impact on provision for credit losses from movements in financial assets including new business, transfers due to changes in creditworthiness and changes in models.
2Allowance for credit losses does not include allowance for country risk amounting to € 6 million as of December 31, 2021.
Development of allowance for credit losses for off-balance sheet positions
Dec 31, 2020 | ||||||||||
Allowance for Credit Losses2 | ||||||||||
in € m. | Stage 1 | Stage 2 | Stage 3 | Stage 3 POCI | Total | |||||
Balance, beginning of year | 128 | 48 | 166 | 0 | 342 | |||||
Movements including new business | 13 | 21 | 41 | 0 | 75 | |||||
Transfers due to changes in creditworthiness | 0 | 0 | (1) | 0 | 0 | |||||
Changes in models | 0 | 0 | 0 | 0 | 0 | |||||
Foreign exchange and other changes | 3 | 4 | (6) | 0 | 1 | |||||
Balance, end of reporting period | 144 | 74 | 200 | 0 | 419 | |||||
of which: Financial guarantees | 99 | 43 | 115 | 0 | 257 | |||||
Provision for Credit Losses excluding country risk1 | 13 | 22 | 40 | 0 | 75 | |||||
1The above table breaks down the impact on provision for credit losses from movements in financial assets including new business, transfers due to changes in creditworthiness and changes in models.
2Allowance for credit losses does not include allowance for country risk amounting to € 4 million as of December 31, 2020
20 – Transfer of Financial Assets, Assets Pledged and Received as Collateral
The Group enters into transactions in which it transfers financial assets held on the balance sheet and as a result may either be eligible to derecognize the transferred asset in its entirety or must continue to recognize the transferred asset to the extent of any continuing involvement, depending on certain criteria. These criteria are discussed in Note 1 “Significant Accounting Policies and Critical Accounting Estimates”.
Where financial assets are not eligible to be derecognized, the transfers are viewed as secured financing transactions, with any consideration received resulting in a corresponding liability. The Group is not entitled to use these financial assets for any other purposes. The most common transactions of this nature entered into by the Group are repurchase agreements, securities lending agreements and total return swaps, in which the Group retains substantially all of the associated credit, equity price, interest rate and foreign exchange risks and rewards associated with the assets as well as the associated income streams.
308 |
Deutsche Bank | ||
Annual Report 2022 | ||
Information on asset types and associated transactions that did not qualify for derecognition
in € m. | Dec 31, 2022 | Dec 31, 2021 | ||
Carrying amount of transferred assets | ||||
Trading securities not derecognized due to the following transactions: | ||||
Repurchase agreements | 30,201 | 44,898 | ||
Securities lending agreements | 8,313 | 5,444 | ||
Total return swaps | 1,461 | 1,766 | ||
Other | 4,480 | 4,028 | ||
Total trading securities | 44,455 | 56,136 | ||
Other trading assets | 171 | 244 | ||
Non-trading financial assets mandatory at fair value through profit or loss | 1,077 | 760 | ||
Financial assets at fair value through other comprehensive income | 2,351 | 5,642 | ||
Loans at amortized cost1 | 104 | 13 | ||
Others | 3,815 | 481 | ||
Total | 51,973 | 63,276 | ||
Carrying amount of associated liabilities | 43,820 | 57,522 | ||
¹Loans where the associated liability is recourse only to the transferred assets had NIL carrying value and fair value as at December 31, 2022 and December 31, 2021. The associated liabilities had the same carrying value and fair value which resulted in a net position of 0.
Carrying value of assets transferred to the Group has continuing involvement
in € m. | Dec 31, 2022 | Dec 31, 2021 | ||
Carrying amount of the original assets transferred | ||||
Trading securities | 1,059 | 1,050 | ||
Non-trading financial assets mandatory at fair value through profit or loss | 328 | 308 | ||
Carrying amount of the assets continued to be recognized | ||||
Trading securities | 34 | 61 | ||
Non-trading financial assets mandatory at fair value through profit or loss | 16 | 15 | ||
Carrying amount of associated liabilities | 95 | 102 | ||
The Group could retain some exposure to the future performance of a transferred asset either through new or existing contractual rights and obligations and still be eligible to derecognize the asset. This ongoing involvement will be recognized as a new instrument which may be different from the original financial asset that was transferred. Typical transactions include retaining senior notes of non-consolidated securitizations to which originated loans have been transferred; financing arrangements with structured entities to which the Group has sold a portfolio of assets; or sales of assets with credit-contingent swaps. The Group’s exposure to such transactions is not considered to be significant as any substantial retention of risks associated with the transferred asset will commonly result in an initial failure to derecognize. Transactions not considered to result in an ongoing involvement include normal warranties on fraudulent activities that could invalidate a transfer in the event of legal action, qualifying pass-through arrangements and standard trustee or administrative fees that are not linked to performance.
The impact on the Group’s Balance Sheet of on-going involvement associated with transferred assets derecognized in full
| Dec 31,2022 | Dec 31,2021 | ||||||||||
in € m. | Carrying | Fair value | Maximum | Carrying | Fair value | Maximum | ||||||
Loans at amortized cost | ||||||||||||
Securitization notes | 357 | 321 | 321 | 283 | 302 | 302 | ||||||
Other | 0 | 0 | 0 | 0 | 0 | 0 | ||||||
Total loans at amortized cost | 357 | 321 | 321 | 283 | 302 | 302 | ||||||
Financial assets held at fair value through profit or loss | ||||||||||||
Securitization notes | 30 | 30 | 30 | 29 | 29 | 29 | ||||||
Non-standard Interest Rate, cross-currency or inflation-linked swap | 0 | 0 | 0 | 465 | 465 | 465 | ||||||
Total financial assets held at fair value through profit or loss | 30 | 30 | 30 | 494 | 494 | 494 | ||||||
Financial assets at fair value through other comprehensive income: | ||||||||||||
Securitization notes | 739 | 629 | 629 | 709 | 713 | 713 | ||||||
Other | 0 | 0 | 0 | 0 | 0 | 0 | ||||||
Total financial assets at fair value through other comprehensive income | 739 | 629 | 629 | 709 | 713 | 713 | ||||||
Total financial assets representing on-going involvement | 1,126 | 981 | 981 | 1,486 | 1,509 | 1,509 | ||||||
Financial liabilities held at fair value through profit or loss | ||||||||||||
Non-standard Interest Rate, cross-currency or inflation-linked swap | 0 | 0 | 0 | 8 | 8 | 0 | ||||||
Total financial liabilities representing on-going involvement | 0 | 0 | 0 | 8 | 8 | 0 | ||||||
1The maximum exposure to loss is defined as the carrying value plus the notional value of any undrawn loan commitments not recognized as liabilities.
309 |
Deutsche Bank | ||
Annual Report 2022 | ||
The impact on the Group’s Statement of Income of on-going involvement associated with transferred assets derecognized in full
| Dec 31,2022 | Dec 31,2021 | ||||||||||
in € m. | Year-to- | Cumulative | Gain/(loss) | Year-to- | Cumulative | Gain/(loss) | ||||||
Securitization notes | 41 | 112 | (8) | 30 | 81 | 48 | ||||||
Non-standard Interest Rate, cross-currency or | (0) | (0) | 0 | 41 | 41 | 0 | ||||||
Net gains/(losses) recognized from on-going | 40 | 112 | (8) | 72 | 123 | 48 | ||||||
The Group pledges assets primarily as collateral against secured funding and for repurchase agreements, securities borrowing agreements as well as other borrowing arrangements and for margining purposes on OTC derivative liabilities. Pledges are generally conducted under terms that are usual and customary for standard securitized borrowing contracts and other transactions described. As at December 31, 2022 the bank had securitized loans of €28 billion and the secured own bonds were pledged as collateral into the ECBs TLTRO program or market standard securities financing transactions. The encumbered loans below includes this balance.
Carrying value of the Group’s assets pledged as collateral for liabilities or contingent liabilities1
in € m. | Dec 31, 2022 | Dec 31, 2021 | ||
Financial assets at fair value through profit or loss | 37,216 | 51,165 | ||
Financial assets at fair value through other comprehensive income | 2,375 | 6,395 | ||
Loans | 73,305 | 79,485 | ||
Other | 5,306 | 611 | ||
Total | 118,202 | 137,656 | ||
1Excludes assets pledged as collateral from transactions that do not result in liabilities or contingent liabilities.
Total assets pledged to creditors available for sale or repledge1
in € m. | Dec 31, 2022 | Dec 31, 2021 | ||
Financial assets at fair value through profit or loss | 40,997 | 48,426 | ||
Financial assets at fair value through other comprehensive income | 1,408 | 5,252 | ||
Loans | 2,716 | 2,073 | ||
Other | 593 | 481 | ||
Total | 45,715 | 56,233 | ||
1Includes assets pledged as collateral from transactions that do not result in liabilities or contingent liabilities.
The Group receives collateral primarily in reverse repurchase agreements, securities lending agreements, derivatives transactions, customer margin loans and other transactions. These transactions are generally conducted under terms that are usual and customary for standard secured lending activities and the other transactions described. The Group, as the secured party, has the right to sell or re-pledge such collateral, subject to the Group returning equivalent securities upon completion of the transaction. This right is used primarily to cover short sales, securities loaned and securities sold under repurchase agreements.
Fair Value of collateral received
in € m. | Dec 31, 2022 | Dec 31, 2021 | ||
Securities and other financial assets accepted as collateral | 309,107 | 260,003 | ||
Of which: | ||||
Collateral sold or repledged | 254,856 | 222,232 | ||
310 |
Deutsche Bank | ||
Annual Report 2022 | ||
21 – Property and Equipment
in € m. | Owner occupied properties | Furniture and equipment | Leasehold improvements | Construction-in-progress | Property and equipment owned (IAS 16) | Right-of-use for leased assets (IFRS 16) | Total | |||||||
Cost of acquisition: | ||||||||||||||
Balance as of January 1, 2021 | 587 | 2,343 | 2,897 | 387 | 6,214 | 4,844 | 11,058 | |||||||
Changes in the group of consolidated companies | (1) | 0 | 0 | 0 | (1) | 0 | (1) | |||||||
Additions | 0 | 113 | 46 | 391 | 550 | 254 | 804 | |||||||
Transfers | 58 | (8) | 354 | (321) | 83 | 367 | 451 | |||||||
Reclassifications (to)/from “held for sale” | (131) | (16) | (94) | (1) | (241) | 0 | (241) | |||||||
Disposals | 0 | 187 | 146 | 79 | 412 | 165 | 578 | |||||||
Exchange rate changes | 1 | 38 | 45 | 21 | 105 | 139 | 244 | |||||||
Balance as of December 31, 2021 | 514 | 2,283 | 3,102 | 398 | 6,297 | 5,439 | 11,737 | |||||||
Changes in the group of consolidated companies | 0 | 0 | 0 | 0 | 0 | 0 | 0 | |||||||
Additions | 0 | 94 | 65 | 178 | 337 | 971 | 1,308 | |||||||
Transfers | 0 | 109 | 362 | (377) | 94 | 78 | 171 | |||||||
Reclassifications (to)/from “held for sale” | 0 | (7) | (12) | 0 | (19) | (0) | (19) | |||||||
Disposals | 11 | 72 | 35 | 0 | 118 | 417 | 535 | |||||||
Exchange rate changes | (1) | 27 | 42 | 16 | 84 | 117 | 201 | |||||||
Balance as of December 31, 2022 | 503 | 2,434 | 3,523 | 216 | 6,676 | 6,187 | 12,863 | |||||||
Accumulated depreciation and impairment: | ||||||||||||||
Balance as of January 1, 2021 | 317 | 1,856 | 1,989 | 0 | 4,163 | 1,347 | 5,510 | |||||||
Changes in the group of consolidated companies | (1) | 0 | 0 | 0 | (1) | 0 | (1) | |||||||
Depreciation | 16 | 140 | 204 | 0 | 360 | 631 | 991 | |||||||
Impairment losses | 12 | 7 | 39 | 1 | 59 | 99 | 158 | |||||||
Reversals of impairment losses | 0 | 0 | 0 | 0 | 0 | 18 | 18 | |||||||
Transfers | 57 | 16 | 10 | 0 | 84 | 2 | 85 | |||||||
Reclassifications (to)/from “held for sale” | (115) | (15) | (62) | 0 | (191) | 0 | (191) | |||||||
Disposals | 0 | 178 | 125 | 0 | 303 | 133 | 436 | |||||||
Exchange rate changes | 1 | 34 | 39 | 0 | 74 | 29 | 103 | |||||||
Balance as of December 31, 2021 | 288 | 1,860 | 2,095 | 1 | 4,244 | 1,957 | 6,201 | |||||||
Changes in the group of consolidated companies | 0 | 0 | 0 | 0 | 0 | 0 | 0 | |||||||
Depreciation | 13 | 141 | 194 | 0 | 348 | 573 | 922 | |||||||
Impairment losses | 1 | 0 | 4 | 0 | 4 | 6 | 11 | |||||||
Reversals of impairment losses | 4 | 0 | 0 | 0 | 4 | 17 | 21 | |||||||
Transfers | 0 | 61 | 24 | 0 | 86 | 3 | 89 | |||||||
Reclassifications (to)/from “held for sale” | 0 | (6) | (9) | 0 | (15) | 0 | (15) | |||||||
Disposals | 11 | 55 | 28 | 0 | 93 | 393 | 486 | |||||||
Exchange rate changes | (1) | 20 | 24 | 0 | 43 | 17 | 60 | |||||||
Balance as of December 31, 2022 | 286 | 2,022 | 2,304 | 1 | 4,613 | 2,147 | 6,760 | |||||||
Carrying amount: | ||||||||||||||
Balance as of December 31, 2021 | 226 | 423 | 1,007 | 398 | 2,054 | 3,482 | 5,536 | |||||||
Balance as of December 31, 2022 | 217 | 412 | 1,219 | 215 | 2,063 | 4,040 | 6,103 | |||||||
311 |
Deutsche Bank | ||
Annual Report 2022 | ||
Depreciation expenses, impairment losses and reversal of impairment losses on property and equipment are recorded within general and administrative expenses for the income statement.
The carrying value of items of property and equipment on which there is a restriction on sale was € 25 million and € 22 million as of December 31, 2022 and December 31, 2021, respectively.
Commitments for the acquisition of property and equipment were € 150 million at year-end 2022 and € 35 million at year-end 2021.
The Group leases many assets including land and buildings, vehicles and IT equipment for which it records right-of-use assets. During 2022, additions to right-of-use assets amounted to € 971 million and largely reflected new real estate leases. Depreciation charges of € 573 million recognized in 2022 mainly resulted from planned consumption of right-of-use assets for property leases over their contractual terms. The carrying amount of right-of-use assets of € 4.0 billion included in Total Property and equipment as of December 31, 2022 predominantly represented leased properties of € 4.0 billion and vehicle leases of € 10 million. For more information on the Group´s leased properties and related disclosures required under IFRS 16, please refer to Note 22 “Leases”.
312 |
Deutsche Bank | ||
Annual Report 2022 | ||
22 – Leases
The Group’s disclosures are as a lessee under lease arrangements covering property and equipment. The Group has applied judgement in presenting related information pursuant to IFRS 16 in a manner that it considers to be most relevant to an understanding of its financial performance and position.
The Group leases many assets including land and buildings, vehicles and IT equipment. The Group is a lessee for the majority of its offices and branches under long-term rental agreements. Most of the lease contracts are made under usual terms and conditions, which means they include options to extend the lease by a defined amount of time, price adjustment clauses and escalation clauses in line with general office rental market conditions. However, the lease agreements do not include any clauses that impose any restriction on the Group’s ability to pay dividends, engage in debt financing transactions or enter into further lease agreements.
As of December 31, 2022 (December 31, 2021), the Group recorded right-of-use assets on its balance sheet with a carrying amount of € 4.0 billion (€ 3.5 billion), which are included in Property and equipment. The right-of-use assets predominantly represented leased properties of € 4.0 billion (€ 3.5 billion) and vehicle leases of € 10 million (€ 11 million). For more information on the year-to-date development of right-of-use assets, please refer to Note 21 “Property and Equipment”.
Corresponding to the recognition of the right-of-use assets, as of December 31, 2022 (December 31, 2021), the Group recorded lease liabilities on its balance sheet with a carrying amount of € 4.5 billion (€ 4.0 billion), which are included in Other liabilities. As of December 31, 2022, the lease liabilities included the discounted value of future lease payments of € 488 million for the Group headquarters in Frankfurt am Main that was sold and leased back on December 1, 2011. The contract was extended in the fourth quarter 2021 with a fixed term until the end of 2036 and includes two options to extend the lease for two additional 5-year periods up to the end of 2046.
During 2022 and 2021, interest expenses recorded from the compounding of the lease liabilities amounted to € 85 million and € 86 million, respectively. The contractual maturities for the undiscounted cash flows from these liabilities are shown in Note 31 “Maturity Analysis of the earliest contractual undiscounted cash flows of Financial Liabilities”.
Expenses recognized in 2022 (2021) relating to short-term leases and leases of low-value assets, for which the Group decided to apply the recognition exemption under IFRS 16 (and thus not to record right-of-use assets and corresponding lease liabilities on the balance sheet), amounted to € 1 million (€ 2 million) and € 0 million (€ 0 million), respectively.
Income recorded in 2022 (2021) from the subletting of right-of-use assets totaled € 29 million (€ 34 million).
The total cash outflow for leases for 2022 (2021) was € 691 million (€ 767 million) and represented mainly expenditures made for real estate rentals over € 683 million (€ 754 million). Of the total cash outflow amount, payments of € 607 million (€ 679 million) were made for the principal portion of lease liabilities, payments of € 84 million (€ 87 million) were made for the interest portion.
Total future cash outflows to which the Group as a lessee is potentially exposed, that are not reflected in the measurement of the lease liabilities, mainly include potential payment exposures arising from extension options (2022: € 5.7 billion) and future payments for leases not yet commenced, but to which the Group is committed (2022: € 155 million). Their expected maturities are shown in the table below.
Future cash outflows to which the Group is potentially exposed that are not reflected in the measurement of lease liabilities
in € m. | Dec 31, 2022 | Dec 31, 2021 | ||
Future cash outflows not reflected in lease liabilities: | ||||
Not later than one year | 14 | 10 | ||
Later than one year and not later than five years | 613 | 539 | ||
Later than five years | 5,226 | 5,849 | ||
Future cash outflows not reflected in lease liabilities | 5,852 | 6,398 | ||
313 |
Deutsche Bank | ||
Annual Report 2022 | ||
23 – Goodwill and Other Intangible Assets
Goodwill
Changes in Goodwill
The changes in the carrying amount of goodwill, as well as gross amounts and accumulated impairment losses of goodwill, for the years ended December 31, 2022, and December 31, 2021, are shown below by cash-generating units (“CGU”).
The Group’s business operations are organized under the following divisional structure: the Core Bank, which includes the Corporate Bank, Investment Bank, Private Bank and Asset Management corporate divisions and the Capital Release Unit. The corporate divisions as well as the Capital Release Unit each are considered CGUs.
Please also refer to Note 4 “Business Segments and Related Information” for more information regarding changes in the presentation of segment disclosures.
Goodwill allocated to cash-generating units
in € m. | Investment Bank | Corporate Bank | Asset | Private Bank | Total | |||||
Balance as of January 1, 2021 | 0 | 0 | 2,739 | 0 | 2,739 | |||||
Goodwill acquired during the year | 0 | 5 | 0 | 0 | 5 | |||||
Purchase accounting adjustments | 0 | 0 | 0 | 0 | 0 | |||||
Transfers | 0 | 0 | 0 | 0 | 0 | |||||
Reclassification from (to) “held for sale” | 0 | 0 | (56) | 0 | (56) | |||||
Goodwill related to dispositions without being classified as “held for sale” | 0 | 0 | 0 | 0 | 0 | |||||
Impairment losses1 | 0 | (5) | 0 | 0 | (5) | |||||
Exchange rate changes/other | 0 | 0 | 123 | 0 | 123 | |||||
Balance as of December 31, 2021 | 0 | 0 | 2,806 | 0 | 2,806 | |||||
Gross amount of goodwill | 3,854 | 602 | 3,295 | 3,716 | 11,467 | |||||
Accumulated impairment losses | (3,854) | (602) | (489) | (3,716) | (8,662) | |||||
Balance as of January 1, 2022 | 0 | 0 | 2,806 | 0 | 2,806 | |||||
Goodwill acquired during the year | 0 | 0 | 0 | 0 | 0 | |||||
Purchase accounting adjustments | 0 | 0 | 0 | 0 | 0 | |||||
Transfers | 0 | 0 | 0 | 0 | 0 | |||||
Reclassification from (to) “held for sale” | 0 | 0 | 0 | 0 | 0 | |||||
Goodwill related to dispositions without being classified as “held for sale” | 0 | 0 | 0 | 0 | 0 | |||||
Impairment losses1 | 0 | 0 | 0 | 0 | 0 | |||||
Exchange rate changes/other | 0 | 0 | 113 | 0 | 113 | |||||
Balance as of December 31, 2022 | 0 | 0 | 2,919 | 0 | 2,919 | |||||
Gross amount of goodwill | 4,079 | 629 | 3,408 | 3,717 | 11,834 | |||||
Accumulated impairment losses | (4,079) | (629) | (489) | (3,717) | (8,915) | |||||
1Impairment losses of goodwill are recorded as impairment of goodwill and other intangible assets in the income statement.
Changes in goodwill in 2022 only included foreign exchange rate movements of Asset Management goodwill held in non-Group currencies.
Changes in goodwill in 2021 related to the reclassification of € 56 million of Asset Management goodwill to assets held for sale, following the designated sale of DWS’ digital investment platform to a joint venture with BlackFin (see Note 24) and foreign exchange rate movements. Following the acquisition of a payment service provider (Better Payment Germany GmbH) in September 2021 (see Note 3), as part of the purchase price allocation the Group had initially recorded goodwill of € 5 million assigned to the Corporate Bank CGU. Given the valuation of the CGU continued to have a shortfall of its recoverable amount versus its carrying amount, the newly acquired goodwill was considered impaired and fully written off in 2021.
Changes in goodwill in 2020 solely related to foreign exchange rate movements of Asset Management goodwill held in non-Group currencies.
314 |
Deutsche Bank | ||
Annual Report 2022 | ||
Goodwill Impairment Test
For the purposes of impairment testing, goodwill acquired in a business combination is allocated to the appropriate CGU on the basis as described in Note 1 “Significant Accounting Policies and Critical Accounting Estimates”. The Group’s primary CGUs are as outlined above. Asset Management’s goodwill is tested for impairment annually in the fourth quarter by comparing the recoverable amount of the CGU with its carrying amount. In addition, the Group tests goodwill whenever a triggering event is identified. The recoverable amount is the higher of a CGU’s fair value less costs of disposal and its value in use. The Asset Management CGU was the only goodwill carrying CGU to be tested for annual impairment in 2020, 2021 and 2022. The impairment tests conducted on Asset Management in these periods did not result in an impairment loss as the recoverable amounts of the Asset Management CGU was higher than the respective carrying amounts.
A review of the Group’s strategy or certain political or global risks for the banking industry, uncertainties regarding the implementation of already adopted regulation and the introduction of legislation that is already under discussion could result in an impairment of goodwill in the future.
Carrying Amount
The carrying amount of a primary CGU is derived using a capital allocation model based on the Shareholders’ Equity Allocation Framework of the Group (please refer to Note 4, “Business Segments and Related Information” for more details). The allocation uses the Group’s total equity at the date of valuation, including Additional Tier 1 Notes (“AT1 Notes”), which constitute unsecured and subordinated notes of Deutsche Bank and which are classified as additional equity components in accordance with IFRS. Total equity is adjusted for an add-on adjustment for goodwill attributable to noncontrolling interests.
Recoverable Amount
The Group determines the recoverable amounts of its primary CGUs on the basis of the higher of value in use and fair value less costs of disposal (Level 3 of the fair value hierarchy). It employs a discounted cash flow (DCF) model, which reflects the specifics of the banking business and its regulatory environment. The model calculates the present value of the estimated future earnings that are distributable to shareholders after fulfilling the respective regulatory capital requirements. The recoverable amounts also include the fair value of the AT1 Notes, which are allocated to the primary CGUs.
The DCF model uses earnings projections and respective capitalization assumptions based on five-year financial plans as well as longer term expectations on the impact of regulatory developments, which are discounted to their present value. Estimating future earnings and capital requirements involves judgment and the consideration of past and current performances as well as expected developments in the respective markets, and in the overall macroeconomic and regulatory environments. Earnings projections beyond the initial five-year period are, where applicable, adjusted to derive a sustainable level. In case of a going concern, the cash flow to equity is assumed to increase by or converge towards a constant long-term growth rate for the Asset Management CGU of up to 3.0% (2021: up to 2.7%). This is based on projected revenue forecasts of the CGU as well as expectations for the development of gross domestic product and inflation and is captured in the terminal value.
315 |
Deutsche Bank | ||
Annual Report 2022 | ||
Key Assumptions and Sensitivities
Key Assumptions: The DCF value of a CGU is sensitive to the earnings projections, to the discount rate (cost of equity) applied and, to a lesser extent, to the long-term growth rate. The discount rates applied have been determined based on the capital asset pricing model and comprise a risk-free interest rate, a market risk premium and a factor covering the systematic market risk (beta factor). The values for the risk-free interest rate, the market risk premium and the beta factors are determined using external sources of information. CGU-specific beta factors are determined based on a respective group of peer companies. Variations in all of these components might impact the discount rates. For the Asset Management CGU, the discount rates (after tax) applied for 2022 and 2021 were 10.3% and 9.1%, respectively.
Management determined the values for the key assumptions in the following table based on a combination of internal and external analysis. Estimates for efficiency and the cost reduction program are based on progress made to date and scheduled future projects and initiatives.
Key management assumptions are:
Primary goodwill- carrying cash-generating unit | Description of key assumptions | Uncertainty associated with key assumptions and potential events/circumstances that could have a negative effect | |
Asset Management |
|
| |
Sensitivities: In order to test the resilience of the recoverable amount, key assumptions used in the DCF model (for example, the discount rate and the earnings projections) are sensitized. Currently, in Asset Management the recoverable amount exceeds the carrying amount by 14% / € 1.0 billion.
Change in certain key assumptions to cause the recoverable amount to equal the carrying amount
Change in Key Assumptions | Asset Management | |
Discount rate (post tax) increase | ||
from | 10.3% | |
to | 11.3% | |
Change in projected future earnings in each period by | 11.0% | |
Long term growth rate | ||
from | 3.0% | |
to | 1.1% | |
316 |
Deutsche Bank | ||
Annual Report 2022 | ||
Other Intangible Assets
Changes of other intangible assets by asset classes for the years ended December 31, 2022 and December 31, 2021
| Purchased intangible assets | Internally | Total other | |||||||||||||||
Unamortized | Amortized | Amortized | ||||||||||||||||
in € m. | Retail | Other | Total | Customer- | Contract- | Software | Total | Software | ||||||||||
Cost of acquisition/ | ||||||||||||||||||
Balance as of | 945 | 441 | 1,386 | 1,356 | 70 | 778 | 2,204 | 7,910 | 11,499 | |||||||||
Additions | 0 | 0 | 0 | 13 | 0 | 22 | 35 | 1,106 | 1,141 | |||||||||
Changes in the group of | 0 | 0 | 0 | 0 | 0 | 0 | 0 | 5 | 4 | |||||||||
Disposals | 0 | 0 | 0 | 0 | 0 | 12 | 12 | 86 | 98 | |||||||||
Reclassifications from | 0 | 0 | 0 | 0 | 0 | 0 | 0 | (40) | (40) | |||||||||
Transfers | 0 | 0 | 0 | (5) | 0 | 0 | (5) | (1) | (6) | |||||||||
Exchange rate changes | 71 | 1 | 72 | 34 | 0 | 1 | 35 | 125 | 231 | |||||||||
Balance as of | 1,017 | 440 | 1,457 | 1,398 | 70 | 789 | 2,257 | 9,018 | 12,732 | |||||||||
Additions | 0 | 0 | 0 | 0 | 0 | 45 | 45 | 1,145 | 1,191 | |||||||||
Changes in the group of | 0 | 0 | 0 | 0 | 0 | (6) | (6) | (20) | (26) | |||||||||
Disposals | 0 | 0 | 0 | 0 | 0 | 37 | 37 | 122 | 160 | |||||||||
Reclassifications from | 0 | 0 | 0 | 0 | 0 | 0 | 0 | (32) | (32) | |||||||||
Transfers | 0 | 0 | 0 | (9) | 0 | 0 | (9) | 0 | (9) | |||||||||
Exchange rate changes | 67 | 0 | 67 | 32 | 0 | 0 | 32 | 128 | 226 | |||||||||
Balance as of | 1,083 | 441 | 1,524 | 1,421 | 70 | 792 | 2,283 | 10,116 | 13,923 | |||||||||
Accumulated amortization | ||||||||||||||||||
Balance as of | 239 | 439 | 678 | 1,340 | 70 | 633 | 2,043 | 4,793 | 7,513 | |||||||||
Amortization for the year | 0 | 0 | 0 | 6 | 0 | 37 | 43 | 974 | 1,0171 | |||||||||
Changes in the group of | 0 | 0 | 0 | 0 | 0 | 0 | 0 | 0 | (1) | |||||||||
Disposals | 0 | 0 | 0 | 0 | 0 | 12 | 12 | 85 | 97 | |||||||||
Reclassifications from | 0 | 0 | 0 | 0 | 0 | 0 | 0 | (9) | (9) | |||||||||
Impairment losses | 0 | 0 | 0 | 3 | 0 | 0 | 3 | 149 | 1522 | |||||||||
Reversals of impairment | 0 | 0 | 0 | 0 | 0 | 0 | 0 | 0 | 0 | |||||||||
Transfers | 0 | 0 | 0 | 0 | 0 | 3 | 3 | 0 | 2 | |||||||||
Exchange rate changes | 18 | 0 | 18 | 34 | 0 | 1 | 35 | 83 | 136 | |||||||||
Balance as of | 257 | 439 | 696 | 1,383 | 70 | 662 | 2,115 | 5,904 | 8,714 | |||||||||
Amortization for the year | 0 | 0 | 0 | 3 | 0 | 37 | 40 | 980 | 1,0203 | |||||||||
Changes in the group of | 0 | 0 | 0 | 0 | 0 | (6) | (6) | (20) | (26) | |||||||||
Disposals | 0 | 0 | 0 | 0 | 0 | 35 | 35 | 122 | 157 | |||||||||
Reclassifications from | 0 | 0 | 0 | 0 | 0 | 0 | 0 | (25) | (25) | |||||||||
Impairment losses | 68 | 0 | 68 | 0 | 0 | 0 | 0 | 30 | 984 | |||||||||
Reversals of impairment | 0 | 0 | 0 | 3 | 0 | 0 | 3 | 0 | 35 | |||||||||
Transfers | 0 | 0 | 0 | 3 | 0 | 0 | 3 | 0 | 3 | |||||||||
Exchange rate changes | 17 | 0 | 17 | 31 | 0 | 0 | 31 | 78 | 126 | |||||||||
Balance as of | 342 | 439 | 781 | 1,417 | 70 | 659 | 2,146 | 6,824 | 9,750 | |||||||||
Carrying amount: | ||||||||||||||||||
As of December 31, 2021 | 760 | 1 | 761 | 15 | 0 | 128 | 143 | 3,114 | 4,018 | |||||||||
As of December 31, 2022 | 741 | 2 | 743 | 4 | 0 | 133 | 137 | 3,293 | 4,173 | |||||||||
1€ 1.0 billion were included in general and administrative expenses.
2€ 152 million were comprised of impairments of € 149 million on self-developed software and of € 3 million on customer-related intangibles, both recorded in general and administrative expenses.
3 € 1.0 billion were included in general and administrative expenses.
4€ 98 million were comprised of impairments on retail investment management agreements recorded in impairment of goodwill and other intangible assets of € 68 million and of € 30 million on self-developed software recorded in general and administrative expenses.
5 € 3 million were a reversal of impairment losses on customer-related intangibles recorded in general and administrative expenses.
317 |
Deutsche Bank | ||
Annual Report 2022 | ||
Amortizing Intangible Assets
In 2022, amortizing intangible assets increased by net € 173 million. This includes amortization expenses of € 1.0 billion, mostly for the scheduled consumption of capitalized software (€ 1.0 billion) and the impairment of current platform software as well as software under construction (€ 30 million). Additions to internally generated intangible assets of € 1.1 billion resulting from the capitalization of expenses incurred in conjunction with the Group’s development of own-used software overcompensated the negative impact from amortization and impairment charges on net book value. A weaker Euro exchange rate against major currencies accounted for net positive exchange rate changes of € 50 million.
In 2021, amortizing other intangible assets remained nearly unchanged, decreasing only slightly by net € 21 million. This reflects amortization expenses of € 1.0 billion, mostly for the scheduled consumption of capitalized software (€ 1.0 billion) and the impairment of current platform software as well as software under construction (€ 149 million). Additions to internally generated intangible assets of € 1.1 billion resulting from the capitalization of expenses incurred in conjunction with the Group’s development of own-used software compensated for the decrease in net book value. A weaker Euro exchange rate against major currencies accounted for positive exchange rate changes of € 42 million.
In 2020, amortizing other intangible assets decreased by € 161 million. This reduction was driven by amortization expenses of € 1.0 billion, mostly for the scheduled consumption of capitalized software (€ 1.0 billion) and the impairment of current platform software as well as software under construction (€ 50 million). Additions to internally generated intangible assets of € 1.1 billion resulting from the capitalization of expenses incurred in conjunction with the Group’s development of own-used software compensated for the decrease in net book value. A stronger Euro exchange rate against major currencies accounted for negative exchange rate changes of € 112 million.
Other intangible assets with finite useful lives are generally amortized over their useful lives based on the straight-line method.
Useful lives of other amortized intangible assets by asset class
Useful lives | ||
Internally generated intangible assets: | ||
Software | up to 10 | |
Purchased intangible assets: | ||
Customer-related intangible assets | up to 20 | |
Other | up to 10 | |
Unamortized Intangible Assets
Within this asset class, the Group recognizes certain contract-based and marketing-related intangible assets, which are deemed to have an indefinite useful life.
In particular, the asset class comprises the below detailed investment management agreements related to retail mutual funds and certain trademarks. Due to the specific nature of these intangible assets, market prices are ordinarily not observable and, therefore, the Group values such assets based on the income approach, using a post-tax DCF-methodology.
Retail investment management agreements: These assets, amounting to € 741 million, relate to the Group’s U.S. retail mutual fund business and are allocated to the Asset Management CGU. Retail investment management agreements are contracts that give Asset Management the exclusive right to manage a variety of mutual funds for a specified period. Since these contracts are easily renewable at minimal cost, these agreements are not expected to have a foreseeable limit on the contract period. Therefore, the rights to manage the associated assets under management are expected to generate cash flows for an indefinite period of time. This intangible asset was recorded at fair value based upon a valuation provided by a third party at the date of acquisition of Zurich Scudder Investments, Inc. in 2002.
The recoverable amount was calculated as fair value less costs of disposal using the multi-period excess earnings method and the fair value measurement was categorized as Level 3 in the fair value hierarchy. The key assumptions in determining the fair value less costs of disposal include the asset mix, the flows forecast, the effective fee rate and discount rate as well as the terminal value growth rate. The discount rate (cost of equity) applied in the annual impairment test was 10.6% in 2022 (9.8% in 2021). The terminal value growth rate applied for 2022 was 3.8% (for 2021 4.1%). The annual review of the valuation neither resulted in any impairment nor reversal of prior impairments (2021 respectively).
Due to net outflows and change in the discount rate to 10.9% in the fourth quarter, this triggered an indication of impairment and the impairment test was reassessed at year-end. The reassessment resulted in an impairment loss of € 68 million recognized in the Group's income statement within impairment of goodwill and other intangible assets.
318 |
Deutsche Bank | ||
Annual Report 2022 | ||
24 – Non-Current Assets and Disposal Groups Held for Sale
Within the balance sheet, non-current assets and disposal groups held for sale are included in other assets and other liabilities.
in € m. | Dec 31, 2022 | Dec 31, 2021 | ||
Cash and bank balances | 0 | 6 | ||
Loans, net | 40 | 0 | ||
Property and equipment | 0 | 9 | ||
Goodwill and other intangible assets | 0 | 88 | ||
Other assets | 0 | 296 | ||
Total assets classified as held for sale | 40 | 398 | ||
Investment contract liabilities | 208 | 0 | ||
Other liabilities | 0 | 252 | ||
Total liabilities classified as held for sale | 208 | 252 | ||
As of December 31, 2022, and December 31, 2021, no unrealized gains (losses) relating to non-current assets classified as held for sale were recognized directly in accumulated other comprehensive income (loss) (net of tax).
2022
DWS completes closing of transfer of its digital investment platform as part of its partnership with BlackFin
In September 2021, DWS Group (“DWS”) and BlackFin Capital Partners (“BlackFin”) had agreed on a long-term strategic partnership to jointly evolve the digital investment platform into a platform eco system that provides comprehensive solutions and services. It was agreed that DWS would transfer its digital investment platform into a joint venture with BlackFin, maintaining a stake of 30%. The transaction to transfer the digital investment platform into the newly established company MorgenFund GmbH closed as of November 30, 2022. As part of the consideration, the Group received a 30% stake in that company which is accounted for under the equity method and held in the Asset Management division.
Sale of the Italian financial advisors business to Zurich Italy
In August 2021, Deutsche Bank and Zurich Insurance Group Italy (“Zurich Italy”) reached an agreement with Zurich Italy Bank S.p.A. to acquire Deutsche Bank’s Financial Advisors business in Italy. Closing of the sale was announced on October 17, 2022. Under the terms of the agreement, a total of 1,085 Financial Advisors, 96 employees, and approximately € 16 billion in assets under management (of which € 1 billion Discretionary Portfolio Management still managed by Deutsche Bank) have passed to Zurich Bank Italy S.p.A. The pre-tax gain on sale totaled € 312 million and was recorded in the Private Bank segment results in the fourth quarter of 2022.
2021
Transfer of Global Prime Finance & Electronic Equities platform to BNP Paribas completed
As part of the Group’s strategic transformation and restructuring plans announced in July 2019, Deutsche Bank had disclosed the exit of its Equities Sales & Trading business. In this context, Deutsche Bank entered into an agreement with BNP Paribas S.A. (“BNP Paribas “) to transfer technology and staff to BNP Paribas and to continue to operate the platform until clients are migrated to BNP Paribas. The Group and BNP Paribas announced on January 5, 2022 that the transfer of clients, technology and key staff to BNP Paribas has been successfully completed by the end of 2021, in line with the targeted timeline.
319 |
Deutsche Bank | ||
Annual Report 2022 | ||
25 – Other Assets and Other Liabilities
in € m. | Dec 31, 2022 | Dec 31, 2021 | ||
Brokerage and securities related receivables | ||||
Cash/margin receivables | 50,394 | 48,675 | ||
Receivables from prime brokerage | 4 | 5 | ||
Pending securities transactions past settlement date | 2,385 | 3,579 | ||
Receivables from unsettled regular way trades | 18,467 | 19,236 | ||
Total brokerage and securities related receivables | 71,250 | 71,495 | ||
Debt Securities held to collect | 25,500 | 14,800 | ||
Accrued interest receivable | 3,588 | 2,084 | ||
Assets held for sale | 40 | 398 | ||
Other | 17,916 | 15,008 | ||
Total other assets | 118,293 | 103,785 | ||
in € m. | Dec 31, 2022 | Dec 31, 2021 | ||
Brokerage and securities related payables | ||||
Cash/margin payables | 62,824 | 52,875 | ||
Payables from prime brokerage | 24 | 583 | ||
Pending securities transactions past settlement date | 2,982 | 1,549 | ||
Payables from unsettled regular way trades | 16,882 | 15,158 | ||
Total brokerage and securities related payables | 82,711 | 70,165 | ||
Accrued interest payable | 2,826 | 1,625 | ||
Liabilities held for sale | 208 | 252 | ||
Lease liabilities | 4,470 | 3,965 | ||
Other | 23,500 | 21,789 | ||
Total other liabilities | 113,714 | 97,796 | ||
For further details on the assets and liabilities held for sale, please refer to Note 24 “Non-Current Assets and Disposal Groups Held for Sale”.
26 – Deposits
in € m. | Dec 31, 2022 | Dec 31, 2021 | ||
Noninterest-bearing demand deposits | 246,804 | 225,782 | ||
Interest-bearing deposits | ||||
Demand deposits | 131,370 | 167,590 | ||
Time deposits | 158,851 | 122,478 | ||
Savings deposits | 84,431 | 87,901 | ||
Total interest-bearing deposits | 374,652 | 377,969 | ||
Total deposits | 621,456 | 603,750 | ||
320 |
Deutsche Bank | ||
Annual Report 2022 | ||
27 – Provisions
Movements by Class of Provisions
in € m. | Operational | Civil | Regulatory | Re- | Other | Total1 | ||||||
Balance as of January 1, 2021 | 89 | 355 | 492 | 676 | 396 | 2,007 | ||||||
Changes in the group of consolidated companies | 0 | 0 | 0 | 0 | 2 | 2 | ||||||
New provisions | 62 | 475 | 110 | 302 | 641 | 1,590 | ||||||
Amounts used | 2 | 112 | 113 | 339 | 470 | 1,036 | ||||||
Unused amounts reversed | 106 | 78 | 40 | 58 | 151 | 434 | ||||||
Effects from exchange rate fluctuations/Unwind of discount | 0 | 6 | 26 | 1 | 7 | 40 | ||||||
Transfers | (0) | (1) | 0 | (0) | 24 | 22 | ||||||
Balance as of December 31, 2021 | 42 | 644 | 475 | 582 | 448 | 2,192 | ||||||
Changes in the group of consolidated companies | 0 | 0 | 0 | 0 | (0) | (0) | ||||||
New provisions | 14 | 285 | 290 | 3 | 653 | 1,246 | ||||||
Amounts used | 3 | 136 | 216 | 201 | 582 | 1,138 | ||||||
Unused amounts reversed | 8 | 166 | 0 | 137 | 110 | 421 | ||||||
Effects from exchange rate fluctuations/Unwind of discount | (0) | 1 | 23 | 0 | 1 | 26 | ||||||
Transfers | 0 | (1) | (3) | 1 | (13) | (16) | ||||||
Balance as of December 31, 2022 | 45 | 627 | 570 | 248 | 398 | 1,888 | ||||||
1For the remaining portion of provisions as disclosed on the consolidated balance sheet, please see Note 19 “Allowance for Credit Losses”, in which allowances for credit related off-balance sheet positions are disclosed.
Classes of Provisions
Operational Risk Operational risk is the risk of loss resulting from inadequate or failed internal processes, people and systems, or from external events. The definition used for the purposes of determining operational provisions differs from the risk management definition, as it excludes risk of loss resulting from civil litigation and regulatory enforcement matters. For risk management purposes, operational risk includes legal risk, as payments to customers, counterparties and regulatory bodies in civil litigations or regulatory enforcement matters constitute loss events for operational shortcomings, but excludes business and reputational risk.
Civil Litigation provisions arise out of current or potential claims or proceedings alleging non-compliance with contractual or other legal or regulatory responsibilities, which have resulted or may result in demands from customers, counterparties or other parties in civil litigations.
Regulatory Enforcement provisions arise out of current or potential claims or proceedings alleging non-compliance with legal or regulatory responsibilities, which have resulted or may result in an assessment of fines or penalties by governmental regulatory agencies, self-regulatory organizations or other enforcement authorities.
Restructuring provisions arise out of restructuring activities. The Group aims to enhance its long-term competitiveness through major reductions in costs, duplication and complexity in the years ahead. For details see Note 10 “Restructuring”.
Other provisions include several specific items arising from a variety of different circumstances, including the provision for the reimbursement of loan processing fees, deferred sales commissions, provisions for bank levies and mortgage repurchase demands.
Provisions and Contingent Liabilities
The Group recognizes a provision for potential loss only when there is a present obligation arising from a past event that is probable to result in an economic outflow that can be reliably estimated. Where a reliable estimate cannot be made for such an obligation, no provision is recognized and the obligation is deemed a contingent liability. Contingent liabilities also include possible obligations for which the possibility of future economic outflow is more than remote but less than probable. Where a provision has been taken for a particular claim, no contingent liability is recorded; for matters or sets of matters consisting of more than one claim, however, provisions may be recorded for some claims, and contingent liabilities (or neither a provision nor a contingent liability) may be recorded for others.
The Group operates in a legal and regulatory environment that exposes it to significant litigation risks. As a result, the Group is involved in litigation, arbitration and regulatory proceedings and investigations in Germany and in a number of jurisdictions outside Germany, including the United States. In recent years, regulation and supervision in a number of areas have increased, and regulators, governmental bodies and others have sought to subject financial services providers to increasing oversight and scrutiny, which in turn has led to additional regulatory investigations and enforcement actions which are often followed by civil litigation.
321 |
Deutsche Bank | ||
Annual Report 2022 | ||
In determining for which of the claims the possibility of a loss is probable, or less than probable but more than remote, and then estimating the possible loss for those claims, the Group takes into consideration a number of factors, including but not limited to the nature of the claim and its underlying facts, the procedural posture and litigation history of each case, rulings by the courts or tribunals, the Group’s experience and the experience of others in similar cases (to the extent this is known to the Group), prior settlement discussions, settlements by others in similar cases (to the extent this is known to the Group), available indemnities and the opinions and views of legal counsel and other experts.
The provisions the Group has recognized for civil litigation and regulatory enforcement matters as of December 31, 2022 and December 31, 2021 are set forth in the table above. For some matters no provision was recognized when the Group believes an outflow of funds is probable, but the Group could not reliably estimate the amount of the potential outflow.
For the matters for which a reliable estimate can be made, the Group currently estimates that, as of December 31, 2022, the aggregate future loss of which the possibility is more than remote but less than probable is approximately € 1.8 billion for civil litigation matters (December 31, 2021: € 1.7 billion) and € 0.1 billion for regulatory enforcement matters (December 31, 2021: € 0.1 billion). These figures include matters where the Group’s potential liability is joint and several and where the Group expects any such liability to be paid by a third party. For other significant civil litigation and regulatory enforcement matters, the Group believes the possibility of an outflow of funds is more than remote but less than probable but the amount is not reliably estimable, and accordingly such matters are not included in the contingent liability estimates. For still other significant civil litigation and regulatory enforcement matters, the Group believes the possibility of an outflow of funds is remote and therefore has neither recognized a provision nor included them in the contingent liability estimates.
This estimated possible loss, as well as any provisions taken, is based upon currently available information and is subject to significant judgment and a variety of assumptions, variables and known and unknown uncertainties. These uncertainties may include inaccuracies in or incompleteness of the information available to the Group, particularly at the preliminary stages of matters, and assumptions by the Group as to future rulings of courts or other tribunals or the likely actions or positions taken by regulators or adversaries may prove incorrect. Moreover, estimates of possible loss for these matters are often not amenable to the use of statistical or other quantitative analytical tools frequently used in making judgments and estimates, and are subject to even greater degrees of uncertainty than in many other areas where the Group must exercise judgment and make estimates. The estimated possible loss, as well as any provisions taken, can be and often are substantially less than the amount initially requested by regulators or adversaries or the maximum potential loss that could be incurred were the matters to result in a final adjudication adverse to the Group. Moreover, in several regions in which the Group operates, an adversary often is not required to set forth the amount it is seeking, and where it is, the amount may not be subject to the same requirements that generally apply to pleading factual allegations or legal claims.
The matters for which the Group determines that the possibility of a future loss is more than remote will change from time to time, as will the matters as to which a reliable estimate can be made and the estimated possible loss for such matters. Actual results may prove to be significantly higher or lower than the estimate of possible loss in those matters where such an estimate was made. In addition, loss may be incurred in matters with respect to which the Group believed the likelihood of loss was remote. In particular, the estimated aggregate possible loss does not represent the Group’s potential maximum loss exposure for those matters.
The Group may settle litigation or regulatory proceedings or investigations prior to a final judgment or determination of liability. It may do so to avoid the cost, management efforts or negative business, regulatory or reputational consequences of continuing to contest liability, even when the Group believes it has valid defenses to liability. It may also do so when the potential consequences of failing to prevail would be disproportionate to the costs of settlement. Furthermore, the Group may, for similar reasons, reimburse counterparties for their losses even in situations where it does not believe that it is legally compelled to do so.
Current Individual Proceedings
Set forth below are descriptions of civil litigation and regulatory enforcement matters or groups of matters for which the Group has taken material provisions, or for which there are material contingent liabilities that are more than remote, or for which there is the possibility of material business or reputational risk; similar matters are grouped together and some matters consist of a number of proceedings or claims. The disclosed matters also include matters for which the possibility of a loss is more than remote but for which the Group cannot reliably estimate the possible loss. Matters are presented below in English-language alphabetical order based on the titles the Group has used for them.
322 |
Deutsche Bank | ||
Annual Report 2022 | ||
Anti-Money Laundering Matters Involving Former Correspondent Banking Relationships. Deutsche Bank has received requests for information from government authorities concerning certain former correspondent banking relationships, including Danske Bank. Deutsche Bank has provided information to and is otherwise cooperating with the investigating authorities. The bank also completed an internal investigation focused on the bank’s historical processing of correspondent banking transactions on behalf of customers of Danske Bank’s Estonia branch prior to cessation of the correspondent banking relationship with that branch in 2015, including of whether any violations of law, regulation or bank policy occurred and the effectiveness of the related internal control environment.
The Group has not disclosed whether it has established a provision or contingent liability with respect to these investigations because it has concluded that such disclosure can be expected to prejudice seriously their outcome.
On July 7, 2020, the New York State Department of Financial Services (DFS) issued a Consent Order, finding that Deutsche Bank violated New York State banking laws in connection with its relationships with three former Deutsche Bank clients, Danske Bank’s Estonia branch, Jeffrey Epstein and FBME Bank, and imposing a U.S. $ 150 million civil penalty in connection with these three former relationships, which Deutsche Bank paid in the third quarter of 2020.
On July 15, 2020, Deutsche Bank was named as a defendant in a securities class action filed in the U.S. District Court for the District of New Jersey, alleging that the bank made material misrepresentations regarding the effectiveness of its anti-money laundering (AML) controls and related remediation. The complaint cited allegations regarding control deficiencies raised in the DFS Consent Order related to the bank’s relationships with Danske Bank’s Estonia branch, Jeffrey Epstein and FBME Bank. On March 31, 2022, the court granted a motion to transfer the action to the U.S. District Court for the Southern District of New York (SDNY) and on May 18, 2022, the SDNY court granted in part and denied in part the motion to dismiss. On September 23, 2022, Deutsche Bank executed a settlement agreement with plaintiffs in the amount of U.S. $ 26.25 million to resolve this action, and has recorded a provision in the same amount. On February 6, 2023, the Court entered a final judgment and order of dismissal with prejudice, approving the settlement and dismissing the action with prejudice.
Ongoing Regulatory Discussions. Deutsche Bank is engaged in ongoing regulatory discussions to resolve matters concerning adherence to prior orders and settlements related to sanctions and embargoes and AML compliance, and remedial agreements and obligations related to risk management issues.
The Group has not disclosed whether it has established a provision or contingent liability with respect to this matter because it has concluded that such disclosure can be expected to prejudice seriously the outcome.
BGH. On April 27, 2021, the German Federal Court of Justice (BGH) issued a ruling that certain clauses used in Deutsche Bank’s General Terms and Conditions, which assume the customer consents following a notice and non-objection period, are void in relation to consumers (Verbraucher). The Group received the written reasoning for this judgment on May 27, 2021. The relevant clauses were widely used in the German banking industry. The BGH overturned the prior decisions of both the Regional Court and Higher Regional Court of Cologne, which had dismissed the claim brought forward by a consumer protection association. As a result of this ruling, fees introduced or increased since 2018 on the basis of this modification mechanism are potentially ineffective and consumers (Verbraucher) can claim repayment of respective banking fees. The Group has a civil litigation class provision of approximately € 6 million as of December 31, 2022 with respect to this matter.
Cum-ex Investigations and Litigations. Deutsche Bank has received inquiries from law enforcement authorities, including requests for information and documents, in relation to cum-ex transactions of clients. “Cum-ex” refers to trading activities in German shares around dividend record dates (trade date before and settlement date after dividend record date) for the purpose of obtaining German tax credits or refunds in relation to withholding tax levied on dividend payments including, in particular, transaction structures that have resulted in more than one market participant claiming such credit or refund with respect to the same dividend payment. Deutsche Bank is cooperating with the law enforcement authorities in these matters.
The Public Prosecutor in Cologne (Staatsanwaltschaft Köln, “CPP”) has been conducting a criminal investigation since August 2017 concerning two former employees of Deutsche Bank in relation to cum-ex transactions of certain former clients of the bank. Deutsche Bank is a potential secondary participant pursuant to Section 30 of the German Law on Administrative Offences in this proceeding. Deutsche Bank is cooperating with the CPP. At the end of May and beginning of June 2019, the CPP initiated criminal investigations against further current and former employees of Deutsche Bank and five former Management Board members. In July 2020, in the course of inspecting the CPP’s investigation file, Deutsche Bank learned that the CPP had further extended its investigation to include further current and former bank personnel, including one former and one then current Management Board member. In October 2022, the CPP conducted a search at Deutsche Bank’s offices in Frankfurt and Eschborn. Based on the search warrant the CPP expanded the scope of the investigation and included further current and former Deutsche Bank employees and one additional former Management Board member in the investigation. The investigation is still at an early stage and the scope of the investigation may be further broadened.
323 |
Deutsche Bank | ||
Annual Report 2022 | ||
In May 2021, Deutsche Bank learned through an information request received by Deutsche Oppenheim Family Office AG (“DOAG”) as legal successor of Sal. Oppenheim jr. & Cie. AG & Co. KGaA (“Sal. Oppenheim”) that the CPP in 2021 opened a criminal investigation proceeding in relation to cum-ex transactions against unknown former personnel of Sal. Oppenheim. DOAG provided the requested information on September 13 and October 15, 2021.
Deutsche Bank acted as participant in and filed withholding tax refund claims through the electronic refund procedure (elektronisches Datenträgerverfahren) on behalf of, inter alia, two former custody clients in connection with their cum-ex transactions. In February 2018, Deutsche Bank received from the German Federal Tax Office (Bundeszentralamt für Steuern, “FTO”) a demand of approximately € 49 million for tax refunds paid to a former custody client. Deutsche Bank expects to receive a formal notice for the same amount. On December 20, 2019, Deutsche Bank received a liability notice from the FTO requesting payment of € 2.1 million by January 20, 2020 in connection with tax refund claims Deutsche Bank had submitted on behalf of another former custody client. In 2020, Deutsche Bank made the requested payment and filed an objection against the liability notice. On July 28, 2021, Deutsche Bank received a letter from the FTO stating that the revised tax assessment notice dated December 2019 was not a valid administrative act as it could not be served to Deutsche Bank’s client due to its liquidation already in 2016. On the same day, FTO issued another liability notice to Deutsche Bank arguing that it issued incorrect tax certificates. On May 30, 2022, Deutsche Bank’s objections against the liability notices were rejected. On July 1, 2022, Deutsche Bank filed a claim against this rejection with the Fiscal Court of Cologne (Finanzgericht Köln).
By letter dated February 26, 2018, The Bank of New York Mellon SA/NV (“BNY”) informed Deutsche Bank of its intention to seek indemnification for potential cum-ex related tax liabilities incurred by BHF Asset Servicing GmbH (“BAS”) and/or Frankfurter Service Kapitalanlage-GmbH (“Service KAG”, now named BNY Mellon Service Kapitalanlage-Gesellschaft mbH). Deutsche Bank had acquired BAS and Service KAG as part of the acquisition of Sal. Oppenheim in 2010 and sold them to BNY in the same year. BNY estimates the potential tax liability to amount to up to € 120 million (excluding interest of 6% p.a.). In November and December 2020 counsel to BNY informed Deutsche Bank that BNY and/or Service KAG (among others) have received notices from tax authorities in the estimated amount with respect to cum-ex related trades by certain investment funds in 2009 and 2010. BNY has filed objections against the notices. Following receipt of payment orders from tax authorities in the amount of € 60.6 million in relation to one of the investment funds and after consultation with Deutsche Bank, BNY in September 2022 paid € 13.6 million to tax authorities. The remaining € 47 million in relation to that fund were paid by Warburg Invest Kapitalanlagegesellschaft mbH (the investment fund’s manager). Further, following receipt of payment orders from tax authorities in the amount of € 11.8 million regarding another one of the investment funds and after consultation with Deutsche Bank, BNY in January/February 2023 paid € 7.9 million to tax authorities. The remaining € 3.9 million was paid by Hansainvest Hanseatische Investment-GmbH (the investment fund’s manager). In addition, BNY received from the Frankfurt Tax Office regarding another one of the investment funds a notice and payment request regarding penalty interest (Hinterziehungszinsen) in the amount of € 11.6 million with a payment deadline of February 13, 2023. BNY, after consultation with Deutsche Bank, applied for a suspension of enforcement (Aussetzung der Vollziehung) regarding the payment request. The underlying liability amount regarding this fund paid by BNY, after consultation with Deutsche Bank, to the Frankfurt Tax Office in 2021 was € 18.3 million.
On February 6, 2019, the Regional Court (Landgericht) Frankfurt am Main served Deutsche Bank with a claim by M.M.Warburg & CO Gruppe GmbH and M.M.Warburg & CO (AG & Co.) KGaA (together “Warburg”) in connection with cum-ex transactions of Warburg with a custody client of Deutsche Bank during 2007 to 2011. Warburg claimed from Deutsche Bank indemnification against German taxes in relation to transactions conducted in the years 2007 to 2011. Further, Warburg claimed compensation of unspecified damages relating to these transactions. Based on the tax assessment notices received for 2007 to 2011, Warburg claimed a total of € 250 million (of which € 166 million is in relation to taxes and € 84 million is in relation to interest). On March 20, 2020, Warburg extended its claim against Deutsche Bank to indemnify Warburg in relation to a € 176 million (thereof € 166 million in relation to taxes and € 10 million in relation to interest) criminal confiscation order issued by the Regional Court Bonn in the criminal cum-ex trial on March 18, 2020 regarding the same transactions. On July 28, 2021, the German Federal Court of Justice (BGH) confirmed the criminal confiscation. On September 23, 2020, the Frankfurt Regional Court fully dismissed Warburg’s claim against Deutsche Bank on the grounds that Warburg as the tax debtor (Steuerschuldner) is primarily liable and cannot request payment from Deutsche Bank. The court further held that any claims are time-barred. On October 29, 2020, Warburg appealed the decision with the Higher Regional Court (Oberlandesgericht) Frankfurt am Main. On December 1, 2021, Warburg reduced its claim from the first instance proceeding. Warburg now claims € 86 million (thereof € 63 million in relation to taxes and € 23 million in relation to interest). Further, Warburg claims an amount of € 54 million in relation to the criminal confiscation. In a judgment dated March 2, 2022, the Higher Regional Court (Oberlandesgericht) Frankfurt am Main fully dismissed Warburg’s appeal. The court did not admit an appeal of its decision to the German Federal Court of Justice (BGH). Warburg filed an appeal against this non-admission (Nichtzulassungsbeschwerde).
324 |
Deutsche Bank | ||
Annual Report 2022 | ||
On January 25, 2021, the Regional Court (Landgericht) Hamburg served Deutsche Bank with a claim by Warburg Invest Kapitalanlagegesellschaft mbH (“Warburg Invest”) in relation to transactions of two investment funds in 2009 and 2010, respectively. Warburg Invest was fund manager for both funds. Warburg Invest claims, from Deutsche Bank together with several other parties as joint and several debtors (Gesamtschuldner), indemnification against German taxes in relation to cum-ex transactions conducted by the two funds. Further, Warburg Invest claims compensation of unspecified damages relating to these transactions. In November 2020, Warburg Invest received a tax liability notice from tax authorities for one of the funds in the amount of € 61 million. Based on publicly available information Deutsche Bank estimates the tax amount for the second fund to be approximately € 49 million. Warburg Invest filed its claim against several parties including Deutsche Bank inter alia based on an allegation of intentional damage contrary to public policy (Section 826 German Civil Code) and the accusation that Deutsche Bank participated in a business model that was contrary to public policy (sittenwidriges Geschäftsmodell). On July 5, 2021, Deutsche Bank submitted its defense statement to the court. On December 31, 2021, two other defendants of the proceeding served a notice of dispute (Streitverkündung) to several parties including Deutsche Bank. On September 30, 2022, Warburg Invest withdrew its litigation (Rücknahme der Klage) as far as it relates to Deutsche Bank.
On February 26, 2021, the Regional Court (Landgericht) Frankfurt am Main served Deutsche Bank with a claim by Seriva Vermögensverwaltungs GmbH (“Seriva”). Seriva requested that Deutsche Bank reissue certain tax certificates (Steuerbescheinigungen) that Deutsche Bank withdrew in April 2017 in light of Seriva’s cum-ex transactions. Deutsche Bank responded to Seriva’s statement of claim on April 6, 2021. On July 5, 2021, Deutsche Bank received a reply brief from Seriva. Deutsche Bank responded on August 17, 2021. The hearing took place on February 7, 2022. In a judgment dated February 28, 2022, the court dismissed Seriva’s claim. Seriva did not appeal the decision and thus the dismissal is final and binding.
The Group has not disclosed whether it has established a provision or contingent liability with respect to these matters because it has concluded that such disclosure can be expected to prejudice seriously their outcome.
FX Investigations and Litigations. Deutsche Bank has received requests for information from certain regulatory and law enforcement agencies globally who investigated trading in, and various other aspects of, the foreign exchange market. Deutsche Bank cooperated with these investigations. Relatedly, Deutsche Bank has conducted its own internal global review of foreign exchange trading and other aspects of its foreign exchange business.
On November 7, 2018, a group of asset managers opted out of a consolidated class settlement and filed litigation on an individual basis (Allianz, et al. v. Bank of America Corporation, et al.). Defendants’ motion to dismiss was granted and denied in part on May 28, 2020. Plaintiffs filed a third amended complaint on July 28, 2020. Fact discovery substantially concluded in 2022 and expert discovery is underway. Deutsche Bank has also been named as a defendant in an amended and consolidated class action filed in Israel. This action asserts factual allegations similar to those made in the consolidated action in the United States and seeks damages pursuant to Israeli antitrust law as well as other causes of action. This action is in preliminary stages.
On November 11, 2020, Deutsche Bank was named in an action issued in the UK High Court of Justice (Commercial Court) brought by many of the same plaintiffs who brought Allianz, et al. v. Bank of America Corporation, et al. referred to above. The claim is based upon factual allegations similar to those made in Allianz, et al. v. Bank of America Corporation, et al. On March 4, 2022, the High Court ordered that the proceedings be transferred to the UK Competition Appeal Tribunal. The proceedings are at the pleadings stage. Deutsche Bank has reached an agreement in principle to resolve the Allianz proceedings in the US and UK.
On May 4, 2021, Deutsche Bank S.A. – Banco Alemao was named in a civil antitrust action brought in the São Paulo Civil Court of Central Jurisdiction by the Association of Brazilian Exporters (AEB) against certain FX dealers and affiliated financial institutions in Brazil. This action asserts factual allegations based on conduct investigated by the Brazilian competition authority, CADE, and seeks damages pursuant to Brazilian antitrust law. On February 22, 2022, the presiding judge dismissed the action on the basis that the action was not appropriate for a class proceeding. AEB has appealed the decision. Deutsche Bank has not yet been served.
The Group has not disclosed whether it has established a provision or contingent liability with respect to these matters because it has concluded that such disclosure can be expected to seriously prejudice their outcome.
325 |
Deutsche Bank | ||
Annual Report 2022 | ||
Interbank and Dealer Offered Rates Matters. Regulatory and Law Enforcement Matters. Deutsche Bank has responded to requests for information from, and cooperated with, various regulatory and law enforcement agencies, in connection with industry-wide investigations concerning the setting of the London Interbank Offered Rate (LIBOR), Euro Interbank Offered Rate (EURIBOR), Tokyo Interbank Offered Rate (TIBOR) and other interbank and/or dealer offered rates.
From 2013 through 2017, Deutsche Bank entered into settlements with the European Commission, the U.S. Department of Justice (DOJ), the U.S. Commodity Futures Trading Commission (CFTC), the UK Financial Conduct Authority (FCA), the DFS and other regulators with respect to interbank and dealer offered rates matters. Other investigations of Deutsche Bank concerning the setting of various interbank and/or dealer offered rates remain ongoing.
The Group has not disclosed whether it has established a provision or contingent liability with respect to the remaining investigations because it has concluded that such disclosure can be expected to seriously prejudice their outcome.
Overview of Civil Litigations. Deutsche Bank is party to 7 U.S. civil actions concerning alleged manipulation relating to the setting of various interbank and/or dealer offered rates which are described in the following paragraphs, as well as actions pending in each of the UK, Israel, Argentina and Spain. Most of the civil actions, including putative class actions, are pending in the U.S. District Court for the Southern District of New York (SDNY), against Deutsche Bank and numerous other defendants. All but two of the U.S. civil actions were filed on behalf of parties who allege losses as a result of manipulation relating to the setting of U.S. dollar LIBOR. The two U.S. civil actions pending against Deutsche Bank that do not relate to U.S. dollar LIBOR were also filed in the SDNY, and include one consolidated action concerning Pound Sterling (GBP) LIBOR and one action concerning Swiss franc (CHF) LIBOR.
Claims for damages for all 7 of the U.S. civil actions discussed have been asserted under various legal theories, including violations of the U.S. Commodity Exchange Act, federal and state antitrust laws, the U.S. Racketeer Influenced and Corrupt Organizations Act, and other federal and state laws. The Group has not disclosed whether it has established a provision or contingent liability with respect to these matters because it has concluded that such disclosure can be expected to prejudice seriously their outcome.
U.S. dollar LIBOR. With one exception, all of the U.S. civil actions concerning U.S. dollar LIBOR are being coordinated as part of a multidistrict litigation (the “U.S. dollar LIBOR MDL”) in the SDNY. In light of the large number of individual cases pending against Deutsche Bank and their similarity, the civil actions included in the U.S. dollar LIBOR MDL are now subsumed under the following general description of the litigation pertaining to all such actions, without disclosure of individual actions except when the circumstances or the resolution of an individual case is material to Deutsche Bank.
Following a series of decisions in the U.S. dollar LIBOR MDL between March 2013 and March 2019 narrowing their claims, plaintiffs are currently asserting antitrust claims, claims under the U.S. Commodity Exchange Act and U.S. Securities Exchange Act and state law fraud, contract, unjust enrichment and other tort claims. The court has also issued decisions dismissing certain plaintiffs’ claims for lack of personal jurisdiction and on statute of limitations grounds.
On December 20, 2016, the district court issued a ruling dismissing certain antitrust claims while allowing others to proceed. Multiple plaintiffs have filed appeals of the district court’s December 20, 2016 ruling to the U.S. Court of Appeals for the Second Circuit, and those appeals proceeded in parallel with the ongoing proceedings in the district court. On December 30, 2021, the Second Circuit affirmed the district court’s decision on antitrust standing grounds but reversed the court’s decision on personal jurisdiction grounds, and it remanded the cases to the district court for further proceedings. On March 9, 2022, defendants (including Deutsche Bank) filed a petition for a writ of certiorari to the U.S. Supreme Court to review the Court of Appeals’ December 30, 2021 decision. The U.S. Supreme Court denied defendants’ petition on June 21, 2022.
On December 13, 2022, plaintiff in a formerly stayed class action pending as part of the U.S. dollar LIBOR MDL (Guaranty Bank & Trust Co. v. Credit Suisse Group AG, et al.) filed a notice of voluntary dismissal, dismissing its case in its entirety. The court terminated the plaintiff from the MDL on December 14, 2022.
On January 11, 2023, Deutsche Bank and the plaintiff in a non-class action pending as part of the U.S. dollar LIBOR MDL (City of Houston v. Bank of America Corp., et al.) stipulated to the dismissal of plaintiff’s claims against Deutsche Bank. The court dismissed the plaintiff’s claims on January 12, 2023. On January 11, 2023, Deutsche Bank and the plaintiffs in ten consolidated non-class actions pending as part of the U.S. dollar LIBOR MDL (The Regents of the University of California v. Bank of America Corp., et al.; City of Richmond, et al. v. Bank of America Corp., et al.; City of Riverside, et al. v. Bank of America Corp., et al.; County of Mendocino v. Bank of America Corp., et al.; County of Sacramento v. Bank of America Corp., et al.; County of San Diego v. Bank of America Corp., et al.; County of San Mateo, et al. v. Bank of America Corp., et al.; County of Sonoma, et al. v. Bank of America Corp., et al.; East Bay Municipal Utility District v. Bank of America Corp., et al.; and San Diego Association of Governments v. Bank of America Corp., et al.) stipulated to the dismissal of plaintiffs’ claims against Deutsche Bank. The court dismissed the plaintiffs’ claims on January 12, 2023.
326 |
Deutsche Bank | ||
Annual Report 2022 | ||
On January 17, 2023, plaintiff in a formerly stayed non-class action pending as part of the U.S. dollar LIBOR MDL (George Maragos v. Bank of America Corp., et al.) filed a notice of voluntary dismissal, dismissing its case in its entirety.
In August 2020, plaintiffs filed a non-class action in the U.S. District Court for the Northern District of California against several financial institutions, alleging that U.S. dollar LIBOR has been suppressed through the present. On November 10, 2020, plaintiffs moved the court for a preliminary and permanent injunction. On November 11, 2020, certain defendants moved to transfer the action to the SDNY; briefing of that motion is complete. On May 24, 2021, plaintiffs filed a motion for an order to show cause why the court should not order plaintiffs’ previously requested injunction. Defendants moved to strike the motion. On June 3, 2021, the court issued an order (i) denying defendants’ motion to transfer the action to the SDNY, (ii) denying defendants’ motion to strike plaintiffs’ May 24 motion and (iii) setting a hearing for the injunction motions for September 9, 2021. On September 9, 2021, the court held a hearing on the injunction motions and tentatively denied the motions. On December 23, 2021, the court issued a written decision denying the injunction motions. On September 13, 2022, the court granted the defendants’ motion to dismiss, but granted plaintiffs leave to amend. On October 5, 2022, plaintiffs filed an amended complaint. Defendants filed a motion to dismiss the amended complaint on November 4, 2022, which remains pending. This action is not part of the U.S. dollar LIBOR MDL.
There is a further UK civil action regarding U.S. dollar LIBOR brought by the U.S. Federal Deposit Insurance Corporation (FDIC) acting as received for 19 failed financial institutions headquartered in the U.S., in which a claim for damages has been asserted pursuant to Article 101 of The Treaty on the Functioning of the European Union, Section 2 of Chapter 1 of the UK Competition Act 1998 and U.S. state laws. In February 2022, following a ruling issued by the U.S. Court of Appeals for the Second Circuit in relation to USD LIBOR antitrust claims, the UK LIBOR proceedings were stayed until July 31, 2022, to allow for clarification of the position in relation to the parallel proceedings brought by the FDIC against Deutsche Bank in the U.S. The FDIC filed an application to reinstate proceedings in the United States on July 18, 2022. Following the expiration of the UK stay, at a case management conference that took place in December 2022, the UK Court ordered a trial of a sample of three of the failed financial institutions. This ‘sample bank’ trial has been listed for a 19-week trial in February 2026. On December 28, 2022, the SDNY granted the FDIC’s application to reinstate certain of its claims against Deutsche Bank (and the other foreign defendants) in the U.S. to the extent these claims survived a motion to dismiss on the merits and subject to defendants’ reservation of rights to dispute the claims in the future.
A further class action regarding LIBOR has been filed in Argentina seeking damages for losses allegedly suffered by holders of Argentine bonds with interest rates based on LIBOR. Deutsche Bank is defending this action.
SIBOR and SOR. A putative class action alleging manipulation of the Singapore Interbank Offered Rate (SIBOR) and Swap Offer Rate (SOR) remains pending. On July 26, 2019, the SDNY granted defendants’ motion to dismiss the action, dismissing all claims against Deutsche Bank, and denied plaintiff’s motion for leave to file a fourth amended complaint. Plaintiff appealed that decision to the U.S. Court of Appeals for the Second Circuit. On March 17, 2021, the court reversed the SDNY’s decision and remanded the case to the district court. On October 1, 2021, defendants (including Deutsche Bank) filed a petition for a writ of certiorari to the U.S. Supreme Court to review the Court of Appeals’ March 17, 2021 decision. The petition was denied on January 10, 2022. On October 25, 2021, plaintiffs filed their fourth amended complaint, which defendants moved to dismiss on November 24, 2021. On March 17, 2022, Deutsche Bank executed a settlement agreement with plaintiffs in the amount of U.S. $ 11 million to resolve this action. On June 9, 2022, the court granted preliminary approval of the settlement. On October 10, 2022, plaintiffs filed a motion seeking final approval of the settlement. On November 29, 2022, the court granted final approval of the settlement. Accordingly, the action is not included in the total number of actions above. The settlement amount, which Deutsche Bank has paid, is no longer reflected in Deutsche Bank’s litigation provisions.
GBP LIBOR. A putative class action alleging manipulation of the Pound Sterling (GBP) LIBOR remains pending. On December 21, 2018, the SDNY partially granted defendants’ motions to dismiss the action, dismissing all claims against Deutsche Bank. Plaintiffs filed a notice of appeal; the U.S. Court of Appeals for the Second Circuit ordered that the appeal be held in abeyance pending that court’s decision in the appeal of the SIBOR and SOR class action. Following that court’s decision in the SIBOR and SOR class action on March 17, 2021, the appeal is moving forward. Plaintiffs filed their opening brief on October 21, 2021, and all defendants-appellees’ except Deutsche Bank filed their briefs on January 20, 2022. Also on January 20, 2022, plaintiffs filed a motion for (1) severance of their appeal with respect to Deutsche Bank, (2) stay of the severed appeal as to Deutsche Bank, and (3) limited remand of that portion of the matter concerning Deutsche Bank to the district court to consider the approval of a proposed settlement between plaintiffs and Deutsche Bank. The Second Circuit granted plaintiffs’ motion on January 26, 2022. On March 31, 2022, Deutsche Bank executed a settlement agreement with plaintiffs in the amount of U.S. $ 5 million to resolve this action. Plaintiffs filed a motion for preliminary approval of the settlement on July 29, 2022.
327 |
Deutsche Bank | ||
Annual Report 2022 | ||
CHF LIBOR. A putative class action alleging manipulation of the Swiss Franc (CHF) LIBOR remains pending. On September 16, 2019, the SDNY granted defendants’ motion to dismiss the action, dismissing all claims against Deutsche Bank. Plaintiffs filed a notice of appeal; the U.S. Court of Appeals for the Second Circuit ordered that the appeal be held in abeyance pending that court’s decision in the appeal of the SIBOR and SOR class action. Following that court’s decision in the SIBOR and SOR class action on March 17, 2021, the CHF LIBOR action was remanded to the district court for further proceedings. On April 18, 2022, Deutsche Bank executed a settlement agreement with plaintiffs in the amount of U.S. $ 13 million to resolve this action. Plaintiffs filed a motion for preliminary approval of the settlement on June 29, 2022. On November 23, 2022, plaintiffs filed their third amended complaint. On February 15, 2023, the court granted preliminary approval of the settlement.
Spanish EURIBOR Claims. 77 claims in Spain (incorporating at least 258 claimants) have been notified or issued in court against Deutsche Bank by claimants with mortgage loans held by banks and other financial institutions for damages resulting from alleged collusive behavior by Deutsche Bank following the European Commission decision of December 4, 2013. Of those 77 claims, 69 have quantified their alleged losses with a total value of € 1 million and 6 (one of which includes 184 potential claimants) are yet to do so. Of the 77 claims, 51 claims have commenced in court and are at varying stages of maturity, with 35 claims having now been finally dismissed by the courts or withdrawn by the claimants, one decision pending a potential appeal and some claims stayed pending the outcome of the Trucks Cartel decision by the European Court of Justice (ECJ) and/or further referrals to the ECJ. The ECJ’s Trucks Cartel decision of June 22, 2022 confirmed that the limitation period for claimants to notify/issue claims in Spanish EURIBOR would expire on June 30, 2022. Accordingly, the final date for claimants to notify/issue claims has passed.
Jeffrey Epstein Investigations and Litigation. Deutsche Bank has received requests for information from regulatory and law enforcement agencies concerning the bank’s former client relationship with Jeffrey Epstein (individually, and through related parties and entities). In December 2018, Deutsche Bank began the process to terminate its relationship with Epstein, which began in August 2013. Deutsche Bank has provided information to and otherwise cooperated with the investigating agencies. The bank has also completed an internal investigation into the Epstein relationship.
As mentioned above, on July 7, 2020, the DFS issued a Consent Order, finding that Deutsche Bank violated New York State banking laws in connection with its relationships with three former Deutsche Bank clients, Danske Bank’s Estonia branch, Jeffrey Epstein and FBME Bank, and imposing a U.S. $ 150 million civil penalty in connection with these three former relationships, which Deutsche Bank paid in the third quarter of 2020. Also as mentioned above, the bank was also named as a defendant in a securities class action in the U.S. District Court for the Southern District of New York (SDNY) that included allegations relating to the bank’s relationship with Jeffrey Epstein and other entities. Deutsche Bank executed a settlement agreement in that lawsuit, which the Court approved in an order dated February 6, 2023.
The Group has not established a provision or contingent liability with respect to the Jeffrey Epstein investigations. The remaining investigations relating to Jeffrey Epstein are understood to be ongoing.
On November 24, 2022, Deutsche Bank was named as a defendant in a putative class action complaint filed in the U.S. District Court for the Southern District of New York (SDNY) by an unnamed alleged sex trafficking victim of Jeffrey Epstein (Epstein), alleging claims against the bank under the Trafficking Victims Protection Act (TVPA), Racketeer Influenced and Corrupt Organizations Act (RICO) and New York state law in connection with the bank’s provision of banking services to Epstein between August 2013 and December 2018. The lawsuit cites allegations regarding control deficiencies raised in the DFS Consent Order related to the bank’s relationship with Jeffrey Epstein. Deutsche Bank filed a motion to dismiss the complaint on December 30, 2022. On January 13, 2023, the plaintiff filed an amended complaint. On February 7, 2023, Deutsche Bank filed a motion to dismiss the amended complaint.
The Group has not disclosed whether it has established a provision or contingent liability with respect to this litigation because it has concluded that such disclosure can be expected to prejudice seriously the outcome.
Mortgage-Related and Asset-Backed Securities – Issuer and Underwriter Civil Litigation. Deutsche Bank has been named as defendant in numerous civil litigations brought by private parties in connection with its various roles, including issuer or underwriter, in offerings of residential mortgage-backed securities (RMBS) and other asset-backed securities. These cases, described below, allege that the offering documents contained material misrepresentations and omissions, including with regard to the underwriting standards pursuant to which the underlying mortgage loans were issued, or assert that various representations or warranties relating to the loans were breached at the time of origination. The Group has recorded provisions with respect to several of these civil cases, but has not recorded provisions with respect to all of these matters. The Group has not disclosed the amount of these provisions because it has concluded that such disclosure can be expected to prejudice seriously the resolution of these matters.
328 |
Deutsche Bank | ||
Annual Report 2022 | ||
Deutsche Bank is a defendant in a class action relating to its role as one of the underwriters of six RMBS offerings issued by Novastar Mortgage Corporation. No specific damages are alleged in the complaint. The lawsuit was brought by plaintiffs representing a class of investors who purchased certificates in those offerings. The parties reached a settlement to resolve the matter for a total of U.S. $ 165 million, a portion of which was paid by the bank. On August 30, 2017, FHFA/Freddie Mac filed an objection to the settlement and shortly thereafter appealed the district court’s denial of their request to stay settlement approval proceedings, which appeal was resolved against FHFA/Freddie Mac. The court approved the settlement on March 7, 2019 over FHFA/Freddie Mac’s objections. FHFA filed its appeal on June 28, 2019, which was denied on March 14, 2022, and a subsequent petition for rehearing was denied on June 2, 2022. FHFA elected not to file a petition for certiorari in the U.S. Supreme Court, thus ending its challenge to the settlement.
Deutsche Bank is a defendant in an action related to RMBS offerings brought by the FDIC as receiver for Citizens National Bank and Strategic Capital Bank (alleging an unspecified amount in damages against all defendants). In this action, the appellate court reinstated claims previously dismissed on statute of limitations grounds and petitions for rehearing and certiorari to the U.S. Supreme Court were denied. On July 31, 2017, the FDIC filed a second amended complaint, which defendants moved to dismiss on September 14, 2017. On October 18, 2019, defendants’ motion to dismiss was denied. On May 13, 2022, the FDIC voluntarily dismissed its claim with respect to one of the RMBS offerings and Deutsche Bank filed a motion for summary judgment seeking dismissal of the remaining claim. Deutsche Bank's motion has been fully briefed as of July 8, 2022. Discovery is stayed pending resolution of Deutsche Bank's motion.
In June 2014, HSBC, as trustee, brought an action in New York state court against Deutsche Bank to revive a prior action, alleging that Deutsche Bank failed to repurchase mortgage loans in the ACE Securities Corp. 2006-SL2 RMBS offering. The revival action was stayed during the pendency of an appeal of the dismissal of a separate action wherein HSBC, as trustee, brought an action against Deutsche Bank alleging breaches of representations and warranties made by Deutsche Bank concerning the mortgage loans in the same offering. On March 29, 2016, the court dismissed the revival action. Plaintiff appealed and on November 19, 2019, the appellate court affirmed the dismissal. On December 19, 2019, plaintiff filed a motion to appeal to the New York Court of Appeals in the appeals court, which was denied on February 13, 2020. On March 16, 2020, plaintiff petitioned the New York Court of Appeals for leave to appeal, which was granted on September 1, 2020. The Court of Appeals heard argument on May 19, 2022 and affirmed the dismissal of the action on June 16, 2022.
Deutsche Bank is a defendant in cases concerning two RMBS trusts that were brought initially by RMBS investors and subsequently by HSBC, as trustee, in New York state court. The cases allege breaches of loan-level representations and warranties in the ACE Securities Corp. 2006-FM1 and ACE Securities Corp. 2007-ASAP1 RMBS offerings, respectively. Both cases were dismissed on statute of limitations grounds by the trial court on March 28, 2018. Plaintiff appealed the dismissals. On April 25, 2019, the First Department affirmed the dismissals on claims for breach of representations and warranties and for breach of the implied covenant of good faith and fair dealing, but reversed the denial of the motions for leave to file amended complaints alleging failure to notify the trustee of alleged representations and warranty breaches. HSBC filed amended complaints on April 30, 2019, and Deutsche Bank filed its answers on June 3, 2019. Discovery is ongoing. On October 25, 2019, plaintiffs filed two complaints (one by HSBC and one by a certificate holder) seeking to revive, under Section 205(a) of the New York Civil Practice Law and Rules, the breach of representations and warranties claims as to which dismissal was affirmed in the case concerning ACE 2006-FM1. On December 16, 2019, Deutsche Bank moved to dismiss these actions. On July 2, 2022, the Court granted the motion to dismiss the certificate holder action. Plaintiff appealed to the First Department on August 4, 2022, and the appeal remains outstanding. On October 4, 2022, the Court dismissed the HSBC action in light of the Court of Appeals’ decision in the SL2 case described above. On November 7, 2022, plaintiff filed an appeal that remains pending.
In the actions against Deutsche Bank solely as an underwriter of other issuers’ RMBS offerings, Deutsche Bank has contractual rights to indemnification from the issuers, but those indemnity rights may in whole or in part prove effectively unenforceable where the issuers are now or may in the future be in bankruptcy or otherwise defunct.
Mortgage-Related and Asset-Backed Securities – Trustee Civil Litigation. Deutsche Bank National Trust Company (“DBNTC”) and Deutsche Bank Trust Company Americas (“DBTCA”) (collectively, the “Trustees”) are defendants in three separate civil lawsuits, and DBNTC is a defendant in a fourth civil lawsuit, brought by investors concerning the Trustees’ role as trustees of certain RMBS trusts. The actions generally allege claims for breach of contract, breach of fiduciary duty, breach of the duty to avoid conflicts of interest, negligence and/or violations of the U.S. Trust Indenture Act of 1939, based on the Trustees’ alleged failure to perform adequately certain obligations and/or duties as trustee for the trusts.
329 |
Deutsche Bank | ||
Annual Report 2022 | ||
The four lawsuits include actions by (a) the National Credit Union Administration Board (“NCUA”), as an investor in 18 trusts that allegedly suffered total realized collateral losses of more than U.S. $ 3.7 billion; (b) certain CDOs (collectively, “Phoenix Light”) as investors in 43 trusts, and seeking “hundreds of millions of dollars in damages”; (c) Commerzbank AG, as an investor in 50 RMBS trusts, seeking “hundreds of millions of dollars in losses”; and (d) IKB International, S.A. in Liquidation and IKB Deutsche Industriebank A.G. (collectively, “IKB”), as an investor in 17 RMBS trusts, originally seeking more than U.S.$ U.S. $ 268 million of damages before IKB voluntarily discontinued its claims as to certain RMBS certificates. In the NCUA case, DBNTC’s motion to dismiss the amended complaint was granted in part and denied in part, dismissing NCUA’s tort claims but preserving its breach-of-contract claims. Both parties filed motions for partial summary judgment and those motions are fully briefed and pending before the court. On February 8, 2022, the court in the Phoenix Light case granted DBNTC’s and DBTCA’s motion for summary judgment, denied Phoenix Light’s motion for summary judgment, and dismissed the action. On March 10, 2022, Phoenix Light filed a notice of appeal with respect to the court’s orders on the motions to dismiss and for summary judgment. That appeal is fully briefed and pending oral argument. On February 8, 2022, the court in the Commerzbank case granted in part and denied in part DBNTC’s and DBTCA’s motion for summary judgment, dismissing all of the tort claims and dismissing the breach of contract claim relating to certain of the trusts, and denied Commerzbank’s motion for summary judgment in its entirety. Discovery is ongoing. On January 27, 2021, the court in the IKB case granted in part and denied in part the Trustees’ motion to dismiss, dismissing certain of IKB’s claims but allowing certain of its breach of contract and tort claims to go forward; on May 10, 2021, the Trustees filed a notice of appeal regarding certain aspects of that order and, on May 20, 2021, IKB filed a notice of cross-appeal with respect to other aspects of that order. On August 30, 2022, the New York Supreme Court, Appellate Division, First Department, affirmed in part and reversed in part the trial court’s order on the motion to dismiss. On September 30, 2022, DBNTC and DBTCA filed a motion for leave to appeal the decision to the Court of Appeals, and on that same day, IKB filed a motion for reargument or for leave to appeal to the New York Court of Appeals, as to certain aspects of the First Department’s decision. On November 10, 2022, the First Department granted DBNTC’s and DBTCA’s motion for leave to appeal to the Court of Appeals, denied IKB’s motion for reargument, and denied as moot IKB’s motion for leave to appeal to the Court of Appeals. DBNTC’s and DBTCA’s appeal is currently being briefed. Discovery is ongoing.
The Group has established contingent liabilities with respect to certain of these matters, but the Group has not disclosed the amounts because it has concluded that such disclosure can be expected to seriously prejudice the outcome of these matters.
Off-Channel Communications Investigations. On September 27, 2022, U.S. Securities and Exchange Commission (SEC) and the CFTC announced resolutions with multiple financial institutions including Deutsche Bank AG and its subsidiaries Deutsche Bank Securities Inc. (“DBSI”), DWS Investment Management Americas, Inc. (“DIMA”) and DWS Distributors, Inc. (“DDI” and, together with DIMA, “DWS”), with respect to industry-wide investigations regarding compliance with record retention requirements applicable to broker-dealer firms, investment advisers, swap dealers, and futures commission merchants. The SEC and CFTC found that Deutsche Bank, DBSI and DWS, as applicable, did not maintain certain electronic communications required to be maintained pursuant to their respective record retention obligations because the communications were sent or received by employees over unapproved electronic messaging channels from personal devices. The SEC and CFTC also found related supervisory failures. Under these resolutions, DBSI and DWS paid a U.S.$ 125 million civil monetary penalty to the SEC, and Deutsche Bank and DBSI paid a U.S.$ 75 million civil monetary penalty to the CFTC. As part of the resolutions, Deutsche Bank, DBSI and DWS have hired a compliance consultant to conduct a review of relevant policies and procedures, trainings, surveillance measures, technological solutions, and disciplinary framework, and submit a report to the SEC and CFTC with findings and recommendations.
Polish Mortgage Matters. Starting in 2016, certain clients of Deutsche Bank Polska S.A. have reached out to Deutsche Bank Polska S.A. alleging that their mortgage loan agreements in foreign currency include unfair clauses and are invalid. These clients have demanded reimbursement of the alleged overpayments under such agreements totaling over € 384 million with more than 3,000 civil claims having been commenced in Polish courts. This type of cases is an industry wide issue in Poland and other banks are facing similar claims. Deutsche Bank Polska S.A. has and will take necessary legal actions to defend itself and challenge such claims in courts.
The Group has established a portfolio provision to cover potential losses from the existing and potential litigation related to mortgage loans in foreign currency. The amount of the portfolio provision is approximately € 283 million and may be subject to future changes in estimate depending in particular on the jurisprudence of local courts as well as the Court of Justice of European Union.
Postbank Voluntary Public Takeover Offer . On September 12, 2010, Deutsche Bank announced the decision to make a voluntary takeover offer for the acquisition of all shares in Deutsche Postbank AG (Postbank). On October 7, 2010, the bank published its official takeover offer and offered Postbank shareholders a consideration of € 25 for each Postbank share. This offer was accepted for a total of approximately 48.2 million Postbank shares.
330 |
Deutsche Bank | ||
Annual Report 2022 | ||
In November 2010, a former shareholder of Postbank, Effecten-Spiegel AG, which had accepted the takeover offer, brought a claim against Deutsche Bank alleging that the offer price was too low and was not determined in accordance with the applicable German laws. The plaintiff alleges that Deutsche Bank had been obliged to make a mandatory takeover offer for all shares in Postbank, at the latest, in 2009 as the voting rights of Deutsche Post AG in Postbank had to be attributed to Deutsche Bank pursuant to Section 30 of the German Takeover Act. Based thereon, the plaintiff alleges that the consideration offered by Deutsche Bank for the shares in Postbank in the 2010 voluntary takeover offer needed to be raised to € 57.25 per share.
The Regional Court Cologne (Landgericht) dismissed the claim in 2011 and the Cologne appellate court dismissed the appeal in 2012. The Federal Court set this judgment aside and referred the case back to the Higher Regional Court Cologne to take evidence on certain allegations of the plaintiff.
Starting in 2014, additional former shareholders of Postbank, who accepted the 2010 tender offer, brought similar claims as Effecten-Spiegel AG against Deutsche Bank which are pending with the Regional Court Cologne and the Higher Regional Court of Cologne, respectively. On October 20, 2017, the Regional Court Cologne handed down a decision granting the claims in a total of 14 cases which were combined in one proceeding. The Regional Court Cologne took the view that Deutsche Bank was obliged to make a mandatory takeover offer already in 2008 so that the appropriate consideration to be offered in the takeover offer should have been € 57.25 per Postbank share (instead of € 25 ). The additional consideration per share owed to shareholders which have accepted the takeover offer would thus amount to € 32.25 . Deutsche Bank appealed this decision and the appeal was assigned to the 13th Senate of the Higher Regional Court of Cologne, which also heard the appeal of Effecten-Spiegel AG.
In 2019 and 2020 the Higher Regional Court Cologne called a number of witnesses in both cases. The individuals heard included current and former board members of Deutsche Bank, Deutsche Post AG and Postbank as well as other persons involved in the Postbank transaction. In addition, the Higher Regional Court Cologne issued orders for the production of relevant transaction documents entered into between Deutsche Bank and Deutsche Post AG in 2008 and 2009. Deutsche Bank had therefore deposited the originals of these documents with the court in 2019.
On December 16, 2020, the Higher Regional Court Cologne handed down a decision and fully dismissed the claims of Effecten-Spiegel AG. Further, in a second decision handed down on December 16, 2020, the Higher Regional Court Cologne allowed the appeal of Deutsche Bank against the decision of the Regional Court Cologne dated October 20, 2017 and dismissed all related claims of the relevant plaintiffs. The Higher Regional Court Cologne granted leave to appeal to the German Federal Court (Bundesgerichtshof) as regards both decisions and all relevant plaintiffs lodged their respective appeals with the Federal Court by February 2021. On December 13, 2022, the German Federal Court announced its decision, setting aside the judgments of the Higher Regional Court of Cologne and remanding the cases back to the Higher Regional Court.
Deutsche Bank has been served with a large number of additional lawsuits filed against Deutsche Bank shortly before the end of 2017, almost all of which are now pending with the Regional Court Cologne. Some of the new plaintiffs allege that the consideration offered by Deutsche Bank AG for the shares in Postbank in the 2010 voluntary takeover should be raised to € 64.25 per share.
The claims for payment against Deutsche Bank in relation to these matters total almost € 700 million (excluding interest).
The Group has established a contingent liability with respect to these matters but the Group has not disclosed the amount of this contingent liability because it has concluded that such disclosure can be expected to prejudice seriously the outcome of these matters.
Further Proceedings Relating to the Postbank Takeover . In September 2015, former shareholders of Postbank filed in the Regional Court Cologne shareholder actions against Postbank to set aside the squeeze-out resolution taken in the shareholders meeting of Postbank in August 2015 (actions for voidance). Among other things, the plaintiffs alleged that Deutsche Bank was subject to a suspension of voting rights with respect to its shares in Postbank based on the allegation that Deutsche Bank failed to make a mandatory takeover offer. The squeeze out is final and the proceeding itself has no reversal effect, but may result in damage payments. The claimants refer to legal arguments similar to those asserted in the Effecten-Spiegel proceeding described above. In a decision on October 20, 2017, the Regional Court Cologne declared the squeeze-out resolution to be void. The court, however, did not rely on a suspension of voting rights due to an alleged failure of Deutsche Bank to make a mandatory takeover offer, but argued that Postbank violated information rights of Postbank shareholders in Postbank's shareholders meeting in August 2015. Postbank has appealed this decision. On May 15, 2020, DB Privat- und Firmenkundenbank AG (legal successor of Postbank due to a merger in 2018) was merged into Deutsche Bank AG. On July 3, 2020, Deutsche Bank AG withdrew the appeal as regards the actions for voidance because efforts and costs to pursue this appeal became disproportionate to the minor remaining economic importance of the case considering that the 2015 squeeze-out cannot be reversed. As a consequence, the first instance judgement which found that Postbank violated the information rights of its shareholders in the shareholders’ meeting became final.
331 |
Deutsche Bank | ||
Annual Report 2022 | ||
The legal question of whether Deutsche Bank had been obliged to make a mandatory takeover offer for all Postbank shares prior to its 2010 voluntary takeover may also impact two pending appraisal proceedings (Spruchverfahren). These proceedings were initiated by former Postbank shareholders with the aim to increase the cash compensation offered in connection with the squeeze-out of Postbank shareholders in 2015 and the cash compensation offered and annual compensation paid in connection with the execution of a domination and profit and loss transfer agreement (Beherrschungs- und Gewinnabführungs-vertrag) between DB Finanz-Holding AG (now DB Beteiligungs-Holding GmbH) and Postbank in 2012.
The applicants in the appraisal proceedings claim that a potential obligation of Deutsche Bank to make a mandatory takeover offer for Postbank at an offer price of € 57.25 should be decisive when determining the adequate cash compensation in the appraisal proceedings. The Regional Court Cologne had originally followed this legal view of the applicants in two resolutions. In a decision dated June 2019, the Regional Court Cologne expressly gave up this legal view in the appraisal proceedings in connection with execution of a domination and profit and loss transfer agreement. According to this decision, the question whether Deutsche Bank was obliged to make a mandatory offer for all Postbank shares prior to its voluntary takeover offer in 2010 shall not be relevant for determining the appropriate cash compensation. It is likely that the Regional Court Cologne will take the same legal position in the appraisal proceedings in connection with the squeeze-out. On October 1, 2020, the Regional Court Cologne handed down a decision in the appraisal proceeding concerning the domination and profit and loss transfer agreement (dated December 5, 2012) according to which the annual compensation pursuant to Section 304 of the German Stock Corporation Act (jährliche Ausgleichszahlung) shall be increased by € 0.12 to € 1.78 per Postbank share and the settlement amount pursuant to Section 305 of the German Stock Corporation Act (Abfindungsbetrag) shall be increased by € 4.56 to € 29.74 per Postbank share. The increase of the settlement amount is of relevance for approximately 492,000 former Postbank shares whereas the increase of the annual compensation is of relevance for approximately 7 million former Postbank shares. Deutsche Bank as well as the applicants have lodged an appeal against this decision.
The Group has not disclosed whether it has established a provision or contingent liability with respect to this matter because it has concluded that such disclosure can be expected to prejudice seriously its outcome.
Russia/UK Equities Trading Investigation. Deutsche Bank has investigated the circumstances around equity trades entered into by certain clients with Deutsche Bank in Moscow and London. The total volume of transactions reviewed is significant. Deutsche Bank's internal investigation of potential violations of law, regulation and policy and into the related internal control environment has concluded, and Deutsche Bank has assessed the findings identified during the investigation; to date it has identified certain violations of Deutsche Bank’s policies and deficiencies in Deutsche Bank's control environment. Deutsche Bank has advised regulators and law enforcement authorities in several jurisdictions (including Germany, Russia, the UK and the United States) of this investigation. Deutsche Bank has taken disciplinary measures with regards to certain individuals in this matter.
On January 30, 2017, the DFS and the FCA announced settlements with the bank related to their investigations into this matter. The settlements conclude the DFS’s and the FCA’s investigations into the bank’s AML control function in its investment banking division, including in relation to the equity trading described above. Under the terms of the settlement agreement the DFS issued a Consent Order pursuant to which Deutsche Bank agreed to pay a civil monetary penalty of U.S. $ 425 million and to engage an independent monitor for a term of up to two years. Under the terms of the settlement agreement with the FCA, Deutsche Bank agreed to pay a civil monetary penalty of approximately GBP 163 million.
On May 30, 2017, the Federal Reserve announced its settlement with the bank resolving this matter as well as additional AML issues identified by the Federal Reserve. Deutsche Bank paid a penalty of U.S. $ 41 million. Deutsche Bank also agreed to retain independent third parties to assess its Bank Secrecy Act/AML program and review certain foreign correspondent banking activity of its subsidiary Deutsche Bank Trust Company Americas. The bank was also required to submit written remediation plans and is conducting ongoing remediation.
Deutsche Bank continues to cooperate with regulators and law enforcement authorities, including the DOJ which has its own investigation into these securities trades that is understood to be ongoing. The Group has recorded a provision with respect to the remaining investigation. The Group has not disclosed the amount of this provision because it has concluded that such disclosure can be expected to prejudice seriously the outcome of this matter.
Sovereign, Supranational and Agency Bonds (SSA) Investigations and Litigations. Deutsche Bank has received inquiries from certain regulatory and law enforcement authorities, including requests for information and documents, pertaining to SSA bond trading. Deutsche Bank is cooperating with these investigations.
On December 6, 2022, the European Commission sent a Statement of Objections to Deutsche Bank regarding a potential breach of EU antitrust rules in relation to secondary market trading of Euro-denominated SSA bonds, Sovereign bonds, Covered bonds, and Government guaranteed bonds. Deutsche Bank proactively cooperated with the European Commission in this matter and as a result was granted immunity. The sending of a Statement of Objections is a step in the European Commission’s investigation and does not prejudge the outcome of the investigation, which is ongoing.
332 |
Deutsche Bank | ||
Annual Report 2022 | ||
Deutsche Bank is a defendant in a putative class action filed on December 9, 2022 in the U.S. District Court for the Southern District of New York by alleged direct market participants claiming a violation of antitrust law related to alleged manipulation of the secondary trading market for Euro-denominated Sovereign bonds. The complaint seeks treble damages and attorneys’ fees. The case is in the early stages.
Deutsche Bank is also a defendant in putative class actions filed on November 7, 2017 and December 5, 2017 in the Ontario Superior Court of Justice and Federal Court of Canada, respectively, claiming violations of antitrust law and the common law relating to alleged manipulation of secondary trading of SSA bonds. The complaints seek compensatory and punitive damages. On July 20, 2022, Deutsche Bank entered into a national settlement agreement that would resolve the Federal SSA Claim against all Deutsche Bank defendants. The settlement agreement remains subject to approval by the Federal Court of Canada.
Deutsche Bank was named as a defendant in a consolidated putative class action filed in the U.S. District Court for the Southern District of New York alleging violations of U.S. antitrust law and a claim for unjust enrichment relating to Mexican government bond trading. In October 2019, the court granted defendants’ motion to dismiss plaintiffs’ consolidated amended complaint without prejudice. In December 2019, plaintiffs filed a Second Amended Complaint, which the court dismissed without prejudice on November 30, 2020. On May 20, 2021, plaintiffs filed a motion for reconsideration, which was denied on March 30, 2022. On September 15, 2022, plaintiffs-appellants noticed an appeal to the Second Circuit and filed their opening brief on November 7, 2022. Defendants-appellees’ opposition was filed on February 6, 2023. On January 22, 2021, Deutsche Bank was notified that the Mexican competition authority, COFECE, reached a resolution that imposes fines against DB Mexico and two of its former traders, as well as six other financial institutions and nine other traders, for engaging in alleged monopolistic practices in the Mexican government bond secondary market. DB Mexico has appealed. The fine against DB Mexico was approximately U.S. $ 427,000 .
Other than as noted above, the Group has not disclosed whether it has established provisions or contingent liabilities with respect to the matters referred to above because it has concluded that such disclosure can be expected to prejudice seriously their outcome.
US Treasury Securities Investigations. Deutsche Bank has received inquiries from certain regulatory and law enforcement authorities, including requests for information and documents, pertaining to U.S. Treasuries auctions, trading, and related market activity. Deutsche Bank has cooperated with these investigations.
DBSI was a defendant in several putative class actions alleging violations of U.S. antitrust law, the U.S. Commodity Exchange Act and common law related to the alleged manipulation of the U.S. Treasury securities market. These cases have been consolidated in the Southern District of New York. On November 16, 2017, plaintiffs filed a consolidated amended complaint, which did not name DBSI as a defendant. On December 11, 2017, the court dismissed DBSI from the class action without prejudice. On March 31, 2021, the court granted the defendants’ motion to dismiss. On May 14, 2021, the plaintiffs filed a second amended complaint, which also did not name DBSI as a defendant. Defendants filed a motion to dismiss this second amended complaint, which was granted on March 31, 2022. The plaintiffs filed a notice of appeal on April 28, 2022.
On June 18, 2020, the CFTC entered an order pursuant to settlement with DBSI for alleged spoofing by two Tokyo-based traders between January and December 2013. Without admitting or denying the findings or conclusions therein, Deutsche Bank consented to the entry of the order, including a civil monetary fine of U.S. $ 1.25 million.
The Group has not disclosed whether it has established a provision or contingent liability with respect to these matters because it has concluded that such disclosure can be expected to seriously prejudice their outcome.
U.S. Treasury Spoofing Litigation. Following the bank’s settlement with the CFTC mentioned above, five separate putative class actions were filed in the Northern District of Illinois against Deutsche Bank AG and DBSI. The cases allege that Deutsche Bank and other unnamed entities participated in a scheme from January to December 2013 to spoof the market for Treasuries futures and options contracts and Eurodollar futures and options contracts. Plaintiffs filed a consolidated complaint on November 13, 2020. Deutsche Bank AG and DBSI filed a motion to dismiss on January 15, 2021; briefing on the motion to dismiss concluded on April 16, 2021. On September 20, 2021, the judge ordered supplemental briefing on the issues of standing and jurisdictional discovery. On July 20, 2022, the judge ordered limited jurisdictional discovery on the issue of standing. Jurisdictional discovery is ongoing, with the next status report due on or before April 5, 2023.
The Group has not disclosed whether it has established a provision or contingent liability with respect to these matters because it has concluded that such disclosure can be expected to prejudice seriously their outcome.
333 |
Deutsche Bank | ||
Annual Report 2022 | ||
28 – Credit related Commitments and Contingent Liabilities
Irrevocable lending commitments and lending related contingent liabilities
In the normal course of business the Group regularly enters into irrevocable lending commitments, including fronting commitments as well as contingent liabilities consisting of financial and performance guarantees, standby letters of credit and indemnity agreements on behalf of its customers. Under these contracts the Group is required to perform under an obligation agreement or to make payments to the beneficiary based on third party’s failure to meet its obligations. For these instruments it is not known to the Group in detail if, when and to what extent claims will be made. In the event that the Group has to pay out cash in respect of its fronting commitments, the Group would immediately seek reimbursement from the other syndicate lenders. The Group considers all the above instruments in monitoring the credit exposure and may require collateral to mitigate inherent credit risk. If the credit risk monitoring provides sufficient perception about a loss from an expected claim, a provision is established and recorded on the balance sheet.
The following table shows the Group’s revocable lending commitments, irrevocable lending commitments and lending related contingent liabilities without considering collateral or provisions. It shows the maximum potential utilization of the Group in case all these liabilities entered into must be fulfilled. The table therefore does not show the expected future cash flows from these liabilities as many of them will expire without being drawn and arising claims will be honored by the customers or can be recovered from proceeds of arranged collateral.
Irrevocable lending commitments and lending related contingent liabilities
in € m. | Dec 31, 2022 | Dec 31, 2021 | ||
Irrevocable lending commitments1 | 202,595 | 184,634 | ||
Revocable lending commitments | 48,425 | 49,798 | ||
Contingent liabilities | 67,214 | 59,394 | ||
Total | 318,234 | 293,825 | ||
1 Prior year’s comparatives aligned to presentation in the current year.
Other commitments and other contingent liabilities
The following table shows the Group’s other irrevocable commitments and other contingent liabilities without considering collateral or provisions. It shows the maximum potential utilization of the Group in case all these liabilities entered into must be fulfilled. The table therefore does not show the expected future cash flows from these liabilities as many of them will expire without being drawn and arising claims will be honored by the customers or can be recovered from proceeds of arranged collateral.
Other commitments and other contingent liabilities
in € m. | Dec 31, 2022 | Dec 31, 2021 | ||
Other commitments1 | 0 | 0 | ||
Other contingent liabilities | 73 | 77 | ||
Total | 73 | 77 | ||
1 Prior year’s comparatives aligned to presentation in the current year.
Government Assistance
In the course of its business, the Group regularly applies for and receives government support by means of Export Credit Agency (“ECA”) guarantees covering transfer and default risks for the financing of exports and investments into Emerging Markets and to a lesser extent, developed markets for Structured Trade & Export Finance and short- and medium-term Trade Finance business. Almost all export-oriented states have established such ECAs to support their domestic exporters. The ECAs act in the name and on behalf of the government of their respective country and are either constituted directly as governmental departments or organized as private companies vested with the official mandate of the government to act on its behalf. Terms and conditions of such ECA guarantees are broadly similar due to the fact that most of the ECAs act within the scope of the Organization for Economic Cooperation and Development (“OECD”) consensus rules. The OECD consensus rules, an intergovernmental agreement of the OECD member states, define benchmarks intended to ensure that a fair competition between different exporting nations will take place.
334 |
Deutsche Bank | ||
Annual Report 2022 | ||
In some countries dedicated funding programs with governmental support are offered for ECA-covered financings. The Group makes use of such programs to assist its clients in the financing of exported goods and services. In certain financings, the Group also receives government guarantees from national and international governmental institutions as collateral to support financings in the interest of the respective governments. The majority of such ECA guarantees received by the Group were issued either by Korean Export Credit Agencies (Korea Trade Insurance Corporation and The Export-Import Bank of Korea) acting on behalf of the Republic of Korea, by the Euler-Hermes Kreditversicherungs-AG acting on behalf of the Federal Republic of Germany, by the Italian Export Credit Agency (SACE S.p.A.) acting on behalf of the Italian Republic or by the UK Export Finance Agency acting on behalf of the United Kingdom of Great Britain and Northern Ireland.
Irrevocable payment commitments with regard to levies
Irrevocable payment commitments related to bank levy according to Bank Recovery and Resolution Directive (BRRD), the Single Resolution Fund (SRF) and the German deposit protection amounted to € 1.3 billion as of December 31, 2022, and to € 1.1 billion as of December 31, 2021.
29 – Other Short-Term Borrowings
in € m. | Dec 31, 2022 | Dec 31, 2021 | ||
Other short-term borrowings: | ||||
Commercial paper | 1,899 | 1,840 | ||
Other | 3,223 | 2,194 | ||
Total other short-term borrowings | 5,122 | 4,034 | ||
30 – Long-Term Debt and Trust Preferred Securities
Long-Term Debt by Earliest Contractual Maturity
in € m. | Due in | Due in | Due in | Due in | Due in | Due after | Total | Total | ||||||||
Senior debt: | ||||||||||||||||
Bonds and notes: | ||||||||||||||||
Fixed rate | 13,207 | 10,856 | 8,893 | 10,916 | 9,622 | 10,491 | 63,986 | 63,446 | ||||||||
Floating rate | 1,419 | 2,235 | 3,023 | 2,398 | 573 | 4,921 | 14,571 | 18,182 | ||||||||
Other | 30,528 | 4,385 | 451 | 457 | 334 | 5,433 | 41,588 | 53,960 | ||||||||
Subordinated debt: | ||||||||||||||||
Bonds and notes: | ||||||||||||||||
Fixed rate | 58 | 10 | 2,504 | 1,946 | 2,455 | 2,670 | 9,644 | 7,191 | ||||||||
Floating rate | 1,276 | 26 | 190 | 0 | 0 | 0 | 1,491 | 1,412 | ||||||||
Other | 135 | 25 | 0 | 42 | 20 | 23 | 245 | 293 | ||||||||
Total long-term debt | 46,622 | 17,537 | 15,061 | 15,761 | 13,004 | 23,539 | 131,525 | 144,485 | ||||||||
The Group did not have any defaults of principal, interest or other breaches with respect to its liabilities in 2022 and 2021.
Trust Preferred Securities1
in € m. | Dec 31, 2022 | Dec 31, 2021 | ||
Fixed rate | 0 | 0 | ||
Floating rate | 500 | 528 | ||
Total trust preferred securities | 500 | 528 | ||
1Perpetual instruments, redeemable at specific future dates at the Group’s option.
335 |
Deutsche Bank | ||
Annual Report 2022 | ||
31 – Maturity Analysis of the earliest contractual undiscounted cash flows of Financial Liabilities
| Dec 31, 2022 | |||||||||
in € m. | On demand | Due within | Due between | Due between | Due after | |||||
Noninterest bearing deposits | 246,804 | 0 | 0 | 0 | 0 | |||||
Interest bearing deposits | 131,585 | 132,641 | 92,629 | 16,414 | 9,735 | |||||
Trading liabilities¹ | 50,664 | 0 | 0 | 0 | 0 | |||||
Negative market values from derivative financial | 282,353 | 0 | 0 | 0 | 0 | |||||
Financial liabilities designated at fair value | 24,942 | 19,335 | 4,696 | 4,082 | 3,478 | |||||
Investment contract liabilities² | 0 | 0 | 469 | 0 | 0 | |||||
Negative market values from derivative financial | 0 | 326 | 187 | 93 | 181 | |||||
Central bank funds purchased | 0 | 0 | 0 | 0 | 0 | |||||
Securities sold under repurchase agreements | 3,603 | 398 | 21 | 41 | 15 | |||||
Securities loaned | 12 | 1 | 0 | 0 | 0 | |||||
Other short-term borrowings | 3,003 | 2,149 | 142 | 0 | 0 | |||||
Long-term debt | 1 | 34,050 | 17,377 | 71,882 | 22,529 | |||||
Trust preferred securities | 0 | 0 | 514 | 0 | 0 | |||||
Lease liabilities | 36 | 144 | 453 | 1,613 | 3,214 | |||||
Other financial liabilities | 90,334 | 1,655 | 2,023 | 453 | 15 | |||||
Off-balance sheet loan commitments | 192,286 | 0 | 0 | 0 | 0 | |||||
Financial guarantees | 28,083 | 0 | 0 | 0 | 0 | |||||
Total⁴ | 1,053,708 | 190,699 | 118,511 | 94,578 | 39,167 | |||||
1Trading liabilities and derivatives not qualifying for hedge accounting balances are recorded at fair value. The Group believes that this best represents the cash flow that would have to be paid if these positions had to be closed out. Trading liabilities and derivatives not qualifying for hedge accounting balances are shown within “on demand” which Group’s management believes most accurately reflects the short-term nature of trading activities. The contractual maturity of the instruments may however extend over significantly longer periods.
2These are investment contracts where the policy terms and conditions result in their redemption value equaling fair value.
3Derivatives designated for hedge accounting are recorded at fair value and are shown in the time bucket at which the hedged relationship is expected to terminate.
4 The balances in the table do not agree to the numbers in the Group’s balance sheet as the cash flows included in the table are undiscounted. This analysis represents the worst case scenario for the Group if the Group was required to repay all liabilities earlier than expected. The Group believes that the likelihood of such an event occurring is remote.
Dec 31, 2021 | ||||||||||
in € m. | On demand | Due within | Due between | Due between | Due after | |||||
Noninterest bearing deposits | 225,782 | 0 | 0 | 0 | 0 | |||||
Interest bearing deposits | 168,927 | 118,909 | 70,899 | 12,195 | 10,015 | |||||
Trading liabilities¹ | 54,676 | 0 | 0 | 0 | 0 | |||||
Negative market values from derivative financial | 287,108 | 0 | 0 | 0 | 0 | |||||
Financial liabilities designated at fair value | 30,911 | 7,582 | 16,764 | 2,249 | 2,438 | |||||
Investment contract liabilities² | 0 | 0 | 562 | 0 | 0 | |||||
Negative market values from derivative financial | 0 | 678 | 423 | 286 | 79 | |||||
Central bank funds purchased | 0 | 0 | 0 | 0 | 0 | |||||
Securities sold under repurchase agreements | 227 | 33 | 40 | 448 | 8 | |||||
Securities loaned | 24 | 0 | 0 | 0 | 0 | |||||
Other short-term borrowings | 2,676 | 953 | 607 | 0 | 0 | |||||
Long-term debt | 0 | 36,692 | 14,770 | 71,239 | 31,449 | |||||
Trust preferred securities | 0 | 0 | 529 | 0 | 0 | |||||
Lease liabilities | 37 | 142 | 503 | 1,750 | 2,082 | |||||
Other financial liabilities | 78,311 | 3,225 | 337 | 456 | 12 | |||||
Off-balance sheet loan commitments | 175,114 | 0 | 0 | 0 | 0 | |||||
Financial guarantees | 24,024 | 0 | 0 | 0 | 0 | |||||
Total | 1,047,818 | 168,213 | 105,435 | 88,624 | 46,084 | |||||
1Trading liabilities and derivatives not qualifying for hedge accounting balances are recorded at fair value. The Group believes that this best represents the cash flow that would have to be paid if these positions had to be closed out. Trading liabilities and derivatives not qualifying for hedge accounting balances are shown within “on demand” which Group’s management believes most accurately reflects the short-term nature of trading activities. The contractual maturity of the instruments may however extend over significantly longer periods.
2These are investment contracts where the policy terms and conditions result in their redemption value equaling fair value.
3Derivatives designated for hedge accounting are recorded at fair value and are shown in the time bucket at which the hedged relationship is expected to terminate.
4The balances in the table do not agree to the numbers in the Group’s balance sheet as the cash flows included in the table are undiscounted. This analysis represents the worst case scenario for the Group if the Group was required to repay all liabilities earlier than expected. The Group believes that the likelihood of such an event occurring is remote.
336 |
Deutsche Bank | ||
Annual Report 2022 | ||
Additional Notes
32 – Common Shares
Common Shares
Deutsche Bank’s share capital consists of common shares issued in registered form without par value. Under German law, each share represents an equal stake in the subscribed capital. Therefore, each share has a nominal value of € 2.56, derived by dividing the total amount of share capital by the number of shares.
Number of shares | Issued and | Treasury shares | Outstanding | |||
Common shares, January 1, 2021 | 2,066,773,131 | (1,346,166) | 2,065,426,965 | |||
Shares issued under share-based compensation plans | 0 | 0 | 0 | |||
Capital increase | 0 | 0 | 0 | |||
Shares purchased for treasury | 0 | (35,979,884) | (35,979,884) | |||
Shares sold or distributed from treasury | 0 | 36,647,102 | 36,647,102 | |||
Common shares, December 31, 2021 | 2,066,773,131 | (678,948) | 2,066,094,183 | |||
Shares issued under share-based compensation plans | 0 | 0 | 0 | |||
Capital increase | 0 | 0 | 0 | |||
Shares purchased for treasury | 0 | (55,830,172) | (55,830,172) | |||
Shares sold or distributed from treasury | 0 | 27,577,502 | 27,577,502 | |||
Common shares, December 31, 2022 | 2,066,773,131 | (28,931,618) | 2,037,841,513 | |||
There are no issued ordinary shares that have not been fully paid.
The Group has bought back shares pursuant to share buyback authorizations by the Annual General Meetings. All such transactions were recorded in shareholders’ equity and no revenues and expenses were recorded in connection with these activities. Treasury stock held as of year-end will mainly be used for cancellation with the purpose of distributing capital to shareholders as well as for future share-based compensation.
Authorized Capital
The Management Board is authorized to increase the share capital by issuing new shares for cash consideration. As of December 31, 2022, Deutsche Bank AG had authorized but unissued capital of € 2,560,000,000 which may be issued in whole or in part until April 30, 2026. Further details are governed by Section 4 of the Articles of Association.
Authorized capital | Consideration | Pre-emptive rights | Expiration date | |||
€ 512,000,000 | Cash | May be excluded pursuant to Section 186 (3) sentence 4 of the Stock Corporation Act and may be excluded in so far as it is necessary to grant pre-emptive rights to the holders of option rights, convertible bonds, and convertible participatory rights | April 30, 2026 | |||
€ 2,048,000,000 | Cash | May be excluded in so far as it is necessary to grant pre-emptive rights to the holders of option rights, convertible bonds, and convertible participatory rights. | April 30, 2026 | |||
|
|
|
|
|
|
|
Conditional Capital
The Management Board was authorized to issue once or more than once, participatory notes that are linked with conversion rights or option rights and/or convertible bonds and/or bonds with warrants. The participatory notes, convertible bonds or bonds with warrants could also be issued by affiliated companies of Deutsche Bank AG. For this purpose, share capital was increased conditionally upon exercise of these conversion and/or exchange rights or upon mandatory conversion.
Conditional capital | Purpose of conditional capital | Expiration date | ||||||
€ 512,000,000 | May be used if holders of conversion or option rights that are linked with participatory notes or convertible bonds or bonds with warrants make use of their conversion or option rights or holders with conversion obligations of convertible participatory notes or convertible bonds fulfill their obligation to convert. | April 30, 2022 | ||||||
€ 51,200,000 | May be used to fulfill options that are awarded on or before the expiration date and will only be used to the extent that holders of issued options make use of their right to receive shares and shares are not delivered out of treasury shares | April 30, 2022 | ||||||
The authorizations expired unused on April 30, 2022. Other conditional capital does not exist.
337 |
Deutsche Bank | ||
Annual Report 2022 | ||
Dividends
The following table presents the amount of dividends proposed or declared for the years ended December 31, 2022, 2021 and 2020, respectively.
2022 | 2021 | 2020 | ||||
Cash dividends declared (in € ) | 611,352,454 | 413,000,000 | 0 | |||
Cash dividends declared per common share (in €) | 0.30 | 0.20 | 0.00 | |||
No dividends have been declared since the balance sheet date.
33 – Employee Benefits
Share-Based Compensation Plans
The Group made grants of share-based compensation under the Deutsche Bank Equity Plan. This plan represents a contingent right to receive Deutsche Bank common shares after a specified period of time. The award recipient is not entitled to receive dividends during the vesting period of the award.
The share awards granted under the terms and conditions of the Deutsche Bank Equity Plan may be forfeited fully or partly if the recipient voluntarily terminates employment before the end of the relevant vesting period (or release period for Upfront Awards). Vesting usually continues after termination of employment in cases such as redundancy or retirement. Deferred share awards are subject to forfeiture provisions and performance conditions until release.
In countries where legal or other restrictions hinder the delivery of shares, a cash plan variant of the Deutsche Bank Equity Plan was used for granting awards, and for employees of certain legal entities, deferred equity is replaced with restricted shares due to local regulatory requirements.
Please note that this table does not cover awards granted to the Management Board. For awards granted under the DWS Equity Plan, please refer to the DWS Share-Based Compensation Plans section.
338 |
Deutsche Bank | ||
Annual Report 2022 | ||
The following table sets forth the basic terms of these share plans:
Grant year(s) | Deutsche Bank Equity Plan | Vesting schedule | Eligibility | |||
2022 4 | Annual Award | 1/4: 12 months1 | Select employees as | |||
1/4: 24 months1 | annual performance-based | |||||
1/4: 36 months1 | compensation | |||||
1/4: 48 months1 | (CB/IB/CRU and InstVV MRTs)2 | |||||
Annual Award | 1/3: 12 months1 | Select employees as | ||||
1/3: 24 months1 | annual performance-based | |||||
1/3: 36 months1 | compensation (non-CB/IB/CRU)2 | |||||
Annual Award | 1/5: 12 months1 | Select employees as | ||||
1/5: 24 months1 | annual performance-based | |||||
1/5: 36 months1 | compensation (Senior Management) | |||||
1/5: 48 months1 | ||||||
1/5: 60 months1 | ||||||
Retention/New Hire | Individual specification | Select employees to attract and | ||||
Severance | Individual specification | Regulatory requirement for certain employees to defer severance payments | ||||
Annual Award – Upfront | Vesting immediately at grant3 | Selected employees | ||||
2019-2021 4 | Annual Award | 1/4: 12 months1 | Select employees as | |||
1/4: 24 months1 | annual performance-based | |||||
1/4: 36 months1 | compensation | |||||
1/4: 48 months1 | (CB/IB/CRU and InstVV MRTs in an Material Business Unit)2 | |||||
Annual Award | 1/3: 12 months1 | Select employees as | ||||
1/3: 24 months1 | annual performance-based | |||||
1/3: 36 months1 | compensation (non-CB/IB/CRU)2 | |||||
Annual Award | 1/5: 12 months1 | Select employees as | ||||
1/5: 24 months1 | annual performance-based | |||||
1/5: 36 months1 | compensation (Senior Management) | |||||
1/5: 48 months1 | ||||||
1/5: 60 months1 | ||||||
Retention/New Hire/Off-Cycle 5 | Individual specification | Select employees to attract and | ||||
Severance | Individual specification | Regulatory requirement for certain employees to defer severance payments | ||||
Annual Award – Upfront | Vesting immediately at grant3 | Regulated employees | ||||
2017 -2018 4 | Annual Award | 1/4: 12 months1 | Select employees as | |||
1/4: 24 months1 | annual performance-based | |||||
1/4: 36 months1 | compensation | |||||
1/4: 48 months1 | ||||||
Or cliff vesting after 54 months1 | Members of Senior Leadership Cadre | |||||
Severance | Individual specification | Regulatory requirement for certain employees to defer severance payments | ||||
Retention/New Hire/Off-Cycle | Individual specification | Select employees to attract and retain the best talent | ||||
1For InstVV-regulated employees (and Senior Management) a further retention period of twelve months applies (six months for awards granted from 2017 -2018).
2For grant year 2019 divisions were called CIB, for grant years 2020 and 2021 CIB is split into CB/IB/CRU.
3Share delivery takes place after a further retention period of twelve months.
4Annual and Retention/New Hire awards include grants made under the Restricted Share Plan from 2018-2022.
5Off-Cycle awards granted up to 2020.
Furthermore, the Group offers a broad-based employee share ownership plan entitled Global Share Purchase Plan. The Global Share Purchase Plan offers employees in specific countries the opportunity to purchase Deutsche Bank shares in monthly installments over one year. At the end of the purchase cycle, the Group matches the acquired stock in a ratio of one to one up to a maximum of ten free shares, provided that the employee remains at Deutsche Bank Group for another year. In total, 11,451 staff from 18 countries enrolled in the cycle that began in November 2022.
The Group has other local share-based compensation plans, none of which, individually or in the aggregate, are material to the consolidated financial statements.
339 |
Deutsche Bank | ||
Annual Report 2022 | ||
The following table sets out the movements in share award units, including grants under the cash plan variant of the Deutsche Bank Equity Plan.
Share units (in thousands) | 2022 | 2021 | ||
Balance outstanding as of January 01 | 121,818 | 119,206 | ||
Granted | 45,114 | 50,554 | ||
Released | (34,121) | (43,206) | ||
Forfeited | (4,872) | (4,537) | ||
Other movements | (411) | (200) | ||
Balance outstanding as of December 31 | 127,528 | 121,818 | ||
The following table sets out key information regarding awards granted, released and remaining in the year.
| 2022 | 2021 | ||||||||||
Weighted average fair value per award granted in year | Weighted average share price at release in year | Weighted average remaining contractual life in years | Weighted average fair value per award granted in the year | Weighted average share price at release in year | Weighted average remaining contractual life in years | |||||||
DB Equity Plan | € 9.53 | € 10.04 | 1.5 | € 9.25 | € 10.58 | 1.7 | ||||||
Share-based payment transactions resulting in a cash payment give rise to a liability, which amounted to approximately € 9 million and € 8 million for the years ended December 31, 2022 and 2021, respectively.
The grant volume of outstanding share awards was approximately € 1.0 billion and € 0.9 billion as of December 31, 2022 and 2021, respectively. Thereof, approximately € 0.8 billion and € 0.7 billion had been recognized as compensation expense in the reporting year or prior to that. Hence, compensation expense for deferred share-based compensation not yet recognized amounted to approximately € 0.2 billion and € 0.2 billion as of December 31, 2022 and 2021, respectively.
DWS Share-Based Compensation Plans
The DWS Group made grants of share-based compensation under the DWS Equity Plan. This plan represents a contingent right to receive a cash payment by referencing to the value of DWS shares during a specified time period.
In September 2018 one-off IPO related awards under the DWS Stock Appreciation Rights (SAR) Plan were granted to all DWS employees. A limited number of DWS senior managers were granted a one-off IPO-related Performance Share Unit under the DWS Equity Plan instead. For members of the Executive Board, one-off IPO-related awards under the DWS Equity Plan were granted in January 2019.
The DWS Stock Appreciation Rights Plan represents a contingent right to receive a cash payment equal to any appreciation (or gain) in the value of a set number of notional DWS shares over a fixed period of time. This award does not provide any entitlement to receive DWS shares, voting rights or associated dividends.
The DWS Equity Plan is a phantom share plan representing a contingent right to receive a cash payment by referencing to the value of DWS shares during a specified period of time.
The award recipient for any share-based compensation plan is not entitled to receive dividends during the vesting period of the award.
The share awards granted under the terms and conditions of any share-based compensation plan are forfeited fully or partly if the recipient voluntarily terminates employment before the end of the relevant vesting period (or the end of the retention period for Upfront Awards). Vesting usually continues after termination of employment in cases such as redundancy or retirement.
340 |
Deutsche Bank | ||
Annual Report 2022 | ||
The following table sets forth the basic terms of the DWS share-based plans:
Grant year(s) | Award Type | Vesting schedule | Eligibility | |||
2021-2022 | Annual Awards | 1/4: 12 months 1 | Select employees as annual | |||
1/4: 24 months 1 | performance-based | |||||
1/4: 36 months 1 | compensation (InstVV MRTs) | |||||
1/4: 48 months 1 | ||||||
Annual Awards | 1/3: 12 months 1 | Select employees as annual | ||||
1/3: 24 months 1 | performance-based | |||||
1/3: 36 months 1 | compensation (non-InstVV MRTs) | |||||
Annual Awards (Senior Management) | 1/5: 12 months 1 | Members of the Executive Board | ||||
1/5: 24 months 1 | ||||||
1/5: 36 months 1 | ||||||
1/5: 48 months 1 | ||||||
1/5: 60 months 1 | ||||||
Annual Award - Upfront | Vesting immediately at grant 1 | Regulated employees | ||||
Retention/New Hire/Off-Cycle 4 | Individual specification | Select employees to attract and retain the best talent | ||||
2019-2020 | Annual Awards | 1/3: 12 months 1 | Select employees as annual performance-based | |||
1/3: 24 months 1 | compensation | |||||
1/3: 36 months 1 | ||||||
Annual Awards (Senior Management) | 1/5: 12 months 1 | Members of the Executive Board | ||||
1/5: 24 months 1 | ||||||
1/5: 36 months 1 | ||||||
1/5: 48 months 1 | ||||||
1/5: 60 months 1 | ||||||
Annual Award - Upfront | Vesting immediately at grant 1 | Regulated employees | ||||
Retention/New Hire/Off-Cycle 4 | Individual specification | Select employees to attract and retain the best talent | ||||
Severance | Individual specification | Regulatory requirement for certain employees to defer severance payments | ||||
Performance Share Unit Award | 1/3: March 2022 1 | Members of the Executive Board | ||||
(one-off IPO related award granted in 2019) | 1/3: March 2023 1 | |||||
1/3: March 2024 1 | ||||||
2018 | Retention/New Hire | Individual specification | Select employees to attract and retain the best talent | |||
Performance Share Unit Award | 1/3: March 2022 1 | Select Senior Managers | ||||
(one-off IPO related award ) | 1/3: March 2023 1 | |||||
1/3: March 2024 1 | ||||||
SAR Award (one-off IPO related award) | For non-MRTs: | all DWS employees 2 | ||||
For MRTs: | ||||||
1 Depending on their individual regulatory status, a six month retention period (AIFMD/UCITS MRTs) or a twelve month retention period (InstVV MRTs) applies after vesting.
2 Unless the employee received Performance Share Unit Award.
3 For outstanding awards, a 4-year exercise period applies following vesting/retention period.
4 Off-Cycle awards to non-InstVV regulated employees only.
The following table sets out the movements in share award units.
| DWS Equity Plan | DWS SAR Plan | ||||||||||
2022 | 2021 | 2022 | 2021 | |||||||||
Share units (in thousands) | Number of Awards | Number of Awards | Number of Awards | Weighted-average exercise price | Number of Awards | Weighted-average exercise price | ||||||
Outstanding at beginning of year | 2,415 | 2,418 | 948 | € 24.65 | 1,254 | € 24.65 | ||||||
Granted | 1,005 | 709 | 0 | - | 0 | - | ||||||
Issued or Exercised | (1,042) | (583) | (40) | € 24.65 | (256) | € 24.65 | ||||||
Forfeited | (55) | (110) | (4) | € 24.65 | (14) | € 24.65 | ||||||
Expired | 0 | 0 | (16) | € 24.65 | (36) | € 24.65 | ||||||
Other Movements | 6 | (18) | (1) | € 24.65 | 0 | € 24.65 | ||||||
Outstanding at end of year | 2,329 | 2,415 | 887 | € 24.65 | 948 | € 24.65 | ||||||
Of which, exercisable | 0 | 0 | 678 | € 24.65 | 739 | € 24.65 | ||||||
341 |
Deutsche Bank | ||
Annual Report 2022 | ||
The following table sets out key information regarding awards granted, released and remaining in the year.
| 2022 | 2021 | ||||||||||
Weighted average fair value per award granted in year | Weighted average share price at release/ exercise in year | Weighted average remaining contractual life in years | Weighted average fair value per award granted in the year | Weighted average share price at release/ exercise in year | Weighted average remaining contractual life in years | |||||||
DWS Equity Plan | € 27.67 | € 29.24 | 1.3 | € 30.44 | € 37.24 | 1.7 | ||||||
DWS SAR Plan | n/a | € 31.89 | 3.0 | n/a | € 39.59 | 4.0 | ||||||
The fair value of outstanding share-based awards was approximately € 67 million and € 83 million as of December 31, 2022 and 2021, respectively. Of the awards, approximately € 58 million and € 69 million has been recognized in the income statement up to the period ending 2022 and 2021 respectively, of which € 25 million and € 29 million as of December 31, 2022 and 2021 relate to fully vested awards. Total unrecognized expense related to share-based plans was approximately € 10 million and € 14 million as of December 31, 2022 and 2021 respectively, dependent on future share price development.
The fair value of the DWS Stock Appreciation Rights Plan awards have been measured using the generalized Black-Scholes model. The liabilities incurred are re-measured at the end of each reporting period until settlement. The principal inputs being the market value on reporting date, discounted for any dividends foregone over the holding periods of the award, and adjustment for expected and actual levels of vesting which includes estimating the number of eligible employees leaving the Group and number of employees eligible for early retirement. The inputs used in the measurement of the fair values at grant date and measurement date were as follows.
| Measurement date | Measurement date | ||
Units (in thousands) | 887 | 948 | ||
Fair value | € 7.65 | € 10.99 | ||
Share price | € 30.36 | € 35.48 | ||
Exercise price | € 24.65 | € 24.65 | ||
Expected volatility (weighted-average) | 32% | 32% | ||
Expected life (weighted-average) in years | 3.0 | 4.0 | ||
Expected dividends (% of income) | 66% | 65% | ||
Given the limited trading in the market of implied DWS share price volatility, the expected volatility of the DWS share price has been based on an evaluation of the historical volatility for a comparable peer group over the preceding 5-year period. The expected dividend level is linked to the latest DWS Group communication.
342 |
Deutsche Bank | ||
Annual Report 2022 | ||
Post-employment Benefit Plans
Nature of Plans
The Group sponsors a number of post-employment benefit plans on behalf of its employees, both defined contribution plans and defined benefit plans. The Group’s plans are accounted for based on the nature and substance of the plan. Generally, for defined benefit plans the value of a participant’s accrued benefit is based on each employee’s remuneration and length of service; contributions to defined contribution plans are typically based on a percentage of each employee’s remuneration. The rest of this note focuses predominantly on the Group’s defined benefit plans.
The Group’s defined benefit plans are primarily described on a geographical basis, reflecting differences in the nature and risks of benefits, as well as in the respective regulatory environments. In particular, the requirements set by local regulators can vary significantly and determine the design and financing of the benefit plans to a certain extent. Key information is also shown based on participant status, which provides a broad indication of the maturity of the Group’s obligations.
| Dec 31, 2022 | |||||||||
in € m. | Germany | UK | U.S. | Other | Total | |||||
Defined benefit obligation related to | ||||||||||
Active plan participants | 3,193 | 287 | 218 | 593 | 4,291 | |||||
Participants in deferred status | 1,827 | 1,375 | 523 | 83 | 3,808 | |||||
Participants in payment status | 5,017 | 1,214 | 461 | 207 | 6,899 | |||||
Total defined benefit obligation | 10,037 | 2,876 | 1,202 | 884 | 14,999 | |||||
Fair value of plan assets | 10,351 | 3,768 | 996 | 962 | 16,077 | |||||
Funding ratio (in %) | 103% | 131% | 83%1 | 109% | 107% | |||||
1US Total defined benefit obligation is inclusive of the unfunded US Medicare Plan (€ 120 million) in addition to defined benefit pension plans. The US defined benefit pension funding ratio excluding Medicare is 92%.
| Dec 31, 2021 | |||||||||
in € m. | Germany | UK | U.S. | Other | Total | |||||
Defined benefit obligation related to | ||||||||||
Active plan participants | 4,626 | 632 | 243 | 635 | 6,136 | |||||
Participants in deferred status | 2,535 | 3,020 | 564 | 118 | 6,237 | |||||
Participants in payment status | 5,936 | 1,277 | 544 | 274 | 8,031 | |||||
Total defined benefit obligation | 13,097 | 4,929 | 1,351 | 1,027 | 20,404 | |||||
Fair value of plan assets | 12,642 | 6,019 | 1,148 | 1,079 | 20,888 | |||||
Funding ratio (in %) | 97% | 122% | 85%1 | 105% | 102% | |||||
1US Total defined benefit obligation is inclusive of the unfunded US Medicare Plan (€ 170 million) in addition to defined benefit pension plans. The US defined benefit pension funding ratio excluding Medicare is 97%.
The majority of the Group’s defined benefit plan obligations relate to Germany, the United Kingdom and the United States. Within the other countries, the largest obligation relates to Switzerland. In Germany and some continental European countries, post-employment benefits are usually agreed on a collective basis with respective employee workers councils, unions or their equivalent. The Group’s main pension plans are governed by boards of trustees, fiduciaries or their equivalent.
Post-employment benefits can form an important part of an employee’s total remuneration. The Group’s approach is that their design shall be attractive to employees in the respective market, but sustainable for the Group to provide over the longer term. At the same time, the Group tries to limit its risks related to provision of such benefits. Consequently, the Group has moved to offer defined contribution plans in many locations over recent years.
In the past the Group typically offered pension plans based on final pay prior to retirement. These types of benefits still form a significant part of the pension obligations for participants in deferred and payment status. Currently, in Germany and the United States, the main defined benefit pension plans for active staff are cash account type plans where the Group credits an annual amount to individual accounts based on an employee’s current compensation. Dependent on the plan rules, the accounts increase either at a fixed interest rate or participate in market movements of certain underlying investments to limit the investment risk for the Group. Sometimes, in particular in Germany, there is a guaranteed benefit amount within the plan rules, e.g. payment of at least the amounts contributed. Upon retirement, beneficiaries may usually opt for a lump sum, a fixed number of annual instalments or for conversion of the accumulated account balance into a life annuity. This conversion is often based on market conditions and mortality assumptions at retirement.
343 |
Deutsche Bank | ||
Annual Report 2022 | ||
The Group also sponsors retirement and termination indemnity plans in several countries, as well as some post-employment medical plans for a number of current and retired employees, mainly in the United States. The post-employment medical plans typically pay fixed percentages of medical expenses of eligible retirees after a set deductible has been met. In the United States, once a retiree is eligible for Medicare, the Group contributes to a Health Reimbursement Account and the retiree is no longer eligible for the Group’s medical program. The Group’s total defined benefit obligation for post-employment medical plans was € 144 million and € 201 million at December 31, 2022 and December 31, 2021, respectively. In combination with the benefit structure, these plans represent limited risk for the Group, given the nature and size of the post-retirement medical plan liabilities versus the size of the Group’s balance sheet at year end 2022.
The following amounts of expected benefit payments from the Group’s defined benefit plans include benefits attributable to employees’ past and estimated future service and include both amounts paid from the Group’s external pension trusts and paid directly by the Group in respect of unfunded plans.
in € m. | Germany | UK | U.S. | Other | Total | |||||
Actual benefit payments 2022 | 485 | 131 | 92 | 67 | 775 | |||||
Benefits expected to be paid 2023 | 522 | 151 | 84 | 71 | 828 | |||||
Benefits expected to be paid 2024 | 528 | 127 | 85 | 71 | 811 | |||||
Benefits expected to be paid 2025 | 550 | 138 | 86 | 66 | 840 | |||||
Benefits expected to be paid 2026 | 564 | 146 | 90 | 64 | 864 | |||||
Benefits expected to be paid 2027 | 582 | 161 | 90 | 65 | 898 | |||||
Benefits expected to be paid 2028 – 2032 | 3,165 | 917 | 456 | 331 | 4,869 | |||||
Weighted average duration of defined benefit | 13 | 16 | 9 | 9 | 12 | |||||
Multi-employer Plans
In Germany, the Group is a member of the BVV Versicherungsverein des Bankgewerbes a.G. (BVV) together with other financial institutions. The BVV offers retirement benefits to eligible employees in Germany as a complement to post-employment benefit promises of the Group. Both employers and employees contribute on a regular basis to the BVV. The BVV provides annuities of a fixed amount to individuals on retirement and increases these fixed amounts if surplus assets arise within the plan. According to legislation in Germany, the employer is ultimately liable for providing the benefits to its employees. An increase in benefits may also arise due to additional obligations to retirees for the effects of inflation. BVV is a multi-employer defined benefit plan. However, in line with industry practice, the Group accounts for it as a defined contribution plan since insufficient information is available to identify assets and liabilities relating to the Group’s current and former employees, primarily because the BVV does not fully allocate plan assets to beneficiaries nor to member companies.
Governance and Risk
The Group maintains a Pensions Committee to oversee its pension and related risks on a global basis. This Committee meets at least quarterly and reports directly to the Senior Executive Compensation Committee.
Within this context, the Group develops and maintains guidelines for governance and risk management, including funding, asset allocation and actuarial assumption setting.
During and after acquisitions or changes in the external environment (e.g., legislation, taxation), topics such as the general plan design or potential plan amendments are considered. Any plan changes follow a process requiring approval by Group Human Resources and, above a certain threshold, also of the Pensions Committee.
Pension risk management is embedded in the Group’s risk management organization, with strong focus on market risks given importance of capital market developments (e.g., interest rate, credit spread, price inflation) for the value of plan assets and liabilities, hence IFRS and regulatory capital. Risk management thereby encompasses regular measurement, monitoring and reporting of risks via specific metrics, as well as a risk control framework, e.g. via the establishment of risk limits or thresholds as applicable. Risk management activities also include the consideration, review and measurement of other financial risks, e.g. risks from demographic and other actuarial assumptions (e.g., longevity risk) but also the assessment of model, valuation and other non-financial risks.
In the Group’s key pension countries, the Group’s largest post-employment benefit plan risk exposures relate to potential changes in credit spreads, interest rates, price inflation and longevity, that are partially mitigated through the investment strategy adopted. To the extent that pension plans are funded, the assets held mitigate some of the liability risks, but introduce investment risk.
Overall, the Group seeks to minimize the impact of pensions on the Group’s financial position from market movements, subject to balancing the trade-offs involved in financing post-employment benefits, regulatory capital and constraints from local funding or accounting requirements.
344 |
Deutsche Bank | ||
Annual Report 2022 | ||
Funding
The Group maintains various external pension trusts to fund the majority of its defined benefit plan obligations. The Group’s funding principle is to maintain funding of the defined benefit obligation by plan assets within a range of 90% to 100% of the obligation, subject to meeting any local statutory requirements. The Group has also determined that certain plans should remain unfunded, although their funding approach is subject to periodic review, e.g. when local regulations or practices change. Obligations for the Group’s unfunded plans are accrued on the balance sheet.
For many of the externally funded defined benefit plans there are local minimum funding requirements. The Group can decide on any additional plan contributions, with reference to the Group’s funding principle. There are some locations, e.g. the United Kingdom, where the trustees and the Group jointly agree contribution levels. In most countries the Group expects to receive an economic benefit from any plan surpluses of plan assets compared to defined benefit obligations, typically by way of reduced future contributions. Given the relatively high funding level and the investment strategy adopted in the Group’s key funded defined benefit plans, any minimum funding requirements that may apply are not expected to place the Group under any material adverse cash strain in the short term. With reference to the Group’s funding principle, the Group considers not re-claiming benefits paid from the Group’s assets as an equivalent to making cash contributions into the external pension trusts during the year.
During 2022, the majority of the German pension plans moved into surplus status due to significant market movements. The Group has claimed around € 860 million from the trust, which represents the benefits paid from the Bank’s assets on behalf of the trust during 2022 including the forgiven re-imbursement of the prior year in order to limit the extent to which the Group breached the upper end of its target funding ratio.
For post-retirement medical plans, the Group accrues for obligations over the period of employment and pays the benefits from Group assets when the benefits become due.
345 |
Deutsche Bank | ||
Annual Report 2022 | ||
Actuarial Methodology and Assumptions
December 31 is the measurement date for all plans. All plans are valued by independent qualified actuaries using the projected unit credit method. A Group policy provides guidance to ensure consistency globally on setting actuarial assumptions which are finally determined by the Group’s Pensions Committee. Senior management of the Group is regularly informed of movements and changes in key actuarial assumptions.
The key actuarial assumptions applied in determining the defined benefit obligations at December 31 are presented below in the form of weighted averages.
Dec 31, 2022 | Dec 31, 2021 | |||||||||||||||
Germany | UK | U.S.1 | Other | Germany | UK | U.S.1 | Other | |||||||||
Discount rate (in %) | 3.80% | 4.77% | 5.34% | 3.99% | 1.10% | 1.86% | 2.73% | 1.92% | ||||||||
Rate of price inflation (in %) | 2.62% | 3.71% | 2.20% | 2.16% | 2.19% | 3.73% | 2.30% | 1.88% | ||||||||
Rate of nominal increase in | 2.81% | 3.71% | 2.30% | 3.14% | 2.42% | 4.23% | 2.40% | 2.69% | ||||||||
Rate of nominal increase for | 2.97% | 3.32% | 2.20% | 0.85% | 2.10% | 3.49% | 2.30% | 1.05% | ||||||||
Assumed life expectancy | ||||||||||||||||
For a male aged 65 | 21.3 | 23.6 | 22.0 | 22.0 | 21.3 | 23.5 | 21.9 | 22.0 | ||||||||
For a female aged 65 | 23.6 | 25.4 | 23.4 | 24.1 | 23.5 | 25.1 | 23.3 | 24.0 | ||||||||
For a male aged 45 | 22.6 | 24.9 | 23.3 | 23.5 | 22.6 | 24.6 | 23.3 | 23.4 | ||||||||
For a female aged 45 | 24.7 | 26.7 | 24.8 | 25.5 | 24.6 | 26.5 | 24.7 | 25.4 | ||||||||
Mortality tables applied | Modified | SAPS (S3) | PRI-2012 | Country | Modified | SAPS (S3) | PRI-2012 | Country | ||||||||
1 Cash balance interest crediting rate in line with the 30-year US government bond yield.
For the Group’s most significant pension plans in the key countries, the discount rate used at each measurement date is set based on a high quality corporate bond yield curve, which is derived using a bond universe sourced from reputable third-party market data providers, and reflects the timing, amount and currency of the future expected benefit payments for the respective plan. In the second quarter 2022, a recalibration of the discount curve for defined benefit plans was applied to the Eurozone curve in order to better align to market data which resulted in a benefit recognized in Other Comprehensive Income of € 310 million.
The price inflation assumptions in the Eurozone and the United Kingdom are set with reference to market measures of inflation based on inflation swap rates in those markets at each measurement date. For other countries, the price inflation assumptions are typically based on long term forecasts by Consensus Economics Inc.
The assumptions for the increases in future compensation levels and for increases to pensions in payment are developed separately for each plan, where relevant. Each is set based on the price inflation assumption and reflecting the Group’s reward structure or policies in each market, as well as relevant local statutory and plan-specific requirements.
Among other assumptions, mortality assumptions can be significant in measuring the Group’s obligations under its defined benefit plans. These assumptions have been set in accordance with current best estimate in the respective countries. Future potential improvements in longevity have been considered and included where appropriate. Due to the long-term nature of mortality assumptions and lack of clarity over the longer term impacts of the pandemic on health outcomes, there has been no specific allowance for the impact of COVID-19 in any region, other than for recent experience which was captured as part of the annual valuation process.
346 |
Deutsche Bank | ||
Annual Report 2022 | ||
Reconciliation in Movement of Liabilities and Assets – Impact on Financial Statements
2022 | |||||||||||
in € m. | Germany | UK | U.S. | Other | Total | ||||||
Change in the present value of the defined benefit obligation: | |||||||||||
Balance, beginning of year | 13,097 | 4,929 | 1,351 | 1,027 | 20,404 | ||||||
Defined benefit cost recognized in Profit & Loss | |||||||||||
Current service cost | 164 | 18 | 10 | 38 | 230 | ||||||
Interest cost | 142 | 88 | 39 | 20 | 289 | ||||||
Past service cost and gain or loss arising from settlements | 17 | 2 | 0 | 0 | 19 | ||||||
Defined benefit cost recognized in Other Comprehensive Income | |||||||||||
Actuarial gain or loss arising from changes in financial | (3,055) | (1,966) | (196) | (183) | (5,400) | ||||||
Actuarial gain or loss arising from changes in demographic assumptions | 80 | 29 | (5) | 0 | 104 | ||||||
Actuarial gain or loss arising from experience | 79 | 97 | 3 | 25 | 204 | ||||||
Cash flow and other changes | |||||||||||
Contributions by plan participants | 1 | 0 | 0 | 16 | 17 | ||||||
Benefits paid | (485) | (131) | (92) | (67) | (775) | ||||||
Payments in respect to settlements | 0 | 0 | 0 | 0 | 0 | ||||||
Acquisitions/Divestitures | (2) | 0 | 0 | (2) | (4) | ||||||
Exchange rate changes | 0 | (190) | 92 | 9 | (89) | ||||||
Other | (0) | 0 | 0 | 0 | 0 | ||||||
Balance, end of year | 10,037 | 2,876 | 1,202 | 884 | 14,999 | ||||||
thereof: | |||||||||||
Unfunded | 0 | 10 | 143 | 75 | 228 | ||||||
Funded | 10,037 | 2,866 | 1,059 | 809 | 14,771 | ||||||
Change in fair value of plan assets: | |||||||||||
Balance, beginning of year | 12,642 | 6,019 | 1,148 | 1,079 | 20,888 | ||||||
Defined benefit cost recognized in Profit & Loss | |||||||||||
Interest income | 139 | 108 | 33 | 19 | 299 | ||||||
Defined benefit cost recognized in Other Comprehensive Income | |||||||||||
Return from plan assets less interest income | (1,594) | (1,982) | (184) | (130) | (3,890) | ||||||
Cash flow and other changes | |||||||||||
Contributions by plan participants | 1 | 0 | 0 | 16 | 17 | ||||||
Contributions by the employer1 | (353) | 0 | 0 | 28 | (325) | ||||||
Benefits paid2 | (485) | (130) | (77) | (60) | (752) | ||||||
Payments in respect to settlements | 0 | 0 | 0 | 0 | 0 | ||||||
Acquisitions/Divestitures | 1 | 0 | 0 | (1) | 0 | ||||||
Exchange rate changes | 0 | (243) | 79 | 11 | (153) | ||||||
Other | 0 | 0 | 0 | 0 | 0 | ||||||
Plan administration costs | 0 | (4) | (3) | 0 | (7) | ||||||
Balance, end of year | 10,351 | 3,768 | 996 | 962 | 16,077 | ||||||
Funded status, end of year | 314 | 892 | (206) | 78 | 1,078 | ||||||
Change in irrecoverable surplus (asset ceiling) | |||||||||||
Balance, beginning of year | 0 | 0 | 0 | (90) | (90) | ||||||
Interest cost | 0 | 0 | 0 | 0 | 0 | ||||||
Changes in irrecoverable surplus | 0 | 0 | 0 | (12) | (12) | ||||||
Exchange rate changes | 0 | 0 | 0 | (5) | (5) | ||||||
Balance, end of year | 0 | 0 | 0 | (107) | (107) | ||||||
Net asset (liability) recognized | 314 | 892 | (206) | (29) | 9713 | ||||||
Fair value of reimbursement rights | 0 | 0 | 0 | 3 | 3 | ||||||
1 Net Amount includes re-imbursement of 2022 benefit payments and a forgiven benefit payment from 2021.
2For funded plans only.
3 Thereof € 1,326 million recognized in Other assets and € 355 million in Other liabilities.
347 |
Deutsche Bank | ||
Annual Report 2022 | ||
2021 | |||||||||||
in € m. | Germany | UK | U.S. | Other | Total | ||||||
Change in the present value of the defined benefit obligation: | |||||||||||
Balance, beginning of year | 13,532 | 4,917 | 1,327 | 1,031 | 20,807 | ||||||
Defined benefit cost recognized in Profit & Loss | |||||||||||
Current service cost | 177 | 23 | 10 | 40 | 250 | ||||||
Interest cost | 80 | 63 | 31 | 16 | 190 | ||||||
Past service cost and gain or loss arising from settlements | 28 | (15) | 0 | (1) | 12 | ||||||
Defined benefit cost recognized in Other Comprehensive Income | |||||||||||
Actuarial gain or loss arising from changes in financial | (319) | (220) | (50) | (21) | (610) | ||||||
Actuarial gain or loss arising from changes in demographic | 0 | (5) | 3 | (14) | (16) | ||||||
Actuarial gain or loss arising from experience | 75 | (16) | 20 | 1 | 80 | ||||||
Cash flow and other changes | |||||||||||
Contributions by plan participants | 1 | 0 | 0 | 14 | 15 | ||||||
Benefits paid1 | (477) | (134) | (87) | (67) | (765) | ||||||
Payments in respect to settlements | 0 | 0 | 0 | 0 | 0 | ||||||
Acquisitions/Divestitures | 0 | 0 | 0 | 0 | 0 | ||||||
Exchange rate changes | 0 | 316 | 97 | 28 | 441 | ||||||
Other | 0 | 0 | 0 | 0 | 0 | ||||||
Balance, end of year | 13,097 | 4,929 | 1,351 | 1,027 | 20,404 | ||||||
thereof: | |||||||||||
Unfunded | 0 | 14 | 197 | 90 | 301 | ||||||
Funded | 13,097 | 4,915 | 1,154 | 937 | 20,103 | ||||||
Change in fair value of plan assets: | |||||||||||
Balance, beginning of year | 12,658 | 5,705 | 1,107 | 987 | 20,457 | ||||||
Defined benefit cost recognized in Profit & Loss | |||||||||||
Interest income | 76 | 74 | 26 | 14 | 190 | ||||||
Defined benefit cost recognized in Other Comprehensive Income | |||||||||||
Return from plan assets less interest income | 243 | 5 | 7 | 46 | 301 | ||||||
Cash flow and other changes | |||||||||||
Contributions by plan participants | 1 | 0 | 0 | 14 | 15 | ||||||
Contributions by the employer | 141 | 0 | 4 | 32 | 177 | ||||||
Benefits paid1 | (477) | (134) | (75) | (52) | (738) | ||||||
Payments in respect to settlements | 0 | 0 | 0 | 0 | 0 | ||||||
Acquisitions/Divestitures | 0 | 0 | 0 | 0 | 0 | ||||||
Exchange rate changes | 0 | 374 | 82 | 39 | 495 | ||||||
Other | 0 | 0 | 0 | 0 | 0 | ||||||
Plan administration costs | 0 | (5) | (3) | (1) | (9) | ||||||
Balance, end of year | 12,642 | 6,019 | 1,148 | 1,079 | 20,888 | ||||||
Funded status, end of year | (455) | 1,090 | (203) | 52 | 484 | ||||||
Change in irrecoverable surplus (asset ceiling) | |||||||||||
Balance, beginning of year | 0 | 0 | 0 | (38) | (38) | ||||||
Interest cost | 0 | 0 | 0 | 0 | 0 | ||||||
Changes in irrecoverable surplus | 0 | 0 | 0 | (48) | (48) | ||||||
Exchange rate changes | 0 | 0 | 0 | (4) | (4) | ||||||
Balance, end of year | 0 | 0 | 0 | (90) | (90) | ||||||
Net asset (liability) recognized | (455) | 1,090 | (203) | (38) | 3942 | ||||||
Fair value of reimbursement rights | 0 | 0 | 0 | 0 | 0 | ||||||
1For funded plans only.
2 Thereof € 1,207 million recognized in Other assets and € 813 million in Other liabilities.
The Group has a reimbursement right of around € 3 million domiciled in France at 31 December, 2022. This relates to the surplus of the previous CRPB Fund which was identified in 2022 that can be used to fund the retirement indemnity payments for the DB AG Branch Paris. There are no other reimbursement rights for the Group.
348 |
Deutsche Bank | ||
Annual Report 2022 | ||
Investment Strategy
The Group’s investment objective is to protect the Group from adverse impacts of its defined benefit pension plans on key financial metrics. The primary focus is to protect the plans’ IFRS funded status in the case of adverse market scenarios. Since 2021, there has been a shift in the investment strategy in selected markets to balance competing key financial metrics. Investment managers manage pension assets in line with investment mandates or guidelines as agreed with the pension plans’ trustees and investment committees.
For key defined benefit plans for which the Group aims to protect the IFRS funded status, the Group applies a liability driven investment approach. Risks from mismatches between fluctuations in the present value of the defined benefit obligations and plan assets due to capital market movements are minimized, subject to balancing relevant trade-offs. This is achieved by allocating plan assets closely to the market risk factor exposures of the pension liability to interest rates, credit spreads and inflation. Thereby, plan assets broadly reflect the underlying risk profile and currency of the pension obligations.
Where the desired hedging level for market risks cannot be achieved with physical instruments (i.e., corporate and government bonds), derivatives are employed. Derivative overlays mainly include interest rate, inflation swaps and credit default swaps. Other instruments are also used, such as interest rate futures and options. In practice, a completely hedged approach is impractical, for instance because of insufficient market depth for ultra-long-term corporate bonds, as well as liquidity and cost considerations. Therefore, plan assets contain further return-seeking asset categories such as equity, real estate, high yield bonds or emerging markets bonds to create long-term value and achieve diversification benefits. Furthermore, this shift in the investment strategy allows for actively taken market risk exposures from interest rates and credit spreads within defined limits governed by the Pensions Committee. As a result, the market risk from plan assets has been reduced.
In Q3 2022, the Group entered into a buy-in transaction with a third party insurer to de-risk € 410 million of exposure to the UK defined benefit pension schemes funded from existing assets, with no additional employer contribution required. The recognition of the insurance policy as a qualifying plan asset in Q3 negatively impacted Other Comprehensive Income in the Group’s financial statement by approximately € 35 million. In total, the Group has entered into three buy-in transactions in the UK with third-party insurers protecting the Group from movements in defined benefit obligations of around € 1.2 billion at 31 December, 2022.
Plan asset allocation to key asset classes
The following table shows the asset allocation of the Group’s funded defined benefit plans to key asset classes, i.e. exposures include physical securities in discretely managed portfolios and underlying asset allocations of any commingled funds used to invest plan assets.
Asset amounts in the following table include both “quoted” (i.e., Level 1 assets in accordance with IFRS 13 – amounts invested in markets where the fair value can be determined directly from prices which are quoted in active, liquid markets) and “other” (i.e., Level 2 and 3 assets in accordance with IFRS 13) assets.
Dec 31, 2022 | Dec 31, 2021 | |||||||||||||||||||
in € m. | Germany | UK | U.S. | Other | Total | Germany | UK | U.S. | Other | Total | ||||||||||
Cash and cash equivalents | 34 | 551 | 56 | 69 | 710 | 930 | 321 | 56 | 78 | 1,385 | ||||||||||
Equity instruments1 | 1,046 | 174 | 108 | 186 | 1,514 | 1,220 | 348 | 151 | 209 | 1,928 | ||||||||||
Investment-grade bonds2 | ||||||||||||||||||||
Government | 1,860 | 537 | 346 | 169 | 2,912 | 2,524 | 1,918 | 436 | 207 | 5,085 | ||||||||||
Non-government bonds | 3,898 | 1,302 | 385 | 315 | 5,900 | 5,386 | 1,894 | 379 | 336 | 7,995 | ||||||||||
Non-investment-grade bonds | ||||||||||||||||||||
Government | 89 | 1 | 2 | 3 | 95 | 137 | 1 | 1 | 1 | 140 | ||||||||||
Non-government bonds | 282 | 168 | 13 | 17 | 480 | 423 | 142 | 33 | 55 | 653 | ||||||||||
Securitized and other Debt Investments | 45 | 47 | 81 | 7 | 180 | 839 | 124 | 79 | 7 | 1,049 | ||||||||||
Insurance | 0 | 1,193 | 0 | 9 | 1,202 | 1 | 1,256 | 0 | 10 | 1,267 | ||||||||||
Alternatives | ||||||||||||||||||||
Real estate | 690 | 0 | 0 | 105 | 795 | 528 | 0 | 0 | 98 | 626 | ||||||||||
Commodities | 41 | 0 | 0 | 5 | 46 | 25 | 0 | 0 | 5 | 30 | ||||||||||
Private equity | 0 | 0 | 0 | 2 | 2 | 0 | 0 | 0 | 2 | 2 | ||||||||||
Other3 | 1,008 | 0 | 0 | 51 | 1,059 | 46 | 0 | 0 | 50 | 96 | ||||||||||
Derivatives (Market Value) | ||||||||||||||||||||
Interest rate | 1,294 | 229 | 13 | 7 | 1,543 | 518 | 42 | 9 | 2 | 571 | ||||||||||
Credit | 6 | (112) | 7 | 0 | (99) | 65 | (87) | 16 | 1 | (5) | ||||||||||
Inflation | 0 | (14) | 0 | 13 | (1) | 0 | (62) | 0 | 14 | (48) | ||||||||||
Foreign exchange | 55 | (5) | 0 | 4 | 54 | (1) | 4 | 0 | 4 | 7 | ||||||||||
Other | 3 | (303) | (15) | 0 | (315) | 1 | 118 | (12) | 0 | 107 | ||||||||||
Total fair value of plan assets | 10,351 | 3,768 | 996 | 962 | 16,077 | 12,642 | 6,019 | 1,148 | 1,079 | 20,888 | ||||||||||
1 Allocation of equity exposure is broadly in line with the typical index in the respective market, e.g. the equity portfolio’s benchmark of the UK retirement benefit plans is the MSCI All Countries World Index.
2Investment-grade means BBB and above. Average credit rating exposure for the Group’s main plans is around A.
3This position contains commingled funds which could not be segregated into the other asset categories.
349 |
Deutsche Bank | ||
Annual Report 2022 | ||
The following table sets out the Group’s funded defined benefit plan assets only invested in “quoted” assets, i.e. Level 1 assets in accordance with IFRS 13.
Dec 31, 2022 | Dec 31, 2021 | |||||||||||||||||||
in € m. | Germany | UK | U.S. | Other | Total | Germany | UK | U.S. | Other | Total | ||||||||||
Cash and cash equivalents | (154) | 551 | 55 | 24 | 476 | 756 | 317 | 48 | 34 | 1,155 | ||||||||||
Equity instruments1 | 772 | 173 | 108 | 38 | 1,091 | 983 | 348 | 151 | 53 | 1,535 | ||||||||||
Investment-grade bonds2 | ||||||||||||||||||||
Government | 691 | 537 | 340 | 49 | 1,617 | 902 | 1,902 | 431 | 77 | 3,312 | ||||||||||
Non-government bonds | 0 | 0 | 0 | 0 | 0 | 0 | 0 | 0 | 0 | 0 | ||||||||||
Non-investment-grade bonds | ||||||||||||||||||||
Government | 0 | 1 | 0 | 0 | 1 | 0 | 0 | 0 | 0 | 0 | ||||||||||
Non-government bonds | 0 | 0 | 0 | 0 | 0 | 0 | 0 | 0 | 0 | 0 | ||||||||||
Securitized and other Debt Investments | 0 | 45 | 0 | 0 | 45 | 0 | 118 | 0 | 0 | 118 | ||||||||||
Insurance | 0 | 0 | 0 | 0 | 0 | 0 | 0 | 0 | 0 | 0 | ||||||||||
Alternatives | ||||||||||||||||||||
Real estate | 0 | 0 | 0 | 0 | 0 | 0 | 0 | 0 | 0 | 0 | ||||||||||
Commodities | 0 | 0 | 0 | 0 | 0 | 0 | 0 | 0 | 0 | 0 | ||||||||||
Private equity | 0 | 0 | 0 | 0 | 0 | 0 | 0 | 0 | 0 | 0 | ||||||||||
Other | 0 | 0 | 0 | 0 | 0 | 0 | 0 | 0 | 0 | 0 | ||||||||||
Derivatives (Market Value) | ||||||||||||||||||||
Interest rate | 0 | 0 | (7) | 0 | (7) | 0 | 0 | (16) | 0 | (16) | ||||||||||
Credit | 0 | 0 | 0 | 0 | 0 | 0 | 1 | 0 | 0 | 1 | ||||||||||
Inflation | 0 | 0 | 0 | 0 | 0 | 0 | 0 | 0 | 14 | 14 | ||||||||||
Foreign exchange | 0 | 0 | 0 | 0 | 0 | 0 | 2 | 0 | 0 | 2 | ||||||||||
Other | 3 | 0 | 0 | 0 | 3 | 1 | 0 | 0 | 0 | 1 | ||||||||||
Total fair value of quoted | 1,312 | 1,307 | 496 | 111 | 3,226 | 2,642 | 2,688 | 614 | 178 | 6,122 | ||||||||||
1Allocation of equity exposure is broadly in line with the typical index in the respective market, e.g. the equity portfolio’s benchmark of the UK retirement benefit plans is the MSCI All Countries World Index.
2Investment-grade means BBB and above. Average credit rating exposure for the Group’s main plans is around A.
The following tables show the asset allocation of the “quoted” and “other” defined benefit plan assets by key geography in which they are invested.
| Dec 31, 2022 | |||||||||||||
in € m. | Germany | United | United | Other | Other | Emerging | Total | |||||||
Cash and cash equivalents | 4 | 387 | 126 | 132 | 31 | 30 | 710 | |||||||
Equity instruments | 29 | 43 | 881 | 327 | 172 | 62 | 1,514 | |||||||
Government bonds | 372 | 544 | 402 | 1,044 | 106 | 444 | 2,912 | |||||||
Government bonds | 0 | 1 | 0 | 0 | 2 | 92 | 95 | |||||||
Non-government bonds | 347 | 1,068 | 1,810 | 2,100 | 500 | 75 | 5,900 | |||||||
Non-government bonds | 16 | 104 | 23 | 327 | 7 | 3 | 480 | |||||||
Securitized and other Debt Investments | 32 | 35 | 81 | 21 | 9 | 2 | 180 | |||||||
Subtotal | 800 | 2,182 | 3,323 | 3,951 | 827 | 708 | 11,791 | |||||||
Share (in %) | 7% | 19% | 28% | 34% | 7% | 6% | 100% | |||||||
Other asset categories | 4,286 | |||||||||||||
Fair value of plan assets | 16,077 | |||||||||||||
350 |
Deutsche Bank | ||
Annual Report 2022 | ||
| Dec 31, 2021 | |||||||||||||
in € m. | Germany | United | United | Other | Other | Emerging | Total | |||||||
Cash and cash equivalents | 3 | 174 | 88 | 1,039 | 45 | 37 | 1,386 | |||||||
Equity instruments | 36 | 61 | 1,182 | 304 | 258 | 87 | 1,928 | |||||||
Government bonds | 860 | 1,799 | 500 | 1,153 | 222 | 551 | 5,085 | |||||||
Government bonds | 0 | 0 | 0 | 4 | 2 | 134 | 140 | |||||||
Non-government bonds | 500 | 1,546 | 2,437 | 2,873 | 539 | 100 | 7,995 | |||||||
Non-government bonds | 46 | 61 | 92 | 438 | 9 | 7 | 653 | |||||||
Securitized and other Debt Investments | 23 | 97 | 86 | 31 | 809 | 3 | 1,049 | |||||||
Subtotal | 1,468 | 3,738 | 4,385 | 5,842 | 1,884 | 919 | 18,236 | |||||||
Share (in %) | 8% | 20% | 24% | 32% | 10% | 5% | 100% | |||||||
Other asset categories | 2,652 | |||||||||||||
Fair value of plan assets | 20,888 | |||||||||||||
Plan assets include derivative transactions with Group entities with an overall positive market value of around € 1.3 billion at December 31, 2022 and € 553 million December 31, 2021, respectively. There is neither a material amount of securities issued by the Group nor other claims on Group assets included in the fair value of plan assets. The plan assets do not include any real estate which is used by the Group.
Key Risk Sensitivities
The Group’s defined benefit obligations are sensitive to changes in capital market conditions and actuarial assumptions. Sensitivities to capital market movements and key assumption changes are presented in the following table. Each market risk factor or assumption is changed in isolation. Sensitivities of the defined benefit obligations are approximated using geometric extrapolation methods based on plan durations for the respective assumption. Duration is a risk measure that indicates the broad sensitivity of the obligations to a change in an underlying assumption and provides a reasonable approximation for small to moderate changes in those assumptions.
For example, the interest rate duration is derived from the change in the defined benefit obligation to a change in the interest rate based on information provided by the local actuaries of the respective plans. The resulting duration is used to estimate the remeasurement liability loss or gain from changes in the interest rate. For other assumptions, a similar approach is used to derive the respective sensitivity results.
For defined benefit pension plans, changes in capital market conditions will impact the plan obligations via actuarial assumptions (e.g. via the discount rate and price inflation rate) as well as the plan assets’ fair value. Where the Group applies a liability driven investment approach or has insured part of the obligations as in the UK, the Group’s overall risk exposure to such changes is reduced. To help readers gain a better understanding of the Group’s risk exposures to key capital market movements, the net impact of the change in the defined benefit obligations and plan assets due to a change of the related market risk factor or underlying actuarial assumption is shown. Where changes in actuarial assumptions do not affect plan assets, only the impact on the defined benefit obligations is reported.
Asset-related sensitivities are derived for the Group’s major plans by using risk sensitivity factors determined by the Group’s Market Risk Management function. These sensitivities are calculated based on information provided by the plans’ investment managers and extrapolated linearly to reflect the approximate change of the plan assets’ market value in case of a change in the underlying risk factor.
351 |
Deutsche Bank | ||
Annual Report 2022 | ||
The sensitivities illustrate plausible variations over time in capital market movements and key actuarial assumptions. The Group is not in a position to provide a view on the likelihood of these capital market or assumption changes. While these sensitivities illustrate the overall impact on the funded status of the changes shown, the significance of the impact and the range of reasonable possible alternative assumptions may differ between the different plans that comprise the aggregated results. Even though plan assets and plan obligations are sensitive to similar risk factors, actual changes in plan assets and obligations may not fully offset each other due to imperfect correlations between market risk factors and actuarial assumptions. Caution should be used when extrapolating these sensitivities due to non-linear effects that changes in capital market conditions and key actuarial assumptions may have on the overall funded status. Any management actions that may be taken to mitigate the inherent risks in the post-employment defined benefit plans are not reflected in these sensitivities.
Dec 31, 2022 | Dec 31, 2021 | |||||||||||||||
in € m. | Germany | UK | U.S. | Other | Germany | UK | U.S. | Other | ||||||||
Interest rate (–50 bp): | ||||||||||||||||
(Increase) in DBO | (570) | (225) | (25) | (35) | (915) | (520) | (40) | (60) | ||||||||
Expected increase in plan assets1 | 290 | 170 | 25 | 10 | 595 | 350 | 35 | 20 | ||||||||
Expected net impact on funded status (de-) increase | (280) | (55) | 0 | (25) | (320) | (170) | (5) | (40) | ||||||||
Interest rate (+50 bp): | ||||||||||||||||
Decrease in DBO | 540 | 210 | 25 | 35 | 855 | 470 | 40 | 55 | ||||||||
Expected (decrease) in plan assets1 | (290) | (170) | (25) | (10) | (595) | (350) | (35) | (20) | ||||||||
Expected net impact on funded status (de-) increase | 250 | 40 | 0 | 25 | 260 | 120 | 5 | 35 | ||||||||
Credit spread (–50 bp): | ||||||||||||||||
(Increase) in DBO | (570) | (225) | (55) | (40) | (915) | (520) | (75) | (60) | ||||||||
Expected increase in plan assets1 | 210 | 65 | 15 | 5 | 595 | 125 | 15 | 10 | ||||||||
Expected net impact on funded status (de-) increase | (360) | (160) | (40) | (35) | (320) | (395) | (60) | (50) | ||||||||
Credit spread (+50 bp): | ||||||||||||||||
Decrease in DBO | 540 | 210 | 50 | 40 | 855 | 470 | 70 | 55 | ||||||||
Expected (decrease) in plan assets1 | (210) | (65) | (15) | (5) | (595) | (125) | (15) | (10) | ||||||||
Expected net impact on funded status (de-) increase | 330 | 145 | 35 | 35 | 260 | 345 | 55 | 45 | ||||||||
Rate of price inflation (–50 bp):2 | ||||||||||||||||
Decrease in DBO | 305 | 140 | 10 | 10 | 370 | 365 | 0 | 20 | ||||||||
Expected (decrease) in plan assets1 | (285) | (115) | 0 | (5) | (290) | (270) | 0 | (10) | ||||||||
Expected net impact on funded status (de-) increase | 20 | 25 | 10 | 5 | 80 | 95 | 0 | 10 | ||||||||
Rate of price inflation (+50 bp):2 | ||||||||||||||||
(Increase) in DBO | (325) | (145) | (5) | (10) | (385) | (365) | 0 | (25) | ||||||||
Expected increase in plan assets1 | 285 | 115 | 0 | 5 | 290 | 270 | 0 | 10 | ||||||||
Expected net impact on funded status (de-) increase | (40) | (30) | (5) | (5) | (95) | (95) | 0 | (15) | ||||||||
Rate of real increase in future compensation | ||||||||||||||||
Decrease in DBO, net impact on funded status | 30 | 5 | 0 | 10 | 55 | 5 | 0 | 15 | ||||||||
Rate of real increase in future compensation | ||||||||||||||||
(Increase) in DBO, net impact on funded status | (30) | (5) | 0 | (10) | (55) | (5) | 0 | (15) | ||||||||
Longevity improvements by 10%:3 | ||||||||||||||||
(Increase) in DBO, net impact on funded status | (215) | (60)4 | (20) | (10) | (335) | (160)4 | (30) | (15) | ||||||||
1 Expected changes in the fair value of plan assets contain the simulated impact from the biggest plans in Germany, the UK, the U.S., Channel Islands, Switzerland and Belgium which cover over 99% of the total fair value of plan assets. The fair value of plan assets for other plans is assumed to be unchanged for this presentation.
2Incorporates sensitivity to changes in pension benefits to the extent linked to the price inflation assumption.
3Estimated to be equivalent to an increase of around 1 year in overall life expectancy.
4Due to buy-in transaction the net impact on funded status reduces by € 30 million due to expected gains within the plan assets. The reduction was € 30 million for 2021.
352 |
Deutsche Bank | ||
Annual Report 2022 | ||
Expected cash flows
The following table shows expected cash flows for post-employment benefits in 2023, including contributions to the Group’s external pension trusts in respect of funded plans, direct payment to beneficiaries in respect of unfunded plans, as well as contributions to defined contribution plans.
2023 | ||
in € m. | Total | |
Expected contributions to | ||
Defined benefit plan assets | 150 | |
BVV | 55 | |
Other defined contribution plans | 260 | |
Expected benefit payments for unfunded defined benefit plans | 25 | |
Expected total cash flow related to post-employment benefits | 490 | |
Expense of employee benefits
The following table presents a breakdown of specific expenses according to the requirements of IAS 19 and IFRS 2.
in € m. | 2022 | 2021 | 2020 | |||
Expenses for defined benefit plans: | ||||||
Service cost1 | 229 | 234 | 246 | |||
Net interest cost (income) | (10) | 0 | 5 | |||
Total expenses defined benefit plans | 219 | 234 | 251 | |||
Expenses for defined contribution plans: | ||||||
BVV | 57 | 58 | 60 | |||
Other defined contribution plans | 258 | 244 | 243 | |||
Total expenses for defined contribution plans | 315 | 302 | 303 | |||
Total expenses for post-employment benefit plans | 534 | 536 | 554 | |||
Employer contributions to state-mandated pension plans | ||||||
Pensions related payments social security in Germany | 214 | 221 | 233 | |||
Contributions to pension fund for Postbank´s postal civil servants | 58 | 66 | 79 | |||
Further pension related state-mandated benefit plans | 216 | 217 | 245 | |||
Total employer contributions to state-mandated benefit plans | 488 | 504 | 557 | |||
Expenses for share-based payments: | ||||||
Expenses for share-based payments, equity settled2 | 405 | 455 | 318 | |||
Expenses for share-based payments, cash settled2 | 29 | 35 | 49 | |||
Expenses for cash retention plans2 | 418 | 398 | 329 | |||
Expenses for severance payments3 | 82 | 184 | 184 | |||
1Severance related items under Service Costs are reclassified to Expenses for Severance payments.
2Including expenses for new hire awards and the acceleration of expenses not yet amortized due to the discontinuation of employment including those amounts which are recognized as part of the Group’s restructuring expenses.
3 Excluding the acceleration of expenses for deferred compensation awards not yet amortized. Severance related items under Service Costs were reclassified to Expense for Severance payments.
353 |
Deutsche Bank | ||
Annual Report 2022 | ||
34 – Income Taxes
in € m. | 2022 | 2021 | 2020 | |||
Current tax expense (benefit): | ||||||
Tax expense (benefit) for current year | 919 | 847 | 739 | |||
Adjustments for prior years | (132) | 14 | (46) | |||
Total current tax expense (benefit) | 787 | 861 | 693 | |||
Deferred tax expense (benefit): | ||||||
Origination and reversal of temporary differences, unused tax losses and tax credits | 424 | 65 | (218) | |||
Effect of changes in tax law and/or tax rate | (20) | (26) | (11) | |||
Adjustments for prior years | (1,256) | (20) | (67) | |||
Total deferred tax expense (benefit) | (852) | 19 | (296) | |||
Total income tax expense (benefit) | (64) | 880 | 397 | |||
Total deferred tax benefit includes benefits from previously unrecognized tax losses (tax credits/deductible temporary differences) and the reversal of previous write-downs of deferred tax assets and expenses arising from write-downs of deferred tax assets, which increased the deferred tax benefit by € 1.4 billion in 2022, decreased the deferred tax expense by € 242 million in 2021, and decreased the deferred tax benefit by € 96 million in 2020.
Difference between applying German statutory (domestic) income tax rate and actual income tax expense/(benefit)
in € m. | 2022 | 2021 | 2020 | |||
Expected tax expense (benefit) at domestic income tax rate of 31.3% (31.3% for 2021 and 31.3% for 2020) | 1,751 | 1,061 | 319 | |||
Foreign rate differential | (117) | (92) | (38) | |||
Tax-exempt gains on securities and other income | (217) | (183) | (181) | |||
Loss (income) on equity method investments | (12) | (11) | (18) | |||
Nondeductible expenses | 429 | 287 | 293 | |||
Impairments of goodwill | (0) | 1 | 0 | |||
Changes in recognition and measurement of deferred tax assets1 | (1,891) | (227) | 96 | |||
Effect of changes in tax law and/or tax rate | (20) | (26) | (11) | |||
Effect related to share-based payments | (5) | 1 | (29) | |||
Other1 | 18 | 69 | (34) | |||
Actual income tax expense (benefit) | (64) | 880 | 397 | |||
1Current and deferred tax expense/(benefit) relating to prior years are mainly reflected in the line items “Changes in recognition and measurement of deferred tax assets” and “Other”.
The Group is under continuous examinations by tax authorities in various jurisdictions. “Other” in the preceding table includes the effects of these examinations by the tax authorities.
Changes in recognition and measurement of deferred tax assets in 2022 and 2021 mainly included the effect of the recognition of previously unrecognized deferred tax assets in the U.S. In determining the amount of deferred tax assets, the Group uses historical tax capacity and profitability information and, if relevant, forecasted operating results based upon approved business plans, including a review of the eligible carry-forward periods, available tax planning opportunities and other relevant considerations.
The domestic income tax rate, including corporate tax, solidarity surcharge, and trade tax, used for calculating deferred tax assets and liabilities was 31.3% for 2022, 2021 and 2020.
Income taxes credited or charged to equity (other comprehensive income/additional paid in capital)
in € m. | 2022 | 2021 | 2020 | |||
Actuarial gains (losses) related to defined benefit plans | (642 ) | (207) | 76 | |||
Net fair value gains (losses) attributable to credit risk related to financial | (25 ) | 5 | 6 | |||
Financial assets mandatory at fair value through other comprehensive income: | ||||||
Unrealized net gains (losses) arising during the period | 254 | 109 | (204) | |||
Realized net gains (losses) arising during the period (reclassified to profit or loss) | (61) | 68 | 84 | |||
Derivatives hedging variability of cash flows: | ||||||
Unrealized net gains (losses) arising during the period | 229 | (2) | 4 | |||
Net gains (losses) reclassified to profit or loss | (18) | 15 | (1) | |||
Other equity movement: | ||||||
Unrealized net gains (losses) arising during the period | 192 | 88 | (19) | |||
Net gains (losses) reclassified to profit or loss | 0 | 7 | 14 | |||
Income taxes credited (charged) to other comprehensive income | (71) | 83 | (40) | |||
Other income taxes credited (charged) to equity | 25 | 45 | 11 | |||
354 |
Deutsche Bank | ||
Annual Report 2022 | ||
Major components of the Group’s gross deferred tax assets and liabilities
in € m. | Dec 31, 2022 | Dec 31, 2021 | ||
Deferred tax assets: | ||||
Unused tax losses | 3,946 | 1,653 | ||
Unused tax credits | 2 | 2 | ||
Deductible temporary differences: | ||||
Trading activities, including derivatives | 8,157 | 2,105 | ||
Employee benefits, including equity settled share based payments | 1,653 | 2,533 | ||
Accrued interest expense | 1,367 | 1,428 | ||
Loans and borrowings, including allowance for loans | 791 | 892 | ||
Leases | 865 | 857 | ||
Intangible Assets | 43 | 52 | ||
Fair value OCI (IFRS 9) | 387 | 53 | ||
Other assets | 630 | 515 | ||
Other provisions | 81 | 110 | ||
Other liabilities | 1 | 10 | ||
Total deferred tax assets pre offsetting | 17,923 | 10,210 | ||
Deferred tax liabilities: | ||||
Taxable temporary differences: | ||||
Trading activities, including derivatives | 8,561 | 1,958 | ||
Employee benefits, including equity settled share based payments | 245 | 296 | ||
Loans and borrowings, including allowance for loans | 549 | 538 | ||
Leases | 780 | 774 | ||
Intangible Assets | 594 | 501 | ||
Fair value OCI (IFRS 9) | 70 | 76 | ||
Other assets | 371 | 214 | ||
Other provisions | 85 | 82 | ||
Other liabilities | 46 | 54 | ||
Total deferred tax liabilities pre offsetting | 11,301 | 4,493 | ||
Deferred tax assets and liabilities, after offsetting
in € m. | Dec 31, 2022 | Dec 31, 2021 | ||
Presented as deferred tax assets | 7,272 | 6,218 | ||
Presented as deferred tax liabilities | 650 | 501 | ||
Net deferred tax assets | 6,622 | 5,717 | ||
The change in the balance of deferred tax assets and deferred tax liabilities might not equal the deferred tax expense/(benefit). In general, this is due to (1) deferred taxes that are booked directly to equity, (2) the effects of exchange rate changes on tax assets and liabilities denominated in currencies other than euro, (3) the acquisition and disposal of entities as part of ordinary activities and (4) the reclassification of deferred tax assets and liabilities which are presented otherwise on the face of the balance sheet as components of other assets and liabilities.
In August 2022, the U.S. enacted the corporate alternative minimum tax (Inflation Reduction Act). These new provisions will take effect for the first time in 2023 and will generally apply to the Group’s U.S. operations. The corporate alternative minimum tax is imposed at a tax rate of 15% on profits before tax determined under U.S. Generally Accepted Accounting Principles with some adjustments. To the extent an alternative minimum tax liability may arise in the future, a corresponding deferred tax asset on unused tax credits may generally be recognized, as such liability may be carried forward indefinitely as a tax credit.
Items for which no deferred tax assets were recognized
in € m. | Dec 31, 2022¹ | Dec 31, 2021¹ | ||
Deductible temporary differences | (773) | (988) | ||
Not expiring | (9,462) | (10,331) | ||
Expiring in subsequent period | (0) | 0 | ||
Expiring after subsequent period | (471) | (5,811) | ||
Unused tax losses | (9,933) | (16,142) | ||
Expiring after subsequent period | (0) | (20) | ||
Unused tax credits | (1) | (21) | ||
1Amounts in the table refer to deductible temporary differences, unused tax losses and tax credits for federal income tax purposes.
Deferred tax assets were not recognized on these items because it is not probable that future taxable profit will be available against which the unused tax losses, unused tax credits and deductible temporary differences can be utilized.
355 |
Deutsche Bank | ||
Annual Report 2022 | ||
As of December 31, 2022 and December 31, 2021, the Group recognized deferred tax assets of € 2.5 billion and € 5.4 billion, respectively, that exceeded deferred tax liabilities in entities which have suffered a loss in either the current or preceding period. This is based on management’s assessment that it is probable that the respective entities will have taxable profits against which the unused tax losses, unused tax credits and deductible temporary differences can be utilized. In determining the amounts of deferred tax assets to be recognized, management uses historical profitability information and, if relevant, forecasted operating results, based upon approved business plans, including a review of the eligible carry-forward periods, tax planning opportunities and other relevant considerations.
As of December 31, 2022 and December 31, 2021, the Group had temporary differences associated with the Group’s parent company’s investments in subsidiaries, branches and associates and interests in joint ventures of € 244 million and € 242 million respectively, in respect of which no deferred tax liabilities were recognized.
35 – Derivatives
Derivative financial instruments and hedging activities
Derivative contracts used by the Group include swaps, futures, forwards, options and other similar types of contracts. In the normal course of business, the Group enters into a variety of derivative transactions for sales, market-making and risk management purposes. The Group’s objectives in using derivative instruments are to meet customers’ risk management needs and to manage the Group’s exposure to risks.
In accordance with the Group’s accounting policy relating to derivatives and hedge accounting as described in Note 1 “Significant Accounting Policies and Critical Accounting Estimates”, all derivatives are carried at fair value in the balance sheet regardless of whether they are held for trading or non-trading purposes.
Derivatives held for sales and market-making purposes
Sales and market-making
The majority of the Group’s derivatives transactions relate to sales and market-making activities. Sales activities include the structuring and marketing of derivative products to customers to enable them to take, transfer, modify or reduce current or expected risks. Market-making involves quoting bid and offer prices to other market participants, enabling revenue to be generated based on spreads and volume.
Risk management
The Group uses derivatives in order to reduce its exposure to market risks as part of its asset and liability management. This is achieved by entering into derivatives that hedge specific portfolios of fixed rate financial instruments and forecast transactions as well as strategic hedging against overall balance sheet exposures. The Group actively manages interest rate risk through, among other things, the use of derivative contracts. Utilization of derivative financial instruments is modified from time to time within prescribed limits in response to changing market conditions, as well as to changes in the characteristics and mix of the related assets and liabilities.
Derivatives qualifying for hedge accounting
The Group applies hedge accounting if derivatives meet the specific criteria described in Note 1 “Significant Accounting Policies and Critical Accounting Estimates”.
In fair value hedge relationship, the Group uses primarily interest rate swaps and options, in order to protect itself against movements in the fair value of fixed-rate financial instruments due to movements in market interest rates. In a cash flow hedge relationship, the Group uses interest rate swaps in order to protect itself against exposure to variability in interest rates. The Group enters into foreign exchange forwards and swaps for hedges of translation adjustments resulting from translating the financial statements of net investments in foreign operations into the reporting currency of the parent at period end spot rates.
356 |
Deutsche Bank | ||
Annual Report 2022 | ||
Interest rate risk
The Group uses interest rate swaps and options to manage its exposure to interest rate risk by modifying the re-pricing characteristics of existing and/or forecasted assets and liabilities, including funding and investment activities. The interest rate swaps and options are designated in either a fair value hedge or a cash flow hedge. For fair value hedges, the Group uses interest rate swaps and options contracts to manage the fair value movements of fixed rate financial instruments due to changes in benchmark interest. For cash flow hedges, we use interest rate swaps to manage the exposure to cash flow variability of our variable rate instruments as a result of changes in benchmark interest rates.
The Group manages its interest rate risk exposure on a portfolio basis with frequent changes in the portfolio due to the origination of new loans and bonds, repayments of existing loans and bonds, issuance of new funding liabilities and repayment of existing funding liabilities. Accordingly, a dynamic hedging accounting approach is adopted for the portfolio, in which individual hedge relationships are designated and de-designated on a more frequent basis (e.g. on a monthly basis).
The Group assesses and measures hedge effectiveness of a hedging relationship based on the change in the fair value or cash flows of the derivative hedging instrument relative to the change in the fair value or cash flows of the hedged item attributable to the hedged risk. Potential sources of ineffectiveness can be attributed to differences between hedging instruments and hedged items:
- – Mismatches in the terms of hedged items and hedging instruments, for example the frequency and timing of when interest rates are reset, frequency of payment and callable features.
- – Difference in the discounting rate applied to the hedged item and the hedging instrument, taking into consideration differences in the reset frequency of the hedged item and hedging instrument.
- – Derivatives used as hedging instrument with a non-zero fair value at inception date of the hedging relationship, resulting in mismatch in terms with the hedged item.
Foreign exchange risk
The Group manages its foreign currency risk (including U.S. dollar and British pound) from investments in foreign operation through net investment hedges using rolling foreign exchange forward strategy. In addition, the Group applies cash flow hedge accounting for specific foreign denominated highly probable cash flows using foreign exchange forward instruments as hedging instruments.
As the investments in foreign operations are only hedged to the extent of the notional amount of the hedging derivative instrument the Group generally does not expect to incur significant ineffectiveness on hedges of net investments in foreign operations. Potential sources of ineffectiveness are limited to situations where derivatives with a non-zero fair value at inception date of the hedging relationship are used as hedging instrument, resulting in mismatch in terms with the hedged item. Similarly, for cash flow hedge accounting applications the foreign exchange forward instruments generally match the terms of the underlying highly probable transactions such that the Group does not expect to incur significant ineffectiveness in such hedge relationships.
Hedge Accounting and Interest Rate Benchmarks
The table below shows the Group’s hedge accounting relationships impacted by the IASB Benchmark Reform amendments, the significant interest rate benchmarks the Group is exposed to which are subject to expected future reform, and the nominal amounts of the derivative hedging instruments as at December 31, 2022 and December 31, 2021. As at December 31, 2022 there were no hedge relationships with hedging instruments, hedged items or the hedged risk being an IBOR benchmark which ceased to be quoted in early 2022. The derivative hedging instruments provide a close approximation to the extent of the risk exposure the Group manages through hedge accounting relationships.
Hedge accounting relationships impacted by the IASB Benchmark Reform amendments
Dec 31, 2022 | Dec 31, 2021 | |||
in € m. | Notional | Notional | ||
Fair value hedge | ||||
CHF LIBOR | 0 | 0 | ||
GBP LIBOR | 0 | 0 | ||
JPY LIBOR | 0 | 0 | ||
USD LIBOR | 12,281 | 20,298 | ||
357 |
Deutsche Bank | ||
Annual Report 2022 | ||
Fair value hedge accounting
Derivatives held as fair value hedges
| Dec 31, 2022 | 2022 | Dec 31, 2021 | 2021 | ||||||||||||
in € m. | Assets | Liabilities | Nominal | Fair Value | Assets | Liabilities | Nominal | Fair Value | ||||||||
Derivatives held as fair value hedges | 10,392 | 18,053 | 257,443 | (6,000) | 4,591 | 1,928 | 156,553 | (1,424) | ||||||||
| 2022 | 2021 | ||
in € m. | Hedge | Hedge | ||
Result of fair value hedges | 349 | 448 | ||
Financial instruments designated in fair value hedges
Dec 31, 2022 | 2022 | |||||||||||||
Carrying amount of Financial | Accumulated amount of | Accumulated amount of | Fair Value | |||||||||||
in € m. | Assets | Liabilities | Assets | Liabilities | Assets | Liabilities | ||||||||
Financial assets at fair value through | 14,823 | 0 | (2,311) | 0 | (21) | 0 | (2,607) | |||||||
Bonds at amortized cost | 336 | 0 | (37) | 0 | 0 | 0 | (37) | |||||||
Long-term debt | 0 | 68,596 | 0 | (6,606) | 0 | (164) | 8,444 | |||||||
Deposits | 0 | 135,231 | 0 | (7,727) | 0 | 0 | 7,507 | |||||||
Loans at amortized cost | 35,957 | 0 | (6,559) | 0 | 0 | 0 | (6,958) | |||||||
Dec 31, 2021 | 2021 | |||||||||||||
Carrying amount of Financial | Accumulated amount of | Accumulated amount of | Fair Value | |||||||||||
in € m. | Assets | Liabilities | Assets | Liabilities | Assets | Liabilities | ||||||||
Financial assets at fair value through | 12,397 | 0 | (221) | 0 | 4 | 0 | (724) | |||||||
Bonds at amortized cost | 582 | 0 | 5 | 0 | 2 | 0 | (12) | |||||||
Long-term debt | 0 | 62,294 | 0 | 1,595 | 0 | 302 | 2,329 | |||||||
Deposits | 0 | 57,893 | 0 | (646) | 0 | 0 | 1,357 | |||||||
Loans at amortized cost | 16,949 | 0 | (751) | 0 | 0 | 0 | (1,078) | |||||||
Cash flow hedge accounting
Derivatives held as cash flow hedges
Dec 31, 2022 | 2022 | Dec 31, 2021 | 2021 | |||||||||||||
in € m. | Assets | Liabilities | Nominal | Fair Value | Assets | Liabilities | Nominal | Fair Value | ||||||||
Derivatives held as cash flow hedges | 6 | 1,219 | 47,976 | (802) | 49 | 43 | 7,451 | (75) | ||||||||
Cash flow hedge balances
in € m. | Dec 31, 2022 | Dec 31, 2021 | Dec 31, 2020 | |||
Reported in Equity1 | (790) | (42) | 11 | |||
thereof relates to terminated programs | 0 | 0 | 0 | |||
Gains (losses) posted to equity for the year ended | (819) | 1 | (14) | |||
Gains (losses) removed from equity for the year ended | 71 | (54) | 4 | |||
thereof relates to terminated programs | 0 | 0 | 0 | |||
Changes of hedged item's value used for hedge effectiveness | (899) | 66 | (7) | |||
Ineffectiveness recorded within P&L | 16 | 25 | (12) | |||
1Reported in equity refers to accumulated other comprehensive income as presented in the Consolidated Balance Sheet.
358 |
Deutsche Bank | ||
Annual Report 2022 | ||
In accordance with IAS 39.96 the gains and losses posted to equity in a cash flow hedge relationship is the lesser of cumulative gain or loss on the hedging instrument from the inception of the hedge and the cumulative change in fair value of the expected future cash flows on the hedged item from inception of the hedge. As a result, changes of the hedged item’s value used for hedge effectiveness are not fully recorded in equity if it exceeds the hedging instrument’s fair value changes used for hedge effectiveness. Consequently, hedge ineffectiveness recorded within P&L does not always reconcile to the difference between the changes of the hedged item’s value used for hedge effectiveness and the hedging instrument’s fair value changes used for hedge effectiveness.
As of December 31, 2022 the longest term cash flow hedge matures in 2034.
The financial instruments designated as cash flow hedges are recognized as Loans at amortized cost in the Group’s Consolidated Balance Sheet.
Net investment hedge accounting
Derivatives held as net investment hedges
Dec 31, 2022 | 2022 | Dec 31, 2021 | 2021 | |||||||||||||
in € m. | Assets | Liabilities | Nominal amount | Fair Value | Assets | Liabilities | Nominal amount | Fair Value | ||||||||
Derivatives held as net investment hedges | 1,044 | 513 | 45,749 | (2,539) | 227 | 1,093 | 39,087 | (1,707) | ||||||||
| 2022 | 2021 | ||||||
in € m. | Fair value changes | Hedge | Fair value changes | Hedge | ||||
Result of net investment hedges | 2,410 | (329) | 1,892 | (179) | ||||
1Reported in equity refers to accumulated other comprehensive income as presented in the Consolidated Balance Sheet.
Profile of derivatives held as net investment hedges
in € m. | Within 1 year | 1–3 years | 3–5 years | Over 5 years | ||||
As of December 31, 2022 | ||||||||
Nominal amount Foreign exchange forwards | 34,664 | 229 | 21 | 0 | ||||
Nominal amount Foreign exchange swaps | 10,776 | 59 | 0 | 0 | ||||
Total | 45,440 | 288 | 21 | 0 | ||||
As of December 31, 2021 | ||||||||
Nominal amount Foreign exchange forwards | 31,727 | 36 | 0 | 3 | ||||
Nominal amount Foreign exchange swaps | 7,239 | 68 | 16 | 0 | ||||
Total | 38,965 | 103 | 16 | 3 | ||||
The Group uses a foreign exchange forward strategy. As indicated in the above table, the vast majority of forward contracts mature within the year. The Group did not calculate an average foreign currency rate because the amount of contracts that mature after 1 year are not material.
359 |
Deutsche Bank | ||
Annual Report 2022 | ||
36 – Related Party Transactions
Parties are considered to be related if one party has the ability to directly or indirectly control the other party or exercise significant influence over the other party in making financial or operational decisions. The Group’s related parties include:
- – Key management personnel including close family members and entities which are controlled, significantly influenced by, or for which significant voting power is held by key management personnel or their close family members
- – Subsidiaries, joint ventures and associates and their respective subsidiaries
- – Post-employment benefit plans for the benefit of Deutsche Bank employees
Transactions with Key Management Personnel
Key management personnel are those persons having authority and responsibility for planning, directing, and controlling the activities of Deutsche Bank, directly or indirectly. The Group considers the members of the Management Board and of the Supervisory Board of the parent company to constitute key management personnel for purposes of IAS 24.
Compensation expense of key management personnel
in € m. | 2022 | 2021 | 2020 | |||
Short-term employee benefits | 37 | 36 | 30 | |||
Post-employment benefits | 5 | 7 | 7 | |||
Other long-term benefits | 15 | 10 | 2 | |||
Termination benefits | 2 | 6 | 0 | |||
Share-based payment | 17 | 15 | 8 | |||
Total | 76 | 74 | 47 | |||
The above table does not contain compensation that employee representatives and former board members on the Supervisory Board have received. The aggregated compensation paid to such members for their services as employees of Deutsche Bank or status as former employees (retirement, pension and deferred compensation) amounted to € 1 million as of December 31, 2022, € 1 million as of December 31, 2021 and € 1 million as of December 31, 2020.
Among the Group’s transactions with key management personnel as of December 31, 2022, were loans and commitments of € 5 million and deposits of € 8 million. As of December 31, 2021, the Group’s transactions with key management personnel were loans and commitments of € 8 million and deposits of € 13 million.
In addition, the Group provides banking services, such as payment and account services as well as investment advice, to key management personnel.
Transactions with Subsidiaries, Joint Ventures and Associates
Transactions between Deutsche Bank AG and its subsidiaries meet the definition of related party transactions. If these transactions are eliminated on consolidation, they are not disclosed as related party transactions. Transactions between the Group and its associated companies and joint ventures and their respective subsidiaries also qualify as related party transactions.
Transactions for subsidiaries, joint ventures and associates are presented combined in below table as these are not material individually.
Loans
in € m. | 2022 | 2021 | ||
Loans outstanding, beginning of year | 153 | 214 | ||
Net movement in loans during the period | (34) | 159 | ||
Changes in the group of consolidated companies | 0 | 0 | ||
Exchange rate changes/other1 | 0 | (221) | ||
Loans outstanding, end of year1,2 | 119 | 153 | ||
Other credit risk related transactions: | ||||
Allowance for loan losses | 0 | 0 | ||
Provision for loan losses | 0 | 0 | ||
Guarantees and commitments | 5 | 28 | ||
1Prior years' comparatives aligned to presentation in the current year.
2.Loans past due were € 0 million as of December 31, 2022 and € 0 million as of December 31, 2021. For the total loans the Group held collateral of € 0 million and € 0 million as of December 31, 2022 and December 31, 2021, respectively.
360 |
Deutsche Bank | ||
Annual Report 2022 | ||
Deposits
in € m. | 2022 | 2021 | ||
Deposits outstanding, beginning of year | 63 | 49 | ||
Net movement in deposits during the period | (32) | 14 | ||
Changes in the group of consolidated companies | 0 | 0 | ||
Exchange rate changes/other | 0 | 0 | ||
Deposits outstanding, end of year | 31 | 63 | ||
Other Transactions
Trading assets and positive market values from derivative financial transactions with associated companies amounted to € 3 million as of December 31, 2022, and € 2 million as of December 31, 2021. Trading liabilities and negative market values from derivative financial transactions with associated companies amounted to € 0 million as of December 31, 2022, and € 0 million as of December 31, 2021.
Other assets related to transactions with associated companies amounted to € 33 million as of December 31, 2022, and € 42 million as of December 31, 2021. Other liabilities related to transactions with associated companies were € 3 million as of December 31, 2022, and € 1 million as of December 31, 2021.
Transactions with Pension Plans
Under IFRS, post-employment benefit plans are considered related parties. The Group has business relationships with a number of its pension plans pursuant to which it provides financial services to these plans, including investment management services. The Group’s pension funds may hold or trade Deutsche Bank shares or securities.
Transactions with related party pension plans
in € m. | 2022 | 2021 | ||
Equity shares issued by the Group held in plan assets | 0 | 23 | ||
Other assets | 5 | 17 | ||
Fees paid from plan assets to asset managers of the Group | 20 | 22 | ||
Market value of derivatives with a counterparty of the Group | 1,389 | 765 | ||
Notional amount of derivatives with a counterparty of the Group | 12,888 | 12,309 | ||
361 |
Deutsche Bank | ||
Annual Report 2022 | ||
37 – Information on Subsidiaries
Composition of the Group
Deutsche Bank AG is the direct or indirect holding company for the Group’s subsidiaries.
The Group consists of 521 (2021: 563) consolidated entities, thereof 200 (2021: 225) consolidated structured entities. 362 (2021: 376) of the entities controlled by the Group are directly or indirectly held by the Group at 100% of the ownership interests (share of capital). Third parties also hold ownership interests in 159 (2021: 187) of the consolidated entities (noncontrolling interests). As of December 31, 2022, and 2021, one subsidiary has material noncontrolling interests. Noncontrolling interests for all other subsidiaries are neither individually nor cumulatively material to the Group.
Subsidiaries with material noncontrolling interests
| Dec 31, 2022 | Dec 31, 2021 | ||
DWS Group GmbH & Co. KGaA | ||||
Proportion of ownership interests and voting rights held by noncontrolling interests | 20.51% | 20.51% | ||
Place of business | Global | Global | ||
in € m | Dec 31, 2022 | Dec 31, 2021 | ||
Net income attributable to noncontrolling interests | 119 | 161 | ||
Accumulated noncontrolling interests of the subsidiary | 1,622 | 1,545 | ||
Dividends paid to noncontrolling interests | 82 | 74 | ||
Summarized financial information: | ||||
Total assets | 11,396 | 11,611 | ||
Total liabilities | 3,566 | 4,166 | ||
Total net revenues | 2,712 | 2,720 | ||
Net income (loss) | 599 | 782 | ||
Total comprehensive income (loss), net of tax | 783 | 1,064 | ||
Significant restrictions to access or use the Group’s assets
Statutory, contractual or regulatory requirements as well as protective rights of noncontrolling interests might restrict the ability of the Group to access and transfer assets freely to or from other entities within the Group and to settle liabilities of the Group.
The following restrictions impact the Group’s ability to use assets:
- – The Group has pledged assets to collateralize its obligations under repurchase agreements, securities financing transactions, collateralized loan obligations and for margining purposes for OTC derivative liabilities
- – The assets of consolidated structured entities are held for the benefit of the parties that have bought the notes issued by these entities
- – Regulatory and central bank requirements or local corporate laws may restrict the Group’s ability to transfer assets to or from other entities within the Group in certain jurisdictions
Restricted assets
| Dec 31, 2022 | Dec 31, 2021 | ||||||
in € m. | Total | Restricted | Total | Restricted | ||||
Interest-earning deposits with banks | 164,136 | 108 | 180,942 | 196 | ||||
Financial assets at fair value through profit or loss | 482,376 | 40,346 | 491,233 | 55,325 | ||||
Financial assets at fair value through other comprehensive income | 31,675 | 2,771 | 28,979 | 6,648 | ||||
Loans at amortized cost | 483,700 | 73,500 | 471,319 | 79,764 | ||||
Other | 174,902 | 3,592 | 151,521 | 3,233 | ||||
Total | 1,336,788 | 120,317 | 1,323,993 | 145,166 | ||||
The table above excludes assets that are not encumbered at an individual entity level, but which may be subject to restrictions in terms of their transferability within the Group. Such restrictions may be based on local connected lending requirements or similar regulatory restrictions. In this situation, it is not feasible to identify individual balance sheet items that cannot be transferred. This is also the case for regulatory minimum liquidity requirements. The Group identifies the volume of liquidity reserves in excess of local stress liquidity outflows. The aggregate amount of such liquidity reserves that are considered restricted for this purpose is € 19.9 billion as of December 31, 2022 (as of December 31, 2021: € 25.5 billion).
362 |
Deutsche Bank | ||
Annual Report 2022 | ||
38 – Structured entities
Nature, purpose and extent of the Group’s interests in structured entities
The Group engages in various business activities with structured entities which are designed to achieve a specific business purpose. A structured entity is one that has been set up so that any voting rights or similar rights are not the dominant factor in deciding who controls the entity. An example is when voting rights relate only to administrative tasks and the relevant activities are directed by contractual arrangements.
A structured entity often has some or all of the following features or attributes:
- – Restricted activities
- – A narrow and well defined objective
- – Insufficient equity to permit the structured entity to finance its activities without subordinated financial support
- – Financing in the form of multiple contractually linked instruments to investors that create concentrations of credit or other risks (tranches)
The principal uses of structured entities are to provide clients with access to specific portfolios of assets and to provide market liquidity for clients through securitizing financial assets. Structured entities may be established as corporations, trusts or partnerships. Structured entities generally finance the purchase of assets by issuing debt and equity securities that are collateralized by and/or indexed to the assets held by the structured entities. The debt and equity securities issued by structured entities may include tranches with varying levels of subordination.
Structured entities are consolidated when the substance of the relationship between the Group and the structured entities indicate that the structured entities are controlled by the Group, as discussed in Note 1 “Significant Accounting Policies and Critical Accounting Estimates”.
Consolidated structured entities
The Group has contractual arrangements which may require it to provide financial support to the following types of consolidated structured entities.
Securitization vehicles
The Group uses securitization vehicles for funding purchase of diversified pool of assets. The Group provides financial support to these entities in the form of liquidity facility. As of December 31, 2022, and December 31, 2021, there were no outstanding loan commitments to these entities.
Funds
The Group may provide funding and liquidity facility or guarantees to funds consolidated by the group. As of December 31, 2022 and December 31, 2021, the notional value of the liquidity facilities and guarantees provided by the Group to such funds was € 1.1 billion and € 1.2 billion, respectively.
Deutsche Bank did not provide non-contractual support during the year to consolidated structured entities.
Unconsolidated structured entities
These are entities which are not consolidated because the Group does not control them through voting rights, contract, funding agreements, or other means. The extent of the Group’s interests to unconsolidated structured entities will vary depending on the type of structured entities.
Below is a description of the Group’s involvements in unconsolidated structured entities by type.
Repackaging and investment entities
Repackaging and investment entities are established to meet clients’ investment needs through the combination of securities and derivatives. These entities are not consolidated by the Group because the Group does not have power to influence the returns obtained from the entities. These entities are usually set up to provide a certain investment return pre-agreed with the investor, and the Group is not able to change the investment strategy or return during the life of the transaction.
363 |
Deutsche Bank | ||
Annual Report 2022 | ||
Third party funding entities
The Group provides funding to structured entities that hold a variety of assets. These entities may take the form of funding entities, trusts and private investment companies. The funding is collateralized by the asset in the structured entities. The group’s involvement involves predominantly both lending and loan commitments.
The vehicles used in these transactions are controlled by the borrowers where the borrowers have the ability to decide whether to post additional margin or collateral in respect of the financing. In such cases, where borrowers can decide to continue or terminate the financing, the borrowers will consolidate the vehicle.
Securitization Vehicles
The Group establishes securitization vehicles which purchase diversified pools of assets, including fixed income securities, corporate loans, and asset-backed securities (predominantly commercial and residential mortgage-backed securities and credit card receivables). The vehicles fund these purchases by issuing multiple tranches of debt and equity securities, the repayment of which is linked to the performance of the assets in the vehicles.
The Group may transfer assets to these securitization vehicles and provides financial support to these entities in the form of liquidity facilities.
The Group also invests and provides liquidity facilities to third party sponsored securitization vehicles.
The securitization vehicles that are not consolidated into the Group are those where the Group does not hold the power or ability to unilaterally remove the servicer or special servicer who has been delegated power over the activities of the entity.
Funds
The Group establishes structured entities to accommodate client requirements to hold investments in specific assets. The Group also invests in funds that are sponsored by third parties. A group entity may act as fund manager, custodian or some other capacity and provide funding and liquidity facilities to both group sponsored and third party funds. The funding provided is collateralized by the underlying assets held by the fund.
The Group does not consolidate funds when Deutsche Bank is deemed agent or when another third party investor has the ability to direct the activities of the fund.
Other
These are Deutsche Bank sponsored or third party structured entities that do not fall into any criteria above. These entities are not consolidated by the Group when the Group does not hold power over the decision making of these entities.
Income derived from involvement with structured entities
The Group earns management fees and, occasionally, performance-based fees for its investment management service in relation to funds. Interest income is recognized on the funding provided to structured entities. Any trading revenue as a result of derivatives with structured entities and from the movements in the value of notes held in these entities is recognized in ‘Net gains/losses on financial assets/liabilities held at fair value through profit and loss’.
Interests in unconsolidated structured entities
The Group’s interests in unconsolidated structured entities refer to contractual and non-contractual involvement that exposes the Group to variability of returns from the performance of the structured entities. Examples of interests in unconsolidated structured entities include debt or equity investments, liquidity facilities, guarantees and certain derivative instruments in which the Group is absorbing variability of returns from the structured entities.
Interests in unconsolidated structured entities exclude instruments which introduce variability of returns into the structured entities. For example, when the Group purchases credit protection from an unconsolidated structured entity whose purpose and design is to pass through credit risk to investors, the Group is providing the variability of returns to the entity rather than absorbing variability. The purchased credit protection is therefore not considered as an interest for the purpose of the table below.
364 |
Deutsche Bank | ||
Annual Report 2022 | ||
Maximum exposure to unconsolidated structured entities
The maximum exposure to loss is determined by considering the nature of the interest in the unconsolidated structured entity. The maximum exposure for loans and trading instruments is reflected by their carrying amounts in the consolidated balance sheet. The maximum exposure for derivatives and off balance sheet commitments such as guarantees, liquidity facilities and loan commitments under IFRS 12, as interpreted by the Group, is reflected by the notional amounts. Such amounts or its development do not reflect the economic risks faced by the Group because it does not take into account the effects of collateral or hedges nor the probability of such losses being incurred. At December 31, 2022, the notional related to the positive and negative replacement values of derivatives and off balance sheet commitments were € 457 billion, € 397 billion and € 28 billion respectively. At December 31, 2021, the notional related to the positive and negative replacement values of derivatives and off balance sheet commitments were € 104 billion, € 296 billion and € 22 billion respectively.
Size of structured entities
The Group provides a different measure for size of structured entities depending on their type. The following measures have been considered as appropriate indicators for evaluating the size of structured entities:
- – Funds – Net asset value or assets under management where the Group holds fund units and notional of derivatives when the Group’s interest comprises of derivatives
- – Securitizations – notional of notes in issue (excluding interest only and excess notes where applicable) when the Group derives its interests through notes its holds and notional of derivatives when the Group’s interests is in the form of derivatives
- – Third party funding entities –Total assets in entities
- – Repackaging and investment entities – Fair value of notes in issue
For Third party funding entities, size information is not publicly available, therefore the Group has disclosed the greater of the collateral the Group has received/pledged or the notional of the exposure the Group has to the entity.
Based on the above definitions, the total size of structured entities is € 2,723 billion, of which the majority of € 1,138 billion is from Funds. In 2021, it was € 2,168 billion and € 1,251 billion respectively.
The following table shows, by type of structured entity, the carrying amounts of the Group’s interests recognized in the consolidated statement of financial position as well as the maximum exposure to loss resulting from these interests. The carrying amounts presented below do not reflect the true variability of returns faced by the Group because they do not take into account the effects of collateral or hedges.
365 |
Deutsche Bank | ||
Annual Report 2022 | ||
Carrying amounts and size relating to Deutsche Bank’s interests
Dec 31, 2022 | ||||||||||
in € m. | Repacka- | Third Party | Securiti- | Funds | Total | |||||
Assets | ||||||||||
Cash and central bank balances | 0 | 0 | 0 | 0 | 0 | |||||
Interbank balances (w/o central banks) | 1 | 0 | 319 | 7 | 327 | |||||
Central bank funds sold and securities | 0 | 0 | 87 | 2,404 | 2,491 | |||||
Securities Borrowed | 0 | 0 | 0 | 0 | 0 | |||||
Total financial assets at fair value | 195 | 8,675 | 4,956 | 46,695 | 60,520 | |||||
Trading assets | 145 | 2,910 | 3,159 | 3,660 | 9,874 | |||||
Positive market values | 34 | 4,224 | 863 | 5,458 | 10,580 | |||||
Non-trading financial assets mandatory at fair value through profit or loss | 16 | 1,541 | 933 | 37,577 | 40,067 | |||||
Financial assets designated at fair | 0 | 0 | 0 | 0 | 0 | |||||
Financial assets at fair value through other comprehensive income | 0 | 830 | 298 | 404 | 1,532 | |||||
Loans at amortized cost | 212 | 68,398 | 31,077 | 18,896 | 118,583 | |||||
Other assets | 0 | 956 | 3,293 | 10,405 | 14,654 | |||||
Total assets | 408 | 78,859 | 40,030 | 78,810 | 198,107 | |||||
Liabilities | ||||||||||
Total financial liabilities at fair value | 51 | 1,251 | 438 | 5,021 | 6,761 | |||||
Negative market values | 51 | 1,251 | 438 | 5,021 | 6,761 | |||||
Other short-term borrowings | 0 | 0 | 0 | 0 | 0 | |||||
Other liabilities | 0 | 0 | 0 | 0 | 0 | |||||
Total liabilities | 51 | 1,251 | 438 | 5,021 | 6,761 | |||||
Off-balance sheet exposure | 0 | 10,644 | 11,045 | 6,747 | 28,437 | |||||
Total | 357 | 88,252 | 50,637 | 80,536 | 219,782 | |||||
366 |
Deutsche Bank | ||
Annual Report 2022 | ||
Dec 31, 2021 | ||||||||||
in € m. | Repacka- | Third Party | Securiti- | Funds | Total | |||||
Assets | ||||||||||
Cash and central bank balances | 0 | 0 | 0 | 0 | 0 | |||||
Interbank balances (w/o central banks) | 1 | 0 | 0 | 11 | 12 | |||||
Central bank funds sold and securities | 0 | 0 | 82 | 1,593 | 1,675 | |||||
Securities Borrowed | 0 | 0 | 0 | 0 | 0 | |||||
Total financial assets at fair value | 328 | 7,860 | 4,923 | 44,192 | 57,303 | |||||
Trading assets | 172 | 4,825 | 3,243 | 3,980 | 12,220 | |||||
Positive market values | 156 | 300 | 9 | 2,671 | 3,135 | |||||
Non-trading financial assets mandatory at fair value through profit or loss | 0 | 2,735 | 1,671 | 37,542 | 41,948 | |||||
Financial assets designated at fair | 0 | 0 | 0 | 0 | 0 | |||||
Financial assets at fair value through other comprehensive income | 0 | 298 | 1,043 | 530 | 1,871 | |||||
Loans at amortized cost | 1,089 | 60,338 | 26,406 | 15,245 | 103,079 | |||||
Other assets | 4 | 575 | 3,333 | 12,202 | 16,114 | |||||
Total assets | 1,422 | 69,072 | 35,787 | 73,773 | 180,054 | |||||
Liabilities | ||||||||||
Total financial liabilities at fair value | 74 | 185 | 20 | 8,721 | 9,000 | |||||
Negative market values | 74 | 185 | 20 | 8,721 | 9,000 | |||||
Other short-term borrowings | 0 | 0 | 0 | 0 | 0 | |||||
Other liabilities | 0 | 0 | 0 | 13 | 13 | |||||
Total liabilities | 74 | 185 | 20 | 8,734 | 9,013 | |||||
Off-balance sheet exposure | 0 | 7,765 | 10,093 | 3,683 | 21,541 | |||||
Total | 1,348 | 76,652 | 45,861 | 68,722 | 192,582 | |||||
Trading assets –Total trading assets as of December 31, 2022 and December 31, 2021 of € 9.9 billion and € 12.2 billion are comprised primarily of € 3.2 billion and € 3.2 billion in Securitizations and € 3.7 billion and € 4.0 billion in Funds structured entities respectively. The Group’s interests in securitizations are collateralized by the assets contained in these entities. Where the Group holds fund units these are typically in regards to market making in funds or otherwise serve as hedges for notes issued to clients. Moreover the credit risk arising from loans made to Third party funding structured entities is mitigated by the collateral received.
Non-trading financial assets mandatory at fair value through profit or loss – Reverse repurchase agreements to Funds comprise the majority of the interests in this category and are collateralized by the underlying securities.
Loans – Loans as of December 31, 2022 and December 31, 2021 consist of € 118.6 billion and € 103.1 billion investment in securitization tranches and financing to Third party funding entities. The Group’s financing to Third party funding entities is collateralized by the assets in those structured entities.
Other assets – Other assets as of December 31, 2022 and December 31, 2021 of € 14.7 billion and € 16.1 billion, respectively, consist primarily of cash margin balances.
Pending Receivables – Pending Receivable balances are not included in this disclosure note due to the fact that these balances arise from typical customer supplier relationships out of e.g. brokerage type activities and their inherent volatility would not provide users of the financial statements with effective information about Deutsche Bank’s exposures to structured entities.
Financial support
Deutsche Bank did not provide non-contractual support during the year to unconsolidated structured entities.
367 |
Deutsche Bank | ||
Annual Report 2022 | ||
Sponsored unconsolidated structured entities where the Group has no interest as of December 31, 2022 and December 31, 2021.
As a sponsor, the Group is involved in the legal set up and marketing of the entity and supports the entity in different ways, namely:
- – Transferring assets to the entities
- – Providing seed capital to the entities
- – Providing operational support to ensure the entity’s continued operation
- – Providing guarantees of performance to the structured entities.
The Group is also deemed a sponsor for a structured entity if market participants would reasonably associate the entity with the Group. Additionally, the use of the Deutsche Bank name for the structured entity indicates that the Group has acted as a sponsor.
The gross revenues from sponsored entities where the Group did not hold an interest as of December 31, 2022 and December 31, 2021 were € 226 million and € 254 million respectively. Instances where the Group does not hold an interest in an unconsolidated sponsored structured entity include cases where any seed capital or funding to the structured entity has already been repaid in full to the Group during the year. This amount does not take into account the impacts of hedges and is recognized in Net gains/losses on financial assets/liabilities at fair value through profit and loss. The aggregated carrying amounts of assets transferred to sponsored unconsolidated structured entities in 2022 were € 3.4 billion for securitization and € 1.2 billion for repackaging and investment entities. In 2021, they were € 3.2 billion for securitization and € 1.4 billion for repackaging and investment entities.
368 |
Deutsche Bank | ||
Annual Report 2022 | ||
39 – Current and non-current assets and liabilities
Asset and liability line items by amounts recovered or settled within or after one year
Asset items as of December 31, 2022
| Amounts recovered or settled | Total | ||||
in € m. | within one year | after one year | Dec 31, 2022 | |||
Cash and central bank balances | 178,896 | 0 | 178,896 | |||
Interbank balances (w/o central banks) | 7,189 | 6 | 7,195 | |||
Central bank funds sold and securities purchased under resale agreements | 8,415 | 3,063 | 11,478 | |||
Securities borrowed | 0 | 0 | 0 | |||
Financial assets at fair value through profit or loss | 475,945 | 6,431 | 482,376 | |||
Financial assets at fair value through other comprehensive income | 7,296 | 24,380 | 31,675 | |||
Equity method investments | 0 | 1,124 | 1,124 | |||
Loans at amortized cost | 119,109 | 364,591 | 483,700 | |||
Property and equipment | 0 | 6,103 | 6,103 | |||
Goodwill and other intangible assets | 0 | 7,092 | 7,092 | |||
Other assets | 93,565 | 24,729 | 118,293 | |||
Assets for current tax | 873 | 711 | 1,584 | |||
Total assets before deferred tax assets | 891,287 | 438,229 | 1,329,516 | |||
Deferred tax assets | 7,272 | |||||
Total assets | 1,336,788 | |||||
Liability items as of December 31, 2022
| Amounts recovered or settled | Total | ||||
in € m. | within one year | after one year | Dec 31, 2022 | |||
Deposits | 596,500 | 24,956 | 621,456 | |||
Central bank funds purchased and securities sold under repurchase agreements | 517 | 56 | 573 | |||
Securities loaned | 13 | 0 | 13 | |||
Financial liabilities at fair value through profit or loss | 383,954 | 4,118 | 388,072 | |||
Other short-term borrowings | 5,122 | 0 | 5,122 | |||
Other liabilities | 107,345 | 6,369 | 113,714 | |||
Provisions | 2,449 | 0 | 2,449 | |||
Liabilities for current tax | 240 | 148 | 388 | |||
Long-term debt | 46,622 | 84,903 | 131,525 | |||
Trust preferred securities | 500 | 0 | 500 | |||
Total liabilities before deferred tax liabilities | 1,143,261 | 120,550 | 1,263,811 | |||
Deferred tax liabilities | 650 | |||||
Total liabilities | 1,264,461 | |||||
Asset items as of December 31, 2021
| Amounts recovered or settled | Total | ||||
in € m. | within one year | after one year | Dec 31, 2021 | |||
Cash and central bank balances | 192,012 | 9 | 192,021 | |||
Interbank balances (w/o central banks) | 7,318 | 24 | 7,342 | |||
Central bank funds sold and securities purchased under resale agreements | 5,904 | 2,465 | 8,368 | |||
Securities borrowed | 63 | 0 | 63 | |||
Financial assets at fair value through profit or loss | 483,183 | 8,050 | 491,233 | |||
Financial assets at fair value through other comprehensive income | 6,995 | 21,984 | 28,979 | |||
Equity method investments | 0 | 1,091 | 1,091 | |||
Loans at amortized cost | 132,516 | 338,803 | 471,319 | |||
Property and equipment | 0 | 5,536 | 5,536 | |||
Goodwill and other intangible assets | 0 | 6,824 | 6,824 | |||
Other assets | 87,654 | 16,131 | 103,785 | |||
Assets for current tax | 717 | 497 | 1,214 | |||
Total assets before deferred tax assets | 916,360 | 401,415 | 1,317,775 | |||
Deferred tax assets | 6,218 | |||||
Total assets | 1,323,993 | |||||
369 |
Deutsche Bank | ||
Annual Report 2022 | ||
Liability items as of December 31, 2021
Amounts recovered or settled | Total | |||||
in € m. | within one year | after one year | Dec 31, 2021 | |||
Deposits | 582,278 | 21,472 | 603,750 | |||
Central bank funds purchased and securities sold under repurchase agreements | 297 | 450 | 747 | |||
Securities loaned | 24 | 0 | 24 | |||
Financial liabilities at fair value through profit or loss | 398,203 | 2,653 | 400,857 | |||
Other short-term borrowings | 4,034 | 0 | 4,034 | |||
Other liabilities1 | 92,314 | 5,482 | 97,796 | |||
Provisions | 2,641 | 0 | 2,641 | |||
Liabilities for current tax | 411 | 189 | 600 | |||
Long-term debt | 49,434 | 95,051 | 144,485 | |||
Trust preferred securities | 528 | 0 | 528 | |||
Total liabilities before deferred tax liabilities1 | 1,130,164 | 125,298 | 1,255,462 | |||
Deferred tax liabilities | 501 | |||||
Total liabilities | 1,255,962 | |||||
1 Prior year’s comparatives aligned to presentation in the current year.
40 – Events after the reporting period
Having fulfilled its de-risking and cost reduction mandate from 2019 through end-2022, the Capital Release Unit will cease to be reported as a separate segment with effect from the first quarter of 2023. Its remaining portfolio, resources and employees will be reported within the Corporate & Other segment. In line with that change, the Core Bank, which represents the Group excluding the Capital Release Unit, will cease to be reported as well, and from the first quarter of 2023 the Group will consist of the segments Corporate Bank, Investment Bank, Private Bank, Asset Management and Corporate & Other.
The Group will implement additional Driver-Based Cost Management allocations from the first quarter of 2023. The new methodology aims to provide greater transparency over the drivers of infrastructure costs and links costs more closely to service consumption. While the Group’s cost/income ratio and return on tangible equity metrics will be unaffected by the change in internal allocations, the respective divisional metrics will change going forward.
370 |
Deutsche Bank | ||
Annual Report 2022 | ||
41 – Regulatory capital information
General definitions
The calculation of Deutsche Bank’s own funds incorporates the capital requirements following the “Regulation (EU) No 575/2013 on prudential requirements for credit institutions” CRR and the “Directive 2013/36/EU on access to the activity of credit institutions and the prudential supervision of credit institutions” “CRD”, which have been further amended with subsequent Regulations and Directives. The CRD has been implemented into German law. The information in this section as well as in the section “Development of risk-weighted assets” is based on the regulatory principles of consolidation.
This section refers to the capital adequacy of the group of entities consolidated for banking regulatory purposes pursuant to the CRR and the German Banking Act (“Kreditwesengesetz” or “KWG”). Therein not included are insurance companies or companies outside the finance sector.
The total own funds pursuant to the effective regulations as of year-end 2022 comprises Tier 1 and Tier 2 capital. Tier 1 capital is subdivided into Common Equity Tier 1 capital and Additional Tier 1 capital.
CET 1 capital consists primarily of common share capital (reduced by own holdings) including related share premium accounts, retained earnings (including losses for the financial year, if any) and accumulated other comprehensive income, subject to regulatory adjustments (i.e., prudential filters and deductions), as well as minority interests qualifying for inclusion in consolidated CET 1 capital. Prudential filters for CET 1 capital, according to Articles 32 to 35 CRR, include (i) securitization gains on sale, (ii) cash flow hedges and changes in the value of own liabilities, and (iii) additional value adjustments. CET 1 capital deductions for instance includes (i) intangible assets (exceeding their prudential value), (ii) deferred tax assets that rely on future profitability, (iii) negative amounts resulting from the calculation of expected loss amounts, (iv) net defined benefit pension fund assets, (v) reciprocal cross holdings in the capital of financial sector entities and, (vi) significant and non-significant investments in the capital (CET 1, AT1, Tier 2) of financial sector entities above certain thresholds. All items not deducted (i.e., amounts below the threshold) are subject to risk-weighting.
Additional Tier 1 capital consists of AT1 capital instruments and related share premium accounts as well as noncontrolling interests qualifying for inclusion in consolidated AT1 capital. To qualify as AT1 capital under CRR/CRD, instruments must have principal loss absorption through a conversion to common shares or a write-down mechanism allocating losses at a trigger point and must also meet further requirements (perpetual with no incentive to redeem; institution must have full dividend/coupon discretion at all times, etc.).
Tier 2 capital comprises eligible capital instruments, the related share premium accounts and subordinated long-term debt, certain loan loss provisions and noncontrolling interests that qualify for inclusion in consolidated Tier 2 capital. To qualify as Tier 2 capital, capital instruments or subordinated debt must have an original maturity of at least five years. Moreover, eligible capital instruments may inter alia not contain an incentive to redeem, a right of investors to accelerate repayment, or a credit sensitive dividend feature.
In the comparison period of this report Deutsche Bank presents certain figures based on the CRR definition of own fund instruments applicable for Additional Tier 1 and Tier 2 instruments.
Starting with the first quarter of 2022, CET 1, Tier 1 Capital and Total Capital is presented as reported. The fully loaded definition has been discontinued in the first quarter 2022 due to immaterial differences.
Capital instruments
The Management Board received approval from the 2021 Annual General Meeting to buy back up to 206.7 million shares before the end of April 2026. Thereof 103.3 million shares can be purchased by using derivatives, this includes 41.3 million derivatives with a maturity exceeding 18 months. During the period from the 2021 Annual General Meeting until the 2022 Annual General Meeting (May 19, 2022), 59.8 million shares were purchased. A total amount of 33.3 million shares was purchased for equity compensation purposes in the same period or upcoming periods. The remaining amount of 26.5 million shares was bought back for cancellation with the purpose of distributing capital to shareholders. In addition, 48.8 million call options were purchased for equity compensation purposes in upcoming periods. The number of shares held in Treasury from buybacks amounted to 34.8 million as of the 2022 Annual General Meeting, thereof 26.5 million shares for cancellation and 8.3 million shares for equity compensation purposes.
371 |
Deutsche Bank | ||
Annual Report 2022 | ||
The 2022 Annual General Meeting granted the Management Board the approval to buy back up to 206.7 million shares before the end of April 2027. Thereof 103.3 million shares can be purchased by using derivatives, this includes 41.3 million derivatives with a maturity exceeding 18 months. These authorizations substitute the authorizations of the previous year. During the period from the 2022 Annual General Meeting until December 31, 2022, no shares or call options were purchased. The number of shares held in Treasury from buybacks amounted to 28.9 million as of December 31, 2022. Thereof 26.5 million relate to shares bought back for cancellation. The remaining amount of 2.4 million relates to shares to be used for equity compensation purposes in upcoming periods.
Since the 2017 Annual General Meeting, renewed at the 2021 Annual General Meeting, and as of December 31, 2022, authorized capital available to the Management Board is € 2,560 million (1,000 million shares). On 30 April 2022, the conditional capital against cash of € 512 million (200 million shares) and for equity compensation of € 51.2 million (20 million shares) expired unused.
Further, the 2022 Annual General Meeting authorized the issuance of participatory notes and other hybrid debt securities that fulfill the regulatory requirements to qualify as Additional Tier 1 capital with an equivalent value of € 9.0 billion on or before April 30, 2027.
Transitional agreements for AT1 and Tier 2 instruments were applicable until January 1, 2022. Capital instruments issued on or prior to December 31, 2011, that no longer qualify as AT1 or Tier 2 capital under the fully loaded CRR/CRD as currently applicable were subject to grandfathering rules during the transitional period and were phased out from 2013 to 2022 with their recognition capped at 20% in 2020 and 10% in 2021 (in relation to the portfolio eligible for grandfathering which was outstanding on December 31, 2012). The grandfathering no longer applies as of January 1, 2022.
The current CRR as applicable since June 27, 2019, provides further grandfathering rules for AT1 and Tier 2 instruments issued prior to June 27, 2019. AT1 and Tier 2 instruments issued through special purpose entities were grandfathered until December 31, 2021. In 2022, transitional arrangements only exist for AT1 and Tier 2 instruments which continue to qualify until June 26, 2025, even if they do not meet certain new requirements that apply since June 27, 2019. Deutsche Bank had an immaterial amount of instruments that qualified during 2022, which resulted in there being no material difference between the “fully loaded” and “transitional” amounts.
Based on the current CRR, the Group has eligible AT1 instruments of € 8.6 billion outstanding as of December 2022. In 2022, the bank issued AT1 notes amounting to € 2.0 billion and redeemed AT1 instruments with a notional of € 1.75 billion.
As of December 31, 2022, Tier 2 capital instruments amounted to € 9.5 billion (nominal value of € 11.7 billion). In 2022, the bank issued Tier 2 capital instruments with a nominal value of € 1.5 billion and U.S. $ 1.25 billion (equivalent amount of € 1.2 billion) and a notional of € 15 million Tier 2 capital instruments matured.
Minimum capital requirements and additional capital buffers
Failure to meet minimum capital requirements can result in supervisory measures such as restrictions of profit distributions or limitations on certain businesses such as lending. Deutsche Bank complied with the minimum regulatory capital adequacy requirements in 2022.
372 |
Deutsche Bank | ||
Annual Report 2022 | ||
Details on regulatory capital
Own Funds Template (incl. RWA and capital ratios)
Dec 31, 2022 ³ | Dec 31, 2021 | |||||
in € m. | CRR/CRD | CRR/CRD | CRR/CRD | |||
Common Equity Tier 1 (CET 1) capital: instruments and reserves | ||||||
Capital instruments, related share premium accounts and other reserves | 45,458 | 45,864 | 45,864 | |||
Retained earnings | 12,305 | 10,506 | 10,506 | |||
Accumulated other comprehensive income (loss), net of tax | (1,314) | (444) | (444) | |||
Independently reviewed interim profits net of any foreseeable charge or dividend1 | 4,183 | 1,379 | 1,379 | |||
Other | 1,002 | 910 | 910 | |||
Common Equity Tier 1 (CET 1) capital before regulatory adjustments | 61,634 | 58,215 | 58,215 | |||
Common Equity Tier 1 (CET 1) capital: regulatory adjustments | ||||||
Additional value adjustments (negative amount) | (2,026) | (1,812) | (1,812) | |||
Other prudential filters (other than additional value adjustments) | 600 | (14) | (14) | |||
Goodwill and other intangible assets (net of related tax liabilities) (negative amount) | (5,024) | (4,897) | (4,897) | |||
Deferred tax assets that rely on future profitability excluding those arising from | (3,244) | (1,466) | (1,466) | |||
Negative amounts resulting from the calculation of expected loss amounts | (466) | (573) | (573) | |||
Defined benefit pension fund assets (net of related tax liabilities) (negative amount) | (1,149) | (991) | (991) | |||
Direct, indirect and synthetic holdings by an institution of own CET 1 instruments (negative amount) | (0) | 0 | 0 | |||
Direct, indirect and synthetic holdings by the institution of the CET 1 instruments of financial sector entities where the institution has a significant investment in those entities (amount above the 10% / 15% thresholds and net of eligible short positions) (negative amount) | 0 | 0 | 0 | |||
Deferred tax assets arising from temporary differences (net of related tax liabilities where the conditions in Art. 38 (3) CRR are met) (amount above the 10% / 15% thresholds) (negative amount) | 0 | (151) | (151) | |||
Other regulatory adjustments2 | (2,225) | (1,805) | (1,805) | |||
Total regulatory adjustments to Common Equity Tier 1 (CET 1) capital | (13,536) | (11,709) | (11,709) | |||
Common Equity Tier 1 (CET 1) capital | 48,097 | 46,506 | 46,506 | |||
Additional Tier 1 (AT1) capital: instruments | ||||||
Capital instruments and the related share premium accounts | 8,578 | 8,328 | 8,328 | |||
Amount of qualifying items referred to in Art. 484 (4) CRR and the related share | 0 | N/M | 600 | |||
Additional Tier 1 (AT1) capital before regulatory adjustments | 8,578 | 8,328 | 8,928 | |||
Additional Tier 1 (AT1) capital: regulatory adjustments | ||||||
Direct, indirect and synthetic holdings by an institution of own AT1 instruments | (60) | (60) | (60) | |||
Residual amounts deducted from AT1 capital with regard to deduction from CET 1 capital during the transitional period pursuant to Art. 472 CRR | ||||||
Other regulatory adjustments | 0 | 0 | 0 | |||
Total regulatory adjustments to Additional Tier 1 (AT1) capital | (60) | (60) | (60) | |||
Additional Tier 1 (AT1) capital | 8,518 | 8,268 | 8,868 | |||
Tier 1 capital (T1 = CET 1 + AT1) | 56,616 | 54,775 | 55,375 | |||
Tier 2 (T2) capital | 9,531 | 7,328 | 7,358 | |||
Total capital (TC = T1 + T2) | 66,146 | 62,102 | 62,732 | |||
Total risk-weighted assets | 360,003 | 351,629 | 351,629 | |||
| ||||||
Common Equity Tier 1 capital ratio (as a percentage of risk-weighted assets) | 13.4 | 13.2 | 13.2 | |||
Tier 1 capital ratio (as a percentage of risk-weighted assets) | 15.7 | 15.6 | 15.7 | |||
Total capital ratio (as a percentage of risk-weighted assets) | 18.4 | 17.7 | 17.8 | |||
N/M – Not meaningful
1Full year profit is recognized as per ECB Decision (EU) 2015/656 in accordance with the Article 26(2) of Regulation (EU) No 575/2013 (ECB/2015/4)
2 Includes capital deductions of € 1.2 billion (Dec 2021: € 1.1 billion) based on ECB guidance on irrevocable payment commitments related to the Single Resolution Fund and the Deposit Guarantee Scheme, € 1.0 billion (Dec 2021: € 0.7 billion) based on ECB's supervisory recommendation for a prudential provisioning of non-performing exposures, € 7.4 million (Dec 2021: € 17 million) resulting from minimum value commitments as per Article 36 (1)(n) of the CRR and CET 1 decrease of € 14.7 million (Dec 2021: € 39 million) from IFRS 9 transitional provision as per Article 473a of the CRR
3 Starting with the first quarter of 2022, information is presented as reported as the fully loaded definition has been eliminated as resulting only in an immaterial difference; comparative information for earlier periods is unchanged and based on Deutsche Bank’s earlier fully loaded definition
4 Numbers may not add up due to rounding
373 |
Deutsche Bank | ||
Annual Report 2022 | ||
Reconciliation of shareholders’ equity to Own Funds
CRR/CRD | ||||
in € m. | Dec 31, 2022 | Dec 31, 2021 | ||
Total shareholders’ equity per accounting balance sheet | 61,959 | 58,027 | ||
Deconsolidation/Consolidation of entities | 29 | 265 | ||
Of which: | ||||
Additional paid-in capital | 0 | 0 | ||
Retained earnings | 29 | 265 | ||
Accumulated other comprehensive income (loss), net of tax | 0 | 0 | ||
Total shareholders' equity per regulatory balance sheet | 61,988 | 58,292 | ||
Minority Interests (amount allowed in consolidated CET 1) | 1,002 | 910 | ||
AT1 coupon and shareholder dividend deduction1 | (1,342) | (987) | ||
Capital instruments not eligible under CET 1 as per CRR 28(1) | (14) | 0 | ||
Common Equity Tier 1 (CET 1) capital before regulatory adjustments | 61,634 | 58,215 | ||
Additional value adjustments | (2,026) | (1,812) | ||
Other prudential filters (other than additional value adjustments) | 600 | (14) | ||
Goodwill and other intangible assets (net of related tax liabilities) (negative amount) | (5,024) | (4,897) | ||
Deferred tax assets that rely on future profitability | (3,244) | (1,617) | ||
Defined benefit pension fund assets (net of related tax liabilities) (negative amount) | (1,149) | (991) | ||
Direct, indirect and synthetic holdings by the institution of the CET 1 instruments of financial sector entities | 0 | 0 | ||
Other regulatory adjustments2 | (2,691) | (2,378) | ||
Common Equity Tier 1 capital³ | 48,097 | 46,506 | ||
1Full year profit is recognized as per ECB Decision (EU) 2015/656 in accordance with the Article 26(2) of Regulation (EU) No 575/2013 (ECB/2015/4)
2Includes capital deductions of € 1.2 billion (Dec 2021: € 1.1 billion) based on ECB guidance on irrevocable payment commitments related to the Single Resolution Fund and the Deposit Guarantee Scheme, € 1.0 billion (Dec 2021: € 0.7 billion) based on ECB's supervisory recommendation for a prudential provisioning of non-performing exposures, € 7.4 million (Dec 2021: € 17 million) resulting from minimum value commitments as per Article 36 (1)(n) of the CRR and CET 1 decrease of € 14.7 million (Dec 2021: € 39 million) from IFRS 9 transitional provision as per Article 473a of the CRR
3Numbers may not add up due to rounding
Capital management
Deutsche Bank’s Treasury function manages solvency, capital adequacy, leverage, and bail-in capacity ratios at Group level and locally in each region, as applicable. Treasury implements Deutsche Bank’s capital strategy, which itself is developed by the Group Risk Committee and approved by the Management Board. Treasury, directly or through the Group Asset and Liability Committee, manages, among other things, issuance and repurchase of shares and capital instruments, hedging of capital ratios against foreign exchange swings, setting capacities for key financial resources, the design of shareholders’ equity allocation, and regional capital planning. The bank is fully committed to maintaining Deutsche Bank’s sound capitalization both from an economic and regulatory perspective considering both book equity based on IFRS accounting standards, regulatory and economic capital as well as specific capital requirements from rating agencies. The bank continuously monitors and adjusts Deutsche Bank’s overall capital demand and supply to always achieve an appropriate balance.
Treasury manages the issuance and repurchase of capital instruments, namely Common Equity Tier 1, Additional Tier 1 and Tier 2 capital instruments as well as TLAC/MREL eligible debt instruments. Treasury constantly monitors the market for liability management trades. Such trades represent a countercyclical opportunity to create Common Equity Tier 1 capital by buying back Deutsche Bank’s issuances below par.
Treasury manages the sensitivity of Deutsche Bank’s CET 1 ratio and capital towards swings in foreign currency exchange rates against the euro. For this purpose, Treasury develops and executes suitable hedging strategies within the constraints of a Management Board approved Risk Appetite. Capital invested into Deutsche Bank’s foreign subsidiaries and branches is either not hedged, partially hedged or fully hedged. Thereby, Treasury aims to balance effects from foreign exchange rate movements on capital, capital deduction items and risk weighted assets in foreign currency. In addition, Treasury also accounts for associated hedge cost and implications on market risk weighted assets.
374 |
Deutsche Bank | ||
Annual Report 2022 | ||
Resource limit setting
Usage of key financial resources is influenced through the following governance processes and incentives.
Target resource capacities are reviewed in Deutsche Bank’s annual strategic plan in line with Deutsche Bank’s CET 1 and Leverage Ratio ambitions. As a part of Deutsche Bank’s quarterly process, the Group Asset and Liability Committee approves divisional resource limits for total capital demand (defined as the sum of RWA and certain RWA equivalents of Capital Deduction Items) and leverage exposure that are based on the strategic plan but adjusted for market conditions and the short-term outlook. Limits are enforced through a close monitoring process and an excess charging mechanism.
Overall regulatory capital requirements are principally driven by either Deutsche Bank’s CET 1 ratio (solvency) or leverage ratio (leverage) requirements, whichever is the more binding constraint. For the internal capital allocation, the combined contribution of each segment to the Group’s Common Equity Tier 1 ratio, the Group’s Leverage ratio and the Group’s Capital Loss under Stress are weighted to reflect their relative importance and level of constraint to the Group. Contributions to the Common Equity Tier 1 ratio and the Leverage ratio are measured through RWA and Leverage Ratio Exposure (LRE). The Group’s Capital Loss under Stress is a measure of the Group’s overall economic risk exposure under a defined stress scenario. Goodwill, other intangible assets, and business-related regulatory capital deduction items included in total capital demand are directly allocated to the respective segments, supporting the calculation of the allocated tangible shareholders equity and the respective rate of return.
Most of Deutsche Bank’s subsidiaries and several of Deutsche Bank’s branches are subject to legal and regulatory capital requirements. In developing, implementing, and testing Deutsche Bank’s capital and liquidity position, the bank fully takes such legal and regulatory requirements into account. Any material capital requests of Deutsche Bank’s branches and subsidiaries across the globe are presented to and approved by the Group Investment Committee prior to execution.
Further, Treasury is a member of Deutsche Bank’s Pensions Committee and represented in relevant Investment Committees overseeing the management of the assets of the largest Deutsche Bank pension funds in Germany. These investment committees set the investment strategy for these funds in line with the bank’s investment objective to protect the capital base and distribution capacity of the bank.
375 |
Deutsche Bank | ||
Annual Report 2022 | ||
42 – Supplementary information to the consolidated financial statements according to Sections 297 (1a) / 315a HGB and the return on assets according to article 26a of the German Banking Act
Staff costs
in € m. | 2022 | 2021 | ||
Staff costs: | ||||
Wages and salaries | 8,871 | 8,551 | ||
Social security costs | 1,841 | 1,867 | ||
thereof: those relating to pensions | 1,024 | 1,038 | ||
Total | 10,712 | 10,418 | ||
Staff
The average number of effective staff employed in 2022 was 85,143 (2021: 84,298) of whom 37,815 (2021: 37,359) were women. Part-time staff is included in these figures proportionately. An average of 49,372 (2021: 47,460) staff members worked outside Germany.
Management Board and Supervisory Board remuneration
In accordance with the requirements of the GAS 17, the members of the Management Board collectively received in the 2022 financial year compensation totaling € 52,870,209 (2021: € 49,984,668). Of that, € 26,981,982 (2021: € 26,467,225) was for fixed compensation, € 1,300,000 (2021: € 1,300,000) for fixed allowances, € 1,119,403 (2021: € 1,115,438) for fringe benefits and € 23,468,824 (2021: € 21,102,005) for performance-related components.
Former members of the Management Board of Deutsche Bank AG or their surviving dependents received € 22,974,014 and € 38,737,800 for the years ended December 31, 2022 and 2021, respectively.
Provisions for pension obligations to former members of the Management Board and their surviving dependents amounted to € 158,228,043 and € 184,815,849 at December 31, 2022 and 2021, respectively.
The compensation principles for Supervisory Board members are set forth in our Articles of Association. The compensation provisions, which were newly conceived in 2013, were last amended by resolution of the Annual General Meeting on May 19 2022 and became effective on July 20, 2022. The members of the Supervisory Board receive fixed annual compensation. The annual base compensation amounts to € 100,000 for each Supervisory Board member. The Supervisory Board Chairman receives twice that amount and the Deputy Chairperson one and a half times that amount. Members and chairs of the committees of the Supervisory Board are paid additional fixed annual compensation. 75% of the compensation determined is disbursed to each Supervisory Board member after submitting invoices within the first three months of the following year. The other 25% is converted by the company at the same time into company shares (notional shares) according to the provisions of the Articles of Association. The share value of this number of shares is paid to the respective Supervisory Board member in February of the year following his departure from the Supervisory Board or the expiration of his term of office according to the provisions of the Articles of Association, provided that the member does not leave the Supervisory Board due to important cause which would have justified dismissal. In case of a change in Supervisory Board membership during the year, compensation for the financial year will be paid on a pro rata basis, rounded up/down to full months. For the year of departure, the entire compensation is paid in cash; a forfeiture regulation applies to 25% of the compensation for that financial year. The members of the Supervisory Board received for the financial year 2022 a total remuneration of € 6,833,333 (2021: € 6,520,833), of which € 5,260,417 will be paid out in spring 2023 (2022: € 4,965,625) according to the provisions of the Articles of Association.
Loans and advances granted and contingent liabilities assumed for members of the Management Board amounted to € 4,514,404 and € 6,476,340 and for members of the Supervisory Board amounted to € 939,889 and € 1,559,179 for the years ended December 31, 2022 and 2021, respectively. Members of the Supervisory Board repaid € 93,153 loans in 2022.
376 |
Deutsche Bank | ||
Annual Report 2022 | ||
Return on assets
Article 26a of the German Banking Act defines the return on assets as net profit divided by average total assets. According to this definition the return on assets was 0.39% and 0.18% for the years ended December 31, 2022 and 2021, respectively.
Information on the parent company
Deutsche Bank Aktiengesellschaft is the parent company of Deutsche Bank Group. It is incorporated in Frankfurt am Main and is registered in the Commercial Register of the District Court Frankfurt am Main under registration number HRB 30000.
Corporate Governance
Deutsche Bank AG has approved the Declaration of Conformity in accordance with section 161 of the German
Corporation Act (AktG). The declaration is published on Deutsche Bank’s website (www.db.com/ir/en/reports.htm).
Principal accountant fees and services
Breakdown of fees charged by Ernst & Young GmbH Wirtschaftsprüfungsgesellschaft („EY GmbH“) and other EY member firms
Fee category in € m. | 2022 | 2021 | ||
Audit fees | 59 | 54 | ||
thereof to EY GmbH | 46 | 42 | ||
Audit-related fees | 8 | 8 | ||
thereof to EY GmbH | 6 | 6 | ||
Tax-related fees | 0 | 1 | ||
thereof to EY GmbH | 0 | 0 | ||
All other fees | 1 | 1 | ||
thereof to EY GmbH | 0 | 0 | ||
Total fees | 68 | 64 | ||
The Audit fees include fees for professional services for the audit of Deutsche Bank AG’s annual financial statements and consolidated financial statements and do not include audit fees for DWS and its subsidiaries that are not audited by EY. The Audit-related fees include fees for other assurance services required by law or regulations, in particular for financial service specific attestation, for quarterly reviews, for spin-off audits and for merger audits, as well as fees for voluntary assurance services, like voluntary audits for internal management purposes and the issuance of comfort letters. Tax-related fees include fees for services relating to the preparation and review of tax returns and related compliance assistance and advice, tax consultation and advice relating to Group tax planning strategies and initiatives and assistance with assessing compliance with tax regulations.
377 |
Deutsche Bank | ||
Annual Report 2022 | ||
43 – Country by country reporting
§ 26a KWG requires annual disclosure of certain information by country. The disclosed information is derived from the IFRS Group accounts of Deutsche Bank. It is however not reconcilable to other financial information in this report because of specific requirements published by Bundesbank on December 16, 2014 which include the requirement to present the country information prior to elimination of cross-border intra group transactions. In line with these Bundesbank requirements, intra group transactions within the same country are eliminated. These eliminations are identical to the eliminations applied for internal management reporting on countries.
The geographical location of subsidiaries and branches considers the country of incorporation or residence as well as the relevant tax jurisdiction. For the names, nature of activity and geographical location of subsidiaries and branches, please refer to Note 44 “Shareholdings”. In addition, Deutsche Bank AG and its subsidiaries have German and foreign branches, for example in London, New York and Singapore. The net revenues are composed of net interest revenues and noninterest revenues.
Dec 31, 2022 | ||||||||
in € m. | Net revenues | Employees | Profit (loss) before income tax | Income tax | ||||
Australia | 262 | 273 | 93 | (29) | ||||
Austria | 14 | 73 | (3) | (0) | ||||
Belgium | 170 | 464 | 15 | (4) | ||||
Brazil | 103 | 156 | 63 | (26) | ||||
Canada | 16 | 12 | 9 | (1) | ||||
Cayman Islands | (5) | 0 | (5) | 0 | ||||
China | 224 | 613 | 95 | (24) | ||||
Columbia | 0 | 0 | 1 | 0 | ||||
Czech Republic | 34 | 40 | 23 | (4) | ||||
France | 93 | 207 | 10 | (0) | ||||
Germany | 10,208 | 35,594 | 1,869 | (450) | ||||
Great Britain | 4,738 | 7,228 | 1,376 | (239) | ||||
Greece | 1 | 12 | 2 | (0) | ||||
Hong Kong | 600 | 848 | 54 | (10) | ||||
Hungary | 30 | 55 | 9 | (2) | ||||
India | 729 | 16,998 | 423 | (186) | ||||
Indonesia | 81 | 214 | 33 | (9) | ||||
Ireland | 24 | 153 | 10 | (3) | ||||
Israel | 5 | 12 | 2 | (1) | ||||
Italy | 1,643 | 3,150 | 700 | (161) | ||||
Japan | 302 | 375 | 115 | (22) | ||||
Jersey | 3 | 0 | 3 | (0) | ||||
Luxembourg | 798 | 471 | 283 | (62) | ||||
Malaysia | 92 | 187 | 59 | (18) | ||||
Mauritius | (16) | 0 | (16) | (0) | ||||
Mexico | 8 | 31 | (7) | 0 | ||||
Netherlands | 250 | 494 | (13) | 3 | ||||
Pakistan | 17 | 88 | 10 | (5) | ||||
Peru | 2 | 0 | 0 | 0 | ||||
Philippines | 24 | 1,356 | (3) | 1 | ||||
Poland | 135 | 357 | (103) | (14) | ||||
Portugal | 11 | 40 | (1) | 0 | ||||
Qatar | (0) | 2 | (0) | (0) | ||||
Romania | 1 | 1,317 | 9 | (1) | ||||
Russian Fed. | 129 | 871 | 107 | (21) | ||||
Saudi Arabia | 17 | 45 | (30) | 0 | ||||
Singapore | 686 | 1,818 | (74) | (3) | ||||
South Africa | 21 | 43 | 7 | (0) | ||||
South Korea | 116 | 187 | 41 | (11) | ||||
Spain | 622 | 2,286 | 152 | (48) | ||||
Sri Lanka | 18 | 58 | 2 | (1) | ||||
Sweden | 5 | 26 | 3 | (1) | ||||
Switzerland | 310 | 599 | 46 | (9) | ||||
Taiwan | 31 | 124 | (0) | (0) | ||||
Thailand | 36 | 110 | 1 | (0) | ||||
Turkey | 79 | 117 | 59 | (15) | ||||
UAE | 27 | 197 | 16 | (1) | ||||
Ukraine | 11 | 33 | 7 | (1) | ||||
USA | 5,539 | 7,522 | 1,188 | 1,340 | ||||
Vietnam | 34 | 75 | 21 | (4) | ||||
1 Full-time equivalents as of December 31, 2022
378 |
Deutsche Bank | ||
Annual Report 2022 | ||
44 – Shareholdings
Subsidiaries | |||||||||||
Consolidated Structured Entities | |||||||||||
Companies accounted for at equity | |||||||||||
Other Companies, where the holding exceeds 20% | |||||||||||
Holdings in large corporations, where the holding exceeds 5% of the voting rights | |||||||||||
The following pages show the Shareholdings of Deutsche Bank Group pursuant to Section 313 (2) of the German Commercial Code (“HGB”). | |||||||||||
Footnotes: | |||||||||||
1 | Controlled. | ||||||||||
2 | Status as shareholder with unlimited liability pursuant to Section 313 (2) Number 6 HGB. | ||||||||||
3 | General Partnership. | ||||||||||
4 | Only specified assets and related liabilities (silos) of this entity were consolidated. | ||||||||||
5 | Joint venture. | ||||||||||
6 | Accounted for at equity due to significant influence. | ||||||||||
7 | Not controlled. | ||||||||||
8 | Classified as Structured Entity not to be accounted for at equity under IFRS. | ||||||||||
9 | Classified as Structured Entity not to be consolidated under IFRS. | ||||||||||
10 | Preliminary Own funds of € 7,326.4m / Result of € (40.4)m (Business Year 2022). | ||||||||||
12 | Not consolidated or accounted for at equity as classified as non-trading financial assets mandatory at fair value through profit or loss. | ||||||||||
11 | Preliminary Own funds of € 7,230.4m / Result of € (263.8)m (Business Year 2022). | ||||||||||
13 | Own funds of € 18.4m / Result of € 2.8m (Business Year 2021). | ||||||||||
379 |
Deutsche Bank | ||
Annual Report 2022 | ||
Subsidiaries
Serial | Name of company | Domicile of | Foot- | Nature of activity | Share of | |||||
1 | Deutsche Bank Aktiengesellschaft | Frankfurt am Main | Credit Institution | |||||||
2 | ABFS I Incorporated | Lutherville-Timonium | Financial Institution | 100.0 | ||||||
3 | Alex. Brown Financial Services Incorporated | Lutherville-Timonium | Financial Institution | 100.0 | ||||||
4 | Alex. Brown Investments Incorporated | Lutherville-Timonium | Financial Institution | 100.0 | ||||||
5 | Alfred Herrhausen Gesellschaft mbH | Berlin | Other Enterprise | 100.0 | ||||||
6 | Argent Incorporated | Lutherville-Timonium | Financial Institution | 100.0 | ||||||
7 | Baldur Mortgages Limited | London | Financial Institution | 100.0 | ||||||
8 | Bayan Delinquent Loan Recovery 1 (SPV-AMC), Inc. | Makati City | Financial Institution | 100.0 | ||||||
9 | Betriebs-Center für Banken AG | Frankfurt | Ancillary Services Undertaking | 100.0 | ||||||
10 | Better Financial Services GmbH | Berlin | Ancillary Services Undertaking | 100.0 | ||||||
11 | Better Payment Germany GmbH | Berlin | Ancillary Services Undertaking | 100.0 | ||||||
12 | BHW - Gesellschaft für Wohnungswirtschaft mbH | Hameln | Financial Institution | 100.0 | ||||||
13 | BHW Bausparkasse Aktiengesellschaft | Hameln | Credit Institution | 100.0 | ||||||
14 | BHW Holding GmbH | Hameln | Financial Holding Company | 100.0 | ||||||
15 | Borfield Sociedad Anonima | Montevideo | Other Enterprise | 100.0 | ||||||
16 | Breaking Wave DB Limited | London | Ancillary Services Undertaking | 100.0 | ||||||
17 | BT Globenet Nominees Limited | London | Other Enterprise | 100.0 | ||||||
18 | Cardea Real Estate S.r.l. | Milan | Ancillary Services Undertaking | 100.0 | ||||||
19 | Caribbean Resort Holdings, Inc. | New York | 1 | Financial Institution | 0.0 | |||||
20 | Cathay Advisory (Beijing) Co., Ltd. | Beijing | Other Enterprise | 100.0 | ||||||
21 | Cathay Asset Management Company Limited | Ebène | Financial Institution | 100.0 | ||||||
22 | Cathay Capital Company (No 2) Limited | Ebène | Financial Institution | 67.6 | ||||||
23 | China Recovery Fund, LLC | Wilmington | Financial Institution | 85.0 | ||||||
24 | Cinda - DB NPL Securitization Trust 2003-1 | Wilmington | 1 | Financial Institution | 10.0 | |||||
25 | Consumo Srl in Liquidazione | Milan | Financial Institution | 100.0 | ||||||
26 | D B Investments (GB) Limited | London | Financial Holding Company | 100.0 | ||||||
27 | D&M Turnaround Partners Godo Kaisha | Tokyo | Financial Institution | 100.0 | ||||||
28 | DB (Barbados) SRL | Christ Church | Ancillary Services Undertaking | 100.0 | ||||||
29 | DB (Malaysia) Nominee (Asing) Sdn. Bhd. | Kuala Lumpur | Other Enterprise | 100.0 | ||||||
30 | DB (Malaysia) Nominee (Tempatan) Sendirian Berhad | Kuala Lumpur | Other Enterprise | 100.0 | ||||||
31 | DB Alex. Brown Holdings Incorporated | Wilmington | Financial Institution | 100.0 | ||||||
32 | DB Aotearoa Investments Limited | George Town | Ancillary Services Undertaking | 100.0 | ||||||
33 | DB Beteiligungs-Holding GmbH | Frankfurt | Financial Holding Company | 100.0 | ||||||
34 | DB Boracay LLC | Wilmington | Financial Institution | 100.0 | ||||||
35 | DB Capital Markets (Deutschland) GmbH | Frankfurt | Financial Holding Company | 100.0 | ||||||
36 | DB Cartera de Inmuebles 1, S.A.U. | Madrid | Ancillary Services Undertaking | 100.0 | ||||||
37 | DB Chestnut Holdings Limited | George Town | Ancillary Services Undertaking | 100.0 | ||||||
38 | DB Corporate Advisory (Malaysia) Sdn. Bhd. | Kuala Lumpur | Financial Institution | 100.0 | ||||||
39 | DB Delaware Holdings (Europe) Limited (in voluntary liquidation) | Camana Bay | Financial Institution | 100.0 | ||||||
40 | DB Direkt GmbH | Frankfurt | Ancillary Services Undertaking | 100.0 | ||||||
41 | DB Elara LLC | Wilmington | Financial Institution | 100.0 | ||||||
42 | DB Energy Trading LLC | Wilmington | Ancillary Services Undertaking | 100.0 | ||||||
43 | DB Equipment Leasing, Inc. | New York | Financial Institution | 100.0 | ||||||
44 | DB Equity Limited (in members' voluntary liquidation) | London | Financial Institution | 100.0 | ||||||
45 | DB Finance (Delaware), LLC | Wilmington | Financial Institution | 100.0 | ||||||
46 | DB Global Technology SRL | Bucharest | Ancillary Services Undertaking | 100.0 | ||||||
47 | DB Global Technology, Inc. | Wilmington | Ancillary Services Undertaking | 100.0 | ||||||
48 | DB Group Services (UK) Limited | London | Ancillary Services Undertaking | 100.0 | ||||||
49 | DB Holdings (New York), Inc. | New York | Financial Institution | 100.0 | ||||||
50 | DB HR Solutions GmbH | Frankfurt | Ancillary Services Undertaking | 100.0 | ||||||
51 | DB Immobilienfonds 5 Wieland KG i.L. | Frankfurt | Other Enterprise | 93.6 | ||||||
52 | DB Impact Investment Fund I, L.P. | Edinburgh | 2 | Financial Institution | 100.0 | |||||
53 | DB Industrial Holdings Beteiligungs GmbH & Co. KG | Luetzen | 2 | Financial Institution | 100.0 | |||||
54 | DB Industrial Holdings GmbH | Luetzen | Financial Institution | 100.0 | ||||||
55 | DB Intermezzo LLC | Wilmington | Financial Institution | 100.0 |
380 |
Deutsche Bank | ||
Annual Report 2022 | ||
56 | DB International (Asia) Limited | Singapore | Credit Institution | 100.0 | ||||||
57 | DB International Investments Limited | London | Financial Institution | 100.0 | ||||||
58 | DB International Trust (Singapore) Limited | Singapore | Other Enterprise | 100.0 | ||||||
59 | DB Investment Managers, Inc. | Wilmington | Financial Institution | 100.0 | ||||||
60 | DB Investment Partners Limited | London | Financial Institution | 100.0 | ||||||
61 | DB Investment Resources (US) Corporation | Wilmington | Financial Institution | 100.0 | ||||||
62 | DB Investment Resources Holdings Corp. | Wilmington | Financial Institution | 100.0 | ||||||
63 | DB Investment Services GmbH | Frankfurt | Ancillary Services Undertaking | 100.0 | ||||||
64 | DB Io LP | Wilmington | 2 | Financial Institution | 100.0 | |||||
65 | DB IROC Leasing Corp. | New York | Financial Institution | 100.0 | ||||||
66 | DB London (Investor Services) Nominees Limited | London | Financial Institution | 100.0 | ||||||
67 | DB Management Support GmbH | Frankfurt | Ancillary Services Undertaking | 100.0 | ||||||
68 | DB Nominees (Hong Kong) Limited | Hong Kong | Ancillary Services Undertaking | 100.0 | ||||||
69 | DB Nominees (Jersey) Limited | St. Helier | Other Enterprise | 100.0 | ||||||
70 | DB Nominees (Singapore) Pte Ltd | Singapore | Other Enterprise | 100.0 | ||||||
71 | DB Omega Ltd. | George Town | Financial Institution | 100.0 | ||||||
72 | DB Omega S.C.S. | Luxembourg | 2 | Financial Institution | 100.0 | |||||
73 | DB Operaciones y Servicios Interactivos, S.L.U. | Madrid | Ancillary Services Undertaking | 100.0 | ||||||
74 | DB Overseas Finance Delaware, Inc. | Wilmington | Financial Institution | 100.0 | ||||||
75 | DB Overseas Holdings Limited | London | Financial Institution | 100.0 | ||||||
76 | DB Print GmbH | Frankfurt | Ancillary Services Undertaking | 100.0 | ||||||
77 | DB Private Clients Corp. | Wilmington | Financial Institution | 100.0 | ||||||
78 | DB Private Wealth Mortgage Ltd. | New York | Financial Institution | 100.0 | ||||||
79 | DB Re S.A. | Luxembourg | Reinsurance Undertaking | 100.0 | ||||||
80 | DB Service Centre Limited | Dublin | Ancillary Services Undertaking | 100.0 | ||||||
81 | DB Services (Jersey) Limited | St. Helier | Ancillary Services Undertaking | 100.0 | ||||||
82 | DB Services Americas, Inc. | Wilmington | Ancillary Services Undertaking | 100.0 | ||||||
83 | DB Servizi Amministrativi S.r.l. | Milan | Ancillary Services Undertaking | 100.0 | ||||||
84 | DB Strategic Advisors, Inc. | Makati City | Ancillary Services Undertaking | 100.0 | ||||||
85 | DB Structured Derivative Products, LLC | Wilmington | Ancillary Services Undertaking | 100.0 | ||||||
86 | DB Structured Products, Inc. | Wilmington | Financial Institution | 100.0 | ||||||
87 | DB Trustee Services Limited | London | Other Enterprise | 100.0 | ||||||
88 | DB Trustees (Hong Kong) Limited | Hong Kong | Other Enterprise | 100.0 | ||||||
89 | DB U.S. Financial Markets Holding Corporation | Wilmington | Financial Holding Company | 100.0 | ||||||
90 | DB UK Bank Limited | London | Credit Institution | 100.0 | ||||||
91 | DB UK Holdings Limited | London | Financial Institution | 100.0 | ||||||
92 | DB UK PCAM Holdings Limited | London | Financial Institution | 100.0 | ||||||
93 | DB USA Core Corporation | West Trenton | Ancillary Services Undertaking | 100.0 | ||||||
94 | DB USA Corporation | Wilmington | Financial Institution | 100.0 | ||||||
95 | DB Valoren S.à r.l. | Luxembourg | Financial Holding Company | 100.0 | ||||||
96 | DB Value S.à r.l. | Luxembourg | Financial Institution | 100.0 | ||||||
97 | DB VersicherungsManager GmbH | Frankfurt | Other Enterprise | 100.0 | ||||||
98 | DB Vita S.A. | Luxembourg | Insurance Undertaking | 84.0 | ||||||
99 | DBAH Capital, LLC | Wilmington | Financial Institution | 100.0 | ||||||
100 | DBCIBZ1 | George Town | Financial Institution | 100.0 | ||||||
101 | DBFIC, Inc. | Wilmington | Financial Institution | 100.0 | ||||||
102 | DBNZ Overseas Investments (No.1) Limited | George Town | Financial Institution | 100.0 | ||||||
103 | DBOI Global Services (UK) Limited | London | Ancillary Services Undertaking | 100.0 | ||||||
104 | DBR Investments Co. Limited | George Town | Financial Institution | 100.0 | ||||||
105 | DBRE Global Real Estate Management IB, Ltd. | George Town | Asset Management Company | 100.0 | ||||||
106 | DBRMSGP1 | George Town | 2, 3 | Financial Institution | 100.0 | |||||
107 | DBUK PCAM Limited | London | Financial Holding Company | 100.0 | ||||||
108 | DBUSBZ2, S.à r.l. | Luxembourg | Financial Institution | 100.0 | ||||||
109 | DBX Advisors LLC | Wilmington | Financial Institution | 100.0 | ||||||
110 | DEBEKO Immobilien GmbH & Co Grundbesitz OHG | Eschborn | 2 | Ancillary Services Undertaking | 100.0 | |||||
111 | DEE Deutsche Erneuerbare Energien GmbH | Frankfurt | Financial Institution | 100.0 | ||||||
112 | DEUKONA Versicherungs-Vermittlungs-GmbH | Frankfurt | Ancillary Services Undertaking | 100.0 | ||||||
113 | Deutsche (Aotearoa) Capital Holdings New Zealand | Auckland | Financial Institution | 100.0 | ||||||
114 | Deutsche (Aotearoa) Foreign Investments New Zealand | Auckland | Financial Institution | 100.0 | ||||||
115 | Deutsche (New Munster) Holdings New Zealand Limited | Auckland | Financial Institution | 100.0 | ||||||
116 | Deutsche Access Investments Limited | Sydney | Ancillary Services Undertaking | 100.0 | ||||||
117 | Deutsche Aeolia Power Production Société Anonyme | Athens | Other Enterprise | 95.6 | ||||||
118 | Deutsche Alternative Asset Management (UK) Limited | London | Asset Management Company | 100.0 | ||||||
119 | Deutsche Asia Pacific Holdings Pte Ltd | Singapore | Financial Holding Company | 100.0 | ||||||
120 | Deutsche Asset Management (India) Private Limited | Mumbai | Ancillary Services Undertaking | 100.0 |
381 |
Deutsche Bank | ||
Annual Report 2022 | ||
121 | Deutsche Australia Limited | Sydney | Financial Institution | 100.0 | ||||||
122 | Deutsche Bank (Cayman) Limited | George Town | Other Enterprise | 100.0 | ||||||
123 | Deutsche Bank (China) Co., Ltd. | Beijing | Credit Institution | 100.0 | ||||||
124 | Deutsche Bank (Malaysia) Berhad | Kuala Lumpur | Credit Institution | 100.0 | ||||||
125 | Deutsche Bank (Suisse) SA | Geneva | Credit Institution | 100.0 | ||||||
126 | Deutsche Bank (Uruguay) Sociedad Anónima Institución Financiera Externa | Montevideo | Credit Institution | 100.0 | ||||||
127 | DEUTSCHE BANK A.S. | Istanbul | Credit Institution | 100.0 | ||||||
128 | Deutsche Bank Americas Holding Corp. | Wilmington | Financial Institution | 100.0 | ||||||
129 | Deutsche Bank Europe GmbH | Frankfurt | Credit Institution | 100.0 | ||||||
130 | Deutsche Bank Financial Company | George Town | Financial Institution | 100.0 | ||||||
131 | Deutsche Bank Holdings, Inc. | Wilmington | Financial Institution | 100.0 | ||||||
132 | Deutsche Bank Insurance Agency Incorporated | Wilmington | Other Enterprise | 100.0 | ||||||
133 | Deutsche Bank Luxembourg S.A. | Luxembourg | Credit Institution | 100.0 | ||||||
134 | Deutsche Bank Mutui S.p.A. | Milan | Credit Institution | 100.0 | ||||||
135 | Deutsche Bank México, S.A., Institución de Banca Múltiple | Mexico City | Credit Institution | 100.0 | ||||||
136 | Deutsche Bank National Trust Company | Los Angeles | Financial Institution | 100.0 | ||||||
137 | Deutsche Bank Polska Spólka Akcyjna | Warsaw | Credit Institution | 100.0 | ||||||
138 | Deutsche Bank Representative Office Nigeria Limited | Lagos | Ancillary Services Undertaking | 100.0 | ||||||
139 | Deutsche Bank S.A. - Banco Alemão | Sao Paulo | Credit Institution | 100.0 | ||||||
140 | Deutsche Bank Securities Inc. | Wilmington | Financial Institution | 100.0 | ||||||
141 | Deutsche Bank Securities Limited | Toronto | Financial Institution | 100.0 | ||||||
142 | Deutsche Bank Società per Azioni | Milan | Credit Institution | 99.9 | ||||||
143 | Deutsche Bank Trust Company Americas | New York | Credit Institution | 100.0 | ||||||
144 | Deutsche Bank Trust Company Delaware | Wilmington | Credit Institution | 100.0 | ||||||
145 | Deutsche Bank Trust Company, National Association | New York | Financial Institution | 100.0 | ||||||
146 | Deutsche Bank Trust Corporation | New York | Financial Holding Company | 100.0 | ||||||
147 | Deutsche Bank, Sociedad Anónima Española | Madrid | Credit Institution | 100.0 | ||||||
148 | Deutsche Capital Finance (2000) Limited | George Town | Financial Institution | 100.0 | ||||||
149 | Deutsche Capital Markets Australia Limited | Sydney | Financial Institution | 100.0 | ||||||
150 | Deutsche Capital Partners China Limited | Camana Bay | Financial Institution | 100.0 | ||||||
151 | Deutsche Cayman Ltd. | Camana Bay | Other Enterprise | 100.0 | ||||||
152 | Deutsche CIB Centre Private Limited | Mumbai | Ancillary Services Undertaking | 100.0 | ||||||
153 | Deutsche Custody N.V. | Amsterdam | Financial Institution | 100.0 | ||||||
154 | Deutsche Domus New Zealand Limited | Auckland | Financial Institution | 100.0 | ||||||
155 | Deutsche Equities India Private Limited | Mumbai | Financial Institution | 100.0 | ||||||
156 | Deutsche Finance No. 2 Limited | George Town | Financial Institution | 100.0 | ||||||
157 | Deutsche Foras New Zealand Limited | Auckland | Financial Institution | 100.0 | ||||||
158 | Deutsche Gesellschaft für Immobilien-Leasing mit beschränkter Haftung | Duesseldorf | Financial Institution | 100.0 | ||||||
159 | Deutsche Global Markets Limited | Tel Aviv | Ancillary Services Undertaking | 100.0 | ||||||
160 | Deutsche Group Holdings (SA) Proprietary Limited | Johannesburg | Financial Institution | 100.0 | ||||||
161 | Deutsche Group Services Pty Limited | Sydney | Ancillary Services Undertaking | 100.0 | ||||||
162 | Deutsche Grundbesitz-Anlagegesellschaft mit beschränkter Haftung | Frankfurt | Other Enterprise | 99.8 | ||||||
163 | Deutsche Holdings (Grand Duchy) | Luxembourg | Financial Holding Company | 100.0 | ||||||
164 | Deutsche Holdings (Luxembourg) S.à r.l. | Luxembourg | Financial Holding Company | 100.0 | ||||||
165 | Deutsche Holdings Limited | London | Financial Holding Company | 100.0 | ||||||
166 | Deutsche Holdings No. 2 Limited | London | Financial Institution | 100.0 | ||||||
167 | Deutsche Holdings No. 3 Limited | London | Financial Institution | 100.0 | ||||||
168 | Deutsche Holdings No. 4 Limited | London | Financial Institution | 100.0 | ||||||
169 | Deutsche Immobilien Leasing GmbH | Duesseldorf | Financial Institution | 100.0 | ||||||
170 | Deutsche India Holdings Private Limited | Mumbai | Financial Holding Company | 100.0 | ||||||
171 | Deutsche India Private Limited | Mumbai | Ancillary Services Undertaking | 100.0 | ||||||
172 | Deutsche International Corporate Services (Ireland) Limited | Dublin | Financial Institution | 100.0 | ||||||
173 | Deutsche International Corporate Services Limited | St. Helier | Other Enterprise | 100.0 | ||||||
174 | Deutsche International Custodial Services Limited | St. Helier | Other Enterprise | 100.0 | ||||||
175 | Deutsche Investments (Netherlands) N.V. | Amsterdam | Financial Institution | 100.0 | ||||||
176 | Deutsche Investments India Private Limited | Mumbai | Financial Institution | 100.0 | ||||||
177 | Deutsche Investor Services Private Limited | Mumbai | Other Enterprise | 100.0 | ||||||
178 | Deutsche Knowledge Services Pte. Ltd. | Singapore | Ancillary Services Undertaking | 100.0 | ||||||
179 | Deutsche Leasing New York Corp. | New York | Ancillary Services Undertaking | 100.0 | ||||||
180 | Deutsche Mexico Holdings S.à r.l. | Luxembourg | Financial Holding Company | 100.0 |
382 |
Deutsche Bank | ||
Annual Report 2022 | ||
181 | Deutsche Morgan Grenfell Group Limited | London | Financial Institution | 100.0 | ||||||
182 | Deutsche Mortgage & Asset Receiving Corporation | Wilmington | Ancillary Services Undertaking | 100.0 | ||||||
183 | Deutsche Nederland N.V. | Amsterdam | Ancillary Services Undertaking | 100.0 | ||||||
184 | Deutsche New Zealand Limited | Auckland | Financial Institution | 100.0 | ||||||
185 | Deutsche Nominees Limited | London | Financial Institution | 100.0 | ||||||
186 | Deutsche Oppenheim Family Office AG | Cologne | Credit Institution | 100.0 | ||||||
187 | Deutsche Overseas Issuance New Zealand Limited | Auckland | Ancillary Services Undertaking | 100.0 | ||||||
188 | Deutsche Postbank Finance Center Objekt GmbH | Schuettringen | Ancillary Services Undertaking | 100.0 | ||||||
189 | Deutsche Private Asset Management Limited (in members' voluntary liquidation) | London | Other Enterprise | 100.0 | ||||||
190 | Deutsche Securities (India) Private Limited | New Delhi | Financial Institution | 100.0 | ||||||
191 | Deutsche Securities (Proprietary) Limited | Johannesburg | Financial Institution | 100.0 | ||||||
192 | Deutsche Securities (SA) (Proprietary) Limited | Johannesburg | Financial Institution | 100.0 | ||||||
193 | Deutsche Securities Asia Limited | Hong Kong | Financial Institution | 100.0 | ||||||
194 | Deutsche Securities Inc. | Tokyo | Financial Institution | 100.0 | ||||||
195 | Deutsche Securities Israel Ltd. | Tel Aviv | Financial Institution | 100.0 | ||||||
196 | Deutsche Securities Korea Co. | Seoul | Financial Institution | 100.0 | ||||||
197 | Deutsche Securities Saudi Arabia (a closed joint stock company) | Riyadh | Financial Institution | 100.0 | ||||||
198 | Deutsche Securities, S.A. de C.V., Casa de Bolsa | Mexico City | Financial Institution | 100.0 | ||||||
199 | Deutsche Services (CI) Limited | St. Helier | Financial Institution | 100.0 | ||||||
200 | Deutsche Services Polska Sp. z o.o. | Warsaw | Ancillary Services Undertaking | 100.0 | ||||||
201 | Deutsche StiftungsTrust GmbH | Frankfurt | Other Enterprise | 100.0 | ||||||
202 | Deutsche Strategic Investment Holdings Yugen Kaisha | Tokyo | Financial Institution | 100.0 | ||||||
203 | Deutsche Trustee Company Limited | London | Other Enterprise | 100.0 | ||||||
204 | Deutsche Trustee Services (India) Private Limited | Mumbai | Other Enterprise | 100.0 | ||||||
205 | Deutsche Trustees Malaysia Berhad | Kuala Lumpur | Other Enterprise | 100.0 | ||||||
206 | Deutsche Wealth Management S.G.I.I.C., S.A. | Madrid | Asset Management Company | 100.0 | ||||||
207 | Deutsches Institut für Altersvorsorge GmbH | Frankfurt | Other Enterprise | 78.0 | ||||||
208 | DI Deutsche Immobilien Treuhandgesellschaft mbH | Frankfurt | Other Enterprise | 100.0 | ||||||
209 | DIP Management GmbH | Frankfurt | Financial Institution | 100.0 | ||||||
210 | DISCA Beteiligungsgesellschaft mbH | Duesseldorf | Financial Institution | 100.0 | ||||||
211 | Durian (Luxembourg) S.à r.l. | Luxembourg | Other Enterprise | 100.0 | ||||||
212 | DWS Alternatives France | Paris | Other Enterprise | 100.0 | ||||||
213 | DWS Alternatives Global Limited | London | Asset Management Company | 100.0 | ||||||
214 | DWS Alternatives GmbH | Frankfurt | Asset Management Company | 100.0 | ||||||
215 | DWS Asset Management (Korea) Company Limited | Seoul | Asset Management Company | 100.0 | ||||||
216 | DWS Beteiligungs GmbH | Frankfurt | Financial Institution | 98.7 | ||||||
217 | DWS CH AG | Zurich | Financial Institution | 100.0 | ||||||
218 | DWS Distributors, Inc. | Wilmington | Financial Institution | 100.0 | ||||||
219 | DWS Far Eastern Investments Limited | Taipei | Financial Institution | 60.0 | ||||||
220 | DWS Global Business Services Inc. | Taguig City | Ancillary Services Undertaking | 99.9 | ||||||
221 | DWS Group GmbH & Co. KGaA | Frankfurt | 2 | Financial Holding Company | 79.5 | |||||
222 | DWS Group Services UK Limited | London | Ancillary Services Undertaking | 100.0 | ||||||
223 | DWS Grundbesitz GmbH | Frankfurt | Asset Management Company | 99.9 | ||||||
224 | DWS India Private Limited | Mumbai | Ancillary Services Undertaking | 100.0 | ||||||
225 | DWS International GmbH | Frankfurt | Investment Firm | 100.0 | ||||||
226 | DWS Investment GmbH | Frankfurt | Asset Management Company | 100.0 | ||||||
227 | DWS Investment Management Americas, Inc. | Wilmington | Financial Institution | 100.0 | ||||||
228 | DWS Investment S.A. | Luxembourg | Asset Management Company | 100.0 | ||||||
229 | DWS Investments Australia Limited | Sydney | Financial Institution | 100.0 | ||||||
230 | DWS Investments Hong Kong Limited | Hong Kong | Financial Institution | 100.0 | ||||||
231 | DWS Investments Japan Limited | Tokyo | Financial Institution | 100.0 | ||||||
232 | DWS Investments Shanghai Limited | Shanghai | Financial Institution | 100.0 | ||||||
233 | DWS Investments Singapore Limited | Singapore | Financial Institution | 100.0 | ||||||
234 | DWS Investments UK Limited | London | Asset Management Company | 100.0 | ||||||
235 | DWS Management GmbH | Frankfurt | Financial Institution | 100.0 | ||||||
236 | DWS Real Estate GmbH | Frankfurt | Financial Institution | 99.9 | ||||||
237 | DWS Service Company | Wilmington | Ancillary Services Undertaking | 100.0 | ||||||
238 | DWS Shanghai Private Equity Fund Management Limited | Shanghai | Financial Institution | 100.0 | ||||||
239 | DWS Trust Company | Concord | Financial Institution | 100.0 | ||||||
240 | DWS USA Corporation | Wilmington | Financial Holding Company | 100.0 |
383 |
Deutsche Bank | ||
Annual Report 2022 | ||
241 | EC EUROPA IMMOBILIEN FONDS NR. 3 GmbH & CO. KG i.I. | Hamburg | Other Enterprise | 65.2 | ||||||
242 | Elizabethan Holdings Limited | George Town | Financial Institution | 100.0 | ||||||
243 | Elizabethan Management Limited | George Town | Other Enterprise | 100.0 | ||||||
244 | Elm (Luxembourg) S.à r.l. | Luxembourg | Other Enterprise | 100.0 | ||||||
245 | European Value Added I (Alternate G.P.) LLP | London | Financial Institution | 100.0 | ||||||
246 | Fiduciaria Sant' Andrea S.r.l. | Milan | Other Enterprise | 100.0 | ||||||
247 | Finanzberatungsgesellschaft mbH der Deutschen Bank | Berlin | Ancillary Services Undertaking | 100.0 | ||||||
248 | Fir (Luxembourg) S.à r.l. | Luxembourg | Other Enterprise | 100.0 | ||||||
249 | Franz Urbig- und Oscar Schlitter-Stiftung Gesellschaft mit beschränkter Haftung | Frankfurt | Ancillary Services Undertaking | 100.0 | ||||||
250 | Fünfte SAB Treuhand und Verwaltung GmbH & Co. Suhl "Rimbachzentrum" KG | Bad Homburg | Other Enterprise | 74.9 | ||||||
251 | G Finance Holding Corp. | Wilmington | Financial Institution | 100.0 | ||||||
252 | German American Capital Corporation | Lutherville-Timonium | Financial Institution | 100.0 | ||||||
253 | Greenheart (Luxembourg) S.à r.l. | Luxembourg | Other Enterprise | 100.0 | ||||||
254 | Greenwood Properties Corp. | New York | 1 | Financial Institution | 0.0 | |||||
255 | Grundstücksgesellschaft Frankfurt Bockenheimer Landstraße GbR | Troisdorf | 2 | Other Enterprise | 98.7 | |||||
256 | Grundstücksgesellschaft Kerpen-Sindorf Vogelrutherfeld GbR | Troisdorf | 2 | Other Enterprise | 94.0 | |||||
257 | Grundstücksgesellschaft Köln Oppenheimstraße GbR | Troisdorf | 2 | Ancillary Services Undertaking | 100.0 | |||||
258 | Grundstücksgesellschaft Wiesbaden Luisenstraße/Kirchgasse GbR | Troisdorf | 2 | Other Enterprise | 78.7 | |||||
259 | Immobilienfonds Büro-Center Erfurt am Flughafen Bindersleben I GbR | Troisdorf | 2 | Other Enterprise | 90.0 | |||||
260 | Immobilienfonds Wohn- und Geschäftshaus Köln-Blumenberg V GbR | Troisdorf | 2 | Other Enterprise | 99.0 | |||||
261 | ISTRON Beteiligungs- und Verwaltungs-GmbH | Cologne | Ancillary Services Undertaking | 100.0 | ||||||
262 | IVAF I Manager, S.à r.l. | Luxembourg | Financial Institution | 100.0 | ||||||
263 | J R Nominees (Pty) Ltd | Johannesburg | Other Enterprise | 100.0 | ||||||
264 | Joint Stock Company Deutsche Bank DBU | Kiev | Credit Institution | 100.0 | ||||||
265 | Jyogashima Godo Kaisha | Tokyo | Financial Institution | 100.0 | ||||||
266 | KEBA Gesellschaft für interne Services mbH | Frankfurt | Ancillary Services Undertaking | 100.0 | ||||||
267 | Kidson Pte Ltd | Singapore | Financial Institution | 100.0 | ||||||
268 | Konsul Inkasso GmbH | Essen | Ancillary Services Undertaking | 100.0 | ||||||
269 | LA Water Holdings Limited | George Town | Financial Institution | 75.0 | ||||||
270 | LAWL Pte. Ltd. | Singapore | Financial Institution | 100.0 | ||||||
271 | Leasing Verwaltungsgesellschaft Waltersdorf mbH | Schoenefeld | Financial Institution | 100.0 | ||||||
272 | Leonardo III Initial GP Limited | London | Financial Institution | 100.0 | ||||||
273 | Maher Terminals Holdings (Toronto) Limited | Vancouver | Financial Institution | 100.0 | ||||||
274 | MEF I Manager, S. à r.l. | Munsbach | Financial Institution | 100.0 | ||||||
275 | MIT Holdings, Inc. | Baltimore | Financial Institution | 100.0 | ||||||
276 | MortgageIT Securities Corp. | Wilmington | Ancillary Services Undertaking | 100.0 | ||||||
277 | MortgageIT, Inc. | New York | Financial Institution | 100.0 | ||||||
278 | norisbank GmbH | Bonn | Credit Institution | 100.0 | ||||||
279 | OOO "Deutsche Bank TechCentre" | Moscow | Ancillary Services Undertaking | 100.0 | ||||||
280 | OOO "Deutsche Bank" | Moscow | Credit Institution | 100.0 | ||||||
281 | OPB Verwaltungs- und Treuhand GmbH | Cologne | Financial Institution | 100.0 | ||||||
282 | OPB-Oktava GmbH | Cologne | Financial Institution | 100.0 | ||||||
283 | OPPENHEIM Capital Advisory GmbH | Cologne | Financial Institution | 100.0 | ||||||
284 | OPPENHEIM PRIVATE EQUITY Verwaltungsgesellschaft mbH | Cologne | Financial Institution | 100.0 | ||||||
285 | PADUS Grundstücks-Vermietungsgesellschaft mbH | Duesseldorf | Financial Institution | 100.0 | ||||||
286 | Pan Australian Nominees Pty Ltd | Sydney | Ancillary Services Undertaking | 100.0 | ||||||
287 | PB Factoring GmbH | Bonn | Financial Institution | 100.0 | ||||||
288 | PB Spezial-Investmentaktiengesellschaft mit Teilgesellschaftsvermögen i.L. | Bonn | Ancillary Services Undertaking | 100.0 | ||||||
289 | PCC Services GmbH der Deutschen Bank | Essen | Ancillary Services Undertaking | 100.0 | ||||||
290 | Plantation Bay, Inc. | St. Thomas | Other Enterprise | 100.0 | ||||||
291 | Postbank Beteiligungen GmbH | Bonn | Financial Institution | 100.0 | ||||||
292 | Postbank Direkt GmbH | Bonn | Financial Institution | 100.0 | ||||||
293 | Postbank Filialvertrieb AG | Bonn | Financial Institution | 100.0 | ||||||
294 | Postbank Finanzberatung AG | Hameln | Other Enterprise | 100.0 | ||||||
295 | Postbank Immobilien GmbH | Hameln | Other Enterprise | 100.0 | ||||||
296 | Postbank Leasing GmbH | Bonn | Financial Institution | 100.0 | ||||||
297 | PT Deutsche Sekuritas Indonesia | Jakarta | Financial Institution | 99.0 | ||||||
298 | R.B.M. Nominees Pty Ltd | Sydney | Ancillary Services Undertaking | 100.0 | ||||||
299 | RoPro U.S. Holding, Inc. | Wilmington | Financial Institution | 100.0 | ||||||
300 | Route 28 Receivables, LLC | Wilmington | Financial Institution | 100.0 |
384 |
Deutsche Bank | ||
Annual Report 2022 | ||
301 | RREEF America L.L.C. | Wilmington | Financial Institution | 100.0 | ||||||
302 | RREEF China REIT Management Limited (in members' voluntary winding up) | Hong Kong | Other Enterprise | 100.0 | ||||||
303 | RREEF European Value Added I (G.P.) Limited | London | Financial Institution | 100.0 | ||||||
304 | RREEF Fund Holding Co. | George Town | Financial Institution | 100.0 | ||||||
305 | RREEF India Advisors Private Limited | Mumbai | Other Enterprise | 100.0 | ||||||
306 | RREEF Management L.L.C. | Wilmington | Ancillary Services Undertaking | 100.0 | ||||||
307 | SAB Real Estate Verwaltungs GmbH | Hameln | Financial Institution | 100.0 | ||||||
308 | SAGITA Grundstücks-Vermietungsgesellschaft mbH | Duesseldorf | Financial Institution | 100.0 | ||||||
309 | Sal. Oppenheim jr. & Cie. Beteiligungs GmbH | Cologne | Financial Institution | 100.0 | ||||||
310 | SAPIO Grundstücks-Vermietungsgesellschaft mbH | Duesseldorf | Financial Institution | 100.0 | ||||||
311 | Sharps SP I LLC | Wilmington | Financial Institution | 100.0 | ||||||
312 | Stelvio Immobiliare S.r.l. | Bolzano | Other Enterprise | 100.0 | ||||||
313 | Süddeutsche Vermögensverwaltung Gesellschaft mit beschränkter Haftung | Frankfurt | Financial Institution | 100.0 | ||||||
314 | TELO Beteiligungsgesellschaft mbH | Schoenefeld | Financial Institution | 100.0 | ||||||
315 | Tempurrite Leasing Limited | London | Financial Institution | 100.0 | ||||||
316 | Thai Asset Enforcement and Recovery Asset Management Company Limited | Bangkok | Financial Institution | 100.0 | ||||||
317 | Treuinvest Service GmbH | Frankfurt | Other Enterprise | 100.0 | ||||||
318 | Triplereason Limited | London | Financial Institution | 100.0 | ||||||
319 | VÖB-ZVD Processing GmbH | Bonn | Payment Institution | 100.0 | ||||||
320 | WEPLA Beteiligungsgesellschaft mbH | Frankfurt | Financial Institution | 100.0 | ||||||
321 | World Trading (Delaware) Inc. | Wilmington | Financial Institution | 100.0 | ||||||
385 |
Deutsche Bank | ||
Annual Report 2022 | ||
Consolidated structured entities
Serial | Name of company | Domicile of | Foot- | Nature of activity | Share of | |||||
322 | Alguer Inversiones Designated Activity Company | Dublin | Other Enterprise | |||||||
323 | Alixville Invest, S.L. | Madrid | Other Enterprise | |||||||
324 | Altersvorsorge Fonds Hamburg Alter Wall Dr. Juncker KG | Frankfurt | Other Enterprise | |||||||
325 | Amber Investments S.à r.l., en liquidation volontaire | Luxembourg | Other Enterprise | 100.0 | ||||||
326 | Atlas Investment Company 1 S.à r.l. | Luxembourg | Financial Institution | |||||||
327 | Atlas Investment Company 2 S.à r.l. | Luxembourg | Financial Institution | |||||||
328 | Atlas Investment Company 3 S.à r.l. | Luxembourg | Financial Institution | |||||||
329 | Atlas Investment Company 4 S.à r.l. | Luxembourg | Financial Institution | |||||||
330 | Atlas Portfolio Select SPC | George Town | Financial Institution | 0.0 | ||||||
331 | Atlas SICAV - FIS | Luxembourg | 4 | Other Enterprise | ||||||
332 | Australian Secured Personal Loans Trust | Melbourne | Other Enterprise | 100.0 | ||||||
333 | Axia Insurance, Ltd. | Hamilton | 4 | Other Enterprise | ||||||
334 | Carpathian Investments Designated Activity Company | Dublin | Financial Institution | 100.0 | ||||||
335 | Cathay Capital Company Limited | Ebène | Financial Institution | 9.5 | ||||||
336 | Cathay Strategic Investment Company Limited | Hong Kong | Financial Institution | |||||||
337 | Cathay Strategic Investment Company No. 2 Limited | George Town | Financial Institution | |||||||
338 | Cayman Reference Fund Holdings Limited | George Town | Ancillary Services Undertaking | |||||||
339 | Ceto S.à r.l. | Luxembourg | Financial Institution | |||||||
340 | Charitable Luxembourg Four S.à r.l. | Luxembourg | Financial Institution | |||||||
341 | Charitable Luxembourg Three S.à r.l. | Luxembourg | Financial Institution | |||||||
342 | Charitable Luxembourg Two S.à r.l. | Luxembourg | Financial Institution | |||||||
343 | City Leasing (Thameside) Limited | London | Financial Institution | 100.0 | ||||||
344 | City Leasing Limited | London | Financial Institution | 100.0 | ||||||
345 | CLASS Limited | St. Helier | 4 | Other Enterprise | ||||||
346 | Collins Capital Low Volatility Performance II Special Investments, Ltd. | Road Town | Financial Institution | |||||||
347 | Crofton Invest, S.L. | Madrid | Other Enterprise | |||||||
348 | Danube Properties S.à r.l., en faillite | Luxembourg | Other Enterprise | 25.0 | ||||||
349 | DB Asset Finance I S.à r.l. | Luxembourg | Financial Institution | 96.9 | ||||||
350 | DB Asset Finance II S.à r.l. | Luxembourg | Financial Institution | 96.9 | ||||||
351 | DB Aster II, LLC | Wilmington | Ancillary Services Undertaking | 100.0 | ||||||
352 | DB Aster III, LLC | Wilmington | Ancillary Services Undertaking | 100.0 | ||||||
353 | DB Aster, Inc. | Wilmington | Financial Institution | 100.0 | ||||||
354 | DB Aster, LLC | Wilmington | Ancillary Services Undertaking | 100.0 | ||||||
355 | DB Covered Bond S.r.l. | Conegliano | Financial Institution | 90.0 | ||||||
356 | DB Credit Investments S.à r.l. | Luxembourg | Financial Institution | 100.0 | ||||||
357 | DB Finance International GmbH | Frankfurt | Financial Institution | 100.0 | ||||||
358 | DB Holding Fundo de Investimento Multimercado Investimento no Exterior Crédito Privado | Sao Paulo | Financial Institution | 100.0 | ||||||
359 | DB Immobilienfonds 1 Wieland KG | Frankfurt | Other Enterprise | |||||||
360 | DB Immobilienfonds 2 KG i.L. | Frankfurt | Financial Institution | 74.0 | ||||||
361 | DB Impact Investment (GP) Limited | London | Financial Institution | 100.0 | ||||||
362 | DB Litigation Fee LLC | Wilmington | Financial Institution | 100.0 | ||||||
363 | DB Municipal Holdings LLC | Wilmington | Ancillary Services Undertaking | 100.0 | ||||||
364 | db PBC | Luxembourg | 4 | Other Enterprise | ||||||
365 | DB RC Holdings, LLC | Wilmington | Financial Institution | 100.0 | ||||||
366 | DB SPEARs/LIFERs, Series DBE-8052 Trust | Wilmington | Ancillary Services Undertaking | 0.0 | ||||||
367 | DB SPEARs/LIFERs, Series DBE-8055 Trust | Wilmington | Ancillary Services Undertaking | 0.0 | ||||||
368 | DB SPEARs/LIFERs, Series DBE-8057 Trust | Wilmington | Ancillary Services Undertaking | 0.0 | ||||||
369 | DB SPEARs/LIFERs, Series DBE-8060 Trust | Wilmington | Ancillary Services Undertaking | 0.0 | ||||||
370 | DB SPEARs/LIFERs, Series DBE-8063 Trust | Wilmington | Ancillary Services Undertaking | 0.0 | ||||||
371 | DB SPEARs/LIFERs, Series DBE-8066 Trust | Wilmington | Ancillary Services Undertaking | 0.0 | ||||||
372 | DB SPEARs/LIFERs, Series DBE-8067 Trust | Wilmington | Ancillary Services Undertaking | 0.0 | ||||||
373 | DB SPEARs/LIFERs, Series DBE-8070 Trust | Wilmington | Ancillary Services Undertaking | 0.0 | ||||||
374 | DB SPEARs/LIFERs, Series DBE-8071 Trust | Wilmington | Ancillary Services Undertaking | 0.0 | ||||||
375 | DB SPEARs/LIFERs, Series DBE-8073 Trust | Wilmington | Ancillary Services Undertaking | 0.0 | ||||||
376 | DB SPEARs/LIFERs, Series DBE-8081 Trust | Wilmington | Ancillary Services Undertaking | 0.0 | ||||||
377 | DB SPEARs/LIFERs, Series DBE-8082 Trust | Wilmington | Ancillary Services Undertaking | 0.0 | ||||||
378 | DB SPEARs/LIFERs, Series DBE-8083 Trust | Wilmington | Ancillary Services Undertaking | 0.0 | ||||||
379 | DB SPEARs/LIFERs, Series DBE-8084 Trust | Wilmington | Ancillary Services Undertaking | 0.5 | ||||||
380 | DB SPEARs/LIFERs, Series DBE-8085 Trust | Wilmington | Ancillary Services Undertaking | 0.0 |
386 |
Deutsche Bank | ||
Annual Report 2022 | ||
381 | DB SPEARs/LIFERs, Series DBE-8086 Trust | Wilmington | Ancillary Services Undertaking | 0.0 | ||||||
382 | DB SPEARs/LIFERs, Series DBE-8087 Trust | Wilmington | Ancillary Services Undertaking | 0.0 | ||||||
383 | DB SPEARs/LIFERs, Series DBE-8088 Trust | Wilmington | Ancillary Services Undertaking | 0.1 | ||||||
384 | DB SPEARs/LIFERs, Series DBE-8090 Trust | Wilmington | Ancillary Services Undertaking | 0.0 | ||||||
385 | DB SPEARs/LIFERs, Series DBE-8901 Trust | Wilmington | Ancillary Services Undertaking | 5.0 | ||||||
386 | DB Structured Holdings Luxembourg S.à r.l. | Luxembourg | Financial Institution | 100.0 | ||||||
387 | DBRE Global Real Estate Management US IB, L.L.C. | Wilmington | Financial Institution | 100.0 | ||||||
388 | DBX ETF Trust | Wilmington | 4 | Other Enterprise | ||||||
389 | De Heng Asset Management Company Limited | Beijing | Financial Institution | |||||||
390 | Deloraine Spain, S.L. | Madrid | Other Enterprise | |||||||
391 | Deutsche Bank Luxembourg S.A. - Fiduciary Deposits | Luxembourg | 4 | Other Enterprise | ||||||
392 | Deutsche Bank Luxembourg S.A. - Fiduciary Note Programme | Luxembourg | 4 | Other Enterprise | ||||||
393 | Deutsche Colombia S.A.S. | Bogotá | Financial Institution | 100.0 | ||||||
394 | Deutsche Postbank Funding LLC I | Wilmington | Financial Institution | 100.0 | ||||||
395 | Deutsche Postbank Funding LLC III | Wilmington | Financial Institution | 100.0 | ||||||
396 | Deutsche Postbank Funding Trust I | Wilmington | 1 | Financial Institution | 100.0 | |||||
397 | Deutsche Postbank Funding Trust III | Wilmington | 1 | Financial Institution | 100.0 | |||||
398 | DWS Access S.A. | Luxembourg | 4 | Other Enterprise | ||||||
399 | DWS Alternatives (IE) ICAV | Dublin | Other Enterprise | |||||||
400 | DWS Funds | Luxembourg | 4 | Other Enterprise | ||||||
401 | DWS Garant | Luxembourg | 4 | Other Enterprise | ||||||
402 | DWS Invest | Luxembourg | 4 | Other Enterprise | ||||||
403 | DWS Invest (IE) ICAV | Dublin | Other Enterprise | |||||||
404 | DWS Zeitwert Protect | Luxembourg | Other Enterprise | |||||||
405 | DWS-Fonds Treasury Liquidity (EUR) | Frankfurt | Other Enterprise | 100.0 | ||||||
406 | Dynamic Infrastructure Securities Fund LP | Wilmington | Financial Institution | |||||||
407 | Earls Four Limited | George Town | 4 | Other Enterprise | ||||||
408 | EARLS Trading Limited | George Town | Financial Institution | |||||||
409 | Einkaufszentrum "HVD Dresden" S.à.r.l & Co. KG i.I. | Cologne | Other Enterprise | |||||||
410 | Eirles Three Designated Activity Company | Dublin | 4 | Other Enterprise | ||||||
411 | Eirles Two Designated Activity Company | Dublin | 4 | Other Enterprise | ||||||
412 | Emerald Asset Repackaging Designated Activity Company | Dublin | Financial Institution | 100.0 | ||||||
413 | Emerging Markets Capital Protected Investments Limited | George Town | 4 | Other Enterprise | ||||||
414 | Emeris | George Town | Financial Institution | |||||||
415 | Encina Property Finance Designated Activity Company | Dublin | Financial Institution | |||||||
416 | Epicuro SPV S.r.l. | Conegliano | Other Enterprise | |||||||
417 | Erste Frankfurter Hoist GmbH | Frankfurt | Financial Institution | 100.0 | ||||||
418 | Fondo Privado de Titulizacion Activos Reales 1 B.V. | Amsterdam | Other Enterprise | |||||||
419 | Fondo Privado de Titulización PYMES I Designated Activity Company | Dublin | Other Enterprise | |||||||
420 | Freddie Mac Class A Taxable Multifamily M Certificates Series M-037 | McLean | Ancillary Services Undertaking | 100.0 | ||||||
421 | Freddie Mac Class A Taxable Multifamily M Certificates Series M-039 | McLean | Ancillary Services Undertaking | 100.0 | ||||||
422 | Freddie Mac Class A Taxable Multifamily M Certificates Series M-040 | McLean | Ancillary Services Undertaking | 100.0 | ||||||
423 | Freddie Mac Class A Taxable Multifamily M Certificates Series M-041 | McLean | Ancillary Services Undertaking | 100.0 | ||||||
424 | Freddie Mac Class A Taxable Multifamily M Certificates Series M-043 | McLean | Ancillary Services Undertaking | 100.0 | ||||||
425 | Freddie Mac Class A Taxable Multifamily M Certificates Series M-044 | McLean | Ancillary Services Undertaking | 100.0 | ||||||
426 | Freddie Mac Class A Taxable Multifamily M Certificates Series M-047 | McLean | Ancillary Services Undertaking | 100.0 | ||||||
427 | G.O. IB-US Management, L.L.C. | Wilmington | Financial Institution | 100.0 | ||||||
428 | GAC-HEL, Inc. | Wilmington | Ancillary Services Undertaking | 100.0 | ||||||
429 | Galene S.à r.l. | Luxembourg | Other Enterprise | |||||||
430 | Gladyr Spain, S.L. | Madrid | Other Enterprise | |||||||
431 | Global Opportunities Co-Investment Feeder, LLC | Wilmington | Financial Institution | |||||||
432 | Global Opportunities Co-Investment, LLC | George Town | Financial Institution | |||||||
433 | Groton Invest, S.L. | Madrid | Financial Institution | |||||||
434 | GWC-GAC Corp. | Wilmington | Ancillary Services Undertaking | 100.0 | ||||||
435 | Havbell Designated Activity Company | Dublin | Other Enterprise | |||||||
436 | Histria Inversiones Designated Activity Company | Dublin | Financial Institution | |||||||
437 | Iberia Inversiones Designated Activity Company (in liquidation) | Dublin | Other Enterprise | |||||||
438 | Iberia Inversiones II Designated Activity Company | Dublin | Other Enterprise | |||||||
439 | Infrastructure Debt Fund S.C.Sp. SICAV-RAIF | Luxembourg | Other Enterprise | |||||||
440 | Infrastructure Holdings (Cayman) SPC | George Town | Financial Institution |
387 |
Deutsche Bank | ||
Annual Report 2022 | ||
441 | Inn Properties S.à r.l., en faillite | Luxembourg | Other Enterprise | 25.0 | ||||||
442 | Investor Solutions Limited | St. Helier | 4 | Other Enterprise | ||||||
443 | Isar Properties S.à r.l., en faillite | Luxembourg | Other Enterprise | 25.0 | ||||||
444 | IVAF (Jersey) Limited | St. Helier | Ancillary Services Undertaking | |||||||
445 | Kelona Invest, S.L. | Madrid | Other Enterprise | |||||||
446 | Kelsey Street LLC | Wilmington | Ancillary Services Undertaking | 100.0 | ||||||
447 | KH Kitty Hall Holdings Limited | Galway | Financial Institution | |||||||
448 | Kratus Inversiones Designated Activity Company | Dublin | Financial Institution | |||||||
449 | Ledyard, S.L. | Madrid | Other Enterprise | |||||||
450 | 87 Leonard Development LLC | Wilmington | Ancillary Services Undertaking | 100.0 | ||||||
451 | Life Mortgage S.r.l. | Conegliano | Other Enterprise | |||||||
452 | Lindsell Finance Limited | St. Julian's | Ancillary Services Undertaking | 100.0 | ||||||
453 | Lockwood Invest, S.L. | Madrid | Financial Institution | |||||||
454 | London Industrial Leasing Limited | London | Financial Institution | 100.0 | ||||||
455 | Lunashadow Limited | Dublin | Financial Institution | |||||||
456 | 2755 LVB I LLC | Wilmington | Other Enterprise | 100.0 | ||||||
457 | Malabo Holdings Designated Activity Company | Dublin | Financial Institution | |||||||
458 | Merlin XI | George Town | Financial Institution | |||||||
459 | Meseta Inversiones Designated Activity Company | Dublin | Other Enterprise | |||||||
460 | Motion Picture Productions One GmbH & Co. KG | Frankfurt | 2 | Financial Institution | 100.0 | |||||
461 | MPP Beteiligungsgesellschaft mbH | Frankfurt | Financial Institution | 100.0 | ||||||
462 | Navegator - SGFTC, S.A. | Lisbon | Ancillary Services Undertaking | 100.0 | ||||||
463 | NCW Holding Inc. | Vancouver | Financial Institution | 100.0 | ||||||
464 | New 87 Leonard, LLC | Wilmington | Financial Institution | 100.0 | ||||||
465 | Oasis Securitisation S.r.l. | Conegliano | 1 | Other Enterprise | 0.0 | |||||
466 | Oder Properties S.à r.l., en faillite | Luxembourg | Other Enterprise | 25.0 | ||||||
467 | OPAL, en liquidation volontaire | Luxembourg | 4 | Other Enterprise | ||||||
468 | Opus Niestandaryzowany Sekurytyzacyjny Fundusz Inwestycyjny Zamkniety | Warsaw | Other Enterprise | |||||||
469 | OTTAM Mexican Capital Trust Designated Activity Company | Dublin | 4 | Other Enterprise | ||||||
470 | Palladium Global Investments S.A. | Luxembourg | 4 | Other Enterprise | ||||||
471 | Palladium Securities 1 S.A. | Luxembourg | 4 | Other Enterprise | ||||||
472 | PanAsia Funds Investments Ltd. | George Town | 4 | Financial Institution | ||||||
473 | PARTS Funding, LLC | Wilmington | Financial Institution | 100.0 | ||||||
474 | PEIF II SLP Feeder 2 LP | Edinburgh | Financial Institution | 100.0 | ||||||
475 | PEIF III SLP Feeder GP, S.à r.l. | Senningerberg | Financial Institution | |||||||
476 | PEIF III SLP Feeder, SCSp | Senningerberg | 2 | Other Enterprise | 55.1 | |||||
477 | Peruda Leasing Limited | London | Financial Institution | 100.0 | ||||||
478 | PES Carry and Employee Co-Investment Feeder SCSp | Luxembourg | Financial Institution | 1.1 | ||||||
479 | PES Carry and Employee Co-Investment GP S.à r.l. | Luxembourg | Financial Institution | |||||||
480 | Philippine Opportunities for Growth and Income (SPV-AMC), INC. | Makati City | Financial Institution | 95.0 | ||||||
481 | Property Debt Fund S.C.Sp. SICAV-RAIF | Luxembourg | Other Enterprise | |||||||
482 | QR Tower 2, LLC | Wilmington | Ancillary Services Undertaking | 100.0 | ||||||
483 | Quartz No. 1 S.A., en liquidation volontaire | Luxembourg | Other Enterprise | |||||||
484 | Radical Properties Unlimited Company | Dublin | Financial Institution | |||||||
485 | Reference Capital Investments Limited (in members' voluntary liquidation) | London | Financial Institution | 100.0 | ||||||
486 | REO Properties Corporation II | Wilmington | 1 | Ancillary Services Undertaking | 0.0 | |||||
487 | Rhine Properties S.à r.l., en faillite | Luxembourg | Other Enterprise | 25.0 | ||||||
488 | Riviera Real Estate | Paris | Other Enterprise | 100.0 | ||||||
489 | ROCKY 2021-1 SPV S.r.l. | Conegliano | Other Enterprise | |||||||
490 | Romareda Holdings Designated Activity Company | Dublin | Financial Institution | |||||||
491 | RREEF DCH, L.L.C. | Wilmington | Financial Institution | 100.0 | ||||||
492 | Samburg Invest, S.L. | Madrid | Other Enterprise | |||||||
493 | SCB Alpspitze UG (haftungsbeschränkt) | Frankfurt | Financial Institution | |||||||
494 | Seaconview Designated Activity Company | Dublin | Other Enterprise | |||||||
495 | Singer Island Tower Suite LLC | Wilmington | Ancillary Services Undertaking | 100.0 | ||||||
496 | Somkid Immobiliare S.r.l. | Conegliano | Other Enterprise | 100.0 | ||||||
497 | SP Mortgage Trust | Wilmington | Other Enterprise | 100.0 | ||||||
498 | SPV I Sociedad Anónima Cerrada | Lima | Financial Institution | 99.9 | ||||||
499 | SPV II Sociedad Anónima Cerrada | Lima | Ancillary Services Undertaking | 99.8 | ||||||
500 | Style City Limited | Dublin | Financial Institution |
388 |
Deutsche Bank | ||
Annual Report 2022 | ||
501 | Swabia 1 Designated Activity Company | Dublin | Other Enterprise | |||||||
502 | Swabia 1. Vermögensbesitz-GmbH | Frankfurt | Financial Institution | 100.0 | ||||||
503 | Tagus - Sociedade de Titularização de Creditos, S.A. | Lisbon | Other Enterprise | 100.0 | ||||||
504 | Tasman NZ Residential Mortgage Trust | Auckland | Other Enterprise | |||||||
505 | Tech Venture Growth Portfolio, F.C.R. | Madrid | Financial Institution | 100.0 | ||||||
506 | Tech Venture Growth S.C.R., S.A. | Madrid | Financial Institution | 100.0 | ||||||
507 | Trave Properties S.à r.l., en faillite | Luxembourg | Other Enterprise | 25.0 | ||||||
508 | TRS Aria LLC | Wilmington | Financial Institution | 100.0 | ||||||
509 | TRS Leda LLC | Wilmington | Financial Institution | 100.0 | ||||||
510 | TRS Scorpio LLC | Wilmington | Financial Institution | 100.0 | ||||||
511 | TRS SVCO LLC | Wilmington | Financial Institution | 100.0 | ||||||
512 | TRS Venor LLC | Wilmington | Financial Institution | 100.0 | ||||||
513 | VCJ Lease S.à r.l. | Luxembourg | Other Enterprise | 100.0 | ||||||
514 | Vermögensfondmandat Flexible (80% teilgeschützt) | Luxembourg | Other Enterprise | |||||||
515 | Waltzfire Limited | Dublin | Financial Institution | |||||||
516 | Wedverville Spain, S.L. | Madrid | Other Enterprise | |||||||
517 | Wendelstein 2017-1 UG (haftungsbeschränkt) | Frankfurt | Other Enterprise | |||||||
518 | 5353 WHMR LLC | Wilmington | Other Enterprise | 100.0 | ||||||
519 | Xtrackers (IE) Public Limited Company | Dublin | 4 | Other Enterprise | 0.1 | |||||
520 | Xtrackers II | Luxembourg | 4 | Other Enterprise | 0.1 | |||||
521 | Zumirez Drive LLC | Wilmington | Ancillary Services Undertaking | 100.0 | ||||||
389 |
Deutsche Bank | ||
Annual Report 2022 | ||
Companies accounted for at equity
Serial | Name of company | Domicile of | Foot- | Nature of activity | Share of | |||||
522 | A.C.N. 603 303 126 Pty Ltd | Melbourne | Financial Institution | 19.5 | ||||||
523 | AKA Ausfuhrkredit-Gesellschaft mit beschränkter Haftung | Frankfurt | Credit Institution | 26.9 | ||||||
524 | Arabesque AI Ltd | London | Financial Institution | 24.9 | ||||||
525 | BANKPOWER GmbH Personaldienstleistungen | Frankfurt | Other Enterprise | 30.0 | ||||||
526 | Bestra Gesellschaft für Vermögensverwaltung mit beschränkter Haftung | Duesseldorf | Financial Institution | 49.0 | ||||||
527 | Cyber Defence Alliance Limited | London | 5, 6 | Other Enterprise | 0.0 | |||||
528 | DBG Eastern Europe II L.P. | St. Helier | Financial Institution | 25.9 | ||||||
529 | Deutsche Börse Commodities GmbH | Eschborn | Other Enterprise | 16.2 | ||||||
530 | Deutsche Zurich Pensiones Entidad Gestora de Fondos de Pensiones, S.A. | Barcelona | Other Enterprise | 50.0 | ||||||
531 | Deutscher Pensionsfonds Aktiengesellschaft | Cologne | Other Enterprise | 25.1 | ||||||
532 | DIL Internationale Leasinggesellschaft mbH | Duesseldorf | Financial Institution | 50.0 | ||||||
533 | Domus Beteiligungsgesellschaft der Privaten Bausparkassen mbH | Berlin | Financial Holding Company | 21.1 | ||||||
534 | dwins GmbH | Frankfurt | Other Enterprise | 18.7 | ||||||
535 | Elbe Properties S.à r.l., en faillite clôturée | Luxembourg | Other Enterprise | 25.0 | ||||||
536 | Evroenergeiaki Anonymi Etaireia | Athens | 5 | Other Enterprise | 40.0 | |||||
537 | FSDB Merchant Services GmbH | Frankfurt | Other Enterprise | 49.0 | ||||||
538 | Fünfte SAB Treuhand und Verwaltung GmbH & Co. "Leipzig-Magdeburg" KG | Bad Homburg | Other Enterprise | 41.2 | ||||||
539 | Fünfte SAB Treuhand und Verwaltung GmbH & Co. Dresden "Louisenstraße" KG | Bad Homburg | Other Enterprise | 30.6 | ||||||
540 | G.O. IB-SIV Feeder, L.L.C. | Wilmington | Financial Institution | 15.7 | ||||||
541 | Gesellschaft für Kreditsicherung mit beschränkter Haftung | Berlin | Other Enterprise | 36.7 | ||||||
542 | gixyz Abwicklungs GmbH i.L. | Frankfurt | Other Enterprise | 33.3 | ||||||
543 | Grundstücksgesellschaft Karlsruhe Kaiserstraße GbR | Troisdorf | 2 | Other Enterprise | 40.1 | |||||
544 | Grundstücksgesellschaft Köln-Merheim Winterberger Straße GbR | Troisdorf | 2 | Other Enterprise | 41.6 | |||||
545 | Grundstücksgesellschaft Leipzig Petersstraße GbR | Troisdorf | 2, 7 | Other Enterprise | 62.1 | |||||
546 | Grundstücksgesellschaft Mietwohnhäuser Leipzig-Gohlis GbR | Troisdorf | Other Enterprise | 25.0 | ||||||
547 | Grundstücksgesellschaft München Synagogenplatz GbR | Troisdorf | 2 | Other Enterprise | 26.0 | |||||
548 | Harvest Fund Management Co., Ltd. | Shanghai | Financial Institution | 30.0 | ||||||
549 | Huarong Rongde Asset Management Company Limited | Beijing | Financial Institution | 40.7 | ||||||
550 | ILV Immobilien-Leasing Verwaltungsgesellschaft Düsseldorf mbH | Duesseldorf | 5 | Financial Institution | 50.0 | |||||
551 | Immobilienfonds Büro Center Erfurt am Flughafen Bindersleben III GbR | Chemnitz | 2 | Other Enterprise | 20.7 | |||||
552 | Immobilienfonds Bürohaus Düsseldorf Grafenberg GbR | Troisdorf | 2 | Other Enterprise | 39.0 | |||||
553 | Immobilienfonds Bürohaus Düsseldorf Parsevalstraße GbR | Cologne | 2 | Other Enterprise | 30.5 | |||||
554 | Immobilienfonds Köln-Deutz Arena und Mantelbebauung GbR | Troisdorf | 2 | Other Enterprise | 28.9 | |||||
555 | Immobilienfonds Köln-Ossendorf II GbR | Troisdorf | 2 | Other Enterprise | 40.3 | |||||
556 | Ingrid S.à r.l. | Luxembourg | 5 | Other Enterprise | 23.8 | |||||
557 | iSwap Limited | London | Financial Institution | 14.0 | ||||||
558 | IZI Düsseldorf Informations-Zentrum Immobilien Gesellschaft mit beschränkter Haftung i.L. | Duesseldorf | Financial Institution | 22.9 | ||||||
559 | IZI Düsseldorf Informations-Zentrum Immobilien GmbH & Co. Kommanditgesellschaft i.L. | Duesseldorf | Other Enterprise | 22.9 | ||||||
560 | KVD Singapore Pte. Ltd. | Singapore | Financial Institution | 25.9 | ||||||
561 | Lion Residential Holdings S.à r.l., en liquidation volontaire | Luxembourg | Financial Institution | 17.4 | ||||||
562 | MorgenFund GmbH | Frankfurt | Investment Firm | 30.0 | ||||||
563 | North Coast Wind Energy Corp. | Port Moody | 5 | Other Enterprise | 50.0 | |||||
564 | PERILLA Beteiligungsgesellschaft mbH | Duesseldorf | Financial Institution | 50.0 | ||||||
565 | Prestipay S.p.A. | Udine | 5 | Financial Institution | 40.0 | |||||
566 | REDUS DTHG, LLC | Wilmington | Other Enterprise | 49.9 | ||||||
567 | Relax Holding S.à r.l. | Luxembourg | Other Enterprise | 20.0 | ||||||
568 | SRC Security Research & Consulting GmbH | Bonn | Other Enterprise | 22.5 | ||||||
569 | Starpool Finanz GmbH | Berlin | Other Enterprise | 49.9 | ||||||
570 | Trade Information Network Limited | London | 5 | Other Enterprise | 18.6 |
390 |
Deutsche Bank | ||
Annual Report 2022 | ||
571 | TRAXPAY GmbH | Frankfurt | Other Enterprise | 2.4 | ||||||
572 | Triton Beteiligungs S.à r.l., en liquidation volontaire | Luxembourg | Other Enterprise | 33.1 | ||||||
573 | U.S.A. ITCF XCI L.P. | New York | 7 | Other Enterprise | 99.9 | |||||
574 | UKEM Motoryacht Medici Mangusta GbR | Troisdorf | 6 | Other Enterprise | 0.0 | |||||
575 | Ullmann Krockow Esch GbR | Troisdorf | 6 | Other Enterprise | 0.0 | |||||
576 | Ullmann, Krockow, Esch Luftverkehrsgesellschaft bürgerlichen Rechts | Troisdorf | 6 | Other Enterprise | 0.0 | |||||
577 | Volbroker.com Limited | Rochford | Financial Institution | 22.5 | ||||||
578 | Weser Properties S.à r.l., en faillite clôturée | Luxembourg | Other Enterprise | 25.0 | ||||||
579 | WIS JV LLC | Wilmington | 5 | Other Enterprise | 50.0 | |||||
580 | Wood NewCo S.à r.l., en liquidation volontaire | Luxembourg | 7 | Other Enterprise | 52.1 | |||||
581 | zeitinvest-Service GmbH | Eschborn | Other Enterprise | 25.0 | ||||||
582 | Zhong De Securities Co., Ltd | Beijing | 5 | Financial Institution | 33.3 | |||||
583 | ZYRUS Beteiligungsgesellschaft mbH | Schoenefeld | Financial Institution | 25.0 | ||||||
391 |
Deutsche Bank | ||
Annual Report 2022 | ||
Other companies, where the holding exceeds 20%
Serial | Name of company | Domicile of | Foot- | Nature of activity | Share of | |||||
584 | ABATE Grundstücks-Vermietungsgesellschaft mbH | Duesseldorf | 8 | Financial Institution | 50.0 | |||||
585 | ABRI Beteiligungsgesellschaft mbH | Duesseldorf | 8 | Financial Institution | 50.0 | |||||
586 | ACHTE PAXAS Treuhand- und Beteiligungsgesellschaft mbH | Duesseldorf | 8 | Other Enterprise | 50.0 | |||||
587 | ACHTZEHNTE PAXAS Treuhand- und Beteiligungsgesellschaft mbH | Duesseldorf | 8 | Other Enterprise | 50.0 | |||||
588 | ACIS Beteiligungsgesellschaft mbH | Duesseldorf | 8 | Financial Institution | 50.0 | |||||
589 | ACTIO Grundstücks-Vermietungsgesellschaft mbH | Duesseldorf | 8 | Financial Institution | 50.0 | |||||
590 | ADEO Beteiligungsgesellschaft mbH | Duesseldorf | 8 | Financial Institution | 50.0 | |||||
591 | ADLAT Beteiligungsgesellschaft mbH | Duesseldorf | 8 | Financial Institution | 50.0 | |||||
592 | ADMANU Beteiligungsgesellschaft mbH i.L. | Duesseldorf | 8 | Financial Institution | 50.0 | |||||
593 | AGLOM Beteiligungsgesellschaft mbH i.L. | Duesseldorf | 8 | Financial Institution | 50.0 | |||||
594 | AGUM Beteiligungsgesellschaft mbH | Duesseldorf | 8 | Financial Institution | 50.0 | |||||
595 | ALANUM Beteiligungsgesellschaft mbH | Duesseldorf | 8 | Financial Institution | 50.0 | |||||
596 | ALTA Beteiligungsgesellschaft mbH | Duesseldorf | 8 | Financial Institution | 50.0 | |||||
597 | ANDOT Grundstücks-Vermietungsgesellschaft mbH | Duesseldorf | 8 | Financial Institution | 50.0 | |||||
598 | AVOC Beteiligungsgesellschaft mbH i.L. | Duesseldorf | 8 | Financial Institution | 50.0 | |||||
599 | BAKTU Beteiligungsgesellschaft mbH i.L. | Schoenefeld | 8 | Financial Institution | 50.0 | |||||
600 | Banks Island General Partner Inc. | Toronto | 8 | Financial Institution | 50.0 | |||||
601 | Benefit Trust GmbH | Luetzen | 9, 10 | Financial Institution | 100.0 | |||||
602 | BIMES Beteiligungsgesellschaft mbH i.L. | Schoenefeld | 8 | Financial Institution | 50.0 | |||||
603 | BLI Beteiligungsgesellschaft für Leasinginvestitionen mbH | Duesseldorf | 8 | Financial Institution | 33.2 | |||||
604 | BLI Internationale Beteiligungsgesellschaft mbH i.L. | Duesseldorf | 8 | Financial Institution | 32.0 | |||||
605 | Cedar (Luxembourg) S.à r.l. | Luxembourg | 7, 11 | Financial Institution | 98.2 | |||||
606 | DB Advisors SICAV | Luxembourg | 9, 12 | Other Enterprise | 95.9 | |||||
607 | DB Placement, LLC | Wilmington | 7, 9 | Other Enterprise | 100.0 | |||||
608 | DB RC Investments II, LLC | Wilmington | 7, 9 | Other Enterprise | 99.9 | |||||
609 | DB Real Estate Global Opportunities IB (Offshore), L.P. | Camana Bay | 8 | Financial Institution | 33.6 | |||||
610 | Deutsche River Investment Management Company S.à r.l., en faillite clôturée | Luxembourg | 8 | Financial Institution | 49.0 | |||||
611 | DONARUM Holding GmbH | Duesseldorf | 8 | Financial Institution | 50.0 | |||||
612 | DREIUNDZWANZIGSTE PAXAS Treuhand- und Beteiligungsgesellschaft mbH i.L. | Duesseldorf | 8 | Other Enterprise | 50.0 | |||||
613 | DREIZEHNTE PAXAS Treuhand- und Beteiligungsgesellschaft mbH | Duesseldorf | 8 | Other Enterprise | 50.0 | |||||
614 | DRITTE Fonds-Beteiligungsgesellschaft mbH | Duesseldorf | 8 | Financial Institution | 50.0 | |||||
615 | DRITTE PAXAS Treuhand- und Beteiligungsgesellschaft mbH | Duesseldorf | 8 | Other Enterprise | 50.0 | |||||
616 | DWS Offshore Infrastructure Debt Opportunities Feeder LP | George Town | 8 | Financial Institution | 26.3 | |||||
617 | EINUNDZWANZIGSTE PAXAS Treuhand- und Beteiligungsgesellschaft mbH | Duesseldorf | 8 | Other Enterprise | 50.0 | |||||
618 | Eisler Capital (TA) Ltd | London | 11 | Other Enterprise | 34.7 | |||||
619 | ELC Logistik-Centrum Verwaltungs-GmbH | Erfurt | 8 | Financial Institution | 50.0 | |||||
620 | ELFTE PAXAS Treuhand- und Beteiligungsgesellschaft mbH | Duesseldorf | 8 | Other Enterprise | 50.0 | |||||
621 | FÜNFTE PAXAS Treuhand- und Beteiligungsgesellschaft mbH | Duesseldorf | 8 | Other Enterprise | 50.0 | |||||
622 | FÜNFZEHNTE PAXAS Treuhand- und Beteiligungsgesellschaft mbH | Duesseldorf | 8 | Other Enterprise | 50.0 | |||||
623 | Glor Music Production GmbH & Co. KG | Rottach-Egern | 11 | Other Enterprise | 29.5 | |||||
624 | GLOR Music Production II GmbH & Co. KG | Rottach-Egern | 11 | Other Enterprise | 28.6 | |||||
625 | HR "Simone" GmbH & Co. KG i.I. | Jork | 11 | Other Enterprise | 24.3 | |||||
626 | Immobilien-Vermietungsgesellschaft Schumacher GmbH & Co. Objekt Rolandufer KG i.L. | Berlin | 8 | Financial Institution | 20.5 | |||||
627 | Intermodal Finance I Ltd. | George Town | 8 | Other Enterprise | 49.0 | |||||
628 | Isaac Newton S.A. | Capellen | 7, 9 | Other Enterprise | 98.2 | |||||
629 | Kinneil Leasing Company | London | 8 | Other Enterprise | 35.0 | |||||
630 | KOMPASS 3 Beteiligungsgesellschaft mbH i.L. | Duesseldorf | 8 | Financial Institution | 50.0 | |||||
631 | M Cap Finance Mittelstandsfonds GmbH & Co. KG | Frankfurt | 7, 11, 13 | Financial Institution | 77.1 | |||||
632 | M Cap Finance Mittelstandsfonds III GmbH & Co. KG | Frankfurt | 11 | Financial Institution | 35.7 | |||||
633 | MCT Südafrika 3 GmbH & Co. KG i.I. | Hamburg | 11 | Other Enterprise | 39.0 | |||||
634 | Metro plus Grundstücks-Vermietungsgesellschaft mbH i.L. | Duesseldorf | 8 | Financial Institution | 40.0 | |||||
635 | MT "CAPE BEALE" Tankschiffahrts GmbH & Co. KG i.I. | Hamburg | 11 | Other Enterprise | 34.0 | |||||
636 | MT "KING DANIEL" Tankschiffahrts UG (haftungsbeschränkt) & Co. KG i.L. | Hamburg | 11 | Other Enterprise | 32.8 | |||||
637 | MT "KING DOUGLAS" Tankschiffahrts UG (haftungsbeschränkt) & Co. KG i.L. | Hamburg | 11 | Other Enterprise | 33.0 | |||||
638 | NBG Grundstücks-Vermietungsgesellschaft mbH i.L. | Duesseldorf | 8 | Financial Institution | 50.0 | |||||
639 | NEUNTE PAXAS Treuhand- und Beteiligungsgesellschaft mbH | Duesseldorf | 8 | Other Enterprise | 50.0 | |||||
640 | NEUNZEHNTE PAXAS Treuhand- und Beteiligungsgesellschaft mbH | Duesseldorf | 8 | Other Enterprise | 50.0 |
392 |
Deutsche Bank | ||
Annual Report 2022 | ||
641 | Nexus Infrastruktur Beteiligungsgesellschaft mbH | Duesseldorf | 8 | Financial Institution | 50.0 | |||||
642 | NOFA Grundstücks-Vermietungsgesellschaft mbH | Duesseldorf | 8 | Financial Institution | 50.0 | |||||
643 | OPPENHEIM Buy Out GmbH & Co. KG i.L. | Cologne | 1, 2, 8 | Financial Institution | 27.7 | |||||
644 | PADEM Grundstücks-Vermietungsgesellschaft mbH | Duesseldorf | 8 | Financial Institution | 50.0 | |||||
645 | PALDO Grundstücks-Vermietungsgesellschaft mbH | Duesseldorf | 8 | Financial Institution | 50.0 | |||||
646 | PAXAS Treuhand- und Beteiligungsgesellschaft mbH | Duesseldorf | 8 | Other Enterprise | 50.0 | |||||
647 | PENDIS Grundstücks-Vermietungsgesellschaft mbH | Duesseldorf | 8 | Financial Institution | 50.0 | |||||
648 | PENTUM Beteiligungsgesellschaft mbH | Duesseldorf | 8 | Financial Institution | 50.0 | |||||
649 | PERGUM Grundstücks-Vermietungsgesellschaft mbH i.L. | Duesseldorf | 8 | Financial Institution | 50.0 | |||||
650 | PERLIT Mobilien-Vermietungsgesellschaft mbH | Duesseldorf | 8 | Financial Institution | 50.0 | |||||
651 | PERLU Grundstücks-Vermietungsgesellschaft mbH | Duesseldorf | 8 | Financial Institution | 50.0 | |||||
652 | PERNIO Grundstücks-Vermietungsgesellschaft mbH | Duesseldorf | 8 | Financial Institution | 50.0 | |||||
653 | PERXIS Beteiligungsgesellschaft mbH | Duesseldorf | 8 | Financial Institution | 50.0 | |||||
654 | PETA Grundstücks-Vermietungsgesellschaft mbH | Duesseldorf | 8 | Financial Institution | 50.0 | |||||
655 | PONTUS Grundstücks-Vermietungsgesellschaft mbH | Duesseldorf | 8 | Financial Institution | 50.0 | |||||
656 | PRADUM Beteiligungsgesellschaft mbH | Duesseldorf | 8 | Financial Institution | 50.0 | |||||
657 | PRASEM Beteiligungsgesellschaft mbH | Duesseldorf | 8 | Financial Institution | 50.0 | |||||
658 | PRISON Grundstücks-Vermietungsgesellschaft mbH | Schoenefeld | 8 | Financial Institution | 50.0 | |||||
659 | Private Equity Invest Beteiligungs GmbH | Duesseldorf | 8 | Financial Institution | 50.0 | |||||
660 | Private Equity Life Sciences Beteiligungsgesellschaft mbH | Duesseldorf | 8 | Financial Institution | 50.0 | |||||
661 | PUDU Grundstücks-Vermietungsgesellschaft mbH | Duesseldorf | 8 | Financial Institution | 50.0 | |||||
662 | PURIM Grundstücks-Vermietungsgesellschaft mbH i.L. | Duesseldorf | 8 | Financial Institution | 50.0 | |||||
663 | QUANTIS Grundstücks-Vermietungsgesellschaft mbH | Schoenefeld | 8 | Financial Institution | 50.0 | |||||
664 | QUELLUM Grundstücks-Vermietungsgesellschaft mbH i.L. | Duesseldorf | 8 | Financial Institution | 50.0 | |||||
665 | QUOTAS Grundstücks-Vermietungsgesellschaft mbH | Duesseldorf | 8 | Financial Institution | 50.0 | |||||
666 | SABIS Grundstücks-Vermietungsgesellschaft mbH | Duesseldorf | 8 | Financial Institution | 50.0 | |||||
667 | SALIX Grundstücks-Vermietungsgesellschaft mbH i.L. | Duesseldorf | 8 | Financial Institution | 50.0 | |||||
668 | SALUS Grundstücks-Vermietungsgesellschaft mbH | Duesseldorf | 8 | Financial Institution | 50.0 | |||||
669 | SALUS Grundstücks-Vermietungsgesellschaft mbH & Co. Objekt Dresden KG i.L. | Duesseldorf | 9 | Financial Institution | 58.5 | |||||
670 | SANCTOR Grundstücks-Vermietungsgesellschaft mbH | Duesseldorf | 8 | Financial Institution | 50.0 | |||||
671 | SANDIX Grundstücks-Vermietungsgesellschaft mbH | Duesseldorf | 8 | Financial Institution | 50.0 | |||||
672 | SANO Grundstücks-Vermietungsgesellschaft mbH i.L. | Duesseldorf | 8 | Financial Institution | 50.0 | |||||
673 | SARIO Grundstücks-Vermietungsgesellschaft mbH | Duesseldorf | 8 | Financial Institution | 50.0 | |||||
674 | SATINA Mobilien-Vermietungsgesellschaft mbH i.L. | Duesseldorf | 8 | Financial Institution | 50.0 | |||||
675 | SCANDO Grundstücks-Vermietungsgesellschaft mbH | Duesseldorf | 8 | Financial Institution | 50.0 | |||||
676 | Schumacher Beteiligungsgesellschaft mbH | Duesseldorf | 8 | Financial Institution | 33.2 | |||||
677 | SCITOR Grundstücks-Vermietungsgesellschaft mbH | Duesseldorf | 8 | Financial Institution | 50.0 | |||||
678 | SCITOR Grundstücks-Vermietungsgesellschaft mbH & Co. Objekt Heiligenstadt KG i.L. | Duesseldorf | 9 | Financial Institution | 71.1 | |||||
679 | SECHSTE Fonds-Beteiligungsgesellschaft mbH | Duesseldorf | 8 | Financial Institution | 50.0 | |||||
680 | SECHSTE PAXAS Treuhand- und Beteiligungsgesellschaft mbH | Duesseldorf | 8 | Other Enterprise | 50.0 | |||||
681 | SECHZEHNTE PAXAS Treuhand- und Beteiligungsgesellschaft mbH | Duesseldorf | 8 | Other Enterprise | 50.0 | |||||
682 | SEGES Grundstücks-Vermietungsgesellschaft mbH | Duesseldorf | 8 | Financial Institution | 50.0 | |||||
683 | SEGU Grundstücks-Vermietungsgesellschaft mbH | Duesseldorf | 8 | Financial Institution | 50.0 | |||||
684 | SELEKTA Grundstücksverwaltungsgesellschaft mbH | Duesseldorf | 8 | Financial Institution | 50.0 | |||||
685 | SENA Grundstücks-Vermietungsgesellschaft mbH | Duesseldorf | 8 | Financial Institution | 50.0 | |||||
686 | SENA Grundstücks-Vermietungsgesellschaft mbH & Co. Objekt Kamenz KG | Duesseldorf | 7, 9 | Financial Institution | 100.0 | |||||
687 | SERICA Grundstücks-Vermietungsgesellschaft mbH i.L. | Duesseldorf | 8 | Financial Institution | 50.0 | |||||
688 | SIDA Grundstücks-Vermietungsgesellschaft mbH | Duesseldorf | 8 | Financial Institution | 50.0 | |||||
689 | SIEBTE PAXAS Treuhand- und Beteiligungsgesellschaft mbH | Duesseldorf | 8 | Other Enterprise | 50.0 | |||||
690 | SIEBZEHNTE PAXAS Treuhand- und Beteiligungsgesellschaft mbH | Duesseldorf | 8 | Other Enterprise | 50.0 | |||||
691 | SIFA Grundstücks-Vermietungsgesellschaft mbH | Duesseldorf | 9 | Financial Institution | 100.0 | |||||
692 | SILEX Grundstücks-Vermietungsgesellschaft mbH | Duesseldorf | 8 | Financial Institution | 50.0 | |||||
693 | SILUR Grundstücks-Vermietungsgesellschaft mbH | Duesseldorf | 8 | Financial Institution | 50.0 | |||||
694 | SOLATOR Grundstücks-Vermietungsgesellschaft mbH | Duesseldorf | 8 | Financial Institution | 50.0 | |||||
695 | SOLIDO Grundstücks-Vermietungsgesellschaft mbH i.L. | Duesseldorf | 9 | Other Enterprise | 100.0 | |||||
696 | SOLON Grundstücks-Vermietungsgesellschaft mbH i.L. | Schoenefeld | 8 | Financial Institution | 50.0 | |||||
697 | SOLUM Grundstücks-Vermietungsgesellschaft mbH | Duesseldorf | 8 | Financial Institution | 50.0 | |||||
698 | SOMA Grundstücks-Vermietungsgesellschaft mbH | Duesseldorf | 8 | Financial Institution | 50.0 | |||||
699 | SOREX Grundstücks-Vermietungsgesellschaft mbH | Duesseldorf | 8 | Financial Institution | 50.0 | |||||
700 | SOSPITA Grundstücks-Vermietungsgesellschaft mbH | Duesseldorf | 8 | Financial Institution | 50.0 |
393 |
Deutsche Bank | ||
Annual Report 2022 | ||
701 | SPLENDOR Grundstücks-Vermietungsgesellschaft mbH i.L. | Schoenefeld | 8 | Financial Institution | 50.0 | |||||
702 | STAGIRA Grundstücks-Vermietungsgesellschaft mbH | Duesseldorf | 8 | Financial Institution | 50.0 | |||||
703 | STATOR Heizkraftwerk Frankfurt (Oder) Beteiligungsgesellschaft mbH i.L. | Schoenefeld | 9 | Financial Institution | 100.0 | |||||
704 | SUPERA Grundstücks-Vermietungsgesellschaft mbH | Duesseldorf | 8 | Financial Institution | 50.0 | |||||
705 | SUPLION Beteiligungsgesellschaft mbH | Duesseldorf | 8 | Financial Institution | 50.0 | |||||
706 | SUSA Mobilien-Vermietungsgesellschaft mbH i.L. | Duesseldorf | 8 | Financial Institution | 50.0 | |||||
707 | SUSIK Grundstücks-Vermietungsgesellschaft mbH i.L. | Duesseldorf | 8 | Financial Institution | 50.0 | |||||
708 | TABA Grundstücks-Vermietungsgesellschaft mbH | Schoenefeld | 8 | Financial Institution | 50.0 | |||||
709 | TACET Grundstücks-Vermietungsgesellschaft mbH | Duesseldorf | 8 | Financial Institution | 50.0 | |||||
710 | TAGO Grundstücks-Vermietungsgesellschaft mbH | Duesseldorf | 8 | Financial Institution | 50.0 | |||||
711 | TAGUS Beteiligungsgesellschaft mbH | Duesseldorf | 8 | Financial Institution | 50.0 | |||||
712 | TAKIR Grundstücks-Vermietungsgesellschaft mbH | Duesseldorf | 9 | Financial Institution | 100.0 | |||||
713 | TESATUR Beteiligungsgesellschaft mbH | Duesseldorf | 8 | Financial Institution | 50.0 | |||||
714 | TESATUR Beteiligungsgesellschaft mbH & Co. Objekt Halle I KG i.L. | Duesseldorf | 9 | Financial Institution | 100.0 | |||||
715 | TESATUR Beteiligungsgesellschaft mbH & Co. Objekt Nordhausen I KG i.L. | Duesseldorf | 9 | Financial Institution | 100.0 | |||||
716 | TIEDO Grundstücks-Vermietungsgesellschaft mbH | Duesseldorf | 8 | Financial Institution | 50.0 | |||||
717 | TOSSA Grundstücks-Vermietungsgesellschaft mbH | Duesseldorf | 9 | Financial Institution | 100.0 | |||||
718 | TRAGO Grundstücks-Vermietungsgesellschaft mbH | Duesseldorf | 8 | Financial Institution | 50.0 | |||||
719 | TREMA Grundstücks-Vermietungsgesellschaft mbH | Berlin | 8 | Financial Institution | 50.0 | |||||
720 | TRENTO Grundstücks-Vermietungsgesellschaft mbH | Duesseldorf | 8 | Financial Institution | 50.0 | |||||
721 | TRIPLA Grundstücks-Vermietungsgesellschaft mbH | Duesseldorf | 9 | Financial Institution | 100.0 | |||||
722 | TYRAS Beteiligungsgesellschaft mbH i.L. | Duesseldorf | 8 | Financial Institution | 50.0 | |||||
723 | VIERTE Fonds-Beteiligungsgesellschaft mbH | Duesseldorf | 8 | Financial Institution | 50.0 | |||||
724 | VIERTE PAXAS Treuhand- und Beteiligungsgesellschaft mbH | Duesseldorf | 8 | Other Enterprise | 50.0 | |||||
725 | VIERUNDZWANZIGSTE PAXAS Treuhand- und Beteiligungsgesellschaft mbH | Duesseldorf | 8 | Other Enterprise | 50.0 | |||||
726 | VIERZEHNTE PAXAS Treuhand- und Beteiligungsgesellschaft mbH | Duesseldorf | 8 | Other Enterprise | 50.0 | |||||
727 | XELLUM Grundstücks-Vermietungsgesellschaft mbH | Duesseldorf | 8 | Financial Institution | 50.0 | |||||
728 | XENTIS Grundstücks-Vermietungsgesellschaft mbH | Duesseldorf | 8 | Financial Institution | 50.0 | |||||
729 | XERA Grundstücks-Vermietungsgesellschaft mbH | Duesseldorf | 8 | Financial Institution | 50.0 | |||||
730 | ZABATUS Grundstücks-Vermietungsgesellschaft mbH | Duesseldorf | 8 | Financial Institution | 50.0 | |||||
731 | ZAKATUR Grundstücks-Vermietungsgesellschaft mbH i.L. | Duesseldorf | 8 | Financial Institution | 50.0 | |||||
732 | ZALLUS Beteiligungsgesellschaft mbH i.L. | Duesseldorf | 8 | Financial Institution | 50.0 | |||||
733 | ZARAT Beteiligungsgesellschaft mbH i.L. | Duesseldorf | 8 | Financial Institution | 50.0 | |||||
734 | ZARGUS Grundstücks-Vermietungsgesellschaft mbH | Duesseldorf | 8 | Financial Institution | 50.0 | |||||
735 | ZEA Beteiligungsgesellschaft mbH | Schoenefeld | 8 | Financial Institution | 25.0 | |||||
736 | ZEHNTE PAXAS Treuhand- und Beteiligungsgesellschaft mbH | Duesseldorf | 8 | Other Enterprise | 50.0 | |||||
737 | ZELAS Beteiligungsgesellschaft mbH i.L. | Duesseldorf | 8 | Financial Institution | 50.0 | |||||
738 | ZENO Grundstücks-Vermietungsgesellschaft mbH | Duesseldorf | 8 | Financial Institution | 50.0 | |||||
739 | ZEREVIS Grundstücks-Vermietungsgesellschaft mbH | Duesseldorf | 8 | Financial Institution | 50.0 | |||||
740 | ZERGUM Grundstücks-Vermietungsgesellschaft mbH i.L. | Duesseldorf | 8 | Financial Institution | 50.0 | |||||
741 | ZIDES Grundstücks-Vermietungsgesellschaft mbH | Schoenefeld | 8 | Financial Institution | 50.0 | |||||
742 | ZIMBEL Grundstücks-Vermietungsgesellschaft mbH i.L. | Schoenefeld | 8 | Financial Institution | 50.0 | |||||
743 | ZINUS Grundstücks-Vermietungsgesellschaft mbH i.L. | Schoenefeld | 8 | Financial Institution | 50.0 | |||||
744 | ZIRAS Grundstücks-Vermietungsgesellschaft mbH | Schoenefeld | 8 | Financial Institution | 50.0 | |||||
745 | ZITON Grundstücks-Vermietungsgesellschaft mbH | Duesseldorf | 8 | Financial Institution | 50.0 | |||||
746 | ZITUS Grundstücks-Vermietungsgesellschaft mbH i.L. | Schoenefeld | 8 | Financial Institution | 50.0 | |||||
747 | ZONTUM Grundstücks-Vermietungsgesellschaft mbH | Duesseldorf | 8 | Financial Institution | 50.0 | |||||
748 | ZORUS Grundstücks-Vermietungsgesellschaft mbH i.L. | Duesseldorf | 8 | Financial Institution | 50.0 | |||||
749 | ZURET Beteiligungsgesellschaft mbH i.L. | Duesseldorf | 8 | Financial Institution | 50.0 | |||||
750 | ZWANZIGSTE PAXAS Treuhand- und Beteiligungsgesellschaft mbH | Duesseldorf | 8 | Other Enterprise | 50.0 | |||||
751 | ZWEITE Fonds-Beteiligungsgesellschaft mbH | Duesseldorf | 8 | Financial Institution | 50.0 | |||||
752 | ZWEITE PAXAS Treuhand- und Beteiligungsgesellschaft mbH | Duesseldorf | 8 | Other Enterprise | 50.0 | |||||
753 | ZWEIUNDZWANZIGSTE PAXAS Treuhand- und Beteiligungsgesellschaft mbH i.L. | Duesseldorf | 8 | Other Enterprise | 50.0 | |||||
754 | ZWÖLFTE PAXAS Treuhand- und Beteiligungsgesellschaft mbH | Duesseldorf | 8 | Other Enterprise | 50.0 | |||||
755 | ZYLUM Beteiligungsgesellschaft mbH | Schoenefeld | 8 | Financial Institution | 25.0 | |||||
394 |
Deutsche Bank | ||
Annual Report 2022 | ||
Holdings in large corporations, where the holding exceeds 5% of the voting rights
Serial | Name of company | Domicile of | Foot- | Nature of activity | Share of | |||||
756 | ABRAAJ Holdings (in official liquidation) | Camana Bay | Financial Institution | 8.8 | ||||||
757 | BÜRGSCHAFTSBANK BRANDENBURG GmbH | Potsdam | Financial Institution | 8.5 | ||||||
758 | Bürgschaftsbank Hamburg GmbH | Hamburg | Financial Institution | 8.7 | ||||||
759 | Bürgschaftsbank Mecklenburg-Vorpommern GmbH | Schwerin | Financial Institution | 8.4 | ||||||
760 | Bürgschaftsbank Sachsen GmbH | Dresden | Financial Institution | 6.3 | ||||||
761 | Bürgschaftsbank Sachsen-Anhalt GmbH | Magdeburg | Financial Institution | 8.2 | ||||||
762 | Bürgschaftsbank Schleswig-Holstein Gesellschaft mit beschränkter Haftung | Kiel | Financial Institution | 5.6 | ||||||
763 | Bürgschaftsbank Thüringen GmbH | Erfurt | Financial Institution | 8.7 | ||||||
764 | MTS S.p.A. | Rome | Other Enterprise | 5.0 | ||||||
765 | Prader Bank S.p.A. | Bolzano | Credit Institution | 9.0 | ||||||
766 | Private Export Funding Corporation | Wilmington | Financial Institution | 6.0 | ||||||
767 | Saarländische Investitionskreditbank Aktiengesellschaft | Saarbruecken | Credit Institution | 11.8 | ||||||
768 | Yensai.com Co., Ltd. | Tokyo | Financial Institution | 7.8 | ||||||
395 |
Deutsche Bank | ||
Annual Report 2022 | ||
45 – Impact of Deutsche Bank’s transformation
As of December 31, 2022, the Group has fully recognized all transformation related effects associated with its transformation announced in July 2019. For the full year 2022 transformation related effects amounted to € 126 million, after € 1.5 billion in 2021. Since the start of the transformation phase in 2019, the Group has recognized a total of € 8.5 billion transformation related effects.
As part of the transformation related effects, the Group has recognized transformation charges. For the full year 2022 transformation charges amounted to € 132 million, after € 1.0 billion in 2021. Since the start of the transformation phase in 2019, the Group has recognized a total of € 2.8 billion transformation charges.
46 – Interest rate benchmark reform
The following table shows the notional values of financial instruments, external to the Group, which reference IBORs where it is expected that there will no longer be a requirement to quote IBOR rates. The table includes those financial instruments with a maturity date that extends past the date when the requirement to submit quotes is expected to end. All the positions previously referencing GBP LIBOR, CHF LIBOR, JPY LIBOR, EUR LIBOR, EONIA and those USD LIBOR tenors that ceased in early 2022 have either been transitioned to an alternative reference rate or utilize GBP and JPY synthetic IBOR until the transition arrangements are finalized. Contracts utilizing GBP and JPY synthetic LIBOR as of December 31, 2022 had an immaterial impact to the notional values of the group (December 31, 2021: approximately € 1.15 billion). As a result, the amounts disclosed as of December 31, 2022 only includes USD LIBOR financial instruments, where the maturity date of the financial instruments is after June 30, 2023.
Interest Rate Benchmark (IBOR) Reform
Dec 31, 2022 | ||
in € m. | USD LIBOR | |
Non-Derivative Financial assets | 33,862 | |
Loans | 31,416 | |
Other | 2,445 | |
Derivative Financial assets | 3,062,368 | |
Total financial assets | 3,096,230 | |
Non-Derivative Financial liabilities | 8,666 | |
Bonds | 7,731 | |
Deposits | 728 | |
Other | 207 | |
Derivative Financial liabilities | 2,835,216 | |
Total financial liabilities | 2,843,883 | |
Off-balance sheet | 34,914 | |
Dec 31, 2021 | ||||||||||||||
in € m. | USD LIBOR | GBP LIBOR | CHF LIBOR | JPY LIBOR | EONIA | Other IBORs | Multiple basis² | |||||||
Non-Derivative Financial assets | 64,584 | 5,605 | 182 | 66 | 536 | 469 | - | |||||||
Loans | 62,403 | 5,478 | 182 | 59 | 363 | 469 | - | |||||||
Other | 2,181 | 127 | - | 7 | 173 | - | - | |||||||
Derivative Financial assets 1 | 2,829,421 | 351,302 | 47,065 | 523,527 | 9,042 | 40,503 | 167,050 | |||||||
Total financial assets | 2,894,005 | 356,907 | 47,247 | 523,593 | 9,578 | 40,971 | 167,050 | |||||||
Non-Derivative Financial liabilities | 17,403 | 41 | - | - | 689 | - | - | |||||||
Bonds | 6,561 | - | - | - | - | - | - | |||||||
Deposits | 10,809 | - | - | - | 664 | - | - | |||||||
Other | 32 | 41 | - | - | 25 | - | - | |||||||
Derivative Financial liabilities 1 | 2,669,363 | 321,430 | 45,442 | 502,571 | 7,151 | 38,650 | 144,217 | |||||||
Total financial liabilities | 2,686,766 | 321,471 | 45,442 | 502,571 | 7,840 | 38,650 | 144,217 | |||||||
Off-balance sheet | 73,166 | 498 | 40 | 95 | 1,963 | 33 | - | |||||||
1The Group also has exposure to interest rate benchmark reform in respect of its cash collateral balances across some of its Credit Support Annex agreements. This exposure is not presented in the table due to its short term nature.
2Multiple basis relates to underlying contracts utilizing multiple benchmarks subject to reforms, (e.g. floating- floating interest rate swaps which have cash flows in GBP IBOR and USD IBOR).
396 |
Deutsche Bank | ||
Annual Report 2022 | ||
Confirmations
Independent auditor’s report
To Deutsche Bank Aktiengesellschaft, Frankfurt am Main
Report on the audit of the consolidated financial statements and of the group management report
Opinions
We have audited the consolidated financial statements of Deutsche Bank Aktiengesellschaft, Frankfurt am Main, and its subsidiaries (the group), which comprise the consolidated balance sheet as at 31 December 2022, and the consolidated statement of income, consolidated statement of comprehensive income, consolidated statement of changes in equity and consolidated statement of cash flows for the fiscal year from 1 January 2022 to 31 December 2022, and notes to the consolidated financial statements, including a summary of significant accounting policies. In addition, we have audited the group management report of Deutsche Bank Aktiengesellschaft, Frankfurt am Main, which is combined with the management report of the Bank, for the fiscal year from 1 January 2022 to 31 December 2022. In accordance with the German legal requirements, we have not audited the last paragraph of the section “Risk management principles (chapter risk report)” of the group management report regarding management’s statement on the risk management framework and internal control system, the report on “equal treatment and equal pay” included in the group management report and the content of the combined “Corporate Governance Statement pursuant to Sec. 289f and 315d HGB” which is published on the website stated in the group management report and is part of the group management report.
In our opinion, on the basis of the knowledge obtained in the audit,
- – the accompanying consolidated financial statements comply, in all material respects, with the IFRSs as adopted by the EU, and the additional requirements of German commercial law pursuant to Sec. 315e (1) HGB and, in compliance with these requirements, give a true and fair view of the assets, liabilities and financial position of the group as at 31 December 2022 and of its financial performance for the fiscal year from 1 January 2022 to 31 December 2022, and
- – the accompanying group management report as a whole provides an appropriate view of the group’s position. In all material respects, this group management report is consistent with the consolidated financial statements, complies with German legal requirements and appropriately presents the opportunities and risks of future development. We do not express an opinion on the last paragraph of the section risk management principles (chapter “risk report”) of the group management report regarding management’s statement on the risk management framework and internal control system referred to above, on the report on equal treatment and equal pay referred to above or the content of the combined statement on corporate governance referred to above.
Pursuant to Sec. 322 (3) Sentence 1 HGB, we declare that our audit has not led to any reservations relating to the legal compliance of the consolidated financial statements and of the group management report.
Basis for the opinions
We conducted our audit of the consolidated financial statements and of the group management report in accordance with Sec. 317 HGB and the EU Audit Regulation (No 537/2014, referred to subsequently as "EU Audit Regulation") and in compliance with German Generally Accepted Standards for Financial Statement Audits promulgated by the Institut der Wirtschaftsprüfer [Institute of Public Auditors in Germany] (IDW). Our responsibilities under those requirements and principles are further described in the "Auditor’s responsibilities for the audit of the consolidated financial statements and of the group management report" section of our auditor’s report. We are independent of the group entities in accordance with the requirements of European law and German commercial and professional law, and we have fulfilled our other German professional responsibilities in accordance with these requirements. In addition, in accordance with Art. 10 (2) f) of the EU Audit Regulation, we declare that we have not provided non-audit services prohibited under Art. 5 (1) of the EU Audit Regulation. We believe that the audit evidence we have obtained is sufficient and appropriate to provide a basis for our opinions on the consolidated financial statements and on the group management report.
397 |
Deutsche Bank | ||
Annual Report 2022 | ||
Key audit matters in the audit of the consolidated financial statements
Key audit matters are those matters that, in our professional judgment, were of most significance in our audit of the consolidated financial statements for the fiscal year from 1 January 2022 to 31 December 2022. These matters were addressed in the context of our audit of the consolidated financial statements as a whole, and in forming our opinion thereon; we do not provide a separate opinion on these matters.
Below, we describe what we consider to be the key audit matters:
1. Valuation of level 3 financial instruments and related inputs not quoted in active markets
Reasons why the matter was determined to be a key audit matter
Management uses valuation techniques to establish the fair value of level 3 financial instruments and related inputs not quoted in active markets. The Group held level 3 financial assets and financial liabilities measured at fair value of EUR 26,675 million and EUR 10,815 million as of December 31, 2022. The relevant financial instruments are reported within financial assets and liabilities at fair value through profit or loss, and financial assets at fair value through other comprehensive income.
Financial instruments and related inputs that are not quoted in active markets include structured derivatives valued using complex models; more-complex OTC derivatives; distressed debt; highly-structured bonds; illiquid loans; credit spreads used to determine valuation adjustments (Credit Valuation Adjustment); and other significant inputs which cannot be observed for instruments with longer-dated maturities.
As the valuation of level 3 financial instruments and related inputs not quoted in active markets is based on a high degree on management’s assumptions and judgments due to the complex nature of the valuation techniques and models being utilized and the unobservability of the significant inputs used, this is a key audit matter.
Auditor’s response
We obtained an understanding, evaluated the design and tested the operating effectiveness of the controls over management’s processes to determine fair value of financial instruments and determination of significant unobservable inputs therein. This includes controls relating to independent price verification; independent validation of valuation models, including assessment of model limitations; monitoring of valuation model usage; and calculation of fair value adjustments.
We evaluated the valuation techniques, models and methodologies, and tested the significant inputs used in those models. We performed an independent revaluation of a sample of derivatives and other financial instruments at fair value that are not quoted in active markets, using independent models and inputs. We also independently assessed the reasonableness of a sample of proxy inputs used by comparing to market data sources.
In addition, we evaluated the methodology and inputs used by management in determining fair value adjustments against the requirements of IFRS 13 and performed recalculations for a sample of these valuation adjustments using our own independent data and methodology.
We involved internal financial instruments valuation specialists in the procedures related to valuation models, independent revaluation and fair value adjustments.
Our procedures did not lead to any reservations relating to the valuation of level 3 financial instruments and related inputs not quoted in active markets.
Reference to related disclosures
Information on the valuation techniques, models and methodologies used in the measurement of fair value is provided in notes 1 and 13 of the notes to the consolidated financial statements.
398 |
Deutsche Bank | ||
Annual Report 2022 | ||
2. Inclusion of forward-looking information in the model-based calculation of expected credit losses
Reasons why the matter was determined to be a key audit matter
As of December 30, 2022, the Group recognized an allowance for credit losses of EUR 5,615 million, with EUR 1,426 million relating to stage 1 and stage 2 allowances.
The estimated probabilities of default (PD) used in the model-based calculation of expected credit losses on non-defaulted financial instruments (IFRS 9 stage 1 and stage 2) are based on historical information, combined with current economic developments and forward-looking macroeconomic forecasts (e.g., gross domestic product and unemployment rates). Statistical techniques are used to transform the base scenario for future macroeconomic developments into multiple scenarios. These scenarios are the basis for deriving multi-year PD curves for different rating and counterparty classes, which are used in the calculation of expected credit losses.
Given the economic uncertainties from the war in Ukraine, potential energy shortages in Europe, rising inflationary pressures and related risks to the global economy, the estimation of forward-looking information requires significant judgment. To reflect these uncertainties, management must assess whether to make adjustments to its standard process for inclusion of macroeconomic variables into the expected credit loss model and forecasting methods, either by adjusting the macroeconomic variables or through the inclusion of management overlays.
In view of the significant holdings of non-defaulted financial instruments and the economic uncertainty and significant use of judgment, we consider the inclusion of forward-looking information in the model-based calculation of expected credit losses, and any adjustments thereof, to be a key audit matter.
Auditor’s response
We obtained an understanding of the processes implemented by management, assessed the design of the controls over the selection, determination, monitoring and validation of forward-looking information in respect of the requirements under IFRS 9, and tested their operating effectiveness.
We evaluated management’s review of its expected credit loss model and forecasting methods conducted through the model validation process. Furthermore, we evaluated the methods used to include the selected variables in the baseline scenario and the derivation of the multiple scenarios.
We assessed the baseline macroeconomic forecasts by comparing them with macroeconomic forecasts published by external sources.
We also evaluated the methodology applied by management to determine whether to adjust its standard process for inclusion of macroeconomic variables or to adjust the model results through management overlays. In doing so, we assessed the results of management’s sensitivity analysis and compared the macroeconomic variables used to our own benchmark analysis. We also assessed that the adjustments were included in the calculation of expected credit losses according to management’s methodology.
To assess the inclusion of forward-looking information in the model-based calculation of expected credit losses, we involved internal credit risk modelling specialists to assist us.
Our procedures did not lead to any reservations relating to the inclusion of forward-looking information in the model-based calculation of expected credit losses.
Reference to related disclosures
Information on the inclusion of forward-looking information into the model-based calculation of expected credit losses and their adjustments for stages 1 and 2 is provided in notes 1 and 19 to the notes to the consolidated financial statements.
399 |
Deutsche Bank | ||
Annual Report 2022 | ||
3. Measurement of goodwill for the Asset Management cash-generating unit
Reasons why the matter was determined to be a key audit matter
As of December 31, 2022, the Group reported goodwill of EUR 2,919 million that was exclusively allocated to its Asset Management cash-generating unit (CGU).
For purposes of the impairment test the recoverable amount of the Asset Management CGU is calculated using the discounted cash flow model. In this context, significant assumptions are made regarding the earnings projections, the discount rate and the long-term growth rate. The discount rate is derived using the Capital Asset Pricing Model.
As the measurement of goodwill for the Asset Management CGU is based on a high degree of judgment due to the earnings projections, discount rate and long-term growth rate contained in the discounted cash flow model this is a key audit matter.
Auditor’s response
We obtained an understanding of the process for preparing the earnings projections and calculating the recoverable amount of goodwill for the Asset Management CGU. In this respect, we also obtained an understanding of management’s controls regarding the earnings projections, the discount rate and the long-term growth rate, assessed the design of such controls and tested their operating effectiveness.
We analyzed the significant assumptions described above with a focus on significant changes compared with the prior year. In this regard, we assessed the consistency and reasonableness of the significant assumptions used in the discounted cash flow model by comparing them with external market expectations.
In analyzing the expected future cash flows of the Asset Management CGU, we compared the earnings projections with the prior fiscal year’s projections and with the actual results achieved and evaluated any significant deviations. Furthermore, we assessed the significant valuation parameters used for the estimate of the recoverable amount, such as the discount rate and long- term growth rate, to the extent they are within a range of externally available forecasts.
To assess the above assumptions made in the recoverability of goodwill we involved internal business valuation specialists.
Our procedures did not lead to any reservations relating to the measurement of the goodwill for the Asset Management CGU.
Reference to related disclosures
Information on the measurement of goodwill is provided in notes 1 and 23 of the notes to the consolidated financial statements.
4. Recognition and measurement of deferred tax assets
Reasons why the matter was determined to be a key audit matter
As of 31 December 2022, the Group reported net deferred tax assets of EUR 6,622 million.
The recognition and measurement of deferred tax assets is based on the estimation of the ability to utilize unused tax losses and deductible temporary differences against potential future taxable income. This estimate is based, among others, on assumptions regarding forecasted operating results based upon the approved business plan.
In light of the use of judgment in estimation of future taxable income and the ability to use tax losses, the recognition and measurement of deferred tax assets is a key audit matter.
Auditor’s response
We obtained an understanding of the process to determine whether deductible temporary differences and unused tax losses are identified in different jurisdictions and measured in accordance with the provisions of tax law and rules for accounting for deferred taxes under IAS 12, evaluated the design and tested the operating effectiveness of the related controls.
400 |
Deutsche Bank | ||
Annual Report 2022 | ||
We tested the assumptions used to develop and allocate elements of the approved business plan as a basis for estimating the future taxable income of the relevant group companies and tax groups.
Furthermore, we evaluated the recognition of deferred tax assets by analyzing the key assumptions made in estimating future taxable income. We assessed the estimates made in the forecasted operating results by comparing the underlying key assumptions with historical and prospective data available externally. We compared the historical forecasts with the actual results. In addition, we assessed the estimated tax adjustments and we performed sensitivity analyses on the utilization periods of the respective deferred tax assets.
To assess the assumptions used in the recoverability of the deferred taxes, we involved our tax professionals and internal business valuation specialists.
Our procedures did not lead to any reservations relating to the recognition and measurement of the deferred tax assets.
Reference to related disclosures
Information on the recognition and measurement of deferred tax assets is provided in notes 1 and 34 of the notes to the consolidated financial statements
5. IT Access and Change Management in the financial reporting
Reasons why the matter was determined to be a key audit matter
The accuracy of the Group’s financial reporting is highly dependent on the reliability and the continuity of the used information technology due to the significant number of transactions that are processed daily.
Given the high dependency on reliable and continuing data processing and given the pervasive nature of IT controls on the internal control system, we consider IT Access and Change Management in the Group’s financial reporting as a key audit matter.
Auditor’s response
We assessed the IT control environment including the IT general controls as well as the IT application controls relevant to the Group’s financial reporting. Our procedures also covered the changes during the year on the current IT control environment.
Moreover, we tested the operating effectiveness of prevent and detect IT general controls related to user access management and change management across applications, databases and operating systems. Additionally, we tested IT application controls over automated data processing, data feeds and interfaces. Our audit procedures related to IT access management included, but were not limited to, user access provisioning and removal, privileged user access, periodic access right recertifications, system security settings and user authentication controls.
Our audit procedures related to IT change management included, but were not limited to, evaluating if changes in the production environment were tested and approved prior to implementation and the ability to deploy changes was restricted to authorized users.
To assess the IT Access and Change Management in the Group’s financial reporting process, we involved internal professionals who have particular expertise in the area of IT audits.
Our procedures did not lead to any reservations relating to the IT access and change management in the group’s financial reporting.
Reference to related disclosures
For a general description of internal controls over the financial reporting, we refer to the combined management report in section “Internal Control over Financial Reporting”.
401 |
Deutsche Bank | ||
Annual Report 2022 | ||
Other information
The Supervisory Board is responsible for the Report of the Supervisory Board. The executive directors and the Supervisory Board are responsible for the declaration pursuant to Sec. 161 AktG ["Aktiengesetz": German Stock Corporation Act] on the German Corporate Governance Code, which is part of the combined Corporate Governance Statement as well as for the compensation report pursuant to Sec. 162 AktG. In all other respects, the executive directors are responsible for the other information. The other information comprises
- – the last paragraph of the section risk management principles (chapter “risk report”) of the group management report regarding management’s statement on the risk management framework and internal control system,
- – the report on equal treatment and equal pay included in the group management report,
- – the combined Corporate Governance Statement pursuant to Sec. 289f. and 315d HGB published on the website referred to in the group management report,
and other parts to be included in the annual report, of which we obtained a version prior to issuing this auditor’s report, in particular:
- – Non-financial Report,
- – Responsibility Statement pursuant to Sec. 297 (2) Sentence 4 HGB in conjunction with Sec. 315 (1) Sentence 6 HGB,
- – Section "Deutsche Bank – Financial Summary",
- – Section "Deutsche Bank Group",
- – Compensation Report,
- – Section "Corporate Governance Statement according to Sec. 289f and 315d of the German Commercial Code/Corporate Governance Report " section and
- – Section "Supplementary Information",
but not the consolidated financial statements, not the group management report disclosures whose content is audited and not our auditor’s report thereon.
Our opinions on the annual financial statements and on the group management report do not cover the other information, and consequently we do not express an opinion or any other form of assurance conclusion thereon.
In connection with our audit, our responsibility is to read the other information referred to above and, in so doing, to consider whether the other information
- – is materially inconsistent with the consolidated financial statements, the disclosures in the group management report whose content was audited or our knowledge obtained in the audit, or
- – otherwise appears to be materially misstated.
If, based on the work we have performed, we conclude that there is a material misstatement of this other information, we are required to report that fact. We have nothing to report in this regard.
Responsibilities of the executive directors and the Supervisory Board for the consolidated financial statements and the group management report
The executive directors are responsible for the preparation of the consolidated financial statements that comply, in all material respects, with IFRSs as adopted by the EU and the additional requirements of German commercial law pursuant to Sec. 315e (1) HGB, and that the consolidated financial statements, in compliance with these requirements, give a true and fair view of the assets, liabilities, financial position and financial performance of the group. In addition, the executive directors are responsible for such internal control as they have determined necessary to enable the preparation of consolidated financial statements that are free from material misstatement, whether due to fraud (i.e., fraudulent financial reporting and misappropriation of assets) or error.
In preparing the consolidated financial statements, the executive directors are responsible for assessing the group’s ability to continue as a going concern. They also have the responsibility for disclosing, as applicable, matters related to going concern. In addition, they are responsible for financial reporting based on the going concern basis of accounting unless there is an intention to liquidate the group or to cease operations, or there is no realistic alternative but to do so.
Furthermore, the executive directors are responsible for the preparation of the group management report that, as a whole, provides an appropriate view of the group’s position and is, in all material respects, consistent with the consolidated financial statements, complies with German legal requirements, and appropriately presents the opportunities and risks of future development. In addition, the executive directors are responsible for such arrangements and measures (systems) as they have considered necessary to enable the preparation of a group management report that is in accordance with the applicable German legal requirements, and to be able to provide sufficient appropriate evidence for the assertions in the group management report.
402 |
Deutsche Bank | ||
Annual Report 2022 | ||
The Supervisory Board is responsible for overseeing the group’s financial reporting process for the preparation of the consolidated financial statements and of the group management report.
Auditor’s responsibilities for the audit of the consolidated financial statements and of the group management report
Our objectives are to obtain reasonable assurance about whether the consolidated financial statements as a whole are free from material misstatement, whether due to fraud or error, and whether the group management report as a whole provides an appropriate view of the group’s position and, in all material respects, is consistent with the consolidated financial statements and the knowledge obtained in the audit, complies with the German legal requirements and appropriately presents the opportunities and risks of future development, as well as to issue an auditor’s report that includes our opinions on the consolidated financial statements and on the group management report.
Reasonable assurance is a high level of assurance, but is not a guarantee that an audit conducted in accordance with Sec. 317 HGB and the EU Audit Regulation and in compliance with German Generally Accepted Standards for Financial Statement Audits promulgated by the Institut der Wirtschaftsprüfer (IDW) will always detect a material misstatement. Misstatements can arise from fraud or error and are considered material if, individually or in the aggregate, they could reasonably be expected to influence the economic decisions of users taken on the basis of these consolidated financial statements and this group management report.
We exercise professional judgment and maintain professional skepticism throughout the audit. We also:
- – Identify and assess the risks of material misstatement of the consolidated financial statements and of the group management report, whether due to fraud or error, design and perform audit procedures responsive to those risks, and obtain audit evidence that is sufficient and appropriate to provide a basis for our opinions. The risk of not detecting a material misstatement resulting from fraud is higher than the risk of not detecting a material misstatement resulting from error, as fraud may involve collusion, forgery, intentional omissions, misrepresentations, or the override of internal control.
- – Obtain an understanding of internal control relevant to the audit of the consolidated financial statements and of arrangements and measures (systems) relevant to the audit of the group management report in order to design audit procedures that are appropriate in the circumstances, but not for the purpose of expressing an opinion on the effectiveness of these systems.
- – Evaluate the appropriateness of accounting policies used by the executive directors and the reasonableness of estimates made by the executive directors and related disclosures.
- – Conclude on the appropriateness of the executive directors’ use of the going concern basis of accounting and, based on the audit evidence obtained, whether a material uncertainty exists related to events or conditions that may cast significant doubt on the group’s ability to continue as a going concern. If we conclude that a material uncertainty exists, we are required to draw attention in the auditor’s report to the related disclosures in the consolidated financial statements and in the group management report or, if such disclosures are inadequate, to modify our respective opinions. Our conclusions are based on the audit evidence obtained up to the date of our auditor’s report. However, future events or conditions may cause the group to cease to be able to continue as a going concern.
- – Evaluate the overall presentation, structure and content of the consolidated financial statements, including the disclosures, and whether the consolidated financial statements present the underlying transactions and events in a manner that the consolidated financial statements give a true and fair view of the assets, liabilities, financial position and financial performance of the group in compliance with IFRSs as adopted by the EU and the additional requirements of German commercial law pursuant to Sec. 315e (1) HGB.
- – Obtain sufficient appropriate audit evidence regarding the financial information of the entities or business activities within the group to express opinions on the consolidated financial statements and on the group management report. We are responsible for the direction, supervision and performance of the group audit. We remain solely responsible for our audit opinions.
- – Evaluate the consistency of the group management report with the consolidated financial statements, its conformity with [German] law, and the view of the group’s position it provides.
- – Perform audit procedures on the prospective information presented by the executive directors in the group management report. On the basis of sufficient appropriate audit evidence we evaluate, in particular, the significant assumptions used by the executive directors as a basis for the prospective information, and evaluate the proper derivation of the prospective information from these assumptions. We do not express a separate opinion on the prospective information and on the assumptions used as a basis. There is a substantial unavoidable risk that future events will differ materially from the prospective information.
403 |
Deutsche Bank | ||
Annual Report 2022 | ||
We communicate with those charged with governance regarding, among other matters, the planned scope and timing of the audit and significant audit findings, including any significant deficiencies in internal control that we identify during our audit.
We also provide those charged with governance with a statement that we have complied with the relevant independence requirements, and communicate with them all relationships and other matters that may reasonably be thought to bear on our independence and where applicable, related safeguards.
From the matters communicated with those charged with governance, we determine those matters that were of most significance in the audit of the consolidated financial statements of the current period and are therefore the key audit matters. We describe these matters in our auditor’s report unless law or regulation precludes public disclosure about the matter.
Other legal and regulatory requirements
Report on the assurance on the electronic rendering of the consolidated financial statements and the group management report prepared for publication purposes in accordance with Sec. 317 (3a) HGB
Opinion
We have performed assurance work in accordance with Sec. 317 (3a) HGB to obtain reasonable assurance about whether the rendering of the consolidated financial statements and the group management report (hereinafter the “ESEF documents”) contained in Deutsche_Bank_AG_KA+KLB_ESEF-2022-12-31.zip and prepared for publication purposes complies in all material respects with the requirements of Sec. 328 (1) HGB for the electronic reporting format (“ESEF format”). In accordance with German legal requirements, this assurance work extends only to the conversion of the information contained in the consolidated financial statements and the group management report into the ESEF format and therefore relates neither to the information contained within these renderings nor to any other information contained in the file identified above.
In our opinion, the rendering of the consolidated financial statements and the group management report contained in the file identified above and prepared for publication purposes complies in all material respects with the requirements of Sec. 328 (1) HGB for the electronic reporting format. Beyond this assurance opinion and our audit opinions on the accompanying consolidated financial statements and the accompanying group management report for the fiscal year from 1 January 2022 to 31 December 2022 contained in the “Report on the audit of the consolidated financial statements and of the group management report” above, we do not express any assurance opinion on the information contained within these renderings or on the other information contained in the file identified above.
Basis for the opinion
We conducted our assurance work on the rendering of the consolidated financial statements and the group management report contained in the file identified above in accordance with Sec. 317 (3a) HGB and the IDW Assurance Standard: Assurance on the Electronic Rendering of Financial Statements and Management Reports Prepared for Publication Purposes in Accordance with Sec. 317 (3a) HGB (IDW AsS 410) (06.2022) and the International Standard on Assurance Engagements 3000 (Revised). Our responsibility in accordance therewith is further described in the “Group auditor’s responsibilities for the assurance work on the ESEF documents” section. Our audit firm applies the IDW Standard on Quality Management 1: Requirements for Quality Management in the Audit Firm (IDW QS 1).
Responsibilities of the executive directors and the Supervisory Board for the ESEF documents
The executive directors of the Company are responsible for the preparation of the ESEF documents including the electronic rendering of the consolidated financial statements and the group management report in accordance with Sec. 328 (1) Sentence 4 No. 1 HGB and for the tagging of the consolidated financial statements in accordance with Sec. 328 (1) Sentence 4 No. 2 HGB.
In addition, the executive directors of the Company are responsible for such internal control as they have determined necessary to enable the preparation of ESEF documents that are free from material intentional or unintentional non-compliance with the requirements of Sec. 328 (1) HGB for the electronic reporting format.
The Supervisory Board is responsible for overseeing the process for preparing the ESEF documents as part of the financial reporting process.
404 |
Deutsche Bank | ||
Annual Report 2022 | ||
Group auditor’s responsibilities for the assurance work on the ESEF documents
Our objective is to obtain reasonable assurance about whether the ESEF documents are free from material intentional or unintentional non-compliance with the requirements of Sec. 328 (1) HGB. We exercise professional judgment and maintain professional skepticism throughout the assurance work. We also:
- – Identify and assess the risks of material intentional or unintentional non-compliance with the requirements of Sec. 328 (1) HGB, design and perform assurance procedures responsive to those risks, and obtain assurance evidence that is sufficient and appropriate to provide a basis for our assurance opinion.
- – Obtain an understanding of internal control relevant to the assurance on the ESEF documents in order to design assurance procedures that are appropriate in the circumstances, but not for the purpose of expressing an assurance opinion on the effectiveness of these controls.
- – Evaluate the technical validity of the ESEF documents, i.e., whether the file containing the ESEF documents meets the requirements of Commission Delegated Regulation (EU) 2019/815, in the version in force at the date of the financial statements, on the technical specification for this file.
- – Evaluate whether the ESEF documents enable an XHTML rendering with content equivalent to the audited consolidated financial statements and to the audited group management report.
- – Evaluate whether the tagging of the ESEF documents with Inline XBRL technology (iXBRL) in accordance with the requirements of Arts. 4 and 6 of Commission Delegated Regulation (EU) 2019/815, in the version in force at the date of the financial statements, enables an appropriate and complete machine-readable XBRL copy of the XHTML rendering.
Further information pursuant to Art. 10 of the EU Audit Regulation
We were elected as group auditor by the Annual General Meeting on 19 May 2022. We were engaged by the Supervisory Board on 26 September 2022. We have been the group auditor of Deutsche Bank Aktiengesellschaft uninterrupted since fiscal year 2020.
We declare that the opinions expressed in this auditor’s report are consistent with the additional report to the Audit Committee pursuant to Art. 11 of the EU Audit Regulation (long-form audit report).
Other matters – use of the auditor’s report
Our auditor’s report must always be read together with the audited consolidated financial statements and the audited group management report as well as the assured ESEF documents. The consolidated financial statements and the group management report converted to the ESEF format – including the versions to be published in the Unternehmensregister [German Company Register] – are merely electronic renderings of the audited consolidated financial statements and the audited group management report and do not take their place. In particular, the ESEF report and our assurance opinion contained therein are to be used solely together with the assured ESEF documents made available in electronic form.
German Public Auditor responsible for the engagement
The German Public Auditor responsible for the engagement is Mr. Holger Lösken.
Eschborn/Frankfurt am Main, 13 March 2023
Ernst & Young GmbH
Wirtschaftsprüfungsgesellschaft
Lösken | Mai |
Wirtschaftsprüfer [German Public Auditor] | Wirtschaftsprüfer [German Public Auditor] |
405 |
Deutsche Bank | ||
Annual Report 2022 | ||
Responsibility Statement by the Management Board
To the best of our knowledge, and in accordance with the applicable reporting principles, the consolidated financial statements give a true and fair view of the assets, liabilities, financial position and profit or loss of the Group and the Group management report, which has been combined with the management report for Deutsche Bank AG, includes a fair review of the development and performance of the business and the position of the Group, together with a description of the principal opportunities and risks associated with the expected development of the Group.
Frankfurt am Main, March 9, 2023
|  |  |
Christian Sewing | James von Moltke | Karl von Rohr |
 |  |  |
Fabrizio Campelli | Bernd Leukert | Alexander von zur Mühlen |
 |  |  |
Christiana Riley | Rebecca Short | Stefan Simon |
 | ||
Olivier Vigneron |
406 |
Deutsche Bank | ||
Annual Report 2022 | ||
3-
Compensation Report
| Compensation of the Management Board | |||
| Compensation of members of the Supervisory Board | |||
| Comparative presentation of compensation and earnings trends | |||
| Compensation of the employees (unaudited) | |||
407 |
Deutsche Bank | ||
Annual Report 2022 | ||
Introduction
The Compensation Report for the year 2022 provides detailed information on compensation in Deutsche Bank Group.
Compensation Report for the Management Board and the Supervisory Board
The Compensation Report for the Management Board and the Supervisory Board for the 2022 financial year was prepared jointly by the Management Board and the Supervisory Board of Deutsche Bank Aktiengesellschaft (hereinafter: Deutsche Bank AG or the bank) in accordance with Section 162 of the German Stock Corporation Act. The Compensation Report describes the fundamental features of the compensation systems for Deutsche Bank’s Management Board and Supervisory Board and provides information on the compensation granted and owed by Deutsche Bank in the 2022 financial year to each incumbent or former member of the Management Board and Supervisory Board.
The Compensation Report fulfills the current legal and regulatory requirements, in particular of Section 162 of the German Stock Corporation Act and the Remuneration Ordinance for Institutions (InstitutsVergV) and takes into account the recommendations set out in the German Corporate Governance Code (GCGC). It is also in compliance with the applicable requirements of the accounting rules for capital market-oriented companies (German Commercial Code (HGB), International Financial Reporting Standards (IFRS)) as well as the guidelines issued by the working group Guidelines for Sustainable Management Board Remuneration Systems.
Employee Compensation Report
This part of the compensation report discloses information with regard to the compensation system and structure that applies to the employees in Deutsche Bank Group. The report provides details on the Group Compensation Framework and it outlines the decisions on Variable Compensation for 2022. Furthermore, this part contains quantitative disclosures specific to employees identified as Material Risk Takers (MRTs) in accordance with the Remuneration Ordinance for Institutions (Institutsvergütungsverordnung – InstVV).
408 |
Deutsche Bank | ||
Annual Report 2022 | ||
Compensation of the Management Board
Principles for Management Board Compensation
Responsibility and procedures for setting and reviewing Management Board compensation
The Supervisory Board as a whole is responsible for the decisions on the design of the compensation system as well as for setting the individual compensation amounts and procedures for awarding the compensation. The Compensation Control Committee supports the Supervisory Board in its tasks of designing and monitoring the implementation of the system and prepares proposals for resolutions for the Supervisory Board. As necessary, the Compensation Control Committee issues recommendations for the Supervisory Board to make adjustments to the system. In the case of significant changes, but at least every four years, the compensation system for the Management Board is submitted to the General Meeting for approval in accordance with Section 120a (1) of the German Stock Corporation Act. The compensation system was last approved by the General Meeting 2021 by a majority of 97.76%.
On the basis of the approved compensation system, the Supervisory Board sets the target total compensation for each Management Board member for the respective financial year, while taking into account the scope and complexity of the respective Management Board member’s functional responsibilities, the length of service of the Management Board member on the Management Board as well as the company’s financial situation. In the process, the Supervisory Board also considers the customary market compensation, also based on both horizontal and vertical comparisons, and sets the upper limit for total compensation (maximum compensation) (additional information is provided in the section “Appropriateness of Management Board compensation and compliance with the set maximum compensation”).
Guiding principle: Alignment of Management Board compensation to corporate strategy
Deutsche Bank aims to make a positive contribution to its clients, employees, investors and society in general by fostering economic growth and social progress. Deutsche Bank would like to offer its clients solutions and provide an active contribution to foster the creation of value by its clients. This approach is also intended to ensure that Deutsche Bank is competitive and profitable and can operate on the basis of a strong capital and liquidity position. Deutsche Bank is committed to a corporate culture that appropriately aligns risks and revenues.
Building on a stable and promising foundation with a balanced business model, prudent risk management and a strong balance sheet, Deutsche Bank has outlined its strategy for the Group for the period up to 2025 at the Investor Deep Dive in March 2022 aiming for sustainable profitable growth. The aim is an average annual revenue growth of 3.5 to 4.5%. At the same time, there is a commitment to remain disciplined on costs to free up capacity for investments and improving the operational leverage. The aim is to push the cost/income ratio below 62.5% by 2025 while at the same time generating an attractive return on tangible equity above 10%. The capital distribution objectives are to be achieved through a combination of dividends and share repurchases, with a payout ratio of 50% from 2025 onwards. The bank will continue to focus on conduct and controls and follow a clear management agenda to change the way of working, to become even more innovative and to remain an employer of choice.
In the interests of the shareholders, the Management Board compensation system is aligned to the business strategy as well as the sustainable and long-term development of Deutsche Bank and provides suitable incentives for a consistent achievement of the set targets. Through the composition of total compensation comprising fixed and variable compensation components, through the assessment of performance across short-term and long-term periods and through the consideration of relevant, challenging performance parameters, the implementation of the Group strategy and the alignment with the sustainable and long-term performance of the Group are rewarded in a clear and understandable manner. The structure of the targets and objectives therefore comprises a balanced mix of both financial and non-financial parameters and indicators.
Through the structuring of the compensation system, the members of the Management Board are motivated to achieve the targets and objectives linked to Deutsche Bank’s strategy, to work individually and as a team continually towards the long-term positive development of Deutsche Bank, without taking on disproportionately high risks. The Supervisory Board thus ensures there is always a strong link between compensation and performance in line with shareholder interests (“pay for performance connection”).
409 |
Deutsche Bank | ||
Annual Report 2022 | ||
Compensation principles
The design of the compensation system and thus the assessment of individual compensation amounts are based on the compensation principles outlined below. The Supervisory Board takes them into consideration when adopting its resolutions in this context:
Corporate strategy | The compensation system for the Management Board members is closely linked to Deutsche Bank’s strategy, thereby focusing their work on its implementation and the long-term positive development of the Group, without taking disproportionate risks. | ||
Shareholders’ interests | The interests of shareholders are always taken into account when designing the specific structure of the compensation system, determining individual compensation amounts and structuring the means of compensation allocation and delivery. | ||
Individual and collective objectives | Setting individual, divisional and collective objectives fosters not only the sustainable and long-term development of each of the business divisions, infrastructure areas or regions the Management Board members are responsible for, but also the performance of the Management Board as a collective management body. | ||
Long-term perspective | A long-term link to Deutsche Bank’s performance is secured by setting a greater percentage of long-term objectives in comparison to short-term objectives and by granting variable compensation exclusively in deferred form and mostly as share-based compensation with vesting and holding periods of up to seven years. | ||
Sustainability | Objectives in accordance with Deutsche Bank’s Environmental, Social and Governance (ESG) strategy provide incentives for acting responsibly, also in the context of sustainability, and thus make an important contribution to Deutsche Bank`s long-term performance. | ||
Appropriateness and upper limits (caps) | The appropriateness of the compensation amounts is ensured through the review of the compensation based on a horizontal comparison with peers and a vertical comparison with the workforce as well as suitable compensation caps on the achievable variable compensation and maximum compensation. | ||
Transparency | By avoiding unnecessary complexity in the structures and through clear and understandable reporting, the transparency of the compensation system is increased in accordance with the expectations of investors and the public as well as the regulatory requirements. | ||
Governance | The structuring of the compensation system and the assessment to determine the individual compensation take place within the framework of the statutory and regulatory requirements. | ||
Compensation-related developments in 2022
Development of business and alignment of Management Board compensation to corporate strategy in 2022
Management Board compensation is closely aligned to Deutsche Bank’s strategic targets. All the individual and collective objectives agreed with the Management Board members as well as their assessment parameters for the 2022 financial year were discussed by the Compensation Control Committee at the beginning of the year and subsequently resolved on by the Supervisory Board. The objectives serve overall in fostering the strategic transformation of the Group. The achievement levels determined for the objectives for the 2022 financial year at the beginning of the year 2023 reflect the extent to which the individual objectives were achieved and thus contributed to the Bank’s performance.
Over the past three and a half years Deutsche Bank has managed to transform itself under the management team. By refocusing the business around core strengths, the bank has become significantly more profitable, better balanced and more cost-efficient. Thanks to disciplined execution of the strategy, the bank has been able to support its clients through highly challenging conditions, proving its resilience with strong risk discipline and sound capital management.
Profit before tax amounted to € 5.6 billion at the end of 2022. This is an increase of 65% over the previous year and the highest result for fifteen years. Post-tax return on tangible equity rose to 9.4%. Revenues increased by 7% to € 27.2 billion on the back of increased client business. At the same time, Deutsche Bank has further reduced costs by 5% to € 20.4 billion. The cost/income ratio fell from 85 to 75% for the full year.
Reflecting the profitability of all business segments in 2022, the Corporate Bank and the Private Bank were the most important growth drivers with revenue increases of 23% and 11% respectively. Both divisions also achieved record profits. Corporate Bank net revenues were € 6.3 billion in 2022, up 23% year on year, with 39% growth in net interest income and 7% growth in commission and fee income. Private Bank net revenues were € 9.2 billion, up 11% year on year. The Investment Bank's continued success in Fixed Income and Currencies more than compensated for the slowdown in Origination & Advisory last year, and revenues increased by 4%. In Asset Management, revenues fell by 4% to € 2.6 billion, less sharply than in almost all major markets.
410 |
Deutsche Bank | ||
Annual Report 2022 | ||
The 2022 results demonstrate the benefits of Deutsche Bank’s transformation efforts. The bank delivered revenue growth in its core businesses and continued cost reductions. The risk provisions are in line with guidance, despite challenging conditions. Focused de-risking of the balance sheet has contributed to the solid capital ratio and the completion of the Capital Release Unit’s journey marks a major milestone in its transformation execution.
The individual objectives are bundled in the short-term component (Short-Term Award (STA)) and account for a share of 40% of the target total variable compensation. The Supervisory Board determined an achievement level for these components for the 2022 financial year of between 105.69% and 127.54%. The performance of the Management Board as a collective body is reflected in the long-term component (Long-Term Award (LTA)), which accounts for a share of 60% of the target total variable compensation. Overall, the achievement level of the collective objectives based solely on the 2022 financial year was 86.29%. This achievement level accounts for 60% of the Long-Term Award to be granted for the 2022 financial year. 30% will be for the 2023 financial year and 10% for the 2024 financial year. As achievement levels for prior years (at 30% from 2021 and 10% from 2020) also affected the Long-Term Award for the 2022 financial year, the achievement level of this component for the 2022 financial year was 79.60% based on the weighted achievement levels of the three financial years. Details on the individual achievement levels are presented as an overview in this report under the heading “Application of the compensation system in the financial year”.
Management Board Changes and Compensation Decisions in 2022
Stuart Lewis resigned as member of the Management Board and Chief Risk Officer with effect from the day of the General Meeting on May 19, 2022. The appointment of his successor, Olivier Vigneron, took place with effect from May 20, 2022. Olivier Vigneron initially worked for Deutsche Bank as Senior Group Director (Generalbevollmächtigter), starting as of March 1, 2022. As a result, a smooth transition of tasks and responsibilities of the Chief Risk Officer could be ensured.
The Management Board comprised 10 members throughout 2022 with a proportion of women of 20%.
The Supervisory Board reviews the compensation levels of the members of the Management Board annually and regularly engages external compensation advisors to support the review, while assuring that these advisors are independent from the Management Board and Deutsche Bank. In 2022, the Supervisory Board conducted a review of the compensation levels taking into account comparable companies (peer groups) with the support of the external compensation advisor. On the basis of the results of this review and taking into account other aspects such as the duration of membership in the Management Board or changes in the area of responsibility within the Management Board, the Supervisory Board has taken the following compensation decisions in 2022:
The overall target compensation for Olivier Vigneron in his capacity as member of the Management Board and Chief Risk Officer was set at the level of compensation of other Management Board members with responsibly for an infrastructure area or a region. This corresponds to a target value of € 6.5 million p.a. The total target compensation is therefore 7.14% below the total target compensation of his predecessor.
In March 2022, James von Moltke was appointed ´President´ of Deutsche Bank AG in addition to his duties as Chief Financial Officer (CFO). This appointment leads to an extension in his area of responsibility within the Management Board and additional tasks. Taking into account the extended area of responsibility and his senior membership in the Management Board already in the sixth year, the Supervisory Board decided to increase his total target compensation by € 400k p.a. to € 7.4 million p.a. with effect from 1 July 2022. This represents an increase of 5.71%.
Fabrizio Campelli successfully took over responsibility for the Corporate Bank and the Investment Bank from Christian Sewing on 1 May 2021 in a smooth takeover. The review of the compensation levels by the external compensation advisor showed that his positioning within the two peer groups of the International and European Banks with an overall target compensation of € 6.5 million p.a. is lower compared to the positioning of the other Management Board members. In addition, his appointment as a member of the Management Board was extended for a further three years. For these reasons, the Supervisory Board decided to increase the total target compensation to € 7 million p.a. which represents an increase of 7.69%. The increase took effect at the same time as the extension of his appointment with effect from 1 November 2022.
In 2022 the Management Board acknowledged that the use of non-authorized communication channels among staff represents a cultural shortcoming at Deutsche Bank. Therefore, the Management Board wanted so set a cultural signal and proposed to the Supervisory Board that, as part of performance management, this should have an impact on individual compensation. Thus, all Management Board members active on 31 December 2021 agreed to reduce variable compensation for the financial year 2021 by each EUR 75,000. The reduction will be achieved through the reduction of the Restricted Incentive Awards due on 1 March 2023 in the amount above.
411 |
Deutsche Bank | ||
Annual Report 2022 | ||
When determining the variable compensation for the financial year 2022, the Supervisory Board took positive account of the financial milestones achieved and the contributions of the individual members of the Management Board to this success in their performance evaluation. In addition, the Management Board has continued its remediation activities with strong commitment and with various measures taken to meet the high expectations of the regulators; however, despite recent progress, the Supervisory Board believes that the overall extended timeline on which the remediation has taken place and the re-planning and/or missed milestones in certain areas need to be recognized in the Management Board's compensation. For this reason, the Supervisory Board, acting on a proposal from the Compensation Control Committee, reduced the individual achievement level with regards to the Short-Term Award calculated on the basis of the individual performances by 5% for all members of the Management Board active in the financial year. Details on how to calculate the Short-Term Award are presented in this report under the heading “Application of the compensation system in the financial year”.
Approval of the Compensation Report 2021 by the Annual General Meeting 2022
The Compensation Report 2021 for members of the Management Board and Supervisory Board of Deutsche Bank as published on March 11, 2022, was submitted to the ordinary General Meeting on May 19, 2022, for approval in accordance with Section 120a (4) of the German Stock Corporation Act. The General Meeting approved the Compensation Report with a majority of 88.03%.
Improvements compared to the Compensation Report 2021
While last year’s Compensation Report was in principle well received by shareholders, we constantly strive to improve the quality of the Group’s reporting. In the interests of our shareholders, the bank provides more information this year and thus increases transparency by
- – Providing further comprehensive rationale for decisions on changes related to Management Board compensation
- – Enhancing information on individual objectives including the overall achievement levels for each Management Board member
- – Disclosing Balanced Scorecard Key Performance Indicators (KPIs) for the Chief Executive Officer (CEO) and the Chief Financial Officer (CFO) including overall achievement levels
- – Introducing summaries of the performance assessment for the CEO and CFO for the Short-Term Award (STA) components of the individual objectives and the annual priorities
- – Extending the Long-Term Award (LTA) table for the Group Component to include target/actual values and achievement levels
- – Providing a detailed overview of the 3-year assessment period showing the individual achievement grades to evaluate the overall achievement level for each LTA component
- – Providing an outlook on objectives to be set for 2023, including improvements on the compensation structures for the Management Board with effect from 2023
412 |
Deutsche Bank | ||
Annual Report 2022 | ||
Principles governing the determination of compensation
Structure of the Management Board compensation system
The compensation system consists of fixed and variable compensation components. The fixed compensation and variable compensation together form the total compensation for a Management Board member. The Supervisory Board defines target and maximum amounts (caps) for all compensation components.
Management Board Compensation System 2022
Components | Objective | Implementation | ||||
Fixed Compensation | ||||||
Base salary | The base salary rewards the Management Board member for performing the respective role and responsibilities. The fixed compensation is intended to ensure a fair and market-oriented income and to ensure that undue risks are avoided. In addition, Management Board members are granted recurrent, fringe benefits and contributions for pension benefits. | - | Monthly payment; Annual base salary of between € 2.4 million and € 3.6 million | |||
Fringe benefits | - | Company car and driver services as well, if applicable moving expenses, housing allowance, insurance premiums and reimbursement of business representation expenses | ||||
Pension | - | A single and contractually agreed annually pension plan contribution or allowance of € 650,000 for adequate pension provision | ||||
Variable Compensation | ||||||
Short Term Award (STA) | The STA rewards the individual value contribution of each member of the Management Board to achieving short- and medium-term objectives in accordance with the corporate strategy. It consists of three elements, which are tailored to the role and responsibilities of the Management Board member and can be individually influenced by the level of achievement by the Management Board member. | - | 40% of the total variable compensation with 3 elements related to individual performance | |||
- | Maximum target level 150% | |||||
- | Assessment period 1 year | |||||
- | Earliest possible disbursement in 4 tranches in Restricted Incentive Awards (cash-based) - 1, 3, 5 and 7 years after being granted | |||||
- | Target amount for 100% achievement level: Between € 1.640 million and € 2.160 million | |||||
Long Term Award (LTA) | Within the determination of the variable compensation, the focus is on achieving long-term objectives linked to the strategy. To underline this, the Supervisory Board has set the focus on this component with a share of the LTA of 60% of the total variable target compensation. For the LTA, the Supervisory Board sets collective objectives for the members of the Management Board. An important part of the LTA is the ESG factor. Since its implementation in 2021 and further development, Deutsche Bank’s sustainability strategy has been systematically linked to the Management Board compensation | - | 60% of total variable compensation with 4 group targets | |||
- | Maximum target level 150% | |||||
- | Assessment period of 3 years with weightings of 60% (Financial Year (FY)), 30% (FY+1), 10% (FY+2) | |||||
- | Disbursement in 4 tranches exclusively in Restricted Equity Awards (share-based) – earliest possible delivery after 2, 3, 4, 5 years plus a holding period in each case of 1 year after grant | |||||
- | Target amount for 100% Achievement level: Between € 2.460 million and € 3.240 million | |||||
413 |
Deutsche Bank | ||
Annual Report 2022 | ||
Overview

Detailed information on the compensation system for members of the Management Board of Deutsche Bank AG is available on the company’s website: Compensation system for the Management Board Members from January 2021 onwards.
Composition of the target total compensation and maximum compensation
The Supervisory Board determines for each Management Board member a target (reference) total compensation on the basis of the compensation system approved by the General Meeting. It also determines, in accordance with the recommendation of the German Corporate Governance Code, what relative proportions the fixed compensation on the one hand and short-term and long-term variable compensation on the other hand have in the target total compensation. In this context, the Supervisory Board ensures in particular that the variable compensation linked to achieving long-term objectives exceeds the portion of variable compensation linked to short-term objectives.
When setting the target total compensation for each member of the Management Board, the Supervisory Board takes into account the scope and complexity of the respective Management Board member’s functional responsibility as well as the experience and length of service of the member on the Management Board. Furthermore, the compensation amounts are reviewed for their appropriateness on the basis of market data for suitable peer groups. On the basis of these criteria, the Supervisory Board set the relative percentages for the compensation components within the target total compensation as follows:
Relative shares of the total annual target compensation allocated to the different compensation components (%)
Compensation components | Relative share of total compensation in % | |
Base Salary | ~ 33-37% | |
Regular fringe benefits | ~ 1% | |
Pension service costs / pension allowance | ~ 7-9% | |
Short-Term Award | ~ 22-23% | |
Long-Term Award | ~ 33-34% | |
Reference total compensation | 100% | |
The compensation of the Management Board members is limited (capped) in several ways (maximum compensation).
Pursuant to Section 25a (5) of the German Banking Act (Kreditwesengesetz – KWG), the ratio of fixed to variable compensation is generally limited to 1:1 (cap regulation), i.e. the amount of variable compensation must not exceed that of fixed compensation, unless the shareholders of a bank resolve to increase the ratio of fixed to variable compensation to up to 1:2. The General Meeting in May 2014 made use of this possibility and increased the ratio to 1:2.
414 |
Deutsche Bank | ||
Annual Report 2022 | ||
The Supervisory Board additionally limited the maximum possible achievement levels for the short-term objectives (STA) and long-term objectives (LTA) consistently to 150% of the target variable compensation. Furthermore, it specified an additional amount limit (cap) for the aggregate amount of base salary, STA and LTA of € 9.85 million. This means that even with target achievement levels that would lead to higher compensation amounts, compensation is capped at a maximum of € 9.85 million. After the target achievement level is assessed, if the calculation should result in variable compensation or total compensation that exceeds one of the specified caps, the variable compensation is to be reduced. This is to take place through a pro rata reduction of the STA and LTA.
Target and maximum amounts of base salary and variable compensation
2022 | 2021 | |||||||||
in € | Base | Short-Term | Long-Term | Total | Total | |||||
CEO | ||||||||||
Target value | 3,600,000 | 2,160,000 | 3,240,000 | 9,000,000 | 9,000,000 | |||||
Maximum value | 3,600,000 | 3,240,000 | 4,860,000 | 9,850,000 | 9,850,000 | |||||
Presidents2, 3 | ||||||||||
Target value | 3,000,000 | 1,760,000 | 2,640,000 | 7,400,000 | 7,400,000 | |||||
Maximum value | 3,000,000 | 2,640,000 | 3,960,000 | 9,600,000 | 9,600,000 | |||||
Ordinary Board Member responsible for Corporate Bank and Investment Bank (CB & IB)3 | ||||||||||
Target value | 2,800,000 | 1,680,000 | 2,520,000 | 7,000,000 | 6,500,000 | |||||
Maximum value | 2,800,000 | 2,520,000 | 3,780,000 | 9,100,000 | 8,550,000 | |||||
All other Ordinary Board Members3 | ||||||||||
Target value | 2,400,000 | 1,640,000 | 2,460,000 | 6,500,000 | 6,500,000 | |||||
Maximum value | 2,400,000 | 2,460,000 | 3,690,000 | 8,550,000 | 8,550,000 | |||||
1 Limit the maximum total amount of basic salary and variable compensation to the upper limit set by the Supervisory Board.
2 Presidents and Ordinary Board members responsible for Private Bank (PB)/ Asset Management (AM) and Finance (CFO).
3 For further details on compensation decision, please refer to chapter "Management Board Changes and Compensation Decisions in 2022" in this report.

In addition, in accordance with Section 87a (1) sentence 2 No. 1 of the German Stock Corporation Act, the Supervisory Board also set an upper limit for the maximum total compensation of € 12 million for each Management Board member (Maximum Compensation). The Maximum Compensation is set consistently for all Management Board members. The Maximum Compensation corresponds to the sum of all compensation components for any financial year. This comprises not only the base salary, STA and LTA, but also the fringe benefits and service costs for the company pension plan or pension allowances.

415 |
Deutsche Bank | ||
Annual Report 2022 | ||
Application of the compensation system in the financial year
Fixed compensation
The fixed compensation components in the form of base salary, fringe benefits and contributions to the pension plan or pension allowances were granted in the financial year as fixed compensation and in accordance with the individual agreements in the service contracts. Due to the requirements of Section 25a (5) of the German Banking Act and in accordance with the decision of the Annual General Meeting in May 2014, the ratio of fixed to variable compensation is generally limited to 1:2 (cap rule). Therefore, when determining the amount of base salary as part of the target compensation, it must be taken into account that the variable compensation may not exceed the maximum value of 200% of the fixed compensation.
The expenses for fringe benefits and pension service costs vary in their annual amounts. Although the contribution to Deutsche Bank’s pension plan is defined consistently for all Management Board members, the amounts to be contributed by Deutsche Bank during the year in the form of pension service cost accruals vary, however, based on the length of service on the Management Board within the financial year, the age of the Management Board member and actuarial figures (additional information is provided in the section “Benefits upon regular contract termination”).
Variable compensation
The Supervisory Board, based on the proposal of the Compensation Control Committee, determined the variable compensation for the Management Board members for the 2022 financial year. Variable compensation comprises two components, a short-term component (Short-Term Award (STA)) with a weighting of 40% and a long-term component (Long-Term Award (LTA)) with a weighting of 60% in relation to the target variable compensation.
All objectives, measurements and assessment criteria that were used for the assessment of performance for the 2022 financial year are derived from Deutsche Bank’s strategy and are in line with the compensation system approved by the General Meeting. The objectives were selected to set suitable incentives for the Management Board members, to promote the development of Deutsche Bank’s earnings and the alignment to the interests of shareholders as well as to fulfill Deutsche Bank’s social responsibility through the inclusion of sustainability aspects and climate protection. The challenging objectives reflect the Bank’s ambitions. If the objectives are not achieved, the variable compensation can be zero; in the case of over-achievement, the maximum achievement level is limited to 150% of the target value.
Balance of financial and non-financial objectives
Financial and non-financial objectives are considered in a balanced way when setting the objectives. In relation to the total variable compensation, there was a greater focus on financial objectives in the 2022 financial year, with a weighting of around 68%. Both the financial and non-financial objectives were chosen in such a way that they are quantitatively or qualitatively measurable at the end of the financial year. Around 75% of the targets are quantitatively measurable and a portion of around 25% is measured qualitatively.
Short-Term Award (STA)
The amount of the Short-Term Award for the 2022 financial year is based on the achievement level during the assessment period of the short-term individual and divisional objectives. The assessment period coincides with the financial year and is one year.
The Short-Term Award comprises the following three elements with different weightings:
- – Individual Objectives (50%)
- – Individual Balanced Scorecards (25%)
- – Annual Priorities (25%)
For each of these components, the Supervisory Board determines the achievement level based on a clearly structured year-end assessment process at the beginning of the following year. The achievement of the three components determines the overall achievement level for each Management Board member which in turn determines the amount of the short-term component for the preceding financial year.
416 |
Deutsche Bank | ||
Annual Report 2022 | ||
Determination of the cash value of the Short-Term Award
Short-Term Award (40%) | ||||||
Individual Objectives (50%) | Balanced Scorecard (25%) | Annual Priorities (25%) | ||||
Target Amount1 | 820,000 - 1,080,000 | 410,000 - 540,000 | 410,000 - 540,000 | |||
Target Achievement Level | 0% - 150% | 0% - 150% | 0% - 150% | |||
Overall Target Amount per STA component | 0 - 1,620,000 | 0 - 810,000 | 0 - 810,000 | |||
Overall Target Amount STA | 0 - 3,240,000 | |||||
1 Target amount differs depending on the Management Board member’s functional responsibility. On the basis of 100%. Pro rata temporis upon joining or leaving during the year.
Individual objectives
The Supervisory Board sets personal and divisional objectives (Individual Objectives) for each member of the Management Board at the beginning of the year. The weightings of each of these objectives as well as relevant quantitatively or qualitatively measurable performance criteria for their assessment are defined as well. The objectives are chosen so that they are challenging, ambitious and sufficiently concrete in order to ensure there is an appropriate alignment of performance and compensation and that the “pay-for-performance” principle is taken into account.
The Individual Objectives are derived from the corporate strategy and foster its implementation. They are set for each Management Board member in consideration of her or his respective area of functional responsibility and the contribution of this area of functional responsibility to advancing Deutsche Bank’s overall strategy. ESG objectives such as the further development of the sustainability strategy or the promotion of measures to improve regulatory remediation are also included as individual objectives. Individual Objectives can also be defined as project or regional targets. Besides operational measures, the implementation of strategic projects and initiatives can be agreed as objectives as well, if they are directly instrumental in the implementation of the strategy, by contributing to, for example, the structure, organization and sustainable development of Deutsche Bank.
At the beginning of the 2022 financial year, between 4 and 7 Individual Objectives were set with different weightings for each Management Board member. For these objectives, the Supervisory Board has assigned clear expectations and financial and/or non-financial performance criteria at the beginning of the year, such as financial Key Performance Indicators (KPIs), achievements of milestones, Chief Executive Officer (CEO) and/or Supervisory Board feedback, stakeholder Feedback and qualitative assessments. These enable the Supervisory Board to objectively assess the performance contribution of the respective Management Board member towards the concrete execution of the objectives.
At year-end, the determination of the achievement levels follows a pre-defined process. In a first step, all members of the Management Board perform an initial self-assessment of the achievement levels of their objectives. The self-assessed achievement levels are then discussed in conversations with the Chief Executive Officer (CEO) and the Chairman of the Compensation Control Committee. Based on the feedback from these conversations, the Compensation Control Committee prepares a proposal for the Supervisory Board for its decision. For this purpose the achievement levels are combined into an average for each Management Board member according to pre-defined weightings.
The following overview shows the objectives as well as the achievement levels as resolved on by the Supervisory Board for each Management Board member.
417 |
Deutsche Bank | ||
Annual Report 2022 | ||
Management Board Member | Weighting | Individual objectives | Achievement | |||
Christian Sewing | 25% | Further develop Deutsche Bank´s long-term vision & positioning | 131.50% | |||
20% | Deliver on Deutsche Bank Group short-term strategy execution and milestones | |||||
15% | Further evolve Deutsche Bank culture | |||||
15% | Provide oversight to Human Resources transformation including Real Estate | |||||
15% | Further develop Bank-wide ESG & Sustainable Banking Strategy | |||||
10% | Strengthen positioning with key political stakeholders | |||||
James von Moltke | 30% | Ensure execution of Group financial plan through Group Performance Management | 126.75% | |||
15% | Drive development of new strategy | |||||
15% | Drive investor and Rating Agencies engagement | |||||
10% | Deliver Balance Sheet & Liquidity Optimization | |||||
10% | Deliver Liquidity Remediation Program | |||||
10% | Execute Group Finance strategy, incl. Financial & Analytics enhancement | |||||
10% | Support CEO in further evolution of DB culture, with a focus on integrity and conduct. | |||||
Karl von Rohr | 30% | Deliver on strategy execution for the division Private Bank incl. efficiency, growth and sustainable profitability | 131.75% | |||
10% | Support CEO in developing new strategy and achieving Group financial targets | |||||
15% | Ensure delivery on critical remediation activities within the area of financial crime | |||||
20% | Support DWS strategy through oversight role | |||||
15% | Provide oversight for Regions Germany & EMEA | |||||
10% | Support CEO in further evolution of DB culture, with a focus on integrity and conduct | |||||
Fabrizio Campelli | 30% | Deliver on strategy execution and sustainable profitability for the divisions Corporate Bank and Investment Bank | 130.00% | |||
20% | Improve controls and demonstrate their effectiveness to regulators for Corporate Bank and Investment Bank | |||||
20% | Drive development of new strategy for Corporate Bank and Investment Bank | |||||
10% | Drive stronger F2B alignment for Corporate Bank and Investment Bank | |||||
10% | Provide oversight to Region UK and Ireland | |||||
10% | Support CEO in further evolution of DB culture, with a focus on integrity and conduct | |||||
Bernd Leukert | 35% | Execute strategy for the division Technology, Data & Innovation (TDI) and evolve TDI priorities in line with the 25 strategy | 122.00% | |||
20% | Technology: Continue improvement of estate | |||||
20% | Data: Drive quality enhancements | |||||
15% | Innovation: Drive client-centric technology approach across DB | |||||
10% | Support CEO in further evolution of DB culture, with a focus on integrity and conduct | |||||
Alexander von zur Mühlen | 40% | Execute and evolve APAC strategy in line with the 2025 strategy | 123.50% | |||
30% | Strengthen APAC franchise and client focus | |||||
20% | Foster control culture and deliver on critical remediation activities within the area of financial crime for the APAC region | |||||
10% | Support CEO in further evolution of DB culture, with a focus on integrity and conduct | |||||
Christiana Riley | 40% | US regulatory remediation and engagement including delivery on critical remediation activities within the area of financial crime for the Americas and 2022 Comprehensive Capital Analysis and Review (CCAR) | 119.00% | |||
30% | Execute and evolve America's strategy in line with the 2025 strategy | |||||
20% | Strengthen client engagement | |||||
10% | Support CEO in further evolution of DB culture, with a focus on integrity and conduct | |||||
418 |
Deutsche Bank | ||
Annual Report 2022 | ||
Rebecca Short | 25% | Execute transformation agenda | 120.00% | |||
20% | Drive CRU reductions | |||||
20% | Drive global cost reduction | |||||
15% | Drive Procurement excellence | |||||
10% | Support development of new strategy and financial aspiration | |||||
10% | Support CEO in further evolution of DB culture, with a focus on integrity and conduct | |||||
Professor Dr. Stefan Simon | 40% | Drive delivery on critical remediation activities within the area of financial crime | 122.50% | |||
15% | Drive strategic engagement with regulatory authorities | |||||
15% | Further drive down bank-wide litigation portfolio | |||||
10% | Drive build out and operationalize CAO Controls Framework | |||||
10% | Drive overhaul of CAO policy setting and implementation | |||||
10% | Support CEO in further evolution of Deutsche Bank culture, with a focus on integrity and conduct | |||||
Olivier Vigneron | 50% | Foster a strong risk-return culture and continue to strengthen the risk organization | 105.00% | |||
(Member since | 20% | Strengthen Non-Financial Risk Management | ||||
May 20, 2022) | 20% | Further address regulatory and internal audit findings | ||||
10% | Support CEO in further evolution of DB culture, with a focus on integrity and conduct | |||||
Stuart Lewis | 25% | Foster a strong risk-return culture throughout the organization | 121.25% | |||
(Member until | 20% | Handover to successor | ||||
May 19, 2022) | 20% | Further address regulatory and internal audit findings | ||||
15% | Continue to develop and strengthen the risk organization | |||||
10% | Vendor Management remediation | |||||
10% | Support CEO in further evolution of DB culture, with a focus on integrity and conduct | |||||
For the qualitative objectives, the Supervisory Board has formulated expectations and financial and/or non-financial performance criteria at the beginning of the year, which enable it to objectively assess the performance contribution of the respective Management Board members with regard to the concrete implementation of an objective for the performance year at the beginning of the following year. The degrees of achievement thus determined for the individual objectives are consolidated into an average for each Management Board member according to the weightings defined in advance. The degree of target achievement determined accordingly is multiplied by the target amount of 50% of the variable target remuneration of the STA. This results in the calculated payout amount for the component of the individual objectives.
419 |
Deutsche Bank | ||
Annual Report 2022 | ||
Pay-for-performance summary for CEO and CFO for the STA Individual objectives

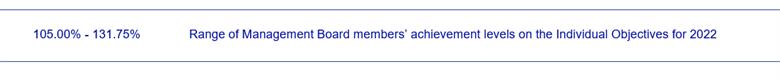
Individual Balanced Scorecard
Balanced Scorecards make it possible to have an overview of key performance indicators and transform strategic objectives into operating practices through concrete actions and consequent cascading into the organization. With the Balanced Scorecards, the Bank has an appropriate tool for the steering and control of key performance indicators that can be used to check the achievement level of financial and non-financial objectives against pre-defined measurement parameters at any time and to measure them transparently for the performance year at the beginning of the following year. At the same time, the Balanced Scorecards provide an overview of the priorities of the individual divisions across the entire Group.
Based on the functional responsibilities according to the Business Allocation Plan for the Management Board, each Management Board member is assigned at least one individual Balanced Scorecard and a maximum of 4 Balanced Scorecards. If more than one Balanced Scorecard is assigned to a Management Board member, these are weighted to each other based on the size of the activities. Four Management Board members have more than one Balanced Scorecard due to their multiple functional and/or divisional responsibilities. The table below shows the number of Balanced Scorecards and their respective weightings.
420 |
Deutsche Bank | ||
Annual Report 2022 | ||
Balanced Scorecards for Management Board Members in 2022
Management Board Member | Weightings | Balanced Scorecard | ||
Christian Sewing | 60% | Group / Chairman | ||
40% | Human Resources / Corporate Real Estate | |||
James von Moltke | 100% | Chief Financial Office | ||
Karl von Rohr | 40% | Private Bank | ||
40% | Asset Management | |||
10% | Region Germany | |||
10% | Region Europe, the Middle East and Africa (EMEA) | |||
Fabrizio Campelli | 35% | Corporate Bank | ||
35% | Investment Bank | |||
20% | Corporate Bank & Investment Bank Operations and Control | |||
10% | Region UKI | |||
Bernd Leukert | 100% | Technology, Digitalization & Innovation | ||
Alexander von zur Mühlen | 100% | Region APAC | ||
Christiana Riley | 100% | Region Americas | ||
Rebecca Short | 50% | Chief Transformation Office including Global Procurement | ||
50% | Capital Release Unit | |||
Professor Dr. Stefan Simon | 100% | Chief Administrative Office | ||
Olivier Vigneron1 | 100% | Chief Risk Office | ||
Stuart Lewis 2 | ||||
1 Member since May 20, 2022
2 Member until May 19, 2022

The respective Management Board members’ functional responsibilities are linked with pre-defined key financial figures and non-financial targets from up to three categories. The three categories are:
A total of 56 Key Performance Indicators (KPIs) are assigned to these categories, of which a set of 8 to 21 KPIs are embedded in each individual Balanced Scorecard depending on the Management Board member`s area of functional responsibility. The methodology for the Balanced Scorecards has been further developed since their introduction in 2018 and adjusted to meet the developing focus. For example, in order to foster aspects of Environmental, Social and Governance (ESG) aspects in the compensation system, since 2021 ESG topics have been given an even greater consideration in the Balanced Scorecards and also in the Long-Term Award (LTA).
The KPIs within the individual categories are set at the beginning of the year for each Management Board member individually along with corresponding target, thresholds and corresponding assessment parameters. In addition, a weighting is set for each category. The weightings that the individual categories have within the overall Balanced Scorecard can be up to 65% depending on the functional responsibility of the Management Board member. The KPIs of the Balanced Scorecards are measured continuously throughout the year, but the overall assessment is made at the end of the year.
The calculation logic for determining the final levels of achievement for each Management Board member is as follows:
In a first step, the achievement band of each KPI is determined. If a minimum threshold value is not reached, the achievement level for this KPI is set at zero. Once a maximum limit for a KPI has been reached, the achievement level is set at 150%. For a clear overview, the Balanced Scorecard shows if each individual KPI was fulfilled or exceeded based on the defined assessment criteria (“green”), or only achieved to less than 100% (“amber”) or not achieved (“red”).
In a second step, the achievement level for each category is calculated taking into account the assessment of the KPIs from the first step and the resulting bands applicable to the respective category. When all objectives of a category are exceeded, the achievement level for a category can be up to 150%. However, if none of the minimum threshold values of a category is met, the achievement level is 0%.
In a third step, an overall achievement level for the individual Balanced Scorecard is derived from the achievement levels of the categories and their weightings.

421 |
Deutsche Bank | ||
Annual Report 2022 | ||
422 |
Deutsche Bank | ||
Annual Report 2022 | ||
Individual Chairman Balanced Scorecard for Christian Sewing 1
1The Group/ Chairman Balanced Scorecard represents one of the two Balanced Scorecards for the CEO (Group/Chairman and Human Resources / Corporate Real Estate). The overall Balanced Scorecard achievement level is determined based on a combination of both Balanced Scorecards.
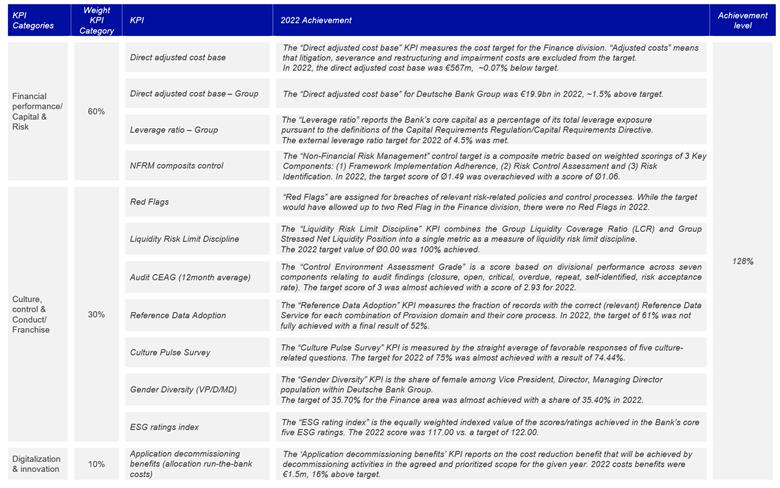
Individual CFO Balanced Scorecard for James von Moltke

423 |
Deutsche Bank | ||
Annual Report 2022 | ||
424 |
Deutsche Bank | ||
Annual Report 2022 | ||
Balanced Scorecard (illustrative functioning of the internal tracking tool)
1Resulting bands of KPI categories: Green (100-150%); Green to amber (75-125%), Green to red (50-100%), Amber to red (25%-75%), Red (0%).
If a Management Board member has more than one Balanced Scorecard, an additional fourth step is carried out to determine a final overall achievement level based on the pre-defined weightings of the Balanced Scorecards.
Balanced Scorecard Achievement levels per Management Board Member
Management Board member | Balanced Scorecard achievement level (in %) | ||
Christian Sewing | 129.00% | ||
James von Moltke | 128.00% | ||
Karl von Rohr | 117.00% | ||
Fabrizio Campelli | 125.00% | ||
Bernd Leukert | 116.00% | ||
Alexander von zur Mühlen | 116.00% | ||
Christiana Riley | 100.00% | ||
Rebecca Short | 140.00% | ||
Professor Dr. Stefan Simon | 118.00% | ||
Olivier Vigneron1 | 115.00% | ||
Stuart Lewis2 | 115.00% | ||
1 Member since May 20, 2022
2 Member until May 19, 2022

Annual Priorities
Uniform Annual Priorities are set for all Management Board members. The Supervisory Board assesses the profitability and performance-related contributions of each Management Board member towards pre-defined focus topics for the year. These focus topics are derived from, and intended to further support, Deutsche Bank’s strategy. This component of the Short-Term Award (STA) provides the possibility to set operational focal points annually depending on the current priorities. The performance criteria to be used for the assessment can be of both a financial and non-financial nature.
For the 2022 financial year, the Supervisory Board specified the following focus topics as Annual Priorities:
- – Constructive flexible responses to events/developments occurring during the performance year
- – Key deliverables from the Balanced Scorecard that have not already been assessed under another objective
The Supervisory Board assesses how each individual member of the Management Board reacted to certain and sometimes unforeseen events and developments that occurred during the financial year, particularly from the risk management perspective. At the end of the year, the achievement level is assessed qualitatively.
425 |
Deutsche Bank | ||
Annual Report 2022 | ||
Within the corporate strategy, the Supervisory Board assesses the achievement levels of Key Deliverables, such as One Bank Client Centricity, Decarbonization and Transformation Targets, Workforce Management and Optimization and Global Reporting that are related to the corporate strategy in the “Book of Work” assigned to the individual Management Board members and measured throughout the year. Each activity is in turn linked to measurement criteria, such as delivery of milestones on time versus plan, financial benefit thresholds and enhanced revenues over baseline that enable a quantitative measurement. Based on this, an individual level of achievement for the performance of each individual Management Board member can be derived at the end of the financial year.
Annual Priorities Achievement levels per Management Board Member
Management Board Member | Weighting | Annual Priorities | Achievement | |||
Christian Sewing | 50% | Constructive flexible responses to events/developments occurring in 2022 | 145.00% | |||
50% | Key deliverables from the Balanced Scorecards | |||||
James von Moltke | 50% | Constructive flexible responses to events/developments occurring in 2022 | 137.50% | |||
50% | Key deliverables from the Balanced Scorecards | |||||
Karl von Rohr | 50% | Constructive flexible responses to events/developments occurring in 2022 | 137.50% | |||
50% | Key deliverables from the Balanced Scorecards | |||||
Fabrizio Campelli | 50% | Constructive flexible responses to events/developments occurring in 2022 | 140.00% | |||
50% | Key deliverables from the Balanced Scorecards | |||||
Bernd Leukert | 50% | Constructive flexible responses to events/developments occurring in 2022 | 130.00% | |||
50% | Key deliverables from the Balanced Scorecards | |||||
Alexander von zur Mühlen1 | 100% | Constructive flexible responses to events/developments occurring in 2022 | 122.50% | |||
Christiana Riley | 50% | Constructive flexible responses to events/developments occurring in 2022 | 125.00% | |||
50% | Key deliverables from the Balanced Scorecards | |||||
Rebecca Short | 50% | Constructive flexible responses to events/developments occurring in 2022 | 125.00% | |||
50% | Key deliverables from the Balanced Scorecards | |||||
Professor Dr. Stefan Simon | 50% | Constructive flexible responses to events/developments occurring in 2022 | 125.00% | |||
50% | Key deliverables from the Balanced Scorecards | |||||
Olivier Vigneron | 50% | Constructive flexible responses to events/developments occurring in 2022 | 120.00% | |||
(Member since | 50% | Key deliverables from the Balanced Scorecards | ||||
Stuart Lewis | 50% | Constructive flexible responses to events/developments occurring in 2022 | 122.50% | |||
(Member until | 50% | Key deliverables from the Balanced Scorecards | ||||
1 Balanced Scorecard key deliverables were not agreed for 2022.
426 |
Deutsche Bank | ||
Annual Report 2022 | ||
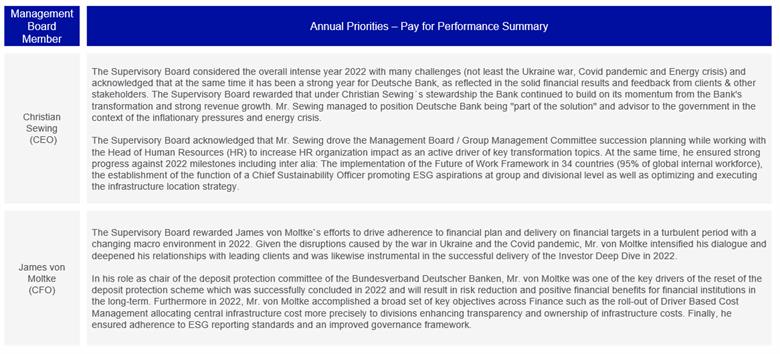
Pay-for-performance summary for CEO and CFO for the STA Annual Priorities

Overall achievement of the Short-Term Award
For the 2022 financial year, the following overall levels of achievement were determined for the members of the Management Board based on the level of achievement of the objectives linked to the three components defined by the Supervisory Board in the Short-Term Award:
Short-Term Award overall achievement
| Individual Achievement Level (in %) | Overall STA Achievement | |||||||||||
Individual | Balanced | Annual | Achievement level | Achievement level incl. 5% reduction | Achievement level | ||||||||
Christian Sewing | 131.50% | 129.00% | 145.00% | 134.25% | 127.54% | 2,754,810 | |||||||
James von Moltke | 126.75% | 128.00% | 137.50% | 129.75% | 123.26% | 2,120,115 | |||||||
Karl von Rohr | 131.75% | 117.00% | 137.50% | 129.50% | 123.03% | 2,165,240 | |||||||
Fabrizio Campelli | 130.00% | 125.00% | 140.00% | 131.25% | 124.69% | 2,053,188 | |||||||
Bernd Leukert | 122.00% | 116.00% | 130.00% | 122.50% | 116.38% | 1,908,550 | |||||||
Alexander von zur Mühlen | 123.50% | 116.00% | 122.50% | 121.38% | 115.31% | 1,891,023 | |||||||
Christiana Riley | 119.00% | 100.00% | 125.00% | 115.75% | 109.96% | 1,803,385 | |||||||
Rebecca Short | 120.00% | 140.00% | 125.00% | 126.25% | 119.94% | 1,966,975 | |||||||
Professor Dr. Stefan Simon | 122.50% | 118.00% | 125.00% | 122.00% | 115.90% | 1,900,760 | |||||||
Olivier Vigneron2 | 105.00% | 115.00% | 120.00% | 111.25% | 105.69% | 1,064,039 | |||||||
Stuart Lewis3 | 121.25% | 115.00% | 122.50% | 120.00% | 114.00% | 798,000 | |||||||
1Reduction of the individual achievement levels for the short-term component by 5% for all Management Board members active in the financial year (see chapter “Management Board Changes and Compensation Decisions in 2022).
2Member since May 20, 2022
3 Member until May 19, 2022, Pro-rata to the duration of the service contract until 31 May 2022.

427 |
Deutsche Bank | ||
Annual Report 2022 | ||
Long-Term Award (LTA)
When determining variable compensation, a significant focus is placed on the achievement of long-term objectives linked to Deutsche Bank’s strategy. To emphasize this, the Supervisory Board decided that the Long-Term Award (LTA) will account for 60% of the total target variable compensation. At the beginning of each financial year, the Supervisory Board specifies the collective long-term objectives for the Management Board members for the LTA. The objectives and their weightings in the LTA for 2022 are:
- – ESG Factor (33.33%)
- – Relative Total Shareholder Return of the Deutsche Bank share (25%)
- – Organic Capital Growth (25%)
- – Group Component (16.67%)
All LTA objectives are assessed over a period of three years. 60% of the target compensation for each objective is multiplied by the target level achieved in the performance year and thus makes up the largest share for that respective financial year. 30% of the applicable objective target compensation is based on the achievement level for the preceding financial year and 10% is determined based on the achievement level for the financial year before that. This results in a weighted overall achievement level for the performance year.

Assessment period of three years
ESG
Deutsche Bank has set for itself the aim of spearheading sustainability initiatives such as decarbonization and thus contributing to a more environmentally, socially and financially well-governed economy. To link Management Board compensation closely and consistently to the Bank’s sustainability strategy, the Supervisory Board resolved to combine the Bank’s strategic sustainability targets in an Environmental, Social and Governance (ESG) component and to implement the results as one of the collective objectives within the LTA (ESG component).
The ESG component accounts for the largest portion of the LTA with a share of 33.33%. This corresponds to 20% of the total variable compensation and emphasizes the importance of the ESG agenda for Deutsche Bank. At the beginning of each financial year, the Supervisory Board sets targets as well as upper limits and lower limits for all the objectives bundled in the ESG component. The assessment of the achievement levels for the financial year takes place retrospectively. A linear calculation methodology is used to assess the achievement levels for the quantitative measurable KPIs (all except AML/KYC remediation activities) in the categories of 0% and 100%, 100% and 100% to 150%. The following table shows the target amounts, the results as of the end of the year and the resulting achievement level for the 2022 financial year:

428 |
Deutsche Bank | ||
Annual Report 2022 | ||
429 |
Deutsche Bank | ||
Annual Report 2022 | ||
1 The target (+ € 103 billion for the ESG KPI) for Sustainable Finance and Investment was set at the beginning of the year 2022. Gross volume growth of € 74.20 billion was offset by a negative impact of new regulatory requirements (MiFiD), resulting in € 58 billion reported at year-end 2022. However, this negative effect was not taken into account for the determination of target achievement.
ESG overall achievement level
Year | Weighted achievement levels over 3 years | |||||||||
2020 | 10% | x | 37.50% | = | 3.75% | |||||
2021 | 30% | x | 89.38% | = | 26.81% | |||||
2022 | 60% | x | 64.38% | = | 38.63% | |||||

An overall achievement level for the ESG component for the 2022 financial year was calculated based on the weighted achievement levels for the seven sub-objectives and set at 64.38%. This results in a weighted overall achievement level of 69.19% for the three-year period for the portion of the LTA attributable to the ESG component.
Relative Total Shareholder Return (RTSR)
A key strategic target of the Bank is the performance of the Deutsche Bank share in comparison to the performance of the shares of its competitors (Relative Total Shareholder Return (RTSR)). The target for the RTSR for the Deutsche Bank share in comparison to selected financial institutions is intended to strengthen the sustainable performance of the Deutsche Bank share. The RTSR links the interests of the Management Board with those of shareholders. In addition, the RTSR provides a relative measurement of performance, creating an incentive to outperform the relevant peers. The total shareholder return is defined as the share price performance plus theoretically reinvested gross dividends. The RTSR is derived and calculated based on the total shareholder return of the Deutsche Bank share in relation to the average total shareholder returns of the peer group.
If the RTSR is greater than 100%, then the target achievement level increases proportionally to an upper limit of 150% of the target figure, i.e., the target achievement level increases by 1% for each percentage point above 100%. If the RTSR average is less than 100%, the target achievement level declines disproportionately. For each percentage point decline of the RTSR in the range of less than 100% and 80%, the target achievement level declines by two percentage points. For each percentage point decline of the RTSR in the range between less than 80% and 60%, the target achievement level declines by three percentage points. If the RTSR does not exceed 60% over the entire assessment period, the target achievement level is zero.

430 |
Deutsche Bank | ||
Annual Report 2022 | ||
The peer group used as the basis for calculating the RTSR is selected from among the companies with generally comparable business activities as well as a comparable size and international presence. The Supervisory Board reviews the composition of the peer group regularly. Since 2021 the peer group for the RTSR has comprised the following 11 banks: Banco Santander, Bank of America, Barclays, BNP Paribas, Citigroup, Credit Suisse, HSBC, JP Morgan Chase, Société Générale, UBS and UniCredit.
RTSR overall achievement level
Year | Weighted achievement levels over 3 years | |||||||||
2020 | 10% | x | 160.00% | = | 16.00% | |||||
2021 | 30% | x | 88.00% | = | 26.40% | |||||
2022 | 60% | x | 113.00% | = | 67.80% | |||||

In 2022, Deutsche Bank’s total shareholder return was higher compared to 8 out of 11 competitors in the peer group. The achievement level for the 2022 financial year came to 113%. This results in a weighted overall achievement level of 110.20% for the overall period of three years for the granting of the portion of the LTA attributable to the RTSR.
431 |
Deutsche Bank | ||
Annual Report 2022 | ||
Organic Capital Growth
Another key objective of Deutsche Bank is its growth. As an incentive for the Management Board members to promote growth, the Supervisory Board defined Organic Capital Growth on a net basis as a long-term objective for the LTA.
Organic Capital Growth is defined as the balance of the following changes (which are reported in the Consolidated Statement of Changes in Equity) occurring during the financial year, divided by total shareholders’ equity as of December 31 of the preceding financial year:
- – Total comprehensive income, net of tax
- – Coupon on additional equity components, net of tax
- – Remeasurement gains (losses) related to defined benefit pension plans, net of tax
- – Option premiums and other effects from options on Deutsche Bank shares
- – Net gains (losses) on treasury shares sold
Therefore, “inorganic” changes in equity, in particular the payment of a dividend or a capital increase, are of no relevance to the achievement of the objective.
Starting from an average Organic Capital Growth of 2.5% (lower limit), the target achievement level increases by 1% for each 0.05% of growth up to the 150% cap, which will be reached upon an Organic Capital Growth of 10% or more (upper limit cap). If capital growth does not exceed 2.5% in the assessment period, the target achievement level is zero.

432 |
Deutsche Bank | ||
Annual Report 2022 | ||
Organic Capital Growth overall achievement level
Year | Weighted achievement levels over 3 years | |||||||||
2020 | 10% | x | 0% | = | 0% | |||||
2021 | 30% | x | 26.00% | = | 7.80% | |||||
2022 | 60% | x | 93.00% | = | 55.80% | |||||

Organic Capital Growth pursuant to the definition specified above developed positively in 2022 at 7.16% and thus exceeded the threshold of the lower limit of 2.5%. This results in an achievement level of 93% for 2022 and in a weighted overall achievement level of 63.60% for the overall three-year period for the portion of the LTA attributable to Organic Capital Growth.
Group Component
Through the Group Component, the Supervisory Board links the key financial figures supporting the corporate strategy with the Management Board’s compensation and thus establishes an incentive to sustainably foster the Bank’s capital, risk, costs and earnings profile. The Group Component also provides a link to the compensation for employees, as this is an employee compensation system component.
Group Component | Target | Actuals | Achievement | |||||
Common Equity Tier 1 capital ratio (in %) | The bank’s Common Equity Tier 1 capital, as a percentage of the risk weighted assets for credit, market and operational risk. | >= 13.00% | 13.4% | 80.00% | ||||
Return on tangible equity (in %) | Net income (or loss) attributable to shareholders as a percentage of average tangible shareholders’ equity. The latter is determined by deducting goodwill and other intangible assets from shareholders’ equity | 8% | 9.4% | |||||
Cost/Income Ratio (CIR) (in %) | Noninterest expenses as a percentage of total net revenues, which are defined as net interest income before provision for credit losses plus noninterest income. | 70% | 75% | |||||
Sustainable Finance Volume1 (in € bn) | Volume of new financing, capital markets issuance and | 80.00 | 74.20 | |||||
1The target (+ € 80 billion for the GVC KPI) for Sustainable Finance and Investment was set at the beginning of the year 2022. Gross volume growth of € 74.20 billion was offset by a negative impact of new regulatory requirements (MiFiD), resulting in € 58 billion reported at year-end 2022. However, this negative effect was not taken into account for the determination of target achievement.
Group component overall achievement level
Year | Weighted achievement levels over 3 years | |||||||||
2020 | 10% | x | 72.50% | = | 7.25% | |||||
2021 | 30% | x | 77.50% | = | 23.25% | |||||
2022 | 60% | x | 80.00% | = | 48.00% | |||||

The achievement levels of all four equally weighted objectives of the Group Component was 80% in 2022. This results in a weighted overall achievement level of 78.50% for the overall three-year period for the portion of the LTA attributable to the Group Component.
433 |
Deutsche Bank | ||
Annual Report 2022 | ||
Long-Term Award overall achievement
| Achievement Levels (%) | Overall LTA Achievement | ||||||||||
ESG- | RTSR | Organic | Group | Achievement | Achievement | |||||||
Christian Sewing | 69.19% | 110.20% | 63.60% | 78.50% | 79.60% | 2,578,932 | ||||||
James von Moltke | 2,053,594 | |||||||||||
Karl von Rohr | 2,101,352 | |||||||||||
Fabrizio Campelli | 1,966,038 | |||||||||||
Bernd Leukert | 1,958,078 | |||||||||||
Alexander von zur Mühlen | 1,958,078 | |||||||||||
Christiana Riley | 1,958,078 | |||||||||||
Rebecca Short | 1,958,078 | |||||||||||
Professor Dr. Stefan Simon | 1,958,078 | |||||||||||
Olivier Vigneron1 | 64.38% | 113.00% | 93.00% | 80.00% | 86.29% | 1,303,173 | ||||||
Stuart Lewis2 | 69.19% | 110.20% | 63.60% | 78.50% | 79.60% | 835,765 | ||||||
1 Member since May 20, 2022. Long-term achievement level based on 1-year assessment period as the MB member joined Deutsche Bank on 1 March 2022..
2 Member until May 19, 2022, duration of the service contract until 31 May 2022.

Appropriateness of Management Board compensation and compliance with the set maximum compensation
The Supervisory Board regularly reviews the appropriateness of the individual compensation components as well as the amount of total compensation. The review of the appropriateness of Management Board compensation concluded that the Management Board compensation resulting from the achievement levels for the 2022 financial year is appropriate.
Horizontal appropriateness
Through the horizontal comparison, the Supervisory Board ensures that the target total compensation is appropriate in relation to the tasks and achievements of the Management Board as well as the company’s situation and is also customary in the market. In this context, the level and structure of compensation, in particular, are examined at comparable companies (peer groups). Suitable companies in consideration of Deutsche Bank’s market position (in particular with regard to business sector, size and country) are used as the basis for this comparison. The assessment of horizontal appropriateness takes place in comparison with the following three peer groups.
Peer Group 1:
This group consists of 11 global banks with
- – a comparable business model; and
- – a comparable size (measured by balance sheet total, number of employees and market capitalization).
The 11 institutions in this Peer Group are identical to the banks used to measure the Relative Total Shareholder Return (see Chapter "Relative return on shares"). These are the following: Banco Santander, Bank of America, Barclays, BNP Paribas, Citigroup, Credit Suisse, HSBC, JP Morgan Chase, Société Générale, UBS and UniCredit.
Peer Group 2:
This group consists of 16 European banks with
- – a comparable business model; and
- – a comparable size (measured by balance sheet total, number of employees and market capitalization).
These are the following banks: Banco Bilbao Vizcaya Argentaria, Banco Santander, Barclays, BNP Paribas, BPCE,
Rabobank, Crédit Agricole, Crédit Mutuel, Credit Suisse, HSBC Holdings, ING Bank, Intesa Sanpaolo, Nordea
Bank, Société Générale, UBS Group and UniCredit.
434 |
Deutsche Bank | ||
Annual Report 2022 | ||
Peer Group 3:
This group includes the companies of the German Stock Index (DAX).
The horizontal appropriateness of the Management Board compensation is reviewed annually by the Supervisory Board. The Supervisory Board regularly engages external compensation advisors for the review of horizontal appropriateness, while assuring itself that these advisors are independent from the Management Board and Deutsche Bank. The Supervisory Board takes the results of the review into consideration when setting the target total compensation for the Management Board members.
Vertical appropriateness
In addition to the horizontal comparison, the Supervisory Board considers a vertical comparison, which compares the compensation of the Management Board and the compensation of the workforce. Within the vertical comparison, the Supervisory Board considers in particular, in accordance with the German Corporate Governance Code, the development of the compensation over time. This involves a comparison of the Management Board compensation and the compensation of two groups of employees. Taken into account are, on the one hand, the compensation of the senior management, which comprises the first management level below the Management Board and members of the top executive committees of the divisions, as well as of management board members of significant institutions within Deutsche Bank Group and of corresponding management board-1 level positions with management responsibility. The Management Board compensation is compared to, on the other hand, the compensation of all other employees of Deutsche Bank Group worldwide (tariff and non-tariff employees).
Compliance with the set maximum compensation (cap)
The maximum compensation limit (cap) is set at € 12 million for each Management Board member. This is based on the actual expense and/or actual disbursement of the compensation awarded for a financial year. The base salaries are fixed amounts. The expenses for fringe benefits vary from Management Board member to Management Board member in any given year. The contribution to Deutsche Bank’s pension plan or pension allowance is set at the same amount for all Management Board members. However, the amount to be recognized by the Bank during the year for Deutsche Bank’s pension service costs fluctuates based on actuarial variables. As the expense amount for the multi-year variable compensation components of the Short-Term Award (STA) and Long-Term Award (LTA) are not determined until up to seven years due to the deferral periods, compliance with the maximum compensation set for the 2022 financial year can only be conclusively reported within the framework of the Compensation Reports for the financial years up to 2030. Compliance with the maximum compensation limit as defined under Section 87a of the German Stock Corporation Act is, however, already ensured for the 2022 financial year.
Deferrals and holding periods
The Remuneration Ordinance for Institutions (InstitutsVergV) generally stipulates a three-year assessment period for the determination of the variable compensation for Management Board members. Deutsche Bank complies with this requirement by assessing each of the objectives of the Long-Term Award (LTA) over a three-year period. If the relevant three years cannot be attributed to a member of the Management Board because the member joined the Bank only recently, the achievement level for the objectives will be determined for the period that can be attributed to the member. The deferral period for the LTA is in principle five years. If the assessment period is shorter than the prescribed minimum, the deferral period of the variable compensation to be granted is extended by the number of years missing for the minimum assessment period. The Short-Term Award (STA) has an assessment period of one year. The deferral period for the STA is in principle seven years.
The Long-Term Award (LTA) is granted in the form of a share-based instrument (Restricted Equity Awards (REAs)). The disbursement takes place over a deferral period of 5 years in 4 tranches, beginning with a tranche of 40% in year 2 after the end of the performance period and 3 tranches of 20% in years 3, 4, and 5 after the end of the performance period. After the deferral period, the REAs of each tranche are also subject to an additional holding period of one year. Accordingly, the Management Board members cannot dispose of the shares underlying the REAs until after 3 years, at the earliest, and in full until after 6 years. During the deferral and holding periods, the value of the REAs is linked to the performance of the Deutsche Bank share and is therefore tied to the long-term performance of the Bank, and thereby strengthens the alignment of the Management Board members’ incentives to Deutsche Bank’s performance.
The Short-Term Award (STA) is generally granted in the form of deferred cash compensation (Restricted Incentive Awards - RIAs). The STA is paid out in four tranches of 25% each over a total period of seven years after 1, 3, 5 and 7 years following the end of the assessment period. However, if the STA accounts for more than 50% of the total variable compensation, the portion exceeding 50% is also granted in the form of Restricted Equity Awards (REAs). This ensures that at least 50% of the total variable compensation is always granted in a share-based form in accordance with the regulatory requirements. The portion exceeding 50% is subject to the same deferral rules as the share-based compensation from the LTA.
435 |
Deutsche Bank | ||
Annual Report 2022 | ||
Instead of receiving Restricted Equity Awards (REAs) and Restricted Incentive Awards (RIAs) as described above, holders of specific functions at certain Deutsche Bank U.S. entities are required by applicable regulation to be compensated under different plans. Restricted compensation for these persons consists of restricted share awards and restricted cash awards. The recipient becomes the beneficial owner of the awards as of the Award Date and the awards are held on the recipient’s behalf. These awards are restricted for a period of time (subject to the applicable plan rules and award statements, including performance conditions and forfeiture provisions). The restriction period is aligned to the retention periods applicable to Deutsche Bank´s usual deferred awards. With regard to the Management Board members, these rules apply to Christiana Riley due to her role as CEO of Deutsche Bank USA Corp.
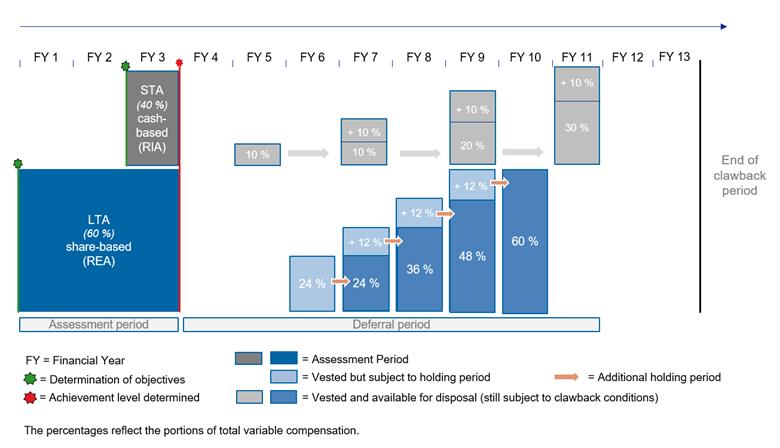
For the RIAs and REAs, specific forfeiture conditions apply during the deferral and holding periods (additional information is provided in the section “Backtesting, malus and clawback").
Backtesting, malus and clawback
By granting compensation components in a deferred form spread out over several years, a long-term incentive is created. In addition, the individual tranches are subject to specific forfeiture conditions until they vest.
The Supervisory Board regularly reviews whether the results achieved by the Management Board members in the past are sustainable (backtesting). If the outcome is that the achievements underlying the granting of the variable compensation were not sustainable, the awards may be partially or fully forfeited.
Also, if the Group’s results are negative, previously granted variable compensation may be declared fully or partially forfeited during the deferral period. In addition, the awards may be fully or partially forfeited if specific solvency or liquidity conditions are not met. Furthermore, awards may be forfeited in whole or in part in the event of individual misconduct (including breaches of regulations), dismissal for cause or negative individual contributions to performance (malus).
In addition, the contracts of the Management Board members also enable the Supervisory Board to reclaim already paid or delivered compensation components due to certain individual negative performance contributions by the Management Board member (clawback) in accordance with the provisions pursuant to Sections 18 (5) and 20 (6) of the Remuneration Ordinance for Institutions (InstitutsVergV). The clawback is possible for the entire variable compensation for a financial year until the end of two years after the end of the deferral period of the last tranche of the compensation elements awarded on a deferred basis for the respective financial year.
The Supervisory Board regularly reviews in due time before the respective due dates the possibility of a full or partial forfeiture (malus) or reclaiming (clawback) of the Management Board members’ variable compensation components. There was no forfeiture or clawback of awards in 2022.
436 |
Deutsche Bank | ||
Annual Report 2022 | ||
Information on shares and fulfilling the share ownership obligation (Shareholding Guidelines)
All members of the Management Board are required to acquire a significant amount of Deutsche Bank shares and to hold them on a long-term basis. This requirement is meant to foster the identification of the Management Board members with Deutsche Bank and its shareholders and to ensure a long-term link to the development of the Deutsche Bank’s business.
For the Chief Executive Officer, the number of shares to be held is equivalent to 200% of his annual gross base salary, and for the other Management Board members, 100% of their annual gross base salary. The requirements of the shareholding obligation must first be fulfilled as of the date on which the share-based variable compensation that has been granted to the Management Board member since his or her appointment to the Management Board (waiting period) in total corresponds to 1.33 times the shareholding obligation. Compliance with the requirements is reviewed semi-annually. If the required number of shares is not met, the Management Board members must correct any deficiencies by the next review.
In the context of granting variable compensation, the Supervisory Board can resolve on an individual basis that not only the Long-Term Award (LTA) but also parts of the Short-Term Award (STA) or the STA as a whole may be awarded in shares until the shareholding obligation is fulfilled. This is intended to ensure faster compliance with the shareholding obligation.
Members of the Management Board
The following table shows the number of outstanding share awards of the current Management Board members as of February 11, 2022 and February 10, 2023 as well as the number of share awards newly granted, delivered or forfeited in this period.
Members of the Management Board | Balance as of | Granted | Delivered | Forfeited | Balance as of | |||||
Christian Sewing | 693,230 | 202,143 | – | – | 895,373 | |||||
James von Moltke | 564,465 | 153,123 | – | – | 717,588 | |||||
Karl von Rohr | 519,839 | 160,670 | – | – | 680,509 | |||||
Fabrizio Campelli | 338,899 | 149,265 | 32,994 | – | 455,170 | |||||
Bernd Leukert | 151,300 | 147,039 | 3,037 | – | 295,302 | |||||
Alexander von zur Mühlen | 278,282 | 145,900 | 46,275 | – | 377,906 | |||||
Christiana Riley | 248,345 | 147,0921 | 102,8102 | – | 292,6273 | |||||
Rebecca Short | 92,754 | 106,0284 | 26,517 | – | 172,265 | |||||
Professor Dr. Stefan Simon | 149,373 | 145,979 | 29,574 | – | 265,778 | |||||
Olivier Vigneron5 | – | – | – | – | 130,539 | |||||
1Under the underlying plan, the 147,092 restricted shares originally granted were taxed at the time of grant, with 74,278 shares remaining on an after-tax basis. We refer to the corresponding presentation in the chapter "Deferral and retention periods".
2Included are 72,814 share awards delivered to cover the amount of tax due under the underlying plan (see footnote 1).
3Includes a net number of 74,278 share entitlements under the underlying plan (see footnote 1).
4Includes 8,020 shares granted in 2022 for her pre-Board role.
5Member since 20 May 2022.
437 |
Deutsche Bank | ||
Annual Report 2022 | ||
The table below shows the total number of Deutsche Bank shares held by the incumbent Management Board members as of the reporting dates February 11, 2022, and February 10, 2023 as well as the number of share-based awards and the fulfillment level for the shareholding obligation.
as of February 10, 2023 | ||||||||||||||||
Members of the Management Board | Number of Deutsche Bank shares | Number of Deutsche Bank shares | Restricted Equity Award(s)/ Outstanding Equity Units | thereof 75% of Restricted Equity Award(s)/ Outstanding Equity Units chargeable to share obligation | Total value of Deutsche Bank shares and Restricted Equity Award(s)/ Outstanding Equity Units chargeable to share obligation | Share retention obligation must be fulfilled | Level of required shareholding obligation | Fulfillment ratio | ||||||||
Christian Sewing | 192,000 | 222,171 | 895,373 | 671,530 | 893,701 | No | 635,257 | 141% | ||||||||
James von Moltke | 74,753 | 74,753 | 717,588 | 538,191 | 612,944 | Yes | 264,690 | 232% | ||||||||
Karl von Rohr | 30,058 | 30,058 | 680,509 | 510,382 | 540,440 | Yes | 264,690 | 204% | ||||||||
Fabrizio Campelli | 132,010 | 149,473 | 455,170 | 341,377 | 490,850 | No | 247,044 | 199% | ||||||||
Bernd Leukert | 7,882 | 9,477 | 295,302 | 221,477 | 230,954 | Yes | 211,752 | 109% | ||||||||
Alexander von zur Mühlen | 320,829 | 359,655 | 377,906 | 283,430 | 643,085 | No | 211,752 | 304% | ||||||||
Christiana Riley | 82,504 | 100,620 | 292,627 | 219,470 | 320,090 | Yes | 211,752 | 151% | ||||||||
Rebecca Short | 36,451 | 51,299 | 172,265 | 129,199 | 180,498 | No | 211,752 | 85% | ||||||||
Prof. Dr. Stefan Simon | 0 | 0 | 265,778 | 199,334 | 199,334 | No | 211,752 | 94% | ||||||||
Olivier Vigneron2 | – | 0 | 130,539 | 97,904 | 97,904 | No | 211,752 | 46% | ||||||||
Total | 876,487 | 997,506 | 4,283,058 | 3,212,294 | 4,209,800 | |||||||||||
1The calculation of the total value of the Deutsche Bank shares and share awards / outstanding shares eligible for the shareholding requirements is based on the share price € 11.338 (Xetra closing price on February 10, 2023).
2Member since May 20, 2022.
All Management Board members fulfilled the shareholding obligations in 2022 or are currently in the waiting period.
The Chairman of the Management Board, Mr. Sewing, voluntarily committed to invest 15% of his monthly net salary in Deutsche Bank shares from September 2019 until the end of December 2022. In each case, purchases take place on the 22nd day of each month or on the following trading day.
Benefits as of the end of the mandate
Benefits upon regular contract termination
The Supervisory Board allocates an entitlement to pension plan benefits to the Management Board members. These entitlements involve a pension plan with predefined contributions. Under this pension plan, a personal pension account is set up for each participating member of the Management Board with effect from the start of office as a Management Board member.
The members of the Management Board, including the Management Board Chairman, receive a uniform, contractually defined, fixed annual contribution amount of € 650,000. The contribution accrues interest that is credited in advance and determined by means of an age-related factor, up to the age of 60. For entitlements from a first-time or renewed appointment starting from the 2021 financial year, interest accrues at an average rate of 2% per annum, for legacy entitlements 4%. From the age of 61 onwards, an additional contribution equal to the amount resulting from applying the above interest rate to the balance of the pension account as of December 31 of the previous year will be credited to the pension account. The annual contributions, taken together, form the pension capital amount available to pay the future pension benefits upon the occurrence of a pension event (retirement age, disability or death). The pension account balance is vested from the start.
If a Management Board member is subject to non-German income tax, the granting of an annual pension cash allowance of € 650,000 may be selected as an alternative to the pension plan entitlement. This is subject to the precondition that receiving the customary pension plan contributions entails not insignificant tax-related disadvantages for the Management Board member compared to receiving a pension allowance. This option can be exercised once and from then on applies to the entire term of office of the Management Board member.
438 |
Deutsche Bank | ||
Annual Report 2022 | ||
The following table shows the annual contributions, the interest credits, the account balances and the annual service costs for the years 2022 and 2021 as well as the corresponding defined benefit obligations for each member of the Management Board in office in 2022 as of December 31, 2021 and December 31,2022. The different balances are attributable to the different lengths of service on the Management Board, the respective age-related factors, and the different contribution rates.
Members of the | Annual contribution, | Interest credit, | Account balance, | Service cost (IFRS), | Present value of the | |||||||||||||||
in € | 2022 | 2021 | 2022 | 2021 | 2022 | 2021 | 2022 | 2021 | 2022 | 2021 | ||||||||||
Christian Sewing | 760,500 | 773,500 | 0 | 0 | 7,276,500 | 6,516,000 | 529,109 | 701,494 | 5,422,875 | 6,263,328 | ||||||||||
James von Moltke | 845,000 | 871,000 | 0 | 0 | 5,034,250 | 4,189,250 | 638,068 | 820,820 | 3,945,284 | 4,095,605 | ||||||||||
Karl von Rohr | 728,000 | 754,000 | 0 | 0 | 5,449,001 | 4,721,001 | 652,035 | 772,131 | 4,864,821 | 4,866,754 | ||||||||||
Fabrizio Campelli | 946,836 | 1,007,500 | 0 | 0 | 3,181,754 | 2,234,918 | 605,376 | 906,767 | 2,148,218 | 2,091,609 | ||||||||||
Bernd Leukert | 786,500 | 812,500 | 0 | 0 | 2,734,334 | 1,947,834 | 637,939 | 785,526 | 2,317,651 | 1,957,432 | ||||||||||
Alexander von zur Mühlen1 | 0 | 0 | 0 | 0 | 0 | 0 | 0 | 0 | 0 | 0 | ||||||||||
Christiana Riley1 | 0 | 0 | 0 | 0 | 0 | 0 | 0 | 0 | 0 | 0 | ||||||||||
Rebecca Short | 819,000 | 554,668 | 0 | 0 | 1,373,668 | 554,668 | 475,091 | 476,303 | 826,548 | 496,829 | ||||||||||
Prof. Dr. Stefan Simon | 845,000 | 871,000 | 0 | 0 | 3,009,501 | 2,164,501 | 629,482 | 824,015 | 2,311,957 | 2,128,664 | ||||||||||
Olivier Vigneron2 | 644,584 | 0 | 0 | 0 | 644,584 | 0 | 423,955 | 0 | 446,932 | 0 | ||||||||||
Stuart Lewis3 | 303,335 | 754,000 | 0 | 0 | 6,715,273 | 6,411,938 | 258,440 | 756,618 | 6,115,579 | 6,919,079 | ||||||||||
1The Management Board member receives a pension allowance, which is shown in the chapter "Compensation granted and owed (inflow table)”.
2 Member since May 20, 2022
3 Member until May 19, 2022
Benefits upon early termination
The Management Board members are in principle entitled to receive a severance payment upon an early termination of their appointment, provided the Bank is not entitled to revoke the appointment or give notice under the contractual agreement for cause. In accordance with the recommendation of the German Corporate Governance Code, the severance payment amounts to up to a maximum of two times the annual compensation at the maximum and must not exceed the amount that would be payable as compensation for the remaining term of the service contract. The calculation of the severance payment is based on the annual compensation for the previous financial year and, if applicable, on the expected annual compensation for the current financial year. The severance payment is determined and granted in accordance with the statutory and regulatory requirements, in particular with the provisions of the Remuneration Ordinance for Institutions (InstitutsVergV).
In the event of a change of control, Management Board members have a special right to termination of their service contract. However, in such case, there is no entitlement to a severance payment.
Other service contract provisions
Term of the service contract
The term of the Management Board service contracts is linked to the duration of the appointment and is a maximum of five years in accordance with Section 84 of the German Stock Corporation Act. The Supervisory Board shall decide at an early stage, no later than six months before the expiry of the appointment period, on a renewed appointment. In the case of the Management Board member’s reappointment, the service contract is extended for the duration of a renewed appointment.
For first-time appointments, a contract term of three years is not to be exceeded. The Management Board service contract ends automatically with the expiry of the appointment period without requiring the express notice of termination.
439 |
Deutsche Bank | ||
Annual Report 2022 | ||
Reduction of base salary regarding compensation from other mandates
The service contracts of the Management Board members contain an obligation of the members to ensure that they will not receive any compensation to which they would otherwise be entitled in their capacity as a member of any corporate body, in particular a supervisory board, advisory board or similar body of any group entity of the Bank pursuant to Section 18 of the German Stock Corporation Act. Accordingly, Management Board members do not receive any compensation for mandates on boards of Deutsche Bank subsidiaries.
A Management Board member’s base salary will be reduced in an amount equal to 50% of the compensation from a mandate – in particular supervisory board or advisory board mandates – at a company that does not belong to Deutsche Bank Group. There is no such deduction of any compensation that does not exceed € 100,000 per mandate and calendar year.
In the 2022 financial year, the base salary of one member of the Management Board was reduced by the amount of the compensation from one mandate at a company that does not belong to Deutsche Bank Group, since the compensation exceeded the threshold amount.
Post-contractual non-compete clause
After leaving the Management Board, the members are as a general rule subject to a one-year non-compete clause. During the non-compete period, Deutsche Bank pays the Management Board member compensation (waiting allowance “Karenzentschädigung”) amounting to 65% of his or her annual base salary. The waiting allowance shall be credited against any claim for severance pay. In addition, the waiting allowance will be reduced by any income that the Management Board member earns during the non-compete period from self-employed, salaried or other paid activities that are not subject to the non-compete clause. Deutsche Bank may waive a Management Board member’s compliance with the post-contractual non-compete clause. From the date of the waiver, if and when such waiver is granted, Deutsche Bank’s obligation to pay the waiting allowance (“Karenzentschädigung”) ends.
Stuart Lewis left the Management Board with effect of the end of May 19th, 2022. The Service Contract was terminated amicably with effect as of the end of the May 31st, 2022. As foreseen and In line with his service contract, compensation for a post-contractual non-compete clause (“Karenzentschädigung”) in the amount of € 1,820,000 corresponding to 65% of his fixed base salary p.a. was agreed. The post-contractual non-compete clause applies from June 1st, 2022 until May 31st, 2023 in the scope set forth of the Service Contract.
Deviations from the compensation system
There were no deviations from the compensation system in the 2022 financial year.
440 |
Deutsche Bank | ||
Annual Report 2022 | ||
Management Board compensation 2022
Current Management Board members
Total compensation 2022
The Supervisory Board determined the aforementioned compensation on an individual basis for 2022 and 2021 as follows:
2022 | 2021 | |||||||||||||
in € | Base | Short Term Award | Long Term Award | Total | Target Total compensation | Ratio | Total | |||||||
Christian Sewing | 3,600,000 | 2,754,810 | 2,578,932 | 8,933,742 | 9,000,000 | 99% | 8,812,448 | |||||||
James von Moltke | 2,900,000 | 2,120,115 | 2,053,594 | 7,073,709 | 7,200,000 | 98% | 6,748,426 | |||||||
Karl von Rohr | 3,000,000 | 2,165,240 | 2,101,352 | 7,266,592 | 7,400,000 | 98% | 7,143,047 | |||||||
Fabrizio Campelli | 2,466,667 | 2,053,188 | 1,966,038 | 6,485,893 | 6,583,334 | 99% | 6,248,949 | |||||||
Bernd Leukert | 2,400,000 | 1,908,550 | 1,958,078 | 6,266,628 | 6,500,000 | 96% | 6,191,549 | |||||||
Alexander von zur Mühlen | 2,400,000 | 1,891,023 | 1,958,078 | 6,249,101 | 6,500,000 | 96% | 6,162,166 | |||||||
Christiana Riley | 2,400,000 | 1,803,385 | 1,958,078 | 6,161,463 | 6,500,000 | 95% | 6,192,916 | |||||||
Rebecca Short | 2,400,000 | 1,966,975 | 1,958,078 | 6,325,053 | 6,500,000 | 97% | 4,127,244 | |||||||
Professor Dr. Stefan Simon | 2,400,000 | 1,900,760 | 1,958,078 | 6,258,838 | 6,500,000 | 96% | 6,164,216 | |||||||
Olivier Vigneron2 | 1,473,333 | 1,064,039 | 1,303,173 | 3,840,545 | 3,990,278 | 96% | – | |||||||
Stuart Lewis3 | 1,166,667 | 798,000 | 835,765 | 2,800,432 | 2,916,667 | 96% | 6,728,126 | |||||||
Total | 26,606,667 | 20,426,085 | 20,629,244 | 67,661,996 | 69,590,279 | 97% | 64,519,087 | |||||||
1In the column "Basic salary", the target values set by the Supervisory Board are shown in EUR for reasons of comparability. The actual inflow differs from this target value for Management Board members Alexander von zur Mühlen and Christiana Riley due to currency fluctuations and for Bernd Leukert due to the offsetting of compensation from mandates. The inflow is shown in the chapter " Compensation granted and owed (inflow table).
2Member since May 20, 2022.
3Member until May 19, 2022. Pro-rata to the duration of the service contract until 31 May 2022.
The number of share awards granted to the members of the Management Board in the form of Restricted Equity Awards (REA) in 2023 for the 2022 financial year was calculated by dividing the respective amounts in euro by the higher of either the average Xetra closing price of the Deutsche Bank share during the last ten trading days in February 2023 or the Xetra closing price on February 28, 2023 (€ 11.800).
Members of the Management Board | Restricted Equity Award(s) | |
Christian Sewing | 226,006 | |
James von Moltke | 176,852 | |
Karl von Rohr | 180,788 | |
Fabrizio Campelli | 170,306 | |
Bernd Leukert | 165,939 | |
Alexander von zur Mühlen | 165,939 | |
Christiana Riley | 165,939 | |
Rebecca Short | 166,316 | |
Prof. Dr. Stefan Simon | 165,939 | |
Olivier Vigneron2 | 110,438 | |
Stuart Lewis3 | 70,828 | |
Total | 1,765,289 | |
1The Restricted Equity Awards are commercially rounded for presentation purposes.
2Member since May 20, 2022.
3Member until May 19, 2022
441 |
Deutsche Bank | ||
Annual Report 2022 | ||
Granted and owed compensation (inflow table)
The following table shows the compensation paid and owed in the 2022 and 2021 financial years to incumbent members of the Management Board in the 2021 financial year, pursuant to Section 162 (1) sentence 1 of the German Stock Corporation Act. This involves the compensation components that were either actually paid or delivered to the individual Management Board members within the reporting period (“paid”) or were already legally due during the reporting period but not yet delivered (“owed”).
Besides the compensation amounts, the table additionally shows the relative proportions of fixed and variable compensation within the total compensation pursuant to Section 162 (1) sentence 2 of the German Stock Corporation Act.
Christian Sewing | James von Moltke | |||||||||||||||
2022 | 2021 | 2022 | 2021 | |||||||||||||
in € t. | in % | in € t. | in % | in € t. | in % | in € t. | in % | |||||||||
Fixed compensation components: | ||||||||||||||||
Base salary | 3,600 | 82% | 3,600 | 93% | 2,9002 | 77% | 2,800 | 70% | ||||||||
Pension allowance | 0 | 0% | 0 | 0% | 0 | 0% | 0 | 0% | ||||||||
Fringe benefits | 216 | 5% | (8.0)1 | 0% | 84 | 2% | 52 | 1% | ||||||||
Total fixed compensation | 3,816 | 87% | 3,592 | 93% | 2,984 | 79% | 2,852 | 71% | ||||||||
Variable compensation components: | ||||||||||||||||
Deferred variable compensation | ||||||||||||||||
thereof Restricted Incentive Awards: | ||||||||||||||||
2017 Restricted Incentive Award: Buyout | 0 | 0% | 0 | 0% | 0 | 0% | 140 | 3% | ||||||||
2017 Restricted Incentive Award: Sign On | 0 | 0% | 0 | 0% | 67 | 2% | 67 | 2% | ||||||||
2019 Restricted Incentive Award for 2018 | 232 | 5% | 232 | 6% | 169 | 4% | 169 | 4% | ||||||||
2020 Restricted Incentive Award for 2019 | 43 | 1% | 43 | 1% | 43 | 1% | 43 | 1% | ||||||||
2021 Restricted Incentive Award for 2020 | 304 | 7% | 0 | 0% | 213 | 6% | 0 | 0% | ||||||||
thereof Equity Awards: | ||||||||||||||||
2017 Restricted Equity Award: Buyout | 0 | 0% | 0 | 0% | 0 | 0% | 124 | 3% | ||||||||
2015 DB Equity Plan for 2014 | 0 | 0% | 0 | 0% | 0 | 0% | 0 | 0% | ||||||||
Fringe benefits | 0 | 0% | 0 | 0% | 3083 | 8% | 6163 | 15% | ||||||||
Total variable compensation | 579 | 13% | 275 | 7% | 799 | 21% | 1,157 | 29% | ||||||||
Total compensation | 4,394 | 100% | 3,867 | 100% | 3,783 | 100% | 4,009 | 100% | ||||||||
1Due to the economic participation in the costs of a company car provided, which exceeds the amount of the other fringe benefits, a negative balance is to be shown for the financial year 2021.
2For further details on compensation decision, please refer to chapter "Management Board Changes and Compensation Decisions in 2022" in this report.
3The variable fringe benefits represent a housing allowance which was granted until June 30, 2022.
Karl von Rohr | Fabrizio Campelli | |||||||||||||||
2022 | 2021 | 2022 | 2021 | |||||||||||||
in € t. | in % | in € t. | in % | in € t. | in % | in € t. | in % | |||||||||
Fixed compensation components: | ||||||||||||||||
Base salary | 3,000 | 87% | 3,000 | 93% | 2,4671 | 90% | 2,400 | 99% | ||||||||
Pension allowance | 0 | 0% | 0 | 0% | 0 | 0% | 0 | 0% | ||||||||
Fringe benefits | 8 | 0% | 24 | 1% | 57 | 2% | 12 | 0% | ||||||||
Total fixed compensation | 3,008 | 87% | 3,024 | 93% | 2,524 | 92% | 2,412 | 100% | ||||||||
Variable compensation components: | ||||||||||||||||
Deferred variable compensation | ||||||||||||||||
thereof Restricted Incentive Awards: | ||||||||||||||||
2017 Restricted Incentive Award: Buyout | 0 | 0% | 0 | 0% | 0 | 0% | 0 | 0% | ||||||||
2017 Restricted Incentive Award: Sign On | 0 | 0% | 0 | 0% | 0 | 0% | 0 | 0% | ||||||||
2019 Restricted Incentive Award for 2018 | 169 | 5% | 169 | 5% | 0 | 0% | 0 | 0% | ||||||||
2020 Restricted Incentive Award for 2019 | 43 | 1% | 43 | 1% | 7 | 0% | 7 | 0% | ||||||||
2021 Restricted Incentive Award for 2020 | 224 | 5% | 0 | 0% | 213 | 6% | 0 | 0% | ||||||||
thereof Equity Awards: | ||||||||||||||||
2017 Restricted Equity Award: Buyout | 0 | 0% | 0 | 0% | 0 | 0% | 0 | 0% | ||||||||
2015 DB Equity Plan for 2014 | 0 | 0% | 0 | 0% | 0 | 0% | 0 | 0% | ||||||||
Fringe benefits | 0 | 0% | 0 | 0% | 0 | 0% | 0 | 0% | ||||||||
Total variable compensation | 435 | 13% | 211 | 7% | 220 | 8% | 7 | 0% | ||||||||
Total compensation | 3,444 | 100% | 3,235 | 100% | 2,744 | 100% | 2,420 | 100% | ||||||||
1For further details on compensation decision, please refer to chapter "Management Board Changes and Compensation Decisions in 2022" in this report.
442 |
Deutsche Bank | ||
Annual Report 2022 | ||
Bernd Leukert | Alexander von zur Mühlen | |||||||||||||||
2022 | 2021 | 2022 | 2021 | |||||||||||||
in € t. | in % | in € t. | in % | in € t. | in % | in € t. | in % | |||||||||
Fixed compensation components: | ||||||||||||||||
Base salary | 2,3971 | 92% | 2,3941 | 99% | 2,5672 | 75% | 2,3452 | 74% | ||||||||
Pension allowance | 0 | 0% | 0 | 0% | 650 | 19% | 650 | 21% | ||||||||
Fringe benefits | 8 | 0% | 25 | 1% | 121 | 4% | 64 | 2% | ||||||||
Total fixed compensation | 2,404 | 93% | 2,419 | 100% | 3,338 | 98% | 3,059 | 97% | ||||||||
Variable compensation components: | ||||||||||||||||
Deferred variable compensation | ||||||||||||||||
thereof Restricted Incentive Awards: | ||||||||||||||||
2017 Restricted Incentive Award: Buyout | 0 | 0% | 0 | 0% | 0 | 0% | 0 | 0% | ||||||||
2017 Restricted Incentive Award: Sign On | 0 | 0% | 0 | 0% | 0 | 0% | 0 | 0% | ||||||||
2019 Restricted Incentive Award for 2018 | 0 | 0% | 0 | 0% | 0 | 0% | 0 | 0% | ||||||||
2020 Restricted Incentive Award for 2019 | 0 | 0% | 0 | 0% | 0 | 0% | 0 | 0% | ||||||||
2021 Restricted Incentive Award for 2020 | 188 | 4% | 0 | 0% | 74 | 2% | 0 | 0% | ||||||||
thereof Equity Awards: | ||||||||||||||||
2017 Restricted Equity Award: Buyout | 0 | 0% | 0 | 0% | 0 | 0% | 0 | 0% | ||||||||
2015 DB Equity Plan for 2014 | 0 | 0% | 0 | 0% | 0 | 0% | 0 | 0% | ||||||||
Fringe benefits | 0 | 0% | 0 | 0% | 0 | 0% | 98 | 3% | ||||||||
Total variable compensation | 188 | 7% | 0 | 0% | 74 | 2% | 98 | 3% | ||||||||
Total compensation | 2,593 | 100% | 2,419 | 100% | 3,412 | 100% | 3,157 | 100% | ||||||||
1 The fixed compensation shown includes the crediting of compensation from mandates.
2 As the fixed compensation is granted in local currency, it is subject to FX-rate changes.
Christiana Riley | Rebecca Short | |||||||||||||||
2022 | 2021 | 2022 | 2021 | |||||||||||||
in € t. | in % | in € t. | in % | in € t. | in % | in € t. | in % | |||||||||
Fixed compensation components: | ||||||||||||||||
Base salary | 2,6121 | 72% | 2,3281 | 76% | 2,400 | 99% | 1,600 | 100% | ||||||||
Pension allowance | 650 | 18% | 650 | 21% | 0 | 0% | - | 0% | ||||||||
Fringe benefits | 204 | 6% | 85 | 3% | 36 | 1% | 6 | 0% | ||||||||
Total fixed compensation | 3,466 | 95% | 3,063 | 99% | 2,436 | 100% | 1,606 | 100% | ||||||||
Variable compensation components: | ||||||||||||||||
Deferred variable compensation | ||||||||||||||||
thereof Restricted Incentive Awards: | ||||||||||||||||
2017 Restricted Incentive Award: Buyout | 0 | 0% | 0 | 0% | 0 | 0% | 0 | 0% | ||||||||
2017 Restricted Incentive Award: Sign On | 0 | 0% | 0 | 0% | 0 | 0% | 0 | 0% | ||||||||
2019 Restricted Incentive Award for 2018 | 0 | 0% | 0 | 0% | 0 | 0% | 0 | 0% | ||||||||
2020 Restricted Incentive Award for 2019 | 0 | 0% | 0 | 0% | 0 | 0% | 0 | 0% | ||||||||
2021 Restricted Incentive Award for 2020 | 186 | 4% | 0 | 0% | 0 | 0% | 0 | 0% | ||||||||
thereof Equity Awards: | ||||||||||||||||
2017 Restricted Equity Award: Buyout | 0 | 0% | 0 | 0% | 0 | 0% | 0 | 0% | ||||||||
2015 DB Equity Plan for 2014 | 0 | 0% | 0 | 0% | 0 | 0% | 0 | 0% | ||||||||
Fringe benefits | 1 | 0% | 17 | 1% | 0 | 0% | 0 | 0% | ||||||||
Total variable compensation | 187 | 5% | 17 | 1% | 0 | 0% | 0 | 0% | ||||||||
Total compensation | 3,653 | 100% | 3,079 | 100% | 2,436 | 100% | 1,606 | 100% | ||||||||
0 | 0 | 0 | 0 | 0 | 0 | 0 | 0 | |||||||||
1 As the fixed compensation is granted in local currency, it is subject to FX-rate changes.
443 |
Deutsche Bank | ||
Annual Report 2022 | ||
Professor Dr. Stefan Simon | Olivier Vigneron (Member since May 20, 2022) | |||||||||||||||
2022 | 2021 | 2022 | 2021 | |||||||||||||
in € t. | in % | in € t. | in % | in € t. | in % | in € t. | in % | |||||||||
Fixed compensation components: | ||||||||||||||||
Base salary | 2,400 | 96% | 2,400 | 98% | 1,473 | 98% | – | – | ||||||||
Pension allowance | 0 | 0% | 0 | 0% | 0 | 0% | – | – | ||||||||
Fringe benefits | 10 | 0% | 46 | 2% | 35 | 2% | – | – | ||||||||
Total fixed compensation | 2,410 | 97% | 2,446 | 100% | 1,508 | 100% | – | – | ||||||||
Variable compensation components: | ||||||||||||||||
Deferred variable compensation | ||||||||||||||||
thereof Restricted Incentive Awards: | ||||||||||||||||
2017 Restricted Incentive Award: Buyout | 0 | 0% | 0 | 0% | 0 | 0% | – | – | ||||||||
2017 Restricted Incentive Award: Sign On | 0 | 0% | 0 | 0% | 0 | 0% | – | – | ||||||||
2019 Restricted Incentive Award for 2018 | 0 | 0% | 0 | 0% | 0 | 0% | – | – | ||||||||
2020 Restricted Incentive Award for 2019 | 0 | 0% | 0 | 0% | 0 | 0% | – | – | ||||||||
2021 Restricted Incentive Award for 2020 | 78 | 2% | 0 | 0% | 0 | 0% | – | – | ||||||||
thereof Equity Awards: | ||||||||||||||||
2017 Restricted Equity Award: Buyout | 0 | 0% | 0 | 0% | 0 | 0% | – | – | ||||||||
2015 DB Equity Plan for 2014 | 0 | 0% | 0 | 0% | 0 | 0% | – | – | ||||||||
Fringe benefits | 0 | 0% | 0 | 0% | 0 | 0% | – | – | ||||||||
Total variable compensation | 78 | 3% | 0 | 0% | 0 | 0% | – | – | ||||||||
Total compensation | 2,488 | 100% | 2,446 | 100% | 1,508 | 100% | – | – | ||||||||
Stuart Lewis (Member until May 19, 2022) | ||||||||
2022 | 2021 | |||||||
in € t. | in % | in € t. | in % | |||||
Fixed compensation components: | ||||||||
Base salary | 1,167 | 44% | 2,800 | 91% | ||||
Non-compete payment | 1,062 | 40% | 0 | 0% | ||||
Pension allowance | 0 | 0% | 0 | 0% | ||||
Fringe benefits | 32 | 1% | 80 | 3% | ||||
Total fixed compensation | 2,260 | 85% | 2,880 | 94% | ||||
Variable compensation components: | ||||||||
Deferred variable compensation | ||||||||
thereof Restricted Incentive Awards: | ||||||||
2017 Restricted Incentive Award: Buyout | 0 | 0% | 0 | 0% | ||||
2017 Restricted Incentive Award: Sign On | 0 | 0% | 0 | 0% | ||||
2019 Restricted Incentive Award for 2018 | 156 | 6% | 156 | 5% | ||||
2020 Restricted Incentive Award for 2019 | 43 | 2% | 43 | 1% | ||||
2021 Restricted Incentive Award for 2020 | 188 | 4% | 0 | 0% | ||||
thereof Equity Awards: | ||||||||
2017 Restricted Equity Award: Buyout | 0 | 0% | 0 | 0% | ||||
2015 DB Equity Plan for 2014 | 0 | 0% | 0 | 0% | ||||
Fringe benefits | 0 | 0% | 0 | 0% | ||||
Total variable compensation | 387 | 15% | 199 | 6% | ||||
Total compensation | 2,648 | 100% | 3,079 | 100% | ||||
With respect to the deferred compensation components of previous years approved in the reporting year, the Supervisory Board confirmed that the respective performance conditions were met.
444 |
Deutsche Bank | ||
Annual Report 2022 | ||
Former members of the Management Board
Granted and owed compensation (inflow table)
The following table shows the compensation paid and owed to the former members of the Management Board in the 2022 financial year pursuant to Section 162 (1) sentence 1 of the German Stock Corporation Act. This involves the compensation components that were either actually delivered to the former Management Board members within the reporting period (“paid”) or were already legally due during the reporting period but not yet delivered (“owed”). Pursuant to Section 162 (5) of the German Stock Corporation Act, no personal data is provided on former members of the Management Board who ended their work for the Management Board before December 31, 2012.
| Frank Kuhnke | Werner Steinmüller | Sylvie Matherat | Garth Ritchie | |||||||||||||
2022 | 2022 | 2022 | 2022 | ||||||||||||||
in € t. | in % | in € t. | in % | in € t. | in % | in € t. | in % | ||||||||||
Non-Compete payment | 520 | 32% | 0 | 0% | 0 | 0% | 0 | 0% | |||||||||
Deferred variable compensation | |||||||||||||||||
Restricted Incentive Awards | 212 | 13% | 283 | 100% | 132 | 99% | 268 | 100% | |||||||||
Equity Awards | 894 | 55% | 0 | 0% | 0 | 0% | 0 | 0% | |||||||||
Fringe benefits | 0 | 0% | 0 | 0% | 2 | 1% | 0 | 0% | |||||||||
Pension benefits | 0 | 0% | 0 | 0% | 0 | 0% | 0 | 0% | |||||||||
Total compensation | 1,626 | 100% | 283 | 100% | 134 | 100% | 268 | 100% | |||||||||
Nicolas Moreau | ||||||||
2022 | ||||||||
DB AG | DWS Management GmbH | Overall | ||||||
in € t. | in € t. | in € t. | in % | |||||
Deferred variable compensation | ||||||||
Restricted Incentive Awards | 79 | 90 | 169 | 53% | ||||
Equity Awards1 | 0 | 126 | 126 | 40% | ||||
Fringe benefits | 21 | 0 | 21 | 7% | ||||
Pension benefits | 0 | 0 | 0 | 0% | ||||
Total compensation | 101 | 216 | 317 | 100% | ||||
1The equity awards shown are share-based instruments granted by DWS Management GmbH. Details of these instruments can be found in the DWS Annual Report.
Frank Strauß | Kimberly Hammonds1 | Dr. Marcus Schenck | John Cryan | ||||||||||||||
2022 | 2022 | 2022 | 2022 | ||||||||||||||
in € t. | in % | in € t. | in % | in € t. | in % | in € t. | in % | ||||||||||
Deferred variable compensation | |||||||||||||||||
Restricted Incentive Awards | 326 | 100% | 52 | 73% | 65 | 100% | 47 | 100% | |||||||||
Equity Awards | 0 | 0% | 20 | 28% | 0 | 0% | 0 | 0% | |||||||||
Fringe benefits | 0 | 0% | 0 | 0% | 0 | 0% | 0 | 0% | |||||||||
Pension benefits | 0 | 0% | 0 | 0% | 0 | 0% | 0 | 0% | |||||||||
Total compensation | 326 | 100% | 71 | 100% | 65 | 100% | 47 | 100% | |||||||||
1Kimberly Hammonds passed away in 2022, therefore there will be no disclosure within the table “Granted and owed” from the Compensation Report 2023 and onwards.
| Hermann-Josef Lamberti | Josef Ackermann | |||||||
2022 | 2022 | ||||||||
in € t. | in % | in € t. | in % | ||||||
Deferred variable compensation | |||||||||
Restricted Incentive Awards | 0 | 0% | 0 | 0% | |||||
Equity Awards | 0 | 0% | 0 | 0% | |||||
Fringe benefits | 0 | 0% | 0 | 0% | |||||
Pension benefits | 1,492 | 100% | 959 | 100% | |||||
Total compensation | 1,492 | 100% | 959 | 100% | |||||
445 |
Deutsche Bank | ||
Annual Report 2022 | ||
Outlook for the 2023 financial year
Total target compensation and maximum compensation
The total target compensation for 2023 will in principle remain unchanged compared to the total target compensation in force or adjusted in 2022.
The limits on compensation for the members of the Management Board remain unchanged versus the 2022 financial year. This means that the maximum possible achievement level for variable compensation amounts to 150%, and there is a cap at € 9.85 million that limits the sum of base salary, STA and LTA. In addition, in accordance with Section 87a (1) sentence 2 No. 1 of the German Stock Corporation Act (AktG), the limit set for total compensation is maintained unchanged at € 12 million uniformly for all members of the Management board as the maximum cap based on the financial year.
2023 objective structure and targets
The current compensation system works well and produces the right results. However, the system is perceived as very complex. For this reason, the Compensation Control Committee discussed in several meetings options to simplify the compensation structures without substantially changing the system itself. Therefore, the objective structure will continue to be in line with the compensation system approved by the General Meeting in 2021. However, appropriate adjustments were made in order to reduce the overall complexity of the system from the 2023 financial year onwards.
Short-Term Award (STA)
Generally unchanged from 2022, the amount of the Short-Term Award (STA) for the 2023 financial year will continue to be 40% of the total target variable compensation and is based on the individual achievement level of the short and medium-term individual as well as divisional objectives.
In 2022, the Short-Term Award consisted of three compensation components. From 2023 on the component "annual priorities" will be eliminated as a separate compensation component and its two objectives will be allocated to the remaining two components. The non-financial objective with a weighting to 5% is allocated to the "Individual Objectives" component and the financial objective with a weighting of 5% will be allocated to the "Balanced Scorecard" component.
From 2023, the STA components are:
- – Individual objectives (25%): 3 to 4 individual or divisional objectives and one additional non-financial “behavior objective”
- – Balanced Scorecards (15%): Individual and divisional/regional dashboards and Key Deliverables
The specific objectives of the Short-Term Award for 2023 will be disclosed retrospectively in the 2023 Compensation Report.
Long-Term Award (LTA)
The Long-Term Award (LTA) will continue to be 60% of the total target variable compensation and consists of collective long-term objectives linked to the Bank´s strategy.
In 2022, the Long-Term Award consisted of four compensation components. The components “ESG” and “Relative Total Shareholder Return” remain with unchanged weightings in 2023. The components “Organic Capital Growth” and “Group Component” will be combined into “Group Financials" weighting 25%; since the Organic Capital Growth and RoTE accurately reflect the capital increase, the Organic Capital Growth is removed as a separate objective.
From 2023, the LTA components are:
- – ESG Component (20%)
- – Relative Total Shareholder Return (15%)
- – Group Financials (CET1, RoTE and CIR) (25%)
On balance, these changes are improvements which simplify the compensation structure. They increase the emphasis on individual goals while preserving the consistency of the overall structure.
ESG
446 |
Deutsche Bank | ||
Annual Report 2022 | ||
In order to constantly align our compensation system with our sustainability strategy, the ESG Component including its assessment and evaluation criteria, has been revised and adjusted with a clear focus on the reduction of greenhouse gas emissions, regarding our own operations and furthermore, guiding our clients on their path to net zero. The remaining KPIs are kept unchanged to enable a long-term comparison and consistent assessment measurement.
The objectives of the ESG for the financial year 2023 are the following:
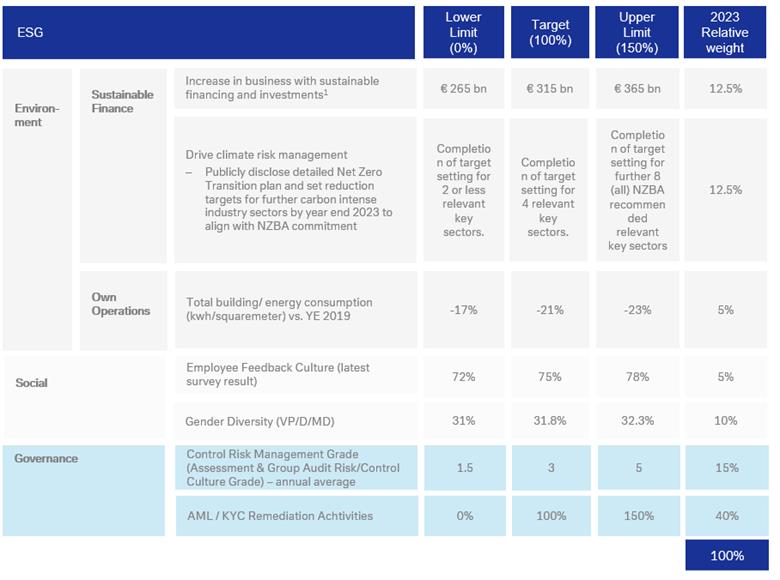
1The target value is an increase of € 100 billion compared to the previous year, based on a cumulative total volume of € 215 billion at the end of 2022.
The targets for the Relative Total Shareholder Return in relation to the average share returns of a selected peer group remain unchanged in 2023.
The “Financial Group Objectives” component contains important financial indicators, which are communicated as the Bank’s strategic objectives and constitute appropriate control instruments for the Bank. For 2023, these targets are the “Core capital ratio (CET1 ratio)”, the “Return on tangible equity (RoTE)” and the “cost/income ratio (CIR)”. In 2022, all three targets were already part of the Group Component.
447 |
Deutsche Bank | ||
Annual Report 2022 | ||
Compensation of members of the Supervisory Board
Supervisory Board compensation is regulated in Section 14 of the Articles of Association, which can be amended by the General Meeting if necessary. The compensation provisions redesigned in 2013 were last amended by resolution of the General Meeting on May 19, 2022, and became effective on July 20, 2022. Accordingly, the following provisions apply:
The members of the Supervisory Board receive fixed annual compensation (“Supervisory Board Compensation”). The annual base compensation amounts to € 100,000 for each Supervisory Board member. The Supervisory Board Chairman receives twice that amount and the Deputy Chairpersons one and a half times that amount.
Members and chairs of the committees of the Supervisory Board are paid additional fixed annual compensation as follows:
Dec 31, 2022 | ||||
Committee | Chair | Member | ||
Audit Committee | 200,000 | 100,000 | ||
Risk Committee | 200,000 | 100,000 | ||
Nomination Committee | 100,000 | 50,000 | ||
Mediation Committee | 0 | 0 | ||
Regulatory Oversight Committee1 | 200,000 | 100,000 | ||
Chairman’s Committee | 100,000 | 50,000 | ||
Compensation Control Committee | 100,000 | 50,000 | ||
Strategy and Sustainability Committee1 | 100,000 | 50,000 | ||
Technology, Data and Innovation Committee | 200,000 | 100,000 | ||
1On 28 July 2022, the Supervisory Board resolved that the Integrity Committee is renamed as the Regulatory Oversight Committee in order to make the focal point of its tasks more clear externally. For the same reason, the Supervisory Board resolved on 15 December 2022 that the Strategy Committee is renamed as the Strategy and Sustainability Committee.
75% of the compensation determined is disbursed to each Supervisory Board member after submitting invoices within the first three month of the following year. The other 25% is converted by the company at the same time into company shares based on the average closing price on the Frankfurt Stock Exchange (Xetra or successor system) during the last ten trading days of the preceding January, calculated to three digits after the decimal point. The share value of this number of shares is paid to the respective Supervisory Board member in February of the year following his departure from the Supervisory Board or the expiration of his term of office, based on the average closing price on the Frankfurt Stock Exchange (Xetra or successor system) during the last ten trading days of the preceding January, provided that the member does not leave the Supervisory Board due to important cause which would have justified dismissal (forfeiture regulation).
In case of a change in Supervisory Board membership during the year, compensation for the financial year will be paid on a pro rata basis, rounded up/down to full months. For the year of departure, the entire compensation is paid in cash; a forfeiture regulation applies to 25% of the compensation for that financial year.
The company reimburses the Supervisory Board members for the cash expenses they incur in the performance of their office, including any value added tax (VAT) on their compensation and reimbursements of expenses. Furthermore, any employer contributions to social security schemes that may be applicable under foreign law to the performance of their Supervisory Board work shall be paid for each Supervisory Board member affected. Finally, the Supervisory Board Chairman will be reimbursed appropriately for travel expenses incurred in performing representative tasks due to his function and reimbursed for costs for the security measures required based on his function.
In the interest of the company, the members of the Supervisory Board will be included in an appropriate amount in any financial liability insurance policy held by the company. The premiums for this are paid by the company.
Supervisory Board Compensation for the 2022 and 2021 financial years
Individual members of the Supervisory Board received the following compensation for the 2022 and 2021 financial years (excluding value added tax). The following two tables show the compensation paid and owed to the members of the Supervisory Board in the 2022 and 2021 financial years pursuant to Section 162 (1) sentence 1 of the German Stock Corporation Act (AktG).
448 |
Deutsche Bank | ||
Annual Report 2022 | ||
Compensation for fiscal year 2022 | ||||||||||||||
Members of the Supervisory Board | Base salary | Compensation for Committees1 | Total Compensation | Thereof payable in 1st quarter 2023 | ||||||||||
in € | in % | in € | in % | in € | in € | in % | ||||||||
Alexander Wynaendts2 | 116,667 | 24% | 379,167 | 76% | 495,833 | 371,875 | 75% | |||||||
Dr. Paul Achleitner3 | 83,333 | 22% | 291,667 | 78% | 375,000 | 375,000 | 100% | |||||||
Detlef Polaschek | 150,000 | 33% | 300,000 | 67% | 450,000 | 337,500 | 75% | |||||||
Ludwig Blomeyer-Bartenstein | 100,000 | 33% | 200,000 | 67% | 300,000 | 225,000 | 75% | |||||||
Mayree Clark | 100,000 | 23% | 329,167 | 77% | 429,167 | 321,875 | 75% | |||||||
Jan Duscheck | 100,000 | 33% | 200,000 | 67% | 300,000 | 225,000 | 75% | |||||||
Manja Eifert4 | 75,000 | 64% | 41,667 | 36% | 116,667 | 87,500 | 75% | |||||||
Dr. Gerhard Eschelbeck3 | 41,667 | 40% | 62,500 | 60% | 104,167 | 104,167 | 100% | |||||||
Sigmar Gabriel | 100,000 | 50% | 100,000 | 50% | 200,000 | 150,000 | 75% | |||||||
Timo Heider | 100,000 | 32% | 208,333 | 68% | 308,333 | 231,250 | 75% | |||||||
Martina Klee | 100,000 | 50% | 100,000 | 50% | 200,000 | 150,000 | 75% | |||||||
Henriette Mark5 | 25,000 | 40% | 37,500 | 60% | 62,500 | 62,500 | 100% | |||||||
Gabriele Platscher | 100,000 | 33% | 200,000 | 67% | 300,000 | 225,000 | 75% | |||||||
Bernd Rose | 100,000 | 29% | 250,000 | 71% | 350,000 | 262,500 | 75% | |||||||
Yngve Slyngstad2 | 58,333 | 58% | 41,667 | 42% | 100,000 | 75,000 | 75% | |||||||
John Alexander Thain | 100,000 | 50% | 100,000 | 50% | 200,000 | 150,000 | 75% | |||||||
Michele Trogni | 100,000 | 22% | 350,000 | 78% | 450,000 | 337,500 | 75% | |||||||
Dr. Dagmar Valcárcel | 100,000 | 22% | 350,000 | 78% | 450,000 | 337,500 | 75% | |||||||
Stefan Viertel | 100,000 | 31% | 220,833 | 69% | 320,833 | 240,625 | 75% | |||||||
Dr. Theodor Weimer | 100,000 | 50% | 100,000 | 50% | 200,000 | 150,000 | 75% | |||||||
Frank Werneke | 100,000 | 33% | 200,000 | 67% | 300,000 | 225,000 | 75% | |||||||
Prof. Dr. Norbert Winkeljohann | 120,833 | 23% | 400,000 | 77% | 520,833 | 390,625 | 75% | |||||||
Frank Witter | 100,000 | 33% | 200,000 | 67% | 300,000 | 225,000 | 75% | |||||||
Total | 2,170,833 | 32% | 4,662,500 | 68% | 6,833,333 | 5,260,417 | 77% | |||||||
1The respective memberships of the Supervisory Board committees in the 2022 financial year are presented in the section Committees of the Supervisory Board.
2Member of the Supervisory Board since May 19,2022.
3Member of the Supervisory Board until May 19, 2022.
4Member of the Supervisory Board since April 7, 2022.
5Member of the Supervisory Board until March 31, 2022.
Compensation for fiscal year 2021 | ||||||||||||||
Members of the Supervisory Board | Base salary | Compensation for Committees1 | Total Compensation | Thereof paid in 1st quarter 2022 | ||||||||||
in € | in % | in € | in % | in € | in € | in % | ||||||||
Dr. Paul Achleitner | 200,000 | 23% | 670,833 | 77% | 870,833 | 653,125 | 75% | |||||||
Detlef Polaschek | 150,000 | 33% | 300,000 | 67% | 450,000 | 337,500 | 75% | |||||||
Ludwig Blomeyer-Bartenstein | 100,000 | 33% | 200,000 | 67% | 300,000 | 225,000 | 75% | |||||||
Frank Bsirske2 | 83,333 | 33% | 166,667 | 67% | 250,000 | 250,000 | 100% | |||||||
Mayree Clark | 100,000 | 22% | 350,000 | 78% | 450,000 | 337,500 | 75% | |||||||
Jan Duscheck | 100,000 | 37% | 170,833 | 63% | 270,833 | 203,125 | 75% | |||||||
Dr. Gerhard Eschelbeck | 100,000 | 46% | 116,667 | 54% | 216,667 | 162,500 | 75% | |||||||
Sigmar Gabriel | 100,000 | 50% | 100,000 | 50% | 200,000 | 150,000 | 75% | |||||||
Timo Heider | 100,000 | 34% | 191,667 | 66% | 291,667 | 218,750 | 75% | |||||||
Martina Klee | 100,000 | 59% | 70,833 | 41% | 170,833 | 128,125 | 75% | |||||||
Henriette Mark | 100,000 | 40% | 150,000 | 60% | 250,000 | 187,500 | 75% | |||||||
Gabriele Platscher | 100,000 | 33% | 200,000 | 67% | 300,000 | 225,000 | 75% | |||||||
Bernd Rose | 100,000 | 31% | 220,833 | 69% | 320,833 | 240,625 | 75% | |||||||
Gerd Alexander Schütz3 | 41,667 | 83% | 8,333 | 17% | 50,000 | 50,000 | 100% | |||||||
John Alexander Thain | 100,000 | 50% | 100,000 | 50% | 200,000 | 150,000 | 75% | |||||||
Michele Trogni | 100,000 | 26% | 291,667 | 74% | 391,667 | 293,750 | 75% | |||||||
Dr. Dagmar Valcárcel | 100,000 | 22% | 350,000 | 78% | 450,000 | 337,500 | 75% | |||||||
Stefan Viertel | 100,000 | 41% | 141,667 | 59% | 241,667 | 181,250 | 75% | |||||||
Dr. Theodor Weimer | 100,000 | 50% | 100,000 | 50% | 200,000 | 150,000 | 75% | |||||||
Frank Werneke4 | 8,333 | 100% | 0 | 0% | 8,333 | 6,250 | 75% | |||||||
Prof. Dr. Norbert Winkeljohann | 100,000 | 20% | 395,833 | 80% | 495,833 | 371,875 | 75% | |||||||
Frank Witter5 | 58,333 | 41% | 83,333 | 59% | 141,667 | 106,250 | 75% | |||||||
Total | 2,141,666 | 33% | 4,379,166 | 67% | 6,520,833 | 4,965,625 | 76% | |||||||
1The respective memberships of the Supervisory Board committees in the 2021 financial year are presented in the Annual Report 2021 on page 429.
2Member of the Supervisory Board until October 27, 2021.
3Member of the Supervisory Board until May 27, 2021.
4Member of the Supervisory Board since November 25, 2021.
5Member of the Supervisory Board since May 27, 2021.
Following the submission of invoices 25% of the compensation determined for each Supervisory Board member for the 2022 financial year was converted into notional shares of the company on the basis of a share price of € 12.0496 (average closing price on the Frankfurt Stock Exchange (Xetra) during the last ten trading days of January 2023). Members who left the Supervisory Board in 2022 were paid the entire amount of compensation in cash.
449 |
Deutsche Bank | ||
Annual Report 2022 | ||
The following table shows the number of notional shares of the Supervisory Board members, to three digits after the decimal point, that were awarded in the first three months 2023 as part of their 2022 compensation, and the change versus the prior year, the number of notional shares accrued from previous years as part of the compensation, the total number of notional shares accumulated during the respective periods of membership in the Supervisory Board, and the change versus the prior year, as well as the total amounts paid out in February 2023 for members that left the Supervisory Board.
Number of notional shares | ||||||||||||
Members of the Supervisory Board | Converted in | Change compared to previous year in % |
| Total (cumulative) | Change compared to previous year in % | In February 2023 | ||||||
Alexander Wynaendts2 | 10,287.340 | N/A | 0 | 10,287.340 | N/A | 0 | ||||||
Dr. Paul Achleitner3 | 0 | N/A | 104,444.785 | 104,444.785 | 0% | 1,258,518 | ||||||
Detlef Polaschek | 9,336.410 | -4% | 44,909.808 | 54,246.218 | 21% | 0 | ||||||
Ludwig Blomeyer-Bartenstein | 6,224.273 | -4% | 29,939.872 | 36,164.145 | 21% | 0 | ||||||
Mayree Clark | 8,904.168 | -8% | 39,849.378 | 48,753.546 | 22% | 0 | ||||||
Jan Duscheck | 6,224.273 | 7% | 25,398.115 | 31,622.388 | 25% | 0 | ||||||
Manja Eifert4 | 2,420.551 | N/A | 0 | 2,420.551 | N/A | 0 | ||||||
Dr. Gerhard Eschelbeck3 | 0 | N/A | 18,653.863 | 18,653.863 | 0% | 224,772 | ||||||
Sigmar Gabriel | 4,149.515 | -4% | 8,974.025 | 13,123.540 | 46% | 0 | ||||||
Timo Heider | 6,397.169 | 2% | 25,846.336 | 32,243.505 | 25% | 0 | ||||||
Martina Klee | 4,149.515 | 13% | 15,418.158 | 19,567.673 | 27% | 0 | ||||||
Henriette Mark5 | 0 | N/A | 24,949.893 | 24,949.893 | 0% | 300,636 | ||||||
Gabriele Platscher | 6,224.273 | -4% | 29,939.872 | 36,164.145 | 21% | 0 | ||||||
Bernd Rose | 7,261.652 | 5% | 27,174.511 | 34,436.163 | 27% | 0 | ||||||
Yngve Slyngstad2 | 2,074.758 | N/A | 0 | 2,074.758 | N/A | 0 | ||||||
John Alexander Thain | 4,149.515 | -4% | 19,959.915 | 24,109.430 | 21% | 0 | ||||||
Michele Trogni | 9,336.410 | 11% | 33,979.446 | 43,315.856 | 27% | 0 | ||||||
Dr. Dagmar Valcárcel | 9,336.410 | -4% | 26,921.443 | 36,257.853 | 35% | 0 | ||||||
Stefan Viertel | 6,656.514 | 28% | 5,199.369 | 11,855.883 | 128% | 0 | ||||||
Dr. Theodor Weimer | 4,149.515 | -4% | 7,339.140 | 11,488.655 | 57% | 0 | ||||||
Frank Werneke | 6,224.273 | N/M | 179.289 | 6,403.562 | N/M | 0 | ||||||
Prof. Dr. Norbert Winkeljohann | 10,806.030 | 1% | 38,562.948 | 49,368.978 | 28% | 0 | ||||||
Frank Witter | 6,224.273 | 104% | 3,047.906 | 9,272.179 | 204% | 0 | ||||||
Total | 130,536.837 | 9% | 530,688.072 | 661,224.909 | 37% | 1,783,926 | ||||||
1At a value of € 12.0496 based on the average closing price on the Frankfurt Stock Exchange (Xetra or successor system) during the last ten trading days of January 2023.
2Member since May 19, 2022.
3Member until May 19, 2022.
4Member since April 7, 2022.
5Member until March 31, 2022.
All employee representatives on the Supervisory Board, with the exception of Jan Duscheck and Frank Werneke, are employed by Deutsche Bank Group. In the 2022 financial year, we paid such members a total amount of € 1.28 million in the form of salary, retirement and pension compensation in addition to their Supervisory Board compensation.
We do not provide members of the Supervisory Board with any benefits after they have left the Supervisory Board, though members who are or were employed by us are entitled to the benefits associated with the termination of such employment. During 2022, we set aside € 0.07 million for pension, retirement or similar benefits for the members of the Supervisory Board who are or were employed by us.
With the agreement of the Bank’s Management Board, Dr. Paul Achleitner (Chairman of the Supervisory Board until May 19, 2022) performed representative functions in various ways on an unpaid basis for the Bank and participated in opportunities for referrals of business for the Bank. These tasks were related to the functional responsibilities of the Chairman of the Supervisory Board of Deutsche Bank AG. In this respect, the reimbursement of costs is provided for in the Articles of Association. On the basis of a separate contractual agreement, the Bank provided Dr. Paul Achleitner with infrastructure and support services free of charge for his services in the interest of the Bank. He was therefore entitled to avail himself of internal resources for preparing and carrying out these activities. The Bank’s security and car services were available for Dr. Paul Achleitner for use free of charge for these tasks. The Bank also reimbursed travel expenses and attendance fees and covered the taxes for any non-cash benefits provided. On September 24, 2012, the Chairman’s Committee approved the conclusion of this agreement. The provisions applied for the duration of Dr. Paul Achleitner’s tenure as Chairman of the Supervisory Board and were reviewed on an annual basis for appropriateness. Under this agreement between Deutsche Bank and Dr. Achleitner, support services equivalent to € 51,000 (2021: € 95,000) were provided and reimbursements for expenses amounting to € 194,000 (2021 € 209,589) were paid during the 2022 financial year.
450 |
Deutsche Bank | ||
Annual Report 2022 | ||
Comparative presentation of compensation and earnings trends
The following table shows the comparative presentation of the change from year to year in the compensation, in the earnings of the company and the Group as well as the average compensation of employees on a full-time equivalent basis. The information provided pursuant to Section 162 (1) sentence 2 No. 2 of the German Stock Corporation Act will be successively expanded with the change from one financial year to the prior year until a reporting period of five years is reached. Starting with the 2025 financial year, the year-to-year changes will be shown for each of the past five years.
The information on the compensation of the current and former members of the Management Board and Supervisory Board reflects the individualized statement in the Compensation Report of the paid or owed compensation pursuant to Section 162 (1) sentence 2 No. 1 of the German Stock Corporation Act. The presentation of the development of the company’s earnings is to reflect, according to the legal requirements, those of the stand-alone listed company, i.e. Deutsche Bank AG. Accordingly, the net income (net loss) of Deutsche Bank AG is used to present earnings within the meaning of Section 162 (1) sentence 2 No. 2 of the German Stock Corporation Act. As the Management Board compensation is measured on the basis of Group figures, the earnings figures for the Group are additionally shown for the comparative presentation. These Group earnings figures are net income (net loss), cost/income ratio and Return on Tangible Equity (RoTE). For the group of employees for the comparison, the data relevant for Deutsche Bank Group were used in light of Deutsche Bank’s global workforce. The group of employees for the comparison comprises all of the employees worldwide of Deutsche Bank Group.
451 |
Deutsche Bank | ||
Annual Report 2022 | ||
2022 | 2021 | 2020 | Annual change from 2022 to 2021 in % | Annual change from 2021 to 2020 in % | ||||||
1. Company profit development | ||||||||||
Net income (net loss) of Deutsche Bank AG (in € m) | 5,506 | 1,9191 | (1,769) | 187 | N/M | |||||
Net income (net loss) of Deutsche Bank Group (in € m) | 5,525 | 2,365 | 495 | 134 | N/M | |||||
Cost/income ratio of Deutsche Bank Group (in %) | 74.9% | 84.6% | 88.3% | (11) | (4) | |||||
Return on Tangible Equity (RoTE) of Deutsche Bank Group (in %) | 9.4% | 3.8% | 0.2% | 147 | N/M | |||||
2. Average compensation employees | ||||||||||
World-wide on a full-time equivalent basis2 | 125,301 | 120,336 | 113,350 | 4 | 6 | |||||
3. Management Board compensation (in € t.) | ||||||||||
Current Management Board members | ||||||||||
Christian Sewing (Member since January 1, 2015) | 4,394 | 3,867 | 3,352 | 14 | 15 | |||||
James von Moltke (Member since July 1, 2017) | 3,783 | 4,009 | 3,635 | (6) | 10 | |||||
Karl von Rohr (Member since November 1, 2015) | 3,444 | 3,235 | 2,930 | 6 | 10 | |||||
Fabrizio Campelli (Member since November 1, 2019) | 2,744 | 2,420 | 2,222 | 13 | 9 | |||||
Bernd Leukert (Member since January 1, 2020) | 2,593 | 2,419 | 2,222 | 7 | 9 | |||||
Alexander von zur Mühlen (Member since August 1, 2020) | 3,412 | 3,157 | 1,282 | 8 | 146 | |||||
Christiana Riley (Member since January 1, 2020) | 3,653 | 3,079 | 3,034 | 19 | 1 | |||||
Rebecca Short (Member since May 1, 2021) | 2,436 | 1,606 | - | 52 | N/M | |||||
Prof. Dr. Stefan Simon (Member since August 1, 2020) | 2,488 | 2,446 | 1,007 | 2 | 143 | |||||
Olivier Vigneron (Member since May 20, 2022) | 1,508 | - | - | N/M | N/M | |||||
Members who left the Management Board during the financial year | ||||||||||
Stuart Lewis (Member until May 19, 2022) | 2,648 | 3,079 | 2,912 | (14) | 6 | |||||
Members who left the Management Board before the financial year | ||||||||||
Frank Kuhnke (Member until 30 April 2021) | 1,626 | 2,264 | 2,207 | (28) | 3 | |||||
Werner Steinmüller (Member until July 31, 2020) | 283 | 3,117 | 2,436 | (91) | 28 | |||||
Sylvie Matherat (Member until July 31, 2019) | 134 | 211 | 2,7193 | (36) | (92) | |||||
Garth Ritchie (Member until July 31, 2019) | 268 | 2,071 | 4,1853 | (87) | (51) | |||||
Frank Strauß (Member until July 31, 2019) | 326 | 326 | 2,168 | N/M | (85) | |||||
Nicolas Moreau (Member until Dec 31, 2018) | 317 | 299 | 1,826 | 6 | (84) | |||||
Kimberly Hammonds (Member until May 24, 2018) | 71 | 124 | 52 | (43) | 138 | |||||
Dr. Marcus Schenck (Member until May 24, 2018) | 65 | 65 | 65 | N/M | N/M | |||||
John Cryan (Member until April 8, 2018) | 47 | 47 | 47 | N/M | N/M | |||||
Hermann-Josef Lamberti (Member until May 31, 2012) | 1,492 | 1,414 | 1,450 | 6 | (2) | |||||
Josef Ackermann (Member until May 31, 2012) | 959 | 924 | 911 | 4 | 1 | |||||
4. Supervisory Board compensation (in € tsd.) | ||||||||||
Current Supervisory Board members | ||||||||||
Alexander Wynaendts (Member since May 19, 2022) | 496 | - | - | N/M | N/M | |||||
Detlef Polaschek (Member since May 24, 2018) | 450 | 450 | 450 | N/M | N/M | |||||
Prof. Dr. Norbert Winkeljohann (Member since August 1, 2018) | 521 | 496 | 450 | 5 | 10 | |||||
Ludwig Blomeyer-Bartenstein (Member since May 24, 2018) | 300 | 300 | 300 | N/M | N/M | |||||
Mayree Clark (Member since May 24, 2018) | 429 | 450 | 425 | (5) | 6 | |||||
Jan Duscheck Member since August 2, 2016) | 300 | 271 | 250 | 11 | 8 | |||||
Manja Eifert (Member since April 7, 2022) | 117 | - | - | N/M | N/M | |||||
Sigmar Gabriel (Member since March 11, 2020) | 200 | 200 | 167 | N/M | 20 | |||||
Timo Heider (Member since May 23, 2013) | 308 | 292 | 250 | 5 | 17 | |||||
Martina Klee (Member since May 29, 2008) | 200 | 171 | 150 | 17 | 14 | |||||
Gabriele Platscher (Member since June 10, 2003) | 300 | 300 | 300 | N/M | N/M | |||||
Bernd Rose (Member since May 23, 2013) | 350 | 321 | 275 | 9 | 17 | |||||
Yngve Slyngstad (Member since May 19, 2022) | 100 | - | - | N/M | N/M | |||||
John Alexander Thain (Member since May 24, 2018) | 200 | 200 | 200 | N/M | N/M | |||||
Michele Trogni (Member since May 24, 2018) | 450 | 392 | 350 | 15 | 12 | |||||
Dr. Dagmar Valcárcel (Member since August 1, 2019) | 450 | 450 | 425 | N/M | 6 | |||||
Stefan Viertel (Member since January 1, 2021) | 321 | 242 | - | 33 | N/M | |||||
Dr. Theodor Weimer (Member since May 20, 2020) | 200 | 200 | 108 | N/M | 85 | |||||
Frank Werneke (Member since November 25, 2021) | 300 | 8 | - | N/M | N/M | |||||
Frank Witter (Member since May 27, 2021) | 300 | 142 | - | 111 | N/M | |||||
Former Members of the Supervisory Board | ||||||||||
Dr. Paul Achleitner (Member until May 19, 2022) | 375 | 871 | 802 | (57) | 9 | |||||
Frank Bsirske (Member until October 27, 2021) | - | 250 | 300 | N/M | (17) | |||||
Dr. Gerhard Eschelbeck (Member until May 19, 2022) | 104 | 217 | 150 | (52) | 45 | |||||
Henriette Mark (Member until March 31, 2022) | 63 | 250 | 250 | (75) | N/M | |||||
Gerd Alexander Schütz (Member until May 27, 2021) | - | 50 | 175 | N/M | (71) | |||||
Stephan Szukalski (Member until December 31, 2020) | - | - | 200 | N/M | N/M | |||||
Katherine Garrett-Cox (Member until May 20, 2020) | - | - | 100 | N/M | N/M | |||||
1Prior year comparatives aligned to the presentation in the current year.
2The average compensation of employees based on a full-time equivalent basis. Improved determination approach for the years 2022-2020.
3Including termination benefits for 2020.
452 |
Deutsche Bank | ||
Annual Report 2022 | ||
Independent auditor’s report
To Deutsche Bank Aktiengesellschaft, Frankfurt am Main
We have audited the attached remuneration report of Deutsche Bank Aktiengesellschaft, Frankfurt am Main prepared to comply with Sec. 162 AktG [“Aktiengesetz”: German Stock Corporation Act] for the fiscal year from 1. January 2022 to 31. December 2022 and the related disclosures.
Responsibilities of the executive directors and the supervisory board
The executive directors and supervisory board of Deutsche Bank Aktiengesellschaft are responsible for the preparation of the remuneration report and the related disclosures in compliance with the requirements of Sec. 162 AktG. In addition, the executive directors and supervisory board are responsible for such internal control as they determine is necessary to enable the preparation of a remuneration report and the related disclosures that are free from material misstatement, whether due to fraud or error.
Auditor’s responsibility
Our responsibility is to express an opinion on this remuneration report and the related disclosures based on our audit. We conducted our audit in compliance with German Generally Accepted Standards for Financial Statement Audits promulgated by the Institut der Wirtschaftsprüfer [Institute of Public Auditors in Germany] (IDW). Those standards require that we comply with ethical requirements and plan and perform the audit to obtain reasonable assurance about whether the remuneration report and the related disclosures are free from material misstatement.
An audit involves performing procedures to obtain audit evidence about the amounts in the remuneration report and the related disclosures. The procedures selected depend on the auditor’s judgment, including the assessment of the risks of material misstatement of the remuneration report and the related disclosures, whether due to fraud or error. In making those risk assessments, the auditor considers internal control relevant to the preparation of the remuneration report and the related disclosures in order to plan and perform audit procedures that are appropriate in the circumstances, but not for the purpose of expressing an opinion on the effectiveness of the entity’s internal control. An audit also includes evaluating the accounting policies used and the reasonableness of accounting estimates made by the executive directors and supervisory board, as well as evaluating the overall presentation of the remuneration report and the related disclosures.
We believe that the evidence we have obtained is sufficient and appropriate to provide a basis for our opinion.
Opinion
In our opinion, on the basis of the knowledge obtained in the audit, the remuneration report for the fiscal year from 1 January 2022 to 31 December 2022 and the related disclosures comply, in all material respects, with the financial reporting provisions of Sec. 162 AktG.
Other matter – formal audit of the remuneration report
The audit of the content of the remuneration report described in this auditor’s report comprises the formal audit of the remuneration report required by Sec. 162 (3) AktG and the issue of a report on this audit. As we are issuing an unqualified opinion on the audit of the content of the remuneration report, this also includes the opinion that the disclosures pursuant to Sec. 162 (1) and (2) AktG are made in the remuneration report in all material respects.
453 |
Deutsche Bank | ||
Annual Report 2022 | ||
Limitation of liability
The “General Engagement Terms for Wirtschaftsprüfer and Wirtschaftsprüfungsgesellschaften [German Public Auditors and Public Audit Firms]” as issued by the IDW on 1 January 2017, which are attached to this report, are applicable to this engagement and also govern our responsibility and liability to third parties in the context of this engagement.
Eschborn/Frankfurt am Main, 13 March 2023
Ernst & Young GmbH
Wirtschaftsprüfungsgesellschaft
LöskenMai
Wirtschaftsprüfer Wirtschaftsprüfer
[German Public Auditor] [German Public Auditor]
454 |
Deutsche Bank | ||
Annual Report 2022 | ||
Compensation of the employees (unaudited)
The content of the 2022 Employee Compensation Report is based on the qualitative and quantitative remuneration disclosure requirements outlined in Article 450 No. 1 (a) to (j) Capital Requirements Regulation (CRR) in conjunction with Section 16 of the Remuneration Ordinance for Institutions (Institutsvergütungsverordnung – InstVV).
This Compensation Report takes a group-wide view and covers all consolidated entities of the Deutsche Bank Group. In accordance with regulatory requirements, equivalent reports for 2022 are prepared for the following Significant Institutions within Deutsche Bank Group: BHW Bausparkasse AG, Germany; Deutsche Bank Luxembourg S.A., Luxembourg; Deutsche Bank S.p.A., Italy; Deutsche Bank Mutui S.p.A., Italy; Deutsche Bank S.A.E., Spain.
Regulatory environment
Ensuring compliance with regulatory requirements is an overarching consideration in the bank’s Group Compensation Strategy. The bank strives to be at the forefront of implementing regulatory requirements with respect to compensation and will continue to maintain a close exchange with its prudential supervisor, the European Central Bank (ECB), to be in compliance with all existing and new requirements.
As an EU-headquartered institution, Deutsche Bank is subject to the Capital Requirements Regulation/Directive (CRR/CRD) globally, as transposed into German national law in the German Banking Act and InstVV. These rules are applied to all of Deutsche Bank subsidiaries and branches world-wide to the extent required in accordance with Section 27 InstVV. As a Significant Institution within the meaning of InstVV, Deutsche Bank identifies all employees whose work is deemed to have a material impact on the overall risk profile (Material Risk Takers or MRTs) in accordance with the updated criteria stipulated in the German Baking Act and in the Commission Delegated Regulation 2021/923. Deutsche Bank identifies MRTs at a Group level, at the level of Significant Institutions and, in accordance with the German Banking Act, for all CRR institutions at a solo level.
Taking into account more specific sectorial legislation and in accordance with InstVV, some of Deutsche Bank’s subsidiaries (in particular within the DWS Group) fall under sector specific remuneration rules, such as the Alternative Investments Fund Managers Directive (AIFMD), the Undertakings for Collective Investments in Transferable Securities Directive (UCITS) and the Investment Firm Directive (IFD) including the applicable local transpositions. MRTs are also identified in these subsidiaries. Identified employees are subject to the remuneration provisions outlined in the applicable Guidelines on sound remuneration policies published by the European Securities and Markets Authority (ESMA) and the European Banking Authority (EBA).
Deutsche Bank takes into account the regulations targeted at employees who engage directly or indirectly with the bank’s clients, for instance as per the local transpositions of the Markets in Financial Instruments Directive II – MiFID II. Accordingly, specific provisions for employees deemed to be Relevant Persons are implemented with a view to ensuring that they act in the best interest of the bank’s clients.
Where applicable, Deutsche Bank is also subject to specific rules and regulations implemented by local regulators. Many of these requirements are aligned with the InstVV. However, where variations are apparent, proactive and open discussions with regulators have enabled the bank to follow the local regulations whilst ensuring that any impacted employees or locations remain within the bank’s overall Group Compensation Framework. This includes, for example, the compensation structures applied to Covered Employees in the United States under the requirements of the Federal Reserve Board. In any case, the InstVV requirements are applied as minimum standards globally.
455 |
Deutsche Bank | ||
Annual Report 2022 | ||
Compensation governance
Deutsche Bank has a robust governance structure enabling it to operate within the clear parameters of its Compensation Strategy and Policy. In accordance with the German two-tier board structure, the Supervisory Board governs the compensation of the Management Board members while the Management Board oversees compensation matters for all other employees in the Group. Both the Supervisory Board and the Management Board are supported by specific committees and functions, in particular the Compensation Control Committee (CCC), the Compensation Officer, and the Senior Executive Compensation Committee (SECC).
In line with their responsibilities, the bank’s control functions are involved in the design and application of the bank’s remuneration systems, in the identification of MRTs and in determining the total amount of VC. This includes assessing the impact of employees’ behavior and the business-related risks, performance criteria, granting of remuneration and severances as well as ex-post risk adjustments.
Reward governance structure
 |
1Does not comprise a complete list of Supervisory Board Committees.
2The Integrity Committee was replaced by the Regulatory Oversight Committee.
Compensation Control Committee (CCC)
The Supervisory Board has set up the CCC to support in establishing and monitoring the structure of the compensation system for the Management Board Members of Deutsche Bank AG. Furthermore, the CCC monitors the appropriateness of the compensation systems for the employees of Deutsche Bank Group, as established by the Management Board and the SECC. The CCC reviews whether the total amount of variable compensation is affordable and set in accordance with the risk, capital and liquidity situation as well as in alignment with the business and risk strategies. Furthermore, the CCC supports the Supervisory Board in monitoring the MRT identification process.
The CCC consists of the Supervisory Board Chairperson as well as two other Supervisory Board Members representing shareholders and three Supervisory Board Members representing employees. The Committee held six meetings in the calendar year 2022. The members of the Risk Committee attended two meetings as guests, the Chairperson of the Risk Committee attended four meetings as guest. Further details can be found in the Report of the Supervisory Board within the Annual Report.
Compensation Officer
The Management Board, in cooperation with the CCC, has appointed a Group Compensation Officer to support the Supervisory Boards of Deutsche Bank AG and of the bank’s Significant Institutions in Germany in performing their compensation related duties. The Compensation Officer is involved in the conceptual review, development, monitoring and application of the employees’ compensation systems, the MRT identification and remuneration disclosures on an ongoing basis. The Compensation Officer performs all relevant monitoring obligations independently, provides an assessment on the appropriateness of the design and strategy of the compensation systems for employees at least annually and regularly supports and advises the CCC.
456 |
Deutsche Bank | ||
Annual Report 2022 | ||
Senior Executive Compensation Committee (SECC)
The SECC is a delegated committee established by the Management Board which has the mandate to develop sustainable compensation principles, to prepare recommendations on Total Compensation levels and to ensure appropriate compensation governance and oversight. The SECC establishes the Compensation and Benefits Strategy and Policy. Moreover, using quantitative and qualitative factors, the SECC assesses Group and divisional performance as a basis for compensation decisions and makes recommendations to the Management Board regarding the total amount of annual variable compensation and its allocation across business divisions and infrastructure functions.
In order to maintain its independence, only representatives from infrastructure and control functions who are not aligned to any of the business divisions are members of the SECC. In 2022, the SECC’s membership comprised of the Global Head of Human Resources and the Chief Financial Officer as Co-Chairpersons, the Global Head of Compliance, the Global Head of Performance & Reward as well as an additional representative from both Finance and Risk as voting members. The Compensation Officer, the Deputy Compensation Officer and an additional representative from Finance participated as nonvoting members. The SECC generally meets on a monthly basis but with more frequent meetings during the compensation process. It held twenty meetings in total with regard to the compensation process for the performance year 2022.
Compensation and Benefits Strategy
Deutsche Bank recognizes that its compensation framework plays a vital role in supporting its strategic objectives. It enables the bank to attract and retain the individuals required to achieve the bank’s objectives. The Compensation and Benefits Strategy is aligned to Deutsche Bank’s business strategy, risk strategy, and to its corporate values and beliefs as outlined below.
 |
457 |
Deutsche Bank | ||
Annual Report 2022 | ||
Group Compensation Framework
The compensation framework, generally applicable globally across all regions and business lines, emphasizes an appropriate balance between Fixed Pay (FP) and Variable Compensation (VC) – together forming Total Compensation (TC). It aligns incentives for sustainable performance at all levels of Deutsche Bank whilst ensuring the transparency of compensation decisions and their impact on shareholders and employees. The underlying principles of the compensation framework are applied to all employees equally, irrespective of differences in seniority, tenure, gender or ethnicity.
Pursuant to CRD and the requirements subsequently adopted in the German Banking Act, Deutsche Bank is subject to a maximum ratio of 1:1 with regard to fixed-to-variable remuneration components, which was increased to 1:2 with shareholder approval on May 22, 2014 with an approval rate of 95.27%, based on valid votes by 27.68% of the share capital represented at the Annual General Meeting. Nonetheless, the bank has determined that employees in specific infrastructure functions (such as Legal, Group Tax and Human Resources) should continue to be subject to a maximum ratio of 1:1 while Control Functions as defined by InstVV are subject to a maximum ratio of 2:1. These Control Functions comprise Risk, Compliance, Anti-Financial Crime, Group Audit and the Compensation Officer and his Deputy.
The bank has assigned a Reference Total Compensation (RTC) to eligible employees that describes a reference value for their role. This value provides employees with orientation on their FP and VC. Actual individual TC can be at, above or below the Reference Total Compensation, depending on VC decisions.
Fixed Pay is used to compensate employees for their skills, experience and competencies, commensurate with the requirements, size and scope of their role. The appropriate level of FP is determined with reference to the prevailing market rates for each role, internal comparisons and applicable regulatory requirements. FP plays a key role in order to attract and retain the right talent. For the majority of employees, FP is the primary compensation component.
Variable Compensation reflects affordability and performance at Group, divisional, and individual level. It allows the bank to differentiate individual performance and to drive behavior through appropriate incentives that can positively influence culture. It also allows for flexibility in the cost base. VC generally consists of two elements – the Group VC Component and the Individual VC Component.
The Group VC Component is based on one of the overarching goals of the compensation framework – to ensure an explicit link between VC and the performance of the Group. To assess the bank’s annual achievements in reaching its strategic targets, the four Key Performance Indicators (KPIs) utilized as the basis for determining the 2022 Group VC Component were: Common Equity Tier 1 (CET 1) Capital Ratio, Cost/Income Ratio (CIR), Post-Tax Return on Tangible Equity (RoTE) and ESG – Sustainable Finance Volume. These four KPIs represent the bank’s capital, cost, profitability and sustainability targets.
The Individual VC Component is delivered either in the form of Individual VC or as Recognition Award. An employee’s eligibility to receive either of these VC elements depends on division, region, profession, and Corporate Title. In case of negative performance contributions or misconduct, an employee’s VC can be reduced accordingly and can go down to zero. VC is granted and paid out subject to Group affordability. Under the compensation framework, there continues to be no guarantee of VC in an existing employment relationship. Such arrangements are utilized only on a very limited basis for new hires in the first year of employment and are subject to the bank’s standard deferral requirements.
Key components of the compensation framework
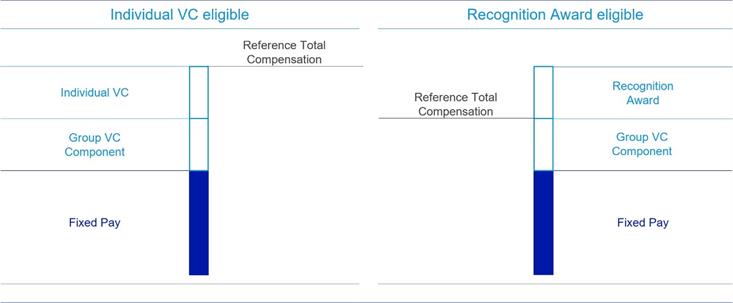 |
458 |
Deutsche Bank | ||
Annual Report 2022 | ||
Individual VC takes into consideration a number of financial and nonfinancial factors, including the applicable divisional performance, the employee’s individual performance, conduct, and adherence to values and beliefs, as well as additional factors such as the bank’s strategic decisions and retention considerations.
Recognition Awards provide the opportunity to acknowledge and reward outstanding contributions made by the employees of lower seniority levels in a timely and transparent manner. Generally, the overall size of the Recognition Award budget is directly linked to a set percentage of FP for the eligible population and it can be paid out up to four times a year, following a review of nominations and contributions in a process managed at the divisional level.
In the context of InstVV, severance payments are considered variable compensation. The bank’s severance framework ensures full alignment with the respective InstVV requirements.
Employee benefits complement Total Compensation and are considered FP from a regulatory perspective, as they have no direct link to performance or discretion. They are granted in accordance with applicable local market practices and requirements. Pension expenses represent the main element of the bank’s benefits portfolio globally.
Employee groups with specific compensation structures
For some areas of the bank, compensation structures apply that deviate, within regulatory boundaries, in some aspects from the Group Compensation Framework outlined above.
Postbank units
While generally executive staff of former Postbank follow the remuneration structure of Deutsche Bank, the compensation for any other staff in Postbank units is based on specific frameworks agreed with trade unions or with the respective workers’ councils. Where no collective agreements exist, compensation is subject to individual contracts. In general, nonexecutive and tariff staff in Postbank units receive VC, but the structure and portion of VC can differ between legal entities.
DWS
The vast majority of DWS asset management entities and employees fall under AIFMD, UCITS or IFD, while a limited number of employees remain in scope of the bank’s Group Compensation Framework and InstVV. DWS has established its own compensation governance, policy, and structures, as well as Risk Taker identification process in line with AIFMD/UCITS/IFD requirements. These structures and processes are aligned with InstVV where required but tailored towards the Asset Management business. Pursuant to the ESMA Guidelines, DWS’s compensation strategy is designed to ensure an appropriate ratio between fixed and variable compensation.
Generally, DWS applies remuneration rules that are equivalent to the Deutsche Bank Group approach, but use DWS Group-related parameters, where possible. Notable deviations from the Group Compensation Framework include the use of share-based instruments linked to DWS shares and fund-linked instruments. These serve to improve the alignment of employee compensation with DWS’ shareholders’ and investors’ interests.
Tariff staff
Within Deutsche Bank Group there are 15,191 tariff employees in Germany (based on full-time equivalent). Tariff staff are either subject to a collective agreement (Tarifvertrag für das private Bankgewerbe und die öffentlichen Banken), as negotiated between trade unions and employer associations, or subject to agreements as negotiated with the respective trade unions directly. The remuneration of tariff staff is included in the quantitative disclosures in this Report.
459 |
Deutsche Bank | ||
Annual Report 2022 | ||
Determination of performance-based variable compensation
The bank puts a strong focus on its governance related to compensation decision-making processes. A robust set of rule-based principles for compensation decisions with close links to the performance of both business and individual were applied.
The total amount of VC for any given performance year is derived from an assessment of the bank’s profitability, solvency, and liquidity position, and the determination of VC pools for divisions and infrastructure functions based on their performance in support of achieving the bank’s strategic objectives.
In a first step, Deutsche Bank assesses the bank’s profitability, solvency and liquidity position in line with its Risk Appetite Framework, including a holistic review against the bank’s multi-year strategic plan to determine what the bank “can” award in line with regulatory requirements (i.e. Group affordability). In the next step, the bank assesses divisional risk-adjusted performance, i.e. what the bank “should” award in order to provide an appropriate compensation for contributions to the bank’s success.
When assessing divisional performance, a range of considerations are referenced. Performance is assessed in the context of financial and – based on Balanced Scorecards – nonfinancial targets. The financial targets for front-office divisions are subject to appropriate risk-adjustment, in particular by referencing the degree of future potential risks to which Deutsche Bank may be exposed, and the amount of capital required to absorb severe unexpected losses arising from these risks. For the infrastructure functions, the financial performance assessment is mainly based on the achievement of cost targets. While the allocation of VC to infrastructure functions, and in particular to control functions, depends on both Deutsche Bank’s overall and their own performance, it is not dependent on the performance of the division(s) that these functions oversee.
At the level of the individual employee, the Variable Compensation Guiding Principles are established, which detail the factors and metrics that have to be taken into account when making Individual VC decisions. Managers must fully appreciate the risk-taking activities of individuals to ensure that VC allocations are balanced and risk-taking is not inappropriately incentivized. The factors and metrics to be considered include, but are not limited to, (i) business delivery (“What”), i.e. quantitative and qualitative financial, risk-adjusted and nonfinancial performance metrics, and (ii) behavior (“How”), i.e. culture, conduct and control considerations such as qualitative inputs from control functions or disciplinary sanctions. Generally, performance is assessed based on a one year period. However, for Management Board members of Significant Institutions, the performance across three years is taken into account.
460 |
Deutsche Bank | ||
Annual Report 2022 | ||
Variable compensation structure
The compensation structures are designed to provide a mechanism that promotes and supports long-term performance of employees and the bank. Whilst a portion of VC is paid upfront, these structures require that an appropriate portion is deferred to ensure alignment to the sustainable performance of the Group. For both parts of VC, Deutsche Bank shares are used as instruments and as an effective way to align compensation with Deutsche Bank’s sustainable performance and the interests of shareholders.
The bank continues to go beyond regulatory requirements with the scope as well as the amount of VC that is deferred and the minimum deferral periods for certain employee groups. The deferral rate and period are determined based on the risk categorization of the employee, the division and the business unit. Where applicable, the bank starts to defer parts of variable compensation for MRTs where VC is set at or above € 50,000 or where VC exceeds 1/3 of TC. For non-MRTs, deferrals start at higher levels of VC. MRTs are on average subject to deferral rates in excess of the minimum 40% (60% for Senior Management) as required by InstVV. For MRTs in Material Business Units (MBU) the bank applies a deferral rate of at least 50%. The VC threshold for MRTs requiring at least 60% deferral is set at € 500,000.
Furthermore, Directors and Managing Directors in Corporate Bank (CB), Investment Bank (IB) or Capital Release Unit (CRU) are subject to a VC deferral rate of 100% with respect to any VC in excess of € 500,000. Moreover, if fixed pay for these employees exceeds an amount of € 500,000, the full VC is deferred.
As detailed in the table below, deferral periods range from three to five years, dependent on employee groups.
Overview on 2022 award types (excluding DWS Group)
Award Type | Description | Beneficiaries | Deferral Period | Retention Period | Proportion | |||||
Upfront: | Upfront cash portion | All eligible employees | N/A | N/A | MRTs with VC ≥ € 50,000 or where VC exceeds 1/3 of TC: 50% of upfront VC | |||||
Upfront: | Upfront equity portion (linked to Deutsche Bank’s share price over the retention period) | All MRTs with VC ≥ € 50,000 or where VC exceeds 1/3 of TC € 500,000 | N/A | 12 months | 50% of upfront VC | |||||
Deferred: | Deferred cash portion | All employees with deferred VC | Equal tranche vesting: Non-MRTs in IB/CB/CRU: | N/A | 50% of deferred VC | |||||
Deferred: | Deferred equity portion (linked to Deutsche Bank’s share price over the vesting and retention period) | All employees with deferred VC | Equal tranche vesting: | 12 months for MRTs | 50% of deferred VC |
N/A – Not applicable
1For the purpose of Performance Year 2022 annual awards, Senior Management is defined as Deutsche Bank AG MB-1 positions; voting members of Business Division Top Executive Committees; MB members of Significant Institutions; respective MB-1 positions with managerial responsibility; for the specific deferral rules for the Management Board of Deutsche Bank AG refer to the Compensation Report for the Management Board
Employees are not allowed to sell, pledge, transfer or assign a deferred award or any rights in respect to the award. They may not enter into any transaction having an economic effect of hedging any variable compensation, for example offsetting the risk of price movement with respect to the equity-based award. The Human Resources and Compliance functions, overseen by the Compensation Officer, work together to monitor employee trading activity and to ensure that all employees comply with this requirement.
461 |
Deutsche Bank | ||
Annual Report 2022 | ||
Ex-post risk adjustment of variable compensation
In line with regulatory requirements relating to ex-post risk adjustment of variable compensation, the bank believes that a long-term view on conduct and performance of its employees is a key element of deferred VC. As a result, under the Management Board’s oversight, all deferred awards are subject to performance conditions and forfeiture provisions as detailed below.
Overview on Deutsche Bank Group performance conditions and forfeiture provisions of variable compensation granted for Performance Year 2022
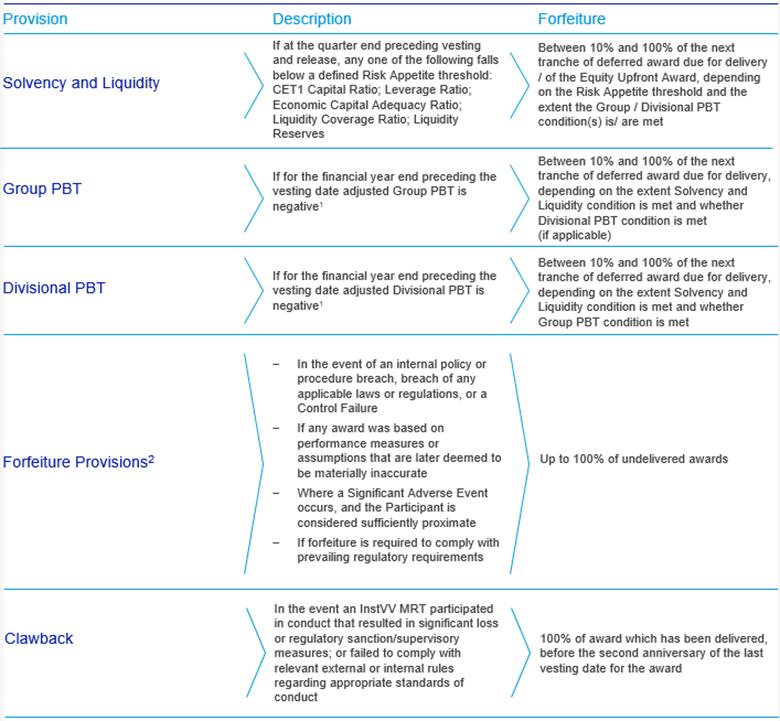 |
1Considering clearly defined and governed adjustments for relevant Profit and Loss items (e.g., business restructurings; impairments of goodwill or intangibles)
2Other provisions may apply as outlined in the respective plan rules
462 |
Deutsche Bank | ||
Annual Report 2022 | ||
Compensation decisions for 2022
Year-end considerations and decisions for 2022
All compensation decisions are made within the boundaries of regulatory requirements. These requirements form the overarching framework for determining compensation at Deutsche Bank. In particular, management must ensure that compensation decisions are not detrimental to maintaining the bank’s sound capital base and liquidity reserves.
In an environment of increasing geopolitical uncertainties and macroeconomic challenges the bank delivered its best results for more than a decade. This underlines the successful completion of the bank’s strategic transformation announced in 2019. Deutsche Bank’s key goals were achieved, and its earnings power was significantly improved. As a result, the bank is significantly more profitable with a pre-tax profit of € 5.6 billion and a net profit of € 5.7 billion.
Although 2022 was a successful year for Deutsche Bank, the bank again adopted a measured and forward-looking approach when deciding on variable compensation for 2022. This approach balanced the need to remain within the boundaries of affordability with the need to remunerate its employees fairly. When determining the level of year-end performance-based VC, the bank weighed the successful transformation and strong business performance against the current uncertain economic outlook and considerations of prudent capital planning and long-term capital stability. This resulted in VC levels for 2022 which are more conservative than the bank’s financial performance, at the Group and divisional level, might have indicated. As in previous years, the SECC continuously monitored and reviewed the implications of potential VC awards, both for the bank’s capital and liquidity base and for its ambitious cost targets.
With due consideration for all these factors, the Management Board determined that the bank is in a position to award variable compensation, including a year-end performance-based VC pool, of € 2.126 billion for 2022 (2021: € 2.099 billion). The VC for the Management Board of Deutsche Bank AG was determined, as always, by the Supervisory Board in a separate process, but is included in the tables and charts below.
As part of the overall 2022 VC awards granted in March 2023, the Group VC Component was awarded to all eligible employees in line with the assessment of the four defined KPIs which are outlined in the Group Compensation Framework chapter of this Report. The Management Board determined a payout rate of 80% for the Group VC Component in 2022, compared to 77.5% in 2021 and 72.5% in 2020.
The slight year-on-year increase of 2022 year-end performance-based VC reflects both Deutsche Bank’s strong performance and the need for prudence.
Compensation awards for 2022 – all employees
| 2022 | 2021 | ||||||||||||||||||||
in € m. | Super- | Mana- | IB3 | CB3 | PB3 | AM3 | CRU3 | Control | Corporate | Group | Group | |||||||||||
Number of employees (full-time equivalent) | 20 | 10 | 7,657 | 13,980 | 26,951 | 4,283 | 194 | 6,725 | 25,130 | 84,930 | 82,969 | |||||||||||
Total compensation | 7 | 76 | 2,256 | 1,306 | 2,540 | 772 | 52 | 779 | 2,457 | 10,237 | 9,912 | |||||||||||
Base salary and allowances | 7 | 28 | 1,209 | 946 | 1,910 | 473 | 30 | 631 | 1,907 | 7,135 | 6,811 | |||||||||||
Pension expenses | 0 | 6 | 71 | 76 | 152 | 41 | 2 | 53 | 139 | 540 | 537 | |||||||||||
Fixed Pay according to | 7 | 35 | 1,280 | 1,022 | 2,062 | 514 | 32 | 684 | 2,046 | 7,674 | 7,348 | |||||||||||
Year-end performance-based VC4 | 0 | 41 | 945 | 226 | 284 | 209 | 17 | 76 | 327 | 2,126 | 2,099 | |||||||||||
Other VC4 | 0 | 0 | 4 | 6 | 43 | 32 | 0 | 5 | 19 | 110 | 135 | |||||||||||
Severance payments | 0 | 0 | 27 | 52 | 151 | 17 | 3 | 14 | 65 | 328 | 330 | |||||||||||
Variable Pay according to § 2 InstVV | 0 | 41 | 976 | 284 | 478 | 258 | 19 | 94 | 411 | 2,563 | 2,564 | |||||||||||
1The table may contain marginal rounding differences; FTE (full-time equivalent) as of December 31, 2022
2Supervisory Board represents the Supervisory Board Members of Deutsche Bank AG (they are not considered for the Group Total number of employees); employee representatives are considered with their compensation for the Supervisory Board role only (their employee compensation is included in the relevant divisional column); the remuneration for members of the Deutsche Bank AG Supervisory Board is not reflected in the Group Total
3Management Board represents the Management Board Members of Deutsche Bank AG; IB = Investment Bank; CB = Corporate Bank; PB = Private Bank; AM = Asset Management; CRU = Capital Release Unit; Control Functions include Chief Risk Office, Group Audit, Compliance and Anti-Financial Crime; Corporate Functions include any Infrastructure function which is neither captured as a Control Function nor part of any division
4Year-end performance-based VC includes Individual and Group VC; other VC includes other contractual VC commitments such as sign-on awards, retention awards, recognition awards and specific VC elements for tariff staff and civil servants; it also includes fringe benefits awarded to Management Board Members of Deutsche Bank AG which are to be classified as variable remuneration; the table does not include new hire replacement awards for lost entitlements from previous employers (buyouts)
463 |
Deutsche Bank | ||
Annual Report 2022 | ||
Reported year-end performance-based variable compensation and deferral rates year over year – all employees

Deutsche Bank continues to apply deferral structures that go beyond the regulatory minimum, resulting in an overall deferral rate (all employees including non-MRT population) of 45% in 2022. For the MRT population only, the deferral rate amounts to 90%.
Material Risk Taker compensation disclosure
On a global basis, 1,426 employees were identified as MRTs according to InstVV for financial year 2022, compared to 1,263 employees for 2021. This increase is attributable to the increased number of quantitative (remuneration driven) MRTs. The number of 2022 Group MRTs amounts to 1,171 individuals. Moreover, 194 individuals were identified by Significant Institutions (thereof 44 Group MRTs) and 123 individuals were identified by Other CRR Institutions (thereof 17 Group MRTs and one MRT identified by a Significant Institution). The remuneration elements for all those MRTs on a consolidated basis are detailed in the tables below in accordance with Section 16 InstVV and Article 450 CRR.
With regard to deferral arrangements and pay-out instruments, 87 MRTs identified by Other CRR Institutions, whose total remuneration amounts to € 18.7 million (thereof € 7.2 million variable remuneration including severance payments) benefit from a derogation laid down in Article 94(3) CRD point (a) and 61 MRTs identified by Group or Significant Institutions, whose total remuneration amounts to € 9.7 million (thereof € 1.6 million variable remuneration including severance payments) benefit from a derogation laid down in Article 94(3) CRD point (b).
464 |
Deutsche Bank | ||
Annual Report 2022 | ||
Remuneration for 2022 - Material Risk Takers (REM 1)
2022 | |||||||||||||
in € m. | Super- | Manage- | Senior Management4 | Other Material Risk Takers | Group | ||||||||
Fixed Pay | Number of MRTs5 | 20 | 10 | 236 | 1,021 | 1,286 | |||||||
Total Fixed Pay | 7 | 35 | 157 | 628 | 826 | ||||||||
of which: cash-based | 5 | 30 | 148 | 597 | 780 | ||||||||
of which: shares or equivalent ownership interests | 2 | 0 | 0 | 0 | 2 | ||||||||
of which: share-linked instruments or equivalent non-cash instruments | 0 | 0 | 0 | 0 | 0 | ||||||||
of which: other instruments | 0 | 0 | 0 | 0 | 0 | ||||||||
of which: other forms | 0 | 5 | 9 | 31 | 45 | ||||||||
Variable Pay | Number of MRTs5 | 0 | 10 | 231 | 984 | 1,224 | |||||||
Total Variable Pay6 | 0 | 41 | 129 | 579 | 750 | ||||||||
of which: cash-based | 0 | 21 | 69 | 302 | 392 | ||||||||
of which: deferred | 0 | 20 | 46 | 228 | 294 | ||||||||
of which: shares or equivalent ownership interests | 0 | 21 | 52 | 277 | 349 | ||||||||
of which: deferred | 0 | 21 | 42 | 227 | 290 | ||||||||
of which: share-linked instruments or equivalent non-cash instruments | 0 | 0 | 7 | 1 | 8 | ||||||||
of which: deferred | 0 | 0 | 5 | 1 | 5 | ||||||||
of which: other instruments | 0 | 0 | 1 | 0 | 1 | ||||||||
of which: deferred | 0 | 0 | 1 | 0 | 1 | ||||||||
of which: other forms | 0 | 0 | 0 | 0 | 0 | ||||||||
of which: deferred | 0 | 0 | 0 | 0 | 0 | ||||||||
Total Pay | 7 | 76 | 286 | 1,207 | 1,576 | ||||||||
1The table may contain marginal rounding differences
2Supervisory Board represents the Supervisory Board Members of Deutsche Bank AG
3Management Board represents the Management Board Members of Deutsche Bank AG
4Senior Management is defined as Deutsche Bank AG MB-1 positions; voting members of Business Division Top Executive Committees; MB members of Significant and Other CRR Institutions and respective MB-1 positions with managerial responsibility
5Beneficiaries only (HC reported for Supervisory Board and Management Board, FTE reported for the remaining part); therefore, the totals do not add up to the 1,426 individuals identified as MRTs
6Variable Pay includes Deutsche Bank´s Year-end performance-based VC for 2022, other VC and severance payments; it also includes fringe benefits awarded to Management Board Members of Deutsche Bank AG which are to be classified as variable remuneration; the table does not include new hire replacement awards for lost entitlements from previous employers (buyouts)
Guaranteed variable remuneration and severance payments - Material Risk Takers (REM 2)
2022 | |||||||||||
in € m. | Super- | Manage- | Senior Management4 | Other Material Risk Takers | Group | ||||||
Guaranteed variable remuneration awards | |||||||||||
Number of MRTs5 | 1 | 0 | 1 | 9 | 10 | ||||||
Total amount | 0 | 0 | 0 | 8 | 8 | ||||||
of which: paid during financial year, not taken into account in bonus cap | 0 | 0 | 0 | 2 | 2 | ||||||
Severance payments awarded in previous periods, paid out during financial year | |||||||||||
Number of MRTs5 | 0 | 0 | 0 | 0 | 0 | ||||||
Total amount | 0 | 0 | 0 | 0 | 0 | ||||||
Severance payments awarded during financial year | |||||||||||
Number of MRTs5 | 0 | 0 | 10 | 38 | 48 | ||||||
Total amount6 | 0 | 0 | 11 | 21 | 32 | ||||||
of which: paid during financial year | 0 | 0 | 9 | 20 | 29 | ||||||
of which: deferred | 0 | 0 | 2 | 1 | 3 | ||||||
of which: paid during financial year, not taken into account in bonus cap | 0 | 0 | 9 | 20 | 29 | ||||||
1The table may contain marginal rounding differences
2Supervisory Board represents the Supervisory Board Members of Deutsche Bank AG
3Management Board represents the Management Board Members of Deutsche Bank AG
4Senior Management is defined as Deutsche Bank AG MB-1 positions; voting members of Business Division Top Executive Committees; MB members of Significant and Other CRR Institutions and respective MB-1 positions with managerial responsibility
5Beneficiaries only (HC reported for all categories)
6Severance payments are generally not taken into account for the bonus cap; the highest single severance payment made in 2022 amounts to € 4,054,481
465 |
Deutsche Bank | ||
Annual Report 2022 | ||
Deferred remuneration - Material Risk Takers (REM 3)
2022 | ||||||||||||||||
in € m. | Total amount of deferred remuneration awarded for previous performance periods |
|
| Amount of performance adjustment made in the financial year to deferred remuneration that was due to vest in the financial year | Amount of performance adjustment made in the financial year to deferred remuneration that was due to vest in future performance years | Total amount of adjustment during the financial year due to ex post implicit adjustments5 | Total amount of deferred remuneration awarded before the financial year actually paid out in the financial year6 | Total of amount of deferred remuneration awarded for previous performance period that has vested but is subject to retention periods | ||||||||
Supervisory Board2 | 1 | 0 | 0 | 0 | 0 | 0 | 0 | 0 | ||||||||
Cash-based | 0 | 0 | 0 | 0 | 0 | 0 | 0 | 0 | ||||||||
Shares or equivalent ownership interests | 0 | 0 | 0 | 0 | 0 | 0 | 0 | 0 | ||||||||
Share-linked instruments or equivalent non-cash instruments | 0 | 0 | 0 | 0 | 0 | 0 | 0 | 0 | ||||||||
Other instruments | 0 | 0 | 0 | 0 | 0 | 0 | 0 | 0 | ||||||||
Other forms | 0 | 0 | 0 | 0 | 0 | 0 | 0 | 0 | ||||||||
Management Board3 | 91 | 9 | 83 | 0 | 0 | (5) | 9 | 3 | ||||||||
Cash-based | 39 | 5 | 34 | 0 | 0 | 0 | 5 | 0 | ||||||||
Shares or equivalent ownership interests | 52 | 4 | 49 | 0 | 0 | (5) | 4 | 3 | ||||||||
Share-linked instruments or equivalent non-cash instruments | 0 | 0 | 0 | 0 | 0 | 0 | 0 | 0 | ||||||||
Other instruments | 0 | 0 | 0 | 0 | 0 | 0 | 0 | 0 | ||||||||
Other forms | 0 | 0 | 0 | 0 | 0 | 0 | 0 | 0 | ||||||||
Senior management4 | 357 | 104 | 253 | 0 | 0 | (16) | 104 | 47 | ||||||||
Cash-based | 174 | 53 | 121 | 0 | 0 | 0 | 53 | 0 | ||||||||
Shares or equivalent ownership interests | 167 | 48 | 119 | 0 | 0 | (14) | 48 | 44 | ||||||||
Share-linked instruments or equivalent non-cash instruments | 14 | 3 | 11 | 0 | 0 | (2) | 3 | 3 | ||||||||
Other instruments | 2 | 0 | 2 | 0 | 0 | 0 | 0 | 0 | ||||||||
Other forms | 0 | 0 | 0 | 0 | 0 | 0 | 0 | 0 | ||||||||
Other Material Risk Takers | 1,601 | 441 | 1,160 | 1 | 3 | (75) | 438 | 137 | ||||||||
Cash-based | 820 | 248 | 573 | 1 | 1 | 0 | 246 | 0 | ||||||||
Shares or equivalent ownership interests | 777 | 192 | 585 | 0 | 1 | (74) | 191 | 137 | ||||||||
Share-linked instruments or equivalent non-cash instruments | 4 | 1 | 2 | 0 | 0 | (1) | 1 | 0 | ||||||||
Other instruments | 0 | 0 | 0 | 0 | 0 | 0 | 0 | 0 | ||||||||
Other forms | 0 | 0 | 0 | 0 | 0 | 0 | 0 | 0 | ||||||||
Total amount | 2,049 | 554 | 1,496 | 1 | 3 | (96) | 551 | 188 | ||||||||
1The table may contain marginal rounding differences
2Supervisory Board represents the Supervisory Board Members of Deutsche Bank AG
3Management Board represents the Management Board Members of Deutsche Bank AG
4Senior Management is defined as Deutsche Bank AG MB-1 positions; voting members of Business Division Top Executive Committees; MB members of Significant and Other CRR Institutions and respective MB-1 positions with managerial responsibility
5Changes of value of deferred remuneration due to the changes of prices of instruments
6Defined as remuneration awarded before the financial year which vested in the financial year (including where subject to a retention period)
466 |
Deutsche Bank | ||
Annual Report 2022 | ||
Remuneration of high earners – Material Risk Takers (REM 4)
2022 | 2021 | |||
in € | Number of individuals1 | Number of individuals2 | ||
Total Pay3 | ||||
1,000,000 to 1,499,999 | 299 | 234 | ||
1,500,000 to 1,999,999 | 120 | 115 | ||
2,000,000 to 2,499,999 | 47 | 56 | ||
2,500,000 to 2,999,999 | 36 | 33 | ||
3,000,000 to 3,499,999 | 16 | 19 | ||
3,500,000 to 3,999,999 | 12 | 19 | ||
4.000,000 to 4,499,999 | 9 | 9 | ||
4,500,000 to 4,999,999 | 5 | 4 | ||
5,000,000 to 5,999,999 | 7 | 10 | ||
6,000,000 to 6,999,999 | 6 | 6 | ||
7,000,000 to 7,999,999 | 8 | 8 | ||
8,000,000 to 8,999,999 | 4 | 3 | ||
9,000,000 to 9,999,999 | 2 | 3 | ||
10,000,000 to 10,999,999 | 1 | 1 | ||
Total | 572 | 520 | ||
1Comprises MRTs only (including 2022 leavers)
2Comprises Group MRTs only; the total (incl. MRTs of Significant and Other CRR Institutions) corresponds to 524 MRT High Earners
3 Includes all components of FP and VC (including severances); buyouts are not included
In total, 572 MRTs received a Total Pay of € 1 million or more for 2022.
Compensation awards 2022 – Material Risk Takers (REM 5)
Management Body Remuneration | Business Areas | |||||||||||||||||||||
in € m. | Super- | Manage- | Total Manage- | IB2 | CB2 | PB2 | AM2 | CRU2 | Corporate Functions2 | Control Functions2 | Total | |||||||||||
Total number of Material Risk Takers3 | 1,286 | |||||||||||||||||||||
of which: Management Body | 20 | 10 | 30 | N/A | N/A | N/A | N/A | N/A | N/A | N/A | N/A | |||||||||||
of which: Senior Management4 | N/A | N/A | N/A | 16 | 29 | 59 | 6 | 6 | 88 | 32 | 236 | |||||||||||
of which: Other Material Risk Takers | N/A | N/A | N/A | 578 | 79 | 127 | 6 | 15 | 133 | 83 | 1,021 | |||||||||||
Total Pay of Material Risk Takers | 7 | 76 | 83 | 945 | 110 | 154 | 28 | 19 | 177 | 60 | 1,576 | |||||||||||
of which: variable pay5 | 0 | 41 | 41 | 471 | 58 | 72 | 13 | 9 | 73 | 14 | 750 | |||||||||||
of which: fixed pay | 7 | 35 | 41 | 475 | 53 | 82 | 15 | 10 | 104 | 46 | 826 | |||||||||||
1The table may contain marginal rounding differences
2Supervisory Board represents the Supervisory Board Members of Deutsche Bank AG, Management Board represents the Management Board Members of Deutsche Bank AG; IB = Investment Bank; CB = Corporate Bank; PB = Private Bank; AM = Asset Management; CRU = Capital Release Unit; Control Functions include Chief Risk Office, Group Audit, Compliance and Anti-Financial Crime; Corporate Functions include any Infrastructure function which is neither captured as a Control Function nor part of any division
3HC reported for Supervisory Board and Management Board, FTE reported for the remaining part; therefore, the totals do not add up to the 1,426 individuals identified as MRTs
4Senior Management is defined as Deutsche Bank AG MB-1 positions; voting members of Business Division Top Executive Committees; MB members of Significant and Other CRR Institutions and respective MB-1 positions with managerial responsibility
5Variable Pay includes Deutsche Bank´s Year-end performance-based VC for 2022, other VC and severance payments; it also includes fringe benefits awarded to Management Board Members of Deutsche Bank AG which are to be classified as variable remuneration; the table does not include new hire replacement awards for lost entitlements from previous employers (buyouts)
467 |
Deutsche Bank | ||
Annual Report 2022 | ||
4-
Corporate Governance Statement according to Sections 289f and 315d of the German Commercial Code/Corporate Governance Report
Management Board and Supervisory Board | ||||
Reporting and Transparency | ||||
Related Party Transactions | ||||
Auditing and Controlling | ||||
Compliance with the German Corporate Governance Code |
468 |
Deutsche Bank | ||
Annual Report 2022 | ||
All information presented in this Corporate Governance Statement according to Sections 289f and 315d of the German Commercial Code is as of February 10, 2023.
Management Board and Supervisory Board
Management Board
Deutsche Bank’s Management Board is responsible for the management of the company in accordance with the law, its Articles of Association and the Terms of Reference for the Management Board with the objective of creating sustainable value in the interests of the company. It considers the interests of shareholders, employees and other company-related stakeholders. The members of the Management Board are collectively responsible for managing the bank’s business. The Management Board, as the Group Management Board, manages Deutsche Bank Group in accordance with uniform guidelines; it exercises general control over all Group companies.
The Management Board decides on all matters prescribed by law and the Articles of Association and ensures compliance with the legal requirements and internal guidelines (compliance). It also takes the necessary measures to ensure that adequate internal guidelines are developed and implemented. The Management Board's responsibilities include, in particular, the bank’s strategic management and direction, the allocation of resources, financial accounting and reporting, control and risk management, the proper functioning of the business organization, the systematic identification and assessment of the environmental and social impacts of the company’s operations as well as corporate control. The Management Board decides on the appointments to the senior management level below the Management Board and, in particular, on the appointment of Global Key Function Holders. In appointing people to management functions in the Group, the Management Board takes diversity into account and strives, in particular, to achieve an appropriate representation of women (more detailed information in section “Targets for the proportion of women in management positions/gender quota“ in this Corporate Governance Statement).
The Management Board works closely together with the Supervisory Board in a cooperative relationship of trust and for the benefit of the company. The Management Board reports to the Supervisory Board at a minimum within the scope prescribed by law or administrative guidelines, in particular on all issues with relevance for the Group concerning strategy, the intended business policy, planning, business development, risk situation, risk management, staff development, reputation and compliance.
A comprehensive presentation of the duties, responsibilities and procedures of our Management Board is specified in its Terms of Reference, the current version of which is available on our website (www.db.com/ir/en/documents.htm).
Personnel changes to the Management Board and the current members of the Management Board
The following member of the Management Board was appointed for a three-year period:
- – Olivier Vigneron with effect from May 20, 2022.
The following member left the Management Board:
- – Stuart Lewis as of May 19, 2022.
The following information is provided on the current members of the Management Board on the year in which they were born, year in which they were first appointed and year in which their term expires as well as their current positions and area of responsibility according to the current Business Allocation Plan for the Management Board. Also specified are their other board mandates or directorships outside of Deutsche Bank Group as well as all memberships in legally prescribed supervisory boards or other comparable domestic or foreign supervisory bodies of commercial enterprises. Listed companies are marked with an “*”. The Terms of Reference for the Management Board specify that the members of our Management Board generally should not accept the chair of supervisory boards of companies outside Deutsche Bank Group.
469 |
Deutsche Bank | ||
Annual Report 2022 | ||
Christian Sewing
Year of birth: 1970
First appointed: 2015
Term expires: 2026
Christian Sewing became a member of the Management Board on January 1, 2015, and is Chief Executive Officer with effect from April 8, 2018. He is responsible on the Management Board for Communications & Corporate Social Responsibility (CSR), Research, Group Audit and Human Resources.
Prior to assuming his role on the Management Board, Mr. Sewing was Global Head of Group Audit and held a number of positions before that in Risk, including Deputy Chief Risk Officer (from 2012 to 2013) and Chief Credit Officer (from 2010 to 2012) of Deutsche Bank.
From 2005 until 2007, Mr. Sewing was a member of the Management Board of Deutsche Genossenschafts-Hypothekenbank.
Before graduating with a diploma from the Bankakademie Bielefeld and Hamburg, Mr. Sewing completed a bank apprenticeship at Deutsche Bank in 1989.
Mr. Sewing does not have any external directorships subject to disclosure.
James von Moltke
Year of birth: 1969
First appointed: 2017
Term expires: 2026
James von Moltke became a member of the Management Board on July 1, 2017, and President as of March 25, 2022. He is Chief Financial Officer and in this function he is responsible for, among other things, Finance, Group Tax, Treasury and Investor Relations.
Before Mr. von Moltke joined Deutsche Bank he served as Treasurer of Citigroup. He started his career at the investment bank Credit Suisse First Boston in London in 1992. In 1995, he joined J.P. Morgan, working at the bank for 10 years in New York and Hong Kong. After next working at Morgan Stanley in New York for four years, where he led the Financial Technology advisory team globally, Mr. von Moltke joined Citigroup as Head of Corporate Mergers and Acquisitions (M&A) in 2009 and three years later became the Global Head of Financial Planning.
He holds a Bachelor of Arts degree from New College, University of Oxford.
Mr. von Moltke does not have any external directorships subject to disclosure.
Karl von Rohr
Year of birth: 1965
First appointed: 2015
Term expires: 2023
Karl von Rohr became a member of the Management Board on November 1, 2015, and President as of April 8, 2018. He is responsible on the Management Board for the Private Bank and Asset Management. He is also Regional Chief Executive Officer (CEO) for Germany, as well as for the EMEA Region (Europe, Middle East and Africa).
Mr. von Rohr joined Deutsche Bank in 1997. From November 2015 to November 2019 he was the Management Board member responsible for Human Resources and until July 2020, he was responsible for Legal, Group Governance and Government & Regulatory Affairs. From 2013 to 2015 he was Global Chief Operating Officer, Regional Management. Prior to this, he was Head of Human Resources for Deutsche Bank in Germany and member of the Management Board of Deutsche Bank Privat- und Geschäftskunden AG. During his time at Deutsche Bank, he has held various senior management positions in other divisions in Germany and Belgium.
He studied law at the universities of Bonn (Germany), Kiel (Germany), Lausanne (Switzerland) and at Cornell University (U.S.A.).
Mr. von Rohr does not have any external directorships subject to disclosure.
He is Chairman of the Supervisory Board of DWS Group GmbH & Co. KGaA.*
470 |
Deutsche Bank | ||
Annual Report 2022 | ||
Fabrizio Campelli
Year of birth: 1973
First appointed: 2019
Term expires: 2025
Fabrizio Campelli became a member of the Management Board on November 1, 2019. He is responsible for the Corporate Bank and the Investment Bank and also for the bank’s UK & Ireland region.
From November 2019 to April 2021, he was the Management Board member responsible for transformation, as Chief Transformation Officer, and for Human Resources. He previously spent four years as the Global Head of Deutsche Bank Wealth Management. Before that, he was Head of Strategy & Organizational Development as well as Deputy Chief Operating Officer for Deutsche Bank Group.
He joined Deutsche Bank in 2004 after working at McKinsey & Company in the firm’s London and Milan offices, focusing on strategic assignments mainly for global financial institutions.
He holds an MBA from MIT Sloan School of Management and a Business Administration degree from Bocconi University in Milan.
Mr. Campelli has been a member of the following Supervisory Boards: BVV Versicherungsverein des Bankgewerbes a.G. and BVV Versorgungskasse des Bankgewerbes e.V.
Bernd Leukert
Year of birth: 1967
First appointed: 2020
Term expires: 2025
Bernd Leukert became a member of the Management Board on January 1, 2020. He is Chief Technology, Data and Innovation Officer and is responsible for the Chief Information Office for the Infrastructure areas and the business divisions, as well as for the Chief Technology Office and the Chief Security Office. He is also responsible for Data Governance and Oversight and Trade Settlement as well as for Cloud and Innovation.
He joined Deutsche Bank on September 1, 2019. He previously worked for many years at SAP SE, the global software company. He joined SAP in 1994 and held various management positions. From 2014 to 2019, he was responsible for product development and innovations as well as the Digital Business Services division on the Executive Board.
Mr. Leukert studied Industrial Engineering and Management at the University of Karlsruhe and at Trinity College Dublin, graduating in 1994 with a Master’s Degree in Business Administration.
He is member of the Supervisory Board of Bertelsmann SE & Co. KGaA.
He is a member of the Supervisory Board of DWS Group GmbH & Co. KGaA.*
Alexander von zur Mühlen
Year of birth: 1975
First appointed: 2020
Term expires: 2026
Alexander von zur Mühlen became a member of the Management Board on August 1, 2020. He is Regional CEO Asia Pacific.
Mr. von zur Mühlen joined Deutsche Bank in 1998 and over the years has held a range of management roles in London and Frankfurt across infrastructure and business divisions. From 2018 to 2020 he was responsible for the Group’s strategic development and was the advisor to the Chief Executive Officer (CEO). Before that, he served as Co-Head of Global Capital Markets, with a regional focus on Asia-Pacific and Europe, the Middle East and Africa (EMEA). From 2009 to 2017, he was Group Treasurer.
Alexander von zur Mühlen holds a Diploma in Business Administration from the Berlin School of Economics and Law in Berlin.
Mr. von zur Mühlen does not have any external directorships subject to disclosure.
471 |
Deutsche Bank | ||
Annual Report 2022 | ||
Christiana Riley
Year of birth: 1978
First appointed: 2020
Term expires: 2025
Christiana Riley became a member of the Management Board on January 1, 2020. She is Regional CEO Americas.
Ms. Riley joined Deutsche Bank in 2006 where she was recently the Chief Financial Officer of the Corporate & Investment Bank. She previously spent nine years in Group Strategy & Planning, which she led from 2011 to 2015. Prior to this Ms. Riley worked at the management consultancy McKinsey & Company and at the investment bank Greenhill & Co.
She graduated cum laude in 2000 from Princeton University in America where she studied Romance Languages, Literature and Linguistics. She also studied at London Business School in the UK, where she gained a Master of Business Administration in 2005.
Ms. Riley is a member of the Supervisory Board of The Clearing House Payments Company LLC.
She is Chief Executive Officer of DB USA Corporation.
Rebecca Short
Year of birth: 1974
First appointed: 2021
Term expires: 2024
Rebecca Short became a member of the Management Board on May 1, 2021. She is Chief Transformation Officer and the Management Board member responsible for Transformation and Global Procurement. She was responsible for the Capital Release Unit until January 31, 2023 and continues to retain oversight for the remaining activities in this regard.
She previously spent almost six years within Finance as Head of Group Planning & Performance Management.
She joined Deutsche Bank on its graduate program in Auckland in 1998. She moved to London in 2000 with Credit Risk Management, where she spent 12 years, formerly as European Head of Corporates. She then set up a new Risk-wide team, Strategic Risk Analysis & Reporting in 2012 before moving to a senior central management role in Audit in 2013, where she spent two years.
She has a BCom (Honours) degree in Finance & Accounting from the University of Otago, Dunedin, New Zealand.
Ms. Short does not have any external directorships subject to disclosure.
Professor Dr. Stefan Simon
Year of birth: 1969
First appointed: 2020
Term expires: 2026
Professor Dr. Stefan Simon became a member of the Management Board on August 1, 2020. He is Chief Administrative Officer (CAO) and is responsible for Government and Regulatory Affairs as well as for Legal and Governance. Additionally, he is responsible for Compliance, Anti-Financial-Crime (AFC) and the Business Selection and Conflicts Office, as well as for Controls Testing & Assurance.
Professor Dr. Simon joined Deutsche Bank on August 1, 2019. He was a member of the Supervisory Board from August 2016 until July 2019 and was Chairman of its Integrity Committee. He is a lawyer and tax consultant and between 1997 and 2016 worked at the law firm Flick Gocke Schaumburg, where he became a partner in 2002. Since 2008 he has also been an Honorary Professor of the University of Cologne.
He studied law at the University of Cologne and received his doctorate there in 1998.
Professor Dr. Simon is Chairman of the Advisory Council of Leop. Krawinkel GmbH & Co. KG.
472 |
Deutsche Bank | ||
Annual Report 2022 | ||
Olivier Vigneron
Year of birth: 1971
First appointed: 2022
Term expires: 2025
Olivier Vigneron became a member of the Management Board on May 20, 2022. He is Chief Risk Officer responsible for the functions managing Credit Risk, Market Risk and Liquidity Risk as well as for other Risk-Infrastructure units.
Mr. Vigneron re-joined Deutsche Bank on March 1, 2022. From January 2020 until re-joining Deutsche Bank in 2022, Olivier Vigneron was Chief Risk Officer of Natixis, where he also served on the Senior Management Committee. From 2008 to 2020, he worked at J.P. Morgan, where he served as Chief Risk Officer for Europe, Middle East and Africa and Firmwide Risk Executive for Market Risk. Prior to this, he worked for BNP Paribas, UniCredit, and Goldman Sachs, Between 2002 and 2005 he worked in Structured Credit Trading for Deutsche Bank in London.
He has also served on the Supervisory Board of J.P. Morgan Germany and on the board of Natixis Assurances.
Olivier Vigneron studied at the Lycée Louis-le-Grand in Paris and holds a Diplôme d’Ingénieur (degree in Engineering) from France’s École Polytechnique. He also holds a PhD in Economics from the University of Chicago.
Mr. Vigneron does not have any external directorships subject to disclosure.
473 |
Deutsche Bank | ||
Annual Report 2022 | ||
Supervisory Board
The Supervisory Board of Deutsche Bank AG appoints and dismisses the members of the Management Board, supervises and advises the Management Board and is directly involved in decisions of fundamental importance to the bank. Supervison and advice also include in particular, sustainability issues. The Supervisory Board works together closely with the Management Board in a cooperative relationship of trust and for the benefit of the company. The internal organization of the Supervisory Board and its committees as well as the requirements for its members are subject to specific supervisory requirements that further supplement the corporate-law regulations concerning corporate governance. Such requirements are founded on, among other things, the German Banking Act (Kreditwesengesetz), the Remuneration Ordinance for Institutions (Institutsvergütungsverordnung), the guidelines of the European Banking Authority (EBA) and European Securities and Markets Authority (ESMA) and the administrative practices of the European Central Bank as our prudential supervisory authority. In individual cases, these may diverge from the recommendations of the German Corporate Governance Code (GCGC) for listed companies. The tasks of the Supervisory Board’s committees, the basic principles for the meeting preparations and follow-ups, as well as general rules for the internal procedures of the Supervisory Board including its committees are set out in the Terms of Reference for the Supervisory Board and for its committees. The current versions are published on the Deutsche Bank website (www.db.com/ir/en/documents.htm). The number of meetings held during the financial year, along with a specification of the meeting conducted per telephone, through video conference and with physical attendance, is specified in the Report of the Supervisory Board. In addition, the representatives of the employees and the representatives of the shareholders regularly conduct preliminary discussions separately.
Together with the Management Board, the Supervisory Board arranges for a long-term succession planning: The Nomination Committee supports the Chairman’s Committee and the Supervisory Board in identifying candidates to fill a position on the bank’s Management Board. In doing so, the Committee prepares a position description with a candidate profile and states the expected time commitment. Suitable candidates are identified, in some cases in collaboration with external recruiting consultants, and structured interviews are conducted. Besides this succession planning with external candidates, the Management Board and Supervisory Board maintain a list of internal candidates. The Nomination Committee and Supervisory Board regularly receive reports from the Management Board on internal candidates for succession planning and the process from the perspective of the Management Board. For the selection of suitable candidates, external and internal, the Nomination Committee takes into account the balance and diversity of the knowledge, skills and experience of all members of the Management Board. It also seeks to foster diversity on the Management Board, for example, with regard to gender, nationality and age. The Supervisory Board ensures compliance with the legally required minimum gender participation pursuant to Section 76 (3a) of the Stock Corporation Act (AktG). In 2017, based on the legal regulation applicable at the time under Section 111 (5) of the Stock Corporation Act (AktG), the Supervisory Board had set the minimum target of at least 20% women on the Management Board by June 30, 2022. This target was met, as two women are members of the Management Board: Christiana Riley and Rebecca Short. Building on the work of the Nomination Committee, the Chairman’s Committee submits a recommendation for the Supervisory Board’s resolution. Based on this, the Supervisory Board decides on the appointment of Management Board members. The first appointment period is for a maximum of three years. Management Board members can be reappointed for one or several terms of office, which may be for a maximum of five years pursuant to the law, whereby at Deutsche Bank such reappointments should generally also be for a maximum of three years. Besides proposals for the appointment of members of the Management Board, the Chairman’s Committee also submits proposals for the dismissal of Management Board members, which the Supervisory Board decides on.
Based on proposals of the Compensation Control Committee, the Supervisory Board determines the total compensation of the individual members of the Management Board and also regularly reviews and resolves on the compensation system for the Management Board.
The Supervisory Board receives reports from the Management Board at least within the scope prescribed by law or administrative guidelines, in particular on all issues of relevance for the Group concerning strategy, intended business policy, planning, business development, risk situation, risk management, staff development, reputation and compliance. Furthermore, Group Audit informs the Audit Committee of any deficiencies identified regularly and – in the case of severe deficiencies – without undue delay. The Chairman of the Supervisory Board is informed accordingly of any serious findings relating to the members of the Management Board. The Supervisory Board and Management Board adopted an Information Regime, a general engagement (interaction) protocol and a specific engagement (interaction) protocol for regulatory topics. These regulate not only the reporting to the Supervisory Board, but also, among other things the Supervisory Board’s enquiries and requests for information from employees of the company as well as the exchange of information in connection with preparations for the meetings and between the meetings.
474 |
Deutsche Bank | ||
Annual Report 2022 | ||
The Chairman of the Supervisory Board plays a crucial role in the proper functioning of the Supervisory Board and has a leadership role in this. He can issue internal guidelines and principles concerning the Supervisory Board’s internal organization and communications, the coordination of the work within the Supervisory Board and the Supervisory Board’s interaction with the Management Board. Between meetings, the Chairman of the Supervisory Board and, to the extent expedient, the chairpersons of the Supervisory Board committees maintain regular contact with the members of the Management Board, especially with the Chairperson of the Management Board, and deliberate with them, among other things, on issues of Deutsche Bank Group’s strategy, planning, the development of its business, risk situation, risk management, risk controlling, governance, compliance, compensation systems, IT, data and digitalization as well as material litigation cases. The Chairman of the Supervisory Board and – within their respective functional responsibility – the chairpersons of the Supervisory Board committees are informed without delay by the Chairman of the Management Board or by the respectively responsible Management Board member about important events of material significance for the assessment of the situation, development and management of Deutsche Bank Group. The Chairman of the Supervisory Board engages in investor discussions on Supervisory Board-related topics when necessary and regularly informs the Supervisory Board of the substance of such discussions. These also cover Environmental, Social and Governance (ESG) topics. The Chairperson of the Audit Committee furthermore conducts regular discussions with the auditor outside the meetings.
The types of business that require the approval of the Supervisory Board to be transacted are specified in the Articles of Association of Deutsche Bank AG. Furthermore, the Supervisory Board may specify additional transactions that require its approval. The Supervisory Board meets regularly also without the Management Board. After due consideration and insofar as materially appropriate, the Supervisory Board, or any of its committees, may, in order to perform their tasks, consult auditors, legal advisors and other internal or external advisors. In performing their tasks, the Chairman of the Supervisory Board, the chairpersons of the committees and the Supervisory Board members are supported by the Office of the Supervisory Board, which is independent of the Management Board.
At several meetings, the Nomination Committee and Supervisory Board addressed the assessment of the Supervisory Board which is to be conducted at least annually as prescribed by law pursuant to Section 25d of the German Banking Act (KWG), and which is also the self-assessment of the Supervisory Board pursuant to Section D.12 of the German Corporate Governance Code (GCGC). The concrete implementation of and the schedule for the assessment were deliberated on and set out at the meetings of the Nomination Committee on July 26, 2022, and October 25, 2022. Services of an external advisor were not mandated in this context. The assessment was performed essentially on the basis of extensive questionnaires regarding the work of the Supervisory Board, of the Supervisory Board committees and of the Management Board, individual interviews conducted by members of the Nomination Committee with the members of the Management Board, and an assessment of the individual members of both the Management Board and Supervisory Board. The final discussion and approval of the results of the assessment took place at the Supervisory Board meeting in plenum on February 1, 2023, and the results were set out in a written final report. The Supervisory Board continues to hold the opinion that the Supervisory Board and Management Board have achieved a high standard and that there are no reservations, in particular, regarding the professional qualifications, personal reliability and time availability of the members of the Management Board and of the Supervisory Board.
475 |
Deutsche Bank | ||
Annual Report 2022 | ||
Members of the Supervisory Board
The Supervisory Board has 20 members. In accordance with the German Co-Determination Act (Mitbestimmungsgesetz), it comprises an equal number of shareholder representatives and employee representatives.
In accordance with the Articles of Association, the members of the Supervisory Board are elected for the period until the conclusion of the General Meeting which adopts the resolutions concerning the ratification of the acts of management for the fourth financial year following the beginning of the term of office. For the election of shareholder representatives, the General Meeting may establish that the terms of office of individual members may begin or end on differing dates. In accordance with the Terms of Reference for the Supervisory Board since July 2020, shareholder representatives are proposed to the General Meeting for election for a maximum of approximately four years, i.e. until the conclusion of the General Meeting which adopts the resolutions concerning the ratification of the acts of management for the third financial year following the beginning of the term of office, whereby the financial year in which the term of office begins is not taken into account.
The following table shows information on the current members of our Supervisory Board.
Member | Principal occupation | Supervisory board memberships and other directorships |
Alexander Wynaendts Year of birth: 1960 First elected: May 19, 2022 Term expires: 2026 | Chairman of the Supervisory Board, Deutsche Bank AG | Air France-KLM Group S.A. 2 (Member of the Board of Directors); Uber Technologies, Inc. 2 (Member of the Board of Directors); Puissance Holding B.V. (Non-Executive Director, Chairman) |
Ludwig Blomeyer-Bartenstein 1 Year of birth: 1957 First elected: May 24, 2018 Term expires: 2023 | Spokesperson of the Management Bremen, Deutsche Bank AG | Frowein & Co. Beteiligungs AG; Bürgschaftsbank Bremen GmbH (Member of the Board of Directors) (until December 2022) |
Mayree Clark Year of birth: 1957 First elected: May 24, 2018 Term expires: 2023 | Supervisory Board member | Ally Financial, Inc. 2 (Member of the Board of Directors); Allvue Systems Holdings, Inc. (Member of the Board of Directors) |
Jan Duscheck 1 Year of birth: 1984 Appointed by the court: August 2, 2016 Term expires: 2023 | Head of National Working Group Banking, trade union ver.di (Vereinte Dienstleistungsgewerkschaft) | No memberships or directorships subject to disclosure |
Manja Eifert 1 Year of birth: 1971 Appointed by the court: April 7, 2022 Term expires: 2023 | Staff Council member | No memberships or directorships subject to disclosure |
Sigmar Gabriel Year of birth: 1959 Appointed by the court: March 11, 2020 Term expires: 2025 | Former German Federal Government Minister | GP Günter Papenburg AG (until April 2022); Siemens Energy AG 2 ; ThyssenKrupp Steel Europe AG (Chairman of the Supervisory Board) (since April 2022) |
Timo Heider 1 Year of birth: 1975 | Staff Council member | BHW Bausparkasse AG 3 (Deputy Chairman); PCC Services GmbH der Deutschen Bank 3 (Deputy Chairman); Pensionskasse der BHW Bausparkasse AG VvaG 3 (Deputy Chairman) |
Martina Klee 1 Year of birth: 1962 | Staff Council member | Sterbekasse für die Angestellten der Deutsche Bank-Gruppe VvaG 3 |
476 |
Deutsche Bank | ||
Annual Report 2022 | ||
Gabriele Platscher 1 Year of birth: 1957 | Bank employee | BVV Versicherungsverein des Bankgewerbes a.G. |
Detlef Polaschek 1 First elected: May 24, 2018 Term expires: 2023 | Deputy Chairman of the Supervisory Board of Deutsche Bank AG; Staff Council member | No memberships or directorships subject to disclosure |
Bernd Rose 1 Year of birth: 1967 | Staff Council member | Postbank Filialvertrieb AG 3 ; ver.di Vermögensverwaltungsgesellschaft m.b.H. (Deputy Chairperson) |
Yngve Slyngstad Year of birth: 1962 First elected: May 19, 2022 Term expires: 2026 | Chief Executive Officer of Aker Asset Management AS | No memberships or directorships subject to disclosure |
John Alexander Thain Year of birth: 1955 First elected: May 24, 2018 Term expires: 2023 | Supervisory Board member | Uber Technologies, Inc. 2 (Member of the Board of Directors); Aperture Investors LLC (Member of the Board of Directors); Pine Island Capital Partners LLC (Chairman); Pine Island Acquisition Corp.2 (Chairman of the Board of Directors) (until October 2022) |
Michele Trogni Year of birth: 1965 First elected: May 24, 2018 Term expires: 2023 | Operating Partner Eldridge | Zinnia Corporate Holdings LLC (formerly SE2 LLC) (Chief Executive Officer since May 2022 and Chairperson of the Board of Directors) |
Dr. Dagmar Valcárcel Year of birth: 1966 Appointed by the court: August 1, 2019 Term expires: 2025 | Supervisory Board member | amedes Holding GmbH; Antin Infrastructure Partners S.A. 2 (Member of the Board of Directors) |
Stefan Viertel 1 Year of birth: 1964 Succession as substitute member: January 1, 2021 4 Term expires: 2023 | Staff Council member | No memberships or directorships subject to disclosure |
Dr. Theodor Weimer Year of birth: 1959 First elected: May 20, 2020 Term expires: 2025 | Chief Executive Officer, Deutsche Börse AG | Knorr Bremse AG 2 |
Frank Werneke 1 Year of birth: 1967 Appointed by the court: November 25, 2021 Term expires: 2023 | Chairman of the trade union ver.di (Vereinte Dienstleistungsgewerkschaft) | ZDF Studios GmbH (formerly ZDF Enterprises GmbH); Member of the Television Council of the Zweites Deutsches Fernsehen (ZDF); ver.di Vermögensgesellschaft m.b.H. |
Professor Dr. Norbert Winkeljohann Year of birth: 1957 First elected: August 1, 2018 Term expires: 2023 | Deputy Chairman of the Supervisory Board of Deutsche Bank AG; Self-Employed Corporate Consultant Norbert Winkeljohann Advisory & Investment | Bayer AG 2 (Chairman); Georgsmarienhütte Holding GmbH; Sievert SE (Chairman); Bohnenkamp AG (Chairman) |
Frank Witter Year of birth: 1959 First elected: May 27, 2021 Term expires: 2025 | Supervisory Board member | Traton SE 2 ; Vfl Wolfsburg-Fußball GmbH (Chairman); CGI Inc. 2 (Member of the Board of Directors) |
1Employee representatives
2 Listed company
3 Group-internal mandate
4 Mr. Viertel already was a member of the Supervisory Board from August 1, 2010 to May 23, 2013.
477 |
Deutsche Bank | ||
Annual Report 2022 | ||
Objectives for the composition of the Supervisory Board, Profile of Requirements, diversity concept and status of implementation
The composition of the Supervisory Board should ensure the effective and qualified control of and advice for the Management Board of an internationally operating, broadly positioned bank. In this connection, its members as a whole must possess the knowledge, abilities and expert experience to properly complete its tasks, and the members in their entirety of the Supervisory Board and the Audit Committee must be familiar with the banking sector. Attention should be placed, in particular, on the integrity, personality, willingness to perform, professionalism and independence of the individuals proposed for election. Furthermore, the members must be able to devote sufficient time to performing their mandates. The objective is for the Supervisory Board as a whole to possess all of the knowledge and experience considered to be essential while taking into account the activities of Deutsche Bank Group, also with regard to the observance of the relevant bank supervisory regulations.
At its meeting on December 15, 2022, the Supervisory Board discussed and approved a restructuring of its Profile of Requirements in order to be able to report on its skills and expertise in a qualifications matrix. The Supervisory Board specified general fields of expertise and expanded fields of expertise.
General fields of expertise:
Ideally, every member of the Supervisory Board possesses these individual qualifications.
- – Understanding of commercial business issues
- – Analytical and strategic mindset
- – Understanding of the German corporate governance system, and – as a result – an understanding of a Supervisory Board member’s responsibilities
- – Understanding of the business model and the structure of Deutsche Bank AG
- – Basic understanding of the financial services sector, e. g. (i) knowledge in the areas of banking, financial services, financial markets, financial industry, including the bank’s home market as well as Europe and the bank’s key markets outside Europe, and (ii) knowledge of the relevant clients for the bank, the market’s expectations and the operational environment.
The fulfillment of these fields of expertise is reported on in summary in the qualification matrix in the line “General fields of expertise”.
Expanded fields of expertise:
These fields of expertise refer to the Supervisory Board in its entirety (collective suitability). The Supervisory Board, as a whole, must have an understanding of the specified fields of expertise that is appropriate for the size and complexity of Deutsche Bank AG. They are derived from the bank’s business model and from specific laws and regulations that apply to the bank. The fields of expertise are:
Accounting, including sustainability reporting:
- – Accounting (International Financial Reporting Standards (IFRS) and German Commercial Code (HGB)) and auditing of annual financial statements
- – Taxation
Regulatory framework and legal requirements:
- – Understanding of the key legal framework conditions in the countries in which the company has its main operations
- – Understanding of the key relevant legal systems for the bank
- – Experience in the executive management / supervisory board of large enterprises
- – Regulatory framework and legal requirements, in particular, knowledge of the legal systems relevant for the bank
- – Knowledge of the social, political and regulatory expectations in the home market
Human capital, compensation and corporate culture:
- – Human resources and staff management
- – Compensation and compensation systems
- – Selection procedure for management body members and assessment of their suitability
- – Corporate culture
478 |
Deutsche Bank | ||
Annual Report 2022 | ||
Risk management:
- – Risk management (investigation, assessment, mitigation, management and control of financial and non-financial risks, capital and liquidity management, shareholdings)
- – Combating money laundering and prevention of financial crime and the financing of terrorism
Information technology, data and digitalization:
- – Digitalization, including digital banking
- – Data, including data governance
- – Information technology (IT), IT systems and IT security, including cyber risks
Strategy, transformation and Environmental, Social and Governance (ESG) issues:
- – Strategic planning of business models and risk strategies as well as their implementation
- – Climate and other environmental aspects
- – Knowledge of social and political expectations (in particular in the home market) and their impacts on corporate social responsibility
- – Company’s purpose
Organizational structure and control of a financial institution
- – Governance
- – Management of a large, international regulated company
- – Internal organization of the bank
- – Internal audit
- – Compliance and internal controls
In order to adequately reflect the bank’s business model, the Supervisory Board shall demonstrate not only these professional qualifications but also qualifications and experience in the various client segments and different sales markets.
Client segments
- – Private Banking and Wealth Management
- – Corporate Banking
- – Investment Banking
- – Asset Management
Regional expertise
- – Germany
- – Europe
- – Americas
- – Asia-Pacific (APAC)
The suitability of each individual member to perform their mandate is assessed, determined and continuously monitored both internally and externally by the Nomination Committee and the Supervisory Board as well as by the regulatory authorities. The suitability assessment covers the expertise, reliability and time available of the individual members. In addition, there is an assessment of the knowledge, skills and experience of the Supervisory Board in its entirety that are necessary for it to perform its control function (collective suitability). Passing the suitability assessment of the European Central Bank (ECB) and the continual suitability of the Supervisory Board member during the entire mandate with Deutsche Bank AG are mandatory regulatory prerequisites for the performance of his or her work.
The Supervisory Board believes that it complies with the specified concrete objectives regarding its composition and the Profile of Requirements – as shown in the following qualifications matrix. The members of the Supervisory Board as a whole possess the knowledge, ability and expert experience to properly complete their tasks.
The Supervisory Board shall be composed such that the number of independent members among the shareholder representatives will be at least six. The matrix also provides information on this. All members act with independence of mind, i.e. all members of the Supervisory Board engage actively in their duties and are able to make their own sound, objective and independent decisions and judgements when performing their functions and responsibilities. In the preceding financial year, there were no former members of the Management Board on the Supervisory Board.
479 |
Deutsche Bank | ||
Annual Report 2022 | ||
Alexander Wynaendts | Ludwig Blomeyer-Bartenstein | Mayree Clark | Jan Duscheck | Manja Eifert | Sigmar Gabriel | Timo Heider | Martina Klee | Gabriele Platscher | Detlef Polaschek | Bernd Rose | Yngve Slyngstad | John Alexander Thain | Michele Trogni | Dr. Dagmar Valcárcel | Stefan Viertel | Dr. Theodor Weimer | Frank Werneke | Prof. Dr. Norbert Winkeljohann | Frank Witter | |||
Member- | No Overboarding* | ✓ | ✓ | ✓ | ✓ | ✓ | ✓ | ✓ | ✓ | ✓ | ✓ | ✓ | ✓ | ✓ | ✓ | ✓ | ✓ | ✓ | ✓ | ✓ | ✓ | |
Independent ** | ✓ | ER | ✓ | ER | ER | ✓ | ER | ER | ER | ER | ER | ✓ | ✓ | ✓ | ✓ | ER | ✓ | ER | ✓ | ✓ | ||
Professional expertise | General fields of expertise | ✓ | ✓ | ✓ | ✓ | ✓ | ✓ | ✓ | ✓ | ✓ | ✓ | ✓ | ||||||||||
Accounting and reporting, incl. sustainability reporting | ✓ | ✓ | ✓ | ✓ | ✓ | ✓ | ✓ | ✓ | ✓ | ✓ | ✓ | ✓ | ✓ | ✓ | ✓ | ✓ | ||||||
Audit Committee Financial Experts *** | w | w | w | w | w | |||||||||||||||||
Expertise in the area of accounting *** | w | w | w | w | w | |||||||||||||||||
Expertise in the area of auditing *** | w | w | w | w | w | |||||||||||||||||
Regulatory framework and Legal requirements | ✓ | ✓ | ✓ | ✓ | ✓ | ✓ | ✓ | ✓ | ✓ | ✓ | ✓ | ✓ | ✓ | ✓ | ✓ | |||||||
Human Capital, Compensation and Corporate Culture | ✓ | ✓ | ✓ | ✓ | ✓ | ✓ | ✓ | ✓ | ✓ | ✓ | ✓ | ✓ | ✓ | ✓ | ✓ | ✓ | ✓ | ✓ | ✓ | ✓ | ||
Compensation Control Committee Compensation Experts*** | w | w | w | |||||||||||||||||||
Risk Management | ✓ | ✓ | ✓ | ✓ | ✓ | ✓ | ✓ | ✓ | ✓ | ✓ | ✓ | ✓ | ✓ | |||||||||
Information technology, data and digitalization | ✓ | ✓ | ✓ | ✓ | ✓ | ✓ | ✓ | ✓ | ||||||||||||||
Strategy, Transformation and ESG | ||||||||||||||||||||||
Organizational structure and control of a financial institution | ✓ | ✓ | ✓ | ✓ | ✓ | ✓ | ✓ | ✓ | ✓ | ✓ | ✓ | ✓ | ✓ | ✓ | ✓ | ✓ | ||||||
Client/ business | Private Banking and Wealth Management | ✓ | ✓ | ✓ | ✓ | ✓ | ✓ | ✓ | ✓ | ✓ | ||||||||||||
Corporate Banking | ✓ | ✓ | ✓ | ✓ | ✓ | ✓ | ✓ | ✓ | ✓ | ✓ | ✓ | ✓ | ||||||||||
Investment Banking | ✓ | ✓ | ✓ | ✓ | ✓ | ✓ | ✓ | ✓ | ✓ | ✓ | ||||||||||||
Asset Management | ✓ | ✓ | ✓ | ✓ | ✓ | ✓ | ||||||||||||||||
Regional | Germany | ✓ | ✓ | ✓ | ✓ | ✓ | ✓ | |||||||||||||||
Europe | ✓ | ✓ | ✓ | ✓ | ✓ | ✓ | ✓ | ✓ | ✓ | ✓ | ✓ | ✓ | ✓ | |||||||||
Americas | ✓ | ✓ | ✓ | ✓ | ✓ | ✓ | ✓ | ✓ | ||||||||||||||
APAC | ✓ | ✓ | ✓ | ✓ | ✓ | ✓ | ||||||||||||||||
ü Profound and professional knowledge / expert
w Regulatory expert / expertise required by law and/or supervisory regulation
ER Employees representatives
* Definition of no overboarding: All Supervisory Board members hold an admissible number of board directorships in various companies in addition to Deutsche Bank AG. Overboarding, i.e. holding an inadmissible number of board directorships in different companies, is determined on the basis of the statutory regulation in Section 25d (3) of the German Banking Act (KWG). A Supervisory Board member may concurrently be a member of the supervisory body of a maximum of five companies (including Deutsche Bank AG). If a Supervisory Board member is also an executive director of a company, this Supervisory Board member may concurrently be a member of the supervisory body of a maximum of three companies (including Deutsche Bank AG). The decisive factors for determining if this is the case are the supervisory authority’s regulatory requirements in consideration of the local laws. Compliance with this statutory regulation is continually monitored by the regulatory authorities. In the event of directorship overboarding, the supervisory authorities may require that Deutsche Bank AG revoke a Supervisory Board member’s appointment and prohibit this Supervisory Board member from performing his or her work.
** Definition of independence: A Supervisory Board member is independent when there are no personal or business relations with Deutsche Bank or its Management Board that may cause a substantial and not merely temporary conflict of interest. Back in 2017, the Supervisory Board issued guidelines for the consistent assessment of the independence of its members, and these also take into account the regulatory requirements on independence. The bank has no controlling shareholder at present.
*** Definition of experts given in the section “Auditing and Controlling” on page 451.
480 |
Deutsche Bank | ||
Annual Report 2022 | ||
There is a regular maximum age limit of 70. In well-founded, individual cases, a Supervisory Board member may be elected or appointed for a period that extends at the latest until the end of the fourth Annual General Meeting that takes place after he or she has reached the age of 70. This age limit was taken into account in the election proposals to the General Meeting and shall also be taken into account for the next Supervisory Board elections or subsequent appointments for Supervisory Board positions that become vacant.
For shareholder representatives on the Supervisory Board elected or appointed since July 2020, the length of Supervisory Board membership shall not, as a rule, exceed 12 years.
The Supervisory Board respects diversity when proposing its members for appointment. In light of the international operations of Deutsche Bank, care should be taken that the Supervisory Board has an appropriate number of members with long-term international experience. Currently, the professional careers or private lives of six members of the Supervisory Board are centered outside Germany. Furthermore, all of the shareholder representatives on the Supervisory Board have many years of international experience from their current or former activities, for example, as management board members or chief executive officers or in a comparable executive function of corporations or organizations with international operations. In these two ways, the Supervisory Board believes the international activities of the company are sufficiently taken into account. The objective is to retain the currently existing international profile.
Special importance has already been attached to an appropriate consideration of women in the selection process since the Supervisory Board elections in 2008. For the election proposals to the General Meeting, the Supervisory Board takes into account the recommendations of the Nomination Committee and the legal requirements according to which the Supervisory Board shall be composed of at least 30% women and at least 30% men. In reviewing potential candidates for a new election or subsequent appointments to Supervisory Board positions that have become vacant, qualified women are included in the selection process and appropriately considered in the election proposals. At the end of the financial year, three women and seven men were members of the Supervisory Board on both the employee representatives’ side and shareholder representatives’ side. The statutory minimum quota of 30% has thus been fulfilled for many years now.
The age structure is diverse, ranging from 38 to 67 years of age at the end of the financial year and spanning three generations, according to the general definition of the term. The length of membership on the Supervisory Board of Deutsche Bank ranged from under one year to around 20 years at the end of the financial year.
The diverse range of the members’ educational and professional backgrounds includes banking, business administration, economics, auditing, law, German studies, political science, electrical engineering and healthcare. The resumes of the members of the Supervisory Board are published on Deutsche Bank’s website (www.db.com/ir/en/supervisory-board.htm).
The members of the Supervisory Board do not exercise functions on a management body of, or perform advisory duties at, major competitors. Material conflicts of interest involving a member of the Supervisory Board that are not merely temporary will result in the termination of that member’s Supervisory Board mandate. Members of the Supervisory Board may not, according to Section 25d of the German Banking Act (KWG), and shall not, according to the recommendations under C.4 and C.5 of the German Corporate Governance Code (GCGC), hold more than the allowed number of supervisory board mandates or mandates in supervisory bodies of companies which have similar requirements. These requirements were met in the preceding financial year.
Some members of the Supervisory Board are, or were last year, in high-ranking positions at other companies that Deutsche Bank has business relations with. Business transactions with these companies were conducted under the same conditions as those between unrelated third parties. In the opinion of the Management Board and the Supervisory Board, these transactions did not affect the independence of the Supervisory Board members involved.
481 |
Deutsche Bank | ||
Annual Report 2022 | ||
Committees of the Supervisory Board
The Supervisory Board has established the following eight standing committees: Chairman’s Committee, Nomination Committee, Audit Committee, Risk Committee, Regulatory Oversight Committee (formerly Integrity Committee), Compensation Control Committee, Strategy and Sustainability Committee (formerly Strategy Committee), and Technology, Data and Innovation Committee. To the extent required, the committees coordinate their work and consult each other on an ad hoc basis. The committee chairpersons report regularly to the Supervisory Board on the work of the committees. The tasks and further details of the standing committees are regulated in separate Terms of Reference. The current versions are available on the Deutsche Bank website (www.db.com/ir/en/documents.htm).
The members of the committees are or were:
Chairman’s Committee: Alexander Wynaendts, Chairman (since May 19, 2022), Dr. Paul Achleitner Chairman (until May 19, 2022), Detlef Polaschek, Frank Werneke, Professor Dr. Norbert Winkeljohann
Nomination Committee: Alexander Wynaendts, Chairman (since July 28, 2022), member (from May 19, 2022 to July 28, 2022), Mayree Clark, Chairperson (until July 28, 2022), member (since July 28, 2022), Dr. Paul Achleitner (until May 19, 2022), Detlef Polaschek, Frank Werneke, Professor Dr. Norbert Winkeljohann
Audit Committee: Frank Witter, Chairman (since July 28, 2022), member (until July 28, 2022), Professor Dr. Norbert Winkeljohann, Chairman (until July 28, 2022), member (since July 28, 2022), Dr. Paul Achleitner (until May 19, 2022), Manja Eifert (since July 28, 2022), Henriette Mark (until March 31, 2022), Gabriele Platscher, Detlef Polaschek, Bernd Rose, Dr. Dagmar Valcárcel, Stefan Viertel, Dr. Theodor Weimer, Alexander Wynaendts (since May 19, 2022)
Risk Committee: Mayree Clark, Chairperson, Dr. Paul Achleitner (until May 19, 2022), Ludwig Blomeyer-Bartenstein, Jan Duscheck, Michele Trogni, Stefan Viertel, Professor Dr. Norbert Winkeljohann, Alexander Wynaendts (since May 19, 2022)
Regulatory Oversight Committee (since July 28, 2022, formerly Integrity Committee): Dr. Dagmar Valcárcel, Chairperson, Dr. Paul Achleitner (until May 19, 2022), Ludwig Blomeyer-Bartenstein, Sigmar Gabriel, Timo Heider, Gabriele Platscher, Alexander Wynaendts (since May 19, 2022)
Compensation Control Committee: Professor Dr. Norbert Winkeljohann, Chairman (since July 28, 2022), Alexander Wynaendts, Chairman (from May 19, 2022 to July 28, 2022), member (since July 28, 2022), Dr. Paul Achleitner, Chairman (until May 19, 2022), Dr. Gerhard Eschelbeck (until May 19, 2022), Detlef Polaschek, Bernd Rose, Dr. Dagmar Valcárcel, Frank Werneke
Strategy and Sustainability Committee (since December 15, 2022, formerly Strategy Committee): John Alexander Thain, Chairman, Dr. Paul Achleitner (until May 19, 2022), Mayree Clark, Timo Heider, Henriette Mark (until March 31, 2022), Detlef Polaschek, Michele Trogni, Stefan Viertel (since July 28, 2022), Frank Werneke, Alexander Wynaendts (since May 19, 2022)
Technology, Data and Innovation Committee: Michele Trogni, Chairperson, Dr. Paul Achleitner (until May 19, 2022), Jan Duscheck, Dr. Gerhard Eschelbeck (until May 19, 2022), Timo Heider (until July 28, 2022), Martina Klee, Bernd Rose, Yngve Slyngstad (since July 28, 2022), Frank Witter (until July 28, 2022), Alexander Wynaendts (since May 19, 2022)
The Report of the Supervisory Board provides information on the concrete work of the committees over the preceding financial year. In addition to the eight standing committees, the Mediation Committee, which is required by German law, makes proposals to the Supervisory Board on the appointment or dismissal of members of the Management Board in cases where the Supervisory Board is unable to reach a two-thirds majority decision. The Mediation Committee only meets if necessary. Its members are or were: Alexander Wynaendts, Chairman (since May 19, 2022), Dr. Paul Achleitner, Chairman (until May 19, 2022), Detlef Polaschek, Frank Werneke and Professor Dr. Norbert Winkeljohann.
Share Plans
For information on the employee share plans, please refer to the additional Note 33 “Employee Benefits” to the Consolidated Financial Statements.
482 |
Deutsche Bank | ||
Annual Report 2022 | ||
Reporting and Transparency
Directors’ Share Ownership
Management Board: For information on the share ownership of the Management Board, please refer to our detailed Compensation Report in the Management Report.
Supervisory Board: The members of our Supervisory Board held the following numbers of our shares and share awards under our employee share plans.
Members of the Supervisory Board | Number of | Number of | ||
Alexander Wynaendts | 0 | 0 | ||
Ludwig Blomeyer-Bartenstein | 5,490 | 4,7351 | ||
Mayree Clark | 109,444 | 0 | ||
Jan Duscheck | 0 | 0 | ||
Manja Eifert | 103 | 10 | ||
Sigmar Gabriel | 0 | 0 | ||
Timo Heider | 0 | 0 | ||
Martina Klee | 2,781 | 10 | ||
Gabriele Platscher | 1,684 | 10 | ||
Detlef Polaschek | 1,934 | 10 | ||
Bernd Rose | 0 | 0 | ||
Yngve Slyngstad | 0 | 0 | ||
John Alexander Thain | 100,000 | 0 | ||
Michele Trogni | 15,000 | 0 | ||
Dr. Dagmar Valcárcel | 0 | 0 | ||
Stefan Viertel | 1,007 | 0 | ||
Dr. Theodor Weimer | 108,000 | 0 | ||
Frank Werneke | 0 | 0 | ||
Professor Dr. Norbert Winkeljohann | 0 | 0 | ||
Frank Witter | 0 | 0 | ||
Total | 345,443 | 4,775 | ||
1Restricted Equity Awards. Mr. Blomeyer-Bartenstein has an entitlement linked to 4,735 shares through Restricted Equity Awards as part of his variable compensation. These become due for disbursal from 2023 to 2027.
As of February 10, 2023, the members of the Supervisory Board held 345,443 shares, which is less than 0.02% of the shares issued as of the reporting day.
The “Number of share awards” column in the table lists share awards granted under the Global Share Purchase Plan to Supervisory Board members who are employees of Deutsche Bank (“Matching Awards”), which are scheduled to be delivered to them on November 1, 2023, as well as Restricted Equity Awards (deferred share awards), which are granted to employees with deferred variable compensation. The Restricted Equity Awards are indicated with a footnote in the table, and further details on them as a compensation instrument are provided in the “Employee compensation report”.
As described in the “Management Report: Compensation Report: Compensation system for Supervisory Board members”, 25% of each member’s compensation for services as a member of the Supervisory Board for a given prior year is, rather than being paid in cash, converted into notional shares of Deutsche Bank AG in February of the following year. The cash value of the notional shares is paid to the members in February of the year following their departure from the Supervisory Board or the expiration of their term of office, based on the market price of the Deutsche Bank share near the payment date.
The Compensation Report on the preceding financial year and the auditor’s report pursuant to Section 162 of the German Stock Corporation Act (AktG), the currently applicable compensation system pursuant to Section 87a (1) and (2) sentence 1 AktG as well as the last resolution on compensation pursuant to Section 113 (3) AktG are available from the bank’s website www.db.com (under the Investor Relations headings “Reports and Events”, “Annual Reports”).
Related Party Transactions
For information on related party transactions please refer to Note 36 “Related party transactions“.
483 |
Deutsche Bank | ||
Annual Report 2022 | ||
Auditing and Controlling
Audit Committee Financial Expert
The Supervisory Board determined that the following members of the Audit Committee are “Audit Committee Financial Experts*, as such term is defined by the implementation rules of the U.S. Securities and Exchange Commission issued pursuant to Section 407 of the Sarbanes-Oxley Act of 2002: Dr. Dagmar Valcárcel, Dr. Theodor Weimer, Professor Dr. Norbert Winkeljohann, Frank Witter and Alexander Wynaendts. These Audit Committee Financial Experts are “independent” of the bank, as defined in Rule 10A-3 under the U.S. Securities Exchange Act of 1934.
Furthermore, the Supervisory Board determined in accordance with Sections 107 (4) and 100 (5) of the Stock Corporation Act (AktG) and Section 25d (9) of the German Banking Act (KWG) that Dr. Dagmar Valcárcel, Dr. Theodor Weimer, Professor Dr. Norbert Winkeljohann, Frank Witter and Alexander Wynaendts have expert knowledge in financial accounting and the auditing of financial statements.
Dr. Dagmar Valcárcel has expertise in the areas of accounting and auditing through her many years of experience as Chair of the Management Board of Andbank Asset Management Luxembourg S.A. and Barclays Vida y Pensiones, S.A.U. and through her current work as member of the Board of Directors of Antin Infrastructure Partners S.A. Dr. Theodor Weimer has expertise in the areas of accounting and auditing through his many years of experience as Chief Executive Officer of HypoVereinsbank / UniCredit AG and as a former member of the Audit Committee of ERGO Gruppe AG as well as through his current work as Chairman of the Executive Board of Deutsche Börse AG. Professor Dr. Norbert Winkeljohann has expertise in the areas of accounting and auditing through his education and training as an auditor and his many years of experience as an auditor at various auditing firms and as Chairman of the Management Board of PwC Europe SE. Frank Witter has expertise in the areas of accounting and auditing through his many years of experience as Chief Financial Officer of Volkswagen AG and as Chairman of the Board of Management of Volkswagen Financial Services AG. Alexander Wynaendts has expertise in the areas of accounting and auditing through his many years of experience as Chief Executive Officer and Chairman of the Management and Executive Boards of Aegon N.V.
Compensation Control Committee Compensation Expert
Pursuant to Section 25d (12) of the German Banking Act (KWG), at least one member of the Compensation Control Committee must have sufficient expertise and professional experience in the field of risk management and risk controlling, in particular, with regard to the mechanisms to align compensation systems to the company’s overall risk appetite and strategy and the bank’s capital base. Based on the recommendation of the Compensation Control Committee, the Supervisory Board resolved to specify by name Dr. Dagmar Valcárcel, Alexander Wynaendts and Professor Dr. Norbert Winkeljohann as Compensation Control Committee Compensation Experts. All of them have expertise and professional experience in the field of risk management and risk controlling, in particular with regard to mechanisms to align the compensation systems to the company’s overall risk appetite and strategy and its capital base. They therefore fulfill the requirements of Section 25d (12) of the German Banking Act (KWG).
Dr Valcárcel has comprehensive legal experience with compensation frameworks, including reputational risks, from her time as, among other things, Head of the Legal Department of Barclays PLC for Western Europe.
Based on their years of experience as Management Board Chairman and/or Chief Executive Officer, Alexander Wynaendts and Professor Dr. Norbert Winkeljohann have sufficient expertise and professional experience in the area of risk management and risk controlling.
Values and leadership principles of Deutsche Bank AG and Deutsche Bank Group
Deutsche Bank Group Code of Conduct and Code of Ethics for Senior Financial Officers
Deutsche Bank Group’s Code of Conduct sets out Deutsche Banks’s purpose, values and beliefs and minimum standards of conduct that we expect all members of our Management Board and employees to follow. These values and standards govern employee interactions with our clients, competitors, business partners, government and regulatory authorities, and shareholders, as well as with other employees. In addition, the Code forms the cornerstone of our policies, which provide guidance on compliance with applicable laws and regulations.
484 |
Deutsche Bank | ||
Annual Report 2022 | ||
In accordance with Section 406 of the Sarbanes-Oxley Act of 2002, the bank adopted a Code of Ethics for Senior Financial Officers of Deutsche Bank AG and Deutsche Bank Group with special obligations that apply to the “Senior Financial Officers”, which currently consist of Deutsche Bank’s Chairman of the Management Board and the Chief Financial Officer as well as certain other Senior Financial Officers. There were no amendments or waivers to this Code of Ethics in 2022.
The current versions of the Code of Conduct as well as the Code of Ethics for Senior Financial Officers of Deutsche Bank AG and Deutsche Bank Group are available from Deutsche Bank’s website: www.db.com/ir/en/documents.htm.
Corporate Governance at Deutsche Bank AG and Deutsche Bank Group
Deutsche Bank established a Group Governance function to define, implement and monitor the corporate governance framework of Deutsche Bank AG and Deutsche Bank Group and to perform this governance function throughout the Group. Group Governance addresses corporate governance issues in Deutsche Bank AG and Deutsche Bank Group, while focusing closely on clear organizational structures aligned to the key elements of good corporate governance.
Deutsche Bank AG and Deutsche Bank Group are committed to ensuring a corporate governance framework in accordance with international standards and statutory provisions. In support of this objective, Deutsche Bank AG and Deutsche Bank Group have instituted clear corporate governance principles.
Further details on corporate governance are published on Deutsche Bank’s website (www.db.com/ir/en/corporate-governance.htm).
485 |
Deutsche Bank | ||
Annual Report 2022 | ||
Principal accountant fees and services
In accordance with German law, our principal accountant is appointed at our Annual General Meeting based on a recommendation of our Supervisory Board. The Audit Committee of our Supervisory Board prepares such a recommendation. Subsequent to the principal accountant’s appointment, the Audit Committee awards the contract and in its sole authority approves the terms and scope of the audit and all audit engagement fees as well as monitors the principal accountant’s independence. Ernst & Young GmbH Wirtschaftsprüfungsgesellschaft („EY“) was our principal accountant for the 2021 and 2022 fiscal years, respectively.
The tables set forth below contain the aggregate fees billed for each of the last two fiscal years by EY in each of the following categories: (1) Audit fees, which are fees for professional services for the audit of our annual financial statements or services that are normally provided by the accountant in connection with statutory and regulatory filings or engagements for those fiscal years, (2) Audit-related fees, which are fees for assurance and related services that are reasonably related to the performance of the audit or review of our financial statements and are not reported as Audit fees, (3) Tax-related fees, which are fees for professional services rendered for tax compliance, tax consulting and tax planning, and (4) All other fees, which are fees for products and services other than Audit fees, Audit-related fees and Tax-related fees. These amounts include expenses and exclude Value Added Tax (VAT).
Fees billed by EY
Fee category in € m. | 2022 | 2021 | ||
Audit fees | 59 | 54 | ||
Audit-related fees | 8 | 8 | ||
Tax-related fees | 0 | 1 | ||
All other fees | 1 | 1 | ||
Total fees | 1 | 68 | 64 | |
The Audit fees include fees for professional services for the audit of our annual financial statements and consolidated financial statements and do not include audit fees for DWS and its subsidiaries that are not audited by EY. The Audit-related fees include fees for other assurance services required by law or regulations, in particular for financial service specific attestation, for quarterly reviews, for spin-off audits and for merger audits, as well as fees for voluntary assurance services, like voluntary audits for internal management purposes and the issuance of comfort letters. Our Tax-related fees include fees for services relating to the preparation and review of tax returns and related compliance assistance and advice, tax consultation and advice relating to Group tax planning strategies and initiatives and assistance with assessing compliance with tax regulations.
Under SEC regulations, the principal accountant fees are required to be presented as follows: audit fees were € 61 million in 2022 compared to € 56 million in 2021, audit-related fees were € 6 million in 2022 compared to € 6 million in 2021, tax-related fees were € 0 million in 2022 compared to € 1 million in 2021, and all other fees were € 1 million in 2022 compared to € 1 million in 2021.
United States law and regulations, and our own policies, generally require that all engagements of our principal accountant be pre-approved by our Audit Committee or pursuant to policies and procedures adopted by it. Our Audit Committee has adopted the following policies and procedures for consideration and approval of requests to engage our principal accountant to perform non-audit services. Engagement requests must in the first instance be submitted to the Accounting Engagement Team. If the request relates to services that would impair the independence of our principal accountant, the request must be rejected. Our Audit Committee has given its pre-approval for specified assurance, financial advisory and tax services, provided the expected fees for any such service do not exceed € 1 million. If the engagement request relates to such specified pre-approved services, it may be approved by the Accounting Engagement Team and must thereafter be reported to the Audit Committee. If the engagement request relates neither to prohibited non-audit services nor to pre-approved non-audit services, it must be forwarded to the Audit Committee for consideration. In addition, to facilitate the consideration of engagement requests between its meetings, the Audit Committee has delegated approval authority to several of its members who are “independent” as defined by the Securities and Exchange Commission and the New York Stock Exchange. Such members are required to report any approvals made by them to the Audit Committee at its next meeting.
Additionally, United States law and regulations permit the pre-approval requirement to be waived with respect to engagements for non-audit services aggregating to no more than five percent of the total amount of revenues we paid to our principal accountant, if such engagements were not recognized by us at the time of engagement and were promptly brought to the attention of our Audit Committee or a designated member thereof and approved prior to the completion of the audit. In 2021 and 2022, the percentage of the total amount of revenues we paid to our principal accountant for non-audit services that was subject to such a waiver was less than 5% for each year.
486 |
Deutsche Bank | ||
Annual Report 2022 | ||
Compliance with the German Corporate Governance Code
Declaration pursuant to Section 161 German Stock Corporation Act (AktG) (Declaration of Conformity 2022)
In updating the Declaration of Conformity issued on October 28, 2021, the Management Board and Supervisory Board of Deutsche Bank AG approved the following Declaration of Conformity on October 26, 2022.
“The Management Board and Supervisory Board of Deutsche Bank Aktiengesellschaft state pursuant to Section 161 German Stock Corporation Act (AktG):
- 1. The last Declaration of Conformity was issued on October 28, 2021. As of this date on, Deutsche Bank Aktiengesellschaft complied with the recommendations of the “Government Commission on the German Corporate Governance Code” in the version of the Code dated December 16, 2019, and published in the Federal Gazette (Bundesanzeiger) on March 20, 2020, without deviations. The German Corporate Governance Code limits the applicability of the Code’s recommendations to credit institutions and insurance companies to the extent that the recommendations apply to them insofar as there are no statutory provisions to the contrary. Deutsche Bank Aktiengesellschaft last reported these statutory regulations and the effects for the Declaration of Conformity in its Corporate Governance Statement in the Annual Report 2021.
- 2. On April 28, 2022, the “Government Commission on the German Corporate Governance Code” submitted a new version of the Code, which was published in the Federal Gazette (Bundesanzeiger) on June 27, 2022. Deutsche Bank Aktiengesellschaft complies with all of the recommendations applicable to it and will comply with them in the future, with the following deviation:
With regard to recommendation G.10, second sentence, according to which long-term variable remuneration components shall be accessible to a Management Board member only after a period of four years.
The compensation system for the Management Board provides that the long-term components of variable compensation vest over a deferral period of five years. As this involves share-based compensation elements, these are subject to an additional holding period of one year after their vesting. With regard to the structure of the deferral period, the Supervisory Board resolved in February 2022 that Management Board members will in future already be able to dispose over a first part after three years and over the last part of the long-term component after six years. The Supervisory Board thus remains within the requirements for financial institutions set out in the Remuneration Ordinance for Institutions (Institutsvergütungsverordnung). We do not consider a further tightening of the bank-specific regulatory requirements to be appropriate. Although the Management Board members will not be able to dispose over the first part of the long-term component granted for the 2021 financial year until 2025, we already today declare an exception to the recommendation.
Frankfurt am Main, in October 2022
The Management Board | The Supervisory Board |
of Deutsche Bank Aktiengesellschaft | of Deutsche Bank Aktiengesellschaft” |
487 |
Deutsche Bank | ||
Annual Report 2022 | ||
Inapplicable Code recommendations due to the precedence of statutory provisions
Pursuant to the recommendation in Section F.4 of the German Corporate Governance Code in the version of April 28, 2022, companies subject to special legal regulations shall specify in the Corporate Governance Statement which Code recommendations were not applicable due to over-riding legal stipulations.
For Deutsche Bank Aktiengesellschaft, this currently applies to the recommendation in Section D.5 of the German Corporate Governance Code in the version of April 28, 2022, which states that the Supervisory Board shall form a Nomination Committee which is composed exclusively of shareholder representatives.
Deutsche Bank Aktiengesellschaft, as a supervised credit institution, is subject to the special legal regulations of the German Banking Act (KWG). The Supervisory Board of Deutsche Bank Aktiengesellschaft established a Nomination Committee in accordance with Section 25d (11) of the German Banking Act (KWG) whose tasks are to support the Supervisory Board in the following tasks:
- identifying candidates to fill a position on the Management Board and preparing proposals for the election of members of the Supervisory Board;
- drawing up an objective to promote the representation of the under-represented gender on the Supervisory Board as well as a strategy for achieving this;
- the regular assessment, to be performed at least once a year, of the structure, size, composition and performance of the Management Board and of the Supervisory Board and making recommendations regarding this to the Supervisory Board;
- the regular assessment, to be performed at least once a year, of the knowledge, skills and experience of the individual members of the Management Board and of the Supervisory Board as well as of the respective body collectively; and
- the review of the Management Board’s principles for selecting and appointing persons to the upper management level and the recommendations made to the Management Board in this respect.
The Nomination Committee to be established in accordance with the German Banking Act (KWG) therefore has numerous tasks that go beyond the preparation of the election proposals for the shareholder representatives on the Supervisory Board. A general exclusion of a supervisory board’s employee representatives from a membership on a committee is only admissible, according to prevailing opinion, if there is a material reason for this. Whereas such a material reason can exist for a committee that solely handles the preparation of the proposals to the General Meeting for the election of shareholder representatives, a justification for the exclusion of employee representatives is lacking for a nomination committee with the range of tasks assigned to it by the German Banking Act (KWG). Due to the Nomination Committee’s range of mandatory tasks stipulated by the German Banking Act (KWG) and the inadmissibility of discriminating against employee representatives in the composition of the committees, the recommendation in Section D.4 of the German Corporate Governance Code is therefore not applicable to Deutsche Bank Aktiengesellschaft. Nonetheless, in order to take this recommendation into account, Section 2 (3) of the Terms of Reference for the Nomination Committee provides that the election proposals to the General Meeting are prepared only by the shareholder representatives on the Nomination Committee.
488 |
Deutsche Bank | ||
Annual Report 2022 | ||
Goals for the proportion of women in management positions/gender quota
As of the date of this Corporate Governance Statement, the percentage of women on the Supervisory Board of Deutsche Bank AG is 30%. The statutory minimum of 30% pursuant to Section 96 (2) of the German Stock Corporation Act (AktG) is thereby fulfilled.
On July 27, 2017, the Supervisory Board set a goal of at least 20% for the percentage of female members of the Management Board as of June 30, 2022. For a Management Board size of between eight and 12 members, this corresponds to two women. With Christiana Riley and Rebecca Short on the Management Board this goal has already been met since May 1, 2021. The current German Act to Supplement and Amed Regulations on the Equal Participation of Women and Men in Management Positions in the Private and Public Sectors (Equal Participation Act II (FüPoG II) requires that at least one woman and one man be appointed to a management board with more than three members however no additional goals must be set. With two women on the Management Board the bank exceeded this requirement as of December 31, 2022.
Deutsche Bank is firmly convinced that an improved gender balance in leadership roles will meaningfully contribute to its future success.
In accordance with the legal framework conditions and based on the bank’s own strategy on diversity, equity and inclusion the bank is working on making progress on its ambitious goals of the “35 by 25” program that the Management Board set on May 4, 2021.
The goals for the representation of women on the two management levels below the Management Board are now for at least 30% women on the first management level and at least 30% women on the second management level below the Management Board. These goals are to be reached by December 31, 2025.
The population of staff on the first management level below the Management Board comprises Managing Directors and Directors who report directly to the Management Board and managers with comparable responsibilities. The population of staff on the second management level comprises Managing Directors and Directors who report to the first management level.
Implementing German gender quota legislation at Deutsche Bank AG
Dec 31, 2022 | Dec 31, 2021 | Dec 31, 2020 | ||||||
Goal | Result | Result | Result | |||||
Level (headcount, in %)1 | ||||||||
Supervisory Board | 30.0 | 30.0 | 30.0 | 30.0 | ||||
Management Board2 | 20.0 | 20.0 | 20.0 | 10.0 | ||||
Management Board level -13 | 30.0 | 17.1 | 20.0 | 20.0 | ||||
Management Board level -23 | 30.0 | 29.6 | 27.5 | 23.9 | ||||
1Pursuant to Germany’s Act on the Equal Participation of Women and Men in Management Positions in the Private and Public Sectors.
2Goal reflects June 2022.
3Goal reflects December 2025.
As of December 31, 2022, the proportion of women was 17,1% (2021: 20%) on the first management level below the Management Board and 29,6% (2021: 27,5%) on the second management level below the Management Board.
While the Group’s commitment to increase the representation of women in senior management positions is global, the Group’s implementation is local. Each region, each business has its own diversity and inclusion needs because cultures and current social challenges differ from nation to nation and from business area to business area. However, the Management Board remains committed to these goals and focused initiatives are put in place to accelerate change. These initiatives impact the full lifecycle of people spanning across talent attraction, talent development, talent retention and promotion.
Within this framework, the bank’s decisions on promotions and appointments are aligned, in particular, to the suitability of the candidates for the respective roles, their demonstrated performance and their future potential. In line with our basic diversity concept, the bank also take into account the knowledge and skills required for the proper performance of tasks and the necessary experience of the employees for the composition of the two levels below the Management Board.
489 |
Deutsche Bank | ||
Annual Report 2022 | ||
Diversity concept
As an integral part of our strategy as a leading European bank with a global reach and a strong home market in Germany, Diversity is a decisive factor for our success. Diversity, equity and inclusion help Deutsche Bank in forming and strengthening relationships with our clients and partners in the societies where we do business.
Age and gender as well as educational and professional backgrounds have long been accepted as key aspects of our far more comprehensive understanding of diversity at Deutsche Bank.
The bank were convinced that diversity, equity and inclusion stimulate innovation, for example, and help us to take more balanced decisions and thus play a decisive role for the success of Deutsche Bank. diversity and Inclusion are therefore integral components of the bank’s values and beliefs and its Code of Conduct.
The Supervisory Board and Management Board strive to and should serve as role models for the bank regarding diversity, equity and inclusion. In accordance with our values and beliefs specified above, diversity in the composition of the Supervisory Board and the Management Board also facilitates the proper performance of the tasks and duties assigned to them by law, Articles of Association and Terms of Reference.
Based on Deutsche Bank’s understanding of diversity, equity and inclusion, the values and beliefs and the measures described in the following for their implementation also apply – to the extent legally admissible – to the Supervisory Board and the Management Board of Deutsche Bank AG. The Supervisory Board considers diversity in the company, in particular, when filling positions on the Management Board and Supervisory Board.
On December 15, 2022, the Supervisory Board of Deutsche Bank AG updated the Suitability Guideline for selecting members of the Supervisory Board and Management Board of Deutsche Bank AG, which also continues to comprise diversity principles. This Suitability Guideline implements the “Guidelines on the assessment of the suitability of members of the management body and key function holders” issued jointly by the European Banking Authority and European Securities and Markets Authority.
Diversity concept for the Supervisory Board
The diversity concept for the Supervisory Board and its implementation are described above in the section “Objectives for the composition of the Supervisory Board, Profile of Requirements, diversity concept and status of implementation”.
Diversity concept and succession planning for the Management Board
Through the composition of the Management Board, it is to be ensured that its members have, at all times, the required knowledge, skills and experience necessary to properly perform their tasks. Accordingly, when selecting members for the Management Board, care is to be taken that they collectively have sufficient expertise and diversity within the meaning of our objectives specified above. Furthermore, the Supervisory Board and the Management Board should ensure long-term succession planning.
The current German Act to Supplement and Amend Regulations on the Equal Participation of Women and Men in Management Positions in the Private and Public Sectors (Equal Participation Act II (FüPoG II) requires that at least one woman and one man be appointed to a management board with more than three members; however, no additional goals must be set. The bank exceeded this requirement as of December 31, 2022.In general, a Management Board member should not be older at the end of his or her appointment period than the regular retirement age according to the rules of the statutory pension insurance scheme applicable in Germany for the long-term insured to claim an early retirement pension.
490 |
Deutsche Bank | ||
Annual Report 2022 | ||
Implementation
In accordance with the law, the Articles of Association and Terms of Reference, the Supervisory Board adopted one candidate profile for the members of the Management Board, based on a proposal from the Nomination Committee. This profile take into account an “Expertise and Capabilities Matrix”, specifying, among other things, the required knowledge, skills and experience to perform the tasks as Management Board member, in order to successfully develop and implement the bank’s strategy in the respective market or the respective division and as a management body collectively. The Management Board reviews succession plans for Management Board positions, both individually and as a group. Individual succession plans are reviewed and internal succession candidates are discussed in detail based on potential, leadership, fit and proper suitability. As gender diversity is a key focus of Deutsche Bank respective succession metrics and data analytics support this process. After approval by the Management Board these plans are submitted to the Nomination Committee and the Supervisory Board in principle at a meeting for extensive deliberation.
In identifying candidates to fill a position on the bank’s Management Board, the Supervisory Board’s Nomination Committee takes into account the appropriate diversity balance of all Management Board members collectively. Furthermore, it also considers the targets set by the Supervisory Board in accordance with statutory requirements for the percentage of women on the Management Board.
The Nomination Committee supports the Supervisory Board with the periodic assessment, to be performed at least once a year, of the knowledge, skills and experience of the individual members of the Management Board and of the Management Board in its entirety.
Results achieved in the 2022 financial year
At the end of the financial year, the Management Board comprised two women (20%) and eight men. The target of 20% of the members or two women adopted for June 30, 2022, for the Management Board was met. As of the date of this Corporate Governance Statement, the Management Board of Deutsche Bank AG comprised two women and eight men.
The age structure is diverse, ranging from 44 to 57 years of age as of the date of this Corporate Governance Statement. As The length of experience as member of the Management Board of Deutsche Bank of the date of this Corporate Governance Statement ranged from less than one year to around ten years.
Also with our strategy in mind of being a leading European bank with a global reach and a strong home market in Germany, six of the ten Management Board members as of the date of this Corporate Governance Statement have a German background. Furthermore, in the Management Board Italy, the United Kingdom, France, Australia, New Zealand and the USA are represented as nationalities. However, the ethnic diversity of the Management Board does not currently reflect the full diversity of the markets where we do business or the diversity of our employees.
The diverse range of the members’ educational and professional backgrounds includes banking, business administration, economics, law, linguistics and engineering.
The bank transparently reports on Management Board diversity in addition to the information presented above in this Corporate Governance Report in the section “Management Board and Supervisory Board:
Management Board” as well as on the bank’s website: www.db.com (Heading: Investor Relations, “Corporate Governance”, “Management Board”).
491 |
Deutsche Bank | ||
Annual Report 2022 | ||
Non-GAAP Financial Measures
This document and other documents the Group has published or may publish contain non-GAAP financial measures. Non-GAAP financial measures are measures of the Group’s historical or future performance, financial position or cash flows that contain adjustments that exclude or include amounts that are included or excluded, as the case may be, from the most directly comparable measure calculated and presented in accordance with IFRS in the Group’s financial statements.
Return on Equity Ratios
The Group reports a post-tax return on average shareholders’ equity and a post-tax return on average tangible shareholders’ equity, each of which is a non-GAAP financial measure.
The post-tax returns on average shareholders’ equity and average tangible shareholders' equity are calculated as profit (loss) attributable to Deutsche Bank shareholders after profit (loss) attributable to additional equity components (AT1 coupon) as a percentage of average shareholders’ equity and average tangible shareholders' equity, respectively.
Profit (loss) attributable to Deutsche Bank shareholders after AT1 coupon for the segments is a non-GAAP financial measure and is defined as profit (loss) excluding post-tax profit (loss) attributable to noncontrolling interests and after AT1 coupon, which are allocated to segments based on their allocated average tangible shareholders’ equity. For the Group, it reflects the reported effective tax rate, which was (1)% for the full year 2022, 26% for 2021 and 39% for 2020. For the segments, the applied tax rate was 28% for all reported periods in 2022, 2021 and 2020.
At the Group level, tangible shareholders' equity is shareholders’ equity as reported in the Consolidated Balance Sheet excluding goodwill and other intangible assets. Tangible shareholders’ equity for the segments is calculated by deducting goodwill and other intangible assets from shareholders’ equity as allocated to the segments. Shareholders’ equity and tangible shareholders’ equity are presented on an average basis.
The Group believes that a presentation of average tangible shareholders’ equity makes comparisons to its competitors easier and refers to this measure in the return on equity ratios presented by the Group. However, average tangible shareholders’ equity is not a measure provided for in IFRS, and the Group’s ratios based on this measure should not be compared to other companies’ ratios without considering differences in the calculations.
The reconciliation of the aforementioned ratios is set forth in the table below:
| 2022 | |||||||||||||
in € m. | Corporate | Investment | Private | Asset | Capital | Corporate & | Total | |||||||
Profit (loss) before tax | 2,051 | 3,487 | 1,979 | 598 | (932) | (1,589) | 5,594 | |||||||
Profit (loss) | 1,477 | 2,510 | 1,425 | 431 | (671) | 487 | 5,659 | |||||||
Profit (loss) attributable to | 0 | 0 | 0 | 0 | 0 | 134 | 134 | |||||||
Profit (loss) attributable to DB | 1,477 | 2,510 | 1,425 | 431 | (671) | 353 | 5,525 | |||||||
Profit (loss) attributable to additional equity components | 102 | 232 | 116 | 22 | 28 | (0) | 500 | |||||||
Profit (loss) attributable to Deutsche Bank shareholders | 1,375 | 2,278 | 1,309 | 408 | (699) | 353 | 5,025 | |||||||
Average allocated shareholders' equity | 11,901 | 26,032 | 13,584 | 5,459 | 3,018 | 0 | 59,994 | |||||||
Deduct: Average allocated goodwill and other intangible assets1 | 884 | 1,139 | 1,175 | 3,067 | 61 | 0 | 6,328 | |||||||
Average allocated tangible shareholders' equity | 11,017 | 24,893 | 12,409 | 2,392 | 2,956 | 0 | 53,666 | |||||||
Post-tax return on average | 11.6% | 8.8% | 9.6% | 7.5% | (23.2)% | N/M | 8.4% | |||||||
Post-tax return on average | 12.5% | 9.2% | 10.6% | 17.1% | (23.7)% | N/M | 9.4% | |||||||
N/M – Not meaningful
1Goodwill and other intangible assets related to the share of DWS that is not held by Deutsche Bank are excluded since the first quarter of 2018
493 |
Deutsche Bank | ||
Annual Report 2022 | ||
| 2021 | |||||||||||||
in € m. | Corporate | Investment | Private | Asset | Capital | Corporate & | Total | |||||||
Profit (loss) before tax | 1,011 | 3,714 | 355 | 816 | (1,364) | (1,142) | 3,390 | |||||||
Profit (loss) | 728 | 2,674 | 256 | 587 | (982) | (753) | 2,510 | |||||||
Profit (loss) attributable to | 0 | 0 | 0 | 0 | 0 | 144 | 144 | |||||||
Profit (loss) attributable to DB | 728 | 2,674 | 256 | 587 | (982) | (897) | 2,365 | |||||||
Profit (loss) attributable to additional equity components | 81 | 195 | 97 | 16 | 37 | (0) | 426 | |||||||
Profit (loss) attributable to Deutsche Bank shareholders | 647 | 2,479 | 159 | 571 | (1,019) | (897) | 1,940 | |||||||
Average allocated shareholders' equity | 10,301 | 24,181 | 12,663 | 4,815 | 4,473 | 0 | 56,434 | |||||||
Deduct: Average allocated goodwill and other intangible assets1 | 721 | 1,087 | 1,256 | 2,889 | 96 | 0 | 6,049 | |||||||
Average allocated tangible shareholders' equity | 9,580 | 23,094 | 11,408 | 1,926 | 4,377 | 0 | 50,385 | |||||||
Post-tax return on average | 6.3% | 10.3% | 1.3% | 11.9% | (22.8)% | N/M | 3.4% | |||||||
Post-tax return on average | 6.8% | 10.7% | 1.4% | 29.7% | (23.3)% | N/M | 3.8% | |||||||
N/M – Not meaningful
Prior year’s comparatives aligned to presentation in the current year
1Goodwill and other intangible assets related to the share of DWS that is not held by Deutsche Bank are excluded since the first quarter of 2018
| 2020 | |||||||||||||
in € m. | Corporate | Investment | Private | Asset | Capital | Corporate & | Total | |||||||
Profit (loss) before tax | 547 | 3,166 | (108) | 544 | (2,200) | (929) | 1,021 | |||||||
Profit (loss) | 394 | 2,280 | (78) | 392 | (1,584) | (780) | 624 | |||||||
Profit (loss) attributable to | 0 | 0 | 0 | 0 | 0 | 129 | 129 | |||||||
Profit (loss) attributable to DB | 394 | 2,280 | (78) | 392 | (1,584) | (909) | 495 | |||||||
Profit (loss) attributable to additional equity components | 72 | 169 | 79 | 14 | 48 | (0) | 382 | |||||||
Profit (loss) attributable to Deutsche Bank shareholders | 322 | 2,111 | (157) | 378 | (1,632) | (909) | 113 | |||||||
Average allocated shareholders' equity | 9,945 | 22,911 | 11,553 | 4,757 | 6,166 | 0 | 55,332 | |||||||
Deduct: Average allocated goodwill and other intangible assets1 | 603 | 1,133 | 1,255 | 2,993 | 142 | (0) | 6,127 | |||||||
Average allocated tangible shareholders' equity | 9,341 | 21,777 | 10,298 | 1,764 | 6,024 | 0 | 49,205 | |||||||
Post-tax return on average | 3.2% | 9.2% | (1.4)% | 7.9% | (26.5)% | N/M | 0.2% | |||||||
Post-tax return on average | 3.4% | 9.7% | (1.5)% | 21.4% | (27.1)% | N/M | 0.2% | |||||||
N/M – Not meaningful
Prior year’s comparatives aligned to presentation in the current year
1Goodwill and other intangible assets related to the share of DWS that is not held by Deutsche Bank are excluded since the first quarter of 2018
494 |
Deutsche Bank | ||
Annual Report 2022 | ||
Adjusted post-tax return (Group)
Adjusted post-tax return (Group) adjusts Profit (loss) attributable to Deutsche Bank shareholders for specific revenue items and transformation charges (each of which is further described below), impairment of goodwill and other intangibles, and restructuring and severance, as well as for the impact of tax net of these items. Adjusted post-tax return on average tangible shareholders’ equity is calculated by dividing Adjusted profit (loss) attributable to Deutsche Bank shareholders by Average allocated tangible shareholders' equity. The Group believes that a presentation of Adjusted post-tax return makes comparisons to its competitors easier.
in € m. | 2022 | 2021 | 2020 | |||
Profit (loss) attributable to Deutsche Bank shareholders | 5,025 | 1,940 | 113 | |||
Specific revenue items | (473) | (73) | (30) | |||
Transformation charges | 132 | 1,003 | 490 | |||
Impairment of goodwill / other intangibles | 68 | 5 | 0 | |||
Restructuring & severance | (6) | 470 | 688 | |||
Tax adjustments | 81 | (392) | (313) | |||
of which: Tax effect of above adjustment items1 | 78 | (393) | (321) | |||
of which: Adjustments for share based payment related effects | 3 | 1 | (29) | |||
of which: Adjustments for DTA valuation adjustments (transformation related) | 0 | 0 | 37 | |||
Adjusted profit (loss) attributable to Deutsche Bank shareholders | 4,827 | 2,952 | 947 | |||
Average allocated tangible shareholders' equity | 53,666 | 50,385 | 49,205 | |||
Adjusted post-tax return on average tangible shareholders’ equity | 9.0% | 5.9% | 1.9% | |||
1Pre-tax adjustments taxed at a rate of 28%
Core Bank
The Core Bank represents the Group excluding the Capital Release Unit.
The following table presents the results of the Core Bank.
in € m. | 2022 | 2021 | 2020 | |||
Profit (loss) before tax | 6,527 | 4,754 | 3,221 | |||
Profit (loss) | 6,330 | 3,492 | 2,208 | |||
Profit (loss) attributable to noncontrolling interests | 134 | 144 | 129 | |||
Profit (loss) attributable to Deutsche Bank shareholders and additional equity components | 6,196 | 3,347 | 2,079 | |||
Profit (loss) attributable to additional equity components | 472 | 388 | 334 | |||
Profit (loss) attributable to Deutsche Bank shareholders | 5,724 | 2,959 | 1,745 | |||
Average allocated shareholders' equity | 56,976 | 51,961 | 49,166 | |||
Deduct: Average allocated goodwill and other intangible assets | 6,266 | 5,953 | 5,985 | |||
Average allocated tangible shareholders' equity | 50,710 | 46,008 | 43,181 | |||
Post-tax return on average shareholders’ equity | 10.0% | 5.7% | 3.5% | |||
Post-tax return on average tangible shareholders’ equity | 11.3% | 6.4% | 4.0% | |||
Prior year’s comparatives aligned to presentation in the current year
The following table presents a reconciliation of Adjusted profit (loss) before tax of the Core Bank.
in € m. | 2022 | 2021 | 2020 | |||
Profit (loss) before tax - Group | 5,594 | 3,390 | 1,021 | |||
Profit (loss) before tax - CRU | (932) | (1,364) | (2,200) | |||
Profit (loss) before tax - Core Bank | 6,527 | 4,754 | 3,221 | |||
Prior year’s comparatives aligned to presentation in the current year
in € m. | 2022 | 2021 | 2020 | |||
Profit (loss) before tax | 6,527 | 4,754 | 3,221 | |||
Specific revenue items | (479) | (74) | (38) | |||
Transformation charges | 132 | 945 | 328 | |||
Impairment of goodwill / other intangibles | 68 | 5 | 0 | |||
Restructuring & severance | (8) | 464 | 671 | |||
Adjusted profit (loss) before tax – Core Bank | 6,241 | 6,093 | 4,182 | |||
495 |
Deutsche Bank | ||
Annual Report 2022 | ||
Adjusted post-tax return (Core Bank)
The following table presents a reconciliation of adjusted post-tax return on average tangible shareholders’ equity of the Core Bank.
in € m. | 2022 | 2021 | 2020 | |||
Profit (loss) attributable to Deutsche Bank shareholders | 5,724 | 2,959 | 1,745 | |||
Specific revenue items | (479) | (74) | (38) | |||
Transformation charges | 132 | 945 | 328 | |||
Impairment of goodwill / other intangibles | 68 | 5 | 0 | |||
Restructuring & severance | (8) | 464 | 671 | |||
Tax adjustments | 83 | (374) | (261) | |||
of which: Tax effect of above adjustment items1 | 80 | (375) | (269) | |||
of which: Adjustments for share based payment related effects | 3 | 1 | (29) | |||
of which: Adjustments for DTA valuation adjustments (transformation related) | 0 | 0 | 37 | |||
Adjusted profit (loss) attributable to Deutsche Bank shareholders | 5,521 | 3,924 | 2,445 | |||
Average allocated tangible shareholders' equity | 50,710 | 46,008 | 43,181 | |||
Adjusted post-tax return on average tangible shareholders’ equity | 10.9% | 8.5% | 5.7% | |||
Prior year’s comparatives aligned to presentation in the current year
1 Pre-tax adjustments taxed at a rate of 28%
Transformation charges
Transformation charges are costs, included in adjusted costs, that are directly related to Deutsche Bank’s transformation as a result of the strategy announced on July 7, 2019 and certain costs related to incremental or accelerated decisions driven by the changes in the expected operations due to the COVID-19 pandemic. Such charges include the transformation related impairment of software and real estate, the accelerated software amortization and other transformation charges like onerous contract provisions or legal and consulting fees related to the strategy execution. The table represents the transformation charges by the respective cost category.
in € m. | 2022 | 2021 | 2020 | |||
Compensation and benefits | 0 | 8 | 8 | |||
Information Technology | 117 | 689 | 257 | |||
Professional services | 12 | 35 | 18 | |||
Occupancy | 0 | 258 | 196 | |||
Communication, data services, marketing | 1 | 4 | 7 | |||
Other | 3 | 8 | 4 | |||
Transformation charges | 132 | 1,003 | 490 | |||
Adjusted costs
Adjusted costs is one of the Group’s key performance indicators and is a non-GAAP financial measure for which the most directly comparable IFRS financial measure is noninterest expenses. Adjusted costs is calculated by deducting (i) impairment of goodwill and other intangible assets, (ii) net litigation charges and (iii) restructuring and severance (in total referred to as nonoperating costs) from noninterest expenses under IFRS. The Group believes that a presentation of noninterest expenses excluding the impact of these items provides a more meaningful depiction of the costs associated with the operating businesses. To show the development of the cost initiatives excluding costs that are directly related to Deutsche Bank’s transformation as a result of the strategy announced on July 7, 2019, the Group also presents Adjusted costs excluding transformation charges, in which the transformation charges described above are deducted from Adjusted costs.
BNP Paribas and Deutsche Bank signed a master transaction agreement to provide continuity of service to Deutsche Bank’s Prime Finance and Electronic Equities clients. Under the agreement Deutsche Bank operated the platform until clients were migrated to BNP Paribas by the end of 2021. Expenses of the transferred business were eligible for reimbursement by BNP Paribas. To show the development of the cost initiatives excluding not only transformation charges but also these eligible reimbursable expenses, for 2021 and 2020 the Group also presents Adjusted costs excluding transformation charges and expenses eligible for reimbursement related to Prime Finance.
496 |
Deutsche Bank | ||
Annual Report 2022 | ||
| 2022 | ||||||||||||||
in € m. | Corporate | Investment | Private | Asset | Capital | Corporate & | Total | ||||||||
Noninterest expenses | 3,949 | 6,196 | 6,593 | 1,836 | 922 | 893 | 20,390 | ||||||||
Impairment of goodwill and other | 0 | 0 | 0 | 68 | 0 | 0 | 68 | ||||||||
Litigation charges, net | 23 | 166 | (60) | 24 | 139 | 122 | 413 | ||||||||
Restructuring and severance | (6) | 44 | (87) | 37 | 2 | 5 | (6) | ||||||||
Adjusted costs | 3,933 | 5,986 | 6,740 | 1,708 | 781 | 767 | 19,915 | ||||||||
Transformation charges | 16 | 0 | 116 | 0 | 0 | 0 | 132 | ||||||||
Adjusted costs ex. transformation charges | 3,917 | 5,986 | 6,624 | 1,708 | 781 | 767 | 19,782 | ||||||||
2021 | |||||||||||||||
in € m. | Corporate | Investment | Private | Asset | Capital | Corporate & | Total | ||||||||
Noninterest expenses | 4,143 | 5,831 | 7,433 | 1,664 | 1,432 | 1,002 | 21,505 | ||||||||
Impairment of goodwill and other | 5 | 0 | 0 | 0 | 0 | 0 | 5 | ||||||||
Litigation charges, net | 2 | 99 | 134 | 2 | 230 | 1 | 466 | ||||||||
Restructuring and severance | 111 | 87 | 237 | 21 | 6 | 7 | 470 | ||||||||
Adjusted costs | 4,025 | 5,645 | 7,062 | 1,641 | 1,195 | 995 | 20,564 | ||||||||
Transformation charges | 58 | 60 | 221 | 3 | 57 | 603 | 1003 | ||||||||
Adjusted costs ex. transformation charges | 3,967 | 5,585 | 6,841 | 1,638 | 1,138 | 391 | 19,561 | ||||||||
Expenses eligible for reimbursement related to Prime Finance | 302 | ||||||||||||||
Adjusted costs ex. transformation charges and expenses eligible for reimbursement related to Prime Finance | 19,259 | ||||||||||||||
Prior year’s comparatives aligned to presentation in the current year
2020 | ||||||||||||||
in € m. | Corporate | Investment | Private | Asset | Capital | Corporate & | Total | |||||||
Noninterest expenses | 4,235 | 5,418 | 7,522 | 1,526 | 1,947 | 568 | 21,216 | |||||||
Impairment of goodwill and other | 0 | 0 | 0 | 0 | 0 | 0 | 0 | |||||||
Litigation charges, net | 99 | 20 | 83 | (1) | 25 | (67) | 158 | |||||||
Restructuring and severance | 79 | 26 | 520 | 37 | 17 | 10 | 688 | |||||||
Adjusted costs | 4,058 | 5,373 | 6,920 | 1,490 | 1,905 | 625 | 20,370 | |||||||
Transformation charges | 59 | 84 | 122 | 5 | 162 | 58 | 490 | |||||||
Adjusted costs ex. transformation charges | 3,999 | 5,289 | 6,797 | 1,485 | 1,743 | 567 | 19,880 | |||||||
Expenses eligible for reimbursement related to Prime Finance | 360 | |||||||||||||
Adjusted costs ex. transformation charges and expenses eligible for reimbursement related to Prime Finance | 19,520 | |||||||||||||
Prior year’s comparatives aligned to presentation in the current year
The following table presents a reconciliation of Adjusted costs excluding transformation charges and bank levies for the Group.
in € m. | 2022 | 2021 | 2020 | |||
Adjusted costs ex. transformation charges | 19,782 | 19,561 | 19,880 | |||
Bank levies | 762 | 553 | 634 | |||
Adjusted costs ex. transformation charges and bank levies | 19,020 | 19,008 | 19,246 | |||
497 |
Deutsche Bank | ||
Annual Report 2022 | ||
Revenues excluding specific items
Revenues excluding specific items is a performance indicator that is a non-GAAP financial measure most directly comparable to the IFRS financial measure net revenues. Revenues excluding specific items is calculated by adjusting net revenues under IFRS for specific revenue items which generally fall outside the usual nature or scope of the business and are likely to distort an accurate assessment of the divisional operating performance. Excluded items are Debt Valuation Adjustment (DVA) and material transactions or events that are either one-off in nature or belong to a portfolio of connected transactions or events where the P&L impact is limited to a specific period of time. The Group believes that a presentation of net revenues excluding the impact of these items provides a more meaningful depiction of the revenues associated with the business.
| 2022 | ||||||||||||||
in € m. | Corporate | Investment | Private | Asset | Capital | Corporate & | Total | ||||||||
Revenues | 6,335 | 10,016 | 9,155 | 2,608 | (28) | (877) | 27,210 | ||||||||
DVA | 0 | 49 | 0 | 0 | (6) | 0 | 43 | ||||||||
Sal. Oppenheim workout | 0 | 0 | 125 | 0 | 0 | 0 | 125 | ||||||||
Gain on sale Financial Advisors business Italy – International Private Bank1 | 0 | 0 | 305 | 0 | 0 | 0 | 305 | ||||||||
Total Specific revenue items | 0 | 49 | 430 | 0 | (6) | 0 | 473 | ||||||||
Revenues excluding specific items | 6,335 | 9,968 | 8,725 | 2,608 | (22) | (877) | 26,737 | ||||||||
1 Gain on sale of € 312m, net of transaction-related fees of € 6m
2021 | |||||||||||||||
in € m. | Corporate | Investment | Private | Asset | Capital | Corporate & | Total | ||||||||
Revenues | 5,151 | 9,631 | 8,234 | 2,708 | 26 | (340) | 25,410 | ||||||||
DVA | 0 | (28) | 0 | 0 | (2) | 0 | (30) | ||||||||
Sal. Oppenheim workout | 0 | 0 | 103 | 0 | 0 | 0 | 103 | ||||||||
Gain on sale Financial Advisors business Italy – International Private Bank | 0 | 0 | 0 | 0 | 0 | 0 | 0 | ||||||||
Total Specific revenue items | 0 | (28) | 103 | 0 | (2) | 0 | 73 | ||||||||
Revenues excluding specific items | 5,151 | 9,660 | 8,132 | 2,708 | 28 | (340) | 25,337 | ||||||||
Prior year’s comparatives aligned to presentation in the current year
2020 | ||||||||||||||
in € m. | Corporate | Investment | Private | Asset | Capital | Corporate & | Total | |||||||
Revenues | 5,146 | 9,286 | 8,126 | 2,229 | (225) | (534) | 24,028 | |||||||
DVA | 0 | 6 | 0 | 0 | (8) | 0 | (2) | |||||||
Sale of PB Systems to TCS | (16) | 0 | (88) | 0 | 0 | 0 | (104) | |||||||
Change in valuation of an investment | 0 | 22 | 0 | 0 | 0 | 0 | 22 | |||||||
Sal. Oppenheim workout | 0 | 0 | 114 | 0 | 0 | 0 | 114 | |||||||
Gain on sale Financial Advisors business Italy – International Private Bank | 0 | 0 | 0 | 0 | 0 | 0 | 0 | |||||||
Total Specific revenue items | (16) | 28 | 26 | 0 | (8) | 0 | 30 | |||||||
Revenues excluding specific items | 5,161 | 9,258 | 8,100 | 2,229 | (217) | (534) | 23,998 | |||||||
Prior year’s comparatives aligned to presentation in the current year
498 |
Deutsche Bank | ||
Annual Report 2022 | ||
Revenues and costs on a currency adjusted basis
Revenues and costs on a currency-adjusted basis are calculated by translating prior-period revenues or costs that were generated or incurred in non-euro currencies into euros at the foreign exchange rates that prevailed during the current year period. These adjusted figures, and period-to-period percentage changes based thereon, are intended to provide information on the development of underlying business volumes and costs.
Adjusted profit (loss) before tax
Adjusted profit (loss) before tax is calculated by adjusting the profit (loss) before tax under IFRS for specific revenue items, transformation charges, impairments of goodwill and other intangibles, as well as restructuring and severance expenses. The Group believes that a presentation of profit (losses) before tax excluding the impact of the foregoing items provides a more meaningful depiction of the profitability of the operating business.
| 2022 | ||||||||||||||
in € m. | Corporate | Investment | Private | Asset | Capital | Corporate & | Total | ||||||||
Profit (loss) before tax | 2,051 | 3,487 | 1,979 | 598 | (932) | (1,589) | 5,594 | ||||||||
Specific revenue items | 0 | (49) | (430) | 0 | 6 | 0 | (473) | ||||||||
Transformation charges | 16 | 0 | 116 | 0 | 0 | 0 | 132 | ||||||||
Impairment of goodwill / other intangibles | 0 | 0 | 0 | 68 | 0 | 0 | 68 | ||||||||
Restructuring & severance | (6) | 44 | (87) | 37 | 2 | 5 | (6) | ||||||||
Adjusted profit (loss) before tax | 2,061 | 3,482 | 1,578 | 703 | (925) | (1,584) | 5,316 | ||||||||
2021 | |||||||||||||||
in € m. | Corporate | Investment | Private | Asset | Capital | Corporate & | Total | ||||||||
Profit (loss) before tax | 1,011 | 3,714 | 355 | 816 | (1,364) | (1,142) | 3,390 | ||||||||
Specific revenue items | 0 | 28 | (103) | 0 | 2 | 0 | (73) | ||||||||
Transformation charges | 58 | 60 | 221 | 3 | 57 | 603 | 1,003 | ||||||||
Impairment of goodwill / other intangibles | 5 | 0 | 0 | 0 | 0 | 0 | 5 | ||||||||
Restructuring & severance | 111 | 87 | 237 | 21 | 6 | 7 | 470 | ||||||||
Adjusted profit (loss) before tax | 1,185 | 3,889 | 711 | 840 | (1,298) | (531) | 4,795 | ||||||||
Prior year’s comparatives aligned to presentation in the current year
2020 | ||||||||||||||
in € m. | Corporate | Investment | Private | Asset | Capital | Corporate & | Total | |||||||
Profit (loss) before tax | 547 | 3,166 | (108) | 544 | (2,200) | (929) | 1,021 | |||||||
Specific revenue items | 16 | (28) | (26) | 0 | 8 | 0 | (30) | |||||||
Transformation charges | 59 | 84 | 122 | 5 | 162 | 58 | 490 | |||||||
Impairment of goodwill / other intangibles | 0 | 0 | 0 | 0 | 0 | 0 | 0 | |||||||
Restructuring & severance | 79 | 26 | 520 | 37 | 17 | 10 | 688 | |||||||
Adjusted profit (loss) before tax | 700 | 3,248 | 509 | 586 | (2,013) | (861) | 2,169 | |||||||
Prior year’s comparatives aligned to presentation in the current year
499 |
Deutsche Bank | ||
Annual Report 2022 | ||
Adjustments regarding BGH ruling on pricing agreements for Private Bank
In the second quarter of 2021, the bank introduced a pro-forma disclosure, which is a non-GAAP financial measure, that excludes impacts related to a BGH ruling on pricing agreements from Private Bank’s revenues, profit before tax and post-tax return on average tangible shareholder’s equity. The bank introduced this disclosure to improve comparability of Private Bank’s operational trends compared to the prior quarters.
in € m. | 2022 | 2021 | 2020 | |||
Net Revenues | 9,155 | 8,234 | 8,126 | |||
BGH ruling on pricing agreements - impact of forgone revenues | 22 | 154 | 0 | |||
of which: Private Bank Germany - BGH ruling on pricing agreements - impact of forgone revenues | 23 | 152 | 0 | |||
Net revenues ex BGH ruling on pricing agreements | 9,177 | 8,388 | 8,126 | |||
of which: Private Bank Germany net revenues ex BGH ruling on pricing agreements | 5,351 | 5,160 | 4,989 | |||
Revenue specific items | (430) | (103) | (26) | |||
Net revenues ex specific items ex BGH ruling on pricing agreements | 8,747 | 8,285 | 8,100 | |||
therein: Private Bank Germany – revenues ex specific items ex BGH ruling on pricing agreements | 5,351 | 5,160 | 5,077 | |||
Adjusted profit (loss) before tax | 1,578 | 711 | 509 | |||
BGH ruling - total impact | (60) | 284 | 0 | |||
of which: impact of forgone revenues | 22 | 154 | 0 | |||
of which: impact of additional adjusted costs | 4 | 2 | 0 | |||
of which: impact of litigation charges | (86) | 128 | 0 | |||
Adjusted profit (loss) before tax ex BGH ruling on pricing agreements | 1,518 | 994 | 509 | |||
Adjusted profit (loss) ex BGH ruling on pricing agreements | 1,093 | 716 | 366 | |||
Profit (loss) attributable to noncontrolling interests | 0 | 0 | 0 | |||
Profit (loss) attributable to additional equity components | 116 | 97 | 79 | |||
Adjusted Profit (loss) attributable to Deutsche Bank shareholders ex BGH ruling on pricing agreements | 977 | 619 | 287 | |||
Average allocated tangible shareholders' equity | 12,409 | 11,408 | 10,298 | |||
Adjusted post-tax RoTE ex BGH ruling on pricing agreements (in %) | 7.9% | 5.4% | 2.8% | |||
Reported post-tax RoTE (in %) | 10.6% | 1.4% | (1.5)% | |||
Net assets (adjusted)
Net assets (adjusted) are defined as IFRS Total assets adjusted to reflect the recognition of legal netting agreements, offsetting of cash collateral received and paid and offsetting pending settlements balances. The Group believes that a presentation of net assets (adjusted) makes comparisons to its competitors easier.
in € m. | 2022 | 2021 | 2020 | |||
Total assets | 1,337 | 1,324 | 1,325 | |||
Deduct: Derivatives (incl. hedging derivatives) credit line netting | 228 | 239 | 266 | |||
Deduct: Derivatives cash collateral received / paid | 70 | 65 | 83 | |||
Deduct: Securities Financing Transactions credit line netting | 2 | 2 | 1 | |||
Deduct: Pending settlements netting | 17 | 15 | 12 | |||
Net assets (adjusted) | 1,019 | 1,002 | 963 | |||
500 |
Deutsche Bank | ||
Annual Report 2022 | ||
Book Value and Tangible Book Value per Basic Share Outstanding
Book value per basic share outstanding and tangible book value per basic share outstanding are non-GAAP financial measures that are used and relied upon by investors and industry analysts as capital adequacy metrics. Book value per basic share outstanding represents the Bank’s total shareholders’ equity divided by the number of basic shares outstanding at period-end. Tangible book value represents the Bank’s total shareholders’ equity less goodwill and other intangible assets. Tangible book value per basic share outstanding is computed by dividing tangible book value by period-end basic shares outstanding.
Tangible Book Value
in € m. | 2022 increase (decrease) | 2021 increase (decrease) | ||||||||||||
(unless stated otherwise) | 2022 | 2021 | 2020 | in € m. | in % | in € m. | in % | |||||||
Total shareholders’ equity (Book value) | 61,959 | 58,027 | 54,786 | 3,932 | 7 | 3,242 | 6 | |||||||
Goodwill and other intangible assets1 | (6,327) | (6,079) | (5,997) | (248) | 4 | (82) | 1 | |||||||
Tangible shareholders’ equity (Tangible | 55,632 | 51,949 | 48,789 | 3,683 | 7 | 3,160 | 6 | |||||||
1Excludes Goodwill and other intangible assets attributable to partial sale of DWS
Basic Shares Outstanding
in € m. | 2022 increase (decrease) | 2021 increase (decrease) | ||||||||||||
(unless stated otherwise) | 2022 | 2021 | 2020 | in € m. | in % | in € m. | in % | |||||||
Number of shares | 2,066.8 | 2,066.8 | 2,066.8 | 0 | 0 | 0 | 0 | |||||||
Shares outstanding: | ||||||||||||||
Treasury shares | (28.9) | (0.7) | (1.3) | (28.3) | N/M | 0.6 | (47.7) | |||||||
Vested share awards | 45.6 | 34.5 | 38.6 | 11.1 | 32.0 | (4.1) | (10.7) | |||||||
Basic shares outstanding | 2,083.4 | 2,100.6 | 2,104.1 | (17.2) | (0.8) | (3.5) | (0.2) | |||||||
Book value per basic share outstanding in € | 29.74 | 27.62 | 26.04 | 2.12 | 7.7 | 1.58 | 6.1 | |||||||
Tangible book value per basic share | 26.70 | 24.73 | 23.19 | 1.97 | 8.0 | 1.54 | 6.6 | |||||||
CRR/CRD Regulatory measures
The Group’s regulatory assets, exposures, risk-weighted assets, capital and ratios are calculated for regulatory purposes and are set forth throughout this document under the CRR/CRD as currently applicable.
For the comparatives as of December 31, 2021 certain figures are based on the CRR definition of own fund instruments (applicable for Additional Tier 1 (AT1) capital and Tier 2 capital and figures based thereon, including Tier 1, Total Capital and Leverage Ratio) are presented on a “fully loaded” basis. Such fully loaded figures are calculated excluding the transitional arrangements for own fund instruments as provided in the currently applicable CRR/CRD. Deutsche Bank had immaterial amounts of such instruments outstanding at year end 2022. For those comparatives periods the CET 1 and RWA figures include the transitional impacts from the IFRS 9 add-back also in the fully-loaded figures given it is an immaterial difference. Measures calculated pursuant to the Group’s fully loaded methodology are non-GAAP financial measures.
Deutsche Bank believes that these fully loaded calculations provided useful information to investors as they reflected the bank’s progress against then known future regulatory capital standards. Many of Deutsche Bank’s competitors have been describing calculations on a fully loaded basis, however, competitors’ assumptions and estimates regarding fully loaded calculations may have varied such that the bank’s fully loaded measures may not have been comparable with similarly labelled measures used by its competitors.
501 |
Deutsche Bank | ||
Annual Report 2022 | ||
Declaration of Backing | ||
Deutsche Bank AG ensures, except in the case of political risk, that the following subsidiaries are able to meet their | ||
contractual liabilities: | ||
D B Investments (GB) Limited, London | Deutsche Bank Trust Company Americas, New York | |
DB International (Asia) Limited, Singapore Deutsche Australia Limited, Sydney DEUTSCHE BANK A.Ş., Istanbul Deutsche Bank Americas Holding Corp., Wilmington Deutsche Bank (China) Co., Ltd., Beijing Deutsche Bank Europe GmbH, Frankfurt am Main Deutsche Bank Luxembourg S.A., Luxembourg Deutsche Bank (Malaysia) Berhad, Kuala Lumpur Deutsche Bank Polska Spółka Akcyjna, Warsaw Deutsche Bank S.A. – Banco Alemão, São Paulo Deutsche Bank, Sociedad Anónima Española, Madrid Deutsche Bank Società per Azioni, Milan Deutsche Bank (Suisse) SA, Geneva | Deutsche Holdings (Grand Duchy), Luxembourg Deutsche Immobilien Leasing GmbH, Düsseldorf Deutsche Morgan Grenfell Group Limited, London Deutsche Securities Inc., Tokyo Deutsche Securities Asia Limited, Hong Kong Deutsche Securities Saudi Arabia (a closed joint stock company), Riyadh norisbank GmbH, Bonn Joint Stock Company Deutsche Bank DBU, Kiev OOO “Deutsche Bank”, Moscow Deutsche Oppenheim Family Office AG, Cologne BHW Bausparkasse Aktiengesellschaft, Hameln PB Factoring GmbH, Bonn | |
502 |
Deutsche Bank | ||
Annual Report 2022 | ||
Group Five-Year Record
in € m. | 2022 | 2021 | 2020 | 2019 | 2018 | |||||
Net interest income | 13,650 | 11,155 | 11,526 | 13,749 | 13,316 | |||||
Provision for credit losses | 1,226 | 515 | 1,792 | 723 | 525 | |||||
Net interest income after provision for credit losses | 12,425 | 10,640 | 9,734 | 13,026 | 12,791 | |||||
Commissions and fee income | 9,838 | 10,934 | 9,424 | 9,520 | 10,039 | |||||
Net gains (losses) on financial assets/liabilities | 2,999 | 3,045 | 2,465 | 193 | 1,209 | |||||
Other noninterest income (loss) | 723 | 277 | 614 | (298) | 753 | |||||
Total net revenues | 27,210 | 25,410 | 24,028 | 23,165 | 25,316 | |||||
Compensation and benefits | 10,712 | 10,418 | 10,471 | 11,142 | 11,814 | |||||
General and administrative expenses | 9,728 | 10,821 | 10,259 | 12,253 | 11,286 | |||||
Policyholder benefits and claims | 0 | 0 | 0 | 0 | 0 | |||||
Impairment of goodwill and other intangible assets | 68 | 5 | 0 | 1,037 | 0 | |||||
Restructuring activities | (118) | 261 | 485 | 644 | 360 | |||||
Total noninterest expenses | 20,390 | 21,505 | 21,216 | 25,076 | 23,461 | |||||
Income (loss) before income taxes | 5,594 | 3,390 | 1,021 | (2,634) | 1,330 | |||||
Income tax expense | (64) | 880 | 397 | 2,630 | 989 | |||||
Net income (loss) | 5,659 | 2,510 | 624 | (5,265) | 341 | |||||
Net income attributable to noncontrolling interests | 134 | 144 | 129 | 125 | 75 | |||||
Net income (loss) attributable to Deutsche Bank shareholders and additional equity components | 5,525 | 2,365 | 495 | (5,390) | 267 | |||||
in € | ||||||||||
Basic earnings per share1 | 2.42 | 0.96 | 0.07 | (2.71) | (0.01) | |||||
Diluted earnings per share2 | 2.37 | 0.93 | 0.07 | (2.71) | (0.01) | |||||
Dividends paid per share3 | 0.20 | 0.00 | 0.00 | 0.11 | 0.11 | |||||
Dividends paid per share in U.S.$4 | 0.21 | 0.00 | 0.00 | 0.12 | 0.13 | |||||
1Basic earnings per share for each period are calculated by dividing net income attributable to Deutsche Bank shareholders by the average number of common shares outstanding; earnings were adjusted by € 479 million, € 363 million, € 349 million and € 330 million before tax and € 292 million net of tax for the coupons paid on Additional Tier 1 Notes in April 2022, April 2021, April 2020, April 2019 and April 2018, respectively; since 2019 the tax impact is recognized in net income (loss) directly.
2Diluted earnings per share for each period are calculated by dividing net income attributable to Deutsche Bank shareholders by the average number of common shares outstanding, both after assumed conversions; earnings were adjusted by € 479 million, € 363 million, € 349 million and € 330 million before tax and € 292 million net of tax for the coupons paid on Additional Tier 1 Notes in April 2022, April 2021, April 2020, April 2019 and April 2018, respectively; for 2019 there was no dilutive effect as the Group reported a net loss; there was no dilutive effect for 2018 as the net income was offset by coupons paid on Additional Tier 1 Notes; since 2019 the tax impact is recognized in net income (loss) directly.
3Dividends declared and paid in the year.
4Dividends declared and paid in U.S.$ were translated from € into U.S.$ based on the exchange rates as of the respective payment days.
in € m. | 2022 | 2021 | 2020 | 2019 | 2018 | |||||
Total assets | 1,336,788 | 1,323,993 | 1,325,259 | 1,297,674 | 1,348,137 | |||||
Loans at amortized cost | 483,700 | 471,319 | 426,995 | 429,841 | 400,297 | |||||
Deposits | 621,456 | 603,750 | 568,031 | 572,208 | 564,405 | |||||
Long-term debt | 131,525 | 144,485 | 149,163 | 136,473 | 152,083 | |||||
Common shares | 5,291 | 5,291 | 5,291 | 5,291 | 5,291 | |||||
Total shareholders’ equity | 61,959 | 58,027 | 54,786 | 55,857 | 62,495 | |||||
Common Equity Tier 1 capital (CRR/CRD 4 reported/phase-in)1 | 48,097 | 46,506 | 44,885 | 44,148 | 47,486 | |||||
Common Equity Tier 1 capital (CRR/CRD 4 fully loaded)1,2 | N/A | 46,506 | 44,885 | 44,148 | 47,486 | |||||
Tier 1 capital (CRR/CRD 4 reported/phase-in)1 | 56,616 | 55,375 | 51,734 | 50,546 | 55,091 | |||||
Tier 1 capital (CRR/CRD 4 fully loaded)1,2 | N/A | 54,775 | 50,634 | 48,733 | 52,082 | |||||
Total regulatory capital (CRR/CRD 4 reported/phase-in)1 | 66,146 | 62,732 | 58,677 | 56,503 | 61,292 | |||||
Total regulatory capital (CRR/CRD 4 fully loaded)1,2 | N/A | 62,102 | 57,257 | 56,503 | 61,292 | |||||
1Figures presented based on the transitional rules (“CRR/CRD 4”) and the full application (“CRR/CRD 4 fully loaded”) of the CRR/CRD 4 framework.
2Starting with the first quarter of 2022, information is presented as reported as the fully loaded definition has been eliminated as resulting only in an immaterial difference; comparative information for earlier periods is unchanged and based on Deutsche Bank’s earlier fully loaded definition.
503 |
Deutsche Bank | ||
Annual Report 2022 | ||
Imprint / Publications | ||||
Deutsche Bank Aktiengesellschaft | Cautionary statement regarding forward-looking statements | |||
Taunusanlage 12 | ||||
60325 Frankfurt am Main | This report contains forward-looking statements. | |||
(for letters and postcards: 60262) | Forward-looking statements are statements that | |||
Germany | are not historical facts; they include statements | |||
Telephone: +49 69 910-00 | about our beliefs and expectations and the | |||
deutsche.bank@db.com | assumptions underlying them. These statements | |||
are based on plans, estimates and projections as | ||||
they are currently available to the management of | ||||
Contact for shareholders | Deutsche Bank. Forward-looking statements | |||
+49 800 910-8000 | therefore speak only as of the date they are | |||
db.ir@db.com | made, and we undertake no obligation to update | |||
publicly any of them in light of new information or | ||||
future events. | ||||
AGM Hotline | ||||
+49 6196 8870704 | ||||
By their very nature, forward-looking statements | ||||
involve risks and uncertainties. A number of | ||||
Online | important factors could therefore cause actual | |||
All publications relating to our | results to differ materially from those contained in | |||
financial reporting are available at: | any forward-looking statement. Such factors | |||
www.db.com/reports | include the conditions in the financial markets in | |||
Germany, in Europe, in the United States and | ||||
elsewhere from which the bank derives a substantial | ||||
Publication | portion of its revenues and in which we hold a | |||
Published on March 17, 2023 | substantial portion of its assets, the development | |||
of asset prices and market volatility, potential | ||||
defaults of borrowers or trading counterparties, | ||||
the implementation of the Group’s strategic initiatives, | ||||
the reliability of its risk management policies, | ||||
procedures and methods, and other risks | ||||
referenced in its filings with the U.S. Securities | ||||
and Exchange Commission. Such factors are | ||||
described in detail in the bank’s SEC Form 20-F of | ||||
March 11, 2022 under the heading “Risk Factors.” | ||||
Copies of this document are readily available | ||||
upon request or can be downloaded from | ||||
www.db.com/ir. | ||||
504 |