As filed with the Securities and Exchange Commission on April 15, 2013
UNITED STATES
SECURITIES AND EXCHANGE COMMISSION
WASHINGTON, D.C. 20549
Form 20-F
| | ¨ | REGISTRATION STATEMENT PURSUANT TO SECTION 12(b) OR (g) OF THE SECURITIES EXCHANGE ACT OF 1934 |
or
| | x | ANNUAL REPORT PURSUANT TO SECTION 13 OR 15(d) OF THE SECURITIES EXCHANGE ACT OF 1934 FOR THE FISCAL YEAR ENDED DECEMBER 31, 2012 |
or
| | ¨ | TRANSITION REPORT PURSUANT TO SECTION 13 OR 15(d) OF THE SECURITIES EXCHANGE ACT OF 1934 |
or
| | ¨ | SHELL COMPANY REPORT PURSUANT TO SECTION 13 OR 15(d) OF THE SECURITIES EXCHANGE ACT OF 1934 |
Date of event requiring this shell company report……………………………….
Commission file number 1-15242
Deutsche Bank Aktiengesellschaft
(Exact name of Registrant as specified in its charter)
Deutsche Bank Corporation
(Translation of Registrant’s name into English)
Federal Republic of Germany
(Jurisdiction of incorporation or organization)
Taunusanlage 12, 60325 Frankfurt am Main, Germany
(Address of principal executive offices)
Karin Dohm, +49-69-910-31183, karin.dohm@db.com, Taunusanlage 12, 60325 Frankfurt am Main, Germany
(Name, Telephone, E-mail and/or Facsimile number and Address of Company Contact Person)
Securities registered or to be registered pursuant to Section 12(b) of the Act
See following page
Securities registered or to be registered pursuant to Section 12(g) of the Act.
NONE
(Title of Class)
Securities for which there is a reporting obligation pursuant to Section 15(d) of the Act.
NONE
(Title of Class)
Indicate the number of outstanding shares of each of the issuer’s classes of capital or common stock as of the close of the period covered by the annual report:
| | |
| Ordinary Shares, no par value | | 929,183,898 |
(as of December 31, 2012)
Indicate by check mark if the registrant is a well-known seasoned issuer, as defined in Rule 405 of the Securities Act.
Yes x No ¨
If this report is an annual or transition report, indicate by check mark if the registrant is not required to file reports pursuant to Section 13 or 15(d) of the Securities Exchange Act of 1934.
Yes ¨ No x
Indicate by check mark whether the registrant (1) has filed all reports required to be filed by Section 13 or 15(d) of the Securities Exchange Act of 1934 during the preceding 12 months (or for such shorter period that the registrant was required to file such reports), and (2) has been subject to such filing requirements for the past 90 days.
Yes x No ¨
Indicate by check mark whether the registrant has submitted electronically and posted on its corporate website, if any, every Interactive Data File required to be submitted and posted pursuant to Rule 405 of Regulation S-T (§232.405 of this chapter) during the preceding 12 months (or for such shorter period that the registrant was required to submit and post such files).
Yes ¨ No ¨
Indicate by check mark whether the registrant is a large accelerated filer, an accelerated filer, or non-accelerated filer. See definition of “accelerated filer and large accelerated filer” in Rule 12b-2 of the Exchange Act (Check one):
| | | | |
| Large accelerated filer x | | Accelerated filer ¨ | | Non-accelerated filer ¨ |
Indicate by check mark which basis of accounting the registrant has used to prepare the financial statements included in this filing:
| | | | |
| U.S. GAAP ¨ | | International Financial Reporting Standards x | | Other ¨ |
| | as issued by the International Accounting Standards Board | | |
If “Other” has been checked in response to the previous question, indicate by check mark which financial statement item the registrant has elected to follow
Item 17 ¨ Item 18 ¨
If this is an annual report, indicate by check mark whether the registrant is a shell company (as defined in Rule 12b-2 of the Exchange Act).
Yes ¨ No x
| | | | |
| Deutsche Bank | | | | |
| Annual Report 2012 on Form 20-F | | | | |
| | |
| | | | |
| | |
| | | | |
Securities registered or to be registered pursuant to Section 12(b) of the Act (as of February 28, 2013).
| | |
Title of each class | | Name of each exchange on which
registered |
Ordinary shares, no par value | | New York Stock Exchange |
| | |
6.375 % Noncumulative Trust Preferred Securities of Deutsche Bank Capital Funding Trust VIII | | New York Stock Exchange |
6.375 % Noncumulative Company Preferred Securities of Deutsche Bank Capital Funding LLC VIII* | | |
Subordinated Guarantees of Deutsche Bank AG in connection with Capital Securities* | | |
| | |
6.55 % Trust Preferred Securities of Deutsche Bank Contingent Capital Trust II | | New York Stock Exchange |
6.55 % Company Preferred Securities of Deutsche Bank Contingent Capital LLC II* | | |
Subordinated Guarantees of Deutsche Bank AG in connection with Capital Securities* | | |
| | |
6.625 % Noncumulative Trust Preferred Securities of Deutsche Bank Capital Funding Trust IX | | New York Stock Exchange |
6.625 % Noncumulative Company Preferred Securities of Deutsch Bank Capital Funding LLC IX* | | |
Subordinated Guarantees of Deutsche Bank AG in connection with Capital Securities* | | |
| | |
7.350 % Noncumulative Trust Preferred Securities of Deutsche Bank Capital Funding Trust X | | New York Stock Exchange |
7.350 % Noncumulative Company Preferred Securities of Deutsche Bank Capital Funding LLC X* | | |
Subordinated Guarantees of Deutsche Bank AG in connection with Capital Securities* | | |
| | |
7.60 % Trust Preferred Securities of Deutsche Bank Contingent Capital Trust III | | New York Stock Exchange |
7.60 % Company Preferred Securities of Deutsche Bank Contingent Capital LLC III* | | |
Subordinated Guarantees of Deutsche Bank AG in connection with Capital Securities* | | |
| | |
8.05 % Trust Preferred Securities of Deutsche Bank Contingent Capital Trust V | | New York Stock Exchange |
8.05 % Company Preferred Securities of Deutsche Bank Contingent Capital LLC V* | | |
Subordinated Guarantees of Deutsche Bank AG in connection with Capital Securities* | | |
| | |
DB Agriculture Short Exchange Traded Notes due April 1, 2038 | | NYSE Arca |
| | |
DB Agriculture Long Exchange Traded Notes due April 1, 2038 | | NYSE Arca |
| | |
DB Agriculture Double Short Exchange Traded Notes due April 1, 2038 | | NYSE Arca |
| | |
DB Agriculture Double Long Exchange Traded Notes due April 1, 2038 | | NYSE Arca |
| | |
DB Commodity Short Exchange Traded Notes due April 1, 2038 | | NYSE Arca |
| | |
DB Commodity Long Exchange Traded Notes due April 1, 2038 | | NYSE Arca |
| | |
DB Commodity Double Long Exchange Traded Notes due April 1, 2038 | | NYSE Arca |
| | |
DB Commodity Double Short Exchange Traded Notes due April 1, 2038 | | NYSE Arca |
| | |
DB Gold Double Long Exchange Traded notes due February 15, 2038 | | NYSE Arca |
| | |
DB Gold Double Short Exchange Traded notes due February 15, 2038 | | NYSE Arca |
| | |
DB Gold Short Exchange Traded notes due February 15, 2038 | | NYSE Arca |
| | |
ELEMENTS “Dogs of the Dow” Linked to the Dow Jones High Yield Select 10 Total Return Index due November 14, 2022 | | NYSE Arca |
| | |
ELEMENTS Linked to the Morningstar® Wide Moat Focus(SM) Total Return Index due October 24, 2022 | | NYSE Arca |
| | |
PowerShares DB Base Metals Short Exchange Traded Notes due June 1, 2038 | | NYSE Arca |
| | |
PowerShares DB Base Metals Long Exchange Traded Notes due June 1, 2038 | | NYSE Arca |
| | |
PowerShares DB Base Metals Double Short Exchange Traded Notes due June 1, 2038 | | NYSE Arca |
| | |
PowerShares DB Base Metals Double Long Exchange Traded Notes due June 1, 2038 | | NYSE Arca |
| | |
PowerShares DB Crude Oil Short Exchange Traded Notes due June 1, 2038 | | NYSE Arca |
| | |
PowerShares DB Crude Oil Long Exchange Traded Notes due June 1, 2038 | | NYSE Arca |
| | |
PowerShares DB Crude Oil Double Short Exchange Traded Notes due June 1, 2038 | | NYSE Arca |
| | |
PowerShares DB German Bund Futures Exchange Traded Notes due March 31, 2021 | | NYSE Arca |
| | |
PowerShares DB Italian Treasury Bond Futures Exchange Traded Notes due March 31, 2021 | | NYSE Arca |
| | |
PowerShares DB Japanese Govt Bond Futures Exchange Traded Notes due March 31, 2021 | | NYSE Arca |
| | |
PowerShares DB Inverse Japanese Govt Bond Futures Exchange Traded Notes due November 30, 2021 | | NYSE Arca |
| | |
PowerShares DB US Deflation Exchange Traded Notes due November 30, 2021 | | NYSE Arca |
| | |
PowerShares DB US Inflation Exchange Traded Notes due November 30, 2021 | | NYSE Arca |
| | |
PowerShares DB 3x German Bund Futures Exchange Traded Notes due March 31, 2021 | | NYSE Arca |
| | |
PowerShares DB 3x Italian Treasury Bond Futures Exchange Traded Notes due March 31, 2021 | | NYSE Arca |
| | |
PowerShares DB 3x Japanese Govt Bond Futures Exchange Traded Notes due March 31, 2021 | | NYSE Arca |
| | |
PowerShares DB 3x Inverse Japanese Govt Bond Futures Exchange Traded Notes due November 30, 2021 | | NYSE Arca |
| | |
PowerShares DB 3x Long US Dollar Index Futures Exchange Traded Notes due June 30, 2031 | | NYSE Arca |
| | |
PowerShares DB 3x Short US Dollar Index Futures Exchange Traded Notes due June 30, 2031 | | NYSE Arca |
| | |
PowerShares DB 3x Long 25+ Year Treasury Bond Exchange Traded Notes due May 31, 2040 | | NYSE Arca |
| | |
PowerShares DB 3x Short 25+ Year Treasury Bond Exchange Traded Notes due May 31, 2040 | | NYSE Arca |
| | |
| * | For listing purpose only, not for trading. |
| | | | |
| Deutsche Bank | | | | 1 |
| Annual Report 2012 on Form 20-F | | | | |
| | |
| | | | |
| | |
| | | | |
Table of Contents
| | | | |
| Deutsche Bank | | | | 2 |
| Annual Report 2012 on Form 20-F | | | | |
| | |
| | | | |
| | |
| | | | |
| | | | |
| Deutsche Bank | | | | 3 |
| Annual Report 2012 on Form 20-F | | | | |
| | |
| | | | |
| | |
| | | | |
Deutsche Bank Aktiengesellschaft, which we also call Deutsche Bank AG, is a stock corporation organized under the laws of the Federal Republic of Germany. Unless otherwise specified or required by the context, in this document, references to “we”, “us”, “our”, “the Group” and “Deutsche Bank Group” are to Deutsche Bank Aktiengesellschaft and its consolidated subsidiaries.
Due to rounding, numbers presented throughout this document may not add up precisely to the totals we provide and percentages may not precisely reflect the absolute figures.
Our registered address is Taunusanlage 12, 60325 Frankfurt am Main, Germany, and our telephone number is
+49-69-910-00.
Inclusion of Our Financial Report
We have included as an integral part of this Annual Report on Form 20-F our Financial Report 2012, to which we refer for the responses to certain items hereof. Certain portions of the Financial Report have been omitted, as indicated therein. The included Financial Report contains our consolidated financial statements, which we also incorporate by reference into this report, in response to Items 8.A and 18. Such consolidated financial statements differ from those contained in the Financial Report used for other purposes in that, for Notes 42 and 43 thereof, notes addressing non-U.S. requirements have been replaced with notes addressing U.S. requirements. Such consolidated financial statements have been audited by KPMG AG Wirtschaftsprüfungs gesellschaft, as described in their “Report of Independent Registered Public Accounting Firm” included on page 383 of the Financial Report, which report is included only in the version of the Financial Report included in this Annual Report on Form 20-F.
Cautionary Statement Regarding Forward-Looking Statements
We make certain forward-looking statements in this document with respect to our financial condition and results of operations. In this document, forward-looking statements include, among others, statements relating to:
| — | | the potential development and impact on us of economic and business conditions and the legal and regulatory environment to which we are subject; |
| — | | the implementation of our strategic initiatives and other responses there to; |
| — | | the development of aspects of our results of operations; |
| — | | our expectations of the impact of risks that affect our business, including the risks of losses on our trading processes and credit exposures; and |
| — | | other statements relating to our future business development and economic performance. |
In addition, we may from time to time make forward-looking statements in our periodic reports to the United States Securities and Exchange Commission on Form 6-K, annual and interim reports, invitations to Annual General Meetings and other information sent to shareholders, offering circulars and prospectuses, press releases and other written materials. Our Management Board, Supervisory Board, officers and employees may also make oral forward-looking statements to third parties, including financial analysts.
Forward-looking statements are statements that are not historical facts, including statements about our beliefs and expectations. We use words such as “believe”, “anticipate”, “expect”, “intend”, “seek”, “estimate”, “project”, “should”, “potential”, “reasonably possible”, “plan”, “aim” and similar expressions to identify forward-looking statements.
| | | | |
| Deutsche Bank | | | | 4 |
| Annual Report 2012 on Form 20-F | | | | |
| | |
| | | | |
| | |
| | | | |
By their very nature, forward-looking statements involve risks and uncertainties, both general and specific. We base these statements on our current plans, estimates, projections and expectations. You should therefore not place too much reliance on them. Our forward-looking statements speak only as of the date we make them, and we undertake no obligation to update any of them in light of new information or future events.
We caution you that a number of important factors could cause our actual results to differ materially from those we describe in any forward-looking statement. These factors include, among others, the following:
| — | | the potential development and impact on us of economic and business conditions; |
| — | | other changes in general economic and business conditions; |
| — | | changes and volatility in currency exchange rates, interest rates and asset prices; |
| — | | changes in governmental policy and regulation, including measures taken in response to economic, business, political and social conditions; |
| — | | changes in our competitive environment; |
| — | | the success of our acquisitions, divestitures, mergers and strategic alliances; |
| — | | our success in implementing our strategic initiatives and other responses to economic and business conditions and the legal and regulatory environment and realizing the benefits anticipated there from; and |
| — | | other factors, including those we refer to in “Item 3: Key Information – Risk Factors” and elsewhere in this document and others to which we do not refer. |
Use of Non-GAAP Financial Measures
This document and other documents we have published or may publish contain non-GAAP financial measures. Non-GAAP financial measures are measures of our historical or future performance, financial position or cash flows that contain adjustments that exclude or include amounts that are included or excluded, as the case may be, from the most directly comparable measure calculated and presented in accordance with IFRS in our financial statements. Examples of our non-GAAP financial measures, and the most directly comparable IFRS financial measures, are as follows:
| | |
Non-GAAP Financial Measure | | Most Directly Comparable IFRS Financial Measure |
IBIT attributable to Deutsche Bank shareholders | | Income (loss) before income taxes |
| | |
Average active equity | | Average shareholders’ equity |
| | |
Pre-tax return on average active equity | | Pre-tax return on average shareholders’ equity |
| | |
Total assets adjusted | | Total assets |
| | |
Total equity adjusted | | Total equity |
| | |
Leverage ratio (total assets adjusted to total equity adjusted) | | Leverage ratio (total assets to total equity) |
|
While our regulatory risk-weighted assets, capital and ratios thereof are set forth throughout this document under the Basel 2.5 capital rules, we also set forth in several places measures of our regulatory risk-weighted assets, capital and ratios thereof under a pro forma full application of the Basel 3 rules, based on our assumptions as to how such rules will be implemented. Because the Basel 3 rules are not yet implemented, such measures are also non-GAAP financial measures.
For descriptions of these non-GAAP financial measures and the adjustments made to the most directly comparable financial measures under IFRS (or Basel 2.5, as applicable), please refer (i) for the adjusted leverage ratio as well as the total assets adjusted and total equity adjusted figures used in its calculation, to “Management Report: Risk Report: Balance Sheet Management” on pages 183 through 184 of the Financial Report, and (ii) for the other non-GAAP financial measures described above, to pages S-16 through S-18 of the Supplemental Financial Information, which are incorporated by reference herein.
| | | | |
| Deutsche Bank | | | | 5 |
| Annual Report 2012 on Form 20-F | | | | |
| | |
| | | | |
| | |
| | | | |
When used with respect to future periods, our non-GAAP financial measures are also forward-looking statements. We cannot predict or quantify the levels of the most directly comparable financial measures under IFRS or Basel 2.5 (described above) that would correspond to these non-GAAP financial measures for future periods. This is because neither the magnitude of such IFRS or Basel 2.5 financial measures, nor the magnitude of the adjustments to be used to calculate the related non-GAAP financial measures from such IFRS or Basel 2.5 financial measures, can be predicted. Such adjustments, if any, will relate to specific, currently unknown, events and in most cases can be positive or negative, so that it is not possible to predict whether, for a future period, the non-GAAP financial measure will be greater than or less than the related IFRS or Basel 2.5 financial measure.
Use of Internet Addresses
This document contains inactive textual addresses of Internet websites operated by us and third parties. Reference to such websites is made for informational purposes only, and information found at such websites is not incorporated by reference into this document.
| | | | |
| Deutsche Bank | | Item 3: Key Information | | 6 |
| Annual Report 2012 on Form 20-F | | | | |
| | |
| PART I | | | | |
| | |
| | | | |
Item 1: Identity of Directors, Senior Management and Advisers
Not required because this document is filed as an annual report.
Item 2: Offer Statistics and Expected Timetable
Not required because this document is filed as an annual report.
Item 3: Key Information
Selected Financial Data
We have derived the data we present in the tables below from our audited consolidated financial statements for the years presented. You should read all of the data in the tables below together with the consolidated financial statements and notes included in “Item 18: Financial Statements” and the information we provide in “Item 5: Operating and Financial Review and Prospects.” Except where we have indicated otherwise, we have prepared all of the consolidated financial information in this document in accordance with International Financial Reporting Standards (“IFRS”) as issued by the International Accounting Standards Board (“IASB”) and as endorsed by the European Union (“EU”). Our corporate division and segment data comes from our management reporting systems and is not in all cases prepared in accordance with IFRS. For a discussion of the major differences between our management reporting systems and our consolidated financial statements under IFRS, see Note 05 “Business Segments and Related Information”.
| | | | |
| Deutsche Bank | | Item 3: Key Information | | 7 |
| Annual Report 2012 on Form 20-F | | | | |
| | |
| | | | |
| | |
| | | | |
Income Statement Data
| | | | | | | | | | | | | | | | | | | | | | | | |
| | 20121 | | | 2012 | | | 2011 | | | 2010 | | | 2009 | | | 2008 | |
| | | in U.S.$ m. | | | in€ m. | | | in€ m. | | | in € m. | | | in € m. | | | in€ m. | |
| | | | | | | | | | | | | | | | | | | | | | | | |
Net interest income | | | 20,967 | | | | 15,891 | | | | 17,445 | | | | 15,583 | | | | 12,459 | | | | 12,453 | |
| | | | | | | | | | | | | | | | | | | | | | | | |
Provision for credit losses | | | 2,271 | | | | 1,721 | | | | 1,839 | | | | 1,274 | | | | 2,630 | | | | 1,076 | |
| | | | | | | | | | | | | | | | | | | | | | | | |
Net interest income after provision for credit losses | | | 18,696 | | | | 14,170 | | | | 15,606 | | | | 14,309 | | | | 9,829 | | | | 11,377 | |
| | | | | | | | | | | | | | | | | | | | | | | | |
Commissions and fee income | | | 15,187 | | | | 11,510 | | | | 11,544 | | | | 10,669 | | | | 8,911 | | | | 9,741 | |
| | | | | | | | | | | | | | | | | | | | | | | | |
| Net gains (losses) on financial assets/liabilities at fair value through profit or loss | | | 7,387 | | | | 5,599 | | | | 3,058 | | | | 3,354 | | | | 7,109 | | | | (9,992) | |
| | | | | | | | | | | | | | | | | | | | | | | | |
Other noninterest income (loss) | | | 978 | | | | 741 | | | | 1,181 | | | | (1,039) | | | | (527) | | | | 1,411 | |
| | | | | | | | | | | | | | | | | | | | | | | | |
Total net revenues | | | 44,518 | | | | 33,741 | | | | 33,228 | | | | 28,567 | | | | 27,952 | | | | 13,613 | |
| | | | | | | | | | | | | | | | | | | | | | | | |
Compensation and benefits | | | 17,846 | | | | 13,526 | | | | 13,135 | | | | 12,671 | | | | 11,310 | | | | 9,606 | |
| | | | | | | | | | | | | | | | | | | | | | | | |
General and administrative expenses | | | 19,812 | | | | 15,016 | | | | 12,657 | | | | 10,133 | | | | 8,402 | | | | 8,339 | |
| | | | | | | | | | | | | | | | | | | | | | | | |
Policyholder benefits and claims | | | 547 | | | | 414 | | | | 207 | | | | 485 | | | | 542 | | | | (252) | |
| | | | | | | | | | | | | | | | | | | | | | | | |
Impairment of intangible assets | | | 2,488 | | | | 1,886 | | | | – | | | | 29 | | | | (134) | | | | 585 | |
| | | | | | | | | | | | | | | | | | | | | | | | |
Restructuring activities | | | 520 | | | | 394 | | | | – | | | | – | | | | – | | | | – | |
| | | | | | | | | | | | | | | | | | | | | | | | |
Total noninterest expenses | | | 41,213 | | | | 31,236 | | | | 25,999 | | | | 23,318 | | | | 20,120 | | | | 18,278 | |
| | | | | | | | | | | | | | | | | | | | | | | | |
Income (loss) before income taxes | | | 1,034 | | | | 784 | | | | 5,390 | | | | 3,975 | | | | 5,202 | | | | (5,741) | |
| | | | | | | | | | | | | | | | | | | | | | | | |
Income tax expense (benefit) | | | 651 | | | | 493 | | | | 1,064 | | | | 1,645 | | | | 244 | | | | (1,845) | |
| | | | | | | | | | | | | | | | | | | | | | | | |
Net income (loss) | | | 384 | | | | 291 | | | | 4,326 | | | | 2,330 | | | | 4,958 | | | | (3,896) | |
| | | | | | | | | | | | | | | | | | | | | | | | |
Net income (loss) attributable to noncontrolling interests | | | 71 | | | | 54 | | | | 194 | | | | 20 | | | | (15) | | | | (61) | |
| | | | | | | | | | | | | | | | | | | | | | | | |
Net income (loss) attributable to Deutsche Bank shareholders | | | 312 | | | | 237 | | | | 4,132 | | | | 2,310 | | | | 4,973 | | | | (3,835) | |
| | | | | | | | | | | | | | | | | | | | | | | | |
| | | | | | |
| | | in U.S.$ | | | | in€ | | | | in€ | | | | in€ | | | | in€ | | | | in€ | |
| | | | | | | | | | | | | | | | | | | | | | | | |
Basic earnings per share2,3 | | | 0.33 | | | | 0.25 | | | | 4.45 | | | | 3.07 | | | | 7.21 | | | | (6.87) | |
| | | | | | | | | | | | | | | | | | | | | | | | |
Diluted earnings per share2,4 | | | 0.33 | | | | 0.25 | | | | 4.30 | | | | 2.92 | | | | 6.94 | | | | (6.87) | |
| | | | | | | | | | | | | | | | | | | | | | | | |
Dividends paid per share5 | | | 0.99 | | | | 0.75 | | | | 0.75 | | | | 0.75 | | | | 0.50 | | | | 4.50 | |
| |
| 1 | Amounts in this column are unaudited. We have translated the amounts solely for your convenience at a rate of U.S.$ 1.3194 per€, the euro foreign exchange reference rate for U.S. dollars published by the European Central Bank (ECB) for December 31, 2012. |
| 2 | The number of average basic and diluted shares outstanding has been adjusted for all periods before October 6, 2010 to reflect the effect of the bonus element of the subscription rights issue in connection with the capital increase. |
| 3 | We calculate basic earnings per share for each period by dividing our net income (loss) attributable to Deutsche Bank shareholders by the average number of common shares outstanding. |
| 4 | We calculate diluted earnings per share for each period by dividing our net income (loss) attributable to Deutsche Bank shareholders by the average number of common shares outstanding after assumed conversions. |
| 5 | Dividends we declared and paid in the year. |
Balance Sheet Data
| | | | | | | | | | | | | | | | | | | | | | | | |
| | 20121 | | | 2012 | | | 2011 | | | 2010 | | | 2009 | | | 2008 | |
| | | in U.S. $ m. | | | in€ m. | | | in€ m. | | | in€ m. | | | in€ m. | | | in€ m. | |
| | | | | | | | | | | | | | | | | | | | | | | | |
Total assets | | | 2,655,067 | | | | 2,012,329 | | | | 2,164,103 | | | | 1,905,630 | | | | 1,500,664 | | | | 2,202,423 | |
| | | | | | | | | | | | | | | | | | | | | | | | |
Loans | | | 524,170 | | | | 397,279 | | | | 412,514 | | | | 407,729 | | | | 258,105 | | | | 269,281 | |
| | | | | | | | | | | | | | | | | | | | | | | | |
Deposits | | | 761,560 | | | | 577,202 | | | | 601,730 | | | | 533,984 | | | | 344,220 | | | | 395,553 | |
| | | | | | | | | | | | | | | | | | | | | | | | |
Long-term debt | | | 208,593 | | | | 158,097 | | | | 163,416 | | | | 169,660 | | | | 131,782 | | | | 133,856 | |
| | | | | | | | | | | | | | | | | | | | | | | | |
Common shares | | | 3,140 | | | | 2,380 | | | | 2,380 | | | | 2,380 | | | | 1,589 | | | | 1,461 | |
| | | | | | | | | | | | | | | | | | | | | | | | |
Total shareholders’ equity2 | | | 71,252 | | | | 54,003 | | | | 53,390 | | | | 48,819 | | | | 36,647 | | | | 30,703 | |
| | | | | | | | | | | | | | | | | | | | | | | | |
Tier 1 capital3 | | | 66,607 | | | | 50,483 | | | | 49,047 | | | | 42,565 | | | | 34,406 | | | | 31,094 | |
| | | | | | | | | | | | | | | | | | | | | | | | |
Regulatory capital3 | | | 75,226 | | | | 57,015 | | | | 55,226 | | | | 48,688 | | | | 37,929 | | | | 37,396 | |
| |
| 1 | Amounts in this column are unaudited. We have translated the amounts solely for your convenience at a rate of U.S.$ 1.3194 per€, the euro foreign exchange reference rate for U.S. dollars published by the European Central Bank (ECB) for December 31, 2012. |
| 2 | The initial acquisition accounting for ABN AMRO, which was finalized at March 31, 2011, resulted in a retrospective adjustment of retained earnings of€ (24) million for December 31, 2010. |
| 3 | Capital amounts for 2012 and 2011 are based on the amended capital requirements for trading book and securitization positions following the Capital Requirements Directive 3, also known as “Basel 2.5”, as implemented in the German Banking Act and the Solvency Regulation (“Solvabilitätsverordnung”). Capital amounts presented for 2010, 2009 and 2008 are pursuant to the revised capital framework presented by the Basel Committee in 2004 (“Basel 2”) as adopted into German law by the German Banking Act and the Solvency Regulation. Excludes transitional items pursuant to Section 64h (3) of the German Banking Act. |
| | | | |
| Deutsche Bank | | Item 3: Key Information | | 8 |
| Annual Report 2012 on Form 20-F | | | | |
| | |
| | | | |
| | |
| | | | |
Certain Key Ratios and Figures
| | | | | | | | | | | | | | | | | | | | |
| | 2012 | | | 2011 | | | 2010 | | | 2009 | | | 2008 | |
Share price at period-end1 | | | € 32.95 | | | | € 29.44 | | | | € 39.10 | | | | € 44.98 | | | € | 25.33 | |
| | | | | | | | | | | | | | | | | | | | |
Share price high1 | | | € 39.51 | | | | € 48.70 | | | | € 55.11 | | | | € 53.05 | | | € | 81.73 | |
| | | | | | | | | | | | | | | | | | | | |
Share price low1 | | | € 22.11 | | | | € 20.79 | | | | € 35.93 | | | | € 14.00 | | | € | 16.92 | |
| | | | | | | | | | | | | | | | | | | | |
Book value per basic share outstanding2 | | | € 57.37 | | | | € 58.11 | | | | € 52.38 | | | | € 52.65 | | | € | 47.90 | |
| | | | | | | | | | | | | | | | | | | | |
Return on average shareholders’ equity (post-tax)3 | | | 0.4 % | | | | 8.2 % | | | | 5.5 % | | | | 14.6 % | | | | (11.1) % | |
| | | | | | | | | | | | | | | | | | | | |
Pre-tax return on average shareholders’ equity4 | | | 1.3 % | | | | 10.2 % | | | | 9.5 % | | | | 15.3 % | | | | (16.5) % | |
| | | | | | | | | | | | | | | | | | | | |
Pre-tax return on average active equity5 | | | 1.3 % | | | | 10.3 % | | | | 9.6 % | | | | 15.1 % | | | | (17.7) % | |
| | | | | | | | | | | | | | | | | | | | |
Cost/income ratio6 | | | 92.6 % | | | | 78.2 % | | | | 81.6 % | | | | 72.0 % | | | | 134.3 % | |
| | | | | | | | | | | | | | | | | | | | |
Compensation ratio7 | | | 40.1 % | | | | 39.5 % | | | | 44.4 % | | | | 40.5 % | | | | 70.6 % | |
| | | | | | | | | | | | | | | | | | | | |
Noncompensation ratio8 | | | 52.5 % | | | | 38.7 % | | | | 37.3 % | | | | 31.5 % | | | | 63.7 % | |
| | | | | | | | | | | | | | | | | | | | |
Common Equity Tier 1 capital ratio9 | | | 11.4 % | | | | 9.5 % | | | | 8.7 % | | | | 8.7 % | | | | 7.0 % | |
| | | | | | | | | | | | | | | | | | | | |
Tier 1 capital ratio9 | | | 15.1 % | | | | 12.9 % | | | | 12.3 % | | | | 12.6 % | | | | 10.1 % | |
| | | | | | | | | | | | | | | | | | | | |
Employees at period-end (full-time equivalent):10 | | | | | | | | | | | | | | | | | | | | |
In Germany | | | 46,308 | | | | 47,323 | | | | 49,265 | | | | 27,321 | | | | 27,942 | |
Outside Germany | | | 51,911 | | | | 53,673 | | | | 52,797 | | | | 49,732 | | | | 52,514 | |
| | | | | | | | | | | | | | | | | | | | |
Branches at period-end: | | | | | | | | | | | | | | | | | | | | |
In Germany | | | 1,944 | | | | 2,039 | | | | 2,087 | | | | 961 | | | | 961 | |
Outside Germany | | | 1,040 | | | | 1,039 | | | | 996 | | | | 1,003 | | | | 989 | |
| |
| 1 | For comparison purposes, the share prices have been adjusted for all periods before October 6, 2010 to reflect the impact of the subscription rights issue in connection with the capital increase. |
| 2 | Shareholders’ equity divided by the number of basic shares outstanding (both at period-end). |
| 3 | Net income (loss) attributable to our shareholders as a percentage of average shareholders’ equity. |
| 4 | Income (loss) before income taxes attributable to our shareholders as a percentage of average shareholders’ equity. |
| 5 | Income (loss) before income taxes attributable to our shareholders as a percentage of average active equity. |
| 6 | Total noninterest expenses as a percentage of net interest income before provision for credit losses, plus noninterest income. |
| 7 | Compensation and benefits as a percentage of total net interest income before provision for credit losses, plus noninterest income. |
| 8 | Noncompensation noninterest expenses, which is defined as total noninterest expenses less compensation and benefits, as a percentage of total net interest income before provision for credit losses, plus noninterest income. |
| 9 | Ratios presented for 2012 and 2011 are based on the amended capital requirements for trading book and securitization positions following the Capital Requirements Directive 3, also known as “Basel 2.5”, as implemented in the German Banking Act and the Solvency Regulation. Ratios presented for 2010, 2009 and 2008 are pursuant to the revised capital framework presented by the Basel Committee in 2004 (“Basel 2”) as adopted into German law by the German Banking Act and the Solvency Regulation (“Solvabilitätsverordnung”). The capital ratios relate the respective capital to risk-weighted assets for credit, market and operational risk. Excludes transitional items pursuant to Section 64h (3) of the German Banking Act. |
| 10 | Deutsche Postbank aligned its FTE definition to that of Deutsche Bank which reduced the Group number as of December 31, 2011 by 260 (prior periods not restated). |
Dividends
The following table shows the dividend per share in euro and in U.S. dollars for the years ended December 31, 2012, 2011, 2010, 2009 and 2008. We declare our dividends at our Annual General Meeting following each year. Our dividends are based on the non-consolidated results of Deutsche Bank AG as prepared in accordance with German accounting principles. Because we declare our dividends in euro, the amount an investor actually receives in any other currency depends on the exchange rate between euro and that currency at the time the euros are converted into that currency.
Effective January 1, 2009, the German withholding tax applicable to dividends increased to 26.375 % (consisting of a 25 % withholding tax and an effective 1.375 % surcharge) compared to 21.1 % applicable for the year 2008. For individual German tax residents, the withholding tax paid after January 1, 2009 represents for private dividends, generally, the full and final income tax applicable to the dividends. Dividend recipients who are tax residents of countries that have entered into a convention for avoiding double taxation may be eligible to receive a refund from the German tax authorities of a portion of the amount withheld and in addition may be entitled to receive a tax credit for the German withholding tax not refunded in accordance with their local tax law.
| | | | |
| Deutsche Bank | | Item 3: Key Information | | 9 |
| Annual Report 2012 on Form 20-F | | | | |
| | |
| | | | |
| | |
| | | | |
U.S. residents will be entitled to receive a refund equal to 11.375 % of the dividends received after January 1, 2009 (compared to an entitlement to a refund of 6.1 % of the dividends received in the year 2008). For U.S. federal income tax purposes, the dividends we pay are not eligible for the dividends received deduction generally allowed for dividends received by U.S. corporations from other U.S. corporations.
Dividends in the table below are presented before German withholding tax.
See “Item 10: Additional Information – Taxation” for more information on the tax treatment of our dividends.
| | | | | | | | | | | | | | | | |
| | | | | | | | | Payout ratio2,3 | |
| | Dividends
per share1 | | | Dividends
per share | | | Basic earnings
per share | | | Diluted earnings
per share | |
2012 (proposed) | | | $ 0.99 | | | | € 0.75 | | | | N/M | | | | N/M | |
| | | | | | | | | | | | | | | | |
2011 | | | $ 0.97 | | | | € 0.75 | | | | 17 % | | | | 17 % | |
| | | | | | | | | | | | | | | | |
2010 | | | $ 1.00 | | | | € 0.75 | | | | 24 % | | | | 26 % | |
| | | | | | | | | | | | | | | | |
2009 | | | $ 1.08 | | | | € 0.75 | | | | 10 % | | | | 11 % | |
| | | | | | | | | | | | | | | | |
2008 | | | $ 0.70 | | | | € 0.50 | | | | N/M | | | | N/M | |
| | | | | | | | | | | | | | | | |
| 1 | For your convenience, we present dividends in U.S. dollars for each year by translating the euro amounts at the period end rate for the last business day at each year end as described below under “Exchange Rate and Currency Information”. The exchange rates for 2008 are based on the “noon buying rate” announced by the Federal Reserve Bank of New York. The Federal Reserve Bank of New York discontinued the publication of foreign exchange rates on December 31, 2008. |
| 2 | We define our payout ratio as the dividends we paid per share in respect of each year as a percentage of our basic and diluted earnings per share for that year. For 2008, the payout ratio was not calculated due to the net loss. |
| 3 | The number of average basic and diluted shares outstanding has been adjusted for all periods before October 6, 2010 to reflect the effect of the bonus element of the subscription rights issue in connection with the capital increase. |
Exchange Rate and Currency Information
Germany’s currency is the euro. For your convenience, we have translated some amounts denominated in euro appearing in this document into U.S. dollars. Unless otherwise stated, we have made these translations at U.S.$ 1.3194 per euro, the euro foreign exchange reference rate for U.S. dollars published by the European Central Bank (ECB) for December 31, 2012 (the last business day of 2012). ECB euro foreign exchange reference rates are based on a regular daily concertation procedure between central banks across Europe and worldwide, which normally takes place at 2.15 p.m. CET. You should not construe any translations as a representation that the amounts could have been exchanged at the rate used on December 31, 2012 or any other date.
The ECB euro foreign exchange reference rate for U.S. dollars for December 31, 2012 may differ from the actual rates we used in the preparation of the financial information in this document. Accordingly, U.S. dollar amounts appearing in this document may differ from the actual U.S. dollar amounts that we originally translated into euros in the preparation of our financial statements.
Fluctuations in the exchange rate between the euro and the U.S. dollar will affect the U.S. dollar equivalent of the euro price of our shares quoted on the German stock exchanges and, as a result, are likely to affect the market price of our shares on the New York Stock Exchange. These fluctuations will also affect the U.S. dollar value of cash dividends we may pay on our shares in euros. Past fluctuations in foreign exchange rates may not be predictive of future fluctuations.
| | | | |
| Deutsche Bank | | Item 3: Key Information | | 10 |
| Annual Report 2011 on Form 20-F | | | | |
| | |
| | | | |
| | |
| | | | |
Euro foreign exchange reference rates for U.S. dollars as published by the ECB (unless indicated otherwise)
| | | | | | | | | | | | | | | | |
in U.S.$ per€ | | Period-end1 | | | Average2 | | | High | | | Low | |
2013 | | | | | | | | | | | | | | | | |
March (through March 28) | | | 1.2805 | | | | – | | | | 1.3090 | | | | 1.2768 | |
February | | | 1.3129 | | | | – | | | | 1.3644 | | | | 1.3077 | |
January | | | 1.3550 | | | | – | | | | 1.3550 | | | | 1.3012 | |
| | | | | | | | | | | | | | | | |
2012 | | | | | | | | | | | | | | | | |
December | | | 1.3194 | | | | – | | | | 1.3302 | | | | 1.2905 | |
November | | | 1.2986 | | | | – | | | | 1.2994 | | | | 1.2694 | |
October | | | 1.2993 | | | | – | | | | 1.3120 | | | | 1.2877 | |
September | | | 1.2930 | | | | – | | | | 1.3095 | | | | 1.2568 | |
| | | | | | | | | | | | | | | | |
2012 | | | 1.3194 | | | | 1.2932 | | | | 1.3454 | | | | 1.2089 | |
| | | | | | | | | | | | | | | | |
2011 | | | 1.2939 | | | | 1.4000 | | | | 1.4882 | | | | 1.2889 | |
| | | | | | | | | | | | | | | | |
2010 | | | 1.3362 | | | | 1.3207 | | | | 1.4563 | | | | 1.1942 | |
| | | | | | | | | | | | | | | | |
2009 | | | 1.4406 | | | | 1.3963 | | | | 1.5120 | | | | 1.2555 | |
| | | | | | | | | | | | | | | | |
20083 | | | 1.3919 | | | | 1.4695 | | | | 1.6010 | | | | 1.2446 | |
| | | | | | | | | | | | | | | | |
| 1 | Period-end rate is the rate announced for the last business day of the period. |
| 2 | We calculated the average rates for each year using the average of exchange rates on the last business day of each month during the year. We did not calculate average exchange rates within months. |
| 3 | The exchange rates for 2008 are based on the “noon buying rate” announced by the Federal Reserve Bank of New York. The Federal Reserve Bank of New York discontinued the publication of foreign exchange rates on December 31, 2008. |
Capitalization and Indebtedness
Consolidated capitalization in accordance with IFRS as of December 31, 2012
| | | | |
| | in€ m. | |
Debt:1,2 | | | | |
| | | | |
Long-term debt | | | 158,097 | |
| | | | |
Trust preferred securities | | | 12,091 | |
| | | | |
Long-term debt at fair value through profit or loss | | | 12,193 | |
| | | | |
Total debt | | | 182,381 | |
| | | | |
| | | | |
| | | | |
Shareholders’ equity: | | | | |
| | | | |
Common shares (no par value) | | | 2,380 | |
| | | | |
Additional paid-in capital | | | 23,778 | |
| | | | |
Retained earnings | | | 29,198 | |
| | | | |
Common shares in treasury, at cost | | | (60) | |
| | | | |
Accumulated other comprehensive income, net of tax | | | | |
| | | | |
Unrealized net gains (losses) on financial assets available for sale, net of applicable tax and other | | | 465 | |
Unrealized net gains (losses) on derivatives hedging variability of cash flows, net of tax | | | (159) | |
Unrealized net gains (losses) on assets classified as held for sale, net of tax | | | – | |
Foreign currency translation, net of tax | | | (1,589) | |
Unrealized net gains (losses) from equity method investments | | | (10) | |
| | | | |
Total shareholders’ equity | | | 54,003 | |
| | | | |
Noncontrolling interests | | | 407 | |
| | | | |
Total equity | | | 54,410 | |
| | | | |
Total capitalization | | | 236,791 | |
| | | | |
| 1 | € 1,535 million (1 %) of our debt was guaranteed as of December 31, 2012. This consists of debt of a subsidiary of Deutsche Postbank AG which is guaranteed by the German government. |
| 2 | € 56,214 million (31 %) of our debt was secured as of December 31, 2012. |
Reasons for the Offer and Use of Proceeds
Not required because this document is filed as an annual report.
| | | | |
| Deutsche Bank | | Item 3: Key Information | | 11 |
| Annual Report 2012 on Form 20-F | | | | |
| | |
| | | | |
| | |
| | | | |
Risk Factors
An investment in our securities involves a number of risks. You should carefully consider the following information about the risks we face, together with other information in this document, when you make investment decisions involving our securities. If one or more of these risks were to materialize, it could have a material adverse effect on our financial condition, results of operations, cash flows or prices of our securities.
As a global investment bank with a large private client franchise, our businesses are materially affected by global macroeconomic and financial market conditions. Over the last several years, banks, including us, have experienced nearly continuous stress on their business models and prospects. A widespread loss of investor confidence, both in our industry and in the broader markets, has put significant pressure on the financial sector and our businesses.
While slow economic growth largely continued in 2011 and 2012 in our key North American and Asian markets, the eurozone has fallen back into recession for the second time since 2009, and even our home market Germany is likely to have contracted in the last quarter 2012. Continued concerns about the European sovereign debt crisis have persisted through 2012, fuelled by increasing public debt loads, economic contraction or weak growth and surging unemployment rates in several European countries. The continued high degree of uncertainty in Europe has been further exacerbated by headwinds in the global economy, with declining rates of growth in emerging economies including China, and a recovery in the United States that has remained tepid at best. The negative sentiment has particularly affected banks, such as us, given their sensitivity to macroeconomic conditions. In addition, the economic outlook remains uncertain and many European banks are finding themselves positioned between the threat posed by the European sovereign debt crisis and uncertain or reduced revenue streams, on the one hand, and new and more rigorous regulatory capital requirements and proposals for further regulatory tightening, coupled with market expectations that they phase in the new capital requirements quickly, on the other hand. In response, some banks have tightened the availability of credit in the real economy, placing further pressure on the prospects for early economic recovery.
These conditions have adversely impacted many of our businesses, even as we have been recalibrating our business model in response to the effects of the global financial crisis that began in 2008 and the ongoing European sovereign debt crisis. In particular, during 2008 and 2009, we wrote down the carrying values of some of our portfolios of assets, including leveraged loans and loan commitments, and more recently we wrote down the carrying value of our Greek sovereign debt portfolio. Despite initiatives to reduce our exposure to affected asset classes or activities, reductions of exposures have not always been possible due to illiquid trading markets for many assets. As a result, we have substantial remaining exposures in some asset classes and thus continue to be exposed to any future deterioration in prices for the remaining positions. In addition, levels of activity in a number of our businesses that are dependent on robust levels of client activity, such as our credit and equity trading businesses and our asset management business, have seen lower levels of customer-driven transaction flow, leading to lower revenues. If uncertainty about the macroeconomic environment persists or worsens, this trend may also be difficult for us to counter. More generally, if economic conditions in the eurozone fail to improve, or continue to worsen, or if economic growth stagnates elsewhere, our results of operations may be materially and adversely affected. In particular, we may in the future be unable to offset the potential negative effects on our profitability of the current macroeconomic and market conditions through performance in our other businesses.
We have been and may continue to be directly affected by the ongoing European sovereign debt crisis, and we may be required to take impairments on our exposures to the sovereign debt of European or other countries. The credit default swaps into which we have entered to manage sovereign credit risk may not be available to offset these losses.
Starting in late 2009, the sovereign debt markets of the eurozone began to undergo substantial stress as the markets began to perceive the credit risk of a number of countries as having increased. Despite a number of measures taken by European governments and regulators to stem the negative effects of the crisis, in particular the loosening of central bank funding and participation in the restructuring of Greece’s sovereign indebtedness,
| | | | |
| Deutsche Bank | | Item 3: Key Information | | 12 |
| Annual Report 2012 on Form 20-F | | | | |
| | |
| | | | |
| | |
| | | | |
the uncertainty surrounding the sovereign debt crisis and European Union efforts to resolve the crisis have continued largely unabated. During 2012, concern increased that financial contagion would spread to the core of the eurozone, as investors demanded increasingly high returns for the sovereign debt of Italy and Spain.
The effects of the sovereign debt crisis have been especially evident in the financial sector, as a large portion of the sovereign debt of eurozone countries is held by European financial institutions, including us. As of December 31, 2012, we had a direct sovereign credit risk exposure of€ 847 million to Italy,€ 1.5 billion to Spain,€ 355 million to Ireland,€ 258 million to Portugal and€ 39 million to Greece. In February 2012 the Greek government invited private sector holders of bonds issued or guaranteed by the Greek government to participate in a debt exchange offer and consent solicitations. As a consequence of the exchange, we and other financial institutions recognized further impairments in March 2012 in addition to prior impairments voluntarily agreed in 2011. However, it remains uncertain whether Greece will be able to manage its reduced debt levels after these efforts. In addition, concerns over the ability of other eurozone sovereigns, especially Spain, Italy and Cyprus, to manage their debt levels have intensified, and similar negotiations or exchanges could take place with respect to the sovereign debt of these or other affected countries. The outcome of any negotiations regarding changed terms (including reduced principal amounts or extended maturities) of sovereign debt may result in additional impairments of assets on our balance sheet. Any negotiations are highly likely to be subject to political and economic pressures that we cannot control, and we are unable to predict their effects on the financial markets, on the greater economy or on ourselves.
In addition, any restructuring of outstanding sovereign debt may result in potential losses for us and other market participants that are not covered by payouts on hedging instruments that we have entered into to protect against the risk of default. These instruments largely consist of credit default swaps, generally referred to as CDSs, pursuant to which one party agrees to make a payment to another party if a credit event (such as a default) occurs on the identified underlying debt obligation. A sovereign restructuring that avoids a credit event through voluntary write-downs of value may not trigger the provisions in CDSs we have entered into, meaning that our exposures in the event of a write-down could exceed the exposures we previously viewed as our net exposure after hedging. Additionally, even if the CDS provisions are triggered, the amounts ultimately paid under the CDSs may not correspond to the full amount of any loss we incur. We also face the risk that our hedging counterparties have not effectively hedged their own exposures and may be unable to provide the necessary liquidity if payments under the instruments they have written are triggered. This may result in systemic risk for the European banking sector as a whole and may negatively affect our business and financial position.
Regulatory and political actions by European governments in response to the sovereign debt crisis may not be sufficient to prevent the crisis from spreading or to prevent departure of one or more member countries from the common currency. The default or departure of any one or more countries from the euro could have unpredictable consequences on the financial system and the greater economy, potentially leading to declines in business levels, write-downs of assets and losses across our businesses. Our ability to protect ourselves against these risks is limited.
The deterioration of the sovereign debt market in the eurozone and Eastern Europe, particularly the increasing costs of borrowing affecting many eurozone states during the course of 2012 and downgrades in the credit ratings of most eurozone countries in 2011 and 2012, indicate that the sovereign debt crisis can affect even the financially more stable countries in the eurozone, including Germany. Substantial doubt remains whether actions taken by European policymakers will be sufficient to contain the crisis over the longer term. In particular, there are doubts about the effectiveness of the European Stability Mechanism, generally referred to as the ESM, the special purpose vehicle created by the European Union to combat the sovereign debt crisis. In addition, the austerity programs introduced by a number of countries across the eurozone in response to the sovereign debt crisis appear to be dampening economic growth, and may continue to do so over the medium and longer terms. As the eurozone has fallen back into recession, questions about the long-term growth prospects
| | | | |
| Deutsche Bank | | Item 3: Key Information | | 13 |
| Annual Report 2012 on Form 20-F | | | | |
| | |
| | | | |
| | |
| | | | |
of the eurozone countries could exacerbate their difficulties in refinancing their sovereign debt as it comes due, further increasing pressure on other eurozone governments.
In addition, the possibility exists that one or more members of the eurozone may default on their debt obligations or leave the common currency, resulting in the reintroduction of one or more national currencies. Should a eurozone country conclude it must exit the common currency, the resulting need to reintroduce a national currency and restate existing contractual obligations could have unpredictable financial, legal, political and social consequences, leading not only to significant losses on sovereign debt but also on private debt in that country. Given the highly interconnected nature of the financial system within the eurozone, and the high levels of exposure we have to public and private counterparties around Europe, our ability to plan for such a contingency in a manner that would reduce our exposure to non-material levels is likely to be limited. If the overall economic climate deteriorates as a result of one or more departures from the eurozone, our business could be adversely affected, and, if overall business levels decline or we are forced to write down significant exposures among our various businesses, we could incur substantial losses.
We have a continuous demand for liquidity to fund our business activities, and our ability to access the capital markets for liquidity and to fund assets in the current market environment may be limited. In addition, we may suffer during periods of market-wide or firm-specific liquidity constraints, and liquidity may not be available to us even if our underlying business remains strong.
We are exposed to liquidity risk, which is the risk arising from our potential inability to meet all payment obligations when they become due or only being able to meet them at excessive cost. Our liquidity may become impaired due to a reluctance of our counterparties or the market to finance our operations due to actual or perceived weaknesses in our businesses. Such impairments can also arise from circumstances unrelated to our businesses and outside our control, such as, but not limited to, disruptions in the financial markets. As a result of the ongoing European sovereign debt crisis, we have, in recent periods, experienced declines in the price of our shares and increases in the premium investors must pay when purchasing CDSs on our debt. In addition, negative developments concerning other financial institutions perceived to be comparable to us and negative views about the financial services industry in general have also recently affected us. These perceptions have affected the prices at which we have accessed the capital markets to obtain the necessary funding to support our business activities; should these perceptions worsen, our ability to obtain this financing on acceptable terms may be adversely affected. Among other things, an inability to refinance assets on our balance sheet or maintain appropriate levels of capital to protect against deteriorations in their value could force us to liquidate assets we hold at depressed prices or on unfavorable terms, and could also force us to curtail business, such as the extension of new credit. This could have an adverse effect on our business, financial condition and results of operations.
As a result of funding pressures arising from the European sovereign debt crisis, there has been increased intervention by a number of central banks, in particular the European Central Bank, generally referred to as the ECB, and the U.S. Federal Reserve. In September 2012, the ECB announced a new unlimited sovereign bond buying program aimed at keeping the borrowing costs of affected eurozone countries low through the purchase of their debt instruments. In addition, the ECB agreed in December 2011 and February 2012 to provide low-interest secured loans to European financial institutions for up to three years. The U.S. Federal Reserve has expanded its provision of U.S. dollar liquidity to the ECB, which the ECB has then made available to European banks. To date a number of financial institutions have drawn on these funding sources to maintain or enhance their liquidity. To the extent these incremental measures are curtailed or halted, this could adversely impact funding markets for all European institutions, including us, leading to an increase in funding costs, or reduced funding supply, which could result in a reduction in business activity. In addition, negative perceptions concerning our business and prospects could develop as a result of large losses, changes of our credit ratings, a general decline in the level of business activity in the financial services sector, regulatory action, serious employee misconduct or illegal activity, as well as many other reasons outside our control and that we cannot foresee.
| | | | |
| Deutsche Bank | | Item 3: Key Information | | 14 |
| Annual Report 2012 on Form 20-F | | | | |
| | |
| | | | |
| | |
| | | | |
Since the start of the global financial crisis the major credit rating agencies have lowered our credit ratings or placed them on review or watch on multiple occasions. This trend has continued during the ongoing European sovereign debt crisis. On November 29, 2011, Standard & Poor’s, while affirming our long-term credit rating at A+, revised our outlook to “negative”, on December 15, 2011, Fitch Ratings announced that it was downgrading our long-term issuer default rating to A+ from AA-, and on June 21, 2012, Moody’s Investor Services announced it was downgrading our long-term senior debt rating from A2 to Aa3. Most recently, on March 26, 2013, Standard & Poor’s placed our long-term credit rating on credit watch with negative implications. Recent credit rating downgrades have not materially affected our borrowing costs. However, any future downgrade could materially affect our funding costs, although we are unable to predict whether this would be the case or the extent of any such effect. The effect would depend on a number of factors including whether a downgrade affects financial institutions across the industry or on a regional basis, or is intended to reflect circumstances specific to us; any actions our senior management may take in advance of or in response to the downgrade; the willingness of counterparties to continue to do business with us; any impact of other market events and the state of the macroeconomic environment more generally.
Additionally, under many of the contracts governing derivative instruments to which we are a party, a downgrade could require us to post additional collateral, lead to terminations of contracts with accompanying payment obligations for us or give counterparties additional remedies. We take these effects into account in our liquidity stress testing analysis, as further described in “Management Report: Risk Report: Liquidity Risk: Stress Testing and Scenario Analysis” on pages 164 through 165 of the Financial Report.
Regulatory reforms enacted and proposed in response to the persistent weaknesses in the financial sector, together with increased regulatory scrutiny more generally, will require us to maintain increased capital and may significantly affect our business model and the competitive environment. Any perceptions in the market that we may be unable to meet our capital requirements with an adequate buffer, or that we should maintain capital in excess of the requirements, could intensify the effect of these factors on our business and results.
In response to the global financial crisis and the European sovereign debt crisis, governments, regulatory authorities and others have made and continue to make proposals to reform the regulatory framework for the financial services industry to enhance its resilience against future crises. Legislation has already been enacted and regulations issued in response to some of these proposals. The regulatory framework for financial institutions is likely to undergo further significant change. This creates significant uncertainty for us and the financial industry in general. The wide range of recent actions or current proposals includes, among others, provisions for more stringent regulatory capital and liquidity standards, restrictions on compensation practices, charging special levies to fund governmental intervention in response to crises, expansion of the resolution powers of regulators, separation of certain businesses from deposit taking, breaking up financial institutions that are perceived to be too large for regulators to assume the risk of their failure, and reforming derivatives and other market infrastructures. In addition, regulatory scrutiny under existing laws and regulations has become more intense. The specific effects of a number of new laws and regulations remain uncertain because the drafting and implementation of these laws and regulations are still on-going. In December 2010, the Basel Committee on Banking Supervision published a set of comprehensive changes to the capital adequacy framework, known as Basel 3, which will be implemented into European Union law by a legislative package referred to as “CRD 4”. Following political agreement on CRD 4, the Council of the European Union published a revised draft of the legislative package on March 26, 2013. CRD 4 will contain, among others, detailed rules on regulatory banking capital, increased capital requirements and the introduction of additional capital buffers, tightened liquidity standards and the introduction of a non-risk based leverage ratio. CRD 4 will also provide for executive compensation reforms which could put us at a disadvantage to our competitors in attracting and retaining talented employees, especially compared to those outside the European Union. Most of the new rules are expected to apply from January 1, 2014, with capital requirements and buffers increasing from year to year.
| | | | |
| Deutsche Bank | | Item 3: Key Information | | 15 |
| Annual Report 2012 on Form 20-F | | | | |
| | |
| | | | |
| | |
| | | | |
We may not have sufficient capital to meet increasing regulatory requirements. This could occur due to regulatory and other changes, such as the gradual phase out of our hybrid capital instruments, and due to any substantial losses we were to incur, which would reduce our retained earnings, a component of Core Tier 1 capital (which will be replaced by Common Equity Tier 1 capital when the CRD 4 proposals become law), or due to a combination of these factors. If we are unable to increase our capital ratios to the regulatory minimum in any such case, by raising new capital through the capital markets, through the reduction of risk-weighted assets or through other means, we could be forced to accept capital injections from the German government or the European Union. These capital injections could lead to significant dilution of our shareholders, and regulators may impose additional operational and other limitations or obligations on our business as conditions to public funding. If we are unable to build up capital buffers as required by Basel 3 and CRD 4, we may become subject to restrictions on the pay-out of dividends, share buybacks and discretionary compensation payments. In addition, any requirement to increase capital ratios could lead us to adopt a strategy focusing on capital preservation and creation over revenue generation and profit growth, in particular involving the reduction in higher margin risk-weighted assets.
Any increased capital requirements, including those described above, could have adverse effects on our business, financial condition and results of operations, as well as on perceptions in the market of our stability, particularly if any such proposal becomes effective and results in our having to raise capital at a time when financial markets are distressed. If these regulatory requirements must be implemented very quickly, we may decide that the quickest and most reliable path to compliance is to reduce the level of assets on our balance sheet, dispose of divisions or separate out certain activities or reduce or close down certain business lines. The effects on our capital raising efforts in such a case could be amplified due to the expectation that our competitors, at least those subject to the same or similar capital requirements, would likely also be required to raise capital at the same time. Moreover, some of our competitors, particularly those outside the European Union, may not face the same or similar regulations, which could put us at a competitive disadvantage.
In addition to these regulatory initiatives, market sentiment may encourage financial institutions such as us to maintain even more capital beyond regulatory-mandated minima, which could exacerbate the effects on us described above or, if we do not increase our capital to the encouraged levels, could lead to the perception in the market that we are undercapitalized relative to our peers generally.
On February 6, 2013, the German government published a Draft Bill on the Separation of Risks and Recovery and Resolution Planning for Credit Institutions and Banking Groups (the “Draft Bill”). The Draft Bill contains, among other provisions, rules on the preparation of recovery and resolutions plans for banks, such as us, which are deemed systemically important to the German economy. The Draft Bill also grants additional powers to the German Federal Financial Supervisory Authority (Bundesanstalt für Finanzdienstleistungsaufsicht, “BaFin”) to eliminate impediments to a bank’s resolution, which could affect our business activities or our legal or operational structure. The Draft Bill preempts in part the implementation into German law of the European directive establishing a framework for the recovery and resolution of credit institutions and investment firms (“RRD”), a draft of which was published by the European Commission on June 6, 2012. The RRD, in addition to the rules and requirements set forth in the Draft Bill, provides for the power of the resolution authority to write down debt, or to convert debt into equity (so-called “bail-in”). In order to facilitate such bail-in powers, which are expected to become effective from January 1, 2018 onwards, banks may be required to include in their debt instruments conditions that recognize the powers to write down or convert debt. The bail-in powers and such conditions could result in increased refinancing costs. Furthermore, we may not be able to issue debt instruments subject to bail-in in sufficient amounts to meet regulatory requirements, for example because there is no liquid market for such debt instruments. This could adversely affect our business, financial condition and results of operations.
In the United States, the Dodd-Frank Wall Street Reform and Consumer Protection Act, or the Dodd-Frank Act, enacted in July 2010, has numerous provisions that may affect our operations. Under the Dodd-Frank Act, we and certain of our affiliates and subsidiaries registered as swap dealers and became subject to extensive oversight by the U.S. Commodity Futures Trading Commission. Regulation of swap dealers by the U.S. Commodity
| | | | |
| Deutsche Bank | | Item 3: Key Information | | 16 |
| Annual Report 2012 on Form 20-F | | | | |
| | |
| | | | |
| | |
| | | | |
Futures Trading Commission will impose numerous corporate governance, business conduct, capital, margin, reporting, clearing, execution and other regulatory requirements on us, which may adversely affect our derivatives business and make us less competitive, especially as compared to competitors not subject to such regulation. However, although many significant regulations applicable to swap dealers are already in effect, we are unable at this time to determine the full impact of these requirements because some of the most important rules, such as margin requirements, have not yet been implemented.
Proposals in the United States designed to prohibit proprietary trading (Volcker Rule) and in the European Union and Germany, targeting structural separation of trading from deposit taking activities (based upon the Liikanen group recommendations), could have significant implications for future bank strategy. In Germany, these proposals form part of the Draft Bill. While none of the proposals are settled yet, and the ultimately agreed rules may have limited implications for market-making activity, each of the proposals has the potential to disrupt markets and materially increase operational costs. If the proposals in the Draft Bill were implemented as drafted, we would be required to separate our proprietary trading (as defined in the rulemaking, which could include trading we view as customer related) and certain other activities associated with higher risks from our deposit-taking business. Such separation could result in higher operational financing costs for the separated activities that could adversely affect our business, financial condition and results of operations.
Regulatory authorities also have substantial discretion in how to regulate banks, and this discretion, and the means available to the regulators, have been steadily increasing during the recent years of crisis. Regulation may be imposed on an ad hoc basis by governments and regulators in response to the ongoing or future crises, and these may especially affect financial institutions such as us that are deemed to be systemically important. For example, future stress tests or exceptional and temporary capital ratios, such as the one mandated by the European Council in October 2011, may be imposed very quickly. In addition, the regulators having jurisdiction over us have discretion to impose capital deductions on financial institutions for operational risks that are not otherwise recognized in risk-weighted assets or other surcharges depending on the individual situation of the bank. Furthermore, any prospective changes in accounting standards, such as those imposing stricter or more extensive requirements to carry assets at fair value, could also have uncertain impacts on our capital needs.
In December 2012, the U.S. Federal Reserve proposed a rule that would impose enhanced prudential standards on our U.S. operations and would require us to organize all of our U.S. bank and nonbank subsidiaries under a U.S. intermediate holding company that would be subject to U.S. capital requirements and enhanced prudential standards applicable to top-tier U.S. bank holding companies of its size. Such proposed rule, which is open for public comment until April 30, 2013, would become effective in July 2015. This rule, if adopted in its current form, could require us to reduce assets held in the U.S., inject capital or otherwise change the structure of our U.S. operations. To the extent that we are required to reduce operations in the U.S. or deploy capital in the U.S. that could be deployed more profitably elsewhere, the rule could have an adverse effect on our business, financial condition and results of operations.
In addition, bank levies have been introduced in some countries including Germany and the United Kingdom and are still under discussion in a number of other countries. We accrued€ 247 million for the German and U.K. bank levies in 2011 and€ 222 million in 2012, primarily recognized in Consolidation & Adjustments. Furthermore, the European Union contemplates the introduction of a bank-funded European resolution fund, which will likely replace national resolution funds such as the German restructuring fund. The impact of future levies cannot currently be quantified and they may have a material adverse effect on our business, results of operations and financial condition in future periods.
Separately, on January 22, 2013, the Council of the European Union adopted a decision authorizing eleven member states (Austria, Belgium, Estonia, France, Germany, Greece, Italy, Portugal, Slovakia, Slovenia and Spain) to proceed with the introduction of a financial transaction tax under the European Union’s “enhanced cooperation procedure”. The European Commission adopted a draft directive for the implementation of the financial transaction tax on February 14, 2013. Since the directive is only in draft form, the scope of the proposed tax is still uncertain. Depending on the final details, the proposed financial transaction tax could have a
| | | | |
| Deutsche Bank | | Item 3: Key Information | | 17 |
| Annual Report 2012 on Form 20-F | | | | |
| | |
| | | | |
| | |
| | | | |
materially negative effect on our profits and business. National financial transaction taxes have already been proposed or implemented in a number of European jurisdictions, including France (starting in August 2012) and Italy (starting from March/July 2013). Though these national regimes include intermediary exemptions, there will be implementation costs as well as market consequences which may affect our revenues.
Adverse market conditions, historically low prices and volatility have affected and may in the future materially and adversely affect our revenues and profits, particularly in our investment banking, brokerage and other commission- and fee-based businesses. As a result, we have incurred and may in the future incur significant losses from our trading and investment activities.
As a global investment bank, we have significant exposure to the financial markets and are more at risk from adverse developments in the financial markets than are institutions engaged predominantly in traditional banking activities. Sustained market declines have caused and can in the future cause our revenues to decline, and, if we are unable to reduce our expenses at the same pace, can cause our profitability to erode or cause us to show material losses. Volatility can also adversely affect us, by causing the value of financial assets we hold to decline or the expense of hedging our risks to rise.
Specifically, our investment banking revenues, in the form of financial advisory and underwriting fees, directly relate to the number and size of the transactions in which we participate and are susceptible to adverse effects from sustained market downturns. These fees and other income are generally linked to the value of the underlying transactions and therefore can decline with asset values, as they have during the recent downturn. In addition, periods of market decline and uncertainty, such as that currently being experienced in light of the ongoing European sovereign debt crisis, tend to dampen client appetite for market and credit risk, a critical driver of transaction volumes and investment banking revenues, especially transactions with higher margins. In the recent past, decreased client appetite for risk has led to lower results in our Corporate Banking & Securities Corporate Division. Our revenues and profitability could sustain material adverse effects from a significant reduction in the number or size of debt and equity offerings and merger and acquisition transactions.
Market downturns also have led and may in the future lead to declines in the volume of transactions that we execute for our clients and, therefore, to declines in our noninterest income. In addition, because the fees that we charge for managing our clients’ portfolios are in many cases based on the value or performance of those portfolios, a market downturn that reduces the value of our clients’ portfolios or increases the amount of withdrawals reduces the revenues we receive from our asset management and private banking businesses. Even in the absence of a market downturn, below-market or negative performance by our investment funds may result in increased withdrawals and reduced inflows, which would reduce the revenue we receive from our asset management business. While our clients would be responsible for losses we incur in taking positions for their accounts, we may be exposed to additional credit risk as a result of their need to cover the losses where we do not hold adequate collateral or cannot realize it. Our business may also suffer if our clients lose money and we lose the confidence of clients in our products and services.
In addition, the revenues and profits we derive from many of our trading and investment positions and our transactions in connection with them can be directly and negatively impacted by market prices, which have been volatile in recent years. In each of the product and business lines in which we enter into these trading and investment positions, part of our business entails making assessments about the financial markets and trends in them. When we own assets, market price declines can expose us to losses. Many of the more sophisticated transactions of our Corporate Banking & Securities Corporate Division are designed to profit from price movements and differences among prices. If prices move in a way we have not anticipated, we may experience losses. Also, when markets are volatile, the assessments we have made may prove to lead to lower revenues or profits, or may lead to losses, on the related transactions and positions. In addition, we commit capital and take market risk to facilitate certain capital markets transactions; doing so can result in losses as well as income volatility. Such losses may especially occur on assets we hold for which there are not very liquid markets initially. Assets that are not traded on stock exchanges or other public trading markets, such as derivatives contracts between banks, may have values that we calculate using models other than publicly-quoted prices.
| | | | |
| Deutsche Bank | | Item 3: Key Information | | 18 |
| Annual Report 2012 on Form 20-F | | | | |
| | |
| | | | |
| | |
| | | | |
Monitoring the deterioration of prices of assets like these is difficult and could lead to losses we did not anticipate.
In order to address concerns about recent market and regulatory developments in addition to greatly increased costs of risk, we have recently announced our Strategy 2015+. If we are unable to implement our new strategy successfully, we may be unable to achieve our financial objectives, or incur losses or low profitability, and our share price may be materially and adversely affected.
In mid-2012, we conducted a strategic review of our business focused on adapting it to the current difficult economic and regulatory environment. As a result of this review, in September 2012, we published our strategic and financial aspirations for 2015 in our Strategy 2015+. As part of this, we announced financial objectives for the Group and our operating businesses for 2015, which were based on a number of key assumptions regarding economic, business and regulatory conditions. To support these aspirations, we launched a number of strategic initiatives, including the creation of an integrated Asset & Wealth Management division that includes former Corporate Banking & Securities businesses such as exchange-traded funds (ETFs), the launch of an Operational Excellence Program aimed at achieving major reductions in costs, duplication and complexity in the years ahead, and the creation of a Non-Core Operations Unit, the purpose of which is to accelerate de-risking through coordinating activities across Deutsche Bank to dispose of non-core assets.
If we fail to implement our strategic initiatives in whole or in part or should the initiatives that are implemented fail to produce the anticipated benefits, or should the costs we incur to implement our initiatives exceed the€ 4.0 billion we have anticipated, we may fail to achieve our financial objectives, or incur losses or low profitability, and our share price may be materially and adversely affected. A number of internal and external factors could prevent the implementation of these initiatives or the realization of their anticipated benefits, including the continuation of the European sovereign debt crisis, the recurrence of extreme turbulence in the markets in which we are active, weakness of global, regional and national economic conditions, regulatory changes that increase our costs or restrict our activities and increased competition for business.
Our non-traditional credit businesses materially add to our traditional banking credit risks.
As a bank and provider of financial services, we are exposed to the risk that third parties that owe us money, securities or other assets will not perform their obligations. Many of the businesses we engage in beyond the traditional banking businesses of deposit-taking and lending also expose us to credit risk.
In particular, much of the business we conduct through our Corporate Banking & Securities Corporate Division entails credit transactions, frequently ancillary to other transactions. Nontraditional sources of credit risk can arise, for example, from holding securities of third parties; entering into swap or other derivative contracts under which counterparties have obligations to make payments to us; executing securities, futures, currency or commodity trades that fail to settle at the required time due to nondelivery by the counterparty or systems failure by clearing agents, exchanges, clearing houses or other financial intermediaries; and extending credit through other arrangements. Parties to these transactions, such as trading counterparties, may default on their obligations to us due to bankruptcy, political and economic events, lack of liquidity, operational failure or other reasons.
Many of our derivative transactions are individually negotiated and non-standardized, which can make exiting, transferring or settling the position difficult. Certain credit derivatives require that we deliver to the counterparty the underlying security, loan or other obligation in order to receive payment. In a number of cases, we do not hold, and may not be able to obtain, the underlying security, loan or other obligation. This could cause us to forfeit the payments otherwise due to us or result in settlement delays, which could damage our reputation and ability to transact future business, as well as increased costs to us. Recently enacted legislation in the European Union (EMIR) and the U.S. (the Dodd-Frank Act) will introduce requirements for the standardization, margining, central clearing and transaction reporting of certain over-the-counter derivatives. While such requirements are aimed at reducing the risk posed to counterparties and the financial system by such derivatives,
| | | | |
| Deutsche Bank | | Item 3: Key Information | | 19 |
| Annual Report 2012 on Form 20-F | | | | |
| | |
| | | | |
| | |
| | | | |
they may reduce the volume and profitability of the transactions in which we engage, and compliance with such provisions may impose substantial costs on us.
The exceptionally difficult market conditions experienced during the recent global financial crisis have severely adversely affected certain areas in which we do business that entail nontraditional credit risks, including the leveraged finance and structured credit markets, and may do so in the future.
We have incurred losses, and may incur further losses, as a result of changes in the fair value of our financial instruments.
A substantial proportion of the assets and liabilities on our balance sheet comprise financial instruments that we carry at fair value, with changes in fair value recognized in the income statement. Fair value is defined as the price at which an asset or liability could be exchanged in a current transaction between knowledgeable, willing parties, other than in a forced or liquidation sale. If the value of an asset carried at fair value declines (or the value of a liability carried at fair value increases) a corresponding unfavorable change in fair value is recognized in the income statement. These changes have been and could in the future be significant. Additionally, in recent periods there has been a significant difference between fair value and book value for some assets.
Observable prices or inputs are not available for certain classes of financial instruments. Fair value is determined in these cases using valuation techniques we believe to be appropriate for the particular instrument. The application of valuation techniques to determine fair value involves estimation and management judgment, the extent of which will vary with the degree of complexity of the instrument and liquidity in the market. Management judgment is required in the selection and application of the appropriate parameters, assumptions and modeling techniques. If any of the assumptions change due to negative market conditions or for other reasons, subsequent valuations may result in significant changes in the fair values of our financial instruments, requiring us to record losses.
Our exposure and related changes in fair value are reported net of any fair value gains we may record in connection with hedging transactions related to the underlying assets. However, we may never realize these gains, and the fair value of the hedges may change in future periods for a number of reasons, including as a result of deterioration in the credit of our hedging counterparties. Such declines may be independent of the fair values of the underlying hedged assets or liabilities and may result in future losses.
Our risk management policies, procedures and methods leave us exposed to unidentified or unanticipated risks, which could lead to material losses.
We have devoted significant resources to developing our risk management policies, procedures and assessment methods and intend to continue to do so in the future. Nonetheless, the risk management techniques and strategies have not been and may in the future not be fully effective in mitigating our risk exposure in all economic market environments or against all types of risk, including risks that we fail to identify or anticipate. Some of our quantitative tools and metrics for managing risk are based upon our use of observed historical market behavior. We apply statistical and other tools to these observations to arrive at quantifications of our risk exposures. During the recent financial crisis, the financial markets experienced unprecedented levels of volatility (rapid changes in price direction) and the breakdown of historically observed correlations (the extent to which prices move in tandem) across asset classes, compounded by extremely limited liquidity. In this volatile market environment, our risk management tools and metrics failed to predict some of the losses we experienced, particularly in 2008, and may in the future fail to predict important risk exposures. In addition, our quantitative modeling does not take all risks into account and makes numerous assumptions regarding the overall environment, which may not be borne out by events. As a result, risk exposures have arisen and could continue to arise from factors we did not anticipate or correctly evaluate in our statistical models. This has limited and could continue to limit our ability to manage our risks especially in light of the ongoing European sovereign debt crisis, many of the outcomes of which are currently unforeseeable. Our losses thus have been and may continue to be significantly greater than the historical measures indicate.
| | | | |
| Deutsche Bank | | Item 3: Key Information | | 20 |
| Annual Report 2012 on Form 20-F | | | | |
| | |
| | | | |
| | |
| | | | |
In addition, our more qualitative approach to managing those risks not taken into account by our quantitative methods could also prove insufficient, exposing us to material unanticipated losses. Also, if existing or potential customers or counterparties believe our risk management is inadequate, they could take their business elsewhere or seek to limit their transactions with us. This could harm our reputation as well as our revenues and profits. See “Management Report: Risk Report” beginning on page 43 of the Financial Report for a more detailed discussion of the policies, procedures and methods we use to identify, monitor and manage our risks.
We operate in an increasingly regulated and litigious environment, potentially exposing us to liability and other costs, the amounts of which may be difficult to estimate.
The financial services industry is among the most highly regulated industries. Our operations throughout the world are regulated and supervised by the central banks and regulatory authorities in the jurisdictions in which we operate. In recent years, regulation and supervision in a number of areas has increased, and regulators, counterparties and others have sought to subject financial services providers to increasing responsibilities and liabilities. This trend has accelerated markedly as a result of the recent global financial crisis and the ongoing European sovereign debt crisis. As a result, we may further be subject to an increasing incidence or amount of liability or regulatory sanctions and may further be required to make greater expenditures and devote additional resources to address potential liability.
Due to the nature of our business, we and our subsidiaries are involved in litigation, arbitration and regulatory proceedings in jurisdictions around the world. Such matters are subject to many uncertainties, and the outcome of individual matters is not predictable with assurance. We may settle litigation or regulatory proceedings prior to a final judgment or determination of liability. We may do so to avoid the cost, management efforts or negative business, regulatory or reputational consequences of continuing to contest liability, even when we believe we have valid defenses to liability. We may also do so when the potential consequences of failing to prevail would be disproportionate to the costs of settlement. Furthermore, we may, for similar reasons, reimburse counterparties for their losses even in situations where we do not believe that we are legally compelled to do so. The financial impact of legal risks might be considerable but may be hard or impossible to estimate and to quantify, so that amounts eventually paid may exceed the amount of provisions made for such risks. See “Item 8: Financial Information – Legal Proceedings” and Note 29 “Provisions” to our consolidated financial statements for information on our legal, regulatory and arbitration proceedings.
We are currently the subject of regulatory and criminal industry-wide investigations relating to interbank offered rates, as well as civil actions. Due to a number of uncertainties, including those related to the high profile of the matters and other banks’ settlement negotiations, the eventual outcome of these matters is unpredictable, and may materially and adversely affect our results of operations, financial condition and reputation.
We have received subpoenas and requests for information from various regulatory and law enforcement agencies in Europe, North America and Asia Pacific in connection with industry-wide investigations concerning the setting of London Interbank Offered Rate (LIBOR), Euro Interbank Offered Rate (EURIBOR), Tokyo Interbank Offered Rate (TIBOR), Singapore Interbank Offered Rate (SIBOR) and other interbank offered rates. We are cooperating with these investigations.
In addition, a number of civil actions, including putative class actions, are pending in federal court in the United States District Court for the Southern District of New York and in other federal district courts against us and numerous other banks. All but one of these actions are filed on behalf of certain parties who allege that they held or transacted in U.S. Dollar LIBOR-based derivatives or other financial instruments and sustained losses as a result of collusion or manipulation by the defendants regarding the setting of U.S. Dollar LIBOR.
Regulators are also investigating numerous financial institutions in addition to us, and as details of these investigations and their findings have become public, the reported actions of some financial institutions have attracted substantial attention in the media and the markets, leading to further reputational risk for institutions like us that are currently subject to similar inquiries. In the period from mid-2012 to early 2013, three financial institutions entered into settlements with the U.K. Financial
| | | | |
| Deutsche Bank | | Item 3: Key Information | | 21 |
| Annual Report 2012 on Form 20-F | | | | |
| | |
| | | | |
| | |
| | | | |
Services Authority, U.S. Commodity Futures Trading Commission and U.S. Department of Justice (DOJ). While the terms of the various settlements differed, they all involved significant financial penalties and regulatory consequences. For example, one financial institution’s settlement included a Deferred Prosecution Agreement, pursuant to which the DOJ agreed to defer prosecution of criminal charges against that entity provided that the financial institution satisfies the terms of the Deferred Prosecution Agreement. The terms of the other financial institutions’ settlements included Non-Prosecution Agreements, pursuant to which the DOJ agreed not to file criminal charges against the entities so long as certain conditions are met. In addition, affiliates of two of the financial institutions agreed to plead guilty to a crime in a United States court for related conduct.
Because the various investigations and civil actions are still in their early stages, we cannot predict the effect on us of the interbank offered rates matters, which could include fines levied by government bodies, damages from private litigation for which we may be liable and regulatory consequences. This uncertainly is further exacerbated by several factors outside of our control, such as the high profile of these matters and the contours of other financial institutions’ settlement negotiations. In addition, regulatory and law enforcement authorities may make assessments about the conduct of institutions in the industry as a whole and impose additional regulatory or supervisory burdens on us. Any fines, damages or regulatory consequences may have a material adverse effect, beyond provisions taken, on our results of operations, financial condition or reputation.
We have been subject to contractual claims and litigation in respect of our U.S. residential mortgage loan business that may materially and adversely affect our results or reputation.
From 2005 through 2008, as part of our U.S. residential mortgage loan business, we sold approximately U.S. $ 84 billion of loans into private label securitizations and U.S. $ 71 billion through whole loan sales, including to U.S. government-sponsored entities such as the Federal Home Loan Mortgage Corporation and the Federal National Mortgage Association. We have been, and in the future may be, presented with demands to repurchase loans from or to indemnify purchasers, investors or financial insurers with respect to losses allegedly caused by material breaches of representations and warranties. Our general practice is to process valid repurchase claims that are presented in compliance with contractual rights. As of December 31, 2012, we have approximately U.S. $ 4.6 billion of outstanding mortgage repurchase demands (based on original principal balance of the loans). Against these outstanding demands, we have established provisions of€ 341 million in 2012. As with provisions generally, however, it is possible that the provisions we have established may ultimately be insufficient, either with respect to particular claims or with respect to the full set of claims that have been or may be presented. There are other potential mortgage repurchase demands that we anticipate may be made, but we cannot reliably estimate their timing or amount. As of December 31, 2012, we have completed repurchases and otherwise settled claims on loans with an original principal balance of approximately U.S. $ 2.6 billion. In connection with those repurchases and settlements, we have obtained releases for potential claims on approximately U.S. $ 41.6 billion of loans sold by us as described above.
From 2005 through 2008, we or our affiliates have also acted as an underwriter of approximately U.S. $ 105 billion of U.S. residential mortgage-backed securities (“RMBS”) for third-party originators.
As is the case with a significant number of other participants in the mortgage securitizations market and as described in Note 29 “Provisions” to our consolidated financial statements, we have received subpoenas and requests for information from certain regulators and government entities concerning our RMBS businesses. We are cooperating fully in response to those subpoenas and requests for information. We have a number of pending lawsuits against us or our affiliates as issuer and/or underwriter of RMBS. Such RMBS litigations pending are in various stages up through discovery and we continue to defend these actions vigorously. Legal and regulatory proceedings are subject to many uncertainties, and the outcome of individual matters is not predictable with assurance.
| | | | |
| Deutsche Bank | | Item 3: Key Information | | 22 |
| Annual Report 2012 on Form 20-F | | | | |
| | |
| | | | |
| | |
| | | | |
Operational risks may disrupt our businesses.
We face operational risk arising from errors, inadvertent or intentional, made in the execution, confirmation or settlement of transactions or from transactions not being properly recorded, evaluated or accounted for. Derivative contracts are not always confirmed with the counterparties on a timely basis; while the transaction remains unconfirmed, we are subject to heightened credit and operational risk and in the event of a default may find it more difficult to enforce the contract. The European sovereign debt crisis and the recent global financial crisis, in which the risk of counterparty default has increased, have increased the possibility that this operational risk materializes.
Our businesses are highly dependent on our ability to process, on a daily basis, a large number of transactions across numerous and diverse markets in many currencies, and certain of the transactions we process have become increasingly complex. Consequently, we rely heavily on our financial, accounting and other data processing systems. If any of these systems do not operate properly, or are disabled, we could suffer financial loss, a disruption of our businesses, liability to clients, regulatory intervention or reputational damage.
Among the operational risks we face is the risk of breaches of the security of our computer systems due to unauthorized access to networks or resources, the introduction of computer viruses or malware or other forms of cyberattack. Although we devote significant resources toward the protection of our computer systems against such breaches, there is no assurance that such measures will be effective against all threats. We and other financial institutions have experienced attacks on computer systems, including attacks aimed at obtaining unauthorized access to company or customer information or damaging or interfering with company data, resources or business activities. Given the varying nature and evolving sophistication of such attacks, it is possible that we may not be able to effectively anticipate and prevent all such attacks. A successful attack could have a significant negative impact on us, including as a result of disclosure or misappropriation of confidential information, damage to computer systems, financial losses, reputational damage, customer dissatisfaction and potential regulatory or litigation exposure.
In addition, despite the contingency plans we have in place, our ability to conduct business may be adversely impacted by a disruption in the infrastructure that supports our businesses and the communities in which we are located. This may include a disruption due to terrorist activities, or disease pandemics, as well as disruption involving electrical, communications, transportation or other services used by us or third parties with whom we conduct business.
The size of our clearing operations exposes us to a heightened risk of material losses should these operations fail to function properly.
We have large clearing and settlement businesses and an increasingly complex IT landscape. These give rise to the risk that we, our customers or other third parties could lose substantial sums if our systems fail to operate properly for even short periods. This will be the case even where the reason for the interruption is external to us. In such a case, we might suffer harm to our reputation even if no material amounts of money are lost. This could cause customers to take their business elsewhere, which could materially harm our revenues and profits.
We may have difficulty in identifying and executing acquisitions, and both making acquisitions and avoiding them could materially harm our results of operations and our share price.
We consider business combinations from time to time. Even though we review the companies we plan to acquire, it is generally not feasible for these reviews to be complete in all respects. As a result, we may assume unanticipated liabilities, or an acquisition may not perform as well as expected. Were we to announce or complete a significant business combination transaction, our share price could decline significantly if investors viewed the transaction as too costly or unlikely to improve our competitive position. In addition, we might have difficulty integrating any entity with which we combine our operations. Failure to complete announced business combinations or failure to integrate acquired businesses successfully into ours could materially and adversely affect our profitability. It could also affect investors’ perception of our business prospects and management, and
| | | | |
| Deutsche Bank | | Item 3: Key Information | | 23 |
| Annual Report 2012 on Form 20-F | | | | |
| | |
| | | | |
| | |
| | | | |
thus cause our share price to fall. It could also lead to departures of key employees, or lead to increased costs and reduced profitability if we felt compelled to offer them financial incentives to remain.
The effects of the takeover of Deutsche Postbank AG may differ materially from our expectations.
Deutsche Postbank AG (together with its subsidiaries, “Postbank”) became a consolidated, majority-owned subsidiary of ours in December 2010 following a public takeover offer by us. In June 2012 Deutsche Postbank AG and a wholly-owned subsidiary of Deutsche Bank AG entered into a domination and profit and loss transfer agreement, which became incontestably valid in September 2012. As a result, we have general control over the management of Postbank. The effects of this acquisition on us may differ materially from our expectations. Our estimates of the synergies and other benefits that we expect to realize, and the costs that we might incur, as a result of this acquisition involve subjective assumptions and judgments that are subject to significant uncertainties. Moreover, Postbank’s securities portfolio contains products that may also be subject to material further decreases in value.
Furthermore, unforeseen difficulties may emerge in connection with the integration of Postbank’s business, including potential difficulties due to integration of IT systems and personnel, different internal standards and business procedures, the commitment of management resources in connection with the integration process and the potential loss of key personnel. The benefits, synergies, costs and timeframe of the integration could be adversely affected by any of these factors, as well as by a variety of factors that are partially or entirely beyond our and Postbank’s control, such as negative market developments. Any failure to integrate Postbank’s operations on a timely and efficient basis could have a material adverse effect on our net assets, financial condition and results of operations.
We may have difficulties selling non-core assets at favorable prices or at all and may experience material losses from these assets and other investments irrespective of market developments.
We may seek to sell certain non-core assets, including those assigned to our new Non-Core Operations Unit. Such sales may be made as part of our strategy to meet or exceed the new capital requirements by reducing risk-weighted assets and thereby improving our capital ratios. This strategy may prove difficult in the current market environment as many of our competitors are also seeking to dispose of assets to improve their capital ratios. Unfavorable business or market conditions may make it difficult for us to sell such assets at favorable prices, or may preclude such a sale altogether. If the measures announced in response to the ongoing European sovereign debt crisis prove inadequate to calm market concern or if the European debt crisis otherwise worsens, we may experience difficulty in obtaining funding in a manner permitting us to conduct our business without needing to dispose of significant volumes of assets.
In addition, we have made significant investments in individual companies and have other assets that are not part of our core business such as our stakes in The Cosmopolitan of Las Vegas, Maher Terminals and BHF-BANK. Losses and risks from those assets and at those companies may restrict our ability to sell our shareholdings and may reduce the value of our holdings considerably, potentially impacting our financial statements or earnings, even where general market conditions are favorable. Our larger, less liquid interests are particularly vulnerable given the size of these exposures. Any potential write-down for any such investment could further negatively affect our business.
Intense competition, in our home market of Germany as well as in international markets, could materially adversely impact our revenues and profitability.
Competition is intense in all of our primary business areas, in Germany as well as in international markets. If we are unable to respond to the competitive environment in these markets with attractive product and service offerings that are profitable for us, we may lose market share in important areas of our business or incur losses on some or all of our activities. In addition, downturns in the economies of these markets could add to the competitive pressure, through, for example, increased price pressure and lower business volumes for us.
| | | | |
| Deutsche Bank | | Item 3: Key Information | | 24 |
| Annual Report 2012 on Form 20-F | | | | |
| | |
| | | | |
| | |
| | | | |
In recent years there has been substantial consolidation and convergence among financial services companies, culminating in unprecedented consolidations in the course of the global financial crisis. This trend has significantly increased the capital base and geographic reach of some of our competitors and has hastened the globalization of the securities and other financial services markets. As a result, we must compete with financial institutions that may be larger and better capitalized than we are and that may have a stronger position in local markets. Also, governmental action in response to the global financial crisis may place us at a competitive disadvantage.
Transactions with counterparties in countries designated by the U.S. State Department as state sponsors of terrorism or persons targeted by U.S. economic sanctions may lead potential customers and investors to avoid doing business with us or investing in our securities, harm our reputation or result in regulatory action which could materially and adversely affect our business.
We engage or have engaged in a limited amount of business with counterparties, including government owned or controlled counterparties, in certain countries which the U.S. State Department has designated as state sponsors of terrorism, including Iran and Cuba (“Sanctioned Countries”), or with persons targeted by U.S. economic sanctions (“Sanctioned Persons”). U.S. law generally prohibits U.S. persons acting within U.S. jurisdiction from doing business with Sanctioned Countries or Sanctioned Persons. Our U.S. subsidiaries, branch offices, and employees are subject to those prohibitions. We are a German bank and our activities with respect to Sanctioned Countries and Sanctioned Persons have been subject to policies and procedures designed to avoid the involvement of persons within U.S. jurisdiction in any managerial or operational role and to ensure compliance with United Nations, European Union and German embargoes. However, should these policies prove to have been ineffective, we may be subject to regulatory action that could materially and adversely affect our business. In 2007 and before, our Management Board decided that we will not engage in new business with counterparties in countries such as Iran, Syria, Sudan and North Korea and to exit existing business to the extent legally possible.
We had a representative office in Tehran, Iran, which we discontinued at December 31, 2007. Our remaining business with Iranian counterparties consists mostly of participations as lender and/or agent in a few large trade finance facilities arranged some years ago to finance the export contracts of exporters in Europe and Asia. The lifetime of most of these facilities is ten years or more and we are legally obligated to fulfill our contractual obligations. We do not believe our business activities with Iranian counterparties are material to our overall business, with the outstandings to Iranian borrowers representing substantially less than 0.01 % of our total assets as of December 31, 2012 and the revenues from all such activities representing less than 0.02 % of our total revenues for the year ended December 31, 2012.
In recent years, the United States has taken steps, including the passage of the Comprehensive Iran Sanctions, Accountability, and Divestment Act of 2010, the National Defense Authorization Act for Fiscal Year 2012, the Iran Threat Reduction and Syria Human Rights Act of 2012, and the Iran Freedom and Counter-Proliferation Act of 2012, to further deter foreign companies from dealing with Iran, including by providing for possible sanctions against companies that provide services in support of certain Iranian activity in (among others) the energy, shipping or military sectors. These indirect U.S. economic sanctions also target foreign financial institutions that, among other things, facilitate significant transactions with, or provide significant financial services to a wide range of Iranian entities, persons, and financial institutions. We do not believe we have engaged in activities sanctionable under these statutes, but the U.S. authorities have considerable discretion in applying the statutes and any imposition of sanctions could be material.
As required by Section 219 of the Iran Threat Reduction and Syria Human Rights Act of 2012 (Section 13(r) of the Securities Exchange Act of 1934, as amended) we have disclosed certain information regarding our activities or transactions with persons subject to U.S. sanctions against Iran and other persons subject to such provision. Such disclosure is set forth in the section of this document entitled “Disclosures Under Iran Threat Reduction and Syria Human Rights Act of 2012”, which follows “Item 16H: Mine Safety Disclosure”.
| | | | |
| Deutsche Bank | | Item 4: Information on the Company | | 25 |
| Annual Report 2012 on Form 20-F | | | | |
| | |
| | | | |
| | |
| | | | |
We are also engaged in a limited amount of business with counterparties domiciled in Cuba, which is not subject to any United Nations, European Union or German embargo. The business consists of a limited number of non-confirmed letters of credit and of structured export finance transactions and represented substantially less than 0.01 % of our assets as of December 31, 2012. The transactions served to finance commercial products like tools for the sugar industry, and electricity supply, pharmaceutical products and sanitary goods.
We are aware, through press reports and other means, of initiatives by governmental and non-governmental entities in the United States and elsewhere to adopt laws, regulations or policies prohibiting transactions with or investment in, or requiring divestment from, entities doing business with such countries, particularly Iran. Such initiatives may result in our being unable to gain or retain entities subject to such prohibitions as customers or as investors in our securities. In addition, our reputation may suffer due to our association with such countries. Such a result could have significant adverse effects on our business or the price of our securities.
Item 4: Information on the Company
History and Development of the Company
The legal and commercial name of our company is Deutsche Bank Aktiengesellschaft. It is a stock corporation organized under the laws of Germany.
Deutsche Bank Aktiengesellschaft originated from the reunification of Norddeutsche Bank Aktiengesellschaft, Hamburg, Rheinisch-Westfälische Bank Aktiengesellschaft, Düsseldorf, and Süddeutsche Bank Aktiengesellschaft, Munich. Pursuant to the Law on the Regional Scope of Credit Institutions, these were disincorporated in 1952 from Deutsche Bank, which had been founded in 1870. The merger and the name were entered in the Commercial Register of the District Court Frankfurt am Main on May 2, 1957.
We are registered under registration number HRB 30 000. Our registered address is Taunusanlage 12, 60325 Frankfurt am Main, Germany, and our telephone number is +49-69-910-00. Our agent in the United States is: Peter Sturzinger, Deutsche Bank Americas, c/o Office of the Secretary, 60 Wall Street, Mail Stop NYC60-4006, New York, NY 10005.
We have made the following significant capital expenditures or divestitures since January 1, 2012:
| — | | In February 2012, Sicherungseinrichtungsgesellschaft deutscher Banken mbH (“SdB”) repaid€ 1.0 billion (of which€ 0.7 billion was allocated to the former Corporate Investments, now part of the NCOU, and the remainder was allocated to other Corporate Divisions) of ECB-eligible notes guaranteed by the SOFFin (Sonderfonds Finanzmarktstabilisierung, established in October 2008 by the German government in the context of the financial crisis). Taking into account smaller repayments in 2010 and 2011, our remaining exposure to SdB amounted to€ 1.0 billion at the end of 2012. |
| — | | In February 2012, we exchanged a mandatorily-exchangeable bond issued by Deutsche Post in February 2009 into 60 million Postbank shares (and cash) and one day later Deutsche Post exercised its option to sell to us an additional 12.1 % of the share capital in Postbank. Together with shares held at this point in time, our ownership in Postbank increased to 93.7 %. |
| — | | In March 2012, we completed the sale of our U.S. multi-family financing business (Deutsche Bank Berkshire Mortgage) to a group led by Lewis Ranieri and Wilbur L. Ross, in line with our desire to focus on our core business strengths in the U.S. |
| — | | In March 2012, Deutsche Postbank AG (“Postbank”) and our wholly owned subsidiary DB Finanz-Holding GmbH (“DB Finanz-Holding”) decided to conclude a domination and profit and loss transfer |
| | | | |
| Deutsche Bank | | Item 4: Information on the Company | | 26 |
| Annual Report 2012 on Form 20-F | | | | |
| | |
| | | | |
| | |
| | | | |
| | | agreement according to Section 291 of the German Stock Corporation Act, with DB Finanz-Holding as controlling company and Postbank as dependent. Following the approval of the agreement at Postbank’s annual shareholders’ meeting and its registration in the Commercial Register, the agreement became effective in June 2012. It reached final legal validity through an order issued by the Higher Regional Court in Cologne on September 11, 2012. Thereby, Postbank became linked to Deutsche Bank AG by a chain of domination and profit and loss transfer agreements. |
| — | | In June 2012, we completed the sale of DB Export Leasing GmbH to Interoute Communications Limited. |
| — | | In September 2012, we signed an agreement regarding the sale of BHF-BANK AG to Kleinwort Benson Group. The transaction is subject to regulatory approvals. |
| — | | In October 2012, we exited our exposure to Actavis, the generic pharmaceuticals company, upon completion of Watson Pharmaceuticals’ acquisition of the company. |
| — | | In January 2013, we completed the sale of our 15 % participation in Dedalus GmbH & Co. KGaA, through which we indirectly held approximately 1.1 % of the shares in EADS N.V. for a consideration of approximately€ 250 million. |
Since January 1, 2012, there have been no public takeover offers by third parties with respect to our shares and we have not made any public takeover offers in respect of any other company’s shares.
Furthermore, we have made the following significant capital expenditures or divestitures between January 1, 2010 and December 31, 2011:
| — | | In March 2010, we closed the full acquisition of the Sal. Oppenheim Group for a total purchase price of approximately€ 1.3 billion paid in cash, of which approximately€ 0.3 billion was for BHF Asset Servicing GmbH (“BAS”), which was on-sold in the third quarter 2010 to Bank of New York Mellon. Shortly after the acquisition, Sal. Oppenheim’s Equity Trading & Derivatives and Capital Markets Sales and Research units were sold by us to Australia’s Macquarie Group in the second quarter 2010. BHF-BANK AG, a 100 % subsidiary of Sal. Oppenheim, is being managed as a standalone entity and is currently subject to a purchase agreement with Kleinwort Benson Group. |
| — | | In April 2010, we completed the acquisition of parts of ABN AMRO Bank N.V.’s (“ABN AMRO”) commercial banking activities in the Netherlands for a final consideration of€ 687 million in cash. The acquisition accounting for the business combination had been finalized in the first quarter of 2011, leading to a negative goodwill of€ 192 million. The acquired businesses have become part of our Global Transaction Banking Corporate Division and operate under the Deutsche Bank brand name. |
| — | | In October 2010, we made a voluntary public takeover offer to the shareholders of Postbank at€ 25.00 per share. The offer was accepted for a total of 48.2 million shares, allowing Deutsche Bank to increase its participation in Postbank from 29.95 % to 51.98 % for a total consideration of€ 1.2 billion. Following the successful completion of the takeover offer, Postbank became a consolidated subsidiary of ours in the fourth quarter of 2010. |
| — | | In November 2010, we completed the restructuring of loans we had to Actavis Group, a generic pharmaceutical group. The restructuring resulted in Deutsche Bank continuing to provide both senior and subordinated debt financing to Actavis as well as a new Payment in Kind financing arrangement. |
| — | | In the course of 2010, the liquidity facility for Deutsche Pfandbriefbank AG (formerly Hypo Real Estate Bank AG) of€ 9.2 billion, in which the former Corporate Investments participated in December 2009, was fully repaid. The last repayment was made in December 2010, at which point we participated in a new liquidity facility for FMS Wertmanagement Anstalt des öffentlichen Rechts, the winding-up agency of the Hypo Real Estate Group, by subscribing to€ 7.5 billion of ECB-eligible notes (of which€ 6.4 billion was allocated to the former Corporate Investments, and the remainder was allocated to other Corporate Divisions). |
| — | | In January 2011, we sold our 40 % stake in Paternoster Limited, a specialist pension insurer, to Rothesay Life, in accordance with the decision of the majority of Paternoster shareholders to sell their shares in the company. |
| — | | In April 2011, we completed the subscription of newly issued shares in Hua Xia Bank Co. Ltd. Upon final settlement of the transaction, which was effective with the registration of the new shares on April 26, |
| | | | |
| Deutsche Bank | | Item 4: Information on the Company | | 27 |
| Annual Report 2012 on Form 20-F | | | | |
| | |
| | | | |
| | |
| | | | |
| | | 2011, this investment increased our existing equity stake in Hua Xia Bank from 17.12 % to 19.99 % of issued capital, the maximum single foreign ownership level as permitted by Chinese regulations. |
| — | | In July 2011, we completed the sale of our equity linked note giving economic exposure to Newlands, a credit derivative product company incorporated in Bermuda, to funds advised by Oakhill Advisors. |
| — | | In August 2011, SdB repaid€ 0.5 billion (of which€ 0.3 billion was allocated to the former Corporate Investments and the remainder was allocated to other Corporate Divisions) of ECB-eligible notes guaranteed by SOFFin which were acquired in February 2009 as part of a liquidity facility for SdB. |
| — | | In November 2011, we closed an agreement for the sale of our premises at Taunusanlage 12 in Frankfurt am Main to a closed-end real estate fund launched by DWS. The sales price for the property determined by independent valuations was approximately€ 600 million. We continue to use these premises as Group headquarters under a long-term lease. |
| — | | In the course of 2011, the liquidity facility for FMS Wertmanagement Anstalt des öffentlichen Rechts, the winding-up agency of the Hypo Real Estate Group, of€ 7.5 billion (of which€ 6.4 billion was allocated to the former Corporate Investments and the remainder was allocated to other Corporate Divisions), in which we participated in December 2010, was fully repaid. |
Business Overview
Our Organization
Please see “Management Report: Operating and Financial Review: Deutsche Bank Group: Our Organization” on page 4 of the Financial Report.
Management Structure
Please see “Management Report: Operating and Financial Review: Deutsche Bank Group: Management Structure” on page 4 to 5 of the Financial Report.
Our Business Strategy
In September 2012, we announced “Strategy 2015+” which articulates how we plan to address near-term challenges in a changed business environment and positions us to seize opportunities presented by longer-term megatrends and achieve our vision to become the leading client-centric global universal bank.
Five levers are key to Deutsche Bank realizing this vision:
| — | | Clients. Deutsche Bank serves a focused portfolio of clients and regions based on our ability to generate value. In Strategy 2015+, we have placed strategic emphasis on growth in our home market, Germany, in Asia Pacific, and in the Americas. |
| — | | Competencies. Our strategy also rests on the strength of our business franchises. We believe that our four core business pillars are well placed to balance our earnings mix and to satisfy increasingly complex and global customer needs. Strategy 2015+ defines a framework to develop the Corporate Banking & Securities (CB&S), Global Transaction Banking (GTB), and Private & Business Clients (PBC) divisions, bolstered by a new fully integrated Asset & Wealth Management (AWM) division. Closer collaboration between the individual corporate divisions and the infrastructure functions is expected to generate substantial synergies. |
| — | | Capital. Deutsche Bank is committed to further strengthening its capital ratios in the future. We have identified a series of measures to promote organic capital growth and further reduce risk-weighted assets (RWAs). Under full application of Basel 3 rules, we aim to achieve a Core-Tier 1 ratio of more than 10 % by the end of the first quarter of 2015. To help accelerate the process of reducing RWAs from non-core activities, a dedicated Non-Core Operations Unit (NCOU) has been established. Organized as a distinct division, the unit is accountable and empowered to manage and sell non-core assets in the most efficient manner for the bank. |
| — | | Cost. We aim to secure our long-term competitiveness by achieving operational excellence with major reductions in costs, duplication, and complexity in the years ahead. We plan to incur costs to achieve of |
| | | | |
| Deutsche Bank | | Item 4: Information on the Company | | 28 |
| Annual Report 2012 on Form 20-F | | | | |
| | |
| | | | |
| | |
| | | | |
| | approximately€ 4 billion over the next three years with the aim of achieving annual savings of€ 4.5 billion by 2015. Nearly 40 % of the planned savings relate to the bank’s infrastructure, including investing in new integrated IT platforms, rationalizing regional back-office activities and centralizing procurement. We further plan to consolidate our real-estate footprint. |
| — | | Culture. Deutsche Bank recognizes the need for cultural change in the banking sector and aspires to be at the forefront of this change. Compensation practices are one important way to achieve behavioral change and align incentives to longer-term sustainable performance on behalf of all stakeholders. Client focus and teamwork are other attributes we are emphasizing to complement our performance culture, entrepreneurial spirit and cultural diversity. |
In summary, our Strategy 2015+ seeks to strengthen our unique global platform and home market position, further leverage integrated performance of our universal banking model, achieve operational excellence and cost efficiency, build capital strength organically and place Deutsche Bank at the forefront of cultural change in the banking industry. It is our aim in delivering against these objectives to position Deutsche Bank as a winner in a changed competitive environment.
Strategy in CB&S
CB&S comprises our Markets and Corporate Finance businesses.
We believe that CB&S’s previous recalibration to a strongly client-focused business model will help to ensure that we can remain well positioned within the current market and competitive landscape. In 2012, we maintained our position as a leading franchise while reducing headcount, balance sheet and risk-weighted assets. In 2013, we plan to target increased scale and efficiency with the intention that the business maintains its leading positions and delivers sustainable returns to our shareholders. Following the bank’s strategic review we continue to evaluate our business portfolio and are adapting it to reflect the current market environment and the needs of our clients.
InMarkets, our diversified client-focused business model and Top-3 client market shares across most products and regions (based on latest available Euromoney and Greenwich Associates rankings and surveys) result in a clear competitive advantage in a difficult market environment. In our fixed income, currencies and commodities (FICC) franchise we plan to continue to invest in our market-leading FX business and to build out our EM businesses, while also increasing the integration of our platforms to achieve further efficiencies of scale. In Equities, we remain committed to ensuring that the business is appropriately aligned with market opportunities.
InCorporate Finance we were ranked number 5 globally in 2012 (according to Dealogic), despite higher exposure than our peers to the economic slow-down in Europe. A strong focus on profitability drove the realization of significant efficiencies across the business. In 2013, we plan to continue to focus on deepening relationships with our most profitable clients, increasing the efficiency of our lending portfolio as well as productivity. We will look to maintain our leading position in Europe, win market share in the U.S. and consolidate our market leading Asian franchise.
Strategy in GTB
GTB comprises Deutsche Bank’s Trade Finance, Cash Management and Trust & Securities Services businesses. It is based on a solution-oriented, volume-driven business model of global scale focused on serving Financial Institutions, Non-Bank Financial institutions and Complex Corporate clients globally and MidCap clients in Germany as well as MidCaps and SMEs in the Netherlands.
In a persistently challenging environment, which nevertheless entails significant growth opportunities for well-positioned transaction banks, GTB again delivered a strong and consistent performance in 2012. Revenues and pre-tax profit grew in all regions and major products, with the exception of our commercial banking activities in the Netherlands which were successfully migrated onto Deutsche Bank systems in August 2012.
| | | | |
| Deutsche Bank | | Item 4: Information on the Company | | 29 |
| Annual Report 2012 on Form 20-F | | | | |
| | |
| | | | |
| | |
| | | | |
GTB’s strategy centers on a continued focus on clearly defined target clients, products and geographies and the following key strategic priorities: deepen relationships with existing clients and acquire new target clients, invest in solutions, platforms and operational excellence, continuously optimize GTB’s business portfolio, resource utilization and global footprint, drive synergies from closer collaboration with CB&S, AWM and PBC, and maintain strict cost, risk and capital discipline.
Strategy in AWM
AWM is a new corporate division established in June 2012 by integrating the Bank’s existing Asset Management (AM) and Private Wealth Management (PWM) businesses. The new division also includes former CB&S passive and third-party alternatives businesses, such as db-X exchange traded funds (ETFs), dbSelect liquid hedge fund strategies and Abbey Life. With invested assets of over€ 940 billion as of December 31, 2012, the combined AWM is a business of significant scale, as well as an essential pillar of Deutsche Bank’s universal banking model.
Concurrent with the establishment of AWM we announced the end of the strategic review of certain AM businesses initiated in November 2011. After extensive consideration we reaffirmed DWS Americas, DB Advisors, Deutsche Insurance Asset Management and RREEF Alternatives as integral parts of AWM. By combining active and passive investment strategies together with institutional and retail asset management and private wealth management in one business we seek to unlock the full potential of these businesses and create value for clients and shareholders alike.
Since the announcement of the creation of AWM, significant progress has been made on initiatives to leverage the power of the integrated division. We have established a client-centric organizational structure to give clients better access to the full capabilities of Deutsche Bank’s buy-side businesses and created closer links with other divisions, for example to streamline vendor relationships, share technologies and expand global client coverage. Various initiatives are underway with the objective to deliver regional revenue growth and cost savings.
Looking ahead, we intend AWM to focus on building an efficient platform by eliminating duplication and driving collaboration to deliver strong investment performance, a broader range of products, enhanced client coverage and future business growth.
InAsset Management, we plan to focus on aligning our business platforms and investment capabilities with client needs and delivering strong performance across a broader mix of products and solutions, including passive/ETF strategies and liquid alternatives. We will seek to leverage our market-leading positions in institutional and retail asset management to offer clients customized and coordinated solutions leveraging AWM and broader Deutsche Bank capabilities.
InWealth Management, we plan to continue building on strength in our domestic market Germany, as well as improved performance globally, particularly in APAC and the Americas. With our integrated AWM platform, we aim to further expand our strategy serving the specific needs of ultra-high-net-worth (UHNW) clients worldwide in cooperation with CB&S.
Strategy in PBC
InPBC, we have continued to leverage our well-diversified franchise with a leading position among private retail banks in Germany. With the conclusion of the domination and profit and loss transfer agreement as well as the smooth execution of Postbank integration, we were able to generate significant synergies and continued working on a joint platform (Magellan). Despite challenges brought on by the European debt crisis, PBC’s international franchise remained profitable and resilient. We opened branches in selected European countries and India while benefiting from our stake in Hua Xia Bank in China. PBC contributes significantly to Deutsche Bank Group’s funding base.
| | | | |
| Deutsche Bank | | Item 4: Information on the Company | | 30 |
| Annual Report 2012 on Form 20-F | | | | |
| | |
| | | | |
| | |
| | | | |
Our strategy is to compete among Europe’s leading retail banks with a strong advisory business in our home market Germany, as well as well-positioned advisory franchises in selected international markets. In Germany, we also plan to strengthen further our consumer banking business under the Postbank brand, by achieving business alignment and cost reductions via implementation of organizational measures. Furthermore, we intend to leverage our competitive advantage to grow our credit business at attractive margins and maintain a strong position as deposit gatherer. With Magellan, we are building a new joint services and IT platform for PBC, offering services to both advisory and consumer banking proposition. We believe that this state-of-the-art platform with integrated services, innovative tools and an end-to-end process model is positioned to drive PBC’s efficiency and thus contribute to delivering PBC’s growth.
Strategy in the NCOU
In September 2012, we announced the creation of the NCOU as a key element of our Strategy 2015+. The purpose of the NCOU is to accelerate de-risking through coordinating activities across Deutsche Bank to dispose of non-core assets. This includes the streamlining of management priorities to help the organisation and its management to focus on the core businesses and improving external transparency on non-core positions by showing analysts and investors the performance of the Bank’s core businesses.
The NCOU was established in the fourth quarter of 2012 as a fifth pillar in Deutsche Bank’s divisional structure and will contribute to ensuring tight management of capital and balance sheet, a critical element to Deutsche Bank’s success in the current environment.
Our Corporate Divisions
Please see “Management Report: Operating and Financial Review: Deutsche Bank Group: Corporate Divisions” beginning on page 5 of the Financial Report.
The Competitive Environment
Competitor Landscape
Following the economic recovery in 2009 and 2010, market conditions deteriorated in 2011 driven by the intensifying European sovereign debt crisis. In 2012, the macroeconomic environment remained unstable and the medium-term outlook is challenging. Lower global growth expectations compared to the last decade and further potential for shocks as well as the need for the deleveraging of Western economies constrain the growth potential of banks. On the other hand, there are longer-term megatrends such as changing global demographics, financial deepening in emerging markets and technological advancements that may provide opportunities.
The banking sector also faces significant regulatory and reputational challenges. More restrictive regulatory changes put pressure on profitability and returns. Misaligned incentives and other excesses in the run-up to the financial crisis led to a strained relationship of the banking sector with society. To win back the trust of clients, policy makers and shareholders, cultural change is needed. This change has to include realigning compensation practices and promoting more long-term orientation, sustainability and client focus.
In this environment, the banking industry (including us, in all of our businesses) is experiencing intense competition and is gradually consolidating, with larger and more profitable banks being in a better position than smaller and less efficient players in the respective businesses. Especially in investment banking (except advisory) high fixed costs of maintaining state-of-the-art technology make scale an imperative. Second-tier banks find it increasingly difficult to generate sufficient returns and several of them already announced measures to retrench from certain areas.
| | | | |
| Deutsche Bank | | Item 4: Information on the Company | | 31 |
| Annual Report 2012 on Form 20-F | | | | |
| | |
| | | | |
| | |
| | | | |
Deutsche Bank’s competitors include other universal banks, commercial banks, savings banks, public sector banks, brokers and dealers, investment banking firms, asset managers, private banks, investment advisors, mutual funds, insurance companies, and hedge funds. We compete with some of our competitors globally and with some others on a regional, product, or niche basis. We compete on the basis of a number of factors, including the quality of client relationships, transaction execution, our products and services, innovation, reputation and price.
In our home market, Germany, the retail banking market remains fragmented and our competitive environment remains influenced by the three pillar system of private banks, public banks and cooperative banks. Following recent and ongoing consolidation activity, particularly among public regional commercial banks (“Landesbanken”) and private banks, competitive intensity has increased. Our takeover of Deutsche Postbank AG as well as the merger of the second and third largest private sector banks have affected the domestic competitive landscape and further increased concentration.
Regulatory Reform
Implementation of global regulatory reforms in the wake of the financial crisis has slowed, as a result of delays in political negotiations and the increased number and complexity of proposals. This complexity arises both from the interaction of different proposals and from their application on a cross-border basis, while the number of proposals mean that regulatory agencies face capacity constraints. At the same time, new regulatory proposals continue to be developed. As such, considerable uncertainty for all market participants remains around the ultimate impact of reforms to both prudential and markets regulation.
Proposals currently being discussed or implemented at a global, U.S. and European level that could have a material impact on our competitive position (positive or negative) include:
| — | | Implementation of the Basel 3 framework on capital and liquidity standards, along with the introduction of an international leverage ratio; |
| — | | The introduction of specific capital requirements for financial institutions that are systemically important on a global or national level, such as Federal Reserve Board Notice of Proposed Rulemaking regarding the enhanced prudential standards and early remediation requirements for foreign banking organisations with consolidated assets in excess of U.S. $ 50 billion; |
| — | | Global reviews regarding the implementation of international regulatory standards with respect to risk-weighted assets and the treatment of trading book assets by national regulators and financial institutions; |
| — | | The introduction of rules to require the creation of recovery and resolution plans along with new powers for regulators to restructure failing financial institutions or write-down and convert instruments held by shareholders and creditors in the event of bank failure; |
| — | | The separation of certain businesses such as proprietary trading activities from the deposit-taking business (subject of draft legislation in Germany and focus of ongoing work in EU Commission); |
| — | | Requirements for over-the-counter and standardized derivatives to be centrally cleared and traded on formal platforms, with additional capital and margin requirements for non-cleared trades (such as the European Regulation on OTC Derivatives, Central Counterparties and Trade Repositories (EMIR), which became effective on August 16, 2012 and the rules of which are expected to apply from spring 2013 onwards); |
| — | | Greater regulation and oversight of commodity derivatives markets with more traders brought into the scope of conduct regulation and the potential imposition of position limits in the EU and U.S.; |
| — | | Additional rules and restrictions applied to banks at national and international level to address perceived risks to market integrity and efficiency posed by high frequency and algorithmic trading; |
| — | | Extension of pre and post trade transparency and market abuse rules from equities to all financial instruments, greater restrictions on operating trading platforms, and greater sanctioning powers; |
| | | | |
| Deutsche Bank | | Item 4: Information on the Company | | 32 |
| Annual Report 2012 on Form 20-F | | | | |
| | |
| | | | |
| | |
| | | | |
| — | | Changes to EU and Asian restrictions on the eligible assets and operation of investment companies and the structure and sale of investment products, in particular to retail investors; |
| — | | Increased regulation and oversight of “shadow banking” including new requirements for money market funds, securities financing markets and other non-bank financial intermediaries; |
| — | | Global and domestic reforms to enhance the oversight of systemically important benchmarks and indices; |
| — | | Additional corporate governance, audit, risk management, reporting and disclosure requirements and, in the EU, further restrictions on variable remuneration (potentially applied globally to EU bank staff); |
| — | | Reforms to financial markets infrastructure to improve their resilience and increase their financial resources; |
| — | | Reforms to financial regulatory architecture which may result in increased costs for firms; and |
| — | | Possible introduction of a financial transaction tax in a number of EU countries. |
There is a range of risks to financial institutions, and particularly the banking sector, which may arise across all of these areas and could increase pressure on the scope of their activities, balance sheet size and profitability. Uncertainty regarding the final shape of legislation contributes to difficulty assessing these risks and their potential impact. In addition, the regulatory burden of having to comply with different regulations, including in some areas potentially conflicting or duplicative cross-border requirements may substantially increase. Regulatory measures in individual jurisdictions which go beyond the regulatory standards agreed on globally may result in an unlevel competitive playing field between financial institutions from different jurisdictions.
Climate change, environmental and social issues
Many governments, corporations and investors are increasing their focus on climate change, environmental and social issues by enacting legislation, changing business models, setting business operational policies and changing investment decision making. Respected authorities estimate that the total impact of these actions is insufficient to reduce the risks of climate change. The number and strength of government, corporate and investor actions may therefore increase over time as climate change has a greater impact on society. This affects the financial services industry, in particular in connection with projects that contribute to or mitigate climate change, as well as other environmental and societal impacts. Projects and products that contribute to climate change or other negative environmental or social impacts, as well as their financing and other services for these projects, are being reviewed more critically by investors, customers, environmental authorities, non-governmental organizations and others. At Deutsche Bank such review is conducted based on the Deutsche Bank Group Environmental and Social Reputational Risk Framework. Where our own assessment of these issues so indicates, we may abstain from participating in such projects. By contrast, projects and products that aim to mitigate climate change or other environmental pressures are increasingly seeking financing and other financial services; these offer growth opportunities for many of our businesses. Our research indicates that companies incorporating the best environmental, social and governance practices are able to raise capital at a lower cost and may be able to achieve superior risk adjusted returns. Moreover, we note that investors, customers and others increasingly take the overall approach of companies to climate change, including the direct and indirect carbon emissions of their operations, into consideration in their decisions, even where such emissions are minimal. We have undertaken a number of measures to reduce our carbon emissions over time, such as a comprehensive renovation of our world headquarters in Germany to bring the energy efficiency of these buildings to the highest possible level for similar office towers. Combined with other measures, we have significantly reduced our emissions. These efforts are recognized with the highest rankings in many industry assessments.
| | | | |
| Deutsche Bank | | Item 4: Information on the Company | | 33 |
| Annual Report 2012 on Form 20-F | | | | |
| | |
| | | | |
| | |
| | | | |
Regulation and Supervision
Overview
Our operations throughout the world are regulated and supervised by the relevant authorities in each of the jurisdictions where we conduct business. Such regulation relates to licensing, capital adequacy, liquidity, risk concentration, conduct of business as well as organizational and reporting requirements. It affects the type and scope of the business we conduct in a country and how we structure specific operations. Currently and in reaction to the crisis in the financial markets, the regulatory environment is undergoing significant changes.
Most notably, the Basel Committee on Banking Supervision has proposed revised capital adequacy and liquidity standards that are significantly more stringent than the existing requirements. In December 2010, the Basel Committee published a set of comprehensive changes to the capital adequacy framework, known as Basel 3, which will be implemented into European Union law by a legislative package referred to as “CRD 4”. Following political agreement on CRD 4, the Council of the European Union published a revised draft of the legislative package on March 26, 2013. CRD 4 will contain, among others, detailed rules on regulatory banking capital, increased capital requirements and the introduction of additional capital buffers, tightened liquidity standards and the introduction of a non-risk based leverage ratio. Most of new rules are expected to apply from January 1, 2014, with capital requirements and buffers increasing from year to year. Further delays to the effectiveness of the rules are possible.
Furthermore, we had to create by June 30, 2012 and maintain, pursuant to an agreement of the Council of the European Union of October 26, 2011 affecting 70 large banks in the European Economic Area, an exceptional and temporary capital buffer to address market concerns over sovereign risk. More generally, to prevent shortfalls in the capitalization of German banks, the German legislature enacted a statute in December 2012 allowing stabilization measures in the period through December 2014 that can be imposed on banks without approval of their shareholders.
Further changes continue to be under consideration in the jurisdictions in which we operate. While the extent and nature of these changes cannot be predicted now, they may include a further increase in regulatory oversight and enhanced prudential standards relating to capital, liquidity, employee compensation, limitations on activities and other aspects of our operations that may have a material effect on the businesses and the services and products that we will be able to offer.
The following sections present a description of the supervision of our business by the authorities in Germany, our home market, in the member states of the European Economic Area, and in the U.S., which we view as the most significant for us. Beyond these regions, local country regulations generally have limited impact on our operations that are unconnected with these countries.
Regulation and Supervision in Germany – Basic Principles
We are authorized to conduct banking business and to provide financial services as set forth in the German Banking Act (Kreditwesengesetz – KWG). We are subject to comprehensive regulation and supervision by the German Federal Financial Supervisory Authority (Bundesanstalt für Finanzdienstleistungsaufsicht, “BaFin”) and the Deutsche Bundesbank (“Bundesbank”), the German central bank.
The BaFin is a federal regulatory authority and reports to the German Federal Ministry of Finance. It supervises the operations of German banks to ensure that they are in compliance with the German Banking Act and other applicable German laws and regulations. The Bundesbank supports the BaFin and closely cooperates with it. The cooperation includes the ongoing review and evaluation of reports submitted by us and of our audit reports as well as assessments of the adequacy of our capital base and risk management systems. The BaFin and the Bundesbank require German banks to file comprehensive information in order to monitor compliance with applicable legal requirements and to obtain information on the financial condition of banks.
| | | | |
| Deutsche Bank | | Item 4: Information on the Company | | 34 |
| Annual Report 2012 on Form 20-F | | | | |
| | |
| | | | |
| | |
| | | | |
Generally, supervision by the BaFin and the Bundesbank applies on an unconsolidated basis (company only) and on a consolidated basis (the company and the entities consolidated with it for German regulatory purposes). Banks forming part of a consolidated group may waive the application of capital adequacy requirements, large exposure limits and certain organizational requirements on an unconsolidated basis if certain conditions are met. Deutsche Bank AG meets these conditions and has waived application of these rules since January 1, 2007.
We are in compliance with the German laws that are applicable to our business in all material respects.
The German Banking Act
The German Banking Act contains the principal rules for German banks, including the requirements for a banking license, and regulates the business activities of German banks. In particular it requires that an enterprise that engages in one or more of the activities defined in the German Banking Act as “banking business” or “financial services” in Germany must be licensed as a “credit institution” (Kreditinstitut) or “financial services institution” (Finanzdienstleistungsinstitut), as the case may be. We are licensed as a credit institution.
The German Banking Act and the rules and regulations adopted thereunder implement certain European Union directives relating to banks. These directives reflect recommendations of the Basel Committee on Banking Supervision and address issues such as accounting standards, regulatory capital, risk-based capital adequacy, the monitoring and control of large exposures, consolidated supervision and liquidity.
The CRD 4 legislative package, which will implement the Basel 3 framework in the European Union, comprises a European Union regulation (which is referred to as the Capital Requirements Regulation or CRR) which will apply directly in every member state, and a European Union directive, which will require subsequent national transposition legislation. The legislative process is expected to be completed in 2013, so that most of the new rules are expected to apply from January 1, 2014. Further delays to effectiveness are possible. To a large extent, the CRR, instead of the German Banking Act, will then govern our regulatory capital, risk-based capital adequacy, monitoring and control of large exposures, consolidated supervision and liquidity.
The German Securities Trading Act
Under the German Securities Trading Act (Wertpapierhandelsgesetz – WpHG), the BaFin regulates and supervises securities trading in Germany. The German Securities Trading Act contains, among other things, disclosure and transparency rules for issuers of securities that are listed on a German exchange and prohibits insider trading with respect to certain listed securities. The German Securities Trading Act also contains rules of conduct. These rules of conduct apply to all businesses that provide securities services. Securities services include, in particular, the purchase and sale of securities or derivatives for others and the intermediation of transactions in securities or derivatives and certain types of investment advice. The BaFin has broad powers to investigate businesses providing securities services to monitor their compliance with the rules of conduct and the reporting requirements. In addition, the German Securities Trading Act requires an independent auditor to perform an annual audit of the securities services provider’s compliance with its obligations under the German Securities Trading Act.
The European Union has completed or brought forward several legislative proposals which result, or would result, if enacted, in further regulation of securities trading and the trading in derivatives in particular. In particular, the European Union has adopted the European Regulation on OTC Derivatives, Central Counterparties and Trade Repositories (EMIR), which became effective on August 16, 2012 and the rules of which are expected to apply from summer 2013 onwards. EMIR introduces requirements for standardized over-the-counter derivatives to be centrally cleared and derivative transactions to be notified to so-called trade repositories. EMIR also includes additional capital and margin requirements for non-cleared trades. Further proposals (the so-called “MiFID 2” and “MAD 2” proposals) provide for, among other things, greater regulation and oversight by covering additional markets and instruments, extension of pre- and post-trade transparency and market
| | | | |
| Deutsche Bank | | Item 4: Information on the Company | | 35 |
| Annual Report 2012 on Form 20-F | | | | |
| | |
| | | | |
| | |
| | | | |
abuse rules from equities to all financial instruments, greater restrictions on operating trading platforms, and greater sanctioning powers. The MiFID 2 and MAD 2 proposals are expected to be enacted in 2013 or 2014.
Capital Adequacy Requirements
The German Banking Act and the Solvency Regulation (Solvabilitätsverordnung) issued by the Federal Ministry of Finance thereunder reflect the capital adequacy rules of the Basel 2 and 2.5 frameworks and require German banks to maintain an adequate level of regulatory capital in relation to their risk positions. Risk positions (commonly referred to as “risk-weighted assets”) comprise credit risks, market risks and operational risks (comprising, among other things, risks related to certain external factors, as well as to technical errors and errors of employees). Credit risks and operational risks must be covered with Tier 1 capital (“core capital”) and Tier 2 capital (“supplementary capital”) (together, “regulatory banking capital”). Market risk must be covered with regulatory banking capital (to the extent not required to cover credit and operational risk) and Tier 3 capital (together with regulatory banking capital, “own funds”). Under certain circumstances, the BaFin may impose capital requirements on individual banks which are more stringent than statutory requirements. For details of Deutsche Bank’s regulatory capital, see “Management Report: Risk Report: Capital Management: Capital Adequacy” on pages 169 through 177 of our Financial Report.
Responding to market concerns over the ability of banks to be able to absorb potential losses associated with sovereign debt, the Council of the European Union agreed on October 26, 2011 to require that 70 large banks in the European Economic Area including us create an exceptional and temporary capital buffer. To that effect, the relevant banks have to maintain a capital ratio of 9 % of Core Tier 1 capital against their credit, operational and market risks after accounting for market valuation of sovereign debt. The banks concerned had to attain the capital target by June 30, 2012, based on plans agreed with their respective national regulatory authority and the European Banking Authority (“EBA”). The increased capital requirements will remain in force until rescinded.
Under CRD 4, which implements the Basel 3 framework in the European Union, banks will be required, subject to certain transition periods, to maintain a minimum ratio of Tier 1 capital to risk-weighted assets of 6 % (up from currently 4 %) and a minimum ratio of Common Equity Tier 1 capital to risk-weighted assets of 4.5 % (up from currently 2 %). Common Equity Tier 1 capital consists primarily of common share capital including related share premium accounts, retained earnings and other comprehensive income, adjusted by certain deductions such as for goodwill and other intangible assets. Certain hybrid capital instruments will no longer qualify as Common Equity Tier 1 capital (formerly referred to as Core Tier 1 capital), subject to certain grandfathering provisions, and Tier 3 capital will no longer be recognized as own funds.
CRD 4 will also provide that banks shall build up a mandatory capital conservation buffer (Common Equity Tier 1 capital amounting to 2.5 % of risk-weighted assets), and authorizes national regulators to require banks building up an additional counter-cyclical buffer (Common Equity Tier 1 capital of up to another 2.5 % of risk-weighted assets) during periods of high credit growth. In addition, national regulators may require banks to build up a systemic risk buffer (Common Equity Tier 1 capital of between 1 % and 3 % of risk-weighted assets for all exposures and up to 5 % for domestic and third-country exposures) to prevent and mitigate long term non-cyclical systemic or macro-prudential risks not otherwise covered by CRD 4. Global systemically important banks (such as us) will be subject to an additional capital buffer of between 1 % and 3.5 % of risk-weighted assets which will be determined for the banks concerned based on a scoring system measuring their systemic importance. The systemic risk buffer and buffers for systemically important banks will generally not be cumulative; only the highest of these two buffers will apply. If a bank fails to build up the required capital buffers, it will be subject to restrictions on the pay-out of dividends, share buybacks and discretionary compensation payments.
The Basel 3 framework also proposes a non-risk based leverage ratio as a complement to the risk-based capital requirements. While CRD 4 will not immediately require banks to comply with a specific leverage ratio, banks will be required to report their leverage ratios for a future assessment and calibration of the leverage ratio, on which EBA shall report to the European Commission by the end of 2016.
| | | | |
| Deutsche Bank | | Item 4: Information on the Company | | 36 |
| Annual Report 2012 on Form 20-F | | | | |
| | |
| | | | |
| | |
| | | | |
Limitations on Large Exposures
The German Banking Act and the Large Exposure Regulation (Großkredit- und Millionenkreditverordnung) limit a bank’s concentration of credit risks through restrictions on large exposures (Großkredite). All exposures to a single customer (and customers connected with it) are aggregated for these purposes.
An exposure incurred in the banking book that equals or exceeds 10 % of the bank’s regulatory banking capital constitutes a banking book large exposure. A banking book and trading book exposure taken together that equals or exceeds 10 % of the bank’s own funds constitutes an aggregate book large exposure. No large exposure may exceed 25 % of the bank’s regulatory banking capital or own funds, as applicable, without BaFin approval.
Increased capital requirements apply to the amount of the large exposure exceeding the ceiling. The BaFin may waive these requirements for a transitional period.
Furthermore, total trading book exposures to a single customer (and customers affiliated with it) must not exceed five times the bank’s own funds that are not required to meet the capital adequacy requirements with respect to the banking book. Total trading book exposures to a single customer (and customers affiliated with it) in excess of the aforementioned limit are not permitted.
Consolidated Regulation and Supervision
The provisions of the German Banking Act on consolidated supervision require that each group of institutions (Institutsgruppe) taken as a whole complies with the requirements on capital adequacy and the limitations on large exposures described above. A group of institutions generally consists of a domestic bank or financial services institution, as the parent company, and all other banks, financial services institutions, investment management companies, financial enterprises, payment institutions or ancillary services enterprises in which the parent company holds more than 50 % of voting rights or on which the parent company can otherwise exert a controlling influence. Special rules apply to joint venture arrangements that result in the joint management of another bank, financial services institution, investment company, financial enterprise, bank service enterprise or payment institution by a bank and one or more third parties.
Financial groups which offer services and products in various financial sectors (banking and securities business, insurance and reinsurance business) are subject to supplementary supervision as a financial conglomerate (Finanzkonglomerat) once certain thresholds have been exceeded. The supervision on the level of the conglomerate is exercised by the BaFin. It comprises requirements regarding own funds, risk concentration, risk management, transactions within the conglomerate and organizational matters. We are a financial conglomerate and therefore are required to report to the BaFin and the Bundesbank capital adequacy requirements and risk concentrations also on a conglomerate level. In addition, we are required to report significant conglomerate internal transactions as well as significant risk concentrations.
Liquidity Requirements
The German Banking Act requires German banks and certain financial services institutions to invest their funds so as to maintain adequate liquidity at all times. The Liquidity Regulation (Liquiditätsverordnung) provides for minimum liquidity requirements based upon a comparison of the remaining terms of certain assets and liabilities. It requires maintenance of a ratio (Liquiditätskennzahl or “liquidity ratio”) of liquid assets to liquidity reductions expected during the month following the date on which the ratio is determined of at least one. The Liquidity Regulation also allows banks and financial services institutions subject to it to use their own methodology and procedures to measure and manage liquidity risk if the BaFin has approved such methodology and procedures. The liquidity ratio and estimated liquidity ratios for the next eleven months must be reported to the BaFin on a monthly basis. Generally, the liquidity requirements do not apply on a consolidated basis. The BaFin may impose on individual banks liquidity requirements which are more stringent than the general statutory requirements if such bank’s continuous liquidity would otherwise not be ensured.
| | | | |
| Deutsche Bank | | Item 4: Information on the Company | | 37 |
| Annual Report 2012 on Form 20-F | | | | |
| | |
| | | | |
| | |
| | | | |
Under CRD 4, more stringent liquidity standards are expected to apply from 2015 onwards. Subject to certain transition periods, banks will be required to observe a certain liquidity coverage ratio (LCR), i.e., the ratio of the bank’s unencumbered high-quality liquid assets (HQLA) that can be converted into cash easily and immediately in private markets to the bank’s liquidity needs for a 30 calendar day liquidity stress scenario. While Basel 3 also contains proposals regarding a net stable funding ratio (NSFR), i.e., the ratio of long-term assets to long term, stable funding, CRD 4 will not immediately implement these proposals. Instead, it calls on the European Commission to report to the European Parliament and the Council of the European Union and, if applicable, submit a legislative proposal by the end of 2016.
Financial Statements and Audits
As required by the German Commercial Code (Handelsgesetzbuch – HGB), we prepare our non-consolidated financial statements in accordance with German GAAP. Our consolidated financial statements are prepared in accordance with International Financial Reporting Standards, and our compliance with capital adequacy requirements and large exposure limits is determined solely based upon such consolidated financial statements.
Under German law, we are required to be audited annually by a certified public accountant (Wirtschaftsprüfer). The accountant is appointed at the shareholders’ meeting. However, the supervisory board mandates the accountant and supervises the audit. The BaFin must be informed of and may reject the accountant’s appointment. The German Banking Act requires that a bank’s auditor informs the BaFin of any facts that come to the accountant’s attention which would lead it to refuse to certify or to limit its certification of our annual financial statements or which would adversely affect our financial position. The auditor is also required to notify the BaFin in the event of a material breach by management of the articles of association or of any other applicable law. The auditor is required to prepare a detailed and comprehensive annual audit report (Prüfungsbericht) for submission to the bank’s supervisory board, the BaFin and the Bundesbank.
Investigative, Enforcement and Restructuring Powers
Investigations and Official Audits
The BaFin conducts audits of banks on a random basis, as well as for cause. The BaFin is also responsible for auditing internal risk models used by a bank for regulatory purposes. It may revoke the approval to use such models or impose conditions on their continued use for regulatory purposes.
The BaFin may require a bank to furnish information and documents in order to ensure that the bank is complying with the German Banking Act and applicable regulations. The BaFin may conduct investigations without having to state a reason therefor. Such investigations may also take place at a foreign entity that is part of a bank’s group for regulatory purposes. Investigations of foreign entities are limited to the extent that the law of the jurisdiction where the entity is located restricts such investigations.
The BaFin may attend meetings of a bank’s supervisory board and shareholders meetings. It also has the authority to require that such meetings be convened.
Enforcement Powers
The BaFin has a wide range of enforcement powers in the event it discovers any irregularities. It may remove the bank’s managers from office, transfer their responsibilities in whole or in part to a special commissioner or prohibit them from exercising their current managerial capacities. The BaFin may also cause the removal of members of the supervisory board of a bank if they are not reliable, lack the necessary expertise or violate their duties.
| | | | |
| Deutsche Bank | | Item 4: Information on the Company | | 38 |
| Annual Report 2012 on Form 20-F | | | | |
| | |
| | | | |
| | |
| | | | |
If a bank’s own funds are inadequate, if a bank does not meet the liquidity requirements, or if, based upon the circumstances, the BaFin concludes that a bank will likely not be able to continuously fulfill the statutory capital or liquidity requirements, the BaFin may take a variety of measures in order to improve the capitalization or liquidity of the bank. In particular, the BaFin may prohibit or restrict a bank from distributing profits, taking balance sheet measures in order to offset an annual loss or to generate distributable profits, making payments on instruments that constitute own funds if such payments are not covered by the bank’s annual profit, or extending credit. The BaFin may also order a bank to adopt certain measures to reduce risks if such risks result from particular types of transactions or systems used by the bank. Generally, these enforcement powers also apply to the parent bank of a group of institutions in the event that the own funds of the group are inadequate on a consolidated basis.
If a bank is in danger of defaulting on its obligations to creditors, the BaFin may take emergency measures to avert default. These emergency measures may include:
| — | | issuing instructions relating to the management of the bank; |
| — | | prohibiting the acceptance of deposits and the extension of credit; |
| — | | prohibiting or restricting the bank’s managers from carrying on their functions; |
| — | | prohibiting payments and disposals of assets; |
| — | | closing the bank’s customer services; and |
| — | | prohibiting the bank from accepting any payments other than payments of debts owed to the bank. |
In order to ensure compliance with applicable supervisory law, the BaFin may also appoint a special representative and delegate the responsibilities and powers of corporate bodies of a bank to such special representative if certain conditions are met.
If these measures are inadequate, the BaFin may revoke the bank’s license. Only the BaFin may file an application for the initiation of insolvency proceedings against a bank.
Violations of the Banking Act may result in criminal and administrative penalties.
Restructuring Powers
The BaFin also has powers to effect or facilitate the stabilization, reorganization or restructuring of banks.
If, based upon the circumstances, it is likely that a bank will not be able to continuously fulfill the statutory capital or liquidity requirements, the bank may submit a stabilization plan to the BaFin. A stabilization plan may in particular provide for the taking up of new loans or other financing that will have priority over the claims of existing creditors if insolvency proceedings are opened within three years following the commencement of the stabilization proceedings. The aggregate amount of such loans may not exceed 10 % of the bank’s own funds. If the BaFin considers the stabilization plan to be sustainable, it applies to the court for the opening of a stabilization proceeding. If the statutory requirements are met, the court appoints a stabilization advisor who oversees the implementation of the stabilization plan and has the authority to issue orders to the management of the bank.
If a bank considers a stabilization proceeding to be futile, it may initiate reorganization proceedings, provided that the bank has systemic relevance and is at risk to become insolvent. The bank must then submit a reorganization plan to the BaFin. This reorganization plan may in particular provide for debt-to-equity swaps, contributions in kind, capital increases and reductions, an exclusion of subscription rights and the spin-off of parts of the bank. Upon application by the BaFin, the court must order the opening of reorganization proceedings if the statutory requirements are met. If reorganization proceedings are opened, each class of creditors and the shareholders resolve independently on the adoption of the restructuring plan. Under certain conditions, the reorganization plan may also be implemented without the approval of a class of creditors or the shareholders (i.e., it can be forced upon dissenting creditors or shareholders).
| | | | |
| Deutsche Bank | | Item 4: Information on the Company | | 39 |
| Annual Report 2012 on Form 20-F | | | | |
| | |
| | | | |
| | |
| | | | |
The BaFin may also restructure a bank that has systemic relevance and is at risk to become insolvent by transferring assets and liabilities of such bank in whole or in part to another bank in Germany including a so-called bridge bank owned by the Restructuring Fund (Restrukturierungsfonds) managed by the Federal Agency for Financial Market Stabilization (Bundesanstalt für Finanzmarktstabilisierung). The Restructuring Fund is financed by non-tax deductible annual contributions of all banks that hold a German banking license, subject to certain limited exceptions. The amount of contributions depends on the business volume, size and interconnectedness in the financial market of the respective banks.
Recovery and Resolution Planning, Separation of Proprietary Trading Activities by Universal Banks
On November 4, 2011, the Financial Stability Board (FSB) published a list of 29 banks (including us) which have been identified by the FSB to be of global systemic importance and which shall, among other things, have in place recovery and resolution plans to facilitate their restructuring or resolution without government support. The FSB also published so-called “Key Attributes” containing further details of recovery and resolution planning for banks. On June 6, 2012, the European Commission adopted a legislative proposal for a directive establishing a framework for the recovery and resolution of credit institutions and investment firms that subjects every bank in the European Union to recovery and resolution planning and an assessment of their resolvability and defines a set of resolution tools for the competent authorities including the power to write down debt, or to convert debt into equity (so-called “bail-in”) from January 1, 2018 onwards.
On February 6, 2013, the German Government adopted a Draft Bill on the Separation of Risks and Recovery and Resolution Planning for Credit Institutions and Banking Groups (the “Draft Bill”). The Draft Bill contains rules on the preparation of recovery and resolutions plans for banks which are of systemic importance at least for the German market (such as us), and provides for powers of the German banking regulator BaFin to eliminate impediments to a bank’s resolution.
Furthermore, the Draft Bill contains provisions that implement certain recommendations of an expert group established by the European Commission and chaired by Erkki Liikanen, Governor of the Bank of Finland. The Liikanen Group proposed in its a final report dated October 2, 2012 that banks be required to separate activities associated with increased risks, such as proprietary trading of securities and derivatives, from their deposit-taking business, provided that certain thresholds are exceeded. In line with this, the Draft Bill provides that deposit-taking banks and their affiliates would be prohibited from engaging in proprietary trading that does not constitute a service for others, high-frequency trading (with the exception of market-making activities), and credit or guarantee transactions with hedge funds and comparable enterprises, unless such activities are transferred to a separate legal entity. The separation requirement applies if certain thresholds are exceeded, and if the Draft Bill is enacted as drafted, we would exceed such thresholds. In addition, it authorizes the BaFin to prohibit the deposit-taking bank and its affiliates, on a case-by-case basis, from engaging in market-making and other activities that are comparable to the activities prohibited by law, if these activities may put the solvency of the deposit-taking bank or any of its affiliates at risk. In the event that the BaFin orders such a prohibition, the respective activities must be discontinued or transferred to a separate legal entity. The separate legal entity may be established in the form of an investment firm or a bank and may be part of the same group as the deposit-taking bank. However, it must be economically and organizationally independent from the deposit-taking bank and its (other) affiliates, and it has to comply with enhanced risk management requirements.
Deposit Protection in Germany
The Deposit Guarantee Act
The Law on Deposit Insurance and Investor Compensation (Einlagensicherungs- und Anlegerentschädigungsgesetz, the “Deposit Guarantee Act”) provides for a mandatory deposit insurance system in Germany. It requires that each German bank participate in one of the licensed government-controlled investor compensation institutions (Entschädigungseinrichtungen). Entschädigungseinrichtung deutscher Banken GmbH acts as the investor compensation institution for private sector banks such as us, collects and administers the contributions of the member banks, and settles the compensation claims of investors in accordance with the Deposit Guarantee Act.
| | | | |
| Deutsche Bank | | Item 4: Information on the Company | | 40 |
| Annual Report 2012 on Form 20-F | | | | |
| | |
| | | | |
| | |
| | | | |
Investor compensation institutions are liable only for obligations resulting from deposits and securities transactions that are denominated in euro or the currency of a contracting state to the Agreement on the European Economic Area. They are not liable for obligations represented by instruments in bearer form or negotiable by endorsement. Claims of certain entities, such as banks, financial institutions (Finanzinstitute), insurance companies, investment funds, the Federal Republic of Germany, the German federal states, municipalities and medium-sized and large corporations, are not protected.
The maximum liability of an investor compensation institution to any one creditor is limited to an amount of€ 100,000, and to 90 % of any one creditor’s aggregate claims arising from securities transactions up to an amount of€ 20,000.
Banks are obliged to make annual contributions to the investor compensation institution in which they participate. Annual contributions payable to our investor compensation institution are assessed based on a scoring system measuring the creditworthiness of the contributing banks.
An investor compensation institution must levy special contributions on the banks participating therein or take up loans, whenever it is necessary to settle compensation claims by such institution in accordance with the Deposit Guarantee Act. There is no absolute limit on such special contributions. The investor compensation institution may exempt a bank from special contributions in whole or in part if full payments of such contributions are likely to render such bank unable to repay its deposits or perform its obligations under securities transactions. The amount of such contribution will then be added proportionately to the special contributions levied on the other participating banks.
Voluntary Deposit Protection System
Liabilities to creditors that are not covered under the Deposit Guarantee Act may be covered by one of the various protection funds set up by the banking industry on a voluntary basis. We take part in the Deposit Protection Fund of the Association of German Banks (Einlagensicherungsfonds des Bundesverbandes deutscher Banken e. V.). The Deposit Protection Fund covers liabilities to customers up to an amount equal to 30 % of the bank’s core capital and supplementary capital (to the extent that supplementary capital does not exceed 25 % of core capital). This limit will be reduced to 20 % of the bank’s applicable capital base from January 1, 2015 onwards, to 15 % from January 1, 2020 onwards and to 8.75 % from January 1, 2025 onwards. Liabilities to other banks and other specified institutions, obligations of banks represented by instruments in bearer form and covered bonds in registered form (Namenspfandbriefe) are not covered. To the extent the Deposit Protection Fund makes payments to customers of a bank, it will be subrogated to their claims against the bank.
Banks that participate in the Deposit Protection Fund make annual contributions to the fund based on their liabilities to customers, and may be required to make special contributions up to an amount of 50 % of their annual contributions to the extent requested by the Deposit Protection Fund to enable it to fulfill its purpose. If one or more German banks are in financial difficulties, we may therefore participate in their restructuring even where we have no business relationship or strategic interest, in order to avoid making special contributions to the Deposit Protection Fund in case of an insolvency of such bank or banks, or we may be required to make such special contributions. Following financial difficulties of various German banks, the annual contributions to the Deposit Protection Fund were doubled from 2009 onwards.
Proposed Revision of the EU Directives on Deposit Guarantee and Investor Protection Schemes
On July 12, 2010, the European Commission initiated a revision of the European Union directives on deposit guarantee and investor protection schemes, the adoption of which is currently pending. The purpose of the revision is among other things to improve the funding of these schemes, to expand the scope of eligible deposits and to provide for a faster disbursement of funds when the protection scheme is called upon. The relevant European Union authorities aim at reaching political agreement on the proposed revisions before summer 2013. Pursuant to this proposal, deposit protection schemes must have 1.5 % of the total covered deposits at hand, and investor compensation schemes 0.5 % of the value of funds and financial instruments covered by
| | | | |
| Deutsche Bank | | Item 4: Information on the Company | | 41 |
| Annual Report 2012 on Form 20-F | | | | |
| | |
| | | | |
| | |
| | | | |
the investor compensation scheme that are held by, deposited with or managed by investment firms and collective investment schemes. The proposal also provides for a ten year transition period to accumulate the respective funds. In the event that the directives on deposit guarantee and investor protection schemes are amended as proposed, the costs for deposit guarantee and investor protection schemes (and thus our contributions to these schemes) will increase substantially.
Regulation and Supervision in the European Economic Area
Since 1989 the European Union has enacted a number of regulations and directives to create a single European Union-wide market with almost no internal barriers on banking and financial services. The Agreement on the European Economic Area extends this single market to Iceland, Liechtenstein and Norway. Within this market our branches generally operate under the so-called “European Passport”. Under the European Passport, our branches are subject to regulation and supervision primarily by the BaFin. The authorities of the host country are responsible for the regulation and supervision of the liquidity requirements and the financial markets of the host country. They also retain responsibility with regard to the provision of securities services within the territory of the host country.
On November 24, 2010, the European Union enacted regulations to further integrate the existing national supervisory authorities into a European System of Financial Supervision. A European Systemic Risk Board (“ESRB”) was established and the independent advisory committees to the European Commission for banks, insurance companies and securities markets which had existed since 2004 were transformed into new European authorities: the European Banking Authority (“EBA”), the European Insurance and Occupational Pensions Authority (“EIOPA”) and the European Securities and Markets Authority (“ESMA”).
The ESRB is responsible for the macro-prudential oversight of the financial system within the EU. It will in particular collect and analyze all relevant information, identify systemic risks and issue warnings and recommendations for remedial action as appropriate. The secretariat of the ESRB is provided by the European Central Bank. The tasks of EBA and the other new authorities are to further integrate and harmonize the work of the relevant national supervisory authorities and to ensure a consistent application of EU law. To that effect they shall in particular develop technical standards for supervision, and help develop regulatory standards, which will become effective if the European Commission endorses them. They shall also issue guidelines and recommendations for supervisory practices and coordinate the work of national authorities in emergency situations where the orderly functioning or integrity of the financial markets or the stability of the financial system in the EU is jeopardized. In such case, the EBA and the other new authorities may give instructions to national authorities and, in certain circumstances, directly to banks and other financial institutions, to take remedial measures.
On September 12, 2012, the European Commission published legislative proposals for a European banking union for eurozone member states and other participating member states, with the European Central Bank (“ECB”) carrying out key supervisory functions (single supervisory mechanism, “SSM”). On December 13, 2012, the Council of the European Union reached agreement on this proposal, pursuant to which the ECB will have direct oversight over all eurozone and other participating member states’ banks. National supervisors would remain in charge of tasks not conferred on the ECB. On March 19, 2013, the European Parliament, the Council of the European Union and the European Commission reached political agreement on the SSM legislation. According to current plans, the ECB would assume its supervisory tasks in mid-2014.
Regulation and Supervision in the United States
Our operations are subject to extensive federal and state banking and securities regulation and supervision in the United States. We engage in U.S. banking activities directly through our New York branch. We also control U.S. banking subsidiaries, including Deutsche Bank Trust Company Americas (“DBTCA”), and U.S. broker-dealers, such as Deutsche Bank Securities Inc., U.S. nondeposit trust companies and nonbanking subsidiaries.
| | | | |
| Deutsche Bank | | Item 4: Information on the Company | | 42 |
| Annual Report 2012 on Form 20-F | | | | |
| | |
| | | | |
| | |
| | | | |
On July 21, 2010, the United States enacted the Dodd-Frank Wall Street Reform and Consumer Protection Act (the “Dodd-Frank Act”), which provides a broad framework for significant regulatory changes that will extend to almost every area of U.S. financial regulation. Implementation of the Dodd-Frank Act will require further detailed rulemaking over several years by different U.S. regulators, including the Department of the Treasury, the Federal Reserve Board, the Securities and Exchange Commission (SEC), the Federal Deposit Insurance Corporation (FDIC), the Commodity Futures Trading Commission (CFTC) and the newly created Financial Stability Oversight Council (Council), and uncertainty remains about the final details, timing and impact of many of the rules.
The Dodd-Frank Act’s Volcker Rule limits the ability of banking entities, except solely outside the United States in the case of non-U.S. banking entities (such as Deutsche Bank AG), to sponsor or invest in private equity or hedge funds and to engage in certain types of proprietary trading unrelated to serving clients. U.S. regulators have jointly and separately proposed rules implementing the statute, but final rules have not yet been issued.
The Dodd-Frank Act also provides regulators with tools to provide greater capital, leverage and liquidity requirements and other prudential standards, particularly for financial institutions that pose significant systemic risk. U.S. regulators will also be able to restrict the size and growth of systemically significant non-bank financial companies and large interconnected bank holding companies and will be required to impose bright-line debt-to-equity ratio limits on financial companies that the Council determines pose a grave threat to financial stability if the Council determines that the imposition of the limit is necessary to minimize the risk.
With respect to prudential standards, on December 14, 2012, the Federal Reserve published for comment proposed rules (“FBO Proposed Rules”) that set forth how the U.S. operations of foreign banking organizations (“FBOs”), such as Deutsche Bank, would be required to be structured in the U.S., as well as the enhanced prudential standards that would apply to the FBO’s U.S. operations.
Under the FBO Proposed Rules, large FBOs with greater than U.S.$ 50 billion in assets, such as us, would be required to create a separately capitalized top-tier U.S. intermediate holding company (“IHC”) that would hold all of the FBO’s U.S. bank and nonbank subsidiaries, if the FBO has U.S.$ 10 billion or more in U.S. assets, excluding the assets held by its U.S. branch network. The proposed rules would permit an FBO subject to the IHC requirement to request permission from the Federal Reserve to establish multiple IHCs or use an alternative organizational structure. An IHC would be subject, on a consolidated basis, to U.S. capital, liquidity and other enhanced prudential standards, such as stress testing and capital planning, and the Federal Reserve would have the authority to examine any IHC and any subsidiary of an IHC. An FBO’s U.S. branch and agency network is not subject to the requirement to be held beneath an IHC; however, the U.S. branch network of the FBO (and in certain cases, the combined U.S. operations of the FBO) would be subject to certain liquidity requirements, as well as other specific enhanced prudential standards, such as single counterparty credit limits and asset maintenance requirements. Additionally, the FBO Proposed Rules will place requirements on the FBO itself related to the adequacy and reporting of the FBO’s home country capital and stress testing results. In addition, the FBO Proposed Rules would also require the Federal Reserve Board to implement prescribed restrictions and penalties against the FBO and its U.S. operations and certain of its officers and directors, if the FBO and/or its U.S. operations do not meet certain requirements, and would authorize the termination of U.S. operations under certain circumstances.
The Federal Reserve Board proposed that the FBO Proposed Rules would become effective in July 2015 and is currently accepting comments on the proposed rules until April 30, 2013. It is uncertain when, and in what form, the rule will be finalized.
| | | | |
| Deutsche Bank | | Item 4: Information on the Company | | 43 |
| Annual Report 2012 on Form 20-F | | | | |
| | |
| | | | |
| | |
| | | | |
Furthermore, the Dodd-Frank Act provides for an extensive framework for the regulation of over-the-counter (OTC) derivatives, including mandatory clearing, exchange trading and transaction reporting of certain OTC derivatives, as well as rules regarding the registration of, and capital, margin and business conduct standards for, swap dealers and major swap participants. The Dodd-Frank Act also requires broader regulation of hedge funds and private equity funds, as well as credit rating agencies, and imposes new requirements with respect to asset securitization activities.
The Dodd-Frank Act also establishes a new regulatory framework and enhanced regulation for several other areas, including but not limited to the following. Under the Dodd-Frank Act and implementing regulations, a new regime for the orderly liquidation of systemically significant financial companies is established, which authorizes assessments on financial institutions that have U.S.$ 50 billion or more in consolidated assets to repay outstanding debts owed to the Treasury in connection with a liquidation of a systemically significant financial company under the new insolvency regime. In addition, the Dodd-Frank Act requires U.S. regulatory agencies to prescribe regulations with respect to incentive-based compensation at financial institutions in order to prevent inappropriate behavior that could lead to a material financial loss. Other provisions require issuers with securities listed on U.S. stock exchanges, which may include foreign private issuers such as us, to establish a “clawback” policy to recoup previously awarded executive compensation in the event of an accounting restatement. Dodd-Frank also grants the SEC discretionary rule-making authority to impose a new fiduciary standard on brokers, dealers and investment advisers, and expands the extraterritorial jurisdiction of U.S. courts over actions brought by the SEC or the United States with respect to violations of the antifraud provisions of the Securities Act of 1933, the Securities Exchange Act of 1934 and the Investment Advisers Act of 1940.
Implementation of the Dodd-Frank Act and related final regulations could result in additional costs or limit or restrict the way we conduct our business. Although uncertainty remains about many of the details, impact and timing of these reforms, we expect that there may be significant costs and limitations on our businesses resulting from certain regulatory initiatives, including the proposed regulations to implement the Volcker Rule limitations.
Regulatory Authorities
We and Deutsche Bank Trust Corporation, our wholly owned subsidiary, are bank holding companies under the U.S. Bank Holding Company Act of 1956, as amended (the Bank Holding Company Act), by virtue of, among other things, our ownership of DBTCA. As a result, we and our U.S. operations are subject to regulation, supervision and examination by the Federal Reserve Board as our U.S. “umbrella supervisor”. Until February 1, 2012, Taunus Corporation was our top-tier U.S. bank holding company subsidiary. On that date, we reorganized our ownership of our U.S. banking subsidiaries so that they are no longer held through Taunus Corporation, which is thus no longer a bank holding company, and Deutsche Bank Trust Corporation is now our top-tier U.S. bank holding company subsidiary.
DBTCA is a New York state-chartered bank whose deposits are insured by the FDIC to the extent permitted by law. DBTCA is subject to regulation, supervision and examination by the Federal Reserve Board and the New York State Department of Financial Services and to relevant FDIC regulation. Deutsche Bank Trust Company Delaware is a Delaware state-chartered bank which is subject to regulation, supervision and examination by the FDIC and the Office of the State Bank Commissioner of Delaware. Deutsche Bank’s New York branch is supervised by the Federal Reserve Board and the New York State Department of Financial Services. Deutsche Bank’s federally chartered nondeposit trust companies are subject to regulation, supervision and examination by the Office of the Comptroller of the Currency. Certain of Deutsche Bank’s subsidiaries are also subject to regulation, supervision and examination by state banking regulators of certain states in which they conduct banking operations.
| | | | |
| Deutsche Bank | | Item 4: Information on the Company | | 44 |
| Annual Report 2012 on Form 20-F | | | | |
| | |
| | | | |
| | |
| | | | |
Restrictions on Activities
As described below, federal and state banking laws and regulations restrict our ability to engage, directly or indirectly through subsidiaries, in activities in the United States. We are required to obtain the prior approval of the Federal Reserve Board before directly or indirectly acquiring the ownership or control of more than 5 % of any class of voting shares of U.S. banks, certain other depository institutions, and bank or depository institution holding companies. Under applicable U.S. federal banking law, our U.S. banking operations are also restricted from engaging in certain “tying” arrangements involving products and services.
Our two U.S. FDIC-insured bank subsidiaries are subject to requirements and restrictions under federal and state law, including requirements to maintain reserves against deposits, restrictions on the types and amounts of loans that may be made and the interest that may be charged thereon, and limitations on the types of investments that may be made and the types of services that may be offered.
In addition to the business of banking, and managing or controlling banks, so long as we are a financial holding company under U.S. law, we may also engage in nonbanking activities in the United States that are financial in nature, or incidental or complementary to such financial activity, including securities, merchant banking, insurance and other financial activities, subject to certain limitations on the conduct of such activities and to prior regulatory approval in some cases. As a non-U.S. bank, we are generally authorized under U.S law and regulations to acquire a non-U.S. company engaged in nonfinancial activities as long as the company’s U.S. operations do not exceed certain thresholds and certain other conditions are met.
Our status as a financial holding company, and our resulting ability to engage in a broader range of nonbanking activities are dependent on Deutsche Bank AG and our two insured U.S. depository institutions being “well capitalized” and “well managed” (as defined by Federal Reserve Board regulations) and upon our insured U.S. depository institutions meeting certain requirements under the Community Reinvestment Act. In order to meet the “well capitalized” test, both Deutsche Bank on a consolidated basis and our U.S. depository institutions on a stand-alone basis are required to maintain a Tier 1 risk-based capital ratio of at least 6 % and a total risk-based capital ratio of at least 10 %.
State-chartered banks (such as DBTCA) and state-licensed branches and agencies of foreign banks (such as our New York branch) may not, with certain exceptions that require prior regulatory approval, engage as a principal in any type of activity not permissible for their federally chartered or licensed counterparts. In addition, DBTCA and Deutsche Bank Trust Company Delaware are subject to their respective state banking laws pertaining to legal lending limits. Likewise, the United States federal banking laws also subject state branches and agencies to the same single-borrower lending limits that apply to federal branches or agencies, which are substantially similar to the lending limits applicable to national banks. These single-borrower lending limits are based on the worldwide capital of the entire foreign bank (i.e., Deutsche Bank AG in the case of the New York branch).
The Federal Reserve Board may terminate the activities of any U.S. office of a foreign bank if it determines that the foreign bank is not subject to comprehensive supervision on a consolidated basis in its home country or that there is reasonable cause to believe that such foreign bank or its affiliate has violated the law or engaged in an unsafe or unsound banking practice in the United States or, for a foreign bank that presents a risk to the stability of the United States financial system, the home country of the foreign bank has not adopted, or made demonstrable progress toward adopting, an appropriate system of financial regulation to mitigate such risk.
| | | | |
| Deutsche Bank | | Item 4: Information on the Company | | 45 |
| Annual Report 2012 on Form 20-F | | | | |
| | |
| | | | |
| | |
| | | | |
The Dodd-Frank Act removed a longstanding prohibition on the payment of interest on demand deposits by our FDIC-insured bank subsidiaries and our New York branch. In addition, the Dodd-Frank Act requires that the lending limits applicable to our FDIC-insured state-chartered bank subsidiaries take into account credit exposures arising from derivative transactions, and that the lending limits applicable to our New York branch take into account both credit exposures arising from derivative transactions as well as securities borrowing and lending transactions and repurchase and reverse repurchase agreements with counterparties. An interim final rule applicable to our New York branch was issued by the Office of the Comptroller of the Currency in June 2012. Final rules applicable to our FDIC-insured bank subsidiaries were issued and took effect by January 21, 2013.
Also, under the so-called swap “push-out” provisions of the Dodd-Frank Act, the derivatives activities of FDIC-insured banks and U.S. branch offices of foreign banks will be restricted or prohibited, which may necessitate a restructuring of how we conduct our derivatives activities. In addition, regulations which the Council, or the Consumer Financial Protection Bureau established under the Dodd-Frank Act, may adopt could affect the nature of the activities which a bank (including our FDIC-insured bank subsidiaries and our New York branch) may conduct, and may impose restrictions and limitations on the conduct of such activities.
There are various qualitative and quantitative restrictions on the extent to which we and our nonbank subsidiaries can borrow or otherwise obtain credit from our U.S. banking subsidiaries or engage in certain other transactions involving those subsidiaries. In general, these transactions must be on terms that would ordinarily be offered to unaffiliated entities, must be secured by designated amounts of specified collateral and are subject to volume limitations. These restrictions also apply to certain transactions of our New York branch with our U.S. broker-dealers and certain of our other affiliates. As of July 2012, the Dodd-Frank Act subjects credit exposure arising from derivative transactions, securities borrowing and lending transactions, and repurchase/reverse repurchase agreements to these collateral and volume limitations. The Federal Reserve Board has yet to issue a proposed and/or final rule on how such restrictions must be instituted by FDIC-insured banks and U.S. branches of foreign banking organizations.
A major focus of U.S. governmental policy relating to financial institutions is aimed at preventing money laundering and terrorist financing and compliance with economic sanctions in respect of designated countries or activities. Failure of an institution to have policies and procedures and controls in place to prevent, detect and report money laundering and terrorist financing could in some cases have serious legal, financial and reputational consequences for the institution.
New York Branch
Our New York branch is licensed by the New York Superintendent of Financial Services to conduct a commercial banking business and is required to maintain eligible high-quality assets with banks in the State of New York (up to a maximum of U.S.$ 100 million of assets pledged so long as the New York branch remains “well-rated” by the New York State Superintendent of Financial Services). Should our New York branch cease to be “well-rated”, we may need to maintain substantial additional amounts of eligible assets. The Superintendent of Financial Services may also establish asset maintenance requirements for branches of foreign banks. Currently, no such requirement has been imposed upon our New York branch.
| | | | |
| Deutsche Bank | | Item 4: Information on the Company | | 46 |
| Annual Report 2012 on Form 20-F | | | | |
| | |
| | | | |
| | |
| | | | |
The New York State Banking Law authorizes the Superintendent of Financial Services to take possession of the business and property of a New York branch of a foreign bank under certain circumstances, generally involving violation of law, conduct of business in an unsafe manner, impairment of capital, suspension of payment of obligations, or initiation of liquidation proceedings against the foreign bank at its domicile or elsewhere. In liquidating or dealing with a branch’s business after taking possession of a branch, only the claims of depositors and other creditors which arose out of transactions with a branch are to be accepted by the Superintendent of Financial Services for payment out of the business and property of the foreign bank in the State of New York, without prejudice to the rights of the holders of such claims to be satisfied out of other assets of the foreign bank. After such claims are paid, the Superintendent of Financial Services will turn over the remaining assets, if any, to the foreign bank or its duly appointed liquidator or receiver.
Deutsche Bank Trust Company Americas
The Federal Deposit Insurance Corporation Improvement Act of 1991 (referred to as FDICIA) provides for extensive regulation of depository institutions (such as DBTCA and its direct and indirect parent companies), including requiring federal banking regulators to take “prompt corrective action” with respect to FDIC-insured banks that do not meet minimum capital requirements. As an insured bank’s capital level declines and the bank falls into lower categories (or if it is placed in a lower category by the discretionary action of its supervisor), greater limits are placed on its activities and federal banking regulators are authorized (and, in many cases, required) to take increasingly more stringent supervisory actions, which could ultimately include the appointment of a conservator or receiver for the bank (even if it is solvent). In addition, FDICIA generally prohibits an FDIC-insured bank from making any capital distribution (including payment of a dividend) or payment of a management fee to its holding company if the bank would thereafter be undercapitalized. If an insured bank becomes “undercapitalized”, it is required to submit to federal regulators a capital restoration plan guaranteed by the bank’s holding company. Since the enactment of FDICIA, both of our U.S. insured banks have been categorized as “well capitalized,” the highest capital category under applicable regulations.
DBTCA, like other FDIC-insured banks, is required to pay assessments to the FDIC for deposit insurance under the FDIC’s Deposit Insurance Fund (calculated using the FDIC’s risk-based assessment system). As a result of losses incurred by the Deposit Insurance Fund on account of current financial market conditions, the amount of these assessments has been increasing. The FDIC authorized the imposition of special assessments of five basis points on each FDIC-insured institution’s assets minus its Tier 1 capital (subject to a cap of 10 basis points of an institution’s domestic deposits). The first special assessment was collected on September 30, 2009. Instead of imposing additional special assessments, the FDIC issued a regulation that required FDIC-insured institutions to prepay on December 30, 2009 their estimated quarterly risk-based assessments for the fourth quarter of 2009 and for all of 2010, 2011 and 2012, with institutions accounting for the prepayment as a prepaid expense (an asset). The Dodd-Frank Act changes the FDIC deposit insurance assessment framework (the amounts paid by FDIC-insured institutions into the deposit insurance fund of the FDIC), primarily by basing assessments on an FDIC-insured institution’s total assets less tangible equity rather than U.S. domestic deposits, which is expected to shift a greater portion of the aggregate assessments to large FDIC-insured institutions.
The FDIC’s basic amount of deposit insurance is U.S.$ 250,000. Although the Dodd-Frank Act provided for unlimited deposit insurance for certain noninterest-bearing transaction accounts through December 31, 2012, deposit accounts that provide for unlimited deposit insurance are no longer available.
| | | | |
| Deutsche Bank | | Item 4: Information on the Company | | 47 |
| Annual Report 2012 on Form 20-F | | | | |
| | |
| | | | |
| | |
| | | | |
Other
In the United States, our U.S.-registered broker-dealers are regulated by the SEC. Broker-dealers are subject to regulations that cover all aspects of the securities business, including sales methods, trade practices among broker-dealers, use and safekeeping of customers’ funds and securities, capital structure, recordkeeping, the financing of customers’ purchases and the conduct of directors, officers and employees.
Our principal U.S. SEC-registered broker-dealer subsidiary, Deutsche Bank Securities Inc., is a member of the New York Stock Exchange and is regulated by the Financial Industry Regulatory Authority (FINRA) and the individual state securities authorities in the states in which it operates. The U.S. government agencies and self-regulatory organizations, as well as state securities authorities in the United States having jurisdiction over our U.S. broker-dealer affiliates, are empowered to conduct administrative proceedings that can result in censure, fine, the issuance of cease-and-desist orders or the suspension or expulsion of a broker-dealer or its directors, officers or employees.
Under the Dodd-Frank Act, with certain exceptions, our entities that are swap dealers, security-based swap dealers, major swap participants or major security-based swap participants will be required to register with the SEC or CFTC, or both, and will become subject to the requirements as to capital, margin, business conduct, recordkeeping and other requirements applicable to such entities. The details of these requirements will be established through numerous regulations to be issued by various U.S. regulatory authorities. We were required to provisionally register, subject to certain restrictions, at least one subsidiary as a swap dealer and provisionally registered Deutsche Bank AG and DB Energy Trading LLC effective on December 31, 2012. At a future date, we will be required to register one or more subsidiaries as security-based swap dealers with the SEC and additional subsidiaries as swap dealers with the CFTC and may be required to register certain subsidiaries as CFTC-regulated major swap participants and/or SEC-regulated major security-based swap participants.
Organizational Structure
We operate our business along the structure of our five corporate divisions. Deutsche Bank AG is the direct or indirect holding company for our subsidiaries. The following table sets forth the significant subsidiaries we own, directly or indirectly as of December 31, 2012. We used the three-part test set out in Section 1-02 (w) of Regulation S-X under the U.S. Securities Exchange Act of 1934 to determine significance. We do not have any other subsidiaries we believe are material based on other, less quantifiable, factors.
We own 100 % of equity and voting interests in these subsidiaries, except for Deutsche Postbank AG, of which we own shares representing approximately 94.1 % of equity and voting rights. Further detail is included in Note 04 “Acquisitions and Dispositions”. These subsidiaries prepare financial statements as of December 31, 2012 and are included in our consolidated financial statements. Their principal countries of operation are the same as their countries of incorporation.
| | | | |
| Deutsche Bank | | Item 4A: Unresolved Staff Comments | | 48 |
| Annual Report 2012 on Form 20-F | | | | |
| | |
| | | | |
| | |
| | | | |
| | |
Subsidiary | | Place of Incorporation |
Taunus Corporation1 | | Delaware, United States |
Deutsche Bank Securities Inc.2 | | Delaware, United States |
German American Capital Corporation3 | | Delaware, United States |
| | |
Deutsche Bank Trust Corporation4 | | New York, United States |
Deutsche Bank Trust Company Americas5 | | New York, United States |
| | |
Deutsche Bank Luxembourg S.A.6 | | Luxembourg |
| | |
DWS Investment GmbH7 | | Frankfurt am Main, Germany |
| | |
Deutsche Bank Privat- und Geschäftskunden Aktiengesellschaft8 | | Frankfurt am Main, Germany |
| | |
DB Finanz-Holding GmbH9 | | Frankfurt am Main, Germany |
DB Valoren S.à r.l.10 | | Luxembourg |
DB Equity S.à r.l.11 | | Luxembourg |
Deutsche Postbank AG12 | | Bonn, Germany |
| | |
| 1 | Taunus Corporation is one of two top-level holding companies for our subsidiaries in the United States. Effective February 1, 2012, Taunus Corporation is no longer a bank holding company under Federal Reserve Board regulations. |
| 2 | Deutsche Bank Securities Inc. is a U.S. company registered as a broker dealer and investment advisor with the Securities and Exchange Commission, a municipal advisor with the Municipal Securities Rulemaking Board, and a futures commission merchant with the Commodities Future Trading Commission. It is a member of the New York Stock Exchange and various other exchanges. |
| 3 | German American Capital Corporation is engaged in purchasing and holding loans from financial institutions, trading and securitization of mortgage whole loans and mortgage securities, and providing collateralized financing to counterparties. |
| 4 | Deutsche Bank Trust Corporation is a bank holding company under Federal Reserve Board regulations. |
| 5 | Deutsche Bank Trust Company Americas is a New York State-chartered bank and member of the Federal Reserve System. It originates loans and other forms of credit, accepts deposits, arranges financings and provides numerous other commercial banking and financial services. |
| 6 | The primary business of this company comprises Treasury and Markets activities, especially as a major supplier of Euro liquidity for Deutsche Bank Group. Further business activities are the international loan business, where the bank acts as lending office for continental Europe and as risk hub for credit portfolio strategies group, and private banking. The company serves private individuals, affluent clients and small business clients with banking products. |
| 7 | This company, in which DB Capital Markets (Deutschland) GmbH and DB Finanz-Holding GmbH indirectly own 100 % of the equity and voting interests, is a limited liability company. DWS Investment GmbH is a major German investment management company (KAG) managing traditional mutual funds issued by DWS Investment GmbH and issued by DWS Investment S.A. Luxembourg. |
| 8 | The company serves private individuals, affluent clients and small business clients with banking products. |
| 9 | The company holds the majority stake in Deutsche Postbank AG and a part of our stake in DWS Holding & Service GmbH. |
| 10 | This company is a holding company for our subgroups in Australia, New Zealand, and Singapore. It is also the holding company for DB Equity S.à r.l. |
| 11 | This company holds a part of our stake in Deutsche Postbank AG. |
| 12 | The business activities of this company comprise retail banking, business with corporate customers, money and capital markets activities as well as home savings loans. |
Property and Equipment
As of December 31, 2012, we operated in 72 countries out of 2,984 branches around the world, of which 65 % were in Germany. We lease a majority of our offices and branches under long-term agreements.
We continue to review our property requirements worldwide taking into account cost containment measures as well as growth initiatives in selected businesses. Please see Note 23 “Property and Equipment” to the consolidated financial statements for further information.
Information Required by Industry Guide 3
Please see pages S-1 through S-15 of the Supplemental Financial Information, which pages are incorporated by reference herein, for information required by SEC Industry Guide 3.
Item 4A: Unresolved Staff Comments
We have not received written comments from the Securities and Exchange Commission regarding our periodic reports under the Exchange Act, as of any day 180 days or more before the end of the fiscal year to which this annual report relates, which remain unresolved.
| | | | |
| Deutsche Bank | | Item 5: Operating and Financial Review and Prospects | | 49 |
| Annual Report 2012 on Form 20-F | | | | |
| | |
| | | | |
| | |
| | | | |
Item 5: Operating and Financial Review and Prospects
Overview
The following discussion and analysis should be read in conjunction with the consolidated financial statements and the related notes to them included in “Item 18: Financial Statements” of this document, on which we have based this discussion and analysis. Our consolidated financial statements for the years ended December 31, 2012, 2011 and 2010 have been audited by KPMG AG Wirtschaftsprüfungsgesellschaft, as described in the “Report of Independent Registered Public Accounting Firm” on page 383 of the Financial Report, immediately following the notes to the consolidated financial statements.
We have prepared our consolidated financial statements in accordance with IFRS as issued by the International Accounting Standards Board (“IASB”) and as endorsed by the European Union (“EU”).
Significant Accounting Policies and Critical Accounting Estimates
Our significant accounting policies are essential to understanding our reported results of operations and financial condition. Certain of these accounting policies require critical accounting estimates that involve complex and subjective judgments and the use of assumptions, some of which may be for matters that are inherently uncertain and susceptible to change. Such critical accounting estimates could change from period to period and have a material impact on our financial condition, changes in financial condition or results of operations. Critical accounting estimates could also involve estimates where management could have reasonably used another estimate in the current accounting period. Actual results may differ from these estimates if conditions or underlying circumstances were to change. See Notes 01 “Significant Accounting Policies” and 02 “Critical Accounting Estimates” to the consolidated financial statements for a discussion on our significant accounting policies and critical accounting estimates.
We have identified the following significant accounting policies that involve critical accounting estimates:
| — | | Reclassification of financial assets |
| — | | Impairment of loans and provision for off-balance sheet positions |
| — | | Impairment of other financial assets |
| — | | Impairment of non-financial assets |
| — | | Legal and regulatory contingencies and uncertain tax positions |
Recently Adopted Accounting Pronouncements and New Accounting Pronouncements
See Note 03 “Recently Adopted and New Accounting Pronouncements” to the consolidated financial statements for a discussion on our recently adopted and new accounting pronouncements.
| | | | |
| Deutsche Bank | | Item 5: Operating and Financial Review and Prospects | | 50 |
| Annual Report 2012 on Form 20-F | | | | |
| | |
| | | | |
| | |
| | | | |
Operating Results
You should read the following discussion and analysis in conjunction with our consolidated financial statements.
Executive Summary
Please see “Management Report: Operating and Financial Review: Executive Summary” on pages 11 to 14 of the Financial Report.
Trends and Uncertainties
Our net revenues increased slightly in 2012 compared with prior-year levels, while noninterest expenses increased significantly mainly due to impairments of goodwill and other intangible assets, significant litigation related charges and further specific items, resulting in considerably lower net income. In addition, our results reflected the impact of a continuing difficult macro-political and macro-economic environment with low interest rates, increasing competitive pressures and significant regulatory uncertainties. A continuation of this environment will adversely impact our results going forward.
Foreign exchange rate fluctuations have impacted our reported results in 2012 and are likely to continue to impact our reported euro revenues and expenses.
As part of “Strategy 2015+”, we have launched the Operational Excellence Program (OpEx) which is targeted at achieving annual savings of€ 4.5 billion by 2015 on the basis of a cumulative, one-time investment of€ 4.0 billion (costs to achieve, CtA). These CtA will result in increased expenses over the execution period. Detailed measures are in the process of being identified and agreed upon. The outcome of OpEx is dependent on the successful and timely execution of the measures and will likely impact the extent and timing of CtA and related savings.
In CB&S, increased net revenues in 2012 were fostered by an increased client activity across the industry and an increase in volumes across several products. Improved market conditions led to higher flow and client solutions revenues in Sales & Trading (debt and other products), absorbing the negative impact of the Credit Valuation Adjustment relating to certain derivative exposures due to refinement in the calculation methodology and RWA mitigation. Several other sales and trading products were negatively impacted by lower volatility, margin compression and reduced market activity while increased corporate debt issuance led to higher net revenues in Origination (debt). Net revenues in CB&S benefited from the positive impact related to a refinement in the calculation methodology of the Debt Valuation Adjustment on certain derivative liabilities. Noninterest expenses included an impairment of goodwill. Litigation-related expenses were significant in 2012 and might continue to be high or even increase further. Variable compensation was reduced in connection with a review of the compensation practices. The development of compensation expenses will continue to be influenced significantly by the operating performance of our businesses. Variable compensation will further be influenced by the governance of bank compensation, industry-wide compensation standards and our own compensation practices. Stricter regulatory requirements and capital adequacy requirements in particular continue to provide challenges to investment banking business models. Although we have set out a strategy to position ourselves as a long-term winner in a changed environment, future performance of our CB&S business will partly depend on the development of the European sovereign debt crisis and other macroeconomic factors.
In GTB, revenues increased driven by a strong performance across products and regions. Net charges related to the turnaround of the acquired commercial banking activities in the Netherlands as well as a litigation related charge, however, led to a reduced income before income taxes. Interest rate levels, international trade volumes, volumes in cross-border payments and corporate actions as well as the global economic development will continue to influence the revenues in GTB. Likewise, further charges associated with the turnaround of the commercial banking activities in the Netherlands are likely to impact the income development in GTB.
| | | | |
| Deutsche Bank | | Item 5: Operating and Financial Review and Prospects | | 51 |
| Annual Report 2012 on Form 20-F | | | | |
| | |
| | | | |
| | |
| | | | |
In AWM, revenues were up in all product categories, reflecting increased revenues from mark-to-market movements in investments held to back insurance policyholder claims in Abbey Life (offset in noninterest expenses) as well as higher deposit volumes, market appreciation in invested assets and business growth in Wealth Management. This was more than offset by higher in noninterest expenses reflecting an increase in the aforementioned effect related to Abbey Life, impairment charges, and CtA related to OpEx, leading to a significantly reduced income before income taxes. It is anticipated that revenues will continue to be impacted by changes in market conditions and investor sentiment. Overall results will be influenced by the progress in establishing an integrated, optimized and more efficient investment platform.
In PBC, net revenues decreased mainly as a result of the non-recurrence of a one-off gain related to our stake in Hua Xia Bank recorded in 2011 and higher negative PPA effects in Consumer Banking Germany. The remaining revenue decrease was mainly driven by a lower interest income due to the ongoing low interest rate environment and reduced investment portfolio at Postbank. Revenues in advisory/brokerage and discretionary portfolio/fund management were also lower driven by muted client investment activity while the remaining product categories were broadly stable. Provision for credit losses was reduced in 2012 compared to the prior year. This was to a large extent driven by Postbank-related loan loss allowances recorded after consolidation, and a further improvement in Advisory Banking Germany. Credit and deposit revenues in PBC will continue to be impacted by the development of volumes and margins, which also depend on interest rates. If economic growth continues to be slow it could result in an increase of our provision for credit losses, while noninterest expenses will continue to be impacted by CtA related to OpEx, as mentioned above, and to the integration of Postbank.
In the NCOU, the performance in 2012 included specific items such as impairment charges related to goodwill and our exposure to Actavis as well as litigation-related charges. Revenues also reflected losses from sales of capital intensive positions, mark-downs of certain legacy assets and negative effects related to the refinement to the CVA methodology. Results will continue to be driven by the pace of the de-risking activities, market conditions, the timing and nature of specific items as well as a number of external factors.
Our loss in Consolidation & Adjustments was mainly driven by differences in the accounting methods used for management reporting and IFRS as well as litigation-related charges. Among others, charges for UK and German bank levies impacted our results in 2012. We expect the future results to be impacted by these items going forward.
Our effective tax rate in 2012 of 63 % was mainly impacted by expenses that are not deductible for tax purposes which include impairments of goodwill. The effective tax rate in future periods could continue to be influenced by the potential occurrence of specific factors.
We further strengthened our capital position in 2012. The Bank’s Basel 2.5 Core Tier 1 capital ratio could further be improved due to lower RWA as well as reduced securitization capital deduction items both a result of a combination of portfolio optimization, de-risking activities, and enhancing our risk models and processes. However, future developments in regulatory requirements in the various jurisdictions we are operating in might affect our capital position.
Our liquidity reserves were above€ 230 billion as of year-end 2012. Unexpected or extreme market turbulence could provide an industry-wide challenge to the access to funding sources.
| | | | |
| Deutsche Bank | | Item 5: Operating and Financial Review and Prospects | | 52 |
| Annual Report 2012 on Form 20-F | | | | |
| | |
| | | | |
| | |
| | | | |
Results of Operations
Please see “Management Report: Operating and Financial Review: Results of Operations” on pages 14 to 31 of the Financial Report.
Financial Position
Please see “Management Report: Operating and Financial Review: Financial Position” on page 32 of the Financial Report.
Liquidity and Capital Resources
For a detailed discussion of our liquidity risk management, see “Management Report: Risk Report: Liquidity Risk” beginning on page 159 of the Financial Report.
For a detailed discussion of our capital management, see “Management Report: Risk Report: Capital Management” on beginning on page 168 of the Financial Report.
Post-Employment Benefit Plans
Please see “Management Report: Employees: Post-Employment Benefit Plans” on page 230 of the Financial Report.
Exposure to Monoline Insurers
Please see “Management Report: Operating and Financial Review: Exposure to Monoline Insurers” on pages 33 to 34 of the Financial Report.
Off-Balance Sheet Arrangements
Please see “Management Report: Operating and Financial Review: Special Purpose Entities and Off-Balance Sheet Arrangements” on pages 35 to 39 of the Financial Report.
Tabular Disclosure of Contractual Obligations
Please see “Management Report: Operating and Financial Review: Tabular Disclosure of Contractual Obligations” on page 41 of the Financial Report.
Research and Development, Patents and Licenses
Not applicable.
| | | | |
| Deutsche Bank | | Item 6: Directors, Senior Management and Employees | | 53 |
| Annual Report 2012 on Form 20-F | | | | |
| |
| Item 6: Directors, Senior Management and Employees | | |
| | |
| | | | |
Directors and Senior Management
In accordance with the German Stock Corporation Act (Aktiengesetz), we have a Management Board (Vorstand) and a Supervisory Board (Aufsichtsrat). The Stock Corporation Act prohibits simultaneous membership on both the Management Board and the Supervisory Board. The members of the Management Board are the executive officers of our company. The Management Board is responsible for managing our company and representing us in dealings with third parties. The Supervisory Board oversees the Management Board, appoints and removes its members and determines their salaries and other compensation components, including pension benefits. According to German law, our Supervisory Board represents us in dealings with members of the Management Board. Therefore, no members of the Management Board may enter into any agreement with us without the prior consent of our Supervisory Board.
German law does not require the members of the Management Board to own any of our shares to be qualified. In addition, German law has no requirement that members of the Management Board retire under an age limit. However, age limits for members of the Management Board are defined contractually and exist for the members of the Supervisory Board according to the Terms of Reference for our Supervisory Board.
The Supervisory Board may not make management decisions. However, German law and our Articles of Association (Satzung) require the Management Board to obtain the consent of the Supervisory Board for certain actions. The most important of these actions are:
| — | | granting general powers of attorney (Generalvollmachten). A general power of attorney authorizes its holder to represent the company in substantially all legal matters without limitation to the affairs of a specific office; |
| — | | acquisitions and disposals (including transactions carried out by a subsidiary) of real estate when the value of the object exceeds 1 % of our regulatory banking capital (haftendes Eigenkapital); |
| — | | granting loans and acquiring participations if the German Banking Act requires approval by the Supervisory Board. In particular, the German Banking Act requires the approval of the Supervisory Board if we grant a loan (to the extent legally permissible) to a member of the Management Board or the Supervisory Board or one of our employees who holds a procuration (Prokura) or general power of attorney; and |
| — | | acquisitions and disposals (including transactions carried out by a subsidiary) of other participations, insofar as the object involves more than 2 % of our regulatory banking capital. The Supervisory Board must be informed without delay of any acquisition or disposal of such participations involving more than 1 % of our regulatory banking capital. |
The Management Board must submit regular reports to the Supervisory Board on our current operations and future business planning. The Supervisory Board may also request special reports from the Management Board at any time.
With respect to voting powers, a member of the Supervisory Board or the Management Board may not vote on resolutions open to a vote at a board meeting if the proposed resolution concerns:
| — | | a legal transaction between us and the member; or |
| — | | commencement, settlement or completion of legal proceedings between us and the member. |
A member of the Supervisory Board or the Management Board may not directly or indirectly exercise voting rights on resolutions open to a vote at a shareholders’ meeting (Hauptversammlung, which we refer to as the General Meeting) if the proposed resolution concerns:
| | | | |
| Deutsche Bank | | Item 6: Directors, Senior Management and Employees | | 54 |
| Annual Report 2012 on Form 20-F | | | | |
| |
| | |
| | |
| | | | |
| — | | ratification of the member’s acts; |
| — | | a discharge of liability of the member; or |
| — | | enforcement of a claim against the member by us. |
Supervisory Board and Management Board
In carrying out their duties, members of both the Management Board and Supervisory Board must exercise the standard of care of a prudent and diligent business person, and they are liable to us for damages if they fail to do so. Both boards are required to take into account a broad range of considerations in their decisions, including our interests and those of our shareholders, employees and creditors.
The liability of the members of the Management Board or the Supervisory Board under the German Stock Corporation Act for breach of their fiduciary duties is to the company rather than individual shareholders. However, also individual shareholders that hold at least 1 % or€ 100,000 of the subscribed capital and are granted standing by the court may invoke such liability to the company. The underlying concept is that all shareholders should benefit equally from amounts received under this liability by adding such amounts to the company’s assets rather than disbursing them to plaintiff shareholders. We may waive the right to claim damages or settle these claims if at least three years have passed since the alleged breach and if the shareholders approve the waiver or settlement at the General Meeting with a simple majority of the votes cast, and provided that opposing shareholders do not hold, in the aggregate, one tenth or more of our share capital and do not have their opposition formally noted in the minutes maintained by a German notary.
Supervisory Board
Our Articles of Association require our Supervisory Board to have twenty members. In the event that the number of members on our Supervisory Board falls below twenty, the Supervisory Board maintains its authority to pass resolutions so long as at least ten members participate in the passing of a resolution, either in person or by submitting their votes in writing. If the number of members remains below twenty for more than three months or falls below ten, upon application to a competent court, the court must appoint replacement members to serve on the board until official appointments are made.
The German Co-Determination Act of 1976 (Mitbestimmungsgesetz) requires that the shareholders elect half of the members of the supervisory board of large German companies, such as Deutsche Bank, and that employees in Germany elect the other half. None of the current members of either of our boards were selected pursuant to any arrangement or understandings with major shareholders, customers or others.
Each member of the Supervisory Board generally serves for a fixed term of approximately five years. For the election of shareholder representatives, the General Meeting may establish that the terms of office of up to five members may begin or end on differing dates. Pursuant to German law, the term expires at the latest at the end of the Annual General Meeting that approves and ratifies such member’s actions in the fourth fiscal year after the year in which the Supervisory Board member was elected. Supervisory Board members may also be re-elected. The shareholders may, by a majority of the votes cast in a General Meeting, remove any member of the Supervisory Board they have elected in a General Meeting. The employees may remove any member they have elected by a vote of three-quarters of the employee votes cast.
The members of the Supervisory Board elect the chairperson and the deputy chairperson of the Supervisory Board. Traditionally, the chairperson is a representative of the shareholders, and the deputy chairperson is a representative of the employees. At least half of the members of the Supervisory Board must be present at a meeting or must have submitted their vote in writing to constitute a quorum. In general, approval by a simple majority of the members of the Supervisory Board present and voting is required to pass a resolution. In the case of a deadlock, the resolution is put to a second vote. In the case of a second deadlock, the chairperson has the deciding vote.
| | | | |
| Deutsche Bank | | Item 6: Directors, Senior Management and Employees | | 55 |
| Annual Report 2012 on Form 20-F | | | | |
| |
| | |
| | |
| | | | |
For additional information on our Supervisory Board, including a table providing the names of and biographical information for the current members, see “Corporate Governance Statement/Corporate Governance Report: Management Board and Supervisory Board: Supervisory Board” on pages 427 to 431 of the Financial Report.
Standing Committees
For information on the standing committees of our Supervisory Board, please see “Corporate Governance Statement/Corporate Governance Report: Management Board and Supervisory Board: Standing Committees” on pages 431 to 432 of the Financial Report.
The business address of the members of the Supervisory Board is the same as our business address, Taunusanlage 12, 60325 Frankfurt am Main, Germany.
Management Board
Our Articles of Association require the Management Board to have at least three members. Our Management Board currently has seven members. The Supervisory Board has also appointed two Co-Chairmen of the Management Board.
The Supervisory Board appoints the members of the Management Board for a maximum term of five years and oversees them. They may be re-appointed or have their term extended for one or more terms of up to a maximum of five years each. The Supervisory Board may remove a member of the Management Board prior to the expiration of his or her term for good cause.
Pursuant to our Articles of Association, two members of the Management Board, or one member of the Management Board together with a holder of procuration, may represent us for legal purposes. A holder of procuration is an attorney-in-fact who holds a legally defined power under German law, which cannot be restricted with respect to third parties. However, pursuant to German law, the Management Board itself must resolve on certain matters as a body. In particular, it may not delegate strategic planning, coordinating or controlling responsibilities to individual members of the Management Board. The Management Board is required to ensure that shareholders are treated on an equal basis and receive equal information. The Management Board is also required to ensure appropriate risk management within our operations and to establish an internal monitoring system.
Other responsibilities of the Management Board are:
| — | | appointing key personnel; |
| — | | making decisions regarding significant credit exposures or other risks which have not been delegated to individual risk management units in accordance with the terms of reference (Geschäftsordnung) for the Management Board and terms of reference for our Risk Executive Committee; |
| — | | calling shareholders’ meetings; |
| — | | filing petitions to set aside shareholders’ resolutions; |
| — | | preparing and executing shareholders’ resolutions; and |
| — | | reporting to the Supervisory Board. |
For additional information on our Management Board, including the names of and biographical information for the current members, see “Corporate Governance Statement/Corporate Governance Report: Management Board and Supervisory Board: Management Board” on pages 424 to 427 of the Financial Report.
| | | | |
| Deutsche Bank | | Item 6: Directors, Senior Management and Employees | | 56 |
| Annual Report 2012 on Form 20-F | | | | |
| |
| | |
| | |
| | | | |
Board Practices of the Management Board
The terms of reference for the Management Board, according to the Management Board resolution of June 1, 2012, are based on the authorization of the Supervisory Board of May 30, 2012. These terms of reference provide that in addition to the joint overall responsibility of the Management Board as a group, the individual responsibilities of the members of the Management Board are determined by the business allocation plan for the Management Board. The terms of reference stipulate that, notwithstanding the Management Board’s joint management and joint responsibility, and the functional responsibilities of the operating committees of our corporate divisions and of the functional committees, the members of the Management Board each have a primary responsibility for the divisions or functions to which they are assigned, as well as for those committees of which they are members.
In addition to managing our company, some of the members of our Management Board also supervise and advise our affiliated companies. As permitted by German law, some of the members also serve as members of the supervisory boards of other companies. Also, to assist us in avoiding conflicts of interest, the members of our Management Board have generally undertaken not to assume chairmanships of supervisory boards of companies outside our consolidated group.
Section 161 of the Stock Corporation Act requires that the management board and supervisory board of any German exchange-listed company declare annually that the recommendations of the German Corporate Governance Code have been adopted by the company or which recommendations have not been so adopted. These recommendations go beyond the requirements of the Stock Corporation Act. The Management Board and Supervisory Board issued a new Declaration of Conformity in accordance with § 161 German Stock Corporation Act (AktG) on October 30, 2012, which is available on our Internet website at www.deutsche-bank.com/corporate-governance under the heading “Declarations of Conformity”.
Group Executive Committee
Please see “Corporate Governance Statement/Corporate Governance Report: Management Board and Supervisory Board: Group Executive Committee” on page 427 of the Financial Report.
Compensation
For information on the compensation of the members of our Supervisory Board, see “Management Report: Compensation Report: Compensation System for Supervisory Board Members” on pages 224 to 225 of the Financial Report.
For information on the compensation of the members of our Management Board, see “Management Report: Compensation Report: Management Board Report and Disclosure” on pages 206 to 214 of the Financial Report and “Management Report: Compensation Report: Management Board Compensation” on pages 214 to 220 of the Financial Report. Additional information on our compensation approach and practices, some of which applies to compensation of the Management Board, is provided in “Management Report: Compensation Report” on pages 195 to 225.
| | | | |
| Deutsche Bank | | Item 7: Major Shareholders and Related Party Transactions | | 57 |
| Annual Report 2012 on Form 20-F | | | | |
| |
| | |
| | |
| | | | |
Employees
For information on our employees, see “Management Report: Employees” on pages 228 to 230 of the Financial Report.
Share Ownership
For the share ownership of the Management Board, see “Management Report: Compensation Report: Management Board Share Ownership” on page 220 of the Financial Report.
For the share ownership of the members of the Supervisory Board, see “Corporate Governance Statement/Corporate Governance Report: Reporting and Transparency: Directors’ Share Ownership” on page 433 of the Financial Report.
For a description of our employee share programs, please see Note 34 “Employee Benefits” of the consolidated financial statements.
Item 7: Major Shareholders and Related Party Transactions
Major Shareholders
On December 31, 2012, our issued share capital amounted to€ 2,379,519,078 divided into 929,499,640 no par value ordinary registered shares.
On December 31, 2012, we had 610,694 registered shareholders. The majority of our shareholders are retail investors in Germany. On that date, 125,125,036 of our shares were registered in the names of 1,087 shareholders resident in the United States, representing 13.46 % of our share capital.
The German Securities Trading Act (Wertpapierhandelsgesetz) requires investors in publicly-traded corporations whose investments reach certain thresholds to notify both the corporation and the BaFin of such change within seven days. The minimum disclosure threshold is 3 % of the corporation’s issued voting share capital.
BlackRock, Inc., New York has notified us that as of December 22, 2010 they held 5.14 % of our shares. We have received no further notification since that date.
We are neither directly nor indirectly owned nor controlled by any other corporation, by any government or by any other natural or legal person severally or jointly.
Pursuant to German law and our Articles of Association, to the extent that we may have major shareholders at any time, we may not give them different voting rights from any of our other shareholders.
We are aware of no arrangements which may at a subsequent date result in a change in control of our company.
| | | | |
| Deutsche Bank | | Item 7: Major Shareholders and Related Party Transactions | | 58 |
| Annual Report 2012 on Form 20-F | | | | |
| |
| | |
| | |
| | | | |
Related Party Transactions
We have business relationships with a number of the companies in which we own significant equity interests. We also have business relationships with a number of companies where members of our Management Board also hold positions on boards of directors. Our business relationships with these companies cover many of the financial services we provide to our clients generally. For more detailed information, refer to Note 37 “Related Party Transactions” of the consolidated financial statements.
We conduct our business with these companies on terms equivalent to those that would prevail if we did not have equity holdings in them or management members in common, and we have conducted business with these companies on that basis in 2012 and prior years. None of these transactions is or was material to us.
Among our business with related party companies in 2012, there have been and currently are loans, guarantees and commitments, which totaled€ 1.3 billion (including loans amounting to€ 867 million) as of January 31, 2013. The€ 4.6 billion decrease compared to January 31, 2012 was principally driven by our derisking activities with the exit from a non-core Leveraged Finance exposure with a single counterparty and the reduction of a non-core commercial real estate exposure with a single counterparty.
All these credit exposures
| — | | were made in the ordinary course of business, |
| — | | were made on substantially the same terms, including interest rates and collateral, as those prevailing at the time for comparable transactions with other persons, and |
| — | | did not involve more than the normal risk of collectability at their initiation or present other unfavorable features compared to loans to nonrelated parties. |
We have not conducted material business with parties that fall outside of the definition of related parties, but with whom we or our related parties have a relationship that enables the parties to negotiate terms of material transactions that may not be available from other, more clearly independent, parties on an arm’s-length basis.
Related Party Impaired Loans
In addition to our other shareholdings, we hold acquired equity interests in some of our clients arising from our efforts to protect our then-outstanding lending exposures to them.
Impaired loans to related parties which may exhibit more than normal risk of collectability or present other unfavorable features compared to performing loans to related parties decreased by€ 28 million to€ 460 million, from January 31, 2012. The following table presents an overview of the impaired loans we hold of some of our related parties as of January 31, 2013.
| | | | |
| Deutsche Bank | | Item 7: Major Shareholders and Related Party Transactions | | 59 |
| Annual Report 2012 on Form 20-F | | | | |
| |
| | |
| | |
| | | | |
| | | | | | | | | | | | | | | | | | |
in€ m. | | Amount
outstanding
as of
January 31,
2013 | | | Largest amount
outstanding
January 1, 2012 to
January 31, 2013 | | | Provision for
loan losses
in 20121 | | | Allowance for
loan losses as of
Dec 31, 20121 | | | Nature of the loan and transaction in which incurred |
Customer A | | | 0 | | | | 1 | | | | (0) | | | | 1 | | | Uncollateralized shareholder loan bearing interest at 8.5 % per annum. The loan is held at contractual terms but interest is accreted at the effective interest rate applied to the carrying amount. |
| | | | | | | | | | | | | | | | | | |
Customer B | | | 170 | | | | 212 | | | | 21 | | | | 19 | | | Consisting of senior collateralized debt which has been reclassified according to IAS 39 and shareholders loans, bearing interest at 6.75 % per annum. The loans are held at contractual terms but interest is accreted at the effective interest rate applied to the carrying amount. |
| | | | | | | | | | | | | | | | | | |
Customer C | | | 106 | | | | 114 | | | | 12 | | | | 11 | | | Consisting of senior collateralized debt which has been reclassified according to IAS 39 and shareholders loans, bearing interest at 6.75 % per annum. The loans are held at contractual terms but interest is accreted at the effective interest rate applied to the carrying amount. |
| | | | | | | | | | | | | | | | | | |
Customer D | | | 40 | | | | 43 | | | | 4 | | | | 4 | | | Consisting of senior collateralized debt which has been reclassified according to IAS 39 and shareholders loans, bearing interest at 6.75 % per annum. The loans are held at contractual terms but interest is accreted at the effective interest rate applied to the carrying amount. |
| | | | | | | | | | | | | | | | | | |
Customer E | | | 38 | | | | 41 | | | | 4 | | | | 4 | | | Consisting of senior collateralized debt which has been reclassified according to IAS 39 and shareholders loans, bearing interest at 6.75 % per annum. The loans are held at contractual terms but interest is accreted at the effective interest rate applied to the carrying amount. |
| | | | | | | | | | | | | | | | | | |
Customer F | | | 33 | | | | 35 | | | | 4 | | | | 3 | | | Consisting of senior collateralized debt which has been reclassified according to IAS 39 and shareholders loans, bearing interest at 6.75 % per annum. The loans are held at contractual terms but interest is accreted at the effective interest rate applied to the carrying amount. |
| | | | | | | | | | | | | | | | | | |
Customer G | | | 12 | | | | 13 | | | | 1 | | | | 1 | | | Consisting of senior collateralized debt which has been reclassified according to IAS 39 and shareholders loans, bearing interest at 6.75 % per annum. The loans are held at contractual terms but interest is accreted at the effective interest rate applied to the carrying amount. |
| | | | | | | | | | | | | | | | | | |
Customer H | | | 43 | | | | 45 | | | | — | | | | — | | | Consisting of an uncollateralized shareholders loan bearing interest at Libor + 3.5 % per annum. The loan is payable and interest is accreted at the effective interest rate applied to the carrying amount. |
| | | | | | | | | | | | | | | | | | |
Customer I | | | 4 | | | | 5 | | | | (0) | | | | 2 | | | Consisting of a claim from a collateralized real estate leasing finance unpaid at maturity, bearing interest at 4.67 % per annum. The exposure is past due and payable, interest is accreted at the effective interest rate applied to the carrying amount. |
| | | | | | | | | | | | | | | | | | |
Customer J | | | 2 | | | | 2 | | | | 0 | | | | 1 | | | Consisting of a claim from a collateralized real estate leasing finance unpaid at maturity, bearing interest at 6.62 % per annum. The exposure is past due and payable, interest is accreted at the effective interest rate applied to the carrying amount. |
| | | | | | | | | | | | | | | | | | |
Customer K | | | 1 | | | | 1 | | | | 0 | | | | 0 | | | Consisting of a claim from a collateralized real estate leasing finance unpaid at maturity, bearing interest at 5.28 % per annum. The exposure is past due and payable, interest is accreted at the effective interest rate applied to the carrying amount. |
| | | | | | | | | | | | | | | | | | |
Customer L | | | 11 | | | | 11 | | | | 0 | | | | 11 | | | Consisting of a real estate finance loan bearing interest at 6.27 % per annum and guarantees which were honored after the company filed for liquidation bearing no interest. The exposure is past due and payable, interest is accreted at the effective interest rate applied to the carrying amount. |
| | | | | | | | | | | | | | | | | | |
Total | | | 460 | | | | — | 2 | | | 47 | | | | 58 | | | |
|
| 1 | The allowance for loan losses is calculated by subtracting the net present value of future expected cash flows from the current outstanding. The year-end balance of the loan loss allowance is in most cases lower than the amount of provision for credit losses required for the recognition due to unwinding effects based upon passage of time which are recognized in interest income. |
| 2 | Simply adding the largest amounts outstanding of the individual borrowers during the reporting period to arrive at an aggregate outstanding is not applicable as it would imply the assumption that the largest outstandings for all borrowers occured simultaneously. |
In the above table, customer A is an unconsolidated subsidiary of ours, customers B to K are investments held at equity and customer L is a shareholding in which we hold a participation of 10 % or more of the voting rights. The customers J and K became related parties during 2012. Impaired loans to all other customers have been carried forward from the previous year end.
We have not disclosed the names of the related party customers described above because we have concluded that such disclosure would violate applicable privacy laws, such as customer confidentiality and data protection laws, and those customers have not waived application of these privacy laws. A legal opinion regarding the applicable privacy laws is filed as Exhibit 14.1 hereto.
| | | | |
| Deutsche Bank | | Item 8: Financial Information | | 60 |
| Annual Report 2012 on Form 20-F | | | | |
| |
| | |
| | |
| | | | |
Interests of Experts and Counsel
Not required because this document is filed as an annual report.
Item 8: Financial Information
Consolidated Statements and Other Financial Information
Consolidated Financial Statements
The Financial Statements of this Annual Report on Form 20-F consist of the Consolidated Financial Statements including the Notes 1 to 43, which are set forth on pages 243 to 382 of the Financial Report, and those parts of the “Management Report: Risk Report” which are marked by a bracket in the margins, which Risk Report is set forth on pages 43 to 186 of the Financial Report. Such Consolidated Financial Statements have been audited by KPMG AG Wirtschaftsprüfungsgesellschaft, as described in their “Report of Independent Registered Public Accounting Firm” included on page 383 of the Financial Report.
Legal Proceedings
General. We and our subsidiaries operate in a legal and regulatory environment that exposes us to significant litigation risks. As a result, we are involved in litigation, arbitration and regulatory proceedings in Germany and in a number of jurisdictions outside Germany, including the United States, arising in the ordinary course of our businesses. Please refer to Note 29 “Provisions” of our consolidated financial statements for descriptions of certain significant legal proceedings. Additional legal proceedings that may have, or have had in the recent past, significant effects on our financial position or profitability are described below.
City of Milan Matters. In January 2009, the City of Milan (the “City”) issued civil proceedings in the District Court of Milan against Deutsche Bank and three other banks (together the “Banks”) in relation to a 2005 bond issue by the City (the “Bond”) and a related swap transaction which was subsequently restructured several times between 2005 and 2007 (the “Swap”) (the Bond and Swap together, the “Transaction”). The City sought damages and/or other remedies on the grounds of alleged fraudulent and deceitful acts and alleged breach of advisory obligations. During March 2012, the City and the Banks agreed to discharge all existing civil claims between them in respect of the Transaction, with no admission of liability by the Banks. While some aspects of the Swap remain in place between Deutsche Bank and the City, others were terminated as part of the civil settlement. As a further condition of the civil settlement, the sums seized from the Banks by the Milan Prosecutor (in the case of Deutsche Bank,€ 25 million) have been returned by the Prosecutor to the Banks, despite this seizure having been part of the trial described below. Deutsche Bank also received a small interest payment in respect of the seized sum.
In March 2010, at the Milan Prosecutor’s request, the Milan judge of the preliminary hearing approved the indictment of each of the Banks and certain of their employees (including two current employees of Deutsche Bank). The indictments of the employees were for alleged criminal offences relating to the Swap and subsequent restructuring, in particular fraud against a public authority. The Banks were charged with an administrative (non-criminal) offence of having systems and controls that did not prevent the employees’ alleged crimes. A first instance verdict was handed down on December 19, 2012. This verdict found all the Banks and certain employees, including the two Deutsche Bank employees, guilty of the charges against them. A reasoned judgment
| | | | |
| Deutsche Bank | | Item 8: Financial Information | | 61 |
| Annual Report 2012 on Form 20-F | | | | |
| |
| | |
| | |
| | | | |
was handed down on February 3, 2013. Deutsche Bank and its employees intend to appeal. Any appeal must be filed by May 3, 2013. The associated monetary penalties (approximately€ 25.4 million in the case of Deutsche Bank) and prison sentences are suspended until the appeals process is exhausted.
Corporate Securities Matters. Deutsche Bank AG and Deutsche Bank Securities Inc. (“DBSI”) regularly act in the capacity of underwriter and sales agent for debt and equity securities of corporate issuers and are from time to time named as defendants in litigation commenced by investors relating to those securities.
Deutsche Bank AG and DBSI, along with numerous other financial institutions, have been sued in the United States District Court for the Southern District of New York in various actions in their capacity as underwriters and sales agents for debt and equity securities issued by American International Group, Inc. (“AIG”) between 2006 and 2008. On May 19, 2009, lead plaintiffs filed a consolidated putative securities class action pursuant to Sections 11, 12(a)(2), and 15 of the Securities Act of 1933 and Sections 10(b) and 20(a) of the Securities Exchange Act of 1934 (the “Exchange Act”). The underwriters and sales agents are not named in the Exchange Act claims. The complaint alleges, among other things, that the offering documents failed to reveal that AIG had substantial exposure to losses due to credit default swaps, that AIG’s real estate assets were overvalued, and that AIG’s financial statements did not conform to GAAP. The total amount of securities alleged to have been sold by the underwriter and sales agent defendants pursuant to the offerings at issue in the consolidated action is U.S.$ 27 billion. Deutsche Bank AG underwrote approximately U.S.$ 550 million in AIG securities. DBSI underwrote approximately U.S.$ 811 million in AIG securities. On April 1, 2011, lead plaintiffs filed a motion for class certfication and defendants’ oppositions were filed on May 24, 2012. Lead plaintiffs filed their reply brief on June 22, 2012. The Court has scheduled oral argument on the class certification motion for May 1, 2013. Fact discovery is also complete. Expert discovery has been deferred pending the Court’s ruling on class certification. The underwriter and sales agent defendants, including Deutsche Bank AG and DBSI, received a customary agreement to indemnify from AIG as issuer in connection with the offerings, upon which they have notified AIG that they are seeking indemnity.
DBSI, along with numerous other financial institutions, was named as a defendant in a putative class action lawsuit pending in the United States District Court for the Southern District of New York relating to alleged misstatements and omissions in the registration statement of General Motors Company (“GM”) in connection with GM’s November 18, 2010 initial public offering (“IPO”). DBSI acted as an underwriter for the offering. Specifically, lead plaintiff alleges that the registration statement issued in connection with the IPO contained material misstatements and/or omissions. The original complaint was filed on June 29, 2012. Lead plaintiff was appointed on November 21, 2012, and lead plaintiff filed an amended complaint on February 1, 2013. The underwriters, including DBSI, received a customary agreement to indemnify from GM as issuer in connection with the offerings, upon which they have notified GM that they are seeking indemnity.
DBSI, along with other financial institutions, was named as a defendant in a putative class action lawsuit pending in the United States District Court for the Southern District of New York in April 2009 alleging material misstatements and/or omissions in the offering documents of General Electric Co.’s (“GE”) October 2008 Common Stock Offering. DBSI acted as an underwriter in the offering. On July 29, 2009, the Court entered an order consolidating this action with others generally arising out of the same facts against GE and various company officers and directors. A consolidated amended complaint was filed on October 2, 2009. Defendants moved to dismiss the consolidated amended complaint on November 24, 2009, and, on June 9, 2010, the plaintiff filed a second amended complaint. Defendants moved to dismiss the second amended complaint on June 30, 2010, and the Court granted in part and denied in part that motion on January 12, 2012. On January 26, 2012, defendants moved for reconsideration regarding the claims which were not dismissed, and, on April 18, 2012, the Court granted reconsideration and dismissed the remaining claims against DBSI and the other underwriter defendants. Some claims against the GE-related defendants survived. The time for any appeal from dismissal of the claims against the underwriters will not begin to run until disposition of the remaining claims against the GE-related defendants. The underwriters, including DBSI, received a customary agreement to indemnify from GE as issuer in connection with the offerings, upon which they have notified GE that they are seeking indemnity.
| | | | |
| Deutsche Bank | | Item 8: Financial Information | | 62 |
| Annual Report 2012 on Form 20-F | | | | |
| |
| | |
| | |
| | | | |
CO2 Emission Rights. The Frankfurt am Main Office of Public Prosecution (the “OPP”) is investigating alleged value-added tax (VAT) fraud in connection with the trading of CO2 emission rights by certain trading firms, some of which also engaged in trading activity with Deutsche Bank. The OPP alleges that certain employees of Deutsche Bank knew that their counterparties were part of a fraudulent scheme to avoid VAT on transactions in CO2 emission rights, and it searched Deutsche Bank’s head office and London branch in April 2010 and issued various requests for documents. In December 2012, the OPP widened the scope of its investigation and again searched Deutsche Bank’s head office. It alleges that certain employees deleted e-mails of suspects shortly before the 2010 search and failed to issue a suspicious activity report under the Anti-Money Laundering Act which, according to the OPP, was required. It also alleges that Deutsche Bank filed an incorrect VAT return for 2009, which was signed by two members of the Management Board, and incorrect monthly returns for September 2009 to February 2010. Deutsche Bank is cooperating with the OPP.
IBEW Local 90 Class Action. Deutsche Bank and certain of its officers have been named as defendants in a putative class action pending in the United States District Court for the Southern District of New York brought on behalf of all persons who acquired Deutsche Bank ordinary shares between January 3, 2007 and January 16, 2009 (the “class period”). In an amended complaint, plaintiff alleges that during the class period, the value of Deutsche Bank’s securities was inflated due to alleged misstatements or omissions on Deutsche Bank’s part regarding the potential exposure to Deutsche Bank arising out of the MortgageIT, Inc. acquisition, and regarding the potential exposure arising from Deutsche Bank’s RMBS (residential mortgage-backed securities) and CDO (collateralized debt obligations) portfolio during the class period. Claims are asserted under Sections 10(b) and 20(a) of the Securities Exchange Act of 1934, and Rule 10b-5 thereunder. Defendants moved to dismiss the amended complaint. By decision dated March 27, 2013 the Court largely denied the motion to dismiss as to Deutsche Bank and all but one of the individual defendants. The Court dismissed all claims by class members who acquired shares outside the United States. Discovery is expected to commence shortly.
Hydro Dispute. Deutsche Bank is involved in legal proceedings in Italy and in front of an ICC Arbitration Tribunal in France with respect to a hydropower project in Albania. On the other side are two Italian companies, BEG SpA and Hydro Srl. BEG is Deutsche Bank’s joint venture partner with respect to the project; Hydro is the joint venture vehicle (owned 55 % by BEG and 45 % Deutsche Bank). The dispute centers around whether Deutsche Bank has an obligation to fund construction of the project in full. Deutsche Bank’s position is that its sole funding obligation with respect to the project was to provide an equity injection of up to€ 35 million, which obligation it has fulfilled.
In Italy, Deutsche Bank was defendant in an arbitration claim from Hydro for damages of€ 411 million for alleged failure to finance the construction of the project. In November 2011, the arbitration panel ruled that there was evidence of some (unspecified) further financing commitment on Deutsche Bank’s part, and issued an award of approximately€ 29 million against Deutsche Bank. Deutsche Bank has appealed to the Court of Appeal for the award to be set aside. The Court’s ruling is due in late 2013 to early 2014.
In Paris, Deutsche Bank is the claimant in an ICC arbitration against BEG, in which it seeks inter alia a declaration that Deutsche Bank has fulfilled its obligations in respect of the project to date. BEG has counterclaimed€ 242 million. The last hearing took place in 2012; the award is expected in the second quarter of 2013.
In the fourth quarter of 2012, Hydro launched a new arbitration against Deutsche Bank in Italy. Hydro is seeking damages of approximately€ 490 million in respect of losses that it alleges it has suffered to date, with a further€ 200 million in respect of future losses should the concession to build the power plant be revoked.
Kaupthing CLN Claims. In June 2012, Kaupthing hf (acting through its Winding-up Committee) issued Icelandic law clawback claims for approximately€ 509 million (plus interest) against Deutsche Bank in both Iceland and England. The claims relate to leveraged credit linked notes, referencing Kaupthing, issued by Deutsche Bank to two British Virgin Island Special Purpose Vehicles (“SPVs”) in 2008. The SPVs were ultimately owned by high net worth individuals. Kaupthing claims to have funded the SPVs and alleges that Deutsche Bank was or should have been aware that Kaupthing itself was economically exposed in the transactions. It is claimed that
| | | | |
| Deutsche Bank | | Item 8: Financial Information | | 63 |
| Annual Report 2012 on Form 20-F | | | | |
| | |
| | | | |
| | |
| | | | |
the transactions are voidable by Kaupthing on a number of alternative grounds, including the ground that the transactions were improper because one of the alleged purposes of the transactions was to allow Kaupthing to influence the market in its own CDS (credit default swap) spreads and thereby its listed bonds. Additionally, in November 2012, an English law claim (with allegations similar to those featured in the Icelandic law claims) was commenced by Kaupthing against Deutsche Bank in London.
Deutsche Bank filed its defense in the Icelandic proceedings in late February 2013. The next court hearing, which will relate to jurisdiction, is scheduled to take place in Iceland in June 2013.
KOSPI Index Unwind Matters.Following the decline of the Korea Composite Stock Price Index 200 (“KOSPI 200”) in the closing auction on November 11, 2010 by approximately 2.7 %, the Korean Financial Supervisory Service (“FSS”) commenced an investigation and expressed concerns that the fall in the KOSPI 200 was attributable to a sale by Deutsche Bank of a basket of stocks, worth approximately€ 1.6 billion, that was held as part of an index arbitrage position on the KOSPI 200. On February 23, 2011, the Korean Financial Services Commission, which oversees the work of the FSS, reviewed the FSS’ findings and recommendations and resolved to take the following action: (i) to file a criminal complaint to the Korean Prosecutor’s Office for alleged market manipulation against five employees of the Deutsche Bank group and Deutsche Bank’s subsidiary Deutsche Securities Korea Co. (DSK) for vicarious liability; and (ii) to impose a suspension of six months, commencing April 1, 2011 and ending September 30, 2011, of DSK’s business for proprietary trading of cash equities and listed derivatives and DMA (direct market access) cash equities trading, and the requirement that DSK suspend the employment of one named employee for six months. There was an exemption to the business suspension which permitted DSK to continue acting as liquidity provider for existing derivatives linked securities. On August 19, 2011, the Korean Prosecutor’s Office announced its decision to indict DSK and four employees of the Deutsche Bank group on charges of spot/futures linked market manipulation. The criminal trial commenced in January 2012. A verdict in respect of DSK and one of the four indicted employees may come as early as mid 2013. In addition, a number of civil actions have been filed in Korean courts against Deutsche Bank and DSK by certain parties who allege they incurred losses as a consequence of the fall in the KOSPI 200 on November 11, 2010. The claimants are seeking damages with an aggregate claim amount of not less than€ 220 million (at present exchange rates) plus interest and costs. These litigations are at various stages of proceedings, with verdicts in some actions possible by the end of 2013.
MortgageIT Litigation.On May 3, 2011, the United States Department of Justice (“USDOJ”) filed a civil action against Deutsche Bank and MortgageIT, Inc. in the United States District Court for the Southern District of New York. The USDOJ filed an amended complaint on August 22, 2011. The amended complaint, which asserts claims under the U.S. False Claims Act and common law, alleged that Deutsche Bank, DB Structured Products, Inc., MortgageIT, Inc. and DBSI submitted false certifications to the Department of Housing and Urban Development’s Federal Housing Administration (FHA) concerning MortgageIT, Inc.’s compliance with FHA requirements for quality controls and concerning whether individual loans qualified for FHA insurance. As set forth in the amended complaint, the FHA has paid U.S.$ 368 million in insurance claims on mortgages that are allegedly subject to false certifications. The amended complaint sought recovery of treble damages and indemnification of future losses on loans insured by FHA, and as set forth in the filings, the USDOJ sought over U.S.$ 1 billion in damages. On September 23, 2011, the defendants filed a motion to dismiss the amended complaint. Following a hearing on December 21, 2011, the court granted the USDOJ leave to file a second amended complaint. On May 10, 2012, Deutsche Bank settled this litigation with the USDOJ for
U.S.$ 202.3 million.
Ocala Litigation.Deutsche Bank is a secured creditor of Ocala Funding LLC (“Ocala”), a commercial paper vehicle sponsored by Taylor Bean & Whitaker Mortgage Corp. (“Taylor Bean”), which ceased mortgage lending operations and filed for bankruptcy protection in August 2009. Bank of America is the trustee, collateral agent, custodian and depository agent for Ocala. Deutsche Bank has commenced a civil litigation in the United States District Court for the Southern District of New York against Bank of America for breach of contract, breach of fiduciary duty, and contractual indemnity resulting from Bank of America’s failure to secure and safeguard cash
| | | | |
| Deutsche Bank | | Item 8: Financial Information | | 64 |
| Annual Report 2012 on Form 20-F | | | | |
| | |
| | | | |
| | |
| | | | |
and mortgage loans that secured Deutsche Bank’s commercial paper investment. On March 23, 2011, the trial court denied in part and granted in part Bank of America’s motion to dismiss the complaint. On October 1, 2012, Deutsche Bank amended its first complaint against Bank of America, to assert claims for breach of contract, breach of fiduciary duty (which includes a claim related to Bank of America’s conversion of mortgages), negligence, negligent misrepresentation, unjust enrichment, and other tort and equitable claims. Bank of America’s motion to dismiss certain aspects of the amended complaint is pending. This litigation is in discovery.
On December 29, 2011, Deutsche Bank commenced a civil litigation in Circuit Court of the 11th Judicial Circuit in Miami Dade County, Florida for professional malpractice and negligent misrepresentation against Deloitte & Touche LLP, the auditors of Taylor Bean’s financial statements, which were consolidated with certain subsidiaries, including wholly owned subsidiary Ocala. On March 20, 2012, the court denied Deloitte & Touche LLP’s motion to dismiss. This litigation is in discovery.
Parmalat Litigation.Following the bankruptcy of the Italian company Parmalat, prosecutors in Parma conducted a criminal investigation against various bank employees, including employees of Deutsche Bank, and brought charges of fraudulent bankruptcy against a number of Deutsche Bank employees and others. The trial commenced in September 2009 and is ongoing.
Certain retail bondholders and shareholders have alleged civil liability against Deutsche Bank in connection with the above-mentioned criminal proceedings. Deutsche Bank has made a formal settlement offer to those retail investors who have asserted claims against Deutsche Bank. This offer has been accepted by some of the retail investors. The outstanding claims will be heard during the criminal trial process.
In January 2011, a group of institutional investors (bondholders and shareholders) commenced a civil claim for damages, in an aggregate amount of approximately€ 130 million plus interest and costs, in the Milan courts against various international and Italian banks, including Deutsche Bank and Deutsche Bank S.p.A., on allegations of cooperation with Parmalat in the fraudulent placement of securities and of deepening the insolvency of Parmalat. Hearings on a preliminary application (made for preliminary matters, including jurisdiction) brought by the defendant banks have taken place and the court has reserved judgment and ordered the case to proceed on the merits. Deutsche Bank has petitioned the Italian Supreme Court for a final assessment of the jurisdiction argument.
Sebastian Holdings Litigation.Deutsche Bank is in litigation in the United Kingdom and the United States with Sebastian Holdings Inc., a Turks and Caicos company (“SHI”). The dispute arose in October 2008 when SHI accumulated trading losses and subsequently failed to meet margin calls issued by Deutsche Bank.
The U.K. action is brought by Deutsche Bank to recover approximately U.S.$ 246 million owed by SHI after the termination of two sets of master trading agreements with SHI. In the U.K. action against SHI, the trial court (upheld by the Court of Appeal) held that it has jurisdiction over Deutsche Bank’s suit and rejected SHI’s claim that the U.K. is an inconvenient forum for the case to be heard. The action is progressing in the English courts, with a trial date of April 2013. As a counterclaim against Deutsche Bank in the U.K., SHI is duplicating aspects of the U.S. claim (described below) in the U.K. proceedings. The amount of the U.K. pleaded counterclaim has not been fully specified and elements may be duplicative, but the pleaded claim is at least NOK 8.28 billion (around€ 1.1 billion or U.S.$ 1.5 billion at recent exchange rates, which do not necessarily equate to the rates applicable to the claim). Substantial consequential loss claims are in addition pleaded based primarily on the profits which SHI claims it would have made on the moneys allegedly lost. The total quantum of these alleged consequential losses is not clear, but some elements have been estimated by SHI in its pleaded claims potentially to amount to NOK 30 billion (around€ 4.0 billion or U.S.$ 5.3 billion at recent exchange rates, which do not necessarily equate to the rates applicable to the claim). SHI is amending its case which is expected to result in a higher damages claim, possibly in the range of€ 5.3 to 7.7 billion or U.S.$ 7 to 10 billion at recent exchange rates, which do not necessarily equate to the rates applicable to the claim. SHI has also brought other claims including for restitution and declaratory relief.
| | | | |
| Deutsche Bank | | Item 8: Financial Information | | 65 |
| Annual Report 2012 on Form 20-F | | | | |
| | |
| | | | |
| | |
| | | | |
The U.S. action is a damages claim brought by SHI against Deutsche Bank in New York State court, arising out of the same circumstances as Deutsche Bank’s suit against SHI in the U.K. and seeking damages of at least U.S.$ 2.5 billion in an amended complaint. SHI’s claims largely relate to allegations that Deutsche Bank breached certain agreements and made improper margin calls. The trial court denied SHI’s request to enjoin Deutsche Bank’s suits in the U.K. The trial court denied Deutsche Bank’s motion to dismiss or stay the U.S. action in favor of the U.K. action, while granting Deutsche Bank’s motion to dismiss SHI’s tort claims but not its contract and quasi-contractual claims. The New York Appellate Division affirmed the trial court’s decision, and the amended complaint was filed after the Appellate Division decision. Deutsche Bank has moved to dismiss certain of the claims alleged in the amended complaint. The trial court granted Deutsche Bank’s motion to dismiss SHI’s tort claims, certain of its contract and quasi-contract claims, and its claims for punitive damages. SHI has filed a notice of appeal from the trial court’s ruling. Discovery in the U.S. action is ongoing.
Trust Preferred Securities Litigation.Deutsche Bank and certain of its affiliates and officers were the subject of a consolidated putative class action, filed in the United States District Court for the Southern District of New York, asserting claims under the federal securities laws on behalf of persons who purchased certain trust preferred securities issued by Deutsche Bank and its affiliates between October 2006 and May 2008. Claims are asserted under Sections 11, 12(a)(2), and 15 of the Securities Act of 1933 that registration statements and prospectuses for such securities contained material misstatements and omissions. An amended and consolidated class action complaint was filed on January 25, 2010. On August 19, 2011, the court granted in part and denied in part the defendants’ motion to dismiss. Following this, plaintiffs filed a second amended complaint, which did not include claims based on the October 2006 issuance of securities. On defendants’ motion for reconsideration, the court on August 10, 2012 dismissed the second amended complaint with prejudice. Plaintiffs have sought reconsideration of that dismissal.
Dividend Policy
We generally pay dividends each year. However, we may not pay dividends in the future at rates we have paid them in previous years. In particular, the dividend proposed for 2012 is€ 0.75, compared to dividends paid of€ 0.75 for 2011 and€ 0.75 for 2010. If we are not profitable, we may not pay dividends at all. If we fail to meet the capital adequacy requirements or the liquidity requirements under the Banking Act, the BaFin may suspend or limit the payment of dividends. See “Item 4: Information on the Company – Regulation and Supervision – Regulation and Supervision in Germany”.
Under German law, our dividends are based on the unconsolidated results of Deutsche Bank AG as prepared in accordance with German accounting rules. Our Management Board, which prepares the annual financial statements of Deutsche Bank AG on an unconsolidated basis, and our Supervisory Board, which reviews them, first allocate part of Deutsche Bank’s annual surplus (if any) to our statutory reserves and to any losses carried forward, as it is legally required to do. If deferred tax assets net of deferred tax liabilities, self-developed intangible assets or unrealized gains on plan assets are recognized, a profit distribution is blocked to the extent that the total of those assets does not exceed distributable retained earnings including profit or loss carried forward from previous year. They then allocate the remainder between other revenue reserves (or retained earnings) and balance sheet profit (or distributable profit). They may allocate up to one-half of this remainder to other revenue reserves, and must allocate at least one-half to balance sheet profit. We then distribute the full amount of the balance sheet profit of Deutsche Bank AG if the Annual General Meeting so resolves. The Annual General Meeting may resolve a non-cash distribution instead of or in addition to a cash dividend. However, we are not legally required to distribute our balance sheet profit to our shareholders to the extent that we have issued participatory rights (Genussrechte) or granted a silent participation (stille Gesellschaft) that accord their holders the right to a portion of our distributable profit.
We declare dividends by resolution of the Annual General Meeting and pay them once a year. Dividends approved at a General Meeting are payable on the first stock exchange trading day after that meeting, unless otherwise decided at that meeting. In accordance with the German Stock Corporation Act, the record date for determining which holders of our ordinary shares are entitled to the payment of dividends, if any, or other distributions whether cash, stock or property, is the date of the General Meeting at which such dividends or other
| | | | |
| Deutsche Bank | | Item 9: The Offer and Listing | | 66 |
| Annual Report 2012 on Form 20-F | | | | |
| | |
| | | | |
| | |
| | | | |
distributions are declared. If we issue a new class of shares, our Articles of Association permit us to declare a different dividend entitlement for the new class of shares.
Significant Changes
Except as otherwise stated in this document, there have been no significant changes subsequent to December 31, 2012.
Item 9: The Offer and Listing
Offer and Listing Details and Markets
Our share capital consists of ordinary shares issued in registered form without par value. Under German law, shares without par value are deemed to have a “nominal” value equal to the total amount of share capital divided by the number of shares. Our shares have a nominal value of€ 2.56 per share.
The principal trading market for our shares is the Frankfurt Stock Exchange. Our shares are also traded on the six other German stock exchanges (Berlin, Duesseldorf, Hamburg, Hanover, Munich and Stuttgart) and on the New York Stock Exchange.
We maintain a share register in Frankfurt am Main and, for the purposes of trading our shares on the New York Stock Exchange, a share register in New York.
All shares on German stock exchanges trade in euros, and all shares on the New York Stock Exchange trade in U.S. dollars. The following table sets forth, for the calendar periods indicated, high, low and period-end prices for our shares as reported by the Frankfurt Stock Exchange and the New York Stock Exchange.
| | | | |
| Deutsche Bank | | Item 9: The Offer and Listing | | 67 |
| Annual Report 2012 on Form 20-F | | | | |
| | |
| | | | |
| | |
| | | | |
| | | | | | | | | | | | | | | | | | | | | | | | |
| | | Price per share (Xetra)1 | | | Price per share (NYSE)2 | |
| | | High
(in€) | | | Low
(in€) | | | Period-end
(in€) | | | High
(in U.S.$) | | | Low
(in U.S.$) | | | Period-end
(in U.S.$) | |
Monthly 2013: | | | | | | | | | | | | | | | | | | | | | | | | |
February | | | 38.73 | | | | 33.94 | | | | 35.09 | | | | 52.92 | | | | 44.74 | | | | 45.73 | |
January | | | 38.54 | | | | 33.45 | | | | 38.21 | | | | 52.30 | | | | 44.91 | | | | 51.66 | |
| | | | | | | | | | | | | | | | | | | | | | | | |
Monthly 2012: | | | | | | | | | | | | | | | | | | | | | | | | |
December | | | 35.50 | | | | 32.12 | | | | 32.95 | | | | 46.39 | | | | 42.51 | | | | 44.29 | |
November | | | 36.24 | | | | 32.10 | | | | 33.94 | | | | 46.63 | | | | 40.80 | | | | 44.13 | |
October | | | 35.83 | | | | 30.64 | | | | 34.97 | | | | 46.90 | | | | 40.07 | | | | 45.71 | |
September | | | 34.13 | | | | 27.27 | | | | 30.75 | | | | 44.96 | | | | 34.65 | | | | 39.65 | |
| | | | | | | | | | | | | | | | | | | | | | | | |
Quarterly 2012: | | | | | | | | | | | | | | | | | | | | | | | | |
Fourth Quarter | | | 36.24 | | | | 30.64 | | | | 32.95 | | | | 46.90 | | | | 40.07 | | | | 44.29 | |
Third Quarter | | | 34.13 | | | | 22.11 | | | | 30.75 | | | | 44.96 | | | | 27.05 | | | | 39.65 | |
Second Quarter | | | 38.02 | | | | 26.61 | | | | 28.50 | | | | 50.26 | | | | 33.14 | | | | 36.17 | |
First Quarter | | | 39.51 | | | | 26.17 | | | | 37.31 | | | | 52.53 | | | | 33.29 | | | | 49.79 | |
| | | | | | | | | | | | | | | | | | | | | | | | |
Quarterly 2011: | | | | | | | | | | | | | | | | | | | | | | | | |
Fourth Quarter | | | 33.86 | | | | 23.40 | | | | 29.44 | | | | 47.95 | | | | 31.26 | | | | 37.86 | |
Third Quarter | | | 42.08 | | | | 20.79 | | | | 26.32 | | | | 61.23 | | | | 28.58 | | | | 34.61 | |
Second Quarter | | | 44.56 | | | | 38.60 | | | | 40.75 | | | | 66.00 | | | | 54.82 | | | | 59.24 | |
First Quarter | | | 48.70 | | | | 39.24 | | | | 41.49 | | | | 65.77 | | | | 51.88 | | | | 59.07 | |
| | | | | | | | | | | | | | | | | | | | | | | | |
Annual: | | | | | | | | | | | | | | | | | | | | | | | | |
2012 | | | 39.51 | | | | 22.11 | | | | 32.95 | | | | 52.53 | | | | 27.05 | | | | 44.29 | |
2011 | | | 48.70 | | | | 20.79 | | | | 29.44 | | | | 66.00 | | | | 28.58 | | | | 37.86 | |
2010 | | | 55.11 | | | | 35.93 | | | | 39.10 | | | | 82.16 | | | | 47.35 | | | | 52.05 | |
2009 | | | 53.05 | | | | 14.00 | | | | 44.98 | | | | 84.93 | | | | 21.15 | | | | 70.91 | |
2008 | | | 81.73 | | | | 16.92 | | | | 25.33 | | | | 130.79 | | | | 22.45 | | | | 40.69 | |
| | | | | | | | | | | | | | | | | | | | | | | | |
Note: Data is based on Bloomberg and NYSE Euronext.
| 1 | Historical share prices have been adjusted on October 6, 2010 with retroactive effect to reflect the capital increase by multiplying a correcting factor of 0.912477. |
| 2 | Historical share prices are unadjusted prior to October 6, 2010. |
For a discussion of the possible effects of fluctuations in the exchange rate between the euro and the U.S. dollar on the price of our shares, see “Item 3: Key Information – Exchange Rate and Currency Information.”
You should not rely on our past share performance as a guide to our future share performance.
Plan of Distribution
Not required because this document is filed as an annual report.
Selling Shareholders
Not required because this document is filed as an annual report.
Dilution
Not required because this document is filed as an annual report.
Expenses of the Issue
Not required because this document is filed as an annual report.
| | | | |
| Deutsche Bank | | Item 10: Additional Information | | 68 |
| Annual Report 2012 on Form 20-F | | | | |
| | |
| | | | |
| | |
| | | | |
Item 10: Additional Information
Share Capital
Not required because this document is filed as an annual report.
Memorandum and Articles of Association
For information regarding our Articles of Association, please refer to the discussions under the corresponding sections of our Annual Reports on Form 20-F for the years ended December 31, 2008 and December 31, 2011, which discussions we hereby incorporate by reference into this document. Copies of our Articles of Association are publicly available at the Commercial Register in Frankfurt am Main, and an English translation is filed as Exhibit 1.1 to this Annual Report. For more information on provisions of our Articles of Association relating to our Supervisory Board and Management Board, see “Item 6: Directors, Senior Management and Employees.” For a summary of our dividend policy and legal basis for dividends under German law, see “Item 8: Financial Information – Dividend Policy.”
Notification Requirements
Disclosure of Interests in a Listed Stock Corporation
Disclosure Obligations under the German Securities Trading Act
Pursuant to the German Securities Trading Act (Wertpapierhandelsgesetz), any shareholder whose voting interest in a listed company like Deutsche Bank, through acquisition, sale or by other means, reaches, exceeds or falls below a 3 %, 5 %, 10 %, 15 %, 20 %, 25 %, 30 %, 50 % or 75 % threshold must notify Deutsche Bank and the BaFin of its current aggregate voting interest in writing and without undue delay, but at the latest within four trading days. In connection with this requirement, the German Securities Trading Act contains various provisions regarding the attribution of shareholdings to the person who actually controls the voting rights attached to the shares. For instance, a shareholder will be attributed shares held by a third party if the shareholder controls the respective third party, as well as any shares which are held by a third party for the account of a shareholder.
Furthermore, the voting rights attached to a third party’s shares may be required to be attributed to another shareholder if the shareholder coordinates its conduct concerning the listed company with the third party (so-called “acting in concert”) either through an agreement or other means. Acting in concert is deemed to exist if the parties coordinate their voting at the listed company’s general shareholders’ meetings or, outside general shareholders’ meetings, coordinate their actions with the goal of extensively and permanently modifying the listed company’s corporate strategy. Shareholders acting in concert must attribute the voting rights of other shareholders acting in concert to their own. Any kind of cooperation among shareholders that is designed to effect a permanent and material change in the business strategy of the listed company may result in the attribution of voting rights, i.e., cooperation among shareholders need not necessarily relate specifically to the exercise of voting rights; coordination in individual cases, for instance, will not trigger the attribution of voting rights.
Shareholders failing to comply with their notification obligations will be precluded from exercising any rights attached to their shares (including voting rights and the right to receive dividends) until proper notice has been given. In the event of a willful or grossly negligent breach of the notification obligations, shareholders will be prevented from exercising their voting rights for a six-month period commencing upon the delayed submission of the notification, unless the shareholder submitted an incorrect notification deviating no more than 10 % from
| | | | |
| Deutsche Bank | | Item 10: Additional Information | | 69 |
| Annual Report 2012 on Form 20-F | | | | |
| | |
| | | | |
| | |
| | | | |
the actual percentage of voting rights and the shareholder notified the listed company that his or her holdings reached, exceeded or fell below the notification thresholds described above. Non-compliance with the disclosure requirement may also result in a fine.
Except for the 3 % threshold, similar notification obligations exist for reaching, exceeding or falling below the thresholds described above when a person holds other financial instruments that entitle their holder to unilaterally acquire existing shares of the listed company carrying voting rights pursuant to a binding legal agreement. Holdings in the relevant financial instruments are to be aggregated with the voting rights attached to shares for purposes of determining whether any of the relevant notification thresholds have been triggered. According to the German Act on Strengthening Investor Protection and Improving the Functionality of the Capital Market (Gesetz zur Stärkung des Anlegerschutzes und Verbesserung der Funktionsfähigkeit des Kapitalmarktes), the relevant part of which came into effect as of February 1, 2012, this obligation has been extended to “other instruments” which may not qualify as “financial instruments” within the meaning of the German Securities Trading Act that grant the holder the right to acquire unilaterally, based on a legally binding agreement, existing shares of Deutsche Bank carrying voting rights.
Deutsche Bank must publish the foregoing notifications without undue delay, but no later than within three trading days after their receipt, and report the publication to the BaFin.
Shareholders whose voting rights reach or exceed thresholds of 10 % of the voting rights in a listed company, or higher thresholds, are obliged to inform the company within 20 trading days of the purpose of their investment and the origin of the funds used for such investment, unless the articles of association of the listed company provide otherwise. Our Articles of Association do not contain such a provision.
Disclosure Obligations under the German Securities Acquisition and Takeover Act
Pursuant to the German Securities Acquisition and Takeover Act, any person whose voting interest reaches or exceeds 30 % of the voting shares of a listed stock corporation must, within seven calendar days, publish this fact (including the percentage of its voting rights) on the Internet and by means of an electronically operated financial information dissemination system. In addition, the person must subsequently make a mandatory public tender offer within four weeks to all shareholders of the listed company unless an exemption has been granted. The German Securities Acquisition and Takeover Act contains a number of provisions intended to ensure that shareholdings are attributed to those persons who actually control the voting rights attached to the shares. The provisions regarding coordinated conduct as part of the German Securities Acquisition and Takeover Act (so-called “acting in concert”) and the rules on the attribution of voting rights attached to shares of third parties are the same as the statutory securities trading provisions described above under “Disclosure Obligations under the German Securities Trading Act” except with respect to voting rights of shares underlying financial instruments whose holders are vested with the right, pursuant to a legally binding agreement, to unilaterally acquire existing voting shares of the listed company and voting rights which may be acquired on the basis of financial and other instruments enabling the acquisition of voting shares. If a shareholder fails to provide notice on reaching or exceeding the 30 % threshold, or fails to make a public tender offer, the shareholder will be precluded from exercising any rights associated with its shares (including voting and dividend rights) until proper notice has been given. In addition,
non-compliance with the disclosure requirement may result in a fine.
Disclosure of Participations in a Credit Institution
The German Banking Act (Kreditwesengesetz) requires any person intending to acquire, alone or acting in concert with another person, a significant participation (bedeutende Beteiligung) in a credit or financial services institution to notify the BaFin and the Bundesbank without undue delay and in writing of the intended acquisition. A significant participation is deemed to exist if at least 10 % of the capital of, or the voting rights in, the institution is held directly or indirectly through one or more subsidiaries or a similar relationship or in concert with other persons or enterprises, or if a significant influence can be exercised on the management of the institution in which a participating interest is held. The required notice must contain information demonstrating, among others, the reliability of the person or, in the case of a corporation or other legal entity, the reliability of its directors and officers.
| | | | |
| Deutsche Bank | | Item 10: Additional Information | | 70 |
| Annual Report 2012 on Form 20-F | | | | |
| | |
| | | | |
| | |
| | | | |
A person holding a significant participation shall also notify the BaFin and the Bundesbank without undue delay and in writing if he intends to increase the amount of the significant participation up to or beyond the thresholds of 20 %, 30 % or 50 % of the voting rights or capital or in such way that the institution comes under such person’s control or if such person intends to reduce the participation below 10 % or below one of the other thresholds described above.
The BaFin may, within a period of 60 business days following its confirmation that it received the complete notification, prohibit the intended acquisition if there appears to be reason to assume that the acquirer or its directors and officers are not reliable or financially sound, that the participation would impair the effective supervision of the relevant banking institution, that the prospective managing director (Geschäftsleiter) is not reliable or not qualified, that money laundering or financing of terrorism has occurred or been attempted in connection with the intended acquisition, or that there would be an increased risk of such illegal acts as a result of the intended acquisition. During its assessment period the BaFin may request further information necessary for its assessment. Such a request delays the expiration of the assessment period by up to 20 business days.
If a person acquires a significant participation despite such prohibition or without making the required notification, the BaFin may prohibit the person from exercising the voting rights attached to the shares. In addition, non-compliance with the disclosure requirement may result in the imposition of a fine in accordance with statutory provisions. Moreover, the BaFin may order that any disposition of the shares requires its approval and may ultimately appoint a trustee to exercise the voting rights attached to the shares or to sell the shares to the extent they constitute a significant participation.
Review of Acquisition of 25 % or more by the German Federal Ministry of Economics and Technology
Pursuant to the German Foreign Trade Act (Außenwirtschaftsgesetz) and the Foreign Trade Regulation (Außenwirtschaftsverordnung), the direct or indirect acquisition of 25 % or more of the voting rights in a German company by investors from outside the European Union and the European Free Trade Association (Iceland, Liechtenstein, Norway and Switzerland) or by entities which are owned by 25 % or more by investors from outside the aforementioned region may be reviewed by the German Federal Ministry of Economics and Technology. If such Ministry determines that the acquisition poses a threat to the public policy or public security of Germany, it may impose conditions on or suspend the acquisition or require that it is unwound. The decision to review an acquisition must be made within three months following the conclusion of the contract or publication of the decision to launch a take-over bid or publication of the acquisition of control. The review must be completed within two months following receipt of the complete acquisition documents. No notification of the acquisition is required but the acquirer may seek pre-clearance of a proposed acquisition from the Federal Ministry of Economics and Technology.
German Act on the Prevention of Improper Securities and Derivatives Transactions (ban on naked short-selling)
The German Securities Trading Act was amended in 2010 by the German Act on the Prevention of Improper Securities and Derivatives Transactions (Gesetz zur Vorbeugung gegen missbräuchliche Wertpapier- und Derivategeschäfte) on July 21, 2010 banning naked short-selling. In particular, this act governs among other things the prohibition of naked short-selling of shares which are admitted for trading on a regulated market on a domestic stock exchange. A net short selling position arises if, after netting all financial instruments held by the market participant, the market participant has an aggregate economic interest in the listed company’s shares which corresponds to a short sale of the shares. At the same time, the act authorizes the BaFin – in agreement with the Bundesbank – to prevent or suspend trading in individual financial instruments temporarily.
| | | | |
| Deutsche Bank | | Item 10: Additional Information | | 71 |
| Annual Report 2012 on Form 20-F | | | | |
| | |
| | | | |
| | |
| | | | |
Material Contracts
In the usual course of our business, we enter into numerous contracts with various other entities. We have not, however, entered into any material contracts outside the ordinary course of our business within the past two years.
Exchange Controls
As in other member states of the European Union, regulations issued by the competent European Union authorities to comply with United Nations Resolutions have caused freeze orders on assets of certain legal and natural persons designated in such regulations. In addition, Regulation (EU) No. 961/2010 of October 25, 2010 on restrictive measures against Iran requires that transfers of funds from or to Iranian persons, entities or bodies that exceed€ 10,000 (or the equivalent in a foreign currency) shall be notified in advance in writing to the Bundesbank. If the amount to be transferred exceeds€ 40,000 (or the equivalent in a foreign currency), a prior authorization of the Bundesbank is required.
With some exceptions, corporations or individuals residing in Germany are required to report to the Bundesbank any payment received from, or made to or for the account of, a nonresident corporation or individual that exceeds€ 12,500 (or the equivalent in a foreign currency). This reporting requirement is for statistical purposes.
Subject to the above-mentioned exceptions, there are currently no German laws, decrees or regulations that would prevent the transfer of capital or remittance of dividends or other payments to our shareholders who are not residents or citizens of Germany.
There are also no restrictions under German law or our Articles of Association concerning the right of nonresident or foreign shareholders to hold our shares or to exercise any applicable voting rights. Where the investment reaches or exceeds certain thresholds, however, certain reporting obligations apply and the investment may become subject to review by the BaFin and other competent authorities. For more information see “Item 10: Additional Information – Notification Requirements”.
Taxation
The following is a summary of material German and United States federal income tax consequences of the ownership and disposition of shares for a resident of the United States for purposes of the income tax convention between the United States and Germany (the “Treaty”) who is fully eligible for benefits under the Treaty. A U.S. resident will generally be entitled to Treaty benefits if it is:
| — | | the beneficial owner of shares (and of the dividends paid with respect to the shares); |
| — | | an individual resident of the United States, a U.S. corporation, or a partnership, estate or trust to the extent its income is subject to taxation in the United States in its hands or in the hands of its partners or beneficiaries; |
| — | | not also a resident of Germany for German tax purposes; and |
| — | | not subject to “anti-treaty shopping” articles under German domestic law or the Treaty that apply in limited circumstances. |
The Treaty benefits discussed below generally are not available to shareholders who hold shares in connection with the conduct of business through a permanent establishment in Germany. The summary does not discuss the treatment of those shareholders.
| | | | |
| Deutsche Bank | | Item 10: Additional Information | | 72 |
| Annual Report 2012 on Form 20-F | | | | |
| | |
| | | | |
| | |
| | | | |
The summary does not purport to be a comprehensive description of all of the tax considerations that may be relevant to any particular shareholder, including tax considerations that arise from rules of general application or that are generally assumed to be known by shareholders. In particular, the summary deals only with shareholders that will hold shares as capital assets and does not address the tax treatment of shareholders that are subject to special rules, such as fiduciaries of pension,
profit-sharing or other employee benefit plans, banks, insurance companies, dealers in securities or currencies, persons that hold shares as a position in a straddle, conversion transaction, synthetic security or other integrated financial transaction, persons that elect mark-to-market treatment, persons that own, directly or indirectly, ten percent or more of our voting stock, persons that hold shares through a partnership or hybrid entity and persons whose “functional currency” is not the U.S. dollar. The summary is based on German and U.S. laws, treaties and regulatory interpretations, including in the United States current and proposed U.S. Treasury regulations as of the date hereof, all of which are subject to change (possibly with retroactive effect).
Shareholders should consult their own advisors regarding the tax consequences of the ownership and disposition of shares in light of their particular circumstances, including the effect of any state, local, or other national laws.
Taxation of Dividends
Dividends that we pay are subject to German withholding tax at an aggregate rate of 26.375 % (consisting of a 25 % withholding tax and a 1.375 % surcharge). Under the Treaty, a U.S. resident will be entitled to receive a refund from the German tax authorities of 11.375 in respect of a declared dividend of 100. For example, for a declared dividend of 100, a U.S. resident initially will receive 73.625 and may claim a refund from the German tax authorities of 11.375 and, therefore, receive a total cash payment of 85 (i.e., 85 % of the declared dividend). For U.S. tax purposes, a U.S. resident will be deemed to have received total dividends of 100. The gross amount of dividends that a U.S. resident receives (which includes amounts withheld in respect of German withholding tax) generally will be subject to U.S. federal income taxation as foreign source dividend income, and will not be eligible for the dividends received deduction generally allowed to U.S. corporations. German withholding tax at the 15 % rate provided under the Treaty will be treated as a foreign income tax that, subject to generally applicable limitations under U.S. tax law, is eligible for credit against a U.S. resident’s U.S. federal income tax liability or, at its election, may be deducted in computing taxable income. Thus, for a declared dividend of 100, a U.S. resident will be deemed to have paid German taxes of 15. A U.S. resident cannot claim credits for German taxes that would have been refunded to it if it had filed a claim for refund. Foreign tax credits will not be allowed for withholding taxes imposed in respect of certain short-term or hedged positions. The creditability of foreign withholding taxes may be limited in certain situations, including where the burden of foreign taxes is separated inappropriately from the related foreign income.
Subject to certain exceptions for short-term and hedged positions, “qualified dividends” received by certain non-corporate U.S. shareholders will generally be subject to taxation in the United States at a lower rate than other ordinary income. Dividends received will be qualified dividends if we (i) are eligible for the benefits of a comprehensive income tax treaty with the United States that the U.S. Internal Revenue Service (“IRS”) has approved for purposes of the qualified dividend rules and (ii) were not, in the year prior to the year in which the dividend was paid, and are not, in the year in which the dividend is paid, a passive foreign investment company (“PFIC”). The Treaty has been approved for purposes of the qualified dividend rules, and we believe we qualify for benefits under the Treaty. The determination of whether we are a PFIC must be made annually and is dependent on the particular facts and circumstances at the time. It requires an analysis of our income and valuation of our assets, including goodwill and other intangible assets. Based on our audited financial statements and relevant market and shareholder data, we believe that we were not a PFIC for U.S. federal income tax purposes with respect to our taxable years ended December 31, 2011 or December 31, 2012. In addition, based on our current expectations regarding the value and nature of our assets, the sources and nature of our income, and relevant market and shareholder data, we do not currently anticipate becoming a PFIC for our taxable year ending December 31, 2013, or for the foreseeable future. However, the PFIC rules are complex and their application to financial services companies is unclear. Each U.S. shareholder should consult its own
| | | | |
| Deutsche Bank | | Item 10: Additional Information | | 73 |
| Annual Report 2012 on Form 20-F | | | | |
| | |
| | | | |
| | |
| | | | |
tax advisor regarding the potential applicability of the PFIC regime to us and its implications for their particular circumstances.
If a U.S. resident receives a dividend paid in euros, it will recognize income in a U.S. dollar amount calculated by reference to the exchange rate in effect on the date of receipt, regardless of whether the payment is in fact converted into U.S. dollars. If dividends are converted into U.S. dollars on the date of receipt, a U.S. resident generally should not be required to recognize foreign currency gain or loss in respect of the dividend income but may be required to recognize foreign currency gain or loss on the receipt of a refund in respect of German withholding tax to the extent the U.S. dollar value of the refund differs from the U.S. dollar equivalent of that amount on the date of receipt of the underlying dividend.
Refund Procedures
To claim a refund, a U.S. resident must submit, within four years from the end of the calendar year in which the dividend is received, a claim for refund to the German tax authorities together with the original bank voucher (or certified copy thereof) issued by the paying entity documenting the tax withheld. For dividends received after 2011, the claim for refund must be accompanied by a withholding tax certificate (Kapitalertragsteuerbescheinigung) on officially prescribed form and issued by the institution that withheld the tax.
Claims for refunds are made on a special German claim for refund form (Form E-USA), which must be filed with the German tax authorities: Bundeszentralamt für Steuern, An der Küppe 1, D-53225 Bonn, Germany. The German claim for refund forms may be obtained inter alia from the German tax authorities at the same address where the applications are filed or can be downloaded from the homepage of the Bundeszentralamt für Steuern (www.bzst.bund.de). A U.S. resident must also submit to the German tax authorities a certification (on IRS Form 6166) with respect to its last filed U.S. federal income tax return. Requests for IRS Form 6166 are made on IRS Form 8802, which requires payment of a user fee. IRS Form 8802 and its instructions can be obtained from the IRS website at www.irs.gov. Instead of the individual refund procedure described above, a U.S. resident may use an IT-supported quick-refund procedure (“Datenträgerverfahren – DTV”/“Data Medium Procedure – DMP”). If the U.S. resident’s bank or broker elects to participate in the DMP, it will perform administrative functions necessary to claim the Treaty refund for the beneficiaries. The refund beneficiaries must provide specified information to the DMP participant and confirm to the DMP participant that they meet the conditions of the Treaty provisions and that they authorize the DMP participant to file applications and receive notices and payments on their behalf.
The refund beneficiaries also must provide a “certification of filing a tax return” on IRS Form 6166 with the DMP participant. In addition, if the individual refund procedure requires a withholding tax certificate (see above), such certificate is generally also necessary under the DMP.
The German tax authorities reserve the right to audit the entitlement to tax refunds for several years following their payment pursuant to the Treaty in individual cases. The DMP participant must assist with the audit by providing the necessary details or by forwarding the queries to the respective refund beneficiaries/shareholders.
The German tax authorities will issue refunds denominated in euros. In the case of shares held through banks or brokers participating in the Depository Trust Company, the refunds will be issued to the Depository Trust Company, which will convert the refunds to U.S. dollars. The resulting amounts will be paid to banks or brokers for the account of holders.
If a U.S. resident holds its shares through a bank or broker who elects to participate in the DMP, it could take at least three weeks for it to receive a refund after a combined claim for refund has been filed with the German tax authorities. If a U.S. resident files a claim for refund directly with the German tax authorities, it could take at least eight months for it to receive a refund. The length of time between filing a claim for refund and receipt of that refund is uncertain and we can give no assurances as to when any refund will be received.
| | | | |
| Deutsche Bank | | Item 10: Additional Information | | 74 |
| Annual Report 2012 on Form 20-F | | | | |
| | |
| | | | |
| | |
| | | | |
Taxation of Capital Gains
Under the Treaty, a U.S. resident will not be subject to German capital gains tax in respect of a sale or other disposition of shares. For U.S. federal income tax purposes, a U.S. holder will recognize capital gain or loss on the sale or other disposition of shares in an amount equal to the difference between such holder’s tax basis in the shares and the U.S. dollar value of the amount realized from their sale or other disposition. Such gain or loss will be capital gain or loss, and will be long-term capital gain or loss if the shares were held for more than one year. The net amount of long-term capital gain realized by an individual generally is subject to taxation at a lower rate than ordinary income. Any such gain generally would be treated as income arising from sources within the United States; any such loss would generally be allocated against U.S. source income. The ability to offset capital losses against ordinary income is subject to limitations.
Shareholders whose shares are held in an account with a German bank or financial services institution (including a German branch of a non-German bank or financial services institution) are urged to consult their own advisors. This summary does not discuss their particular tax situation.
United States Information Reporting and Backup Withholding
Dividends and payments of the proceeds on a sale of shares, paid within the United States or through certain U.S.-related financial intermediaries are subject to information reporting and may be subject to backup withholding unless the U.S. resident (i) is a corporation or other exempt recipient or (ii) provides a taxpayer identification number and certifies (on IRS Form W-9) that no loss of exemption from backup withholding has occurred. Shareholders that are not U.S. persons generally are not subject to information reporting or backup withholding.
However, a non-U.S. person may be required to provide a certification (generally on IRS Form W-8BEN) of its non-U.S. status in connection with payments received in the United States or through a U.S.-related financial intermediary.
Backup withholding tax is not an additional tax, and any amounts withheld under the backup withholding rules will be allowed as a refund or a credit against a holder’s U.S. federal income tax liability, provided the required information is furnished to the IRS.
Shareholders may be subject to other U.S. information reporting requirements. Shareholders should consult their own advisors regarding the application of U.S. information reporting rules in light of their particular circumstances.
German Gift and Inheritance Taxes
Under the current estate, inheritance and gift tax treaty between the United States and Germany (the “Estate Tax Treaty”), a transfer of shares generally will not be subject to German gift or inheritance tax so long as the donor or decedent, and the heir, donee or other beneficiary, were not domiciled in Germany for purposes of the Estate Tax Treaty at the time the gift was made, or at the time of the decedent’s death, and the shares were not held in connection with a permanent establishment or fixed base in Germany.
The Estate Tax Treaty provides a credit against U.S. federal estate and gift tax liability for the amount of inheritance and gift tax paid in Germany, subject to certain limitations, where shares are subject to German inheritance or gift tax and United States federal estate or gift tax.
Other German Taxes
There are presently no German net wealth, transfer, stamp or other similar taxes that would apply to a U.S. resident as a result of the receipt, purchase, ownership or sale of shares.
| | | | |
| Deutsche Bank | | Item 12: Description of Securities other than Equity Securities | | 75 |
| Annual Report 2012 on Form 20-F | | | | |
| | |
| | | | |
| | |
| | | | |
Dividends and Paying Agents
Not required because this document is filed as an annual report.
Statement by Experts
Not required because this document is filed as an annual report.
Documents on Display
We are subject to the informational requirements of the Securities Exchange Act of 1934, as amended. In accordance with these requirements, we file reports and other information with the Securities and Exchange Commission. You may inspect and copy these materials, including this document and its exhibits, at the Commission’s Public Reference Room at 100 F Street, N.E., Room 1580, Washington, D.C. 20549, and at the Commission’s regional offices at 175 W. Jackson Boulevard, Suite 900, Chicago, Illinois 60604, and at 3 World Financial Center, Suite 400, New York, New York, 10281-1022. You may obtain copies of the materials from the Public Reference Room of the Commission at 100 F Street, N.E., Room 1580, Washington, D.C. 20549, at prescribed rates. You may obtain information on the operation of the Commission’s Public Reference Room by calling the Commission in the United States at 1-800-SEC-0330. Our Securities and Exchange Commission filings are also available over the Internet at the Securities and Exchange Commission’s website at www.sec.gov under File Number 001-15242. In addition, you may visit the offices of the New York Stock Exchange at 20 Broad Street, New York, New York 10005 to inspect material filed by us.
Subsidiary Information
Not applicable.
Item 11: Quantitative and Qualitative Disclosures about Credit, Market and Other Risk
For Quantitative and Qualitative Disclosures about Credit Market and Other Risk, please see “Management Report: Risk Report” beginning on page 43 of the Financial Report.
Please see pages S-1 through S-15 of the Supplemental Financial Information, which pages are incorporated by reference herein, for information required by SEC Industry Guide 3.
Item 12: Description of Securities other than Equity Securities
Not required because this document is filed as an annual report and our ordinary shares are not represented by American Depositary Receipts.
| | | | |
| Deutsche Bank | | Item 15: Controls and Procedures | | 76 |
| Annual Report 2012 on Form 20-F | | | | |
| | |
| | | | |
| | |
| | | | |
PART II
Item 13: Defaults, Dividend Arrearages and Delinquencies
Not applicable.
Item 14: Material Modifications to the Rights of Security Holders and Use of Proceeds
Not applicable.
Item 15: Controls and Procedures
Disclosure Controls and Procedures
An evaluation was carried out under the supervision and with the participation of our management, including our Co-Chief Executive Officers and Chief Financial Officer, of the effectiveness of the design and operation of our disclosure controls and procedures (as defined in Rule 13a-15(e) under the Securities Exchange Act of 1934) as of December 31, 2012. There are, as described below, inherent limitations to the effectiveness of any control system, including disclosure controls and procedures. Accordingly, even effective disclosure controls and procedures can provide only reasonable assurance of achieving their control objectives. Based upon such evaluation, our Co-Chief Executive Officers and Chief Financial Officer concluded that the design and operation of our disclosure controls and procedures were effective as of December 31, 2012.
Management’s Annual Report on Internal Control over Financial Reporting
Management of Deutsche Bank Aktiengesellschaft, together with its consolidated subsidiaries, is responsible for establishing and maintaining adequate internal control over financial reporting. Our internal control over financial reporting is a process designed under the supervision of our co-principal executive officers and our principal financial officer to provide reasonable assurance regarding the reliability of financial reporting and the preparation of the firm’s financial statements for external reporting purposes in accordance with International Financial Reporting Standards. As of December 31, 2012, management conducted an assessment of the effectiveness of our internal control over financial reporting based on the framework established in Internal Control – Integrated Framework issued by the Committee of Sponsoring Organizations of the Treadway Commission (COSO). Based on the assessment performed, management has determined that our internal control over financial reporting as of December 31, 2012 was effective based on the COSO framework.
| | | | |
| Deutsche Bank | | Item 15: Controls and Procedures | | 77 |
| Annual Report 2012 on Form 20-F | | | | |
| | |
| | | | |
| | |
| | | | |
KPMG AG Wirtschaftsprüfungsgesellschaft, the registered public accounting firm that audited the financial statements included in this document, has issued an attestation report on our internal control over financial reporting, which attestation report is set forth below.
Report of Independent Registered Public Accounting Firm
To the Supervisory Board of
Deutsche Bank Aktiengesellschaft:
We have audited Deutsche Bank Aktiengesellschaft and subsidiaries’ (the “Company” or “Deutsche Bank”) internal control over financial reporting as of December 31, 2012, based on criteria established in Internal Control Integrated Framework issued by the Committee of Sponsoring Organizations of the Treadway Commission (COSO). The Company’s management is responsible for maintaining effective internal control over financial reporting and for its assessment of the effectiveness of internal control over financial reporting, included in the accompanying “Management’s Annual Report on Internal Control over Financial Reporting”. Our responsibility is to express an opinion on the Company’s internal control over financial reporting based on our audit.
We conducted our audit in accordance with the standards of the Public Company Accounting Oversight Board (United States). Those standards require that we plan and perform the audit to obtain reasonable assurance about whether effective internal control over financial reporting was maintained in all material respects. Our audit included obtaining an understanding of internal control over financial reporting, assessing the risk that a material weakness exists, and testing and evaluating the design and operating effectiveness of internal control based on the assessed risk. Our audit also included performing such other procedures as we considered necessary in the circumstances. We believe that our audit provides a reasonable basis for our opinion.
A company’s internal control over financial reporting is a process designed to provide reasonable assurance regarding the reliability of financial reporting and the preparation of financial statements for external purposes in accordance with generally accepted accounting principles. A company’s internal control over financial reporting includes those policies and procedures that (1) pertain to the maintenance of records that, in reasonable detail, accurately and fairly reflect the transactions and dispositions of the assets of the company; (2) provide reasonable assurance that transactions are recorded as necessary to permit preparation of financial statements in accordance with generally accepted accounting principles, and that receipts and expenditures of the company are being made only in accordance with authorizations of management and directors of the company; and (3) provide reasonable assurance regarding prevention or timely detection of unauthorized acquisition, use, or disposition of the company’s assets that could have a material effect on the financial statements.
Because of its inherent limitations, internal control over financial reporting may not prevent or detect misstatements. Also, projections of any evaluation of effectiveness to future periods are subject to the risk that controls may become inadequate because of changes in conditions, or that the degree of compliance with the policies or procedures may deteriorate.
In our opinion, Deutsche Bank maintained, in all material respects, effective internal control over financial reporting as of December 31, 2012, based on criteria established in Internal Control Integrated Framework issued by the Committee of Sponsoring Organizations of the Treadway Commission.
| | | | |
| Deutsche Bank | | Item 16A: Audit Committee Financial Expert | | 78 |
| Annual Report 2012 on Form 20-F | | | | |
| | |
| | | | |
| | |
| | | | |
We also have audited, in accordance with the standards of the Public Company Accounting Oversight Board (United States), the consolidated balance sheets of Deutsche Bank Aktiengesellschaft and subsidiaries as of December 31, 2012 and 2011 on pages 243 to 382 of the Financial Report and the related consolidated statements of income, comprehensive income, changes in equity, and cash flows for each of the years in the three-year period ended December 31, 2012, including the disclosures described as being part of the financial statements within the Risk Report section on pages 43 to 186 of the Financial Report and our report dated April 11, 2013 expressed an unqualified opinion on those consolidated financial statements.
Frankfurt am Main, Germany
April 11, 2013
KPMG AG
Wirtschaftsprüfungsgesellschaft
Change in Internal Control over Financial Reporting
There was no change in our internal control over financial reporting identified in connection with the evaluation referred to above that occurred during the year ended December 31, 2012 that has materially affected, or is reasonably likely to materially affect, our internal control over financial reporting.
A control system, no matter how well conceived and operated, can provide only reasonable, not absolute, assurance that the objectives of the control system are met. As such, disclosure controls and procedures or systems for internal control over financial reporting may not prevent all error and all fraud. Further, the design of a control system must reflect the fact that there are resource constraints, and the benefits of controls must be considered relative to their costs. Because of the inherent limitations in all control systems, no evaluation of controls can provide absolute assurance that all control issues and instances of fraud, if any, within the company have been detected. These inherent limitations include the realities that judgments in decision-making can be faulty, and that breakdowns can occur because of simple error or mistake. Additionally, controls can be circumvented by the individual acts of some persons, by collusion of two or more people, or by management override of the control. The design of any system of controls also is based in part upon certain assumptions about the likelihood of future events, and any design may not succeed in achieving its stated goals under all potential future conditions; over time, control may become inadequate because of changes in conditions, or the degree of compliance with the policies or procedures may deteriorate. Because of the inherent limitations in a cost-effective control system, misstatements due to error or fraud may occur and not be detected.
Item 16A: Audit Committee Financial Expert
Our Supervisory Board has determined that Dr. Paul Achleitner, Dr. Karl-Gerhard Eick and Prof. Dr. Klaus Rüdiger Trützschler, who are members of its Audit Committee, are “audit committee financial experts”, as such term is defined by the regulations of the Securities and Exchange Commission issued pursuant to Section 407 of the Sarbanes-Oxley Act of 2002. For a description of their experience, please see “Management Report: Corporate Governance Statement/Corporate Governance Report: Management Board and Supervisory Board: Supervisory Board” on pages 427 to 432 of the Financial Report. The audit committee financial experts mentioned above are “independent” as such term is defined in Rule 10A-3 of the Securities Exchange Act of 1934. As a foreign private issuer of common shares listed on the New York Stock Exchange, we are subject to the requirements of this definition.
| | | | |
| Deutsche Bank | | Item 16C: Principal Accountant Fees and Services | | 79 |
| Annual Report 2012 on Form 20-F | | | | |
| | |
| | | | |
| | |
| | | | |
Item 16B: Code of Ethics
In response to Section 406 of the Sarbanes-Oxley Act of 2002, we have adopted a code of ethics that applies to our principal executive officers, principal financial officer, principal accounting officer or controller, or persons performing similar functions. A copy of this code of ethics is available on our Internet website at www.db.com/ir/en/content/code_of_ethics.htm, under the heading “Code of Ethics for Senior Financial Officers”. Other than several nonsubstantive changes made in May 2006, April 2010 (based on a decision in March 2010) and November 2011, there have been no amendments or waivers to this code of ethics since its adoption. Information regarding any future amendments or waivers will be published on the aforementioned website.
Item 16C: Principal Accountant Fees and Services
In accordance with German law, our principal accountant is appointed at our General Meeting based on a recommendation of our Supervisory Board. The Audit Committee of our Supervisory Board prepares such a recommendation. Subsequent to the principal accountant’s appointment, the Audit Committee awards the contract and in its sole authority approves the terms and scope of the audit and all audit engagement fees as well as monitors the principal accountant’s independence. KPMG AG Wirtschaftsprüfungsgesellschaft was our principal accountant for the 2011 and 2012 fiscal years, respectively.
The table set forth below contains the aggregate fees billed for each of the last two fiscal years by KPMG AG Wirtschaftprüfungsgesellschaft and the worldwide member firms of KPMG International in each of the following categories: (1) Audit fees, which are fees for professional services for the audit of our annual financial statements or services that are normally provided by the accountant in connection with statutory and regulatory filings or engagements for those fiscal years, (2) Audit-related fees, which are fees for assurance and related services that are reasonably related to the performance of the audit or review of our financial statements and are not reported as Audit fees, and (3) Tax-related fees, which are fees for professional services rendered for tax compliance, tax consulting and tax planning, and (4) All other fees, which are fees for products and services other than Audit fees, Audit-related fees and Tax-related fees. These amounts include expenses and exclude Value Added Tax (VAT).
| | | | | | | | |
Fee category in€ m. | | 2012 | | | 2011 | |
Audit fees | | | 50 | | | | 54 | |
| | | | | | | | |
Audit-related fees | | | 19 | | | | 12 | |
| | | | | | | | |
Tax-related fees | | | 7 | | | | 7 | |
| | | | | | | | |
All other fees | | | 1 | | | | 3 | |
| | | | | | | | |
Total fees1 | | | 76 | | | | 76 | |
| |
| 1 | Totals do not add up due to roundings |
Audit fees have decreased as the number of entities to be audited has fallen year on year. The increase in Audit-related fees results from a higher number of Postbank engagements. The Audit-related fees include fees for accounting advisory, due diligence relating to actual or contemplated acquisitions and dispositions, attestation engagements and other agreed-upon procedure engagements. Our Tax-related fees include fees for services relating to the preparation and review of tax returns and related compliance assistance and advice, tax consultation and advice relating to Group tax planning strategies and initiatives and assistance with assessing compliance with tax regulations. All other fees were incurred for project-related advisory services.
United States law and regulations, and our own policies, generally require all engagements of our principal accountant be pre-approved by our Audit Committee or pursuant to policies and procedures adopted by it. Our Audit Committee has adopted the following policies and procedures for consideration and approval of requests to engage our principal accountant to perform non-audit services. Engagement requests must in the first instance
| | | | |
| Deutsche Bank | | Item 16D: Exemptions from the Listing Standards for Audit Committees | | 80 |
| Annual Report 2012 on Form 20-F | | | | |
| | |
| | | | |
| | |
| | | | |
be submitted to the Accounting Engagement Team established and supervised by our Group Finance Committee, whose members consist of our Chief Financial Officer and senior members of our Finance and Tax departments. If the request relates to services that would impair the independence of our principal accountant, the request must be rejected. Our Audit Committee has given its pre-approval for specified assurance, financial advisory and tax services, provided the expected fees for any such service do not exceed€ 1 million. If the engagement request relates to such specified pre-approved services, it may be approved by the Group Finance Committee, which must thereafter report such approval to the Audit Committee. If the engagement request relates neither to prohibited non-audit services nor to pre-approved non-audit services, it must be forwarded by the Group Finance Committee to the Audit Committee for consideration. In addition, to facilitate the consideration of engagement requests between its meetings, the Audit Committee has delegated approval authority to several of its members who are “independent” as defined by the Securities and Exchange Commission and the New York Stock Exchange. Such members are required to report any approvals made by them to the Audit Committee at its next meeting.
Additionally, United States law and regulations permit the pre-approval requirement to be waived with respect to engagements for non-audit services aggregating no more than five percent of the total amount of revenues we paid to our principal accountant, if such engagements were not recognized by us at the time of engagement and were promptly brought to the attention of our Audit Committee or a designated member thereof and approved prior to the completion of the audit. In each of 2011 and 2012, the percentage of the total amount of revenue we paid to our principal accountant represented by non-audit services in each category that were subject to such a waiver was less than 5 %.
Item 16D: Exemptions from the Listing Standards for Audit Committees
Our common shares are listed on the New York Stock Exchange, the corporate governance rules of which require a foreign private issuer such as us to have an audit committee that satisfies the requirements of Rule 10A-3 under the U.S. Securities Exchange Act of 1934. These requirements include a requirement that the audit committee be composed of members that are “independent” of the issuer, as defined in the Rule, subject to certain exemptions, including an exemption for employees who are not executive officers of the issuer if the employees are elected or named to the board of directors or audit committee pursuant to the issuer’s governing law or documents, an employee collective bargaining or similar agreement or other home country legal or listing requirements. The German Co-Determination Act of 1976 (Mitbestimmungsgesetz) requires that the shareholders elect half of the members of the supervisory board of large German companies, such as us, and that employees in Germany elect the other half. Employee-elected members are typically themselves employees or representatives of labor unions representing employees. Pursuant to law and practice, committees of the Supervisory Board are typically composed of both shareholder- and employee-elected members. Of the current members of our Audit Committee, three – Henriette Mark, Karin Ruck and Marlehn Thieme – are current employees of Deutsche Bank who have been elected as Supervisory Board members by the employees. None of them is an executive officer. Accordingly, their service on the Audit Committee is permissible pursuant to the exemption from the independence requirements provided for by paragraph (b)(1)(iv)(C) of the Rule. We do not believe the reliance on such exemption would materially adversely affect the ability of the Audit Committee to act independently and to satisfy the other requirements of the Rule.
| | | | |
| Deutsche Bank | | Item 16E: Purchases of Equity Securities by the Issuer and Affiliated Purchasers | | 81 |
| Annual Report 2012 on Form 20-F | | | | |
| | |
| | | | |
| | |
| | | | |
Item 16E: Purchases of Equity Securities by the Issuer and Affiliated Purchasers
In 2012, we repurchased a total of 17,365,961 shares for group purposes pursuant to share buy-backs authorized by the General Meeting. During the period from January 1, 2012 until the 2012 Annual General Meeting on May 31, 2012, we repurchased 14,854,538 of our ordinary shares pursuant to the authorization granted by the Annual General Meeting on May 26, 2011, at an average price of€ 34.76 and for a total consideration of€ 516 million. This authorization was replaced by a new authorization to buy back shares approved by the Annual General Meeting on May 31, 2012. Under the new authorization, up to 92,949,964 shares may be repurchased through November 30, 2016. Of these, 46,474,982 shares may be purchased by using derivatives. During the period from the 2012 Annual General Meeting until December 31, 2012, we repurchased 2,511,423 shares at an average price of€ 33.26 and for a total consideration of€ 84 million (excluding option premium). At December 31, 2012, the number of shares held in Treasury from buybacks totaled 35,148 shares. This figure stems from 24.1 million shares at the beginning of the year, plus 17.4 million shares from buybacks in 2012, less 41.4 million shares which were used to fulfill delivery obligations in the course of share-based compensation of employees. We did not cancel any shares in 2012.
In addition to these share buy-backs for group purposes, pursuant to a shareholder authorization approved at our 2010 Annual General Meeting, we are authorized to buy and sell, for the purpose of securities trading, our ordinary shares through November 30, 2014, provided that the net number of shares held for this purpose at the close of any trading day may not exceed 5 % of our share capital on that day. The gross volume of these securities trading transactions is often large, and even the net amount of such repurchases or sales may, in a given month, be large, though over longer periods of time such transactions tend to offset and are in any event constrained by the 5 % of share capital limit. These securities trading transactions consist predominantly of transactions on major non-U.S. securities exchanges. We also enter into derivative contracts with respect to our shares.
The following table sets forth, for each month in 2012 and for the year as a whole, the total gross number of our shares repurchased by us and our affiliated purchasers (pursuant to both activities described above), the total gross number of shares sold, the net number of shares purchased or sold, the average price paid per share (based on the gross shares repurchased), the number of shares that were purchased for group purposes mentioned above and the maximum number of shares that at that date remained eligible for purchase under such programs.
| | | | |
| Deutsche Bank | | Item 16G: Corporate Governance | | 82 |
| Annual Report 2012 on Form 20-F | | | | |
| | |
| | | | |
| | |
| | | | |
Issuer Purchases of Equity Securities in 2012
| | | | | | | | | | | | | | | | | | | | | | | | |
Month | | Total number of
shares
purchased | | | Total number of
shares sold | | | Net number of
shares
purchased or
(sold) | | | Average price
paid per share
(in€) | | | Number of
shares
purchased for
group purposes | | | Maximum
number of
shares that may
yet be purchased
under plans or
programs | |
January | | | 27,092,160 | | | | 27,025,631 | | | | 66,529 | | | | 30.63 | | | | – | | | | 65,537,307 | |
| | | | | | | | | | | | | | | | | | | | | | | | |
February | | | 47,167,992 | | | | 71,262,989 | | | | (24,094,997) | | | | 33.96 | | | | 4,192,542 | | | | 61,344,765 | |
| | | | | | | | | | | | | | | | | | | | | | | | |
March | | | 55,410,718 | | | | 49,124,698 | | | | 6,286,020 | | | | 37.50 | | | | 6,120,656 | | | | 55,224,109 | |
| | | | | | | | | | | | | | | | | | | | | | | | |
April | | | 15,358,605 | | | | 14,410,161 | | | | 948,444 | | | | 34.30 | | | | 1,147,268 | | | | 54,076,841 | |
| | | | | | | | | | | | | | | | | | | | | | | | |
May | | | 53,752,444 | | | | 50,493,135 | | | | 3,259,309 | | | | 29.50 | | | | 3,394,072 | | | | 92,949,964 | |
| | | | | | | | | | | | | | | | | | | | | | | | |
June | | | 44,298,041 | | | | 43,736,600 | | | | 561,441 | | | | 27.84 | | | | 579,889 | | | | 92,370,075 | |
| | | | | | | | | | | | | | | | | | | | | | | | |
July | | | 24,677,669 | | | | 24,616,199 | | | | 61,470 | | | | 25.99 | | | | – | | | | 92,370,075 | |
| | | | | | | | | | | | | | | | | | | | | | | | |
August | | | 16,683,930 | | | | 25,095,000 | | | | (8,411,070) | | | | 26.15 | | | | – | | | | 92,370,075 | |
| | | | | | | | | | | | | | | | | | | | | | | | |
September | | | 17,575,400 | | | | 17,594,884 | | | | (19,484) | | | | 32.14 | | | | – | | | | 92,370,075 | |
| | | | | | | | | | | | | | | | | | | | | | | | |
October | | | 33,266,086 | | | | 33,063,771 | | | | 202,315 | | | | 33.56 | | | | 204,880 | | | | 92,165,195 | |
| | | | | | | | | | | | | | | | | | | | | | | | |
November | | | 26,638,570 | | | | 29,693,272 | | | | (3,054,702) | | | | 33.81 | | | | 1,726,654 | | | | 90,438,541 | |
| | | | | | | | | | | | | | | | | | | | | | | | |
December | | | 19,195,496 | | | | 19,574,028 | | | | (378,532) | | | | 33.20 | | | | – | | | | 90,438,541 | |
| | | | | | | | | | | | | | | | | | | | | | | | |
Total 2012 | | | 381,117,111 | | | | 405,690,368 | | | | (24,573,257) | | | | 31.88 | | | | 17,365,961 | | | | 90,438,541 | |
| | | | | | | | | | | | | | | | | | | | | | | | |
Item 16F: Change in Registrant’s Certifying Accountant
Not applicable.
Item 16G: Corporate Governance
Our common shares are listed on the New York Stock Exchange, as well as on all seven German stock exchanges. Set forth below is a description of the significant ways in which our corporate governance practices differ from those applicable to U.S. domestic companies under the New York Stock Exchange’s listing standards as set forth in its Listed Company Manual (the “NYSE Manual”).
The Legal Framework. Corporate governance principles for German stock corporations (Aktiengesellschaften) are set forth in the German Stock Corporation Act (Aktiengesetz), the German Co-Determination Act of 1976 (Mitbestimmungsgesetz) and the German Corporate Governance Code (Deutscher Corporate Governance Kodex, referred to as the Code).
The Two-Tier Board System of a German Stock Corporation. The Stock Corporation Act provides for a clear separation of management and oversight functions. It therefore requires German stock corporations to have both a Supervisory Board (Aufsichtsrat) and a Management Board (Vorstand). These boards are separate; no individual may be a member of both. Both the members of the Management Board and the members of the Supervisory Board must exercise the standard of care of a diligent business person to the company. In complying with this standard of care they are required to take into account a broad range of considerations, including the interests of the company and those of its shareholders, employees and creditors.
The Management Board is responsible for managing the company and representing the company in its dealings with third parties. The Management Board is also required to ensure appropriate risk management within the corporation and to establish an internal monitoring system. The members of the Management Board, including its chairperson or speaker, are regarded as peers and share a collective responsibility for all management decisions.
| | | | |
| Deutsche Bank | | Item 16G: Corporate Governance | | 83 |
| Annual Report 2012 on Form 20-F | | | | |
| | |
| | | | |
| | |
| | | | |
The Supervisory Board appoints and removes the members of the Management Board. It also may appoint a chairperson of the Management Board. Although it is not permitted to make management decisions, the Supervisory Board has comprehensive monitoring functions, including advising the company on a regular basis and participating in decisions of fundamental importance to the company. To ensure that these monitoring functions are carried out properly, the Management Board must, among other things, regularly report to the Supervisory Board with regard to current business operations and business planning, including any deviation of actual developments from concrete and material targets previously presented to the Supervisory Board. The Supervisory Board may also request special reports from the Management Board at any time. Transactions of fundamental importance to the company, such as major strategic decisions or other actions that may have a fundamental impact on the company’s assets and liabilities, financial condition or results of operations, may be subject to the consent of the Supervisory Board. Pursuant to our Articles of Association (Satzung), such transactions include the granting of powers of attorney without limitation to the affairs of a specific office, major acquisitions or disposals of real estate or participations in companies and granting of loans and acquiring participations if the Banking Act (Kreditwesengesetz) requires approval by the Supervisory Board.
Pursuant to the Co-Determination Act, our Supervisory Board consists of representatives elected by the shareholders and representatives elected by the employees in Germany. Based on the total number of Deutsche Bank employees in Germany these employees have the right to elect one-half of the total of twenty Supervisory Board members. The chairperson of the Supervisory Board of Deutsche Bank is a shareholder representative who has the deciding vote in the event of a tie.
This two-tier board system contrasts with the unitary board of directors envisaged by the relevant laws of all U.S. states and the New York Stock Exchange listing standards.
The Group Executive Committee of Deutsche Bank is a body that is not based on the Stock Corporation Act. It has been created by the Management Board under its terms of reference and serves as a tool to coordinate the corporate divisions and regional management with the Management Board. It comprises the members of the Management Board and senior representatives from regions, corporate divisions and certain infrastructure functions appointed by the Management Board. The Co-Chairmen of the Management Board, Messrs. Fitschen and Jain, are also the Co-Chairmen of the Group Executive Committee. It reviews the development of the businesses, discusses matters of group strategy and prepares recommendations for decision by the Management Board. Functional committees assist the Management Board in executing cross divisional strategic management, resource allocation, control and risk management.
Companies which have securities listed on a stock exchange in Germany must report each year on the company’s corporate governance in their annual report to shareholders.
The Recommendations of the Code. The Code was issued in 2002 by a commission composed of German corporate governance experts appointed by the German Federal Ministry of Justice in 2001. The Code was last amended in May 2012 and, as a general rule, will be reviewed annually and amended if necessary to reflect international corporate governance developments. The Code describes and summarizes the basic mandatory statutory corporate governance principles found in the provisions of German law. In addition, it contains supplemental recommendations and suggestions for standards on responsible corporate governance intended to reflect generally accepted best practice.
The Code addresses six core areas of corporate governance. These are (1) shareholders and shareholders’ meetings, (2) the cooperation between the Management Board and the Supervisory Board, (3) the Management Board, (4) the Supervisory Board, (5) transparency and (6) financial reporting and audits.
The Code contains three types of provisions. First, the Code describes and summarizes the existing statutory, i.e., legally binding, corporate governance framework set forth in the Stock Corporation Act and in other German laws. Those laws – and not the incomplete and abbreviated summaries of them reflected in the Code – must be complied with. The second type of provisions is recommendations. While these are not legally binding,
| | | | |
| Deutsche Bank | | Item 16G: Corporate Governance | | 84 |
| Annual Report 2012 on Form 20-F | | | | |
| | |
| | | | |
| | |
| | | | |
Section 161 of the Stock Corporation Act requires that any German exchange-listed company declare annually that the recommendations of the Code have been adopted by it or which recommendations have not been adopted. The third type of Code provisions comprises suggestions which companies may choose not to adopt without disclosure. The Code contains a significant number of such suggestions, covering almost all of the core areas of corporate governance it addresses.
In their last Declaration of Conformity of October 30, 2012, the Management Board and the Supervisory Board of Deutsche Bank stated that they will act in conformity with the recommendations of the Code. The Declaration of Conformity and the amendments are available on Deutsche Bank’s internet website at www.deutsche-bank.com/corporate-governance.
Supervisory Board Committees. The Supervisory Board may form committees. The Co-Determination Act requires that the Supervisory Board form a mediation committee to propose candidates for the Management Board in the event that the two-thirds majority of the members of the Supervisory Board needed to appoint members of the Management Board is not met.
The Stock Corporation Act specifically mentions the possibility to establish an “audit committee” to handle issues of accounting and risk management, compliance, auditor independence, the engagement and compensation of outside auditors appointed by the shareholders’ meeting and the determination of auditing focal points. The Code recommends establishing such an “audit committee”. Since 2007 the Code also recommends establishing a “nomination committee” comprised only of shareholder elected Supervisory Board members to prepare the Supervisory Board’s proposals for the election or appointment of new shareholder representatives to the Supervisory Board. The Code also includes suggestions on the subjects that may be handled by Supervisory Board committees, including corporate strategy, compensation of the members of the Management Board, investments and financing. Under the Stock Corporation Act, any Supervisory Board committee must regularly report to the Supervisory Board.
The Supervisory Board of Deutsche Bank has established a Chairman’s Committee (Präsidialausschuss) which is responsible for deciding the terms of the service contracts and other contractual arrangements with the members of the Management Board, a Nomination Committee (Nominierungsausschuss), an Audit Committee (Prüfungsausschuss), a Risk Committee (Risikoausschuss) and the required Mediation Committee (Vermittlungsausschuss). The functions of a nominating/corporate governance committee and of a compensation committee required by the NYSE Manual for U.S. companies listed on the NYSE are therefore performed by the Supervisory Board or one of its committees, in particular the Chairman’s Committee and the Mediation Committee.
Independent Board Members. The NYSE Manual requires that a majority of the members of the board of directors of a NYSE listed U.S. company and each member of its nominating/corporate governance, compensation and audit committees be “independent” according to strict criteria and that the board of directors determines that such member has no material direct or indirect relationship with the company.
As a foreign private issuer, Deutsche Bank is not subject to these requirements. However, its audit committee must meet the more lenient independence requirement of Rule 10A-3 under the Securities Exchange Act of 1934. German corporate law does not require an affirmative independence determination, meaning that the Supervisory Board need not make affirmative findings that audit committee members are independent. However, the Stock Corporation Act requires that at least one member of the supervisory board or, if an audit committee is established, such audit committee, must be independent and have expertise in accounting and audit matters, unless all members have been appointed before May 29, 2009. Moreover, both the Stock Corporation Act and the Code contain several rules, recommendations and suggestions to ensure the Supervisory Board’s independent advice to, and supervision of, the Management Board. As noted above, no member of the Management Board may serve on the Supervisory Board (and vice versa). Supervisory Board members will not be bound by directions or instructions from third parties. Any advisory, service or similar contract between a member of the Supervisory Board and the company is subject to the Supervisory Board’s approval. A similar requirement
| | | | |
| Deutsche Bank | | Disclosures Under Iran Threat Reduction and Syria Human Rights Act of 2012 | | 85 |
| Annual Report 2012 on Form 20-F | | | | |
| | |
| | | | |
| | |
| | | | |
applies to loans granted by the company to a Supervisory Board member or other persons, such as certain members of a Supervisory Board member’s family. In addition, the Stock Corporation Act prohibits a person who within the last two years was a member of the management board from becoming a member of the supervisory board of the same company unless he or she is elected upon the proposal of shareholders holding more than 25 % of the voting rights of the company.
The Code also recommends that each member of the Supervisory Board informs the Supervisory Board of any conflicts of interest which may result from a consulting or directorship function with clients, suppliers, lenders or other business partners of the stock corporation. In the case of material conflicts of interest or ongoing conflicts, the Code recommends that the mandate of the Supervisory Board member be removed by the shareholders’ meeting. The Code further recommends that any conflicts of interest that have occurred be reported by the Supervisory Board at the Annual General Meeting, together with the action taken, and that potential conflicts of interest be also taken into account in the nomination process for the election of Supervisory Board members.
Audit Committee Procedures. Pursuant to the NYSE Manual the audit committee of a U.S. company listed on the NYSE must have a written charter addressing its purpose, an annual performance evaluation, and the review of an auditor’s report describing internal quality control issues and procedures and all relationships between the auditor and the company. The Audit Committee of Deutsche Bank operates under written terms of reference and reviews the efficiency of its activities regularly.
Disclosure of Corporate Governance Guidelines. Deutsche Bank discloses its Articles of Association, the Terms of Reference of its Management Board, its Supervisory Board, the Chairman’s Committee, the Audit Committee and the Risk Committee, its Declaration of Conformity under the Code and other documents pertaining to its corporate governance on its internet website at www.deutsche-bank.com/corporate-governance.
Item 16H: Mine Safety Disclosure
Not applicable.
Disclosures Under Iran Threat Reduction and Syria Human Rights Act of 2012
Under Section 219 of the Iran Threat Reduction and Syria Human Rights Act of 2012, which added Section 13(r) of the U.S. Securities Exchange Act of 1934, as amended, we are required to disclose certain of our activities and those of our affiliates relating to Iran and to other persons sanctioned by the U.S. under programs relating to terrorism and proliferation of weapons of mass destruction that occurred during the twelve-month period covered by this report. We describe below a number of potentially disclosable activities. Disclosure is generally required even where the activities, transactions or dealings were conducted in compliance with applicable law.
Legacy Financing Arrangements. Despite having ceased entering into new business in or with Iran in 2007, we continue to be engaged as lender, sponsoring bank and/or facility agent in several long-term financing agreements relating to the construction or acquisition of plant or equipment for the petroleum and petrochemical industries, under which Iranian entities were the direct or indirect borrowers. Before 2007, as part of a number of banking consortia, we entered into a number of financing arrangements, ten of which remained outstanding
| | | | |
| Deutsche Bank | | Disclosures Under Iran Threat Reduction and Syria Human Rights Act of 2012 | | 86 |
| Annual Report 2012 on Form 20-F | | | | |
| | |
| | | | |
| | |
| | | | |
early in 2012 (including two framework agreements that cover a total of 17 individual credit agreements), with the National Iranian Oil Company, the National Petrochemical Company, Bank Melli Iran and their respective group entities as borrowers. The latest final maturity under these loan facilities is in 2019. These loan facilities were guaranteed by national export credit agencies representing various European and Asian national governments. The obligations of the borrowers under these loan facilities are secured by assignments of receivables from oil and oil products exported by the National Iranian Oil Company, the National Petrochemical Company and/or their trading subsidiaries to buyers, mostly in Asia. For some of these arrangements, we act as escrow agent, holding escrow accounts for the Iranian borrowers mentioned above, into which receivables are paid by the buyers of the oil and oil products. Such accounts are pledged in favor of the relevant banking consortium. We have no involvement in the contractual arrangements related to, or in the physical settlement of, the oil and oil product exports mentioned above. The Iranian entities in whose names the escrow accounts are held are not permitted to draw on these accounts, either because they are sanctioned parties or, where this is not the case, due to our business decision to freeze the accounts in light of the overall sanction environment.
During 2012,€ 266 million was paid into the escrow accounts, and we, in our role as escrow agent, distributed to the participants in the banking consortia€ 696 million including portions attributable to us totalling€ 29 million.
Without being either agent or arranger and in our role as mere lender participant we received approximately€ 10.2 million of repayments in principal and interest in 2012 and passed on from this approximately€ 5.1 million to other participants in such arrangements.
We generated revenues in 2012 of approximately€ 3.6 million in respect of these financing arrangements, of which approximately€ 3.3 million consisted of escrow account revenues,€ 0.3 million consisted of loan interest revenues and€ 20,000 consisted of fee revenues.
Pursuant to ongoing negotiations with the borrowers, the two above-mentioned framework agreements together with all the individual loan agreements concluded thereunder were prepaid in 2012. Such repayments consisted of National Iranian Oil Company’s overall obligation amounting to€ 440 million, of which our portion was€ 5 million, and National Petrochemical Company’s overall obligation amounting to€ 109 million, of which our portion was€ 7 million. Neither prepayment generated revenues for us. Another two financing agreements amounting to€ 4.43 million were repaid in accordance with their terms in 2012. Accordingly, only six outstanding financing arrangements remained as of December 31, 2012. Our portion of the remaining loan facilities amounted to€ 35 million as of December 31, 2012. We intend to continue pursuing repayment and fulfilling our administrative role under these agreements, but we do not intend to engage in any new extensions of credit to these or other Iranian entities.
Portions of the undrawn commitments under two of the financing agreements referred to above under which the National Petrochemical Company and its group entities are borrowers were cancelled during 2012. Under one of these,€ 28 million of the total€ 42 million undrawn commitment was terminated during 2012. Our portion of this cancelled commitment was€ 3 million. Due to the export credit agency coverage, the remainder cannot be cancelled without German government approval, for which we have applied but have not yet received. In addition, a total remaining undrawn commitment of€ 766,000 (of which our portion was€ 48,000) was cancelled during 2012. Our remaining undrawn commitment is€ 1.3 million. We do not intend to make further disbursements upon this undrawn commitment.
A wholly-owned subsidiary of ours, BHF-BANK AG, which we acquired as part of the acquisition of the Sal. Oppenheim Group in March 2010 and which we have agreed to sell pending regulatory approvals, was a lender participant in a number of similar arrangements, the borrowers of which were Bank Saderat, Bank Melli, Bank Sepah, Bank Tejarat and National Petrochemical Company. In that capacity, it received approximately€ 20 million in repayments of principal and interest in 2012, part of which was paid by us to BHF-BANK in our capacity as agent or arranger. Of the amounts received, BHF-BANK passed on approximately€ 1.5 million to participants in such arrangements. In 2012, BHF-BANK’s gross revenues from this business were approximately€ 272,000 and their net profits were less than this amount.
| | | | |
| Deutsche Bank | | Disclosures Under Iran Threat Reduction and Syria Human Rights Act of 2012 | | 87 |
| Annual Report 2012 on Form 20-F | | | | |
| | |
| | | | |
| | |
| | | | |
Money Transfers From Escrow Accounts. A single payment of€ 6,500 was paid in early 2012 out of a balance in excess of the amount required to be maintained in escrow on one of the escrow accounts referred to above. This payment was made to a German exporter unrelated to the financing agreement to which the escrow account relates. In addition, a single payment of€ 250,000 was made in 2012 from one of the escrow accounts described above to the account of the hospital of a state university in North Rhine-Westphalia in Aachen, Germany, as an advance payment on behalf of Iranian victims of a refinery explosion being transported to Germany for treatment.
Legacy Contractual Obligations Related to Guarantees. Prior to 2007, we provided guarantees to a number of Iranian entities. In almost all of these cases, we issued counter-indemnities in support of guarantees issued by Iranian banks because the Iranian beneficiaries of the guarantees required that they be backed directly by Iranian banks. In 2007, we made a decision to refrain from issuing new guarantees to Iranian or Iran-related beneficiaries. Although these pre-existing guarantees stipulate that they must be either extended or honored if we receive such a demand and we are legally not able to terminate these guarantees, we decided in 2011 to reject any “extend or pay” demands under such guarantees. In 2012, we exited many of these guarantees, but a number are still outstanding, having an aggregate face amount of approximately€ 8.7 million as of year-end 2012. We paid approximately€ 1,100 in cancellation fees in 2012 in respect of these guarantees into frozen accounts of the relevant Iranian banks at European financial institutions. Additionally, we paid approximately€ 35,000 from the accounts of the instructing parties to the Iranian banks that issued guarantees. The gross revenues from this business were approximately€ 60,000 and the net profit we derived from these activities was less than this amount.
We also have outstanding legacy guarantees in relation to relevant Syrian banks. The aggregate face amount of these legacy guarantees was approximately€ 9.0 million, the gross revenues received from non-Syrian parties for these guarantees were approximately€ 80,000 and the net profit we derived from these activities was less than this amount. In one case we paid cancellation fees of€ 320 to the frozen account of a Syrian bank.
BHF-Bank, based on similar legacy guarantees issued before 2012, paid commissions and charges of€ 60,000 to accounts of relevant Iranian banks frozen under applicable EU law. BHF-BANK received approximately€ 140,000 in fees from the non-Iranian parties for which the guarantees were issued. No new guarantees were issued relating to such business in 2012. The aggregate face amount of these legacy guarantees was approximately€ 23.5 million as of December 31, 2012.
BHF-BANK also has outstanding legacy guarantees in relation to relevant Syrian banks. The aggregate face amount of these legacy guarantees was below€ 0.5 million, no payments to relevant Syrian banks were made, the gross revenues received from non-Syrian parties for these guarantees were less than€ 5,000 and the net profit derived from these activities was less than this amount.
We intend to exit these arrangements in the coming years as soon as possible.
Payments. We received less than 30 payments adding up to approximately€ 5.2 million in favor of non-Iranian clients in Germany, the Netherlands and Abu Dhabi, which payments stemmed ultimately from relevant Iranian entities. These figures include relevant payments in favor of clients of our subsidiary Postbank. Revenues for these incoming payments were less than€ 10,000.
We received from a relevant Syrian bank a payment of approximately€ 2.2 million on behalf of a European public institution.
| | | | |
| Deutsche Bank | | Disclosures Under Iran Threat Reduction and Syria Human Rights Act of 2012 | | 88 |
| Annual Report 2012 on Form 20-F | | | | |
| | |
| | | | |
| | |
| | | | |
Operations of Iranian Bank Branches and Subsidiaries in Germany and/or France. Several Iranian banks, including Bank Melli Iran, Bank Saderat, Bank Tejarat and Europäisch-Iranische Handelsbank, have branches or offices in Germany and/or France, even though their funds and other economic resources are frozen under European law. As part of the payment clearing system in Germany and other European countries, when these branches or offices need to make payments in Germany or Europe to cover their day-to-day operations such as rent, taxes, insurance premia and salaries for their remaining staff, or for any other kind of banking-related operations necessary to wind down their legacy trade business, the German Bundesbank and French Central Bank accept fund transfers from these Iranian banks and disburse them to the applicable mainly German payees, some of whom hold accounts with us. In 2012, we received approximately€ 80 million in such disbursements in less than 1,500 transactions via the German and French Central Banks in respect of payments from the above-mentioned Iranian banks, and the net profits derived from these payments were negligible (less than one euro per transaction). Relevant transactions of our subsidiary Postbank are included in these figures. In general we intend to continue this business.
Out of these transactions we passed on three payments totaling€ 1 million to another European bank in favor of one of their clients, a relevant Iranian entity (revenues were less than one euro per transaction). We do not intend to execute payments like this in future.
The German Bundesbank also accepts fund transfers in favor of the mentioned Iranian bank branches and freezes the relevant amounts under applicable law. By using this avenue, our subsidiary Postbank on behalf of its clients transferred to two of the Iranian banks mentioned above one payment each, totaling€ 65,608 (revenues were less than one euro per transaction). We do not intend to execute payments like this in future.
BHF-BANK is, by request of the German Bundesbank, maintaining accounts for Bank Sepah in Frankfurt, Germany, which is frozen under European sanctions law. In 2012, the total volume of outgoing payments from these accounts was approximately€ 4.5 million, which payments were made with the consent of the competent authorities in Germany under applicable law. In 2012, the gross revenues from this activity were approximately€ 37,000 and the net profits were less than this amount.
Maintaining of Accounts for Iranian Consulates and Embassies. Iranian embassies and consulates in Germany and the Netherlands also hold accounts with us. These accounts exist to fund the day-to-day operational costs of the embassies and consulates, such as salaries, rent, and electricity. Additionally, Deutsche Bank Netherlands N.V. has a relationship with the Agent Bureau of the Embassy of the Islamic Republic of Iran in The Hague (which is responsible for all Iran-U.S. Claims Tribunal activities). The total volume of outgoing payments from these accounts was approximately€ 15 million in 2012, which payments were made with the consent of the competent authorities in the relevant European countries under applicable law. We derived gross revenues of approximately€ 50,000 and net profits which were less than this amount from these activities. The relevant European governments have requested that we continue to provide these services in the future to enable the Government of Iran to conduct its diplomatic relations with various European countries and the United Nations. We intend to continue these activities.
Activities of Entities in Which We Have Interests. Section 13(r) requires us to provide the specified disclosure with respect to ourselves and our “affiliates,” as defined in Exchange Act Rule 12b-2. Although we have minority equity interests in certain entities that could arguably result in these entities being deemed “affiliates,” we do not have the authority or the legal ability to acquire in every instance the information from these entities that would be necessary to determine whether they are engaged in any disclosable activities under Section 13(r). In some cases, legally independent entities are not permitted to disclose the details of their activities to us because of German privacy and data protection laws or the applicable banking laws and regulations. In such cases, voluntary disclosure of such details could violate such legal and/or regulatory requirements and subject the relevant entities to criminal prosecution or regulatory investigations.
| | | | |
| Deutsche Bank | | Item 19: Exhibits | | 89 |
| Annual Report 2012 on Form 20-F | | | | |
| | |
| | | | |
| | |
| | | | |
PART III
Item 17: Financial Statements
Not applicable.
Item 18: Financial Statements
The Financial Statements of this Annual Report on Form 20-F consist of the Consolidated Financial Statements including the Notes 1 to 43, which are set forth on pages 243 to 382 of the Financial Report, and those parts of the “Management Report: Risk Report” which are marked by a bracket in the margins, which Risk Report is set forth on pages 43 to 186 of the Financial Report. Such Consolidated Financial Statements have been audited by KPMG AG Wirtschaftsprüfungsgesellschaft, as described in their “Report of Independent Registered Public Accounting Firm” included on page 383 of the Financial Report.
Item 19: Exhibits
We have filed the following documents as exhibits to this document.
| | |
| Exhibit number | | Description of Exhibit |
|
| 1.1 | | English translation of the Articles of Association of Deutsche Bank AG, furnished as Exhibit 99.1 to our Report on Form 6-K dated August 14, 2012 and incorporated by reference herein. |
|
| 2.1 | | The total amount of long-term debt securities of us or our subsidiaries authorized under any instrument does not exceed 10 percent of the total assets of our Group on a consolidated basis. We hereby agree to furnish to the Commission, upon its request, a copy of any instrument defining the rights of holders of long-term debt of us or of our subsidiaries for which consolidated or unconsolidated financial statements are required to be filed. |
|
| 4.1 | | Equity Plan Rules 2010, furnished as Exhibit 4.2 to our 2009 Annual Report on Form 20-F and incorporated by reference herein. |
|
| 4.2 | | Equity Plan Rules 2011, furnished as Exhibit 4.3 to our 2010 Annual Report on Form 20-F and incorporated by reference herein. |
|
| 4.3 | | Equity Plan Rules 2012, furnished as Exhibit 4.4 to our 2011 Annual Report on Form 20-F and incorporated by reference herein. |
|
| 4.4 | | Equity Plan Rules 2013. |
|
| 7.1 | | Statement re Computation of Ratio of Earnings to Fixed Charges of Deutsche Bank AG for the periods ended December 31, 2012, 2011, 2010, 2009 and 2008 (also incorporated as Exhibit 12.1 to Registration Statement No. 333-184193 of Deutsche Bank AG). |
|
| 8.1 | | List of Subsidiaries. |
|
| 12.1 | | Principal Executive Officer Certifications Required by 17 C.F.R. 240.13a-14(a). |
|
| 12.2 | | Principal Executive Officer Certifications Required by 17 C.F.R. 240.13a-14(a). |
|
| 12.3 | | Principal Financial Officer Certifications Required by 17 C.F.R. 240.13a-14(a). |
|
| 13.1 | | Chief Executive Officer Certification Required by 18 U.S.C. Section 1350. |
|
| 13.2 | | Chief Executive Officer Certification Required by 18 U.S.C. Section 1350. |
|
| 13.3 | | Chief Financial Officer Certification Required by 18 U.S.C. Section 1350. |
|
| 14.1 | | Legal Opinion regarding confidentiality of related party customers. |
|
| 15.1 | | Consent of KPMG AG Wirtschaftsprüfungsgesellschaft. |
|
| | | | |
| Deutsche Bank | | Signatures | | 90 |
| Annual Report 2012 on Form 20-F | | | | |
| | |
| | | | |
| | |
| | | | |
Signatures
The registrant hereby certifies that it meets all of the requirements for filing on Form 20-F and has duly caused and authorized the undersigned to sign this annual report on its behalf.
Date: April 15, 2013
Deutsche Bank Aktiengesellschaft
/s/ JUERGEN FITSCHEN
Juergen Fitschen
Co-Chairman of the Management Board
/s/ ANSHUMAN JAIN
Anshuman Jain
Co-Chairman of the Management Board
/s/ STEFAN KRAUSE
Stefan Krause
Member of the Management Board
Chief Financial Officer

| | | | |
| Deutsche Bank | | | | |
| Financial Report 2012 | | | | |
| | |
| | | | |
| | |
| | | | |
[Page intentionally left blank for SEC filing purposes]
| | | | |
| Deutsche Bank | | Content | | 1 |
| Financial Report 2012 | | | | |
| | |
| | | | |
| | |
| | | | |
| | | | |
| Deutsche Bank | | Content | | 2 |
| Financial Report 2012 | | | | |
| | |
| | | | |
| | |
| | | | |
| | | | |
| Deutsche Bank | | 01 – Management Report | | 4 |
| Financial Report 2012 | | Operating and Financial Review | | |
| | |
| | | | |
| | |
| | | | |
Operating and Financial Review
The following discussion and analysis should be read in conjunction with the consolidated financial statements and the related notes to them. Our consolidated financial statements for the years ended December 31, 2012 and 2011 have been audited by KPMG AG Wirtschaftsprüfungsgesellschaft, which issued an unqualified opinion.
Deutsche Bank Group
Our Organization
Headquartered in Frankfurt am Main, Germany, we are the largest bank in Germany and one of the largest financial institutions in Europe and the world, as measured by total assets of€ 2,012 billion as of December 31, 2012. As of that date, we employed 98,219 people on a full-time equivalent basis and operated in 72 countries out of 2,984 branches worldwide, of which 65 % were in Germany. We offer a wide variety of investment, financial and related products and services to private individuals, corporate entities and institutional clients around the world.
Following a comprehensive strategic review, we realigned our organizational structure in the fourth quarter 2012. We reaffirmed our commitment to the universal banking model and to our four existing corporate divisions. We strengthened this emphasis with an integrated Asset & Wealth Management Corporate Division that includes former Corporate Banking & Securities businesses such as exchange-traded funds (ETFs). Furthermore, we created a Non-Core Operations Unit. This unit includes the former Group Division Corporate Investments (CI) as well as non-core operations which were re-assigned from other corporate divisions.
As of December 31, 2012 we were organized into the following five corporate divisions:
| — | | Corporate Banking & Securities (CB&S) |
| — | | Global Transaction Banking (GTB) |
| — | | Asset & Wealth Management (AWM) |
| — | | Private & Business Clients (PBC) |
| — | | Non-Core Operations Unit (NCOU) |
The five corporate divisions are supported by infrastructure functions. In addition, we have a regional management function that covers regional responsibilities worldwide.
We have operations or dealings with existing or potential customers in most countries in the world. These operations and dealings include:
| — | | subsidiaries and branches in many countries; |
| — | | representative offices in many other countries; and |
| — | | one or more representatives assigned to serve customers in a large number of additional countries. |
Please see Note 05 “Business Segments and Related Information” of our consolidated financial statements for a table with our net revenues split by geographical region, based on our management reporting systems.
| | | | |
| Deutsche Bank | | 01 – Management Report | | 5 |
| Financial Report 2012 | | Operating and Financial Review | | |
| | |
| | | | |
| | |
| | | | |
Management Structure
We operate the five corporate divisions and the infrastructure functions under the umbrella of a “virtual holding company”. We use this term to mean that, while we subject the corporate divisions to the overall supervision of our Management Board, which is supported by infrastructure functions, we do not have a separate legal entity holding these five corporate divisions but we nevertheless allocate substantial managerial autonomy to them. To support this structure, key governance bodies function as follows:
The Management Board has the overall responsibility for the management of Deutsche Bank, as provided by the German Stock Corporation Act. Its members are appointed and removed by the Supervisory Board, which is a separate corporate body. Our Management Board focuses on strategic management, corporate governance, resource allocation, risk management and control, assisted by functional committees.
The Group Executive Committee was established in 2002. It comprises the members of the Management Board and senior representatives from our regions, corporate divisions and certain infrastructure functions appointed by the Management Board. The Group Executive Committee is a body that is not required by the Stock Corporation Act. It serves as a tool to coordinate our businesses and regions, discusses Group strategy and prepares recommendations for Management Board decisions. It has no decision making authority.
Within each corporate division and region, coordination and management functions are handled by operating committees and executive committees, which helps ensure that the implementation of the strategy of individual businesses and the plans for the development of infrastructure areas are integrated with global business objectives.
Corporate Divisions
Corporate Banking & Securities Corporate Division
Corporate Division Overview
CB&S is made up of the business divisions Corporate Finance and Markets. These businesses offer financial products worldwide including the underwriting of stocks and bonds, trading services for investors and the tailoring of solutions for companies’ financial requirements.
The CB&S businesses are supported by the Credit Portfolio Strategies Group (CPSG), which was formerly known as the Loan Exposure Management Group (LEMG). CPSG has responsibility for a range of loan portfolios, actively managing the risk of these through the implementation of a structured hedging regime.
Effective in November 2012, following a comprehensive strategic review of the Group’s organizational structure, CB&S was realigned as part of the Group’s new banking model. This realignment covered three main aspects: the transfer of non-core assets (namely correlation and capital intensive securitization positions, monoline positions, and IAS 39 reclassified assets) to the NCOU; the transfer of passive and third-party alternatives businesses, such as ETF’s, into the newly integrated AWM Corporate Division; and a refinement of coverage costs between CB&S and GTB.
Products and Services
Within our Corporate Finance Business Division, our clients are offered mergers and acquisitions, equity and debt financing and general corporate finance advice. In addition, we provide a variety of financial services to the public sector.
The Markets Business Division is responsible for the sales, trading and structuring of a wide range of fixed income, equity, equity-linked, foreign exchange and commodities products. The division aims to deliver solutions for the investing, hedging and other needs of customers. As part of the realignment of CB&S in November 2012, Rates and Flow Credit Trading businesses were integrated and the Structured Finance business was created to encompass non-flow financing and structured risk for clients across all industries and asset classes.
We exited our dedicated Equity Proprietary Trading business during 2010, following the exit of our dedicated Credit Proprietary Trading business during 2008. Along with managing any residual proprietary positions, we continue to conduct trading on our own account in the normal course of market-making and facilitating client business. For example, to facilitate customer flow business, traders will maintain short-term long positions (accumulating securities) and short positions (selling securities we do not yet own) in a range of securities and derivative products, reducing the exposure by hedging transactions where appropriate. While these activities give rise to market and other risk, we do not view this as proprietary trading.
| | | | |
| Deutsche Bank | | 01 – Management Report | | 6 |
| Financial Report 2012 | | Operating and Financial Review | | |
| | |
| | | | |
| | |
| | | | |
All our trading activities are covered by our risk management procedures and controls which are described in detail in the Risk Report.
Distribution Channels and Marketing
In CB&S, the focus of our corporate and institutional coverage bankers and sales teams is on our client relationships. We have restructured our client coverage model so as to provide varying levels of standardized or dedicated services to our customers depending on their needs and level of complexity.
Global Transaction Banking Corporate Division
Corporate Division Overview
GTB delivers commercial banking products and services to corporate clients and financial institutions, including domestic and cross-border payments, financing for international trade, as well as the provision of trust, agency, depositary, custody and related services. Our business divisions consist of:
| — | | Trade Finance and Cash Management Corporates |
| — | | Trust & Securities Services and Cash Management Financial Institutions |
On April 1, 2010, we closed the acquisition of parts of ABN AMRO’s commercial banking activities in the Netherlands.
Products and Services
Trade Finance offers local expertise, a range of international trade products and services (including short-term financing), custom-made solutions for structured trade and the latest technology across our international network so that our clients can better manage the risks and other issues associated with their cross-border and domestic trades.
Cash Management caters to the needs of a diverse client base of corporates and financial institutions. With the provision of a comprehensive range of innovative and robust solutions, we handle the complexities of global and regional treasury functions including customer access, payment and collection services, liquidity management, information and account services and electronic bill presentation and payment solutions.
Trust & Securities Services provides a range of trust, payment, administration and related services for selected securities and financial transactions, as well as domestic securities custody in more than 30 markets.
Distribution Channels and Marketing
GTB develops and markets its own products and services in Europe, the Middle East, Asia and the Americas. The marketing is carried out in conjunction with the coverage functions both in this division and in CB&S.
Customers can be differentiated into two main groups: (i) financial institutions, such as banks, mutual funds and retirement funds, broker-dealers, fund managers and insurance companies, and (ii) multinational corporations, large local corporates and medium-sized companies, predominantly in Germany and the Netherlands.
Asset & Wealth Management Corporate Division
Corporate Division Overview
With€ 944 billion of invested assets as of December 31, 2012, Deutsche Bank AWM is one of the world’s leading investment organizations. AWM helps individuals and institutions worldwide to protect and grow their wealth, offering traditional and alternative investments across all major asset classes. AWM also provides customized wealth management solutions and private banking services to high-net-worth and ultra-high-net-worth individuals and family offices.
AWM comprises former Private Wealth Management (PWM) and Asset Management (AM) businesses as well as passive and third party alternatives businesses that were re-assigned from CB&S to AWM in the fourth quarter 2012. The combined division has sizable franchises in both retail and institutional asset and wealth
| | | | |
| Deutsche Bank | | 01 – Management Report | | 7 |
| Financial Report 2012 | | Operating and Financial Review | | |
| | |
| | | | |
| | |
| | | | |
management, allowing both clients and Deutsche Bank Group to benefit from its scale. In addition, non-core assets and businesses were re-assigned from AWM to the NCOU in the fourth quarter 2012. AWM now consists of two major pillars: Investment Platform and Coverage/Advisory.
In November 2011, we completed the step-acquisition of Deutsche UFG Capital Management (“DUCM”), one of Russia’s largest independent asset management companies. The transaction followed our exercise of a purchase option on the remaining 60 % stake. We now fully control DUCM, which was previously accounted for under the equity method.
Since March 2010, Sal. Oppenheim jr. & Cie. S.C.A. has been a wholly owned subsidiary of Deutsche Bank AG. All Sal. Oppenheim Group operations, including all of its asset management activities, the investment bank, BHF-BANK Group, BHF Asset Servicing GmbH (BAS) and Sal. Oppenheim Private Equity Partners S.A. were transferred to Deutsche Bank. The Equity Trading & Derivatives and Capital Markets Sales units were sold to Australia’s Macquarie Group in the second quarter 2010, while BAS was sold to Bank of New York Mellon in the third quarter 2010. As of January 1, 2011, BHF-BANK was transferred from former PWM to former CI.
Products and Services
The Investment Platform offers capabilities across a diverse array of asset classes and covers the former AM businesses. The Investment Platform provides securities investment management and investment management of third party real property, infrastructure, private equity and hedge fund portfolios. In addition, the Investment Platform comprises the businesses transferred from CB&S, i.e., the passive investment business, including the ETF business, and third-party alternatives businesses as well as Abbey Life, which is a closed book life insurance business.
Finally, the Investment Platform also offers customized wealth management solutions and private banking services including lending and discretionary portfolio management.
The second major pillar of AWM is Coverage/Advisory, focusing on the connecting and engaging with clients. Beside the coverage of Institutional and Key Clients, this also includes the Wealth Management teams for Germany, Sal. Oppenheim, EMEA, Americas and APAC. Coverage/Advisory has a strong footprint in Europe and North America, and is expanding in emerging markets.
All businesses deliver superior service to their clients through a strong investment performance in a broader range of products and by providing customized advice and services, including strong risk management.
Distribution Channels and Marketing
A major competitive advantage for AWM is the fact that it is a private bank within Deutsche Bank, with its substantial investment banking, corporate banking and asset management activities. In order to make optimal use of the potential offered by cross-divisional cooperation, since 2007 AWM has established Key Client Teams in order to serve clients with very complex assets and highly sophisticated needs. Coverage offers these clients the opportunity to make direct additional purchases, co-invest in its private equity activities or obtain direct access to its trading units.
AWM Coverage/Advisory possesses well-established and worldwide internal distribution channels. It pursues an integrated business model to cater to the complex needs of high-net-worth clients and ultra-high-net-worth individuals, family offices and selected institutions. The relationship managers work within target customer groups, assisting clients in developing individual investment strategies and creating enduring relationships with our clients.
AWM also markets and distributes its offering through other business divisions of Deutsche Bank Group, notably PBC for retail customers and CB&S for institutional and corporate customer, as well as through third-party distributors.
| | | | |
| Deutsche Bank | | 01 – Management Report | | 8 |
| Financial Report 2012 | | Operating and Financial Review | | |
| | |
| | | | |
| | |
| | | | |
Private & Business Clients Corporate Division
Corporate Division Overview
PBC operates under a single business model across Europe and selected Asian markets. PBC serves retail and affluent clients as well as small and medium sized business customers.
The PBC Corporate Division is organized into the following business units:
| — | | Advisory Banking Germany, which comprises all of PBC’s activities in Germany excluding Postbank. |
| — | | Advisory Banking International, which covers PBC’s European activities outside Germany and PBC’s activities in Asia including our stake in and partnership with Hua Xia Bank. |
| — | | Consumer Banking Germany, which mainly comprises the contribution of Postbank Group to the consolidated results of Deutsche Bank. |
With establishment of the NCOU, PBC reassigned several business portfolios as well as non-strategic activities, in particular in non-strategic locations, into the new corporate division.
In 2012, we continued our balanced growth with a strategic focus on balance sheet based business, e.g. mortgages.
With the integration of Postbank, we strengthen and expanded our leading market position in our German home market, offering synergy potential and growth opportunities. By combining the businesses we aim at increasing the share of retail banking earnings in the results of the Group and further strengthening and diversifying the refinancing basis of the Group due to significantly increased volumes of retail customer deposits. Postbank continues to exist as a stand-alone stock corporation and remains visible in the market under its own brand. With the conclusion of the domination and profit and loss transfer agreement and the continued execution of the integration of Postbank into PBC, we seek to significantly progress towards our integrated business model and generate considerable revenue and costs synergies.
We have consolidated Deutsche Postbank Group since December 2010. Further information on the Postbank acquisition is included in Note 04 “Acquisitions and Dispositions”.
In Europe we are focusing on low risk products and advisory services for affluent and business customers. Our profitable brand network operates in five major banking markets in Continental Europe: Italy, Spain, Portugal, Belgium and Poland.
In Asia, PBC operates a branch network supported by a mobile sales force in India and holds a 19.99 % stake in the Chinese Hua Xia Bank, with which it has a strategic partnership and cooperation arrangement. As part of this, we and Hua Xia Bank have jointly developed and distributed credit cards in China. In India, PBC currently has seventeen branches. India and China are considered Asian core markets for PBC. While further growing the franchise in India through continuous branch openings, our China strategy focuses on leveraging our stake in Hua Xia Bank.
Products and Services
PBC offers a similar range of banking products and services throughout Europe and Asia, with some variations among countries that are driven by local market, regulatory and customer requirements.
We provide portfolio/fund management (investment advice, discretionary portfolio management and securities custody services) and brokerage services to our clients.
We provide loan and deposit services, with the a strategy focusing on property financing (including mortgages) and consumer and commercial loans, as well as traditional current accounts, savings accounts and time deposits. The property finance business, which includes mortgages and construction finance, is our most significant lending business. We provide property finance loans primarily for private purposes, such as home
| | | | |
| Deutsche Bank | | 01 – Management Report | | 9 |
| Financial Report 2012 | | Operating and Financial Review | | |
| | |
| | | | |
| | |
| | | | |
financing. Most of our mortgages have an original fixed interest period of five or ten years. Loan and deposit products also include the home loan and savings business in Germany, offered through our subsidiaries Deutsche Bank Bauspar AG and BHW Bausparkasse AG. Our lending businesses are subject to our credit risk management processes, both at origination and on an ongoing basis. For further discussion of these processes please see the “Monitoring Credit Risk” and “Main Credit Exposure Categories” sections in the Risk Report.
PBC’s deposits and payment services consist of administration of current accounts in local and foreign currency as well as settlement of domestic and cross-border payments on these accounts. They also include the purchase and sale of payment media and the sale of insurance products, home loan and savings contracts and credit cards. In the ongoing low interest rate environment in Germany, we maintained our focus on stabilizing our deposit base, including sight deposits, while growing our deposit base in Europe, where we optimized our local funding.
Distribution Channels and Marketing
To achieve a strong brand position internationally, we market our services consistently throughout the European and Asian countries which are of strategic focus and in which PBC is active directly. In order to make banking products and services more attractive to clients, we seek to optimize the accessibility and availability of our services. To accomplish this, we deploy self-service functions and technological advances to supplement our branch network with an array of access channels to PBC’s products and services. These channels consist of the following in-person and remote distribution points:
| — | | Investment and Finance Centers. Investment and Finance Centers offer our entire range of products and advice. |
| — | | Financial Agents. In most countries, we market our retail banking products and services through self-employed financial agents. |
| — | | Call Centers. Call centers provide clients with remote services supported by automated systems. Remote services include access to account information, securities brokerage and other basic banking transactions. |
| — | | Internet. On our website, we offer clients brokerage services, account information and product information on proprietary and third-party investment products. These offerings are complemented with services that provide information, analysis tools and content to support the client in making independent investment decisions. |
| — | | Self-service Terminals. These terminals support our branch network and allow clients to withdraw and transfer funds, receive custody account statements and make appointments with our financial advisors. |
In addition to our branch network and financial agents, we enter into country-specific distribution and cooperation arrangements. In Germany, we maintain cooperation partnerships with reputable companies such as DP DHL (Postbank cooperation) and Deutsche Vermögensberatung AG (DVAG). With DVAG, we distribute our mutual funds and other banking products through DVAG’s independent distribution network. In order to complement our product range, we have signed distribution agreements, in which PBC distributes the products of reputable product suppliers. These include an agreement with Zurich Financial Services for insurance products, and a strategic alliance with nine fund companies for the distribution of their investment products.
Non-Core Operations Unit Corporate Division
In November 2012, we established the NCOU. The NCOU operates as a separate corporate division alongside Deutsche Bank’s core businesses. The NCOU manages assets with a value of approximately€ 100 billion and Basel 2.5 risk-weighted assets (“RWA”) equivalent of€ 80 billion, as of December 31, 2012.
As set out in Strategy 2015+, our objectives in setting up the NCOU are to improve external transparency of our non-core positions; to increase management focus on the core operating businesses by separating the non-core activities; and to facilitate targeted accelerated de-risking.
| | | | |
| Deutsche Bank | | 01 – Management Report | | 10 |
| Financial Report 2012 | | Operating and Financial Review | | |
| | |
| | | | |
| | |
| | | | |
In addition to managing our global principal investments and holding certain other non-core assets to maturity, targeted de-risking activities within the NCOU will help us reduce risks that are not related to our planned future strategy, thereby reducing capital demand. In carrying out these targeted de-risking activities, the NCOU will prioritize for exit those positions with less favorable capital and risk return profiles to enable the Bank to strengthen its Core Tier 1 capital ratio under Basel 3.
The NCOU’s portfolio includes activities that are non-core to the Bank’s strategy going forward; assets materially affected by business, environment, legal or regulatory changes; assets earmarked for de-risking; assets suitable for separation; assets with significant capital absorption but low returns; and assets exposed to legal risks. In addition, certain liabilities were also assigned to the NCOU following similar criteria to those used for asset selection, e.g. liabilities of businesses in run-off or for sale, legacy bond issuance formats and various other short-dated liabilities, linked to assigned assets.
In RWA terms the majority has been assigned from CB&S, and includes credit correlation trading positions, securitization assets, exposures to monoline insurers and assets reclassified under IAS 39. Assets assigned from PBC include Postbank commercial real estate assets outside core markets, Postbank capital-intensive structured credit products, selected foreign residential mortgages and other financial investments, such as the structured credit and the GIIPS portfolio which have already been in run-off for a number of years, and the repo matched book with balance sheet leverage no longer deemed strategic for Postbank. NCOU’s portfolio also contains all those assets previously booked and managed in the former Group Division CI. These are the Bank’s global principal investment activities and include our stakes in the port operator Maher Terminals, The Cosmopolitan of Las Vegas and BHF-BANK.
Effective January 1, 2011, the exposure in Actavis Group was transferred from CB&S to former CI. During the fourth quarter 2012, we completed the sale of Actavis Group from the NCOU.
As of January 1, 2011, BHF-BANK, was transferred from AWM to former CI.
In December 2010, the former CI transferred the investment in Deutsche Postbank AG to PBC. Also in December 2010, The Cosmopolitan of Las Vegas property started its operations.
Infrastructure and Regional Management
The infrastructure group consists of our centralized business support areas. These areas principally comprise control and service functions supporting our five corporate divisions.
This infrastructure group is organized to reflect the areas of responsibility of those Management Board members that are not in charge of a specific business line. The infrastructure group is organized into COO functions (e.g., global technology, global business services, global logistics services and group strategy & planning), CFO functions (e.g., finance, tax, insurance and treasury), CRO functions (e.g., credit risk management and market risk management), CEO functions (e.g., communications & corporate social responsibility and economics) and HR, Legal & Compliance functions.
The Regional Management function covers regional responsibilities worldwide. It focuses on governance, franchise development and performance development. Regional and country heads and management committees are established in the regions to enhance client-focused product coordination across businesses and to ensure compliance with regulatory and control requirements, both from a local and Group perspective. In addition the Regional Management function represents regional interests at the Group level and enhances cross-regional coordination.
All expenses and revenues incurred within the Infrastructure and Regional Management areas are fully allocated to our five corporate divisions.
| | | | |
| Deutsche Bank | | 01 – Management Report | | 11 |
| Financial Report 2012 | | Operating and Financial Review | | |
| | |
| | | | |
| | |
| | | | |
Executive Summary
The Global Economy
The global economy was impacted by numerous negative factors in 2012: the sovereign debt crisis in Europe, the fiscal cliff in the U.S., geopolitical risks in the Middle East and rising commodities and food prices. In 2012, global economic growth continued to decline to an estimated 2.9 % after an already slower growth of 3.8 % in 2011.
As in 2011, the slowdown took place predominantly in the industrialized countries, which only expanded by an estimated 1.2 %. The industrialized countries still face major structural challenges. The reduction in state deficits and the cutting back of private debt led to lower growth in the eurozone in particular. In addition, the increased political uncertainties in the eurozone and the U.S. had a negative impact on the global economy. By contrast, growth was supported by the extremely expansive monetary policy of the major central banks, which lowered their key interest rates to historically low levels and also undertook extensive quantitative easing measures.
The eurozone went into recession in 2012 due to increased uncertainty over the further development of the sovereign debt crisis, fiscal consolidation and weakened demand for exports. Economic activity fell by an estimated 0.5 %, following 1.4 % growth in 2011. A stabilizing effect came from the announcement made by the European Central Bank in September 2012 that it would make unlimited purchases of sovereign bonds, subject to strict conditionality (Outright Monetary Transactions), as well as the clear commitment of eurozone governments for all current members to stay in the eurozone. The German economy weakened noticeably over the year due to reduced demand for exports and falling investment activity, and it likely contracted towards the end of 2012. As an annualized average, the German economy grew by an estimated 0.7 % following an increase of 3.0 % in 2011.
In the U.S. economy, growth was relatively robust with estimated 2.3 % in 2012, which was somewhat stronger than the 1.8 % in the previous year. Although the real estate market stabilized and unemployment gradually fell over the year, doubts over the resolution of the fiscal cliff are thought to have caused growth to slow towards the end of the year. In Japan, where the clean-up and rebuilding efforts in the wake of the tsunami and the nuclear catastrophe and the government’s economic stimulus measures had a positive effect on economic activity in the first half of 2012, economic output declined again from mid-year. For the year as a whole, Japan’s economy probably grew by 2.0 %.
Due to the close links between the financial and real economies, the global development had negative effects on economic activity in emerging markets. Growth in emerging markets cooled down to an estimated 4.7 %, but there are clear differences in growth between the regions. Growth in Asia (excluding Japan) slowed down from 7.5 % in 2011 to 5.9 % in 2012. China’s growth moderated considerably to 7.8 % year-on-year, the slowest since 1999, due to the confluence of stagnating external demand and a deliberate attempt to restrain stimulus with a view to rebalance the economic structure. India’s growth also slowed significantly to 4.6 % year-on-year, the lowest in a decade, as domestic demand was hit by tight liquidity and stubborn inflation. Economic activity in Latin America cooled off to 2.9 % in 2012, following 4.7 % growth in 2011. Brazilian economic growth continued to disappoint in 2012, slowing to an estimated 1 % from an already weak 2.7 % in 2011. While domestic demand and labor markets remained strong, investment was weak and exports were weighed down by stagnating global economic activity and lower prices for several commodities.
| | | | |
| Deutsche Bank | | 01 – Management Report | | 12 |
| Financial Report 2012 | | Operating and Financial Review | | |
| | |
| | | | |
| | |
| | | | |
The Banking Industry
The banking industry in 2012 saw another year marked by high uncertainty, yet with sentiment gradually improving in the last six months due to retreating concerns about the future of European Monetary Union and about the global growth outlook.
Capital market developments closely echoed these trends. Overall, global M&A activity and equities issuance remained subdued, while debt issuance soared to record highs both in the investment-grade and the high-yield segment. This was particularly true in the second half of the year when investor risk appetite returned and bond yields came down significantly. Corporate bond issuance in 2012 was stronger than ever before. Total investment banking revenues declined slightly compared with the prior year, with Europe and Asia weakening and the fee volume in America rising. Similar to the advisory and underwriting business, equities trading activity was relatively low, with falling margins putting additional pressure on revenues. Fixed-income trading rebounded somewhat from a poor prior year result, though earnings remained below 2009/10 levels.
In commercial banking, Europe and the U.S. were diverging even more markedly than in the years before: U.S. banks continued their recovery and are now as profitable as at the pre-crisis peak. Lending volumes are growing, especially with companies borrowing more, but with the real estate market finally having turned the corner, household lending and particularly residential mortgages may have also bottomed out. In Europe, by contrast, corporate loans shrank throughout the year, with the pace of contraction accelerating rather than slowing down. Lending to households, at least, remained by and large stable. Deposit growth continued at moderate speed on both sides of the Atlantic, though it lost some momentum in the U.S. In addition, differences in asset quality developments were partly responsible for the diverging fortunes between European banks, which saw loan loss provisions rising again for the first time since 2009 and U.S. institutions, which recorded a further fall in provisions to their lowest level in five years.
Asset and wealth management benefited from rising equity and bond markets, particularly in the second half of the year, and from investors increasingly searching for yield in a close-to-zero interest rate environment. Globally, bond funds attracted the bulk of net new money, whereas many equity and money market funds recorded net outflows. As in the past few years, the passively managed segment grew faster than actively managed funds.
New regulation had a significant impact on the industry: While European banks still had to cope with the tightening effect of Basel 2.5, the foreshadowing of Basel 3 was felt throughout the banking sector as investors and analysts demanded early compliance. Furthermore, new consumer and investor protection rules and market infrastructure regulations such as the Markets in Financial Instruments Directive II and European Market Infrastructure Regulation (the former being drawn up and the latter taking effect) had a largely negative effect on banks’ earnings. In the eurozone, political leaders agreed on a transfer of supervisory powers over the largest banks from national authorities to the European Central Bank (ECB), as part of a more comprehensive shift towards a “Banking Union”. Finally, the banking industry in the U.S. as well as in Europe suffered steep fines and losses in confidence as litigation issues continued to mount.
Deutsche Bank
The market environment in 2012 continued to be difficult. A slowdown in economic growth could be observed predominantly in the industrialized countries, while conditions in the eurozone have stabilized only since mid-2012. Structural debt levels in mature economies were still high and were reflected in strong client demand. The macro-political environment, however, perpetuated low interest rate levels. Equity markets could not yet consistently profit from the stabilized environments, resulting in volatile market conditions, favoring only the derivative segment of the market. Many other markets and products saw competitive pressures, margin compression, declining volumes and macro-economic and regulatory uncertainties which caused volatility. As a result, this led to risk aversion among investors with especially private investors remaining wary for most of the year.
| | | | |
| Deutsche Bank | | 01 – Management Report | | 13 |
| Financial Report 2012 | | Operating and Financial Review | | |
| | |
| | | | |
| | |
| | | | |
Despite this challenging environment, our revenue performance was resilient, with increases in almost every business division in the “Core Bank” (CB&S, GTB, AWM and PBC), and our provision for credit losses was lower than in the prior year. However, results especially in the second half of 2012 reflected the impact of several actions taken to mobilize our Strategy 2015+. These actions resulted mainly in higher noninterest expenses versus the full-year 2011, including cost-to-achieve related to our Operational Excellence Program (OpEx) and the integration of Postbank totaling€ 0.9 billion. We met the savings objectives of OpEx for year-end 2012, achieving savings of€ 0.4 billion in the second half of 2012. Expenses also included impairments of goodwill and other intangible assets (€ 1.9 billion) as well as significant litigation-related charges (€ 2.2 billion). In addition, our results in 2012 were impacted by further specific items of€ 1.3 billion, such as charges related to turnaround measures in our commercial banking activities in the Netherlands, other net charges and results from de-risking in the NCOU.
In this context, we generated a 2012 net income of€ 291 million (2011:€ 4.3 billion) and income before income taxes of€ 784 million compared with€ 5.4 billion in 2011. Excluding the impairment of goodwill and other intangible assets as well as the significant litigation-related charges, full year income before income taxes for the Group would have been€ 4.9 billion in 2012, to which the Core Bank contributed€ 6.5 billion.
In 2012, we have reviewed our variable compensation levels and established a Compensation Panel. As a first result, though compensation and benefits expenses increased 3 % in 2012 from 2011, variable compensation has come down by 11 % versus 2011, and we reduced our deferral rate from 61 % to 47 %, thus reducing respective charges on future year’s results.
Overall, we considerably strengthened our capital position, liquidity reserves and refinancing sources and, thus, should be well prepared for further potential challenges caused by market turbulences and stricter regulatory rules. Due to the annual net income and the accelerated capital formation and de-risking activities, including measures taken in the NCOU, our Tier 1 capital ratio according to Basel 2.5 improved to a record level of 15.1 % and our Core Tier 1 capital ratio increased to 11.4 % as of December 31, 2012. The pro-forma Basel 3 fully-loaded Core Tier 1 capital ratio also increased substantially to 7.8 % up from less than 6 % in the preceding year and surpassed the communicated target of 7.2 %, reflecting strong delivery on portfolio optimization and de-risking of non-core activities, as well as model and process enhancements.
Risk-weighted assets at year-end 2012 were€ 334 billion, versus€ 381 billion at year-end 2011, largely due to management actions aimed at de-risking our business. In the second half of 2012, we achieved a reduction in pro-forma Basel 3 risk-weighted asset equivalents of€ 80 billion, versus our communicated target of€ 90 billion for March 31, 2013.
Our liquidity reserves were in excess of€ 230 billion as of December 31, 2012, including reserves held on a Postbank AG level, which contributed in excess of€ 25 billion at year-end (December 31, 2011:€ 223 billion, excluding Postbank).
| | | | |
| Deutsche Bank | | 01 – Management Report | | 14 |
| Financial Report 2012 | | Operating and Financial Review | | |
| | |
| | | | |
| | |
| | | | |
Condensed Consolidated Statement of Income
| | | | | | | | | | | | | | | | | | | | | | | | | | | | |
| in€ m. | | | | | | | | | | | 2012 increase (decrease)
from 2011 | | | 2011 increase (decrease)
from 2010 | |
(unless stated otherwise) | | 2012 | | | 2011 | | | 2010 | | | in€ m. | | | in % | | | in€ m. | | | in % | |
Net interest income | | | 15,891 | | | | 17,445 | | | | 15,583 | | | | (1,554) | | | | (9) | | | | 1,862 | | | | 12 | |
| | | | | | | | | | | | | | | | | | | | | | | | | | | | |
Provision for credit losses | | | 1,721 | | | | 1,839 | | | | 1,274 | | | | (118) | | | | (6) | | | | 565 | | | | 44 | |
| | | | | | | | | | | | | | | | | | | | | | | | | | | | |
| Net interest income after provision for credit losses | | | 14,170 | | | | 15,606 | | | | 14,309 | | | | (1,436) | | | | (9) | | | | 1,297 | | | | 9 | |
| | | | | | | | | | | | | | | | | | | | | | | | | | | | |
Commissions and fee income | | | 11,510 | | | | 11,544 | | | | 10,669 | | | | (34) | | | | (0) | | | | 875 | | | | 8 | |
| | | | | | | | | | | | | | | | | | | | | | | | | | | | |
| Net gains (losses) on financial assets/liabilities at fair value through profit or loss | | | 5,599 | | | | 3,058 | | | | 3,354 | | | | 2,541 | | | | 83 | | | | (296) | | | | (9) | |
| | | | | | | | | | | | | | | | | | | | | | | | | | | | |
| Net gains (losses) on financial assets available for sale | | | 301 | | | | 123 | | | | 201 | | | | 178 | | | | 145 | | | | (78) | | | | (39) | |
| | | | | | | | | | | | | | | | | | | | | | | | | | | | |
| Net income (loss) from equity method investments | | | 159 | | | | (264) | | | | (2,004) | | | | 423 | | | | N/M | | | | 1,740 | | | | (87) | |
| | | | | | | | | | | | | | | | | | | | | | | | | | | | |
Other income (loss) | | | 281 | | | | 1,322 | | | | 764 | | | | (1,041) | | | | (79) | | | | 558 | | | | 73 | |
| | | | | | | | | | | | | | | | | | | | | | | | | | | | |
Total noninterest income | | | 17,850 | | | | 15,783 | | | | 12,984 | | | | 2,067 | | | | 13 | | | | 2,799 | | | | 22 | |
| | | | | | | | | | | | | | | | | | | | | | | | | | | | |
Total net revenues1 | | | 32,020 | | | | 31,389 | | | | 27,293 | | | | 631 | | | | 2 | | | | 4,096 | | | | 15 | |
| | | | | | | | | | | | | | | | | | | | | | | | | | | | |
Compensation and benefits | | | 13,526 | | | | 13,135 | | | | 12,671 | | | | 391 | | | | 3 | | | | 464 | | | | 4 | |
| | | | | | | | | | | | | | | | | | | | | | | | | | | | |
General and administrative expenses | | | 15,016 | | | | 12,657 | | | | 10,133 | | | | 2,359 | | | | 19 | | | | 2,524 | | | | 25 | |
| | | | | | | | | | | | | | | | | | | | | | | | | | | | |
Policyholder benefits and claims | | | 414 | | | | 207 | | | | 485 | | | | 207 | | | | 100 | | | | (278) | | | | (57) | |
| | | | | | | | | | | | | | | | | | | | | | | | | | | | |
Impairment of intangible assets | | | 1,886 | | | | – | | | | 29 | | | | 1,886 | | | | N/M | | | | (29) | | | | N/M | |
| | | | | | | | | | | | | | | | | | | | | | | | | | | | |
Restructuring activities | | | 394 | | | | – | | | | – | | | | 394 | | | | N/M | | | | – | | | | N/M | |
| | | | | | | | | | | | | | | | | | | | | | | | | | | | |
Total noninterest expenses | | | 31,236 | | | | 25,999 | | | | 23,318 | | | | 5,237 | | | | 20 | | | | 2,681 | | | | 11 | |
| | | | | | | | | | | | | | | | | | | | | | | | | | | | |
Income before income taxes | | | 784 | | | | 5,390 | | | | 3,975 | | | | (4,606) | | | | (85) | | | | 1,415 | | | | 36 | |
| | | | | | | | | | | | | | | | | | | | | | | | | | | | |
Income tax expense | | | 493 | | | | 1,064 | | | | 1,645 | | | | (571) | | | | (54) | | | | (581) | | | | (35) | |
| | | | | | | | | | | | | | | | | | | | | | | | | | | | |
Net income | | | 291 | | | | 4,326 | | | | 2,330 | | | | (4,035) | | | | (93) | | | | 1,996 | | | | 86 | |
| | | | | | | | | | | | | | | | | | | | | | | | | | | | |
| Net income attributable to noncontrolling interests | | | 54 | | | | 194 | | | | 20 | | | | (140) | | | | (72) | | | | 174 | | | | N/M | |
| | | | | | | | | | | | | | | | | | | | | | | | | | | | |
| Net income attributable to Deutsche Bank shareholders | | | 237 | | | | 4,132 | | | | 2,310 | | | | (3,895) | | | | (94) | | | | 1,822 | | | | 79 | |
| |
N/M – Not meaningful
| 1 | After provision for credit losses. |
Results of Operations
Consolidated Results of Operations
You should read the following discussion and analysis in conjunction with the consolidated financial statements.
Net Interest Income
| | | | | | | | | | | | | | | | | | | | | | | | | | | | |
| in€ m. | | | | | | | | | | | 2012 increase (decrease)
from 2011 | | | 2011 increase (decrease)
from 2010 | |
(unless stated otherwise) | | 2012 | | | 2011 | | | 2010 | | | in€ m. | | | in % | | | in€ m. | | | in % | |
Total interest and similar income | | | 32,242 | | | | 34,878 | | | | 28,779 | | | | (2,636) | | | | (8) | | | | 6,099 | | | | 21 | |
| | | | | | | | | | | | | | | | | | | | | | | | | | | | |
Total interest expenses | | | 16,351 | | | | 17,433 | | | | 13,196 | | | | (1,083) | | | | (6) | | | | 4,237 | | | | 32 | |
| | | | | | | | | | | | | | | | | | | | | | | | | | | | |
Net interest income | | | 15,891 | | | | 17,445 | | | | 15,583 | | | | (1,554) | | | | (9) | | | | 1,862 | | | | 12 | |
| | | | | | | | | | | | | | | | | | | | | | | | | | | | |
Average interest-earning assets1 | | | 1,241,791 | | | | 1,174,201 | | | | 993,780 | | | | 67,590 | | | | 6 | | | | 180,421 | | | | 18 | |
| | | | | | | | | | | | | | | | | | | | | | | | | | | | |
Average interest-bearing liabilities1 | | | 1,120,540 | | | | 1,078,721 | | | | 933,537 | | | | 41,819 | | | | 4 | | | | 145,184 | | | | 16 | |
| | | | | | | | | | | | | | | | | | | | | | | | | | | | |
Gross interest yield2 | | | 2.61% | | | | 2.97% | | | | 2.90% | | | | (0.36) ppt | | | | (12) | | | | 0.07 ppt | | | | 2 | |
| | | | | | | | | | | | | | | | | | | | | | | | | | | | |
Gross interest rate paid3 | | | 1.48% | | | | 1.62% | | | | 1.41% | | | | (0.14) ppt | | | | (9) | | | | 0.21 ppt | | | | 15 | |
| | | | | | | | | | | | | | | | | | | | | | | | | | | | |
Net interest spread4 | | | 1.14% | | | | 1.35% | | | | 1.48% | | | | (0.21) ppt | | | | (16) | | | | (0.13) ppt | | | | (9) | |
| | | | | | | | | | | | | | | | | | | | | | | | | | | | |
Net interest margin5 | | | 1.28% | | | | 1.49% | | | | 1.57% | | | | (0.21) ppt | | | | (14) | | | | (0.08) ppt | | | | (5) | |
| |
ppt – Percentage points
| 1 | Average balances for each year are calculated in general based upon month-end balances. |
| 2 | Gross interest yield is the average interest rate earned on our average interest-earning assets. |
| 3 | Gross interest rate paid is the average interest rate paid on our average interest-bearing liabilities. |
| 4 | Net interest spread is the difference between the average interest rate earned on average interest-earning assets and the average interest rate paid on average interest-bearing liabilities. |
| 5 | Net interest margin is net interest income expressed as a percentage of average interest-earning assets. |
The decrease in net interest income in 2012 of€ 1.6 billion, or 9 %, to€ 15.9 billion compared to€ 17.4 billion in 2011, was primarily driven by lower interest income on CB&S trading assets resulting from a lower interest rate environment and reduced asset volumes as well as by lower net interest income in the NCOU due to a
| | | | |
| Deutsche Bank | | 01 – Management Report | | 15 |
| Financial Report 2012 | | Operating and Financial Review | | |
| | |
| | | | |
| | |
| | | | |
reduced asset base as a result of de-risking. The remaining decline was further impacted by lower interest income in PBC based on a decrease of Purchase Price Allocation (PPA) effects, following the acquisition of Postbank. These developments contributed to a tightening of our net interest spread by 21 basis points and to a decline in our net interest margin by 21 basis points.
The development of our net interest income is also impacted by the accounting treatment of some of our hedging-related derivative transactions. We entered into nontrading derivative transactions primarily as economic hedges of the interest rate risks of our nontrading interest-earning assets and interest-bearing liabilities. Some of these derivatives qualify as hedges for accounting purposes while others do not. When derivative transactions qualify as hedges of interest rate risks for accounting purposes, the interest arising from the derivatives is reported in interest income and expense, where it offsets interest flows from the hedged items. When derivatives do not qualify for hedge accounting treatment, the interest flows that arise from those derivatives will appear in trading income.
Net Gains (Losses) on Financial Assets/Liabilities at Fair Value through Profit or Loss
| | | | | | | | | | | | | | | | | | | | | | | | | | | | |
| in€ m. | | | | | | | | | | | 2012 increase (decrease)
from 2011 | | | 2011 increase (decrease)
from 2010 | |
| (unless stated otherwise) | | 2012 | | | 2011 | | | 2010 | | | in € m. | | | in % | | | in € m. | | | in % | |
| | | | | | | | | | | | | | | | | | | | | | | | | | | | |
CB&S – Sales & Trading (equity) | | | 998 | | | | 312 | | | | 375 | | | | 686 | | | | N/M | | | | (63) | | | | (17) | |
| | | | | | | | | | | | | | | | | | | | | | | | | | | | |
CB&S – Sales & Trading (debt and other products) | | | 4,491 | | | | 4,337 | | | | 4,392 | | | | 154 | | | | 4 | | | | (55) | | | | (1) | |
| | | | | | | | | | | | | | | | | | | | | | | | | | | | |
Non-Core Operations Unit | | | (1,256) | | | | (1,564) | | | | (1,961) | | | | 308 | | | | (20) | | | | 397 | | | | (20) | |
| | | | | | | | | | | | | | | | | | | | | | | | | | | | |
Other | | | 1,366 | | | | (27) | | | | 548 | | | | 1,393 | | | | N/M | | | | (575) | | | | N/M | |
| | | | | | | | | | | | | | | | | | | | | | | | | | | | |
| Total net gains (losses) on financial assets/ liabilities at fair value through profit or loss | | | 5,599 | | | | 3,058 | | | | 3,354 | | | | 2,541 | | | | 83 | | | | (296) | | | | (9) | |
| | | | | | | | | | | | | | | | | | | | | | | | | | | | |
N/M – Not meaningful
Net gains on financial assets/liabilities at fair value through profit or loss increased by€ 2.5 billion to€ 5.6 billion for the full year 2012. The majority of the increase in net gains on financial assets/liabilities at fair value through profit or loss arose outside our Sales & Trading business. Special factors were mainly gains on remaining products held at fair value in CB&S arising from refinements in methodology used to calculate Debt Valuation Adjustments (DVA) on derivative liabilities, a decrease of fair value losses at Abbey Life in AWM and higher net gains in Consolidation & Adjustments (C&A) related to U.S. dollar/euro basis swaps designated as net investment hedges for capital investments in US entities. The increase of€ 686 million of net gains on financial assets/liabilities at fair value through profit or loss in Sales & Trading (equity) was due to volatile market conditions leading to an increase in client trading activities and resulting in higher revenues from equity derivatives as well as higher fair value gains in Prime Finance. The increase of€ 154 million on net gains on financial assets/liabilities at fair value through profit or loss in Sales & Trading (debt and other products) was mainly driven by higher Flow Credit revenues reflecting improved credit market conditions and higher Rates revenues driven by strong client activity. This was partially offset by lower revenues in Money Markets due to reduced volatility. The NCOU showed a decrease in net losses due to a smaller asset base as a result of de-risking activity and fair value movements on the non-core assets particularly in credit spreads.
Net Interest Income and Net Gains (Losses) on Financial Assets/Liabilities at Fair Value through Profit or Loss
Our trading and risk management businesses include significant activities in interest rate instruments and related derivatives. Under IFRS, interest and similar income earned from trading instruments and financial instruments designated at fair value through profit or loss (e.g., coupon and dividend income) and the costs of funding net trading positions are part of net interest income. Our trading activities can periodically shift income between net interest income and net gains (losses) on financial assets/liabilities at fair value through profit or loss depending on a variety of factors, including risk management strategies.
In order to provide a more business-focused discussion, the following table presents net interest income and net gains (losses) on financial assets/liabilities at fair value through profit or loss by corporate division and by product within CB&S.
| | | | |
| Deutsche Bank | | 01 – Management Report | | 16 |
| Financial Report 2012 | | Operating and Financial Review | | |
| | |
| | | | |
| | |
| | | | |
| | | | | | | | | | | | | | | | | | | | | | | | | | | | |
| in€ m. | | | | | | | | | | | 2012 increase (decrease)
from 2011 | | | 2011 increase (decrease)
from 2010 | |
(unless stated otherwise) | | 2012 | | | 2011 | | | 2010 | | | in€ m. | | | in % | | | in€ m. | | | in % | |
Net interest income | | | 15,891 | | | | 17,445 | | | | 15,583 | | | | (1,554) | | | | (9) | | | | 1,862 | | | | 12 | |
| | | | | | | | | | | | | | | | | | | | | | | | | | | | |
| Total net gains (losses) on financial assets/ liabilities at fair value through profit or loss | | | 5,599 | | | | 3,058 | | | | 3,354 | | | | 2,541 | | | | 83 | | | | (296) | | | | (9) | |
| | | | | | | | | | | | | | | | | | | | | | | | | | | | |
| Total net interest income and net gains (losses) on financial assets/liabilities at fair value through profit or loss | | | 21,490 | | | | 20,503 | | | | 18,937 | | | | 987 | | | | 5 | | | | 1,566 | | | | 8 | |
| | | | | | | | | | | | | | | | | | | | | | | | | | | | |
| | | | | | | | | | | | | | | | | | | | | | | | | | | | |
| | | | | | | | | | | | | | | | | | | | | | | | | | | | |
| Breakdown by Corporate Division/product:1 | | | | | | | | | | | | | | | | | | | | | | | | | | | | |
| | | | | | | | | | | | | | | | | | | | | | | | | | | | |
Sales & Trading (equity) | | | 1,738 | | | | 1,504 | | | | 2,151 | | | | 235 | | | | 16 | | | | (648) | | | | (30) | |
Sales & Trading (debt and other products) | | | 8,212 | | | | 8,107 | | | | 9,102 | | | | 105 | | | | 1 | | | | (995) | | | | (11) | |
Total Sales & Trading | | | 9,951 | | | | 9,611 | | | | 11,253 | | | | 340 | | | | 4 | | | | (1,642) | | | | (15) | |
| | | | | | | | | | | | | | | | | | | | | | | | | | | | |
Loan products2 | | | 337 | | | | 353 | | | | 171 | | | | (16) | | | | (5) | | | | 182 | | | | 106 | |
| | | | | | | | | | | | | | | | | | | | | | | | | | | | |
Remaining products3 | | | 1,015 | | | | 535 | | | | 353 | | | | 479 | | | | 90 | | | | 182 | | | | 52 | |
| | | | | | | | | | | | | | | | | | | | | | | | | | | | |
Corporate Banking & Securities | | | 11,303 | | | | 10,499 | | | | 11,777 | | | | 804 | | | | 8 | | | | (1,278) | | | | (11) | |
| | | | | | | | | | | | | | | | | | | | | | | | | | | | |
Global Transaction Banking | | | 1,869 | | | | 1,842 | | | | 1,451 | | | | 27 | | | | 1 | | | | 391 | | | | 27 | |
| | | | | | | | | | | | | | | | | | | | | | | | | | | | |
Asset & Wealth Management | | | 1,451 | | | | 991 | | | | 1,179 | | | | 460 | | | | 46 | | | | (188) | | | | (16) | |
| | | | | | | | | | | | | | | | | | | | | | | | | | | | |
Private & Business Clients | | | 6,221 | | | | 6,623 | | | | 3,875 | | | | (403) | | | | (6) | | | | 2,748 | | | | 71 | |
| | | | | | | | | | | | | | | | | | | | | | | | | | | | |
Non-Core Operations Unit | | | 277 | | | | 588 | | | | 321 | | | | (311) | | | | (53) | | | | 267 | | | | 83 | |
| | | | | | | | | | | | | | | | | | | | | | | | | | | | |
Consolidation & Adjustments | | | 370 | | | | (40) | | | | 333 | | | | 410 | | | | N/M | | | | (373) | | | | N/M | |
| | | | | | | | | | | | | | | | | | | | | | | | | | | | |
| Total net interest income and net gains (losses) on financial assets/liabilities at fair value through profit or loss | | | 21,490 | | | | 20,503 | | | | 18,937 | | | | 987 | | | | 5 | | | | 1,566 | | | | 8 | |
| |
N/M – Not meaningful
| 1 | This breakdown reflects net interest income and net gains (losses) on financial assets/liabilities at fair value through profit or loss only. For a discussion of the corporate divisions’ total revenues by product please refer to Note 05 “Business Segments and Related Information”. |
| 2 | Includes the net interest spread on loans as well as the fair value changes of credit default swaps and loans designated at fair value through profit or loss. |
| 3 | Includes net interest income and net gains (losses) on financial assets/liabilities at fair value through profit or loss of origination, advisory and other products. |
Corporate Banking & Securities (CB&S). Combined revenues from net interest income and from net gains (losses) on financial assets/liabilities at fair value through profit or loss from Sales & Trading were up€ 340 million, or 4 %, to€ 10.0 billion in 2012 compared to€ 9.6 billion in 2011. The increase in Sales & Trading (equity) in 2012 was primarily driven by Equity Derivatives revenues impacted by volatile market conditions. Another contributor to the increase in Sales & Trading (equity) was Equity Trading with higher net interest income due to market share gains resulting in higher volumes offsetting more difficult market conditions. In Sales & Trading (debt and other products) the main drivers for the increase of revenues from net interest income and from net gains (losses) on financial assets/liabilities at fair value through profit or loss were higher Flow Credit revenues reflecting improved credit market conditions and higher Rates revenues driven by strong client activity. This was partially offset by lower revenues in Money Markets due to lower volatility. The increase of net gains in the remaining products held at fair value in CB&S arose from refinements in methodology used to calculate Debt Valuation Adjustments (DVA) on derivative liabilities.
Global Transaction Banking (GTB). Combined revenues from net interest income and from net gains (losses) on financial assets/liabilities at fair value through profit or loss were€ 1.9 billion in 2012, an increase of€ 27 million, or 1 %, compared to 2011. Net interest income increased compared to the prior year driven by strong performance across the GTB product spectrum and regions benefiting from strong volumes. The gain was offset by a decrease in the interest income of the commercial banking activities in the Netherlands, primarily due to the depressed interest rate environment.
Asset & Wealth Management (AWM). Combined revenues from net interest income and from net gains (losses) on financial assets/liabilities at fair value through profit or loss were€ 1.5 billion in 2012, an increase of€ 460 million, or 46 %, compared to 2011. The revenue growth from net interest income and from net gains (losses) on financial assets/liabilities at fair value through profit or loss was mainly attributable to a net gain in Abbey Life offset in noninterest expenses.
Private & Business Clients (PBC). Combined revenues from net interest income and from net gains (losses) on financial assets/liabilities at fair value through profit or loss were€ 6.2 billion in 2012, a decrease of€ 403 million,
| | | | |
| Deutsche Bank | | 01 – Management Report | | 17 |
| Financial Report 2012 | | Operating and Financial Review | | |
| | |
| | | | |
| | |
| | | | |
or 6 %, compared to 2011. The combined net interest income and net gains (losses) on financial assets/liabilities at fair value through profit or loss decreased primarily due to the aforementioned lower PPA effects as well as lower interest income at Postbank.
Non-Core Operations Unit (NCOU). Combined revenues from net interest income and from net gains (losses) on financial assets/liabilities at fair value through profit or loss were€ 277 million in 2012, a decrease of€ 311 million, or 53 %, compared to 2011. The main driver for the decrease of net interest income and net gains (losses) on financial assets/liabilities at fair value through profit or loss was the smaller asset base across all products in the NCOU as a result of de-risking activity and a reduction in fair value losses predominantly due to credit spread movements.
Consolidation & Adjustments (C&A). Combined revenues from net interest income and from net gains (losses) on financial assets/liabilities at fair value through profit or loss were€ 370 million in 2012, compared with a negative€ 40 million in 2011. The increase in net interest income and net gains (losses) on financial assets/liabilities at fair value through profit and loss was mainly a result of net trading revenues from U.S. dollar/euro basis swaps designated as net investment hedges for capital investments in US entities.
Provision for Credit Losses. Provision for credit losses recorded in 2012 decreased by€ 118 million to€ 1.7 billion. This decrease excludes the effect of Postbank releases related to loan loss allowances recorded prior to consolidation of€ 157 million and€ 402 million in 2012 and 2011, respectively. The impact of such releases is reported as interest income on group level. Adjusted for this accounting effect, our provision for credit losses would be€ 1.6 billion reflecting an increase of€ 126 million compared to the prior year.
Remaining Noninterest Income
| | | | | | | | | | | | | | | | | | | | | | | | | | | | |
| in€ m. | | | | | | | | | | | 2012 increase (decrease)
from 2011 | | | 2011 increase (decrease)
from 2010 | |
(unless stated otherwise) | | 2012 | | | 2011 | | | 2010 | | | in€ m. | | | in % | | | in€ m. | | | in % | |
Commissions and fee income1 | | | 11,510 | | | | 11,544 | | | | 10,669 | | | | (34) | | | | (0) | | | | 875 | | | | 8 | |
| | | | | | | | | | | | | | | | | | | | | | | | | | | | |
| Net gains (losses) on financial assets available for sale | | | 301 | | | | 123 | | | | 201 | | | | 178 | | | | 145 | | | | (78) | | | | (39) | |
| | | | | | | | | | | | | | | | | | | | | | | | | | | | |
| Net income (loss) from equity method investments | | | 159 | | | | (264) | | | | (2,004) | | | | 423 | | | | N/M | | | | 1,740 | | | | (87) | |
| | | | | | | | | | | | | | | | | | | | | | | | | | | | |
Other income (loss) | | | 281 | | | | 1,322 | | | | 764 | | | | (1,041) | | | | (79) | | | | 558 | | | | 73 | |
| | | | | | | | | | | | | | | | | | | | | | | | | | | | |
Total remaining noninterest income | | | 12,251 | | | | 12,725 | | | | 9,630 | | | | (474) | | | | (4) | | | | 3,095 | | | | 32 | |
| | | | | | | | | | | | | | | | | | | | | | | | | | | | |
N/M – Not meaningful | | | | | | | | | | | | | | | | | | | | | | | | | | | | |
1 includes: | | | | | | | | | | | | | | | | | | | | | | | | | | | | |
| | 2012 | | | 2011 | | | 2010 | | | in € m. | | | in % | | | in € m. | | | in % | |
Commissions and fees from fiduciary activities: | | | | | | | | | | | | | | | | | | | | | | | | | | | | |
| | | | | | | | | | | | | | | | | | | | | | | | | | | | |
Commissions for administration | | | 453 | | | | 491 | | | | 491 | | | | (38) | | | | (8) | | | | – | | | | – | |
| | | | | | | | | | | | | | | | | | | | | | | | | | | | |
Commissions for assets under management | | | 2,733 | | | | 2,760 | | | | 2,833 | | | | (27) | | | | (1) | | | | (73) | | | | (3) | |
| | | | | | | | | | | | | | | | | | | | | | | | | | | | |
Commissions for other securities business | | | 240 | | | | 207 | | | | 205 | | | | 33 | | | | 16 | | | | 2 | | | | 1 | |
| | | | | | | | | | | | | | | | | | | | | | | | | | | | |
Total | | | 3,425 | | | | 3,458 | | | | 3,529 | | | | (33) | | | | (1) | | | | (71) | | | | (2) | |
| | | | | | | | | | | | | | | | | | | | | | | | | | | | |
Commissions, broker’s fees, mark-ups on securities underwriting and other securities activities: | | | | | | | | | | | | | | | | | | | | | | | | | | | | |
| | | | | | | | | | | | | | | | | | | | | | | | | | | | |
Underwriting and advisory fees | | | 1,893 | | | | 1,783 | | | | 2,148 | | | | 110 | | | | 6 | | | | (365) | | | | (17) | |
| | | | | | | | | | | | | | | | | | | | | | | | | | | | |
Brokerage fees | | | 1,526 | | | | 1,882 | | | | 1,725 | | | | (356) | | | | (19) | | | | 157 | | | | 9 | |
| | | | | | | | | | | | | | | | | | | | | | | | | | | | |
Total | | | 3,418 | | | | 3,665 | | | | 3,873 | | | | (247) | | | | (7) | | | | (208) | | | | (5) | |
| | | | | | | | | | | | | | | | | | | | | | | | | | | | |
Fees for other customer services2 | | | 4,667 | | | | 4,421 | | | | 3,267 | | | | 246 | | | | 6 | | | | 1,153 | | | | 35 | |
| | | | | | | | | | | | | | | | | | | | | | | | | | | | |
Total commissions and fee income | | | 11,510 | | | | 11,544 | | | | 10,669 | | | | (34) | | | | (0) | | | | 875 | | | | 8 | |
| |
| 2 | The increase from 2010 to 2011 includes commissions related to nonbanking activities of Postbank. |
| | | | |
| Deutsche Bank | | 01 – Management Report | | 18 |
| Financial Report 2012 | | Operating and Financial Review | | |
| | |
| | | | |
| | |
| | | | |
Commissions and fee income. Total Commissions and fee income was€ 11.5 billion in 2012, a slight decrease of€ 34 million compared to 2011. Advisory fees increased driven by Global Finance as well as by AWM Alternatives, reflecting increased deal activity. Underwriting fees were in line with 2011 with an increase in Rates and Credit Trading, reflecting higher corporate debt issuance, offset by lower fees from Equity Trading. Other customer services fees slightly increased mainly due to Trade Finance & Cash Management Corporates in GTB as well as Rates and Credit Trading in CB&S. Both Underwriting and advisory fees as well as Other customer services fees, however were offset by lower Brokerage fees, especially in PBC Products, due to muted client investment activities, and in Global Equities.
Net gains (losses) on financial assets available for sale. Net gains on financial assets available for sale were€ 301 million in 2012, versus€ 123 million in 2011.The net gain in 2012 mainly included gains on the sale of EADS shares of€ 152 million and on the sale of the Structured Credit portfolio in the NCOU. These gains were partially offset by specific impairments and realized losses on sale from de-risking activity in the NCOU. The net gain in 2011 mainly included disposal gains of approximately€ 485 million and a one-time positive impact of€ 263 million related to our stake in Hua Xia Bank, arising from the application of equity method accounting upon receiving all substantive regulatory approvals to increase our stake, partly offset by an impairment charge of€ 527 million on Greek government bonds.
Net income (loss) from equity method investments. Net gains from equity method investments were€ 159 mil-lion in 2012, versus a net loss of€ 264 million in 2011. The net income in 2012 included a positive equity pick up of€ 311 million from our investment in Hua Xia Bank, partly offset by an impairment charge of€ 257 million related to Actavis Group. The net loss in 2011 included a positive equity pick-up of€ 154 million related to our stake in Hua Xia Bank and an impairment charge of€ 457 million related to Actavis Group.
Other income (loss). Other income was a gain of€ 281 million in 2012 versus€ 1.3 billion in 2011. The lower other income in 2012 was largely due to significant losses from derivatives qualifying for hedge accounting offset by revenues related to The Cosmopolitan of Las Vegas and Maher Terminals as well as income from the settlement of credit protection received from the seller related to acquired commercial banking activities in the Netherlands. In 2011, other income mainly included significant gains from derivatives qualifying for hedge accounting and revenues related to The Cosmopolitan of Las Vegas.
| | | | |
| Deutsche Bank | | 01 – Management Report | | 19 |
| Financial Report 2012 | | Operating and Financial Review | | |
| | |
| | | | |
| | |
| | | | |
Noninterest Expenses
| | | | | | | | | | | | | | | | | | | | | | | | | | | | |
| in€ m. | | | | | | | | | | | 2012 increase (decrease)
from 2011 | | | 2011 increase (decrease)
from 2010 | |
(unless stated otherwise) | | 2012 | | | 2011 | | | 2010 | | | in€ m. | | | in % | | | in€ m. | | | in % | |
Compensation and benefits | | | 13,526 | | | | 13,135 | | | | 12,671 | | | | 391 | | | | 3 | | | | 464 | | | | 4 | |
| | | | | | | | | | | | | | | | | | | | | | | | | | | | |
General and administrative expenses1 | | | 15,016 | | | | 12,657 | | | | 10,133 | | | | 2,359 | | | | 19 | | | | 2,524 | | | | 25 | |
| | | | | | | | | | | | | | | | | | | | | | | | | | | | |
Policyholder benefits and claims | | | 414 | | | | 207 | | | | 485 | | | | 207 | | | | 100 | | | | (278) | | | | (57) | |
| | | | | | | | | | | | | | | | | | | | | | | | | | | | |
Impairment of intangible assets | | | 1,886 | | | | – | | | | 29 | | | | 1,886 | | | | N/M | | | | (29) | | | | N/M | |
| | | | | | | | | | | | | | | | | | | | | | | | | | | | |
Restructuring activities | | | 394 | | | | – | | | | – | | | | 394 | | | | N/M | | | | – | | | | N/M | |
| | | | | | | | | | | | | | | | | | | | | | | | | | | | |
Total noninterest expenses | | | 31,236 | | | | 25,999 | | | | 23,318 | | | | 5,237 | | | | 20 | | | | 2,681 | | | | 11 | |
| |
| N/M – Not meaningful | | | | | | | | | | | | | | | | | | | | | | | | | | | | |
1 includes: | | | | | | | | | | | | | | | | | | | | | | | | | | | | |
| | 2012 | | | 2011 | | | 2010 | | | in€ m. | | | in % | | | in€ m. | | | in % | |
IT costs | | | 2,547 | | | | 2,194 | | | | 2,274 | | | | 353 | | | | 16 | | | | (80) | | | | (4) | |
| | | | | | | | | | | | | | | | | | | | | | | | | | | | |
Occupancy, furniture and equipment expenses | | | 2,115 | | | | 2,072 | | | | 1,679 | | | | 43 | | | | 2 | | | | 393 | | | | 23 | |
| | | | | | | | | | | | | | | | | | | | | | | | | | | | |
Professional service fees | | | 1,870 | | | | 1,632 | | | | 1,616 | | | | 238 | | | | 15 | | | | 16 | | | | 1 | |
| | | | | | | | | | | | | | | | | | | | | | | | | | | | |
Communication and data services | | | 907 | | | | 849 | | | | 785 | | | | 58 | | | | 7 | | | | 64 | | | | 8 | |
| | | | | | | | | | | | | | | | | | | | | | | | | | | | |
Travel and representation expenses | | | 518 | | | | 539 | | | | 554 | | | | (21) | | | | (4) | | | | (15) | | | | (3) | |
| | | | | | | | | | | | | | | | | | | | | | | | | | | | |
Payment, clearing and custodian services | | | 609 | | | | 504 | | | | 418 | | | | 105 | | | | 21 | | | | 86 | | | | 21 | |
| | | | | | | | | | | | | | | | | | | | | | | | | | | | |
Marketing expenses | | | 376 | | | | 410 | | | | 335 | | | | (34) | | | | (8) | | | | 75 | | | | 22 | |
| | | | | | | | | | | | | | | | | | | | | | | | | | | | |
Consolidated investments | | | 760 | | | | 652 | | | | 390 | | | | 108 | | | | 17 | | | | 262 | | | | 67 | |
| | | | | | | | | | | | | | | | | | | | | | | | | | | | |
Other expenses | | | 5,314 | | | | 3,805 | | | | 2,082 | | | | 1,509 | | | | 39 | | | | 1,723 | | | | 83 | |
| | | | | | | | | | | | | | | | | | | | | | | | | | | | |
Total general and administrative expenses | | | 15,016 | | | | 12,657 | | | | 10,133 | | | | 2,359 | | | | 19 | | | | 2,524 | | | | 25 | |
| |
N/M – Not meaningful
Compensation and benefits. In the full year 2012, compensation and benefits were up by€ 391 million, or 3 %, compared to 2011. Half of the increase in 2012 was attributable to variable compensation mainly due to a decrease in the deferral rate from 61 % to 47 % which led to an increase of the cash bonus component. This was partly offset by retention related costs based on a reduced deferred compensation charge for employees eligible for career retirement. The other significant driver of the increase was the negative impact of FX translation.
General and administrative expenses. General and administration expenses increased by€ 2.4 billion, or 19 %, from€ 12.7 billion in 2011 to€ 15.0 billion in 2012. The main driver for the increase were new litigation provisions as well as items related to the turnaround measures in the Bank’s commercial banking activities in the Netherlands; both shown in other expenses. Further increases resulted from higher IT costs, including the write-down of the technology platform NPP, higher depreciation on IT, and the new Magellan platform in PBC. Professional service fees increased due to higher legal costs relating to litigations and costs related to the strategic review in AWM. Higher costs in consolidated investments were driven by The Cosmopolitan of Las Vegas and Maher Terminals.
Policyholder benefits and claims. Policyholder benefits and claims in 2012 were€ 414 million, an increase of€ 207 million compared to the prior year. These are solely driven by insurance-related charges from the Abbey Life business. These costs are offset by net gains on financial assets/liabilities at fair value through profit or loss on policyholder benefits and claims.
Impairment of intangible assets. In 2012, impairment charges on goodwill and other intangible assets were€ 1.9 billion. They included impairments of€ 1.2 billion for CB&S prior to re-segmentation. Post segmentation reviews resulted in further€ 421 million of goodwill impairments in the newly established NCOU. Impairments of other intangible assets included€ 202 million in AWM and€ 73 million in GTB relating to commercial banking activities in the Netherlands.
| | | | |
| Deutsche Bank | | 01 – Management Report | | 20 |
| Financial Report 2012 | | Operating and Financial Review | | |
| | |
| | | | |
| | |
| | | | |
Restructuring.Restructuring activities were€ 394 million in 2012. Restructuring activities in 2012 led to lower Salary and Benefit costs in the fourth quarter 2012.
Income Tax Expense
In 2012, the income tax expense was€ 493 million, which led to an effective tax rate of 63 % compared to an income tax expense of€ 1.1 billion and an effective tax rate of 20 % in 2011. The current year’s effective tax rate was mainly impacted by expenses that are not deductible for tax purposes which include impairments of goodwill. The prior year’s effective tax rate primarily benefited from changes in the recognition and measurement of deferred taxes, a favorable geographic mix of income and the partial tax exemption of net gains related to our stake in Hua Xia Bank.
Segment Results of Operations
The following is a discussion of the results of our business segments. See Note 05 “Business Segments and Related Information” to the consolidated financial statements for information regarding
| — | | our organizational structure; |
| — | | effects of significant acquisitions and divestitures on segmental results; |
| — | | changes in the format of our segment disclosure; |
| — | | the framework of our management reporting systems; |
| — | | consolidating and other adjustments to the total results of operations of our business segments, and |
| — | | definitions of non-GAAP financial measures that are used with respect to each segment. |
The criterion for segmentation into divisions is our organizational structure as it existed at December 31, 2012. Segment results were prepared in accordance with our management reporting systems.
| | | | | | | | | | | | | | | | | | | | | | | | | | | | | | | | |
2012 in€ m. (unless stated otherwise) | | Corporate
Banking &
Securities | | | Global
Transaction
Banking | | | Asset &
Wealth
Management | | | Private &
Business
Clients | | | Non-Core
Operations
Unit | | | Total
Management
Reporting | | | Consoli-
dation &
Adjustments | | | Total
Consolidated | |
Net revenues | | | 15,648 | | | | 4,006 | | | | 4,466 | 1 | | | 9,541 | | | | 1,058 | | | | 34,719 | | | | (978) | | | | 33,741 | |
| | | | | | | | | | | | | | | | | | | | | | | | | | | | | | | | |
| Provision for credit losses | | | 121 | | | | 168 | | | | 18 | | | | 781 | | | | 634 | | | | 1,721 | | | | 0 | | | | 1,721 | |
| | | | | | | | | | | | | | | | | | | | | | | | | | | | | | | | |
| Total noninterest expenses | | | 12,637 | | | | 3,169 | | | | 4,288 | | | | 7,221 | | | | 3,305 | | | | 30,619 | | | | 617 | | | | 31,236 | |
therein: | | | | | | | | | | | | | | | | | | | | | | | | | | | | | | | | |
Policyholder benefits and claims | | | – | | | | – | | | | 414 | | | | – | | | | – | | | | 414 | | | | – | | | | 414 | |
Restructuring activities | | | 246 | | | | 40 | | | | 104 | | | | – | | | | 3 | | | | 394 | | | | – | | | | 394 | |
Impairment of intangible assets | | | 1,174 | | | | 73 | | | | 202 | | | | 15 | | | | 421 | | | | 1,886 | | | | – | | | | 1,886 | |
| | | | | | | | | | | | | | | | | | | | | | | | | | | | | | | | |
Noncontrolling interests | | | 17 | | | | – | | | | 0 | | | | 16 | | | | 33 | | | | 66 | | | | (66) | | | | – | |
| | | | | | | | | | | | | | | | | | | | | | | | | | | | | | | | |
| Income (loss) before income taxes | | | 2,874 | | | | 669 | | | | 160 | | | | 1,524 | | | | (2,914) | | | | 2,313 | | | | (1,529) | | | | 784 | |
| | | | | | | | | | | | | | | | | | | | | | | | | | | | | | | | |
Cost/income ratio | | | 81% | | | | 79% | | | | 96% | | | | 76% | | | | N/M | | | | 88% | | | | N/M | | | | 93% | |
| | | | | | | | | | | | | | | | | | | | | | | | | | | | | | | | |
Assets2 | | | 1,475,090 | | | | 77,378 | | | | 68,408 | | | | 282,603 | | | | 97,265 | | | | 2,000,744 | | | | 11,585 | | | | 2,012,329 | |
| | | | | | | | | | | | | | | | | | | | | | | | | | | | | | | | |
Risk-weighted assets | | | 124,939 | | | | 27,093 | | | | 12,451 | | | | 72,695 | | | | 80,295 | | | | 317,472 | | | | 16,133 | | | | 333,605 | |
| | | | | | | | | | | | | | | | | | | | | | | | | | | | | | | | |
Average active equity | | | 18,236 | | | | 3,012 | | | | 5,888 | | | | 11,865 | | | | 10,189 | | | | 49,191 | | | | 5,929 | | | | 55,120 | |
| | | | | | | | | | | | | | | | | | | | | | | | | | | | | | | | |
| Pre-tax return on average active equity | | | 16% | | | | 22% | | | | 3% | | | | 13% | | | | (29)% | | | | 5% | | | | (26)% | | | | 1% | |
| |
N/M – Not meaningful
| 1 | Includes revenues in Abbey Life related to Policyholder benefits and claims of€ 420 million offset in expenses. |
| 2 | Starting 2012, segment assets represent consolidated view, i.e. the amounts do not include intersegment balances. Prior periods were adjusted accordingly. |
| | | | |
| Deutsche Bank | | 01 – Management Report | | 21 |
| Financial Report 2012 | | Operating and Financial Review | | |
| | |
| | | | |
| | |
| | | | |
| | | | | | | | | | | | | | | | | | | | | | | | | | | | | | | | |
2011 in€ m. (unless stated otherwise) | | Corporate
Banking &
Securities | | | Global
Transaction
Banking | | | Asset &
Wealth
Management | | | Private &
Business
Clients | | | Non-Core
Operations
Unit | | | Total
Management
Reporting | | | Consoli-
dation &
Adjustments | | | Total
Consolidated | |
Net revenues | | | 14,109 | | | | 3,608 | | | | 4,277 | 1 | | | 10,393 | | | | 879 | | | | 33,266 | | | | (38) | | | | 33,228 | |
| | | | | | | | | | | | | | | | | | | | | | | | | | | | | | | | |
| Provision for credit losses | | | 90 | | | | 158 | | | | 22 | | | | 1,185 | | | | 385 | | | | 1,840 | | | | (1) | | | | 1,839 | |
| | | | | | | | | | | | | | | | | | | | | | | | | | | | | | | | |
| Total noninterest expenses | | | 10,341 | | | | 2,411 | | | | 3,313 | | | | 7,128 | | | | 2,554 | | | | 25,746 | | | | 253 | | | | 25,999 | |
therein: | | | | | | | | | | | | | | | | | | | | | | | | | | | | | | | | |
Policyholder benefits and claims | | | – | | | | – | | | | 207 | | | | – | | | | – | | | | 207 | | | | – | | | | 207 | |
Restructuring activities | | | – | | | | – | | | | – | | | | – | | | | – | | | | – | | | | – | | | | – | |
Impairment of intangible assets | | | – | | | | – | | | | – | | | | – | | | | – | | | | – | | | | – | | | | – | |
| | | | | | | | | | | | | | | | | | | | | | | | | | | | | | | | |
| Noncontrolling interests | | | 21 | | | | – | | | | 0 | | | | 178 | | | | 14 | | | | 213 | | | | (213) | | | | – | |
| | | | | | | | | | | | | | | | | | | | | | | | | | | | | | | | |
| Income (loss) before income taxes | | | 3,657 | | | | 1,039 | | | | 942 | | | | 1,902 | 2 | | | (2,074) | | | | 5,466 | | | | (77) | | | | 5,390 | |
| | | | | | | | | | | | | | | | | | | | | | | | | | | | | | | | |
Cost/income ratio | | | 73% | | | | 67% | | | | 77% | | | | 69% | | | | N/M | | | | 77% | | | | N/M | | | | 78% | |
| | | | | | | | | | | | | | | | | | | | | | | | | | | | | | | | |
Assets3 | | | 1,591,863 | | | | 85,751 | | | | 68,848 | | | | 270,086 | | | | 134,712 | | | | 2,151,260 | | | | 12,843 | | | | 2,164,103 | |
| | | | | | | | | | | | | | | | | | | | | | | | | | | | | | | | |
| Risk-weighted assets | | | 155,302 | | | | 26,986 | | | | 14,626 | | | | 78,637 | | | | 103,810 | | | | 379,362 | | | | 1,884 | | | | 381,246 | |
| | | | | | | | | | | | | | | | | | | | | | | | | | | | | | | | |
| Average active equity | | | 14,389 | | | | 3,068 | | | | 5,656 | | | | 12,081 | | | | 11,405 | | | | 46,599 | | | | 3,850 | | | | 50,449 | |
| | | | | | | | | | | | | | | | | | | | | | | | | | | | | | | | |
| Pre-tax return on average active equity | | | 25% | | | | 34% | | | | 17% | | | | 16% | | | | (18)% | | | | 12% | | | | (2)% | | | | 10% | |
| |
N/M – Not meaningful
| 1 | Includes revenues in Abbey Life related to Policyholder benefits and claims of€ 178 million offset in expenses. |
| 2 | Includes a net positive impact of€ 236 million related to the stake in Hua Xia Bank (PBC). |
| 3 | Starting 2012, segment assets represent consolidated view, i.e. the amounts do not include intersegment balances. Prior periods were adjusted accordingly. |
| | | | | | | | | | | | | | | | | | | | | | | | | | | | | | | | |
2010 in€ m. (unless stated otherwise) | | Corporate
Banking &
Securities | | | Global
Transaction
Banking | | | Asset &
Wealth
Management | | | Private &
Business
Clients | | | Non-Core
Operations
Unit | | | Total
Management
Reporting | | | Consoli-
dation &
Adjustments | | | Total
Consolidated | |
Net revenues | | | 16,282 | | | | 3,379 | 1 | | | 4,520 | 2 | | | 6,048 | | | | (1,285) | 3 | | | 28,944 | | | | (377) | | | | 28,567 | |
| | | | | | | | | | | | | | | | | | | | | | | | | | | | | | | | |
| Provision for credit losses | | | 19 | | | | 113 | | | | 14 | | | | 550 | | | | 577 | | | | 1,273 | | | | 0 | | | | 1,274 | |
| | | | | | | | | | | | | | | | | | | | | | | | | | | | | | | | |
| Total noninterest expenses | | | 10,920 | | | | 2,386 | | | | 3,905 | | | | 4,408 | | | | 1,690 | | | | 23,308 | | | | 10 | | | | 23,318 | |
therein: | | | | | | | | | | | | | | | | | | | | | | | | | | | | | | | | |
Policyholder benefits and claims | | | – | | | | – | | | | 486 | | | | – | | | | – | | | | 486 | | | | – | | | | 486 | |
Restructuring activities | | | – | | | | – | | | | – | | | | – | | | | – | | | | – | | | | – | | | | – | |
Impairment of intangible assets | | | – | | | | 29 | | | | – | | | | – | | | | – | | | | 29 | | | | – | | | | 29 | |
| | | | | | | | | | | | | | | | | | | | | | | | | | | | | | | | |
| Noncontrolling interests | | | 21 | | | | – | | | | (2) | | | | 8 | | | | (4) | | | | 24 | | | | (24) | | | | – | |
| | | | | | | | | | | | | | | | | | | | | | | | | | | | | | | | |
| Income (loss) before income taxes | | | 5,321 | | | | 880 | | | | 603 | | | | 1,082 | | | | (3,548) | | | | 4,339 | | | | (363) | | | | 3,975 | |
| | | | | | | | | | | | | | | | | | | | | | | | | | | | | | | | |
Cost/income ratio | | | 67% | | | | 71% | | | | 86% | | | | 73% | | | | N/M | | | | 81% | | | | N/M | | | | 82% | |
| | | | | | | | | | | | | | | | | | | | | | | | | | | | | | | | |
Assets4 | | | 1,314,556 | | | | 67,621 | | | | 66,334 | | | | 276,878 | | | | 168,397 | | | | 1,893,785 | | | | 11,844 | | | | 1,905,630 | |
| | | | | | | | | | | | | | | | | | | | | | | | | | | | | | | | |
Risk-weighted assets | | | 139,216 | | | | 26,996 | | | | 15,051 | | | | 87,031 | | | | 75,228 | | | | 343,522 | | | | 2,683 | | | | 346,204 | |
| | | | | | | | | | | | | | | | | | | | | | | | | | | | | | | | |
| Average active equity | | | 13,320 | | | | 2,416 | | | | 5,277 | | | | 3,174 | | | | 9,318 | | | | 33,505 | | | | 7,848 | | | | 41,353 | |
| | | | | | | | | | | | | | | | | | | | | | | | | | | | | | | | |
| Pre-tax return on average active equity | | | 40% | | | | 36% | | | | 11% | | | | 34% | | | | (38)% | | | | 13% | | | | (5)% | | | | 10% | |
| |
N/M – Not meaningful
| 1 | Includes a gain from the recognition of negative goodwill related to the acquisition of parts of ABN AMRO’s commercial banking activities in the Netherlands of€ 208 million as reported in the second quarter 2010. |
| 2 | Includes revenues in Abbey Life related to Policyholder benefits and claims of€ 511 million offset in expenses. |
| 3 | Includes a charge related to the investment in Deutsche Postbank AG of€ 2,338 million. |
| 4 | Starting 2012, segment assets represent consolidated view, i.e. the amounts do not include intersegment balances. Prior periods were adjusted accordingly. |
| | | | |
| Deutsche Bank | | 01 – Management Report | | 22 |
| Financial Report 2012 | | Operating and Financial Review | | |
| | |
| | | | |
| | |
| | | | |
Corporate Divisions
Corporate Banking & Securities Corporate Division
| | | | | | | | | | | | | | | | | | | | | | | | | | | | |
| in€ m. | | | | | | | | | | | 2012 increase (decrease)
from 2011 | | | 2011 increase (decrease)
from 2010 | |
(unless stated otherwise) | | | 2012 | | | | 2011 | | | | 2010 | | | | in€ m. | | | | in % | | | | in€ m. | | | | in % | |
| | | | | | | | | | | | | | | | | | | | | | | | | | | | |
Net revenues: | | | | | | | | | | | | | | | | | | | | | | | | | | | | |
| | | | | | | | | | | | | | | | | | | | | | | | | | | | |
| Sales & Trading (debt and other products) | | | 9,181 | | | | 8,520 | | | | 9,844 | | | | 661 | | | | 8 | | | | (1,324) | | | | (13) | |
| | | | | | | | | | | | | | | | | | | | | | | | | | | | |
Sales & Trading (equity) | | | 2,288 | | | | 2,235 | | | | 2,875 | | | | 53 | | | | 2 | | | | (640) | | | | (22) | |
| | | | | | | | | | | | | | | | | | | | | | | | | | | | |
Origination (debt) | | | 1,417 | | | | 1,056 | | | | 1,200 | | | | 361 | | | | 34 | | | | (144) | | | | (12) | |
| | | | | | | | | | | | | | | | | | | | | | | | | | | | |
Origination (equity) | | | 518 | | | | 559 | | | | 706 | | | | (41) | | | | (7) | | | | (147) | | | | (21) | |
| | | | | | | | | | | | | | | | | | | | | | | | | | | | |
Advisory | | | 590 | | | | 621 | | | | 573 | | | | (31) | | | | (5) | | | | 48 | | | | 8 | |
| | | | | | | | | | | | | | | | | | | | | | | | | | | | |
Loan products | | | 1,107 | | | | 1,158 | | | | 1,146 | | | | (51) | | | | (4) | | | | 12 | | | | 1 | |
| | | | | | | | | | | | | | | | | | | | | | | | | | | | |
Other products | | | 547 | | | | (39) | | | | (62) | | | | 586 | | | | N/M | | | | 23 | | | | (37) | |
| | | | | | | | | | | | | | | | | | | | | | | | | | | | |
Total net revenues | | | 15,648 | | | | 14,109 | | | | 16,282 | | | | 1,539 | | | | 11 | | | | (2,173) | | | | (13) | |
| | | | | | | | | | | | | | | | | | | | | | | | | | | | |
Provision for credit losses | | | 121 | | | | 90 | | | | 19 | | | | 31 | | | | 34 | | | | 71 | | | | N/M | |
| | | | | | | | | | | | | | | | | | | | | | | | | | | | |
Total noninterest expenses | | | 12,637 | | | | 10,341 | | | | 10,920 | | | | 2,296 | | | | 22 | | | | (579) | | | | (5) | |
therein: | | | | | | | | | | | | | | | | | | | | | | | | | | | | |
Restructuring activities | | | 246 | | | | – | | | | – | | | | 246 | | | | N/M | | | | – | | | | N/M | |
Impairment of intangible assets | | | 1,174 | | | | – | | | | – | | | | 1,174 | | | | N/M | | | | – | | | | N/M | |
| | | | | | | | | | | | | | | | | | | | | | | | | | | | |
Noncontrolling interests | | | 17 | | | | 21 | | | | 21 | | | | (4) | | | | (19) | | | | – | | | | – | |
| | | | | | | | | | | | | | | | | | | | | | | | | | | | |
| Income (loss) before income taxes | | | 2,874 | | | | 3,657 | | | | 5,321 | | | | (783) | | | | (21) | | | | (1,664) | | | | (31) | |
| | | | | | | | | | | | | | | | | | | | | | | | | | | | |
Cost/income ratio | | | 81% | | | | 73% | | | | 67% | | | | – | | | | 8 ppt | | | | – | | | | 6 ppt | |
| | | | | | | | | | | | | | | | | | | | | | | | | | | | |
Assets1 | | | 1,475,090 | | | | 1,591,863 | | | | 1,314,556 | | | | (116,773) | | | | (7) | | | | 277,307 | | | | 21 | |
| | | | | | | | | | | | | | | | | | | | | | | | | | | | |
Risk-weighted assets | | | 124,939 | | | | 155,302 | | | | 139,216 | | | | (30,363) | | | | (20) | | | | 16,086 | | | | 12 | |
| | | | | | | | | | | | | | | | | | | | | | | | | | | | |
Average active equity2 | | | 18,236 | | | | 14,389 | | | | 13,320 | | | | 3,847 | | | | 27 | | | | 1,069 | | | | 8 | |
| | | | | | | | | | | | | | | | | | | | | | | | | | | | |
| Pre-tax return on average active equity | | | 16% | | | | 25% | | | | 40% | | | | – | | | | (9) ppt | | | | – | | | | (15) ppt | |
| |
N/M – Not meaningful
| 1 | Segment assets represent consolidated view, i.e. the amounts do not include intersegment balances. |
| 2 | See Note 05 “Business Segments and Related Information” to the consolidated financial statements for a description of how average active equity is allocated to the divisions. |
For the full year 2012, Sales & Trading (debt and other products) net revenues were€ 9.2 billion, an increase of€ 661 million, or 8 %, despite a negative impact of€ 186 million relating to Credit Valuation Adjustments (CVAs) in the fourth quarter 2012 due to a refinement in the calculation methodology and RWA mitigation. Revenues in Rates and Credit Flow Trading were significantly higher than the prior year, driven by significantly higher Flow Credit revenues reflecting improved credit market conditions, and by higher Rates revenues reflecting strong client activity, particularly in Europe. Revenues in Structured Finance were higher than the prior year, reflecting a strong client demand, particularly for CMBS products. In contrast, despite increased volumes, Foreign Exchange revenues were lower than the prior year as a result of margin compression. Revenues in Money Markets were lower than the prior year due to lower volatility. In Commodities and RMBS, revenues were lower compared to 2011. Revenues in Emerging Markets were in line with the prior year.
Sales & Trading (equity) generated revenues of€ 2.3 billion in 2012, a slight increase compared to the prior year. Equity Derivatives revenues were significantly higher than the prior year which was negatively impacted by volatile market conditions. Equity Trading revenues were in line with the prior year with market share gains offsetting more difficult market conditions. In Prime Finance, revenues were lower than the prior year driven by lower margins.
Origination and Advisory revenues increased to€ 2.5 billion, up€ 289 million compared to the full year 2011. Deutsche Bank was ranked number five globally, by share of Corporate Finance fees, and number one in Europe. In Advisory revenues were down in comparison to the prior year. Deutsche Bank was ranked number six globally and number two in Europe. Debt Origination revenues increased due to corporate debt issuance, while Equity Origination revenues decreased, reflecting an industry wide decline in IPO activity in the first half of 2012. Deutsche Bank was ranked number five globally for Equity Origination, and number two in Europe. (All ranks from Dealogic unless otherwise stated).
For the full year 2012, net revenues from Other products were€ 547 million, compared to negative€ 39 million in 2011. The increase was driven by€ 516 million relating to the impact of a refinement in the calculation methodology of the Debt Valuation Adjustment (DVA) on certain derivative liabilities.
| | | | |
| Deutsche Bank | | 01 – Management Report | | 23 |
| Financial Report 2012 | | Operating and Financial Review | | |
| | |
| | | | |
| | |
| | | | |
Noninterest expenses were€ 12.6 billion, a substantial increase of€ 2.3 billion compared to€ 10.3 billion for the full year 2011. Approximately half of the increase related to the impairment of intangible assets. The increase also included€ 315 million cost-to-achieve related to OpEx. Additionally, noninterest expenses were impacted by adverse foreign exchange rate movements and higher litigation related charges. These increases were partially offset by the absence of a specific charge of€ 310 million for a German VAT claim in the prior year, and lower non-performance related compensation costs reflecting the implementation of OpEx.
Global Transaction Banking Corporate Division
| | | | | | | | | | | | | | | | | | | | | | | | | | | | |
| in€ m. | | | | | | | | | | | 2012 increase (decrease)
from 2011 | | | 2011 increase (decrease)
from 2010 | |
| (unless stated otherwise) | | | 2012 | | | | 2011 | | | | 2010 | | | | in € m. | | | | in % | | | | in€ m. | | | | in % | |
| | | | | | | | | | | | | | | | | | | | | | | | | | | | |
| Net revenues: | | | | | | | | | | | | | | | | | | | | | | | | | | | | |
| | | | | | | | | | | | | | | | | | | | | | | | | | | | |
| Transaction services | | | 4,006 | | | | 3,608 | | | | 3,163 | | | | 398 | | | | 11 | | | | 445 | | | | 14 | |
| | | | | | | | | | | | | | | | | | | | | | | | | | | | |
| Other products | | | – | | | | – | | | | 216 | | | | – | | | | N/M | | | | (216) | | | | N/M | |
| | | | | | | | | | | | | | | | | | | | | | | | | | | | |
| Total net revenues | | | 4,006 | | | | 3,608 | | | | 3,379 | | | | 398 | | | | 11 | | | | 229 | | | | 7 | |
| | | | | | | | | | | | | | | | | | | | | | | | | | | | |
| Provision for credit losses | | | 168 | | | | 158 | | | | 113 | | | | 10 | | | | 7 | | | | 45 | | | | 40 | |
| | | | | | | | | | | | | | | | | | | | | | | | | | | | |
| Total noninterest expenses | | | 3,169 | | | | 2,411 | | | | 2,386 | | | | 758 | | | | 31 | | | | 25 | | | | 1 | |
therein: | | | | | | | | | | | | | | | | | | | | | | | | | | | | |
Restructuring activities | | | 40 | | | | – | | | | – | | | | 40 | | | | N/M | | | | – | | | | N/M | |
Impairment of intangible assets | | | 73 | | | | – | | | | 29 | | | | 73 | | | | N/M | | | | (29) | | | | N/M | |
| | | | | | | | | | | | | | | | | | | | | | | | | | | | |
| Noncontrolling interests | | | – | | | | – | | | | – | | | | – | | | | N/M | | | | – | | | | N/M | |
| | | | | | | | | | | | | | | | | | | | | | | | | | | | |
| Income (loss) before income taxes | | | 669 | | | | 1,039 | | | | 880 | | | | (370) | | | | (36) | | | | 159 | | | | 18 | |
| | | | | | | | | | | | | | | | | | | | | | | | | | | | |
| Cost/income ratio | | | 79% | | | | 67% | | | | 71% | | | | – | | | | 12 ppt | | | | – | | | | (4) ppt | |
| | | | | | | | | | | | | | | | | | | | | | | | | | | | |
| Assets1 | | | 77,378 | | | | 85,751 | | | | 67,621 | | | | (8,373) | | | | (10) | | | | 18,130 | | | | 27 | |
| | | | | | | | | | | | | | | | | | | | | | | | | | | | |
| Risk-weighted assets | | | 27,093 | | | | 26,986 | | | | 26,996 | | | | 107 | | | | 0 | | | | (10) | | | | (0) | |
| | | | | | | | | | | | | | | | | | | | | | | | | | | | |
| Average active equity2 | | | 3,012 | | | | 3,068 | | | | 2,416 | | | | (56) | | | | (2) | | | | 652 | | | | 27 | |
| | | | | | | | | | | | | | | | | | | | | | | | | | | | |
| Pre-tax return on average active equity | | | 22% | | | | 34% | | | | 36% | | | | – | | | | (12) ppt | | | | – | | | | (3) ppt | |
| |
N/M – Not meaningful
| 1 | Segment assets represent consolidated view, i.e. the amounts do not include intersegment balances. |
| 2 | See Note 05 “Business Segments and Related Information” to the consolidated financial statements for a description of how average active equity is allocated to the divisions. |
GTB’s results in 2012 included a net charge of€ 534 million in the fourth quarter 2012, which limits the comparability of the financial performance to prior periods. This net charge included a litigation-related charge and measures related to the turn-around of the acquired commercial banking activities in the Netherlands, which comprised the settlement of the credit protection received from the seller, an impairment of an intangible asset as well as restructuring charges.
Net revenues increased significantly by€ 398 million, or 11 %, compared to 2011. The reporting period included a settlement payment related to the aforementioned turn-around in the Netherlands. The increase in the underlying business was driven by a strong performance across products and regions benefiting from strong volumes while interest rate levels continued to be low. Trade Finance profited from high demand for international trade and financing products. Trust & Securities Services further grew on the back of higher fee income especially in the Corporate Trust business in the U.S.. Cash Management continued to benefit from a sustained “flight-to-quality” trend, resulting in strong transaction volumes and higher deposit balances, as well as from liquidity management.
Provision for credit losses increased by€ 10 million, or 7 %, versus 2011, which was driven by the commercial banking activities acquired in the Netherlands. This was partly offset by lower provisions in the Trade Finance business.
Noninterest expenses were up€ 758 million, or 31 %, compared to 2011, mainly driven by the aforementioned turn-around measures as well as the litigation-related charge. Excluding these charges, noninterest expenses were above the prior-year level reflecting higher expenses related to compensation and to higher business activity. This was partly offset by the non-recurrence of higher amortization of an upfront premium paid for credit protection received in the prior year.
| | | | |
| Deutsche Bank | | 01 – Management Report | | 24 |
| Financial Report 2012 | | Operating and Financial Review | | |
| | |
| | | | |
| | |
| | | | |
Income before income taxes decreased by€ 370 million, or 36 %, compared to 2011. The decrease resulted from the aforementioned turn-around measures as well as the litigation-related charge. Excluding this net charge, income before income taxes for the reporting period would have been well above the prior year.
Asset & Wealth Management Corporate Division
| | | | | | | | | | | | | | | | | | | | | | | | | | | | |
| in€ m. | | | | | | | | | | | 2012 increase (decrease)
from 2011 | | | 2011 increase (decrease)
from 2010 | |
(unless stated otherwise) | | | 2012 | | | | 2011 | | | | 2010 | | | | in€ m. | | | | in % | | | | in € m. | | | | in % | |
| | | | | | | | | | | | | | | | | | | | | | | | | | | | |
| Net revenues: | | | | | | | | | | | | | | | | | | | | | | | | | | | | |
| | | | | | | | | | | | | | | | | | | | | | | | | | | | |
| Discretionary portfolio/fund management | | | 2,108 | | | | 2,104 | | | | 2,178 | | | | 4 | | | | 0 | | | | (74) | | | | (3) | |
| | | | | | | | | | | | | | | | | | | | | | | | | | | | |
| Advisory/brokerage | | | 807 | | | | 789 | | | | 830 | | | | 18 | | | | 2 | | | | (41) | | | | (5) | |
| | | | | | | | | | | | | | | | | | | | | | | | | | | | |
| Credit products | | | 411 | | | | 393 | | | | 378 | | | | 18 | | | | 5 | | | | 15 | | | | 4 | |
| | | | | | | | | | | | | | | | | | | | | | | | | | | | |
| Deposits and payment services | | | 236 | | | | 158 | | | | 142 | | | | 78 | | | | 49 | | | | 16 | | | | 11 | |
| | | | | | | | | | | | | | | | | | | | | | | | | | | | |
| Other products | | | 904 | | | | 833 | | | | 993 | | | | 71 | | | | 9 | | | | (160) | | | | (16) | |
| | | | | | | | | | | | | | | | | | | | | | | | | | | | |
| Total net revenues | | | 4,466 | | | | 4,277 | | | | 4,520 | | | | 189 | | | | 4 | | | | (243) | | | | (5) | |
| | | | | | | | | | | | | | | | | | | | | | | | | | | | |
| Provision for credit losses | | | 18 | | | | 22 | | | | 14 | | | | (4) | | | | (20) | | | | 8 | | | | 57 | |
| | | | | | | | | | | | | | | | | | | | | | | | | | | | |
Total noninterest expenses | | | 4,288 | | | | 3,313 | | | | 3,905 | | | | 975 | | | | 29 | | | | (592) | | | | (15) | |
therein: | | | | | | | | | | | | | | | | | | | | | | | | | | | | |
Policyholder benefits and claims | | | 414 | | | | 207 | | | | 486 | | | | 207 | | | | 100 | | | | (279) | | | | (57) | |
Restructuring activities | | | 104 | | | | – | | | | – | | | | 104 | | | | N/M | | | | – | | | | N/M | |
Impairment of intangible assets | | | 202 | | | | – | | | | – | | | | 202 | | | | N/M | | | | – | | | | N/M | |
| | | | | | | | | | | | | | | | | | | | | | | | | | | | |
| Noncontrolling interests | | | 0 | | | | 0 | | | | (2) | | | | – | | | | N/M | | | | 2 | | | | N/M | |
| | | | | | | | | | | | | | | | | | | | | | | | | | | | |
| Income (loss) before income taxes | | | 160 | | | | 942 | | | | 603 | | | | (782) | | | | (83) | | | | 339 | | | | 56 | |
| | | | | | | | | | | | | | | | | | | | | | | | | | | | |
| Cost/income ratio | | | 96% | | | | 77% | | | | 86% | | | | – | | | | 19 ppt | | | | – | | | | (9) ppt | |
| | | | | | | | | | | | | | | | | | | | | | | | | | | | |
| Assets1 | | | 68,408 | | | | 68,848 | | | | 66,334 | | | | (440) | | | | (1) | | | | 2,514 | | | | 4 | |
| | | | | | | | | | | | | | | | | | | | | | | | | | | | |
| Risk-weighted assets | | | 12,451 | | | | 14,626 | | | | 15,051 | | | | (2,175) | | | | (15) | | | | (425) | | | | (3) | |
| | | | | | | | | | | | | | | | | | | | | | | | | | | | |
| Average active equity2 | | | 5,888 | | | | 5,656 | | | | 5,277 | | | | 232 | | | | 4 | | | | 379 | | | | 7 | |
| | | | | | | | | | | | | | | | | | | | | | | | | | | | |
| Pre-tax return on average active equity | | | 3% | | | | 17% | | | | 11% | | | | – | | | | (14) ppt | | | | – | | | | 5 ppt | |
| | | | | | | | | | | | | | | | | | | | | | | | | | | | |
| Invested assets (in€ bn.)3 | | | 944 | | | | 912 | | | | 936 | | | | 32 | | | | 3 | | | | (24) | | | | (3) | |
| | | | | | | | | | | | | | | | | | | | | | | | | | | | |
| Net new money (in€ bn.) | | | (22) | | | | (7) | | | | (2) | | | | (15) | | | | N/M | | | | (5) | | | | N/M | |
| |
N/M – Not meaningful
| 1 | Segment assets represent consolidated view, i.e. the amounts do not include intersegment balances. |
| 2 | See Note 05 “Business Segments and Related Information” to the consolidated financial statements for a description of how average active equity is allocated to the divisions. |
| 3 | We define invested assets as (a) assets we hold on behalf of customers for investment purposes and/or (b) client assets that are managed by us. We manage invested assets on a discretionary or advisory basis, or these assets are deposited with us. |
Net revenues increased slightly by€ 189 million, or 4 %, compared to€ 4.3 billion in 2011, reflecting a€ 207 million increase in revenues from Other products from mark-to-market movements on investments held to back insurance policyholder claims in Abbey Life, offset in noninterest expenses. This effect was partly offset by€ 46 million in RREEF driven by gains on sales in 2011,€ 51 million due to reduced demand for hedge fund products and€ 37 million due to lower management fees. Revenues from deposits and payment services increased substantially, reflecting various product initiatives targeting stable funding. Advisory/brokerage revenues and revenues from credit products both improved in the Wealth Management businesses due to continued business growth and increased assets under management.
Noninterest expenses were up€ 975 million, or 29 %, compared to 2011 mainly due to the aforementioned effect related to Abbey Life,€ 202 million of impairments related to Scudder,€ 90 million of IT-related impairments,€ 104 million in costs-to-achieve related to OpEx, costs incurred from the strategic review and litigation-related charges.
Invested assets in AWM were€ 944 billion as of December 31¸2012, an increase of€32 billion versus December 31, 2011, mainly driven by market appreciation of€ 55 billion and transfers of€ 7 billion from Postbank, partly offset by outflows of€ 22 billion and foreign currency movements of€ 7 billion. The private bank attracted inflows of€ 15 billion for the year offset by outflows in asset management, particularly from the institutional business which was impacted by the strategic review.
| | | | |
| Deutsche Bank | | 01 – Management Report | | 25 |
| Financial Report 2012 | | Operating and Financial Review | | |
| | |
| | | | |
| | |
| | | | |
Private & Business Clients Corporate Division
| | | | | | | | | | | | | | | | | | | | | | | | | | | | |
| in€ m. | | | | | | | | | | | 2012 increase (decrease)
from 2011 | | | 2011 increase (decrease)
from 2010 | |
(unless stated otherwise) | | 2012 | | | 2011 | | | 2010 | | | in€ m. | | | in % | | | in€ m. | | | in % | |
Net revenues: | | | | | | | | | | | | | | | | | | | | | | | | | | | | |
| | | | | | | | | | | | | | | | | | | | | | | | | | | | |
| Discretionary portfolio/fund management | | | 213 | | | | 251 | | | | 313 | | | | (38) | | | | (15) | | | | (62) | | | | (20) | |
| | | | | | | | | | | | | | | | | | | | | | | | | | | | |
Advisory/brokerage | | | 860 | | | | 914 | | | | 887 | | | | (54) | | | | (6) | | | | 27 | | | | 3 | |
| | | | | | | | | | | | | | | | | | | | | | | | | | | | |
Credit products | | | 2,149 | | | | 2,099 | | | | 2,117 | | | | 50 | | | | 2 | | | | (18) | | | | (1) | |
| | | | | | | | | | | | | | | | | | | | | | | | | | | | |
Deposits and payment services | | | 2,064 | | | | 2,085 | | | | 1,962 | | | | (21) | | | | (1) | | | | 123 | | | | 6 | |
| | | | | | | | | | | | �� | | | | | | | | | | | | | | | | |
Other products | | | 4,255 | | | | 5,044 | | | | 769 | | | | (789) | | | | (16) | | | | 4,275 | | | | N/M | |
| | | | | | | | | | | | | | | | | | | | | | | | | | | | |
Total net revenues | | | 9,541 | | | | 10,393 | | | | 6,048 | | | | (852) | | | | (8) | | | | 4,345 | | | | 72 | |
| | | | | | | | | | | | | | | | | | | | | | | | | | | | |
Provision for credit losses | | | 781 | | | | 1,185 | | | | 550 | | | | (404) | | | | (34) | | | | 635 | | | | 115 | |
| | | | | | | | | | | | | | | | | | | | | | | | | | | | |
Total noninterest expenses | | | 7,221 | | | | 7,128 | | | | 4,408 | | | | 93 | | | | 1 | | | | 2,720 | | | | 62 | |
therein: | | | | | | | | | | | | | | | | | | | | | | | | | | | | |
Impairment of intangible assets | | | 15 | | | | – | | | | – | | | | 15 | | | | N/M | | | | – | | | | N/M | |
| | | | | | | | | | | | | | | | | | | | | | | | | | | | |
Noncontrolling interests | | | 16 | | | | 178 | | | | 8 | | | | (162) | | | | (91) | | | | 170 | | | | N/M | |
| | | | | | | | | | | | | | | | | | | | | | | | | | | | |
Income (loss) before income taxes | | | 1,524 | | | | 1,902 | | | | 1,082 | | | | (378) | | | | (20) | | | | 820 | | | | 76 | |
| | | | | | | | | | | | | | | | | | | | | | | | | | | | |
Cost/income ratio | | | 76% | | | | 69% | | | | 73% | | | | – | | | | 7 ppt | | | | – | | | | (4) ppt | |
| | | | | | | | | | | | | | | | | | | | | | | | | | | | |
Assets1 | | | 282,603 | | | | 270,086 | | | | 276,878 | | | | 12,517 | | | | 5 | | | | (6,792) | | | | (2) | |
| | | | | | | | | | | | | | | | | | | | | | | | | | | | |
Risk-weighted assets | | | 72,695 | | | | 78,637 | | | | 87,031 | | | | (5,942) | | | | (8) | | | | (8,394) | | | | (10) | |
| | | | | | | | | | | | | | | | | | | | | | | | | | | | |
Average active equity2 | | | 11,865 | | | | 12,081 | | | | 3,174 | | | | (216) | | | | (2) | | | | 8,907 | | | | N/M | |
| | | | | | | | | | | | | | | | | | | | | | | | | | | | |
| Pre-tax return on average active equity | | | 13% | | | | 16% | | | | 34% | | | | – | | | | (3) ppt | | | | – | | | | (18) ppt | |
| | | | | | | | | | | | | | | | | | | | | | | | | | | | |
Invested assets (in€ bn.)3 | | | 293 | | | | 296 | | | | 297 | | | | (3) | | | | (1) | | | | (1) | | | | (0) | |
| | | | | | | | | | | | | | | | | | | | | | | | | | | | |
Net new money (in€ bn.) | | | (10) | | | | 8 | | | | 2 | | | | (18) | | | | N/M | | | | 6 | | | | N/M | |
| | | | | | | | | | | | | | | | | | | | | | | | | | | | |
| | | | | | | | | | | | | | | | | | | | | | | | | | | | |
Breakdown of PBC by business | | | | | | | | | | | | | | | | | | | | | | | | | | | | |
| | | | | | | | | | | | | | | | | | | | | | | | | | | | |
Advisory Banking Germany: | | | | | | | | | | | | | | | | | | | | | | | | | | | | |
| | | | | | | | | | | | | | | | | | | | | | | | | | | | |
Net revenues | | | 3,847 | | | | 3,873 | | | | 4,062 | | | | (26) | | | | (1) | | | | (189) | | | | (5) | |
| | | | | | | | | | | | | | | | | | | | | | | | | | | | |
Provision for credit losses | | | 173 | | | | 268 | | | | 357 | | | | (95) | | | | (36) | | | | (89) | | | | (25) | |
| | | | | | | | | | | | | | | | | | | | | | | | | | | | |
Noninterest expenses | | | 3,204 | | | | 3,031 | | | | 3,038 | | | | 173 | | | | 6 | | | | (7) | | | | (0) | |
| | | | | | | | | | | | | | | | | | | | | | | | | | | | |
Income before income taxes | | | 470 | | | | 574 | | | | 666 | | | | (104) | | | | (18) | | | | (92) | | | | (14) | |
| | | | | | | | | | | | | | | | | | | | | | | | | | | | |
| | | | | | | | | | | | | | | | | | | | | | | | | | | | |
| | | | | | | | | | | | | | | | | | | | | | | | | | | | |
Advisory Banking International: | | | | | | | | | | | | | | | | | | | | | | | | | | | | |
| | | | | | | | | | | | | | | | | | | | | | | | | | | | |
Net revenues | | | 1,971 | | | | 1,996 | | | | 1,526 | | | | (25) | | | | (1) | | | | 470 | | | | 31 | |
| | | | | | | | | | | | | | | | | | | | | | | | | | | | |
Provision for credit losses | | | 211 | | | | 176 | | | | 177 | | | | 35 | | | | 20 | | | | (1) | | | | (1) | |
| | | | | | | | | | | | | | | | | | | | | | | | | | | | |
Noninterest expenses | | | 1,217 | | | | 1,195 | | | | 1,104 | | | | 22 | | | | 2 | | | | 91 | | | | 8 | |
| | | | | | | | | | | | | | | | | | | | | | | | | | | | |
Income before income taxes | | | 543 | | | | 626 | | | | 245 | | | | (83) | | | | (13) | | | | 381 | | | | 156 | |
| | | | | | | | | | | | | | | | | | | | | | | | | | | | |
| | | | | | | | | | | | | | | | | | | | | | | | | | | | |
| | | | | | | | | | | | | | | | | | | | | | | | | | | | |
Consumer Banking Germany: | | | | | | | | | | | | | | | | | | | | | | | | | | | | |
| | | | | | | | | | | | | | | | | | | | | | | | | | | | |
Net revenues | | | 3,723 | | | | 4,523 | | | | 460 | | | | (800) | | | | (18) | | | | 4,063 | | | | N/M | |
| | | | | | | | | | | | | | | | | | | | | | | | | | | | |
Provision for credit losses | | | 397 | | | | 742 | | | | 16 | | | | (345) | | | | (47) | | | | 726 | | | | N/M | |
| | | | | | | | | | | | | | | | | | | | | | | | | | | | |
Noninterest expenses | | | 2,800 | | | | 2,902 | | | | 266 | | | | (102) | | | | (4) | | | | 2,636 | | | | N/M | |
| | | | | | | | | | | | | | | | | | | | | | | | | | | | |
Noncontrolling interests | | | 15 | | | | 178 | | | | 7 | | | | (163) | | | | (91) | | | | 171 | | | | N/M | |
| | | | | | | | | | | | | | | | | | | | | | | | | | | | |
Income before income taxes | | | 511 | | | | 702 | | | | 171 | | | | (191) | | | | (27) | | | | 531 | | | | N/M | |
| |
N/M – Not meaningful
| 1 | Segment assets represent consolidated view, i.e. the amounts do not include intersegment balances. |
| 2 | See Note 05 “Business Segments and Related Information” to the consolidated financial statements for a description of how average active equity is allocated to the divisions. |
| 3 | We define invested assets as (a) assets we hold on behalf of customers for investment purposes and/or (b) client assets that are managed by us. We manage invested assets on a discretionary or advisory basis, or these assets are deposited with us. |
Net revenues decreased by€ 852 million, or 8 %, versus 2011, mainly driven by the non-recurrence of a positive one-time effect of€ 263 million related to our stake in Hua Xia Bank in 2011 and negative impact from purchase price allocation on Postbank in Consumer Banking Germany. The remaining revenue de- crease in other products was related to a low interest rate environment and lower revenues from invest- ment securities due to a targeted accelerated reduction of risk positions. Advisory/brokerage revenues decreased by€ 54 million, or 6 %, and revenues from discretionary portfolio management/fund management decreased by€ 38 million, or 15 %, mainly in Advisory Banking Germany, driven by muted client investment activity. Revenues from deposits and payment services decreased slightly by€ 21 million, or 1 %, driven by lower margins. Credit products increased by€ 50 million, or 2 %, mainly in Advisory Banking International, driven by both higher margins and volumes.
| | | | |
| Deutsche Bank | | 01 – Management Report | | 26 |
| Financial Report 2012 | | Operating and Financial Review | | |
| | |
| | | | |
| | |
| | | | |
Provision for credit losses was€ 781 million, down from€ 1,185 million for 2011, mainly driven by Consumer Banking Germany. This excludes releases from Postbank-related loan loss allowances recorded prior to consolidation. The impact of such releases is reported as interest income. Excluding Consumer Banking Germany, provision for credit losses further decreased, primarily attributable to lower provisions in Advisory Banking Germany reflecting an improved portfolio quality.
Noninterest expenses increased by€ 93 million, or 1 %, compared to 2011 driven by higher costs-to-achieve of€ 133 million, related to Postbank integration and to OpEx.
Invested assets were down mainly driven by€ 10 billion net outflows, mostly in deposits, partly offset by€ 7 billion market appreciation.
Non-Core Operations Unit Corporate Division
| | | | | | | | | | | | | | | | | | | | | | | | | | | | |
| in€ m. | | | | | | | | | | | 2012 increase (decrease)
from 2011 | | | 2011 increase (decrease)
from 2010 | |
(unless stated otherwise) | | 2012 | | | 2011 | | | 2010 | | | in€ m. | | | in % | | | in€ m. | | | in % | |
Net revenues | | | 1,058 | | | | 879 | | | | (1,285) | | | | 179 | | | | 20 | | | | 2,164 | | | | N/M | |
| | | | | | | | | | | | | | | | | | | | | | | | | | | | |
Provision for credit losses | | | 634 | | | | 385 | | | | 577 | | | | 249 | | | | 65 | | | | (192) | | | | (33) | |
| | | | | | | | | | | | | | | | | | | | | | | | | | | | |
Total noninterest expenses | | | 3,305 | | | | 2,554 | | | | 1,690 | | | | 751 | | | | 29 | | | | 864 | | | | 51 | |
therein | | | | | | | | | | | | | | | | | | | | | | | | | | | | |
Restructuring activities | | | 3 | | | | – | | | | – | | | | 3 | | | | N/M | | | | – | | | | N/M | |
Impairment of intangible assets | | | 421 | | | | – | | | | – | | | | 421 | | | | N/M | | | | – | | | | N/M | |
| | | | | | | | | | | | | | | | | | | | | | | | | | | | |
Noncontrolling interests | | | 33 | | | | 14 | | | | (4) | | | | 19 | | | | 136 | | | | 18 | | | | N/M | |
| | | | | | | | | | | | | | | | | | | | | | | | | | | | |
Income (loss) before income taxes | | | (2,914) | | | | (2,074) | | | | (3,548) | | | | (840) | | | | 40 | | | | 1,474 | | | | (42) | |
| | | | | | | | | | | | | | | | | | | | | | | | | | | | |
Assets1 | | | 97,265 | | | | 134,712 | | | | 168,397 | | | | (37,447) | | | | (28) | | | | (33,685) | | | | (20) | |
| | | | | | | | | | | | | | | | | | | | | | | | | | | | |
Risk-weighted assets | | | 80,295 | | | | 103,810 | | | | 75,228 | | | | (23,515) | | | | (23) | | | | 28,582 | | | | 38 | |
| | | | | | | | | | | | | | | | | | | | | | | | | | | | |
Average active equity2 | | | 10,189 | | | | 11,405 | | | | 9,318 | | | | (1,216) | | | | (11) | | | | 2,087 | | | | 22 | |
| |
N/M – Not meaningful
| 1 | Segment assets represent consolidated view, i.e. the amounts do not include intersegment balances. |
| 2 | See Note 05 “Business Segments and Related Information” to the consolidated financial statements for a description of how average active equity is allocated to the divisions. |
Net revenues increased by€ 179 million, or 20 %, compared to 2011. Net revenues in the NCOU are driven by the timing and nature of specific items. In 2012 such specific items included negative effects related to refinements of the CVA methodology of€ 203 million, mortgage repurchase costs of€ 233 million, losses from sales of capital intensive securitization positions and various impairments. Revenues in 2011 were impacted by impairment charges of€ 457 million related to Actavis Group as well as impairments on Greek Government bonds.
Provision for credit losses increased by€ 249 million, or 65 %, in comparison to 2011 mainly due to higher provisions in relation to IAS 39 reclassified assets.
Noninterest expenses increased by€ 751 million, or 29 %, compared to 2011. The increase was mainly driven by specific items such as litigation charges, settlement costs and impairments. While 2012 included€ 421 million impairment of intangible assets, 2011 was impacted by a€ 135 million property related impairment charge,€ 97 million related to BHF-BANK and additional settlement costs.
Consolidation & Adjustments
For a discussion of C&A to our business segment results see Note 05 “Business Segments and Related Information” to the consolidated financial statements.
| | | | |
| Deutsche Bank | | 01 – Management Report | | 27 |
| Financial Report 2012 | | Operating and Financial Review | | |
| | |
| | | | |
| | |
| | | | |
Operating Results (2011 vs. 2010)
Net Interest Income
Net interest income in 2011 was€ 17.4 billion, an increase of€ 1.9 billion, or 12 %, versus 2010. The improvement was primarily driven by the consolidation of Postbank. This also led to an increase in average interest-earning assets and average interest-bearing liabilities. Excluding Postbank, increased cost of funding due to higher spreads and lower net interest income on trading positions in CB&S would have led to lower net interest income, resulting in lower net interest margin.
Net Gains (Losses) on Financial Assets/Liabilities at Fair Value through Profit or Loss
The decrease of net gain on financial assets/liabilities at fair value through profit or loss of€ 296 million was mainly in Sales & Trading (debt and other products). This decrease was mainly driven by significantly lower revenues in Flow Credit, reflecting weakened credit markets and lower client volumes across the industry. The reduced losses in the NCOU were due to reduced losses from trading revenues. The decrease of net gains on financial assets/liabilities at fair value through profit or loss in Other product categories was mainly driven by absence of mark-to-market losses on new loans and loan commitments held at fair value from Loan products, which were recorded in 2010, and higher losses in Abbey Life in AWM 2011.
Net Interest Income and Net Gains (Losses) on Financial Assets/Liabilities at Fair Value through Profit or Loss
Corporate Banking & Securities (CB&S). Combined revenues from net interest income and from net gains (losses) on financial assets/liabilities at fair value through profit or loss from Sales & Trading were€ 9.6 billion in 2011, compared to€ 11.3 billion in 2010. In Sales & Trading (debt and other products) the main drivers for the decrease were significantly lower revenues in Flow Credit, reflecting weakened credit markets and lower client volumes across the industry. In Sales & Trading (equity) revenues were lower than 2010, mainly in Cash Trading, which was negatively impacted by the deterioration in equity markets during 2011, and in Equity Derivatives, due to a more challenging environment and lower client activity. The increase of€ 182 million in remaining products was driven by several items, including positive effects from derivatives not qualifying for hedge accounting.
Global Transaction Banking (GTB). Combined revenues from net interest income and from net gains (losses) on financial assets/liabilities at fair value through profit or loss increased by€ 391 million, compared to 2010. The increase was attributable mainly to Transaction services and included effects from the acquisition of commercial banking activities from ABN AMRO in the Netherlands.
Asset & Wealth Management (AWM). Combined net interest income and net gains (losses) on financial assets/liabilities at fair value through profit or loss were€ 1.0 billion in 2011, a decrease of€ 188 million, or 16 %, compared to 2010. The decrease was fully attributable to the Exchange Traded Funds (ETF) business, reallocated from CB&S to AWM in 2012, and the reassignment of the Sal. Oppenheim workout credit portfolio to NCOU.
Private & Business Clients (PBC). Combined net interest income and net gains (losses) on financial assets/liabilities at fair value through profit or loss were€ 6.6 billion in 2011, an increase of€ 2.7 billion, or 71 %, compared to 2010. The increase was mainly driven by the first-time consolidation of Postbank. In addition, the increase included higher net interest income from Deposits and Payment services, resulting from increased deposit volumes, partly offset by decreases in net interest income from Credit Products. The reassignment of the Postbank structured credit portfolio and of assets and liabilities in run-off to NCOU led to an overall lower increase.
| | | | |
| Deutsche Bank | | 01 – Management Report | | 28 |
| Financial Report 2012 | | Operating and Financial Review | | |
| | |
| | | | |
| | |
| | | | |
Non-Core Operations Unit (NCOU). Combined net interest income and net gains (losses) on financial assets/liabilities at fair value through profit or loss were€ 588 million in 2011, an increase of€ 267 million compared to€ 321 million in 2010. The main driver for the increase was the transfer of the exposure in Actavis Group from CB&S to the former CI at the beginning of 2011.
Consolidation & Adjustments (C&A). Combined net interest income and net gains (losses) on financial assets/liabilities at fair value through profit or loss were negative€ 40 million in 2011, compared to€ 333 million in 2010. The decrease mainly resulted from positions which were measured at fair value for management reporting purposes and measured at amortized cost under IFRS. Partly offsetting was higher net interest income on non-divisionalized assets and liabilities, including taxes.
Provision for Credit Losses
Provision for credit losses was€ 1.8 billion for the full year 2011 versus€ 1.3 billion in 2010. The increase was mainly attributable to Postbank, which contributed€ 761 million for the year. This number excludes releases from Postbank related loan loss allowances recorded prior to consolidation of€ 402 million. The impact of such releases is reported as net interest income on the group level. Excluding Postbank, provisions were down€ 139 million primarily reflecting improved performance in the PBC Clients Advisory Banking Germany and Advisory Banking International.
Remaining Noninterest Income
Commissions and fee income. Total commissions and fee income was€ 11.5 billion in 2011, an increase of€ 875 million, or 8 %, compared to 2010. This development was primarily driven by the consolidation of Postbank, which mainly impacted fees for other customer services (up by€ 1.2 billion, or 35 %) and brokerage fees (up by€ 157 million, or 9 %). Underwriting and advisory fees decreased by€ 365 million, or 17 %, mainly in CB&S, related to a reduced number of deals resulting from the challenging market conditions.
Net gains (losses) on financial assets available for sale. The net gains were€ 123 million in 2011, versus€ 201 million in 2010. The net gains in 2011 mainly included disposal gains of approximately€ 485 million and a one-time positive impact of€ 263 million related to our stake in Hua Xia Bank, driven by the application of equity method accounting upon receiving all substantive regulatory approvals to increase our stake, partly offset by impairments of€ 527 million on Greek government bonds.
Net income (loss) from equity method investments. Net loss from equity method investments was€ 264 mil-lion in 2011 versus a net loss of€ 2.0 billion in 2010. The net loss in 2011 included an impairment charge of€ 457 million related to Actavis Group, partly offset by a positive equity pick-up related to our stake in Hua Xia Bank.
Other income (loss). Total Other income (loss) was a gain of€ 1.3 billion in 2011 versus a gain of€ 764 million in 2010. Other income in 2011 included significant results from derivatives qualifying for hedge accounting, increased revenues related to The Cosmopolitan of Las Vegas (which commenced its activities in December 2010) and was influenced by the consolidation of Postbank. In 2010, other income included a gain representing negative goodwill related to the commercial banking activities acquired from ABN AMRO in the Netherlands as well as an impairment charge on The Cosmopolitan of Las Vegas.
Noninterest Expenses
Compensation and benefits. In the full year 2011, compensation and benefits were up by€ 464 million, or 4 %, compared to 2010. The increase included€ 1.4 billion related to our acquisitions, partly offset by significantly lower performance related compensation and lower severance payments.
| | | | |
| Deutsche Bank | | 01 – Management Report | | 29 |
| Financial Report 2012 | | Operating and Financial Review | | |
| | |
| | | | |
| | |
| | | | |
General and administrative expenses. General and administrative expenses increased by€ 2.5 billion versus 2010, reflecting€ 1.4 billion from our acquisitions. Also contributing to the increase were specific charges in CB&S (€ 655 million litigation-related expenses and a specific charge of€ 310 million relating to the impairment of a German VAT claim). In addition, general and administrative expenses increased due to higher costs related to our consolidated investments, mainly The Cosmopolitan of Las Vegas (including an impairment charge on the property of€ 135 million), and the first time consideration of€ 247 million for bank levies, predominantly in Germany and the UK. These increases were partly offset by savings resulting from the complexity reduction program and from the further integration of Corporate & Investment Banking (CIB), including lower IT costs in comparison to 2010.
Policyholder benefits and claims. Policyholder benefits and claims in 2011 were€ 207 million, a decrease of€ 278 million compared to the prior year, resulting primarily from our Abbey Life business. These insurance-related charges are offsetting related net gains on financial assets/liabilities at fair value through profit or loss.
Impairment of intangible assets. There was no charge for impairment of intangible assets in 2011.
Income Tax Expense
In 2011, the income tax expense was€ 1.1 billion, which led to an effective tax rate of 20 % compared to an income tax expense of€ 1.6 billion and an effective tax rate of 41 % in 2010. This development was due to changes in the recognition and measurement of deferred taxes, a favorable geographic mix of income and the partial tax exemption of net gains related to our stake in Hua Xia Bank.
Results of Operations by Segment (2011 vs. 2010)
Corporate Banking & Securities Corporate Division
Sales & Trading (debt and other products) net revenues decreased due to significantly lower revenues in Rates and Credit Flow Trading, predominantly in Flow Credit, reflecting weakened credit markets, lower client volumes across the industry, and reduced liquidity especially in the latter half of 2011. The aforementioned revenue decrease in Rates was due to lower flow client volumes as a result of market uncertainty. Structured Finance revenues were solid and in line with prior year, reflecting demand for restructuring capabilities. Emerging Markets revenues were lower than 2010 primarily due to lower flow client volumes as a result of market uncertainty. RMBS revenues were significantly higher than the prior year as a result of successful business realignment. Money Markets revenues increased, driven by strong client activity and volatile markets. Foreign Exchange revenues were very strong, with record annual client volumes offsetting lower margins. Commodities delivered record annual revenues despite a challenging environment, reflecting successful strategic investment.
Sales & Trading (equity) revenues decreased due to a more difficult market environment, with higher volatility and declining markets impacting client sentiment and activity, especially in Europe, which accounts for a high proportion of our business. Cash Trading revenues were lower due to the impact of the deterioration in equity markets during 2011 and lower client activity in Europe. Equity Derivatives revenues were lower as a result of a more challenging environment and lower client activity, although record revenues were achieved in the U.S. Prime Finance revenues were slightly lower reflecting reduced levels of client leverage, partially offset by our strong market position.
Noninterest expenses decreased, primarily driven by lower compensation expenses and efficiency savings partly offset by higher litigation related expenses, and a specific charge of€ 310 million relating to the impairment of a German VAT claim.
Income before income taxes decreased driven by the aforementioned revenue effects and partly offset by lower noninterest expenses.
| | | | |
| Deutsche Bank | | 01 – Management Report | | 30 |
| Financial Report 2012 | | Operating and Financial Review | | |
| | |
| | | | |
| | |
| | | | |
Global Transaction Banking Corporate Division
Net revenues increased driven by a performance on record levels across all businesses with growth in fee and interest income. 2010 included€ 216 million related to negative goodwill from the acquisition of commercial banking activities in the Netherlands. Trust & Securities Services profited from improved market conditions in the custody and depositary receipt business. Trade Finance further capitalized on high demand for international trade products and financing. In Cash Management, revenues increased on the basis of higher fees from strong payment volumes as well as higher net interest income mainly driven by slightly improved interest rate levels in Asia and the Euro area compared to the prior year period.
Provision for credit losses increased mainly due to the commercial banking activities acquired in the Netherlands.
Noninterest expenses increased slightly mainly driven by the aforementioned acquisition in the second quarter 2010, including higher expenses related to the amortization of an upfront premium paid for credit protection received and higher insurance-related expenses, partially offset by the non-recurrence of significant severance charges which related to specific measures associated with the realignment of infrastructure areas and sales units and the impact of an impairment of intangible assets in 2010.
Asset & Wealth Management Corporate Division
Net revenues decreased due to€ 279 million effects from mark-to-market movements on investments held to back insurance policyholder claims in Abbey Life, which are offset in noninterest expenses. Revenues from other products overall decreased, including the aforementioned effect which was partly compensated by€ 72 million in alternative assets and€ 46 million in Sal. Oppenheim. Revenues from discretionary portfolio management/fund management decreased reflecting the reduced asset base and performance fees resulting from negative market conditions especially in the second half of 2011. Revenues from advisory/brokerage decreased driven by negative market conditions. In contrast, revenues from deposits and payment services increased. Reflecting higher deposit volumes resulting from dedicated product initiatives. Furthermore, revenues from credit products improved across all Wealth Management units partly offset by Sal. Oppenheim.
Noninterest expenses decreased, mainly influenced from the above mentioned effects related to Abbey Life,€ 144 million from Sal. Oppenheim, reflecting the successful integration into Deutsche Bank, and lower expenses in Active mostly facilitated by measures to improve platform efficiency.
Invested assets declined due to an impact of€ 26 billion from market depreciation and€ 7 billion net outflows, partly offset by€ 9 billion due to foreign currency movements.
Private & Business Clients Corporate Division
The increase in net revenues is mainly attributable to the consolidation of Postbank, which began on December 3, 2010, and contributed revenues of€ 4.5 billion in 2011, compared to€ 460 million in 2010. In 2011 revenues from other products also included€ 62 million impairments on Greek government bonds in Advisory Banking Germany as well as a one-time positive impact of€ 263 million related to our stake in Hua Xia Bank, driven by the application of equity method accounting upon receiving all substantive regulatory approvals to increase our stake. Revenues from deposits and payment services increased, largely driven by higher volumes in Advisory Banking Germany. Advisory/brokerage revenues increased while revenues from discretionary portfolio management/fund management revenues decreased mainly in Advisory Banking Germany due to the challenging environment. Credit products revenues were down with negative effects from lower margins overcompensating revenue increases due to higher volumes in both Advisory Banking Germany and Advisory Banking International.
| | | | |
| Deutsche Bank | | 01 – Management Report | | 31 |
| Financial Report 2012 | | Operating and Financial Review | | |
| | |
| | | | |
| | |
| | | | |
Provision for credit losses was€ 1.2 billion, of which€ 742 million related to Postbank. This number excludes releases from Postbank-related loan loss allowance recorded prior to consolidation of€ 402 million. The impact of such releases is reported as net interest income. Excluding Postbank, provisions for credit losses were€ 444 million, down€ 91 million compared to 2010. The decrease was driven by Advisory Banking Germany.
The increase in noninterest expenses is predominantly driven by Consumer Banking Germany reflecting the consolidation of Postbank. Excluding the Consumer Banking Germany related increase, noninterest expenses were up by€ 84 million, mainly resulting from higher costs-to-achieve related to Postbank integration.
Income before income taxes improved due to Consumer Banking Germany and Advisory Banking International.
Invested assets were€ 296 billion, down€ 1 billion compared to 2010. This was mainly driven by€ 9 billion due to market depreciation, partly offset by€ 8 billion net inflows, mainly in deposits.
Non-Core Operations Unit Corporate Division
Net revenues increased compared to 2010, including revenues from our exposure to Actavis Group as well as investments in BHF-BANK, Maher Terminals and The Cosmopolitan of Las Vegas which were partly reduced by impairment charges of€ 457 million related to Actavis Group as well as impairments on Greek Government bonds. Net revenues in 2010 were mainly impacted by a charge of€ 2.3 billion from our investment in Postbank.
Provision for credit losses decreased due to an improvement in Consumer Finance Business portfolio and lower provisions required in relation to IAS 39 reclassified assets.
The increase in noninterest expenses is mainly caused by the start of operations at The Cosmopolitan of Las Vegas at the end of 2010 and non-core business of Postbank, which was consolidated in December 2010, as well as a specific impairment charge on The Cosmopolitan of Las Vegas property and ongoing litigation and settlement costs.
Loss before income taxes decreased mainly due to revenues impacted by the aforementioned Postbank investment.
Consolidation & Adjustments
For a discussion of C&A to our business segment results see Note 05 “Business Segments and Related Information” to the consolidated financial statements.
| | | | |
| Deutsche Bank | | 01 – Management Report | | 32 |
| Financial Report 2012 | | Operating and Financial Review | | |
| | |
| | | | |
| | |
| | | | |
Financial Position
| | | | | | | | | | | | | | | | |
| | | | | | | | | 2012 increase (decrease)
from 2011 | |
| in€ m. | | Dec 31, 2012 | | | Dec 31, 2011 | | | in€ m. | | | in % | |
| | | | | | | | | | | | | | | | |
Cash and due from banks | | | 27,885 | | | | 15,928 | | | | 11,957 | | | | 75 | |
| | | | | | | | | | | | | | | | |
Interest-earning deposits with banks | | | 119,548 | | | | 162,000 | | | | (42,452) | | | | (26) | |
| | | | | | | | | | | | | | | | |
| Central bank funds sold, securities purchased under resale agreements and securities borrowed | | | 60,517 | | | | 57,110 | | | | 3,407 | | | | 6 | |
| | | | | | | | | | | | | | | | |
Trading assets | | | 245,538 | | | | 240,924 | | | | 4,614 | | | | 2 | |
| | | | | | | | | | | | | | | | |
Positive market values from derivative financial instruments | | | 768,316 | | | | 859,582 | | | | (91,266) | | | | (11) | |
| | | | | | | | | | | | | | | | |
Financial assets designated at fair value through profit or loss | | | 187,027 | | | | 180,293 | | | | 6,734 | | | | 4 | |
thereof: Securities purchased under resale agreements | | | 124,987 | | | | 117,284 | | | | 7,703 | | | | 7 | |
thereof: Securities borrowed | | | 28,304 | | | | 27,261 | | | | 1,043 | | | | 4 | |
| | | | | | | | | | | | | | | | |
Loans | | | 397,279 | | | | 412,514 | | | | (15,235) | | | | (4) | |
| | | | | | | | | | | | | | | | |
Brokerage and securities related receivables | | | 97,295 | | | | 122,810 | | | | (25,515) | | | | (21) | |
| | | | | | | | | | | | | | | | |
Remaining assets | | | 108,924 | | | | 112,942 | | | | (4,018) | | | | (4) | |
| | | | | | | | | | | | | | | | |
Total assets | | | 2,012,329 | | | | 2,164,103 | | | | (151,774) | | | | (7) | |
| | | | | | | | | | | | | | | | |
Deposits | | | 577,202 | | | | 601,730 | | | | (24,528) | | | | (4) | |
| | | | | | | | | | | | | | | | |
| Central bank funds purchased, securities sold under repurchase agreements and securities loaned | | | 39,253 | | | | 43,400 | | | | (4,147) | | | | (10) | |
| | | | | | | | | | | | | | | | |
Trading liabilities | | | 54,914 | | | | 63,886 | | | | (8,972) | | | | (14) | |
| | | | | | | | | | | | | | | | |
Negative market values from derivative financial instruments | | | 752,706 | | | | 838,817 | | | | (86,111) | | | | (10) | |
| | | | | | | | | | | | | | | | |
Financial liabilities designated at fair value through profit or loss | | | 109,166 | | | | 118,318 | | | | (9,152) | | | | (8) | |
thereof: Securities sold under repurchase agreements | | | 82,267 | | | | 93,606 | | | | (11,339) | | | | (12) | |
thereof: Securities loaned | | | 8,443 | | | | 3,697 | | | | 4,746 | | | | 128 | |
| | | | | | | | | | | | | | | | |
Other short-term borrowings | | | 69,060 | | | | 65,356 | | | | 3,704 | | | | 6 | |
| | | | | | | | | | | | | | | | |
Long-term debt | | | 158,097 | | | | 163,416 | | | | (5,319) | | | | (3) | |
| | | | | | | | | | | | | | | | |
Brokerage and securities related payables | | | 128,010 | | | | 139,733 | | | | (11,723) | | | | (8) | |
| | | | | | | | | | | | | | | | |
Remaining liabilities | | | 69,511 | | | | 74,787 | | | | (5,276) | | | | (7) | |
| | | | | | | | | | | | | | | | |
Total liabilities | | | 1,957,919 | | | | 2,109,443 | | | | (151,524) | | | | (7) | |
| | | | | | | | | | | | | | | | |
Total equity | | | 54,410 | | | | 54,660 | | | | (250) | | | | (0) | |
| |
Movements in Assets
The overall decrease of€ 152 billion compared to December 31, 2011 was largely related to a€ 91 billion reduction in positive market values from derivatives, primarily driven by yield curve changes, tightening credit spreads, maturing trades as well as the strengthening Euro against major currencies.
The€ 12 billion increase in cash and due from banks and the€ 42 billion decrease in interest earning deposits with banks reflect our liquidity management activities during the year, including the reduction in our discretionary wholesale funding liabilities.
Brokerage and securities related receivables were down by€ 26 billion compared to December 31, 2011, due to extraordinary low trading volumes over the year-end 2012.
During 2012, loans declined by€ 15 billion, primarily from managed reductions in our NCOU.
Foreign exchange rate movements (included in numbers above), in particular of the U.S. dollar and Japanese yen versus the euro, contributed€ 25 billion to the decrease of our balance sheet during 2012.
Movements in Liabilities
Total liabilities decreased by€ 152 billion over the year 2012, with a€ 86 billion reduction in negative market values from derivatives representing the major driver, primarily due to the same reasons driving the reduction in positive market values from derivatives as outlined above.
Deposits were down by€ 25 billion, largely impacted by (i) an alignment within the Group of cash/margin collateral received resulting in a€ 17 billion reclassification out of deposits into brokerage and securities related payables as of year-end 2012, and (ii) a reduction in discretionary wholesale funding liabilities, partially offset by an increase in retail and transaction banking deposits.
| | | | |
| Deutsche Bank | | 01 – Management Report | | 33 |
| Financial Report 2012 | | Operating and Financial Review | | |
| | |
| | | | |
| | |
| | | | |
The€ 12 billion decrease in brokerage and securities related payables reflects extraordinary low trading volumes over the year 2012, partially offset by the above mentioned reclassification out of deposits.
Equity
Total equity decreased by€ 250 million between 2011 and 2012. The main factors contributing to this development were noncontrolling interests which decreased by€ 863 million, the cash dividend paid to Deutsche Bank shareholders of€ 689 million and actuarial gains (losses) which decreased by€ 452 million. These negative effects were mostly offset by a decrease of€ 763 million in Treasury shares, which are deducted from equity, the increase of accumulated other comprehensive income of€ 688 million and net income attributable to Deutsche Bank shareholders, which amounted to€ 237 million. The increase in accumulated other comprehensive income was mainly a result of unrealized net gains on financial assets available for sale of€ 1.1 billion that were partly offset by negative effects from exchange rate changes of€ 423 million namely related to the U.S. dollar. Unrealized net gains on financial assets available for sale were mainly related to improved market prices of debt securities from European issuers. The decrease in noncontrolling interests was mainly driven by the exercise of Deutsche Post’s put option on Postbank’s shares in February 2012 and by the conclusion of a domination and profit and loss transfer agreement with Postbank in the second quarter 2012.
Regulatory Capital
The calculation of our regulatory capital as of December 31, 2012 is based on the “Basel 2.5”-framework as implemented by the Capital Requirements Directive 3 into the German Banking Act and the Solvency Regulation. Our Total regulatory capital (Tier 1 and Tier 2 capital) reported under Basel 2.5 was€ 57.0 billion at the end of 2012 compared to€ 55.2 billion at the end of 2011. Tier 1 capital increased to€ 50.5 billion at the end of 2012 versus€ 49.0 billion at the end of 2011. As of December 31, 2012, Common Equity Tier 1 (formerly referred to as Core Tier 1) capital increased to€ 38.0 billion from€ 36.3 billion at the end of 2011. The increase in both levels of Tier 1 capital primarily reflected reduced capital deduction items.
Amendments to IAS 39 and IFRS 7, “Reclassification of Financial Assets”
As of December 31, 2012 and December 31, 2011 the carrying value of reclassified assets was€ 17.0 billion and€ 22.9 billion, respectively, compared with a fair value of€ 15.4 billion and€ 20.2 billion as of December 31, 2012 and December 31, 2011, respectively. These assets are held in the NCOU.
Please refer to Note 14 “Amendments to IAS 39 and IFRS 7, ‘Reclassification of Financial Assets’” for additional information on these assets and on the impact of their reclassification.
Exposure to Monoline Insurers
The deterioration of the U.S. subprime mortgage and related markets has generated large exposures to financial guarantors, such as monoline insurers, that have insured or guaranteed the value of pools of collateral referenced by CDOs and other market-traded securities. Actual claims against monoline insurers will only become due if actual defaults occur in the underlying assets (or collateral). There is ongoing uncertainty as to whether some monoline insurers will be able to meet all their liabilities to banks and other buyers of protection. Under certain conditions (e.g., liquidation) we can accelerate claims regardless of actual losses on the underlying assets.
The following tables summarize the fair value of our counterparty exposures to monoline insurers with respect to U.S. residential mortgage-related activity and other activities, respectively, in each case on the basis of the fair value of the assets compared with the notional value guaranteed or underwritten by monoline insurers. The other exposures described in the second table arise from a range of client and trading activity, including collateralized loan obligations, commercial mortgage-backed securities, trust preferred securities, student loans and public sector or municipal debt. The tables show the associated Credit Valuation Adjustments (“CVA”) that we
| | | | |
| Deutsche Bank | | 01 – Management Report | | 34 |
| Financial Report 2012 | | Operating and Financial Review | | |
| | |
| | | | |
| | |
| | | | |
have recorded against the exposures. For monolines with actively traded CDS, the CVA is calculated using a full CDS-based valuation model. For monolines without actively traded CDS, a model-based approach is used with various input factors, including relevant market driven default probabilities, the likelihood of an event (either a restructuring or an insolvency), an assessment of any potential settlement in the event of a restructuring, and recovery rates in the event of either restructuring or insolvency. The monoline CVA methodology is reviewed on a quarterly basis by management; since the second quarter of 2011 market based spreads have been used more extensively in the CVA assessment.
The ratings in the tables below are the lowest of Standard & Poor’s, Moody’s or our own internal credit ratings.
| | | | | | | | | | | | | | | | | | | | | | | | | | | | | | | | |
Monoline exposure related to U.S. residential mortgages | | Dec 31, 2012 | | | Dec 31, 2011 | |
| in€ m. | | Notional
amount | | | Value
prior to
CVA | | | CVA | | | Fair value
after CVA | | | Notional
amount | | | Value
prior to
CVA | | | CVA | | | Fair value
after CVA | |
| | | | | | | | | | | | | | | | | | | | | | | | | | | | | | | | |
AA Monolines: | | | | | | | | | | | | | | | | | | | | | | | | | | | | | | | | |
Other subprime | | | 112 | | | | 47 | | | | (11) | | | | 36 | | | | 124 | | | | 65 | | | | (20) | | | | 45 | |
Alt-A | | | 3,011 | | | | 1,181 | | | | (191) | | | | 990 | | | | 3,662 | | | | 1,608 | | | | (353) | | | | 1,255 | |
| | | | | | | | | | | | | | | | | | | | | | | | | | | | | | | | |
Total AA Monolines | | | 3,123 | | | | 1,228 | | | | (202) | | | | 1,026 | | | | 3,786 | | | | 1,673 | | | | (373) | | | | 1,300 | |
| |
| | |
| Other Monoline exposure | | Dec 31, 2012 | | | Dec 31, 2011 | |
| in€ m. | | Notional
amount | | | Value
prior to
CVA | | | CVA | | | Fair value
after CVA | | | Notional
amount | | | Value
prior to
CVA | | | CVA | | | Fair value
after CVA | |
| | | | | | | | | | | | | | | | | | | | | | | | | | | | | | | | |
AA Monolines: | | | | | | | | | | | | | | | | | | | | | | | | | | | | | | | | |
TPS-CLO | | | 2,441 | | | | 575 | | | | (101) | | | | 474 | | | | 2,721 | | | | 786 | | | | (201) | | | | 585 | |
CMBS | | | 1,092 | | | | 2 | | | | – | | | | 2 | | | | 1,113 | | | | 26 | | | | (3) | | | | 23 | |
Corporate single name/Corporate CDO | | | – | | | | – | | | | – | | | | – | | | | – | | | | – | | | | – | | | | – | |
Student loans | | | 297 | | | | 29 | | | | (3) | | | | 26 | | | | 303 | | | | 56 | | | | (13) | | | | 43 | |
Other | | | 882 | | | | 274 | | | | (127) | | | | 147 | | | | 922 | | | | 305 | | | | (111) | | | | 194 | |
| | | | | | | | | | | | | | | | | | | | | | | | | | | | | | | | |
Total AA Monolines | | | 4,712 | | | | 880 | | | | (231) | | | | 649 | | | | 5,059 | | | | 1,173 | | | | (328) | | | | 845 | |
| | | | | | | | | | | | | | | | | | | | | | | | | | | | | | | | |
Non Investment Grade Monolines: | | | | | | | | | | | | | | | | | | | | | | | | | | | | | | | | |
TPS-CLO | | | 455 | | | | 147 | | | | (40) | | | | 107 | | | | 547 | | | | 199 | | | | (89) | | | | 110 | |
CMBS | | | 3,377 | | | | 92 | | | | (28) | | | | 64 | | | | 3,539 | | | | 211 | | | | (42) | | | | 169 | |
Corporate single name/Corporate CDO | | | 12 | | | | – | | | | – | | | | – | | | | 2,062 | | | | 2 | | | | – | | | | 2 | |
Student loans | | | 1,284 | | | | 534 | | | | (170) | | | | 364 | | | | 1,325 | | | | 587 | | | | (189) | | | | 398 | |
Other | | | 1,084 | | | | 185 | | | | (66) | | | | 119 | | | | 1,076 | | | | 213 | | | | (89) | | | | 124 | |
| | | | | | | | | | | | | | | | | | | | | | | | | | | | | | | | |
Total Non Investment Grade Monolines | | | 6,212 | | | | 958 | | | | (304) | | | | 654 | | | | 8,549 | | | | 1,212 | | | | (409) | | | | 803 | |
| | | | | | | | | | | | | | | | | | | | | | | | | | | | | | | | |
Total | | | 10,924 | | | | 1,838 | | | | (535) | | | | 1,303 | | | | 13,608 | | | | 2,385 | | | | (737) | | | | 1,648 | |
| |
The tables exclude counterparty exposure to monoline insurers that relates to wrapped bonds. A wrapped bond is one that is insured or guaranteed by a third party. As of December 31, 2012 and December 31, 2011, the exposure on wrapped bonds related to U.S. residential mortgages was€ 11 million and€ 52 million, respectively, and the exposure on wrapped bonds other than those related to U.S. residential mortgages was€ 40 million and€ 46 million, respectively. In each case, the exposure represents an estimate of the potential mark-downs of wrapped assets in the event of monoline defaults.
A proportion of the mark-to-market monoline exposure has been mitigated with CDS protection arranged with other market counterparties and other economic hedge activity.
As of December 31, 2012 and December 31, 2011 the total Credit Valuation Adjustment held against monoline insurers was€ 737 million and€ 1,109 million respectively.
| | | | |
| Deutsche Bank | | 01 – Management Report | | 35 |
| Financial Report 2012 | | Operating and Financial Review | | |
| | |
| | | | |
| | |
| | | | |
Special Purpose Entities and Off Balance Sheet Arrangements
We engage in various business activities with certain entities, referred to as special purpose entities (SPEs), which are designed to achieve a specific business purpose. The principal uses of SPEs are to provide clients with access to specific portfolios of assets and risk and to provide market liquidity for clients through securitizing financial assets. SPEs may be established as corporations, trusts or partnerships.
We may or may not consolidate SPEs that we have set up or sponsored or with which we have a contractual relationship. We will consolidate an SPE when we have the power to govern its financial and operating policies, generally accompanying a shareholding, either directly or indirectly, of more than half the voting rights. If the activities of the SPEs are narrowly defined or it is not evident who controls the financial and operating policies of the SPE we will consider other factors to determine whether we have the majority of the risks and rewards. We reassess our treatment of SPEs for consolidation when there is a change in the SPE’s arrangements or the substance of the relationship between us and an SPE changes. For further detail on our accounting policies regarding consolidation and reassessment of consolidation of SPEs please refer to Note 01 “Significant Accounting Policies” in our consolidated financial statements.
In limited situations we consolidate some SPEs for both financial reporting and German regulatory purposes. However, in all other cases we hold regulatory capital, as appropriate, against all SPE-related transactions and related exposures, such as derivative transactions and lending-related commitments and guarantees.
The following sections provide details about the assets (after consolidation eliminations) in our consolidated SPEs and our maximum unfunded exposure remaining to certain non-consolidated SPEs.
Total Assets in Consolidated SPEs
| | | | | | | | | | | | | | | | | | | | | | | | |
| Dec 31, 2012 | | Asset type | |
in€ m. | | Financial
assets at
fair value
through
profit
or loss1 | | | Financial
assets
available
for sale | | | Loans | | | Cash and
cash
equivalents | | | Other
assets | | | Total
assets | |
Category: | | | | | | | | | | | | | | | | | | | | | | | | |
| | | | | | | | | | | | | | | | | | | | | | | | |
Group sponsored ABCP conduits | | | – | | | | 79 | | | | 8,433 | | | | 12 | | | | 16 | | | | 8,540 | |
| | | | | | | | | | | | | | | | | | | | | | | | |
Group sponsored securitizations | | | 1,889 | | | | 344 | | | | 1,100 | | | | 4 | | | | 70 | | | | 3,407 | |
| | | | | | | | | | | | | | | | | | | | | | | | |
Third party sponsored securitizations | | | 485 | | | | – | | | | 469 | | | | 13 | | | | 132 | | | | 1,099 | |
| | | | | | | | | | | | | | | | | | | | | | | | |
Repackaging and investment products | | | 4,287 | | | | 1,038 | | | | 84 | | | | 348 | | | | 257 | | | | 6,014 | |
| | | | | | | | | | | | | | | | | | | | | | | | |
Mutual funds | | | 4,115 | | | | – | | | | – | | | | 493 | | | | 8 | | | | 4,616 | |
| | | | | | | | | | | | | | | | | | | | | | | | |
Structured transactions | | | 357 | | | | 104 | | | | 1,151 | | | | 44 | | | | 182 | | | | 1,838 | |
| | | | | | | | | | | | | | | | | | | | | | | | |
Operating entities | | | 2,638 | | | | 4,070 | | | | 3,023 | | | | 55 | | | | 3,239 | | | | 13,025 | |
| | | | | | | | | | | | | | | | | | | | | | | | |
Other | | | 215 | | | | 333 | | | | 499 | | | | 31 | | | | 343 | | | | 1,421 | |
| | | | | | | | | | | | | | | | | | | | | | | | |
Total | | | 13,986 | | | | 5,968 | | | | 14,759 | | | | 1,000 | | | | 4,247 | | | | 39,960 | |
| |
| 1 | Fair value of derivative positions is€ 218 million. |
| | | | | | | | | | | | | | | | | | | | | | | | |
| Dec 31, 2011 | | Asset type | |
in€ m. | | Financial
assets at
fair value
through
profit or loss1 | | | Financial
assets
available
for sale | | | Loans | | | Cash and
cash
equivalents | | | Other
assets | | | Total
assets | |
Category: | | | | | | | | | | | | | | | | | | | | | | | | |
| | | | | | | | | | | | | | | | | | | | | | | | |
Group sponsored ABCP conduits | | | – | | | | 39 | | | | 10,998 | | | | 1 | | | | 33 | | | | 11,071 | |
| | | | | | | | | | | | | | | | | | | | | | | | |
Group sponsored securitizations | | | 2,044 | | | | 191 | | | | 1,169 | | | | 3 | | | | 48 | | | | 3,455 | |
| | | | | | | | | | | | | | | | | | | | | | | | |
Third party sponsored securitizations | | | – | | | | – | | | | 493 | | | | 14 | | | | 156 | | | | 663 | |
| | | | | | | | | | | | | | | | | | | | | | | | |
Repackaging and investment products | | | 5,032 | | | | 971 | | | | 207 | | | | 606 | | | | 409 | | | | 7,225 | |
| | | | | | | | | | | | | | | | | | | | | | | | |
Mutual funds | | | 3,973 | | | | – | | | | – | | | | 1,934 | | | | 566 | | | | 6,473 | |
| | | | | | | | | | | | | | | | | | | | | | | | |
Structured transactions | | | 2,425 | | | | 43 | | | | 3,748 | | | | 22 | | | | 334 | | | | 6,572 | |
| | | | | | | | | | | | | | | | | | | | | | | | |
Operating entities | | | 2,116 | | | | 3,879 | | | | 3,228 | | | | 102 | | | | 3,439 | | | | 12,764 | |
| | | | | | | | | | | | | | | | | | | | | | | | |
Other | | | 114 | | | | 239 | | | | 329 | | | | 84 | | | | 548 | | | | 1,314 | |
| | | | | | | | | | | | | | | | | | | | | | | | |
Total | | | 15,704 | | | | 5,362 | | | | 20,172 | | | | 2,766 | | | | 5,533 | | | | 49,537 | |
| |
| 1 | Fair value of derivative positions is€ 580 million. |
| | | | |
| Deutsche Bank | | 01 – Management Report | | 36 |
| Financial Report 2012 | | Operating and Financial Review | | |
| | |
| | | | |
| | |
| | | | |
Group Sponsored ABCP Conduits
The Group sets up, sponsors and administers asset-backed commercial paper (ABCP) programs. These programs provide our customers with access to liquidity in the commercial paper market and create investment products for our clients. As an administrative agent for the commercial paper programs, we facilitate the purchase of non-Deutsche Bank Group loans, securities and other receivables by the commercial paper conduit (conduit), which then issues to the market high-grade, short-term commercial paper, collateralized by the underlying assets, to fund the purchase. The conduits require sufficient collateral, credit enhancements and liquidity support to maintain an investment grade rating for the commercial paper. We are the liquidity provider to these conduits and therefore exposed to changes in the carrying value of their assets. We consolidate the majority of our sponsored conduit programs because we have the controlling interest.
Our liquidity exposure to these conduits is to the entire commercial paper issued of€ 9.3 billion and€ 11.6 billion as of December 31, 2012 and December 31, 2011, of which we held€ 393 million and€ 2.5 billion, respectively.
The collateral in the conduits includes a range of asset-backed loans and securities, including aircraft leasing, student loans, trust preferred securities and residential- and commercial-mortgage-backed securities. The collateral in the conduits has decreased due to the repayment of certain transactions and the sale of loans to other entities within the Group.
Group Sponsored Securitizations
We sponsor SPEs for which we originate or purchase assets. These assets are predominantly commercial and residential whole loans or mortgage-backed securities. The SPEs fund these purchases by issuing multiple tranches of securities, the repayment of which is linked to the performance of the assets in the SPE. When we retain a subordinated interest in the assets that have been securitized, an assessment of the relevant factors is performed and, if SPEs are controlled by us, they are consolidated. The fair value of our retained exposure in these securitizations as of December 31, 2012 and December 31, 2011 was€ 3.4 billion and€ 3.1 billion, respectively.
Third Party Sponsored Securitizations
In connection with our securities trading and underwriting activities, we acquire securities issued by third party securitization vehicles that purchase diversified pools of commercial and residential whole loans or mortgage-backed securities. The vehicles fund these purchases by issuing multiple tranches of securities, the repayment of which is linked to the performance of the assets in the vehicles. When we hold a subordinated interest in the SPE, an assessment of the relevant factors is performed and if SPEs are controlled by us, they are consolidated. The increase in the total assets of these SPEs is mainly due to the consolidation of certain Collateralized Mortgage Obligations in the period. As of December 31, 2012 and December 31, 2011 the fair value of our retained exposure in these securitizations was€ 1.0 billion and€ 0.6 billion, respectively.
Repackaging and Investment Products
Repackaging is a similar concept to securitization. The primary difference is that the components of the repackaging SPE are generally securities and derivatives, rather than non-security financial assets, which are then “repackaged” into a different product to meet specific individual investor needs. We consolidate these SPEs when we have the majority of risks and rewards inherent in the repackaging entity. Risks and rewards inherent in the repackaging entity may include price movements of the underlying asset for equity, credit, interest rate and other risks and the potential variability arising from those risks. Our consolidation assessment considers the exposures that both Deutsche Bank and the investor(s) have in relation to the repackaging entity via derivatives and other instruments. Investment products offer clients the ability to become exposed to specific portfolios of assets and risks through purchasing our structured notes. We hedge this exposure by purchasing interests in SPEs that match the return specified in the notes. The decrease in total assets of€ 1.2 billion is mainly driven by the repayment of certain facilities in the period. In addition to the assets of consolidated repackaging vehicles shown in the table the nominal value of the total assets in non-consolidated repackaging vehicles was€ 33 billion and€ 35 billion as December 31, 2012 and December 31, 2011 respectively.
| | | | |
| Deutsche Bank | | 01 – Management Report | | 37 |
| Financial Report 2012 | | Operating and Financial Review | | |
| | |
| | | | |
| | |
| | | | |
Mutual Funds
We offer clients mutual fund and mutual fund-related products which pay returns linked to the performance of the assets held in the funds. We provide a guarantee feature to certain funds in which we guarantee certain levels of the net asset value to be returned to investors at certain dates. The risk for us as guarantor is that we have to compensate the investors if the market values of such products at their respective guarantee dates are lower than the guaranteed levels. For our investment management service in relation to such products, we earn management fees and, on occasion, performance-based fees. We are not contractually obliged to support these funds and have not done so during 2012. During 2012 the amount of assets held in consolidated funds decreased by€ 1.9 billion. This movement was predominantly due to client money outflows during the period.
Structured Transactions
We enter into certain structures which offer clients funding opportunities at favorable rates. The funding is predominantly provided on a collateralized basis. These structures are individually tailored to the needs of our clients. We consolidate these SPEs when we hold the controlling interest or we have the majority of the risks and rewards through a residual interest holding and/or a related liquidity facility. The composition of the SPEs that we consolidate is influenced by the execution of new transactions and the maturing, restructuring and exercise of early termination options with respect to existing transactions. The total assets decreased by€ 4.7 billion during 2012 due to the unwinding of certain trades.
Operating Entities
We establish SPEs to conduct some of our operating business when we benefit from the use of an SPE. These include direct holdings in certain proprietary investments and the issuance of credit default swaps where our exposure has been limited to our investment in the SPE. We consolidate these entities when we hold the controlling interest or are exposed to the majority of risks and rewards of the SPE.
Exposure to Non-consolidated SPEs
We do not consolidate all the SPEs that we transact with but we may have exposure to non-consolidated SPEs through certain arrangements. These arrangements include the provision of sponsorship for commercial paper conduits, finance-related support to third party conduits, liquidity facilities, repurchase and loan commitments and guarantees. These arrangements are discussed in greater detail below.
| | | | | | | | |
in€ bn. | | Dec 31, 2012 | | | Dec 31, 2011 | |
Maximum unfunded exposure by category: | | | | | | | | |
| | | | | | | | |
Group sponsored ABCP conduits | | | 0.8 | | | | 1.2 | |
| | | | | | | | |
Third party ABCP conduits | | | 1.8 | | | | 1.9 | |
| | | | | | | | |
Third party sponsored securitizations | | | | | | | | |
U.S. | | | 1.4 | | | | 1.6 | |
non-U.S. | | | 1.9 | | | | 1.4 | |
| | | | | | | | |
Guaranteed mutual funds1 | | | 9.5 | | | | 9.8 | |
| | | | | | | | |
Real estate leasing funds | | | 0.7 | | | | 0.7 | |
| |
| 1 | Notional amount of the guarantees. |
| | | | |
| Deutsche Bank | | 01 – Management Report | | 38 |
| Financial Report 2012 | | Operating and Financial Review | | |
| | |
| | | | |
| | |
| | | | |
Group Sponsored ABCP Conduits
We sponsor and administer four ABCP conduits, established in Australia, which are not consolidated because we do not hold the majority of risks and rewards. These conduits provide our clients with access to liquidity in the commercial paper market in Australia. As of December 31, 2012 and December 31, 2011 they had assets totaling€ 0.6 billion and€ 1.0 billion respectively, consisting of securities backed by non-U.S. residential mortgages issued by warehouse SPEs set up by the clients to facilitate the purchase of the assets by the conduits. The minimum credit rating for these securities is AA–. The credit enhancement necessary to achieve the required credit ratings is ordinarily provided by mortgage insurance extended by third-party insurers to the SPEs.
The weighted average life of the assets held in the conduits is five years. The average life of the commercial paper issued by these off-balance sheet conduits is one to three months.
Our exposure to these entities is limited to the committed liquidity facilities totaling€ 0.8 billion as of December 31, 2012 and€ 1.2 billion as of December 31, 2011. None of these facilities have been drawn. The decrease in the liquidity facilities has been due to the maturity and reduction of certain facilities during the period. Advances against the liquidity facilities are collateralized by the underlying assets held in the conduits, and thus a drawn facility will be exposed to volatility in the value of the underlying assets. Should the assets decline sufficiently in value, there may not be sufficient funds to repay the advance. As of December 31, 2012 we did not hold material amounts of commercial paper or notes issued by these conduits.
Third Party ABCP Conduits
In addition to sponsoring our commercial paper programs, we also assist third parties with the formation and ongoing risk management of their commercial paper programs. We do not consolidate any third party ABCP conduits as we do not control them.
Our assistance to third party conduits is primarily financing-related in the form of unfunded committed liquidity facilities and unfunded committed repurchase agreements in the event of disruption in the commercial paper market. The liquidity facilities and committed repurchase agreements are recorded off-balance sheet unless a contingent payment is deemed probable and estimable, in which case a liability is recorded. At December 31, 2012 and 2011, the notional amount of undrawn facilities provided by us was€ 1.8 billion and€ 1.9 bil-lion, respectively. These facilities are collateralized by the assets in the SPEs and therefore the movement in the fair value of these assets will affect the recoverability of the amount drawn.
Third Party Sponsored Securitizations
The third party securitization vehicles to which we, and in some instances other parties, provide financing are third party-managed investment vehicles that purchase diversified pools of assets, including fixed income securities, corporate loans, asset-backed securities (predominantly commercial mortgage-backed securities, residential mortgage-backed securities and credit card receivables) and film rights receivables. The vehicles fund these purchases by issuing multiple tranches of debt and equity securities, the repayment of which is linked to the performance of the assets in the vehicles.
| | | | |
| Deutsche Bank | | 01 – Management Report | | 39 |
| Financial Report 2012 | | Operating and Financial Review | | |
| | |
| | | | |
| | |
| | | | |
The notional amount of liquidity facilities with an undrawn component provided by us as of December 31, 2012 and December 31, 2011 was€ 7.0 billion and€ 8.2 billion, respectively, of which€ 3.6 billion and€ 5.2 billion had been drawn and€ 3.3 billion and€ 3.0 billion were still available to be drawn as detailed in the table. All facilities are available to be drawn if the assets meet certain eligibility criteria and performance triggers are not reached. These facilities are collateralized by the assets in the SPEs and therefore the movement in the fair value of these assets affects the recoverability of the amount drawn.
Mutual Funds
We provide guarantees to funds whereby we guarantee certain levels of the net asset value to be returned to investors at certain dates. These guarantees do not result in us consolidating the funds; they are recorded on-balance sheet as derivatives at fair value with changes in fair value recorded in the consolidated statement of income. The fair value of the guarantees was€ 32 million as of December 31, 2012. As of December 31, 2012, these non-consolidated funds had€ 10.9 billion assets under management and provided guarantees of€ 9.5 billion. As of December 31, 2011, assets of€ 10.6 billion and guarantees of€ 9.8 billion were reported.
Real Estate Leasing Funds
We provide guarantees to SPEs that hold real estate assets (commercial and residential land and buildings and infrastructure assets located in Germany) that are financed by third parties and leased to our clients. These guarantees are only drawn upon in the event that the asset is destroyed and the insurance company does not pay for the loss. If the guarantee is drawn we hold a claim against the insurance company. We also write put options to closed-end real estate funds set up by us, which purchase commercial or infrastructure assets located in Germany and which are then leased to third parties. The put option allows the shareholders to sell the asset to us at a fixed price at the end of the lease. As of December 31, 2012 and December 31, 2011 the notional amount of the guarantees was€ 476 million and€ 501 million respectively, and the notional of the put options was€ 228 million and€ 239 million respectively. We do not consolidate these SPEs as we do not hold the majority of their risks and rewards.
For further information on off-balance sheet arrangements, including allowances for off-balance sheet positions, please refer to the Risk Report. Additional information is also included in Note 30 “Credit related Commitments and Contingent Liabilities”.
As of January 1, 2013 the Group has adopted the requirements of IFRS 10 “Consolidated Financial Statements” and IFRS 12 “Disclosure of Interests in Other Entities.” IFRS 12 requires the Group to provide more comprehensive disclosures related to the nature, associated risks, and financial effects of interests in subsidiaries, joint arrangements, associates and unconsolidated structured entities. As a result the disclosure requirements by IFRS 12 will be made in the notes to the financial statements as of year-end 2013. For further information, see Note 03 “Recently Adopted and New Accounting Pronouncements”.
Liquidity and Capital Resources
For a detailed discussion of our liquidity risk management, see our Risk Report.
| | | | |
| Deutsche Bank | | 01 – Management Report | | 40 |
| Financial Report 2012 | | Operating and Financial Review | | |
| | |
| | | | |
| | |
| | | | |
[Page intentionally left blank for SEC filing purposes]
| | | | |
| Deutsche Bank | | 01 – Management Report | | 41 |
| Financial Report 2012 | | Operating and Financial Review | | |
| | |
| | | | |
| | |
| | | | |
Tabular Disclosure of Contractual Obligations
Cash payment requirements outstanding as of December 31, 2012.
| | | | | | | | | | | | | | | | | | | | |
| Contractual obligations | | Payment due by period | |
in€ m. | | Total | | | Less than
1 year | | | 1–3 years | | | 3–5 years | | | More than
5 years | |
Long-term debt obligations1 | | | 176,777 | | | | 42,493 | | | | 38,131 | | | | 36,254 | | | | 59,899 | |
| | | | | | | | | | | | | | | | | | | | |
Trust preferred securities1 | | | 14,715 | | | | 5,367 | | | | 2,731 | | | | 2,791 | | | | 3,826 | |
| | | | | | | | | | | | | | | | | | | | |
| Long-term financial liabilities designated at fair value through profit or loss2 | | | 13,539 | | | | 4,540 | | | | 2,881 | | | | 1,702 | | | | 4,417 | |
| | | | | | | | | | | | | | | | | | | | |
Finance lease obligations | | | 57 | | | | 10 | | | | 30 | | | | 7 | | | | 10 | |
| | | | | | | | | | | | | | | | | | | | |
Operating lease obligations | | | 5,051 | | | | 880 | | | | 1,369 | | | | 1,057 | | | | 1,745 | |
| | | | | | | | | | | | | | | | | | | | |
Purchase obligations | | | 2,386 | | | | 686 | | | | 1,180 | | | | 472 | | | | 48 | |
| | | | | | | | | | | | | | | | | | | | |
Long-term deposits1 | | | 35,245 | | | | — | | | | 12,152 | | | | 7,099 | | | | 15,994 | |
| | | | | | | | | | | | | | | | | | | | |
Other long-term liabilities | | | 5,457 | | | | 210 | | | | 194 | | | | 2,661 | | | | 2,392 | |
| | | | | | | | | | | | | | | | | | | | |
Total | | | 253,227 | | | | 54,184 | | | | 58,668 | | | | 52,043 | | | | 88,331 | |
| |
| 1 | Includes interest payments. |
| 2 | Long-term debt and long-term deposits designated at fair value through profit or loss. |
Figures above do not include the revenues of noncancelable sublease rentals of€ 190 million on operating leases. Purchase obligations for goods and services include future payments for, among other things, facility management, information technology and security settlement services. Some figures above for purchase obligations represent minimum contractual payments and actual future payments may be higher. Long-term deposits exclude contracts with a remaining maturity of less than one year. Under certain conditions future payments for some long-term financial liabilities designated at fair value through profit or loss may occur earlier. See the following notes to the consolidated financial statements for further information: Note 06 “Net Interest Income and Net Gains (Losses) on Financial Assets/Liabilities at Fair Value through Profit or Loss”, Note 24 “Leases”, Note 28 “Deposits” and Note 32 “Long-Term Debt and Trust Preferred Securities”.
| | | | |
| Deutsche Bank | | 01 – Management Report | | 42 |
| Financial Report 2012 | | Operating and Financial Review | | |
| | |
| | | | |
| | |
| | | | |
Events after the Reporting Date
All significant adjusting events that occurred after the reporting date were recognized in our results of operations, financial position and net assets.
| | | | |
| Deutsche Bank | | 01 – Management Report | | 43 |
| Financial Report 2012 | | Risk Report | | |
| | |
| | | | |
| | |
| | | | |
Risk Report
Introduction
Disclosures in line with IFRS 7 and IAS 1
The following Risk Report provides qualitative and quantitative disclosures about credit, market and other risks in line with the requirements of International Financial Reporting Standard 7 (IFRS 7) Financial Instruments: Disclosures, and capital disclosures required by International Accounting Standard 1 (IAS 1) Presentation of Financial Statements. Information which forms part of and is incorporated by reference into the financial statements of this report is marked by a bracket in the margins throughout this Risk Report.
Disclosures according to Pillar 3 of the Basel Capital Framework
In previous years (since 2008), the Pillar 3 disclosures had been provided in separate Pillar 3 Reports. Starting with year-end 2012, the risk report also incorporates the Pillar 3 disclosures resulting from the revised international capital adequacy standards as recommended by the Basel Committee on Banking Supervision (Basel 2), including the amendments for trading book and securitization positions as applicable since December 31, 2011 (Basel 2.5). The European Union enacted the Capital Requirements Directive 3, which adopted the Basel 2.5 capital framework in Europe. Germany adopted the Capital Requirements Directive 3 into national law and revised the disclosure requirements related to Pillar 3 in Section 26a of the German Banking Act (“Kreditwesengesetz” or “KWG”) and in Part 5 of the German Regulation on Solvency (“Solvabilitätsverordnung”, “Solvency Regulation” or “SolvV”).
Per regulation it is not required to audit Pillar 3 disclosures. As such certain Pillar 3 disclosures are labeled unaudited.
We have applied the revised capital framework for the majority of our risk exposures on the basis of internal models for measuring credit risk, market risk and operational risk, as approved by the German Federal Financial Supervisory Authority (Bundesanstalt für Finanzdienstleistungsaufsicht, referred to as “BaFin”). All Pillar 3 relevant disclosures are compiled based upon a set of internally defined principles and related processes as stipulated in our applicable Pillar 3 disclosure policy.
| | | | |
| Deutsche Bank | | 01 – Management Report | | 44 |
| Financial Report 2012 | | Risk Report | | |
| | |
| | | | |
| | |
| | | | |
The following table provides the location of the Pillar 3 disclosure topics in this Risk Report.
Pillar 3 disclosures in our Financial Report
| | |
| Pillar 3 Disclosure topic | | Where to find in our Financial Report |
| Introduction and Scope of Application of Pillar 3 | | “Introduction” |
| Capital Adequacy | | “Regulatory Capital” |
| Risk and Capital Management of the Group | | “Risk Management Executive Summary”, “Risk Management Principles”, “Risk Strategy and Appetite”, “Risk Inventory”, “Risk Management Tools”, “Capital Management”, “Balance Sheet Management” and “Overall Risk Position” |
Counterparty Credit Risk: Strategy and Processes Counterparty Credit Risk: Regulatory Assessment | | “Credit Risk”, “Asset Quality”, “Counterparty Credit Risk: Regulatory Assessment” and Note 01 “Significant Accounting Policies” |
| Securitization | | “Securitization” and Note 01 “Significant Accounting Policies” |
Trading Market Risk Nontrading Market Risk | | “Trading Market Risk”, “Nontrading Market Risk”, “Accounting and Valuation of Equity Investments” and Note 02 “Critical Accounting Estimates – Methods of Determining Fair Value” |
| Operational Risk | | “Operational Risk” |
| Liquidity Risk | | “Liquidity Risk” |
Disclosures according to principles and recommendations of the Enhanced Disclosure Task Force (EDTF)
In 2012 the Enhanced Disclosure Task Force (“EDTF”) was established as a private sector initiative under the auspice of the Financial Stability Board, with the primary objective to develop fundamental principles for enhanced risk disclosures and to recommend improvements to existing risk disclosures. As a member of the EDTF we implemented many of the disclosure recommendations in this Risk Report, with further enhancements being considered for 2013.
General Approach
The sections on qualitative and quantitative risk disclosures provide a comprehensive view on the risk profile of Deutsche Bank Group. All quantitative information generally reflects Deutsche Bank Group including Postbank for the reporting dates December 31, 2012 and December 31, 2011.
With the legally enforceable domination agreement between Deutsche Bank and Postbank in place since September 2012, Postbank´s risk management function has been functionally integrated in our risk function, e.g., regarding functional reporting lines, joint committee structure and group-wide policies. Statements regarding risk management hence always refer to the Group including Postbank. In limited instances where differing approaches remain or where a consolidated view for quantitative information cannot be presented, this is separately highlighted.
Scope of Consolidation
The following sections providing quantitative information refer to our financial statements in accordance with International Financial Reporting Standards. Consequently, the reporting is generally based on the IFRS principles of valuation and consolidation. However, in particular for Pillar 3 purposes, regulatory principles of consolidation are relevant which differ from those applied for our financial statements and are described in more detail below. Where the regulatorily relevant scope is used this is explicitly stated.
| | | | |
| Deutsche Bank | | 01 – Management Report | | 45 |
| Financial Report 2012 | | Risk Report | | |
| | |
| | | | |
| | |
| | | | |
Scope of the Regulatory Consolidation
Deutsche Bank Aktiengesellschaft (“Deutsche Bank AG”), headquartered in Frankfurt am Main, Germany, is the parent institution of the Deutsche Bank group of institutions (the “regulatory group”), which is subject to the supervisory provisions of the KWG and the SolvV. Under Section 10a KWG, a regulatory group of institutions consists of a credit institution (also referred to as a “bank”) or financial services institution, as the parent company, and all other banks, financial services institutions, investment management companies, financial enterprises, payment institutions and ancillary services enterprises which are subsidiaries in the meaning of Section 1 (7) KWG. Such entities are fully consolidated for our regulatory reporting. Additionally certain companies which are not subsidiaries can be included on a pro-rata basis. Insurance companies and companies outside the finance sector are not consolidated in the regulatory group of institutions.
For financial conglomerates, however, insurance companies are included in an additional capital adequacy calculation (also referred to as “solvency margin”). We have been designated by the BaFin as a financial conglomerate in October 2007.
The regulatory principles of consolidation are not identical to those applied for our financial statements. Nonetheless, the majority of subsidiaries according to the KWG are also fully consolidated in accordance with IFRS in our consolidated financial statements.
The main differences between regulatory and accounting consolidation are:
| — | | Entities which are controlled by us but do not belong to the banking industry, do not form part of the regulatory group of institutions, however are included in the consolidated financial statements according to IFRS. |
| — | | Most of our Special Purpose Entities (“SPEs”) consolidated under IFRS do not meet the specific consolidation requirements pursuant to Section 10a KWG and are consequently not consolidated within the regulatory group. However, the risks resulting from our exposures to such entities are reflected in the regulatory capital requirements. |
| — | | Some entities included in the regulatory group are not consolidated for accounting purposes but are treated differently, in particular using the equity method of accounting. There are two entities within our regulatory group which are jointly controlled by its owners and consolidated on a pro-rata basis. One entity is voluntarily consolidated on a pro-rata basis. All three entities are treated according to the equity method of accounting in our financial statements. |
As of year-end 2012, our regulatory group comprised 913 subsidiaries, of which 3 were consolidated on a pro-rata basis. Our regulatory group comprised 137 credit institutions, 3 payment institutions, 80 financial services institutions, 514 financial enterprises, 14 investment management companies and 165 ancillary services enterprises.
As of year-end 2011, our regulatory group comprised 1,027 subsidiaries, of which 3 were consolidated on a pro-rata basis. The regulatory group comprised 152 credit institutions, 2 payment institutions, 93 financial services institutions, 627 financial enterprises, 14 investment management companies and 139 ancillary services enterprises.
131 entities were exempted from regulatory consolidation pursuant to Section 31 (3) KWG as per year end 2012 (year end 2011: 102 entities). Section 31 (3) KWG allows the exclusion of small entities in the regulatory scope of application from consolidated regulatory reporting if either their total assets are below€ 10 million or below 1 % of total assets. None of these entities need to be consolidated in our financial statements in accordance with IFRS. The book values of our participations in their equity were deducted from our regulatory capital, in total€ 31 million as per year end 2012 (year end 2011:€12 million).
The same deduction treatment was applied to a further 267 unconsolidated (in the meaning of regulatory consolidation) entities and three immaterial insurance entities, not included in the solvency margin, which we
| | | | |
| Deutsche Bank | | 01 – Management Report | | 46 |
| Financial Report 2012 | | Risk Report | | |
| | |
| | | | |
| | |
| | | | |
deducted from our regulatory capital pursuant to Section 10 (6) KWG. Section 10 (6) No. 1, 2, 3 and 5 KWG requires the deduction of participating interests in unconsolidated banking, financial and insurance entities from regulatory capital when more than 10 % of the capital is held (in case of insurance entities, 20 % of either the capital or voting rights unless included in the solvency margin calculation of the financial conglomerate). Since we are classified as a financial conglomerate, material investments in insurance entities amounting to at least 20 % of capital or voting rights are not deducted from our regulatory capital as they are included in our solvency calculation at the financial conglomerate level.
Risk Management Executive Summary
The overall focus of Risk and Capital Management in 2012 was on strengthening our capital base and supporting our strategic initiatives whilst maintaining our risk profile in line with our risk strategy.
Overall Risk Assessment
Key risk categories for us include credit risk, market risk, operational risk, business risk (including tax and strategic risk), reputational risk and liquidity risk. We manage the identification, assessment and mitigation of top and emerging risks through a rigorous governance process and robust risk management tools and processes. Our proactive approach to identification and impact assessment aims to ensure that we mitigate the impact of these risks on our financial results, long term strategic goals and reputation.
As part of our regular risk and cross-risk analysis, sensitivities of the key portfolio risks are reviewed through a bottom-up risk assessment and through a top-down macro-economic and political scenario analysis. This two-pronged approach allows us to capture risks that have an impact across our risk inventories and business divisions or those that are relevant only to specific portfolios.
Current portfolio wide risks on which we have been focused in 2012 include: the potential escalation of the European sovereign debt crisis, the impact of a potential US fiscal austerity shock, a potential slowdown in Asian growth and the potential risk of a steep oil price increase resulting from a geopolitical shock. These risks have been a consistent focus throughout recent quarters. The assessment of the potential impacts of these risks has been made through integration into our group-wide stress tests which assess our ability to absorb these events should they occur. The results of these tests showed that we currently have adequate capital and liquidity reserves to absorb the impact of these risks if they were to materialize.
The year 2012 has continued to see increased regulation in the financial services industry. We are also focused on ensuring that we act proactively to identify potential political and regulatory changes and assess the possible impact on our business model or processes. We have a dedicated function which oversees and coordinates the proactive identification, assessment and implementation of requirements due to new regulation including the participation in numerous consultation processes.
As part of our overall capital strategy, assets and portfolios deemed as non strategic or in some cases underperforming have been moved to a newly created Non-Core Operations Unit (NCOU). This division actively oversees, manages and drives an accelerated de-risking program aligned with our externally announced strategic targets. Assets assigned to this unit are managed consistently and in accordance with our risk framework and principles.
Credit Risk Summary
| — | | Adherence to our core credit principles of proactive and prudent risk management has enabled us to weather a sustained volatile macro-economic credit environment over 2012 and has contributed to the containment of loan losses. This has been achieved by application of our existing risk management philosophy of conservative underwriting standards, active concentration risk management and risk mitigation strategies including collateral, hedging, netting and credit support arrangements. |
| | | | |
| Deutsche Bank | | 01 – Management Report | | 47 |
| Financial Report 2012 | | Risk Report | | |
| | |
| | | | |
| | |
| | | | |
| — | | Credit exposure remained diversified by region, industry and counterparty. Regional exposure is evenly spread across our key markets (Germany 27 %, Rest of Western Europe 28 % and North America 30 %) and has been stable year on year. Our largest industry exposure is to Banks and Insurances, which constitutes 33 % of overall gross exposures (i.e., before consideration of collateral) and was€ 359 billion, a decline of€ 17.3 billion from December 31, 2011, when it represented 34 % of gross exposures. These exposures are predominantly with highly rated counterparties and generally are collateralized. On a counterparty level we remained well diversified with our top ten exposures representing 11 % on a gross basis, all with highly rated investment-grade counterparties and including structured trades with high risk mitigation. |
| — | | The economic capital usage for credit risk totaled€ 12.6 billion at year-end 2012. The decrease of€ 238 million, or 2 %, compared to€ 12.8 billion at year-end 2011, mainly reflected overall exposure reduction. |
| — | | Provision for credit losses decreased in 2012 by€ 118 million to€ 1.7 billion. This decrease excludes the effect of Postbank releases related to loan loss allowances recorded prior to consolidation of€ 157 million and€ 402 million in 2012 and 2011 respectively. The impact of such releases is reported as interest income on group level. Adjusted for this accounting effect, our provision for credit losses in 2012 would have been€ 1.6 billion reflecting an increase of€ 126 million compared to the prior year. |
| — | | Our overall loan book as of December 31, 2012 decreased to€ 402 billion versus€ 417 billion as of December 31, 2011. Reductions were mainly driven by focused de-risking in the newly established NCOU. Our single largest industry category loan book is Household mortgages equating to€ 142 billion as of December 31, 2012, with€ 112 billion of these in the stable German market. Our corporate loan book, which accounts for 55 % of the total loan book, is composed 66 % of loans with an investment-grade rating as of December 31, 2012, increased from 64 % as of December 31, 2011 driven by a heavier weighting of reductions to non investment-grade counterparties. |
Market Risk Summary
| — | | Nontrading market risk economic capital usage totaled€ 8.5 billion as of December 31, 2012, which is€ 1.2 billion, or 17 %, above our economic capital usage at year-end 2011. The increase was largely driven by the extension of nontrading market risk economic capital coverage to include material credit spread risks from the banking book. |
| — | | The economic capital usage for trading market risk was€ 4.7 billion at year-end 2012, and decreased by€ 34 million, or 1 % compared to prior year end. The materially unchanged economic capital usage for trading market risk reflected offsetting effects of methodology refinements and exposure reductions. |
| — | | The average value-at-risk of our trading units was€ 57.1 million in 2012, compared to€ 72.7 million per 2011. The decrease was driven primarily by a broad risk reduction across most asset classes, but also partly due to the benefit of lower levels of market data volatility. |
Operational Risk Summary
| — | | The economic capital usage for operational risk increased by€ 172 million, or 3.5 %, to€ 5 billion as of December 31, 2012. The increase is primarily due to higher industry operational risk loss experience and the integration of BHF-BANK into our Advanced Measurement Approach (AMA) model in the first quarter 2012. Our regulatory capital continues to include the safety margin applied in our AMA model, which was implemented in 2011 to cover unforeseen legal risks from the current financial crisis. |
| — | | Internal operational risk losses increased in 2012 compared to prior year driven by increased litigation provisions relating to events over the past decade. |
Liquidity Risk Summary
| — | | Liquidity reserves as of December 31, 2012 were€ 232.2 billion (now including€ 25.9 billion from Postbank following integration). Excluding Postbank (which was not included as of December 31, 2011), our liquidity reserves decreased by€ 16.4 billion over the year. The primary driver of this was a reduction of€ 40 billion in our discretionary wholesale funding during the year, offset by growth in more stable funding sources. Overall our liquidity risk profile remains within our liquidity risk appetite, as confirmed by all year-end stress tests resulting in a net liquidity surplus. |
| | | | |
| Deutsche Bank | | 01 – Management Report | | 48 |
| Financial Report 2012 | | Risk Report | | |
| | |
| | | | |
| | |
| | | | |
| — | | Our 2012 issuance activities amounted to€ 17.9 billion. This compares to our full year plan of€ 15-20 billion. |
| — | | 62 % of our overall funding came from the most stable funding sources, comprising capital markets and equity, retail, and transaction banking liabilities. |
Capital Management Summary
| — | | The Common Equity Tier 1 capital ratio in accordance with Basel 2.5 amounted to 11.4 % based on Common Equity Tier 1 capital of€ 38.0 billion and risk-weighted assets of€ 334 billion. This compares to a Common Equity Tier 1 capital ratio of 9.5 % at year-end 2011 based on Common Equity Tier 1 capital of€ 36.3 billion and risk-weighted assets of€ 381.2 billion. |
| — | | Risk-weighted assets decreased in 2012 by€ 47.6 billion to€ 334 billion at the end of 2012, reflecting de-risking activities as well as model and process improvements. |
| — | | The newly established NCOU division has contributed to significant de-risking. The overall de-risking achieved by the NCOU in 2012 resulted in a reduction in total assets adjusted of€ 35 billion (27 %) from€ 130 billion as of December 31, 2011 to€ 95 billion as of December 31, 2012. |
| — | | The internal capital adequacy ratio, signifying whether the total capital supply is sufficient to cover the capital demand determined by our risk positions, increased to 160 % as of December 31, 2012, compared to 159 % as of December 31, 2011. |
| — | | As at December 31, 2012, our pro forma, fully loaded Basel 3 Common Equity Tier 1 capital ratio was 7.8 %, comprising€ 31 billion Common Equity Tier 1 capital and€ 401 billion risk-weighted assets. |
Balance Sheet Management Summary
| — | | As of December 31, 2012, our adjusted leverage ratio was 21, unchanged from the level at the end of 2011 and below our target leverage ratio of 25. Our leverage ratio calculated as the ratio of total assets under IFRS to total equity under IFRS was 37 as of December 31, 2012, a slight decrease compared to end of 2011. |
Risk Management Principles
We actively take risks in connection with our business and as such the following principles underpin risk management within our group:
| — | | Risk is taken within a defined risk appetite; |
| — | | Every risk taken needs to be approved within the risk management framework; |
| — | | Risk taken needs to be adequately compensated; and |
| — | | Risk should be continuously monitored and managed. |
A strong risk culture helps reinforce our resilience by encouraging a holistic approach to the management of risk and return throughout our organization as well as the effective management of our risk, capital and reputational profile. The management of risk is the responsibility of all employees. We expect employees to exhibit behaviors that maintain a strong risk culture and assess them for this as part of the overall performance and compensation process. Strong risk culture behaviors include:
| — | | Being fully responsible for our risks; |
| — | | Being rigorous, forward looking and comprehensive in the assessment of risk; |
| — | | Inviting, providing and respecting challenges; |
| — | | Trouble shooting collectively; and |
| — | | Placing Deutsche Bank and its reputation at the heart of all decisions. |
| | | | |
| Deutsche Bank | | 01 – Management Report | | 49 |
| Financial Report 2012 | | Risk Report | | |
| | |
| | | | |
| | |
| | | | |
To reinforce these behaviors we have launched a number of group-wide activities, including mandatory trainings on risk awareness. We also have regular communications, including from our Board members, on the importance of a strong Risk Culture.
Risk Management Framework
The diversity of our business model requires us to identify, measure, aggregate and manage our risks effectively, and to allocate our capital among our businesses appropriately. We operate as an integrated group through our divisions, business units and infrastructure functions. Risk and capital are managed via a framework of principles, organizational structures and measurement and monitoring processes that are closely aligned with the activities of the divisions and business units:
| | | | |
— | | Core risk management responsibilities are embedded in the Management Board and appropriately delegated to senior risk management committees responsible for execution and oversight. The Supervisory Board regularly monitors the risk and capital profile. | | |
— | | We operate a three-line of defense risk management model whereby front office functions, risk management oversight and assurance roles are played by functions independent of one another. | | |
— | | Risk strategy is approved by the Management Board on an annual basis and is defined based on the Group Strategic and Capital Plan and Risk Appetite in order to ensure alignment of risk, capital and performance targets. | | |
— | | Cross-risk analysis reviews are conducted across the group to validate that sound risk management practices and a holistic awareness of risk exist. | | |
— | | All major risk classes are managed in a coordinated manner via risk management processes, including: credit risk, market risk, operational risk, liquidity risk, business risk, reputational risk and risk concentrations. | | |
— | | Appropriate monitoring, stress testing tools and escalation processes are in place for key capital and liquidity thresholds and metrics. Where applicable modeling and measurement approaches for quantifying risk and capital demand are implemented across the major risk classes. | | |
| — | | Effective systems, processes and policies are a critical component of our risk management capability. | | |
Risk Governance From a supervisory perspective, our operations throughout the world are regulated and supervised by relevant authorities in each of the jurisdictions in which we conduct business. Such regulation focuses on licensing, capital adequacy, liquidity, risk concentration, conduct of business as well as organisation and reporting requirements. The BaFin and the Deutsche Bundesbank (the German central bank) act in cooperation as our primary supervisors to ensure our compliance with the German Banking Act and other applicable laws and regulations. The German Banking Act and the rules and regulations thereunder implement, in addition, certain recommendations of the Basel Committee on Banking Supervision, as well as certain European Union directives relating to banks. German banking regulators assess our capacity to assume risk in several ways, which are described in more detail in section “Regulatory Capital”. From an internal governance perspective, we have several layers of robust management to provide strong and cohesive risk governance: | | |
| — | | The Supervisory Board monitors our risk and capital profile regularly via its designated committee, the Risk Committee of the Supervisory Board. The chair of the Risk Committee reports on items discussed during the Risk Committee’s meetings to the Supervisory Board. | | |
| — | | The Risk Committee of the Supervisory Board meets regularly. At these meetings, the Management Board reports to the Risk Committee on credit, market, country, liquidity, operational, strategic, regulatory as well as litigation and reputational risks. It also reports on loans requiring a Supervisory Board resolution pursuant to law or the Articles of Association, questions of capital resources and matters of special importance due to the risks they entail. The Risk Committee deliberates with the Management Board on issues of the aggregate risk disposition and the risk strategy. | | |
| | | | |
| Deutsche Bank | | 01 – Management Report | | 50 |
| Financial Report 2012 | | Risk Report | | |
| | |
| | | | |
| | |
| | | | |
| | | | | | |
| | | | — | | | Our Management Board provides overall risk and capital management supervision for the consolidated Group and is exclusively responsible for day-to-day management of the company with the objective of creating sustainable value in the interest of our shareholders, employees and other stakeholders. The Management Board is responsible for defining and implementing comprehensive and aligned business and risk strategies, as well as ensuring well-defined risk management functions and operating processes are in place to ensure that our overall performance is aligned to our business and risk strategy. The Management Board has delegated certain functions and responsibilities to relevant senior governance committees to support the fulfillment of these responsibilities, in particular to the Capital and Risk Committee (“CaR”) and Risk Executive Committee (“Risk ExCo”) whose roles are described in more detail below. |
| | | | | | For further information on how we ensure that our overall performance is aligned to our risk strategy please refer to section below “Risk Strategy and Appetite” |
| | | | | | | Chart: Risk Management Governance Structure of the Deutsche Bank Group. |
| | | | | | | 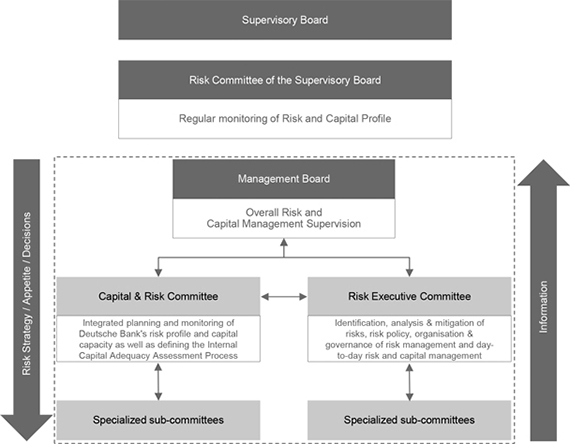 |
| | | | The following functional committees are central to the management of Risk in Deutsche Bank: |
| | | | — | | | The CaR oversees and controls integrated planning and monitoring of our risk profile and capital capacity, providing an alignment of risk appetite, capital requirements and funding/liquidity needs with Group, divisional and sub-divisional business strategies. It provides a platform to discuss and agree strategic issues impacting capital, funding and liquidity among Risk Management, Finance and the business divisions. The CaR initiates appropriate actions and/or makes recommendations to the Management Board. It is also responsible for monitoring our risk profile against our risk appetite on a regular basis and ensuring appropriate escalation or actions are taken. The CaR monitors the performance of our risk profile against early warning indicators and recovery triggers, and provides recommendations to the Management Board to invoke defined process and/or actions under the recovery governance framework if required. |
| | | | |
| Deutsche Bank | | 01 – Management Report | | 51 |
| Financial Report 2012 | | Risk Report | | |
| | |
| | | | |
| | |
| | | | |
| | | | |
— | | Our Risk ExCo, as the most senior functional committee of our risk management, identifies controls and manages all risks including risk concentrations at group level, and is a center of expertise concerning all risk related topics of the business divisions. It is responsible for risk policy, the organization and governance of risk management and ensures and oversees the execution of risk and capital management including identification, analysis and risk mitigation, within the scope of the risk and capital strategy (Risk and Capital Demand Plan) approved by the Management Board. The Risk ExCo is supported by sub-committees that are responsible for dedicated areas of risk management, including several policy committees, the Cross Risk Review Committee (“CRRC”) and the Group Reputational Risk Committee (“GRRC”). | | |
— | | The CRRC supports the Risk ExCo and the CaR with particular emphasis on the management of group-wide risk patterns. The CRRC, under a delegation of authority from the CaR has responsibility for the day-to-day oversight and control of our Internal Capital Adequacy Assessment Process (“ICAAP”). The CRRC also oversees the inventory of stress tests used for managing our risk appetite, reviews the results and proposes management action, if required. It monitors the effectiveness of the stress test process and drives continuous improvement of our stress testing framework. It is supported by a dedicated Stress Testing Oversight Committee which has the responsibility for the definition of the group-wide stress test scenarios, ensuring common standards and consistent scenarios across risk types, and reviewing the group-wide stress test results. | | |
Recovery management governance is part of our overall risk management framework to support that we can proactively identify and respond to severe stress or the threat of a severe stress. The key elements of the recovery management planning and governance include: | | |
| — | | Clear roles and responsibilities which include Management Board oversight; | | |
| — | | A dedicated set of early warning indicators and recovery triggers to monitor potential risks and stimulate management action; | | |
| — | | An enhanced regime of severe stress tests and defined strategic recovery measures to enable proactive management of our risk profile; and | | |
| — | | A dedicated sub-committee of the CaR to ensure ongoing monitoring and process readiness. | | |
Multiple members of the CaR are also members of the Risk ExCo which facilitates a constant and comprehensive information flow between the two committees. Following changes to the structure and composition of our Management Board in 2012, the coverage of risks has been more widely distributed at the level of the Management Board, as the following risk management units, which previously had reported directly to the Chief Risk Officer, now report to other Management Board members: Compliance, Corporate Security & Business Continuity, Government & Regulatory Affairs, Legal and Treasury. Our Chief Risk Officer (“CRO”), who is a member of the Management Board, remains responsible for the identification, assessment and reporting of risks arising within operations across all business and all risk types as well as for the direct management responsibility of the following Risk management divisions: Credit Risk Management, Market Risk Management, Operational Risk Management and Strategic Risk and Enterprise-wide Risk Management. Our governance structure and mechanisms ensure that group wide oversight of risk continues unchanged. With respect to the day-to-day management and oversight of risk, there are dedicated Risk and Treasury units established with the mandate to: | | |
| — | | Ensure that the business conducted within each division is consistent with the risk appetite that the CaR has set within a framework established by the Management Board; | | |
| — | | Formulate and implement risk and capital management policies, procedures and methodologies that are appropriate to the businesses within each division; | | |
| — | | Approve credit, market and liquidity risk limits; | | |
| | | | |
| Deutsche Bank | | 01 – Management Report | | 52 |
| Financial Report 2012 | | Risk Report | | |
| | |
| | | | |
| | |
| | | | |
| | |
— Conduct periodic portfolio reviews to ensure that the portfolio of risks is within acceptable parameters; and |
— Develop and implement risk and capital management infrastructures and systems that are appropriate for each division. |
The Deputy Chief Risk Officer (“DCRO”) leads a Strategic Risk and Enterprise-wide Risk Management function whose mandate is to provide an increased focus on holistic risk management and comprehensive, cross-risk oversight to further enhance our risk portfolio steering. The objectives of the Strategic Risk and Enterprise-wide Risk Management unit are to: — Drive key strategic cross-risk initiatives and establish greater cohesion between defining portfolio strategy and governing execution, including regulatory adherence; — Provide a strategic and forward-looking perspective on the key risk issues for discussion at senior levels within the bank (risk appetite, stress testing framework); — Strengthen risk culture in the bank; and — Foster the implementation of consistent risk management standards. |
Our Finance and Audit departments operate independently of both, our business divisions and of our Risk function. The role of the Finance department is to help quantify and verify the risk that we assume and ensure the quality and integrity of our risk-related data. Our Audit department performs risk-based reviews of the design and operating effectiveness of our system of internal controls. Based on the domination agreement, we have introduced further changes to the governance of the Risk functions across Deutsche Bank and Postbank. The main changes were: |
— Functional reporting lines from the Postbank Risk Management to Deutsche Bank Risk Management have been established. These changes did not affect the disciplinary reporting lines within the Postbank CRO organization; — Postbank’s key risk committees were enlarged with voting members from Deutsche Bank from the respective risk functions and vice versa; and — Key group risk policies have been implemented at Postbank. The key risk management committees of Postbank, in all of which Postbank’s Chief Risk Officer as well as senior risk managers of Deutsche Bank are voting members, are: — The Bank Risk Committee, which advises Postbank’s Management Board with respect to the determination of overall risk appetite and risk allocation; — The Credit Risk Committee, which is responsible for limit allocation and the definition of an appropriate limit framework; — The Market Risk Committee, which decides on limit allocations as well as strategic positioning of Postbank’s banking and trading book and the management of liquidity risk; and — The Operational Risk Committee which defines the appropriate risk framework as well as the capital allocation for the individual business areas. |
| | | |
Risk Reporting and Measurement Systems We have centralized risk data and systems supporting regulatory reporting and external disclosures, as well as internal management reporting for credit, market, operational and liquidity risk. The risk infrastructure incorporates the relevant legal entities and business divisions and provides the basis for tailor-made reporting on risk positions, capital adequacy and limit utilization to the relevant functions on a regular and ad-hoc basis. Established units within Finance and Risk assume responsibility for measurement, analysis and reporting of risk while ensuring sufficient quality and integrity of risk-related data. The main reports on risk and capital management that are used to provide the central governance bodies with information relating to Group Risk Exposures are the following: — Our Risk and Capital Profile is presented monthly to the CaR and the Management Board and is subsequently submitted to the Risk Committee of the Supervisory Board for information. It comprises an overview of the current risk, capital and liquidity status of the Group, also incorporating information on regulatory capital and economic capital adequacy. |
| | | | |
| Deutsche Bank | | 01 – Management Report | | 53 |
| Financial Report 2012 | | Risk Report | | |
| | |
| | | | |
| | |
| | | | |
| — | | An overview of our capital, liquidity and funding is presented to the CaR by the Group Treasurer every month. It comprises information on key metrics including Core Tier 1 capital (under Basel 3 Common Equity Tier 1 capital) and the leverage ratio, as well as an overview of our current funding and liquidity status, the liquidity stress test results and contingency measures. |
| — | | Group-wide macro stress tests are performed quarterly and reported to the CaR. These are supplemented, as required, by ad-hoc stress tests at Group level. |
The above reports are complemented by a suite of other standard and ad-hoc management reports of Risk and Finance, which are presented to several different senior committees responsible for risk and capital management at Group level.
Risk Strategy and Appetite
Strategic and Capital Planning Process
We conduct an annual strategic planning process which underpins the development of our future strategic direction as a group and for our business areas/units. This process consists of a number of different phases.
In a first phase, our risk appetite and key targets for profit and loss (including revenues and costs), capital supply, and capital demand and the key business areas for the three coming years are discussed in the Group Executive Committee and approved by the Management Board, based on our global macro-economic outlook and the expected regulatory framework.
In a second phase, the top-down objectives are substantiated from the bottom-up by detailed business unit plans, which for the first year consist of a month by month operative plan; years two and three are annual plans in the appropriate granularity. The proposed bottom-up plans are reviewed and challenged by Finance (Group Strategic and Capital Planning) and Risk (Strategic Risk and Enterprise-wide Risk Management) and are discussed individually with business heads. Thereby, the specifics of the business are considered and concrete targets decided in line with our strategic direction.
The Strategic and Capital Plan is presented to the Group Executive Committee and the Management Board for discussion and approval before the end of the year. At the beginning of the next year, the final plan is presented to the Supervisory Board.
A dedicated Risk and Capital Demand Plan is an integral part of the Strategic and Capital plan. It is designed to support our vision of being a leading client-centric global universal bank and aims to ensure:
| — | | balanced risk adjusted performance across business areas and units; |
| — | | high risk management standards with focus on risk concentrations; |
| — | | compliance with regulatory requirements; |
| — | | strong capital and liquidity position; and |
| — | | stable funding and liquidity strategy allowing for the business planning within the liquidity risk tolerance and regulatory requirements. |
The Strategic and Capital Planning process allows us to:
| — | | set earnings and key risk and capital adequacy targets considering the bank’s strategic focus and business plans; |
| | | | |
| Deutsche Bank | | 01 – Management Report | | 54 |
| Financial Report 2012 | | Risk Report | | |
| | |
| | | | |
| | |
| | | | |
| — | | assess our risk-bearing capacity with regard to internal and external requirements (i.e., regulatory and economic capital); and |
| — | | apply an appropriate stress test to assess the impact on capital demand, capital supply and liquidity. |
The specific limits are derived from the Strategic and Capital Plan to ensure alignment of risk, capital and performance targets at all levels of the organization.
The targets are monitored on an ongoing basis in appropriate management committees. Any projected shortfall from targets is discussed together with potential mitigating strategies seeking to ensure that we remain on track to achieve our targets.
In September 2012, we communicated a new strategic direction “Strategy 2015+”. With our business franchises strengthened, we aspire a strong capital position of above 10 % Common Equity Tier 1 Ratio by first quarter 2015, under full application of Basel 3 rules. This goal is based on retained earnings assumptions, reflecting not only strong revenue generation in targeted growth areas but also on the delivery of our announced Operational Excellence Program to target annual cost savings of€ 4.5 billion by 2015, achieving a cost-income ratio of below 65 % for our core businesses. Our capital ratio target is further supported by risk reduction measures, notably in our NCOU. Our ambition level for our post-tax RoE is above 15 % for our core operations and 12 % for the Group.
After achieving a Basel 3 pro-forma fully loaded Common Equity Tier 1 ratio of 7.8 % by year-end 2012, ahead of our stated target of 7.2 %, we also revised our March 31, 2013 target from above 8.0 % to 8.5 %, primarily driven by lower capital demand.
Note that like other banks, we are making statements in terms of Basel 3 ratios, which are non-GAAP financial measures when rules are still being finalized by legislators, and regulatory guidance on implementation is incomplete. The targets and estimates reflect our current reading of the draft legislation as well as a clear commitment to meaningful further improvements in our capital ratios.
Risk Profile
Our mix of various business activities implies diverse risk taking by our business divisions. The key risks inherent in their respective business models are best measured through the undiversified Total Economic Capital metric, which mirrors each business division’s risk profile before cross-risk effects on group level.
Risk profile of our corporate divisions as measured by total economic capital
| | | | | | | | | | | | | | | | | | | | | | | | | | | | | | | | |
| | | Dec 31, 2012 | |
| | | Corporate
Banking &
Securities | | | Global
Transaction
Banking | | | Asset &
Wealth
Management | | | Private &
Business
Clients | | | Non-Core
Operations
Unit | | | Consoli-
dation &
Adjustments | | | | | | Total | |
| in % (unless stated otherwise) | | | | | | | | | | | | | | | | | | | | in € m. | | | in % | |
| | | | | | | | | | | | | | | | | | | | | | | | | | | | | | | | |
Credit Risk | | | 17 | | | | 5 | | | | 1 | | | | 13 | | | | 8 | | | | 0 | | | | 12,574 | | | | 44 | |
| | | | | | | | | | | | | | | | | | | | | | | | | | | | | | | | |
Market Risk | | | 14 | | | | 1 | | | | 5 | | | | 11 | | | | 10 | | | | 5 | | | | 13,185 | | | | 46 | |
| | | | | | | | | | | | | | | | | | | | | | | | | | | | | | | | |
Operational Risk | | | 7 | | | | 0 | | | | 2 | | | | 1 | | | | 7 | | | | – | | | | 5,018 | | | | 17 | |
| | | | | | | | | | | | | | | | | | | | | | | | | | | | | | | | |
Diversification Benefit | | | (5) | | | | (0) | | | | (1) | | | | (2) | | | | (6) | | | | (0) | | | | (4,435) | | | | (15) | |
| | | | | | | | | | | | | | | | | | | | | | | | | | | | | | | | |
Business Risk | | | 8 | | | | – | | | | 0 | | | | – | | | | – | | | | – | | | | 2,399 | | | | 8 | |
| | | | | | | | | | | | | | | | | | | | | | | | | | | | | | | | |
Total EC in€ m. | | | 11,788 | | | | 1,434 | | | | 2,016 | | | | 6,720 | | | | 5,452 | | | | 1,331 | | | | 28,741 | | | | 100 | |
in % | | | 41 | | | | 5 | | | | 7 | | | | 23 | | | | 19 | | | | 5 | | | | 100 | | | | | |
| |
Corporate Banking & Securities’ (CB&S) risk profile is dominated by its trading activities, in particular market risk from position taking and credit risk primarily from derivatives exposure. Further credit risks originate from lending to corporates and financial institutions. The remainder is divided equally between operational risks and business risk, primarily from potential legal and earnings volatility risks, respectively. Global Transaction Banking (GTB) has the lowest risk (as measured by economic capital) of all our segments. GTB’s focus on trade finance implies that the vast majority of its risk originates from credit with a small portion from market risk mainly in derivatives positions.
| | | | |
| Deutsche Bank | | 01 – Management Report | | 55 |
| Financial Report 2012 | | Risk Report | | |
| | |
| | | | |
| | |
| | | | |
The main risk driver of Asset & Wealth Management’s (AWM) business are guarantees on investment funds, which we report as nontrading market risk. Otherwise AWM’s advisory and commission focused business attracts primarily operational risk.
In contrast to this, Private & Business Client’s (PBC) risk profile divides equally between credit risk from retail and SME lending and nontrading market risk from Postbank’s investment portfolio.
Risk Appetite
Risk appetite is an expression of the maximum level of risk that we are prepared to accept in order to achieve our business objectives. Our risk appetite statement translates our strategy into measurable short to medium term targets and thresholds across material risk categories and enables intra-year performance monitoring and management which aims to identify optimal growth options considering the risk involved and the allocation of available capital resources to drive sustainable performance.
The Management Board reviews and approves the risk appetite on an annual basis to ensure that it is consistent with our Group strategy, business environment and stakeholder requirements. Setting risk appetite aims to ensure that risk is proactively managed to the level desired and approved by the Management Board. Risk appetite tolerance levels are set at different trigger levels, with clearly defined escalation requirements which enable appropriate actions to be defined and implemented as required. In cases where the tolerance levels are breached, it is the responsibility of the Strategic Risk and Enterprise-wide Risk Management function to bring it to the attention of the respective risk committees, and ultimately to the Chief Risk Officer and the Management Board.
Amendments to the risk and capital strategy must be approved by the Chief Risk Officer or the full Management Board, depending on significance.
Risk Inventory
We face a variety of risks as a result of our business activities, the most significant of which are described below. Credit risk, market risk and operational risk attract regulatory capital. As part of our internal capital adequacy assessment process, we calculate the amount of economic capital that is necessary to cover all material risks generated from our business activities, other than of liquidity risk.
Credit Risk
Credit risk arises from all transactions where actual, contingent or potential claims against any counterparty, borrower or obligor (which we refer to collectively as “counterparties”) exist, including those claims that we plan to distribute (see below in the more detailed section Credit Risk). These transactions are typically part of our traditional nontrading lending activities (such as loans and contingent liabilities), or our direct trading activity with clients (such as OTC derivatives, FX forwards and Forward Rate Agreements). We distinguish between three kinds of credit risk:
| — | | Default risk, the most significant element of credit risk, is the risk that counterparties fail to meet contractual obligations in relation to the claims described above; |
| — | | Settlement risk is the risk that the settlement or clearance of a transaction may fail. Settlement risk arises whenever the exchange of cash, securities and/or other assets is not simultaneous leaving us exposed to a potential loss should the counterparty default; |
| — | | Country risk is the risk that we may experience unexpected default or settlement risk and subsequent losses, in a given country, due to a range of macro-economic or social events primarily affecting counterparties |
| | | | |
| Deutsche Bank | | 01 – Management Report | | 56 |
| Financial Report 2012 | | Risk Report | | |
| | |
| | | | |
| | |
| | | | |
| | |
in that jurisdiction including: a material deterioration of economic conditions, political and social upheaval, nationalisation and expropriation of assets, government repudiation of indebtedness, or disruptive currency depreciation or devaluation. Country risk also includes transfer risk which arises when debtors are unable to meet their obligations owing to an inability to transfer assets to non-residents due to direct sovereign intervention. Market Risk Market risk arises from the uncertainty concerning changes in market prices and rates (including interest rates, equity prices, foreign exchange rates and commodity prices), the correlations among them and their levels of volatility. We differentiate between three different types of market risk: — Trading market risk arises primarily through the market-making activities of the Corporate Banking & Securities division (CB&S). This involves taking positions in debt, equity, foreign exchange, other securities and commodities as well as in equivalent derivatives. — Trading default risk arises from defaults and rating migrations relating to trading instruments. — Nontrading market risk arises from market movements, primarily outside the activities of our trading units, in our banking book and from off-balance sheet items. This includes interest rate risk, credit spread risk, investment risk and foreign exchange risk as well as market risk arising from our pension schemes, guaranteed funds and equity compensation. Nontrading market risk also includes risk from the modeling of client deposits as well as savings and loan products. Operational Risk Operational risk is the potential for failure (including the legal component) in relation to employees, contractual specifications and documentation, technology, infrastructure failure and disasters, external influences and customer relationships. Operational risk excludes business and reputational risk. Liquidity Risk Liquidity risk is the risk arising from our potential inability to meet all payment obligations when they come due or only being able to meet these obligations at excessive costs. |
| | | |
Business Risk Business risk describes the risk we assume due to potential changes in general business conditions, such as our market environment, client behavior and technological progress. This can affect our results if we fail to adjust quickly to these changing conditions. In 2012, we introduced an enhanced economic capital model to improve coverage of strategic risk being a subcategory of business risk. In addition to the above risks, we face a number of other types of risks, such as reputational risk, insurance-specific risk and concentration risk. They are substantially related to one or more of the above risk types. Reputational Risk Within our risk management processes, we define reputational risk as the risk that publicity concerning a transaction, counterparty or business practice involving a client will negatively impact the public’s trust in our organization. Our reputational risk is governed by the Reputational Risk Management Program (RRM Program). The RRM Program was established to provide consistent standards for the identification, escalation and resolution of reputational risk issues that arise from transactions with clients or through different business activities. Primary responsibility for the identification, escalation and resolution of reputational risk issues resides with the business divisions. Each employee is under an obligation, within the scope of his/her activities, to analyse and assess any imminent or intended transaction in terms of possible risk factors in order to minimise reputational risks. If a potential reputational risk is identified, it must be referred for further consideration at a sufficiently senior level within that respective business division. If issues remain, they should then be escalated for discussion |
| | | | |
| Deutsche Bank | | 01 – Management Report | | 57 |
| Financial Report 2012 | | Risk Report | | |
| | |
| | | | |
| | |
| | | | |
among appropriate senior members of the relevant Business and Control Groups. Reputational risk issues not addressed to satisfactory conclusion through such informal discussions must then be escalated for further review and final determination via the established reputational risk escalation process.
As a subcommittee of the Risk ExCo, the Group Reputational Risk Committee (“GRRC”) provides review and final determinations on all reputational risk issues and new client adoptions, where escalation of such issues is deemed necessary by senior Business and Regional Management, or required under the Group policies and procedures.
Insurance Specific Risk
Our exposure to insurance risk relates to Abbey Life Assurance Company Limited and our defined benefit pension obligations. There is also some insurance-related risk within the Pensions & Insurance Risk Markets business. In our risk management framework, we consider insurance-related risks primarily as nontrading market risks. We monitor the underlying assumptions in the calculation of these risks regularly and seek risk mitigating measures such as reinsurances, if we deem this appropriate. We are primarily exposed to the following insurance-related risks.
| — | | Longevity risk: the risk of faster or slower than expected improvements in life expectancy on immediate and deferred annuity products. |
| — | | Mortality and morbidity risks: the risks of a higher or lower than expected number of death or disability claims on assurance products and of an occurrence of one or more large claims. |
| — | | Expenses risk: the risk that policies cost more or less to administer than expected. |
| — | | Persistency risk: the risk of a higher or lower than expected percentage of lapsed policies. |
To the extent that actual experience is less favorable than the underlying assumptions, or it is necessary to increase provisions due to more onerous assumptions, the amount of capital required in the insurance entities may increase.
Risk Concentration
Risk concentrations refer to a loss potential resulting from an unbalanced distribution of dependencies on specific risk drivers and can occur within specific risk types (i.e., intra-risk concentrations) as well as across different risk types (inter-risk concentrations). They are encountered within and across counterparties, businesses, regions/countries, legal entities, industries and products, impacting the aforementioned risks. The management of risk concentrations is integrated in the management of the individual risk types and monitored on a regular basis. The key objective of managing risk concentrations is to avoid any undue concentrations in our portfolio, which we seek to achieve through a quantitative and qualitative approach, as follows:
| — | | Intra-risk concentrations are assessed and monitored by the individual risk disciplines (Credit, Market, Operational Risk Management and others). This is supported by limit setting on different levels according to risk type. |
| — | | Inter-risk concentrations are managed by quantitative top-down stress-testing and qualitative bottom-up reviews identifying and assessing risk themes independent of any risk type and providing a holistic view across the bank. |
The most senior governance body for the oversight of risk concentrations is the Cross Risk Review Committee, which is a subcommittee of the Capital and Risk Committee (CaR) and the Risk Executive Committee (Risk ExCo).
| | | | |
| Deutsche Bank | | 01 – Management Report | | 58 |
| Financial Report 2012 | | Risk Report | | |
| | |
| | | | |
| | |
| | | | |
Risk Management Tools
We use a broad range of quantitative and qualitative methodologies for assessing and managing risks. As a matter of policy, we continually assess the appropriateness and the reliability of our quantitative tools and metrics in light of our changing risk environment. Some of these tools are common to a number of risk categories, while others are tailored to the particular features of specific risk categories. The advanced internal tools and metrics we currently use to measure, manage and report our risks are:
| — | | RWA equivalent. This is defined as total risk-weighted assets (“RWA”) plus a theoretical amount for specific allocated Common Equity Tier 1 capital deduction items if these were converted into RWA. RWA form the key factor in determining the bank’s regulatory Capital Adequacy as reflected in the Common Equity Tier 1 capital ratio. RWA equivalents are used to set targets for the growth of our businesses and monitored within our management reporting systems. As a general rule, RWA are calculated in accordance with the currently valid “Basel 2.5” European (CRD) and German legislation (SolvV). However, we also perform additional RWA equivalent calculations under pro-forma Basel 3 rules to support for use within our forward looking risk and capital planning processes. |
| — | | Expected loss. We use expected loss as a measure of our credit and operational risk. Expected loss is a measurement of the loss we can expect induced by defaults within a one-year period from these risks as of the respective reporting date, based on our historical loss experience. When calculating expected loss for credit risk, we take into account credit risk ratings, collateral, maturities and statistical averaging procedures to reflect the risk characteristics of our different types of exposures and facilities. All parameter assumptions are based on statistical averages of up to nine years based on our internal default and loss history as well as external benchmarks. We use expected loss as a tool of our risk management process and as part of our management reporting systems. We also consider the applicable results of the expected loss calculations as a component of our collectively assessed allowance for credit losses included in our financial statements. For operational risk we determine the expected loss from statistical averages of our internal loss history, recent risk trends as well as forward looking estimates. |
| — | | Return on risk-weighted assets (“RoRWA”). In times of regulatory capital constraints, RoRWA has become an important metric to assess our client relationships’ profitability, in particular for credit risk. RoRWA is currently the primary performance measure and as such attracts more attention than the previously used RARoC profitability measure based on economic capital. |
| — | | Value-at-risk. We use the value-at-risk approach to derive quantitative measures for our trading book market risks under normal market conditions. Our value-at-risk figures play a role in both internal and external (regulatory) reporting. For a given portfolio, value-at-risk measures the potential future loss (in terms of market value) that, under normal market conditions, is not expected to be exceeded with a defined confidence level in a defined period. The value-at-risk for a total portfolio represents a measure of our diversified market risk (aggregated, using pre-determined correlations) in that portfolio. |
| — | | Economic capital. Economic capital measures the amount of capital we need to absorb very severe unexpected losses arising from our exposures. “Very severe” in this context means that economic capital is set at a level to cover with a probability of 99.98 % the aggregated unexpected losses within one year. We calculate economic capital for the default, transfer and settlement risk elements of credit risk, for market risk including trading default risk, for operational risk and for business risk. |
| — | | Stress testing. Credit, market and operational risk as well as liquidity risk are subject to a program of regular stress tests. The stress testing framework at Group level comprises regular group-wide stress tests based on a series of benchmark and more severe macroeconomic global downturn scenarios (provided by dbResearch) consistently applied across all risk types, annual reverse and capital plan relevant stress test as well as ad-hoc scenarios. The hot spots of the downturn scenarios are changing over time according to the changes in economic and political environment around the globe. Prior to the assessment of the stress impact the scenarios are discussed and approved by the appropriate governance committees. In addition, since 2012, the stress program feeds into our Living Wills recovery planning project by assessing the stress impact on specifically defined recovery triggers for a range of near-default scenarios before and after the application of recovery measures. In detail, we assess a suite of recovery triggers under stress. |
| | | | |
| Deutsche Bank | | 01 – Management Report | | 59 |
| Financial Report 2012 | | Risk Report | | |
| | |
| | | | |
| | |
| | | | |
| | | (Common Equity Tier 1 (“CET1”) capital ratio, Internal Capital Adequacy (“ICA”) ratio, Net Liquidity Position (“NLP”) within the regularly performed benchmark and more severe group-wide stress tests and compare them to the Red-Amber-Green (“RAG”) levels as defined in our risk appetite. The respective RAG levels in normal, warning, crisis situation are defined for CET1 capital ratio [>6.5 %, 6.5 % … 5 %, <5 %], for ICA [>135 %, 135 % … 120 %, <120 %] and for NLP [>€ 5 bn,€ 5 bn …€ 0 bn, <€ 0 bn]. For all of the above stress tests, we were able to return to ‘green’ RAG levels for all recovery triggers after the application of recovery measures. |
| — | | We also supplement our risk type specific analysis of credit, market, operational and liquidity risk with stress testing. For credit risk management purposes, we perform stress tests to assess the impact of changes in general economic conditions or specific parameters on our credit exposures or parts thereof as well as the impact on the creditworthiness of our portfolio. For market risk management purposes, we perform stress tests because value-at-risk calculations are based on relatively recent historical data, only purport to estimate risk up to a defined confidence level and assume good asset liquidity. Therefore, they only reflect possible losses under relatively normal market conditions. Stress tests help us determine the effects of potentially extreme market developments on the value of our market risk sensitive exposures, both on our highly liquid and less liquid trading positions as well as our investments. The correlations between market risk factors used in our current stress tests are estimated from historic volatile market conditions and proved to be consistent with those observed during recent periods of market stress. We use stress testing to determine the amount of economic capital we need to allocate to cover our market risk exposure under the scenarios of extreme market conditions we select for our simulations. For operational risk management purposes, we perform stress tests on our economic capital model to assess its sensitivity to changes in key model components, which include external losses. For liquidity risk management purposes, we perform stress tests and scenario analysis to evaluate the impact of sudden stress events on our liquidity position. |
Credit Risk
We measure and manage our credit risk using the following philosophy and principles:
| — | | Our credit risk management function is independent from our business divisions and in each of our divisions credit decision standards, processes and principles are consistently applied. |
| — | | A key principle of credit risk management is client credit due diligence. Prudent client selection is achieved in collaboration with our business division counterparts who stand as a first line of defence. |
| — | | We actively aim to prevent undue concentration and long tail-risks (large unexpected losses) by ensuring a diversified credit portfolio. Client, industry, country and product-specific concentrations are actively assessed and managed against our risk appetite. |
| — | | We maintain conservative underwriting standards and aim to avoid large directional credit risk on a counterparty and portfolio level. In this regard we are cautious in assuming unsecured cash positions and actively use hedging for risk mitigation purposes. Additionally we strive to secure our derivative portfolio through collateral agreements and may additionally hedge concentration risks to further mitigate credit risks from underlying market movements. |
| — | | Every extension of credit or material change to a credit facility (such as its tenor, collateral structure or major covenants) to any counterparty requires credit approval at the appropriate authority level. We assign credit approval authorities to individuals according to their qualifications, experience and training, and we review these periodically. |
| — | | We measure and consolidate all our credit exposures to each obligor on a global basis that applies across our consolidated Group, in line with regulatory requirements of the German Banking Act (Kreditwesengesetz). |
| — | | We manage credit exposures on the basis of the “one obligor principle”, under which all facilities to a group of borrowers which are linked to each other (e.g., by one entity holding a majority of the voting rights or capital of another) are consolidated under one group. |
| | | | |
| Deutsche Bank | | 01 – Management Report | | 60 |
| Financial Report 2012 | | Risk Report | | |
| | |
| | | | |
| | |
| | | | |
| | | | |
| | | — We have established within Credit Risk Management – where appropriate – specialized teams for deriving internal client ratings, analyzing and approving transactions, monitoring the portfolio and covering workout clients. The credit coverage for assets transferred to the NCOU utilizes the expertise of our credit organization. — Our credit lending activities are governed by our Principles for Managing Credit Risk. These principles define our general risk philosophy for credit risk and our methods to actively manage this risk. The principles define key organizational requirements, roles and responsibilities as well as process principles for credit risk management and are applicable to all lending activities undertaken by us. Credit Risk Ratings A basic and key element of the credit approval process is a detailed risk assessment of each credit-relevant counterparty. When rating a counterparty we apply in-house assessment methodologies, scorecards and for non-homogeneous portfolios our 26-grade rating scale for evaluating the credit-worthiness of our counterparties. The majority of our rating methodologies are authorized for use within the advanced internal rating based approach under applicable Basel rules. Our rating scale enables us to compare our internal ratings with common market practice and ensures comparability between different sub-portfolios of our institution. Several default ratings therein enable us to incorporate the potential recovery rate of unsecured defaulted counterparty exposures. We generally rate our counterparties individually, though certain portfolios of purchased or securitized receivables are rated on a pool basis. Ratings are required to be kept up-to-date and documented. In our retail business, creditworthiness checks and counterparty ratings of the homogenous portfolio are derived by utilizing an automated decision engine. The decision engine incorporates quantitative aspects (e.g., financial figures), behavioral aspects, credit bureau information (such as SCHUFA in Germany) and general customer data. These input factors are used by the decision engine to determine the creditworthiness of the borrower and, after consideration of collateral, the expected loss as well as the further course of action required to process the ultimate credit decision. The established rating procedures we have implemented in our retail business are based on multivariate statistical methods and are used to support our individual credit decisions for this portfolio as well as managing the overall retail portfolio. The algorithms of the rating procedures for all counterparties are recalibrated frequently on the basis of the default history as well as other external and internal factors and expert judgments. Postbank makes use of internal rating systems authorized for use within the foundation internal rating based approach under Basel 2. All internal ratings and scorings are based on a uniform master scale, which assigns each rating or scoring result to the default probability determined for that class. Risk governance is provided by a joint risk committee structure with members from both Postbank and Deutsche Bank. |
| | | | | |
| | Rating Governance All of our rating methodologies, excluding Postbank, have to be approved by the Group Credit Policy Committee (“GCPC”), a sub-committee of the Risk Executive Committee, before the methodologies are used for credit decisions and capital calculation for the first time or before they are significantly changed. Regulatory approval may be required in addition. The results of the regular validation processes as stipulated by internal policies have to be brought to the attention of the GCPC, even if the validation results do not lead to a change. The validation plan for rating methodologies is presented to GCPC at the beginning of the calendar year and a status update is given on a quarterly basis. For Postbank, responsibility for implementation and monitoring of internal rating systems effectiveness rests with Postbank’s Risk Analytics unit and Postbank’s validation committee, chaired by Postbank’s Chief Credit Risk Officer. All rating systems are subject to Postbank’s Management Board approval. Effectiveness of rating systems and rating results are reported to the Postbank Management Board on a regular basis. Via a cross committee membership of Deutsche Bank senior managers join in Postbank committees and vice versa, a joint governance is ensured. |
| | | | |
| Deutsche Bank | | 01 – Management Report | | 61 |
| Financial Report 2012 | | Risk Report | | |
| | |
| | | | |
| | |
| | | | |
Credit Risk Measures
The key credit risk measures we apply for managing our credit portfolio, including in transaction approval and the setting of risk appetite, are internal limits and credit exposure under these limits. Credit limits set forth maximum credit exposures we are willing to assume over specified periods. In determining the credit limit for a counterparty, we consider the counterparty’s credit quality by reference to our internal credit rating. Credit limits and credit exposure are both measured on a gross and net basis where net is derived by deducting hedges and certain collateral from respective gross figures. For derivatives, we look at current market values and the potential future exposure over the lifetime of a transaction. We generally also take into consideration the risk-return characteristics of individual transactions and portfolios.
Credit Approval and Authority
Credit limits are established by the Credit Risk Management function via the execution of assigned credit authorities. Credit approvals are documented by the signing of the credit report by the respective credit authority holders and retained for future reference.
Credit authority is generally assigned to individuals as personal credit authority according to the individual’s professional qualification and experience. All assigned credit authorities are reviewed on a periodic basis to ensure that they are adequate to the individual performance of the authority holder. The results of the review are presented to the Group Credit Policy Committee.
Where an individual’s personal authority is insufficient to establish required credit limits, the transaction is referred to a higher credit authority holder or where necessary to an appropriate credit committee such as the CIB Underwriting Committee. Where personal and committee authorities are insufficient to establish appropriate limits the case is referred to the Management Board for approval.
Credit Risk Mitigation
In addition to determining counterparty credit quality and our risk appetite, we also use various credit risk mitigation techniques to optimize credit exposure and reduce potential credit losses. Credit risk mitigants, described more fully below, are applied in the following forms:
| — | | Comprehensive and enforceable credit documentation with adequate terms and conditions. |
| — | | Collateral held as security to reduce losses by increasing the recovery of obligations. |
| — | | Risk transfers, which shift the probability of default risk of an obligor to a third party including hedging executed by our Credit Portfolio Strategies Group. |
| — | | Netting and collateral arrangements which reduce the credit exposure from derivatives and repo- and repo-style transactions. |
Collateral Held as Security
We regularly agree on collateral to be received from or to be provided to customers in contracts that are subject to credit risk. Collateral is security in the form of an asset or third-party obligation that serves to mitigate the inherent risk of credit loss in an exposure, by either substituting the borrower default risk or improving recoveries in the event of a default. While collateral can be an alternative source of repayment, it generally does not replace the necessity of high quality underwriting standards.
We segregate collateral received into the following two types:
| — | | Financial and other collateral, which enables us to recover all or part of the outstanding exposure by liquidating the collateral asset provided, in cases where the borrower is unable or unwilling to fulfil its primary obligations. Cash collateral, securities (equity, bonds), collateral assignments of other claims or inventory, equipment (e.g., plant, machinery and aircraft) and real estate typically fall into this category. |
| | | | |
| Deutsche Bank | | 01 – Management Report | | 62 |
| Financial Report 2012 | | Risk Report | | |
| | |
| | | | |
| | |
| | | | |
| | |
— Guarantee collateral, which complements the borrower’s ability to fulfil its obligation under the legal contract and as such is provided by third parties. Letters of credit, insurance contracts, export credit insurance, guarantees and risk participations typically fall into this category. |
| | | |
Our processes seek to ensure that the collateral we accept for risk mitigation purposes is high quality. This includes seeking to have in place legally effective and enforceable documentation for realizable and measureable collateral assets which are frequently evaluated by dedicated teams. The assessment of the suitability of collateral for a specific transaction is part of the credit decision and must be accounted for in a conservative way, including collateral haircuts that are applied. We have collateral type specific haircuts in place which are regularly reviewed and approved. In this regard, we strive to avoid “wrong-way” risk characteristics where the borrower’s counterparty risk is positively correlated with the risk of deterioration in the collateral value. For guarantee collateral the analysis of the guarantor’s creditworthiness is aligned to the credit assessment process for borrowers. |
Risk Transfers Risk transfers to third parties form a key part of our overall risk management process and are executed in various forms, including outright sales, single name and portfolio hedging, and securitizations. Risk transfers are conducted by the respective business units and by our Credit Portfolio Strategies Group (CPSG), in accordance with specifically approved mandates. CPSG focuses on managing the residual credit risk of loans and lending-related commitments of the international investment-grade portfolio; the leveraged portfolio and the medium-sized German companies’ portfolio within our CB&S Corporate Division. Acting as a central pricing reference, CPSG provides the respective CB&S Division businesses with an observed or derived capital market rate for loan applications; however, the decision of whether or not the business can enter into the credit risk remains exclusively with Credit Risk Management. CPSG is concentrating on two primary objectives within the credit risk framework to enhance risk management discipline, improve returns and use capital more efficiently: — to reduce single-name credit risk concentrations within the credit portfolio and — to manage credit exposures actively by utilizing techniques including loan sales, securitization via collateralized loan obligations, default insurance coverage and single-name and portfolio credit default swaps. |
Netting and Collateral Arrangements for Derivatives Netting is predominantly applicable to OTC derivative transactions as outlined below. Netting is also applied to securities financing transactions as far as documentation, structure and nature of the risk mitigation allow netting with the underlying credit risk. |
| | | |
| In order to reduce the credit risk resulting from OTC derivative transactions, where OTC clearing is not available, we regularly seek the execution of standard master agreements (such as master agreements for derivatives published by the International Swaps and Derivatives Association, Inc. (ISDA) or the German Master Agreement for Financial Derivative Transactions) with our clients. A master agreement allows the netting of rights and obligations arising under derivative transactions that have been entered into under such a master agreement upon the counterparty’s default, resulting in a single net claim owed by or to the counterparty (“close-out netting”). For parts of the derivatives business (e.g., foreign exchange transactions) we also enter into master agreements under which we set off amounts payable on the same day in the same currency and in respect to transactions covered by such master agreements (“payment netting”), reducing our settlement risk. In our risk measurement and risk assessment processes we apply netting only to the extent we have satisfied ourselves of the legal validity and enforceability of the master agreement in all relevant jurisdictions. |
| | | | |
| Deutsche Bank | | 01 – Management Report | | 63 |
| Financial Report 2012 | | Risk Report | | |
| | |
| | | | |
| | |
| | | | |
Also, we enter into credit support annexes (“CSA”) to master agreements in order to further reduce our derivatives-related credit risk. These annexes generally provide risk mitigation through periodic, usually daily, margining of the covered exposure. The CSAs also provide for the right to terminate the related derivative transactions upon the counterparty’s failure to honour a margin call. As with netting, when we believe the annex is enforce-able, we reflect this in our exposure measurement.
Certain CSAs to master agreements provide for rating dependent triggers, where additional collateral must be pledged if a party’s rating is downgraded. We also enter into master agreements that provide for an additional termination event upon a party’s rating downgrade. These downgrading provisions in CSAs and master agreements usually apply to both parties but may seldom apply to us only. We analyze and monitor our potential contingent payment obligations resulting from a rating downgrade in our stress testing approach for liquidity risk on an ongoing basis. For an assessment of the quantitative impact of a downgrading of our credit rating please refer to table “Stress Testing Results” in the section “Liquidity Risk”.
Concentrations within Credit Risk Mitigation
Concentrations within credit risk mitigations taken may occur if a number of guarantors and credit derivative providers with similar economic characteristics are engaged in comparable activities with changes in economic or industry conditions affecting their ability to meet contractual obligations.
We use a comprehensive range of quantitative tools and metrics to monitor our credit risk mitigating activities. These also include monitoring of potential concentrations within collateral types supported by dedicated stress tests. For more qualitative and quantitative details in relation to the application of credit risk mitigation and potential concentration effects please refer to the section “Maximum Exposure to Credit Risk”.
Monitoring Credit Risk
Ongoing active monitoring and management of Deutsche Bank’s credit risk positions is an integral part of our credit risk management framework. The key monitoring focus is on quality trends and on concentrations along the dimensions of counterparty, industry, country and product-specific risks to avoid undue concentrations of credit risk. On a portfolio level, significant concentrations of credit risk could result from having material exposures to a number of counterparties with similar economic characteristics, or who are engaged in comparable activities, where these similarities may cause their ability to meet contractual obligations to be affected in the same manner by changes in economic or industry conditions.
Our portfolio management framework supports a comprehensive assessment of concentrations within our credit risk portfolio in order to keep concentrations within acceptable levels.
Counterparty Risk Management
Credit-related counterparties are principally allocated to credit officers within credit teams which are aligned to types of counterparty (such as financial institution, corporate or private individuals) or economic area (e.g., emerging markets) and dedicated rating analyst teams. The individual credit officers have the relevant expertise and experience to manage the credit risks associated with these counterparties and their associated credit related transactions. For retail clients credit decision making and credit monitoring is highly automated for efficiency reasons. Credit Risk Management has full oversight of the respective processes and tools used in the retail credit process. It is the responsibility of each credit officer to undertake ongoing credit monitoring for their allocated portfolio of counterparties. We also have procedures in place intended to identify at an early stage credit exposures for which there may be an increased risk of loss.
In instances where we have identified counterparties where problems might arise, the respective exposure is generally placed on a watch list. We aim to identify counterparties that, on the basis of the application of our risk management tools, demonstrate the likelihood of problems well in advance in order to effectively manage the credit exposure and maximize the recovery. The objective of this early warning system is to address potential problems while adequate options for action are still available. This early risk detection is a tenet of our credit culture and is intended to ensure that greater attention is paid to such exposures.
| | | | |
| Deutsche Bank | | 01 – Management Report | | 64 |
| Financial Report 2012 | | Risk Report | | |
| | |
| | | | |
| | |
| | | | |
| | |
Industry Risk Management To manage industry risk, we have grouped our corporate and financial institutions counterparties into various industry sub-portfolios. For each of these sub-portfolios an “Industry Batch report” is prepared usually on an annual basis. This report highlights industry developments and risks to our credit portfolio, reviews concentration risks, analyzes the risk/reward profile of the portfolio and incorporates an economic downside stress test. Finally, this analysis is used to define the credit strategies for the portfolio in question. The Industry Batch reports are presented to the Group Credit Policy Committee, a sub-committee of the Risk Executive Committee and are submitted afterwards to the Management Board. In accordance with an agreed schedule, a select number of Industry Batch reports are also submitted to the Risk Committee of the Supervisory Board. In addition to these Industry Batch reports, the development of the industry sub-portfolios is regularly monitored during the year and is compared to the approved sub-portfolio strategies. Regular overviews are prepared for the Group Credit Policy Committee to discuss recent developments and to agree on actions where necessary. |
| | | |
Country Risk Management Avoiding undue concentrations from a regional perspective is also an integral part of our credit risk management framework. In order to achieve this, country risk limits are applied to Emerging Markets as well as selected Higher Risk Developed Markets (based on internal country risk ratings). Emerging Markets are grouped into regions and for each region, as well as for the Higher Risk Developed Markets, a “Country Batch report” is prepared, usually on an annual basis. These reports assess key macroeconomic developments and outlook, review portfolio composition and concentration risks and analyse the risk/reward profile of the portfolio. Based on this, credit limits and strategies are set for key countries and, where relevant, for the region as a whole. Country risk limits are approved by either our Management Board or by our Cross Risk Review Committee, a sub-committee of our Risk Executive Committee and Capital and Risk Committee, pursuant to delegated authority. The Country Limit framework covers all major risk categories which are managed by the respective divisions in Risk: — Credit Risk: Limits are established for counterparty credit risk exposures in a given country to manage the aggregate credit risk subject to country-specific economic and political events. These limits include exposures to entities incorporated locally as well as subsidiaries of foreign multinational corporations. Separate Transfer Risk Limits are established as sub-limits to these counterparty credit limits and apply to Deutsche Bank’s cross-border exposures. — Market Risk: Limits are established to manage trading position risk in emerging markets and are set based on the P&L impact of potential stressed market events on those positions. — Treasury Risk: Exposures of one Deutsche Bank entity to another (Funding, Capital or Margin) are subject to limits given the transfer risk inherent in these cross-border positions. — Gap Risk: Limits established to manage the risk of loss due to intra-country wrong-way risk exposure. |
| | | | |
| Deutsche Bank | | 01 – Management Report | | 65 |
| Financial Report 2012 | | Risk Report | | |
| | |
| | | | |
| | |
| | | | |
Our country risk ratings represent a key tool in our management of country risk. They are established by the independent dbResearch function within Deutsche Bank and include:
| — | | Sovereign rating: A measure of the probability of the sovereign defaulting on its foreign or local currency obligations. |
| — | | Transfer risk rating: A measure of the probability of a “transfer risk event”, i.e., the risk that an otherwise solvent debtor is unable to meet his obligations due to inability to obtain foreign currency or to transfer assets as a result of direct sovereign intervention. |
| — | | Event risk rating: A measure of the probability of major disruptions in the market risk factors relating to a country (interest rates, credit spreads, etc.). Event risks are measured as part of our event risk scenarios, as described in the section “Market Risk Monitoring” of this report. |
All sovereign and transfer risk ratings are reviewed, at least annually, by the Cross Risk Review Committee, although more frequent reviews are undertaken when deemed necessary.
We charge our corporate divisions with the responsibility of managing their country risk within the approved limits. The regional units within Credit Risk Management monitor our country risk based on information provided by Risk Operations and our Finance function. The Cross Risk Review Committee also reviews data on transfer risk.
Postbank ratings are reviewed and adjusted if required by means of a rating tool on a monthly basis. Country risk limits and sovereign risk limits for all relevant countries are approved by the Postbank Management Board annually.
Product specific Risk Management
Complementary to our counterparty, industry and country risk approach, we focus on product specific risk concentrations and selectively set limits where required for risk management purposes. In this context a key focus is put on underwriting caps. These caps limit the combined risk for transactions where we underwrite commitments with the intention to sell down or distribute part of the risk to third parties. These commitments include the undertaking to fund bank loans and to provide bridge loans for the issuance of public bonds. The risk is that we may not be successful in the distribution of the facilities, meaning that we would have to hold more of the underlying risk for longer periods of time than originally intended. These underwriting commitments are additionally exposed to market risk in the form of widening credit spreads. We dynamically hedge this credit spread risk to be within the approved market risk limit framework.
Furthermore, we apply product-specific strategies setting our risk appetite for sufficiently homogeneous portfolios where tailored client analysis is secondary, such as the retail portfolios of mortgages, business and consumer finance products.
Settlement Risk Management
Our trading activities may give rise to risk at the time of settlement of those trades. Settlement risk arises when Deutsche Bank exchanges a like value of cash or other assets with a counterparty. It is the risk of loss due to the failure of a counterparty to honour its obligations (to deliver cash or other assets) to us, after we release payment or delivery of its obligations (of cash or other assets) to the counterparty.
For many types of transactions, we mitigate settlement risk by closing the transaction through a clearing agent, which effectively acts as a stakeholder for both parties, only settling the trade once both parties have fulfilled their sides of the contractual obligation.
| | | | |
| Deutsche Bank | | 01 – Management Report | | 66 |
| Financial Report 2012 | | Risk Report | | |
| | |
| | | | |
| | |
| | | | |
| | |
| Where no such settlement system exists, the simultaneous commencement of the payment and the delivery parts of the transaction is common practice between trading partners (free settlement). In these cases, we may seek to mitigate our settlement risk through the execution of bilateral payment netting agreements. We also participate in industry initiatives to reduce settlement risks. Acceptance of settlement risk on free settlement trades requires approval from our credit risk personnel, either in the form of pre-approved settlement risk limits, or through transaction-specific approvals. We do not aggregate settlement risk limits with other credit exposures for credit approval purposes, but we take the aggregate exposure into account when we consider whether a given settlement risk would be acceptable. |
| | | |
Credit Risk Tools – Economic Capital for Credit Risk We calculate economic capital for the default risk, country risk and settlement risk as elements of credit risk. In line with our economic capital framework, economic capital for credit risk is set at a level to absorb with a probability of 99.98 % very severe aggregate unexpected losses within one year. Full integration of Postbank into our economic capital calculation was achieved at the end of 2010. Our economic capital for credit risk is derived from the loss distribution of a portfolio via Monte Carlo Simulation of correlated rating migrations. The loss distribution is modeled in two steps. First, individual credit exposures are specified based on parameters for the probability of default, exposure at default and loss given default. In a second step, the probability of joint defaults is modeled through the introduction of economic factors, which correspond to geographic regions and industries. The simulation of portfolio losses is then performed by an internally developed model, which takes rating migration and maturity effects into account. Effects due to wrong-way derivatives risk (i.e., the credit exposure of a derivative in the default case is higher than in non default scenarios) are modeled by applying our own alpha factor when deriving the Exposure at Default for derivatives and securities financing transactions under the Basel 2 Internal Models Method (“IMM”). The alpha factor used for the risk-weighted assets calculation is floored at a level of 1.2 according to SolvV, for the internal economic capital calculation, in contrast, a floor of 1.0 applies. We allocate expected losses and economic capital derived from loss distributions down to transaction level to enable management on transaction, customer and business level. Credit Exposures Counterparty credit exposure arises from our traditional nontrading lending activities which include elements such as loans and contingent liabilities. Counterparty credit exposure also arises via our direct trading activity with clients in certain instruments which include OTC derivatives like FX forwards and Forward Rate Agreements. A default risk also arises from our positions in traded credit products such as bonds. We define our credit exposure by taking into account all transactions where losses might occur due to the fact that counterparties may not fulfil their contractual payment obligations. |
| | | |
Maximum Exposure to Credit Risk The maximum exposure to credit risk table shows the direct exposure before consideration of associated collateral held and other credit enhancements (netting and hedges) that do not qualify for offset in our financial statements for the periods specified. The netting credit enhancement component includes the effects of legally enforceable netting agreements as well as the offset of negative mark-to-markets from derivatives against pledged cash collateral. The collateral credit enhancement component mainly includes real estate, collateral in the form of cash as well as securities related collateral. In relation to collateral we apply internally determined haircuts and additionally cap all collateral values at the level of the respective collateralized exposure. |
| | | | |
| Deutsche Bank | | 01 – Management Report | | 67 |
| Financial Report 2012 | | Risk Report | | |
| | |
| | | | |
| | |
| | | | |
Maximum Exposure to Credit Risk
| | | | | | | | | | | | | | | | | | | | |
| Dec 31, 2012 | | Credit Enhancements | |
in€ m.1 | | Maximum
exposure
to credit risk2 | | | Netting | | | Collateral | | | Guarantees and
Credit derivatives3 | | | Total credit
enhancements | |
Due from banks | | | 27,885 | | | | – | | | | – | | | | 1 | | | | 1 | |
| | | | | | | | | | | | | | | | | | | | |
Interest-earning deposits with banks | | | 119,548 | | | | – | | | | 2 | | | | 35 | | | | 37 | |
| | | | | | | | | | | | | | | | | | | | |
| Central bank funds sold and securities purchased under resale agreements | | | 36,570 | | | | – | | | | 36,341 | | | | – | | | | 36,341 | |
| | | | | | | | | | | | | | | | | | | | |
Securities borrowed | | | 23,947 | | | | – | | | | 23,308 | | | | – | | | | 23,308 | |
| | | | | | | | | | | | | | | | | | | | |
| Financial assets at fair value through profit or loss4 | | | 1,119,100 | | | | 657,826 | | | | 211,397 | | | | 3,968 | | | | 873,191 | |
| | | | | | | | | | | | | | | | | | | | |
Financial assets available for sale4 | | | 47,110 | | | | – | | | | 1,287 | | | | 703 | | | | 1,990 | |
| | | | | | | | | | | | | | | | | | | | |
Loans5 | | | 401,975 | | | | – | | | | 208,529 | | | | 37,841 | | | | 246,370 | |
| | | | | | | | | | | | | | | | | | | | |
Other assets subject to credit risk | | | 85,806 | | | | 69,546 | | | | 6,653 | | | | 12 | | | | 76,211 | |
| | | | | | | | | | | | | | | | | | | | |
| Financial guarantees and other credit related contingent liabilities6 | | | 68,361 | | | | – | | | | 7,810 | | | | 8,444 | | | | 16,254 | |
| | | | | | | | | | | | | | | | | | | | |
| Irrevocable lending commitments and other credit related commitments6 | | | 129,657 | | | | – | | | | 4,771 | | | | 10,558 | | | | 15,329 | |
| | | | | | | | | | | | | | | | | | | | |
Maximum exposure to credit risk | | | 2,059,959 | | | | 727,372 | | | | 500,098 | | | | 61,562 | | | | 1,289,032 | |
| |
| 1 | All amounts at carrying value unless otherwise indicated. |
| 2 | Does not include credit derivative notional sold (€ 1,274,960 million) and credit derivative notional bought protection. Interest-earning deposits with banks mainly relate to Liquidity Reserves. |
| 3 | Credit derivatives are reflected with the notional of the underlying. |
| 4 | Excludes equities, other equity interests and commodities. |
| 5 | Gross loans less (deferred expense)/unearned income before deductions of allowance for loan losses. |
| 6 | Financial guarantees, other credit related contingent liabilities and irrevocable lending commitments (including commitments designated under the fair value option) are reflected at notional amounts. |
| | | | | | | | | | | | | | | | | | | | |
| Dec 31, 2011 | | Credit Enhancements | |
in€ m.1 | | Maximum
exposure
to credit risk2 | | | Netting | | | Collateral | | | Guarantees and
Credit derivatives3 | | | Total credit
enhancements | |
Due from banks | | | 15,928 | | | | – | | | | 1 | | | | – | | | | 1 | |
| | | | | | | | | | | | | | | | | | | | |
Interest-earning deposits with banks | | | 162,000 | | | | – | | | | 3 | | | | 147 | | | | 150 | |
| | | | | | | | | | | | | | | | | | | | |
| Central bank funds sold and securities purchased under resale agreements | | | 25,773 | | | | – | | | | 25,232 | | | | – | | | | 25,232 | |
| | | | | | | | | | | | | | | | | | | | |
Securities borrowed | | | 31,337 | | | | – | | | | 30,107 | | | | – | | | | 30,107 | |
| | | | | | | | | | | | | | | | | | | | |
| Financial assets at fair value through profit or loss4 | | | 1,204,412 | | | | 724,194 | | | | 205,210 | | | | 5,732 | | | | 935,136 | |
| | | | | | | | | | | | | | | | | | | | |
Financial assets available for sale4 | | | 42,296 | | | | – | | | | 2,392 | | | | 1,265 | | | | 3,657 | |
| | | | | | | | | | | | | | | | | | | | |
Loans5 | | | 416,676 | | | | – | | | | 203,364 | | | | 42,535 | | | | 245,899 | |
| | | | | | | | | | | | | | | | | | | | |
Other assets subject to credit risk | | | 88,221 | | | | 65,616 | | | | 9,995 | | | | 2 | | | | 75,613 | |
| | | | | | | | | | | | | | | | | | | | |
| Financial guarantees and other credit related contingent liabilities6 | | | 73,653 | | | | – | | | | 5,524 | | | | 7,521 | | | | 13,045 | |
| | | | | | | | | | | | | | | | | | | | |
| Irrevocable lending commitments and other credit related commitments6 | | | 127,995 | | | | – | | | | 715 | | | | 6,386 | | | | 7,101 | |
| | | | | | | | | | | | | | | | | | | | |
Maximum exposure to credit risk | | | 2,188,291 | | | | 789,810 | | | | 482,543 | | | | 63,588 | | | | 1,335,941 | |
| |
| 1 | All amounts at carrying value unless otherwise indicated. |
| 2 | Does not include credit derivative notional sold (€ 1,830,104 million) and credit derivative notional bought protection. Interest-earning deposits with banks mainly relate to liquidity reserves. |
| 3 | Credit derivatives are reflected with the notional of the underlying. |
| 4 | Excludes equities, other equity interests and commodities. |
| 5 | Gross loans less (deferred expense)/unearned income before deductions of allowance for loan losses. |
| 6 | Financial guarantees, other credit related contingent liabilities and irrevocable lending commitments (including commitments designated under the fair value option) are reflected at notional amounts. |
| | | | |
| Deutsche Bank | | 01 – Management Report | | 68 |
| Financial Report 2012 | | Risk Report | | |
| | |
| | | | |
| | |
| | | | |
| | | | | | | | | | | | | | | | | | | | | | | | | | | | | | | | |
| | | Included in the category of financial assets at fair value through profit or loss as of December 31, 2012, were€ 125 billion of securities purchased under resale agreements (€ 117 billion as of December 31, 2011) and€ 28 billion of securities borrowed (€ 27 billion as of December 31, 2011), both with limited net credit risk as a result of very high levels of collateral, as well as debt securities of€ 153 billion (€ 154 billion as of December 31, 2011) that are over 84 % investment grade (over 84 % as of December 31, 2011). The above mentioned financial assets available for sale category primarily reflected debt securities of which more than 95 % were investment grade (more than 93 % as of December 31, 2011). | |
| | | | | | | | | | | | | | | | | | | | | | | | | | | | | | | | |
| | The decrease in maximum exposure to credit risk for December 31, 2012 was predominantly driven by positive market values from derivatives (in financial assets at fair value through profit or loss) which decreased by€ 91 billion to€ 768 billion as of December 31, 2012 and interest-earning deposits with banks, which decreased by€ 42 billion and accounted for€ 120 billion exposure as of December 31, 2012. Credit Enhancements are split in three categories: netting, collateral, and guarantees and credit derivatives. A prudent approach is taken with respect to haircuts, parameter setting for regular margin calls as well as expert judgements for collateral to ensure that market developments do not lead to a build-up of uncollateralised exposures. All categories are monitored and reviewed regularly. Overall credit enhancements received are diversified and of adequate quality being largely cash, Group of Six government bonds and third-party guarantees mostly from well rated banks and insurance companies (including Monoline insurers which are discussed in more detail in section “Financial Position – Exposure to Monoline Insurers”). These financial institutions are mainly domiciled in Western European countries and the United States. Furthermore we obtain collateral pools of highly liquid assets and mortgages (principally consisting of residential properties mainly in Germany) for the homogeneous retail portfolio. | |
| | | | | | | | | | | | | | | | | | | | | | | | | | | | | | | | | |
| | | Credit Quality of Financial Instruments neither Past Due nor Impaired We generally derive our credit quality from internal ratings and group our exposures into classes as shown below. Credit Quality of Financial Instruments neither Past Due nor Impaired | |
| | | | | Dec 31, 2012 | |
| | | in€ m.1 | | | iAAA-iAA | | | | iA | | | | iBBB | | | | iBB | | | | iB | | |
| iCCC
and below |
| | | Total | |
| | | Due from banks | | | 24,957 | | | | 1,528 | | | | 989 | | | | 193 | | | | 171 | | | | 47 | | | | 27,885 | |
| | | | | | | | | | | | | | | | | | | | | | | | | | | | | | | |
| | | Interest-earning deposits with banks | | | 110,051 | | | | 7,238 | | | | 1,369 | | | | 746 | | | | 79 | | | | 65 | | | | 119,548 | |
| | | | | | | | | | | | | | | | | | | | | | | | | | | | | | | |
| | | Central bank funds sold and securities purchased under resale agreements | | | 1,605 | | | | 32,560 | | | | 1,332 | | | | 877 | | | | 140 | | | | 56 | | | | 36,570 | |
| | | | | | | | | | | | | | | | | | | | | | | | | | | | | | | |
| | | Securities borrowed | | | 14,668 | | | | 7,322 | | | | 1,213 | | | | 438 | | | | 306 | | | | – | | | | 23,947 | |
| | | | | | | | | | | | | | | | | | | | | | | | | | | | | | | |
| | | Financial assets at fair value through profit or loss2 | | | 348,329 | | | | 551,300 | | | | 98,274 | | | | 90,853 | | | | 23,260 | | | | 7,084 | | | | 1,119,100 | |
| | | | | | | | | | | | | | | | | | | | | | | | | | | | | | | |
| | | Financial assets available for sale2 | | | 30,077 | | | | 8,303 | | | | 4,076 | | | | 1,913 | | | | 515 | | | | 1,964 | | | | 46,848 | |
| | | | | | | | | | | | | | | | | | | | | | | | | | | | | | | |
| | | Loans3 | | | 51,853 | | | | 52,568 | | | | 99,683 | | | | 129,516 | | | | 38,935 | | | | 13,110 | | | | 385,665 | |
| | | | | | | | | | | | | | | | | | | | | | | | | | | | | | | |
| | | Other assets subject to credit risk | | | 6,469 | | | | 40,113 | | | | 2,687 | | | | 35,128 | | | | 1,299 | | | | 110 | | | | 85,806 | |
| | | | | | | | | | | | | | | | | | | | | | | | | | | | | | | |
| | | Financial guarantees and other credit related contingent liabilities4 | | | 9,064 | | | | 19,192 | | | | 21,304 | | | | 11,460 | | | | 4,886 | | | | 2,455 | | | | 68,361 | |
| | | | | | | | | | | | | | | | | | | | | | | | | | | | | | | |
| | | Irrevocable lending commitments and other credit related commitments4 | | | 20,233 | | | | 37,456 | | | | 37,754 | | | | 22,631 | | | | 10,068 | | | | 1,515 | | | | 129,657 | |
| | | | | | | | | | | | | | | | | | | | | | | | | | | | | | | |
| | | Total | | | 617,306 | | | | 757,580 | | | | 268,681 | | | | 293,755 | | | | 79,659 | | | | 26,406 | | | | 2,043,387 | |
| | | | |
| | | 1 All amounts at carrying value unless otherwise indicated. 2 Excludes equities, other equity interests and commodities. 3 Gross loans less (deferred expense)/unearned income before deductions of allowance for loan losses. 4 Financial guarantees, other credit related contingent liabilities and irrevocable lending commitments (including commitments designated under the fair value option) are reflected at notional amounts. | |
| | | | |
| Deutsche Bank | | 01 – Management Report | | 69 |
| Financial Report 2012 | | Risk Report | | |
| | |
| | | | |
| | |
| | | | |
| | | | | | | | | | | | | | | | | | | | | | | | | | | | | | |
| | | Dec 31, 2011 | |
| in€ m.1 | | | iAAA-iAA | | | | iA | | | | iBBB | | | | iBB | | | | iB | | |
| iCCC
and below |
| | | Total | |
Due from banks | | | 12,851 | | | | 1,021 | | | | 791 | | | | 1,187 | | | | 78 | | | | – | | | | 15,928 | |
| | | | | | | | | | | | | | | | | | | �� | | | | | | | | | |
Interest-earning deposits with banks | | | 149,285 | | | | 7,982 | | | | 1,692 | | | | 2,747 | | | | 145 | | | | 149 | | | | 162,000 | |
| | | | | | | | | | | | | | | | | | | | | | | | | | | | |
| Central bank funds sold and securities purchased under resale agreements | | | 9,010 | | | | 11,604 | | | | 3,994 | | | | 1,097 | | | | 60 | | | | 8 | | | | 25,773 | |
| | | | | | | | | | | | | | | | | | | | | | | | | | | | |
Securities borrowed | | | 25,323 | | | | 3,697 | | | | 1,613 | | | | 566 | | | | 138 | | | | – | | | | 31,337 | |
| | | | | | | | | | | | | | | | | | | | | | | | | | | | |
| Financial assets at fair value through profit or loss2 | | | 503,403 | | | | 492,467 | | | | 107,143 | | | | 73,098 | | | | 14,953 | | | | 13,348 | | | | 1,204,412 | |
| | | | | | | | | | | | | | | | | | | | | | | | | | | | |
Financial assets available for sale2 | | | 22,824 | | | | 8,673 | | | | 5,407 | | | | 2,955 | | | | 528 | | | | 1,357 | | | | 41,744 | |
| | | | | | | | | | | | | | | | | | | | | | | | | | | | |
Loans3 | | | 66,822 | | | | 59,737 | | | | 97,116 | | | | 119,631 | | | | 37,923 | | | | 18,698 | | | | 399,927 | |
| | | | | | | | | | | | | | | | | | | | | | | | | | | | |
Other assets subject to credit risk | | | 13,980 | | | | 22,998 | | | | 8,100 | | | | 42,200 | | | | 556 | | | | 387 | | | | 88,221 | |
| | | | | | | | | | | | | | | | | | | | | | | | | | | | |
| Financial guarantees and other credit related contingent liabilities4 | | | 6,535 | | | | 24,409 | | | | 21,003 | | | | 13,986 | | | | 6,051 | | | | 1,669 | | | | 73,653 | |
| | | | | | | | | | | | | | | | | | | | | | | | | | | | |
| Irrevocable lending commitments and other credit related commitments4 | | | 21,152 | | | | 37,895 | | | | 36,659 | | | | 21,066 | | | | 9,152 | | | | 2,071 | | | | 127,995 | |
| | | | | | | | | | | | | | | | | | | | | | | | | | | | |
Total | | | 831,186 | | | | 670,483 | | | | 283,518 | | | | 278,533 | | | | 69,584 | | | | 37,687 | | | | 2,170,991 | |
| |
| 1 | All amounts at carrying value unless otherwise indicated. Numbers for 2011 adjusted. |
| 2 | Excludes equities, other equity interests and commodities. |
| 3 | Gross loans less (deferred expense)/unearned income before deductions of allowance for loan losses. |
| 4 | Financial guarantees, other credit related contingent liabilities and irrevocable lending commitments (including commitments designated under the fair value option) are reflected at notional amounts. |
Financial assets at fair value through profit and loss saw a material fall in gross exposures (i.e., before credit enhancements) principally driven by a reduction of positive market values of derivatives. On a net basis after credit enhancements portfolio quality has remained broadly stable and heavily biased towards investment grade-rated counterparties. Our loan portfolio quality remained robust with a significant reduction to lowest rated counterparties in “iCCC and below” by 30 % to€ 13.1 billion.
Main Credit Exposure Categories
The tables in this section show details about several of our main credit exposure categories, namely loans, irrevocable lending commitments, contingent liabilities, over-the-counter (“OTC”) derivatives, traded loans, traded bonds, debt securities available for sale and Repo and repo-style transactions:
| — | | “Loans” are net loans as reported on our balance sheet at amortized cost but before deduction of our allowance for loan losses. |
| — | | “Irrevocable lending commitments” consist of the undrawn portion of irrevocable lending-related commitments. |
| — | | “Contingent liabilities” consist of financial and performance guarantees, standby letters of credit and others (mainly indemnity agreements). |
| — | | “OTC derivatives” are our credit exposures from over-the-counter derivative transactions that we have entered into, after netting and cash collateral received. On our balance sheet, these are included in financial assets at fair value through profit or loss or, for derivatives qualifying for hedge accounting, in other assets, in either case, before netting and cash collateral received. |
| — | | “Traded loans” are loans that are bought and held for the purpose of selling them in the near term, or the material risks of which have all been hedged or sold. From a regulatory perspective this category principally covers trading book positions. |
| — | | “Traded bonds” include bonds, deposits, notes or commercial paper that are bought and held for the purpose of selling them in the near term. From a regulatory perspective this category principally covers trading book positions. |
| — | | “Debt securities available for sale” include debentures, bonds, deposits, notes or commercial paper, which are issued for a fixed term and redeemable by the issuer, which we have classified as available for sale. |
| — | | “Repo and repo-style transactions” consist of reverse repurchase transactions, as well as securities or commodities borrowing transactions after application of netting and collateral received. |
| | | | |
| Deutsche Bank | | 01 – Management Report | | 70 |
| Financial Report 2012 | | Risk Report | | |
| | |
| | | | |
| | |
| | | | |
Although considered in the monitoring of maximum credit exposures, the following are not included in the details of our main credit exposure: brokerage and securities related receivables, interest-earning deposits with banks, cash and due from banks, assets held for sale and accrued interest receivables. Excluded as well are traditional securitization positions and equity investments, which are dealt with specifically in the sections “Securitization” and “Nontrading Market Risk – Investment Risk” and “Nontrading Market Risk – Equity Investments Held”, respectively.
Main Credit Exposure Categories by Business Divisions
| | | | | | | | | | | | | | | | | | | | | | | | | | | | | | | | | | | | |
| | | Dec 31, 2012 | |
in€ m. | | Loans1 | | | Irrevocable
lending
commitments2 | | | Contingent
liabilities | | | OTC
derivatives3 | | | Traded
Loans | | | Traded
Bonds | | | Debt securities
available for
sale | | | Repo and
repo-style
transactions4 | | | Total | |
Corporate Banking & Securities | | | 54,155 | | | | 100,617 | | | | 8,741 | | | | 53,629 | | | | 14,052 | | | | 133,519 | | | | 10,517 | | | | 189,681 | | | | 564,911 | |
| | | | | | | | | | | | | | | | | | | | | | | | | | | | | | | | | | | | |
Global Transaction Bank | | | 58,882 | | | | 9,392 | | | | 51,590 | | | | 732 | | | | 827 | | | | 52 | | | | 133 | | | | 2,965 | | | | 124,573 | |
| | | | | | | | | | | | | | | | | | | | | | | | | | | | | | | | | | | | |
Asset & Wealth Management | | | 29,560 | | | | 3,503 | | | | 2,824 | | | | 555 | | | | 21 | | | | 7,540 | | | | 3,044 | | | | 76 | | | | 47,123 | |
| | | | | | | | | | | | | | | | | | | | | | | | | | | | | | | | | | | | |
Private & Business Clients | | | 209,228 | | | | 14,503 | | | | 1,764 | | | | 1,150 | | | | – | | | | 80 | | | | 17,931 | | | | 20,936 | | | | 265,592 | |
| | | | | | | | | | | | | | | | | | | | | | | | | | | | | | | | | | | | |
Non-Core Operations | | | 49,860 | | | | 1,451 | | | | 3,353 | | | | 6,373 | | | | 3,250 | | | | 11,699 | | | | 12,485 | | | | 150 | | | | 88,621 | |
| | | | | | | | | | | | | | | | | | | | | | | | | | | | | | | | | | | | |
Consolidation & Adjustments | | | 290 | | | | 191 | | | | 89 | | | | 5 | | | | 2 | | | | 64 | | | | 45 | | | | – | | | | 686 | |
| | | | | | | | | | | | | | | | | | | | | | | | | | | | | | | | | | | | |
Total | | | 401,975 | | | | 129,657 | | | | 68,361 | | | | 62,444 | | | | 18,152 | | | | 152,954 | | | | 44,155 | | | | 213,808 | | | | 1,091,506 | |
| |
| 1 | Includes impaired loans amounting to€ 10.3 billion as of December 31, 2012. |
| 2 | Includes irrevocable lending commitments related to consumer credit exposure of€ 10.4 billion as of December 31, 2012. |
| 3 | Includes the effect of netting agreements and cash collateral received where applicable. Excludes derivatives qualifying for hedge accounting. |
| 4 | Before reflection of collateral and limited to securities purchased under resale agreements and securities borrowed. |
| | | | | | | | | | | | | | | | | | | | | | | | | | | | | | | | | | | | |
| | | Dec 31, 2011 | |
in€ m. | | Loans1 | | | Irrevocable
lending
commitments2 | | | Contingent
liabilities | | | OTC
derivatives3 | | | Traded
Loans | | | Traded
Bonds | | | Debt securities
available for
sale | | | Repo and
repo-style
transactions4 | | | Total | |
Corporate Banking & Securities | | | 58,428 | | | | 99,219 | | | | 12,412 | | | | 65,145 | | | | 12,913 | | | | 134,394 | | | | 3,006 | | | | 180,020 | | | | 565,537 | |
| | | | | | | | | | | | | | | | | | | | | | | | | | | | | | | | | | | | |
Global Transaction Bank | | | 57,876 | | | | 8,916 | | | | 52,479 | | | | 815 | | | | 436 | | | | 50 | | | | 1,025 | | | | 2,749 | | | | 124,346 | |
| | | | | | | | | | | | | | | | | | | | | | | | | | | | | | | | | | | | |
Asset & Wealth Management | | | 27,638 | | | | 3,225 | | | | 3,038 | | | | 1,042 | | | | – | | | | 6,991 | | | | 2,498 | | | | 627 | | | | 45,059 | |
| | | | | | | | | | | | | | | | | | | | | | | | | | | | | | | | | | | | |
Private & Business Clients | | | 207,653 | | | | 14,089 | | | | 2,330 | | | | 829 | | | | – | | | | 14 | | | | 16,563 | | | | 12,182 | | | | 253,660 | |
| | | | | | | | | | | | | | | | | | | | | | | | | | | | | | | | | | | | |
Non-Core Operations | | | 64,721 | | | | 2,459 | | | | 3,345 | | | | 11,790 | | | | 4,689 | | | | 12,839 | | | | 16,246 | | | | 6,076 | | | | 122,165 | |
| | | | | | | | | | | | | | | | | | | | | | | | | | | | | | | | | | | | |
Consolidation & Adjustments | | | 360 | | | | 87 | | | | 49 | | | | 3 | | | | 1 | | | | 45 | | | | 43 | | | | – | | | | 588 | |
| | | | | | | | | | | | | | | | | | | | | | | | | | | | | | | | | | | | |
Total | | | 416,676 | | | | 127,995 | | | | 73,653 | | | | 79,624 | | | | 18,039 | | | | 154,333 | | | | 39,381 | | | | 201,654 | | | | 1,111,355 | |
| |
| 1 | Includes impaired loans amounting to€ 10.1 billion as of December 31, 2011. |
| 2 | Includes irrevocable lending commitments related to consumer credit exposure of€ 9.2 billion as of December 31, 2011. |
| 3 | Includes the effect of netting agreements and cash collateral received where applicable. Excludes derivatives qualifying for hedge accounting. |
| 4 | Before reflection of collateral and limited to securities purchased under resale agreements and securities borrowed. |
Our main credit exposure decreased by€ 19.8 billion.
| — | | From a divisional perspective, a significant reduction of€ 33.5 billion has been achieved by the recently established NCOU partly offset by an increase in PBC exposure (€ 11.9 billion) mainly driven by Repo and repo-style transactions due to reduced nettable contracts where excess liquidity has been invested in repo transactions. |
| — | | From a product perspective, exposure reductions have been recorded for Loans (€ 14.7 billion) and OTC derivatives (€ 17.2 billion) partly offset by an increase in Repo and repo-style transactions (€ 12.2 billion). |
| | | | |
| Deutsche Bank | | 01 – Management Report | | 71 |
| Financial Report 2012 | | Risk Report | | |
| | |
| | | | |
| | |
| | | | |
Main Credit Exposure Categories by Industry Sectors
| | | | | | | | | | | | | | | | | | | | | | | | | | | | | | | | | | | | |
| | | Dec 31, 2012 | |
in€ m. | | Loans1 | | | Irrevocable
lending
commitments2 | | | Contingent
liabilities | | | OTC
derivatives3 | | | Traded
Loans | | | Traded
Bonds | | | Debt securities
available for
sale | | | Repo and
repo-style
transactions4 | | | Total | |
Banks and insurance | | | 27,849 | | | | 22,083 | | | | 16,021 | | | | 32,673 | | | | 2,720 | | | | 34,750 | | | | 15,280 | | | | 207,476 | | | | 358,852 | |
| | | | | | | | | | | | | | | | | | | | | | | | | | | | | | | | | | | | |
Fund management activities | | | 16,777 | | | | 6,248 | | | | 2,063 | | | | 4,583 | | | | 536 | | | | 7,324 | | | | 1,092 | | | | 18 | | | | 38,641 | |
| | | | | | | | | | | | | | | | | | | | | | | | | | | | | | | | | | | | |
Manufacturing | | | 23,203 | | | | 30,347 | | | | 18,899 | | | | 1,626 | | | | 2,395 | | | | 3,545 | | | | 482 | | | | — | | | | 80,497 | |
| | | | | | | | | | | | | | | | | | | | | | | | | | | | | | | | | | | | |
Wholesale and retail trade | | | 17,026 | | | | 8,799 | | | | 6,080 | | | | 757 | | | | 546 | | | | 1,121 | | | | 149 | | | | — | | | | 34,478 | |
| | | | | | | | | | | | | | | | | | | | | | | | | | | | | | | | | | | | |
Households | | | 180,974 | | | | 12,273 | | | | 2,593 | | | | 730 | | | | 1,380 | | | | 7 | | | | — | | | | 45 | | | | 198,002 | |
| | | | | | | | | | | | | | | | | | | | | | | | | | | | | | | | | | | | |
Commercial real estate activities | | | 45,225 | | | | 2,677 | | | | 691 | | | | 1,567 | | | | 2,355 | | | | 1,335 | | | | 68 | | | | — | | | | 53,918 | |
| | | | | | | | | | | | | | | | | | | | | | | | | | | | | | | | | | | | |
Public sector | | | 15,378 | | | | 1,370 | | | | 107 | | | | 6,319 | | | | 318 | | | | 87,291 | | | | 25,095 | | | | 1,027 | | | | 136,905 | |
| | | | | | | | | | | | | | | | | | | | | | | | | | | | | | | | | | | | |
Other | | | 75,5435 | | | | 45,860 | | | | 21,907 | | | | 14,189 | | | | 7,902 | | | | 17,581 | | | | 1,989 | | | | 5,242 | | | | 190,213 | |
| | | | | | | | | | | | | | | | | | | | | | | | | | | | | | | | | | | | |
Total | | | 401,975 | | | | 129,657 | | | | 68,361 | | | | 62,444 | | | | 18,152 | | | | 152,954 | | | | 44,155 | | | | 213,808 | | | | 1,091,506 | |
| |
| 1 | Includes impaired loans amounting to€ 10.3 billion as of December 31, 2012. |
| 2 | Includes irrevocable lending commitments related to consumer credit exposure of€ 10.4 billion as of December 31, 2012. |
| 3 | Includes the effect of netting agreements and cash collateral received where applicable. Excludes derivatives qualifying for hedge accounting. |
| 4 | Before reflection of collateral and limited to securities purchased under resale agreements and securities borrowed. |
| 5 | Loan exposures for Other include lease financing. |
| | | | | | | | | | | | | | | | | | | | | | | | | | | | | | | | | | | | |
| | | Dec 31, 2011 | |
in€ m. | | Loans1 | | | Irrevocable
lending
commitments2 | | | Contingent
liabilities | | | OTC
derivatives3 | | | Traded
Loans | | | Traded
Bonds | | | Debt securities
available for
sale | | | Repo and
repo-style
transactions4 | | | Total | |
Banks and insurance | | | 35,308 | | | | 22,553 | | | | 17,668 | | | | 50,657 | | | | 2,416 | | | | 38,079 | | | | 15,887 | | | | 193,621 | | | | 376,189 | |
| | | | | | | | | | | | | | | | | | | | | | | | | | | | | | | | | | | | |
Fund management activities | | | 24,952 | | | | 4,931 | | | | 2,432 | | | | 8,943 | | | | 1,008 | | | | 7,688 | | | | 1,127 | | | | 396 | | | | 51,477 | |
| | | | | | | | | | | | | | | | | | | | | | | | | | | | | | | | | | | | |
Manufacturing | | | 22,754 | | | | 31,297 | | | | 19,608 | | | | 3,279 | | | | 1,290 | | | | 3,205 | | | | 697 | | | | 2 | | | | 82,132 | |
| | | | | | | | | | | | | | | | | | | | | | | | | | | | | | | | | | | | |
Wholesale and retail trade | | | 15,045 | | | | 8,412 | | | | 5,527 | | | | 610 | | | | 392 | | | | 1,218 | | | | 251 | | | | 36 | | | | 31,491 | |
| | | | | | | | | | | | | | | | | | | | | | | | | | | | | | | | | | | | |
Households | | | 174,188 | | | | 10,613 | | | | 2,706 | | | | 1,082 | | | | 2,199 | | | | 57 | | | | — | | | | 26 | | | | 190,871 | |
| | | | | | | | | | | | | | | | | | | | | | | | | | | | | | | | | | | | |
Commercial real estate activities | | | 46,143 | | | | 2,877 | | | | 2,348 | | | | 2,187 | | | | 2,526 | | | | 508 | | | | 53 | | | | 110 | | | | 56,752 | |
| | | | | | | | | | | | | | | | | | | | | | | | | | | | | | | | | | | | |
Public sector | | | 16,412 | | | | 1,479 | | | | 104 | | | | 8,625 | | | | 263 | | | | 88,036 | | | | 18,872 | | | | 740 | | | | 134,531 | |
| | | | | | | | | | | | | | | | | | | | | | | | | | | | | | | | | | | | |
Other | | | 81,8745 | | | | 45,833 | | | | 23,260 | | | | 4,241 | | | | 7,945 | | | | 15,542 | | | | 2,494 | | | | 6,723 | | | | 187,912 | |
| | | | | | | | | | | | | | | | | | | | | | | | | | | | | | | | | | | | |
Total | | | 416,676 | | | | 127,995 | | | | 73,653 | | | | 79,624 | | | | 18,039 | | | | 154,333 | | | | 39,381 | | | | 201,654 | | | | 1,111,355 | |
| |
| 1 | Includes impaired loans amounting to€ 10.1 billion as of December 31, 2011. |
| 2 | Includes irrevocable lending commitments related to consumer credit exposure of€ 9.2 billion as of December 31, 2011. |
| 3 | Includes the effect of netting agreements and cash collateral received where applicable. Excludes derivatives qualifying for hedge accounting. |
| 4 | Before reflection of collateral and limited to securities purchased under resale agreements and securities borrowed. |
| 5 | Loan exposures for Other include lease financing. |
From an industry perspective, our credit exposure is lower compared to last year in Banks and Insurance (€ 17.3 billion) and Funds management activities (€ 12.8 billion), partly offset by an increase in Households (€ 7.1 billion) primarily in Loans, reflecting the overall growth of our retail book.
Loan exposures to the industry sectors banks and insurance, manufacturing and public sector comprise predominantly investment grade variable rate loans which are held to maturity. The portfolio is subject to the same credit underwriting requirements stipulated in our Principles for Managing Credit Risk, including various controls according to single name, country, industry and product-specific concentration.
Material transactions, such as loans underwritten with the intention to syndicate, are subject to review by senior credit risk management professionals and (depending upon size) an underwriting credit committee and/or the Management Board. High emphasis is placed on structuring such transactions to ensure de-risking is achieved in a timely and cost effective manner. Exposures within these categories are mostly to good quality borrowers and also subject to further risk mitigation as outlined in the description of our Credit Portfolio Strategies Group’s activities.
| | | | |
| Deutsche Bank | | 01 – Management Report | | 72 |
| Financial Report 2012 | | Risk Report | | |
| | |
| | | | |
| | |
| | | | |
Our household loans exposure amounting to€ 181 billion as of December 31, 2012 (€ 174 billion as of December 2011) is principally associated with our PBC portfolio.€ 142 billion (78 %) of the portfolio comprises mortgages, of which€ 112 billion are held in Germany. The remaining exposures (€ 39 billion, 22 %) are predominantly consumer finance business related. Given the largely homogeneous nature of this portfolio, counterparty credit worthiness and ratings are predominately derived by utilizing an automated decision engine.
Mortgage business is principally the financing of owner occupied properties sold by various business channels in Europe, primarily in Germany but also in Spain, Italy and Poland, with exposure normally not exceeding real estate value. Consumer finance is divided into personal installment loans, credit lines and credit cards. Various lending requirements are stipulated, including (but not limited to) maximum loan amounts and maximum tenors and are adapted to regional conditions and/or circumstances of the borrower (e.g., for consumer loans a maximum loan amount taking into account household net income). Interest rates are mostly fixed over a certain period of time, especially in Germany. Second lien loans are not actively pursued.
The level of credit risk of the mortgage loan portfolio is determined by assessing the quality of the client and the underlying collateral. The loan amounts are generally larger than consumer finance loans and they are extended for longer time horizons. Consumer Finance loan risk depends on client quality. Given that they are uncollateralized, compared to mortgages they are also smaller in value and are extended for shorter time. Based on our underwriting criteria and processes, diversified portfolio (customers/properties) and low loan-to-value (LTV) ratios, the mortgage portfolio is categorized as lower risk and consumer finance medium risk.
Our commercial real estate loans are generally originated for distribution as securities (CMBS) or in the bank syndication market and accounted for as financial assets at fair value through profit and loss, with the exception of Postbank commercial real estate loans which are generally held to maturity and not sold in the secondary market. Loans are generally secured by first mortgages on the underlying real estate property, and follow the credit underwriting requirements stipulated in the Principles for Managing Credit Risk noted above (i.e., rating followed by credit approval based on assigned credit authority) and are subject to additional underwriting and policy guidelines such as LTV ratios of generally less than 75 %. Additionally given the significance of the underlying collateral independent external appraisals are commissioned for all secured loans by our valuation team (part of the independent Credit Risk Management function). Our valuation team is responsible for reviewing and challenging the reported real estate values.
Excluding the exposures transferred into the NCOU, the Commercial Real Estate Group does not normally retain mezzanine or other junior tranches of debt, though the Postbank portfolio holds an insignificant sub-portfolio of junior tranches. Loans originated for securitization are carefully monitored under a pipeline limit. Securitized loan positions are entirely sold (except where regulation requires retention of economic risk), while we frequently retain a portion of syndicated bank loans. This hold portfolio, which is held at amortized cost, is also subject to the aforementioned principles and policy guidelines. We also participate in conservatively underwritten unsecured lines of credit to well-capitalized real estate investment trusts and other public companies (generally investment grade). In addition, sub-performing and non-performing loans and pools of loans are generally acquired from other financial institutions at substantial discounts to both the notional amounts and current collateral values. The underwriting process is stringent and the exposure is managed under a separate portfolio limit. We provide both fixed rate (generally securitized product) and floating rate loans, with interest rate exposure subject to hedging arrangements. Commercial real estate property valuations and rental incomes can be significantly impacted by macro-economic conditions and underlying properties to idiosyncratic events. Accordingly, the portfolio is categorized as higher risk and hence subject to the aforementioned tight restrictions on concentration.
The category Other loans, with exposure of€ 76 billion as of December 31, 2012 (€ 82 billion as of December 31, 2011), relates to numerous smaller industry sectors with no individual sector greater than 5 % of total loans.
| | | | |
| Deutsche Bank | | 01 – Management Report | | 73 |
| Financial Report 2012 | | Risk Report | | |
| | |
| | | | |
| | |
| | | | |
Our credit exposure to our ten largest counterparties accounted for 11 % of our aggregated total credit exposure in these categories as of December 31, 2012 compared to 8 % as of December 31, 2011. Our top ten counterparty exposures were with well-rated counterparties or otherwise related to structured trades which show high levels of risk mitigation.
The following two tables present specific disclosures in relation to Pillar 3. Per regulation it is not required to audit Pillar 3 disclosures.
Residual contract maturity profile of the main credit exposure categories (unaudited)
| | | | | | | | | | | | | | | | | | | | | | | | | | | | | | | | | | | | |
| | | Dec 31, 2012 | |
in€ m. | | Loans1 | | | Irrevocable
lending
commitments2 | | | Contingent
liabilities | | | OTC
derivatives3 | | | Traded
Loans | | | Traded
Bonds | | | Debt securities
available
for sale | | | Repo and
repo-style
transactions4 | | | Total | |
| < 1 year | | | 126,091 | | | | 30,601 | | | | 35,777 | | | | 12,561 | | | | 3,516 | | | | 36,043 | | | | 5,702 | | | | 211,868 | | | | 462,159 | |
| | | | | | | | | | | | | | | | | | | | | | | | | | | | | | | | | | | | |
| 1 year – 5 years | | | 96,668 | | | | 82,179 | | | | 23,996 | | | | 17,821 | | | | 8,513 | | | | 42,794 | | | | 21,110 | | | | 1,817 | | | | 294,898 | |
| | | | | | | | | | | | | | | | | | | | | | | | | | | | | | | | | | | | |
| > 5 years | | | 179,216 | | | | 16,877 | | | | 8,588 | | | | 32,062 | | | | 6,123 | | | | 74,117 | | | | 17,343 | | | | 123 | | | | 334,449 | |
| | | | | | | | | | | | | | | | | | | | | | | | | | | | | | | | | | | | |
| Total credit risk exposure | | | 401,975 | | | | 129,657 | | | | 68,361 | | | | 62,444 | | | | 18,152 | | | | 152,954 | | | | 44,155 | | | | 213,808 | | | | 1,091,506 | |
| |
| 1 | Includes impaired loans amounting to€ 10.3 billion as of December 31, 2012. |
| 2 | Includes irrevocable lending commitments related to consumer credit exposure of€ 10.4 billion as of December 31, 2012. |
| 3 | Includes the effect of netting agreements and cash collateral received where applicable. Excludes derivatives qualifying for hedge accounting. |
| 4 | Before reflection of collateral and limited to securities purchased under resale agreements and securities borrowed. |
| | | | | | | | | | | | | | | | | | | | | | | | | | | | | | | | | | | | |
| | | Dec 31, 2011 | |
in€ m. | | Loans1 | | | Irrevocable
lending
commitments2 | | | Contingent
liabilities | | | OTC
derivatives3 | | | Traded
Loans | | | Traded
Bonds | | | Debt securities
available
for sale | | | Repo and
repo-style
transactions4 | | | Total | |
| < 1 year | | | 135,407 | | | | 34,414 | | | | 39,203 | | | | 14,094 | | | | 4,384 | | | | 40,594 | | | | 6,386 | | | | 197,434 | | | | 471,916 | |
| | | | | | | | | | | | | | | | | | | | | | | | | | | | | | | | | | | | |
| 1 year – 5 years | | | 102,883 | | | | 76,998 | | | | 20,918 | | | | 21,486 | | | | 8,695 | | | | 38,045 | | | | 14,339 | | | | 4,136 | | | | 287,500 | |
| | | | | | | | | | | | | | | | | | | | | | | | | | | | | | | | | | | | |
| > 5 years | | | 178,386 | | | | 16,583 | | | | 13,532 | | | | 44,044 | | | | 4,960 | | | | 75,694 | | | | 18,656 | | | | 84 | | | | 351,939 | |
| | | | | | | | | | | | | | | | | | | | | | | | | | | | | | | | | | | | |
| Total credit risk exposure | | | 416,676 | | | | 127,995 | | | | 73,653 | | | | 79,624 | | | | 18,039 | | | | 154,333 | | | | 39,381 | | | | 201,654 | | | | 1,111,355 | |
| |
| 1 | Includes impaired loans amounting to€ 10.1 billion as of December 31, 2011. |
| 2 | Includes irrevocable lending commitments related to consumer credit exposure of€ 9.2 billion as of December 31, 2011. |
| 3 | Includes the effect of netting agreements and cash collateral received where applicable. Excludes derivatives qualifying for hedge accounting. |
| 4 | Before reflection of collateral and limited to securities purchased under resale agreements and securities borrowed. |
Average credit risk exposure held over the four quarters (unaudited)
| | | | | | | | | | | | | | | | | | | | | | | | | | | | | | | | | | | | |
| | | 2012 | |
in€ m. | | Loans1 | | | Irrevocable
lending
commitments2 | | | Contingent
liabilities | | | OTC
derivatives3 | | | Traded
Loans | | | Traded
Bonds | | | Debt securities
available
for sale | | | Repo and
repo-style
transactions4 | | | Total | |
| Total average credit risk exposure | | | 409,002 | | | | 131,348 | | | | 68,680 | | | | 68,334 | | | | 17,164 | | | | 162,498 | | | | 42,529 | | | | 229,549 | | | | 1,129,104 | |
| | | | | | | | | | | | | | | | | | | | | | | | | | | | | | | | | | | | |
| Total credit risk exposure at year-end | | | 401,975 | | | | 129,657 | | | | 68,361 | | | | 62,444 | | | | 18,152 | | | | 152,954 | | | | 44,155 | | | | 213,808 | | | | 1,091,506 | |
| |
| 1 | Includes impaired loans amounting to€ 10.3 billion as of December 31, 2012. |
| 2 | Includes irrevocable lending commitments related to consumer credit exposure of€ 10.4 billion as of December 31, 2012. |
| 3 | Includes the effect of netting agreements and cash collateral received where applicable. Excludes derivatives qualifying for hedge accounting. |
| 4 | Before reflection of collateral and limited to securities purchased under resale agreements and securities borrowed. |
| | | | | | | | | | | | | | | | | | | | | | | | | | | | | | | | | | | | |
| | | 2011 | |
in€ m. | | Loans1 | | | Irrevocable
lending
commitments2 | | | Contingent
liabilities | | | OTC
derivatives3 | | | Traded
Loans | | | Traded
Bonds | | | Debt securities
available
for sale | | | Repo and
repo-style
transactions4 | | | Total | |
| Total average credit risk exposure | | | 407,212 | | | | 125,310 | | | | 68,988 | | | | 69,490 | | | | 19,651 | | | | 174,242 | | | | 40,797 | | | | 206,014 | | | | 1,111,704 | |
| | | | | | | | | | | | | | | | | | | | | | | | | | | | | | | | | | | | |
| Total credit risk exposure at year-end | | | 416,676 | | | | 127,995 | | | | 73,653 | | | | 79,624 | | | | 18,039 | | | | 154,333 | | | | 39,381 | | | | 201,654 | | | | 1,111,355 | |
| |
| 1 | Includes impaired loans amounting to€ 10.1 billion as of December 31, 2011. |
| 2 | Includes irrevocable lending commitments related to consumer credit exposure of€ 9.2 billion as of December 31, 2011. |
| 3 | Includes the effect of netting agreements and cash collateral received where applicable. Excludes derivatives qualifying for hedge accounting. |
| 4 | Before reflection of collateral and limited to securities purchased under resale agreements and securities borrowed. |
| | | | |
| Deutsche Bank | | 01 – Management Report | | 74 |
| Financial Report 2012 | | Risk Report | | |
| | |
| | | | |
| | |
| | | | |
| | | | | | | | | | | | | | | | | | | | | | | | | | | | | | | | | | | | | | | | |
| | | | | | | | | | | | | | | | | | | | | | | | | | | | | | | | | | | | | | | | | |
| | | Main credit exposure categories by geographical region | |
| | | | |
| | | | | | | Dec 31, 2012 | |
| | | in€ m. | | Loans1 | | | Irrevocable
lending
commitments2 | | | Contingent
liabilities | | | OTC
derivatives3 | | | Traded
Loans | | | Traded
Bonds | | | Debt
securities
available
for sale | | | Repo and
repo-style
transactions4 | | | Total | |
| | | Germany | | | 199,280 | | | | 24,301 | | | | 14,863 | | | | 3,159 | | | | 309 | | | | 15,960 | | | | 12,794 | | | | 24,526 | | | | 295,192 | |
| | | | | | | | | | | | | | | | | | | | | | | | | | | | | | | | | | | | | | | |
| | | Western Europe (excluding Germany) | | | 104,342 | | | | 33,922 | | | | 19,279 | | | | 29,478 | | | | 5,752 | | | | 31,529 | | | | 25,802 | | | | 50,346 | | | | 300,450 | |
| | | | | | | | | | | | | | | | | | | | | | | | | | | | | | | | | | | | | | | |
| | | Eastern Europe | | | 10,187 | | | | 1,479 | | | | 1,926 | | | | 1,075 | | | | 2,314 | | | | 4,246 | | | | 303 | | | | 380 | | | | 21,910 | |
| | | | | | | | | | | | | | | | | | | | | | | | | | | | | | | | | | | | | | | |
| | | North America | | | 52,560 | | | | 63,302 | | | | 19,883 | | | | 18,423 | | | | 7,386 | | | | 63,718 | | | | 2,500 | | | | 100,779 | | | | 328,551 | |
| | | | | | | | | | | | | | | | | | | | | | | | | | | | | | | | | | | | | | | |
| | | Central and South America | | | 4,747 | | | | 756 | | | | 1,343 | | | | 1,053 | | | | 518 | | | | 4,812 | | | | 57 | | | | 2,694 | | | | 15,980 | |
| | | | | | | | | | | | | | | | | | | | | | | | | | | | | | | | | | | | | | | |
| | | Asia/Pacific | | | 29,120 | | | | 5,253 | | | | 10,061 | | | | 9,165 | | | | 1,761 | | | | 31,781 | | | | 2,699 | | | | 34,621 | | | | 124,461 | |
| | | | | | | | | | | | | | | | | | | | | | | | | | | | | | | | | | | | | | | |
| | | Africa | | | 1,635 | | | | 587 | | | | 1,006 | | | | 17 | | | | 88 | | | | 766 | | | | – | | | | 462 | | | | 4,561 | |
| | | | | | | | | | | | | | | | | | | | | | | | | | | | | | | | | | | | | | | |
| | | Other | | | 104 | | | | 57 | | | | – | | | | 74 | | | | 24 | | | | 142 | | | | – | | | | – | | | | 401 | |
| | | | | | | | | | | | | | | | | | | | | | | | | | | | | | | | | | | | | | | |
| | | Total | | | 401,975 | | | | 129,657 | | | | 68,361 | | | | 62,444 | | | | 18,152 | | | | 152,954 | | | | 44,155 | | | | 213,808 | | | | 1,091,506 | |
| | | | |
| | | 1 Includes impaired loans amounting to€ 10.3 billion as of December 31, 2012. | |
| | | 2 Includes irrevocable lending commitments related to consumer credit exposure of€ 10.4 billion as of December 31, 2012. | |
| | | 3 Includes the effect of netting agreements and cash collateral received where applicable. Excludes derivatives qualifying for hedge accounting. | |
| | | 4 Before reflection of collateral and limited to securities purchased under resale agreements and securities borrowed. | |
| | | |
| | | | | Dec 31, 2011 | |
| | | in€ m. | | Loans1 | | | Irrevocable
lending
commitments2 | | | Contingent
liabilities | | | OTC
derivatives3 | | | Traded
Loans | | | Traded
Bonds | | | Debt
securities
available
for sale | | | Repo and
repo-style
transactions4 | | | Total | |
| | | Germany | | | 199,442 | | | | 24,448 | | | | 15,408 | | | | 5,148 | | | | 376 | | | | 17,445 | | | | 7,848 | | | | 24,207 | | | | 294,322 | |
| | | | | | | | | | | | | | | | | | | | | | | | | | | | | | | | | | | | | | | |
| | | Western Europe (excluding Germany) | | | 115,782 | | | | 32,399 | | | | 19,460 | | | | 35,932 | | | | 5,720 | | | | 29,720 | | | | 24,910 | | | | 53,520 | | | | 317,443 | |
| | | | | | | | | | | | | | | | | | | | | | | | | | | | | | | | | | | | | | | |
| | | Eastern Europe | | | 9,387 | | | | 1,357 | | | | 1,682 | | | | 135 | | | | 2,001 | | | | 2,331 | | | | 369 | | | | 548 | | | | 17,810 | |
| | | | | | | | | | | | | | | | | | | | | | | | | | | | | | | | | | | | | | | |
| | | North America | | | 54,962 | | | | 63,318 | | | | 23,884 | | | | 28,070 | | | | 7,482 | | | | 65,424 | | | | 5,523 | | | | 79,014 | | | | 327,677 | |
| | | | | | | | | | | | | | | | | | | | | | | | | | | | | | | | | | | | | | | |
| | | Central and South America | | | 4,775 | | | | 852 | | | | 1,803 | | | | 396 | | | | 499 | | | | 4,936 | | | | 79 | | | | 2,524 | | | | 15,864 | |
| | | | | | | | | | | | | | | | | | | | | | | | | | | | | | | | | | | | | | | |
| | | Asia/Pacific | | | 30,291 | | | | 4,791 | | | | 10,425 | | | | 9,011 | | | | 1,815 | | | | 33,836 | | | | 628 | | | | 41,417 | | | | 132,214 | |
| | | | | | | | | | | | | | | | | | | | | | | | | | | | | | | | | | | | | | | |
| | | Africa | | | 1,502 | | | | 598 | | | | 991 | | | | 888 | | | | 127 | | | | 611 | | | | 7 | | | | 424 | | | | 5,148 | |
| | | | | | | | | | | | | | | | | | | | | | | | | | | | | | | | | | | | | | | |
| | | Other | | | 535 | | | | 232 | | | | – | | | | 44 | | | | 19 | | | | 30 | | | | 17 | | | | – | | | | 877 | |
| | | | | | | | | | | | | | | | | | | | | | | | | | | | | | | | | | | | | | | |
| | | Total | | | 416,676 | | | | 127,995 | | | | 73,653 | | | | 79,624 | | | | 18,039 | | | | 154,333 | | | | 39,381 | | | | 201,654 | | | | 1,111,355 | |
| | | | |
| | | 1 Includes impaired loans amounting to€ 10.1 billion as of December 31, 2011. | |
| | | 2 Includes irrevocable lending commitments related to consumer credit exposure of€ 9.2 billion as of December 31, 2011. | |
| | | 3 Includes the effect of netting agreements and cash collateral received where applicable. Excludes derivatives qualifying for hedge accounting.4 Before reflection of collateral and limited to securities purchased under resale agreements and securities borrowed. Our largest concentration of credit risk within loans from a regional perspective was in our home market Germany, with a significant share in households, which includes the majority of our mortgage lending business. Within the OTC derivatives business our largest concentrations were in Western Europe (excluding Germany) and North America, with a significant share in highly rated banks and insurance companies for which we consider the credit risk to be limited. Our largest concentrations of credit risk within tradable assets from a regional perspective were in North America and Western Europe (excluding Germany), with a significant share in public sector and banks and insurance companies. Within the repo and repo-style transactions our largest concentrations were in North America and Western Europe (excluding Germany), with a significant share in highly rated banks and insurance companies. | |
| | | | | | | | | | | | | | | | | | | | | | | | | | | | | | | | | | | | | | | | | |
| | Our overall loan book as of December 31, 2012 decreased to€ 402 billion versus€ 417 billion as of December 31, 2011. The decrease in OTC derivatives (€ 17 billion) is mainly in North America and Western Europe (excluding Germany). The decrease in loans (€ 15 billion) was mainly in Western Europe (excluding Germany) and North America with banks and insurance and fund management activities. The increase in repo and repo-style transactions (€ 12 billion) was primarily in positions with banks and insurance companies within North America, partly offset with decreases in Asia/Pacific region. | |
| | | | |
| Deutsche Bank | | 01 – Management Report | | 75 |
| Financial Report 2012 | | Risk Report | | |
| | |
| | | | |
| | |
| | | | |
Credit Risk Exposure to Certain Eurozone Countries
Certain eurozone countries are presented within the tables below due to heightened concerns around sovereign risk caused by the wider European sovereign debt crisis as evidenced by widening and volatile credit default swap spreads. This heightened risk is driven by a number of factors impacting the associated sovereign including high public debt levels and/or large deficits, limited access to capital markets, proximity of debt repayment dates, poor economic fundamentals and outlook (including low gross domestic product growth, weak competitiveness, high unemployment and political uncertainty). Some of these countries have accepted “bail out” packages.
For the presentation of our exposure to these certain eurozone countries we apply two general concepts as follows:
| — | | In our “risk management view”, we consider the domicile of the group parent, thereby reflecting the one obligor principle. All facilities to a group of borrowers which are linked to each other (e.g., by one entity holding a majority of the voting rights or capital of another) are consolidated under one obligor. This group of borrowers is usually allocated to the country of domicile of the respective parent company. As an example, a loan to a counterparty in Spain is Spanish risk as per a domicile view but considered a German risk from a risk management perspective if the respective counterparty is linked to a parent company domiciled in Germany following the above-mentioned one obligor principle. In this risk management view we also consider derivative netting and present exposures net of hedges and collateral. The collateral valuations follow the same stringent approach and principles as outlined separately. Also, in our risk management we classify exposure to special purpose entities based on the domicile of the underlying assets as opposed to the domicile of the special purpose entities. Additional considerations apply for structured products. If, for example, a structured note is issued by a special purpose entity domiciled in Ireland, it will be considered an Irish risk in a “country of domicile” view, but if the underlying assets collateralizing the structured note are German mortgage loans, then the exposure would be included as German risk in the “risk management” view. |
| — | | In our “country of domicile view” we aggregate credit risk exposures to counterparties by allocating them to the domicile of the primary counterparty, irrespective of any link to other counterparties, or in relation to credit default swaps underlying reference assets from, these eurozone countries. Hence we also include counterparties whose group parent is located outside of these countries and exposures to special purpose entities whose underlying assets are from entities domiciled in other countries. |
Net credit risk exposure with certain eurozone countries – Risk Management View
| | | | | | | | |
in€ m. | | Dec 31, 2012 | | | Dec 31, 2011 | |
Greece | | | 646 | | | | 840 | |
| | | | | | | | |
Ireland | | | 1,443 | | | | 1,570 | |
| | | | | | | | |
Italy | | | 19,068 | | | | 18,064 | |
| | | | | | | | |
Portugal | | | 1,187 | | | | 1,733 | |
| | | | | | | | |
Spain | | | 12,664 | | | | 12,750 | |
| | | | | | | | |
Total | | | 35,008 | | | | 34,957 | |
| |
Net credit risk exposure is up€ 51 million since year-end 2011. This was primarily driven by increases in Italy from higher trading positions, largely offset by reductions in Portugal and Spain related to financial institutions, exposure in the Postbank portfolio as well as in Greek government bonds mainly due to the participation in the Greek debt restructuring in March 2012. Cyprus credit exposure is also closely monitored in light of rising sovereign risk and is currently at a relatively low level of€ 38 million (based on a risk management view).
Our above exposure is principally to highly diversified, low risk retail portfolios and small and medium enterprises in Italy and Spain, as well as stronger corporate and diversified mid-cap clients. Our financial institutions exposure is predominantly geared towards larger banks in Spain and Italy, typically under collateral agreements, with the majority of Spanish financial institutions exposure being covered bonds. Sovereign exposure is moderate and principally in Italy and Spain, where it is driven mainly by our derivatives positions and participation in government bond auctions.
| | | | |
| Deutsche Bank | | 01 – Management Report | | 76 |
| Financial Report 2012 | | Risk Report | | |
| | |
| | | | |
| | |
| | | | |
The following tables, which are based on the country of domicile view, present our gross position, the included amount thereof of undrawn exposure and our net exposure to these European countries. The gross exposure reflects our net credit risk exposure grossed up for net credit derivative protection purchased with underlying reference assets domiciled in one of these countries, guarantees received and collateral. Such collateral is particularly held with respect to the retail category, but also for financial institutions predominantly in relation to derivative margining arrangements, as well as for corporates. In addition the amounts also reflect the allowance for credit losses. In some cases, our counterparties’ ability to draw on undrawn commitments is limited by terms included within the specific contractual documentation. Net credit exposures are presented after effects of collateral held, guarantees received and further risk mitigation, but excluding net notional amounts of credit derivatives for protection sold/(bought). The provided gross and net exposures to certain European countries do not include credit derivative tranches and credit derivatives in relation to our correlation business which, by design, is structured to be credit risk neutral. Additionally the tranche and correlated nature of these positions does not lend itself to a disaggregated notional presentation by country, e.g., as identical notional exposures represent different levels of risk for different tranche levels.
Gross position, included undrawn exposure and net exposure to certain eurozone countries – Country of Domicile View
| | | | | | | | | | | | | | | | | | | | | | | | | | | | | | | | | | | | | | | | | | | | | | | | |
| | | Sovereign | | | Financial Institutions | | | Corporates | | | Retail | | | Other | | | Total2 | |
in€ m. | | Dec 31,
2012 | | | Dec 31,
20111 | | | Dec 31,
2012 | | | Dec 31,
2011 | | | Dec 31,
2012 | | | Dec 31,
2011 | | | Dec 31,
2012 | | | Dec 31,
2011 | | | Dec 31,
2012 | | | Dec 31,
2011 | | | Dec 31,
2012 | | | Dec 31,
2011 | |
Greece | | | | | | | | | | | | | | | | | | | | | | | | | | | | | | | | | | | | | | | | | | | | | | | | |
Gross | | | 40 | | | | 448 | | | | 715 | | | | 576 | | | | 1,501 | | | | 1,287 | | | | 9 | | | | 8 | | | | – | | | | – | | | | 2,265 | | | | 2,319 | |
Undrawn | | | – | | | | – | | | | 8 | | | | 5 | | | | 160 | | | | 121 | | | | 2 | | | | 2 | | | | – | | | | – | | | | 170 | | | | 128 | |
Net | | | 39 | | | | 448 | | | | 67 | | | | 105 | | | | 356 | | | | 324 | | | | 3 | | | | 2 | | | | – | | | | – | | | | 465 | | | | 879 | |
| | | | | | | | | | | | | | | | | | | | | | | | | | | | | | | | | | | | | | | | | | | | | | | | |
Ireland | | | | | | | | | | | | | | | | | | | | | | | | | | | | | | | | | | | | | | | | | | | | | | | | |
Gross | | | 932 | | | | 420 | | | | 1,427 | | | | 3,472 | | | | 6,505 | | | | 8,436 | | | | 56 | | | | 61 | | | | 4,2923 | | | | 6,4843 | | | | 13,212 | | | | 18,873 | |
Undrawn | | | – | | | | – | | | | 14 | | | | 4 | | | | 1,581 | | | | 1,130 | | | | 2 | | | | 3 | | | | 3663 | | | | 3403 | | | | 1,963 | | | | 1,477 | |
Net | | | 400 | | | | 181 | | | | 1,005 | | | | 1,755 | | | | 4,661 | | | | 6,593 | | | | 7 | | | | 9 | | | | 2,9143 | | | | 5,0843 | | | �� | 8,987 | | | | 13,622 | |
| | | | | | | | | | | | | | | | | | | | | | | | | | | | | | | | | | | | | | | | | | | | | | | | |
Italy | | | | | | | | | | | | | | | | | | | | | | | | | | | | | | | | | | | | | | | | | | | | | | | | |
Gross | | | 3,059 | | | | 1,811 | | | | 7,041 | | | | 5,198 | | | | 8,706 | | | | 9,449 | | | | 20,291 | | | | 19,842 | | | | 127 | | | | 373 | | | | 39,224 | | | | 36,673 | |
Undrawn | | | 1 | | | | 2 | | | | 809 | | | | 637 | | | | 3,162 | | | | 3,581 | | | | 261 | | | | 308 | | | | – | | | | – | | | | 4,233 | | | | 4,528 | |
Net | | | 2,969 | | | | 1,767 | | | | 3,150 | | | | 2,296 | | | | 6,619 | | | | 6,670 | | | | 7,749 | | | | 8,480 | | | | (73) | | | | 173 | | | | 20,414 | | | | 19,386 | |
| | | | | | | | | | | | | | | | | | | | | | | | | | | | | | | | | | | | | | | | | | | | | | | | |
Portugal | | | | | | | | | | | | | | | | | | | | | | | | | | | | | | | | | | | | | | | | | | | | | | | | |
Gross | | | 258 | | | | 165 | | | | 453 | | | | 880 | | | | 1,548 | | | | 1,502 | | | | 2,375 | | | | 2,415 | | | | 33 | | | | 36 | | | | 4,667 | | | | 4,998 | |
Undrawn | | | – | | | | – | | | | 52 | | | | 33 | | | | 188 | | | | 130 | | | | 5 | | | | 30 | | | | – | | | | – | | | | 245 | | | | 193 | |
Net | | | 153 | | | | (45) | | | | 319 | | | | 519 | | | | 769 | | | | 727 | | | | 501 | | | | 364 | | | | 32 | | | | 36 | | | | 1,774 | | | | 1,601 | |
| | | | | | | | | | | | | | | | | | | | | | | | | | | | | | | | | | | | | | | | | | | | | | | | |
Spain | | | | | | | | | | | | | | | | | | | | | | | | | | | | | | | | | | | | | | | | | | | | | | | | |
Gross | | | 1,659 | | | | 1,322 | | | | 5,483 | | | | 7,198 | | | | 10,301 | | | | 10,199 | | | | 11,106 | | | | 11,487 | | | | 216 | | | | 182 | | | | 28,765 | | | | 30,388 | |
Undrawn | | | – | | | | – | | | | 563 | | | | 313 | | | | 2,690 | | | | 3,257 | | | | 547 | | | | 593 | | | | – | | | | – | | | | 3,800 | | | | 4,163 | |
Net | | | 1,659 | | | | 1,318 | | | | 3,561 | | | | 5,740 | | | | 7,688 | | | | 7,152 | | | | 1,789 | | | | 2,018 | | | | 144 | | | | 93 | | | | 14,841 | | | | 16,321 | |
| | | | | | | | | | | | | | | | | | | | | | | | | | | | | | | | | | | | | | | | | | | | | | | | |
Total gross | | | 5,948 | | | | 4,166 | | | | 15,119 | | | | 17,324 | | | | 28,561 | | | | 30,873 | | | | 33,837 | | | | 33,813 | | | | 4,668 | | | | 7,075 | | | | 88,133 | | | | 93,251 | |
Total undrawn | | | 1 | | | | 2 | | | | 1,446 | | | | 992 | | | | 7,781 | | | | 8,219 | | | | 817 | | | | 936 | | | | 366 | | | | 340 | | | | 10,411 | | | | 10,489 | |
Total net4 | | | 5,220 | | | | 3,669 | | | | 8,102 | | | | 10,415 | | | | 20,093 | | | | 21,466 | | | | 10,049 | | | | 10,873 | | | | 3,017 | | | | 5,386 | | | | 46,481 | | | | 51,809 | |
| |
| 1 | Includes impaired available for sale sovereign debt positions in relation to Greece as of December 31, 2011. There are no other sovereign related impaired exposures included. |
| 2 | Approximately 77 % of the overall net exposure will mature within the next 5 years. |
| 3 | Other exposures to Ireland include exposures to counterparties where the domicile of the group parent is located outside of Ireland as well as exposures to special purpose entities whose underlying assets are from entities domiciled in other countries. |
| 4 | Total net exposure excludes credit valuation reserves for derivatives amounting to€ 231 million as of December 31, 2012 and€ 240 million as of December 31, 2011. |
Total net exposure to the above selected eurozone countries decreased by€ 5.3 billion in 2012 driven largely by reductions in exposure to Ireland, primarily to corporates, but also to Other, as well as by reduced exposure to financial institutions in Spain.
| | | | |
| Deutsche Bank | | 01 – Management Report | | 77 |
| Financial Report 2012 | | Risk Report | | |
| | |
| | | | |
| | |
| | | | |
Aggregate net credit risk to certain eurozone countries by type of financial instrument
| | | | | | | | | | | | | | | | | | | | | | | | | | | | |
| | | Financial assets carried at amortized cost | | | Financial assets
measured at
fair value | | | Financial instruments
at fair value through profit or loss | | | Dec 31, 2012 | |
in€ m. | | Loans
before loan
loss allowance | | | Loans
after loan
loss allowance | | | Other1 | | | Financial assets
available
for sale2 | | | Derivatives | | | Other | | | Total3 | |
Greece | | | 324 | | | | 296 | | | | 23 | | | | 5 | | | | 58 | | | | 73 | | | | 455 | |
| | | | | | | | | | | | | | | | | | | | | | | | | | | | |
Ireland | | | 2,188 | | | | 2,181 | | | | 2,982 | | | | 978 | | | | 1,387 | | | | 2,922 | | | | 10,450 | |
| | | | | | | | | | | | | | | | | | | | | | | | | | | | |
Italy | | | 11,345 | | | | 10,615 | | | | 3,815 | | | | 1,585 | | | | 4,132 | | | | (2,312) | | | | 17,835 | |
| | | | | | | | | | | | | | | | | | | | | | | | | | | | |
Portugal | | | 939 | | | | 901 | | | | 379 | | | | 202 | | | | 323 | | | | 434 | | | | 2,239 | |
| | | | | | | | | | | | | | | | | | | | | | | | | | | | |
Spain | | | 5,986 | | | | 5,481 | | | | 3,269 | | | | 3,254 | | | | 591 | | | | 1,842 | | | | 14,437 | |
| | | | | | | | | | | | | | | | | | | | | | | | | | | | |
Total | | | 20,782 | | | | 19,474 | | | | 10,468 | | | | 6,024 | | | | 6,491 | | | | 2,959 | | | | 45,416 | |
| |
1 Primarily includes contingent liabilities and undrawn lending commitments. 2 Excludes equities and other equity interests. 3 After loan loss allowances. | | | | | |
| | | | |
| | | Financial assets carried at amortized cost | | | Financial assets
measured at
fair value | | | Financial instruments
at fair value through profit or loss | | | Dec 31, 2011 | |
in€ m. | | Loans
before loan
loss allowance | | | Loans
after loan
loss allowance | | | Other1 | | | Financial assets
available
for sale2 | | | Derivatives | | | Other | | | Total3 | |
Greece | | | 214 | | | | 200 | | | | 38 | | | | 211 | | | | 100 | | | | 255 | | | | 804 | |
| | | | | | | | | | | | | | | | | | | | | | | | | | | | |
Ireland | | | 4,601 | | | | 4,592 | | | | 3,022 | | | | 1,250 | | | | 2,693 | | | | 3,242 | | | | 14,799 | |
| | | | | | | | | | | | | | | | | | | | | | | | | | | | |
Italy | | | 12,834 | | | | 12,275 | | | | 3,712 | | | | 1,243 | | | | 3,414 | | | | (1,787) | | | | 18,857 | |
| | | | | | | | | | | | | | | | | | | | | | | | | | | | |
Portugal | | | 1,227 | | | | 1,206 | | | | 223 | | | | 209 | | | | 243 | | | | 439 | | | | 2,320 | |
| | | | | | | | | | | | | | | | | | | | | | | | | | | | |
Spain | | | 7,346 | | | | 6,910 | | | | 3,052 | | | | 3,371 | | | | 1,936 | | | | 1,201 | | | | 16,470 | |
| | | | | | | | | | | | | | | | | | | | | | | | | | | | |
Total | | | 26,222 | | | | 25,183 | | | | 10,047 | | | | 6,284 | | | | 8,386 | | | | 3,350 | | | | 53,250 | |
| |
| 1 | Primarily includes contingent liabilities and undrawn lending commitments. |
| 2 | Excludes equities and other equity interests. |
| 3 | After loan loss allowances. |
For our credit derivative exposure with these eurozone countries we present the notional amounts for protection sold and protection bought on a gross level as well as the resulting net notional position and its fair value.
Credit derivative exposure with underlying assets domiciled in certain eurozone countries
| | | | | | | | | | | | | | | | |
| | | Notional amounts | | | Dec 31, 2012 | |
in€ m. | | Protection
sold | | | Protection
bought | | | Net protection
sold/(bought) | | | Net fair value | |
Greece | | | 1,396 | | | | (1,386) | | | | 10 | | | | (8) | |
| | | | | | | | | | | | | | | | |
Ireland | | | 8,280 | | | | (9,743) | | | | (1,463) | | | | 55 | |
| | | | | | | | | | | | | | | | |
Italy | | | 60,638 | | | | (58,059) | | | | 2,579 | | | | 145 | |
| | | | | | | | | | | | | | | | |
Portugal | | | 10,744 | | | | (11,209) | | | | (465) | | | | (5) | |
| | | | | | | | | | | | | | | | |
Spain | | | 30,408 | | | | (30,004) | | | | 404 | | | | (8) | |
| | | | | | | | | | | | | | | | |
Total | | | 111,466 | | | | (110,401) | | | | 1,065 | | | | 179 | |
| |
| | |
| | | Notional amounts | | | Dec 31, 2011 | |
in€ m. | | Protection
sold | | | Protection
bought | | | Net protection
sold/(bought) | | | Net fair value | |
Greece | | | 8,284 | | | | (8,209) | | | | 75 | | | | (75) | |
| | | | | | | | | | | | | | | | |
Ireland | | | 11,203 | | | | (12,380) | | | | (1,177) | | | | 51 | |
| | | | | | | | | | | | | | | | |
Italy | | | 59,890 | | | | (59,361) | | | | 529 | | | | 32 | |
| | | | | | | | | | | | | | | | |
Portugal | | | 12,744 | | | | (13,463) | | | | (719) | | | | 36 | |
| | | | | | | | | | | | | | | | |
Spain | | | 35,267 | | | | (35,416) | | | | (149) | | | | 68 | |
| | | | | | | | | | | | | | | | |
Total | | | 127,388 | | | | (128,829) | | | | (1,441) | | | | 112 | |
| |
| | | | |
| Deutsche Bank | | 01 – Management Report | | 78 |
| Financial Report 2012 | | Risk Report | | |
| | |
| | | | |
| | |
| | | | |
In line with common industry practice, we use credit default swaps (CDS) as one important instrument to manage credit risk in order to avoid any undue concentrations in the credit portfolio. CDS contracts are governed by standard ISDA documentation which defines trigger events which result in settlement payouts. Examples of these triggers include bankruptcy of the reference entity, failure of reference entity to meeting contractual obligations (e.g., interest or principal repayment) and debt restructuring of the reference entity. These triggers also apply to credit default protection contracts sold. Our purchased credit default swap protection acting as a risk mitigant is predominantly issued by highly rated financial institutions governed under collateral agreements. While we clearly focus on net risk including hedging/collateral we also very intensively review our gross positions before any CDS hedging in reflection of the potential risk that a CDS trigger event does not occur as expected.
The exposures associated with these countries noted above are managed and monitored using the credit process explained within the credit risk section of this Risk Report including detailed counterparty ratings, ongoing counterparty monitoring as well as our framework for managing concentration risk as documented within our country risk and industry risk sections as outlined above. This framework is complemented by regular management reporting including targeted portfolio reviews of these countries, portfolio de-risking initiatives and stress testing.
For credit protection purposes we strive to avoid any maturity mismatches. However, this depends on the availability of required hedging instruments in the market. Where maturity mismatches cannot be avoided, these positions are tightly monitored. We take into account the sensitivities of hedging instrument and underlying asset to neutralize the maturity mismatch.
The stress tests we conducted were mainly focused on assessing potential sensitivities in terms of credit, market and liquidity risk in the case of extreme shock events such as a disorderly exit of a eurozone member. These included indirect exposures and assessed the impact of revaluation events and contagion effects on certain portfolios outside Greece, Ireland, Italy, Portugal and Spain (the GIIPS countries) deemed most likely to be indirectly affected by an escalation in the eurozone crisis. In addition, assessments of the potential indirect impact of such an escalation were carried out on collateral values.
The key input parameters included within these stress tests were based on a number of market-related assumptions, including ones relating to GDP, FX, interest rates and fluctuations in the capital markets. These assumptions were provided by our internal macro-economic department, “Deutsche Bank research”. The stress scenarios were discussed with and signed-off by our Stress Test Oversight Committee, which is the central governance committee dealing with the Banks Group Wide Stress Test. Key outputs from these stress tests included credit-relevant metrics, and the stress tests were designed to assess P&L, capital and liquidity implications for the Bank. These outputs were taken into consideration in defining the required risk-mitigating actions.
Our internal risk controls have been further enhanced through the establishment of a governance framework intended to enable adequate preparation for and an ability to manage euro crisis events in terms of risk mitigation and operational contingency measures. This includes a holistic impact analysis based on the above-mentioned scenarios, including the domino impact of a worsening crisis, potential revaluations of new currencies in a “euro exit” of specific countries, regular evaluation of redenomination risk and assessment of product, contractual and jurisdictional specifics in close cooperation with our legal department. However, significant uncertainties still remain in evaluating these risks, in particular redenomination risk where it is highly uncertain which assets and liabilities would be impacted and the scale of any losses which would result. Key considerations include (i) the governing law of the relevant obligation; (ii) the location of performance; (iii) whether or not counterparties default and (iv) the scale of the devaluation of the new currency.
| | | | |
| Deutsche Bank | | 01 – Management Report | | 79 |
| Financial Report 2012 | | Risk Report | | |
| | |
| | | | |
| | |
| | | | |
The above mentioned financial impact analyses are complimented by operational contingency measures that assess the Bank’s crisis management capabilities (roadmap to respond to a crisis event) as well as operational readiness such as the introduction of a new currency into the system environment.
Overall, we have actively managed our exposures to GIIPS countries since the early stages of the debt crisis and believe our credit portfolio to be well-positioned following selective early de-risking focused on sovereign risk and weaker counterparties.
We have internally analyzed the Bank’s potential redenomination and revaluation risk to selected eurozone countries under several different assumptions with the total volume of assets and liabilities at risk varying significantly depending on which assumptions are made. We believe that a quantification of redenomination and revaluation risk would need to be interpreted within the context of each individual risk assessment, based on the internal assumptions we made, but for which we have no ability to predict whether they are more or less likely to occur. As a result, we believe that quantification would not provide meaningful information for the reader.
Sovereign Credit Risk Exposure to Certain Eurozone Countries
Following the October 26, 2011 Euro Summit Statement and the February 21, 2012 Eurogroup Statement, on February 24, 2012 the Greek government made an invitation to private sector holders of bonds issued or guaranteed by the Greek government to participate in a debt exchange offer and/or consent solicitations, referred to as the Private Sector Involvement (“PSI”). The bonds invited to participate in the PSI had an aggregate outstanding face amount of approximately€ 206 billion. The debt exchange offer and consent solicitations were aimed at maximizing the PSI in the overall support package being offered to Greece, in conjunction with the support provided by the official sector (IMF, EU, ECB), thereby mitigating the likelihood of Greece defaulting on its obligations.
In March 2012, we participated in the exchange offer and consent solicitations with all our Greek Government Bonds (“GGB”) eligible in this respect. Under the PSI, GGB holders received in exchange for their GGBs (i) new bonds issued by the Greek government having a face amount equal to 31.5 % of the face amount of their exchanged bonds, (ii) European Financial Stability Facility (“EFSF”) notes with a maturity of two years or less having a face amount of 15 % of the face amount of their exchanged bonds and (iii) detachable securities linked to Greece’s gross domestic product issued by the Greek government having a notional amount equal to the face amount of each holder’s new bonds. The Greek government also delivered short-term EFSF notes to discharge all unpaid interest accrued up to February 24, 2012 on exchanged bonds.
The bonds that we tendered in the debt exchange were derecognized and the new instruments recognized at fair value classified as either financial assets available for sale or at fair value through profit or loss.
The information provided below on our sovereign credit risk exposure to certain eurozone Countries includes, in the figures as of December 31, 2012, the Greek government bonds received as part of the rescheduling.
| | | | |
| Deutsche Bank | | 01 – Management Report | | 80 |
| Financial Report 2012 | | Risk Report | | |
| | |
| | | | |
| | |
| | | | |
| | | | | | | | | | | | | | | | | | | | | | | | | | | | | | | | | | | | |
| | | Sovereign credit risk exposure to certain eurozone countries | |
| | | | | | | Dec 31, 2012 | | | Dec 31, 2011 | |
| | | in€ m. | | Direct
Sovereign
exposure1 | | | Net Notional
of CDS
referencing
sovereign
debt | | | Net sovereign
exposure | | | Memo Item:
Net fair value
of CDS
referencing
sovereign
debt2 | | | Direct
Sovereign
exposure1 | | | Net Notional
of CDS
referencing
sovereign
debt | | | Net sovereign
exposure | | | Memo Item:
Net fair value
of CDS
referencing
sovereign
debt2 | |
| | | Greece | | | 39 | | | | – | | | | 39 | | | | – | | | | 433 | | | | 15 | | | | 448 | | | | (50) | |
| | | | | | | | | | | | | | | | | | | | | | | | | | | | | | | | | | | |
| | | Ireland | | | 355 | | | | 45 | | | | 400 | | | | (4) | | | | 208 | | | | (27) | | | | 181 | | | | (21) | |
| | | | | | | | | | | | | | | | | | | | | | | | | | | | | | | | | | | |
| | | Italy | | | 847 | | | | 2,122 | | | | 2,969 | | | | 159 | | | | 176 | | | | 1,591 | | | | 1,767 | | | | 1 | |
| | | | | | | | | | | | | | | | | | | | | | | | | | | | | | | | | | | |
| | | Portugal | | | 258 | | | | (105) | | | | 153 | | | | (4) | | | | 116 | | | | (161) | | | | (45) | | | | 16 | |
| | | | | | | | | | | | | | | | | | | | | | | | | | | | | | | | | | | |
| | | Spain | | | 1,544 | | | | 115 | | | | 1,659 | | | | (4) | | | | 1,026 | | | | 292 | | | | 1,318 | | | | (13) | |
| | | | | | | | | | | | | | | | | | | | | | | | | | | | | | | | | | | |
| | | Total | | | 3,043 | | | | 2,177 | | | | 5,220 | | | | 147 | | | | 1,959 | | | | 1,710 | | | | 3,669 | | | | (67) | |
| | | | |
| | | 1 Includes debt classified as financial assets/liabilities at fair value through profit or loss, available for sale and loans carried at amortized cost. 2 The amounts reflect the net fair value (i.e., counterparty credit risk) in relation to credit default swaps referencing sovereign debt of the respective country. | |
| | | | | | | | | | | | | | | | | | | | | | | | | | | | |
The above shown amounts reflect a net country of domicile view of our sovereign exposure. With the exception of Greece, the increase compared to year-end 2011 mainly reflects market making activities as well as fair value changes from market price movements occurring within 2012. The exposure decrease to Greece reflects our participation in the aforementioned debt exchange.
The above mentioned direct sovereign exposure included the carrying value of loans held at amortized cost to sovereigns which, as of December 31, 2012, amounted to€ 797 million for Italy and€ 591 million for Spain and, as of December 31, 2011 amounted to€ 546 million for Italy and€ 752 million for Spain.
Fair value of sovereign credit risk exposure to certain eurozone countries classified as financial assets at fair value through profit or loss
| | | | | | | | | | | | | | | | | | | | | | | | |
| | | Dec 31, 2012 | | | Dec 31, 2011 | |
in€ m. | | Fair value of
sovereign debt | | | Fair value of
derivatives with
sovereign
counterparties
(net position)1 | | | Total fair value
of sovereign
exposures | | | Fair value of
sovereign debt | | | Fair value of
derivatives with
sovereign
counterparties
(net position)1 | | | Total fair value
of sovereign
exposures | |
Greece | | | 24 | | | | 15 | | | | 39 | | | | 197 | | | | 25 | | | | 222 | |
| | | | | | | | | | | | | | | | | | | | | | | | |
Ireland | | | 28 | | | | 27 | | | | 55 | | | | (32) | | | | 7 | | | | (25) | |
| | | | | | | | | | | | | | | | | | | | | | | | |
Italy | | | (3,974) | 2 | | | 3,279 | | | | (695) | | | | (3,325) | 2 | | | 2,332 | | | | (993) | |
| | | | | | | | | | | | | | | | | | | | | | | | |
Portugal | | | 150 | | | | 59 | | | | 209 | | | | 81 | | | | 4 | | | | 85 | |
| | | | | | | | | | | | | | | | | | | | | | | | |
Spain | | | 734 | | | | 29 | | | | 763 | | | | 52 | | | | 28 | | | | 80 | |
| | | | | | | | | | | | | | | | | | | | | | | | |
Total | | | (3,038) | | | | 3,409 | | | | 371 | | | | (3,027) | | | | 2,396 | | | | (631) | |
| |
| 1 | Includes the impact of master netting and collateral arrangements. |
| 2 | Short sovereign debt position for Italy predominantly related to structured trades with corresponding credit derivatives offset. |
Sovereign credit risk exposure to certain eurozone countries classified as financial assets available for sale
| | | | | | | | | | | | | | | | | | | | | | | | |
| | | Dec 31, 2012 | | | Dec 31, 2011 | |
in€ m. | | Fair value of
sovereign debt | | | Original carrying
amount | | | Accumulated
impairment
losses
recognized in
net income
(after tax) | | | Fair value of
sovereign debt | | | Original carrying
amount | | | Accumulated
impairment
losses
recognized in
net income
(after tax) | |
Greece | | | – | | | | – | | | | – | | | | 211 | | | | 494 | | | | (368) | |
| | | | | | | | | | | | | | | | | | | | | | | | |
Ireland | | | 300 | | | | 213 | | | | – | | | | 232 | | | | 213 | | | | – | |
| | | | | | | | | | | | | | | | | | | | | | | | |
Italy | | | 741 | | | | 720 | | | | – | | | | 625 | | | | 724 | | | | – | |
| | | | | | | | | | | | | | | | | | | | | | | | |
Portugal | | | 48 | | | | 46 | | | | – | | | | 31 | | | | 46 | | | | – | |
| | | | | | | | | | | | | | | | | | | | | | | | |
Spain | | | 201 | | | | 194 | | | | – | | | | 193 | | | | 194 | | | | – | |
| | | | | | | | | | | | | | | | | | | | | | | | |
Total | | | 1,290 | | | | 1,173 | | | | – | | | | 1,292 | | | | 1,671 | | | | (368) | |
| |
| | | | |
| Deutsche Bank | | 01 – Management Report | | 81 |
| Financial Report 2012 | | Risk Report | | |
| | |
| | | | |
| | |
| | | | |
Credit Exposure from Lending
Our lending businesses are subject to credit risk management processes, both at origination and on an ongoing basis. An overview of these processes is described in the credit risk section of this Risk Report.
Loan book categories segregated into a lower, medium and higher risk bucket
| | | | | | | | | | | | | | | | |
| | | Dec 31, 2012 | | | Dec 31, 20111 | |
in€ m. | | Total | | | thereof:
Non-Core | | | Total | | | thereof:
Non-Core | |
Lower risk bucket: | | | | | | | | | | | | | | | | |
PBC Mortgages | | | 151,078 | | | | 8,579 | | | | 145,511 | | | | 9,457 | |
Investment-Grade/German Mid-Cap | | | 42,906 | | | | 3,356 | | | | 49,657 | | | | 3,986 | |
GTB | | | 58,882 | | | | – | | | | 57,876 | | | | – | |
PWM | | | 30,666 | | | | 1,106 | | | | 28,832 | | | | 1,194 | |
PBC small corporates | | | 18,745 | | | | 1,833 | | | | 19,116 | | | | 1,146 | |
Government collateralized/structured transactions | | | 1,149 | | | | – | | | | 3,615 | | | | 2,450 | |
Corporate Investments | | | 2,464 | | | | 2,464 | | | | 6,707 | | | | 6,707 | |
| | | | | | | | | | | | | | | | |
Sub-total lower risk bucket | | | 305,890 | | | | 17,338 | | | | 311,314 | | | | 24,940 | |
| | | | | | | | | | | | | | | | |
Moderate risk bucket: | | | | | | | | | | | | | | | | |
PBC Consumer Finance | | | 20,316 | | | | 1,303 | | | | 18,996 | | | | 1,266 | |
Asset Finance (Deutsche Bank sponsored conduits) | | | 14,786 | | | | 6,395 | | | | 17,651 | | | | 8,365 | |
Collateralized hedged structured transactions | | | 13,176 | | | | 3,642 | | | | 15,012 | | | | 5,136 | |
Financing of pipeline assets2 | | | 4,312 | | | | 1,316 | | | | 6,619 | | | | 1,639 | |
| | | | | | | | | | | | | | | | |
Sub-total moderate risk bucket | | | 52,590 | | | | 12,656 | | | | 58,278 | | | | 16,406 | |
| | | | | | | | | | | | | | | | |
Higher risk bucket: | | | | | | | | | | | | | | | | |
Commercial Real Estate3 | | | 27,285 | | | | 14,784 | | | | 28,398 | | | | 16,473 | |
Leveraged Finance4 | | | 5,095 | | | | 744 | | | | 5,019 | | | | 1,318 | |
Other5 | | | 11,115 | | | | 4,336 | | | | 13,667 | | | | 5,584 | |
| | | | | | | | | | | | | | | | |
Sub-total higher risk bucket | | | 43,495 | | | | 19,864 | | | | 47,084 | | | | 23,375 | |
| | | | | | | | | | | | | | | | |
Total loan book | | | 401,975 | | | | 49,858 | | | | 416,676 | | | | 64,721 | |
| |
| 1 | Amounts for December 31, 2011 reflect the new business division structure established in 2012. |
| 2 | Thereof vendor financing on loans sold in Leveraged Finance amounting to€ 3.0 billion and in Commercial Real Estate amounting to€ 1.3 billion as of December 31, 2012 (€ 5.0 billion and€ 1.6 billion as of December 31, 2011, respectively). |
| 3 | Includes loans from CMBS securitizations. |
| 4 | Loans mainly relate to CPSG. |
| 5 | Includes other smaller loans predominately in our CB&S business division. |
The majority of our low risk exposures is associated with our PBC retail banking activities. 76 % of our loan book at December 31, 2012 was in the low risk category, broadly in line with the prior year end.
Our higher risk bucket predominantly relates to commercial real estate exposures. Our credit risk management approach puts strong emphasis specifically on the portfolios we deem to be of higher risk. Portfolio strategies and credit monitoring controls are in place for these portfolios. The overall commercial real estate exposures decreased by€ 1.1 billion at December 31, 2012.
Impaired loans and allowance for loan losses for our higher-risk loan bucket
| | | | | | | | | | | | | | | | | | | | | | | | | | | | | | | | |
| | | Dec 31, 2012 | | | Dec 31, 20111 | |
| | | Total | | | thereof: Non-Core | | | Total | | | thereof: Non-Core | |
in€ m. | | Impaired
loans | | | Allowance
for loan
losses | | | Impaired
loans | | | Allowance
for loan
losses | | | Impaired
loans | | | Allowance
for loan
losses | | | Impaired
loans | | | Allowance
for loan
losses | |
| Commercial Real Estate | | | 2,065 | | | | 554 | | | | 1,318 | | | | 353 | | | | 2,225 | | | | 360 | | | | 1,457 | | | | 226 | |
| | | | | | | | | | | | | | | | | | | | | | | | | | | | | | | | |
| Leveraged Finance | | | 64 | | | | 81 | | | | 4 | | | | 3 | | | | 158 | | | | 148 | | | | 93 | | | | 85 | |
| | | | | | | | | | | | | | | | | | | | | | | | | | | | | | | | |
| Other | | | 576 | | | | 160 | | | | 539 | | | | 134 | | | | 626 | | | | 180 | | | | 599 | | | | 143 | |
| | | | | | | | | | | | | | | | | | | | | | | | | | | | | | | | |
| Total | | | 2,705 | | | | 795 | | | | 1,861 | | | | 490 | | | | 3,009 | | | | 688 | | | | 2,149 | | | | 454 | |
| |
| 1 | Amounts for December 31, 2011 reflect the new business division structure established in 2012. 2011 numbers adjusted. |
| | | | |
| Deutsche Bank | | 01 – Management Report | | 82 |
| Financial Report 2012 | | Risk Report | | |
| | |
| | | | |
| | |
| | | | |
The above decrease in impaired loans in our higher risk loan bucket was driven by a reduction in larger commercial real estate loans in relation to Postbank which only had small impairment charges due to fair value adjustments at consolidation.
The increase in allowance for loan losses with regard to commercial real estate was primarily caused by increased provisions for existing impaired loans in relation to Postbank.
Credit Exposure Classification
We also classify our credit exposure under two broad headings: consumer credit exposure and corporate credit exposure.
| — | | Our consumer credit exposure consists of our smaller-balance standardized homogeneous loans, primarily in Germany, Italy and Spain, which include personal loans, residential and nonresidential mortgage loans, overdrafts and loans to self-employed and small business customers of our private and retail business. |
| — | | Our corporate credit exposure consists of all exposures not defined as consumer credit exposure. |
Corporate Credit Exposure
Main corporate credit exposure categories according to our internal creditworthiness categories of our counterparties.
| | | | | | | | | | | | | | | | | | | | | | | | | | | | |
in€ m. | | Dec 31, 2012 | |
Ratingband | | Probability of
default | | | Loans1 | | | Irrevocable
lending
commitments2 | | | Contingent
liabilities | | | OTC derivatives3 | | | Debt securities
available for sale | | | Total | |
iAAA-iAA | | | 0.00-0.04% | | | | 48,992 | | | | 20,233 | | | | 9,064 | | | | 23,043 | | | | 30,054 | | | | 131,386 | |
| | | | | | | | | | | | | | | | | | | | | | | | | | | | |
iA | | | 0.04-0.11% | | | | 43,047 | | | | 37,456 | | | | 19,192 | | | | 22,308 | | | | 8,186 | | | | 130,189 | |
| | | | | | | | | | | | | | | | | | | | | | | | | | | | |
iBBB | | | 0.11-0.5% | | | | 53,804 | | | | 37,754 | | | | 21,304 | | | | 7,713 | | | | 3,788 | | | | 124,363 | |
| | | | | | | | | | | | | | | | | | | | | | | | | | | | |
iBB | | | 0.5-2.27% | | | | 45,326 | | | | 22,631 | | | | 11,460 | | | | 5,778 | | | | 1,749 | | | | 86,944 | |
| | | | | | | | | | | | | | | | | | | | | | | | | | | | |
iB | | | 2.27-10.22% | | | | 17,739 | | | | 10,068 | | | | 4,886 | | | | 2,415 | | | | 227 | | | | 35,335 | |
| | | | | | | | | | | | | | | | | | | | | | | | | | | | |
iCCC and below | | | 10.22-100% | | | | 13,062 | | | | 1,515 | | | | 2,455 | | | | 1,187 | | | | 151 | | | | 18,370 | |
| | | | | | | | | | | | | | | | | | | | | | | | | | | | |
Total | | | | | | | 221,970 | | | | 129,657 | | | | 68,361 | | | | 62,444 | | | | 44,155 | | | | 526,587 | |
| |
| 1 | Includes impaired loans mainly in category CCC and below amounting to€ 6.1 billion as of December 31, 2012. |
| 2 | Includes irrevocable lending commitments related to consumer credit exposure of€ 10.4 billion as of December 31, 2012. |
| 3 | Includes the effect of netting agreements and cash collateral received where applicable. |
| | | | | | | | | | | | | | | | | | | | | | | | | | | | |
in€ m. | | Dec 31, 2011 | |
Ratingband | | Probability of
default | | | Loans1 | | | Irrevocable
lending
commitments2 | | | Contingent
liabilities | | | OTC derivatives3 | | | Debt securities
available for sale | | | Total | |
iAAA-iAA | | | 0.00-0.04% | | | | 51,321 | | | | 21,152 | | | | 6,535 | | | | 37,569 | | | | 22,753 | | | | 139,330 | |
| | | | | | | | | | | | | | | | | | | | | | | | | | | | |
iA | | | 0.04-0.11% | | | | 45,085 | | | | 37,894 | | | | 24,410 | | | | 17,039 | | | | 8,581 | | | | 133,009 | |
| | | | | | | | | | | | | | | | | | | | | | | | | | | | |
iBBB | | | 0.11-0.5% | | | | 59,496 | | | | 36,659 | | | | 21,002 | | | | 12,899 | | | | 5,109 | | | | 135,165 | |
| | | | | | | | | | | | | | | | | | | | | | | | | | | | |
iBB | | | 0.5-2.27% | | | | 50,236 | | | | 21,067 | | | | 13,986 | | | | 7,478 | | | | 2,303 | | | | 95,071 | |
| | | | | | | | | | | | | | | | | | | | | | | | | | | | |
iB | | | 2.27-10.22% | | | | 17,650 | | | | 9,152 | | | | 6,051 | | | | 3,007 | | | | 263 | | | | 36,123 | |
| | | | | | | | | | | | | | | | | | | | | | | | | | | | |
iCCC and below | | | 10.22-100% | | | | 18,148 | | | | 2,071 | | | | 1,669 | | | | 1,632 | | | | 371 | | | | 23,891 | |
| | | | | | | | | | | | | | | | | | | | | | | | | | | | |
Total | | | | | | | 241,936 | | | | 127,995 | | | | 73,653 | | | | 79,624 | | | | 39,381 | | | | 562,589 | |
| |
| 1 | Includes impaired loans mainly in category CCC and below amounting to€ 6.3 billion as of December 31, 2011. |
| 2 | Includes irrevocable lending commitments related to consumer credit exposure of€ 9.2 billion as of December 31, 2011. |
| 3 | Includes the effect of netting agreements and cash collateral received where applicable. |
Our corporate credit exposure has declined by 6 % since December 31, 2011 to€ 526.6 billion. Reductions have been primarily recorded for Loans (€ 20.0 billion) and OTC derivatives (€ 17.2 billion). Overall, the quality of corporate credit exposure has improved with 73 % rated investment grade compared to 72 % as of December 31, 2011. The loan exposure shown in the table above does not take into account any collateral, other credit enhancement or credit risk mitigating transactions. After consideration of such credit mitigants, we believe that our loan book is well-diversified. The decrease in our OTC derivatives exposure, primarily took place in relation to investment grade counterparties. The OTC derivatives exposure does not include credit risk mitigants (other than master agreement netting) or collateral (other than cash). Taking these mitigants into
| | | | |
| Deutsche Bank | | 01 – Management Report | | 83 |
| Financial Report 2012 | | Risk Report | | |
| | |
| | | | |
| | |
| | | | |
account, the remaining current credit exposure was significantly lower, adequately structured, enhanced or well-diversified and geared towards investment grade counterparties. The increase in our debt securities available for sale exposure in comparison to December 31, 2011 is mainly to the strongest counterparties in the rating band iAAA-iAA.
Risk Mitigation for the Corporate Credit Exposure
Our Credit Portfolio Strategies Group (“CPSG”) helps mitigate the risk of our corporate credit exposures. The notional amount of CPSG’s risk reduction activities decreased by 17 % from€ 55.3 billion as of December 31, 2011, to€ 45.7 billion as of December 31, 2012, due to a decrease in the notional of loans requiring hedging and a reduction in hedges used to manage market risk.
As of year-end 2012, CPSG held credit derivatives with an underlying notional amount of€ 27.9 billion. The position totaled€ 37.6 billion as of December 31, 2011. The credit derivatives used for our portfolio management activities are accounted for at fair value.
CPSG also mitigated the credit risk of€ 17.8 billion of loans and lending-related commitments as of December 31, 2012, through synthetic collateralized loan obligations supported predominantly by financial guarantees and, to a lesser extent, credit derivatives for which the first loss piece has been sold. This position totaled€ 17.7 billion as of December 31, 2011.
CPSG has elected to use the fair value option under IAS 39 to report loans and commitments at fair value, provided the criteria for this option are met. The notional amount of CPSG loans and commitments reported at fair value decreased during the year to€ 40.0 billion as of December 31, 2012, from€ 48.3 billion as of December 31, 2011. By reporting loans and commitments at fair value, CPSG has significantly reduced profit and loss volatility that resulted from the accounting mismatch that existed when all loans and commitments were reported at amortized cost while derivative hedges are reported at fair value.
Consumer Credit Exposure
In our consumer credit exposure we monitor consumer loan delinquencies in terms of loans that are 90 days or more past due and net credit costs, which are the annualized net provisions charged after recoveries.
Consumer credit exposure, consumer loan delinquencies and net credit costs
| | | | | | | | | | | | | | | | | | | | | | | | |
| | | Total exposure in€ m. | | | 90 days or more past due
as a % of total exposure | | | Net credit costs
as a % of total exposure1 | |
| | Dec 31, 2012 | | | Dec 31, 2011 | | | Dec 31, 2012 | | | Dec 31, 2011 | | | Dec 31, 2012 | | | Dec 31, 2011 | |
| Consumer credit exposure Germany: | | | 139,939 | | | | 135,069 | | | | 0.84% | | | | 0.95% | | | | 0.29% | | | | 0.49% | |
Consumer and small business financing | | | 20,137 | | | | 19,805 | | | | 1.20% | | | | 1.88% | | | | 1.20% | | | | 1.55% | |
Mortgage lending | | | 119,802 | | | | 115,264 | | | | 0.78% | | | | 0.79% | | | | 0.14% | | | | 0.31% | |
| | | | | | | | | | | | | | | | | | | | | | | | |
| Consumer credit exposure outside Germany | | | 40,065 | | | | 39,672 | | | | 4.58% | | | | 3.93% | | | | 0.66% | | | | 0.61% | |
Consumer and small business financing | | | 13,448 | | | | 13,878 | | | | 9.01% | | | | 7.22% | | | | 1.52% | | | | 1.31% | |
Mortgage lending | | | 26,617 | | | | 25,794 | | | | 2.34% | | | | 2.15% | | | | 0.23% | | | | 0.23% | |
| | | | | | | | | | | | | | | | | | | | | | | | |
Total consumer credit exposure2 | | | 180,004 | | | | 174,741 | | | | 1.67% | | | | 1.63% | | | | 0.38% | | | | 0.52% | |
| |
| 1 | Releases of allowances for credit losses established by consolidated entities prior to their consolidation are not included in the ratio until December 31, 2011 but recorded through net interest income (for detailed description see next section “Impairment Loss and Allowances for Loan Losses”). Taking such amounts into account, the net credit costs as a percentage of total exposure would have amounted to 0.42 % as of December 31, 2011. In 2012 releases of our consolidated entities are included in the net credit costs. |
| 2 | Includes impaired loans amounting to€ 4.2 billion as of December 31, 2012 and€ 3.8 billion as of December 31, 2011. |
The volume of our total consumer credit exposure increased by€ 5.3 billion, or 3.0 %, from year-end 2011 to December 31, 2012. Postbank contributed a net exposure increase of€ 1.0 billion, or 1.3 %, mainly originated in Germany. The volume excluding Postbank rose by€ 4.3 billion, or 4.4 %, mainly driven by our mortgage lending activities in Germany (up€ 4.1 billion). As part of our growth strategy the consumer credit exposure increased in Poland, mainly mortgage lending, by€ 725 million and in India by€ 174 million. The volume in Spain decreased by€ 440 million and in Portugal by€ 108 million following our ongoing de-risking strategy.
| | | | |
| Deutsche Bank | | 01 – Management Report | | 84 |
| Financial Report 2012 | | Risk Report | | |
| |
| | |
| | |
| | | | |
The 90 days or more past due ratio in Germany declined in 2012 driven mainly by a sale of non-performing loans, in addition to benefiting from the favourable economic environment. Apart from the economic development in the rest of Europe the increase in the ratio outside Germany is mainly driven by changes in the charge-off criteria for certain portfolios in 2009. Loans, which were previously fully charged-off upon reaching 270 days past due (180 days past due for credit cards), are now provisioned based on the level of historical loss rates, which are derived from observed recoveries of formerly charged off similar loans. This leads to an increase in 90 days or more past due exposure as the change increased the time until the respective loans are completely charged-off. Assuming no change in the underlying credit performance, the effect will continue to increase the ratio until the portfolio has reached a steady state, which is expected approximately 5 years after the change.
The reduction of net credit costs as a percentage of total exposure is mainly driven by the aforementioned sale of nonperforming loans, but also due to the favourable economic developments in the German market.
Consumer mortgage lending exposure grouped by loan-to-value buckets1
| | | | |
| | Dec 31, 2012 | |
£ 50 % | | | 71 % | |
| | | | |
> 50£ 70 % | | | 16 % | |
| | | | |
> 70£ 90 % | | | 8 % | |
| | | | |
> 90£ 100 % | | | 2 % | |
| | | | |
> 100£ 110 % | | | 1 % | |
| | | | |
> 110£ 130 % | | | 1 % | |
| | | | |
> 130 % | | | 1 % | |
| |
| 1 | When assigning the exposure to the corresponding LTV buckets, the exposure amounts are distributed according to their relative share of the underlying assessed real estate value. |
The LTV expresses the amount of exposure as a percentage of assessed value of real estate.
Our LTV ratios are calculated using the total exposure divided by the current assessed value of the respective properties. These values are updated on a regular basis. The exposure of transactions that are additionally backed by liquid collaterals is reduced by the respective collateral values, whereas any prior charges increase the corresponding total exposure. The LTV calculation includes exposure which is secured by real estate collaterals. Any mortgage lending exposure that is collateralized exclusively by any other type of collateral is not included in the LTV calculation.
The creditor’s creditworthiness, the LTV and the quality of collateral is an integral part of our risk management when originating loans and when monitoring and steering our credit risks. In general, we are willing to accept higher LTV’s, the better the creditor’s creditworthiness is. Nevertheless, restrictions of LTV apply for countries with negative economic outlook or expected declines of real estate values.
As of December 31, 2012, 71 % of our exposure related to the mortgage lending portfolio had a LTV ratio below or equal to 50 %.
Credit Exposure from Derivatives
Exchange-traded derivative transactions (e.g., futures and options) are regularly settled through a central counterparty, the rules and regulations of which provide for daily margining of all current and future credit risk positions emerging out of such transactions. To the extent possible, we also use central counterparty clearing services for OTC derivative transactions (“OTC clearing”); we thereby benefit from the credit risk mitigation achieved through the central counterparty’s settlement system.
| | | | |
| Deutsche Bank | | 01 – Management Report | | 85 |
| Financial Report 2012 | | Risk Report | | |
| | |
| | | | |
| | |
| | | | |
Both the Dodd-Frank Wall Street Reform and Consumer Protection Act (“DFA”) and the European Regulation (EU) No 548/2012 on OTC Derivatives, Central Counterparties and Trade Repositories (“EMIR”) will introduce mandatory OTC Clearing for standardized OTC derivative transactions as well as margin requirements for uncleared OTC derivative transaction. The implementation of DFA and EMIR will further increase our use of credit risk mitigation.
The notional amount of OTC derivatives settled through central counterparties amounted to€ 10.0 trillion as of December 31, 2012, and to€ 10.8 trillion as of December 31, 2011.
Notional amounts and gross market values of derivative transactions
| | | | | | | | | | | | | | | | | | | | | | | | | | | | |
| Dec 31, 2012 | | Notional amount maturity distribution | | | | | | | | | | |
in€ m. | | Within 1 year | | | > 1 and
< 5 years | | | After 5 years | | | Total | | | Positive
market
value | | | Negative
market
value | | | Net
market
value | |
Interest rate related: | | | | | | | | | | | | | | | | | | | | | | | | | | | | |
OTC | | | 15,419,788 | | | | 15,366,636 | | | | 10,478,308 | | | | 41,264,732 | | | | 584,620 | | | | 554,944 | | | | 29,676 | |
Exchange-traded | | | 2,899,159 | | | | 1,169,563 | | | | 4,114 | | | | 4,072,836 | | | | 153 | | | | 144 | | | | 9 | |
| | | | | | | | | | | | | | | | | | | | | | | | | | | | |
Total Interest rate related | | | 18,318,947 | | | | 16,536,199 | | | | 10,482,422 | | | | 45,337,568 | | | | 584,773 | | | | 555,088 | | | | 29,685 | |
| | | | | | | | | | | | | | | | | | | | | | | | | | | | |
Currency related: | | | | | | | | | | | | | | | | | | | | | | | | | | | | |
OTC | | | 4,290,214 | | | | 1,188,952 | | | | 428,949 | | | | 5,908,115 | | | | 94,639 | | | | 101,738 | | | | (7,099) | |
Exchange-traded | | | 19,381 | | | | 470 | | | | – | | | | 19,851 | | | | 8 | | | | 7 | | | | 1 | |
| | | | | | | | | | | | | | | | | | | | | | | | | | | | |
Total Currency related | | | 4,309,595 | | | | 1,189,422 | | | | 428,949 | | | | 5,927,966 | | | | 94,647 | | | | 101,745 | | | | (7,098) | |
| | | | | | | | | | | | | | | | | | | | | | | | | | | | |
Equity/index related: | | | | | | | | | | | | | | | | | | | | | | | | | | | | |
OTC | | | 329,531 | | | | 261,697 | | | | 79,088 | | | | 670,316 | | | | 22,415 | | | | 29,027 | | | | (6,612) | |
Exchange-traded | | | 417,334 | | | | 114,654 | | | | 3,653 | | | | 535,641 | | | | 7,476 | | | | 6,201 | | | | 1,275 | |
| | | | | | | | | | | | | | | | | | | | | | | | | | | | |
Total Equity/index related | | | 746,865 | | | | 376,351 | | | | 82,741 | | | | 1,205,957 | | | | 29,891 | | | | 35,228 | | | | (5,337) | |
| | | | | | | | | | | | | | | | | | | | | | | | | | | | |
Credit derivatives | | | 499,717 | | | | 1,914,989 | | | | 207,623 | | | | 2,622,329 | | | | 49,733 | | | | 46,648 | | | | 3,085 | |
| | | | | | | | | | | | | | | | | | | | | | | | | | | | |
Commodity related: | | | | | | | | | | | | | | | | | | | | | | | | | | | | |
OTC | | | 45,284 | | | | 56,194 | | | | 5,417 | | | | 106,895 | | | | 10,121 | | | | 10,644 | | | | (523) | |
Exchange-traded | | | 194,470 | | | | 107,099 | | | | 1,659 | | | | 303,228 | | | | 4,617 | | | | 4,173 | | | | 444 | |
| | | | | | | | | | | | | | | | | | | | | | | | | | | | |
Total Commodity related | | | 239,754 | | | | 163,293 | | | | 7,076 | | | | 410,123 | | | | 14,738 | | | | 14,817 | | | | (79) | |
| | | | | | | | | | | | | | | | | | | | | | | | | | | | |
Other: | | | | | | | | | | | | | | | | | | | | | | | | | | | | |
OTC | | | 62,890 | | | | 23,991 | | | | 399 | | | | 87,280 | | | | 2,887 | | | | 2,818 | | | | 69 | |
Exchange-traded | | | 12,533 | | | | 1,278 | | | | 5 | | | | 13,816 | | | | 18 | | | | 36 | | | | (18) | |
| | | | | | | | | | | | | | | | | | | | | | | | | | | | |
Total Other | | | 75,423 | | | | 25,269 | | | | 404 | | | | 101,096 | | | | 2,905 | | | | 2,854 | | | | 51 | |
| | | | | | | | | | | | | | | | | | | | | | | | | | | | |
Total OTC business | | | 20,647,424 | | | | 18,812,459 | | | | 11,199,784 | | | | 50,659,667 | | | | 764,415 | | | | 745,819 | | | | 18,596 | |
| | | | | | | | | | | | | | | | | | | | | | | | | | | | |
Total exchange-traded business | | | 3,542,877 | | | | 1,393,064 | | | | 9,431 | | | | 4,945,372 | | | | 12,272 | | | | 10,561 | | | | 1,711 | |
| | | | | | | | | | | | | | | | | | | | | | | | | | | | |
Total | | | 24,190,301 | | | | 20,205,523 | | | | 11,209,215 | | | | 55,605,039 | | | | 776,687 | | | | 756,380 | | | | 20,307 | |
| | | | | | | | | | | | | | | | | | | | | | | | | | | | |
| Positive market values after netting and cash collateral received | | | – | | | | – | | | | – | | | | – | | | | 70,054 | | | | – | | | | – | |
| |
| | | | |
| Deutsche Bank | | 01 – Management Report | | 86 |
| Financial Report 2012 | | Risk Report | | |
| | |
| | | | |
| | |
| | | | |
| | | | | | | | | | | | | | | | | | | | | | | | | | | | |
| Dec 31, 2011 | | Notional amount maturity distribution | | | | | | | | | | |
in€ m. | | Within 1 year | | | > 1 and
< 5 years | | | After 5 years | | | Total | | | Positive
market
value | | | Negative
market
value | | | Net
market
value | |
Interest rate related: | | | | | | | | | | | | | | | | | | | | | | | | | | | | |
OTC | | | 17,946,681 | | | | 17,288,349 | | | | 12,014,092 | | | | 47,249,122 | | | | 595,127 | | | | 574,791 | | | | 20,336 | |
Exchange-traded | | | 635,771 | | | | 179,024 | | | | 6,282 | | | | 821,077 | | | | 101 | | | | 50 | | | | 51 | |
| | | | | | | | | | | | | | | | | | | | | | | | | | | | |
Total Interest rate related | | | 18,582,452 | | | | 17,467,373 | | | | 12,020,374 | | | | 48,070,199 | | | | 595,228 | | | | 574,841 | | | | 20,387 | |
| | | | | | | | | | | | | | | | | | | | | | | | | | | | |
Currency related: | | | | | | | | | | | | | | | | | | | | | | | | | | | | |
OTC | | | 4,357,876 | | | | 1,201,265 | | | | 415,234 | | | | 5,974,375 | | | | 112,784 | | | | 116,134 | | | | (3,350) | |
Exchange-traded | | | 7,521 | | | | 663 | | | | 7 | | | | 8,191 | | | | 140 | | | | 24 | | | | 116 | |
| | | | | | | | | | | | | | | | | | | | | | | | | | | | |
Total Currency related | | | 4,365,397 | | | | 1,201,928 | | | | 415,241 | | | | 5,982,566 | | | | 112,924 | | | | 116,158 | | | | (3,234) | |
| | | | | | | | | | | | | | | | | | | | | | | | | | | | |
Equity/index related: | | | | | | | | | | | | | | | | | | | | | | | | | | | | |
OTC | | | 294,563 | | | | 334,739 | | | | 88,739 | | | | 718,041 | | | | 29,682 | | | | 35,686 | | | | (6,004) | |
Exchange-traded | | | 206,953 | | | | 71,092 | | | | 2,310 | | | | 280,355 | | | | 5,764 | | | | 2,000 | | | | 3,764 | |
| | | | | | | | | | | | | | | | | | | | | | | | | | | | |
Total Equity/index related | | | 501,516 | | | | 405,831 | | | | 91,049 | | | | 998,396 | | | | 35,446 | | | | 37,686 | | | | (2,240) | |
| | | | | | | | | | | | | | | | | | | | | | | | | | | | |
Credit derivatives | | | 673,814 | | | | 2,473,620 | | | | 537,723 | | | | 3,685,157 | | | | 101,115 | | | | 92,988 | | | | 8,127 | |
| | | | | | | | | | | | | | | | | | | | | | | | | | | | |
Commodity related: | | | | | | | | | | | | | | | | | | | | | | | | | | | | |
OTC | | | 84,681 | | | | 112,629 | | | | 4,687 | | | | 201,997 | | | | 13,949 | | | | 14,077 | | | | (128) | |
Exchange-traded | | | 72,321 | | | | 42,353 | | | | 673 | | | | 115,347 | | | | 2,718 | | | | 2,636 | | | | 82 | |
| | | | | | | | | | | | | | | | | | | | | | | | | | | | |
Total Commodity related | | | 157,002 | | | | 154,982 | | | | 5,360 | | | | 317,344 | | | | 16,667 | | | | 16,713 | | | | (46) | |
| | | | | | | | | | | | | | | | | | | | | | | | | | | | |
Other: | | | | | | | | | | | | | | | | | | | | | | | | | | | | |
OTC | | | 77,574 | | | | 38,746 | | | | 2,956 | | | | 119,276 | | | | 5,516 | | | | 4,895 | | | | 621 | |
Exchange-traded | | | 19,704 | | | | 2,781 | | | | 22 | | | | 22,507 | | | | 247 | | | | 324 | | | | (77) | |
| | | | | | | | | | | | | | | | | | | | | | | | | | | | |
Total Other | | | 97,278 | | | | 41,527 | | | | 2,978 | | | | 141,783 | | | | 5,763 | | | | 5,219 | | | | 544 | |
| | | | | | | | | | | | | | | | | | | | | | | | | | | | |
Total OTC business | | | 23,435,189 | | | | 21,449,348 | | | | 13,063,431 | | | | 57,947,968 | | | | 858,173 | | | | 838,571 | | | | 19,602 | |
| | | | | | | | | | | | | | | | | | | | | | | | | | | | |
Total exchange-traded business | | | 942,270 | | | | 295,913 | | | | 9,294 | | | | 1,247,477 | | | | 8,970 | | | | 5,033 | | | | 3,937 | |
| | | | | | | | | | | | | | | | | | | | | | | | | | | | |
Total | | | 24,377,459 | | | | 21,745,261 | | | | 13,072,725 | | | | 59,195,445 | | | | 867,143 | | | | 843,604 | | | | 23,539 | |
| | | | | | | | | | | | | | | | | | | | | | | | | | | | |
| Positive market values after netting and cash collateral received | | | – | | | | – | | | | – | | | | – | | | | 84,272 | | | | – | | | | – | |
| |
The following two tables present specific disclosures in relation to Pillar 3. Per regulation it is not required to audit Pillar 3 disclosures.
Positive market values or replacement costs of derivative transactions (unaudited)
| | | | | | | | | | | | | | | | | | | | | | | | | | | | | | | | |
| | | Dec 31, 2012 | | | Dec 31, 2011 | |
in€ m.1 | | Positive
market values
before netting
and collateral
agreements | | | Netting
agreements | | | Eligible
collateral2 | | | Positive
market values
after netting
and collateral
agreements | | | Positive
market values
before netting
and collateral
agreements | | | Netting
agreements | | | Eligible
collateral | | | Positive
market values
after netting
and collateral
agreements | |
| Interest rate related | | | 578,128 | | | | 490,905 | | | | 61,838 | | | | 25,384 | | | | 587,718 | | | | 502,390 | | | | 51,645 | | | | 33,683 | |
| | | | | | | | | | | | | | | | | | | | | | | | | | | | | | | | |
| Currency related | | | 93,797 | | | | 71,525 | | | | 8,091 | | | | 14,181 | | | | 112,924 | | | | 86,403 | | | | 9,477 | | | | 17,044 | |
| | | | | | | | | | | | | | | | | | | | | | | | | | | | | | | | |
| Equity/index related | | | 29,621 | | | | 19,209 | | | | 2,061 | | | | 8,352 | | | | 35,412 | | | | 23,368 | | | | 3,344 | | | | 8,700 | |
| | | | | | | | | | | | | | | | | | | | | | | | | | | | | | | | |
| Credit derivatives | | | 49,285 | | | | 39,677 | | | | 2,459 | | | | 7,149 | | | | 101,113 | | | | 84,747 | | | | 6,002 | | | | 10,364 | |
| | | | | | | | | | | | | | | | | | | | | | | | | | | | | | | | |
| Commodity related | | | 14,701 | | | | 8,231 | | | | 649 | | | | 5,821 | | | | 16,648 | | | | 12,602 | | | | 809 | | | | 3,236 | |
| | | | | | | | | | | | | | | | | | | | | | | | | | | | | | | | |
| Other | | | 2,783 | | | | 2,244 | | | | 392 | | | | 147 | | | | 5,768 | | | | 4,743 | | | | 515 | | | | 510 | |
| | | | | | | | | | | | | | | | | | | | | | | | | | | | | | | | |
| Total | | | 768,315 | | | | 631,791 | | | | 75,490 | | | | 61,034 | | | | 859,583 | | | | 714,253 | | | | 71,793 | | | | 73,537 | |
| |
| 1 | Excludes for derivatives reported as other assets for December 31, 2012, and December 31, 2011, respectively,€ 8.4 billion (€ 7.6 billion) positive market values before netting and collateral or€ 791 million (€ 612 million) positive market values after netting and collateral. |
| 2 | Includes€ 66.5 billion cash collateral and€ 9 billion non-cash collateral as of December 31, 2012, and€ 61.1 billion cash collateral and€ 10.7 billion non-cash collateral as of December 31, 2011. |
The above table shows the positive market values after netting and collateral, which represent only 8 % of the total IFRS positive market values. Apart from master netting agreements, we have entered into various types of collateral agreements (such as “CSAs” to master agreements), with the vast majority being bilateral.
| | | | |
| Deutsche Bank | | 01 – Management Report | | 87 |
| Financial Report 2012 | | Risk Report | | |
| | |
| | | | |
| | |
| | | | |
Nominal volumes of credit derivative exposure (unaudited)
| | | | | | | | | | | | | | | | | | | | |
| | | Dec 31, 2012 | |
| | | Used for own credit portfolio | | | Acting as intermediary | | | | |
in€ m. | | Protection bought | | | Protection sold | | | Protection bought | | | Protection sold | | | Total1 | |
Credit default swaps – single name | | | 38,885 | | | | 650 | | | | 779,669 | | | | 758,427 | | | | 1,577,631 | |
| | | | | | | | | | | | | | | | | | | | |
Credit default swaps – multi name | | | 9,209 | | | | 168 | | | | 512,299 | | | | 509,832 | | | | 1,031,508 | |
| | | | | | | | | | | | | | | | | | | | |
Total return swaps | | | 919 | | | | 1,759 | | | | 6,388 | | | | 4,124 | | | | 13,190 | |
| | | | | | | | | | | | | | | | | | | | |
| Total notional amount of credit derivatives | | | 49,013 | | | | 2,577 | | | | 1,298,356 | | | | 1,272,383 | | | | 2,622,329 | |
| |
| 1 | Includes credit default swaps on indices and nth-to-default credit default swaps. |
| | | | | | | | | | | | | | | | | | | | |
| | | Dec 31, 2011 | |
| | | Used for own credit portfolio | | | Acting as intermediary | | | | |
in€ m. | | Protection bought | | | Protection sold | | | Protection bought | | | Protection sold | | | Total1 | |
Credit default swaps – single name | | | 48,085 | | | | 844 | | | | 1,017,110 | | | | 999,112 | | | | 2,065,151 | |
| | | | | | | | | | | | | | | | | | | | |
Credit default swaps – multi name | | | 604 | | | | 55 | | | | 782,384 | | | | 824,100 | | | | 1,607,143 | |
| | | | | | | | | | | | | | | | | | | | |
Total return swaps | | | 454 | | | | 927 | | | | 6,416 | | | | 5,066 | | | | 12,863 | |
| | | | | | | | | | | | | | | | | | | | |
| Total notional amount of credit derivatives | | | 49,143 | | | | 1,826 | | | | 1,805,910 | | | | 1,828,278 | | | | 3,685,157 | |
| |
| 1 | Includes credit default swaps on indices and nth-to-default credit default swaps. |
The tables split the exposure into the part held in the regulatory banking book, which is shown under the heading “used for own credit portfolio” and the part held in the regulatory trading book, referred to as “acting as intermediary”. The decrease in credit derivatives is primarily related to trade compression, de-risking activities and reduced volumes in the credit derivatives market.
As the replacement values of derivatives portfolios fluctuate with movements in market rates and with changes in the transactions in the portfolios, we also estimate the potential future replacement costs of the portfolios over their lifetimes or, in case of collateralized portfolios, over appropriate unwind periods. We measure the potential future exposure against separate limits. We supplement the potential future exposure analysis with stress tests to estimate the immediate impact of extreme market events on our exposures (such as event risk in our Emerging Markets portfolio).
The potential future exposure measure which we use is generally given by a time profile of simulated positive market values of each counterparty’s derivatives portfolio, for which netting and collateralization are considered. For limit monitoring we employ the 95th quantile of the resulting distribution of market values, internally referred to as potential future exposure (“PFE”). The average exposure profiles generated by the same calculation process are used to derive the so-called average expected exposure (“AEE”) measure, which we use to reflect expected future replacement costs within our credit risk economic capital, and the expected positive exposure (“EPE”) measure driving our regulatory capital requirements. While AEE and EPE are generally calculated with respect to a time horizon of one year, the PFE is measured over the entire lifetime of a transaction or netting set for uncollateralized portfolios and over an appropriate unwind period for collateralized portfolios, respectively. We also employ the aforementioned calculation process to derive stressed exposure results for input into our credit portfolio stress testing.
The PFE profile of each counterparty is compared daily to a PFE limit profile set by the responsible credit officer. PFE limits are integral part of the overall counterparty credit exposure management in line with other limit types. Breaches of PFE limits at any one profile time point are highlighted for action within our credit risk management process. The EPE is directly used in the customer level calculation of the IRBA regulatory capital under the so-called internal model method (“IMM”), whereas AEE feeds as a loan equivalent into the Group’s credit portfolio model where it is combined with all other exposure to a counterparty within the respective simulation and allocation process (see Chapter “Monitoring Credit Risk”).
| | | | |
| Deutsche Bank | | 01 – Management Report | | 88 |
| Financial Report 2012 | | Risk Report | | |
| | |
| | | | |
| | |
| | | | |
Credit Exposure from Nonderivative Trading Assets
Composition of nonderivative trading assets
| | | | | | | | |
in€ m. | | Dec 31, 2012 | | | Dec 31, 2011 | |
Government paper & agencies | | | 94,597 | | | | 95,336 | |
| | | | | | | | |
Financial institutions & corporates | | | 53,994 | | | | 56,442 | |
| | | | | | | | |
Equities | | | 65,457 | | | | 59,754 | |
| | | | | | | | |
Traded loans | | | 18,152 | | | | 18,039 | |
| | | | | | | | |
Other | | | 13,338 | | | | 11,353 | |
| | | | | | | | |
Total nonderivative trading assets | | | 245,538 | | | | 240,924 | |
| |
Traded credit products such as bonds in our developed markets’ trading book are managed by a dedicated risk management unit combining our credit and market risk expertise. We use appropriate portfolio limits and ratings-driven thresholds on single-issuer basis, combined with our market risk management tools to risk manage such positions.
Asset Quality
This section describes the asset quality of our loans. All loans where known information about possible credit problems of borrowers causes our management to have serious doubts as to the collectability of the borrower’s contractual obligations are included in this section.
Overview of performing, renegotiated, past due and impaired loans by customer groups
| | | | | | | | | | | | | | | | | | | | | | | | |
| | | Dec 31, 2012 | | | Dec 31, 20111 | |
in€ m. | | Corporate
loans | | | Consumer
loans | | | Total | | | Corporate
loans | | | Consumer
loans | | | Total | |
| Loans neither past due, nor renegotiated or impaired | | | 213,591 | | | | 171,233 | | | | 384,824 | | | | 233,097 | | | | 165,809 | | | | 398,906 | |
| | | | | | | | | | | | | | | | | | | | | | | | |
| Past due loans, neither renegotiated nor impaired | | | 1,562 | | | | 4,366 | | | | 5,928 | | | | 1,579 | | | | 5,057 | | | | 6,636 | |
| | | | | | | | | | | | | | | | | | | | | | | | |
| Loans renegotiated, but not impaired | | | 688 | | | | 200 | | | | 888 | | | | 997 | | | | 67 | | | | 1,064 | |
| | | | | | | | | | | | | | | | | | | | | | | | |
| Impaired loans | | | 6,129 | | | | 4,206 | | | | 10,335 | | | | 6,262 | | | | 3,808 | | | | 10,070 | |
| | | | | | | | | | | | | | | | | | | | | | | | |
| Total | | | 221,970 | | | | 180,005 | | | | 401,975 | | | | 241,935 | | | | 174,741 | | | | 416,676 | |
| |
| 1 | Numbers for 2011 adjusted. |
| | | | | | | | | | | | |
| | | | | | | | | | | | | |
| | | Past Due Loans | |
| | | Loans are considered to be past due if contractually agreed payments of principal and/or interest remain unpaid by the borrower, except if those loans are acquired through consolidation. The latter are considered to be past due if payments of principal and/or interest, which were expected at a certain payment date at the time of the initial consolidation of the loans, are unpaid by the borrower. Non-impaired past due loans at amortized cost by past due status | |
| | | | |
| | | | | | | | | | | | | |
| | | in€ m. | | Dec 31, 2012 | | | Dec 31, 2011 | |
| | | Loans less than 30 days past due | | | 3,898 | | | | 4,394 | |
| | | | | | | | | | | |
| | | Loans 30 or more but less than 60 days past due | | | 967 | | | | 958 | |
| | | | | | | | | | | |
| | | Loans 60 or more but less than 90 days past due | | | 394 | | | | 420 | |
| | | | | | | | | | | |
| | | Loans 90 days or more past due | | | 716 | | | | 907 | |
| | | | | | | | | | | |
| | | Total | | | 5,975 | | | | 6,678 | |
| | | | |
| | | | | | |
Non-impaired past due loans at amortized cost by industry
| | | | | | | | |
in€ m. | | Dec 31, 2012 | | | Dec 31, 2011 | |
Banks and insurance | | | 3 | | | | 77 | |
| | | | | | | | |
Fund management activities | | | 3 | | | | 9 | |
| | | | | | | | |
Manufacturing | | | 473 | | | | 233 | |
| | | | | | | | |
Wholesale and retail trade | | | 187 | | | | 439 | |
| | | | | | | | |
Households | | | 3,781 | | | | 4,425 | |
| | | | | | | | |
Commercial real estate activities | | | 888 | | | | 814 | |
| | | | | | | | |
Public sector | | | 19 | | | | 16 | |
| | | | | | | | |
Other | | | 621 | | | | 665 | |
| | | | | | | | |
Total | | | 5,975 | | | | 6,678 | |
| |
| | | | |
| Deutsche Bank | | 01 – Management Report | | 89 |
| Financial Report 2012 | | Risk Report | | |
| | |
| | | | |
| | |
| | | | |
Non-impaired past due loans at amortized cost by region
| | | | | | | | | | | | |
in€ m. | | Dec 31, 2012 | | | Dec 31, 2011 | |
Germany | | | | | | | 3,238 | | | | 3,749 | |
| | | | | | | | |
Western Europe (excluding Germany) | | | 2,141 | | | | 2,532 | |
| | | | | | | | |
Eastern Europe | | | 148 | | | | 143 | |
| | | | | | | | |
North America | | | 397 | | | | 165 | |
| | | | | | | | |
Central and South America | | | 4 | | | | 14 | |
| | | | | | | | |
Asia/Pacific | | | 45 | | | | 73 | |
| | | | | | | | |
Africa | | | 2 | | | | 2 | |
| | | | | | | | |
Other | | | – | | | | – | |
| | | | | | | | |
Total | | | 5,975 | | | | 6,678 | |
| |
| | | | | |
Our non-impaired past due loans decreased by€ 703 million to€ 6.0 billion as of December 31, 2012, largely due to a reduction in households in Germany and Western Europe (excluding Germany). 65 % of our non-impaired past due loans were less than 30 days past due and 54 % were with counterparties domiciled in Germany, while industry concentration was with households (63 %).
Aggregated value of collateral – with the fair values of collateral capped at loan outstandings – held against our non-impaired past due loans
| | | | | | | | | | | | |
in€ m. | | Dec 31, 2012 | | | Dec 31, 2011 | |
Financial and other collateral | | | 3,248 | | | | 3,973 | |
| | | | | | | | |
Guarantees received | | | 167 | | | | 158 | |
| | | | | | | | |
Total | | | 3,415 | | | | 4,131 | |
| |
| |
The reduction of the collateral held for our non-impaired past due loans of€ 716 million mainly results from one customer and from the overall decrease of our non-impaired past due loans, both in Western Europe (excluding Germany).
Renegotiated Loans and Forbearances
Loans that have been renegotiated in such a way that we, for economic or legal reasons related to the borrower’s financial difficulties, granted a concession to the borrower that we would not otherwise have considered are disclosed as renegotiated loans. As of December 31, 2012, the level of our renegotiated loans increased slightly by€ 96 million or 4 % to€ 2.5 billion compared to prior year-end, of which€ 1.6 billion were impaired. Increases in renegotiated loans considered impaired were only partially compensated by an overall decrease in renegotiated loans considered non-impaired.
For economic or legal reasons we might close a forbearance agreement with a borrower who faces financial difficulties in order to ease the contractual obligation for a limited period of time. A case by case approach is applied for our corporate clients considering each transaction and client specific facts and circumstances. For consumer loans we offer forbearances for a limited period of time, in which the total or partial outstanding or future installments are deferred to a later point of time. However, the amount not paid including accrued interest during this period must be re-compensated at a later point of time. Repayment options include distribution over residual tenor, a one-off payment or a tenor extension. Forbearances are restricted and depending on the economic situation of the client, our risk management strategies and the local legislation. In case of a forbearance agreement is entered into, an impairment measurement is conducted as described below, an impairment charge is taken if necessary and the loan is subsequently recorded as impaired. These forbearances are considered as renegotiations and disclosed accordingly.
Impaired Loans
Credit Risk Management regularly assesses whether there is objective evidence that a loan or group of loans is impaired. A loan or group of loans is impaired and impairment losses are incurred if:
| — | | there is objective evidence of impairment as a result of a loss event that occurred after the initial recognition of the asset and up to the balance sheet date (a “loss event”), |
| | | | |
| Deutsche Bank | | 01 – Management Report | | 90 |
| Financial Report 2012 | | Risk Report | | |
| | |
| | | | |
| | |
| | | | |
| | | | | | | | | | | | | | | | | | |
| | | — the loss event had an impact on the estimated future cash flows of the financial asset or the group of financial assets, and — a reliable estimate of the loss amount can be made. Credit Risk Management’s loss assessments are subject to regular review in collaboration with Group Finance. The results of this review are reported to and approved by an oversight committee comprised of Group Finance and Risk senior management. Within consolidations we acquired certain loans for which an impairment had been established previously by the consolidated entities. These loans were taken onto our balance sheet at their fair values as determined by their expected cash flows which reflected the credit quality of these loans at the time of acquisition. As long as our cash flow expectations regarding these loans have not deteriorated since acquisition, they are not considered impaired loans. Impairment Loss and Allowance for Loan Losses If there is evidence of impairment the impairment loss is generally calculated on the basis of discounted expected cash flows using the original effective interest rate of the loan. If the terms of a loan are renegotiated or otherwise modified because of financial difficulties of the borrower without qualifying for a derecognition of the loan, the impairment loss is measured using the original effective interest rate before modification of terms. We reduce the carrying amount of the impaired loan by the use of an allowance account and recognize the amount of the loss in the consolidated statement of income as a component of the provision for credit losses. We record increases to our allowance for loan losses as an increase of the provision for loan losses in our income statement. Charge-offs reduce our allowance while recoveries, if any, are credited to the allowance account. If we determine that we no longer require allowances which we have previously established, we decrease our allowance and record the amount as a reduction of the provision for loan losses in our income statement. When it is considered that there is no realistic prospect of recovery and all collateral has been realized or transferred to us, the loan and any associated allowance for loan losses is charged off (i.e., the loan and the related allowance for loan losses are removed from the balance sheet). While we assess the impairment for our corporate credit exposures individually, we assess the impairment of our smaller-balance standardized homogeneous loans collectively. Our collectively assessed allowance for non-impaired loans reflects allowances to cover for incurred losses that have neither been individually identified nor provided for as part of the impairment assessment of smaller-balance homogeneous loans. For further details regarding our accounting policies regarding impairment loss and allowance for credit losses please refer to Note 01 “Significant Accounting Policies”. Impaired loans, allowance for loan losses and coverage ratios by business division |
| | | | Dec 31, 2012 | | Dec 31, 20111 | | 2012 increase (decrease) from 2011 |
| | in€ m. | | Impaired loans | | Loan loss
allowance | | Impaired loan
coverage ratio in % | | Impaired loans | | Loan loss
allowance | | Impaired loan
coverage ratio in % | | Impaired loans | | Impaired loan
coverage ratio in ppt |
| | Corporate Banking & Securities | | 1,005 | | 721 | | 72 | | 1,197 | | 930 | | 78 | | (192) | | (6) |
| | | | | | | | | | | | | | | | | | |
| | Global Transaction Banking | | 1,014 | | 464 | | 46 | | 639 | | 332 | | 52 | | 375 | | (6) |
| | | | | | | | | | | | | | | | | | |
| | Asset & Wealth Management | | 138 | | 33 | | 24 | | 452 | | 29 | | 6 | | (314) | | 18 |
| | | | | | | | | | | | | | | | | | |
| | Private & Business Clients | | 4,188 | | 2,071 | | 49 | | 3,759 | | 1,572 | | 42 | | 429 | | 7 |
| | | | | | | | | | | | | | | | | | |
| | Non-Core Operations Unit | | 3,990 | | 1,407 | | 35 | | 4,023 | | 1,298 | | 32 | | (33) | | 3 |
| | | | | | | | | | | | | | | | | | |
| | Thereof: assets reclassified to loans and receivables according to IAS 39 | | 1,499 | | 488 | | 33 | | 1,482 | | 444 | | 30 | | 17 | | 3 |
| | | | | | | | | | | | | | | | | | |
| | Total | | 10,335 | | 4,696 | | 45 | | 10,070 | | 4,162 | | 41 | | 265 | | 4 |
| | |
| | 1 Numbers for 2011 adjusted. |
| | | | |
| Deutsche Bank | | 01 – Management Report | | 91 |
| Financial Report 2012 | | Risk Report | | |
| | |
| | | | |
| | |
| | | | |
Impaired loans, allowance for loan losses and coverage ratios by industry
| | | | | | | | | | | | | | | | | | | | | | | | | | | | | | | | |
| Dec 31, 2012 | | Impaired Loans | | | Loan loss allowance | | | | |
in€ m. | | Individually
assessed | | | Collectively
assessed | | | Total | | | Individually
assessed
allowance | | | Collectively
assessed
allowance for
impaired
loans | | | Collectively
assessed
allowance for
non-impaired
loans | | | Total | | | Impaired loan
coverage
ratio in % | |
Banks and insurance | | | 53 | | | | – | | | | 53 | | | | 20 | | | | – | | | | 15 | | | | 35 | | | | 67 | |
| | | | | | | | | | | | | | | | | | | | | | | | | | | | | | | | |
Fund management activities | | | 127 | | | | 1 | | | | 128 | | | | 1 | | | | 0 | | | | 44 | | | | 45 | | | | 35 | |
| | | | | | | | | | | | | | | | | | | | | | | | | | | | | | | | |
Manufacturing | | | 720 | | | | 206 | | | | 926 | | | | 455 | | | | 87 | | | | 63 | | | | 605 | | | | 65 | |
| | | | | | | | | | | | | | | | | | | | | | | | | | | | | | | | |
Wholesale and retail trade | | | 355 | | | | 199 | | | | 554 | | | | 207 | | | | 95 | | | | 34 | | | | 336 | | | | 61 | |
| | | | | | | | | | | | | | | | | | | | | | | | | | | | | | | | |
Households | | | 562 | | | | 3,145 | | | | 3,707 | | | | 216 | | | | 1,623 | | | | 124 | | | | 1,963 | | | | 53 | |
| | | | | | | | | | | | | | | | | | | | | | | | | | | | | | | | |
| Commercial real estate activities | | | 3,087 | | | | 271 | | | | 3,358 | | | | 665 | | | | 23 | | | | 23 | | | | 711 | | | | 21 | |
| | | | | | | | | | | | | | | | | | | | | | | | | | | | | | | | |
Public sector | | | – | | | | – | | | | – | | | | – | | | | 0 | | | | 2 | | | | 2 | | | | – | |
| | | | | | | | | | | | | | | | | | | | | | | | | | | | | | | | |
Other | | | 1,225 | | | | 384 | | | | 1,609 | | | | 702 | | | | 157 | | | | 140 | | | | 999 | | | | 62 | |
| | | | | | | | | | | | | | | | | | | | | | | | | | | | | | | | |
Total | | | 6,129 | | | | 4,206 | | | | 10,335 | | | | 2,266 | | | | 1,985 | | | | 445 | | | | 4,696 | | | | 45 | |
| |
| |
| | | | | | | | | | | | | | | | | | | | | | | | | | | | | | | | |
| Dec 31, 20111 | | Impaired Loans | | | Loan loss allowance | | | | |
in€ m. | | Individually
assessed | | | Collectively
assessed | | | Total | | | Individually
assessed
allowance | | | Collectively
assessed
allowance for
impaired
loans | | | Collectively
assessed
allowance for
non-impaired
loans | | | Total | | | Impaired loan
coverage
ratio in % | |
Banks and insurance | | | 118 | | | | – | | | | 118 | | | | 98 | | | | 3 | | | | 13 | | | | 114 | | | | 97 | |
| | | | | | | | | | | | | | | | | | | | | | | | | | | | | | | | |
Fund management activities | | | 917 | | | | – | | | | 917 | | | | 322 | | | | – | | | | 211 | | | | 533 | | | | 58 | |
| | | | | | | | | | | | | | | | | | | | | | | | | | | | | | | | |
Manufacturing | | | 669 | | | | 162 | | | | 831 | | | | 364 | | | | 69 | | | | 89 | | | | 522 | | | | 63 | |
| | | | | | | | | | | | | | | | | | | | | | | | | | | | | | | | |
Wholesale and retail trade | | | 330 | | | | 138 | | | | 468 | | | | 164 | | | | 75 | | | | 33 | | | | 272 | | | | 58 | |
| | | | | | | | | | | | | | | | | | | | | | | | | | | | | | | | |
Households | | | 394 | | | | 3,008 | | | | 3,402 | | | | 155 | | | | 1,320 | | | | 89 | | | | 1,565 | | | | 46 | |
| | | | | | | | | | | | | | | | | | | | | | | | | | | | | | | | |
| Commercial real estate activities | | | 2,721 | | | | 224 | | | | 2,945 | | | | 424 | | | | 18 | | | | 50 | | | | 492 | | | | 17 | |
| | | | | | | | | | | | | | | | | | | | | | | | | | | | | | | | |
Public sector | | | – | | | | – | | | | – | | | | – | | | | – | | | | 1 | | | | 1 | | | | – | |
| | | | | | | | | | | | | | | | | | | | | | | | | | | | | | | | |
Other | | | 1,113 | | | | 276 | | | | 1,389 | | | | 484 | | | | 127 | | | | 52 | | | | 663 | | | | 48 | |
| | | | | | | | | | | | | | | | | | | | | | | | | | | | | | | | |
Total | | | 6,262 | | | | 3,808 | | | | 10,070 | | | | 2,011 | | | | 1,612 | | | | 538 | | | | 4,162 | | | | 41 | |
| |
| |
| 1 | Numbers for 2011 adjusted. |
Impaired loans, allowance for loan losses and coverage ratios by region
| | | | | | | | | | | | | | | | | | | | | | | | | | | | | | | | |
| Dec 31, 2012 | | Impaired Loans | | | Loan loss allowance | | | | |
in€ m. | | Individually
assessed | | | Collectively
assessed | | | Total | | | Individually
assessed
allowance | | | Collectively
assessed
allowance for
impaired
loans | | | Collectively
assessed
allowance for
non-impaired
loans | | | Total | | | Impaired loan
coverage
ratio in % | |
Germany | | | 1,822 | | | | 1,793 | | | | 3,615 | | | | 783 | | | | 817 | | | | 129 | | | | 1,729 | | | | 48 | |
| | | | | | | | | | | | | | | | | | | | | | | | | | | | | | | | |
| Western Europe (excluding Germany) | | | 3,276 | | | | 2,200 | | | | 5,476 | | | | 1,116 | | | | 1,012 | | | | 180 | | | | 2,308 | | | | 42 | |
| | | | | | | | | | | | | | | | | | | | | | | | | | | | | | | | |
Eastern Europe | | | 137 | | | | 207 | | | | 344 | | | | 53 | | | | 156 | | | | 11 | | | | 220 | | | | 64 | |
| | | | | | | | | | | | | | | | | | | | | | | | | | | | | | | | |
North America | | | 624 | | | | 2 | | | | 626 | | | | 232 | | | | 0 | | | | 84 | | | | 316 | | | | 50 | |
| | | | | | | | | | | | | | | | | | | | | | | | | | | | | | | | |
Central and South America | | | 41 | | | | – | | | | 41 | | | | 31 | | | | – | | | | 5 | | | | 36 | | | | 88 | |
| | | | | | | | | | | | | | | | | | | | | | | | | | | | | | | | |
Asia/Pacific | | | 229 | | | | 4 | | | | 233 | | | | 51 | | | | 0 | | | | 28 | | | | 79 | | | | 34 | |
| | | | | | | | | | | | | | | | | | | | | | | | | | | | | | | | |
Africa | | | – | | | | – | | | | – | | | | – | | | | – | | | | 3 | | | | 3 | | | | – | |
| | | | | | | | | | | | | | | | | | | | | | | | | | | | | | | | |
Other | | | – | | | | – | | | | – | | | | – | | | | – | | | | 5 | | | | 5 | | | | – | |
| | | | | | | | | | | | | | | | | | | | | | | | | | | | | | | | |
Total | | | 6,129 | | | | 4,206 | | | | 10,335 | | | | 2,266 | | | | 1,985 | | | | 445 | | | | 4,696 | | | | 45 | |
| |
| |
| | | | | | | | | | | | | | | | | | | | | | | | | | | | | | | | |
| Dec 31, 20111 | | Impaired Loans | | | Loan loss allowance | | | | |
in€ m. | | Individually
assessed | | | Collectively
assessed | | | Total | | | Individually
assessed
allowance | | | Collectively
assessed
allowance for
impaired
loans | | | Collectively
assessed
allowance for
non-impaired
loans | | | Total | | | Impaired loan
coverage
ratio in % | |
Germany | | | 1,870 | | | | 1,851 | | | | 3,721 | | | | 832 | | | | 683 | | | | 138 | | | | 1,653 | | | | 45 | |
| | | | | | | | | | | | | | | | | | | | | | | | | | | | | | | | |
| Western Europe (excluding Germany) | | | 2,975 | | | | 1,690 | | | | 4,665 | | | | 841 | | | | 751 | | | | 204 | | | | 1,796 | | | | 38 | |
| | | | | | | | | | | | | | | | | | | | | | | | | | | | | | | | |
Eastern Europe | | | 52 | | | | 189 | | | | 241 | | | | 36 | | | | 172 | | | | 10 | | | | 218 | | | | 90 | |
| | | | | | | | | | | | | | | | | | | | | | | | | | | | | | | | |
North America | | | 1,058 | | | | 75 | | | | 1,133 | | | | 193 | | | | 1 | | | | 152 | | | | 345 | | | | 30 | |
| | | | | | | | | | | | | | | | | | | | | | | | | | | | | | | | |
Central and South America | | | 40 | | | | 0 | | | | 40 | | | | 28 | | | | – | | | | 6 | | | | 35 | | | | 87 | |
| | | | | | | | | | | | | | | | | | | | | | | | | | | | | | | | |
Asia/Pacific | | | 267 | | | | 3 | | | | 270 | | | | 81 | | | | 1 | | | | 24 | | | | 106 | | | | 39 | |
| | | | | | | | | | | | | | | | | | | | | | | | | | | | | | | | |
Africa | | | 0 | | | | 0 | | | | 0 | | | | 0 | | | | – | | | | 3 | | | | 3 | | | | – | |
| | | | | | | | | | | | | | | | | | | | | | | | | | | | | | | | |
Other | | | – | | | | 0 | | | | 0 | | | | – | | | | 4 | | | | 2 | | | | 6 | | | | – | |
| | | | | | | | | | | | | | | | | | | | | | | | | | | | | | | | |
Total | | | 6,262 | | | | 3,808 | | | | 10,070 | | | | 2,011 | | | | 1,612 | | | | 538 | | | | 4,162 | | | | 41 | |
| |
| |
| 1 | Numbers for 2011 adjusted. |
| | | | |
| Deutsche Bank | | 01 – Management Report | | 92 |
| Financial Report 2012 | | Risk Report | | |
| | |
| | | | |
| | |
| | | | |
Development of Impaired Loans
| | | | | | | | | | | | | | | | | | | | | | | | |
| | | Dec 31, 2012 | | | Dec 31, 20111 | |
in€ m. | | Individually
assessed | | | Collectively
assessed | | | Total | | | Individually
assessed | | | Collectively
assessed | | | Total | |
Balance, beginning of year | | | 6,262 | | | | 3,808 | | | | 10,070 | | | | 3,564 | | | | 2,749 | | | | 6,313 | |
| | | | | | | | | | | | | | | | | | | | | | | | |
Classified as impaired during the year2 | | | 2,860 | | | | 1,912 | | | | 4,772 | | | | 4,497 | | | | 3,475 | | | | 7,972 | |
| | | | | | | | | | | | | | | | | | | | | | | | |
Transferred to not impaired during the year2 | | | (1,932) | | | | (930) | | | | (2,862) | | | | (1,230) | | | | (1,811) | | | | (3,041) | |
| | | | | | | | | | | | | | | | | | | | | | | | |
Charge-offs | | | (798) | | | | (483) | | | | (1,281) | | | | (553) | | | | (512) | | | | (1,065) | |
| | | | | | | | | | | | | | | | | | | | | | | | |
Disposals of impaired loans | | | (249) | | | | (122) | | | | (371) | | | | (9) | | | | (76) | | | | (85) | |
| | | | | | | | | | | | | | | | | | | | | | | | |
Exchange rate and other movements | | | (14) | | | | 21 | | | | 7 | | | | (7) | | | | (17) | | | | (24) | |
| | | | | | | | | | | | | | | | | | | | | | | | |
Balance, end of year | | | 6,129 | | | | 4,206 | | | | 10,335 | | | | 6,262 | | | | 3,808 | | | | 10,070 | |
| |
| |
| 1 | Numbers for 2011 adjusted. |
Our impaired loans increased by€ 265 million to€ 10.3 billion in 2012 as net new impaired loans of€ 1.5 billion were partly offset by€ 1.3 billion charge-offs. The overall increase is mainly attributable to a net increase of€ 398 million in our collectively assessed impaired loans, predominantly relating to households in Western Europe (excluding Germany). This increase in collectively assessed impaired loans was partly compensated by a€ 133 million net decrease in our individually assessed impaired loans, primarily caused by reductions from de-risking through sale or restructuring of exposures in North America which overcompensated increases in the commercial real estate sector and households in Western Europe (excluding Germany).
The impaired loan coverage ratio improved from 41 % to 45 % mainly attributable to Postbank. At change of control, all loans classified as impaired by Postbank were classified as performing by Deutsche Bank and also initially recorded at fair value. Subsequent increases in provisions at the Postbank level resulted in an impairment of the full loan from a Deutsche Bank consolidated perspective, but with an allowance being built for only the incremental provision. Due to the sale of larger impaired commercial real estate financings as part of our de-risking activities the latter effect has been partially reversed. In addition, the overall increased level of our allowance contributed also to the coverage ratio increase.
Our impaired loans included€ 1.5 billion among the loans reclassified to loans and receivables in accordance with IAS 39. This position is unchanged from prior year, since gross increases of€ 0.3 billion were offset by charge-offs.
Impaired loans, provision for loan losses and recoveries by Industry
| | | | | | | | | | | | | | | | | | | | | | | | |
| | | Dec 31, 2012 | | | 12 months ending Dec 31, 2012 | | | Dec 31, 20111 | | | 12 months ending Dec 31, 2011 | |
in€ m. | | Total
impaired
loans | | | Provision for
loan losses
before
recoveries | | | Recoveries | | | Total
impaired
loans | | | Provision for
loan losses
before
recoveries | | | Recoveries | |
Banks and insurances | | | 53 | | | | 17 | | | | 1 | | | | 118 | | | | 52 | | | | 1 | |
| | | | | | | | | | | | | | | | | | | | | | | | |
Fund management activities | | | 128 | | | | (20) | | | | 1 | | | | 917 | | | | 32 | | | | 0 | |
| | | | | | | | | | | | | | | | | | | | | | | | |
Manufacturing | | | 926 | | | | 110 | | | | 18 | | | | 831 | | | | 156 | | | | 21 | |
| | | | | | | | | | | | | | | | | | | | | | | | |
Wholesale and retail trade | | | 554 | | | | 81 | | | | 7 | | | | 468 | | | | 74 | | | | 9 | |
| | | | | | | | | | | | | | | | | | | | | | | | |
Households | | | 3,707 | | | | 742 | | | | 138 | | | | 3,402 | | | | 982 | | | | 109 | |
| | | | | | | | | | | | | | | | | | | | | | | | |
| Commercial real estate activities | | | 3,358 | | | | 357 | | | | 3 | | | | 2,945 | | | | 356 | | | | 5 | |
| | | | | | | | | | | | | | | | | | | | | | | | |
Public sector | | | – | | | | 1 | | | | – | | | | – | | | | 2 | | | | 0 | |
| | | | | | | | | | | | | | | | | | | | | | | | |
Other | | | 1,609 | | | | 633 | | | | 27 | | | | 1,389 | | | | 347 | | | | 22 | |
| | | | | | | | | | | | | | | | | | | | | | | | |
Total | | | 10,335 | | | | 1,922 | | | | 195 | | | | 10,070 | | | | 2,000 | | | | 168 | |
| |
| 1 | Numbers for 2011 adjusted. |
| | | | |
| Deutsche Bank | | 01 – Management Report | | 93 |
| Financial Report 2012 | | Risk Report | | |
| | |
| | | | |
| | |
| | | | |
Our existing commitments to lend additional funds to debtors with impaired loans amounted to€ 145 million as of December 31, 2012 and€ 168 million as of December 31, 2011.
Collateral held against impaired loans, with fair values capped at transactional outstandings
| | | | | | | | | | | | |
in€ m. | | Dec 31, 2012 | | | Dec 31, 2011 | |
Financial and other collateral | | | 4,253 | | | | 3,714 | |
| | | | | | | | |
Guarantees received | | | 401 | | | | 349 | |
| | | | | | | | |
Total collateral held for impaired loans | | | 4,654 | | | | 4,063 | |
| |
| |
Our total collateral held for impaired loans as of December 31, 2012 increased by€ 591 million compared to prior year. The coverage ratio including collateral increased to 90 % as of December 31, 2012 compared to 82 % as of December 31, 2011 and was driven by the same factor as the impaired loan coverage ratio which is attributable to Postbank.
Collateral Obtained
We obtain collateral on the balance sheet by taking possession of collateral held as security or by calling upon other credit enhancements. Collateral obtained is made available for sale in an orderly fashion or through public auctions, with the proceeds used to repay or reduce outstanding indebtedness. Generally we do not occupy obtained properties for our business use.
Collateral obtained during the reporting periods
| | | | | | | | | | |
in€ m. | | 2012 | | | 2011 | |
Commercial real estate | | | 30 | | | | 89 | |
| | | | | | | | |
Residential real estate | | | 62 | | | | 40 | |
| | | | | | | | |
Other | | | 0 | | | | 0 | |
| | | | | | | | |
Total collateral obtained during the reporting period | | | 92 | | | | 129 | |
| |
| |
The commercial and residential real estate collateral obtained in 2012 refers to our U.S. and Spain exposures.
The residential real estate collateral obtained, as shown in the table above, excludes collateral recorded as a result of consolidating securitization trusts under SIC-12 and IAS 27. The year-end amounts in relation to collateral obtained for these trusts were€ 10 million for December 31, 2012 and€ 20 million for December 31, 2011.
| | | | |
| Deutsche Bank | | 01 – Management Report | | 94 |
| Financial Report 2012 | | Risk Report | | |
| | |
| | | | |
| | |
| | | | |
Allowance for Credit Losses
Development of allowance for credit losses
| | | | | | | | | | | | | | | | | | | | | | | | | | | | |
| | | Allowance for Loan Losses | | | Allowance for Off-Balance Sheet Positions | | | 2012 | |
in€ m. | | Individually
assessed | | | Collectively
assessed | | | Subtotal | | | Individually
assessed | | | Collectively
assessed | | | Subtotal | | | Total | |
Balance, beginning of year | | | 2,011 | | | | 2,150 | | | | 4,162 | | | | 127 | | | | 98 | | | | 225 | | | | 4,386 | |
| | | | | | | | | | | | | | | | | | | | | | | | | | | | |
Provision for credit losses | | | 1,115 | | | | 613 | | | | 1,728 | | | | (7) | | | | 0 | | | | (7) | | | | 1,721 | |
| | | | | | | | | | | | | | | | | | | | | | | | | | | | |
thereof: | | | | | | | | | | | | | | | | | | | | | | | | | | | | |
(Gains)/Losses from disposal of impaired loans | | | 79 | | | | (55) | | | | 24 | | | | – | | | | – | | | | – | | | | 24 | |
| | | | | | | | | | | | | | | | | | | | | | | | | | | | |
Net charge-offs: | | | (762) | | | | (324) | | | | (1,086) | | | | – | | | | – | | | | – | | | | (1,086) | |
| | | | | | | | | | | | | | | | | | | | | | | | | | | | |
Charge-offs | | | (798) | | | | (483) | | | | (1,281) | | | | – | | | | – | | | | – | | | | (1,281) | |
Recoveries | | | 36 | | | | 158 | | | | 195 | | | | – | | | | – | | | | – | | | | 195 | |
| | | | | | | | | | | | | | | | | | | | | | | | | | | | |
Changes in the group of consolidated companies | | | – | | | | – | | | | – | | | | – | | | | – | | | | – | | | | – | |
| | | | | | | | | | | | | | | | | | | | | | | | | | | | |
Exchange rate changes/other | | | (98) | | | | (9) | | | | (107) | | | | (2) | | | | (1) | | | | (3) | | | | (111) | |
| | | | | | | | | | | | | | | | | | | | | | | | | | | | |
Balance, end of year | | | 2,266 | | | | 2,430 | | | | 4,696 | | | | 118 | | | | 97 | | | | 215 | | | | 4,911 | |
| | | | | | | | | | | | | | | | | | | | | | | | | | | | |
| | | | | | | | | | | | | | | | | | | | | | | | | | | | |
Changes compared to prior year | | | | | | | | | | | | | | | | | | | | | | | | | | | | |
| | | | | | | | | | | | | | | | | | | | | | | | | | | | |
Provision for credit losses | | | | | | | | | | | | | | | | | | | | | | | | | | | | |
absolute | | | 208 | | | | (312) | | | | (104) | | | | (26) | | | | 12 | | | | (14) | | | | (118) | |
relative | | | 23% | | | | (34%) | | | | (6%) | | | | (137%) | | | | (103%) | | | | (191%) | | | | (6%) | |
| | | | | | | | | | | | | | | | | | | | | | | | | | | | |
Net charge-offs | | | | | | | | | | | | | | | | | | | | | | | | | | | | |
absolute | | | (249) | | | | 61 | | | | (189) | | | | – | | | | – | | | | – | | | | (189) | |
relative | | | 49% | | | | (16%) | | | | 21% | | | | – | | | | – | | | | – | | | | 21% | |
| | | | | | | | | | | | | | | | | | | | | | | | | | | | |
Balance, end of year | | | | | | | | | | | | | | | | | | | | | | | | | | | | |
absolute | | | 255 | | | | 279 | | | | 534 | | | | (9) | | | | (1) | | | | (10) | | | | 524 | |
relative | | | 13% | | | | 13% | | | | 13% | | | | (7%) | | | | (1%) | | | | (4%) | | | | 12% | |
| |
In a volatile economic environment our credit standards have kept new provisions for loan losses under control. This included pro-active management of the homogeneous retail portfolios as well as strict underwriting standards in CB&S and continued diligent monitoring of higher risk exposures. With the creation of the NCOU, we have begun actively de-risking higher risk assets, which we intend to continue in 2013.
Our allowance for credit losses was€ 4.9 billion as of December 31, 2012, thereof 96 % or€ 4.7 billion related to our loan portfolio and 4 % or€ 215 million to off-balance sheet positions (predominantly loan commitments and guarantees). Our allowance for loan losses as of December 31, 2012 was€ 4.7 billion, 52 % of which is related to collectively assessed and 48 % to individually assessed loan losses. The increase in our allowance for loan losses of€ 534 million mainly relates to€ 1.7 billion of additional loan loss provisions partly offset by€ 1.1 billion of charge-offs. Our allowance for off-balance sheet positions decreased by€ 10 million or 4 % compared to the prior year due to releases of previously established allowances overcompensating new provisions in our portfolio for individually assessed off-balance sheet positions.
Provisions for credit losses recorded in 2012 decreased by€ 118 million to€ 1.7 billion compared to 2011. The overall loan loss provisions decreased by€ 104 million or 6 % in 2012 compared to 2011. This decrease was driven by our collectively assessed loan portfolio, where we saw a reduction of€ 312 million or 34 % driven by lower levels of provisioning for non-impaired loans within our NCOU mainly as a result of our de-risking measures along with lower provisioning in our homogenous Postbank portfolio. The latter decrease however excludes the effect of Postbank releases related to loan loss allowances recorded prior to consolidation. The impact of such releases is reported as interest income on a group level. The increase in provisions for our individually assessed loans of€ 208 million or 23 % is related to assets which had been reclassified in accordance with IAS 39 in North America and United Kingdom now held in the NCOU. Provisions for off-balance
| | | | |
| Deutsche Bank | | 01 – Management Report | | 95 |
| Financial Report 2012 | | Risk Report | | |
| | |
| | | | |
| | |
| | | | |
sheet positions decreased by€ 14 million or 191 % driven by our portfolio for individually assessed off-balance sheet positions, where releases of previously established allowances overcompensated new provisions in 2012.
Net charge-offs increased by€ 189 million or 21 % in 2012. Net charge-offs for our individually assessed loans were up€ 249 million mainly related to assets which had been reclassified in accordance with IAS 39.
| | | | | | | | | | | | | | | | | | | | | | | | | | | | |
| | | Allowance for Loan Losses | | | Allowance for Off-Balance Sheet Positions | | | 2011 | |
in€ m. | | Individually
assessed | | | Collectively
assessed | | | Subtotal | | | Individually
assessed | | | Collectively
assessed | | | Subtotal | | | Total | |
Balance, beginning of year | | | 1,643 | | | | 1,653 | | | | 3,296 | | | | 108 | | | | 110 | | | | 218 | | | | 3,514 | |
| | | | | | | | | | | | | | | | | | | | | | | | | | | | |
Provision for credit losses | | | 907 | | | | 925 | | | | 1,832 | | | | 19 | | | | (12) | | | | 7 | | | | 1,839 | |
| | | | | | | | | | | | | | | | | | | | | | | | | | | | |
thereof: | | | | | | | | | | | | | | | | | | | | | | | | | | | | |
(Gains)/Losses from disposal of impaired loans | | | 1 | | | | (33) | | | | (32) | | | | – | | | | – | | | | – | | | | (32) | |
| | | | | | | | | | | | | | | | | | | | | | | | | | | | |
Net charge-offs: | | | (512) | | | | (385) | | | | (897) | | | | – | | | | – | | | | – | | | | (897) | |
| | | | | | | | | | | | | | | | | | | | | | | | | | | | |
Charge-offs | | | (553) | | | | (512) | | | | (1,065) | | | | – | | | | – | | | | – | | | | (1,065) | |
Recoveries | | | 41 | | | | 127 | | | | 168 | | | | – | | | | – | | | | – | | | | 168 | |
| | | | | | | | | | | | | | | | | | | | | | | | | | | | |
| Changes in the group of consolidated companies | | | – | | | | (0) | | | | (0) | | | | (0) | | | | 0 | | | | 0 | | | | – | |
| | | | | | | | | | | | | | | | | | | | | | | | | | | | |
Exchange rate changes/other | | | (26) | | | | (43) | | | | (69) | | | | (0) | | | | 0 | | | | 0 | | | | (69) | |
| | | | | | | | | | | | | | | | | | | | | | | | | | | | |
Balance, end of year | | | 2,011 | | | | 2,150 | | | | 4,162 | | | | 127 | | | | 98 | | | | 225 | | | | 4,387 | |
| | | | | | | | | | | | | | | | | | | | | | | | | | | | |
| | | | | | | | | | | | | | | | | | | | | | | | | | | | |
Changes compared to prior year | | | | | | | | | | | | | | | | | | | | | | | | | | | | |
| | | | | | | | | | | | | | | | | | | | | | | | | | | | |
Provision for credit losses | | | | | | | | | | | | | | | | | | | | | | | | | | | | |
absolute | | | 345 | | | | 175 | | | | 520 | | | | 37 | | | | 10 | | | | 46 | | | | 566 | |
relative | | | 61% | | | | 23% | | | | 40% | | | | (209%) | | | | (45%) | | | | (119%) | | | | 44% | |
| | | | | | | | | | | | | | | | | | | | | | | | | | | | |
Net charge-offs | | | | | | | | | | | | | | | | | | | | | | | | | | | | |
absolute | | | 384 | | | | 19 | | | | 403 | | | | – | | | | – | | | | – | | | | 403 | |
relative | | | (43%) | | | | (5%) | | | | (31%) | | | | – | | | | – | | | | – | | | | (31%) | |
| | | | | | | | | | | | | | | | | | | | | | | | | | | | |
Balance, end of year | | | | | | | | | | | | | | | | | | | | | | | | | | | | |
absolute | | | 369 | | | | 497 | | | | 866 | | | | 19 | | | | (12) | | | | 7 | | | | 873 | |
relative | | | 22% | | | | 30% | | | | 26% | | | | 18% | | | | (11%) | | | | 3% | | | | 25% | |
| |
At year end 2011, our allowance for credit losses amounted to€ 4.4 billion, thereof 95 % or€ 4.2 billion related to our loan portfolio and 5 % or€ 225 million to off-balance sheet positions.
Our allowance for loan losses as of December 31, 2011 was€ 4.2 billion, a 26 % increase from prior year end. The increase in our allowance was principally due to increased new provisions following the first full year consolidation of Postbank and lower net charge-offs compared to the prior year. Our allowance for off-balance sheet positions at the end of 2011 was almost on the same level as of the end of 2010.
Provisions for credit losses in 2011 amounted to€ 1.8 billion, up€ 566 million compared to 2010. Our provision for loan losses showed an increase of€ 520 million or 40 % in 2011, thereof€ 345 million or 61 % related to individually assessed loans, and€ 175 million or 23 % related to our collectively assessed loan portfolios. The rise in individually assessed provision for loan losses was driven by the first time consolidation of Postbank and furthermore reflected impairment charges taken on a number of exposures in the Americas and in Europe in an overall challenging global economic credit environment. Reduced provisioning levels for IAS 39 reclassified assets partly compensated these increases. Loan loss provisions for our collectively assessed loan portfolios, which increased by 23 % compared to 2010, were also affected by the first time consolidation of Postbank. Excluding Postbank, the loan loss provision for our collectively assessed exposure was reduced due to our retail business in Germany which contributed lower provisions, despite the challenging economic environment. Our provisions for off-balance sheet positions increased by€ 46 million or 119 % compared to 2010 driven by our portfolio for individually assessed off-balance sheet positions.
| | | | |
| Deutsche Bank | | 01 – Management Report | | 96 |
| Financial Report 2012 | | Risk Report | | |
| | |
| | | | |
| | |
| | | | |
Our net charge-offs decreased by€ 403 million or 31 % in 2011, almost fully related to our individually assessed loans, where we saw a reduction of€ 384 million fully driven by IAS 39 reclassified assets.
Derivatives – Credit Valuation Adjustment
We establish a counterparty Credit Valuation Adjustment (“CVA”) for OTC derivative transactions to cover expected credit losses. The adjustment amount is determined by assessing the potential credit exposure to a given counterparty and taking into account any collateral held, the effect of any relevant netting arrangements, expected loss given default and the credit risk, based on available market information, including CDS spreads.
The CVAs are significant for certain monoline counterparties. For monolines with actively traded CDS, the CVA is calculated using a full CDS-based valuation model. For monolines without actively traded CDS a model based approach is used with various input factors, including relevant market driven default probabilities, the likelihood of an event (either a restructuring or an insolvency), an assessment of any potential settlement in the event of a restructuring, and recovery rates in the event of either restructuring or insolvency. The monoline CVA methodology is reviewed on a quarterly basis by management.
We recorded€ 737 million in CVAs against our aggregate monoline exposures as of December 31, 2012, compared to€ 1.1 billion as of December 31, 2011.
Treatment of Default Situations under Derivatives
Unlike standard loan assets, we generally have more options to manage the credit risk in our OTC derivatives when movement in the current replacement costs of the transactions and the behavior of our counterparty indicate that there is the risk that upcoming payment obligations under the transactions might not be honored. In these situations, we are frequently able under prevailing contracts to obtain additional collateral or terminate the transactions or the related master agreement at short notice.
The master agreements executed with our clients usually provide for a broad set of standard or bespoke termination rights, which allow us to respond swiftly to a counterparty’s default or to other circumstances which indicate a high probability of failure. When our decision to terminate derivative transactions or the related master agreement results in a residual net obligation owed by the counterparty, we restructure the obligation into a non-derivative claim and manage it through our regular work-out process. As a consequence, for accounting purposes we typically do not show any nonperforming derivatives.
Wrong way risk occurs when exposure to a counterparty is adversely correlated with the credit quality of that counterparty. It must be carefully considered together with the correlation between the obligor and risk mitigants and is actively monitored and reviewed on a regular basis. In compliance with Section 224 (8) and (9) SolvV we, excluding Postbank, have established a monthly process to monitor specific wrong way risk, whereby transactions subject to wrong way risk are automatically selected and presented for comment to the responsible credit officer. In addition, we, excluding Postbank, utilize our established process for calibrating our own alpha factor (as defined in Section 223 (7) SolvV) to estimate the overall wrong-way risk in our derivatives and securities financing transaction portfolio. Postbank derivative counterparty risk is immaterial to the Group and collateral held is typically in the form of cash.
| | | | |
| Deutsche Bank | | 01 – Management Report | | 97 |
| Financial Report 2012 | | Risk Report | | |
| | |
| | | | |
| | |
| | | | |
Counterparty Credit Risk: Regulatory Assessment
The following section on Counterparty Credit Risk: Regulatory Assessment, ending on page 117, present specific disclosures in relation to Pillar 3. Per regulation it is not required to audit Pillar 3 disclosures. As such this section is labeled unaudited. Quantitative information presented follows the regulatory scope of consolidation.
General Considerations for the Regulatory Assessment of Counterparty Risk
Generally we apply the advanced IRBA for the majority of our advanced IRBA eligible credit portfolios to calculate the regulatory capital requirements according to the SolvV, based on respective approvals received from BaFin.
The BaFin approvals obtained as a result of the advanced IRBA audit processes for our counterparty credit exposures excluding Postbank allow the usage of 63 internally developed rating systems for regulatory capital calculation purposes out of which 37 rating systems were authorized in December 2007 and a further 26 followed until year end 2012. Overall they cover all of our material exposures, excluding Postbank, in the advanced IRBA eligible exposure classes “central governments”, “institutions”, “corporates”, and “retail”.
Postbank’s retail portfolio is also assigned to the advanced IRBA based on respective BaFin approvals Postbank received and the fact that we have an advanced IRBA status. Details of the advanced IRBA and the advanced IRBA exposures are provided in Sections “Advanced Internal Ratings Based Approach” and “Advanced IRBA Exposure”.
Moreover, we apply the foundation IRBA for a significant portion of Postbank’s IRBA eligible credit portfolios, in which Postbank received respective BaFin approvals in recent years. The foundation IRBA and the foundation IRBA exposures are discussed in Sections “Foundation Internal Ratings Based Approach” and “Foundation IRBA Exposure”.
The approvals Postbank obtained from the BaFin as a result of its IRBA audit processes for the counterparty credit exposures allow the usage of 16 internally developed rating systems for regulatory capital calculation purposes under the IRBA of which eight rating systems were authorized in December 2006 and a further nine followed by year end 2012. The application of one rating system has been suspended. Overall they cover Postbank’s material exposures in the advanced IRBA eligible exposure class “retail” as well as Postbank’s material exposures in the foundation IRBA eligible exposure classes “central governments”, “institutions” and “corporates”.
For Postbank’s exposure classes “institutions” and “corporates” advanced IRBA audits have been conducted and are pending approval.
We assign a few remaining advanced IRBA eligible portfolios of small size temporarily to the standardized approach. With regard to these, an implementation plan and approval schedule have been set up and agreed with the competent authorities, the BaFin and the Bundesbank.
Exposures which we do not treat under the advanced or the foundation IRBA are discussed in the Sections “Other IRBA Exposure” and “Standardized Approach” respectively.
| | | | |
| Deutsche Bank | | 01 – Management Report | | 98 |
| Financial Report 2012 | | Risk Report | | |
| | |
| | | | |
| | |
| | | | |
Our advanced IRBA coverage ratio, excluding Postbank, exceeds the German regulatory requirement of 92 % by exposure value (“EAD”) as well as by RWA as of December 31, 2012, using applicable measures according to Section 67 SolvV. This ratio excludes the exposures permanently assigned to the standardized approach (according to Section 70 SolvV) which are discussed in Section “Standardized Approach”, other IRBA exposure (described in Section “Other IRBA Exposure”) as well as securitization positions (please refer to Section “Securitization” for further details). The regulatory minimum requirements with regard to the respective coverage ratio thresholds have been met at all times.
EAD and RWA according to the model approaches applied to our credit risk portfolios
| | | | | | | | | | | | | | | | | | | | | | | | | | | | | | | | | | | | | | | | | | | | |
| | | Dec 31, 2012 | |
| | | Advanced IRBA | | | Foundation IRBA | | | Other IRBA | | | Standardized Approach | | | Total | |
in€ m. | | EAD | | | RWA | | | EAD | | | RWA | | | EAD | | | RWA | | | EAD | | | RWA | | | EAD | | | RWA | | | Capital
Requirements | |
| Central governments | | | 103,199 | | | | 3,762 | | | | 112 | | | | 35 | | | | – | | | | – | | | | 100,612 | | | | 379 | | | | 203,923 | | | | 4,176 | | | | 334 | |
| | | | | | | | | | | | | | | | | | | | | | | | | | | | | | | | | | | | | | | | | | | | |
| Institutions | | | 65,856 | | | | 8,946 | | | | 22,658 | | | | 3,156 | | | | – | | | | – | | | | 4,619 | | | | 230 | | | | 93,133 | | | | 12,331 | | | | 987 | |
| | | | | | | | | | | | | | | | | | | | | | | | | | | | | | | | | | | | | | | | | | | | |
| Corporates | | | 281,190 | | | | 81,646 | | | | 11,936 | | | | 7,349 | | | | 17,672 | | | | 10,957 | | | | 26,392 | | | | 18,640 | | | | 337,191 | | | | 118,593 | | | | 9,487 | |
| | | | | | | | | | | | | | | | | | | | | | | | | | | | | | | | | | | | | | | | | | | | |
| Retail exposures secured by real estate property | | | 145,828 | | | | 20,164 | | | | – | | | | – | | | | – | | | | – | | | | 6,253 | | | | 2,728 | | | | 152,080 | | | | 22,891 | | | | 1,831 | |
| | | | | | | | | | | | | | | | | | | | | | | | | | | | | | | | | | | | | | | | | | | | |
| Qualifying revolving retail exposures | | | 4,550 | | | | 623 | | | | – | | | | – | | | | – | | | | – | | | | – | | | | – | | | | 4,550 | | | | 623 | | | | 50 | |
| | | | | | | | | | | | | | | | | | | | | | | | | | | | | | | | | | | | | | | | | | | | |
| Other retail exposures | | | 32,716 | | | | 15,259 | | | | – | | | | – | | | | – | | | | – | | | | 10,604 | | | | 6,564 | | | | 43,320 | | | | 21,823 | | | | 1,746 | |
| | | | | | | | | | | | | | | | | | | | | | | | | | | | | | | | | | | | | | | | | | | | |
| Other exposures | | | – | | | | – | | | | – | | | | – | | | | 9,937 | | | | 11,635 | | | | 27,830 | | | | 22,342 | | | | 37,767 | | | | 33,977 | | | | 2,718 | |
| | | | | | | | | | | | | | | | | | | | | | | | | | | | | | | | | | | | | | | | | | | | |
| Securitizations | | | 62,549 | | | | 13,325 | | | | – | | | | – | | | | – | | | | – | | | | 2,720 | | | | 1,457 | | | | 65,269 | | | | 14,782 | | | | 1,183 | |
| | | | | | | | | | | | | | | | | | | | | | | | | | | | | | | | | | | | | | | | | | | | |
| Total | | | 695,887 | | | | 143,725 | | | | 34,707 | | | | 10,539 | | | | 27,609 | | | | 22,592 | | | | 179,030 | | | | 52,340 | | | | 937,232 | | | | 229,196 | | | | 18,336 | |
| | | | | | | | | | | | | | | | | | | | | | | | | | | | | | | | | | | | | | | | | | | | |
| Thereof counterparty credit risk from | | | 143,190 | | | | 32,711 | | | | 8,471 | | | | 736 | | | | 726 | | | | 636 | | | | 13,485 | | | | 1,906 | | | | 165,872 | | | | 35,989 | | | | 2,879 | |
| | | | | | | | | | | | | | | | | | | | | | | | | | | | | | | | | | | | | | | | | | | | |
Derivatives | | | 87,857 | | | | 30,870 | | | | 1,552 | | | | 595 | | | | 726 | | | | 636 | | | | 10,658 | | | | 1,696 | | | | 100,792 | | | | 33,797 | | | | 2,704 | |
| | | | | | | | | | | | | | | | | | | | | | | | | | | | | | | | | | | | | | | | | | | | |
Securities financing transactions | | | 55,333 | | | | 1,841 | | | | 6,919 | | | | 140 | | | | – | | | | – | | | | 2,827 | | | | 210 | | | | 65,079 | | | | 2,191 | | | | 175 | |
| |
The table above also provides an overview of the model approaches used for our securitization positions. Please note that the following sections on our exposures in the IRBA and standardized approaches exclude securitization exposures as they are presented separately in more detail in the section “Securitization”. The line item “Other exposures” contain predominantly collective investment undertakings, equity exposures and non-credit obligations treated under the other IRBA as well as remaining exposures classes for the standardized approach which do not fall under the exposure classes “Central governments”, “Institutions”, “Corporates” or “Retail”.
Advanced Internal Ratings Based Approach
The advanced IRBA is the most sophisticated approach available under the regulatory framework for credit risk allowing us to make use of our internal rating methodologies as well as internal estimates of specific other risk parameters. These methods and parameters represent long-used key components of the internal risk measurement and management process supporting the credit approval process, the economic capital and expected loss calculation and the internal monitoring and reporting of credit risk. The relevant parameters include the probability of default (“PD”), the loss given default (“LGD”) driving the regulatory risk-weight and the credit conversion factor (“CCF”) as part of the regulatory exposure at default (“EAD”) estimation. For most of our internal rating systems more than seven years of historical information is available to assess these parameters. Our internal rating methodologies reflect a point-in-time rather than a through-the-cycle rating.
| | | | |
| Deutsche Bank | | 01 – Management Report | | 99 |
| Financial Report 2012 | | Risk Report | | |
| | |
| | | | |
| | |
| | | | |
The probability of default for customers is derived from our internal rating systems. We assign a probability of default to each relevant counterparty credit exposure as a function of a transparent and consistent 26-grid master rating scale for all of our exposure excluding Postbank. The borrower ratings assigned are derived on the grounds of internally developed rating models which specify consistent and distinct customer-relevant criteria and assign a rating grade based on a specific set of criteria as given for a certain customer. The set of criteria is generated from information sets relevant for the respective customer segments like general customer behavior, financial and external data. The methods in use range from statistical scoring models to expert-based models taking into account the relevant available quantitative and qualitative information. Expert-based models are usually applied for counterparts in the exposure classes “Central governments”, “Institutions” and “Corporates” with the exception of small- and medium-sized entities. For the latter as well as for the retail segment statistical scoring or hybrid models combining both approaches are commonly used. Quantitative rating methodologies are developed based on applicable statistical modelling techniques, such as logistic regression. In line with Section 118 of SolvV, these models are complemented by human judgment and oversight to review model-based assignments and to ensure that the models are used appropriately. When we assign our internal risk ratings, it allows us to compare them with external risk ratings assigned to our counterparties by the major international rating agencies, where possible, as our internal rating scale has been designed to principally correspond to the external ratings scales from rating agencies. For quantitative information where we provide our advanced and foundation IRBA exposure based on a rating grade granularity which corresponds to the external Standard & Poors rating equivalents please refer to the section “Advanced IRBA Exposure” and “Foundation IRBA Exposure”.
Although different rating methodologies are applied to the various customer segments in order to properly reflect customer-specific characteristics, they all adhere to the same risk management principles. Credit process policies provide guidance on the classification of customers into the various rating systems. For more information regarding the credit process and the respective rating methods used within that process, please refer to Section “Credit Risk Ratings and Rating Governance”.
For our Postbank retail portfolios subject to the advanced IRBA, Postbank assigns a probability of default to each relevant counterparty credit exposure as a function of an internal rating master scale. The ratings assigned are derived on the grounds of internally developed rating models which specify consistent and distinct customer-relevant criteria. These rating models are statistical scoring methods based on internal and external information relating to the borrower and use statistical procedures to evaluate a probability of default. The resulting scores are then mapped to Postbank’s internal rating master scale.
We apply internally estimated LGD factors as part of the advanced IRBA capital requirement calculation as approved by the BaFin. LGD is defined as the likely loss intensity in case of a counterparty default. It provides an estimation of the exposure that cannot be recovered in a default event and therefore captures the severity of a loss. Conceptually, LGD estimates are independent of a customer’s probability of default. The LGD models ensure that the main drivers for losses (e.g. different levels and quality of collateralization and customer or product types or seniority of facility) are reflected in specific LGD factors. In our LGD models, except Postbank, we assign collateral type specific LGD parameters to the collateralized exposure (collateral value after application of haircuts). Moreover, the LGD for uncollateralized exposure cannot be below the LGD assigned to collateralized exposure and regulatory minimum parameters (10 % for residential mortgage loans) are applied.
| | | | |
| Deutsche Bank | | 01 – Management Report | | 100 |
| Financial Report 2012 | | Risk Report | | |
| | |
| | | | |
| | |
| | | | |
As part of the application of the advanced IRBA we apply specific CCFs in order to calculate an EAD value. Conceptually the EAD is defined as the expected amount of the credit exposure to a counterparty at the time of its default. For advanced IRBA calculation purposes we apply the general principles as defined in Section 100 SolvV to determine the EAD of a transaction. In instances, however, where a transaction outside of Postbank involves an unused limit a percentage share of this unused limit is added to the outstanding amount in order to appropriately reflect the expected outstanding amount in case of a counterparty default. This reflects the assumption that for commitments the utilization at the time of default might be higher than the current utilization. When a transaction involves an additional contingent component (e.g. guarantees) a further percentage share (usage factor) is applied as part of the CCF model in order to estimate the amount of guarantees drawn in case of default. Where allowed under the advanced IRBA the CCFs are internally estimated. The calibrations of such parameters are based on statistical experience as well as internal historical data and consider customer and product type specifics. As part of the approval process, the BaFin assessed our CCF models and stated their appropriateness for use in the process of regulatory capital requirement calculations.
Overall Postbank has similar standards in place to apply the advanced IRBA to its retail portfolios using internally estimated default probabilities, loss rates and conversion factors as the basis for calculating minimum regulatory capital requirements.
For derivative counterparty exposures as well as securities financing transactions (“SFT”) we, excluding Postbank, make use of the internal model method (“IMM”) in accordance with Section 222 et seq. SolvV. In this respect securities financing transactions encompass repurchase transactions, securities or commodities lending and borrowing as well as margin lending transactions (including prime brokerage). The IMM is a more sophisticated approach for calculating EAD for derivatives and SFT, again requiring prior approval from the BaFin before its first application. By applying this approach, we build our EAD calculations on a Monte Carlo simulation of the transactions’ future market values. Within this simulation process, interest and FX rates, credit spreads, equity and commodity prices are modeled by stochastic processes and each derivative and securities financing transaction is revalued at each point of a pre-defined time grid by our internally approved valuation routines. As the result of this process, a distribution of future market values for each transaction at each time grid point is generated. From these distributions, by considering the appropriate netting and collateral agreements, we derive the exposure measures potential future exposure (“PFE”), average expected exposure (“AEE”) and expected positive exposure (“EPE”) mentioned in Section “Counterparty Credit Risk from Derivatives”. The EPE measure evaluated on regulatory eligible netting sets defines the EAD for derivative counterparty exposures as well as for securities financing transactions within our regulatory capital calculations for the great majority of our derivative and SFT portfolio, while applying an own calibrated alpha factor in its calculation, floored at the minimum level of 1.2. For the small population of transactions for which a simulation cannot be computed, the EAD used is derived from the current exposure method.
For our derivative counterparty credit risk resulting from Postbank we apply the current exposure method, i.e., we calculate the EAD as the sum of the net positive fair value of the derivative transactions and the regulatory add-ons. As the EAD derivative position resulting from Postbank is less than 1 % in relation to our overall counterparty credit risk position from derivatives we consider Postbank’s derivative position to be immaterial.
Default Definition and Model Validation
A prerequisite for the development of rating methodologies and the determination of risk parameters is a proper definition, identification and storage of the default event of a customer. We apply a default definition in accordance with the requirements of Section 125 SolvV as confirmed by the BaFin as part of the IRBA approval process.
| | | | |
| Deutsche Bank | | 01 – Management Report | | 101 |
| Financial Report 2012 | | Risk Report | | |
| | |
| | | | |
| | |
| | | | |
As an important element of our risk management framework we regularly validate our rating methodologies and credit risk parameters. Whereas the rating methodology validation focuses on the discriminatory power of the models, the risk parameter validation for PD, LGD and EAD analyzes the predictive power of those parameters when compared against historical default experiences.
According to our standards, and in line with the SolvV-defined minimum requirements, the parameters PD, LGD and EAD are reviewed annually. The validation process for parameters as used by us excluding Postbank is coordinated and supervised by a validation working group composed of members from Finance, Risk Analytics and Instruments and Credit Risk Management. Risk parameter validations consist of quantitative analyses of internal historical data and are enriched by qualitative assessments in case data for validation is not sufficient for getting reliable results. A recalibration of specific parameter settings is triggered based on validation results if required. In addition to annual validations, ad hoc reviews are performed where appropriate as a reaction to quality deterioration at an early stage due to systematic changes of input factors (e.g. changes in payment behavior) or changes in the structure of the portfolio. The reviews conducted in 2012 for advanced IRBA rating systems triggered recalibrations as shown in the table below. 26 new risk parameters are applied due to newly approved rating systems or due to increased granularity in existing risk parameter settings. None of the recalibrations individually nor the impact of all recalibrations in the aggregate materially impacted our regulatory capital requirements.
Analogously at Postbank the allocation mechanism of the master scale to the probabilities of default as well as the results of the estimations of the input parameters PD, CCF and LGD are reviewed annually. Postbank’s model validation committee is responsible for supervising the annual validation process of all models. Via a cross committee membership Deutsche Bank senior managers join in Postbank committees and vice versa, to ensure a joint governance.
Validation results for risk parameters used in our advanced IRBA
| | | | | | | | | | | | | | | | | | | | | | | | |
| | | Dec 31, 2012 | |
| | | PD | | | LGD | | | EAD | |
| | | Count | | | EAD in % | | | Count | | | EAD in % | | | Count | | | EAD in % | |
| | | | | | | | | | | | | | | | | | | | | | | | |
Appropriate | | | 104 | | | | 91.4 | | | | 100 | | | | 89.8 | | | | 40 | | | | 79.5 | |
| | | | | | | | | | | | | | | | | | | | | | | | |
Overly conservative | | | 6 | | | | 1.8 | | | | 18 | | | | 4.1 | | | | 29 | | | | 15.9 | |
| | | | | | | | | | | | | | | | | | | | | | | | |
Progressive | | | 16 | | | | 6.8 | | | | 11 | | | | 6.1 | | | | 5 | | | | 4.6 | |
| | | | | | | | | | | | | | | | | | | | | | | | |
Total | | | 126 | | | | 100.0 | | | | 129 | | | | 100.0 | | | | 74 | | | | 100.0 | |
| |
|
| Thereof already recalibrated and introduced in 2012 | |
| | | | | | | | | | | | | | | | | | | | | | | | |
| | | | | | | | | | | | | | | | | | | | | | | | |
Overly conservative | | | 1 | | | | 0.1 | | | | 17 | | | | 3.5 | | | | 24 | | | | 15.3 | |
| | | | | | | | | | | | | | | | | | | | | | | | |
Progressive | | | 1 | | | | 0.1 | | | | 7 | | | | 2.0 | | | | 5 | | | | 4.6 | |
| | | | | | | | | | | | | | | | | | | | | | | | |
Total | | | 2 | | | | 0.2 | | | | 24 | | | | 5.5 | | | | 29 | | | | 19.9 | |
| |
Above table summarizes the outcome of the model validations for risk parameters PD, LGD and EAD used in our advanced IRBA including Postbank. Individual risk parameter settings are classified as appropriate if no recalibration was triggered by the validation and thus the application of the current parameter setting is continued since still sufficiently conservative. A parameter classifies as overly conservative or progressive if the validation triggers a recalibration leading to a decrease or increase of the setting, respectively. The breakdown for PD, LGD and EAD is presented in counts as well as in the relative EAD attached to the respective parameter as of December 31, 2012.
| | | | |
| Deutsche Bank | | 01 – Management Report | | 102 |
| Financial Report 2012 | | Risk Report | | |
| | |
| | | | |
| | |
| | | | |
The validations largely confirm our PD parameter settings. PDs classified as progressive can be subdivided into a group of 15 parameters with comparably low exposure and one parameter from Postbank assigned to approximately 4 % of our total EAD, for which a recalibration is awaiting final approval from BaFin. Similarly, LGD parameter validations show largely appropriate settings. Progressive LGDs can be subdivided analogously to PDs with one parameter from Postbank assigned to approximately 4 % of our total EAD, for which a recalibration is awaiting final approval from BaFin. For our EAD parameters, excluding Postbank, an improved and extended validation and recalibration approach has been implemented after approval from BaFin now taking into account the exposure changes for each of the twelve months prior to default and not only one year prior to default. Moreover, the extended time series leads to less variance and thus more stable parameter settings. These two effects lead to a reduction of a large number of EAD parameter settings.
Out of the 85 risk parameters where a change was suggested by the conducted validation, 55 were already introduced in 2012. The remaining 30 parameter changes are intended to be implemented in 2013. Some of these parameter changes require pending approval from BaFin prior to introduction. In addition, 5 recalibrated LGD parameters were introduced in 2012 based on validation results in 2011.
In addition to the above, the comparison of regulatory expected loss (“EL”) estimates with actual losses recorded also provides some insight into the predictive power of our parameter estimations and, therefore, EL calculations.
The EL used in this comparison is the forecast credit loss from counterparty defaults of our exposures over a one year period and is computed as the product of PD, LGD and EAD for performing exposures as of December 31 of the preceding year. The actual loss measure is defined by us as new provisions including recoveries on newly impaired exposures recorded in our financial statements through profit and loss during the respective reported years.
While we believe that this approach provides some insight, the comparison has limitations as the two measures are not directly comparable. In particular, the parameter LGD underlying the EL calculation represents the loss expectation until finalization of the workout period while the actual loss as defined above represents the accounting information recorded for one particular financial year. Furthermore, EL is a measure of expected credit losses for a snapshot of our credit exposure at a certain balance sheet date while the actual loss is recorded for a fluctuating credit portfolio over the course of a financial year, i.e., including losses in relation to new loans entered into during the year as well as offsetting releases of allowances for loan losses for loans considered impaired at time of EL determination.
According to the methodology described above, the following table provides a comparison of EL estimates for loans, commitments and contingent liabilities as of year-end 2011 till 2007, with actual losses recorded for the financial years 2012 till 2008, by regulatory exposure class for advanced IRBA exposures. Postbank is firstly reflected in the comparison of EL estimates as of year end 2010 with actual losses recorded for the financial year 2011.
| | | | |
| Deutsche Bank | | 01 – Management Report | | 103 |
| Financial Report 2012 | | Risk Report | | |
| | |
| | | | |
| | |
| | | | |
Comparison of EL estimates for loans, commitments and contingent liabilities with actual losses recorded by regulatory exposure class
| | | | | | | | | | | | | | | | | | | | | | | | | | | | | | | | | | | | | | | | |
| | | Dec 31,
2011 | | | 2012 | | | Dec 31,
2010 | | | 2011 | | | Dec 31,
2009 | | | 2010 | | | Dec 31,
2008 | | | 2009 | | | Dec 31,
2007 | | | 2008 | |
in€ m. | | Expected
loss | | | Actual
loss | | | Expected
loss 1 | | | Actual
loss 1 | | | Expected
loss | | | Actual
loss | | | Expected
loss | | | Actual
loss | | | Expected
loss | | | Actual
loss 2 | |
| Central governments | | | 1 | | | | – | | | | 2 | | | | – | | | | 2 | | | | – | | | | 2 | | | | – | | | | 2 | | | | – | |
| | | | | | | | | | | | | | | | | | | | | | | | | | | | | | | | | | | | | | | | |
| Institutions | | | 7 | | | | 14 | | | | 22 | | | | 2 | | | | 16 | | | | 1 | | | | 21 | | | | 16 | | | | 13 | | | | 55 | |
| | | | | | | | | | | | | | | | | | | | | | | | | | | | | | | | | | | | | | | | |
| Corporates | | | 445 | | | | 393 | | | | 449 | | | | 363 | | | | 471 | | | | 358 | | | | 591 | | | | 1,665 | | | | 320 | | | | 251 | |
| | | | | | | | | | | | | | | | | | | | | | | | | | | | | | | | | | | | | | | | |
| Retail exposures secured by real estate property | | | 294 | | | | 337 | | | | 222 | | | | 359 | | | | 118 | | | | 101 | | | | 120 | | | | 140 | | | | 127 | | | | 125 | |
| | | | | | | | | | | | | | | | | | | | | | | | | | | | | | | | | | | | | | | | |
| Qualifying revolving retail exposures | | | 23 | | | | 17 | | | | 2 | | | | 30 | | | | 2 | | | | 5 | | | | 2 | | | | 7 | | | | 2 | | | | 4 | |
| | | | | | | | | | | | | | | | | | | | | | | | | | | | | | | | | | | | | | | | |
| Other retail exposures | | | 418 | | | | 348 | | | | 390 | | | | 301 | | | | 301 | | | | 282 | | | | 311 | | | | 315 | | | | 226 | | | | 223 | |
| | | | | | | | | | | | | | | | | | | | | | | | | | | | | | | | | | | | | | | | |
| Total expected loss and actual loss in the advanced IRBA | | | 1,188 | | | | 1,109 | | | | 1,088 | | | | 1,055 | | | | 910 | | | | 747 | | | | 1,047 | | | | 2,143 | | | | 690 | | | | 658 | |
| |
| 1 | The 2010 Expected Loss and 2011 Actual Loss figures have been restated to limit disclosure to Postbank’s advanced IRBA exposure only. |
| 2 | Losses related to assets reclassified into loans under IAS 39 amendments were excluded from the actual loss for 2008 since, as of December 31, 2007, the related assets were not within the scope of the corresponding expected loss calculation for loans. |
The actual loss in 2012 was 7 % lower than the expected loss and was primarily driven by the lower level of provisions in our Other retail portfolios.
The increase in expected loss as of December 31, 2011 and as of December 31, 2010 in comparison to December 31, 2009 as well as the higher actual losses in 2012 and 2011 is primarily related to the inclusion of Postbank.
In 2010 the actual loss was 18 % below the expected loss as the actual loss and was positively influenced by lower provisions taken for assets reclassified in accordance with IAS 39.
The decrease of the expected loss for 2010 compared to the expected loss for 2009 reflected the slightly improved economic environment after the financial crisis.
In 2009 actual losses exceeded the expected loss by 104 % driven mainly by material charges taken against a small number of exposures, primarily concentrated in Leveraged Finance, as well as the further deteriorating credit conditions not reflected in the expected losses for our corporate exposures at the beginning of the year.
The following table provides a year-to-year comparison of the actual loss by regulatory exposure class. Postbank is firstly included in the reporting period 2011.
Year-to-year comparison of the actual loss by IRBA exposure class
| | | | | | | | | | | | | | | | | | | | |
in€ m. | | 2012 | | | 2011 | | | 2010 | | | 2009 | | | 2008 | |
| Central governments | | | – | | | | – | | | | – | | | | – | | | | 73 | |
| | | | | | | | | | | | | | | | | | | | |
| Institutions | | | 14 | | | | 2 | | | | 1 | | | | 16 | | | | 55 | |
| | | | | | | | | | | | | | | | | | | | |
| Corporates | | | 393 | | | | 363 | | | | 358 | | | | 1,665 | | | | 295 | |
| | | | | | | | | | | | | | | | | | | | |
| Retail exposures secured by real estate property | | | 337 | | | | 359 | | | | 101 | | | | 140 | | | | 125 | |
| | | | | | | | | | | | | | | | | | | | |
| Qualifying revolving retail exposures | | | 17 | | | | 30 | | | | 5 | | | | 7 | | | | 4 | |
| | | | | | | | | | | | | | | | | | | | |
| Other retail exposures | | | 348 | | | | 301 | | | | 282 | | | | 315 | | | | 223 | |
| | | | | | | | | | | | | | | | | | | | |
| Total actual loss by IRBA in the advanced IRBA | | | 1,109 | | | | 1,055 | | | | 747 | | | | 2,143 | | | | 775 | |
| |
Our actual loss increased by€ 54 million or 5 % in 2012 compared to previous year. The drivers of this increase were primarily higher actual losses in the IRBA exposure classes Other retail exposures as well as Corporates excluding Postbank partly being offset by reduction throughout Postbank’s advanced IRBA exposure classes.
| | | | |
| Deutsche Bank | | 01 – Management Report | | 104 |
| Financial Report 2012 | | Risk Report | | |
| | |
| | | | |
| | |
| | | | |
New provisions established in 2011 were€ 308 million higher compared to 2010 primarily due to the first time inclusion of Postbank in full year reporting.
New provisions established in 2010 were lower by€ 1.4 billion compared to 2009, reflecting predominately significantly reduced provisions required for assets reclassified in accordance with IAS 39. Measures taken on portfolio and country level led to a reduction in the actual loss for our retail exposures in Spain and India, partially offset by increases in the consumer finance business in Poland. The observed decrease in actual loss were partially offset by provisions taken relating to the commercial banking activities acquired from ABN AMRO and Postbank.
The observed increase in actual loss of€ 1.4 billion in 2009 compared to 2008 reflected the overall deterioration in credit conditions, predominantly on our exposure against corporates. Of this increase, 83 % was attributable to assets which had been reclassified in accordance with IAS 39, relating primarily to exposures in Leveraged Finance. Further provisions against corporate exposures were a result of deteriorating credit conditions, predominantly in Europe and the Americas. Increases recorded for our retail exposures reflected our strategy to invest in higher margin consumer finance business and were mainly a result of exacerbating economic crisis in Spain which adversely affected our mortgage loan and commercial finance portfolios there and by its consumer finance business in Poland and India.
Advanced IRBA Exposure
The advanced IRBA requires differentiating a bank’s credit portfolio into various regulatory defined exposure classes, namely central governments, institutions, corporates and retail clients. We identify the relevant regulatory exposure class for each exposure by taking into account factors like customer-specific characteristics, the rating system used as well as certain materiality thresholds which are regulatory defined.
The tables below show all of our advanced IRBA exposures distributed on a rating scale and separately for each regulatory IRBA exposure class. The presentation also includes Postbank’s retail portfolios as far as assigned to the advanced IRBA. The EAD is presented in conjunction with exposures-weighted average PD and LGD, the risk-weighted assets (“RWA”) and the average risk weight (“RW”) calculated as RWA divided by EAD net. The information is shown after credit risk mitigation obtained in the form of financial, physical and other collateral as well as guarantees and credit derivatives. The effect of double default, as far as applicable outside of Postbank’s retail exposures, is considered in the average risk weight. It implies that for a guaranteed exposure a loss only occurs if the primary obligor and the guarantor fail to meet their obligations at the same time.
It should be noted that the EAD gross information for exposures covered by guarantees or credit derivatives is assigned to the exposure class of the original counterparty respectively whereas the EAD net information assigns the exposures to the protection seller. As a consequence the EAD net can be higher than the EAD gross.
The table below also includes our counterparty credit risk position from derivatives and securities financing transactions (“SFT”) as far as it has been assigned to the advanced IRBA. For the vast majority of these exposures we make use of the IMM to derive the EAD where the appropriate netting and collateral agreements are already considered resulting in an EAD net of collateral.
| | | | |
| Deutsche Bank | | 01 – Management Report | | 105 |
| Financial Report 2012 | | Risk Report | | |
| | |
| | | | |
| | |
| | | | |
EAD of Advanced IRBA Credit Exposures by PD Grade (including Postbank)
| | | | | | | | | | | | | | | | | | | | | | | | | | | | | | | | | | | | |
| | | Dec 31, 2012 | |
| | | iAAA – iAA
0.00 – 0.04 % | | | iA
0.04 – 0.11 % | | | iBBB
0.11 – 0.5 % | | | iBB
0.5 – 2.27 % | | | iB
2.27 –
10.22 % | | | iCCC
10.22 –
99.99 % | | | Default 1 | | | Total | | | Delta Total
to previous
year | |
| |
|
Central Governments | |
| |
EAD gross in€ m. | | | 85,351 | | | | 4,948 | | | | 2,804 | | | | 1,404 | | | | 732 | | | | 423 | | | | – | | | | 95,662 | | | | (14,939) | |
| | | | | | | | | | | | | | | | | | | | | | | | | | | | | | | | | | | | |
EAD net in€ m. | | | 93,599 | | | | 6,227 | | | | 2,533 | | | | 583 | | | | 207 | | | | 50 | | | | – | | | | 103,199 | | | | (15,925) | |
| | | | | | | | | | | | | | | | | | | | | | | | | | | | | | | | | | | | |
Average PD in % | | | – | | | | 0.08 | | | | 0.30 | | | | 1.40 | | | | 5.67 | | | | 13.05 | | | | 100.00 | | | | 0.04 | | | | (0.13)ppt | |
| | | | | | | | | | | | | | | | | | | | | | | | | | | | | | | | | | | | |
Average LGD in % | | | 49.24 | | | | 39.44 | | | | 42.77 | | | | 11.04 | | | | 42.70 | | | | 48.91 | | | | 5.00 | | | | 48.26 | | | | 0.75 ppt | |
| | | | | | | | | | | | | | | | | | | | | | | | | | | | | | | | | | | | |
Average RW in % | | | 0.49 | | | | 23.16 | | | | 49.88 | | | | 25.96 | | | | 165.01 | | | | 215.08 | | | | 62.50 | | | | 3.65 | | | | 1.47 ppt | |
| |
|
Institutions | |
| |
EAD gross in€ m. | | | 15,719 | | | | 31,913 | | | | 13,132 | | | | 2,706 | | | | 2,251 | | | | 481 | | | | 166 | | | | 66,368 | | | | (17,969) | |
| | | | | | | | | | | | | | | | | | | | | | | | | | | | | | | | | | | | |
EAD net in€ m. | | | 16,636 | | | | 32,136 | | | | 11,890 | | | | 2,356 | | | | 2,191 | | | | 481 | | | | 166 | | | | 65,856 | | | | (24,116) | |
| | | | | | | | | | | | | | | | | | | | | | | | | | | | | | | | | | | | |
Average PD in % | | | 0.04 | | | | 0.07 | | | | 0.25 | | | | 1.08 | | | | 3.00 | | | | 21.77 | | | | 100.00 | | | | 0.64 | | | | 0.31 ppt | |
| | | | | | | | | | | | | | | | | | | | | | | | | | | | | | | | | | | | |
Average LGD in % | | | 31.64 | | | | 27.03 | | | | 19.44 | | | | 21.83 | | | | 4.59 | | | | 5.51 | | | | 13.43 | | | | 25.70 | | | | (0.32)ppt | |
| | | | | | | | | | | | | | | | | | | | | | | | | | | | | | | | | | | | |
Average RW in % | | | 5.54 | | | | 11.10 | | | | 22.18 | | | | 53.91 | | | | 16.29 | | | | 30.79 | | | | 25.55 | | | | 13.58 | | | | (0.56)ppt | |
| |
|
Corporates | |
| |
EAD gross in€ m. | | | 76,225 | | | | 65,701 | | | | 66,759 | | | | 50,632 | | | | 21,795 | | | | 5,753 | | | | 7,598 | | | | 294,463 | | | | (41,477) | |
| | | | | | | | | | | | | | | | | | | | | | | | | | | | | | | | | | | | |
EAD net in€ m. | | | 78,535 | | | | 64,830 | | | | 62,096 | | | | 45,023 | | | | 18,351 | | | | 4,993 | | | | 7,361 | | | | 281,190 | | | | (40,521) | |
| | | | | | | | | | | | | | | | | | | | | | | | | | | | | | | | | | | | |
Average PD in % | | | 0.03 | | | | 0.07 | | | | 0.24 | | | | 1.17 | | | | 4.70 | | | | 23.56 | | | | 100.00 | | | | 3.61 | | | | 0.12 ppt | |
| | | | | | | | | | | | | | | | | | | | | | | | | | | | | | | | | | | | |
Average LGD in % | | | 32.63 | | | | 34.72 | | | | 30.90 | | | | 24.84 | | | | 22.79 | | | | 16.78 | | | | 28.19 | | | | 30.44 | | | | 1.09 ppt | |
| | | | | | | | | | | | | | | | | | | | | | | | | | | | | | | | | | | | |
Average RW in % | | | 9.50 | | | | 17.86 | | | | 31.06 | | | | 49.72 | | | | 79.28 | | | | 92.15 | | | | 24.14 | | | | 29.04 | | | | (2.24)ppt | |
| |
|
Retail Exposures Secured by Real Estate Property | |
| |
EAD gross in€ m. | | | 2,766 | | | | 9,976 | | | | 45,086 | | | | 67,241 | | | | 12,762 | | | | 5,432 | | | | 2,680 | | | | 145,943 | | | | 10,613 | |
| | | | | | | | | | | | | | | | | | | | | | | | | | | | | | | | | | | | |
EAD net in€ m. | | | 2,766 | | | | 9,976 | | | | 45,078 | | | | 67,203 | | | | 12,730 | | | | 5,410 | | | | 2,665 | | | | 145,828 | | | | 10,615 | |
| | | | | | | | | | | | | | | | | | | | | | | | | | | | | | | | | | | | |
Average PD in % | | | 0.03 | | | | 0.08 | | | | 0.29 | | | | 1.05 | | | | 4.70 | | | | 21.24 | | | | 100.00 | | | | 3.58 | | | | (0.11)ppt | |
| | | | | | | | | | | | | | | | | | | | | | | | | | | | | | | | | | | | |
Average LGD in % | | | 12.13 | | | | 15.18 | | | | 10.40 | | | | 12.21 | | | | 9.69 | | | | 8.85 | | | | 17.99 | | | | 11.04 | | | | 0.14 ppt | |
| | | | | | | | | | | | | | | | | | | | | | | | | | | | | | | | | | | | |
Average RW in % | | | 1.36 | | | | 4.88 | | | | 5.72 | | | | 16.50 | | | | 31.73 | | | | 53.92 | | | | 14.53 | | | | 13.89 | | | | 0.00 ppt | |
| |
|
Qualifying Revolving Retail Exposures | |
| |
EAD gross in€ m. | | | 176 | | | | 1,012 | | | | 1,863 | | | | 1,080 | | | | 292 | | | | 91 | | | | 35 | | | | 4,550 | | | | (580) | |
| | | | | | | | | | | | | | | | | | | | | | | | | | | | | | | | | | | | |
EAD net in€ m. | | | 176 | | | | 1,012 | | | | 1,863 | | | | 1,080 | | | | 292 | | | | 91 | | | | 35 | | | | 4,550 | | | | (580) | |
| | | | | | | | | | | | | | | | | | | | | | | | | | | | | | | | | | | | |
Average PD in % | | | 0.04 | | | | 0.08 | | | | 0.24 | | | | 1.04 | | | | 4.77 | | | | 19.86 | | | | 100.00 | | | | 1.98 | | | | 0.10 ppt | |
| | | | | | | | | | | | | | | | | | | | | | | | | | | | | | | | | | | | |
Average LGD in % | | | 44.30 | | | | 45.49 | | | | 45.67 | | | | 44.63 | | | | 47.92 | | | | 48.20 | | | | 48.33 | | | | 47.12 | | | | (13.81)ppt | |
| | | | | | | | | | | | | | | | | | | | | | | | | | | | | | | | | | | | |
Average RW in % | | | 1.26 | | | | 2.46 | | | | 6.03 | | | | 18.44 | | | | 59.70 | | | | 140.05 | | | | 7.33 | | | | 16.22 | | | | (12.45)ppt | |
| |
|
Other Retail Exposures | |
| |
EAD gross in€ m. | | | 257 | | | | 1,436 | | | | 6,920 | | | | 12,256 | | | | 6,477 | | | | 2,310 | | | | 2,792 | | | | 32,448 | | | | 1,546 | |
| | | | | | | | | | | | | | | | | | | | | | | | | | | | | | | | | | | | |
EAD net in€ m. | | | 294 | | | | 1,625 | | | | 7,053 | | | | 12,272 | | | | 6,497 | | | | 2,278 | | | | 2,697 | | | | 32,716 | | | | 1,612 | |
| | | | | | | | | | | | | | | | | | | | | | | | | | | | | | | | | | | | |
Average PD in % | | | 0.03 | | | | 0.08 | | | | 0.30 | | | | 1.15 | | | | 4.83 | | | | 19.96 | | | | 100.00 | | | | 11.13 | | | | 3.91 ppt | |
| | | | | | | | | | | | | | | | | | | | | | | | | | | | | | | | | | | | |
Average LGD in % | | | 41.61 | | | | 46.82 | | | | 43.50 | | | | 44.91 | | | | 49.81 | | | | 46.43 | | | | 48.51 | | | | 45.81 | | | | 0.05 ppt | |
| | | | | | | | | | | | | | | | | | | | | | | | | | | | | | | | | | | | |
Average RW in % | | | 4.77 | | | | 9.99 | | | | 23.91 | | | | 49.52 | | | | 77.41 | | | | 114.21 | | | | 6.60 | | | | 47.22 | | | | 2.38 ppt | |
| |
|
Total IRBA Exposures | |
| |
EAD gross in€ m. | | | 180,494 | | | | 114,986 | | | | 136,564 | | | | 135,320 | | | | 44,308 | | | | 14,490 | | | | 13,271 | | | | 639,433 | | | | (62,805) | |
| | | | | | | | | | | | | | | | | | | | | | | | | | | | | | | | | | | | |
EAD net in€ m. | | | 192,006 | | | | 115,806 | | | | 130,514 | | | | 128,517 | | | | 40,267 | | | | 13,304 | | | | 12,924 | | | | 633,338 | | | | (68,915) | |
| | | | | | | | | | | | | | | | | | | | | | | | | | | | | | | | | | | | |
Average PD in % | | | 0.02 | | | | 0.07 | | | | 0.26 | | | | 1.14 | | | | 4.58 | | | | 21.96 | | | | 100.00 | | | | 3.08 | | | | 0.41 ppt | |
| | | | | | | | | | | | | | | | | | | | | | | | | | | | | | | | | | | | |
Average LGD in % | | | 40.46 | | | | 31.75 | | | | 25.83 | | | | 19.89 | | | | 22.03 | | | | 18.25 | | | | 30.12 | | | | 29.36 | | | | (0.51)ppt | |
| | | | | | | | | | | | | | | | | | | | | | | | | | | | | | | | | | | | |
Average RW in % | | | 4.64 | | | | 15.22 | | | | 23.61 | | | | 32.41 | | | | 59.49 | | | | 78.67 | | | | 17.38 | | | | 20.61 | | | | (0.85)ppt | |
| |
| 1 | The relative low risk weights in the column “Default” reflect the fact that capital requirements for defaulted exposures are principally considered as a deduction from regulatory capital equal to the difference in expected loss and allowances. |
| | | | |
| Deutsche Bank | | 01 – Management Report | | 106 |
| Financial Report 2012 | | Risk Report | | |
| | |
| | | | |
| | |
| | | | |
| | | | | | | | | | | | | | | | | | | | | | | | | | | | | | | | |
| | | Dec 31, 2011 | |
| | | iAAA – iAA
0.00 – 0.04 % | | | iA
0.04 – 0.11 % | | | iBBB
0.11 – 0.5 % | | | iBB
0.5 – 2.27 % | | | iB
2.27 –
10.22 % | | | iCCC
10.22 –
99.99 % | | | Default 1 | | | Total | |
| |
|
Central Governments | |
| |
EAD gross in€ m. | | | 102,638 | | | | 2,712 | | | | 2,280 | | | | 1,669 | | | | 759 | | | | 380 | | | | 163 | | | | 110,601 | |
| | | | | | | | | | | | | | | | | | | | | | | | | | | | | | | | |
EAD net in€ m. | | | 113,128 | | | | 2,716 | | | | 2,023 | | | | 818 | | | | 276 | | | | 0 | | | | 163 | | | | 119,124 | |
| | | | | | | | | | | | | | | | | | | | | | | | | | | | | | | | |
Average PD in % | | | 0.00 | | | | 0.07 | | | | 0.27 | | | | 1.37 | | | | 5.28 | | | | 21.82 | | | | 100.00 | | | | 0.17 | |
| | | | | | | | | | | | | | | | | | | | | | | | | | | | | | | | |
Average LGD in % | | | 48.01 | | | | 42.12 | | | | 46.68 | | | | 11.14 | | | | 35.45 | | | | 50.00 | | | | 5.00 | | | | 47.51 | |
| | | | | | | | | | | | | | | | | | | | | | | | | | | | | | | | |
Average RW in % | | | 0.27 | | | | 23.36 | | | | 45.71 | | | | 33.39 | | | | 124.98 | | | | 289.48 | | | | 62.50 | | | | 2.17 | |
| |
|
Institutions | |
| |
EAD gross in€ m. | | | 27,831 | | | | 36,188 | | | | 15,543 | | | | 4,227 | | | | 182 | | | | 230 | | | | 136 | | | | 84,337 | |
| | | | | | | | | | | | | | | | | | | | | | | | | | | | | | | | |
EAD net in€ m. | | | 29,482 | | | | 43,156 | | | | 13,539 | | | | 3,287 | | | | 148 | | | | 224 | | | | 136 | | | | 89,972 | |
| | | | | | | | | | | | | | | | | | | | | | | | | | | | | | | | |
Average PD in % | | | 0.04 | | | | 0.06 | | | | 0.25 | | | | 0.99 | | | | 4.65 | | | | 21.89 | | | | 100.00 | | | | 0.33 | |
| | | | | | | | | | | | | | | | | | | | | | | | | | | | | | | | |
Average LGD in % | | | 23.65 | | | | 29.18 | | | | 22.81 | | | | 20.29 | | | | 29.75 | | | | 14.55 | | | | 10.01 | | | | 26.02 | |
| | | | | | | | | | | | | | | | | | | | | | | | | | | | | | | | |
Average RW in % | | | 7.10 | | | | 11.75 | | | | 26.28 | | | | 48.34 | | | | 98.72 | | | | 84.20 | | | | 61.08 | | | | 14.15 | |
| |
|
Corporates | |
| |
EAD gross in€ m. | | | 98,278 | | | | 69,659 | | | | 74,786 | | | | 50,666 | | | | 24,246 | | | | 10,784 | | | | 7,519 | | | | 335,939 | |
| | | | | | | | | | | | | | | | | | | | | | | | | | | | | | | | |
EAD net in€ m. | | | 97,813 | | | | 70,082 | | | | 69,951 | | | | 45,518 | | | | 21,159 | | | | 10,019 | | | | 7,169 | | | | 321,711 | |
| | | | | | | | | | | | | | | | | | | | | | | | | | | | | | | | |
Average PD in % | | | 0.03 | | | | 0.07 | | | | 0.24 | | | | 1.14 | | | | 4.65 | | | | 23.14 | | | | 100.00 | | | | 3.49 | |
| | | | | | | | | | | | | | | | | | | | | | | | | | | | | | | | |
Average LGD in % | | | 26.79 | | | | 35.86 | | | | 31.83 | | | | 26.35 | | | | 25.94 | | | | 14.25 | | | | 26.58 | | | | 29.35 | |
| | | | | | | | | | | | | | | | | | | | | | | | | | | | | | | | |
Average RW in % | | | 9.72 | | | | 18.51 | | | | 32.57 | | | | 56.93 | | | | 92.11 | | | | 78.46 | | | | 29.02 | | | | 31.27 | |
| |
|
Retail Exposures Secured by Real Estate Property2 | |
| |
EAD gross in€ m. | | | 12,114 | | | | 13,125 | | | | 33,803 | | | | 57,341 | | | | 11,743 | | | | 4,463 | | | | 2,740 | | | | 135,329 | |
| | | | | | | | | | | | | | | | | | | | | | | | | | | | | | | | |
EAD net in€ m. | | | 12,114 | | | | 13,125 | | | | 33,795 | | | | 57,303 | | | | 11,706 | | | | 4,443 | | | | 2,726 | | | | 135,213 | |
| | | | | | | | | | | | | | | | | | | | | | | | | | | | | | | | |
Average PD in % | | | 0.03 | | | | 0.08 | | | | 0.28 | | | | 1.06 | | | | 4.64 | | | | 20.66 | | | | 100.00 | | | | 3.69 | |
| | | | | | | | | | | | | | | | | | | | | | | | | | | | | | | | |
Average LGD in % | | | 11.43 | | | | 11.47 | | | | 10.81 | | | | 11.89 | | | | 10.56 | | | | 11.08 | | | | 14.00 | | | | 11.18 | |
| | | | | | | | | | | | | | | | | | | | | | | | | | | | | | | | |
Average RW in % | | | 1.18 | | | | 2.40 | | | | 5.77 | | | | 16.22 | | | | 33.95 | | | | 62.86 | | | | 0.83 | | | | 13.89 | |
| |
|
Qualifying Revolving Retail Exposures2 | |
| |
EAD gross in€ m. | | | 277 | | | | 1,285 | | | | 1,863 | | | | 1,175 | | | | 383 | | | | 92 | | | | 53 | | | | 5,129 | |
| | | | | | | | | | | | | | | | | | | | | | | | | | | | | | | | |
EAD net in€ m. | | | 277 | | | | 1,285 | | | | 1,863 | | | | 1,175 | | | | 383 | | | | 92 | | | | 53 | | | | 5,129 | |
| | | | | | | | | | | | | | | | | | | | | | | | | | | | | | | | |
Average PD in % | | | 0.03 | | | | 0.09 | | | | 0.27 | | | | 1.15 | | | | 4.79 | | | | 15.17 | | | | 100.00 | | | | 1.89 | |
| | | | | | | | | | | | | | | | | | | | | | | | | | | | | | | | |
Average LGD in % | | | 40.27 | | | | 62.76 | | | | 62.20 | | | | 61.73 | | | | 60.52 | | | | 59.95 | | | | 42.37 | | | | 60.94 | |
| | | | | | | | | | | | | | | | | | | | | | | | | | | | | | | | |
Average RW in % | | | 1.10 | | | | 3.73 | | | | 8.94 | | | | 27.42 | | | | 74.83 | | | | 139.51 | | | | 6.95 | | | | 28.67 | |
| |
|
Other Retail Exposures2 | |
| |
EAD gross in€ m. | | | 384 | | | | 1,480 | | | | 7,974 | | | | 12,026 | | | | 5,417 | | | | 2,160 | | | | 1,462 | | | | 30,902 | |
| | | | | | | | | | | | | | | | | | | | | | | | | | | | | | | | |
EAD net in€ m. | | | 408 | | | | 1,545 | | | | 8,128 | | | | 12,051 | | | | 5,481 | | | | 2,118 | | | | 1,373 | | | | 31,104 | |
| | | | | | | | | | | | | | | | | | | | | | | | | | | | | | | | |
Average PD in % | | | 0.03 | | | | 0.08 | | | | 0.29 | | | | 1.13 | | | | 4.61 | | | | 21.75 | | | | 100.00 | | | | 7.23 | |
| | | | | | | | | | | | | | | | | | | | | | | | | | | | | | | | |
Average LGD in % | | | 39.51 | | | | 41.39 | | | | 50.40 | | | | 45.98 | | | | 47.44 | | | | 36.78 | | | | 49.74 | | | | 45.77 | |
| | | | | | | | | | | | | | | | | | | | | | | | | | | | | | | | |
Average RW in % | | | 4.71 | | | | 9.58 | | | | 27.24 | | | | 50.12 | | | | 73.03 | | | | 86.19 | | | | 2.32 | | | | 44.84 | |
| |
|
Total IRBA Exposures2 | |
| |
EAD gross in€ m. | | | 241,523 | | | | 124,448 | | | | 136,249 | | | | 127,104 | | | | 42,731 | | | | 18,109 | | | | 12,074 | | | | 702,238 | |
| | | | | | | | | | | | | | | | | | | | | | | | | | | | | | | | |
EAD net in€ m. | | | 253,222 | | | | 131,909 | | | | 129,299 | | | | 120,151 | | | | 39,153 | | | | 16,898 | | | | 11,621 | | | | 702,253 | |
| | | | | | | | | | | | | | | | | | | | | | | | | | | | | | | | |
Average PD in % | | | 0.02 | | | | 0.07 | | | | 0.25 | | | | 1.13 | | | | 4.62 | | | | 22.33 | | | | 100.00 | | | | 2.67 | |
| | | | | | | | | | | | | | | | | | | | | | | | | | | | | | | | |
Average LGD in % | | | 36.02 | | | | 32.61 | | | | 27.73 | | | | 21.63 | | | | 24.42 | | | | 16.34 | | | | 26.79 | | | | 29.86 | |
| | | | | | | | | | | | | | | | | | | | | | | | | | | | | | | | |
Average RW in % | | | 4.88 | | | | 15.31 | | | | 26.00 | | | | 37.99 | | | | 71.51 | | | | 75.48 | | | | 23.90 | | | | 21.46 | |
| |
| 1 | The relative low risk weights in the column “Default” reflect the fact that capital requirements for defaulted exposures are principally considered as a deduction from regulatory capital equal to the difference in expected loss and allowances. |
| 2 | The 2011 amounts for the retail exposure classes have been adjusted in order to reflect predominantly the integration of the Postbank retail IRBA exposures which were disclosed separately in prior year. |
The decrease in the segments corporate and institutes are largely driven by exposure decrease in derivative and security financing transactions as a result of our portfolio de-risking activities. The decrease in the central governments segment is primarily due to reduction in interest earning deposits with central banks.
| | | | |
| Deutsche Bank | | 01 – Management Report | | 107 |
| Financial Report 2012 | | Risk Report | | |
| | |
| | | | |
| | |
| | | | |
The tables below show our advanced IRBA exposures excluding counterparty credit risk exposures from derivatives and SFT for central governments, institutions and corporates, distributed on our internal rating scale, showing also the PD range for each grade. Our internal ratings correspond to the respective external Standard & Poor’s rating equivalents. The EAD net is presented in conjunction with exposures-weighted average PD and LGD, the RWA and the average RW. The information is shown after credit risk mitigation obtained in the form of financial, physical and other collateral as well as guarantees and credit derivatives. The effect of double default, as far as applicable to exposures outside of Postbank is considered in the average risk weight. It implies that for a guaranteed exposure a loss only occurs if the primary obligor and the guarantor fail to meet their obligations at the same time.
EAD net for Advanced IRBA non-retail Credit Exposures by PD Grade with Central Governments (excluding derivatives and SFTs)
| | | | | | | | | | | | | | | | | | | | | | | | |
in€ m. (unless stated otherwise) | | Dec 31, 2012 | |
| | | | |
| Internal rating | | PD range
in % | | | EAD net | | | Average
PD in % | | | Average
LGD in % | | | RWA | | | Average
RW in % | |
| | | | | | | | | | | | | | | | | | | | | | | | |
iAAA | | | > 0.00 £ 0.01 | | | | 88,889 | | | | 0.00 | | | | 49.65 | | | | 181 | | | | 0.20 | |
| | | | | | | | | | | | | | | | | | | | | | | | |
iAA+ | | | > 0.01£ 0.02 | | | | 627 | | | | 0.02 | | | | 30.00 | | | | 28 | | | | 4.53 | |
| | | | | | | | | | | | | | | | | | | | | | | | |
iAA | | | > 0.02£ 0.03 | | | | 221 | | | | 0.03 | | | | 30.47 | | | | 14 | | | | 6.49 | |
| | | | | | | | | | | | | | | | | | | | | | | | |
iAA- | | | > 0.03£ 0.04 | | | | 81 | | | | 0.04 | | | | 30.20 | | | | 11 | | | | 13.36 | |
| | | | | | | | | | | | | | | | | | | | | | | | |
iA+ | | | > 0.04£ 0.05 | | | | 345 | | | | 0.05 | | | | 49.51 | | | | 49 | | | | 14.32 | |
| | | | | | | | | | | | | | | | | | | | | | | | |
iA | | | > 0.05£ 0.07 | | | | 1,413 | | | | 0.07 | | | | 49.53 | | | | 448 | | | | 31.71 | |
| | | | | | | | | | | | | | | | | | | | | | | | |
iA- | | | > 0.07£ 0.11 | | | | 1,783 | | | | 0.09 | | | | 48.79 | | | | 582 | | | | 32.65 | |
| | | | | | | | | | | | | | | | | | | | | | | | |
iBBB+ | | | > 0.11£ 0.18 | | | | 308 | | | | 0.14 | | | | 47.94 | | | | 61 | | | | 19.66 | |
| | | | | | | | | | | | | | | | | | | | | | | | |
iBBB | | | > 0.18£ 0.30 | | | | 616 | | | | 0.23 | | | | 37.91 | | | | 241 | | | | 39.16 | |
| | | | | | | | | | | | | | | | | | | | | | | | |
iBBB- | | | > 0.30£ 0.50 | | | | 1,048 | | | | 0.39 | | | | 48.72 | | | | 589 | | | | 56.23 | |
| | | | | | | | | | | | | | | | | | | | | | | | |
iBB+ | | | > 0.50£ 0.83 | | | | 24 | | | | 0.64 | | | | 44.10 | | | | 24 | | | | 100.70 | |
| | | | | | | | | | | | | | | | | | | | | | | | |
iBB | | | > 0.83£ 1.37 | | | | 100 | | | | 1.07 | | | | 11.89 | | | | 26 | | | | 25.93 | |
| | | | | | | | | | | | | | | | | | | | | | | | |
iBB- | | | > 1.37£ 2.27 | | | | 343 | | | | 1.76 | | | | 1.48 | | | | 15 | | | | 4.40 | |
| | | | | | | | | | | | | | | | | | | | | | | | |
iB+ | | | > 2.27£ 3.75 | | | | 42 | | | | 2.92 | | | | 45.08 | | | | 57 | | | | 133.24 | |
| | | | | | | | | | | | | | | | | | | | | | | | |
iB | | | > 3.75£ 6.19 | | | | 78 | | | | 4.82 | | | | 39.01 | | | | 127 | | | | 163.31 | |
| | | | | | | | | | | | | | | | | | | | | | | | |
iB- | | | > 6.19£ 10.22 | | | | 42 | | | | 7.95 | | | | 41.84 | | | | 67 | | | | 159.36 | |
| | | | | | | | | | | | | | | | | | | | | | | | |
iCCC+ | | | > 10.22 £ 16.87 | | | | 48 | | | | 13.00 | | | | 49.08 | | | | 103 | | | | 214.37 | |
| | | | | | | | | | | | | | | | | | | | | | | | |
iCCC | | | > 16.87£ 27.84 | | | | 0 | | | | 22.00 | | | | 11.38 | | | | 0 | | | | 70.77 | |
| | | | | | | | | | | | | | | | | | | | | | | | |
iCCC- | | | > 27.84 £ 99.99 | | | | 0 | | | | 31.00 | | | | 3.30 | | | | 0 | | | | 503.75 | |
| | | | | | | | | | | | | | | | | | | | | | | | |
Default | | | 100.00 | | | | – | | | | 100.00 | | | | 5.00 | | | | – | | | | 62.50 | |
| | | | | | | | | | | | | | | | | | | | | | | | |
Total | | | – | | | | 96,008 | | | | 0.03 | | | | 49.13 | | | | 2,624 | | | | 2.73 | |
| |
| | | | |
| Deutsche Bank | | 01 – Management Report | | 108 |
| Financial Report 2012 | | Risk Report | | |
| | |
| | | | |
| | |
| | | | |
EAD net for Advanced IRBA non-retail Credit Exposures by PD Grade with Institutions (excluding derivatives and SFTs)
| | | | | | | | | | | | | | | | | | | | | | | | |
in€ m. (unless stated otherwise) | | Dec 31, 2012 | |
| | | | |
| Internal rating | | PD range in % | | | EAD net | | | Average
PD in %1 | | | Average
LGD in % | | | RWA | | | Average
RW in % | |
| | | | | | | | | | | | | | | | | | | | | | | | |
iAAA | | | > 0.00£ 0.01 | | | | 806 | | | | 0.02 | | | | 45.55 | | | | 62 | | | | 7.74 | |
| | | | | | | | | | | | | | | | | | | | | | | | |
iAA+ | | | > 0.01£ 0.02 | | | | 187 | | | | 0.03 | | | | 36.23 | | | | 21 | | | | 10.99 | |
| | | | | | | | | | | | | | | | | | | | | | | | |
iAA | | | > 0.02£ 0.03 | | | | 2,836 | | | | 0.03 | | | | 41.91 | | | | 131 | | | | 4.62 | |
| | | | | | | | | | | | | | | | | | | | | | | | |
iAA- | | | > 0.03£ 0.04 | | | | 3,961 | | | | 0.04 | | | | 38.79 | | | | 278 | | | | 7.03 | |
| | | | | | | | | | | | | | | | | | | | | | | | |
iA+ | | | > 0.04£ 0.05 | | | | 3,277 | | | | 0.05 | | | | 41.19 | | | | 420 | | | | 12.81 | |
| | | | | | | | | | | | | | | | | | | | | | | | |
iA | | | > 0.05£ 0.07 | | | | 5,013 | | | | 0.07 | | | | 36.60 | | | | 635 | | | | 12.67 | |
| | | | | | | | | | | | | | | | | | | | | | | | |
iA- | | | > 0.07£ 0.11 | | | | 3,486 | | | | 0.09 | | | | 33.68 | | | | 534 | | | | 15.32 | |
| | | | | | | | | | | | | | | | | | | | | | | | |
iBBB+ | | | > 0.11£ 0.18 | | | | 750 | | | | 0.14 | | | | 29.67 | | | | 178 | | | | 23.76 | |
| | | | | | | | | | | | | | | | | | | | | | | | |
iBBB | | | > 0.18£ 0.30 | | | | 645 | | | | 0.23 | | | | 25.74 | | | | 195 | | | | 30.24 | |
| | | | | | | | | | | | | | | | | | | | | | | | |
iBBB- | | | > 0.30£ 0.50 | | | | 3,052 | | | | 0.39 | | | | 27.33 | | | | 1,060 | | | | 34.72 | |
| | | | | | | | | | | | | | | | | | | | | | | | |
iBB+ | | | > 0.50£ 0.83 | | | | 505 | | | | 0.64 | | | | 17.29 | | | | 138 | | | | 27.22 | |
| | | | | | | | | | | | | | | | | | | | | | | | |
iBB | | | > 0.83£ 1.37 | | | | 1,115 | | | | 1.07 | | | | 13.89 | | | | 382 | | | | 34.26 | |
| | | | | | | | | | | | | | | | | | | | | | | | |
iBB- | | | > 1.37£ 2.27 | | | | 113 | | | | 1.76 | | | | 19.78 | | | | 46 | | | | 40.89 | |
| | | | | | | | | | | | | | | | | | | | | | | | |
iB+ | | | > 2.27£ 3.75 | | | | 2,071 | | | | 2.92 | | | | 4.31 | | | | 319 | | | | 15.40 | |
| | | | | | | | | | | | | | | | | | | | | | | | |
iB | | | > 3.75£ 6.19 | | | | 29 | | | | 4.80 | | | | 7.02 | | | | 7 | | | | 22.54 | |
| | | | | | | | | | | | | | | | | | | | | | | | |
iB- | | | > 6.19£ 10.22 | | | | 17 | | | | 7.95 | | | | 5.61 | | | | 4 | | | | 24.13 | |
| | | | | | | | | | | | | | | | | | | | | | | | |
iCCC+ | | | > 10.22£ 16.87 | | | | 11 | | | | 13.00 | | | | 14.84 | | | | 8 | | | | 67.92 | |
| | | | | | | | | | | | | | | | | | | | | | | | |
iCCC | | | > 16.87£ 27.84 | | | | 217 | | | | 22.00 | | | | 5.72 | | | | 65 | | | | 30.02 | |
| | | | | | | | | | | | | | | | | | | | | | | | |
iCCC- | | | > 27.84 £ 99.99 | | | | 0 | | | | 31.00 | | | | 20.44 | | | | 0 | | | | 121.97 | |
| | | | | | | | | | | | | | | | | | | | | | | | |
Default | | | 100.00 | | | | 148 | | | | 100.00 | | | | 14.98 | | | | 42 | | | | 28.45 | |
| | | | | | | | | | | | | | | | | | | | | | | | |
Total | | | – | | | | 28,241 | | | | 1.07 | | | | 32.34 | | | | 4,525 | | | | 16.02 | |
| |
| 1 | Higher average PD in % than defined for the internal rating scales iAAA and iAA+ results for Institutions and Corporates exposure subject to a PD floor of 3 basis points. |
EAD net for Advanced IRBA non-retail Credit Exposures by PD Grade with Corporates (excluding derivatives and SFTs)
| | | | | | | | | | | | | | | | | | | | | | | | |
in€ m. (unless stated otherwise) | | Dec 31, 2012 | |
| | | | |
| Internal rating | | PD range
in % | | | EAD net | | | Average
PD in %1 | | | Average
LGD in % | | | RWA | | | Average
RW in % | |
| | | | | | | | | | | | | | | | | | | | | | | | |
iAAA | | | > 0.00£ 0.01 | | | | 6,209 | | | | 0.03 | | | | 21.99 | | | | 332 | | | | 5.35 | |
| | | | | | | | | | | | | | | | | | | | | | | | |
iAA+ | | | > 0.01£ 0.02 | | | | 4,018 | | | | 0.03 | | | | 31.40 | | | | 290 | | | | 7.23 | |
| | | | | | | | | | | | | | | | | | | | | | | | |
iAA | | | > 0.02£ 0.03 | | | | 6,406 | | | | 0.03 | | | | 19.20 | | | | 333 | | | | 5.19 | |
| | | | | | | | | | | | | | | | | | | | | | | | |
iAA- | | | > 0.03£ 0.04 | | | | 12,073 | | | | 0.04 | | | | 27.36 | | | | 939 | | | | 7.78 | |
| | | | | | | | | | | | | | | | | | | | | | | | |
iA+ | | | > 0.04£ 0.05 | | | | 12,553 | | | | 0.05 | | | | 30.89 | | | | 1,543 | | | | 12.29 | |
| | | | | | | | | | | | | | | | | | | | | | | | |
iA | | | > 0.05£ 0.07 | | | | 14,201 | | | | 0.07 | | | | 30.99 | | | | 2,152 | | | | 15.16 | |
| | | | | | | | | | | | | | | | | | | | | | | | |
iA- | | | > 0.07£ 0.11 | | | | 20,571 | | | | 0.09 | | | | 37.20 | | | | 4,503 | | | | 21.89 | |
| | | | | | | | | | | | | | | | | | | | | | | | |
iBBB+ | | | > 0.11£ 0.18 | | | | 18,108 | | | | 0.14 | | | | 32.92 | | | | 4,676 | | | | 25.82 | |
| | | | | | | | | | | | | | | | | | | | | | | | |
iBBB | | | > 0.18£ 0.30 | | | | 19,811 | | | | 0.23 | | | | 27.15 | | | | 5,121 | | | | 25.85 | |
| | | | | | | | | | | | | | | | | | | | | | | | |
iBBB- | | | > 0.30£ 0.50 | | | | 13,699 | | | | 0.39 | | | | 29.28 | | | | 4,939 | | | | 36.06 | |
| | | | | | | | | | | | | | | | | | | | | | | | |
iBB+ | | | > 0.50£ 0.83 | | | | 10,284 | | | | 0.64 | | | | 28.43 | | | | 4,966 | | | | 48.29 | |
| | | | | | | | | | | | | | | | | | | | | | | | |
iBB | | | > 0.83£ 1.37 | | | | 10,388 | | | | 1.07 | | | | 24.13 | | | | 5,331 | | | | 51.32 | |
| | | | | | | | | | | | | | | | | | | | | | | | |
iBB- | | | > 1.37£ 2.27 | | | | 13,386 | | | | 1.76 | | | | 23.01 | | | | 6,191 | | | | 46.25 | |
| | | | | | | | | | | | | | | | | | | | | | | | |
iB+ | | | > 2.27£ 3.75 | | | | 6,154 | | | | 2.92 | | | | 20.14 | | | | 3,743 | | | | 60.83 | |
| | | | | | | | | | | | | | | | | | | | | | | | |
iB | | | > 3.75£ 6.19 | | | | 5,305 | | | | 4.82 | | | | 19.46 | | | | 3,673 | | | | 69.23 | |
| | | | | | | | | | | | | | | | | | | | | | | | |
iB- | | | > 6.19£ 10.22 | | | | 3,362 | | | | 7.95 | | | | 19.71 | | | | 2,731 | | | | 81.26 | |
| | | | | | | | | | | | | | | | | | | | | | | | |
iCCC+ | | | > 10.22£ 16.87 | | | | 1,485 | | | | 13.00 | | | | 16.16 | | | | 1,210 | | | | 81.47 | |
| | | | | | | | | | | | | | | | | | | | | | | | |
iCCC | | | > 16.87£ 27.84 | | | | 682 | | | | 22.00 | | | | 24.09 | | | | 972 | | | | 142.56 | |
| | | | | | | | | | | | | | | | | | | | | | | | |
iCCC- | | | > 27.84 £ 99.99 | | | | 1,612 | | | | 31.00 | | | | 6.88 | | | | 637 | | | | 39.53 | |
| | | | | | | | | | | | | | | | | | | | | | | | |
Default | | | 100.00 | | | | 7,141 | | | | 100.00 | | | | 28.73 | | | | 1,664 | | | | 23.30 | |
| | | | | | | | | | | | | | | | | | | | | | | | |
Total | | | – | | | | 187,450 | | | | 4.94 | | | | 27.98 | | | | 55,958 | | | | 29.85 | |
| |
| 1 | Higher average PD in % than defined for the internal rating scales iAAA and iAA+ results for Institutions and Corporates exposure subject to a PD floor of 3 basis points. |
The majority of these exposures in all exposure classes is assigned to investment-grade customers. The exposures in the lower rating classes are largely collateralized.
| | | | |
| Deutsche Bank | | 01 – Management Report | | 109 |
| Financial Report 2012 | | Risk Report | | |
| | |
| | | | |
| | |
| | | | |
The table below shows our undrawn commitment exposure treated within the advanced IRBA, including the respective retail portfolios from Postbank. It is broken down by regulatory exposure class and also provides the corresponding exposure-weighted credit conversion factors and resulting EADs.
Undrawn commitment exposure within the advanced IRBA by regulatory exposure class (including Postbank)
| | | | | | | | | | | | | | | | | | | | | | | | |
| | | Dec 31, 2012 | | | Dec 31, 2011 | |
| | | Undrawn
commitments
in€ m. | | | Weighted
Credit
Conversion
Factor (CCF)
in % | | | Exposure
value for undrawn
commitments
(EAD) in€ m. | | | Undrawn
commitments
in€ m. | | | Weighted
Credit
Conversion
Factor (CCF)
in % | | | Exposure
value
for undrawn
commitments
(EAD)
in€ m. | |
| | | | | | | | | | | | | | | | | | | | | | | | |
| Central governments | | | 847 | | | | 84 | | | | 712 | | | | 802 | | | | 90 | | | | 720 | |
| | | | | | | | | | | | | | | | | | | | | | | | |
| Institutions | | | 1,885 | | | | 51 | | | | 955 | | | | 1,575 | | | | 44 | | | | 700 | |
| | | | | | | | | | | | | | | | | | | | | | | | |
| Corporates | | | 135,850 | | | | 40 | | | | 53,868 | | | | 133,928 | | | | 43 | | | | 57,452 | |
| | | | | | | | | | | | | | | | | | | | | | | | |
| Retail exposures secured by real estate property1 | | | 6,755 | | | | 77 | | | | 5,210 | | | | 5,415 | | | | 82 | | | | 4,421 | |
| | | | | | | | | | | | | | | | | | | | | | | | |
| Qualifying revolving retail exposures1 | | | 5,726 | | | | 66 | | | | 3,799 | | | | 5,858 | | | | 73 | | | | 4,270 | |
| | | | | | | | | | | | | | | | | | | | | | | | |
| Other retail exposures1 | | | 7,357 | | | | 52 | | | | 3,830 | | | | 7,716 | | | | 57 | | | | 4,416 | |
| | | | | | | | | | | | | | | | | | | | | | | | |
| Total EAD of undrawn commitments in the advanced IRBA1 | | | 158,420 | | | | 43 | | | | 68,375 | | | | 155,295 | | | | 46 | | | | 71,979 | |
| |
| 1 | The 2011 amounts for the retail exposure classes have been adjusted in order to reflect predominantly the integration of the Postbank retail IRBA exposures which were disclosed separately in prior year. |
The sub-class “Qualifying revolving retail exposure” in the above table mainly represents overdrafts or personal loans to individuals for our exposure excluding Postbank and overdrafts to business clients for Postbank exposure. Postbank’s overdrafts to private client exposure are treated under the standardized approach. The information is shown after credit risk mitigation obtained in the form of financial, physical and other collateral as well as guarantees and credit derivatives.
A year on year comparison provides a stable view on exposure values.
Foundation Internal Ratings Based Approach
We apply the foundation IRBA for the majority of our foundation IRBA eligible credit portfolios at Postbank. The foundation IRBA is an approach available under the regulatory framework for credit risk allowing institutions to make use of their internal rating methodologies while using pre-defined regulatory values for all other risk parameters. Parameters subject to internal estimates include the probability of default (“PD”) while the loss given default (“LGD”) and the credit conversion factor (“CCF”) are defined in the regulatory framework.
For the exposure classes central governments, institutions and corporates respective foundation IRBA rating systems have been developed. A probability of default is assigned to each relevant counterparty credit exposure as a function of a transparent and consistent rating master scale. The borrower ratings assigned are derived on the grounds of internally developed rating models which specify consistent and distinct customer-relevant criteria and assign a rating grade based on a specific set of criteria as given for a certain customer. The set of criteria is generated from information sets relevant for the respective customer segments like general customer behavior, financial and external data. The methods in use are based on statistical analyses and for specific portfolio segments amended by expert-based assessments while taking into account the relevant available quantitative and qualitative information. The rating systems consider external long-term ratings from the major rating agencies (i.e., Standard & Poor’s, Moody’s and Fitch Ratings).
For the foundation IRBA a default definition is applied in accordance with the requirements of Section 125 SolvV as confirmed by the BaFin as part of its IRBA approval process.
We regularly validate our rating methodologies and credit risk parameters at Postbank. Whereas the rating methodology validation focuses on the discriminatory power of the models, the risk parameter validation for PD analyzes its predictive power when compared against historical default experiences.
| | | | |
| Deutsche Bank | | 01 – Management Report | | 110 |
| Financial Report 2012 | | Risk Report | | |
| | |
| | | | |
| | |
| | | | |
For the seven foundation IRBA relevant rating systems of Postbank, four were validated as appropriate and three were validated as progressive. The PD level for two rating systems was already adjusted in 2012 and the amended PD level of the remaining rating system is scheduled for 2013.
For derivative counterparty exposure treated under the foundation IRBA the current exposure method is applied. The current exposure method calculates the exposure at default as the sum of the positive fair value of derivative transactions and the respective regulatory add-on.
Foundation IRBA Exposure
Within the Postbank portfolios we assign our exposures to the relevant regulatory exposure class by taking into account factors like customer-specific characteristics and the rating system used. The following tables also consider Postbank’s counterparty credit risk position resulting from derivatives and SFTs as far as they are assigned to the foundation IRBA.
The table presents the EAD in conjunction with exposures-weighted average risk weights (“RW”) including the counterparty credit risk position from derivatives and securities financing transactions (SFT). The information is shown after credit risk mitigation obtained in the form of financial, physical and other collateral as well as guarantees and credit derivatives. EAD gross information for exposures covered by guarantees or credit derivatives are assigned to the exposure class of the original counterparty whereas the EAD net information assigns the exposure to the protection seller.
Foundation IRBA exposures for each regulatory IRBA exposure class by rating scale
| | | | | | | | | | | | | | | | | | | | | | | | |
| | | Dec 31, 2012 | |
| | | iAAA to iAA
0.000 – 0.045 % | | | iA
0.045 – 0.125 % | | | iBBB
0.125 – 0.475 % | | | iBB to iCCC
> 0,475 % | | | Default | | | Total | |
| |
| | | | | | |
Central Governments | | | | | | | | | | | | | | | | | | | | | | | | |
| | | | | | | | | | | | | | | | | | | | | | | | |
EAD gross in€ m. | | | – | | | | 78 | | | | 23 | | | | – | | | | – | | | | 101 | |
| | | | | | | | | | | | | | | | | | | | | | | | |
EAD net in€ m. | | | – | | | | 89 | | | | 23 | | | | – | | | | – | | | | 112 | |
| | | | | | | | | | | | | | | | | | | | | | | | |
thereof: undrawn commitments | | | – | | | | – | | | | – | | | | – | | | | – | | | | – | |
| | | | | | | | | | | | | | | | | | | | | | | | |
Average RW in % | | | – | | | | 22.06 | | | | 64.85 | | | | – | | | | – | | | | 30.80 | |
| |
| | | | | | |
Institutions | | | | | | | | | | | | | | | | | | | | | | | | |
| | | | | | | | | | | | | | | | | | | | | | | | |
EAD gross in€ m. | | | 1,611 | | | | 14,701 | | | | 6,000 | | | | 226 | | | | 56 | | | | 22,594 | |
| | | | | | | | | | | | | | | | | | | | | | | | |
EAD net in€ m. | | | 1,611 | | | | 14,777 | | | | 6,000 | | | | 214 | | | | 56 | | | | 22,658 | |
| | | | | | | | | | | | | | | | | | | | | | | | |
thereof: undrawn commitments | | | – | | | | – | | | | 5 | | | | – | | | | – | | | | 5 | |
| | | | | | | | | | | | | | | | | | | | | | | | |
Average RW in % | | | 14.37 | | | | 10.94 | | | | 20.50 | | | | 35.43 | | | | – | | | | 13.92 | |
| |
| | | | | | |
Corporates | | | | | | | | | | | | | | | | | | | | | | | | |
| | | | | | | | | | | | | | | | | | | | | | | | |
EAD gross in€ m. | | | 50 | | | | 1,589 | | | | 6,817 | | | | 3,234 | | | | 552 | | | | 12,242 | |
| | | | | | | | | | | | | | | | | | | | | | | | |
EAD net in€ m. | | | 50 | | | | 1,646 | | | | 6,614 | | | | 3,074 | | | | 552 | | | | 11,936 | |
| | | | | | | | | | | | | | | | | | | | | | | | |
thereof: undrawn commitments | | | – | | | | 233 | | | | 1,336 | | | | 375 | | | | 10 | | | | 1,954 | |
| | | | | | | | | | | | | | | | | | | | | | | | |
Average RW in % | | | 16.10 | | | | 30.58 | | | | 53.43 | | | | 107.43 | | | | – | | | | 61.56 | |
| |
| | | | | | |
Total | | | | | | | | | | | | | | | | | | | | | | | | |
| | | | | | | | | | | | | | | | | | | | | | | | |
EAD gross in€ m. | | | 1,661 | | | | 16,368 | | | | 12,840 | | | | 3,460 | | | | 608 | | | | 34,937 | |
| | | | | | | | | | | | | | | | | | | | | | | | |
EAD net in€ m. | | | 1,661 | | | | 16,512 | | | | 12,637 | | | | 3,288 | | | | 608 | | | | 34,706 | |
| | | | | | | | | | | | | | | | | | | | | | | | |
thereof: undrawn commitments | | | – | | | | 233 | | | | 1,341 | | | | 375 | | | | 10 | | | | 1,959 | |
| | | | | | | | | | | | | | | | | | | | | | | | |
Average RW in % | | | 14.42 | | | | 12.96 | | | | 37.81 | | | | 102.75 | | | | – | | | | 30.36 | |
| |
| | | | |
| Deutsche Bank | | 01 – Management Report | | 111 |
| Financial Report 2012 | | Risk Report | | |
| | |
| | | | |
| | |
| | | | |
| | | | | | | | | | | | | | | | | | | | | | | | |
| | | Dec 31, 2011 | |
| | | iAAA to iAA
0.000 – 0.045 % | | | iA
0.045 – 0.125 % | | | iBBB
0.125 – 0.475 % | | | iBB to iCCC
> 0,475 % | | | Default | | | Total | |
| |
| | | | | | |
Central Governments | | | | | | | | | | | | | | | | | | | | | | | | |
| | | | | | | | | | | | | | | | | | | | | | | | |
EAD gross in€ m. | | | 80 | | | | – | | | | 46 | | | | – | | | | 571 | | | | 697 | |
| | | | | | | | | | | | | | | | | | | | | | | | |
EAD net in€ m. | | | 80 | | | | – | | | | 46 | | | | – | | | | 571 | | | | 697 | |
| | | | | | | | | | | | | | | | | | | | | | | | |
thereof: undrawn commitments | | | 1 | | | | – | | | | – | | | | – | | | | – | | | | 1 | |
| | | | | | | | | | | | | | | | | | | | | | | | |
Average RW in % | | | 18.75 | | | | – | | | | 47.83 | | | | – | | | | – | | | | 5.31 | |
| |
| | | | | | |
Institutions | | | | | | | | | | | | | | | | | | | | | | | | |
| |
EAD gross in€ m. | | | 1,052 | | | | 18,226 | | | | 9,860 | | | | 144 | | | | 110 | | | | 29,392 | |
| | | | | | | | | | | | | | | | | | | | | | | | |
EAD net in€ m. | | | 1,064 | | | | 18,390 | | | | 9,737 | | | | 144 | | | | 110 | | | | 29,445 | |
| | | | | | | | | | | | | | | | | | | | | | | | |
thereof: undrawn commitments | | | – | | | | – | | | | 7 | | | | – | | | | – | | | | 7 | |
| | | | | | | | | | | | | | | | | | | | | | | | |
Average RW in % | | | 11.18 | | | | 11.67 | | | | 16.94 | | | | 88.89 | | | | – | | | | 13.73 | |
| |
| | | | | | |
Corporates | | | | | | | | | | | | | | | | | | | | | | | | |
| | | | | | | | | | | | | | | | | | | | | | | | |
EAD gross in€ m. | | | 439 | | | | 2,352 | | | | 7,763 | | | | 2,552 | | | | 802 | | | | 13,908 | |
| | | | | | | | | | | | | | | | | | | | | | | | |
EAD net in€ m. | | | 439 | | | | 2,239 | | | | 7,529 | | | | 2,089 | | | | 802 | | | | 13,098 | |
| | | | | | | | | | | | | | | | | | | | | | | | |
thereof: undrawn commitments | | | 40 | | | | 386 | | | | 1,524 | | | | 203 | | | | 28 | | | | 2,181 | |
| | | | | | | | | | | | | | | | | | | | | | | | |
Average RW in % | | | 12.98 | | | | 29.34 | | | | 52.90 | | | | 114.60 | | | | – | | | | 54.14 | |
| |
| | | | | | |
Total | | | | | | | | | | | | | | | | | | | | | | | | |
| | | | | | | | | | | | | | | | | | | | | | | | |
EAD gross in€ m. | | | 1,571 | | | | 20,578 | | | | 17,669 | | | | 2,696 | | | | 1,483 | | | | 43,997 | |
| | | | | | | | | | | | | | | | | | | | | | | | |
EAD net in€ m. | | | 1,583 | | | | 20,629 | | | | 17,312 | | | | 2,233 | | | | 1,483 | | | | 43,240 | |
| | | | | | | | | | | | | | | | | | | | | | | | |
thereof: undrawn commitments | | | 41 | | | | 386 | | | | 1,531 | | | | 203 | | | | 28 | | | | 2,189 | |
| | | | | | | | | | | | | | | | | | | | | | | | |
Average RW in % | | | 12.07 | | | | 13.59 | | | | 32.66 | | | | 112.90 | | | | – | | | | 25.83 | |
| |
The tables below show our foundation IRBA exposures excluding counterparty credit risk exposures from derivatives and SFT for central governments, institutions and corporates, distributed on our internal rating scale, showing also the PD range for each grade. The internal ratings correspond to the respective external Standard & Poors rating equivalents. The EAD net is presented in conjunction with risk-weighted assets calculated and the average RW. The information is shown after credit risk mitigation obtained in the form of financial, physical and other collateral as well as guarantees and credit derivatives.
| | | | |
| Deutsche Bank | | 01 – Management Report | | 112 |
| Financial Report 2012 | | Risk Report | | |
| | |
| | | | |
| | |
| | | | |
EAD net for Foundation IRBA Credit Exposures by PD Grade for Central Governments
| | | | | | | | | | | | | | | | | | | | |
| in€ m. (unless stated otherwise) | | Dec 31, 2012 | |
| | | | |
| Internal rating | | PD range
in % | | | EAD net | | | Average
PD in % | | | RWA | | | Average RW in % | |
| | | | | | | | | | | | | | | | | | | | |
iAAA | | | > 0.00£ 0.01 | | | | – | | | | – | | | | – | | | | – | |
| | | | | | | | | | | | | | | | | | | | |
iAA+ | | | > 0.01£ 0.02 | | | | – | | | | – | | | | – | | | | – | |
| | | | | | | | | | | | | | | | | | | | |
iAA | | | > 0.02£ 0.03 | | | | – | | | | – | | | | – | | | | – | |
| | | | | | | | | | | | | | | | | | | | |
iAA- | | | > 0.03£ 0.04 | | | | – | | | | – | | | | – | | | | – | |
| | | | | | | | | | | | | | | | | | | | |
iA+ | | | > 0.04£ 0.05 | | | | – | | | | – | | | | – | | | | – | |
| | | | | | | | | | | | | | | | | | | | |
iA | | | > 0.05£ 0.07 | | | | 89 | | | | 0.06 | | | | 20 | | | | 22.06 | |
| | | | | | | | | | | | | | | | | | | | |
iA- | | | > 0.07£ 0.11 | | | | – | | | | – | | | | – | | | | – | |
| | | | | | | | | | | | | | | | | | | | |
iBBB+ | | | > 0.11£ 0.18 | | | | – | | | | – | | | | – | | | | – | |
| | | | | | | | | | | | | | | | | | | | |
iBBB | | | > 0.18£ 0.30 | | | | – | | | | – | | | | – | | | | – | |
| | | | | | | | | | | | | | | | | | | | |
iBBB- | | | > 0.30£ 0.50 | | | | 23 | | | | 0.38 | | | | 15 | | | | 64.85 | |
| | | | | | | | | | | | | | | | | | | | |
iBB+ | | | > 0.50£ 0.83 | | | | – | | | | – | | | | – | | | | – | |
| | | | | | | | | | | | | | | | | | | | |
iBB | | | > 0.83£ 1.37 | | | | – | | | | – | | | | – | | | | – | |
| | | | | | | | | | | | | | | | | | | | |
iBB- | | | > 1.37£ 2.27 | | | | – | | | | – | | | | – | | | | – | |
| | | | | | | | | | | | | | | | | | | | |
iB+ | | | > 2.27£ 3.75 | | | | – | | | | – | | | | – | | | | – | |
| | | | | | | | | | | | | | | | | | | | |
iB | | | > 3.75£ 6.19 | | | | – | | | | – | | | | – | | | | – | |
| | | | | | | | | | | | | | | | | | | | |
iB- | | | > 6.19£ 10.22 | | | | – | | | | – | | | | – | | | | – | |
| | | | | | | | | | | | | | | | | | | | |
iCCC+ | | | > 10.22£ 16.87 | | | | – | | | | – | | | | – | | | | – | |
| | | | | | | | | | | | | | | | | | | | |
iCCC | | | > 16.87£ 27.84 | | | | – | | | | – | | | | – | | | | – | |
| | | | | | | | | | | | | | | | | | | | |
iCCC- | | | > 27.84 £ 99.99 | | | | – | | | | – | | | | – | | | | – | |
| | | | | | | | | | | | | | | | | | | | |
Default | | | 100.00 | | | | – | | | | – | | | | – | | | | – | |
| | | | | | | | | | | | | | | | | | | | |
Total | | | – | | | | 112 | | | | 0.13 | | | | 35 | | | | 30.80 | |
| |
EAD net for Foundation IRBA Credit Exposures by PD Grade for Institutions (excluding derivative positions and SFTs)
| | | | | | | | | | | | | | | | | | | | |
in€ m. (unless stated otherwise) | | Dec 31, 2012 | |
Internal rating | | PD range
in % | | | EAD net | | | Average
PD in % | | | RWA | | | Average
RW in % | |
iAAA | | | > 0.00 £ 0.01 | | | | – | | | | – | | | | – | | | | – | |
| | | | | | | | | | | | | | | | | | | | |
iAA+ | | | > 0.01 £ 0.02 | | | | – | | | | – | | | | – | | | | – | |
| | | | | | | | | | | | | | | | | | | | |
iAA | | | > 0.02£ 0.03 | | | | 917 | | | | 0.03 | | | | 140 | | | | 15.31 | |
| | | | | | | | | | | | | | | | | | | | |
iAA- | | | > 0.03£ 0.04 | | | | 447 | | | | 0.04 | | | | 81 | | | | 18.21 | |
| | | | | | | | | | | | | | | | | | | | |
iA+ | | | > 0.04£ 0.05 | | | | – | | | | – | | | | – | | | | – | |
| | | | | | | | | | | | | | | | | | | | |
iA | | | > 0.05£ 0.07 | | | | 895 | | | | 0.06 | | | | 169 | | | | 18.95 | |
| | | | | | | | | | | | | | | | | | | | |
iA- | | | > 0.07£ 0.11 | | | | 6,489 | | | | 0.09 | | | | 1,044 | | | | 16.09 | |
| | | | | | | | | | | | | | | | | | | | |
iBBB+ | | | > 0.11£ 0.18 | | | | 2,452 | | | | 0.15 | | | | 529 | | | | 21.57 | |
| | | | | | | | | | | | | | | | | | | | |
iBBB | | | > 0.18£ 0.30 | | | | 3,029 | | | | 0.23 | | | | 609 | | | | 20.09 | |
| | | | | | | | | | | | | | | | | | | | |
iBBB- | | | > 0.30£ 0.50 | | | | 186 | | | | 0.38 | | | | 52 | | | | 27.98 | |
| | | | | | | | | | | | | | | | | | | | |
iBB+ | | | > 0.50£ 0.83 | | | | 200 | | | | 0.69 | | | | 60 | | | | 30.10 | |
| | | | | | | | | | | | | | | | | | | | |
iBB | | | > 0.83£ 1.37 | | | | – | | | | – | | | | – | | | | – | |
| | | | | | | | | | | | | | | | | | | | |
iBB- | | | > 1.37£ 2.27 | | | | 9 | | | | 2.06 | | | | 11 | | | | 122.67 | |
| | | | | | | | | | | | | | | | | | | | |
iB+ | | | > 2.27£ 3.75 | | | | – | | | | – | | | | – | | | | – | |
| | | | | | | | | | | | | | | | | | | | |
iB | | | > 3.75£ 6.19 | | | | – | | | | – | | | | – | | | | – | |
| | | | | | | | | | | | | | | | | | | | |
iB- | | | > 6.19 £ 10.22 | | | | – | | | | – | | | | – | | | | – | |
| | | | | | | | | | | | | | | | | | | | |
iCCC+ | | | > 10.22 £ 16.87 | | | | – | | | | – | | | | – | | | | – | |
| | | | | | | | | | | | | | | | | | | | |
iCCC | | | > 16.87£ 27.84 | | | | 6 | | | | 18.00 | | | | 5 | | | | 82.11 | |
| | | | | | | | | | | | | | | | | | | | |
iCCC- | | | > 27.84£ 99.99 | | | | – | | | | – | | | | – | | | | – | |
| | | | | | | | | | | | | | | | | | | | |
Default | | | 100.00 | | | | 56 | | | | 100.00 | | | | – | | | | – | |
| | | | | | | | | | | | | | | | | | | | |
Total | | | – | | | | 14,686 | | | | 0.52 | | | | 2,700 | | | | 18.38 | |
| |
EAD net for Foundation IRBA Credit Exposures by PD Grade for Corporates (excluding derivative positions and SFTs)
| | | | | | | | | | | | | | | | | | | | |
in€ m. (unless stated otherwise) | | Dec 31, 2012 | |
Internal rating | | PD range
in % | | | EAD net | | | Average
PD in % | | | RWA | | | Average
RW in % | |
iAAA | | | > 0.00 £ 0.01 | | | | – | | | | – | | | | – | | | | – | |
| | | | | | | | | | | | | | | | | | | | |
iAA+ | | | > 0.01£ 0.02 | | | | – | | | | – | | | | – | | | | – | |
| | | | | | | | | | | | | | | | | | | | |
iAA | | | > 0.02£ 0.03 | | | | 37 | | | | 0.03 | | | | 6 | | | | 15.31 | |
| | | | | | | | | | | | | | | | | | | | |
iAA- | | | > 0.03£ 0.04 | | | | 13 | | | | 0.04 | | | | 2 | | | | 18.44 | |
| | | | | | | | | | | | | | | | | | | | |
iA+ | | | > 0.04£ 0.05 | | | | – | | | | – | | | | – | | | | – | |
| | | | | | | | | | | | | | | | | | | | |
iA | | | > 0.05£ 0.07 | | | | 225 | | | | 0.06 | | | | 50 | | | | 22.12 | |
| | | | | | | | | | | | | | | | | | | | |
iA- | | | > 0.07£ 0.11 | | | | 1,341 | | | | 0.10 | | | | 427 | | | | 31.86 | |
| | | | | | | | | | | | | | | | | | | | |
iBBB+ | | | > 0.11£ 0.18 | | | | 1,194 | | | | 0.15 | | | | 469 | | | | 39.30 | |
| | | | | | | | | | | | | | | | | | | | |
iBBB | | | > 0.18£ 0.30 | | | | 2,938 | | | | 0.23 | | | | 1,481 | | | | 50.41 | |
| | | | | | | | | | | | | | | | | | | | |
iBBB- | | | > 0.30£ 0.50 | | | | 2,226 | | | | 0.38 | | | | 1,447 | | | | 64.99 | |
| | | | | | | | | | | | | | | | | | | | |
iBB+ | | | > 0.50£ 0.83 | | | | 1,796 | | | | 0.69 | | | | 1,536 | | | | 85.53 | |
| | | | | | | | | | | | | | | | | | | | |
iBB | | | > 0.83£ 1.37 | | | | 634 | | | | 1.23 | | | | 663 | | | | 104.64 | |
| | | | | | | | | | | | | | | | | | | | |
iBB- | | | > 1.37£ 2.27 | | | | 291 | | | | 2.06 | | | | 357 | | | | 122.63 | |
| | | | | | | | | | | | | | | | | | | | |
iB+ | | | > 2.27£ 3.75 | | | | – | | | | – | | | | – | | | | – | |
| | | | | | | | | | | | | | | | | | | | |
iB | | | > 3.75£ 6.19 | | | | 77 | | | | 3.78 | | | | 115 | | | | 149.52 | |
| | | | | | | | | | | | | | | | | | | | |
iB- | | | > 6.19 £ 10.22 | | | | 45 | | | | 7.26 | | | | 78 | | | | 174.28 | |
| | | | | | | | | | | | | | | | | | | | |
iCCC+ | | | > 10.22 £ 16.87 | | | | 10 | | | | 12.76 | | | | 19 | | | | 198.09 | |
| | | | | | | | | | | | | | | | | | | | |
iCCC | | | > 16.87£ 27.84 | | | | 160 | | | | 18.00 | | | | 452 | | | | 282.66 | |
| | | | | | | | | | | | | | | | | | | | |
iCCC- | | | > 27.84£ 99.99 | | | | – | | | | – | | | | – | | | | – | |
| | | | | | | | | | | | | | | | | | | | |
Default | | | 100.00 | | | | 551 | | | | 100.00 | | | | – | | | | – | |
| | | | | | | | | | | | | | | | | | | | |
Total | | | – | | | | 11,538 | | | | 5.48 | | | | 7,102 | | | | 61.55 | |
| |
Other IRBA Exposure
As an IRBA institution, we are required to treat equity investments, collective investment undertakings (“CIU”) and other non-credit obligation assets generally within the IRBA. For these exposure types typically regulatory-defined IRBA risk weights are applied.
We use the simple risk-weight approach according to Section 98 SolvV for our investments in equity positions entered into since January 1, 2008. It distinguishes between exposure in equities which are non-exchange traded but sufficiently diversified, exchange-traded and other non-exchange-traded and then uses the regulatory-defined risk weights of 190 %, 290 % or 370 %, respectively.
| | | | |
| Deutsche Bank | | 01 – Management Report | | 113 |
| Financial Report 2012 | | Risk Report | | |
| | |
| | | | |
| | |
| | | | |
For certain CIU exposures we apply the “look through”-treatment which constitutes a decomposition of the CIU into its underlying investments. If such decomposition is performed the underlying investment components are assigned to their respective exposure class – either within the IRBA or standardized approaches – as if they were directly held. A sub-portion of our CIU exposures resulting from Postbank is covered within the standardized approach by applying risk weights provided by third parties in line with Section 83 (5) SolvV. More details on Postbank’s CIU exposures covered in the standardized approach are provided in Section “Standardized Approach”. For the remaining collective investment undertakings the simple risk weight of 370 % is applied and assigned to the exposure class “equity investments”.
Exposures which are assigned to the exposure class “other non-credit obligation assets” receive an IRBA risk weight of 0 % in case of cash positions or 100 %.
The following table summarizes on an EAD basis our IRBA exposure for equities, CIUs and other non-credit obligation assets, where regulatory risk weights are applied. Credit risk mitigation techniques have not been applied. The decreases mainly result from pension assets, which are reported under the standardized approach following a change in the methodology applied, as well as asset disposals.
EAD of equity investments, CIUs and other non-credit obligation assets by risk weight
| | | | | | | | |
in€ m. | | Dec 31, 2012 | | | Dec 31, 2011 | |
0 % | | | 2,182 | | | | 1,912 | |
| | | | | | | | |
100 % | | | 6,180 | | | | 7,366 | |
| | | | | | | | |
190 % | | | 109 | | | | 210 | |
| | | | | | | | |
290 % | | | 218 | | | | 350 | |
| | | | | | | | |
370 % | | | 1,248 | | | | 2,186 | |
| | | | | | | | |
1250 %1 | | | – | | | | 794 | |
| | | | | | | | |
Total EAD of equity investments, CIUs and other non-credit obligation assets | | | 9,936 | | | | 12,818 | |
| |
| 1 | Decrease results from method change being applied to pension assets. |
The table below summarizes on an EAD basis our IRBA exposure for specialized lending. The exposures comprise commercial loans for residential construction, loans to property developers, operator models, real estate and equipment leasing, real estate located outside Germany, and private mortgage loans financing the construction of properties with more than ten residential units as well as project finance exposures. For the calculation of minimum capital requirements regulatory risk weights are applied where potential risk mitigating factors are already considered in the assignment of a risk weight to a specific structure. Additional credit risk mitigation techniques have not been applied.
The increase primarily relates to Deutsche Bank positions formerly being calculated under the Standardized Approach.
Other IRBA exposure for specialized lending by risk weight
| | | | | | | | |
in€ m. | | Dec 31, 2012 | | | Dec 31, 2011 | |
Risk weight category 1 (strong) | | | 14,008 | | | | 12,328 | |
| | | | | | | | |
Risk weight category 2 (good) | | | 1,443 | | | | 1,033 | |
| | | | | | | | |
Risk weight category 3 (satisfactory) | | | 477 | | | | 811 | |
| | | | | | | | |
Risk weight category 4 (weak) | | | 177 | | | | 329 | |
| | | | | | | | |
Risk weight category 5 (defaulted) | | | 1,568 | | | | 1,960 | |
| | | | | | | | |
Total EAD of specialized lending | | | 17,673 | | | | 16,461 | |
| |
Standardized Approach
We treat a subset of our credit risk exposures within the standardized approach. The standardized approach measures credit risk either pursuant to fixed risk weights, which are predefined by the regulator, or through the application of external ratings.
We assign certain credit exposures permanently to the standardized approach in accordance with Section 70 SolvV. These are predominantly exposures to the Federal Republic of Germany and other German public sector entities as well as exposures to central governments of other European Member States that meet the required
| | | | |
| Deutsche Bank | | 01 – Management Report | | 114 |
| Financial Report 2012 | | Risk Report | | |
| | |
| | | | |
| | |
| | | | |
conditions. These exposures make up more than half of the exposures carried in the standardized approach and receive predominantly a risk weight of zero percent. For internal purposes, however, these exposures are assessed via an internal credit assessment and fully integrated in the risk management and economic capital processes.
In line with Section 66 SolvV, we assign further – generally IRBA eligible – exposures permanently to the standardized approach. This population comprises several small-sized portfolios, which are considered to be immaterial on a stand-alone basis for inclusion in the IRBA.
Other credit exposures which are small in size are temporarily assigned to the standardized approach and we plan to transfer them to the IRBA over time. The prioritization and the corresponding transition plan is discussed and agreed with the competent authorities, the BaFin and the Bundesbank.
Equity positions entered into before January 1, 2008 are subject to the transitional arrangement to exempt them from the IRBA and a risk weight of 100 % is applied according to the standardized approach treatment.
In order to calculate the regulatory capital requirements under the standardized approach, we use eligible external ratings from Standard & Poor’s, Moody’s, Fitch Ratings and in some cases from DBRS. DBRS ratings are applied in the standardized approach for a small number of exposures since 2009. Ratings are applied to all relevant exposure classes in the standardized approach. If more than one rating is available for a specific counterparty, the selection criteria as set out in Section 44 SolvV are applied in order to determine the relevant risk weight for the capital calculation. Moreover, given the low volume of exposures covered under the standardized approach and the high percentage of (externally rated) central government exposures therein, we do not infer borrower ratings from issuer ratings.
Our exposure values in the standardized approach by risk weight is shown before and after credit risk mitigation obtained in the form of eligible financial collateral, guarantees and credit derivatives excluding Postbank’s CIU exposures assigned to the standardized approach which are displayed in the table “EAD of CIUs of Postbank in the Standardized Approach by Risk Weight” thereafter, and excluding exposure subject to settlement risk.
The overall decrease is mainly driven by reductions in central banks related exposures as well as due to changes in model approvals partially offset by inclusion of our pension assets which formally have been calculated under the advanced IRBA.
Exposure values in the standardized approach by risk weight
| | | | | | | | | | | | | | | | |
| | | Dec 31, 2012 | | | Dec 31, 2011 | |
in€ m. | | Before credit risk
mitigation | | | After credit risk
mitigation | | | Before credit risk
mitigation | | | After credit risk
mitigation | |
0 % | | | 100,714 | | | | 103,605 | | | | 115,572 | | | | 118,762 | |
| | | | | | | | | | | | | | | | |
5 % | | | – | | | | – | | | | – | | | | – | |
| | | | | | | | | | | | | | | | |
10 % | | | 46 | | | | 46 | | | | 983 | | | | 983 | |
| | | | | | | | | | | | | | | | |
20 % | | | 2,002 | | | | 2,278 | | | | 2,509 | | | | 4,265 | |
| | | | | | | | | | | | | | | | |
22 % | | | – | | | | – | | | | – | | | | – | |
| | | | | | | | | | | | | | | | |
35 % | | | 2,616 | | | | 2,608 | | | | 4,059 | | | | 4,046 | |
| | | | | | | | | | | | | | | | |
50 % | | | 4,219 | | | | 4,308 | | | | 5,242 | | | | 5,388 | |
| | | | | | | | | | | | | | | | |
55 % | | | 1,018 | | | | 1,018 | | | | – | | | | – | |
| | | | | | | | | | | | | | | | |
75 % | | | 30,450 | | | | 25,125 | | | | 17,897 | | | | 14,705 | |
| | | | | | | | | | | | | | | | |
100 % | | | 31,187 | | | | 21,419 | | | | 41,009 | | | | 25,680 | |
| | | | | | | | | | | | | | | | |
110 % | | | – | | | | – | | | | – | | | | – | |
| | | | | | | | | | | | | | | | |
150 % | | | 1,055 | | | | 999 | | | | 1,411 | | | | 1,401 | |
| | | | | | | | | | | | | | | | |
Total EAD in the standardized approach | | | 173,307 | | | | 161,406 | | | | 188,683 | | | | 175,230 | |
| |
| | | | |
| Deutsche Bank | | 01 – Management Report | | 115 |
| Financial Report 2012 | | Risk Report | | |
| | |
| | | | |
| | |
| | | | |
EAD of CIUs of Postbank in the standardized approach by Risk Weight
| | | | | | | | |
in€ m. | | Dec 31, 2012 | | | Dec 31, 2011 | |
Bonds in CIUs | | | | | | | | |
| | | | | | | | |
0 % | | | – | | | | 80 | |
| | | | | | | | |
11 % | | | – | | | | 87 | |
| | | | | | | | |
22 % | | | 312 | | | | 234 | |
| | | | | | | | |
55 % | | | 432 | | | | 416 | |
| | | | | | | | |
110 % | | | 596 | | | | 747 | |
| | | | | | | | |
200 % | | | 65 | | | | 7 | |
| | | | | | | | |
300 % | | | 393 | | | | 512 | |
| | | | | | | | |
EAD for bonds in CIUs | | | 1,798 | | | | 2,083 | |
| | | | | | | | |
CIUs with risk weight calculated by third parties | | | | | | | | |
| | | | | | | | |
< 22 % | | | 594 | | | | 621 | |
| | | | | | | | |
> 22 % < 110 % | | | 189 | | | | – | |
| | | | | | | | |
> 110 % | | | 18 | | | | – | |
| | | | | | | | |
EAD for CIUs with risk weight calculated by third parties | | | 801 | | | | 621 | |
| | | | | | | | |
Total EAD for CIUs in the standardized approach | | | 2,599 | | | | 2,704 | |
| |
The table above comprises bonds in the form of collective investment undertakings assigned to the standardized approach based on a “look through”-treatment as well as the exposure values for collective investment undertakings with risk weights calculated by third parties in the standardized approach by risk weight. Credit risk mitigation techniques have not been applied.
Regulatory Application of Credit Risk Mitigation Techniques
Risk-weighted assets and regulatory capital requirements can be managed actively by credit risk mitigation techniques. As a prerequisite for recognition in regulatory calculations, we must adhere to certain minimum requirements as stipulated in the SolvV regarding collateral management, monitoring processes and legal enforceability.
The range of collateral being eligible for regulatory recognition is dependent predominantly on the regulatory capital calculation method used for a specific risk position. The principle is that a higher degree of sophistication with regard to the underlying methodology generally leads to a wider range of admissible collateral and options to recognize protection via guarantees and credit derivatives. However, also the minimum requirements to be adhered to and the mechanism available to reflect the risk mitigation benefits are predominantly a function of the regulatory calculation method applied.
The advanced IRBA generally accepts all types of financial collateral, as well as real estate, collateral assignments and other physical collateral. In our application of the advanced IRBA, there is basically no limitation to the range of accepted collateral as long as we can demonstrate to the competent authorities that reliable estimates of the collateral values can be generated and that basic requirements are fulfilled.
The same principle holds true for taking benefits from guarantee and credit derivative arrangements. Within the advanced IRBA, again there are generally no limitations with regard to the range of eligible collateral providers as long as some basic minimum requirements are met. However, collateral providers’ credit quality and other relevant factors are incorporated through our internal models.
In our advanced IRBA calculations financial and other collateral is generally considered through an adjustment to the applicable LGD as the input parameter for determining the risk weight. For recognizing protection from guarantees and credit derivatives, generally a PD substitution approach is applied, i.e., within the advanced IRBA risk-weight calculation the PD of the borrower is replaced by the protection seller’s or guarantor’s PD. However, for certain guaranteed exposures and certain protection providers the so-called double default treatment is applicable. The double default effect implies that for a guaranteed exposure a loss only occurs if the originator and the guarantor fail to meet their obligations at the same time.
| | | | |
| Deutsche Bank | | 01 – Management Report | | 116 |
| Financial Report 2012 | | Risk Report | | |
| | |
| | | | |
| | |
| | | | |
Advanced IRBA exposure values before and after credit risk mitigation
| | | | | | | | | | | | | | | | | | | | | | | | | | | | | | | | |
| | | Dec 31, 2012 | | | Dec 31, 2011 | |
in€ m. | | Total EAD | | | Eligible
advanced
IRBA
collateral | | | Guarantees
and credit
derivatives | | | Total EAD
collateralized1 | | | Total EAD | | | Eligible
advanced
IRBA
collateral | | | Guarantees
and credit
derivatives | | | Total EAD
collateralized1 | |
| Central governments | | | 95,662 | | | | 1,742 | | | | 2,037 | | | | 3,779 | | | | 110,601 | | | | 4,611 | | | | 1,977 | | | | 6,588 | |
| | | | | | | | | | | | | | | | | | | | | | | | | | | | | | | | |
| Institutions | | | 66,368 | | | | 21,677 | | | | 3,639 | | | | 25,316 | | | | 84,337 | | | | 22,212 | | | | 4,190 | | | | 26,402 | |
| | | | | | | | | | | | | | | | | | | | | | | | | | | | | | | | |
| Corporates | | | 294,4632 | | | | 79,870 | | | | 31,045 | | | | 110,915 | | | | 335,9392 | | | | 112,101 | | | | 36,443 | | | | 148,543 | |
| | | | | | | | | | | | | | | | | | | | | | | | | | | | | | | | |
| Retail | | | 182,940 | | | | 128,8393 | | | | 709 | | | | 129,548 | | | | 171,361 | | | | 118,6183 | | | | 682 | | | | 119,300 | |
| | | | | | | | | | | | | | | | | | | | | | | | | | | | | | | | |
| Total | | | 639,433 | | | | 232,128 | | | | 37,431 | | | | 269,558 | | | | 702,238 | | | | 257,541 | | | | 43,292 | | | | 300,833 | |
| |
| 1 | Excludes collateralization which is reflected in the EPE measure. |
| 2 | Includes exposure subject to dilution risk of€ 793 million per end 2012 and€ 1.1 billion per year end 2011. |
| 3 | Due to changes in methodology collateral values from BHW are now included in the segment retail which are€ 25.4 billion per year 2012 and€ 25.3 billion per year end 2011. |
The foundation IRBA sets stricter limitations with regard to the eligibility of credit risk mitigation compared to the advanced IRBA but allows for consideration of financial collateral, guarantees and credit derivates as well as other foundation IRBA-eligible collateral like mortgages and security assignments.
The financial collateral recognised in the foundation IRBA essentially comprises cash, bonds and other securities related to repo lending.
Collateralized counterparty credit risk exposure in the Foundation IRBA by exposure class
| | | | | | | | | | | | | | | | | | | | |
| | | Dec 31,2012 | |
in€ m. | | Total EAD | | | Financial
collateral | | | Other
collateral | | | Guarantees and
credit derivatives | | | Total EAD
collateralized | |
Central governments | | | 101 | | | | – | | | | – | | | | – | | | | – | |
| | | | | | | | | | | | | | | | | | | | |
Institutions | | | 22,594 | | | | 6,919 | | | | – | | | | 62 | | | | 6,981 | |
| | | | | | | | | | | | | | | | | | | | |
Corporates | | | 12,242 | | | | – | | | | – | | | | 511 | | | | 511 | |
| | | | | | | | | | | | | | | | | | | | |
Total | | | 34,937 | | | | 6,919 | | | | – | | | | 573 | | | | 7,492 | |
| |
| | | | | | | | | | | | | | | | | | | | |
| | | Dec 31,2011 | |
in€ m. | | Total EAD | | | Financial
collateral | | | Other
collateral | | | Guarantees and
credit derivatives | | | Total EAD
collateralized | |
Central governments | | | 697 | | | | – | | | | – | | | | – | | | | – | |
| | | | | | | | | | | | | | | | | | | | |
Institutions | | | 29,392 | | | | 9,983 | | | | – | | | | 221 | | | | 10,204 | |
| | | | | | | | | | | | | | | | | | | | |
Corporates | | | 13,908 | | | | – | | | | – | | | | 835 | | | | 835 | |
| | | | | | | | | | | | | | | | | | | | |
Total | | | 43,997 | | | | 9,983 | | | | – | | | | 1,056 | | | | 11,039 | |
| |
In the standardized approach, collateral recognition is limited to eligible financial collateral, such as cash, gold bullion, certain debt securities, equities and CIUs, in many cases only with their volatility-adjusted collateral value. In its general structure, the standardized approach provides a preferred (lower) risk-weight for “claims secured by real estate property”. Given this preferred risk-weight real estate is not considered a collateral item under the standardized approach. Further limitations must be considered with regard to eligible guarantee and credit derivative providers.
In order to reflect risk mitigation techniques in the calculation of capital requirements we apply the financial collateral comprehensive method since the higher sophistication of that method allows a broader range of eligible collateral. Within this approach, financial collateral is reflected through a reduction in the exposure value of the respective risk position, while protection taken in the form of guarantees and credit derivatives is considered by means of a substitution, i.e., the borrower’s risk weight is replaced by the risk weight of the protection provider.
| | | | |
| Deutsche Bank | | 01 – Management Report | | 117 |
| Financial Report 2012 | | Risk Report | | |
| | |
| | | | |
| | |
| | | | |
Exposure values in the standardized approach by exposure class
| | | | | | | | | | | | | | | | | | | | | | | | | | | | | | | | |
| | | Dec 31,2012 | | | Dec 31,2011 | |
in€ m. | | Total EAD | | | Financial
collateral | | | Guarantees
and credit
derivatives | | | Total EAD
collateralized | | | Total EAD | | | Financial
collateral | | | Guarantees
and credit
derivatives | | | Total EAD
collateralized | |
| Central governments | | | 75,051 | | | | 55 | | | | 1,811 | | | | 1,866 | | | | 93,867 | | | | 246 | | | | 2 | | | | 248 | |
| | | | | | | | | | | | | | | | | | | | | | | | | | | | | | | | |
| Regional governments and local authorities | | | 19,253 | | | | 0 | | | | 122 | | | | 122 | | | | 18,340 | | | | 60 | | | | – | | | | 60 | |
| | | | | | | | | | | | | | | | | | | | | | | | | | | | | | | | |
| Other public sector entities | | | 3,219 | | | | 4 | | | | 565 | | | | 569 | | | | 2,607 | | | | 534 | | | | – | | | | 534 | |
| | | | | | | | | | | | | | | | | | | | | | | | | | | | | | | | |
| Multilateral development banks | | | 578 | | | | – | | | | – | | | | – | | | | 270 | | | | – | | | | – | | | | – | |
| | | | | | | | | | | | | | | | | | | | | | | | | | | | | | | | |
| International organizations | | | 411 | | | | – | | | | – | | | | – | | | | 249 | | | | – | | | | – | | | | – | |
| | | | | | | | | | | | | | | | | | | | | | | | | | | | | | | | |
| Institutions | | | 4,480 | | | | 123 | | | | 104 | | | | 227 | | | | 3,967 | | | | 365 | | | | 106 | | | | 471 | |
| | | | | | | | | | | | | | | | | | | | | | | | | | | | | | | | |
| Covered bonds issued by credit institutions | | | 52 | | | | – | | | | – | | | | – | | | | 983 | | | | – | | | | – | | | | – | |
| | | | | | | | | | | | | | | | | | | | | | | | | | | | | | | | |
| Corporates | | | 27,454 | | | | 7,770 | | | | 134 | | | | 7,904 | | | | 34,131 | | | | 9,801 | | | | 1,253 | | | | 11,054 | |
| | | | | | | | | | | | | | | | | | | | | | | | | | | | | | | | |
| Retail | | | 12,341 | | | | 1,852 | | | | – | | | | 1,852 | | | | 17,899 | | | | 1,302 | | | | 1,892 | | | | 3,194 | |
| | | | | | | | | | | | | | | | | | | | | | | | | | | | | | | | |
| Claims secured by real estate property | | | 6,253 | | | | 15 | | | | – | | | | 15 | | | | 7,540 | | | | 22 | | | | – | | | | 22 | |
| | | | | | | | | | | | | | | | | | | | | | | | | | | | | | | | |
| Collective investment undertakings1 | | | 2,599 | | | | – | | | | – | | | | – | | | | 2,704 | | | | – | | | | – | | | | – | |
| | | | | | | | | | | | | | | | | | | | | | | | | | | | | | | | |
| Equity investments | | | 3,517 | | | | – | | | | – | | | | – | | | | 7,163 | | | | 3,641 | | | | – | | | | 3,641 | |
| | | | | | | | | | | | | | | | | | | | | | | | | | | | | | | | |
| Other items | | | 19,390 | | | | – | | | | – | | | | – | | | | 99 | | | | – | | | | – | | | | – | |
| | | | | | | | | | | | | | | | | | | | | | | | | | | | | | | | |
| Past due items | | | 1,325 | | | | 15 | | | | – | | | | 15 | | | | 1,569 | | | | 13 | | | | 5 | | | | 17 | |
| | | | | | | | | | | | | | | | | | | | | | | | | | | | | | | | |
| Total | | | 175,923 | | | | 9,834 | | | | 2,736 | | | | 12,570 | | | | 191,387 | | | | 15,984 | | | | 3,258 | | | | 19,241 | |
| |
| 1 | Includes Postbank’s CIU exposures assigned to the standardized approach. |
The decreases in EAD are primarily driven by exposure decreases in overnight loans for central banks in the segment central governments and by decreases in derivative exposure in the segment corporates. The predominant part of the EAD in the segment retail is shifted to advanced IRBA due to newly approved IRBA rating systems.
Securitization
The following section on Securitization, ending on page 134, presents specific disclosures in relation to Pillar 3. Per regulation it is not required to audit Pillar 3 disclosures. As such this section is labeled unaudited. Quantitative information presented follows the regulatory scope of consolidation.
Overview of our Securitization Activities
We engage in various business activities that use securitization structures. The main purposes of this are to provide clients with access to risk and returns related to specific portfolios of assets, to provide clients with access to funding and to manage our credit risk exposure.
A participant in the securitization market can typically adopt three different roles: as originator, sponsor or investor. An originator is an institution which is involved, either itself or through its related entities, directly or indirectly, in the origination or purchase of the securitized exposures. In a sponsorship role, an institution establishes and manages an asset-backed commercial paper program (“ABCP”) or other securitization transaction, but has neither originated nor taken the purchased assets on its balance sheet. All other securitization positions entered into by us are assumed in the capacity as an investor. In order to achieve our business objectives we act in all three roles on the securitization markets.
Banking Book Securitizations
As an originator, we use securitizations primarily as a strategy to reduce credit risk, mainly through the Credit Portfolio Strategies Group (“CPSG”). It uses, among other means, synthetic securitizations to manage the credit risk of loans and lending-related commitments of the international investment-grade portfolio, leveraged portfolio, and the medium-sized German companies’ portfolio within the CB&S corporate division. The credit risk is predominantly transferred to counterparties through synthetic collateralized loan obligations mainly in the form of financial guarantees and, to a lesser extent, as credit derivatives providing first loss protection.
| | | | |
| Deutsche Bank | | 01 – Management Report | | 118 |
| Financial Report 2012 | | Risk Report | | |
| | |
| | | | |
| | |
| | | | |
The overall volume of credit risk transfer as originator showed a moderate reduction for PBC during 2012, and decreased more significantly for GTB and CB&S. This resulted mainly from the termination and regulatory de-recognition of credit risk coverage on European assets related to small and medium entities (“SME”) and European and American assets related to large entities and institutions. On the other hand, the Global Markets business division of CB&S entered into two new synthetic re-securitisations of its own trading book securities in the amount of€ 590 million. While in both transactions the mezzanine tranches were sold into the market, we hold the retained tranches in the regulatory banking book.
On a limited basis we have entered into securitization transactions as part of an active liquidity risk management strategy during 2008 and 2009. These transactions do not transfer credit risk and are therefore not included in the quantitative part of this section.
We set up, sponsor and administer a number of ABCP programs through which we securitize assets acquired from third parties. These programs provide customers with access to funding in the commercial paper (“CP”) market and create investment products for clients. Each program consists of a commercial paper issuing special purpose entity (the so-called “conduit”) and one or more supporting SPEs through which the assets are purchased. The conduits and the SPEs are organized as limited liability companies or in an equivalent legal form. The assets securitized through the ABCP programs include auto loans, auto leases, auto dealer floor plan receivables, student loans, credit card receivables, trade receivables, capital call receivables, residential and commercial mortgage loans, future flows and other assets. As administrative agent for the CP programs, we facilitate the purchase of non-Deutsche Bank Group loans, securities and other receivables by the CP conduit (“conduit”), which then issues to the market high-grade, short-term CP, collateralized by the underlying assets, to fund the purchase. The conduits require sufficient collateral, credit enhancements and liquidity support to maintain an investment grade rating for the CP. We are acting as provider of liquidity and credit enhancement to these conduits with facilities recorded in our regulatory banking book. There are also instances in which we will face the conduit on foreign exchange and interest rate swaps which are recorded in the trading book.
Furthermore, we act as an investor in third party securitizations through the purchase of third party-issued securitizations or tranches, or provide liquidity/credit support, to which we – and in some instances other parties – provide financing. Additionally, we assist third party securitizations by providing derivatives related to securitization structures. These include currency, interest rate, equity and credit derivatives.
Nearly half of our securitization book in 2012 relates to origination activity, predominantly through transactions for CPSG, i.e., from de-risking activity for our existing loan portfolio. Of the remainder, for approximately two thirds we assumed the investor role, and for the rest we acted as sponsor.
During 2012 the total securitization book decreased by€ 12 billion to€ 65 billion. Main drivers were the termination/regulatory de-recognition of credit risk coverage mentioned above, and the ongoing de-risking strategy pursued throughout the year. Approximately two thirds of this reduction relate to loans to Corporates and SMEs.
Overall, the securitization positions are exposed to the performance of diverse asset classes, including primarily corporate senior loans or unsecured debt, consumer debt such as auto loans or student loans, as well as residential- or commercial 1st and 2nd lien mortgages. We are active across the entire capital structure with an emphasis on the more senior tranches. The subset of re-securitization is predominantly backed by US residential mortgage-backed mezzanine securities.
Primary recourse for securitization exposures lies with the underlying assets. The related risk is mitigated by credit enhancement typically in the form of overcollateralization, subordination, reserve accounts, excess interest, or other support arrangements. Additional protection features include performance triggers, financial covenants and events of default stipulated in the legal documentation which, when breached, provide for the acceleration of repayment, rights of foreclosure and/or other remediation.
| | | | |
| Deutsche Bank | | 01 – Management Report | | 119 |
| Financial Report 2012 | | Risk Report | | |
| | |
| | | | |
| | |
| | | | |
All securitization exposures are subject to regular performance reviews which include checks of the periodic servicer reports against any performance triggers/covenants in the loan documentation, as well as the overall performance trend in the context of economic, geographic, sector and servicer developments. Monitoring of the re-securitization subset takes into consideration the performance of the securitized tranches’ underlying assets, to the extent available.
For longer-term lending-related commitments an internal rating review is required at least annually. Significant negative (or positive) changes in asset performance can trigger an earlier review date. Full credit reviews also are required annually, or, for highly rated exposures, every other year. Furthermore, there is a separate, usually quarterly, watch list process for exposures identified to be at a higher risk of loss, which requires a separate assessment of asset and servicer performance. It includes a review of the exposure strategy and identifies next steps to be taken to mitigate loss potential. There is no difference in approach for re-securitization transactions.
Securitization activities have an impact on our liquidity activity. On one hand, we have entered into securitization transactions as part of an active liquidity risk management strategy during 2008 and 2009, as mentioned before. On the other hand, we are exposed to potential drawdown under liquidity backstop facilities supporting the Deutsche Bank-sponsored asset-backed commercial paper or other revolving commitments. This liquidity risk is monitored by our Treasury department and is included in our liquidity planning and regular stress testing.
Evaluation of structural integrity is another important component of risk management for securitization, focusing on the structural protection of a securitization as defined in the legal documentation (e.g., perfection of security interest, segregation of payment flows, and rights to audit). The evaluation for each securitization is performed by a dedicated team who engages third-party auditors, determines audit scopes, and reviews the results of such external audits. The results of these risk reviews and assessments complement the credit and rating review process performed by Credit Risk Management.
We have identified part of the existing book of securitization transactions as “legacy book” earmarked for de-risking. Although such a non-core book was introduced earlier for Securitisation it now forms part of our NCOU. De-risking generally means that existing transactions are either partially or completely sold into the market, as far as adequate prices can be achieved. During the remaining hold period these positions benefit from reduction through amortization, where applicable. In 2012, this legacy book experienced a net decrease by€ 6.8 billion to€ 18.7 billion.
Hedging requirements for securitization exposures are mandated in the context of each individual credit approval, and are re-visited at each internal credit or rating review. However, credit risk management is conducted mostly through avoidance of undue risk concentration on borrower, servicer and asset class levels. Higher initial underwritings are de-risked to a final hold mandated in the credit approval mainly through syndication, or sales in the secondary market. Success of de-risking is being monitored and reported regularly to senior management. There is only very limited credit hedging activity in the banking book.
Furthermore, in the context of structuring securitization transactions, hedging usually takes place to insulate the SPE from interest rate and cross-currency risk – as far as required depending on the assets being included. When this hedging is provided by us, the related counterparty risk to the securitization structure is included in the Credit Risk Management review process and reported below as part of the banking book exposure despite effectively being part of our trading book. If this hedging is not provided by us, it is largely conducted with large international financial institutions with strong financials. Such indirect counterparty risk is reported to the hedging counterparty’s credit officer to become part of his/her credit evaluation.
Trading Book Securitizations
In the trading book, we act as originator, sponsor and investor. In the role of investor, our main objective is to serve as a market maker in the secondary market. The market making function consists of providing two way markets (buy and sell) to generate flow trading revenues and provide liquidity for customers. In the role of
| | | | |
| Deutsche Bank | | 01 – Management Report | | 120 |
| Financial Report 2012 | | Risk Report | | |
| | |
| | | | |
| | |
| | | | |
originator, we predominately engage in short synthetic single tranche CDOs (SST-CDOs) backed by loans to corporates or SMEs. Also in our role as originator, we finance loans to be securitized; in the current market environment our role in financing loans to be securitized is predominantly being performed in the commercial real estate business. Trading book activities where we have the role of a sponsor (i.e. excluding activities derived from multi-seller originator transactions) are minimal.
We hold a portfolio of asset backed securities (“ABS”) correlation trades within the NCOU portfolio that is in the process of being wound down. Other than de-risking the position, no new activity is being performed. The positions are being actively risk managed and are part of Market Risk Management’s Governance Framework (described below).
Our securitization desks trade assets across all capital structures, from senior bonds with large subordination to first loss subordinate tranches, across both securitizations and re-securitizations. Our exposure to re-securitizations in the trading book is€ 858 million comprised mostly of collateralized loan obligations (including a bucket of securitization) and a median rating of A-. The varying degrees of risk along the capital structure are reflected by the price in which the asset trades; this is because the market requires minimum loss adjusted returns on their investments. Securitization positions consist mostly of residential mortgage backed securities (“RMBS”) and commercial mortgage backed securities (“CMBS”) backed by first and second lien loans, collateralized loan obligations (“CLOs”) backed by corporate senior loans and unsecured debt and consumer ABS backed by secured and unsecured credit.
Securitized trading volume is linked to global growth. A slowdown can lead to decreased liquidity and lower trading volumes, as observed in the second half of 2011. Investor demand strengthened in 2012 for securities products as global economies stabilized and liquidity returned to the market. Other potential risks that exist in securitized assets are prepayment, default and severity uncertainty and servicer performance risk. Note that trading book assets are marked to market and the previous mentioned risks are reflected in the position’s price.
Our Market Risk Management Governance Framework applies to all securitization positions held within the trading book. The Risk Governance Framework applied to securitization includes policies and procedures with respect to new product approvals and new transaction approvals as well as inventory management systems and trade entry. The Risk Governance Framework applied to securitization also includes policies and procedures with respect to risk models and measurements. All securitization positions are captured and measured within value-at-risk, stressed value-at-risk, and economic capital. The measurements are dependent upon internal and external models and processes, which includes the use of third-party assessments of risks associated with the underlying collateral. Furthermore the Risk Governance Framework includes risk reporting and limits, at the global, regional and product levels. All securitization positions held within the trading book are captured, reported and limited within this framework and changes in credit and market risks are reported. The limit structure includes value-at-risk and market value product specific limits. Under the limit framework, asset class market value limits are based on seniority/rating where lower rated positions are given a lower trading limit. The limit monitoring system captures exposures and flags any threshold breaches. Market Risk Management approval is required for any trades over the limit. The processes for securitization and re-securitizations are similar.
Our Traded Credit Positions (“TCP”) process captures the issuer risk for securitization positions in the trading book. TCP-Securitization manages concentration risks and sets position level limits based on asset class and rating. Positions with lower ratings are assigned lower trading limits. Limit management reports are produced to ensure position level limit compliance and to detect any potential limit breaches. When positions exceed the respective market value limits on a global basis, TCP approval is required. In addition collateral level stress testing and performance monitoring is incorporated into the risk management process. The Traded Credit Positions process covers both securitizations and re-securitizations.
The securitization desks incorporate a combination of macro and position level hedges to mitigate credit, interest rate and certain tail risks on the entire securitization portfolio. Duration and credit sensitivities (DV01s and
| | | | |
| Deutsche Bank | | 01 – Management Report | | 121 |
| Financial Report 2012 | | Risk Report | | |
| | |
| | | | |
| | |
| | | | |
CS01s) are the primary risk sensitivity measures used to calculate appropriate hedges. Some of the hedging products utilized include vanilla interest rate swaps, US Treasury bonds and product specific liquid indices. The market risks of the hedges (both funded and unfunded) are incorporated and managed within our Market Risk Management Governance Framework as described above; and, the counterparty risks of the hedges (both funded and unfunded), which are comprised primarily of major global financial institutions, are managed and approved through a formalized risk management process performed by Credit Risk Management.
Accounting and Valuation Policies for Securitizations
Our accounting policies are included in Note 01 “Significant Accounting Policies”. The most relevant accounting policies for the securitisation programmes originated by us, and where we hold assets purchased with the intent to securitize, are “Principles of Consolidation”, “Financial Assets and Financial Liabilities” and “Derecognition of Financial Assets and Financial Liabilities”, see also Note 15 “Financial Instruments carried at Fair Value”.
Types of Special Purposes Entities used by Deutsche Bank as Sponsor of Securitizations
We establish and administer as sponsor asset-backed commercial paper (“ABCP”) programs through which we securitize assets acquired from third parties. Each program consists of a commercial paper issuing special purpose entity (the so-called “conduit”) and one or more supporting SPE through which the assets are purchased. The conduits and the SPEs are organized as limited liability companies or in an equivalent legal form. The assets securitized through the ABCP programs include auto loans, auto leases, auto dealer floor plan receivables, student loans, credit card receivables, trade receivables, capital call receivables, residential and commercial mortgage loans, future flows and other assets.
We assume both on-balance sheet exposure and off-balance sheet exposure which stems from liquidity facilities granted to the SPEs or the related conduit, letters of credit, total return swaps or similar credit enhancements, interest rate and foreign exchange related derivatives and commercial papers.
Occasionally, on a transaction by transaction basis, we assist special purpose entities in acquiring third party assets where we, considering our overall contribution e.g., our influence on selecting the securitized assets and structuring the tranches, qualify as sponsor. This type of transactions may include multi-seller securitizations where a small portion of the securitized assets were originated by us, e.g., performing and non-performing residential and commercial mortgage loans. We assume on-balance sheet exposure and off-balance sheet exposure including first loss tranches or interest rate and foreign exchange related derivatives.
We as originator or sponsor of a securitization transaction sell ABCPs and other securitization tranches (or arrange for such sale through mandated market making institutions) solely on an “execution only” basis and only to sophisticated operative corporate clients that rely on their own risk assessment. In the ordinary course of business, we do not offer such tranches to operative corporate clients to which, at the same time, we offer investment advisory services.
Regulatory Securitization Framework
Section 1b of the German Banking Act (Kreditwesengesetz – KWG) defines which types of transactions and positions must be classified as securitization transactions and securitization positions for regulatory reporting.
Securitization transactions are basically defined as transactions in which the credit risk of a securitized portfolio is divided into at least two securitization tranches and where the payments to the holders of the tranches depend on the performance of the securitized portfolio. The different tranches are in a subordinate relationship that determines the order and the amount of payments or losses assigned to the holders of the tranches (waterfall). Loss allocations to a junior tranche will not already lead to a termination of the entire securitization transaction, i.e., senior tranches survive loss allocations to subordinate tranches.
| | | | |
| Deutsche Bank | | 01 – Management Report | | 122 |
| Financial Report 2012 | | Risk Report | | |
| | |
| | | | |
| | |
| | | | |
Securitization positions can be acquired in various forms including investments in securitization tranches, derivative transactions for hedging interest rate and currency risks included in the waterfall, liquidity facilities, credit enhancements, unfunded credit protection or collateral for securitization tranches.
The approach for the calculation of the regulatory capital requirements for banking book and trading book securitization positions is prescribed by the German solvency regulation (Solvabilitätsverordnung – “SolvV”).
Calculation of Regulatory Capital Requirements for Banking Book Securitizations
The regulatory capital requirements for the credit risk of banking book securitizations are determined based on the securitization framework pursuant to Sections 225 to 268 SolvV, which distinguishes between credit risk standardized approach (“CRSA”)-securitization positions and internal ratings based approach (“IRBA”)-securitization positions. The classification of securitization positions as either CRSA- or IRBA-securitization positions depends on the nature of the securitized portfolio. Basically, CRSA-securitization positions are those where the securitized portfolio predominantly includes credit risk exposures, which would qualify as CRSA-exposures under the credit risk framework if they would be held by us directly. Otherwise, if the majority of the securitized portfolio would qualify as IRBA-exposures, the securitization positions qualify as IRBA-securitization positions.
The risk weights of CRSA-securitization positions are derived from their relevant external ratings, when applicable. External ratings must satisfy certain eligibility criteria for being used in the risk weight calculation. Eligible external ratings are taken from Standard & Poor’s, Moody’s, Fitch Ratings and DBRS. If more than one eligible rating is available for a specific securitization position, the relevant external rating is determined as the second best eligible rating in accordance with the provisions set forth in Sections 236 to 237 SolvV. CRSA-securitization positions with no eligible external rating are deducted from liable capital unless they qualify for the application of the risk concentration approach pursuant to Section 243 (2) SolvV which might lead to a risk weight below 1250 %.
The risk weight of IRBA-securitization positions is determined according to the following hierarchy:
| — | | If one or more eligible external ratings exist for the IRBA-securitization position, or if an external rating can be inferred from an eligible external rating of a benchmark securitization position, the risk weight is derived from the relevant external rating (ratings based approach). |
| — | | Otherwise, if no eligible external rating exists or can be inferred, the risk weight of the IRBA-securitization position will generally be determined based on the supervisory formula approach pursuant to Section 258 SolvV or the internal assessment approach pursuant to Section 259 SolvV. |
| — | | If neither of the aforementioned approaches can be applied, the position is deducted from liable capital. |
The ratings based approach applies to the largest part of our IRBA- and CRSA-securitization positions, largely in the lower (better) risk weight bands. We use mainly the external ratings of Standard & Poor’s, Moody’s and Fitch Ratings and DBRS only to a lesser extent. The majority of securitization positions with an eligible external or inferred external credit assessment are retained positions of our synthetic securitizations or securitization positions held as investor. The risk concentration approach is applied to a few CRSA-securitization exposures that are small compared to the total amount of our banking book securitization exposures. The scope of application of the supervisory formula approach and of the internal assessment approach is described below.
There is no securitization position for which we have applied the special provisions for originators of securitization transactions which include an investor’s interest to be recognized by the originator pursuant to Section 245 et seq. respectively Section 262 et seq. SolvV.
| | | | |
| Deutsche Bank | | 01 – Management Report | | 123 |
| Financial Report 2012 | | Risk Report | | |
| | |
| | | | |
| | |
| | | | |
Supervisory Formula Approach and Internal Assessment Approach
The risk weight of securitization positions subject to the supervisory formula approach (“SFA”) is determined based on a formula which takes as input the capital requirement of the securitized portfolio and the seniority of the securitization position in the waterfall, amongst others. When applying the SFA, we estimate the risk parameters PD and LGD for the assets included in the securitized portfolio, by using internally developed rating systems approved for such assets. We continue to develop new rating systems for homogenous pools of assets to be applied to assets that have not been originated by us. The rating systems are based on historical default and loss information from comparable assets. The risk parameters PD and LGD are derived on risk pool level.
Approximately 40 % of the total banking book securitization positions are subject to the SFA. This approach is predominantly used to rate positions backed by corporate loans, auto-related receivables and commercial real estate.
For unrated IRBA-securitization positions which are related to ABCP programs and which are not asset backed commercial paper, the risk weight is calculated based on the internal assessment approach (“IAA”). Apart from using this concept for regulatory purposes, the internal rating is used for expected loss and economic capital calculations and plays a significant role in the credit decision and monitoring process.
We have received approval from BaFin to apply the IAA to approximately 85 % of our ABCP conduit securitization exposure.
Asset classes subject to IAA are governed by a specific and detailed set of rules per asset class. These asset class write-ups (“ACW”) have been established in cooperation between all relevant departments of the bank including Credit Risk Management, Risk Analytics and Instruments and the Front Office. They are reviewed and approved in a formal internal process, and subject to an at least annual review. For BaFin approved asset classes, the ACW require re-approval by the regulator in case of significant changes during the review process.
BaFin approval for IAA has been received for currently 13 different asset classes in both consumer and commercial assets. The stress factors are different per asset class and rating level; they are established based on criteria set by the “dominant” external rating agency which forms the basis of the internal qualitative and quantitative rating analysis. The stress factor multiples indicate how much credit enhancement is required to obtain a specific rating. It is specified as a multiple of the expected loss.
The following tables summarize (a) the Stress Factor Multiples per rating level, or (b) key stress testing methodology for those without defined Stress Factor Multiples, based on the methodology published by the respective dominant rating agencies:
Stress Factor Multiples per Rating Level by dominant Rating Agencies
| | | | | | | | | | | | | | | | | | | | | | | | |
Asset Class | | Auto Loans | | | CDO | | | Comm. Lease
& Loan | | | Consumer Loans | | | Credit Cards | | | Trade Receivable | |
| Dominant Rating Agency | | | S&P | | | | Moody’s | | | | S&P | | | | S&P | | | | S&P | | | | S&P | |
| | | | | | | | | | | | | | | | | | | | | | | | |
AAA | | | 3.75–5 | | | | 1.95 | | | | 5 | | | | 4–5 | | | | 3–6.6 | | | | 2.5 | |
| | | | | | | | | | | | | | | | | | | | | | | | |
AA | | | 3–4 | | | | 1.8–1.76 | | | | 4 | | | | 3–4 | | | | 2.5–5 | | | | 2.25 | |
| | | | | | | | | | | | | | | | | | | | | | | | |
A | | | 2–3 | | | | 1.73–1.69 | | | | 3 | | | | 2–3 | | | | 2–3.75 | | | | 2 | |
| | | | | | | | | | | | | | | | | | | | | | | | |
BBB | | | 1.75–2 | | | | 1.67–1.63 | | | | 2 | | | | 1.5–2 | | | | 1.5–2.5 | | | | 1.5 | |
| | | | | | | | | | | | | | | | | | | | | | | | |
BB | | | 1.5–1.75 | | | | 1.5–1.2 | | | | | | | | 1–1.5 | | | | 1.25–1.5 | | | | | |
| |
| | | | |
| Deutsche Bank | | 01 – Management Report | | 124 |
| Financial Report 2012 | | Risk Report | | |
| | |
| | | | |
| | |
| | | | |
Summary of Rating agency Stress Factor Methodologies without defined Stress Factor Multiples
| | | | | | | | | | | | | | |
Asset Class | | Capital Calls | | MV CDO | | RMBS
Australia | | RMBS
Europe | | RMBS US | | Structured
Settlements | | Student Loans
FFELP |
Dominant
Rating Agency | | Moody’s | | S&P | | S&P | | S&P | | S&P | | S&P | | Moody’s |
Comment | | Methodology relies on conservative assumptions regarding debtor ratings and recovery rates; supported by conservative correlation criteria | | Methodology of both S&P and Moody’s is using Advance rates instead of Stress Factor Multiples, which are available on their respective websites | | Methodology uses default & loss assumptions per rating level, based on benchmark pools with adjustments appropriate for the respective pool being compared | | Methodology uses default & loss assumptions per rating level, based on benchmark pools with adjustments appropriate for the respective pool being compared | | Stress-testing by applying S&P default and loss assumptions per rating level on each individual loan in the pool | | Generating a probability distribution of potential default rates at each rating level for the portfolio using industry-specific recovery rates. Additional stress tests regarding Largest Obligor and Largest Industry Defaults | | Applying rating-level specific stresses including defined cumulative default rates, voluntary prepayment rates, servicer reject rates and borrower benefit rates |
Information based on methodology published by the respective Dominant Rating Agencies, which may be amended from time to time.
The underlying cash flow models per asset class are also subject to the regular review process. For securitizations in these asset classes we utilize external credit assessment institutions, namely Standard & Poor’s and Moody’s as outlined in the tables above.
Calculation of Regulatory Capital Requirements for Trading Book Securitizations
The regulatory capital requirements for the market risk of trading book securitizations are determined based on a combination of internal models and regulatory standard approaches pursuant to Section 314 et seq. SolvV.
The capital requirement for the general market risk of trading book securitization positions is determined as the sum of (i) the value-at-risk based capital requirement for general market risk and (ii) the stressed value-at-risk based capital requirement for general market risk.
The capital requirement for the specific market risk of trading book securitization positions depends on whether the positions are assigned to the regulatory correlation trading portfolio (“CTP”) or not.
For securitization positions that are not assigned to the CTP, the capital requirement for specific market risk is calculated based on the market risk standardized approach (“MRSA”). The MRSA risk weight for trading book securitization positions is generally calculated by using the same methodologies which apply to banking book securitization positions. The only difference relates to the use of the SFA for trading book securitization positions, where the capital requirement of the securitized portfolio is determined by making use of risk parameters (probability of default and loss given default) that are based on the incremental risk charge model. The MRSA based capital requirement for specific risk is determined as the higher of the capital requirements for all net long and all net short securitization positions outside of the CTP. The securitization positions included in the MRSA calculations for specific risk are additionally included in the value-at-risk and stressed value-at-risk calculations for specific risk.
Trading book securitizations subject to MRSA treatment include various asset classes differentiated by the respective underlying collateral types:
| — | | Residential mortgage backed securities (“RMBS”); |
| — | | Commercial mortgage backed securities (“CMBS”); |
| — | | Collateralized loan obligations (“CLO”); |
| — | | Collateralized debt obligations (“CDO”); and |
| — | | Consumer asset backed securities (incl. credit cards, auto loans and leases, student loans, equipment loans and leases, dealer floorplan loans, etc). |
| | | | |
| Deutsche Bank | | 01 – Management Report | | 125 |
| Financial Report 2012 | | Risk Report | | |
| | |
| | | | |
| | |
| | | | |
They also include synthetic credit derivatives and commonly-traded indices based on the above listed instruments.
Conversely, the capital requirement for the specific market risk of securitization positions which are assigned to the CTP is determined as the sum of (i) the value-at-risk based capital requirement for specific risk, (ii) the stressed value-at-risk based capital requirement for specific risk and (iii) the capital requirement for specific risk as derived from the comprehensive risk measurement (“CRM”) model. The CRM based capital requirement is subject to a floor equal to 8 % of the higher of the specific risk capital requirements for all net long and all net short securitization positions under the MRSA.
The CTP includes all securitization positions and nth-to-default credit derivatives held for the purpose of trading correlation that satisfy the following requirements:
| — | | all reference instruments are either single-name instruments, including single-name credit derivatives for which a liquid two-way market exists, or commonly-traded indices based on those reference entities; |
| — | | the positions are neither re-securitization positions, nor options on a securitization tranche, nor any other derivatives of securitization exposures that do not provide a pro-rata share in the proceeds of a securitization tranche; and |
| — | | the positions do not reference a claim on a special purpose entity, claims or contingent claims on real estate property or retail. |
The CTP also comprises hedges to the securitization and nth-to-default positions in the portfolio, provided a liquid two-way market exists for the instrument or its underlying. Typical products assigned to the CTP are synthetic CDOs, nth-to-default credit default swaps (“CDS”), and index and single name CDS. For details on the CRM covering the regulatory CTP please also refer to the Section “Trading Market Risk”.
Regulatory Good Practice Guidelines
The European Banking Federation, the Association for Financial Markets in Europe (formerly London Investment Banking Association), the European Savings Banks Group and the European Association of Public Banks and Funding Agencies published the “Industry good practice guidelines on Pillar 3 disclosure requirements for securitization” in December 2008, which were slightly revised in 2009/2010. Our Pillar 3 disclosures are in compliance with the spirit of these guidelines as far as they have not been superseded by revised regulations in light of Basel 2.5.
Securitization Details
The amounts reported in the following tables provide details of our securitization exposures separately for the regulatory banking and trading book. The presentation of the banking and trading book exposures is in line with last year’s disclosure. The details of our trading book securitization positions subject to the MRSA are included in this chapter, while details of the trading book securitization positions covered under the Comprehensive Risk Measure (“CRM”) are described in Chapter “Trading Market Risk”.
Overall, the amounts presented in this chapter differ from, and are not directly comparable to, the amounts reported in the section “Special Purpose Entities”, in particular due to the differences in the respective consolidation principles between IFRS accounting and regulatory consolidation frameworks, as described above.
Outstanding Exposures Securitized
We are only exposed to credit or market risks related to the exposures securitized, as shown below, to the extent that we have retained or purchased any of the related securitization positions. The risk of the retained or purchased positions depends on the relative position in the payment waterfall structure of the securitization transaction. For disclosure purposes, we are deemed to be Originator and additionally Sponsor in case of multi-seller securitisations, which is reflected in the disclosure of the total outstanding exposures securitized in the Sponsor column and our share of those exposures in the Originator column.
| | | | |
| Deutsche Bank | | 01 – Management Report | | 126 |
| Financial Report 2012 | | Risk Report | | |
| | |
| | | | |
| | |
| | | | |
The following table details the total banking book outstanding exposure, i.e., the overall pool size, we have securitized in our capacity as either originator or sponsor through traditional or synthetic securitization transactions split by exposure type. Within the originator columns the table provides information of the underlying securitized asset pool which was either originated from our balance sheet or acquired from third parties. The amounts reported are either the carrying values as reported in our consolidated financial statements for on-balance sheet exposures in synthetic securitizations or the principal notional amount for traditional securitizations and off-balance sheet exposures in synthetic transactions. Of the€ 53 billion total outstanding securitized exposure reported as of December 31, 2012 in the table below as “Originator”, the amount retained was€ 31 billion reflecting a decrease in both outstanding securitized as well as retained exposure which for December 31, 2011 were€ 76 billion and€ 40 billion respectively.
For sponsor relationships, the total outstanding exposure securitized reported in the table below represents the principal notional amount of outstanding exposures of the entities issuing the securities and other receivables. As of December 31, 2012, our retained or repurchased exposure of the€ 117 billion total outstanding exposure securitized shown in the “Sponsor” columns including multi-seller transactions was€ 17 billion. The remaining exposure is held by third parties. As of December 31, 2011, our maximum exposure with regard to the€ 131 billion total outstanding exposure securitized resulted from sponsoring activities including multi-seller transactions amounted to€ 21 billion. The decrease in our maximum exposure resulted primarily from a management decision to reduce the securitization book in the current weaker markets. The total reported outstanding exposure securitized is derived using information received from servicer reports of the third parties with whom the conduits have relationships.
Outstanding Exposures Securitized by Exposure Type (Overall Pool Size) within the Banking Book
| | | | | | | | | | | | | | | | | | | | | | | | | | | | | | | | |
| | | Dec 31, 2012 | | | Dec 31, 2011 | |
| | | Originator | | | Sponsor1 | | | Originator | | | Sponsor1 | |
in€ m. | | Traditional | | | Synthetic | | | Traditional | | | Synthetic | | | Traditional | | | Synthetic | | | Traditional | | | Synthetic | |
| Residential mortgages | | | 10,954 | | | | 3,516 | | | | 4,276 | | | | – | | | | 14,018 | | | | 4,124 | | | | 18,131 | | | | – | |
| | | | | | | | | | | | | | | | | | | | | | | | | | | | | | | | |
| Commercial mortgages | | | 13,682 | | | | – | | | | 7,991 | | | | – | | | | 16,569 | | | | – | | | | 4,990 | | | | – | |
| | | | | | | | | | | | | | | | | | | | | | | | | | | | | | | | |
| Credit card receivables | | | – | | | | – | | | | 1,742 | | | | – | | | | – | | | | – | | | | 5,577 | | | | – | |
| | | | | | | | | | | | | | | | | | | | | | | | | | | | | | | | |
| Leasing | | | – | | | | – | | | | 5,967 | | | | – | | | | – | | | | – | | | | 6,390 | | | | – | |
| | | | | | | | | | | | | | | | | | | | | | | | | | | | | | | | |
| Loans to corporates or SMEs (treated as corporates)2 | | | 2,772 | | | | 20,014 | | | | 21,256 | | | | 781 | | | | 6,657 | | | | 27,105 | | | | 26,698 | | | | 1,045 | |
| | | | | | | | | | | | | | | | | | | | | | | | | | | | | | | | |
| Consumer loans | | | – | | | | – | | | | 17,932 | | | | – | | | | – | | | | – | | | | 15,356 | | | | – | |
| | | | | | | | | | | | | | | | | | | | | | | | | | | | | | | | |
| Trade receivables | | | – | | | | – | | | | – | | | | – | | | | – | | | | – | | | | – | | | | – | |
| | | | | | | | | | | | | | | | | | | | | | | | | | | | | | | | |
| Securitizations (re-securitizations) | | | 1,642 | | | | 590 | | | | 3,467 | | | | – | | | | 7,830 | | | | – | | | | 1,022 | | | | – | |
| | | | | | | | | | | | | | | | | | | | | | | | | | | | | | | | |
| Other assets | | | – | | | | – | | | | 53,166 | | | | – | | | | 97 | | | | – | | | | 51,851 | | | | – | |
| | | | | | | | | | | | | | | | | | | | | | | | | | | | | | | | |
| Total outstanding exposures securitized3 | | | 29,050 | | | | 24,120 | | | | 115,797 | | | | 781 | | | | 45,171 | | | | 31,229 | | | | 130,015 | | | | 1,045 | |
| |
| 1 | As of December 31, 2012 included under “Sponsor” is the amount€ 17 billion of multi-seller related securitized exposures, of which we have originated€ 8 billion, and therefore have also included this amount under “Originator”. For December 31, 2011 the amounts were€ 18 billion and€ 10 billion respectively. |
| 2 | SMEs are small- or medium-sized entities. |
| 3 | For a regulatory assessment of our exposure to credit risk in relation to securitization activity in the banking book see table “Banking Book Securitization Positions Retained or Purchased by Risk Weight Band”. |
The table below provides the total outstanding exposure securitized in relation to securitization positions held in our regulatory trading book separately for originator and sponsor activities and further broken down into traditional and synthetic transactions. Short synthetic single tranche CDOs have been reflected as originator positions for which the synthetic pool size was determined as the maximum pool size of the position sets referencing a given synthetic pool. The total outstanding exposure securitized as shown in the table below does not reflect our risk as it includes exposures not retained by us, does not consider the different positioning in the waterfall of related positions and – most notably – does not reflect hedging other than that in identical tranches. Compared to last year, the pool of outstanding exposures securitized reduced significantly for traditional and synthetic securitizations.
| | | | |
| Deutsche Bank | | 01 – Management Report | | 127 |
| Financial Report 2012 | | Risk Report | | |
| | |
| | | | |
| | |
| | | | |
Outstanding Exposures Securitized by Exposure Type (Overall Pool Size) within the Trading Book
| | | | | | | | | | | | | | | | | | | | | | | | | | | | | | | | |
| | | Dec 31, 2012 | | | Dec 31, 2011 | |
| | | Originator | | | Sponsor1 | | | Originator | | | Sponsor1 | |
in€ m. | | Traditional | | | Synthetic | | | Traditional | | | Synthetic | | | Traditional | | | Synthetic | | | Traditional | | | Synthetic | |
| Residential mortgages | | | 7,545 | | | | – | | | | 7,105 | | | | – | | | | 13,591 | | | | – | | | | 4,586 | | | | – | |
| | | | | | | | | | | | | | | | | | | | | | | | | | | | | | | | |
| Commercial mortgages | | | 29,185 | | | | – | | | | 50,308 | | | | – | | | | 39,885 | | | | 5,295 | | | | 55,551 | | | | – | |
| | | | | | | | | | | | | | | | | | | | | | | | | | | | | | | | |
| Credit card receivables | | | – | | | | – | | | | – | | | | – | | | | – | | | | – | | | | – | | | | – | |
| | | | | | | | | | | | | | | | | | | | | | | | | | | | | | | | |
| Leasing | | | – | | | | – | | | | – | | | | – | | | | – | | | | – | | | | – | | | | – | |
| | | | | | | | | | | | | | | | | | | | | | | | | | | | | | | | |
| Loans to corporates or SMEs (treated as corporates)2 | | | 1,902 | | | | 234,619 | | | | 3,805 | | | | – | | | | 2,063 | | | | 274,7463 | | | | 4,126 | | | | – | |
| | | | | | | | | | | | | | | | | | | | | | | | | | | | | | | | |
| Consumer loans | | | – | | | | – | | | | – | | | | – | | | | – | | | | – | | | | – | | | | – | |
| | | | | | | | | | | | | | | | | | | | | | | | | | | | | | | | |
| Trade receivables | | | – | | | | – | | | | – | | | | – | | | | – | | | | – | | | | – | | | | – | |
| | | | | | | | | | | | | | | | | | | | | | | | | | | | | | | | |
| Securitizations (re-securitizations) | | | 3,543 | | | | – | | | | 117 | | | | – | | | | 9,663 | | | | – | | | | – | | | | – | |
| | | | | | | | | | | | | | | | | | | | | | | | | | | | | | | | |
| Other assets | | | 1,189 | | | | – | | | | – | | | | – | | | | 633 | | | | – | | | | 1,367 | | | | – | |
| | | | | | | | | | | | | | | | | | | | | | | | | | | | | | | | |
| Total outstanding exposures securitized4 | | | 43,364 | | | | 234,619 | | | | 61,335 | | | | – | | | | 65,835 | | | | 280,041 | | | | 65,630 | | | | – | |
| |
| 1 | As of December 31, 2012 included under “Sponsor” is the amount€ 57 billion of multi-seller related securitized exposures, of which we have originated€ 23 billion, and therefore have also included this amount under “Originator”. For December 31, 2011 the amounts were€ 63 billion and€ 28 billion respectively. |
| 2 | SMEs are small- or medium-sized entities. |
| 3 | Outstanding Exposures Securitized was restated reflecting additional 14 short synthetic single tranche CDOs not identified last year. |
| 4 | For a regulatory assessment of our exposure to credit risk in relation to securitization activity in the trading book see table “Trading Book Securitization Positions Retained or Purchased by Risk Weight Band subject to the MRSA”. Includes securitized exposure as originator amounting to€ 17 billion and as sponsor amounting to€ 11 billion already reflected in table “Outstanding Exposures Securitized by Exposure Type (Overall Pool Size) within the Banking Book”. |
The following table provides details of the quality of the underlying asset pool of outstanding exposures securitized for which we are an Originator and hold positions in the regulatory banking book. An exposure is reported as past due when it has the status past due for 30 days or more and has not already been included as impaired. For our originated synthetic securitizations, impaired and past due exposure amounts are determined through our internal administration, while for our originated traditional securitizations, impaired and past due exposure amounts are primarily derived from investor reports of underlying exposures.
Separately, the table details losses we recognized in 2012 and 2011 for retained or purchased securitization positions as originator by exposure type. The losses are those reported in the consolidated statement of income. The amounts are the actual losses in the underlying asset pool to the extent that these losses are allocated to the retained or purchased securitization positions held by us after considering any eligible credit protection. This applies to both traditional and synthetic transactions.
| | | | |
| Deutsche Bank | | 01 – Management Report | | 128 |
| Financial Report 2012 | | Risk Report | | |
| | |
| | | | |
| | |
| | | | |
Impaired and Past Due Exposures Securitized and Losses Recognized by Exposure Type (Overall Pool Size) as Originator
| | | | | | | | | | | | | | | | |
| | | Dec 31, 2012 | | | 2012 | | | Dec 31, 2011 | | | 2011 | |
in€ m. | | Impaired/
past due1 | | | Losses | | | Impaired/
past due1 | | | Losses | |
| Residential mortgages | | | 3,639 | | | | 14 | | | | 4,831 | | | | 28 | |
| | | | | | | | | | | | | | | | |
| Commercial mortgages | | | 79 | | | | – | | | | 227 | | | | – | |
| | | | | | | | | | | | | | | | |
| Credit card receivables | | | – | | | | – | | | | – | | | | – | |
| | | | | | | | | | | | | | | | |
| Leasing | | | – | | | | – | | | | – | | | | – | |
| | | | | | | | | | | | | | | | |
| Loans to corporates or SMEs (treated as corporates)2 | | | 256 | | | | 11 | | | | 1,191 | | | | 35 | |
| | | | | | | | | | | | | | | | |
| Consumer loans | | | – | | | | – | | | | – | | | | – | |
| | | | | | | | | | | | | | | | |
| Trade receivables | | | – | | | | – | | | | – | | | | – | |
| | | | | | | | | | | | | | | | |
| Securitizations (re-securitizations) | | | 368 | | | | 5 | | | | 361 | | | | 5 | |
| | | | | | | | | | | | | | | | |
| Other assets | | | – | | | | – | | | | – | | | | – | |
| | | | | | | | | | | | | | | | |
| Total impaired and past due exposures securitized and losses recognized3 | | | 4,342 | | | | 30 | | | | 6,610 | | | | 68 | |
| |
| 1 | Includes the impaired and past due exposures in relation to the overall pool of multi-seller securitizations which could reflect more than our own originated portion. |
| 2 | SMEs are small- or medium-sized entities. |
| 3 | For a regulatory assessment of our exposure to credit risk in relation to securitization activity in the banking book see table “Banking Book Securitization Positions Retained or Purchased by Risk Weight Band”. |
The total impaired or past due exposure securitized decreased by€ 2.3 billion in 2012. The reduction is attributed to the exposure types “Residential mortgages”, “Commercial mortgages” and “Loans to corporates or SMEs”. Losses recorded by us in 2012 decreased across all exposure types to€ 30 million compared to€ 68 million in 2011.
The following table provides details of existing banking and trading book outstanding exposures split by exposure type for which there is a management intention to securitize them in either an existing or new securitization transaction in the near future. Outstanding exposures awaiting securitization do not include assets due for securitization without risk transfer i.e., those securitizations where we will keep all tranches.
Outstanding Exposures Awaiting Securitization
| | | | | | | | | | | | | | | | |
| | | Dec 31, 2012 | | | Dec 31, 2011 | |
in€ m. | | Banking Book | | | Trading Book | | | Banking Book | | | Trading Book | |
| Residential mortgages | | | – | | | | – | | | | – | | | | – | |
| | | | | | | | | | | | | | | | |
| Commercial mortgages | | | – | | | | 1,783 | | | | 243 | | | | 788 | |
| | | | | | | | | | | | | | | | |
| Credit card receivables | | | – | | | | – | | | | – | | | | – | |
| | | | | | | | | | | | | | | | |
| Leasing | | | – | | | | – | | | | – | | | | – | |
| | | | | | | | | | | | | | | | |
| Loans to corporates or SMEs (treated as corporates)1 | | | 6,358 | | | | – | | | | 1,154 | | | | – | |
| | | | | | | | | | | | | | | | |
| Consumer loans | | | – | | | | – | | | | – | | | | – | |
| | | | | | | | | | | | | | | | |
| Trade receivables | | | – | | | | – | | | | – | | | | – | |
| | | | | | | | | | | | | | | | |
| Securitizations (re-securitizations) | | | – | | | | 372 | | | | – | | | | – | |
| | | | | | | | | | | | | | | | |
| Other assets | | | – | | | | – | | | | – | | | | – | |
| | | | | | | | | | | | | | | | |
| Outstanding exposures awaiting securitization | | | 6,358 | | | | 2,155 | | | | 1,397 | | | | 788 | |
| |
| 1 | SMEs are small- or medium-sized entities. |
The majority of the outstanding exposures awaiting securitization are “Loans to corporates or SMEs”, which are subject to securitizations of the CPSG.
Securitization Positions Retained or Purchased
For securitization positions retained or purchased the reported amounts for the banking book are regulatory exposure values prior to the application of credit risk mitigation. The securitization positions in the regulatory trading book are reported based on the exposure definition in Section 299 SolvV which states that identical or closely matched securities and derivatives are offset to a net position.
Securitization Positions Retained or Purchased by Exposure Type
| | | | | | | | | | | | | | | | | | | | | | | | |
| | | Dec 31, 2012 | |
| | | Banking Book | | | Trading Book | |
in€ m. | | On-balance
securitization
positions | | | Off-balance,
derivative
and SFT
securitization
positions | | | Total | | | On-balance
securitization
positions | | | Off-balance,
derivative
and SFT
securitization
positions | | | Total | |
| Residential mortgages | | | 5,484 | | | | 3,331 | | | | 8,815 | | | | 1,553 | | | | 92 | | | | 1,645 | |
| | | | | | | | | | | | | | | | | | | | | | | | |
| Commercial mortgages | | | 2,712 | | | | 934 | | | | 3,646 | | | | 2,263 | | | | 3,319 | | | | 5,582 | |
| | | | | | | | | | | | | | | | | | | | | | | | |
| Credit card receivables | | | – | | | | 920 | | | | 920 | | | | 46 | | | | – | | | | 46 | |
| | | | | | | | | | | | | | | | | | | | | | | | |
| Leasing | | | 2,227 | | | | 1,291 | | | | 3,518 | | | | 0 | | | | – | | | | 0 | |
| | | | | | | | | | | | | | | | | | | | | | | | |
| Loans to corporates or SMEs (treated as corporates)1 | | | 25,568 | | | | 4,791 | | | | 30,359 | | | | 272 | | | | 4,526 | | | | 4,798 | |
| | | | | | | | | | | | | | | | | | | | | | | | |
| Consumer loans | | | 2,818 | | | | 2,470 | | | | 5,288 | | | | 109 | | | | – | | | | 109 | |
| | | | | | | | | | | | | | | | | | | | | | | | |
| Trade receivables | | | – | | | | – | | | | – | | | | 0 | | | | – | | | | 0 | |
| | | | | | | | | | | | | | | | | | | | | | | | |
| Securitizations (re-securitizations) | | | 1,593 | | | | 2,398 | | | | 3,991 | | | | 729 | | | | 56 | | | | 785 | |
| | | | | | | | | | | | | | | | | | | | | | | | |
| Other assets | | | 5,044 | | | | 3,887 | | | | 8,931 | | | | 1,099 | | | | 33 | | | | 1,132 | |
| | | | | | | | | | | | | | | | | | | | | | | | |
| Total securitization positions retained or purchased2 | | | 45,446 | | | | 20,022 | | | | 65,468 | | | | 6,071 | | | | 8,026 | | | | 14,097 | |
| |
| 1 | SMEs are small- or medium-sized entities. |
| 2 | For a regulatory assessment of our exposure to credit risk in relation to securitization activities see table “Banking Book Securitization Positions Retained or Purchased by Risk Weight Band” and table “Trading Book Securitization Positions Retained or Purchased by Risk Weight Band subject to MRSA”. |
| | | | |
| Deutsche Bank | | 01 – Management Report | | 129 |
| Financial Report 2012 | | Risk Report | | |
| | |
| | | | |
| | |
| | | | |
| | | | | | | | | | | | | | | | | | | | | | | | |
| | | Dec 31, 2011 | |
| | | Banking Book | | | Trading Book | |
in€ m. | | On-balance
securitization
positions | | | Off-balance,
derivative
and SFT
securitization
positions | | | Total | | | On-balance
securitization
positions | | | Off-balance,
derivative
and SFT
securitization
positions | | | Total | |
| Residential mortgages | | | 7,278 | | | | 3,540 | | | | 10,818 | | | | 1,766 | | | | 79 | | | | 1,845 | |
| | | | | | | | | | | | | | | | | | | | | | | | |
| Commercial mortgages | | | 4,245 | | | | 1,154 | | | | 5,399 | | | | 1,832 | | | | 1,010 | | | | 2,842 | |
| | | | | | | | | | | | | | | | | | | | | | | | |
| Credit card receivables | | | 613 | | | | 671 | | | | 1,284 | | | | 101 | | | | 32 | | | | 133 | |
| | | | | | | | | | | | | | | | | | | | | | | | |
| Leasing | | | 1,443 | | | | 1,546 | | | | 2,989 | | | | 0 | | | | – | | | | 0 | |
| | | | | | | | | | | | | | | | | | | | | | | | |
| Loans to corporates or SMEs (treated as corporates)1 | | | 32,465 | | | | 5,746 | | | | 38,211 | | | | 227 | | | | 5,837 | | | | 6,064 | |
| | | | | | | | | | | | | | | | | | | | | | | | |
| Consumer loans | | | 2,650 | | | | 3,484 | | | | 6,134 | | | | 60 | | | | – | | | | 60 | |
| | | | | | | | | | | | | | | | | | | | | | | | |
| Trade receivables | | | – | | | | – | | | | – | | | | 3 | | | | – | | | | 3 | |
| | | | | | | | | | | | | | | | | | | | | | | | |
| Securitizations (re-securitizations) | | | 2,313 | | | | 2,574 | | | | 4,887 | | | | 688 | | | | 31 | | | | 719 | |
| | | | | | | | | | | | | | | | | | | | | | | | |
| Other assets | | | 2,263 | | | | 5,659 | | | | 7,922 | | | | 1,768 | | | | 251 | | | | 2,019 | |
| | | | | | | | | | | | | | | | | | | | | | | | |
| Total securitization positions retained or purchased2 | | | 53,270 | | | | 24,374 | | | | 77,644 | | | | 6,445 | | | | 7,240 | | | | 13,685 | |
| |
| 1 | SMEs are small- or medium-sized entities. |
| 2 | For a regulatory assessment of our exposure to credit risk in relation to securitization activities see table “Banking Book Securitization Positions Retained or Purchased by Risk Weight Band” and table “Trading Book Securitization Positions Retained or Purchased by Risk Weight Band subject to the MRSA. |
On a year to year comparison, resulting from an active de-risking strategy pursued throughout the year 2012, the banking book securitization positions retained or purchased decreased across most exposure types. Retained or purchased securitization positions are reduced mainly in the exposure type “Loans to corporates or SMEs” following a termination and a regulatory de-recognition of single synthetic securitizations in 2012. Within the trading book, the significant reduction of securitized exposures from the exposure type “Loans to corporates or SMEs” is offset by increases from the exposure types “Commercial mortgages”, “Consumer loans” and “Securitizations” resulting in a slight overall increase.
Securitization Positions Retained or Purchased by Region
| | | | | | | | | | | | | | | | |
| | | Dec 31, 2012 | | | Dec 31, 2011 | |
in€ m. | | Banking Book | | | Trading Book | | | Banking Book | | | Trading Book | |
| Europe | | | 28,601 | | | | 3,699 | | | | 35,956 | | | | 2,526 | |
| | | | | | | | | | | | | | | | |
| Americas | | | 33,158 | | | | 9,198 | | | | 38,605 | | | | 10,149 | |
| | | | | | | | | | | | | | | | |
| Asia/Pacific | | | 3,616 | | | | 979 | | | | 3,031 | | | | 876 | |
| | | | | | | | | | | | | | | | |
| Other | | | 93 | | | | 221 | | | | 52 | | | | 134 | |
| | | | | | | | | | | | | | | | |
| Total securitization positions retained or purchased1 | | | 65,468 | | | | 14,097 | | | | 77,644 | | | | 13,685 | |
| |
| 1 | For a regulatory assessment of our exposure to credit risk in relation to securitization activities see table “Banking Book Securitization Positions Retained or Purchased by Risk Weight Band” and table “Trading Book Securitization Positions Retained or Purchased by Risk Weight Band subject to the MRSA”. |
The amounts shown in the table above are based on the country of domicile of the obligors of the exposures securitized. The aforementioned termination or regulatory de-recognition of synthetic securitizations resulted in a reduction in banking book securitization positions retained or purchased from across Europe and Americas which were partially offset by newly issued securitizations. In addition, decreases in exposures by€ 3.4 billion were attributed to sponsoring and investor activities respectively, again largely resulting from the management decision to reduce the overall size of securitization positions.
| | | | |
| Deutsche Bank | | 01 – Management Report | | 130 |
| Financial Report 2012 | | Risk Report | | |
| | |
| | | | |
| | |
| | | | |
Banking Book Securitization Exposure
Banking Book Securitization Positions Retained or Purchased in the regulatory banking book by Risk Weight Band
| | | | | | | | | | | | | | | | | | | | | | | | |
| | | Dec 31, 2012 | | | Dec 31, 2011 | |
in€ m. | | Exposure
amount | | | Capital
requirements
IRBA1 | | | Capital
requirements
standardized
approach | | | Exposure
amount | | | Capital
requirements
IRBA | | | Capital
requirements
standardized
approach | |
| £ 10 % | | | 40,929 | | | | 206 | | | | – | | | | 39,796 | | | | 180 | | | | – | |
| | | | | | | | | | | | | | | | | | | | | | | | |
| > 10£ 20 % | | | 5,900 | | | | 73 | | | | 14 | | | | 9,876 | | | | 118 | | | | – | |
| | | | | | | | | | | | | | | | | | | | | | | | |
| > 20£ 50 % | | | 9,816 | | | | 395 | | | | 20 | | | | 15,401 | | | | 386 | | | | 27 | |
| | | | | | | | | | | | | | | | | | | | | | | | |
| > 50£ 100 % | | | 3,666 | | | | 98 | | | | 75 | | | | 4,007 | | | | 222 | | | | 63 | |
| | | | | | | | | | | | | | | | | | | | | | | | |
| > 100£ 350 % | | | 1,167 | | | | 90 | | | | 8 | | | | 2,001 | | | | 208 | | | | 32 | |
| | | | | | | | | | | | | | | | | | | | | | | | |
| > 350£ 650 % | | | 364 | | | | 118 | | | | – | | | | 498 | | | | 142 | | | | 25 | |
| | | | | | | | | | | | | | | | | | | | | | | | |
| > 650 < 1250 % | | | 337 | | | | 86 | | | | – | | | | 179 | | | | 86 | | | | 10 | |
| | | | | | | | | | | | | | | | | | | | | | | | |
| 1250 %/Deduction | | | 3,289 | | | | 1,174 | | | | 94 | | | | 5,886 | | | | 2,894 | | | | 589 | |
| | | | | | | | | | | | | | | | | | | | | | | | |
| Total securitization positions retained or purchased | | | 65,468 | | | | 2,240 | | | | 211 | | | | 77,644 | | | | 4,236 | | | | 746 | |
| |
| 1 | After considering value adjustments according to Sections 253 (3) and 268 (2) SolvV. |
The amounts shown in the table above are prior to application of credit risk mitigation. Exposure reductions are observable in most risk weight bands following the de-risking strategy of the bank. The increase in the exposure amount in the risk weight band “> 650 < 1250 %” is mainly attributed to a downgrading of two securities. Exposures subject to capital deduction declined by 45 % as positions are either terminated, sold, restructured or externally rated BB- or better. Overall, the capital requirements for banking book securitizations were reduced by 51 %.
The largest portion for IRBA eligible banking book securitization exposures are either treated according to the Ratings Based Approach (“RBA”) or the Supervisory Formula Approach (“SFA”). For the remaining IRBA eligible banking book exposures we use the Internal Assessment Approach (“IAA”) predominantly for our ABCP sponsor activity.
Banking Book Securitization Positions Retained or Purchased by Risk Weight Bands subject to the IRBA-Rating Based Approach (RBA)
| | | | | | | | | | | | | | | | | | | | | | | | | | | | | | | | |
| | | Dec 31, 2012 | | | Dec 31, 2011 | |
| | | Exposure amount | | | Capital requirements,
IRBA-RBA1 | | | Exposure amount | | | Capital requirements,
IRBA-RBA1 | |
in€ m. | | Securi-
tization | | | Re-
Securitization | | | Securi-
tization | | | Re-
Securitization | | | Securi-
tization | | | Re-
Securitization | | | Securi-
tization | | | Re-
Securitization | |
| £10 % | | | 10,558 | | | | – | | | | 52 | | | | – | | | | 15,140 | | | | – | | | | 50 | | | | – | |
| | | | | | | | | | | | | | | | | | | | | | | | | | | | | | | | |
| > 10£ 20 % | | | 2,939 | | | | – | | | | 51 | | | | – | | | | 4,548 | | | | – | | | | 88 | | | | – | |
| | | | | | | | | | | | | | | | | | | | | | | | | | | | | | | | |
| > 20£ 50 % | | | 2,163 | | | | 3,545 | | | | 212 | | | | 96 | | | | 2,339 | | | | 3,975 | | | | 107 | | | | 102 | |
| | | | | | | | | | | | | | | | | | | | | | | | | | | | | | | | |
| > 50£ 100 % | | | 1,481 | | | | 610 | | | | 48 | | | | 26 | | | | 1,650 | | | | 162 | | | | 179 | | | | 2 | |
| | | | | | | | | | | | | | | | | | | | | | | | | | | | | | | | |
| > 100£ 350 % | | | 694 | | | | 159 | | | | 43 | | | | 20 | | | | 912 | | | | 356 | | | | 80 | | | | 52 | |
| | | | | | | | | | | | | | | | | | | | | | | | | | | | | | | | |
| > 350£ 650 % | | | 266 | | | | 79 | | | | 84 | | | | 27 | | | | 344 | | | | 84 | | | | 109 | | | | 29 | |
| | | | | | | | | | | | | | | | | | | | | | | | | | | | | | | | |
| > 650 < 1250 % | | | 278 | | | | 58 | | | | 53 | | | | 33 | | | | 35 | | | | 119 | | | | 18 | | | | 62 | |
| | | | | | | | | | | | | | | | | | | | | | | | | | | | | | | | |
| 1250 %/Deduction | | | 2,748 | | | | 294 | | | | 925 | | | | 127 | | | | 3,313 | | | | 1,791 | | | | 1,808 | | | | 933 | |
| | | | | | | | | | | | | | | | | | | | | | | | | | | | | | | | |
| Total securitization positions retained or purchased | | | 21,127 | | | | 4,745 | | | | 1,468 | | | | 329 | | | | 28,281 | | | | 6,487 | | | | 2,439 | | | | 1,180 | |
| |
| 1 | After considering value adjustments according to Sections 253 (3) and 268 (2) SolvV. Including capital requirements for maturity mismatch of synthetic securitizations. |
| | | | |
| Deutsche Bank | | 01 – Management Report | | 131 |
| Financial Report 2012 | | Risk Report | | |
| | |
| | | | |
| | |
| | | | |
Banking Book Securitization Positions Retained or Purchased by Risk Weight Band subject to the IRBA-Internal Assessment Approach (IAA)
| | | | | | | | | | | | | | | | | | | | | | | | | | | | | | | | |
| | | Dec 31, 2012 | | | Dec 31, 2011 | |
| | | Exposure amount | | | Capital requirements,
IRBA-IAA1 | | | Exposure amount | | | Capital requirements,
IRBA-IAA1 | |
in€ m. | | Securi-
tization | | | Re-
Securitization | | | Securi-
tization | | | Re-
Securitization | | | Securi-
tization | | | Re-
Securitization | | | Securi-
tization | | | Re-
Securitization | |
| £ 10 % | | | 4,948 | | | | – | | | | 31 | | | | – | | | | 5,752 | | | | – | | | | 35 | | | | – | |
| | | | | | | | | | | | | | | | | | | | | | | | | | | | | | | | |
| > 10£ 20 % | | | 1,783 | | | | – | | | | 18 | | | | – | | | | 1,878 | | | | – | | | | 19 | | | | – | |
| | | | | | | | | | | | | | | | | | | | | | | | | | | | | | | | |
| > 20£ 50 % | | | 2,291 | | | | 1,093 | | | | 52 | | | | 32 | | | | 2,785 | | | | 1,828 | | | | 78 | | | | 54 | |
| | | | | | | | | | | | | | | | | | | | | | | | | | | | | | | | |
| > 50£ 100 % | | | 191 | | | | 119 | | | | 12 | | | | 5 | | | | 225 | | | | 427 | | | | 13 | | | | 21 | |
| | | | | | | | | | | | | | | | | | | | | | | | | | | | | | | | |
| > 100£ 350 % | | | 17 | | | | 80 | | | | 1 | | | | 10 | | | | 237 | | | | 276 | | | | 45 | | | | 30 | |
| | | | | | | | | | | | | | | | | | | | | | | | | | | | | | | | |
| > 350£ 650 % | | | – | | | | 4 | | | | – | | | | 2 | | | | – | | | | – | | | | – | | | | – | |
| | | | | | | | | | | | | | | | | | | | | | | | | | | | | | | | |
| > 650 < 1250 % | | | – | | | | – | | | | – | | | | – | | | | – | | | | – | | | | – | | | | – | |
| | | | | | | | | | | | | | | | | | | | | | | | | | | | | | | | |
| 1250 %/Deduction | | | 20 | | | | – | | | | 20 | | | | – | | | | – | | | | 135 | | | | – | | | | 135 | |
| | | | | | | | | | | | | | | | | | | | | | | | | | | | | | | | |
| Total securitization positions retained or purchased | | | 9,250 | | | | 1,296 | | | | 134 | | | | 49 | | | | 10,877 | | | | 2,666 | | | | 190 | | | | 240 | |
| |
| 1 | After considering value adjustments according to Sections 253 (3) and 268 (2) SolvV. |
Banking Book Securitization Positions Retained or Purchased by Risk Weight Band subject to the IRBA-Supervisory Formular Approach (SFA)
| | | | | | | | | | | | | | | | | | | | | | | | | | | | | | | | |
| | | Dec 31, 2012 | | | Dec 31, 2011 | |
| | | Exposure amount | | | Capital requirements,
IRBA-SFA1 | | | Exposure amount | | | Capital requirements,
IRBA-SFA1 | |
in€ m. | | Securi-
tization | | | Re-
Securitization | | | Securi-
tization | | | Re-
Securitization | | | Securi-
tization | | | Re-
Securitization | | | Securi-
tization | | | Re-
Securitization | |
| £ 10 % | | | 25,423 | | | | – | | | | 123 | | | | – | | | | 18,904 | | | | – | | | | 95 | | | | – | |
| | | | | | | | | | | | | | | | | | | | | | | | | | | | | | | | |
| > 10£ 20 % | | | 340 | | | | – | | | | 4 | | | | – | | | | 809 | | | | – | | | | 10 | | | | – | |
| | | | | | | | | | | | | | | | | | | | | | | | | | | | | | | | |
| > 20£ 50 % | | | 165 | | | | – | | | | 4 | | | | – | | | | 2,813 | | | | – | | | | 46 | | | | – | |
| | | | | | | | | | | | | | | | | | | | | | | | | | | | | | | | |
| > 50£ 100 % | | | 130 | | | | – | | | | 7 | | | | – | | | | 123 | | | | – | | | | 6 | | | | – | |
| | | | | | | | | | | | | | | | | | | | | | | | | | | | | | | | |
| > 100£ 350 % | | | 127 | | | | – | | | | 15 | | | | – | | | | 4 | | | | – | | | | 1 | | | | – | |
| | | | | | | | | | | | | | | | | | | | | | | | | | | | | | | | |
| > 350£ 650 % | | | 13 | | | | – | | | | 5 | | | | – | | | | 12 | | | | – | | | | 5 | | | | – | |
| | | | | | | | | | | | | | | | | | | | | | | | | | | | | | | | |
| > 650 < 1250 % | | | 1 | | | | – | | | | 1 | | | | – | | | | 11 | | | | – | | | | 6 | | | | – | |
| | | | | | | | | | | | | | | | | | | | | | | | | | | | | | | | |
| 1250 %/Deduction | | | 70 | | | | 62 | | | | 40 | | | | 62 | | | | 58 | | | | – | | | | 17 | | | | – | |
| | | | | | | | | | | | | | | | | | | | | | | | | | | | | | | | |
| Total securitization positions retained or purchased | | | 26,269 | | | | 62 | | | | 199 | | | | 62 | | | | 22,734 | | | | – | | | | 186 | | | | – | |
| |
| 1 | After considering value adjustments according to Sections 253 (3) and 268 (2) SolvV. |
The Credit Risk Standardized Approach (“CRSA”) is used for securitization positions where the underlying portfolio predominantly concerns credit risk exposures, which would qualify for application of the CRSA if these exposures would be directly held by us.
Banking Book Securitization Positions Retained or Purchased by Risk Weight Band subject to the Credit Risk Standardized Approach (CRSA)
| | | | | | | | | | | | | | | | | | | | | | | | | | | | | | | | |
| | | Dec 31, 2012 | | | Dec 31, 2011 | |
| | | Exposure amount | | | Capital requirements,
SA | | | Exposure amount | | | Capital requirements,
SA | |
in€ m. | | Securi-
tization | | | Re-
Securitization | | | Securi-
tization | | | Re-
Securitization | | | Securi-
tization | | | Re-
Securitization | | | Securi-
tization | | | Re-
Securitization | |
| £ 10 % | | | – | | | | – | | | | – | | | | – | | | | – | | | | – | | | | – | | | | – | |
| | | | | | | | | | | | | | | | | | | | | | | | | | | | | | | | |
| > 10£ 20 % | | | 839 | | | | – | | | | 13 | | | | – | | | | 2,641 | | | | – | | | | – | | | | – | |
| | | | | | | | | | | | | | | | | | | | | | | | | | | | | | | | |
| > 20£ 50 % | | �� | 295 | | | | 263 | | | | 12 | | | | 8 | | | | 1,385 | | | | 276 | | | | 18 | | | | 9 | |
| | | | | | | | | | | | | | | | | | | | | | | | | | | | | | | | |
| > 50£ 100 % | | | 1,137 | | | | – | | | | 75 | | | | – | | | | 1,420 | | | | – | | | | 63 | | | | – | |
| | | | | | | | | | | | | | | | | | | | | | | | | | | | | | | | |
| > 100£ 350 % | | | 91 | | | | – | | | | 8 | | | | – | | | | 218 | | | | – | | | | 33 | | | | – | |
| | | | | | | | | | | | | | | | | | | | | | | | | | | | | | | | |
| > 350£ 650 % | | | 1 | | | | – | | | | 0 | | | | – | | | | 1 | | | | 55 | | | | – | | | | 24 | |
| | | | | | | | | | | | | | | | | | | | | | | | | | | | | | | | |
| > 650 < 1250 % | | | – | | | | – | | | | – | | | | – | | | | – | | | | 14 | | | | – | | | | 10 | |
| | | | | | | | | | | | | | | | | | | | | | | | | | | | | | | | |
| 1250 %/Deduction | | | 25 | | | | 69 | | | | 25 | | | | 69 | | | | 589 | | | | – | | | | 589 | | | | – | |
| | | | | | | | | | | | | | | | | | | | | | | | | | | | | | | | |
| Total securitization positions retained or purchased | | | 2,388 | | | | 332 | | | | 133 | | | | 77 | | | | 6,254 | | | | 345 | | | | 703 | | | | 43 | |
| |
| | | | |
| Deutsche Bank | | 01 – Management Report | | 132 |
| Financial Report 2012 | | Risk Report | | |
| | |
| | | | |
| | |
| | | | |
Trading Book Securitization Exposure
For trading book securitization positions not assigned to the correlation trading portfolio, the capital requirement for specific market risk is calculated based on the MRSA. The MRSA risk weight calculation for trading book securitization positions is generally based on the same methodologies which apply to banking book securitization positions. More details on this approach are provided in Section “Regulatory Securitization Framework” as well as in Section “Trading Market Risk”.
Trading Book Securitization Positions Retained or Purchased by Risk Weight Band subject to the Market Risk Standardized Approach (“MRSA”)
| | | | | | | | | | | | | | | | | | | | | | | | | | | | | | | | |
| | | Dec 31, 2012 | | | Dec 31, 2011 | |
| | | Exposure amount | | | Capital requirements,
MRSA | | | Exposure amount | | | Capital requirements,
MRSA | |
in€ m. | | Securi-
tization | | | Re-
Securitization | | | Securi-
tization | | | Re-
Securitization | | | Securi-
tization | | | Re-
Securitization | | | Securi-
tization | | | Re-
Securitization | |
£ 10 % | | | 5,298 | | | | – | | | | 30 | | | | – | | | | 6,292 | | | | – | | | | 36 | | | | – | |
| | | | | | | | | | | | | | | | | | | | | | | | | | | | | | | | |
> 10 £ 20 % | | | 4,637 | | | | – | | | | 53 | | | | – | | | | 1,541 | | | | – | | | | 20 | | | | – | |
| | | | | | | | | | | | | | | | | | | | | | | | | | | | | | | | |
> 20 £ 50 % | | | 1,175 | | | | 309 | | | | 28 | | | | 10 | | | | 1,895 | | | | 149 | | | | 44 | | | | 5 | |
| | | | | | | | | | | | | | | | | | | | | | | | | | | | | | | | |
> 50 £ 100 % | | | 958 | | | | 170 | | | | 61 | | | | 12 | | | | 733 | | | | 29 | | | | 48 | | | | 2 | |
| | | | | | | | | | | | | | | | | | | | | | | | | | | | | | | | |
> 100 £ 350 % | | | 494 | | | | 80 | | | | 72 | | | | 12 | | | | 346 | | | | 121 | | | | 62 | | | | 20 | |
| | | | | | | | | | | | | | | | | | | | | | | | | | | | | | | | |
> 350 £ 650 % | | | 182 | | | | 33 | | | | 68 | | | | 14 | | | | 166 | | | | 77 | | | | 61 | | | | 34 | |
| | | | | | | | | | | | | | | | | | | | | | | | | | | | | | | | |
> 650 < 1250 % | | | 102 | | | | 21 | | | | 56 | | | | 12 | | | | 61 | | | | 32 | | | | 34 | | | | 19 | |
| | | | | | | | | | | | | | | | | | | | | | | | | | | | | | | | |
1250 %/Deduction | | | 392 | | | | 245 | | | | 392 | | | | 245 | | | | 1,571 | | | | 672 | | | | 1,571 | | | | 672 | |
| | | | | | | | | | | | | | | | | | | | | | | | | | | | | | | | |
| Total securitization positions retained or purchased | | | 13,239 | | | | 858 | | | | 761 | | | | 305 | | | | 12,605 | | | | 1,080 | | | | 1,876 | | | | 752 | |
| |
Re-securitization Positions
Trading book re-securitization exposure is reduced by 71 % as a result of hedging being recognized according to section 299 SolvV.
Re-Securitization Positions Retained or Purchased
| | | | | | | | | | | | | | | | | | | | | | | | | | | | | | | | |
| | | Dec 31, 2012 | | | Dec 31, 2011 | |
| | | Banking Book | | | Trading Book | | | Banking Book | | | Trading Book | |
| | | Exposure amount | | | Exposure amount | | | Exposure amount | | | Exposure amount | |
in€ m. | | Before
hedging/
insurances | | | After
hedging/
insurances | | | Before
hedging/
insurances | | | After
hedging/
insurances | | | Before
hedging/
insurances | | | After
hedging/
insurances | | | Before
hedging/
insurances | | | After
hedging/
insurances | |
| Re-Securitization Positions | | | 6,435 | | | | 6,434 | | | | 2,910 | | | | 858 | | | | 9,498 | | | | 9,498 | | | | 3,340 | | | | 1,080 | |
| |
Risk mitigation in the form of financial guarantees has not been applied to our re-securitization positions in either the banking or the trading book.
Securitization Activities
The 2012 yearend amounts in the tables below show an increase in 2012 of our securitization sponsor activity compared to 2011. The new activities are dominated by two transactions outside of our conduit business. Their associated exposures securitized are higher than the renewal of support for existing ABCP conduit transactions where we act as a sponsor. An increase as of year-end 2012 of our securitization originator activity predominately concerned the exposure type “Loans to corporates or SMEs” dominated by the synthetic transactions executed by the Credit Portfolio Strategies Group (CPSG) as well as one new securitization transaction within our Global Transaction Banking.
| | | | |
| Deutsche Bank | | 01 – Management Report | | 133 |
| Financial Report 2012 | | Risk Report | | |
| | |
| | | | |
| | |
| | | | |
Securitization Activity – Total Outstanding Exposures Securitized (i.e., the underlying pools) by Exposure Type within the Banking Book
| | | | | | | | | | | | | | | | | | | | |
| | | Originator | | | Sponsor | |
| | | Dec 31, 2012 | | | 2012 | | | Dec 31, 2012 | |
| | | | | | | | |
in€ m. | | Traditional | | | Synthetic | | | Realized
gains (losses)
from sales/
liquidations | | | Traditional | | | Synthetic | |
Residential mortgages | | | – | | | | – | | | | – | | | | – | | | | – | |
| | | | | | | | | | | | | | | | | | | | |
Commercial mortgages | | | 260 | | | | – | | | | 1 | | | | 1,416 | | | | – | |
| | | | | | | | | | | | | | | | | | | | |
Credit card receivables | | | – | | | | – | | | | – | | | | – | | | | – | |
| | | | | | | | | | | | | | | | | | | | |
Leasing | | | – | | | | – | | | | – | | | | 234 | | | | – | |
| | | | | | | | | | | | | | | | | | | | |
| Loans to corporates or SMEs (treated as corporates)1 | | | 108 | | | | 3,566 | | | | – | | | | 1,460 | | | | – | |
| | | | | | | | | | | | | | | | | | | | |
Consumer loans | | | – | | | | – | | | | – | | | | 251 | | | | – | |
| | | | | | | | | | | | | | | | | | | | |
Trade receivables | | | – | | | | – | | | | – | | | | – | | | | – | |
| | | | | | | | | | | | | | | | | | | | |
Securitizations (re-securitizations) | | | – | | | | 590 | | | | – | | | | 2,107 | | | | – | |
| | | | | | | | | | | | | | | | | | | | |
Other assets2 | | | – | | | | – | | | | – | | | | 702 | | | | – | |
| | | | | | | | | | | | | | | | | | | | |
| Total Outstanding Exposures Securitized3 | | | 368 | | | | 4,156 | | | | 1 | | | | 6,170 | | | | – | |
| |
| 1 | SMEs are small- or medium-sized entities. |
| 2 | Excludes a restructuring activity as Sponsor where one security was transferred between two of our conduits. Respective Outstanding Exposure Securitized of this security is reported in table “Outstanding Exposures Securitized by Exposure Type (Overall Pool Size) within the Banking Book”. |
| 3 | For a regulatory assessment of our exposure to credit risk in relation to securitization activity in the banking book see table “Banking Book Securitization Positions Retained or Purchased by Risk Weight Band”. |
| | | | | | | | | | | | | | | | | | | | |
| | | Originator | | | Sponsor1 | |
| | | Dec 31, 2011 | | | 2011 | | | Dec 31, 2011 | |
| | | | | | | | |
in€ m. | | Traditional | | | Synthetic | | | Realized
gains (losses)
from sales/
liquidations | | | Traditional | | | Synthetic | |
Residential mortgages | | | – | | | | – | | | | – | | | | 1,339 | | | | – | |
| | | | | | | | | | | | | | | | | | | | |
Commercial mortgages | | | 968 | | | | – | | | | 27 | | | | 1,650 | | | | – | |
| | | | | | | | | | | | | | | | | | | | |
Credit card receivables | | | – | | | | – | | | | – | | | | 173 | | | | – | |
| | | | | | | | | | | | | | | | | | | | |
Leasing | | | – | | | | – | | | | – | | | | 751 | | | | – | |
| | | | | | | | | | | | | | | | | | | | |
| Loans to corporates or SMEs (treated as corporates)2 | | | – | | | | 2,996 | | | | – | | | | 209 | | | | – | |
| | | | | | | | | | | | | | | | | | | | |
Consumer loans | | | – | | | | – | | | | – | | | | 214 | | | | – | |
| | | | | | | | | | | | | | | | | | | | |
Trade receivables | | | – | | | | – | | | | – | | | | – | | | | – | |
| | | | | | | | | | | | | | | | | | | | |
Securitizations (re-securitizations) | | | – | | | | – | | | | – | | | | – | | | | – | |
| | | | | | | | | | | | | | | | | | | | |
Other assets | | | – | | | | – | | | | – | | | | 299 | | | | – | |
| | | | | | | | | | | | | | | | | | | | |
| Total Outstanding Exposures Securitized3 | | | 968 | | | | 2,996 | | | | 27 | | | | 4,635 | | | | – | |
| |
| 1 | Included under “Sponsor” is the amount€ 1.6 billion exposures securitized, of which we originated€ 0.6 billion, also included under “Originator”. |
| 2 | SMEs are small- or medium-sized entities. |
| 3 | For a regulatory assessment of our exposure to credit risk in relation to securitization activity in the banking book see table “Banking Book Securitization Positions Retained or Purchased by Risk Weight Band”. |
The main increase of the 2012 yearend amounts compared to 2011 in the tables below for securitization originator activity resulted from one synthetic single tranche CDO contract comprising outstanding exposures securitized of€13 billion.
| | | | |
| Deutsche Bank | | 01 – Management Report | | 134 |
| Financial Report 2012 | | Risk Report | | |
| | |
| | | | |
| | |
| | | | |
Securitization Activity – Total Outstanding Exposures Securitized by Exposure Type within the Trading Book
| | | | | | | | | | | | | | | | | | | | |
| | | Originator | | | Sponsor1 | |
| | | Dec 31, 2012 | | | 2012 | | | Dec 31, 2012 | |
in€ m. | | Traditional | | | Synthetic | | | Realized
gains (losses)
from sales/
liquidations | | | Traditional | | | Synthetic | |
| Residential mortgages | | | – | | | | – | | | | – | | | | 2,115 | | | | – | |
| | | | | | | | | | | | | | | | | | | | |
| Commercial mortgages | | | 3,908 | | | | – | | | | 170 | | | | 6,823 | | | | – | |
| | | | | | | | | | | | | | | | | | | | |
| Credit card receivables | | | – | | | | – | | | | – | | | | – | | | | – | |
| | | | | | | | | | | | | | | | | | | | |
| Leasing | | | – | | | | – | | | | – | | | | – | | | | – | |
| | | | | | | | | | | | | | | | | | | | |
| Loans to corporates or SMEs (treated as corporates)2 | | | – | | | | 16,284 | | | | – | | | | – | | | | – | |
| | | | | | | | | | | | | | | | | | | | |
| Consumer loans | | | – | | | | – | | | | – | | | | – | | | | – | |
| | | | | | | | | | | | | | | | | | | | |
| Trade receivables | | | – | | | | – | | | | – | | | | – | | | | – | |
| | | | | | | | | | | | | | | | | | | | |
| Securitizations (re-securitizations) | | | 1,033 | | | | – | | | | 85 | | | | – | | | | – | |
| | | | | | | | | | | | | | | | | | | | |
| Other assets | | | – | | | | – | | | | – | | | | – | | | | – | |
| | | | | | | | | | | | | | | | | | | | |
| Total Outstanding Exposures Securitized3 | | | 4,941 | | | | 16,284 | | | | 255 | | | | 8,938 | | | | – | |
| |
| 1 | Included under “Sponsor” is the amount€ 7 billion exposures securitized, of which we originated€ 3 billion, also included under “Originator”. |
| 2 | SMEs are small- or medium-sized entities. |
| 3 | For a regulatory assessment of our exposure to credit risk in relation to securitization activity in the trading book see table “Trading Book Securitization Positions Retained or Purchased by Risk Weight Band subject to the MRSA”. |
| | | | | | | | | | | | | | | | | | | | |
| | | Originator | | | Sponsor1 | |
| | | Dec 31, 2011 | | | 2011 | | | Dec 31, 2011 | |
in€ m. | | Traditional | | | Synthetic | | | Realized
gains (losses)
from sales/
liquidations | | | Traditional | | | Synthetic | |
| Residential mortgages | | | – | | | | – | | | | – | | | | 2,247 | | | | – | |
| | | | | | | | | | | | | | | | | | | | |
| Commercial mortgages | | | 3,193 | | | | – | | | | 95 | | | | 4,088 | | | | – | |
| | | | | | | | | | | | | | | | | | | | |
| Credit card receivables | | | – | | | | – | | | | – | | | | – | | | | – | |
| | | | | | | | | | | | | | | | | | | | |
| Leasing | | | – | | | | – | | | | – | | | | – | | | | – | |
| | | | | | | | | | | | | | | | | | | | |
| Loans to corporates or SMEs (treated as corporates)2 | | | – | | | | 2,660 | | | | – | | | | – | | | | – | |
| | | | | | | | | | | | | | | | | | | | |
| Consumer loans | | | – | | | | – | | | | – | | | | – | | | | – | |
| | | | | | | | | | | | | | | | | | | | |
| Trade receivables | | | – | | | | – | | | | – | | | | – | | | | – | |
| | | | | | | | | | | | | | | | | | | | |
| Securitizations (re-securitizations) | | | – | | | | – | | | | – | | | | – | | | | – | |
| | | | | | | | | | | | | | | | | | | | |
| Other assets | | | – | | | | – | | | | – | | | | – | | | | – | |
| | | | | | | | | | | | | | | | | | | | |
| Total Outstanding Exposures Securitized3 | | | 3,193 | | | | 2,660 | | | | 95 | | | | 6,335 | | | | – | |
| |
| 1 | Included under “Sponsor” is the amount€ 4.1 billion exposures securitized, of which we originated€ 1.7 billion, also included under “Originator”. |
| 2 | SMEs are small- or medium-sized entities. |
| 3 | For a regulatory assessment of our exposure to credit risk in relation to securitization activity in the trading book see table “Trading Book Securitization Positions Retained or Purchased by Risk Weight Band subject to the MRSA”. |
| | | | |
| | | | | |
| | | Trading Market Risk The vast majority of our businesses are subject to market risk, defined as the potential for change in the market value of our trading and investing positions. Risk can arise from adverse changes in interest rates, credit spreads, foreign exchange rates, equity prices, commodity prices and other relevant parameters, such as market volatility and market implied default probabilities. The primary objective of Market Risk Management, a part of our independent Risk function, is to ensure that our business units optimize the risk-reward relationship and do not expose us to unacceptable losses outside of our risk appetite. To achieve this objective, Market Risk Management works closely together with risk takers (“the business units”) and other control and support groups. We distinguish between three substantially different types of market risk: |
| | | |
| | | — | | Trading market risk arises primarily through the market-making activities of the CB&S Division. This involves taking positions in debt, equity, foreign exchange, other securities and commodities as well as in equivalent derivatives. |
| | | — | | Traded default risk arising from defaults and rating migrations relating to trading instruments. |
| | | — | | Nontrading market risk arises from market movements, primarily outside the activities of our trading units, in our banking book and from off-balance sheet items. This includes interest rate risk, credit spread risk, investment risk and foreign exchange risk as well as market risk arising from our pension schemes, guaranteed funds and equity compensation. Nontrading market risk also includes risk from the modeling of client deposits as well as savings and loan products. |
| | | | |
| Deutsche Bank | | 01 – Management Report | | 135 |
| Financial Report 2012 | | Risk Report | | |
| | |
| | | | |
| | |
| | | | |
Trading Market Risk Management Framework
Market Risk Management governance is designed and established to ensure oversight of all market risks, including trading market risk, traded default risk and nontrading market risk, effective decision-making and timely escalation to senior management.
Market Risk Management defines and implements a framework to systematically identify, assess, monitor and report our market risk and supports management and mitigation. Market risk managers identify existing and potential future market risks through active portfolio analysis and engagement with the business areas.
Market Risk Measurement and Assessment
Market Risk Management aims to accurately measure all types of market risks by a comprehensive set of risk metrics reflecting economic and regulatory requirements.
In accordance with economic and regulatory requirements, we measure market and related risks by thirteen key risk metrics:
| — | | Value-at-risk and stressed value-at-risk |
| — | | Three metrics for specific risks: Incremental Risk Charge, Comprehensive Risk Measure, and Market Risk Standardised Approach (MRSA) |
| — | | Three types of stress tests: Portfolio Stress Testing, business-level stress testing, and event risk scenarios |
| — | | Market Risk economic capital, including traded default risk |
| — | | Market value/Notional (concentration risk) |
These measures are viewed as complementary to each other and in aggregate define the Market Risk framework, by which all businesses can be measured and monitored.
Market Risk Monitoring
Our primary instrument to manage trading market risk is the application of our limit framework. Our Management Board supported by Market Risk Management, sets group-wide value-at-risk, economic capital and portfolio stress testing (extreme) limits for market risk in the trading book. Market Risk Management sub-allocates this overall limit to our Corporate Divisions and individual business units within CB&S (e.g. Global Rates and Credit, Equity, etc.) based on anticipated business plans and risk appetite. Within the individual business units, the business heads establish business limits, by allocating the limit down to individual portfolios or geographical regions.
In practice, Market Risk Management sets key limits, which tend to be global in nature, to capture an exposure to a particular risk factor. Business limits are specific to various factors, including a particular geographical region or specific portfolio.
Value-at-risk, stressed value-at-risk and economic capital limits are used for managing all types of market risk at an overall portfolio level. As an additional and complementary tool for managing certain portfolios or risk types, Market Risk Management performs risk analysis and stress testing. Limits are also set on sensitivity and concentration/liquidity, portfolio stress tests, business-level stress testing and event risk scenarios.
| | | | |
| Deutsche Bank | | 01 – Management Report | | 136 |
| Financial Report 2012 | | Risk Report | | |
| | |
| | | | |
| | |
| | | | |
| | | | |
| | | Business units are responsible for adhering to the limits against which exposures are monitored and reported. The market risk limits set by Market Risk Management are monitored on a daily, weekly and monthly basis. Where limits are exceeded, Market Risk Management is responsible for identifying and escalating those excesses on a timely basis. To manage the exposures inside the limits, the business units apply several risk mitigating measures, most notably the use of: |
| | | — | | Portfolio management: Risk diversification arises in portfolios which consist of a variety of positions. Since some investments are likely to rise in value when others decline, diversification can help to lower the overall level of risk profile of a portfolio. |
| | | — | | Hedging: Hedging involves taking positions in related financial assets, such as futures and swaps, and includes derivative products, such as futures, swaps and options. Hedging activities may not always provide effective mitigation against losses due to differences in the terms, specific characteristics or other basis risks that may exist between the hedge instrument and the exposure being hedged. |
| | Market Risk Reporting Market Risk Management reporting creates transparency on the risk profile and facilitates the understanding of core market risk drivers to all levels of the organization. The Management Board and Senior Governance Committees receive regular reporting, as well as ad hoc reporting as required, on market risk, regulatory capital and stress testing. Senior Risk Committees receive risk information at a number of frequencies, including weekly or monthly. Additionally, Market Risk Management produces daily and weekly Market Risk specific reports and daily limit excess reports for each asset class. |
| | | | | |
| | | Market Risk Measurement Value-at-Risk at Deutsche Bank Group (excluding Postbank) Value-at-risk is a quantitative measure of the potential loss (in value) of trading positions due to market movements that will not be exceeded in a defined period of time and with a defined confidence level. Our value-at-risk for the trading businesses is based on our own internal model. In October 1998, the German Banking Supervisory Authority (now the BaFin) approved our internal value-at-risk model for calculating the regulatory market risk capital for our general and specific market risks. Since then the model has been continually refined and approval has been maintained. We calculate value-at-risk using a 99 % confidence level and a one day holding period. This means we estimate there is a 1 in 100 chance that a mark-to-market loss from our trading positions will be at least as large as the reported value-at-risk. For regulatory purposes, the holding period is ten days. We use one year of historical market data to calculate value-at-risk. The calculation employs a Monte Carlo Simulation technique, and we assume that changes in risk factors follow a well-defined distribution, e.g. normal, lognormal, or non-normal (t, skew-t, Skew-Normal). To determine our aggregated value-at-risk, we use observed correlations between the risk factors during this one year period. Our value-at-risk model is designed to take into account a comprehensive set of risk factors across all asset classes. Key risk factors are swap/government curves, index and issuer-specific credit curves, funding spreads, single equity and index prices, foreign exchange rates, commodity prices as well as their implied volatilities. To ensure completeness in the risk coverage also second order risk factors, e.g. CDS index vs. constituent basis, money market basis, implied dividends, option-adjusted spreads and precious metals lease rates are considered in the value-at-risk calculation. |
| | | | |
| Deutsche Bank | | 01 – Management Report | | 137 |
| Financial Report 2012 | | Risk Report | | |
| | |
| | | | |
| | |
| | | | |
For each business unit a separate value-at-risk is calculated for each risk class, e.g. interest rate, equity, foreign exchange and commodity. For each risk class this is achieved by assigning the sensitivities to the relevant risk class and then simulating changes in the associated risk drivers. Diversification effect reflects the fact that the total value-at-risk on a given day will be lower than the sum of the value-at-risk relating to the individual risk classes. Simply adding the value-at-risk figures of the individual risk classes to arrive at an aggregate value-at-risk would imply the assumption that the losses in all risk categories occur simultaneously.
The model incorporates both linear and, especially for derivatives, nonlinear effects through a combination of sensitivity-based and full revaluation approach on a fixed price-implied volatility grid.
The value-at-risk measure enables us to apply a consistent measure across all of our trading businesses and products. It allows a comparison of risk in different businesses, and also provides a means of aggregating and netting positions within a portfolio to reflect correlations and offsets between different asset classes. Furthermore, it facilitates comparisons of our market risk both over time and against our daily trading results.
When using value-at-risk estimates a number of considerations should be taken into account. These include:
| — | | The use of historical market data may not be a good indicator of potential future events, particularly those that are extreme in nature. This “backward-looking” limitation can cause value-at-risk to understate risk (as in 2008), but can also cause it to be overstated. |
| — | | Assumptions concerning the distribution of changes in risk factors, and the correlation between different risk factors, may not hold true, particularly during market events that are extreme in nature. The one day holding period does not fully capture the market risk arising during periods of illiquidity, when positions cannot be closed out or hedged within one day. |
| — | | Value-at-risk does not indicate the potential loss beyond the 99th quantile. |
| — | | Intra-day risk is not captured. |
| — | | There may be risks in the trading book that are partially or not captured by the value-at-risk model. |
We are committed to the ongoing development of our proprietary risk models, and we allocate substantial resources to reviewing and improving them. Additionally, we have further developed and improved our process of systematically capturing and evaluating risks currently not captured in our value-at-risk model. An assessment is made to determine the level of materiality of these risks and material risks are prioritized for inclusion in our internal model. All risks-not-in-VaR are monitored and assessed on a regular basis.
During 2012, improvements were made to the value-at-risk calculation, with the inclusion of following risks in our internal model:
| — | | Sovereign CDS quanto basis; |
| — | | Cash-derivatives basis for Agency RMBS; and |
| — | | Precious metals lease rate basis. |
Additionally, market data granularity was increased further by:
| — | | number of issuer specific credit spread curves and number of issuer-specific equity prices to improve accuracy; |
| — | | proxy funding spreads per region to extend coverage for CDS-bond basis; |
| — | | extended coverage for index basis time series to include on/off-the-run index basis; and |
| — | | CDS-based credit spread benchmarks to improve modeling of CDS-Bond basis. |
Finally, an additional methodology refinement was introduced to capture full correlation within the credit specific risk model.
| | | | |
| Deutsche Bank | | 01 – Management Report | | 138 |
| Financial Report 2012 | | Risk Report | | |
| | |
| | | | |
| | |
| | | | |
We continually analyze potential weaknesses of our value-at-risk model using statistical techniques, such as backtesting, and also rely on risk management experience. We compare the daily profits and losses under the buy-and-hold assumption (in accordance with German regulatory requirements) with the estimates from our value-at-risk model. In addition to the standard backtesting analysis at the value-at-risk quantile, the value-at-risk model performance is further verified by analyzing the distributional fit across the whole of the distribution (full distribution backtesting).
The Global Backtesting Committee, with participation from Market Risk Management, Market Risk Operations, Risk Analytics and Instruments, and Finance, meets on a regular basis to review backtesting results as a whole and of individual businesses. The committee analyzes performance fluctuations and assesses the predictive power of our value-at-risk model, which allows us to improve and adjust the risk estimation process accordingly.
An independent model validation team reviews all quantitative aspects of our value-at-risk model on a regular basis. The review covers, but is not limited to, the appropriateness of distribution assumptions of risk factors, recalibration approaches for risk parameters, and model assumptions. Validation results and remediation measures are presented to senior management and are tracked to ensure adherence to deadlines.
Holistic VaR Validation process
The Holistic VaR Validation (HVV) process ensures continuous controls around value-at-risk by providing a comprehensive top-down assessment of the value-at-risk model and framework across five control areas: Limits, Backtesting, Process, Model Validation, and Risks-not-in-VaR. HVV runs on a quarterly basis and provides a detailed report for each of the control areas (HVV Control Packs) as well as an HVV Dashboard indicating the health of each control area. In addition the Quarterly Business Line Review (QBLR) provides an overview of the business line trading strategy and the corresponding risk return profile. The associated formal quarterly HVV governance framework is as follows:
| — | | Level 1: A series of asset-class level HVV Control Pack Review meetings (chaired by the respective Market Risk Management Asset Class Head), at which the HVV Control Pack is reviewed and the HVV Dashboard status is agreed |
| — | | Level 2: The HVV Governance Committee (chaired by the Global Head of Market Risk Management), at which the QBLRs are presented and the overall HVV Dashboard is agreed |
| — | | Level 3: Top-level HVV governance is achieved via a series of senior management briefings including to the CB&S Executive Committee, the Capital and Risk Committee, the Management Board and the Supervisory Board. The briefings provide an executive summary of the quality and control of value-at-risk across the business, an overview of the CB&S business trading strategy and the corresponding risk management strategy. |
On December 20, 2012, the BaFin reduced our value-at-risk multiplier and stressed value-at-risk multiplier from 5.5 to 4.0. The key factor in the reduction of the multiplier was the implementation of the new HVV process.
Market Risk Stress Testing
Stress testing is a key risk management technique, which evaluates the potential effects of extreme market events and extreme movements in individual risk factors. It is one of the core quantitative tools used to assess the market risk of Deutsche Bank’s positions and its primary application is within our economic capital framework. The scenario-based approach in stress testing is complementary to statistical model approaches, such as value-at-risk. Market Risk Management performs several types of stress testing to capture the variety of risks: portfolio stress testing, individual business-level stress tests, event risk scenarios, and group-wide stress testing.
Portfolio stress testing measures the profit and loss impact of potential market events based on pre-defined scenarios, which are either historical or hypothetical and defined at a macro level. A set of common shocks and business-specific stress tests is applied to all trading books and at different severity levels. With portfolio stress
| | | | |
| Deutsche Bank | | 01 – Management Report | | 139 |
| Financial Report 2012 | | Risk Report | | |
| | |
| | | | |
| | |
| | | | |
testing, Market Risk Management completes its perspective on risk provided by other metrics, given that the range of portfolio stress tests fills the gap between the most extreme scenarios (economic capital) and potential daily losses (value-at-risk). Besides several dynamic scenarios, we have three static scenarios, which are calculated and monitored on a weekly basis.
For individual business-level stress tests, market risk managers identify relevant risk factors and develop realistic and credible stress scenarios relating either to macro-economic or business-specific developments. Business-level stress tests capture idiosyncratic and basis risks.
Event risk scenario measures the profit and loss impact of historically observable events of hypothetical situations on trading positions for specific emerging market countries and regions. The entire bank’s exposure to an individual country is stressed under a single scenario, which replicates market movements across that country in times of significant market crisis and reduced liquidity.
Besides these market-risk specific stress test, Market Risk Management participates in group-wide stress testing, where macro-economic scenarios are defined and translated into simultaneous stresses of the underlying risk drivers. This includes credit, market and operational risks. Results are reviewed by the Stress Testing Oversight Committee.
Tail risk or the potential for extreme loss events beyond reported value-at risk is captured via stressed value-at-risk, economic capital, incremental risk charge and comprehensive risk measure. It is also captured via stress testing.
Basel 2.5 Trading Market Risk Requirements
In December 2011 we received model approvals, from the BaFin, for the stressed value-at-risk, incremental risk charge and comprehensive risk measure models. These are additional methods we use to measure market risk exposures.
| — | | Stressed value-at-risk: calculates a stressed value-at-risk measure based on a continuous 1 year period of significant market stress. |
| — | | Incremental Risk Charge: captures default and credit migration risks in addition to the risks already captured in value-at-risk for credit-sensitive positions in the trading book. |
| — | | Comprehensive Risk Measure: captures incremental risk for the credit correlation trading portfolio calculated using an internal model subject to qualitative minimum requirements as well as stress testing requirements. |
| — | | Market Risk Standardized Approach: calculates regulatory capital for securitisations and nth-to-default credit derivatives. |
Stressed value-at-risk, incremental risk charge and the comprehensive risk measure are calculated for all relevant portfolios. The results from the models are used in the day-to-day risk management of the bank, as well as for defining regulatory capital.
Stressed Value-at-Risk
We calculate a stressed value-at-risk measure using a 99 % confidence level and a holding period of one day. For regulatory purposes, the holding period is ten days.
Our stressed value-at-risk calculation utilizes the same systems, trade information and processes as those used for the calculation of value-at-risk. The only difference is that historical market data from a period of significant financial stress (i.e. characterized by high volatilities) is used as an input for the Monte Carlo Simulation. The time window selection process for the stressed value-at-risk calculation is based on the identification of a time window characterized by high levels of volatility and extreme movements in the top value-at-risk contributors. The results from these two indicators (volatility and number of outliers) are combined using chosen weights to ensure qualitative aspects are also taken into account (e.g. inclusion of key crisis periods).
| | | | |
| Deutsche Bank | | 01 – Management Report | | 140 |
| Financial Report 2012 | | Risk Report | | |
| | |
| | | | |
| | |
| | | | |
Incremental Risk Charge
The incremental risk charge is based on our own internal model and is intended to complement the value-at-risk modeling framework. It represents an estimate of the default and migration risks of unsecuritized credit products over a one-year capital horizon at a 99.9 % confidence level, taking into account the liquidity horizons of individual positions or sets of positions. We use a Monte Carlo Simulation for calculating incremental risk charge as the 99.9 % quantile of the portfolio loss distribution and for allocating contributory incremental risk charge to individual positions. The model captures the default and migration risk in an accurate and consistent quantitative approach for all portfolios.
We calculate the incremental risk charge on a weekly basis. The charge is determined as the higher of the most recent 12 week average of incremental risk charge and the most recent incremental risk charge. The market and position data are collected from front office systems and are subject to strict quality control. The incremental risk charge figures are closely monitored and play a significant role in the management of the covered portfolios. Additionally, the incremental risk charge provides information on the effectiveness of the hedging positions which is reviewed by the risk managers.
The contributory incremental risk charge of individual positions, which is calculated by expected shortfall allocation, provides the basis for identifying risk concentrations in the portfolio and designing strategies to reduce the overall portfolio risk.
We use our credit portfolio model, a core piece of our economic capital methodology, to calculate the incremental risk charge. Important parameters for the incremental risk charge calculation are exposures, recovery rates and default probabilities, ratings migrations, maturity, and liquidity horizons of individual positions.
Liquidity horizons are conservatively set to the time required to sell a position or to hedge all material relevant price risks in a stressed market. Liquidity horizons are specified at product level and reflect our actual practice and experience during periods of systematic and idiosyncratic stresses. We have defined the sets of positions used for applying liquidity horizons in a way that meaningfully reflects the differences in liquidity for each set. Market risk managers who specialize in each product type determine liquidity horizons, with a liquidity horizon floor of 3-months. Liquidity horizons are regularly reviewed with regard to the size of positions, market activity, market structure, credit rating, location of issuer, and maturity so that the act of selling or hedging, in itself, would not materially affect the price. Additionally, there are regular reviews of position size at the issuer level to determine if liquidity horizons need to be adjusted for concentration risk. Any experience of selling a position that indicates a liquidity horizon is not sufficiently conservative is taken into account in determining the liquidity horizon for similar products. Default and rating migration probabilities are defined by rating migration matrices which are calibrated on historical external rating data. Taking into account the trade-off between granularity of matrices and their stability we apply a global corporate matrix and a sovereign matrix comprising the seven main rating bands. Accordingly, issue or issuer ratings from the rating agencies Moody’s, S&P and Fitch are assigned to each position.
To quantify a loss due to rating migration, a revaluation of a position is performed under the new rating. The probability of joint rating downgrades and defaults is determined by the migration and rating correlations of the incremental risk charge model. These correlations are specified through systematic factors that represent geographical regions and industries and are calibrated on historical rating migration and equity time series. The simulation process incorporates a rollover strategy that is based on the assumption of a constant level of risk. This assumption implies that positions that have experienced default or rating migration over their liquidity horizon are re-balanced at the end of their liquidity horizon to attain the initial level of risk. Correlations between positions with different liquidity horizons are implicitly specified by the dependence structure of the underlying systematic and idiosyncratic risk factors, ensuring that portfolio concentrations are identified across liquidity horizons. In particular, differences between liquidity horizons and maturities of hedges and hedged positions are recognized.
| | | | |
| Deutsche Bank | | 01 – Management Report | | 141 |
| Financial Report 2012 | | Risk Report | | |
| | |
| | | | |
| | |
| | | | |
All parameters are recalibrated or validated on an annual or ad hoc basis. Apart from regular recalibrations there have been no significant model changes in 2012.
Direct validation of the incremental risk charge through back-testing methods is not possible. The charge is subject to validation principles such as the evaluation of conceptual soundness, ongoing monitoring, process verification and benchmarking and outcome analysis. The validation of the incremental risk charge methodology is embedded in the validation process for our credit portfolio model, with particular focus on the incremental risk charge specific aspects. Model validation relies more on indirect methods including stress tests and sensitivity analyses. Relevant parameters are included in the annual validation cycle established in the current regulatory framework. The incremental risk charge is part of the quarterly group-wide stress test using the stress testing functionality within our credit engine. Stressed incremental risk charge figures are reported on group level and submitted to the Stress Testing Oversight Committee and Cross Risk Review Committee.
Comprehensive Risk Measure
The comprehensive risk measure for the correlation trading portfolio is based on our own internal model. We calculate the comprehensive risk measure based on a Monte Carlo Simulation technique to a 99.9 % confidence level and a capital horizon of 1 year. Our model is applied to the eligible correlation trading positions where typical products include collateralized debt obligations, nth-to-default credit default swaps, and index- and single-name credit default swaps. Re-securitizations or products which reference retail claims or real estate exposures are not eligible. Furthermore, trades subject to the comprehensive risk measure have to meet minimum liquidity standards to be eligible. The model incorporates concentrations of the portfolio and nonlinear effects via a full revaluation approach.
Comprehensive risk measure is designed to capture defaults as well as the following risk drivers: interest rates, credit spreads, recovery rates, foreign exchange rates and base correlations, index-to-constituent and base correlation basis risks.
Comprehensive risk measure is calculated on a weekly basis. Initially, the eligible trade population within the correlation trading portfolio is identified. Secondly, the risk drivers of the P&L are simulated over a one year time horizon. The trade population is then re-valued under the various Monte Carlo scenarios and the 99.9 % quantile of the loss distribution is extracted.
The market and position data are collected from front office systems and are subject to strict quality control. The comprehensive risk measure figures are closely monitored and play a significant role in the management of the correlation trading portfolio. We use historical market data to estimate the risk drivers to the comprehensive risk measure with a history of up to three years.
In our comprehensive risk measure model the liquidity horizon is set to 12 months, which equals the capital horizon.
In order to maintain the high quality of our comprehensive risk measure model we continually monitor the potential weaknesses of this model. Backtesting of the trade valuations and the propagation of single risk factors is carried out on a monthly basis and a quarterly recalibration of parameters is performed. In addition, a series of stress tests have been defined on the correlation trading portfolio where the shock sizes link into historical distressed market conditions.
Model validation is performed by an independent team and reviews, but is not limited to, the above mentioned backtesting, the models which generate risk factors, appropriateness and completeness of risk factors, the Monte Carlo stability, and performs sensitivity analyses.
| | | | |
| Deutsche Bank | | 01 – Management Report | | 142 |
| Financial Report 2012 | | Risk Report | | |
| | |
| | | | |
| | |
| | | | |
| | | | |
| | During 2012 we have improved our comprehensive risk measure model as follows: |
| | |
| | — | | Extension of the liquidity horizon from 6 months to 12 months to improve the explanatory ability of the CRM quantile; |
| | — | | Removal of a conservative adjustment to the comprehensive risk measure capital definition such that it fully aligns with regulation; and |
| | — | | Enhancement of the methodology to simulate recovery rates such as to improve the backtesting. |
| | Market Risk Standardized Approach The specific MRSA is used to determine the regulatory capital charge for the non-correlation trading portfolio securitization products and nth-to-default credit swaps. Market Risk Management monitors exposures and addresses risk issues and concentrations. Longevity risk is the risk of adverse changes in life expectancies resulting in a loss in value on longevity linked policies and transactions. Regulatory capital charge for longevity risk is determined using the MRSA as set out in SolvV regulations. For risk management purposes, stress testing and economic capital allocations are also used to monitor and manage longevity risk. Validation of Front Office models Market Risk Management validates front office models that are used for official pricing and risk management of trading positions. New Model Approval, Ongoing Model Approval and Model Risk assessment are the team’s key activities and they include: |
| | — | | Verification of the mathematical integrity of the models and their implementation; |
| | — | | Periodic review of the models to ensure that the models stay valid in different market conditions; |
| | — | | Assessment of Model suitability for the intended business purposes; and |
| | — | | Establishment of Controls that enforce appropriate use of models across businesses. |
| | Trading Market Risk Management Framework at Postbank |
| | | | | |
| | | Market risk arising from Postbank has been included in our reporting since 2010. Since the domination agreement between Deutsche Bank and Postbank became effective in September 2012, aggregate market risk limits for Postbank are set by Deutsche Bank according to our market risk limit framework. Postbank’s Head of Market Risk Management has a functional reporting line into our Market Risk Management organization and acts based upon delegated authority with respect to monitoring, reporting and managing market risk exposure according to market risk limits allocated to Postbank. |
| | | | | |
| | Sub limits are allocated by the Postbank Market Risk Committee to the individual operating business units. Deutsche Bank’s Head of Market Risk Management for Germany is member of the Postbank Market Risk Committee. The risk economic capital limits allocated to specific business activities define the level of market risk that is reasonable and desirable for Postbank from an earnings perspective. Market risk at Postbank is monitored on a daily basis using a system of limits based on value-at-risk. In addition, Postbank’s Market Risk Committee has defined sensitivity limits for the trading and banking book as well as for key sub-portfolios. Postbank also performs scenario analyses and stress tests in addition to the value-at-risk calculations. The assumptions underlying the stress tests are reviewed and validated on an ongoing basis. |
| | Value-at-Risk at Postbank |
| | | | | |
| | | Postbank also uses the value-at-risk concept to quantify and monitor the market risk it assumes. Value-at-risk is calculated using a Monte Carlo Simulation. The risk factors taken into account in the value-at-risk include interest rates, equity prices, foreign exchange rates, and volatilities, along with risks arising from changes in credit spreads. Correlation effects between the risk factors are derived from equally-weighted historical data. |
| | | | | |
| | Postbank’s trading book value-at-risk is currently not consolidated into the value-at-risk of the remaining Group. However, it is shown separately in the internal value-at-risk report. |
| | | | |
| Deutsche Bank | | 01 – Management Report | | 143 |
| Financial Report 2012 | | Risk Report | | |
| | |
| | | | |
| | |
| | | | |
Economic Capital for Market Risk
Economic capital for market risk measures the amount of capital needed to absorb very severe, unexpected losses arising from our exposures over the period of one year. “Very severe” in this context means that economic capital is set at a level which covers, with a probability of 99.98 %, all unexpected losses over a one year time horizon.
Our economic capital model comprises two core components, the “Common Risk” component covering risk drivers across all businesses and the suite of Business Specific Stress Tests (BSSTs) which enriches the Common Risk component. Both components are calibrated to historically observed severe market shocks.
One of the main components of our wider “Market Risk Framework” initiative has been the transition of the “Common Risk” component into a modified version of our regulatory Stressed value-at-risk approach. This transition went live in November 2012. The new Stressed value-at-risk-based economic capital has following modifications:
| — | | The volatilities of risk factors are increased in order to capture the risk from longer liquidity horizons than value-at-risk; and |
| — | | The confidence level is increased to 99.98 % in line with our standard definition of economic capital, compared to our 99 % quantile for value-at-risk. |
This model change has provided a number of benefits:
| — | | Improved risk accuracy: Since our Stressed value-at-risk methodology has a high coverage of basis risks, a number of BSSTs are no longer required and the related risk is instead modeled more accurately within the comprehensive correlation framework of Stressed value-at-risk. |
| — | | Reduction of operational complexity: The new Common Risk component aligns the methodology, the market data, risk factors and sensitivities with the value-at-risk framework. As a result, changes to value-at-risk and Stressed value-at-risk are fully reconcilable to economic capital. |
There has been an additional change to our economic capital measure relating to the liquidity horizon. The liquidity horizon is an assumption of how quickly management intervention would be taken to unwind or materially hedge our risk positions during times of severe market stress. Liquidity horizons have historically been based on our experience of de-risking portfolios during a single period of stress. However, based on recent regulatory opinion and our understanding of the latest market convention, economic capital is now required to capture the effect of multiple periods of stress within a one year time window. We have chosen to reflect this by extending the liquidity horizon, albeit not necessarily to a full one year due to hedging activities. We have therefore introduced a floor to the liquidity horizon of 3 months for all asset classes.
The calculation of economic capital for market risk from the trading units is performed weekly. The model incorporates the following risk factors: interest rates, credit spreads, equity prices, foreign exchange rates, commodity prices and correlations.
We also continuously assess and refine our BSSTs in an effort to ensure they capture material risks as well as reflect possible extreme market moves. Additionally, risk managers use their expert judgment to define worst case scenarios based upon the knowledge of past extreme market moves. It is possible however, for our market risk positions to lose more value than our economic capital estimates since all downside scenarios cannot be predicted and simulated.
Economic capital for traded default risk represents an estimate of the default and migration risks of credit products at a 99.98 % confidence level, taking into account the liquidity horizons of the respective sub-portfolios. It covers the following positions:
| — | | Fair value assets in the banking book; |
| | | | |
| Deutsche Bank | | 01 – Management Report | | 144 |
| Financial Report 2012 | | Risk Report | | |
| | |
| | | | |
| | |
| | | | |
| — | | Unsecuritized credit products in the trading book excluding correlation trading portfolio; |
| — | | Securitized products in the trading book excluding correlation trading portfolio; and |
| — | | Correlation trading portfolio. |
The traded default risk economic capital for the correlation trading portfolio is calculated using the comprehensive risk measure. For all other positions the calculation of traded default risk economic capital is based on our credit portfolio model. Traded default risk captures the credit exposures across our trading books and it is monitored via single name concentration and portfolio limits which are set based upon rating, size and liquidity. In addition, a traded default risk economic capital limit is set within the Market Risk economic capital framework while the incremental risk charge monitors the regulatory capital requirements associated with these positions. In order to capture diversification and concentration effects we perform a joint calculation for traded default risk economic capital and credit risk economic capital. Important parameters for traded default risk are exposures, recovery rates and default probabilities as well as maturities. Exposures, recovery rates and default probabilities are derived from market information and external ratings for the trading book and internal assessments for the banking book as for credit risk economic capital. Rating migrations are governed by migration matrices, which are obtained from historical rating time series from rating agencies and internal observations. The probability of joint rating downgrades and defaults is determined by the default and rating correlations of the portfolio model. These correlations are specified through systematic factors that represent countries, geographical regions and industries.
Validation of the market risk economic capital model is performed by an independent team. The regular review covers, but is not limited to, the appropriateness of risk factors, the calibration techniques, the parameter settings, and model assumptions.
Balance Sheet and Trading Book Assets
The table below presents those parts of our balance sheet which constitute trading or banking book assets from a regulatory point of view.
Regulatory Trading Book Assets as part of the Balance Sheet
| | | | | | | | | | | | |
| | | | | | Dec 31, 2012 | |
in€ m. | | Balance Sheet | | | Trading Book | | | Banking Book1 | |
| Assets | | | – | | | | – | | | | – | |
| | | | | | | | | | | | |
| Cash and due from banks | | | 27,885 | | | | 163 | | | | 27,722 | |
| | | | | | | | | | | | |
| Interest earning deposits with banks | | | 119,548 | | | | 2,905 | | | | 116,643 | |
| | | | | | | | | | | | |
| Central banks funds sold and securities purchased under resale agreements2 | | | 36,570 | | | | 18,872 | | | | 17,698 | |
| | | | | | | | | | | | |
| Securities borrowed | | | 23,947 | | | | 23,845 | | | | 102 | |
| | | | | | | | | | | | |
| Financial assets at fair value through profit or loss | | | 1,200,881 | | | | 1,152,793 | | | | 48,088 | |
| | | | | | | | | | | | |
Trading Assets3 | | | 245,538 | | | | 229,070 | | | | 16,468 | |
| | | | | | | | | | | | |
Positive market values from derivative financial instruments | | | 768,316 | | | | 754,792 | | | | 13,524 | |
| | | | | | | | | | | | |
Financial assets designated at fair value through profit or loss | | | 187,027 | | | | 168,931 | | | | 18,096 | |
| | | | | | | | | | | | |
| Financial assets available for sale | | | 49,379 | | | | – | | | | 49,379 | |
| | | | | | | | | | | | |
| Equity method investments | | | 3,577 | | | | – | | | | 3,577 | |
| | | | | | | | | | | | |
| Loans | | | 397,279 | | | | 2,175 | | | | 395,104 | |
| | | | | | | | | | | | |
| Property and equipment | | | 4,963 | | | | – | | | | 4,963 | |
| | | | | | | | | | | | |
| Goodwill and other intangible assets | | | 14,219 | | | | – | | | | 14,219 | |
| | | | | | | | | | | | |
| Other assets4 | | | 123,973 | | | | 47,708 | | | | 76,265 | |
| | | | | | | | | | | | |
| Assets for current tax | | | 2,390 | | | | – | | | | 2,390 | |
| | | | | | | | | | | | |
| Deferred tax assets | | | 7,718 | | | | – | | | | 7,718 | |
| | | | | | | | | | | | |
| Total Assets | | | 2,012,329 | | | | 1,248,461 | | | | 763,868 | |
| |
| 1 | Includes exposure in relation to non regulatory consolidated entities. |
| 2 | Only includes securities purchased under resale agreement as of December 31, 2012. |
| 3 | The regulatory Banking Book primarily includes debt securities as part of our liquidity portfolio as well as Traded Loans which do not fulfill the criteria for being allocated to the regulatory Trading Book. |
| 4 | Regulatory Trading Book positions mainly include brokerage receivables and derivatives qualifying for hedge accounting. |
| | | | |
| Deutsche Bank | | 01 – Management Report | | 145 |
| Financial Report 2012 | | Risk Report | | |
| | |
| | | | |
| | |
| | | | |
Value-at-Risk Metrics of Trading Units of Deutsche Bank Group Trading (excluding Postbank)
The table below presents the value-at-risk metrics calculated with a 99 % confidence level and a one-day holding period for our Trading Units.
Value-at-Risk of our Trading Units by Risk Type
| | | | | | | | |
in€ m. | | Dec 31, 2012 | | | Dec 31, 2011 | |
Interest rate risk | | | 53.9 | | | | 53.8 | |
| | | | | | | | |
Equity price risk | | | 11.6 | | | | 13.6 | |
| | | | | | | | |
Foreign exchange risk | | | 15.3 | | | | 25.6 | |
| | | | | | | | |
Commodity price risk1 | | | 21.7 | | | | 21.0 | |
| | | | | | | | |
Diversification effect | | | (44.4) | | | | (63.7) | |
| | | | | | | | |
Total value-at-risk | | | 58.1 | | | | 50.4 | |
| |
| 1 | Includes value-at-risk from gold positions. |
The following table shows the average, maximum, and minimum value-at-risk (with a 99 % confidence level and a one-day holding period) of our trading units for the periods specified.
Value-at-Risk of our Trading Units in the Reporting Period
| | | | | | | | | | | | | | | | | | | | | | | | | | | | | | | | | | | | | | | | | | | | | | | | |
| | | Total | | | Diversification effect | | | Interest rate risk | | | Equity price risk | | | Foreign
exchange risk | | | Commodity
price risk 1 | |
in€ m. | | 2012 | | | 2011 | | | 2012 | | | 2011 | | | 2012 | | | 2011 | | | 2012 | | | 2011 | | | 2012 | | | 2011 | | | 2012 | | | 2011 | |
Average | | | 57.1 | | | | 72.7 | | | | (61.1) | | | | (65.4) | | | | 58.4 | | | | 70.8 | | | | 14.6 | | | | 20.5 | | | | 24.5 | | | | 32.6 | | | | 20.7 | | | | 14.2 | |
| | | | | | | | | | | | | | | | | | | | | | | | | | | | | | | | | | | | | | | | | | | | | | | | |
Maximum | | | 80.1 | | | | 94.8 | | | | (85.1) | | | | (88.1) | | | | 75.8 | | | | 109.1 | | | | 27.4 | | | | 37.6 | | | | 43.4 | | | | 64.9 | | | | 31.8 | | | | 24.3 | |
| | | | | | | | | | | | | | | | | | | | | | | | | | | | | | | | | | | | | | | | | | | | | | | | |
Minimum | | | 43.3 | | | | 45.4 | | | | (35.3) | | | | (41.1) | | | | 44.3 | | | | 45.6 | | | | 7.5 | | | | 12.7 | | | | 9.4 | | | | 14.3 | | | | 9.1 | | | | 7.0 | |
| |
| 1 | Includes value-at-risk from gold positions. |
The€ 15.6 million or 21 % decrease in average value-at-risk observed in 2012 compared to the prior year was driven primarily by a broad risk reduction across most asset classes, but also partly due to the benefit of lower levels of volatility within the one year of historical market data used in the calculation during 2012.
Basel 2.5 Regulatory Trading Market Risk Measures
As discussed under “Basel 2.5 Regulatory Trading Market Risk Requirements”, the following table shows the stressed value-at-risk (with a 99 % confidence level and a one-day holding period) of the trading units of our Trading.
Stressed Value-at-Risk by Risk Type
| | | | | | | | |
in€ m. | | Dec 31, 2012 | | | Dec 31, 2011 | |
Interest rate risk | | | 157.7 | | | | 117.3 | |
| | | | | | | | |
Equity price risk | | | 16.0 | | | | 23.0 | |
| | | | | | | | |
Foreign exchange risk | | | 27.5 | | | | 51.8 | |
| | | | | | | | |
Commodity price risk | | | 43.8 | | | | 34.2 | |
| | | | | | | | |
Diversification effect | | | (98.7) | | | | (113.7) | |
| | | | | | | | |
Total stressed value-at-risk of trading units | | | 146.3 | | | | 112.6 | |
| |
Average, Maximum and Minimum Stressed Value-at-Risk by Risk Type
| | | | | | | | | | | | | | | | | | | | | | | | |
| | | 2012 | | | 2011 | |
in€ m. | | Average | | | Maximum | | | Minimum | | | Average 1 | | | Maximum 1 | | | Minimum 1 | |
Interest rate risk | | | 142.0 | | | | 178.9 | | | | 110.2 | | | | 131.6 | | | | 163.5 | | | | 106.2 | |
| | | | | | | | | | | | | | | | | | | | | | | | |
Equity price risk | | | 19.8 | | | | 47.8 | | | | 7.7 | | | | 22.3 | | | | 64.7 | | | | 15.2 | |
| | | | | | | | | | | | | | | | | | | | | | | | |
Foreign exchange risk | | | 38.1 | | | | 67.9 | | | | 14.5 | | | | 51.2 | | | | 105.4 | | | | 23.0 | |
| | | | | | | | | | | | | | | | | | | | | | | | |
Commodity price risk | | | 36.5 | | | | 61.0 | | | | 11.1 | | | | 29.2 | | | | 35.8 | | | | 19.6 | |
| | | | | | | | | | | | | | | | | | | | | | | | |
Diversification effect | | | (115.8) | | | | (163.7) | | | | (73.9) | | | | (108.0) | | | | (149.7) | | | | (75.8) | |
| | | | | | | | | | | | | | | | | | | | | | | | |
Total stressed value-at-risk of trading units | | | 120.6 | | | | 152.2 | | | | 91.0 | | | | 126.3 | | | | 172.7 | | | | 102.0 | |
| |
| 1 | Average, Maximum and Minimum have been calculated for the period from October 1, 2011 to December 31, 2011. |
For regulatory reporting purposes, the incremental risk charge for the respective reporting dates represents the higher of the spot value at the reporting dates, and their preceding 12-week average calculation. In contrast to this, the incremental risk charge presented for the reporting dates below is the spot values and the average, maximum and minimum values for the 12-week period preceding these reporting dates. The NCOU incremental risk charge for 2012 is due to the hedges within the underlying portfolios.
| | | | |
| Deutsche Bank | | 01 – Management Report | | 146 |
| Financial Report 2012 | | Risk Report | | |
| | |
| | | | |
| | |
| | | | |
| | | | | | | | | | | | |
| | | In light of our restructuring in the fourth quarter of 2012 we have reallocated the credit risk sensitive positions of our trading book to the new structure and have restated amounts disclosed for the prior reporting date and period year accordingly. | |
| | | Incremental Risk Charge of Trading Units (with a 99.9 % confidence level and one-year capital horizon) | |
| | | in€ m. | | Dec 31, 2012 | | | Dec 31, 2011 | |
| | | Global Finance and Foreign Exchange | | | 70.8 | | | | 81.4 | |
| | | | | | | | | | | |
| | | Rates and Credit Trading | | | 441.3 | | | | 485.2 | |
| | | | | | | | | | | |
| | | NCOU | | | (20.9) | | | | 32.0 | |
| | | | | | | | | | | |
| | | Emerging Markets – Debt | | | 224.6 | | | | 140.9 | |
| | | | | | | | | | | |
| | | Other | | | (3.0) | | | | (1.4) | |
| | | | | | | | | | | |
| | | Total incremental risk charge | | | 712.8 | | | | 738.1 | |
| | | | |
| | | | | | | | | | | | | |
| | | | | | | | | | | | | | | | | | | | | | | | | | | | | | | | |
| Average, Maximum and Minimum Incremental Risk Charge of Trading Units (with a 99.9 % confidence level and one-year capital horizon) | |
| | | 2012 | | | 2011 | |
in€ m. | | Weighted
average
liquidity
horizon
in month | | | Average 1 | | | Maximum 1 | | | Minimum 1 | | | Weighted
average
liquidity
horizon
in month | | | Average 1 | | | Maximum 1 | | | Minimum 1 | |
| Global Finance and Foreign Exchange | | | 6.0 | | | | 107.4 | | | | 139.3 | | | | 70.1 | | | | 6.0 | | | | 49.6 | | | | 81.4 | | | | 7.8 | |
| | | | | | | | | | | | | | | | | | | | | | | | | | | | | | | | |
| Rates and Credit Trading | | | 6.0 | | | | 482.2 | | | | 579.6 | | | | 406.1 | | | | 6.0 | | | | 624.2 | | | | 795.4 | | | | 485.2 | |
| | | | | | | | | | | | | | | | | | | | | | | | | | | | | | | | |
| NCOU | | | 6.0 | | | | (23.0) | | | | 29.1 | | | | (120.9) | | | | 6.0 | | | | (4.3) | | | | 32.0 | | | | (18.3) | |
| | | | | | | | | | | | | | | | | | | | | | | | | | | | | | | | |
| Emerging Markets – Debt | | | 6.0 | | | | 197.2 | | | | 273.5 | | | | 150.0 | | | | 6.0 | | | | 90.0 | | | | 140.9 | | | | 23.9 | |
| | | | | | | | | | | | | | | | | | | | | | | | | | | | | | | | |
| Other | | | 6.0 | | | | (3.1) | | | | 0.6 | | | | (6.1) | | | | 6.0 | | | | (1.3) | | | | 2.2 | | | | (5.5) | |
| | | | | | | | | | | | | | | | | | | | | | | | | | | | | | | | |
| Total incremental risk charge of trading units | | | 6.0 | | | | 760.7 | | | | 821.5 | | | | 705.9 | | | | 6.0 | | | | 758.1 | | | | 846.3 | | | | 697.0 | |
| |
1 Average, Maximum and Minimum have been calculated for the 12-week period ending December 31. | |
Based on 52 weeks, the annual average of our total incremental risk charge was€ 760 million for the year 2012. The maximum and minimum of the incremental risk charge for the year 2012 was€ 878 million and€ 673 million respectively. | |
| | | | | | | | | | | | |
| | | | | | | | | | | |
| | | For regulatory reporting purposes, the comprehensive risk measure for the respective reporting dates represents the higher of the spot value at the reporting dates, their preceding 12-week average calculation, and the floor, where the floor is equal to 8 % of the equivalent capital charge under the securitisation framework. In contrast to this, the comprehensive risk measure presented for the reporting dates below is the spot values and the average, maximum and minimum values have been calculated for the 12 weeks period preceding these reporting dates. | |
| | | Comprehensive Risk Measure of Trading Units (with a 99.9 % confidence level and one-year capital horizon) | |
| | | in€ m. | | Dec 31, 2012 | | | Dec 31, 2011 | |
| | | Correlation trading | | | 543.8 | | | | 855.7 | |
| | | | |
| | | | | | | | | | | | | |
| | | | | | | | | | | | | | | | | | | | | | | | | | | | | | | | |
| Average, Maximum and Minimum Comprehensive Risk Measure of Trading Units (with a 99.9 % confidence level and one-year capital horizon) | |
| | | 2012 | | | 2011 | |
in€ m. | | Weighted
average
liquidity
horizon
in month | | | Average 1 | | | Maximum 1 | | | Minimum 1 | | | Weighted
average
liquidity
horizon
in month | | | Average 1 | | | Maximum 1 | | | Minimum 1 | |
| Correlation trading | | | 12.0 | | | | 613.4 | | | | 650.9 | | | | 562.8 | | | | 6.0 | | | | 993.2 | | | | 1,026.2 | | | | 937.9 | |
| |
1 Average, Maximum and Minimum have been calculated for the 12-week period ending December 31. | |
| | | | |
| Deutsche Bank | | 01 – Management Report | | 147 |
| Financial Report 2012 | | Risk Report | | |
| | |
| | | | |
| | |
| | | | |
Based on 52 weeks, the annual average of our total comprehensive risk measure was€ 693 million for the year 2012. The maximum and minimum of comprehensive risk measure for the year 2012 was€ 884 million and€ 418 million respectively.
As of December 31, 2012, the securitization positions using the market risk standardized approach generated risk weighted-assets of€ 5.5 billion and capital deduction items of€ 0.6 billion capital charge. As of December 31, 2011 the securitization positions amounted to€ 5.0 billion and€ 2.2 billion respectively.
As of December 31, 2012, the capital charge for longevity risk was€ 32 million corresponding to risk weighted-assets of€ 403 million. As of December 31, 2011, the capital charge for longevity risk was€ 32 million corresponding to risk-weighted assets of€ 401 million.
Value-at-Risk at Postbank
Value-at-Risk of Postbank trading book (with a 99 % confidence level and a one-day holding period)
| | | | | | | | | | |
in€ m. | | Dec 31, 2012 | | | Dec 31, 2011 | | | |
Interest rate risk | | | 1.2 | | | | 3.9 | | | |
| | | | | | | | | | |
Equity price risk | | | 0.1 | | | | – | | | |
| | | | | | | | | | |
Foreign exchange risk | | | 0.2 | | | | 0.0 | | | |
| | | | | | | | | | |
Commodity price risk | | | – | | | | – | | | |
| | | | | | | | | | |
Diversification effect | | | (0.3) | | | | (0.0) | | | |
| | | | | | | | | | |
Total value-at-risk of Postbanks trading book | | | 1.2 | | | | 3.9 | | | |
| | | |
| | | | | | | | | | |
The decrease in Postbank’s value-at-risk to€ 1.2 million at year end 2012 from€ 3.9 million at year end 2011 is largely due to further reduction of overall position taking and transfer of positions into the regulatory banking book. “Diversification effect” reflects the fact that the total value-at-risk on a given day will be lower than the sum of the value-at-risk relating to the individual risk classes. Simply adding the value-at-risk figures of the individual risk classes to arrive at an aggregate value-at-risk would imply the assumption that the losses in all risk categories occur simultaneously.
Average, Maximum and Minimum Value-at-Risk of Postbank trading book (with a 99 % confidence level and a one-day holding period)
| | | | | | | | | | | | | | | | | | | | | | | | | | | | | | | | | | | | | | | | | | | | | | | | |
| | | Total | | | Diversification
effect | | | Interest rate risk | | | Equity price risk | | | Foreign
exchange risk | | | Commodity
price risk | |
in€ m. | | 2012 | | | 2011 | | | 2012 | | | 2011 | | | 2012 | | | 2011 | | | 2012 | | | 2011 | | | 2012 | | | 2011 | | | 2012 | | | 2011 | |
Average | | | 3.4 | | | | 3.2 | | | | (0.2) | | | | (0.2) | | | | 3.4 | | | | 3.2 | | | | 0.1 | | | | 0.1 | | | | 0.1 | | | | 0.1 | | | | – | | | | – | |
| | | | | | | | | | | | | | | | | | | | | | | | | | | | | | | | | | | | | | | | | | | | | | | | |
Maximum | | | 5.9 | | | | 8.2 | | | | (0.0) | | | | (0.0) | | | | 6.0 | | | | 8.1 | | | | 0.2 | | | | 0.4 | | | | 0.7 | | | | 0.5 | | | | – | | | | – | |
| | | | | | | | | | | | | | | | | | | | | | | | | | | | | | | | | | | | | | | �� | | | | | | | | | |
Minimum | | | 0.9 | | | | 1.1 | | | | (1.0) | | | | (0.8) | | | | 0.9 | | | | 1.1 | | | | (0.0) | | | | – | | | | 0.0 | | | | 0.0 | | | | – | | | | – | |
| |
Regulatory Backtesting of Trading Market Risk
Backtesting is a procedure used to verify the predictive power of the value-at-risk calculations involving the comparison of hypothetical daily profits and losses under the buy-and-hold assumption with the estimates from the value-at-risk model. An outlier is a hypothetical buy-and-hold trading loss that exceeds our value-at-risk estimate. On average, we would expect a 99 percent confidence level to give rise to two to three outliers in any one year. In 2012, we observed two global outliers, one in April and one in December, compared to three in 2011. In both instances the outliers resulted from significant market moves those days that were in excess of our 99 % confidence level. We continue to believe that our value-at-risk model will remain an appropriate measure for our trading market risk under normal market conditions.
| | | | |
| Deutsche Bank | | 01 – Management Report | | 148 |
| Financial Report 2012 | | Risk Report | | |
| | |
| | | | |
| | |
| | | | |
The following graph shows the daily buy-and-hold trading results in comparison to the value-at-risk as of the close of the previous business day for the trading days of the reporting period. Figures are shown in millions of euro and exclude contributions from Postbank’s trading book which is calculated on a stand-alone basis.
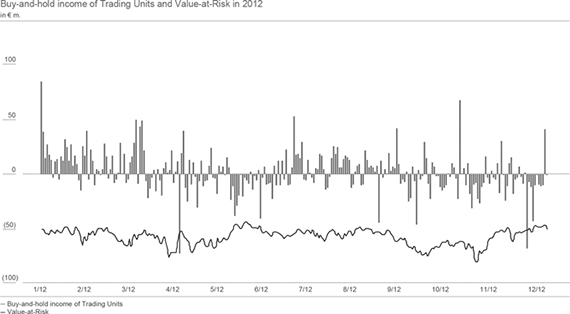
Daily Income of our Trading Units
The following histogram shows the distribution of daily income of our trading units in 2012 (excluding Postbank). It displays the number of trading days on which we reached each level of trading income shown on the horizontal axis in millions of euro.
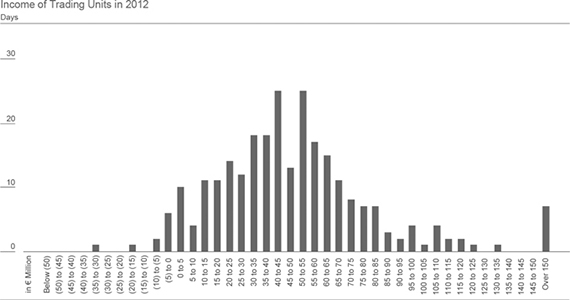
| | | | |
| Deutsche Bank | | 01 – Management Report | | 149 |
| Financial Report 2012 | | Risk Report | | |
| | |
| | | | |
| | |
| | | | |
Our trading units achieved a positive actual income for 96 % of the trading days in 2012 (versus 88 % in 2011).
Economic Capital Usage for our Trading Market Risk
The economic capital usage for trading market risk was€ 4.7 billion at year-end 2012, materially unchanged from year-end 2011. Our trading market risk economic capital usage decreased by€ 34 million, or 1 %. The stable risk figure reflects offsetting effects of methodology refinements and exposure reductions.
Postbank’s contribution to the economic capital usage for our trading market risk was minimal.
Valuation of Market Risk Positions
For details about our methods for determining fair value see the respective section in Note 02 “Critical Accounting Estimates” of our financial statements.
Nontrading Market Risk
Nontrading market risk arises from market movements, primarily outside the activities of our trading units, in our banking book and from off-balance sheet items. Significant market risk factors the bank is exposed to and are overseen by risk management groups in that area are:
| — | | Interest rate risk (including model risk from embedded optionality and from modeling behavioral assumptions for certain product types), credit spread risk, foreign exchange risk, equity risk (including investments in public and private equity as well as real estate, infrastructure and fund assets). |
| — | | Market risks from off-balance sheet items such as pension schemes and guarantees as well as structural foreign exchange risk and equity compensation risk. |
The market risk component of our nontrading activities is overseen by dedicated groups within our risk management organization. Due to the variety of businesses and initiatives subject to nontrading market risk exposure, coverage is split into three main areas:
| — | | Market Risk Management – covering market risks arising in the business units PBC, GTB, AWM and Treasury and NCOU activities, such as structural foreign exchange risks & equity compensation risks, as well as pension risks. |
| — | | CRM Principal Investments – specializing in the risk-related aspects of our nontrading alternative asset activities and performing regular reviews of the risk profile of the banks alternative asset portfolios. |
| — | | CRM Asset Management Risk – specializing in the risk related aspects of our asset and fund management business in the AWM Corporate Division. Key risks in this area arise from performance and/or principal guarantees and reputational risk related to managing client funds. |
The Risk Executive Committee and the Capital and Risk Committee supervise nontrading market risk exposures. Investment proposals for strategic investments are analyzed by the Group Investment Committee. Depending on the size, strategic investments may require approval from the Group Investment Committee, the Management Board or the Supervisory Board. The development of strategic investments is monitored by the Group Investment Committee on a regular basis. Multiple members of the Capital and Risk Committee & Risk Executive Committee are also members of the Group Investment Committee, ensuring a close link between these committees.
An independent team in Risk validates the models for nontrading market risk. In general the validation includes a review of the appropriateness of risk factors, parameters, parameter calibration and model assumptions. Validation results are presented to senior management and appropriate remediating actions are taken by Market Risk Management Methodology to improve the specific model used for the various risk types.
| | | | |
| Deutsche Bank | | 01 – Management Report | | 150 |
| Financial Report 2012 | | Risk Report | | |
| | |
| | | | |
| | |
| | | | |
| | | | |
| | | Assessment of Market Risk in Nontrading Portfolios The majority of market risk in our nontrading portfolios is quantified through the use of stress testing procedures. We use stress tests that are specific to each risk class and which consider, among other factors, large historically observed market moves, the liquidity of each asset class, and changes in client behavior in relation to deposit products. This assessment forms the basis of the economic capital calculations which enable us to actively monitor, aggregate and manage our nontrading market risk exposure. The most significant addition to our nontrading market risk economic capital coverage in 2012 was the inclusion of credit spread risk for Postbank’s banking book investment portfolio following additional regulatory specifications to include material credit spread risk, irrespective of the accounting category. The economic capital charge for the credit spread risk of the portfolio is in addition to credit risk economic capital allocated to the portfolio for risks arising from credit default and rating migrations. |
| | | | | |
Interest Rate Risk in the Banking Book
The majority of our interest rate risk arising from nontrading asset and liability positions, with the exception of some entities and portfolios, has been transferred through internal transactions to the CB&S division. This internally transferred interest rate risk is managed on the basis of value-at-risk, as reflected in trading portfolio figures. The treatment of interest rate risk in our trading portfolios and the application of the value-at-risk model is discussed in the “Trading Market Risk” section of this document.
The most notable exceptions from the aforementioned paragraph are in the PBC Corporate Division in Germany including Postbank and the AWM mortgage business in the U.S. Unit. These entities manage interest rate risk separately through dedicated Asset and Liability Management departments subject to banking book value-at-risk limits set and monitored by Market Risk Management. The measurement and reporting of interest rate risk managed by these dedicated Asset and Liability functions is performed daily in the PBC division and on a weekly basis for AWM. The global interest rate in the banking book is reported on a monthly basis.
The changes of present values of the banking book positions when applying the regulatory required parallel yield curve shifts of (200) and +200 basis points was below 1 % of our total regulatory capital at December 31, 2012. Consequently, outright interest rate risk in the banking book is considered immaterial for us.
Our PBC, GTB and AWM businesses are subject to model risk with regard to client deposits as well as savings and loan products. Measuring interest rate risks for these product types in the banking book is based upon assumptions with respect to client behavior, future availability of deposit balances and sensitivities of deposit rates versus market interest rates resulting in a longer than contractual effective duration. Those parameters are subject to stress testing within our Economic Capital framework. Additionally, consideration is made regarding early prepayment behavior for loan products. The parameters are based on historical observations, statistical analyses and expert assessments. If the future evolution of balances, rates or client behavior differs from these assumptions, then this could have an impact on our interest rate risks in the banking book.
Foreign Exchange Risk
Foreign exchange risk arises from our nontrading asset and liability positions, denominated in currencies other than the functional currency of the respective entity. The majority of this foreign exchange risk is transferred through internal hedges to trading books within CB&S and is therefore reflected and managed via the value-at-risk figures in the trading books. The remaining foreign exchange risks that have not been transferred are mitigated through match funding the investment in the same currency, therefore only residual risk remains in the portfolios. Small exceptions to above approach follow the general MRM monitoring and reporting process, as outlined for the trading portfolio.
The bulk of nontrading foreign exchange risk is related to unhedged structural foreign exchange exposure, mainly in our U.S., U.K. and China entities. Structural foreign exchange exposure arises from local capital (including retained earnings) held in the Bank’s consolidated subsidiaries and branches and from investments
| | | | |
| Deutsche Bank | | 01 – Management Report | | 151 |
| Financial Report 2012 | | Risk Report | | |
| | |
| | | | |
| | |
| | | | |
accounted for at equity. Change in foreign exchange rates of the underlying functional currencies result in revaluation of capital and retained earnings and are recognized in other comprehensive income booked as Currency Translation Adjustments (“CTA”).
The primary objective for managing our structural foreign exchange exposure is to stabilize consolidated capital ratios from the effects of fluctuations in exchange rates. Therefore the exposure remains unhedged for a number of core currencies with considerable amounts of risk-weighted assets denominated in that currency in order to avoid volatility in the capital ratio for the specific entity and the group as a whole.
Investment Risk
Nontrading market risk from investment exposure is predominantly the equity risk arising from our non-consolidated investment holdings in the banking book categorized into strategic and alternative investment assets.
Strategic investments typically relate to acquisitions made by us to support our business franchise and are undertaken with a medium to long-term investment horizon. Alternative assets are comprised of principal investments and other non-strategic investment assets. Principal investments are direct investments in private equity (including leveraged buy-out fund commitments and equity bridge commitments), real estate (including mezzanine debt) and venture capital, undertaken for capital appreciation. In addition, principal investments are made in hedge funds and mutual funds in order to establish a track record for sale to external clients. Other non-strategic investment assets comprise of assets recovered in the workout of distressed positions or other legacy investment assets in private equity and real estate of a non-strategic nature. The majority of the non-strategic investment portfolio has been moved to the newly created NCOU and its mandate to achieve accelerated de-risking and capital relief.
Pension Risk
Deutsche Bank is exposed to market risk from a number of defined benefit pension schemes for past and current employees. The ability of the pension schemes to meet the projected pension payments, is maintained through investments and ongoing plan contributions. Market risk materializes due to a potential decline in the market value of the assets or an increase in the liability of each of the pension plans. Market Risk Management monitors and reports all market risks both on the asset and liability side of our defined benefit pension plans including interest rate risk, inflation risk, credit spread risk, equity risk and longevity risk. For details on our defined benefit pension obligation see Additional Note 34 “Employee Benefits”.
Other Risks
In addition to the above risks, Market Risk Management has the mandate to monitor and manage market risks that arise from capital and liquidity risk management activities of our treasury department. Besides the structural foreign exchange capital hedging process this includes market risks arising from our equity compensation plans.
Market risks in our asset management activities in AWM, primarily results from principal guaranteed funds, but also from co-investments in our funds.
| | | | |
| Deutsche Bank | | 01 – Management Report | | 152 |
| Financial Report 2012 | | Risk Report | | |
| | |
| | | | |
| | |
| | | | |
Economic Capital Usage for Our Nontrading Market Risk Portfolios per Business Area
Economic Capital Usage of Nontrading Portfolios by Business Division
| | | | | | | | | | | | | | | | |
| | | | | | | | | 2012 increase (decrease) from 2011 | |
in€ m. | | Dec 31, 2012 | | | Dec 31, 2011 | | | in € m. | | | in % | |
Corporate Banking & Securities | | | 818 | | | | 443 | | | | 375 | | | | 85 | |
| | | | | | | | | | | | | | | | |
Global Transaction Banking | | | 136 | | | | 87 | | | | 49 | | | | 56 | |
| | | | | | | | | | | | | | | | |
Asset & Wealth Management | | | 1,235 | | | | 1,257 | | | | (22) | | | | (2) | |
| | | | | | | | | | | | | | | | |
Private & Business Clients | | | 3,162 | | | | 2,143 | | | | 1,019 | | | | 48 | |
| | | | | | | | | | | | | | | | |
Non-Core Operations Unit | | | 2,336 | | | | 1,836 | | | | 500 | | | | 27 | |
| | | | | | | | | | | | | | | | |
Consolidation & Adjustments | | | 808 | | | | 1,512 | | | | (704) | | | | (47) | |
| | | | | | | | | | | | | | | | |
Total | | | 8,495 | | | | 7,278 | | | | 1,217 | | | | 17 | |
| |
Nontrading market risk economic capital usage totaled€ 8.5 billion as of December 31, 2012, which is€ 1.2 billion, or 17 %, above our economic capital usage at year-end 2011.
The increase was largely driven by the extension of nontrading market risk economic capital coverage to include material credit spread risks in the banking book and a higher capital charge for the guaranteed funds portfolio, partially offset by higher diversification benefit with other risk types as well as lower economic capital usage due to various asset disposals.
The increase in CB&S nontrading market risk economic capital was mainly driven by an increase of economic capital for guaranteed funds.
The increase in economic capital usage for PBC and the NCOU was caused by the inclusion of credit spread risk exposure of Postbank’s banking book investment portfolio into the coverage of the nontrading economic capital framework.
The major change in Consolidation & Adjustments was the decrease in economic capital for structural foreign exchange risk following a methodological extension to capture further diversification benefits with other components of our ICAAP framework.
| | | | | | | | | | | | | | | | | | | | |
| | | | | | |
| | | Carrying Value and Economic Capital Usage for Nontrading Market Risk Portfolios | |
| | | Carrying Value and Economic Capital Usage for Nontrading Portfolios | |
| | | | | | | Carrying value | | | Economic capital usage | |
| | | in€ bn. | | Dec 31, 2012 | | | Dec 31, 2011 | | | Dec 31, 2012 | | | Dec 31, 2011 | |
| | | Strategic Investments | | | 3.0 | | | | 2.9 | | | | 1.2 | | | | 1.2 | |
| | | | | | | | | | | | | | | | | | | |
| | | Alternative Assets | | | 5.7 | | | | 6.9 | | | | 2.0 | | | | 2.2 | |
| | | Principal Investments | | | 2.1 | | | | 2.6 | | | | 0.9 | | | | 0.9 | |
| | | Other Non Strategic Investment Assets | | | 3.6 | | | | 4.3 | | | | 1.1 | | | | 1.3 | |
| | | | | | | | | | | | | | | | | | | |
| | | Other nontrading market risks1 | | | N/A | | | | N/A | | | | 5.3 | | | | 3.9 | |
| | | | | | | | | | | | | | | | | | | |
| | | Total | | | 8.7 | | | | 9.8 | | | | 8.5 | | | | 7.3 | |
| | | | |
| | | 1 N/A indicates that the risk is mostly related to off-balance sheet and liabilities items. | |
| | | The total economic capital figures for nontrading market risk currently do not take into account diversification benefits between the different asset categories except for those of equity compensation, structural foreign exchange risk, pension risk and banking book credit spread risks. — Strategic Investments. Economic capital usage was mainly driven by our participation in Hua Xia Bank Company Limited. — Alternative assets. The nontrading market risk economic capital decreased during 2012 mainly driven from further de-risking initiatives within the alternative assets portfolio. | |
| | | | |
| | | | |
| Deutsche Bank | | 01 – Management Report | | 153 |
| Financial Report 2012 | | Risk Report | | |
| | |
| | | | |
| | |
| | | | |
| — | | Other nontrading market risks: |
| | — | | Interest Rate Risk. Besides the allocation of economic capital to residual outright interest rate risk in the nontrading market risk portfolio, a main component in this category is the maturity transformation of contractually short term deposits. The effective duration of contractually short term deposits is based upon observable client behavior, elasticity of deposit rates to market interest rates (“DRE”), volatility of deposit balances and Deutsche Bank’s own credit spread. Economic capital is derived by stressing modelling assumptions in particular the DRE – for the effective duration of overnight deposits. Behavioral and economic characteristics are taken into account when calculating the effective duration and optional exposures from our mortgages businesses. In total the economic capital usage for December 31, 2012 was€ 1.4 billion predominantly driven by PBC including Postbank, BHW and Deutsche Bank Bauspar, versus
€ 1.5 billion as of December 31, 2011. |
| | — | | Credit Spread Risk. Economic capital charge for portfolios in the banking book subject to material credit spread risk. Economic capital usage was€ 1.6 billion as of December 31, 2012. |
| | — | | Equity Compensation Risk. Risk arising from structural short position in our own share price arising from restricted equity units. The economic capital usage was€ (303) million as of December 31, 2012 on a diversified basis, compared to€ (101) million as of December 31, 2011. The negative contribution to our diversified economic capital was derived from the fact that a reduction of our share price in a downside scenario as expressed by economic capital calculation methodology would reduce the negative impact on our capital position from the equity compensation liabilities. |
| | — | | Pension Risk. Risk arising from our defined benefit obligations, including interest rate risk and inflation risk, credit spread risk, equity risk and longevity risk. The economic capital usage was€ 340 million and€ 191 million as of December 31, 2012 and December 31, 2011 respectively. |
| | — | | Structural foreign exchange risk. Our foreign exchange exposure arising from unhedged capital and retained earnings in non-euro currencies in certain subsidiaries. Our economic capital usage was€ 828 million as of December 31, 2012 on a diversified basis versus€ 1.5 billion as of December 31, 2011. |
| | — | | Guaranteed Funds. The increase in economic capital usage to€ 1.4 billion as of December 31, 2012 was triggered predominately by the higher capital charge for long duration guarantee funds as a result of the persistent low interest rate environment as well as asset allocation adjustments. As of December 31, 2011 the economic capital amounted to€ 931 million. |
Accounting and Valuation of Equity Investments
Outside of trading, equity investments which are neither consolidated for regulatory purposes nor deducted from our regulatory capital are held as equity positions in the regulatory banking book. In our consolidated balance sheet, these equity investments are either classified as “Financial assets available for sale (“AFS”)” or “Equity method investments”. Only an immaterial amount of financial assets designated at fair value through profit and loss which are equity interests is included in the banking book. These investments are not addressed in this section.
For details on our accounting and valuation policies related to AFS equity instruments and investments in associates and joint ventures please refer to Notes 01 “Significant Accounting Policies”,
15 “Financial Instruments carried at Fair Value” and 18 “Equity Method Investments”.
Equity Investments Held
The following section on Equity Investments Held, ending on page 154, presents specific disclosures in relation to Pillar 3. Per regulation it is not required to audit Pillar 3 disclosures. As such this section is labeled unaudited.
The tables below present IFRS classifications and the gains (losses) for equity investments held. These equity investments principally constitute equity positions in the regulatory banking book or capital deductions according to Section 10 (6) KWG. However, the following aspects need to be considered when comparing the equity investments held – presented below – with the equity position in the regulatory banking book:
| — | | Equity investments held by entities, which are consolidated for IFRS purposes but not consolidated for regulatory purposes, are included in the tables. |
| — | | Entities holding equity investments which are considered for regulatory purposes but not consolidated according to IFRS, do not provide IFRS balance sheet and profit or loss information, and are excluded from these tables. The regulatory exposure value (“EAD”) of these excluded equity investments amounted to€ 246 million as of December 31, 2012, and€ 116 million as of December 31, 2011. |
| | | | |
| Deutsche Bank | | 01 – Management Report | | 154 |
| Financial Report 2012 | | Risk Report | | |
| | |
| | | | |
| | |
| | | | |
| — | | Other positions like equity underlyings resulting from derivative transactions or certain subordinated bonds which from a regulatory point of view are also assigned to the exposure class “Equity in the banking book” are excluded from the tables. Their EAD amounted to€ 217 million as of December 31, 2012, and€ 327 million as of December 31, 2011. |
| — | | The regulatory equity position includes€ 3.2 billion EAD as of December 31, 2012, and€ 2.5 billion EAD as of December 31, 2011, in respect of equity investments which are Group-internal from an IFRS perspective. |
| — | | “Non-exchange-traded positions” combine the two regulatory equity classes “Non-exchange-traded, but belonging to an adequately diversified equity portfolio” and “Other equity positions” according to Section 78 SolvV. |
Equity Investments According to IFRS Classification
| | | | | | | | |
| | | Carrying value | |
in€ m. | | Dec 31, 2012 | | | Dec 31, 2011 | |
Financial assets available for sale equity instruments | | | 1,102 | | | | 1,591 | |
Exchange-traded positions | | | 468 | | | | 345 | |
Non-exchange-traded positions | | | 634 | | | | 1,246 | |
| | | | | | | | |
Equity method investments | | | 3,735 | | | | 3,813 | |
Exchange-traded positions | | | 2,395 | | | | 2,227 | |
Non-exchange-traded positions | | | 1,340 | | | | 1,586 | |
| | | | | | | | |
Total equity investments | | | 4,837 | | | | 5,404 | |
| |
A difference between the carrying value of the investment positions and their fair value was only observable for the exchange-traded equity method investments, which had a carrying value of€ 2.4 billion and a fair value of€ 1.8 billion as of December 31, 2012.
Realized Gains (Losses) in the Reporting Period and Unrealized Gains (Losses) at Year-end from Equity Investments
| | | | | | | | |
in€ m. | | 2012 | | | 2011 | |
Gains and losses on disposal | | | 360 | | | | 204 | |
| | | | | | | | |
Impairments | | | (411) | | | | (625) | |
| | | | | | | | |
Pro-rata share of net income (loss) | | | 397 | | | | 222 | |
| | | | | | | | |
Total realized gains (losses) from equity investments | | | 346 | | | | (199) | |
| | Dec 31, 2012 | | | Dec 31, 2011 | |
Unrealized revaluation gains (losses) | | | 335 | | | | 450 | |
| | | | | | | | |
Difference between carrying value and fair value | | | (568) | | | | (152) | |
| | | | | | | | |
Total unrealized gains (losses) from equity investments | | | (233) | | | | 298 | |
| |
For AFS equity investments, the components considered are realized gains and losses from sales and liquidations as well as unrealized revaluation gains and losses and impairments. For equity method investments, the gain and loss elements consist of realized gains and losses from sales and liquidations, pro-rata share of net income (loss), impairments and unrealized revaluation gains (losses) in form of the differences between carrying amounts and fair values. In this respect, the realized gains (losses) on disposals, the impairments and the pro-rata share of net income (loss) are referring to the reporting period 2012 and 2011 whereas the unrealized revaluation gains (losses) as well as the difference between the carrying values and the fair values for the at equity investments represent the amounts as of December 31, 2012, and December 31, 2011.
The valuation gains (losses) presented are in relation to equity investments. Overall the unrealized gains (losses) on listed securities as to be determined for regulatory purposes were€ 122 million as of December 31, 2012, 45 % of which was included in Tier 2 capital, and€ 155 million as of December 31, 2011, 45 % of which was included in Tier 2 capital.
| | | | |
| Deutsche Bank | | 01 – Management Report | | 155 |
| Financial Report 2012 | | Risk Report | | |
| | |
| | | | |
| | |
| | | | |
Operational Risk
Definition of Operational Risk
Operational risk is the potential for failure (incl. the legal component) in relation to employees, contractual specifications and documentation, technology, infrastructure failure and disasters, external influences and customer relationships.
Particular prominent examples of operational risks are the following:
| — | | Fraud Risk arises from an intentional act or omission involving dishonesty, for personal and/or business gain or to avoid personal and/or business loss such as falsification and/or alteration of records and/or reports, facilitation, breach of trust, intentional omission, misrepresentation, concealment, misleading, and abuse of position in order to obtain personal gain, business advantage and/or conceal improper/unauthorized activity. |
| — | | Business Continuity Risk is the risk of incurring losses resulting from the interruption of normal business activities. Interruptions can be caused by: deliberate acts such as sabotage, terrorism, bomb threats, strikes, riots and assaults on the bank’s staff; natural calamities such as hurricanes, snow storms, floods, and earthquakes; or other unforeseen incidents such as accidents, fires, explosions, utility outrages, and political unrest. |
| — | | Regulatory Compliance Risk is the potential that we may incur regulatory sanctions (such as restrictions on business activities or enhanced reporting requirements), financial and/or reputational damage arising from its failure to comply with applicable laws, rules and regulations. |
| — | | Information Technology Risk is the risk that our Information Technology will lead to quantifiable losses. This comes from inadequate information technology and processing in terms of manageability, exclusivity, integrity, controllability, and continuity. |
| — | | Outsourcing (Vendor) Risk arises from adverse events and risk concentrations due to failures in vendor selection, insufficient controls and oversight over a vendor and/or services provided by a vendor and other impacts to the vendor which could not happen to us by nature, severity or frequency. |
Legal Risk can materialize in any of the above risk categories. This is due to the fact that in each category we may be the subject of a claim or proceedings alleging non-compliance with legal or statutory responsibilities and/or losses allegedly due to inaccurately drafted contracts.
Operational risk excludes business and reputational risk.
Organizational Structure
The Head of Operational Risk Management (“ORM”) chairs the Operational Risk Management Committee (“ORMC”), which is a permanent sub-committee of the Risk Executive Committee and is composed of the operational risk officers from our business divisions and our infrastructure functions. It is the main decision-making committee for all operational risk management matters.
While the day-to-day operational risk management lies with our business divisions and infrastructure functions, the Operational Risk Management function manages the cross divisional and cross regional operational risk as well as risk concentrations and promotes a consistent application of our operational risk management strategy across the bank. Based on this Business Partnership Model we aim to maintain close monitoring and high awareness of operational risk.
Managing Our Operational Risk
We manage operational risk based on a group-wide consistent framework that enables us to determine our operational risk profile in comparison to our risk appetite and systematically identify operational risk themes and concentrations to define risk mitigating measures and priorities. The global operational risk framework is applicable to all risk types included in the definition for operational risk and thus also applies to each of the above defined individual risk types. The newly established business division NCOU fully applies our global operational risk framework.
| | | | |
| Deutsche Bank | | 01 – Management Report | | 156 |
| Financial Report 2012 | | Risk Report | | |
| | |
| | | | |
| | |
| | | | |
In order to cover the broad range of operational risk as outlined in the definition of operational risk, our framework applies a number of techniques. These aim to efficiently manage the operational risk in our business and are used to identify, assess and mitigate operational risk.
The applied techniques are:
| — | | The continuous collection of operational risk loss events is a prerequisite for operational risk management including detailed analyses, definition of mitigating actions and timely information to senior management. We collect all losses above€ 10,000 in our “db-Incident Reporting System” (“dbIRS”). |
| — | | Our Lessons Learned process is required for events, including near misses, above€ 1 million. This process includes but is not limited to: |
| | |
— | | systematic risk analyses including a description of the business environment in which the loss occurred, including previous events, near misses and event specific Key Risk Indicators (“KRI”), |
— | | consideration of any risk management decisions in respect of the specific risk taken, |
— | | root cause analyses, |
— | | identification of control improvements and other actions to prevent and/or mitigate recurrence, and |
— | | assessment of the residual operational risk exposure. |
| The Lessons Learned process serves as an important mean to identify inherent areas of risk and to define appropriate risk mitigating actions. All corrective actions are captured and monitored for resolution via actions plans in our tracking system “dbTrack”. Performance of all corrective actions and their resolution status is reported on a monthly basis to senior management via the ORMC. |
| — | | We systematically utilize information on external events occurring in the banking industry to prevent similar incidents from happening to us, e. g. by particular deep dive analysis or risk profile reviews. |
| — | | In addition to internal and external loss information, scenarios are utilized and actions are derived from them. The set of scenarios consists of relevant external scenarios provided by a public database and internal scenarios. The latter are generated to complete our risk profile. |
| — | | Regular operational risk profile reports at group level for our business divisions, the countries in which we operate and our infrastructure functions are reviewed and discussed with the department’s senior management. The regular performance of the risk profile reviews enables us to detect changes to the business unit’s risk profiles as well as risk concentrations across the Group early and to take corrective actions. |
| — | | We assess and approve the impact of changes to our risk profile as a result of new products, outsourcings, strategic initiatives and acquisitions and divestments. |
| — | | Once operational risks are identified, mitigation is required following the “as low as reasonably practicable (ALARP)” principle by balancing the cost of mitigation with the benefits thereof and formally accepting the residual operational risk. Risks which contravene applicable national or international regulations and legislation cannot be accepted; once identified, such risks must always be mitigated. |
| — | | We monitor risk mitigating measures identified via operational risk management techniques for resolution within our tracking tool “dbTrack”. Higher than important residual operational risks need to be accepted by the ORMC. |
| — | | We perform top risk analyses in which the results of the aforementioned activities are considered. The Top Risk Analyses are a primary input for the annual operational risk management strategy and planning process. Besides the operational risk management strategic and tactical planning we define capital and expected loss targets which are monitored on a regular basis within a quarterly forecasting process. |
| — | | KRIs are used to monitor the operational risk profile and alert the organization to impending problems in a timely fashion. They allow via our tool “dbScore” the monitoring of the bank’s control culture and business environment and trigger risk mitigating actions. KRIs facilitate the forward looking management of operational risk based on early warning signals returned by the KRIs. |
| — | | In our bottom-up Self Assessment (“SA”) process, which is conducted at least annually, areas with high risk potential are highlighted and risk mitigating measures to resolve issues are identified. In general, it is performed in our tool “dbSAT”. On a regular basis we conduct risk workshops aiming to evaluate risks specific to countries and local legal entities we are operating in and take appropriate risk mitigating actions. |
| | | | |
| Deutsche Bank | | 01 – Management Report | | 157 |
| Financial Report 2012 | | Risk Report | | |
| | |
| | | | |
| | |
| | | | |
Additional methodologies and tools implemented by the responsible divisions are utilized to complement the global operational risk framework and specifically address the individual risk types. These include but are not limited to:
| — | | Legal Risk Lessons Learned process: The Legal Department is responsible for managing the legal and reputational risk associated with the bank’s litigation and regulatory enforcement matters. The Legal Department discharges this responsibility through the management and supervision of these matters by the litigation and regulatory enforcement attorneys (“LRAs”) assigned to them, and the regional and global supervision of those LRAs within the Legal Department. The LRAs day-to-day management and oversight of litigation and regulatory enforcement matters may provide a unique perspective on historical practices, possible legal and reputational risk that may result from such historical practices and possible steps that may be taken to mitigate such future risks. Within the operational risk management framework a specific Lessons Learned process for Legal losses is conducted to consider the lessons learned from litigation and regulatory enforcement actions. This includes permanent involvement of Legal, ORM and the Divisional Operational Risk Officers (“DOROs”). |
| — | | The operational risk in Outsourcing Risk is managed by the Internal Relocation and Outsourcing (“IRO”) Process and documented in the IRO database. The outsourcing risk is assessed and managed for all outsourcing arrangements individually following the Smartsourcing Risk Management Policy and the overall ORM framework. A broad governance structure is established to promote appropriate risk levels. |
| — | | Fraud Risk is managed based on section 25a of the German Banking Act as well as other legal and regulatory requirements on a risk based approach, governed by the Global Anti Fraud Policy and corresponding Compliance and Anti-Money-Laundering (AML) framework. In line with regulatory requirements a global risk assessment is performed on a regular basis. Within the general management of operational risks dedicated Fraud Risk relevant aspects are part of the Self Assessments. |
| — | | We manage Business Continuity (“BC”) Risk with our Business Continuity Management (“BCM”) Program, which outlines core procedures for the relocation or the recovery of operations in response to varying levels of disruption. Within this program each of our core businesses functions and infrastructure groups institute, maintain and periodically test business continuity plans (“BC Plans”) to promote continuous and reliable service. The BCM Program has defined roles and responsibilities, which are documented in corporate standards. Compliance with these standards is monitored regionally by dedicated business continuity teams. Reporting to the Group Resiliency Steering Committee (the delegated authority from the Management Board) is a quarterly requirement. Furthermore, key information of the established BCM control environment is used within the general operational risk management for KRIs. |
| — | | The operational risk in Technology Risk is managed within the technology area following international standards for IT management. Applications and IT infrastructure are catalogued and assessed on a regular basis and stability monitoring is established. Key outcomes of the established assessment and control environment are used within the general management or operational risks for KRIs and SAs. |
Measuring Our Operational Risks
We calculate and measure the regulatory and economic capital for operational risk using the internal Advanced Measurement Approach (“AMA”) methodology. Our AMA capital calculation is based upon the loss distribution approach (“LDA”). Gross losses from historical internal and external loss data (Operational Riskdata eXchange Association (“ORX”) consortium data), adjusted for direct recoveries, and external scenarios from a public database complemented by internal scenario data are used to estimate the risk profile (that is, a loss frequency and a loss severity distribution). Thereafter, the frequency and severity distributions are combined in a Monte Carlo simulation to generate losses over a one year time horizon. Finally, the risk mitigating benefits of insurance are applied to each loss generated in the Monte Carlo simulation. Correlation and diversification benefits are applied to the net losses in a manner compatible with regulatory requirements to arrive at a net loss distribution at the Group level covering expected and unexpected losses. Capital is then allocated to each of the business divisions and both a qualitative adjustment (“QA”) and an expected loss deduction are made.
| | | | |
| Deutsche Bank | | 01 – Management Report | | 158 |
| Financial Report 2012 | | Risk Report | | |
| | |
| | | | |
| | |
| | | | |
The qualitative adjustment reflects the effectiveness and performance of the day-to-day operational risk management activities via KRIs and Self Assessment scores focusing on the business environment and internal control factors. The qualitative adjustment is applied as a percentage adjustment to the final capital number. This approach makes qualitative adjustment transparent to the management of the businesses and provides feedback on their risk profile as well as on the success of their management of operational risk. It thus provides incentives for the businesses to continuously improve the management of operational risks in their areas.
The expected loss (“EL”) for operational risk is based on historical loss experience and expert judgment considering business changes denoting the expected cost of operational losses for doing business. To the extent it is considered in the divisional business plans it is deducted from the AMA capital figure. The unexpected losses per business division (after QA and expected loss) are aggregated to produce the Group AMA capital figure.
Economic capital is derived from the 99.98 % percentile and allocated to the business divisions and used in performance measurement and resource allocation, providing an incentive to manage operational risk, optimizing economic capital utilization. The regulatory capital operational risk applies the 99.9 % percentile.
Since December 2007, we have maintained approval by the BaFin to use the AMA. In 2012, the integration of Postbank into our group-wide framework was finalized. We are waiting for regulatory approval to integrate Postbank into our regulatory capital calculation.
The economic capital usage for operational risk increased by€ 172 million, or 3.5 %, to€ 5 billion as of December 31, 2012.
Economic Capital Usage for Operational Risk by Business Division
| | | | | | | | | | | | | | | | | | | | | | |
| | | | | | | | | | | | | | | 2012 increase (decrease) from 2011 | |
| in€ m. | | | | Dec 31, 2012 | | | | | Dec 31, 2011 | | | | | in € m. | | | in % | |
| | | | | | | | | | | | | | | | | | | | | | |
Corporate Banking & Securities | | | | | 2,049 | | | | | | 2,710 | | | | | | (661) | | | | (24) | |
| | | | | | | | | | | | | | | | | | | | | | |
Global Transaction Banking | | | | | 38 | | | | | | 64 | | | | | | (26) | | | | (41) | |
| | | | | | | | | | | | | | | | | | | | | | |
Asset & Wealth Management | | | | | 559 | | | | | | 544 | | | | | | 15 | | | | 3 | |
| | | | | | | | | | | | | | | | | | | | | | |
Private & Business Clients | | | | | 227 | | | | | | 239 | | | | | | (12) | | | | (5) | |
| | | | | | | | | | | | | | | | | | | | | | |
Non-Core Operations Unit | | | | | 2,145 | | | | | | 1,289 | | | | | | 856 | | | | 66 | |
| | | | | | | | | | | | | | | | | | | | | | |
Total economic capital usage for operational risk | | | | | 5,018 | | | | | | 4,846 | | | | | | 172 | | | | 4 | |
| |
The increase is primarily due to higher industry operational risk loss experience, the integration of BHF-BANK into our AMA model in the first quarter 2012, as well as a model refinement in the second quarter 2012. The capital continues to include the safety margin applied in our AMA model, which was implemented in 2011 to cover unforeseen legal risks from the current financial crisis.
At the beginning of 2012, the sub-allocation methodology within CB&S was changed and increased the capital for the part that was later merged into NCOU.
Our Operational Risk Management Stress Testing Concept
We conduct stress testing on a regular basis and separate from our AMA methodology to analyze the impact of extreme situations on our capital and the profit-and-loss account. In 2012, Operational Risk Management took part in all firm-wide stress test scenarios and assessed and contributed the Operational Risk impact to the various stress levels of the scenarios. The Operational Risk impact to stress test scenarios has been moderate and remained in the expected range in regards to capital, but intense for simulated low-frequency high-impact event hits to the Consolidated Statement of Income.
Our AMA Model Validation and Quality Assurance Review Concept
We independently validate all our AMA model components such as but not limited to scenario analysis, KRIs and Self Assessments, Expected Loss and internal loss data individually. The results of the validation exercise are summarized in validation reports and issues identified are followed up for resolution. This promotes enhancement of the methodologies. The validation activities performed in 2012 showed that our AMA model components are valid and regulatory compliant.
| | | | |
| Deutsche Bank | | 01 – Management Report | | 159 |
| Financial Report 2012 | | Risk Report | | |
| | |
| | | | |
| | |
| | | | |
Quality Assurance Reviews are performed for management decisions as well as AMA components requiring data input provided by business divisions and result in capital impact. The AMA components data and documentation is challenged and compared across business divisions to help us maintain consistency and adequacy for any capital calculation.
Role of Corporate Insurance/Deukona
The definition of our insurance strategy and supporting insurance policy and guidelines is the responsibility of our specialized unit Corporate Insurance/Deukona (CI/D). CI/D is responsible for our global corporate insurance policy which is approved by our Management Board.
CI/D is responsible for acquiring insurance coverage and for negotiating contract terms and premiums. CI/D also has a role in the allocation of insurance premiums to the businesses. CI/D specialists assist in devising the method for reflecting insurance in the capital calculations and in arriving at parameters to reflect the regulatory requirements. They validate the settings of insurance parameters used in the AMA model and provide respective updates. CI/D is actively involved in industry efforts to reflect the effect of insurance in the results of the capital calculations.
We buy insurance in order to protect ourselves against unexpected and substantial unforeseeable losses. The identification, definition of magnitude and estimation procedures used are based on the recognized insurance terms of “common sense”, “state-of-the-art” and/or “benchmarking”. The maximum limit per insured risk takes into account the reliability of the insurer and a cost/benefit ratio, especially in cases in which the insurance market tries to reduce coverage by restricted/limited policy wordings and specific exclusions.
We maintain a number of captive insurance companies, both primary and re-insurance companies. However, insurance contracts provided are only considered in the modeling/calculation of insurance-related reductions of operational risk capital requirements where the risk is re-insured in the external insurance market.
The regulatory capital figure includes a deduction for insurance coverage amounting to€ 474 million as of December 31, 2012. Currently, no other risk transfer techniques beyond insurance are recognized in the AMA model.
CI/D selects insurance partners in strict compliance with the regulatory requirements specified in the Solvency Regulations and the Operational Risks Experts Group recommendation on the recognition of insurance in advanced measurement approaches. The insurance portfolio, as well as CI/D activities, is audited by Group Audit on a risk-based approach.
Liquidity Risk
Liquidity risk is the risk arising from our potential inability to meet all payment obligations when they come due or only being able to meet these obligations at excessive costs.
Our liquidity risk management framework has been an important factor in maintaining adequate liquidity and in managing our funding profile during 2012. As of year end 2012, Postbank’s liquidity risk management framework is now integrated within that of the overall Deutsche Bank Group, and as such we no longer include a separate discussion of Liquidity Risk at Postbank (see 2011 Financial Report/Risk Report). Postbank is therefore reflected within the following sections on a consistent basis with all other group entities.
| | | | |
| Deutsche Bank | | 01 – Management Report | | 160 |
| Financial Report 2012 | | Risk Report | | |
| | |
| | | | |
| | |
| | | | |
| | |
| | | Liquidity Risk Management Framework The Management Board defines our liquidity risk strategy, and in particular our tolerance for liquidity risk based on recommendations made by Treasury and the Capital and Risk Committee. At least once every year the Management Board will review and approve the limits which are applied to the Group to measure and control liquidity risk as well as our long-term funding and issuance plan. Our Treasury function is responsible for the management of our liquidity and funding risk globally as defined in the liquidity risk strategy. Our liquidity risk management framework is designed to identify, measure and manage our liquidity risk position. Our overall liquidity and funding is being reported to the Management Board at least weekly via a Liquidity Scorecard. Our liquidity risk management approach starts at the intraday level (operational liquidity) managing the daily payments queue, forecasting cash flows and factoring in our access to Central Banks. It then covers tactical liquidity risk management dealing with access to secured and unsecured funding sources. Finally, the strategic perspective comprises the maturity profile of all assets and liabilities (Funding Matrix) and our issuance strategy. Our cash-flow based reporting system provides daily liquidity risk information to global and local management. Stress testing and scenario analysis plays a central role in our liquidity risk management framework. This also incorporates an assessment of asset liquidity, i.e., the characteristics of our asset inventory, under various stress scenarios as well as contingent funding requirements from off-balance-sheet commitments. The monthly stress testing results are used to calibrate our short-term wholesale funding profile limits (both unsecured and secured) and thereby ensure we remain within the Board’s overall liquidity risk tolerance. Short-term Liquidity and Wholesale Funding Our group-wide reporting system tracks all contractual cash flows from wholesale funding sources on a daily basis over a 12-month horizon. We consider as wholesale funding for this purpose unsecured liabilities raised primarily by our Global Markets Finance business as well as secured liabilities primarily raised by our Global Markets Finance and Equities businesses. Such liabilities primarily come from corporates, banks and other financial institutions, governments and sovereigns. Wholesale funding profile limits, which are calibrated against our stress testing results and are approved by the Management Board according to internal governance, express our maximum tolerance for liquidity risk. The wholesale funding limits apply to the respective cumulative global cash outflows as well as the total volume of unsecured wholesale funding and are monitored on a daily basis. Our Liquidity Reserves are the primary mitigant against stresses in short-term wholesale funding markets. At an individual entity level we may set liquidity outflow limits across a broader range of cash flows where this is considered to be meaningful or appropriate. Funding Diversification Diversification of our funding profile in terms of investor types, regions, products and instruments is an important element of our liquidity risk management framework. Our most stable funding sources are capital markets and equity, retail, and transaction banking clients. Other customer deposits and borrowing from wholesale clients are additional sources of funding. Discretionary wholesale funding represents unsecured wholesale liabilities sourced primarily by our Global Markets Finance business. Given the relatively short-term nature of these liabilities, they are primarily used to fund cash and liquid trading assets. To ensure the additional diversification of our refinancing activities, we hold a Pfandbrief license allowing us to issue mortgage Pfandbriefe. In 2012 we continued to focus on increasing our most stable funding components, and we have seen increases of€ 12.2 billion (4.4 %) and€ 21.4 billion (12.4 %) from retail and transaction banking clients respectively. We maintain access to short-term wholesale funding markets, on both a secured and unsecured basis. |
| | | | |
| Deutsche Bank | | 01 – Management Report | | 161 |
| Financial Report 2012 | | Risk Report | | |
| | |
| | | | |
| | |
| | | | |
Discretionary wholesale funding comprises a range of unsecured products e.g. Certificates of Deposit (CDs), Commercial Paper (CP) as well as term, call and overnight deposits across tenors primarily up to one year. In addition, included within Financing Vehicles, is€ 8.6 billion of asset-backed commercial paper (ABCP) issued through conduits.
The overall volume of discretionary wholesale funding and secured funding fluctuated between reporting dates based on our underlying business activities. Higher volumes, primarily in secured funding transactions, are largely driven by increased client related securities financing activities as well as intra quarter growth in liquid trading inventories. We reduced the volume of discretionary wholesale funding during the year by€ 40.0 billion. This reduction was a consequence of the increase in more stable funding sources combined with a decrease, on a like for like basis, in Liquidity Reserves.
To avoid any unwanted reliance on these short-term funding sources, and to ensure a sound funding profile at the short end, which complies with the defined risk tolerance, we have implemented limit structures (across tenor) to these funding sources, which are derived from our stress testing analysis.
The following chart shows the composition of our external funding sources that contribute to the liquidity risk position as of December 31, 2012 and December 31, 2011, both in EUR billion and as a percentage of our total external funding sources.
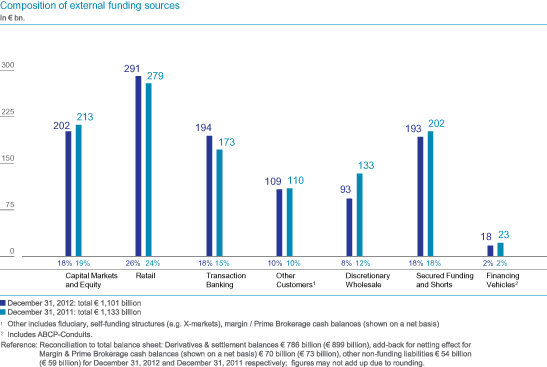
| | | | |
| Deutsche Bank | | 01 – Management Report | | 162 |
| Financial Report 2012 | | Risk Report | | |
| | |
| | | | |
| | |
| | | | |
| | | | | | | | | | | | | | | | | | | | | | | | | | | | | | | | |
The following table shows the contractual maturity of our short-term wholesale funding (comprising discretionary wholesale funding plus asset-backed commercial paper), as well as our capital markets issuance (of which 33 % is to retail customers). Maturity of wholesale funding and capital markets issuance | |
| | | | | | | | | | | | | | | | | | | | | Dec 31, 2012 | |
| | | | |
| in€ m. | | Not more
than 1 month | | | Over 1 month
but not
more
than 3 months | | | Over 3 months
but not
more
than 6 months | | | Over 6 months
but not
more
than 1
year | | | Sub-total less than 1 year | | | Over 1 year
but not more than 2 years | | | Over 2 years | | | Total | |
| | | | | | | | | | | | | | | | | | | | | | | | | | | | | | | | |
| Deposits from banks | | | 24,627 | | | | 5,820 | | | | 2,542 | | | | 870 | | | | 33,859 | | | | 25 | | | | 214 | | | | 34,098 | |
| | | | | | | | | | | | | | | | | | | | | | | | | | | | | | | | |
| Deposits from other customers | | | 20,776 | | | | 1,996 | | | | 779 | | | | 465 | | | | 24,015 | | | | 185 | | | | 294 | | | | 24,495 | |
| | | | | | | | | | | | | | | | | | | | | | | | | | | | | | | | |
CDs and CP | | | 9,978 | | | | 14,880 | | | | 5,329 | | | | 3,625 | | | | 33,812 | | | | 283 | | | | 183 | | | | 34,277 | |
| | | | | | | | | | | | | | | | | | | | | | | | | | | | | | | | |
ABCP | | | 4,552 | | | | 3,721 | | | | 376 | | | | – | | | | 8,649 | | | | – | | | | – | | | | 8,649 | |
| | | | | | | | | | | | | | | | | | | | | | | | | | | | | | | | |
| Senior unsecured vanilla debt | | | 1,972 | | | | 4,921 | | | | 5,101 | | | | 4,489 | | | | 16,483 | | | | 6,929 | | | | 37,419 | | | | 60,832 | |
| | | | | | | | | | | | | | | | | | | | | | | | | | | | | | | | |
| Senior unsecured structured debt | | | 969 | | | | 1,271 | | | | 1,331 | | | | 2,640 | | | | 6,210 | | | | 4,611 | | | | 21,184 | | | | 32,005 | |
| | | | | | | | | | | | | | | | | | | | | | | | | | | | | | | | |
| Covered bonds/ABS | | | 1,501 | | | | 1,120 | | | | – | | | | 11 | | | | 2,631 | | | | 3,555 | | | | 25,316 | | | | 31,502 | |
| | | | | | | | | | | | | | | | | | | | | | | | | | | | | | | | |
| Subordinated liabilities | | | 2,180 | | | | 4,704 | | | | 1,750 | | | | 1,262 | | | | 9,898 | | | | 1,069 | | | | 11,940 | | | | 22,906 | |
| | | | | | | | | | | | | | | | | | | | | | | | | | | | | | | | |
Other | | | 7 | | | | 33 | | | | 12 | | | | 6 | | | | 58 | | | | 18 | | | | 227 | | | | 303 | |
| | | | | | | | | | | | | | | | | | | | | | | | | | | | | | | | |
Total1 | | | 66,563 | | | | 38,465 | | | | 17,220 | | | | 13,368 | | | | 135,616 | | | | 16,675 | | | | 96,777 | | | | 249,068 | |
| |
| Of which secured | | | 6,053 | | | | 4,841 | | | | 376 | | | | 11 | | | | 11,281 | | | | 3,555 | | | | 25,316 | | | | 40,152 | |
| | | | | | | | | | | | | | | | | | | | | | | | | | | | | | | | |
| Of which unsecured | | | 60,509 | | | | 33,625 | | | | 16,844 | | | | 13,357 | | | | 124,335 | | | | 13,120 | | | | 71,461 | | | | 208,917 | |
| |
| | 1 | Liabilities with call features are shown at earliest legally exercisable call date. No assumption is made as to whether such calls would be exercised. |
| | | | |
| | The total volume (€ 135.6 billion) of maturing wholesale liabilities and capital markets issuance maturing within one year should be viewed in the context of our total Liquidity Reserves of€ 232.2 billion. |
| | | | | |
| | | Funding Matrix We map all funding-relevant assets and all liabilities into time buckets corresponding to their economic maturities to compile a maturity profile (funding matrix). Given that trading assets are typically more liquid than their contractual maturities suggest, we determine individual liquidity profiles reflecting their relative liquidity value. We take assets and liabilities from the retail bank (mortgage loans and retail deposits) that show a behavior of being renewed or prolonged regardless of capital market conditions and assign them to time buckets reflecting the expected prolongation. Wholesale banking products are included with their contractual maturities. The funding matrix identifies the excess or shortfall of assets over liabilities in each time bucket, facilitating management of open liquidity exposures. The funding matrix analysis together with the strategic liquidity planning process, which forecasts the funding supply and demand across business units, provides the key input parameter for our annual capital market issuance plan. Upon approval by the Management Board the capital market issuance plan establishes issuing targets for securities by tenor, volume and instrument. As of the year-end 2012, we were long funded in each of the annual time buckets of the funding matrix (>1 year to >10 year). Funding Markets and Capital Markets Issuance Credit markets over 2012 continued to be marked by overall macro-economic developments and the eurozone sovereign crisis. Our 5 year CDS traded within a range of 92 – 222 bps, peaking in July. Since then, the spread has declined and as of year-end was trading close to its lows for the year. The spreads on our bonds exhibited similar volatility. For example, our 5 year EUR benchmark (5.125 % coupon, maturing in August 2017) traded in a range of 40 – 163 bps, also closing the year close to its lows. Our 2012 funding plan of€ 15.0 – 20.0 billion, comprising debt issuance with an original maturity in excess of one year, was completed in early September and we concluded 2012 having raised€ 17.9 billion in term funding. This funding was broadly spread across the following funding sources: unsecured benchmark issuance (€ 3.1 billion), unsecured retail-targeted issuance (€ 5.9 billion), unsecured private placements (€ 6.8 billion) and covered bond or Pfandbrief issuance (€ 2.0 billion). Of the€ 17.9 billion total, the majority was in EUR (€ 10.2 billion). We also issued€ 6.2 billion in USD and smaller amounts in JPY and GBP. In addition to direct issuance, we use long-term cross currency swaps to manage our funding needs outside of EUR. Our investor base comprised retail customers (33 %), banks (25 %), asset managers and pension funds (15 %), insurance companies (6 %) and other, including institutional investors (21 %). The geographical distribution was split between Germany (28 %), Rest of Europe (31 %), US (21 %), Asia Pacific (16 %) and Other (4 %). Of our total capital markets issuance outstanding as of December 31, 2012, approximately 80 % was issued on an unsecured basis. |
| | | | |
| Deutsche Bank | | 01 – Management Report | | 163 |
| Financial Report 2012 | | Risk Report | | |
| | |
| | | | |
| | |
| | | | |
The average spread of our issuance over the relevant floating index (e.g., Libor) was 64 bps for the full year with an average tenor of 4.2 years. Our issuance activities were evenly spread over the first three quarters with volumes reducing in the fourth quarter as we completed our plan. We issued the following volumes over each quarter:€ 5.7 billion,€ 4.8 billion,€ 5.5 billion and€ 1.9 billion, respectively.
In 2013, our funding plan is up to€ 18.0 billion which we plan to cover by accessing the above four sources, without being overly dependent on any one source. We also plan to raise a portion of this funding in USD and may enter into cross currency swaps to manage any residual requirements. We have total capital markets maturities, excluding legally exercisable calls of approximately€ 24.0 billion in 2013.
For information regarding the maturity profile of our wholesale funding and capital markets issuance please refer to the previous table.
Transfer Pricing
We operate a transfer pricing framework that applies to all businesses and ensures pricing of (i) assets in accordance with their underlying liquidity risk, (ii) liabilities in accordance with their funding maturity and (iii) contingent liquidity exposures in accordance with the cost of providing for commensurate liquidity reserves to fund unexpected cash requirements.
Within this transfer pricing framework we allocate funding and liquidity risk costs and benefits to the firm’s business units and set financial incentives in line with the firm’s liquidity risk guidelines. Transfer prices are subject to liquidity (term) premiums depending on market conditions. Liquidity premiums are set by Treasury and picked up by a segregated liquidity account. The Treasury liquidity account is the aggregator of long-term liquidity costs. The management and cost allocation of the liquidity account is the key variable for transfer pricing funding costs within Deutsche Bank.
Liquidity Reserves
Liquidity Reserves comprise available cash and cash equivalents, highly liquid securities (includes government, agency and government guaranteed) as well as other unencumbered central bank eligible assets. The volume of the Liquidity Reserves is a function of the expected stress result, both at an aggregate level as well as at an individual currency level. To the extent we receive incremental short-term wholesale liabilities which attract a high stress roll-off, we will largely keep the proceeds of such liabilities in cash or highly liquid securities as a stress mitigant. As such, the total volume of Liquidity Reserves will fluctuate according to the level of short-term wholesale liabilities held, although this has no material impact on our overall liquidity position under stress. Liquidity Reserves only include assets that are freely transferable within the group, or can be applied against local entity stress outflows. These reserves are held across major currencies and key locations in which the bank is active. The vast majority of our Liquidity Reserves are centrally held at our parent level or at our foreign branches. Size and composition are subject to regular senior management review. The haircuts applied reflect our assumption of the actual liquidity value that could be obtained, primarily through secured funding, and take into account the experience observed in secured funding markets at times of stress.
The following table presents the composition of our Liquidity Reserves for the dates specified. As of December 31, 2012, Liquidity Reserves were€ 232 billion (now including Postbank with€ 26 billion following integration). The December 31, 2011 comparative amounts do not include Postbank. Excluding Postbank, we saw a decrease in our Liquidity Reserves of€ 16 billion. The primary driver of this was a reduction of€ 40 billion in our discretionary wholesale funding during the year, offset by growth in more stable funding sources. Excluding Postbank, our average Liquidity Reserves during the year were€ 211 billion.
| | | | |
| Deutsche Bank | | 01 – Management Report | | 164 |
| Financial Report 2012 | | Risk Report | | |
| | |
| | | | |
| | |
| | | | |
| | | | | | | | | | | | |
| Composition of our liquidity reserves by parent company (including branches) and subsidiaries | |
| | | | | | Dec 31, 2012 | | | Dec 31, 2011 | |
| | | | | | | | |
in€ bn. | | | Carrying Value | | | | Liquidity Value | | | | Carrying Value | |
| | | | | | | | | | | | |
Available cash and cash equivalents (held primarily at central banks) | | | 128 | | | | 128 | | | | 1401 | |
| | | | �� | | | | | | | | |
Parent (incl. foreign branches) | | | 112 | | | | 112 | | | | 133 | |
| | | | | | | | | | | | |
Subsidiaries | | | 16 | | | | 16 | | | | 7 | |
| | | | | | | | | | | | |
Highly liquid securities (includes government, government guaranteed and agency securities) | | | 91 | | | | 82 | | | | 65 | |
| | | | | | | | | | | | |
Parent (incl. foreign branches) | | | 56 | | | | 52 | | | | 56 | |
| | | | | | | | | | | | |
Subsidiaries | | | 35 | | | | 30 | | | | 9 | |
| | | | | | | | | | | | |
Other unencumbered central bank eligible securities | | | 13 | | | | 10 | | | | 18 | |
| | | | | | | | | | | | |
Parent (incl. foreign branches) | | | 12 | | | | 9 | | | | 18 | |
| | | | | | | | | | | | |
Subsidiaries | | | 1 | | | | 1 | | | | 0 | |
| | | | | | | | | | | | |
Total liquidity reserves | | | 232 | | | | 220 | | | | 2231 | |
| | | | | | | | | | | | |
Parent (incl. foreign branches) | | | 180 | | | | 173 | | | | 207 | |
| | | | | | | | | | | | |
Subsidiaries | | | 52 | | | | 47 | | | | 16 | |
| |
| | 1 | Amounts previously disclosed for December 31, 2011 have been adjusted to include also liquidity reserves which cannot be freely transferred across the group, but which are available to mitigate stress outflows in the entities in which they are held. |
| | | | |
| | The above represents those assets that are unencumbered and which could most readily be used as a source of liquidity over a short-term stress horizon. Carrying value represents market value of Liquidity Reserves. Liquidity value represents the value we give to our Liquidity Reserves, post haircut, under our combined stress scenario assumptions. For an analysis of the pledged assets on the balance sheet, please refer to Note 22 “Assets Pledged and Received as Collateral”. |
| | | | | |
| | | Stress Testing and Scenario Analysis We use stress testing and scenario analysis to evaluate the impact of sudden and severe stress events on our liquidity position. The scenarios we apply have been based on historic events, such as the 1987 stock market crash, the 1990 U.S. liquidity crunch and the September 2001 terrorist attacks, liquidity crisis case studies and hypothetical events, as well as the lessons learned from the latest financial markets crisis. They include the prolonged term money-market and secured funding freeze, collateral repudiation, reduced fungibility of currencies, stranded syndications as well as other systemic knock-on effects. The scenario types cover institution-specific events (e.g. rating downgrade), market related events (e.g. systemic market risk) as well as a combination of both, which links a systemic market shock with a multi-notch rating downgrade. We apply stress scenarios to selected significant currencies and entities. Those scenarios are subject to regular reviews and reappraisal. Under each of these scenarios we assume a high degree of rollovers of maturing loans to non-wholesale customers (in order to support franchise value) whereas the rollover of liabilities will be partially or fully impaired resulting in a funding gap. In this context wholesale funding from the most risk sensitive sources (including unsecured funding from commercial banks, money market mutual funds, as well as asset backed commercial paper) is assumed to contractually roll off in the acute phase of stress. In addition we analyze the potential funding requirements from contingent risks which could materialize under stress. Those include drawings of credit facilities, increased collateral requirements under derivative agreements as well as outflows from deposits with a contractual rating trigger. We then model the steps we would take to counterbalance the resulting net shortfall in funding. Countermeasures would include our Liquidity Reserves, as well as potential further asset liquidity from other unencumbered securities. Stress testing is conducted at a global and individual country level and across significant non-eurozone currencies. We review stress-test assumptions at least annually and have increased the severity of a number of these assumptions through the course of 2012. |
| | | | | |
| | Stress testing is fully integrated in our liquidity risk management framework. For this purpose we use the contractual wholesale cash flows per currency and product over an eight-week horizon (which we consider the most critical time span in a liquidity crisis) and apply the relevant stress case to all potential risk drivers from |
| | | | |
| Deutsche Bank | | 01 – Management Report | | 165 |
| Financial Report 2012 | | Risk Report | | |
| | |
| | | | |
| | |
| | | | |
on balance sheet and off balance sheet products. Beyond the eight week time horizon we analyze on a monthly basis the impact of a more prolonged stress period extending out to twelve months. The liquidity stress testing provides the basis for the bank’s contingency funding plan which is approved by the Management Board.
Our stress testing analysis assesses our ability to generate sufficient liquidity under extreme conditions and is a key input when defining our target liquidity risk position. The analysis is performed monthly. The following table shows stress testing results as of December 31, 2012. For each scenario, the table shows what our cumulative funding gap would be over an eight-week horizon after occurrence of the triggering event, how much counterbalancing liquidity we could generate via different sources as well as the resulting net liquidity position.
Stress Testing Results
| | | | | | | | | | | | |
| in€ bn. | | Funding Gap1 | | | Gap Closure2 | | | Net Liquidity Position | |
| | | | | | | | | | | | |
Systemic market risk | | | 39 | | | | 217 | | | | 178 | |
| | | | | | | | | | | | |
Emerging markets | | | 15 | | | | 216 | | | | 201 | |
| | | | | | | | | | | | |
1 notch downgrade (DB specific) | | | 45 | | | | 222 | | | | 177 | |
| | | | | | | | | | | | |
Downgrade to A-2/P-2 (DB specific) | | | 215 | | | | 262 | | | | 47 | |
| | | | | | | | | | | | |
Combined3 | | | 227 | | | | 255 | | | | 28 | |
| |
| 1 | Funding gap caused by impaired rollover of liabilities and other projected outflows. |
| 2 | Based on liquidity generation through Liquidity Reserves (after haircuts) and other countermeasures. |
| 3 | Combined impact of systemic market risk and downgrade to A-2/P-2. |
The table below presents the amount of additional collateral required in the event of a one- or two-notch downgrade by rating agencies.
Additional Contractual Obligations
| | | | | | | | |
| | | | | | Dec 31, 2012 | |
| | | | |
| in€ m. | | One-notch
downgrade | | | Two-notch
downgrade | |
| | | | | | | | |
Contractual derivatives funding or margin requirements | | | 3,593 | | | | 6,912 | |
| | | | | | | | |
Other contractual funding or margin requirements | | | 544 | | | | 1,080 | |
| |
With the increasing importance of liquidity management in the financial industry, we maintain an active dialogue with central banks, supervisors, rating agencies and market participants on liquidity risk-related topics. We participate in a number of working groups regarding liquidity and support efforts to create industry-wide standards to evaluate and manage liquidity risk at financial institutions. In addition to our internal liquidity management systems, the liquidity exposure of German banks is regulated by the Banking Act and regulations issued by the BaFin.
Maturity Analysis of Assets and Financial Liabilities
Treasury manages the maturity analysis of assets and liabilities. Modeling of assets and liabilities is necessary in cases where a product has no contractual maturity or the contractual maturity does not adequately reflect the liquidity risk position. The most significant example in this context would be deposits from retail and transaction banking customers which generally have no contractual maturity, yet have consistently displayed high stability throughout even the most severe financial crises.
The modeling profiles are part of the overall liquidity risk management framework (see section “Stress Test” for short-term liquidity positions£1yr and section “Funding Matrix” for long-term liquidity positions >1yr) which is defined and approved by the Management Board.
| | | | |
| Deutsche Bank | | 01 – Management Report | | 166 |
| Financial Report 2012 | | Risk Report | | |
| | |
| | | | |
| | |
| | | | |
The following table presents a maturity analysis of our total assets based on carrying value and upon earliest legally exercisable maturity as of December 31, 2012.
Maturity analysis of the earliest contractual maturity of assets
| | | | | | | | | | | | | | | | | | | | | | | | | | | | | | | | |
| | | Dec 31, 2012 | |
in€ m. | | On demand | | | On demand
to no more
than
3 months | | | Over
3 months
but no more
than 1 year | | | Sub-total
less
than 1 year | | | Over 1 year
but not more
than 2 years | | | Over 2 years
but no more
than 5 years | | | Over 5 years | | | Total | |
| Cash and deposits with banks | | | 136,491 | | | | 8,726 | | | | 1,955 | | | | 147,173 | | | | 22 | | | | 65 | | | | 173 | | | | 147,433 | |
| | | | | | | | | | | | | | | | | | | | | | | | | | | | | | | | |
| Central bank funds sold | | | – | | | | – | | | | – | | | | – | | | | – | | | | – | | | | – | | | | – | |
| | | | | | | | | | | | | | | | | | | | | | | | | | | | | | | | |
| Securities purchased under resale agreements | | | 5,333 | | | | 21,735 | | | | 9,382 | | | | 36,450 | | | | 27 | | | | 93 | | | | – | | | | 36,570 | |
with banks | | | 1,979 | | | | 17,802 | | | | 8,977 | | | | 28,757 | | | | – | | | | 93 | | | | – | | | | 28,850 | |
with customers | | | 3,355 | | | | 3,933 | | | | 405 | | | | 7,693 | | | | 27 | | | | – | | | | – | | | | 7,720 | |
Retail | | | 18 | | | | – | | | | – | | | | 18 | | | | – | | | | – | | | | – | | | | 18 | |
Corporates and other customers | | | 3,337 | | | | 3,933 | | | | 405 | | | | 7,675 | | | | 27 | | | | – | | | | – | | | | 7,702 | |
| | | | | | | | | | | | | | | | | | | | | | | | | | | | | | | | |
Securities borrowed | | | 23,740 | | | | 111 | | | | – | | | | 23,851 | | | | 96 | | | | – | | | | – | | | | 23,947 | |
with banks | | | 2,760 | | | | 39 | | | | – | | | | 2,800 | | | | – | | | | – | | | | – | | | | 2,800 | |
with customers | | | 20,980 | | | | 71 | | | | – | | | | 21,051 | | | | 96 | | | | – | | | | – | | | | 21,147 | |
Retail | | | 0 | | | | 0 | | | | – | | | | 0 | | | | – | | | | – | | | | – | | | | 0 | |
Corporates and other customers | | | 20,980 | | | | 71 | | | | – | | | | 21,051 | | | | 96 | | | | – | | | | – | | | | 21,147 | |
| | | | | | | | | | | | | | | | | | | | | | | | | | | | | | | | |
| Financial assets at fair value through profit or loss – trading | | | 1,032,422 | | | | 125,654 | | | | 13,202 | | | | 1,171,279 | | | | 4,831 | | | | 10,227 | | | | 14,545 | | | | 1,200,881 | |
Trading assets | | | 245,538 | | | | – | | | | – | | | | 245,538 | | | | – | | | | – | | | | – | | | | 245,538 | |
Fixed-income securities and loans | | | 171,106 | | | | – | | | | – | | | | 171,106 | | | | – | | | | – | | | | – | | | | 171,106 | |
Equities and other variable-income securities | | | 65,457 | | | | – | | | | – | | | | 65,457 | | | | – | | | | – | | | | – | | | | 65,457 | |
Other trading assets | | | 8,975 | | | | – | | | | – | | | | 8,975 | | | | – | | | | – | | | | – | | | | 8,975 | |
Positive market values from derivative financial instruments | | | 768,315 | | | | – | | | | – | | | | 768,315 | | | | – | | | | – | | | | – | | | | 768,315 | |
Financial assets designated at fair value through profit or loss | | | 18,569 | | | | 125,654 | | | | 13,202 | | | | 157,425 | | | | 4,831 | | | | 10,227 | | | | 14,545 | | | | 187,027 | |
Securities purchased under resale agreements | | | 10,256 | | | | 107,589 | | | | 5,798 | | | | 123,643 | | | | 880 | | | | 339 | | | | 126 | | | | 124,987 | |
Securities borrowed | | | 8,166 | | | | 15,373 | | | | 4,765 | | | | 28,304 | | | | – | | | | – | | | | – | | | | 28,304 | |
Fixed-income securities and loans | | | 146 | | | | 2,687 | | | | 1,363 | | | | 4,196 | | | | 2,890 | | | | 6,665 | | | | 9,418 | | | | 23,169 | |
Equities and other variable-income securities | | | – | | | | – | | | | 22 | | | | 22 | | | | 1,013 | | | | 2,978 | | | | 4,906 | | | | 8,919 | |
Other financial assets designated at fair value through profit or loss | | | – | | | | 5 | | | | 1,255 | | | | 1,261 | | | | 47 | | | | 245 | | | | 95 | | | | 1,648 | |
| | | | | | | | | | | | | | | | | | | | | | | | | | | | | | | | |
| Positive market values from derivative financial instruments qualifying for hedge accounting | | | – | | | | 58 | | | | 233 | | | | 291 | | | | 285 | | | | 2,201 | | | | 5,594 | | | | 8,370 | |
| | | | | | | | | | | | | | | | | | | | | | | | | | | | | | | | |
| Financial assets available for sale | | | 6 | | | | 5,404 | | | | 3,859 | | | | 9,269 | | | | 4,491 | | | | 16,891 | | | | 18,729 | | | | 49,380 | |
Fixed-income securities and loans | | | 6 | | | | 5,404 | | | | 3,859 | | | | 9,269 | | | | 3,501 | | | | 16,885 | | | | 17,453 | | | | 47,109 | |
Equitites and other variable-income securities | | | – | | | | – | | | | – | | | | – | | | | 990 | | | | 5 | | | | 1,275 | | | | 2,271 | |
| | | | | | | | | | | | | | | | | | | | | | | | | | | | | | | | |
Loans | | | 29,414 | | | | 58,129 | | | | 37,940 | | | | 125,483 | | | | 26,769 | | | | 64,749 | | | | 180,277 | | | | 397,279 | |
to banks | | | 1,996 | | | | 6,968 | | | | 6,205 | | | | 15,169 | | | | 2,957 | | | | 6,755 | | | | 2,239 | | | | 27,120 | |
to customers | | | 27,419 | | | | 51,161 | | | | 31,735 | | | | 110,314 | | | | 23,813 | | | | 57,994 | | | | 178,038 | | | | 370,158 | |
Retail | | | 5,194 | | | | 12,688 | | | | 8,075 | | | | 25,957 | | | | 7,396 | | | | 19,603 | | | | 129,379 | | | | 182,335 | |
Corporates and other customers | | | 22,224 | | | | 38,473 | | | | 23,660 | | | | 84,357 | | | | 16,417 | | | | 38,391 | | | | 48,659 | | | | 187,824 | |
| | | | | | | | | | | | | | | | | | | | | | | | | | | | | | | | |
| Other financial assets | | | 100,815 | | | | 751 | | | | 321 | | | | 101,887 | | | | 2,619 | | | | 162 | | | | 1,365 | | | | 106,033 | |
| | | | | | | | | | | | | | | | | | | | | | | | | | | | | | | | |
| Total financial assets | | | 1,328,222 | | | | 220,567 | | | | 66,893 | | | | 1,615,682 | | | | 39,141 | | | | 94,387 | | | | 220,682 | | | | 1,969,892 | |
| | | | | | | | | | | | | | | | | | | | | | | | | | | | | | | | |
| Other assets | | | 20,471 | | | | – | | | | – | | | | 20,471 | | | | 329 | | | | 727 | | | | 20,910 | | | | 42,437 | |
| | | | | | | | | | | | | | | | | | | | | | | | | | | | | | | | |
| Total assets | | | 1,348,693 | | | | 220,567 | | | | 66,893 | | | | 1,636,153 | | | | 39,469 | | | | 95,114 | | | | 241,593 | | | | 2,012,329 | |
| |
| | | | |
| Deutsche Bank | | 01 – Management Report | | 167 |
| Financial Report 2012 | | Risk Report | | |
| | |
| | | | |
| | |
| | | | |
The following table presents a maturity analysis of our financial liabilities, off-balance sheet loan commitments and financial guarantees based upon an undiscounted cash flow analysis detailing the earliest contractual maturity or first call for all financial liabilities as of December 31, 2012, and 2011.
Maturity Analysis of the earliest contractual undiscounted cash flows of Financial Liabilities
| | | | | | | | | | | | | | | | | | | | | | |
| Dec 31, 2012 | | | | | | | | | | | | | | | | | | | | | | |
in€ m. | | | | On demand | | | Due within
3 months | | | Due between
3 and 12
months | | | Due between
1 and 5 years | | | Due after
5 years | |
| Noninterest bearing deposits | | | | | 143,920 | | | | – | | | | – | | | | – | | | | – | |
| | | | | | | | | | | | | | | | | | | | | | |
| Interest bearing deposits | | | | | 136,607 | | | | 234,048 | | | | 35,496 | | | | 19,035 | | | | 16,005 | |
| | | | | | | | | | | | | | | | | | | | | | |
| Trading liabilities 1 | | | | | 54,914 | | | | – | | | | – | | | | – | | | | – | |
| | | | | | | | | | | | | | | | | | | | | | |
| Negative market values from derivative financial instruments 1 | | | | | 752,706 | | | | – | | | | – | | | | – | | | | – | |
| | | | | | | | | | | | | | | | | | | | | | |
| Financial liabilities designated at fair value through profit or loss | | | | | 56,277 | | | | 79,238 | | | | 6,741 | | | | 4,864 | | | | 5,309 | |
| | | | | | | | | | | | | | | | | | | | | | |
| Investment contract liabilities 2 | | | | | – | | | | 53 | | | | 788 | | | | 1,225 | | | | 5,666 | |
| | | | | | | | | | | | | | | | | | | | | | |
| Negative market values from derivative financial instruments qualifying for hedge accounting 3 | | | | | 89 | | | | 123 | | | | 92 | | | | 178 | | | | 3,192 | |
| | | | | | | | | | | | | | | | | | | | | | |
| Central bank funds purchased | | | | | 2,585 | | | | 631 | | | | 252 | | | | – | | | | – | |
| | | | | | | | | | | | | | | | | | | | | | |
| Securities sold under repurchase agreements | | | | | 22,950 | | | | 8,796 | | | | 1,230 | | | | – | | | | – | |
| | | | | | | | | | | | | | | | | | | | | | |
| Securities loaned | | | | | 3,110 | | | | 40 | | | | – | | | | – | | | | 33 | |
| | | | | | | | | | | | | | | | | | | | | | |
| Other short-term borrowings | | | | | 18,611 | | | | 41,761 | | | | 8,775 | | | | – | | | | – | |
| | | | | | | | | | | | | | | | | | | | | | |
| Long-term debt | | | | | 857 | | | | 15,157 | | | | 27,188 | | | | 73,950 | | | | 59,841 | |
| | | | | | | | | | | | | | | | | | | | | | |
| Trust preferred securities | | | | | – | | | | 2,956 | | | | 2,410 | | | | 5,522 | | | | 3,818 | |
| | | | | | | | | | | | | | | | | | | | | | |
| Other financial liabilities | | | | | 132,620 | | | | 4,262 | | | | 235 | | | | 584 | | | | 114 | |
| | | | | | | | | | | | | | | | | | | | | | |
| Off-balance sheet loan commitments | | | | | 94,006 | | | | – | | | | – | | | | – | | | | – | |
| | | | | | | | | | | | | | | | | | | | | | |
| Financial guarantees | | | | | 4,470 | | | | – | | | | – | | | | – | | | | – | |
| | | | | | | | | | | | | | | | | | | | | | |
| Total 4 | | | | | 1,423,723 | | | | 387,065 | | | | 83,207 | | | | 105,358 | | | | 93,978 | |
| |
| 1 | Trading liabilities and derivatives not qualifying for hedge accounting balances are recorded at fair value. We believe that this best represents the cash flow that would have to be paid if these positions had to be closed out. Trading liabilities and derivatives not qualifying for hedge accounting balances are shown within “on demand” which management believes most accurately reflects the short-term nature of trading activities. The contractual maturity of the instruments may however extend over significantly longer periods. |
| 2 | These are investment contracts where the policy terms and conditions result in their redemption value equaling fair value. See Note 39 “Insurance and Investment Contracts” for more detail on these contracts. |
| 3 | Derivatives designated for hedge accounting are recorded at fair value and are shown in the time bucket at which the hedged relationship is expected to terminate. |
| 4 | The balances in the table do not agree to the numbers in our balance sheet as the cash flows included in the table are undiscounted. This analysis represents the worst case scenario for us if we were required to repay all liabilities earlier than expected. We believe that the likelihood of such an event occurring is remote. |
| | | | | | | | | | | | | | | | | | | | | | |
| Dec 31, 2011 | | | | | | | | | | | | | | | | | | | | | | |
in€ m. | | | | On demand | | | Due within
3 months | | | Due between
3 and 12
months | | | Due between
1 and 5 years | | | Due after
5 years | |
| Noninterest bearing deposits | | | | | 99,047 | | | | – | | | | – | | | | – | | | | – | |
| | | | | | | | | | | | | | | | | | | | | | |
| Interest bearing deposits | | | | | 163,620 | | | | 277,462 | | | | 30,600 | | | | 21,736 | | | | 16,008 | |
| | | | | | | | | | | | | | | | | | | | | | |
| Trading liabilities 1 | | | | | 63,886 | | | | – | | | | – | | | | – | | | | – | |
| | | | | | | | | | | | | | | | | | | | | | |
| Negative market values from derivative financial instruments 1 | | | | | 838,817 | | | | – | | | | – | | | | – | | | | – | |
| | | | | | | | | | | | | | | | | | | | | | |
| Financial liabilities designated at fair value through profit or loss | | | | | 99,182 | | | | 45,211 | | | | 6,204 | | | | 6,695 | | | | 9,189 | |
| | | | | | | | | | | | | | | | | | | | | | |
| Investment contract liabilities 2 | | | | | – | | | | 604 | | | | 840 | | | | 1,338 | | | | 4,643 | |
| | | | | | | | | | | | | | | | | | | | | | |
| Negative market values from derivative financial instruments qualifying for hedge accounting 3 | | | | | 452 | | | | 135 | | | | 11 | | | | 1,018 | | | | 3,170 | |
| | | | | | | | | | | | | | | | | | | | | | |
| Central bank funds purchased | | | | | 2,866 | | | | 2,050 | | | | – | | | | – | | | | – | |
| | | | | | | | | | | | | | | | | | | | | | |
| Securities sold under repurchase agreements | | | | | 24,781 | | | | 4,975 | | | | 1,022 | | | | – | | | | 19 | |
| | | | | | | | | | | | | | | | | | | | | | |
| Securities loaned | | | | | 7,643 | | | | 38 | | | | – | | | | – | | | | 451 | |
| | | | | | | | | | | | | | | | | | | | | | |
| Other short-term borrowings | | | | | 48,879 | | | | 15,471 | | | | 1,330 | | | | – | | | | – | |
| | | | | | | | | | | | | | | | | | | | | | |
| Long-term debt | | | | | 3,608 | | | | 9,691 | | | | 26,100 | | | | 83,610 | | | | 68,256 | |
| | | | | | | | | | | | | | | | | | | | | | |
| Trust preferred securities | | | | | – | | | | 167 | | | | 3,163 | | | | 5,966 | | | | 6,359 | |
| | | | | | | | | | | | | | | | | | | | | | |
| Other financial liabilities | | | | | 143,375 | | | | 3,788 | | | | 345 | | | | 660 | | | | 47 | |
| | | | | | | | | | | | | | | | | | | | | | |
| Off-balance sheet loan commitments | | | | | 87,433 | | | | – | | | | – | | | | – | | | | – | |
| | | | | | | | | | | | | | | | | | | | | | |
| Financial guarantees | | | | | 23,684 | | | | – | | | | – | | | | – | | | | – | |
| | | | | | | | | | | | | | | | | | | | | | |
| Total 4 | | | | | 1,607,273 | | | | 359,592 | | | | 69,615 | | | | 121,025 | | | | 108,142 | |
| |
| 1 | Trading liabilities and derivatives not qualifying for hedge accounting balances are recorded at fair value. We believe that this best represents the cash flow that would have to be paid if these positions had to be closed out. Trading liabilities and derivatives not qualifying for hedge accounting balances are shown within “on demand” which management believes most accurately reflects the short-term nature of trading activities. The contractual maturity of the instruments may however extend over significantly longer periods. |
| 2 | These are investment contracts where the policy terms and conditions result in their redemption value equalling fair value. See Note 39 “Insurance and Investment Contracts” for more detail on these contracts. |
| 3 | Derivatives designated for hedge accounting are recorded at fair value and are shown in the time bucket at which the hedged relationship is expected to terminate. |
| 4 | The balances in the table do not agree to the numbers in our balance sheet as the cash flows included in the table are undiscounted. This analysis represents the worst case scenario for us if we were required to repay all liabilities earlier than expected. We believe that the likelihood of such an event occurring is remote. |
| | | | |
| Deutsche Bank | | 01 – Management Report | | 168 |
| Financial Report 2012 | | Risk Report | | |
| | |
| | | | |
| | |
| | | | |
| | |
| | | Capital Management Our Treasury function manages our capital at Group level and locally in each region. The allocation of financial resources, in general, and capital, in particular, favors business portfolios with the highest positive impact on our profitability and shareholder value. As a result, Treasury periodically reallocates capital among business portfolios. Treasury implements our capital strategy, which itself is developed by the Capital and Risk Committee and approved by the Management Board, including the issuance and repurchase of shares. We are committed to maintain our sound capitalization. Overall capital demand and supply are constantly monitored and adjusted, if necessary, to meet the need for capital from various perspectives. These include book equity based on IFRS accounting standards, regulatory capital and economic capital as well as specific capital requirements of rating agencies. Regional capital plans covering the capital needs of our branches and subsidiaries are prepared on an annual basis and presented to the Group Investment Committee. Most of our subsidiaries are subject to legal and regulatory capital requirements. Local Asset and Liability Committees attend to those needs under the stewardship of regional Treasury teams. Local Asset and Liability Committees further safeguard compliance with requirements such as restrictions on dividends allowable for remittance to Deutsche Bank AG or on the ability of our subsidiaries to make loans or advances to the parent bank. In developing, implementing and testing our capital and liquidity, we take such legal and regulatory requirements into account. Our core currencies are euro, U.S. dollar and pound sterling. Treasury manages the sensitivity of our capital ratios against swings in core currencies. The capital invested into our foreign subsidiaries and branches in non-core currencies is largely hedged against foreign exchange swings, except for the Chinese yuan that we currently do not hedge. Treasury determines which currencies are to be hedged, develops suitable hedging strategies and finally executes these hedges. Treasury is represented on the Investment Committee of the largest Deutsche Bank pension fund which sets the investment guidelines. This representation ensures that pension assets are aligned with pension liabilities, thus protecting our capital base. Treasury constantly monitors the market for liability management trades. Such trades represent an anticyclical opportunity to create Common Equity Tier 1 capital by buying back our issuances below par. Since the first quarter 2012, we used a changed methodology for allocating average active equity to the business segments and to Consolidation & Adjustments. The total amount allocated continues to be determined based on the higher of our overall economic risk exposure or regulatory capital demand. However, to reflect the further increased regulatory requirements under Basel 3, the internal demand for regulatory capital was derived by assuming a Common Equity Tier 1 ratio of 9.0 % (previously, this was calculated based on a Tier 1 capital ratio of 10 %). As a result, the amount of capital allocated to the segments has increased. From 2013 onwards, it is envisaged that the internal demand for regulatory capital will be derived based on a Common Equity Tier 1 ratio of 10 % at a Group level and assuming full implementation of Basel 3 rules, to further align the allocation of capital with our communicated capital and return on equity targets. |
| | | | |
| Deutsche Bank | | 01 – Management Report | | 169 |
| Financial Report 2012 | | Risk Report | | |
| | |
| | | | |
| | |
| | | | |
During the period from the 2011 Annual General Meeting (May 26, 2011) until the 2012 Annual General Meeting (May 31, 2012), we repurchased 42.3 million of our common shares, thereof none via derivatives. 38.9 million of the shares repurchased were used for equity compensation purposes and 3.4 million shares were used to increase our Treasury position for future equity compensation. We repurchased 14.9 million shares from January 1, 2012 until May 31, 2012, none of which via derivatives. In addition, we purchased 13.9 million physically settled call options in 2012 to hedge existing equity compensation awards, of which 10.6 million call options had an initial maturity of more than 18 months. As of the 2012 Annual General Meeting, the number of shares held in Treasury from buybacks totaled 10.9 million.
The 2012 Annual General Meeting granted our management board the authority to buy back up to 92.9 million shares before November 30, 2016. Thereof 46.5 million shares can be purchased by using derivatives. These authorizations replaced the authorizations of the 2011 Annual General Meeting. During the period from the 2012 Annual General Meeting until December 31, 2012, a total of 2.5 million shares were purchased, thereof none via derivatives. In the same period 13.4 million shares were used for equity compensation purposes. The number of shares held in Treasury from buybacks was less than 1 million as of December 31, 2012.
The 2012 Annual General Meeting further granted our Management Board the authority to create conditional capital by issuing 90 million shares with a face value of€ 230.4 million within the next five years. The total face value of available conditional capital amounts to€ 691.2 million (270 million shares). In addition, the authorized capital available to the Management Board has a total face value of€ 1.2 billion (450 million shares).
Total outstanding hybrid Tier 1 capital (substantially all noncumulative trust preferred securities) as of December 31, 2012, amounted to€ 12.5 billion compared to€ 12.7 billion as of December 31, 2011. This decrease was mainly due to the foreign exchange effects of the weaker U.S. dollar on the U.S. dollar denominated hybrid Tier 1 capital. In 2012, we neither raised nor redeemed any hybrid Tier 1 capital.
In 2012, we did not issue any lower Tier 2 capital (qualified subordinated liabilities). Profit participation rights amounted to€ 1.1 billion as of December 31, 2012, compared to€ 1.2 billion as of December 31, 2011. Total lower Tier 2 capital as of December 31, 2012, amounted to€ 8.0 billion compared to€ 9.4 billion as of December 31, 2011. Cumulative preferred securities amounted to€ 0.3 billion as of December 31, 2012, unchanged from December 31, 2011.
Capital management at Postbank has been integrated into our group-wide capital management process.
Capital Adequacy
Since 2008, we have calculated and published consolidated capital ratios for the Deutsche Bank group of institutions pursuant to the Banking Act and the Solvency Regulation (“Solvabilitätsverordnung”), which implemented the revised capital framework of the Basel Committee from 2004 (“Basel 2”) into German law. Starting with December 31, 2011, the calculation of our capital ratios incorporates the amended capital requirements for trading book and securitization positions pursuant to the “Basel 2.5” framework, as implemented by the Capital Requirements Directive 3 and transposed into German law by the German Banking Act and the Solvency Regulation, representing the legal basis for our capital adequacy calculations also as of December 31, 2012.
| | | | |
| Deutsche Bank | | 01 – Management Report | | 170 |
| Financial Report 2012 | | Risk Report | | |
| | |
| | | | |
| | |
| | | | |
| | |
| | | Although the pending Capital Requirements Directive 4 (“CRD 4”) legislation and the related Regulation on prudential requirements for credit institutions and investment firms (“Capital Requirements Regulation”, short “CRR”), implementing the “Basel 3” framework into European law, have not yet entered into force, we make use of the terms from the Basel 3 framework in the following section and tables on capital adequacy and regulatory capital. Nevertheless the numbers disclosed are still based on the Basel 2.5 framework. This section refers to the capital adequacy of the group of institutions consolidated for banking regulatory purposes that does not include insurance companies or companies outside the finance sector. Our insurance companies are included in an additional capital adequacy (also “solvency margin”) calculation under the Solvency Regulation for Financial Conglomerates. Our solvency margin as a financial conglomerate remains dominated by our banking activities. In light of the regulations given above the following information are based on the regulatory principles of consolidation. The Total regulatory capital pursuant to the effective regulations as of year-end 2012 consists of Tier 1, Tier 2 and Tier 3 capital. Tier 3 capital will no longer be allowed under the coming Basel 3 based regulations. Tier 1 capital consists of Common Equity Tier 1 capital (formerly referred to as Core Tier 1 capital) and Additional Tier 1 capital. Common Equity Tier 1 capital consists primarily of common share capital including related share premium accounts, retained earnings and other comprehensive income, adjusted by deduction of goodwill and other intangible assets. Other regulatory adjustments entail the exclusion of capital from entities outside the group of institutions and the reversal of capital effects under the fair value option on financial liabilities due to own credit risk. The following items must be deducted (according to Basel 2.5, half from Tier 1 and half from Tier 2 capital): investments in unconsolidated banking, financial and insurance entities where a bank holds more than 10 % of the capital (in case of insurance entities at least 20 % either of the capital or of the voting rights unless included in the solvency margin calculation of the financial conglomerate), the amount by which the expected loss for exposures to central governments, institutions and corporate and retail clients as measured under the bank’s internal ratings based approach (“IRBA”) model exceeds the value adjustments and provisions for such exposures, the expected losses for certain equity exposures, securitization positions not included in the risk-weighted assets and the value of securities delivered to a counterparty plus any replacement cost to the extent the required payments by the counterparty have not been made within five business days after delivery provided the transaction has been allocated to the bank’s trading book. Additional Tier 1 capital consists of hybrid capital components such as noncumulative trust preferred securities. Hybrid capital components that are not compliant with the coming Basel 3 requirements for such instruments will be progressively phased out in their consideration for Additional Tier 1 capital under the coming Basel 3-based regulations. Tier 2 capital primarily comprises cumulative trust preferred securities, certain profit participation rights and long-term subordinated debt, as well as 45 % of unrealized gains on certain listed securities. The amount of long-term subordinated debt that may be included as Tier 2 capital is limited to 50 % of Tier 1 capital. Total Tier 2 capital is limited to 100 % of Tier 1 capital. |
| | | | |
| Deutsche Bank | | 01 – Management Report | | 171 |
| Financial Report 2012 | | Risk Report | | |
| | |
| | | | |
| | |
| | | | |
| | | | | | | | | | | | | | | | |
| The following table presents the Tier 1- and Tier 2- components of our Total regulatory capital (no Tier 3 capital is included in our regulatory capital base) as well as our risk-weighted assets (comprising credit risk-, market risk- and operational risk-exposure) and the respective capital ratios, excluding transitional items pursuant to section 64h (3) German Banking Act: | | | | | | | |
Regulatory Capital, RWA and Capital Ratios in€ m. | | | | Dec 31, 2012 | | | Dec 31, 2011 | | | | | | | |
Common Equity Tier 1 capital: instruments and reserves | | | | | | | | | | | | | | | | |
| | | | | | | | | | | | | | | | |
Capital instruments and the related share premium accounts | | | | | 26,098 | | | | 25,252 | | | | | | | |
| | | | | | | | | | | | | | | | |
Retained earnings (excluding interim profits) | | | | | 28,961 | | | | 25,987 | | | | | | | |
| | | | | | | | | | | | | | | | |
Accumulated other comprehensive income | | | | | (1,293) | | | | (1,981) | | | | | | | |
| | | | | | | | | | | | | | | | |
Noncontrolling interests | | | | | 124 | | | | 999 | | | | | | | |
| | | | | | | | | | | | | | | | |
Independently reviewed interim profits net of any foreseeable charge or dividend | | | | | (460) | | | | 3,435 | | | | | | | |
| | | | | | | | | | | | | | | | |
Common Equity Tier 1 capital before regulatory adjustments | | | | | 53,430 | | | | 53,692 | | | | | | | |
| | | | | | | | | | | | | | | | |
| | | | | | |
Common Equity Tier 1 capital: regulatory adjustments | | | | | | | | | | | | | | | | |
| | | | | | | | | | | | | | | | |
Intangible assets (net of related tax liability) | | | | | (11,579) | | | | (12,909) | | | | | | | |
| | | | | | | | | | | | | | | | |
Negative amounts resulting from the calculation of expected loss amounts | | | | | (440) | | | | – | | | | | | | |
| | | | | | | | | | | | | | | | |
Gains or losses on liabilities designated at fair value resulting from changes in own credit standing | | | | | (2) | | | | (128) | | | | | | | |
| | | | | | | | | | | | | | | | |
Direct holdings by an institution of own Common Equity Tier 1 capital instruments1 | | | | | – | | | | – | | | | | | | |
| | | | | | | | | | | | | | | | |
Direct holdings by the institution of the Common Equity Tier 1 capital instruments of relevant entities where the institution has a significant investment in those entities | | | | | (1,493) | | | | (1,332) | | | | | | | |
| | | | | | | | | | | | | | | | |
Exposure amount of the following items which qualify for a RW of 1250 %, where the institution opts for the deduction alternative | | | | | (953) | | | | (3,372) | | | | | | | |
of which: securitization positions | | | | | (953) | | | | (2,863) | | | | | | | |
of which: free deliveries | | | | | – | | | | – | | | | | | | |
| | | | | | | | | | | | | | | | |
Other, including consolidation and regulatory adjustments | | | | | (748) | | | | (486) | | | | | | | |
| | | | | | | | | | | | | | | | |
Regulatory adjustments relating to unrealized gains and losses | | | | | (259) | | | | 847 | | | | | | | |
| | | | | | | | | | | | | | | | |
Amount to be deducted from or added to Common Equity Tier 1 capital with regard to additional filters and deductions required pre CRR | | | | | – | | | | – | | | | | | | |
| | | | | | | | | | | | | | | | |
Total regulatory adjustments to Common Equity Tier 1 capital | | | | | (15,473) | | | | (17,379) | | | | | | | |
| | | | | | | | | | | | | | | | |
Common Equity Tier 1 capital | | | | | 37,957 | | | | 36,313 | | | | | | | |
| | | | | | | | | | | | | | | | |
| | | | | | |
Additional Tier 1 capital: instruments | | | | | | | | | | | | | | | | |
| | | | | | | | | | | | | | | | |
Capital instruments and the related share premium accounts | | | | | 13,025 | | | | 12,734 | | | | | | | |
| | | | | | | | | | | | | | | | |
Additional Tier 1 capital before regulatory adjustments | | | | | 13,025 | | | | – | | | | | | | |
| | | | | | | | | | | | | | | | |
| | | | | | |
Additional Tier 1 capital: regulatory adjustments | | | | | | | | | | | | | | | | |
| | | | | | | | | | | | | | | | |
Direct holdings by an institution of own Additional Tier 1 capital instruments | | | | | (499) | | | | – | | | | | | | |
| | | | | | | | | | | | | | | | |
Additional Tier 1 capital | | | | | 12,526 | | | | 12,734 | | | | | | | |
| | | | | | | | | | | | | | | | |
Tier 1 capital2 | | | | | 50,483 | | | | 49,047 | | | | | | | |
| | | | | | | | | | | | | | | | |
| | | | | | |
Tier 2 capital: instruments and provisions | | | | | | | | | | | | | | | | |
| | | | | | | | | | | | | | | | |
Capital instruments and the related share premium accounts | | | | | 11,852 | | | | 10,883 | | | | | | | |
| | | | | | | | | | | | | | | | |
Tier 2 capital before regulatory adjustments | | | | | 11,852 | | | | 10,883 | | | | | | | |
| | | | | | | | | | | | | | | | |
| | | | | | |
Tier 2 capital: regulatory adjustments | | | | | | | | | | | | | | | | |
| | | | | | | | | | | | | | | | |
Direct holdings by an institution of own Tier 2 capital instruments and subordinated loans | | | | | (152) | | | | – | | | | | | | |
| | | | | | | | | | | | | | | | |
Amortization | | | | | (2,283) | | | | – | | | | | | | |
| | | | | | | | | | | | | | | | |
Items to be partly deducted from Tier 2 capital pursuant to Section 10 (6) and (6a) KWG | | | | | (2,885) | | | | (4,703) | | | | | | | |
| | | | | | | | | | | | | | | | |
Tier 2 capital | | | | | 6,532 | | | | 6,179 | | | | | | | |
| | | | | | | | | | | | | | | | |
Total Regulatory capital | | | | | 57,015 | | | | 55,226 | | | | | | | |
| | | | | | | | | | | | | | | | |
| | | | | | |
Total risk-weighted assets | | | | | 333,605 | | | | 381,246 | | | | | | | |
| | | | | | | | | | | | | | | | |
Credit risk | | | | | 228,952 | | | | 262,460 | | | | | | | |
| | | | | | | | | | | | | | | | |
Market risk | | | | | 53,058 | | | | 68,091 | | | | | | | |
| | | | | | | | | | | | | | | | |
Operational risk | | | | | 51,595 | | | | 50,695 | | | | | | | |
| | | | | | | | | | | | | | | | |
Capital ratios and buffers | | | | | | | | | | | | | | | | |
| | | | | | | | | | | | | | | | |
Common Equity Tier 1 capital (as a percentage of risk-weighted assets) | | | | | 11.4 | | | | 9.5 | | | | | | | |
| | | | | | | | | | | | | | | | |
Tier 1 capital (as a percentage of risk-weighted assets) | | | | | 15.1 | | | | 12.9 | | | | | | | |
| | | | | | | | | | | | | | | | |
Total Regulatory capital (as a percentage of risk-weighted assets) | | | | | 17.1 | | | | 14.5 | | | | | | | |
| | | | | | | |
1 Excludes Holdings that are already considered in the accounting base of Common Equity. 2 Included€ 20 million silent participation as of December 31, 2012 and December 31, 2011. | | | | | | | |
| | | | |
| Deutsche Bank | | 01 – Management Report | | 172 |
| Financial Report 2012 | | Risk Report | | |
| | |
| | | | |
| | |
| | | | |
The following table details the main changes in our Common Equity Tier 1 (formerly: Core Tier 1) capital, Additional Tier 1 and Tier 2 capital from the beginning to the end of the years 2012 and 2011:
Development of regulatory capital
| | | | | | | | | | |
in€ m. | | | | Dec 31, 2012 | | | Dec 31, 2011 | |
Common Equity Tier 1 Capital | | | | | 37,957 | | | | 36,313 | |
| | | | | | | | | | |
Opening amount | | | | | 36,313 | | | | 29,972 | |
| | | | | | | | | | |
Common shares, net effect/(+) issued (–) retirement | | | | | – | | | | – | |
| | | | | | | | | | |
Additional paid-in capital | | | | | 83 | | | | 181 | |
| | | | | | | | | | |
Retained earnings | | | | | (232) | | | | 4,834 | |
| | | | | | | | | | |
Therein: Actuarial gains (losses) rel. to defined benefit plans, net of tax/CTA | | | | | (452) | | | | 666 | |
Therein: Net income attributable to Deutsche Bank Shareholders | | | | | 237 | | | | 4,132 | |
| | | | | | | | | | |
Common shares in treasury, net effect/(+) sales (–) purchase | | | | | 763 | | | | (373) | |
| | | | | | | | | | |
Movements in accumulated other comprehensive income | | | | | (423) | | | | 1,166 | |
Foreign currency translation, net of tax | | | | | (423) | | | | 1,166 | |
| | | | | | | | | | |
Dividend accrual | | | | | (697) | | | | (697) | |
| | | | | | | | | | |
Removal of gains/losses resulting from changes in own credit standing in liabilities designated at fair value (net of tax) | | | | | 126 | | | | (76) | |
| | | | | | | | | | |
Goodwill and other intangible assets (deduction net of related tax liability) | | | | | 1,330 | | | | (518) | |
| | | | | | | | | | |
Noncontrolling interest | | | | | (875) | | | | 72 | |
| | | | | | | | | | |
Deductible investments in banking, financial and insurance entities | | | | | (161) | | | | (381) | |
| | | | | | | | | | |
Securitization positions not included in risk-weighted assets | | | | | 1,911 | | | | 1,987 | |
| | | | | | | | | | |
Excess of expected losses over risk provisions | | | | | 69 | | | | (81) | |
| | | | | | | | | | |
Other, including regulatory adjustments | | | | | (250) | | | | 227 | |
| | | | | | | | | | |
Closing amount | | | | | 37,957 | | | | 36,313 | |
| | | | | | | | | | |
Additional Tier 1 Capital | | | | | 12,526 | | | | 12,734 | |
| | | | | | | | | | |
Opening amount | | | | | 12,734 | | | | 12,593 | |
| | | | | | | | | | |
New Additional Tier 1 eligible capital issues | | | | | – | | | | – | |
| | | | | | | | | | |
Buybacks | | | | | – | | | | – | |
| | | | | | | | | | |
Other, including regulatory adjustments | | | | | (208) | | | | 141 | |
| | | | | | | | | | |
Closing amount | | | | | 12,526 | | | | 12,734 | |
| | | | | | | | | | |
Tier 1 capital | | | | | 50,483 | | | | 49,047 | |
| | | | | | | | | | |
Tier 2 capital: | | | | | 6,532 | | | | 6,179 | |
| | | | | | | | | | |
Opening amount | | | | | 6,179 | | | | 6,123 | |
| | | | | | | | | | |
New Tier 2 eligible capital issues | | | | | – | | | | – | |
| | | | | | | | | | |
Buybacks | | | | | (179) | | | | (251) | |
| | | | | | | | | | |
Amortization | | | | | (1,071) | | | | (747) | |
| | | | | | | | | | |
Other, including regulatory adjustments | | | | | 1,603 | | | | 1,054 | |
| | | | | | | | | | |
Closing amount | | | | | 6,532 | | | | 6,179 | |
| | | | | | | | | | |
Total Regulatory capital | | | | | 57,015 | | | | 55,226 | |
| |
The increase of€ 1.6 billion in Common Equity Tier 1 capital in the year 2012 was primarily the result of a€ 1.9 billion reduction of the capital deduction item for securitization positions not included in risk-weighted assets. Another positive impact of€ 0.8 billion resulted from the reduced position of Common shares in treasury, partially offset by a negative impact of€ 0.4 billion from foreign currency translation. The positive change of€ 1.3 billion shown under the deduction-item “Goodwill and other intangible assets” is primarily the result of Common Equity Tier 1 capital-neutral impairments in the fourth quarter of 2012 which are offset by corresponding effects in our Retained earnings.
Common shares consist of Deutsche Bank AG’s common shares issued in registered form without par value. Under German law, each share represents an equal stake in the subscribed capital. Therefore, each share has a nominal value of€ 2.56, derived by dividing the total amount of share capital by the number of shares. As of December 31, 2012, 929,499,640 shares were issued and fully paid, of which we held 315,742 shares, leaving 929,183,898 shares outstanding. There are no issued ordinary shares that have not been fully paid. Related share premium is included in additional paid-in capital.
| | | | |
| Deutsche Bank | | 01 – Management Report | | 173 |
| Financial Report 2012 | | Risk Report | | |
| | |
| | | | |
| | |
| | | | |
The following two tables present specific disclosures in relation to Pillar 3. Per regulation it is not required to audit Pillar 3 disclosures.
Terms and Conditions of outstanding Additional Tier 1 Capital Instruments (unaudited)
| | | | | | | | | | | | | | |
Issuer | | Amount
in m. | | | Currency | | | | Interest payment obligations | | Termination right of Issuer | | Step-up clauses or other early redemption- incentives |
| DB Capital Trust I | | | 318 | | | USD | | • | | Until March 30, 2009: 3-Month LIBOR plus 1.7 % From March 30, 2009: 5-Year U.S. Dollar Swap Rate plus 2.7 % | | Since March 30, 2009 and on March 30 of each fifth year thereafter with period of 90 days. | | yes, see interest payment obligations |
| | | | | | | | | | | | | | |
| DB Capital Trust II | | | 20,000 | | | JPY | | • | | Until April 27, 2029: 5.2 % p.a. From April 27, 2029: 5-Year Japanese Yen Swap Rate plus 1.62 % | | At the earliest April 27, 2029 with period of 90 days. | | yes, see interest payment obligations |
| | | | | | | | | | | | | | |
| DB Capital Trust III | | | 113 | | | USD | | • | | Until June 30, 2014: 3-Month LIBOR plus 1.9 % From June 30, 2014: 5-Year U.S. Dollar Swap Rate plus 2.9 % | | At the earliest June 30, 2014 with period of 90 days. | | yes, see interest payment obligations |
| | | | | | | | | | | | | | |
| DB Capital Trust IV | | | 153 | | | USD | | • | | Until June 30, 2011: 3-Month LIBOR plus 1.8 % From June 30, 2011: 5-Year U.S. Dollar Swap Rate plus 2.8 % | | Since June 30, 2011: on June 30 of each fifth year thereafter with period of 90 days. | | yes, see interest payment obligations |
| | | | | | | | | | | | | | |
| DB Capital Trust V | | | 147 | | | USD | | • | | Until June 30, 2010: 3-Month LIBOR plus 1.8 % From June 30, 2010: 5-Year U.S. Dollar Swap Rate plus 2.8 % | | Since June 30, 2010: on June 30 of each fifth year thereafter with period of 90 days. | | yes, see interest payment obligations |
| | | | | | | | | | | | | | |
| DB Capital Funding Trust I | | | 625 | | | USD | | • | | Until June 30, 2009: 7.872 % p.a. From June 30, 2009: 3-Month LIBOR plus 2.97 % | | Since June 30, 2009: every 3 months thereafter with period of 30 days. | | yes, see interest payment obligations |
| | | | | | | | | | | | | | |
| DB Capital Funding Trust IV | | | 1,000 | | | EUR | | • | | Until September 19, 2013: 5.33 % p.a. From September 19, 2013: 3-Month EURIBOR plus 1.99 % | | At the earliest September 19, 2013 with period of 30 days. | | yes, see interest payment obligations |
| | | | | | | | | | | | | | |
| DB Capital Funding Trust V | | | 300 | | | EUR | | • | | 6.15 % p.a. | | Since December 2, 2009: every 3 months thereafter with period of 30 days. | | none |
| | | | | | | | | | | | | | |
| DB Capital Funding Trust VI | | | 900 | | | EUR | | • | | Until January 28, 2010: 6 % p.a. From January 28, 2010: Four times the difference between 10-Year- and 2-Year-CMS-Rate, capped at 10 % and floored at 3.5 % | | Since January 28, 2010: on January 28 of each year thereafter with period of 30 days. | | none |
| | | | | | | | | | | | | | |
| DB Capital Funding Trust VII | | | 800 | | | USD | | • | | Until January 19, 2016: 5.628 % p.a. From January 19, 2016: 5.628 % p.a. plus 100 bps | | At the earliest January 19, 2016 with period of 30 days. | | yes, see interest payment obligations |
| | | | | | | | | | | | | | |
| DB Capital Funding Trust VIII | | | 600 | | | USD | | • | | 6.375 % p.a. | | Since October 18, 2011: every 3 months thereafter with period of 30 days. | | none |
| | | | | | | | | | | | | | |
| DB Capital Funding Trust IX | | | 1,150 | | | USD | | • | | 6.625 % p.a. | | Since August 20, 2012 with period of 30 days. | | none |
| | | | | | | | | | | | | | |
| DB Capital Funding Trust X | | | 805 | | | USD | | • | | 7.350 % p.a. | | Since December 15, 2012 with period of 30 days. | | none |
| | | | | | | | | | | | | | |
| DB Capital Funding Trust XI | | | 1,300 | | | EUR | | • | | 9.5 % p.a. | | At the earliest March 31, 2015 with period of 30 days. | | none |
| | | | | | | | | | | | | | |
| DB Contingent Capital Trust II | | | 800 | | | USD | | • | | 6.55 % p.a. | | At the earliest May 23, 2017 with period of 30 days. | | none |
| | | | | | | | | | | | | | |
| DB Contingent Capital Trust III | | | 1,975 | | | USD | | • | | 7.6 % p.a. | | At the earliest February 20, 2018 with period of 30 days. | | none |
| | | | | | | | | | | | | | |
| DB Contingent Capital Trust IV | | | 1,000 | | | EUR | | • | | 8.0 % p.a. | | At the earliest May 15, 2018 with period of 30 days. | | none |
| | | | | | | | | | | | | | |
| DB Contingent Capital Trust V | | | 1,385 | | | USD | | • | | 8.05 % p.a. | | At the earliest June 30, 2018 with period of 30 days. | | none |
| | | | | | | | | | | | | | |
| Deutsche Postbank Funding Trust I | | | 300 | | | EUR | | • | | Until December 2, 2005: 6 % p.a. From December 2, 2005: 10-Year EUR Swap Rate plus 0.025 %, max. 8 % | | Since December 2, 2010 at each subsequent coupon date. | | none |
|
| | | | |
| Deutsche Bank | | 01 – Management Report | | 174 |
| Financial Report 2012 | | Risk Report | | |
| | |
| | | | |
| | |
| | | | |
| | | | | | | | | | | | | | |
Issuer | | Amount
in m. | | | Currency | | | | Interest payment obligations | | Termination right of Issuer | | Step-up clauses or other early redemption- incentives |
| Deutsche Postbank Funding Trust II | | | 500 | | | EUR | | • | | Until December 23, 2009: 6 % p.a. From December 23, 2009: Four times difference between 10-Year and 2-Year CMS-Rate, with min. CMS-Rate 3.75 % and max. CMS-Rate 10 % | | Since December 23, 2009 at each subsequent coupon date. | | none |
| | | | | | | | | | | | | | |
| Deutsche Postbank Funding Trust III | | | 300 | | | EUR | | • | | Until June 7, 2008: 7 % p.a. From June 7, 2008: 10-Year EUR Swap Rate plus 0.125 %, max. 8 % | | Since June 7, 2011 at each subsequent coupon date. | | none |
| | | | | | | | | | | | | | |
| Deutsche Postbank Funding Trust IV | | | 500 | | | EUR | | • | | Until June 29, 2017: 5.983 % p.a. From June 29, 2017: 3-Month EURIBOR plus 2.07 % | | At the earliest June 29, 2017 at each subsequent coupon date. | | yes, see interest payment obligations |
| | | | | | | | | | | | | | |
| Deutsche Postbank AG – silent participation | | | 10 | | | EUR | | • | | 8.15 % p.a. | | Fixed maturity December 31, 2018 | | none |
| | | | | | | | | | | | | | |
| Deutsche Postbank AG – silent participation | | | 10 | | | EUR | | • | | 8.15 % p.a. | | Fixed maturity December 31, 2018 | | none |
|
Of the€ 12.5 billion Additional Tier 1 capital€ 8.8 billion have no step-up clauses or other early redemption-incentives. No instrument has the option to be converted into ordinary shares. All Additional Tier 1 capital instruments qualify as Tier 1 capital according to Section 64m (1) KWG. In the event of the initiation of insolvency proceedings or of liquidation, they will not be repaid until all creditors have been satisfied.
Our Tier 2 capital instruments qualify as regulatory capital according to Section 10 (5) and (5a) KWG, except for the profit participation rights issued by Deutsche Postbank AG which all were issued before December 31, 2010 and qualify as Tier 2 capital according to Section 64m (1) KWG. Accordingly, all Tier 2 capital instruments have a minimum original maturity of 5 years. The majority of the volume of our Tier 2 instruments, however, has an original maturity of 10 years or more and call rights for the issuer after 5 years or more. In the last two years before the maturity of an instrument only 40 % of the paid-in capital qualifies as regulatory capital.
| | | | |
| Deutsche Bank | | 01 – Management Report | | 175 |
| Financial Report 2012 | | Risk Report | | |
| | |
| | | | |
| | |
| | | | |
The several hundred individual Tier 2 capital instruments can be clustered as follows:
Terms and Conditions of the outstanding Tier 2 Capital Instruments (unaudited)
| | | | | | | | | | | | |
Issuer | | Maturity
(year) | | Notional in€ m. | | Currency | | Type of Tier 2 capital instrument | | Early redemption-option | | Interest payment obligations |
| Deutsche Bank Capital Finance Trust I | | perpetual | | 300 | | EUR | | Cumulative Trust preferred securities | | At the earliest on June 27, 2015 and thereafter on each yearly coupon-payment date (June 27) with period of 30 days. | | Fixed interest rate during first five periods of interest payments at 7 % p.a., thereafter ten times the difference between 10 year- and 2 year-CMS-Rate, capped at 10 year-CMS and floored at 1.75 % |
| | | | | | | | | | | | |
Deutsche Postbank AG | | 2014 | | 100 | | EUR | | Profit Participation Rights | | No | | 6.00 % (fix) – 6.26 % (fix) |
| | | | | | | | | | | | |
Deutsche Postbank AG | | 2015 | | 197 | | EUR | | Profit Participation Rights | | No | | 5.13 % (fix) – 5.65 % (fix) |
| | | | | | | | | | | | |
Deutsche Postbank AG | | 2016 | | 676 | | EUR | | Profit Participation Rights | | No | | 4.40 % (fix) – 4.72 % (fix) |
| | | | | | | | | | | | |
Deutsche Postbank AG | | 2017 | | 21 | | EUR | | Profit Participation Rights | | No | | 5.12 % (fix) |
| | | | | | | | | | | | |
Deutsche Postbank AG | | 2018 | | 91 | | EUR | | Profit Participation Rights | | No | | 5.14 % (fix) – 5.53 % (fix) |
| | | | | | | | | | | | |
Deutsche Postbank AG | | 2020 | | 14 | | EUR | | Profit Participation Rights | | No | | 5.10 % (fix) |
| | | | | | | | | | | | |
Deutsche Postbank AG | | 2021 | | 24 | | EUR | | Profit Participation Rights | | No | | 4.53 % (fix) – 4.73 % (fix) |
| | | | | | | | | | | | |
Deutsche Postbank AG | | 2023 | | 10 | | EUR | | Profit Participation Rights | | No | | 5.50 % (fix) |
| | | | | | | | | | | | |
Deutsche Postbank AG | | 2027 | | 20 | | EUR | | Profit Participation Rights | | No | | 5.25 % (fix) |
| | | | | | | | | | | | |
| Bankers Trust Corporation - New York | | 2015 | | 141 | | USD | | Subordinated Liabilities | | No | | 7.50 % (fix) |
| | | | | | | | | | | | |
BHF-BANK AG | | 2015 | | 50 | | EUR | | Subordinated Liabilities | | No | | 4.46 % (fix) |
| | | | | | | | | | | | |
BHF-BANK AG | | 2019 | | 50 | | EUR | | Subordinated Liabilities | | No | | 4.80 % (fix) |
| | | | | | | | | | | | |
BHF-BANK AG | | 2020 | | 57 | | EUR | | Subordinated Liabilities | | no | | 4.59 % (fix) – 4.63 % (fix) |
| | | | | | | | | | | | |
BHF-BANK AG | | 2025 | | 47 | | EUR | | Subordinated Liabilities | | no | | 4.75 % (fix) |
| | | | | | | | | | | | |
Deutsche Bank AG | | 2013 | | 1,175 | | EUR | | Subordinated Liabilities | | no | | 5.10 % (fix) – 5.98 % (fix) |
| | | | | | | | | | | | |
Deutsche Bank AG | | 2013 | | 6,000 | | JPY | | Subordinated Liabilities | | no | | 1.07 % (var.) |
| | | | | | | | | | | | |
| Deutsche Bank AG | | 2014 | | 245 | | AUD | | Subordinated Liabilities | | Early redemption at the issuer’s option since 2009 at each coupon-date | | 5.36 % (var.) |
| | | | | | | | | | | | |
| Deutsche Bank AG | | 2014 | | 1,081 | | EUR | | Subordinated Liabilities | | 1,061 mn.: Early redemption at the issuer’s option since 2009 at each coupon-date | | 1.09 % (var.) – 4.16 % (fix) |
| | | | | | | | | | | | |
| Deutsche Bank AG | | 2014 | | 3,000 | | JPY | | Subordinated Liabilities | | Early redemption at the issuer’s option since 2009 at each coupon-date | | 0.94 % (var.) |
| | | | | | | | | | | | |
| Deutsche Bank AG | | 2014 | | 214 | | NZD | | Subordinated Liabilities | | Early redemption at the issuer’s option since 2009 at each coupon-date | | 3.56 % (var.) |
| | | | | | | | | | | | |
| Deutsche Bank AG | | 2015 | | 710 | | EUR | | Subordinated Liabilities | | Early redemption at the issuer’s option since 2010 at each coupon-date | | 0.88 % (var.) – 1.02 % (var.) |
| | | | | | | | | | | | |
| Deutsche Bank AG | | 2015 | | 190 | | GBP | | Subordinated Liabilities | | Early redemption at the issuer’s option since 2010 at each coupon-date | | 1.41 % (var.) |
| | | | | | | | | | | | |
| Deutsche Bank AG | | 2015 | | 335 | | USD | | Subordinated Liabilities | | Early redemption at the issuer’s option since 2010 at each coupon-date | | 1.11 % (var.) |
| | | | | | | | | | | | |
| Deutsche Bank AG | | 2016 | | 220 | | CAD | | Subordinated Liabilities | | Early redemption at the issuer’s option since 2011 | | 2.03 % (var.) |
| | | | | | | | | | | | |
| Deutsche Bank AG | | 2016 | | 442 | | EUR | | Subordinated Liabilities | | Early redemption at the issuer’s option since 2011 | | 0.98 % (var.) |
| | | | | | | | | | | | |
| Deutsche Bank AG | | 2017 | | 509 | | EUR | | Subordinated Liabilities | | 489 mn.: Early redemption at the issuer’s option since 2012 | | 0.95 % (var.) – 5.82 % (fix) |
| | | | | | | | | | | | |
| Deutsche Bank AG | | 2018 | | 100 | | EUR | | Subordinated Liabilities | | 10 mn.: Early redemption at the issuer’s option in 2013 | | 5.50 % (fix) – 6.50 % (var.) |
| | | | | | | | | | | | |
| Deutsche Bank AG | | 2019 | | 249 | | EUR | | Subordinated Liabilities | | 238 mn.: Early redemption at the issuer’s option in 2014 | | 5.00 % (fix) – 6.00 % (fix) |
| | | | | | | | | | | | |
| Deutsche Bank AG | | 2020 | | 1,235 | | EUR | | Subordinated Liabilities | | 85 mn.: Early redemption at the issuer’s option in 2015 | | 4.00 % (var.) – 5.00 % (fix) |
|
| | | | |
| Deutsche Bank | | 01 – Management Report | | 176 |
| Financial Report 2012 | | Risk Report | | |
| | |
| | | | |
| | |
| | | | |
| | | | | | | | | | | | |
Issuer | | Maturity
(year) | | Notional in€ m. | | Currency | | Type of Tier 2 capital instrument | | Early redemption-option | | Interest payment obligations |
Deutsche Bank AG | | 2024 | | 20 | | EUR | | Subordinated Liabilities | | no | | 5.10 % (fix) |
| | | | | | | | | | | | |
| | | | | | | | | | | | |
| | | | | | | | | | | | |
| Deutsche Bank AG | | 2033 | | 5 | | EUR | | Subordinated Liabilities | | Early redemption at the issuer’s option in 2013 | | 6.30 % (fix) |
| | | | | | | | | | | | |
| Deutsche Bank AG | | 2035 | | 50 | | EUR | | Subordinated Liabilities | | Early redemption at the issuer’s option since 2010 at each coupon-date | | 3.00 % (var.) |
| | | | | | | | | | | | |
| Deutsche Bank Financial Inc. | | 2015 | | 778 | | USD | | Subordinated Liabilities | | No | | 5.38 % (fix) |
| | | | | | | | | | | | |
| Deutsche Bank S.A.E., Barcelona | | 2013 | | 41 | | EUR | | Subordinated Liabilities | | No | | 3.72 % (var.) |
| | | | | | | | | | | | |
| Deutsche Bank S.A.E., Barcelona | | 2014 | | 40 | | EUR | | Subordinated Liabilities | | No | | 5.72 % (var.) |
| | | | | | | | | | | | |
| Deutsche Bank S.p.A., Mailand | | 2018 | | 500 | | EUR | | Subordinated Liabilities | | Early redemption at the issuer’s option in 2013 | | 0.22 % (var.) |
| | | | | | | | | | | | |
| Deutsche Bank Morgan Grenfell Group PLC | | perpetual | | 6 | | USD | | Subordinated Liabilities | | Early redemption at the issuer’s option since 1991 at each coupon-date with minimum period of 30 days | | 1.00 % (var.) |
| | | | | | | | | | | | |
BHW Bausparkasse | | 2013 | | 91 | | EUR | | Subordinated Liabilities | | no | | 4.90 % (fix) – 5.80 % (fix) |
| | | | | | | | | | | | |
BHW Bausparkasse | | 2014 | | 55 | | EUR | | Subordinated Liabilities | | no | | 2.56 % (var.) – 5.60 % (fix) |
| | | | | | | | | | | | |
BHW Bausparkasse | | 2017 | | 5 | | EUR | | Subordinated Liabilities | | no | | 5.69 % (fix) |
| | | | | | | | | | | | |
BHW Bausparkasse | | 2018 | | 6 | | EUR | | Subordinated Liabilities | | no | | 6.08 % (fix) |
| | | | | | | | | | | | |
BHW Bausparkasse | | 2019 | | 48 | | EUR | | Subordinated Liabilities | | no | | 4.27 % (fix) – 5.83 % (fix) |
| | | | | | | | | | | | |
BHW Bausparkasse | | 2023 | | 40 | | EUR | | Subordinated Liabilities | | no | | 5.45 % (fix) – 6.13 % (fix) |
| | | | | | | | | | | | |
BHW Bausparkasse | | 2024 | | 10 | | EUR | | Subordinated Liabilities | | no | | 5.64 % (fix) |
| | | | | | | | | | | | |
Deutsche Postbank AG | | 2013 | | 227 | | EUR | | Subordinated Liabilities | | no | | 4.78 % (fix) – 6.00 % (fix) |
| | | | | | | | | | | | |
Deutsche Postbank AG | | 2014 | | 83 | | EUR | | Subordinated Liabilities | | no | | 4.50 % (fix) – 6.00 % (fix) |
| | | | | | | | | | | | |
| Deutsche Postbank AG | | 2015 | | 508 | | EUR | | Subordinated Liabilities | | 500 mn.: Early redemption at the issuer’s option since 2011 at each coupon-date | | 1.00 % (var.) – 5.50 % (fix) |
| | | | | | | | | | | | |
Deutsche Postbank AG | | 2016 | | 30 | | EUR | | Subordinated Liabilities | | no | | 4.92 % (fix) – 5.01 % (fix) |
| | | | | | | | | | | | |
Deutsche Postbank AG | | 2017 | | 60 | | EUR | | Subordinated Liabilities | | no | | 5.21 % (fix) – 5.83 % (fix) |
| | | | | | | | | | | | |
Deutsche Postbank AG | | 2018 | | 313 | | EUR | | Subordinated Liabilities | | no | | 5.19 % (fix) – 6.63 % (fix) |
| | | | | | | | | | | | |
Deutsche Postbank AG | | 2019 | | 65 | | EUR | | Subordinated Liabilities | | no | | 5.14 % (fix) – 5.46 % (fix) |
| | | | | | | | | | | | |
Deutsche Postbank AG | | 2022 | | 15 | | EUR | | Subordinated Liabilities | | no | | 4.63 % (fix) |
| | | | | | | | | | | | |
Deutsche Postbank AG | | 2023 | | 98 | | EUR | | Subordinated Liabilities | | no | | 5.60 % (fix) – 6.01 % (fix) |
| | | | | | | | | | | | |
Deutsche Postbank AG | | 2024 | | 43 | | EUR | | Subordinated Liabilities | | no | | 5.15 % (fix) – 5.45 % (fix) |
| | | | | | | | | | | | |
Deutsche Postbank AG | | 2027 | | 13 | | EUR | | Subordinated Liabilities | | no | | 6.50 % (fix) |
| | | | | | | | | | | | |
Deutsche Postbank AG | | 2036 | | 24,000 | | JPY | | Subordinated Liabilities | | no | | 2.76 % (fix) – 2.84 % (fix) |
|
| | | | |
| Deutsche Bank | | 01 – Management Report | | 177 |
| Financial Report 2012 | | Risk Report | | |
| | |
| | | | |
| | |
| | | | |
| | | | | | | | | | | | | | | | |
Reconciliation of shareholders’ equity to regulatory capital in€ m. | | | | Dec 31, 2012 | | | Dec 31, 2011 | | | | | | | |
Total shareholders’ equity per accounting balance sheet | | | | | 54,003 | | | | 53,390 | | | | | | | |
| | | | | | | | | | | | | | | | |
Common shares | | | | | 2,380 | | | | 2,380 | | | | | | | |
| | | | | | | | | | | | | | | | |
Additional paid-in capital | | | | | 23,778 | | | | 23,695 | | | | | | | |
| | | | | | | | | | | | | | | | |
Retained earnings | | | | | 29,198 | | | | 30,119 | | | | | | | |
Therein: Actuarial gains (losses) rel. to defined benefit plans, net of tax/CTA | | | | | 198 | | | | 650 | | | | | | | |
Therein: Net income attributable to Deutsche Bank Shareholders | | | | | 237 | | | | 4,132 | | | | | | | |
| | | | | | | | | | | | | | | | |
Common shares in treasury, at cost | | | | | (60) | | | | (823) | | | | | | | |
| | | | | | | | | | | | | | | | |
Equity classified as obligation to purchase common shares | | | | | – | | | �� | – | | | | | | | |
| | | | | | | | | | | | | | | | |
Accumulated other comprehensive income, net of tax | | | | | (1,293) | | | | (1,981) | | | | | | | |
| | | | | | | | | | | | | | | | |
| | | | | | | | | | | | | | | | |
| | | | | | | | | | | | | | | | |
Prudential filters | | | | | (261) | | | | 719 | | | | | | | |
| | | | | | | | | | | | | | | | |
Own credit spread of liabilities designated at fair value | | | | | (2) | | | | (128) | | | | | | | |
| | | | | | | | | | | | | | | | |
Unrealized gains and losses | | | | | (259) | | | | 847 | | | | | | | |
| | | | | | | | | | | | | | | | |
| | | | | | | | | | | | | | | | |
| | | | | | | | | | | | | | | | |
Regulatory adjustments to accounting basis | | | | | (15,785) | | | | (17,796) | | | | | | | |
| | | | | | | | | | | | | | | | |
Dividend accrual | | | | | (697) | | | | (697) | | | | | | | |
| | | | | | | | | | | | | | | | |
Goodwill | | | | | (8,583) | | | | (10,156) | | | | | | | |
Per balance sheet | | | | | (9,297) | | | | (10,973) | | | | | | | |
Goodwill from at-equity investments | | | | | (30) | | | | (29) | | | | | | | |
Goodwill relating to non-regulatory consolidation circle | | | | | 745 | | | | 846 | | | | | | | |
| | | | | | | | | | | | | | | | |
Intangibles | | | | | (2,996) | | | | (2,753) | | | | | | | |
Per balance sheet | | | | | (4,922) | | | | (4,829) | | | | | | | |
Deferred tax liability | | | | | 583 | | | | 676 | | | | | | | |
Intangibles relating to non-regulatory consolidation circle | | | | | 1,343 | | | | 1,399 | | | | | | | |
| | | | | | | | | | | | | | | | |
Noncontrolling interests | | | | | 124 | | | | 999 | | | | | | | |
Per balance sheet | | | | | 407 | | | | 1,270 | | | | | | | |
Noncontrolling interests relating to non-regulatory consolidation circle | | | | | (283) | | | | (271) | | | | | | | |
| | | | | | | | | | | | | | | | |
Securitization positions | | | | | (953) | | | | (2,863) | | | | | | | |
| | | | | | | | | | | | | | | | |
Shortfall of provisions to expected loss | | | | | (440) | | | | (508) | | | | | | | |
| | | | | | | | | | | | | | | | |
Free-deliveries outstanding | | | | | – | | | | – | | | | | | | |
| | | | | | | | | | | | | | | | |
Significant investments in the capital of financial sector entities | | | | | (1,493) | | | | (1,332) | | | | | | | |
| | | | | | | | | | | | | | | | |
Other, including consolidation and regulatory adjustments | | | | | (748) | | | | (486) | | | | | | | |
| | | | | | | | | | | | | | | | |
| | | | | | | | | | | | | | | | |
| | | | | | | | | | | | | | | | |
Common Equity Tier 1 capital | | | | | 37,957 | | | | 36,313 | | | | | | | |
| | | | | | | | | | | | | | | | |
| | | | | | | | | | | | | | | | |
| | | | | | | | | | | | | | | | |
Additional Tier 1 capital | | | | | 12,526 | | | | 12,734 | | | | | | | |
| | | | | | | | | | | | | | | | |
Hybrid capital securities | | | | | 12,526 | | | | 12,734 | | | | | | | |
Per balance sheet | | | | | 12,091 | | | | 12,344 | | | | | | | |
Regulatory adjustments | | | | | 435 | | | | 390 | | | | | | | |
| | | | | | | | | | | | | | | | |
Deductions from Additional Tier 1 capital | | | | | – | | | | – | | | | | | | |
| | | | | | | | | | | | | | | | |
| | | | | | | | | | | | | | | | |
| | | | | | | | | | | | | | | | |
Tier 1 capital | | | | | 50,483 | | | | 49,047 | | | | | | | |
| | | | | | | | | | | | | | | | |
| | | | | – | | | | – | | | | | | | |
| | | | | | | | | | | | | | | | |
Tier 2 capital | | | | | 6,532 | | | | 6,179 | | | | | | | |
| | | | | | | | | | | | | | | | |
Subordinated debt | | | | | 9,362 | | | | 10,813 | | | | | | | |
Per balance sheet | | | | | 11,282 | | | | 12,083 | | | | | | | |
Amortization | | | | | (2,283) | | | | (1,213) | | | | | | | |
Regulatory adjustments | | | | | 364 | | | | (57) | | | | | | | |
| | | | | | | | | | | | | | | | |
Deductions from Tier 2 capital | | | | | (2,885) | | | | (4,703) | | | | | | | |
| | | | | | | | | | | | | | | | |
Other | | | | | 55 | | | | 70 | | | | | | | |
| | | | | | | | | | | | | | | | |
| | | | | | | | | | | | | | | | |
| | | | | | | | | | | | | | | | |
Total Regulatory capital | | | | | 57,015 | | | | 55,226 | | | | | | | |
| | | | | | | |
| | | | | | | | | | | | | | | | |
Regulatory Capital Requirements Under the Basel framework, overall capital requirements have to be calculated and compared with the regulatory capital described above. The overall capital requirements are frequently expressed in risk-weighted asset terms whereby total capital requirements are 8 % of risk-weighted assets. The information presented below is based on the regulatory principles of consolidation. | | | | | | | | | | | |
| | | | |
| Deutsche Bank | | 01 – Management Report | | 178 |
| Financial Report 2012 | | Risk Report | | |
| | |
| | | | |
| | |
| | | | |
Since December 31, 2011, the calculation of our RWAs and capital ratios has incorporated the amended capital requirements for trading book and securitization positions pursuant to the “Basel 2.5” framework, as implemented by the Capital Requirements Directive 3 and transposed into German law by the German Banking Act and the Solvency Regulation.
The Basel 2.5 framework introduced the model based risk measures stressed value-at-risk, incremental risk charge and comprehensive risk within market risk for banks applying an internal model approach:
| — | | Stressed Value-at-Risk: calculates a stressed value-at-risk measure based on a continuous one year period of significant market stress. |
| — | | Incremental Risk Charge (“IRC”): captures default and migration risks in addition to the risks already captured in value-at-risk for credit-sensitive positions in the trading book. |
| — | | Comprehensive Risk Measure (“CRM”): captures incremental risk for the credit correlation trading portfolio calculated using an internal model subject to qualitative minimum requirements as well as stress testing requirements. The CRM must be calculated weekly and is determined as the higher of the latest weekly CRM charge from the model, the twelve weeks average CRM charge, and the MRSA charge for the credit correlation portfolio, the so-called CRM Floor. |
In addition, Basel 2.5 regulations require as part of the market risk capital charge the calculation of the specific market risk of securitization trading positions and nth-to-default credit derivatives, which are not eligible for the comprehensive risk measure, based on the market risk standardized approach.
Against this background, we calculate our RWA based on the following approaches:
In December 2007 the BaFin approved the use of the advanced IRBA for the majority of our counterparty credit risk positions which excludes the exposures consolidated from Postbank. Additional advanced IRBA-related BaFin approvals have been obtained during the period 2008 to 2012. The advanced IRBA constitutes the most sophisticated approach available under the Basel regime. Postbank has BaFin approval for the IRBA to be applied to the retail business, which is assigned to the advanced IRBA for consolidation on Group level, and the foundation IRBA for a significant portion of the other counterparty credit risk exposures.
The remaining IRBA eligible exposures are covered within the standardized approach either temporarily (where we are seeking regulatory approval for some remaining small portfolios) or permanently (where exposures are treated under the standardized approach in accordance with Section 70 SolvV). More details on this topic are provided in the Section “Counterparty Credit Risk: Regulatory Assessment”.
The capital requirement for securitization positions is calculated substantially using the IRBA approach; only minor exposures are captured under the standardized approach. The introduction of Basel 2.5 requires identifying re-securitization positions in the banking and trading book which receive an increased risk-weighting and result in higher capital charges for credit risk and market risk, respectively. More details on the treatment of securitization positions can be found in the Section “Securitization”.
For equity investments entered into before January 1, 2008, we use the transitional arrangement to exempt these positions from an IRBA treatment and apply the grandfathering rule, using a 100 % risk weighting. For investments in equity positions entered into since January 1, 2008, we apply the simple risk weight approach within the IRBA for our exposures. For more details regarding equity investments please refer to the Sections “Nontrading Market Risk – Investment Risk” and “Nontrading Market Risk – Equity Investments Held”.
The calculation of regulatory market risk capital requirements is generally based on an internal value-at-risk model, which was approved by the BaFin in October 1998 for our market risk exposures. In December 2011 we received model approvals from BaFin for the stressed value-at-risk, incremental risk charge and comprehensive risk measure. Our regulatory capital calculation for the specific interest rate risk of trading book securitizations and nth-to-default credit derivatives which are not eligible for the comprehensive risk measure is based
| | | | |
| Deutsche Bank | | 01 – Management Report | | 179 |
| Financial Report 2012 | | Risk Report | | |
| | |
| | | | |
| | |
| | | | |
on the market risk standardized approach. Further market risk positions covered under the standardized approach include for example exposures in relation to Postbank. More details on the aforementioned internal models are provided in the Section “Trading Market Risk”.
In December 2007, we obtained approval to apply the advanced measurement approach (“AMA”) to determine our regulatory operational risk capital requirements, the approval does not apply to Postbank. Details on the respective AMA model are given in the Section “Operational Risk”. As of December 31, 2010, Postbank also obtained the approval to apply the advanced measurement approach. Capital requirements for operational risk are still displayed for the Group excluding Postbank, and separately for Postbank as we are waiting for regulatory approval to integrate Postbank into our regulatory capital calculation.
Risk-weighted Assets by Model Approach and Business Division
| | | | | | | | | | | | | | | | | | | | | | | | | | | | |
| | | Dec 31, 2012 | |
in€ m. | | Corporate
Banking
& Securities | | | Global
Transaction
Bank | | | Asset &
Wealth
Management | | | Private &
Business
Clients | | | Non-Core
Operations
Unit | | | Consolidation
& Adjustments
and Other | | | Total | |
Credit Risk | | | 70,590 | | | | 26,398 | | | | 6,134 | | | | 67,511 | | | | 40,329 | | | | 18,235 | | | | 229,196 | |
Advanced IRBA | | | 63,727 | | | | 18,464 | | | | 2,823 | | | | 38,637 | | | | 19,501 | | | | 573 | | | | 143,725 | |
Central Governments | | | 2,440 | | | | 818 | | | | 11 | | | | 76 | | | | 266 | | | | 151 | | | | 3,762 | |
Institutions | | | 5,686 | | | | 1,607 | | | | 93 | | | | 200 | | | | 1,333 | | | | 27 | | | | 8,946 | |
Corporates | | | 49,258 | | | | 15,610 | | | | 2,589 | | | | 2,796 | | | | 10,999 | | | | 395 | | | | 81,646 | |
Retail | | | 217 | | | | 20 | | | | 130 | | | | 34,529 | | | | 1,150 | | | | 0 | | | | 36,046 | |
Other | | | 6,125 | | | | 409 | | | | 1 | | | | 1,037 | | | | 5,753 | | | | 0 | | | | 13,325 | |
| | | | | | | | | | | | | | | | | | | | | | | | | | | | |
Foundation IRBA | | | – | | | | – | | | | – | | | | 8,726 | | | | 1,813 | | | | – | | | | 10,539 | |
Central Governments | | | – | | | | – | | | | – | | | | 32 | | | | 2 | | | | – | | | | 35 | |
Institutions | | | – | | | | – | | | | – | | | | 2,217 | | | | 939 | | | | – | | | | 3,156 | |
Corporates | | | – | | | | – | | | | – | | | | 6,477 | | | | 872 | | | | – | | | | 7,349 | |
Retail | | | – | | | | – | | | | – | | | | – | | | | – | | | | – | | | | – | |
Other | | | – | | | | – | | | | – | | | | – | | | | – | | | | – | | | | 0 | |
| | | | | | | | | | | | | | | | | | | | | | | | | | | | |
Other IRBA | | | 2,487 | | | | 261 | | | | 455 | | | | 9,042 | | | | 8,027 | | | | 2,321 | | | | 22,592 | |
Central Governments | | | – | | | | – | | | | – | | | | – | | | | – | | | | – | | | | – | |
Institutions | | | – | | | | – | | | | – | | | | – | | | | – | | | | – | | | | – | |
Corporates | | | 1,341 | | | | 240 | | | | – | | | | 5,574 | | | | 3,802 | | | | – | | | | 10,957 | |
Retail | | | – | | | | – | | | | – | | | | – | | | | – | | | | – | | | | – | |
Other | | | 1,146 | | | | 20 | | | | 455 | | | | 3,467 | | | | 4,225 | | | | 2,321 | | | | 11,635 | |
| | | | | | | | | | | | | | | | | | | | | | | | | | | | |
Standardized Approach | | | 4,376 | | | | 7,673 | | | | 2,856 | | | | 11,105 | | | | 10,988 | | | | 15,340 | | | | 52,340 | |
Central Governments | | | 2 | | | | 68 | | | | 0 | | | | 87 | | | | 222 | | | | 1 | | | | 379 | |
Institutions | | | 13 | | | | 16 | | | | 9 | | | | 112 | | | | 77 | | | | 3 | | | | 230 | |
Corporates | | | 3,070 | | | | 7,125 | | | | 1,038 | | | | 2,733 | | | | 4,273 | | | | 401 | | | | 18,640 | |
Retail | | | 16 | | | | 392 | | | | 134 | | | | 5,991 | | | | 2,758 | | | | 1 | | | | 9,292 | |
Other | | | 1,275 | | | | 73 | | | | 1,675 | | | | 2,183 | | | | 3,658 | | | | 14,935 | | | | 23,799 | |
| | | | | | | | | | | | | | | | | | | | | | | | | | | | |
Market Risk | | | 35,656 | | | | 365 | | | | 1,166 | | | | 360 | | | | 15,512 | | | | – | | | | 53,058 | |
Internal Model Approach | | | 31,280 | | | | 365 | | | | 1,166 | | | | – | | | | 13,761 | | | | – | | | | 46,571 | |
Standardized Approach | | | 4,376 | | | | – | | | | – | | | | 360 | | | | 1,751 | | | | – | | | | 6,487 | |
| | | | | | | | | | | | | | | | | | | | | | | | | | | | |
Operational Risk | | | 19,221 | | | | 331 | | | | 4,904 | | | | 4,530 | | | | 22,609 | | | | – | | | | 51,595 | |
Advanced measurement approach | | | 19,221 | | | | 331 | | | | 4,904 | | | | 4,530 | | | | 22,609 | | | | – | | | | 51,595 | |
| | | | | | | | | | | | | | | | | | | | | | | | | | | | |
Total | | | 124,939 | | | | 27,093 | | | | 12,451 | | | | 72,695 | | | | 80,295 | | | | 16,377 | | | | 333,849 | |
| |
Within credit risk, the line item “Other” in Advanced IRBA predominately reflects RWA from securitization positions in the banking book. The Other IRBA mainly contains equity positions as well as non-credit obligation assets in the category “Other”. Within the Standardized Approach, about half of the line item “Other” includes RWAs from banking book securitizations with the remainder being exposures assigned to the further exposure classes in the Standardized Approach apart from central governments, institutions, corporate and retail.
| | | | |
| Deutsche Bank | | 01 – Management Report | | 180 |
| Financial Report 2012 | | Risk Report | | |
| | |
| | | | |
| | |
| | | | |
Regulatory Capital Requirements and Risk-weighted Assets
| | | | | | | | | | | | | | | | |
| | | Dec 31, 2012 | | | Dec 31, 2011 | |
in€ m. | | Capital
requirements | | | RWA | | | Capital
requirements | | | RWA | |
Counterparty credit risk | | | | | | | | | | | | | | | | |
| | | | | | | | | | | | | | | | |
Advanced IRBA | | | | | | | | | | | | | | | | |
Central governments | | | 301 | | | | 3,762 | | | | 207 | | | | 2,586 | |
Institutions | | | 716 | | | | 8,946 | | | | 1,018 | | | | 12,727 | |
Corporates | | | 6,532 | | | | 81,646 | | | | 8,049 | | | | 100,609 | |
Retail (excluding Postbank) | | | 1,727 | | | | 21,583 | | | | 1,718 | | | | 21,480 | |
Retail (Postbank) | | | 1,157 | | | | 14,462 | | | | 912 | | | | 11,405 | |
Other non-credit obligation assets | | | 343 | | | | 4,283 | | | | 1,144 | | | | 14,304 | |
| | | | | | | | | | | | | | | | |
Total advanced IRBA | | | 10,775 | | | | 134,683 | | | | 13,049 | | | | 163,112 | |
| | | | | | | | | | | | | | | | |
Foundation approach | | | | | | | | | | | | | | | | |
Central governments | | | 3 | | | | 35 | | | | 3 | | | | 37 | |
Institutions | | | 252 | | | | 3,156 | | | | 323 | | | | 4,044 | |
Corporates | | | 1,465 | | | | 18,306 | | | | 1,391 | | | | 17,382 | |
Other non-credit obligation assets | | | 152 | | | | 1,897 | | | | 228 | | | | 2,850 | |
| | | | | | | | | | | | | | | | |
Total foundation approach | | | 1,872 | | | | 23,394 | | | | 1,945 | | | | 24,312 | |
| | | | | | | | | | | | | | | | |
Standardized approach | | | | | | | | | | | | | | | | |
Central governments | | | 0 | | | | 1 | | | | 1 | | | | 15 | |
Regional governments and local authorities | | | 4 | | | | 55 | | | | 8 | | | | 100 | |
Other public sector entities | | | 26 | | | | 323 | | | | 52 | | | | 654 | |
Multilateral development banks | | | – | | | | – | | | | – | | | | – | |
International organizations | | | – | | | | – | | | | – | | | | – | |
Institutions | | | 18 | | | | 230 | | | | 47 | | | | 583 | |
Covered bonds issued by credit institutions | | | 1 | | | | 8 | | | | 8 | | | | 98 | |
Corporates | | | 1,491 | | | | 18,640 | | | | 1,840 | | | | 22,998 | |
Retail | | | 525 | | | | 6,564 | | | | 882 | | | | 11,029 | |
Claims secured by real estate property | | | 218 | | | | 2,728 | | | | 252 | | | | 3,152 | |
Collective investment undertakings | | | 196 | | | | 2,444 | | | | 220 | | | | 2,755 | |
Other items | | | 1,176 | | | | 14,702 | | | | 8 | | | | 94 | |
Past due items | | | 130 | | | | 1,625 | | | | 156 | | | | 1,944 | |
| | | | | | | | | | | | | | | | |
Total standardized approach | | | 3,786 | | | | 47,320 | | | | 3,474 | | | | 43,424 | |
| | | | | | | | | | | | | | | | |
Risk from securitization positions | | | | | | | | | | | | | | | | |
Securitizations (IRBA) | | | 1,066 | | | | 13,325 | | | | 1,340 | | | | 16,753 | |
Securitizations (standardized approach) | | | 117 | | | | 1,457 | | | | 157 | | | | 1,961 | |
| | | | | | | | | | | | | | | | |
Total risk from securitization positions | | | 1,183 | | | | 14,782 | | | | 1,497 | | | | 18,714 | |
| | | | | | | | | | | | | | | | |
Risk from equity positions | | | | | | | | | | | | | | | | |
Equity positions (grandfathered) | | | 281 | | | | 3,517 | | | | 282 | | | | 3,522 | |
Equity positions (IRBA simple risk-weight approach) | | | 436 | | | | 5,455 | | | | 760 | | | | 9,503 | |
Exchange-traded | | | 51 | | | | 632 | | | | 81 | | | | 1,016 | |
Non-exchange-traded | | | 369 | | | | 4,616 | | | | 647 | | | | 8,088 | |
Non-exchange-traded but sufficiently diversified | | | 17 | | | | 207 | | | | 32 | | | | 399 | |
| | | | | | | | | | | | | | | | |
Total risk from equity positions | | | 718 | | | | 8,971 | | | | 1,042 | | | | 13,024 | |
| | | | | | | | | | | | | | | | |
Settlement risk | | | 4 | | | | 46 | | | | 14 | | | | 178 | |
| | | | | | | | | | | | | | | | |
Total counterparty credit risk | | | 18,336 | | | | 229,196 | | | | 21,021 | | | | 262,764 | |
| | | | | | | | | | | | | | | | |
Market risk in the trading book | | | | | | | | | | | | | | | | |
Internal model approach | | | 3,726 | | | | 46,571 | | | | 4,819 | | | | 60,241 | |
VaR | | | 761 | | | | 9,510 | | | | 972 | | | | 12,150 | |
Stressed VaR | | | 1,641 | | | | 20,518 | | | | 2,151 | | | | 26,892 | |
Incremental Risk Charge | | | 761 | | | | 9,509 | | | | 758 | | | | 9,475 | |
Comprehensive Risk Measurement (Correlation Trading) | | | 563 | | | | 7,035 | | | | 938 | | | | 11,724 | |
Standardized approach | | | 519 | | | | 6,487 | | | | 628 | | | | 7,854 | |
Interest rate risk – Non-Securitization | | | 2 | | | | 26 | | | | 142 | | | | 1,780 | |
Interest rate risk – Securitization and nth-to-default derivatives | | | 443 | | | | 5,533 | | | | 399 | | | | 4,986 | |
Equity risk | | | – | | | | – | | | | – | | | | – | |
FX risk | | | 42 | | | | 524 | | | | 55 | | | | 688 | |
Commodity risk | | | – | | | | – | | | | – | | | | – | |
Other market risk | | | 32 | | | | 404 | | | | 32 | | | | 401 | |
| | | | | | | | | | | | | | | | |
Total market risk in the trading book | | | 4,245 | | | | 53,058 | | | | 5,448 | | | | 68,095 | |
| | | | | | | | | | | | | | | | |
Operational risk | | | | | | | | | | | | | | | | |
Advanced measurement approach (excluding Postbank) | | | 3,866 | | | | 48,325 | | | | 3,772 | | | | 47,148 | |
Advanced measurement approach (Postbank) | | | 262 | | | | 3,270 | | | | 284 | | | | 3,547 | |
| | | | | | | | | | | | | | | | |
Total operational risk | | | 4,128 | | | | 51,595 | | | | 4,056 | | | | 50,695 | |
| | | | | | | | | | | | | | | | |
Total regulatory capital requirements and RWA | | | 26,708 | | | | 333,849 | | | | 30,524 | | | | 381,554 | |
| |
| | | | |
| Deutsche Bank | | 01 – Management Report | | 181 |
| Financial Report 2012 | | Risk Report | | |
| | |
| | | | |
| | |
| | | | |
The table below provides an analysis of key drivers for RWA movements on a Basel 2.5 basis observed for credit and market risk in the reporting period.
Development of Risk-weighted Assets for Credit Risk and Market Risk
| | | | | | | | |
| | | Dec 31, 2012 | |
| in€ m. | | Counterparty
credit risk | | | thereof:
derivatives and
repo-style
transactions | |
| | | | |
Credit risk RWA balance, beginning of year | | | 262,764 | | | | 50,973 | |
Book Quality/Growth | | | 3,400 | | | | 3,283 | |
Operating Model Improvements | | | (13,534) | | | | (12,800) | |
Advanced Model Roll out | | | (7,325) | | | | (4,180) | |
Asset Sale/Hedging | | | (14,470) | | | | (1,567) | |
Foreign exchange movements | | | (1,639) | | | | (436) | |
| | | | | | | | |
Credit risk RWA balance, end of year | | | 229,196 | | | | 35,274 | |
| |
| | | | |
in€ m. | | Dec 31, 2012 | |
Market risk RWA balance, beginning of year | | | 68,095 | |
Movement in risk levels | | | (322) | |
Market data changes and recalibrations | | | (2,577) | |
Model updates | | | (707) | |
Methodology and policy | | | (11,215) | |
Acquisitions and disposals | | | – | |
Foreign exchange movements | | | (216) | |
| | | | |
Market risk RWA balance, end of year | | | 53,058 | |
| |
The decrease in RWA for counterparty credit risk by 13 % since December 31, 2011 mainly reflects the successful RWA reduction efforts focusing on de-risking as well as model and process enhancements.
The category Asset Sale/Hedging mainly includes de-risking activities through disposals, restructuring and additional hedging. Regular process and data enhancements including further migration of derivatives into the internal model method as well as continuing usage of master netting and collateral agreements are considered in the category Operating Model improvements. The Advanced Model Roll-out category primarily shows the impact from BaFin approvals received for certain advanced IRBA models which we continued to roll out in light of the German regulatory requirement to achieve an IRBA coverage ratio of 92 % on an EAD- and RWA-basis by December 31, 2012. The category Book Quality/Growth includes organic changes in the book size as well as the effects from portfolio rating migrations.
The analysis for market risk covers movements in our internal models for value-at-risk, stressed value-at-risk, incremental risk charge and comprehensive risk measure as well as results from the market risk standardized approach, e.g. for trading securitizations and nth-to-default derivatives or trading exposures for Postbank.
The 22 % RWA decrease for market risk since December 31, 2011 is mainly due to the significant reduction of our BaFin-defined, internal model multiplier from 5.5 to 4.0 for value-at-risk and stressed value-at-risk resulting from model enhancements and process improvements. The impact is reflected exclusively in the “Methodology and policy” category which provides regulatory-driven changes to our market risk RWA models. The market risk RWA movements due to changes in market data levels, volatilities, correlations, liquidity and ratings are included under the market data changes category. In 2012 we saw a benefit in market risk RWA due to lower levels of volatility within the historical market data used in the calculation. Changes to our market risk RWA internal models, such as methodology enhancements or risk scope extensions, are included in the category of “Model updates”. Further details on the market risk methodologies and their refinements are provided in the section “Trading Market Risk – Market Risk Measurement”. Market risk RWA movements in Risk levels are interpreted as organic changes in portfolio size and composition resulting from the normal course of business. In this category we also consider re-allocations between the regulatory trading and banking book which occur in rare cases. Significant new businesses and disposals would be assigned to the line item Acquisition and disposal, which was not applicable in this reporting period.
| | | | |
| Deutsche Bank | | 01 – Management Report | | 182 |
| Financial Report 2012 | | Risk Report | | |
| | |
| | | | |
| | |
| | | | |
Regulatory Capital Ratios
The KWG and the SolvV reflect the capital adequacy rules of Basel 2.5 and require German banks to maintain an adequate level of capital in relation to their regulatory capital requirements comprising counterparty credit risk, operational risk and market risk. Counterparty credit risk and operational risk must be covered with Tier 1 capital and Tier 2 capital (together “regulatory banking capital”). Market risk must be covered with regulatory banking capital (to the extent not required to cover counterparty credit and operational risk) or Tier 3 capital (together with regulatory banking capital, “own funds”).
The following table shows our eligible regulatory capital, including transitional items pursuant to Section 64h (3) KWG, available to cover the minimum capital requirements by risk type:
Coverage of Minimum Capital Requirements
| | | | | | | | | | | | | | | | |
| | | Dec 31, 2012 | | | Dec 31, 2011 | |
in€ m. | | Regulatory
capital
requirements | | | Available
regulatory
capital | | | Regulatory
capital
requirements | | | Available
regulatory
capital | |
Counterparty credit risk and operational risk | | | 22,464 | | | | 57,251 | | | | 25,077 | | | | 55,545 | |
| | | | | | | | | | | | | | | | |
Market risk | | | 4,245 | | | | 34,787 | | | | 5,448 | | | | 30,468 | |
| |
As of each of December 31, 2012, and December 31, 2011, we held regulatory capital well above the required minimum standards. The increase of regulatory capital in 2012 of€ 1.7 billion, thereof€ 1.4 billion in the form of Tier 1 capital, reflected primarily reduced capital deduction items.
The German Banking Act and Solvency Regulation rules required us to cover our market risk as of December 31, 2012 with€ 4,2 billion of total regulatory capital (Tier 1 + 2 + 3) compared to€ 5.4 billion as of December 31, 2011. We met this requirement entirely with Tier 1 and Tier 2 capital that was not required for the minimum coverage of credit and operational risk.
Basel 2.5 requires the deduction of goodwill from Tier 1 capital. However, for a transitional period the partial inclusion of certain goodwill components in Tier 1 capital is allowed pursuant to German Banking Act Section 64h (3).
As of December 31, 2012, the transitional item amounted to€ 236 million compared to€ 319 million as of December 31, 2011. In our reporting to the German regulatory authorities, this amount is included in the Tier 1 capital, total regulatory capital and the total risk-weighted assets, as shown in the tables above. Correspondingly, our Tier 1 and total capital ratios reported to the German regulatory authorities including this item were 15.2 % and 17.1 %, respectively, on December 31, 2012 compared to 12.9 % and 14.6 %, respectively, on December 31, 2011.
As of December 31, 2012, regulatory capital ratios on a standalone basis for Deutsche Bank AG and for its subsidiaries Deutsche Bank Privat- und Geschäftskunden AG, norisbank GmbH, DWS Finanz-Service GmbH, Deutsche Bank Europe GmbH and Sal. Oppenheim jr. & Cie. AG & Co.KGaA are not disclosed as these companies have applied the exemptions codified in Section 2a KWG. As a result, they are exempted from the obligation to comply with certain regulatory requirements of the Banking Act on a standalone basis, including solvency calculations and reporting of regulatory capital ratios. These exemptions can only be applied if, among other things, there is no material practical or legal impediment to the prompt transfer of own funds or repayment of liabilities from Deutsche Bank AG to the respective subsidiaries or from all subsidiaries in the Group to Deutsche Bank AG.
Deutsche Postbank AG, which we have consolidated since December 3, 2010, is considered a significant subsidiary of the Group. Here, “significant” is defined as an entity whose relative individual contribution to our risk-weighted assets exceeds 5 % of our overall RWA. In December 2012 Deutsche Postbank AG has issued a waiver notification in accordance with Section 2a KWG to the German Supervisory Authority, the application of which is currently under discussion between Deutsche Postbank AG and the Supervisory Authority.
| | | | |
| Deutsche Bank | | 01 – Management Report | | 183 |
| Financial Report 2012 | | Risk Report | | |
| | |
| | | | |
| | |
| | | | |
Notwithstanding, the Tier 1 capital ratio as of December 31, 2012 and the total capital ratio for the Deutsche Postbank Group including Deutsche Postbank AG with goodwill components allowed pursuant to Section 64h (3) KWG amounted to 12.0 % and 15.9 %, and 10.8 % and 14.9 % as of December 31, 2011, respectively.
Failure to meet minimum capital requirements can result in orders to suspend or reduce dividend payments or other profit distributions on regulatory capital and discretionary actions by the BaFin that, if undertaken, could have a direct material effect on our businesses. We complied with the regulatory capital adequacy requirements in 2012. Our subsidiaries which are not included in the regulatory consolidation did not report any capital deficiencies in 2012.
Balance Sheet Management
We manage our balance sheet on a Group level and, where applicable, locally in each region. In the allocation of financial resources we favor business portfolios with the highest positive impact on our profitability and shareholder value. We monitor and analyze balance sheet developments and track certain market-observed balance sheet ratios. Based on this we trigger discussion and management action by the Capital and Risk Committee. While we monitor IFRS balance sheet developments, our balance sheet management is principally focused on adjusted values as used in our adjusted leverage ratio, which is calculated using adjusted total assets and adjusted total equity figures.
Leverage Ratio: We calculate our leverage ratio as a non-GAAP financial measure by dividing total assets by total equity. We disclose an adjusted leverage ratio for which the following adjustments are made to the reported IFRS assets and equity:
| — | | Total assets under IFRS are adjusted to reflect additional netting provisions to obtain total assets adjusted. Under IFRS offsetting of financial assets and financial liabilities is required when an entity, (1) currently has a legally enforceable right to set off the recognized amounts; and (2) intends either to settle on a net basis, or to realize the asset and settle the liability simultaneously. IFRS specifically focuses on the intention to settle net in the ordinary course of business, irrespective of the rights in default. As most derivative contracts covered by a master netting agreement do not settle net in the ordinary course of business they must be presented gross under IFRS. Repurchase and reverse repurchase agreements are also presented gross, as they also do not settle net in the ordinary course of business, even when covered by a master netting agreement. It has been industry practice in the U.S. to net the receivables and payables from unsettled regular way trades. This is not permitted under IFRS. |
| — | | Total equity under IFRS is adjusted to reflect pro-forma fair value gains and losses on our own debt (post-tax, estimate assuming that substantially all of our own debt was designated at fair value), to obtain total equity adjusted. The tax rate applied for this calculation is a blended uniform tax rate of 35 %. |
We apply these adjustments in calculating the adjusted leverage ratio to improve comparability with competitors. The definition of the adjusted leverage ratio is used consistently throughout the Group in managing the business. There will still be differences in the way competitors calculate their leverage ratios compared to our definition of the adjusted leverage ratio. Therefore our adjusted leverage ratio should not be compared to other companies’ leverage ratios without considering the differences in the calculation. Our adjusted leverage ratio is not likely to be identical to, nor necessarily indicative of, what our leverage ratio would be under any current or future bank regulatory leverage ratio requirement.
| | | | |
| Deutsche Bank | | 01 – Management Report | | 184 |
| Financial Report 2012 | | Risk Report | | |
| | |
| | | | |
| | |
| | | | |
Leverage ratio
| | | | | | | | |
in€ bn. (unless stated otherwise) | | Dec 31, 2012 | | | Dec 31, 2011 | |
Total assets (IFRS) | | | 2,012 | | | | 2,164 | |
| | | | | | | | |
Adjustment for additional derivatives netting | | | (705) | | | | (782) | |
| | | | | | | | |
Adjustment for additional pending settlements netting | | | (82) | | | | (105) | |
| | | | | | | | |
Adjustment for additional reverse repo netting | | | (26) | | | | (10) | |
| | | | | | | | |
Total assets (adjusted) | | | 1,199 | | | | 1,267 | |
| | | | | | | | |
| | | | | | | | |
| | | | | | | | |
Total equity (IFRS) | | | 54.4 | | | | 54.7 | |
| | | | | | | | |
Adjustment for pro-forma fair value gains (losses) on own debt (post-tax)1 | | | 1.7 | | | | 4.5 | |
| | | | | | | | |
Total equity (adjusted) | | | 56.1 | | | | 59.2 | |
| | | | | | | | |
| | | | | | | | |
Leverage Ratio in % (IFRS) | | | 37 | | | | 40 | |
| | | | | | | | |
Leverage Ratio in % (adjusted) | | | 21 | | | | 21 | |
| |
| 1 | The estimated cumulative tax effect on pro-forma fair value gains (losses) on such own debt was€ (0.9) billion and€ (2.4) billion at December 31, 2012 and December 31, 2011, respectively. |
As of December 31, 2012, on a consolidated basis our adjusted leverage ratio was materially unchanged compared to the prior year-end, and is well below our leverage ratio target of 25. Our leverage ratio calculated as the ratio of total assets under IFRS to total equity under IFRS was 37 as of December 31, 2012, a slight decrease compared to end of 2011.
Overall Risk Position
Economic Capital
To determine our overall (nonregulatory) risk position, we generally consider diversification benefits across risk types except for business risk, which we aggregate by simple addition.
Overall risk position as measured by economic capital usage
| | | | | | | | | | | | | | | | |
in€ m. | | Dec 31, 2012 | | | Dec 31, 2011 | | | 2012 increase (decrease)
from 2011 | |
| | | | in€ m. | | | in % | |
Credit risk | | | 12,574 | | | | 12,812 | | | | (238) | | | | (2) | |
| | | | | | | | | | | | | | | | |
Market Risk | | | 13,185 | | | | 12,003 | | | | 1,182 | | | | 10 | |
Trading market risk | | | 4,690 | | | | 4,724 | | | | (34) | | | | (1) | |
Nontrading market risk | | | 8,495 | | | | 7,278 | | | | 1,216 | | | | 17 | |
| | | | | | | | | | | | | | | | |
Operational risk | | | 5,018 | | | | 4,846 | | | | 171 | | | | 4 | |
| | | | | | | | | | | | | | | | |
Diversification benefit across credit, market and operational risk | | | (4,435) | | | | (4,264) | | | | (171) | | | | 4 | |
| | | | | | | | | | | | | | | | |
Sub-total credit, market and operational risk | | | 26,342 | | | | 25,397 | | | | 945 | | | | 4 | |
| | | | | | | | | | | | | | | | |
Business risk | | | 2,399 | | | | 980 | | | | 1,419 | | | | 145 | |
| | | | | | | | | | | | | | | | |
Total economic capital usage | | | 28,741 | | | | 26,377 | | | | 2,364 | | | | 9 | |
| |
As of December 31, 2012, our economic capital usage totaled€ 28.7 billion, which is€ 2.4 billion, or 9 %, above the€ 26.4 billion economic capital usage as of December 31, 2011. The higher overall risk position mainly reflected introduction of the new strategic risk model for business risk and extension of nontrading market risk coverage to banking book credit spread risk.
The economic capital usage as of December 31, 2012 included€ 5.3 billion in relation to Postbank, which is€ 1.0 billion, or 23 % higher than the€ 4.3 billion economic capital usage as of December 31, 2011. The increase was largely driven by the inclusion of credit spread risk exposure of Postbank’s banking book investment portfolio into the coverage of the nontrading economic capital framework, partially offset by reduced economic capital usage for business risk.
Our economic capital usage for credit risk totaled€ 12.6 billion as of December 31, 2012. The decrease of€ 238 million, or 2 %, mainly reflected overall exposure reduction compensated for by the effects from regular recalibrations of credit risk parameters and methodology updates.
| | | | |
| Deutsche Bank | | 01 – Management Report | | 185 |
| Financial Report 2012 | | Risk Report | | |
| | |
| | | | |
| | |
| | | | |
The economic capital usage for market risk increased by€ 1.2 billion, or 10 %, to€ 13.2 billion as of December 31, 2012 and was driven by€ 1.2 billion, or 17 %, higher nontrading market risk. The increase was primarily due to the extension of nontrading market risk coverage to banking book credit spread risk mentioned above as well as higher economical capital usage for our guaranteed funds portfolio, partially offset by methodology updates in relation to structural foreign exchange risk, higher diversification benefit with trading market risk and lower economic capital usage due to asset sales. Our trading market risk economic capital usage decreased by€ 34 million, or 1 %. The materially unchanged economic capital usage for trading market risk reflected offsetting effects of methodology refinements and exposure reductions.
The economic capital usage for operational risk increased by€ 171 million, or 4 %, to€ 5.0 billion as of December 31, 2012. The increase is primarily due to higher industry loss experience, the integration of BHF-BANK into our AMA model in the first quarter 2012, as well as a model refinement in the second quarter 2012. The capital continues to include the safety margin applied in our AMA model, which was implemented in 2011 to cover unforeseen legal risks from the current financial crisis.
Our business risk economic capital usage, consisting of a strategic risk and a tax risk component, totaled€ 2.4 billion as of December 31, 2012, which is€ 1.4 billion or 145 % higher than the€ 1.0 billion economic capital usage as of December 31, 2011. The increase was driven by a new, significantly improved model to calculate the economic capital for strategic risk, which was implemented in the fourth quarter 2012. The new model replaced our former scenario approach by a full simulation of the Group and business unit earnings and links in more closely with the Group’s strategic planning process.
The diversification effect of the economic capital usage across credit, market and operational risk increased by€ 171 million, or 4 %, as of December 31, 2012, corresponding to the higher risk position considered for diversification.
Relative measure of each risk type as measured by economic capital usage of our business Divisions
| | | | | | | | |
in€ m. | | Dec 31, 2012 | | | Dec 31, 2011 | |
Corporate Banking & Securities | | | 11,788 | | | | 8,729 | |
Global Transaction Banking | | | 1,434 | | | | 1,294 | |
Asset & Wealth Management | | | 2,016 | | | | 1,647 | |
Private & Business Clients | | | 6,720 | | | | 6,508 | |
Non-Core Operations Unit | | | 5,452 | | | | 6,806 | |
Consolidation & Adjustments | | | 1,331 | | | | 1,393 | |
| | | | | | | | |
Total economic capital requirement | | | 28,741 | | | | 26,377 | |
| |
Internal Capital Adequacy Assessment Process
The lnternal Capital Adequacy Assessment Process (“ICAAP”) requires banks to identify and assess risks, maintain sufficient capital to face these risks and apply appropriate risk-management techniques to ensure adequate capitalization on an ongoing and forward looking basis, i.e., internal capital supply to exceed internal capital demand (figures are described in more detail in the section “Internal Capital Adequacy”).
We, at a group level, maintain compliance with the lCAAP as required under Pillar 2 of Basel 2 and its local implementation in Germany, the Minimum Requirements for Risk Management (MaRisk), through a group-wide risk management and governance framework, methodologies, processes and infrastructure.
In line with MaRisk and Basel requirements, the key instruments to ensure our adequate capitalization on an ongoing and forward looking basis are:
| — | | A strategic planning process which aligns risk strategy and appetite with commercial objectives; |
| — | | A continuous monitoring process against approved risk and capital targets set; |
| — | | Frequent risk and capital reporting to management; and |
| — | | An economic capital and stress testing framework which also includes specific stress tests to underpin our Recovery monitoring processes. |
| | | | |
| Deutsche Bank | | 01 – Management Report | | 186 |
| Financial Report 2012 | | Risk Report | | |
| | |
| | | | |
| | |
| | | | |
More information on risk management organized by major risk category can be found in section “Risk Management Principles – Risk Governance”.
Internal Capital Adequacy
As the primary measure of our Internal Capital Adequacy Assessment Process, we assess our internal capital adequacy based on our “gone concern approach” as the ratio of our total capital supply divided by our total capital demand as shown in the table below. During 2011 we revised our capital supply definition for deferred tax assets, fair value adjustments and noncontrolling interests in accordance with regulatory guidance. In the fourth quarter of 2012 shareholders’ equity replaced adjusted active book equity as the starting point for capital supply calculation to make it more transparent. The prior year comparison information has been adjusted accordingly.
Internal Capital Adequacy
| | | | | | | | |
in€ m. (unless stated otherwise) | | Dec 31, 2012 | | | Dec 31, 2011 | |
Capital Supply | | | | | | | | |
Shareholders’ Equity | | | 54,003 | | | | 53,390 | |
Unrealized net gains/losses1 | | | 220 | | | | 125 | |
Deferred Tax Assets | | | (7,718) | | | | (8,737) | |
Fair Value adjustments for financial assets reclassified to loans2 | | | (1,992) | | | | (3,323) | |
Noncontrolling Interests3 | | | – | | | | 694 | |
Hybrid Tier 1 capital instruments | | | 12,526 | | | | 12,734 | |
Tier 2 capital instruments4 | | | 11,646 | | | | 12,044 | |
| | | | | | | | |
Capital Supply | | | 68,685 | | | | 66,927 | |
| | | | | | | | |
| | | | | | | | |
| | | | | | | | |
Capital Demand | | | | | | | | |
Economic Capital Requirement | | | 28,741 | | | | 26,377 | |
Intangibles | | | 14,219 | | | | 15,802 | |
| | | | | | | | |
Capital Demand | | | 42,960 | | | | 42,179 | |
| | | | | | | | |
| | | | | | | | |
| | | | | | | | |
Internal Capital Adequacy Ratio | | | 160 % | | | | 159 % | |
| |
| 1 | Includes unrealized net gains (losses) on cash flow hedges, net of tax and deduction of fair value gains on own credit-effect relating to own liabilities designated under the fair value option. |
| 2 | Includes fair value adjustments for assets reclassified in accordance with IAS 39 and for banking book assets where no matched funding is available. |
| 3 | Includes noncontrolling interest up to the economic capital requirement for each subsidiary. |
| 4 | Tier 2 capital instruments excluding items to be partly deducted from Tier 2 capital pursuant to Section 10 (6) and (6a) KWG, unrealized gains on listed securities (45 % eligible) and certain haircut-amounts that only apply under regulatory capital assessment. |
A ratio of more than 100 % signifies that the total capital supply is sufficient to cover the capital demand determined by the risk positions. This ratio was 160 % as of December 31, 2012, compared to 159 % as of December 31, 2011. The increase in capital supply, driven by higher shareholders’ equity and reduced deduction items, outweighed the increase in the observed capital demand and determined the development in favor of the ratio. The shareholders’ equity increase by€ 613 million mainly reflected unrealized gains on financial assets available for sale and net income of the year, partially offset by foreign currency translation effects. The decrease in the noncontrolling interest by€ 694 million was due to effects from the conclusion of the aforementioned domination and profit and loss transfer agreement with Postbank. The increase in capital demand was driven by higher economic capital requirement, explained in the section “Overall Risk Position”, which was partially offset by the impairments of goodwill and other intangible assets in the fourth quarter 2012.
The above capital adequacy measures apply for the consolidated group as a whole (including Postbank) and form an integral part of our Risk and Capital Management framework, further described in the other sections of this report.
| | | | |
| Deutsche Bank | | 01 – Management Report | | 187 |
| Financial Report 2012 | | Internal Control over Financial Reporting | | |
| | |
| | | | |
| | |
| | | | |
[Page intentionally left blank for SEC filing purposes]
| | | | |
| Deutsche Bank | | 01 – Management Report | | 188 |
| Financial Report 2012 | | Internal Control over Financial Reporting | | |
| | |
| | | | |
| | |
| | | | |
[Page intentionally left blank for SEC filing purposes]
| | | | |
| Deutsche Bank | | 01 – Management Report | | 189 |
| Financial Report 2012 | | Internal Control over Financial Reporting | | |
| | |
| | | | |
| | |
| | | | |
[Page intentionally left blank for SEC filing purposes]
| | | | |
| Deutsche Bank | | 01 – Management Report | | 190 |
| Financial Report 2012 | | Internal Control over Financial Reporting | | |
| | |
| | | | |
| | |
| | | | |
[Page intentionally left blank for SEC filing purposes]
| | | | |
| Deutsche Bank | | 01 – Management Report | | 191 |
| Financial Report 2012 | | Information pursuant to Section 315 (4) of the German Commercial Code and Explanatory Report | | |
| | |
| | | | |
| | |
| | | | |
[Page intentionally left blank for SEC filing purposes]
| | | | |
| Deutsche Bank | | 01 – Management Report | | 192 |
| Financial Report 2012 | | Information pursuant to Section 315 (4) of the German Commercial Code and Explanatory Report | | |
| | |
| | | | |
| | |
| | | | |
[Page intentionally left blank for SEC filing purposes]
| | | | |
| Deutsche Bank | | 01 – Management Report | | 193 |
| Financial Report 2012 | | Information pursuant to Section 315 (4) of the German Commercial Code and Explanatory Report | | |
| | |
| | | | |
| | |
| | | | |
[Page intentionally left blank for SEC filing purposes]
| | | | |
| Deutsche Bank | | 01 – Management Report | | 194 |
| Financial Report 2012 | | Information pursuant to Section 315 (4) of the German Commercial Code and Explanatory Report | | |
| | |
| | | | |
| | |
| | | | |
[Page intentionally left blank for SEC filing purposes]
| | | | |
| Deutsche Bank | | 01 – Management Report | | 195 |
| Financial Report 2012 | | Compensation Report | | |
| | |
| | | | |
| | |
| | | | |
Compensation Report
Introduction
The Compensation Report in prior years provided information on the underlying principles and the amount of compensation of only the members of the Management Board of Deutsche Bank AG. For the 2012 financial year, however, in order to promote greater transparency with regards to overall Group compensation, the information and disclosures required under the German regulation on the supervisory requirements for compensation systems of banks (“InstitutsVergV”) have been consolidated into the report.
The full report now comprises the following sections:
| — | | Group compensation overview and disclosure |
| — | | Management Board report and disclosure |
| — | | Senior Management Group |
| — | | Employees regulated under the InstitutsVergV |
| — | | Compensation System for Supervisory Board Members |
The report complies with the requirements of Section 314 (1) No. 6 of the German Commercial Code (“HGB”), the German Accounting Standard No. 17 “Reporting on Executive Body Remuneration”, the InstitutsVergV and the recommendations of the German Corporate Governance Code.
Group compensation overview and disclosure
The evolution of compensation practices and culture was placed firmly at the forefront of our commitments during 2012. It is widely perceived that certain aspects of compensation across the financial services industry should be addressed in the context of the current regulatory and macroeconomic environment, including impacts and lessons learned from the 2007 financial crisis. During the Investor Day in September 2012, we committed to taking specific and innovative actions in this regard which we have initiated, and in some instances already delivered, during the intervening period. For the first time we have asked senior professionals from outside the industry to assist us with their expertise and independent view in order to further improve our compensation practices. More information on the Independent Compensation Review Panel (ICRP) and how they have influenced compensation practices can be found in the subsequent sections of the report.
Our compensation governance structure, principles and policies have been the focus of continuous improvement in recent years. Many of these enhancements have been aligned with the introduction and oversight of new specific compensation regulations. In 2012, however, we have consciously taken the decision to step away from and go beyond the existing requirements with the clear intention to lead what is hoped will be a cultural change across the industry. These enhancements are addressed in the following report.
This section focuses on our compensation philosophy, policy and governance structures at a Group level and addresses the Section 7 group disclosure requirements under the InstitutsVergV. Specific information and disclosures with respect to the Management Board and other defined employee populations is included in subsequent sections.
| | | | |
| Deutsche Bank | | 01 – Management Report | | 196 |
| Financial Report 2012 | | Compensation Report | | |
| | |
| | | | |
| | |
| | | | |
Independent Compensation Review Panel
In September 2012 we announced our intention to convene an independent panel comprised of senior, highly regarded professionals with extensive experience from both industry and high public office. The clear intention was to seek an objective view of our existing compensation policies and processes, assess how these compared to industry best practice and formulate core principles and minimum standards for future structures and practices. Furthermore, we sought assistance in defining appropriate levels of transparency and disclosure in relation to compensation.
In October 2012 membership of the panel was announced.
| | | | |
| Dr. Jürgen Hambrecht (Chair) | | – former CEO of BASF | | |
| | |
Michael Dobson | | – CEO of Schroders | | |
| |
Morris W. Offit | | – Chairman of Offit Capital and Independent Director of AIG |
| |
Dr. Michael Otto | | – Chairman of the Supervisory Board of Otto Group |
| |
Dr. Theo Waigel | | – former Federal Minister of Finance for Germany |
The panel followed a specific work plan leading up to the end of 2012 and continuing in 2013, working stringently towards their objectives and final recommendations. Preliminary conclusions are evident in the Compensation Report, particularly with regards to increased levels of transparency and disclosure but also the recommendation to adjust slightly the focus of compensation structures for the most senior employees and work towards more competitive levels of compensation deferred. The full recommendations from the panel will be finalised in 2013. Specific references to the panel recommendations are made in the following sections where applicable.
Compensation Philosophy and Principles
Deutsche Bank is a truly global organization operating in all regions across the world. We operate and strongly support a “One Bank” approach in relation to compensation to ensure employees are globally governed under the same principles, policy and procedures. This ensures a fully transparent, balanced and equitable approach to compensation.
The following core remuneration principles which were already introduced in 2010 apply globally and form the backbone of our compensation practices:
| — | | align compensation to shareholder interests and sustained firm-wide profitability, taking account of risk and the cost of capital; |
| — | | comply with regulatory requirements; |
| — | | maximize employee and firm performance; |
| — | | attract and retain the best talents; |
| — | | calibrate to different divisions and levels of responsibility; |
| — | | have simple and transparent compensation design. |
| | | | |
| Deutsche Bank | | 01 – Management Report | | 197 |
| Financial Report 2012 | | Compensation Report | | |
| | |
| | | | |
| | |
| | | | |
The principles are fully aligned with and build on our following core values which underpin and shape the work we do:
Complete focus on and dedication to clients is an imperative for building on and maintaining our success. Customers must be placed at the centre of our activities and drive all that we seek to achieve. Looking forward in 2013, this key objective will play an even greater role and will form one of the core principles reflected in new performance standards. Our Passion to Perform is driven by dedicated Client Focus and reinforced through delivering excellence and building long-term trusted relationships.
Within this wider context, we strongly believe that defined standards for compensation help to establish a direct relationship between the incentives for performance and the longer-term success of the firm. Compensation should reflect the success of the Bank as a whole but equally also account for the contributions made at a divisional and individual level. Discouragement of excessive risk taking forms an integral part of our compensation policy and this is both accompanied and supported by a management culture which is built on and guided by strong risk management, sound judgment, stable processes and effective controls.
We continually seek to reform and improve our compensation policies, practices and cultural direction through ongoing review processes. Our compensation policy is framed by the specific requirements of our home regulator, the Bundesanstalt für Finanzdienstleistungsaufsicht (“BaFin”). In particular, the InstitutsVergV which came into effect in 2010 is the primary compensation regulation requirement applicable to us on a Group-wide basis.
We are also subject to specific local regulations in certain jurisdictions and continue to pro-actively engage with regulators to ensure compliance with these to the extent they differ from the InstitutsVergV. A consistent global approach to compensation regulation appears unlikely in the near future, however, we continue to promote the merits of a level playing field across the industry in this respect. Strong, purposeful and targeted regulation is important to underpin sound risk management policies by firms.
Governance Structure
We operate a Global Reward Governance Structure within the German Two Tier Board Structure which oversees all aspects of compensation and compliance with the global regulatory requirements. For the Management Board, the Governance Structure is led solely by the Supervisory Board. The Senior Executive Compensation Committee (“SECC”) oversees compensation related decisions for all other employees in the Group. The SECC is specifically tasked by the Management Board to:
| — | | develop sustainable compensation principles and prepare recommendations on compensation and bonus levels including allocation to employees; |
| — | | ensure appropriate compensation governance and oversight. |
The SECC is co-chaired by Stefan Krause (Chief Financial Officer) and Dr. Stephan Leithner (Chief Executive Officer Europe (except Germany and UK), Human Resources, Legal & Compliance, Government & Regulatory Affairs), both of whom are members of the Management Board, and also includes senior employees from Risk, Finance and Human Resources. No employees aligned to any of our business divisions are members of the SECC in order to ensure its independence.
| | | | |
| Deutsche Bank | | 01 – Management Report | | 198 |
| Financial Report 2012 | | Compensation Report | | |
| | |
| | | | |
| | |
| | | | |
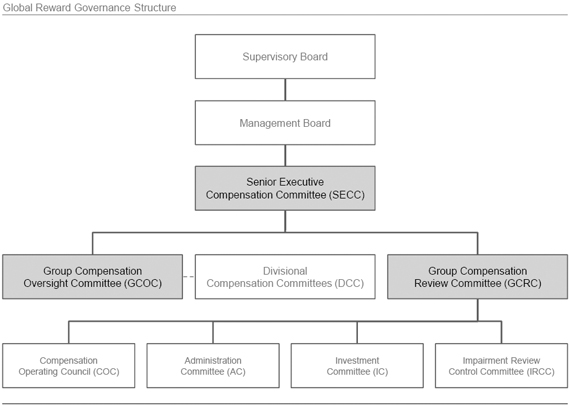
The SECC is supported by two sub-committees, each responsible for specific aspects of our governance requirements.
The Group Compensation Oversight Committee (“GCOC”) reviews divisional compensation frameworks and ensures that the frameworks and practices comply with both our compensation principles and policies and all external regulatory requirements. This compliance includes taking into account sound measurements and metrics on: the financial performance of the Group and the respective divisions, the inherent risk profiles based on the different types of risk (i.e. operational, market, liquidity, reputational, regulatory and credit risk) and adherence to Compliance policies.
The GCOC has made a number of enhancements to the requirements it places upon the divisional compensation committees during 2012. These include the requirement, where applicable, for sub-divisional compensation frameworks in order to further integrate the use of business specific metrics and information into the compensation decision making process. Furthermore, the written documentation requirements required of senior managers to support Variable Compensation decisions have been significantly enhanced.
The Group Compensation Review Committee’s (“GCRC”) main responsibilities include operating an effective framework of compensation components and policies, approving new plans and changes to existing plans and reviewing our current and future liabilities related to compensation plans, in particular with regards to equity or equity-based components.
| | | | |
| Deutsche Bank | | 01 – Management Report | | 199 |
| Financial Report 2012 | | Compensation Report | | |
| | |
| | | | |
| | |
| | | | |
Fundamental Compensation Structure and Components
We operate a Total Compensation philosophy for all staff globally. Total Compensation is made up of fixed (salary and any applicable allowances) and Variable Compensation. Variable Compensation awards are generally discretionary and are determined in accordance with the performance of the employee, their respective division and the Group as a whole.
Variable Compensation is used as a tool to incentivize and reward high performing employees and furthermore, through the deferral of awards, ensure part of the compensation of senior employees is aligned to their own and the Group’s future performance. A Group-wide matrix is operated in order to determine the amount of any Variable Compensation that is deferred.
As an interim recommendation, the Independent Compensation Review Panel indicated that we should focus on deferral of Variable Compensation for our most senior employees and where possible reduce overall deferrals, thus reducing the compensation cost for future years. The deferral threshold was set at€ 100,000 from which point 50 % of Variable Compensation was deferred. The overall amount deferred increased as the value of Variable Compensation increased.
As part of the focus on aligning senior employee compensation to future performance, 100 % of any Variable Compensation award above€ 1 million was deferred. As a result of this and the overall deferral matrix, the maximum immediate cash payment was limited to€ 300,000.
Increasing the deferral threshold to€ 100,000 whilst retaining an overall cash cap ensured we achieved our objective of focusing on senior employees. More junior employees were subject to lower deferrals than 2011 whilst our most senior employees were still subject to a cash cap and deferral levels remained high in comparison to the majority of industry peers.
In accordance with the InstitutsVergV 50 % of the non-deferred Variable Compensation for any employees covered by this regulation (in the following referred to as “Regulated Employees”) is required to be awarded in equity and subject to a retention period. On this basis, Regulated Employees with Variable Compensation of€ 1 million or above were subject to a minimum effective deferral rate of 85 % and cash payment cap of€ 150,000. This deferral rate is considerably higher than the requirements under the Capital Requirements Directive III and the InstitutsVergV. Furthermore, at this time there is no requirement to put a maximum limit on the amount of the non-deferred Variable Compensation. Both measures have been voluntarily implemented by us.
Deferral structures and vehicles
Whilst we operate a global compensation policy, it is important that specific employee populations can be identified, and where necessary steps taken to structure certain aspects of compensation accordingly. The illustration below identifies the four main categories of employees at Deutsche Bank Group who have received a deferred compensation award for 2012. Further detailed information on the Management Board, Senior Management Group and further Regulated Employees is set out in subsequent sections of the report.
| | | | |
| Deutsche Bank | | 01 – Management Report | | 200 |
| Financial Report 2012 | | Compensation Report | | |
| | |
| | | | |
| | |
| | | | |
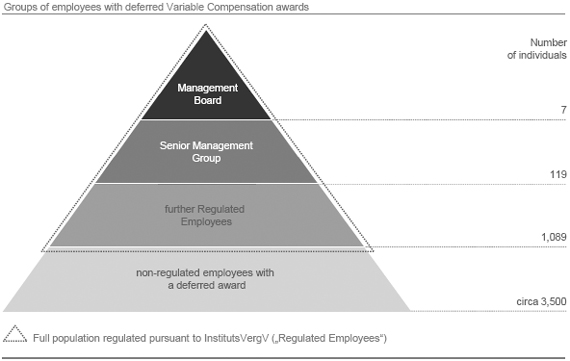
All employees with a 2012 deferred Variable Compensation award received 50 % of the deferred award in the form of equity and 50 % in deferred cash.
Restricted Equity Awards
The portion of deferred Variable Compensation that is equity-based is granted in the form of a conditional entitlement to the future delivery of shares (a Restricted Equity Award “REA”). REAs are governed by the Deutsche Bank Equity Plan, under which employees are granted the right to receive Deutsche Bank shares after a specified period of time. The value of the REAs is subject to the performance of the Deutsche Bank share price over the pre-defined vesting and (where applicable) retention period and is thus linked to the sustained development of long-term value. Participants in the Deutsche Bank Equity Plan are not entitled to receive actual dividends until the shares are delivered to them.
The vesting period and forfeiture provisions for the REA vary across the different groups of employees in the diagram above. The Management Board and Senior Management Group are subject to a newly introduced four and a half year cliff vesting period followed by a further six-month retention period (during which time the shares cannot be sold). All other Regulated Employees are subject to a three-year pro rata vesting period with a further six-month retention period following the vesting of each tranche. All remaining employees with a deferred award are subject to a three year pro rata vesting period. A 5 % premium award is applicable for all employees (excluding the Senior Management Group and Management Board) to reflect the fact that the award does not attract dividends during the vesting period. A dividend equivalent based on the dividend paid and share price on the dividend payment date applies to the Management Board and Senior Management Group.
| | | | |
| Deutsche Bank | | 01 – Management Report | | 201 |
| Financial Report 2012 | | Compensation Report | | |
| | |
| | | | |
| | |
| | | | |
Restricted Incentive Awards
The non equity based portion of deferred Variable Compensation is granted as deferred cash compensation (Restricted Incentive Award “RIA”). RIAs are granted on the basis of the Deutsche Bank Restricted Incentive Plan. The RIA is subject to a minimum three-year pro-rata vesting period during which time specific forfeiture provisions apply. A 2 % premium award is applicable for all beneficiaries in recognition that the award does not attract interest.
Equity Upfront Awards
As per REAs, Equity Upfront Awards (“EUA”) are granted and governed under the Deutsche Bank Equity Plan. Accordingly, EUAs represent a conditional entitlement to the future delivery of shares. The value of the EUA is subject to the performance of the Deutsche Bank share price over the pre-defined retention period and is thus linked to a sustained development. Participants in the Deutsche Bank Equity Plan are not entitled to receive actual dividends until the shares are delivered to them. As required under the InstitutsVergV, for all Regulated Employees, 50 % of the remaining non-deferred Variable Compensation (after the percentage deferred is calculated) is awarded in the form of EUA and subject to a retention period of six months (three years for Management Board members). A dividend equivalent based on the dividend paid and share price on the dividend payment date applies during the retention period.
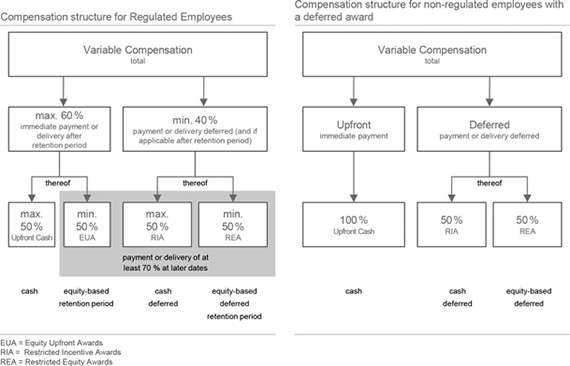
A consolidated summary of the vesting periods for each award type across the employee populations identified is set out below. Further detailed information is provided in the specific sections addressing compensation for the Management Board, Regulated Employees and Senior Management Group.
| | | | |
| Deutsche Bank | | 01 – Management Report | | 202 |
| Financial Report 2012 | | Compensation Report | | |
| | |
| | | | |
| | |
| | | | |
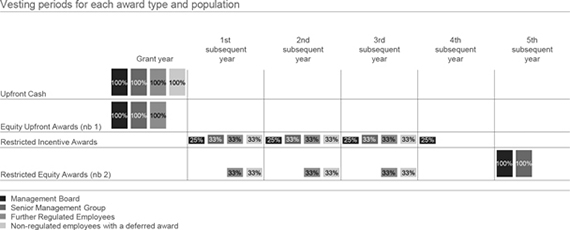
Nb 1: The Equity Upfront Awards are subject to a six-month retention period (with the exception of the Management Board for whom a three-year retention period applies). The shares are released after this period. Nb 2: The full number of Restricted Equity Awards granted to the members of the Management Board and the Senior Management Group is delivered after five years. This comprises a four and a half year vesting period and a six-month retention period. For further Regulated Employees a six-month retention period applies following the vesting of each tranche after which the shares are released.
Compensation and Risk Management
We are acutely aware of the importance of ensuring Variable Compensation pools are subject to appropriate risk adjustment measures.
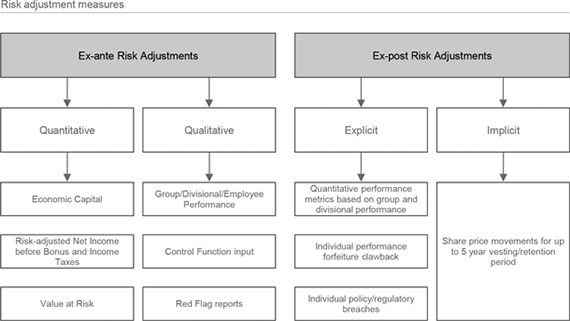
| | | | |
| Deutsche Bank | | 01 – Management Report | | 203 |
| Financial Report 2012 | | Compensation Report | | |
| | |
| | | | |
| | |
| | | | |
Ex-ante risk adjustment measures
To achieve appropriate ex-ante risk adjustments, we use an Economic Capital Model developed within the Risk function which is our primary method of calculating the degree of future potential risk to which we may be exposed.
The model measures the amount of capital the Group would need in order to absorb very severe unexpected losses arising from the Group’s exposures. “Very severe” in this context means that economic capital is set at a level to cover, with a probability of 99.98 %, the aggregated unexpected losses within one year.
Ex-ante risk adjustment is initially employed at the Group level and is designed to reflect our risk exposure at the time of Variable Compensation allocation. Risk is considered by reviewing risk-adjusted profit and loss prior to distributing divisional Variable Compensation pools. As the risk profile of the organization increases, the economic capital charge also increases, thereby driving down Group-wide economic profitability and, by extension, the amount of Variable Compensation awarded. After adjusting Net Income before Bonus and Income Taxes for economic capital at the Group-wide level, we determine risk adjusted bonus eligible Net Income before Bonus and Income Taxes as a basis for allocating Variable Compensation pools. Therefore, adjustments made at the Group-wide level are reflected in allocations made at all levels of the organization.
As a general rule, we capture all material risks within the four prime risk types of our economic capital framework (Credit, Market, Operational, and Business Risk). Other risks are mapped into the appropriate overarching risk type. Specific examples of risks captured within each of the sub-risk types are as follows:
Credit Risk
| — | | counterparty risk, transfer risk, settlement risk; |
Market Risk
| — | | trading default risk, trading market risk, nontrading market risk; |
Operational Risk
| — | | legal risk, IT risk, staff risk, business continuity risk, vendor risk, transaction processing risk, financial reporting/recording risk, fiduciary service risk, real estate risk, security risk; |
Business Risk
| — | | strategic risk, tax risk. |
Ex-post risk adjustment measures
Clawback provisions, pursuant to which we are entitled to forfeit compensation components previously awarded, represent a crucial aspect our governance process and act as a mechanism for ensuring that a substantial portion of Variable Compensation for senior employees remains subject to both future performance and conduct. We have utilized clawback provisions for a number of years and have once again enhanced the depth of the measures attached to 2012 deferred Variable Compensation awards.
The clawback provisions below have been applied to 2012 deferred Variable Compensation awards. The following table outlines which of the provisions apply to the specific employee populations. Where necessary, further information on the application of the clawbacks is provided in the sections addressing the Management Board, Regulated Employees and Senior Management Group.
| | This clawback utilises positive Group Net Income Before Income Taxes as a performance condition for vesting in the full value of the REA and RIA granted for 2012. The performance condition is met only if Group Net Income Before Income Taxes is zero or greater. If Group Net Income Before Income Taxes is negative for any year during the vesting period, the performance condition will not be met and 100 % of the REA and RIA tranches due to vest in respect of that year will be forfeited. For the Management Board and |
| | | | |
| Deutsche Bank | | 01 – Management Report | | 204 |
| Financial Report 2012 | | Compensation Report | | |
| | |
| | | | |
| | |
| | | | |
| | Senior Management Group subject to the five year REA cliff vesting, if for any year during the vesting period the Group Net Income before Taxes is negative, 20 % of the award will be forfeited in respect of that year. |
| | This clawback utilises positive divisional Net Income before Income Taxes as a performance condition for vesting in the full value of the REA and RIA granted for 2012. The performance condition is met for individual employees only if their respective divisional Net Income before Income Taxes is not negative. If Net Income before Income Taxes is negative for any division during any year of the vesting period, the performance condition will not be met and 100 % of the REA and RIA tranches due to vest in respect of that year will be forfeited by all employees in the applicable division. For the Senior Management Group subject to the five-year REA cliff vesting, if for any year during the vesting period the divisional Net Income before Income Taxes is negative, 20 % of the award will be forfeited in respect of that year. The divisional clawback measure does not apply to the Management Board or employees working in Regional Management or Infrastructure divisions. |
| — | | Performance Forfeiture clawback |
| | This clawback puts an employee’s RIA and REA at risk into the future and allows us to determine whether adjustments may be necessary based on actual outcomes. Up to 100 % of an employee’s unvested awards can be clawed back in the event that we discover that the original award value was inappropriate because a performance measure is later deemed to be materially inaccurate or if a deal, trade or transaction considered to be attributable to the employee has a significant adverse effect on any Group entity, any Corporate Division or the Group. This clawback has been applied for the first time to REAs granted in respect of 2012 and represents an important governance enhancement. |
| — | | Policy/Regulatory Breach clawback |
| | All of our long-term compensation plans contain a behavioral clawback, which includes provisions providing for the forfeiture of all unvested and unpaid compensation if an employee is terminated for misconduct, including but not limited to, dishonesty, fraud, misrepresentation or breach of trust. An award may be clawed back for an internal policy or procedure breach or breach of any applicable laws or regulations imposed other than by us. Specific tranches of an award may also be forfeited where it is determined that a policy breach has occurred, however the disciplinary sanctions fall short of termination for Cause. |
Application of clawbacks to different employee populations
| | | | | | | | |
| | | Group clawback | | Divisional clawback | | Performance Forfeiture clawback | | Policy/Regulatory
Breach clawback |
| | | | | | | | |
Management Board | | ü | | | | ü | | ü |
| | | | | | | | |
Senior Management Group | | ü | | ü1 | | ü | | ü |
| | | | | | | | |
further Regulated Employees | | ü | | ü1 | | ü | | ü |
| | | | | | | | |
non-regulated employees with a deferred award | | | | | | ü | | ü |
|
| 1 | Only applies for employees working in front office business divisions. |
In addition to these specific clawbacks, a number of other provisions are included in the relevant plan rules which facilitate the forfeiture of deferred awards for all employees. These include (but are not limited to):
| — | | voluntary termination of employment; |
| — | | solicitation of customers, clients or Deutsche Bank Group employees; |
| — | | disclosure or usage of proprietary information; |
| — | | provision of similar, related or competitive services to other financial services companies following retirement, career retirement or public service retirement. |
| | | | |
| Deutsche Bank | | 01 – Management Report | | 205 |
| Financial Report 2012 | | Compensation Report | | |
| | |
| | | | |
| | |
| | | | |
Hedging
All employees with deferred awards are not permitted to limit or cancel out the risk in connection with their compensation through hedging or other countermeasures. Any such action is deemed a breach of policy and will result in the full forfeiture of awards.
Compensation Disclosure pursuant to Section 7 InstitutsVergV
2012 Variable Compensation awards (which exclude charges for prior year deferrals but include current year awards vesting in the future) were€ 3.166 billion in total. With regards to the underlying award structures we refer to the detailed descriptions provided in this report. The Group-wide deferral ratio was 47 % compared to 61 % in 2011.
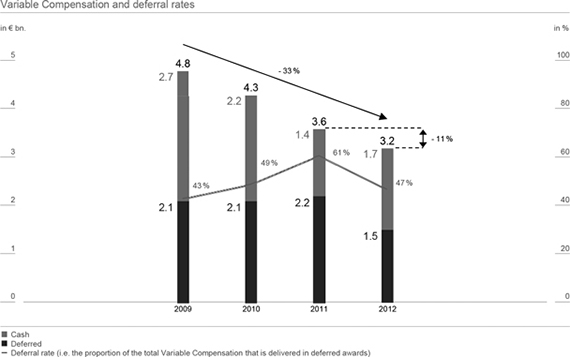
| | | | | | | | | | | | | | | | | | | | | | | | | | | | |
| | | | | | | | | | | | | | | | | | 2012 | | | 2011 | |
| | | | | | | | |
| in€ m. (unless stated otherwise)1 | | CB&S | | | GTB | | | AWM | | | PBC | | | NCOU | | | Group Total | | | Group Total | |
| | | | | | | | | | | | | | | | | | | | | | | | | | | | |
Total Compensation | | | 4,890 | | | | 936 | | | | 1,424 | | | | 2,685 | | | | 255 | | | | 10,191 | | | | 10,455 | |
| | | | | | | | | | | | | | | | | | | | | | | | | | | | |
thereof: | | | | | | | | | | | | | | | | | | | | | | | | | | | | |
Fixed Compensation | | | 2,698 | | | | 697 | | | | 1,013 | | | | 2,424 | | | | 194 | | | | 7,025 | | | | 6,895 | |
Variable Compensation | | | 2,192 | | | | 240 | | | | 411 | | | | 262 | | | | 61 | | | | 3,166 | | | | 3,560 | |
| | | | | | | | | | | | | | | | | | | | | | | | | | | | |
# of employees | | | 28,659 | | | | 10,022 | | | | 11,562 | | | | 45,493 | | | | 2,483 | | | | 98,219 | | | | 100,996 | |
| |
| 1 | Comprises the number of employees as well as the discretionary part of the Variable Compensation of Postbank. |
All figures in the above table include the allocation of Infrastructure related compensation or number of employees according to our established cost allocation key.
| | | | |
| Deutsche Bank | | 01 – Management Report | | 206 |
| Financial Report 2012 | | Compensation Report | | |
| | |
| | | | |
| | |
| | | | |
Amortisation of deferred variable compensation awards
As of December 31, 2012, including awards granted in early February 2013, unamortized deferred variable compensation costs amount to approximately€ 2.8 billion.
| | | | | | | | | | | | | | | | | | | | | | | | | | | | | | | | | | | | | | | | |
| | | Actual P&L charge1 | | | Projected P&L charge2 | |
in€ m. | | 2010 | | | 2011 | | | 2012 | | | 2013 | | | 2014 | | | 2015 | | | 2016 | | | 2017 | | | 2018 | | | total
2013–2018 | |
Cash awards granted before January 1, 2013 | | | 705 | | | | 945 | | | | 1,092 | | | | 415 | | | | 171 | | | | 47 | | | | 0 | | | | – | | | | – | | | | 633 | |
Share-based awards granted before January 1, 2013 | | | 1,057 | | | | 1,164 | | | | 1,045 | | | | 429 | | | | 150 | | | | 20 | | | | 1 | | | | – | | | | – | | | | 600 | |
Cash awards granted in early 2013 | | | – | | | | – | | | | – | | | | 321 | | | | 231 | | | | 106 | | | | 26 | | | | – | | | | – | | | | 684 | |
Share-based awards granted in early 2013 | | | – | | | | – | | | | – | | | | 473 | | | | 232 | | | | 112 | | | | 36 | | | | 12 | | | | 1 | | | | 866 | |
| | | | | | | | | | | | | | | | | | | | | | | | | | | | | | | | | | | | | | | | |
Total | | | 1,762 | | | | 2,109 | | | | 2,137 | | | | 1,6383 | | | | 784 | | | | 285 | | | | 63 | | | | 12 | | | | 1 | | | | 2,783 | |
| |
| 1 | Includes severance and restructuring expense covering the acceleration of deferred compensation awards not yet amortized due to the discontinuation of employment. |
| 2 | Excludes future grants and forfeitures. |
| 3 | Thereof€ 893 million in the first half of 2013. |
Management Board Report and Disclosure
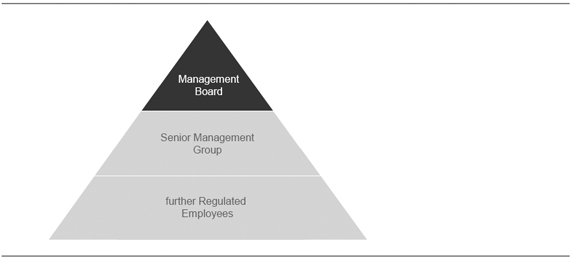
Principles of the Compensation System for Management Board Members
In May 2012 the compensation system was presented and approved by a majority vote of 94 % at the Annual General Meeting on the basis of the Compensation Report applicable at the time. However, as part of their mandate the ICRP is also reviewing the current compensation system with the endorsement of the Supervisory Board.
| | | | |
| Deutsche Bank | | 01 – Management Report | | 207 |
| Financial Report 2012 | | Compensation Report | | |
| | |
| | | | |
| | |
| | | | |
Responsibility
The Supervisory Board is responsible for determining the individual amounts of compensation for the Management Board members. The Chairman’s Committee supports the Supervisory Board in the process. It advises the Supervisory Board on all issues in connection with the compensation of the members of the Management Board and prepares all of the resolutions on the compensation system and on the determination of the individual compensation of each Management Board members.
The Chairman’s Committee of the Supervisory Board comprises a total of four members, of which two are representatives of the Group´s employees. The Chairman’s Committee held regular meetings in 2012 and continues to do so in 2013. Most recently it prepared the decision on how the amount of the Variable Compensation for the members of the Management Board for the financial year 2012 is to be assessed.
Principles
The compensation structure for the members of the Management Board takes into account all of the applicable statutory and regulatory requirements. As divergent requirements have been established around the world, numerous aspects must be considered, and therefore the requirements placed on such a system are increasingly extensive and complex.
When designing the structure of the compensation system, determining compensation amounts and structuring its delivery, the focus is set on ensuring a close link between the interests of both the Management Board members and shareholders. This is achieved through the utilization of specific key financial figures which have a connection to the performance of the Deutsche Bank share price and granting compensation elements that are equity-based. The equity-based compensation components are directly linked to the performance of the Deutsche Bank share price and only become eligible for payment over a period of several years. Our performance compared with other companies in the market is a further important criterion for the structuring and determination of compensation.
Furthermore, the compensation system is aligned with performance and success targets. Particular emphasis is attached to our long-term focus, as well as appropriateness and sustainability measures. The compensation system is structured to ensure members of the Management Board are motivated to avoid unreasonably high risks, to achieve the objectives set out in our strategies and to continuously work towards the positive development of the Group.
Compensation for the Management Board members is determined on the basis of several criteria. These include our overall results as well as the relative performance of the Deutsche Bank share price in comparison to selected peer institutions. Within the framework, the Supervisory Board specifically takes into account risk aspects and contributions to our success by the respective organizational unit as well as by the individual Management Board members themselves. Both financial and non-financial parameters are considered when assessing performance. This procedure also fulfils regulatory requirements by going beyond a purely formula-based assessment. Most of the Variable Compensation components are determined on the basis of a multi-year assessment in order to avoid limiting the assessment of business performance to a single year only.
The Supervisory Board regularly reviews the compensation framework for Management Board members with due consideration to market trends and changing legal and regulatory requirements. If the Supervisory Board considers a change to be required, it will adjust the framework accordingly. In the context of this review and the determination of the Variable Compensation, the Supervisory Board uses the expertise of independent external compensation and, if necessary, legal consultants.
Compensation Structure
The compensation structure approved by the Supervisory Board for the individual Management Board members is reflected in their contractual agreements. The compensation is divided into both non-performance-related and performance-related components.
| | | | |
| Deutsche Bank | | 01 – Management Report | | 208 |
| Financial Report 2012 | | Compensation Report | | |
| | |
| | | | |
| | |
| | | | |
Non-Performance-Related Components
The non-performance-related components primarily comprise the base salary, which is paid in twelve equal monthly payments. In 2012, the annual base salary of the ordinary Management Board members remained unchanged to the previous year. The last adjustment to the base salaries of the two Co-Chairmen took effect as of June 1, 2012. The annual amounts are as follows:
| | | | | | | | |
| in€ | | January–May | | | June–December | |
| | | | | | | | |
Base salary | | | | | | | | |
| | | | | | | | |
Chairman1/Co-Chairmen | | | 1,650,000 | | | | 2,300,000 | |
| | | | | | | | |
Ordinary Board Members | | | 1,150,000 | | | | 1,150,000 | |
| |
| 1 | Refers to Dr. Ackermann until May 2012. |
Additional non-performance-related components include other benefits, which comprise the monetary value of non-cash benefits such as company cars and driver, insurance premiums, expenses for company-related social functions and security measures including payments, if applicable, of taxes on these benefits as well as taxable reimbursements of expenses.
Performance-Related Components (Variable Compensation)
Variable Compensation is performance-related. It consists of two components; a bonus and a Long-Term Performance Award. Effective from June 2012 and in line with the appointment of Mr. Jain as Co-Chairman of the Management Board, his entitlement to receive the Division Incentive compensation component related to his responsibility for the CB&S was removed.
Bonus
The total bonus is determined on the basis of two components (bonus components 1 and 2). Their levels depend on the development of the return on equity (based on income before income tax), which is a key factor influencing the share price performance. The first component of the bonus is determined through a comparison of the planned and actually achieved return on equity. The second component of the bonus is based on the actually achieved return on equity. The two components are each assessed over a two-year period: the year for which the bonus is determined and the preceding year. This ensures that the assessment is based not just on a short-term development of the return on equity.
The total bonus to be granted is calculated on the basis of a total target figure. In connection with the new composition of the Management Board effective from June 1, 2012 the total target figures were amended. The individual annual total target figures for an ordinary Management Board member and for the Management Board Chairman/Co-Chairmen in 2012 are as follows:
| | | | | | | | |
| in€ | | January–May | | | June–December | |
| | | | | | | | |
Bonus Target (total) | | | | | | | | |
| | | | | | | | |
Chairman/Co-Chairmen | | | 4,000,000 | | | | 2,300,000 | |
| | | | | | | | |
Ordinary Board Members | | | 1,150,000 | | | | 1,150,000 | |
| |
The total target figure is divided in half into the two components specified above (target figures 1 and 2). The target figures 1 and 2 are each multiplied with an annually calculated factor (factors 1 and 2) to calculate the respective bonus components 1 and 2.
The calculated total bonus is determined as follows.

The level of factor 1, which is used for calculating bonus component 1, is determined on the basis of the actually achieved return on equity of a given year as a ratio of the plan figure defined for that year. The ratio resulting
| | | | |
| Deutsche Bank | | 01 – Management Report | | 209 |
| Financial Report 2012 | | Compensation Report | | |
| | |
| | | | |
| | |
| | | | |
from this is the level of achievement, which is calculated as described above for two consecutive years. If the actually achieved return on equity is negative for a given year, the level of achievement is set to zero. Factor 1 is the average of the levels of achievement calculated for the two years. The average of the levels of achievement for the two years being assessed must come to at least 50 %. If it falls below this minimum level, the factor is set to zero and bonus component 1 is not granted. Bonus component 1 is linked to the level of factor 1, resulting in a corresponding linear increase or decrease starting from the target figure. There is an upper limit that is set at 150 % of the target figure.
Factor 2 is determined on the basis of the actually achieved return on equity over a two-year period. The initial basis is an annual return on equity of 18 %. If this figure is achieved, it is linked to a multiplier of 1.0. For each percentage point of deviation, upwards or downwards, the multiplier is increased or reduced in steps of 0.05; in the process, intermediate values are calculated as well. The multiplier can amount to a maximum of 1.5, which corresponds to a return on equity of 28 % or more. In contrast, if the return on equity falls below a minimum level of 4 %, the multiplier is zero. To determine factor 2, the average is formed from the multipliers of the two assessment years and has to amount to a minimum of 0.5.
The two bonus components are added together, resulting in a total bonus. If, for example, the factors for the two bonus components are 1.0 each, the total bonus amounts to the respective total target figure. The calculated total bonus is capped at 1.5 times the total target figure. If defined minimum levels are not reached for both of the bonus components, as described above, no bonus is paid.
The Supervisory Board carries out an additional assessment that can result in an increase or reduction of the calculated total bonus amount. The objective is to adequately take additional quantitative and qualitative factors into account, for example, revenue contributions, the individual contributions to performance, or risk-related factors in light of regulatory requirements. Until May 31, 2012, the exercised discretion was limited to an increase or reduction by up to 50 % of the calculated total bonus amount for all Management Board members. With effect from June 1, 2012, the Supervisory Board revised the rules governing discretion allowing them to sanction an increase or reduction of up to 50 % of the calculated total bonus amount for an ordinary Management Board member and an increase of up to 150 % or reduction of up to 100 % for the Management Board Co-Chairmen. As a result, under the most favorable conditions effective from June 1, 2012, the total bonus can amount to a maximum of 2.25 times the total target figure for an ordinary Management Board member and of 3.75 for the Management Board Co-Chairmen.
The following chart shows the level of factor 1 depending on the level of achievement calculated according to the method described above and the respective target level achievement in 2012 and 2011.
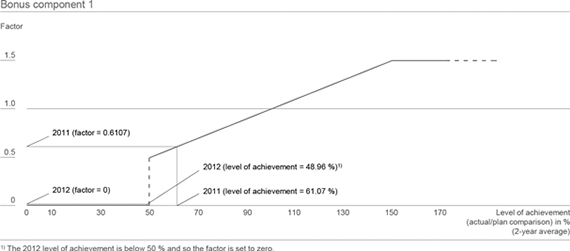
| | | | |
| Deutsche Bank | | 01 – Management Report | | 210 |
| Financial Report 2012 | | Compensation Report | | |
| | |
| | | | |
| | |
| | | | |
The following chart shows the level of the multiplier depending on the actually achieved return on equity for a given year and the respective target level achievement in 2012 and 2011.
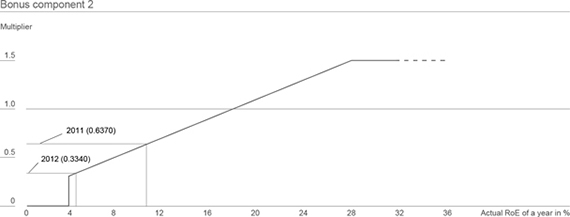
For compensation purposes the Supervisory Board decided to adjust the 2012 return on equity (RoE) by excluding significant goodwill and intangible impairment charges that were incurred in that year. However, as a result the calculated factors for both bonus components were below the relevant threshold of 0.5 each; accordingly no bonus was to be granted for the 2012 financial year. In this respect there was also no basis for any discretion to be exercised by the Supervisory Board.
Factor 1 for bonus component 1 and factor 2 for bonus component 2 were determined as follows:
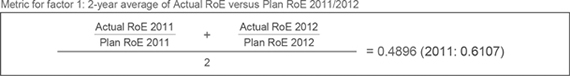
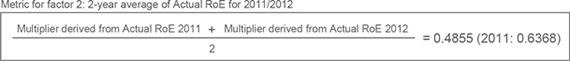
Long-Term Performance Award
The level of the Long-Term Performance Award (LTPA) is tied to the total shareholder return of Deutsche Bank in relation to the average total shareholder returns of a select group of six comparable leading banks (calculated in Euro). The result thereof is the Relative Total Shareholder Return (RTSR). The LTPA is calculated from the average of the annual RTSR for the last three financial years (reporting year and the two preceding years). The criteria used to select the peer group are generally comparable business activities, size and international presence.
The six leading banks are:
| — | | Banco Santander and BNP Paribas (both from the eurozone), |
| — | | Barclays and Credit Suisse (both from Europe outside the eurozone), as well as |
| — | | JPMorgan Chase and Goldman Sachs (both from the US). |
| | | | |
| Deutsche Bank | | 01 – Management Report | | 211 |
| Financial Report 2012 | | Compensation Report | | |
| | |
| | | | |
| | |
| | | | |
The LTPA for the Management Board members is determined on the basis of a pre-defined target figure multiplied by a percentage based on the achieved RTSR. The annual target figures for a Management Board member and for the Management Board Chairman/Co-Chairmen are as follows:
| | | | | | | | |
in€ | | January–May | | | June–December | |
LTPA Target (total) | | | | | | | | |
| | | | | | | | |
Chairman/Co-Chairmen | | | 4,800,000 | | | | 4,350,000 | |
| | | | | | | | |
Ordinary Board Members | | | 2,175,000 | | | | 2,175,000 | |
| |
Like the bonus, the LTPA also has an upper limit (cap). If the three-year average of the RTSR is greater than 100 %, then the value of the LTPA increases proportionately to an upper limit of 125 % of the target figure. If the three-year average of the RTSR is lower than 100 %, however, the value declines disproportionately, as follows. If the RTSR is calculated to be between 90 % and 100 %, the value is reduced for each lower percentage point by three percentage points. The value is reduced by another two percentage points for each lower percentage point between 70 % and 90 %; and by another three percentage points for each percentage point under 70 %. If the three-year average does not exceed 60 %, no LTPA is granted.
This relation can be seen in the following chart.
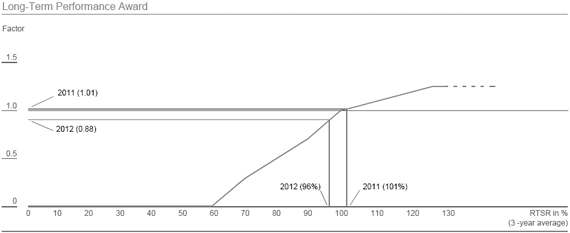
The Relative Total Shareholder Return as the basis for the calculation of the LTPA in the year 2012 was about 86 % (2011: 111 %, 2010: 93 %). Thus, the average of the last three years (2010 until 2012) was about 96 %. Accordingly, the 2012 RTSR of rounded 96 % leads to a percentage factor of 88 %.
Division Incentive
For the business year 2012 Mr. Jain waived his contractual entitlement to payment of the Division Incentive which was approved by the Supervisory Board.
Long-Term Incentive/Sustainability
The total amount of the bonus and LTPA is granted primarily on a deferred basis and spread out over several years. This ensures a long-term incentive effect over a multi-year period.
According to the requirements of the InstitutsVergV at least 60 % of the total Variable Compensation must be granted on a deferred basis. Not less than half of this deferred portion comprises equity-based compensation components, while the remaining portion is granted as deferred cash compensation. Both compensation components are deferred over a multi-year period and subsequently followed by retention periods for the equity-based compensation components. During the period until payment or delivery, the compensation portions
| | | | |
| Deutsche Bank | | 01 – Management Report | | 212 |
| Financial Report 2012 | | Compensation Report | | |
| | |
| | | | |
| | |
| | | | |
awarded on a deferred basis may be forfeited. A maximum of 40 % of the total Variable Compensation is granted on a non-deferred basis. However, at least half of this consists of equity-based compensation components and only the remaining portion is paid out directly in cash. Of the entire Variable Compensation, no more than a maximum of 20 % is paid out in cash immediately, while at least 80 % is paid or delivered at a later date.
The following chart shows the required structure of the Variable Compensation components according to the InstitutsVergV.
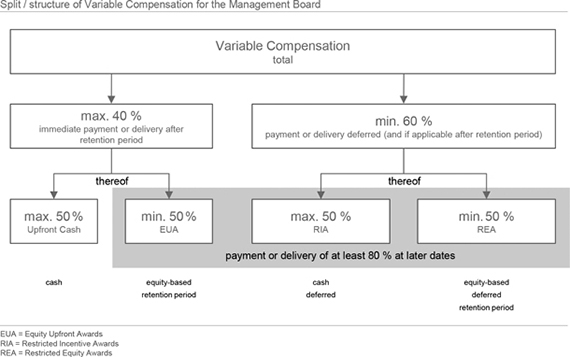
Restricted Equity Awards
At least 50 % of the deferred Variable Compensation is comprised of an REA.
The 2012 REA vest in one tranche (cliff vest) approximately four and a half years after grant and are immediately subject to an additional retention period of six months. Accordingly, Management Board members are first permitted to dispose of the equities after approximately five years. Introducing a cliff rather than pro rata vesting schedule ensures the full award for each employee is subject to potential forfeiture throughout the entire vesting period rather than the potential forfeitable amount reducing after each annual tranche vesting.
The 2011 REA vest in four equal tranches. The first tranche vests approximately one and a half years after the granting of the awards in February 2012. The remaining tranches each subsequently vest in regular intervals of one additional year. After the individual tranches vest, they are subject to an additional retention period. The additional retention period of the first tranche is three years, two years for the second tranche, and one year for the third and fourth tranches.
Restricted Incentive Awards
The RIA comprise a maximum 50 % of the deferred Variable Compensation and vest in four equal tranches. The first tranche vests approximately one and a half years after it is granted and the remaining tranches each subsequently vest in intervals of one year. Payment takes place upon vesting. The deferred cash compensation is thus stretched out over a period of approximately four and a half years.
| | | | |
| Deutsche Bank | | 01 – Management Report | | 213 |
| Financial Report 2012 | | Compensation Report | | |
| | |
| | | | |
| | |
| | | | |
Upfront Awards
The Upfront Awards amount to a maximum of 40 % of the total Variable Compensation. However, no more than half of this is paid out in cash immediately (Upfront Cash). The remaining portion is granted as equity-based compensation in the form of an EUA and subject to a retention period of three years. Only after this retention period has ended may the awards be sold.
The following chart shows the payment date for the immediate cash compensation and the time period for the payment or the delivery of the other Variable Compensation components in the five consecutive years following the grant year.
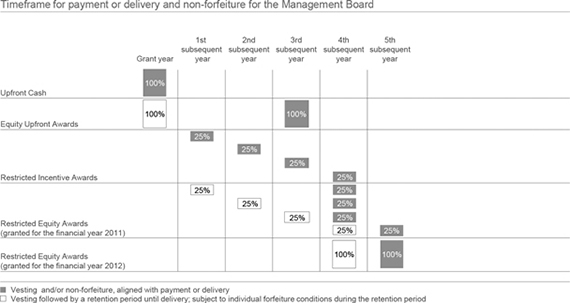
As RIA do not bear interest prior to payment, a one-time premium is added upon grant (2012: 2 %, 2011: 5 %).
Equity-based awards (EUA and REA) granted for the financial year 2011 do not bear any entitlement to dividends until their delivery, so a one-time premium of 5 % was added upon grant.
In respect of the equity-based awards (EUA and REA) granted for the financial year 2012, the award premium has been replaced with a dividend equivalent to further align the Management Board’s interests to those of shareholders. The dividend equivalent is determined according to the following formula.

| | | | |
| Deutsche Bank | | 01 – Management Report | | 214 |
| Financial Report 2012 | | Compensation Report | | |
| | |
| | | | |
| | |
| | | | |
Forfeiture Conditions
Because some of the compensation components are deferred or spread out over several years (Restricted Equity Awards, Restricted Incentive Awards and Equity Upfront Awards) certain forfeiture conditions are applicable until vesting or the end of the retention periods. Awards may be fully or partially forfeited, for example, due to individual misconduct (including a breach of regulations) or to an extraordinary termination, and, with regard to Restricted Equity Awards and Restricted Incentive Awards, also due to a negative Group result or to individual negative contributions to results. The forfeiture conditions are an essential aspect of the awards and ensure they are aligned with the long-term performance of both the Group and the individuals.
Limitations in the event of exceptional developments
In the event of exceptional developments (for example, the sale of large investments), the total compensation for each Management Board member is limited to a maximum amount. A payment of Variable Compensation elements will not take place if the payment of Variable Compensation components is prohibited or restricted by the German Federal Financial Supervisory Authority in accordance with existing statutory requirements.
Management Board Compensation
Base Salary
In 2012, the annual base salary of an ordinary Management Board member was€ 1,150,000. The annual base salary of the Management Board Chairman was€ 1,650,000 until May 31, 2012. The annual base salary of the Management Board Co-Chairmen was€ 2,300,000 each from June 1, 2012.
Variable Compensation
The Supervisory Board, based on the proposal of the Chairman’s Committee, determined the Variable Compensation for the members of the Management Board for the 2012 financial year. The amounts of the bonuses and LTPAs were determined for all Management Board members on the basis of the existing compensation system.
Compensation (collectively and individually)
In accordance with the provisions of German Accounting Standard No. 17, the members of the Management Board collectively received in the 2012 financial year compensation for their service on the Management Board totaling€ 23,681,498 (2011:€ 27,323,672). Thereof,€ 9,599,999 (2011:€ 8,550,000) was for base salaries,€ 1,402,936 (2011:€ 879,591) for other benefits,€ 11,396,439 (2011:€ 17,194,081) for performance-related components with long-term incentives and€ 1,282,124 (2011:€ 700,000) for performance-related components without long-term incentives.
According to the German Accounting Standard No. 17, the Management Board members individually received the following compensation components for their service on the Management Board for or in the years 2012 and 2011.
| | | | |
| Deutsche Bank | | 01 – Management Report | | 215 |
| Financial Report 2012 | | Compensation Report | | |
| | |
| | | | |
| | |
| | | | |
| | | | | | | | | | | | | | | | | | | | | | | | | | | | |
| Members of the Management Board | | | | | Non-
performance-
related
components | | | | | | Performance-related components | | | | |
| | | | | | | | | without long-term
incentives | | | with long-term incentives | | | | |
| | | | | | | | | | | | cash-based | | | share-based | | | | |
in€ | | | | | Base salary | | | immediately
paid out | | | Restricted
Incentive
Award(s)
paid | | | Equity Upfront
Award(s)
(with retention
period) | | | Restricted Equity
Award(s)
(deferred with
additional
retention period) | | | Total | |
Dr. Josef Ackermann1 | | | 2012 | | | | 687,500 | | | | 150,000 | | | | 699,347 | | | | 150,000 | | | | 730,000 | | | | 2,416,847 | |
| | | 2011 | | | | 1,650,000 | | | | 100,000 | | | | 693,139 | | | | 105,000 | | | | 3,750,075 | | | | 6,298,214 | |
| | | | | | | | | | | | | | | | | | | | | | | | | | | | |
Dr. Hugo Bänziger1 | | | 2012 | | | | 479,167 | | | | 134,812 | | | | 97,572 | | | | 134,812 | | | | 263,938 | | | | 1,110,301 | |
| | | 2011 | | | | 1,150,000 | | | | 100,000 | | | | 96,706 | | | | 105,000 | | | | 1,424,884 | | | | 2,876,590 | |
| | | | | | | | | | | | | | | | | | | | | | | | | | | | |
Jürgen Fitschen | | | 2012 | | | | 1,820,833 | | | | 150,000 | | | | 273,122 | | | | 150,000 | | | | 1,365,250 | | | | 3,759,205 | |
| | | 2011 | | | | 1,150,000 | | | | 100,000 | | | | 72,530 | | | | 105,000 | | | | 1,424,884 | | | | 2,852,414 | |
| | | | | | | | | | | | | | | | | | | | | | | | | | | | |
Anshuman Jain | | | 2012 | | | | 1,820,833 | | | | 150,000 | | | | 1,342,968 | | | | 150,000 | | | | 1,365,250 | | | | 4,829,051 | |
| | | 2011 | | | | 1,150,000 | | | | 100,000 | | | | 248,885 | | | | 105,000 | | | | 4,207,384 | | | | 5,811,269 | |
| | | | | | | | | | | | | | | | | | | | | | | | | | | | |
Stefan Krause | | | 2012 | | | | 1,150,000 | | | | 150,000 | | | | 309,829 | | | | 150,000 | | | | 807,000 | | | | 2,566,829 | |
| | | 2011 | | | | 1,150,000 | | | | 100,000 | | | | 96,706 | | | | 105,000 | | | | 1,424,884 | | | | 2,876,590 | |
| | | | | | | | | | | | | | | | | | | | | | | | | | | | |
Hermann-Josef Lamberti1 | | | 2012 | | | | 479,167 | | | | 134,812 | | | | 97,572 | | | | 134,812 | | | | 263,938 | | | | 1,110,301 | |
| | | 2011 | | | | 1,150,000 | | | | 100,000 | | | | 96,706 | | | | 105,000 | | | | 1,424,884 | | | | 2,876,590 | |
| | | | | | | | | | | | | | | | | | | | | | | | | | | | |
Dr. Stephan Leithner2 | | | 2012 | | | | 670,833 | | | | 87,500 | | | | – | | | | 87,500 | | | | 470,750 | | | | 1,316,583 | |
| | | | | | | | | | | | | | | | | | | | | | | | | | | | |
Stuart Lewis2 | | | 2012 | | | | 670,833 | | | | 87,500 | | | | – | | | | 87,500 | | | | 470,750 | | | | 1,316,583 | |
| | | | | | | | | | | | | | | | | | | | | | | | | | | | |
Rainer Neske | | | 2012 | | | | 1,150,000 | | | | 150,000 | | | | 279,279 | | | | 150,000 | | | | 807,000 | | | | 2,536,279 | |
| | | 2011 | | | | 1,150,000 | | | | 100,000 | | | | 72,530 | | | | 105,000 | | | | 1,424,884 | | | | 2,852,414 | |
| | | | | | | | | | | | | | | | | | | | | | | | | | | | |
Henry Ritchotte2 | | | 2012 | | | | 670,833 | | | | 87,500 | | | | – | | | | 87,500 | | | | 470,750 | | | | 1,316,583 | |
| | | | | | | | | | | | | | | | | | | | | | | | | | | | |
Total | | | 2012 | | | | 9,599,999 | | | | 1,282,124 | | | | 3,099,689 | | | | 1,282,124 | | | | 7,014,626 | | | | 22,278,562 | |
| | | | | | | | | | | | | | | | | | | | | | | | | | | | |
Total | | | 2011 | | | | 8,550,000 | | | | 700,000 | | | | 1,377,202 | | | | 735,000 | | | | 15,081,879 | | | | 26,444,081 | |
| | | | | | | | | | | | | | | | | | | | | | | | | | | | |
| | | | | | | | | | | | | | | | | | | | | | | | | | | | |
| 1 | Member of the Management Board until May 31, 2012. |
| 2 | Member of the Management Board from June 1, 2012. |
The following should be noted with regard to the Restricted Incentive Awards in the presentation of the compensation amounts.
In accordance with German Accounting Standard 17, the Restricted Incentive Awards, as a deferred, non-equity-based compensation component subject to certain (forfeiture) conditions, must be recognized in the total compensation for the year of their payment (i.e. in the financial year in which the unconditional payment takes place) and not in the year they are originally granted. This means that the total compensation amounts presented only include the second tranche of the Restricted Incentive Awards (including an adjustment linked to our return on equity) granted in 2010 for the financial year 2009 totaling€ 1,389,536 and the first tranche of the Restricted Incentive Awards granted in 2011 for the financial year 2010 totaling€ 1,710,153. With respect to the previous year this means that the total compensation amounts presented above only include the first tranche of the Restricted Incentive Awards (including an adjustment linked to our return on equity) granted in 2010 for the financial year 2009 totaling€ 1,377,202.
| | | | |
| Deutsche Bank | | 01 – Management Report | | 216 |
| Financial Report 2012 | | Compensation Report | | |
| | |
| | | | |
| | |
| | | | |
The following table provides details on the Restricted Incentive Awards, i.e. the cash-based awards, on an individualized basis awarded to the members in active service on the Management Board in 2012. The information shown presents the amounts paid in the financial year as well as the amounts originally granted along with the respective financial year the amounts were awarded for.
| | | | | | | | | | | | | | | | | | | | |
| Members of the Management Board | | | | | | | | | | | | | | | |
Amounts in€ | | Year1 | | | Allocation over periods/
tranches2 | | | Amount awarded | | | Amount paid
out in 20123 | | | Amount paid
out in 20113 | |
Dr. Josef Ackermann4 | | | 2012 | | | | 2014 to 2017 / 4 | | | | 744,600 | | | | – | | | | – | |
| | | 2011 | | | | 2013 to 2016 / 4 | | | | 3,750,075 | | | | – | | | | – | |
| | | 2010 | | | | 2012 to 2015 / 4 | | | | 2,534,089 | | | | – | | | | – | |
| | | 2009 | | | | 2011 to 2013 / 3 | | | | 1,925,000 | | | | 699,347 | | | | 693,139 | |
| | | | | | | | | | | | | | | | | | | | |
Dr. Hugo Bänziger4 | | | 2012 | | | | 2014 to 2017 / 4 | | | | 269,217 | | | | – | | | | – | |
| | | 2011 | | | | 2013 to 2016 / 4 | | | | 1,424,883 | | | | – | | | | – | |
| | | 2010 | | | | 2012 to 2015 / 4 | | | | 824,399 | | | | – | | | | – | |
| | | 2009 | | | | 2011 to 2013 / 3 | | | | 268,575 | | | | 97,572 | | | | 96,706 | |
| | | | | | | | | | | | | | | | | | | | |
Jürgen Fitschen | | | 2012 | | | | 2014 to 2017 / 4 | | | | 1,392,555 | | | | – | | | | – | |
| | | 2011 | | | | 2013 to 2016 / 4 | | | | 1,424,883 | | | | – | | | | – | |
| | | 2010 | | | | 2012 to 2015 / 4 | | | | 799,770 | | | | 199,943 | | | | – | |
| | | 2009 | | | | 2011 to 2013 / 3 | | | | 201,431 | | | | 73,179 | | | | 72,530 | |
| | | | | | | | | | | | | | | | | | | | |
Anshuman Jain | | | 2012 | | | | 2014 to 2017 / 4 | | | | 1,392,555 | | | | – | | | | – | |
| | | 2011 | | | | 2013 to 2016 / 4 | | | | 4,207,383 | | | | – | | | | – | |
| | | 2010 | | | | 2012 to 2015 / 4 | | | | 4,367,413 | | | | 1,091,853 | | | | – | |
| | | 2009 | | | | 2011 to 2013 / 3 | | | | 691,210 | | | | 251,115 | | | | 248,885 | |
| | | | | | | | | | | | | | | | | | | | |
Stefan Krause | | | 2012 | | | | 2014 to 2017 / 4 | | | | 823,140 | | | | – | | | | – | |
| | | 2011 | | | | 2013 to 2016 / 4 | | | | 1,424,883 | | | | – | | | | – | |
| | | 2010 | | | | 2012 to 2015 / 4 | | | | 849,029 | | | | 212,257 | | | | – | |
| | | 2009 | | | | 2011 to 2013 / 3 | | | | 268,575 | | | | 97,572 | | | | 96,706 | |
| | | | | | | | | | | | | | | | | | | | |
Hermann-Josef Lamberti4 | | | 2012 | | | | 2014 to 2017 / 4 | | | | 269,217 | | | | – | | | | – | |
| | | 2011 | | | | 2013 to 2016 / 4 | | | | 1,424,883 | | | | – | | | | – | |
| | | 2010 | | | | 2012 to 2015 / 4 | | | | 799,770 | | | | – | | | | – | |
| | | 2009 | | | | 2011 to 2013 / 3 | | | | 268,575 | | | | 97,572 | | | | 96,706 | |
| | | | | | | | | | | | | | | | | | | | |
Dr. Stephan Leithner5 | | | 2012 | | | | 2014 to 2017 / 4 | | | | 480,165 | | | | – | | | | – | |
| | | | | | | | | | | | | | | | | | | | |
Stuart Lewis5 | | | 2012 | | | | 2014 to 2017 / 4 | | | | 480,165 | | | | – | | | | – | |
| | | | | | | | | | | | | | | | | | | | |
Rainer Neske | | | 2012 | | | | 2014 to 2017 / 4 | | | | 823,140 | | | | – | | | | – | |
| | | 2011 | | | | 2013 to 2016 / 4 | | | | 1,424,883 | | | | – | | | | – | |
| | | 2010 | | | | 2012 to 2015 / 4 | | | | 824,399 | | | | 206,100 | | | | – | |
| | | 2009 | | | | 2011 to 2013 / 3 | | | | 201,431 | | | | 73,179 | | | | 72,530 | |
| | | | | | | | | | | | | | | | | | | | |
Henry Ritchotte5 | | | 2012 | | | | 2014 to 2017 / 4 | | | | 480,165 | | | | – | | | | – | |
| | | | | | | | | | | | | | | | | | | | |
Total | | | 2012 | | | | 2014 to 2017 / 4 | | | | 7,154,919 | | | | – | | | | – | |
| | | 2011 | | | | 2013 to 2016 / 4 | | | | 15,081,873 | | | | – | | | | – | |
| | | 2010 | | | | 2012 to 2015 / 4 | | | | 10,998,869 | | | | 1,710,153 | | | | – | |
| | | 2009 | | | | 2011 to 2013 / 3 | | | | 3,824,797 | | | | 1,389,536 | | | | 1,377,202 | |
| |
| 1 | Financial year the award was originally issued for (in regard to the service on the Management Board). |
| 2 | Number of equal tranches. |
| 3 | The Restricted Incentive Awards awarded for the 2009 financial year contain a variable component (RoE-linked adjustment) so that the disbursal, i.e. the amount paid out, in the context of the first two tranches differs from the amount originally awarded. |
| 4 | Member of the Management Board until May 31, 2012. |
| 5 | Member of the Management Board from June 1, 2012. |
To add full transparency on the total awards granted to the Management Board members for the 2012 financial year the table below shows – in a deviation from the disclosure according to the German Accounting Standard No. 17 presented above – the compensation components determined by the Supervisory Board for the service of the Management Board members for the years 2012 and 2011.
| | | | |
| Deutsche Bank | | 01 – Management Report | | 217 |
| Financial Report 2012 | | Compensation Report | | |
| | |
| | | | |
| | |
| | | | |
| | | | | | | | | | | | | | | | | | | | | | | | | | | | |
Members of the Management Board | | | | | Non-
performance-
related
components | | | | | | Performance-related components | | | | |
| | | | | | | | | without long-term
incentives | | | with long-term incentives | | | | |
| | | | | | | | | | | | cash-based | | | share-based | | | | |
in€ | | | | | Base salary | | | immediately
paid out | | | Restricted
Incentive
Award(s)
granted | | | Equity Upfront
Award(s)
(with retention
period) | | | Restricted Equity
Award(s)
(deferred with
additional
retention period) | | | Total | |
Dr. Josef Ackermann1 | | | 2012 | | | | 687,500 | | | | 150,000 | | | | 744,600 | | | | 150,000 | | | | 730,000 | | | | 2,462,100 | |
| | | 2011 | | | | 1,650,000 | | | | 100,000 | | | | 3,750,075 | | | | 105,000 | | | | 3,750,075 | | | | 9,355,150 | |
| | | | | | | | | | | | | | | | | | | | | | | | | | | | |
Dr. Hugo Bänziger1 | | | 2012 | | | | 479,167 | | | | 134,812 | | | | 269,217 | | | | 134,812 | | | | 263,938 | | | | 1,281,946 | |
| | | 2011 | | | | 1,150,000 | | | | 100,000 | | | | 1,424,883 | | | | 105,000 | | | | 1,424,884 | | | | 4,204,767 | |
| | | | | | | | | | | | | | | | | | | | | | | | | | | | |
Jürgen Fitschen | | | 2012 | | | | 1,820,833 | | | | 150,000 | | | | 1,392,555 | | | | 150,000 | | | | 1,365,250 | | | | 4,878,638 | |
| | | 2011 | | | | 1,150,000 | | | | 100,000 | | | | 1,424,883 | | | | 105,000 | | | | 1,424,884 | | | | 4,204,767 | |
| | | | | | | | | | | | | | | | | | | | | | | | | | | | |
Anshuman Jain | | | 2012 | | | | 1,820,833 | | | | 150,000 | | | | 1,392,555 | | | | 150,000 | | | | 1,365,250 | | | | 4,878,638 | |
| | | 2011 | | | | 1,150,000 | | | | 100,000 | | | | 4,207,383 | | | | 105,000 | | | | 4,207,384 | | | | 9,769,767 | |
| | | | | | | | | | | | | | | | | | | | | | | | | | | | |
Stefan Krause | | | 2012 | | | | 1,150,000 | | | | 150,000 | | | | 823,140 | | | | 150,000 | | | | 807,000 | | | | 3,080,140 | |
| | | 2011 | | | | 1,150,000 | | | | 100,000 | | | | 1,424,883 | | | | 105,000 | | | | 1,424,884 | | | | 4,204,767 | |
| | | | | | | | | | | | | | | | | | | | | | | | | | | | |
Hermann-Josef Lamberti1 | | | 2012 | | | | 479,167 | | | | 134,812 | | | | 269,217 | | | | 134,812 | | | | 263,938 | | | | 1,281,946 | |
| | | 2011 | | | | 1,150,000 | | | | 100,000 | | | | 1,424,883 | | | | 105,000 | | | | 1,424,884 | | | | 4,204,767 | |
| | | | | | | | | | | | | | | | | | | | | | | | | | | | |
Dr. Stephan Leithner2 | | | 2012 | | | | 670,833 | | | | 87,500 | | | | 480,165 | | | | 87,500 | | | | 470,750 | | | | 1,796,748 | |
| | | | | | | | | | | | | | | | | | | | | | | | | | | | |
Stuart Lewis2 | | | 2012 | | | | 670,833 | | | | 87,500 | | | | 480,165 | | | | 87,500 | | | | 470,750 | | | | 1,796,748 | |
| | | | | | | | | | | | | | | | | | | | | | | | | | | | |
Rainer Neske | | | 2012 | | | | 1,150,000 | | | | 150,000 | | | | 823,140 | | | | 150,000 | | | | 807,000 | | | | 3,080,140 | |
| | | 2011 | | | | 1,150,000 | | | | 100,000 | | | | 1,424,883 | | | | 105,000 | | | | 1,424,884 | | | | 4,204,767 | |
| | | | | | | | | | | | | | | | | | | | | | | | | | | | |
Henry Ritchotte2 | | | 2012 | | | | 670,833 | | | | 87,500 | | | | 480,165 | | | | 87,500 | | | | 470,750 | | | | 1,796,748 | |
| | | | | | | | | | | | | | | | | | | | | | | | | | | | |
Total | | | 2012 | | | | 9,599,999 | | | | 1,282,124 | | | | 7,154,919 | | | | 1,282,124 | | | | 7,014,626 | | | | 26,333,792 | |
| | | | | | | | | | | | | | | | | | | | | | | | | | | | |
Total | | | 2011 | | | | 8,550,000 | | | | 700,000 | | | | 15,081,873 | | | | 735,000 | | | | 15,081,879 | | | | 40,148,752 | |
| | | | | | | | | | | | | | | | | | | | | | | | | | | | |
| | | | | | | | | | | | | | | | | | | | | | | | | | | | |
| 1 | Member of the Management Board until May 31, 2012. |
| 2 | Member of the Management Board from June 1, 2012. |
The number of share awards in the form of Equity Upfront Awards (EUA) and Restricted Equity Awards (REA) granted in 2013 for the year 2012 to each member of the Management Board was determined by dividing the respective euro amounts by€ 38.525, the XETRA closing price of a Deutsche Bank share on February 1, 2013 (prior year:€ 34.04 on February 1, 2012).
As a result, the number of share awards granted was as follows (rounded).
| | | | | | | | | | | | |
| Members of the Management Board | | | | | | | | | |
Units | | Year | | | Equity Upfront Award(s)
(with retention period) | | | Restricted Equity Award(s)
(deferred with additional
retention period) | |
Dr. Josef Ackermann1 | | | 2012 | | | | 3,893 | | | | 18,948 | |
| | | 2011 | | | | 3,084 | | | | 110,166 | |
| | | | | | | | | | | | |
Dr. Hugo Bänziger1 | | | 2012 | | | | 3,499 | | | | 6,851 | |
| | | 2011 | | | | 3,084 | | | | 41,859 | |
| | | | | | | | | | | | |
Jürgen Fitschen | | | 2012 | | | | 3,893 | | | | 35,438 | |
| | | 2011 | | | | 3,084 | | | | 41,859 | |
| | | | | | | | | | | | |
Anshuman Jain | | | 2012 | | | | 3,893 | | | | 35,438 | |
| | | 2011 | | | | 3,084 | | | | 123,601 | |
| | | | | | | | | | | | |
Stefan Krause | | | 2012 | | | | 3,893 | | | | 20,947 | |
| | | 2011 | | | | 3,084 | | | | 41,859 | |
| | | | | | | | | | | | |
Hermann-Josef Lamberti1 | | | 2012 | | | | 3,499 | | | | 6,851 | |
| | | 2011 | | | | 3,084 | | | | 41,859 | |
| | | | | | | | | | | | |
Dr. Stephan Leithner2 | | | 2012 | | | | 2,271 | | | | 12,219 | |
| | | | | | | | | | | | |
Stuart Lewis2 | | | 2012 | | | | 2,271 | | | | 12,219 | |
| | | | | | | | | | | | |
Rainer Neske | | | 2012 | | | | 3,893 | | | | 20,947 | |
| | | 2011 | | | | 3,084 | | | | 41,859 | |
| | | | | | | | | | | | |
Henry Ritchotte2 | | | 2012 | | | | 2,271 | | | | 12,219 | |
| |
| 1 | Member of the Management Board until May 31, 2012. |
| 2 | Member of the Management Board from June 1, 2012. |
| | | | |
| Deutsche Bank | | 01 – Management Report | | 218 |
| Financial Report 2012 | | Compensation Report | | |
| | |
| | | | |
| | |
| | | | |
The following table shows the non-performance-related other benefits for the 2012 and 2011 financial years.
| | | | | | | | |
| Members of the Management Board | | Other benefits | |
in€ | | 2012 | | | 2011 | |
Dr. Josef Ackermann1 | | | 88,372 | | | | 176,256 | |
Dr. Hugo Bänziger1 | | | 36,959 | | | | 50,535 | |
Jürgen Fitschen | | | 240,044 | | | | 151,700 | |
Anshuman Jain | | | 614,588 | | | | 63,214 | |
Stefan Krause | | | 102,301 | | | | 228,878 | |
Hermann-Josef Lamberti1 | | | 42,664 | | | | 103,485 | |
Dr. Stephan Leithner2 | | | 72,601 | | | | – | |
Stuart Lewis2 | | | 71,187 | | | | – | |
Rainer Neske | | | 127,543 | | | | 105,523 | |
Henry Ritchotte2 | | | 6,677 | | | | – | |
| | | | | | | | |
Total | | | 1,402,936 | | | | 879,591 | |
| |
| 1 | Member of the Management Board until May 31, 2012. |
| 2 | Member of the Management Board from June 1, 2012. |
Management Board members do not receive any compensation for mandates on boards of our subsidiaries.
Pension and transitional benefits
The Supervisory Board generally allocates an entitlement to the Management Board members to pension plan benefits. These entitlements involve a defined contribution pension plan. Under this pension plan, a personal pension account has been set up for each participating member of the Management Board after appointment to the Management Board. A contribution is made annually into this pension account. This annual contribution is calculated using an individual contribution rate on the basis of each member’s base salary and total bonus up to a defined ceiling and accrues interest credited in advance, determined by means of an age-related factor, at an average rate of 6 % per year up to the age of 60. From the age of 61 onwards, the pension account is credited with an annual interest payment of 6 % up to the date of retirement. The annual payments, taken together, form the pension amount which is available to pay the future pension benefit. Under defined conditions the pension may also become due for payment before a regular pension event (age limit, disability or death) has occurred. The pension right is vested from the beginning.
Dr. Ackermann, Dr. Bänziger and Mr. Lamberti are entitled to transition payments of 100 % of the sum of salary and total bonus (last total target figure) pro rata temporis for a period of six months after leaving office. Subsequently, Dr. Ackermann is entitled to a further transition payment of 75 % of the sum of salary and total bonus (last total target figure) for a period of 12 months. Based on the above entitlements, the transition payments made in 2012 were€ 928,125 for Dr. Ackermann and€ 575,000 each for Dr. Bänziger and Mr. Lamberti. Further amounts are due in 2013 and also for Dr. Ackermann in 2014.
Based on former contractual commitments Dr. Ackermann and Mr. Lamberti are entitled to a monthly pension payment of€ 29,400 each after the end of the respective transition payment period.
| | | | |
| Deutsche Bank | | 01 – Management Report | | 219 |
| Financial Report 2012 | | Compensation Report | | |
| | |
| | | | |
| | |
| | | | |
The following table shows the annual service costs for pension benefits and transition payments for the years 2012 and 2011 and the corresponding defined benefit obligations each as of December 31, 2012 and December 31, 2011 for the individual members of the Management Board. The different sizes of the balances are due to the different lengths of service on the Management Board, the respective age-related factors, the different contribution rates as well as the individual pensionable compensation amounts and the previously mentioned additional individual entitlements.
| | | | | | | | | | | | |
| Members of the Management Board | | | | | | | | | |
in€ | | | | | Service cost for pension
benefits and transition
payments, in the year | | | Present value of the defined
benefit obligation for pension
benefits and transition
payments, end of year | |
Dr. Josef Ackermann1 | | | 2012 | | | | 405,581 | | | | –2 | |
| | | 2011 | | | | 876,760 | | | | 18,753,007 | |
| | | | | | | | | | | | |
Dr. Hugo Bänziger1 | | | 2012 | | | | 303,183 | | | | –2 | |
| | | 2011 | | | | 508,011 | | | | 2,786,879 | |
| | | | | | | | | | | | |
Jürgen Fitschen | | | 2012 | | | | 327,364 | | | | 1,093,915 | |
| | | 2011 | | | | 222,585 | | | | 565,984 | |
| | | | | | | | | | | | |
Anshuman Jain | | | 2012 | | | | 412,524 | | | | 412,524 | |
| | | | | | | | | | | | |
Stefan Krause | | | 2012 | | | | 550,439 | | | | 2,564,927 | |
| | | 2011 | | | | 470,827 | | | | 1,345,800 | |
| | | | | | | | | | | | |
Hermann-Josef Lamberti1 | | | 2012 | | | | 180,193 | | | | –2 | |
| | | 2011 | | | | 486,920 | | | | 12,463,973 | |
| | | | | | | | | | | | |
Dr. Stephan Leithner3 | | | 2012 | | | | 210,469 | | | | 210,469 | |
| | | | | | | | | | | | |
Stuart Lewis3 | | | 2012 | | | | 209,385 | | | | 209,385 | |
| | | | | | | | | | | | |
Rainer Neske | | | 2012 | | | | 560,153 | | | | 2,179,771 | |
| | | 2011 | | | | 462,655 | | | | 1,066,022 | |
| | | | | | | | | | | | |
Henry Ritchotte3 | | | 2012 | | | | 206,692 | | | | 206,692 | |
| |
| 1 | Member of the Management Board until May 31, 2012. |
| 2 | The respective obligations are part of the provisions for pension obligations to former members of the Management Board. |
| 3 | Member of the Management Board from June 1, 2012. |
In connection with their exit from the Group Dr. Bänziger and Mr. Lamberti received a special contribution into their individual pension account. The amount of this contribution was€ 688,422 for Dr. Bänziger and€ 560,112 for Mr. Lamberti.
Other benefits upon premature termination
The Management Board members are in principle entitled to receive a severance payment upon a premature termination of their appointment at the bank’s initiative, provided the bank is not entitled to revoke the appointment or give notice under the contractual agreement for cause. The severance payment, as a rule, will not exceed the lesser of two annual compensation amounts and the claims to compensation for the remaining term of the contract. The calculation of the compensation is based on the annual compensation for the previous financial year.
If a Management Board member leaves office in connection with a change of control, they are also, under certain conditions, entitled in principle to a severance payment. The severance payment, as a rule, will not exceed the lesser of three annual compensation amounts and the claims to compensation for the remaining term of the contract. The calculation of the compensation is based again on the annual compensation for the previous financial year.
The severance payment mentioned above is determined by the Supervisory Board subject to its sole discretion. In principle, the disbursement of the severance payment takes place in two installments; the second installment is subject to certain forfeiture conditions until vesting.
In connection with their exit from the Group Dr. Bänziger and Mr. Lamberti received a severance payment based on a severance agreement concluded. The severance payment is€ 7,756,000 for Dr. Bänziger and€ 7,729,000 for Mr. Lamberti. In both cases the payment of the severance takes place in two installments, the second installment being subject to certain forfeiture conditions until vesting on May 31, 2013.
| | | | |
| Deutsche Bank | | 01 – Management Report | | 220 |
| Financial Report 2012 | | Compensation Report | | |
| | |
| | | | |
| | |
| | | | |
Expense for Long-Term Incentive Components
The following table presents the compensation expense recognized in the respective years for long-term incentive components of compensation not vested immediately, granted for service on the Management Board.
| | | | | | | | | | | | | | | | |
| Members of the Management Board | | Amount expensed for | |
| | | share-based compensation
components | | | cash-based compensation
components | |
in€ | | 2012 | | | 2011 | | | 2012 | | | 2011 | |
Dr. Josef Ackermann1 | | | 5,093,773 | | | | 2,020,850 | | | | 4,688,524 | | | | 2,152,404 | |
Dr. Hugo Bänziger1 | | | 2,314,873 | | | | 440,182 | | | | 1,989,185 | | | | 386,704 | |
Jürgen Fitschen | | | 967,516 | | | | 309,459 | | | | 819,851 | | | | 359,601 | |
Anshuman Jain | | | 2,738,231 | | | | 1,471,955 | | | | 3,092,210 | | | | 1,818,626 | |
Stefan Krause | | | 981,775 | | | | 364,503 | | | | 824,961 | | | | 395,591 | |
Hermann-Josef Lamberti1 | | | 2,485,906 | | | | 434,736 | | | | 1,974,270 | | | | 377,816 | |
Rainer Neske | | | 969,746 | | | | 314,911 | | | | 827,875 | | | | 368,488 | |
| |
| 1 | Member of the Management Board until May 31, 2012. |
Management Board Share Ownership
As of March 28, 2013 and February 17, 2012 respectively, the current members of our Management Board held the following numbers of Deutsche Bank shares and share awards.
| | | | | | | | | | | | |
Members of the Management Board | | | | | Number
of shares | | | Number of
share awards1 | |
Jürgen Fitschen | | | 2013 | | | | 183,759 | | | | 146,472 | |
| | | 2012 | | | | 181,907 | | | | 110,978 | |
| | | | | | | | | | | | |
Anshuman Jain | | | 2013 | | | | 572,701 | | | | 344,875 | |
| | | 2012 | | | | 552,697 | | | | 346,703 | |
| | | | | | | | | | | | |
Stefan Krause | | | 2013 | | | | – | | | | 141,148 | |
| | | 2012 | | | | – | | | | 116,307 | |
| | | | | | | | | | | | |
Dr. Stephan Leithner | | | 2013 | | | | 24,632 | | | | 180,348 | |
| | | | | | | | | | | | |
Stuart Lewis | | | 2013 | | | | 20,480 | | | | 77,706 | |
| | | | | | | | | | | | |
Rainer Neske | | | 2013 | | | | 73,940 | | | | 132,905 | |
| | | 2012 | | | | 51,088 | | | | 111,902 | |
| | | | | | | | | | | | |
Henry Ritchotte | | | 2013 | | | | 134,082 | | | | 144,944 | |
| | | | | | | | | | | | |
Total | | | 2013 | | | | 1,009,594 | | | | 1,168,398 | |
| | | | | | | | | | | | |
Total | | | 2012 | | | | 785,692 | | | | 685,890 | |
| |
| 1 | Including the share awards received in connection with employment prior to the appointment to the Management Board, if applicable. |
The current members of our Management Board held an aggregate of 1,009,594 of our shares on February 22, 2013 amounting to approximately 0.11 % of Deutsche Bank shares issued on that date.
The number of Deutsche Bank shares delivered in 2012 to the members of the Management Board active in 2012 from deferred compensation awards granted in prior years amounted to 439,722.
| | | | |
| Deutsche Bank | | 01 – Management Report | | 221 |
| Financial Report 2012 | | Compensation Report | | |
| | |
| | | | |
| | |
| | | | |
Senior Management Group
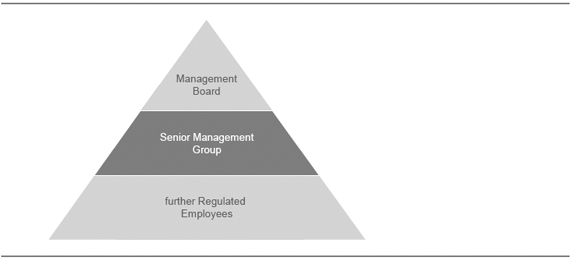
It is imperative that the senior management of any financial institution is collectively committed to building a long-term sustainable business. Compensation structures should reflect this and ensure the employees have a vested interest in the future performance of the firm.
As communicated during the Investor Day in September 2012, we have taken the decision to identify a population of our most senior employees. This population comprises 126 (119 excluding the Management Board) individuals and includes the Group Executive Committee and the most senior employees from each of our business divisions, Regional Management and Infrastructure functions. All of the employees identified are also Regulated Employees under the InstitutsVergV, however, we have voluntarily sought to identify this further sub-set of Regulated Employees in order to apply more stringent compensation provisions.
Restricted Equity Award
In order to further align the compensation of this population with the long-term sustainability of the Group, the decision has been taken to extend the collective deferral and retention period of the REA to five years. Providing the performance conditions are met, the full amount of shares will not be released to employees until the end of the five-year period (rather than on a pro-rata basis).
The awards are subject to the full list of clawback provisions as outlined in the overview of ex-post risk adjustment measures. If for any year during the five-year vesting period either the Group or the employee’s Divisional NIBT is negative, 20 % of the award will be forfeited in respect of that year.
It is our intention to give specific focus to the compensation arrangements of the most senior employees in the Group. In addition to lengthening the vesting period for REA, the cash cap in place ensures high deferral levels for this population. On average, the Senior Management Group is subject to Variable Compensation deferral levels in excess of 90 %. Both the deferral rate and five-year vesting period go beyond the typical industry standards and regulatory requirements. It is a voluntary decision by us and one that may prove to be challenging from a competitive standpoint, however we believe strongly that it supports and demonstrates the increasing alignment between compensation and long-term performance requirements.
| | | | |
| Deutsche Bank | | 01 – Management Report | | 222 |
| Financial Report 2012 | | Compensation Report | | |
| | |
| | | | |
| | |
| | | | |
Employees regulated under the InstitutsVergV
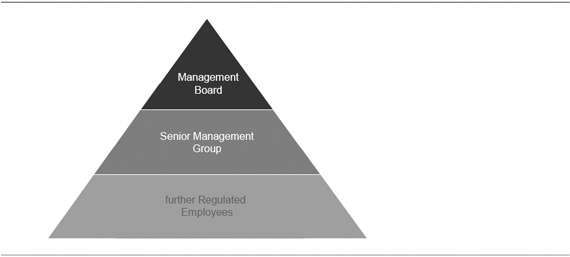
In accordance with the InstitutsVergV we are required to identify all employees whose work is deemed to have a major influence on the overall risk profile of the Group. The SECC has overseen the identification process in respect of 2012 which incorporated both qualitative and quantitative analysis. The process identified the following employee populations:
| — | | Management Board, Group Executive Committee, Regional Management and Board Executive (“Geschäftsleiter”) of significant Group Subsidiaries; |
| — | | Senior Management responsible for day to day management of front office businesses and large country hubs; |
| — | | staff responsible for independent control functions and members of global Infrastructure Committees; |
| — | | all Managing Directors in CB&S (excluding Research and German MidCaps); |
| — | | if not already identified, all other employees with similar remuneration to those captured under the above criteria. |
On a global basis, 1,215 employees were identified as Regulated Employees, spanning 36 countries. This represents a reduction compared to 2011 primarily as a result of identifying fewer Managing Directors in CB&S and an overall reduction in Variable Compensation. Despite this, we expect the number to remain significantly higher than the majority of our principle competitors, both from an absolute level and percentage of the total employee population.
Compensation Structures for Regulated Employees
Regulated Employees are subject to the same deferral matrix as the general employee population, save for the requirement that at least 40 % of Variable Compensation must be deferred. If a Regulated Employee’s Variable Compensation does not trigger 40 % deferral under the Group’s global matrix then the matrix is overridden to ensure the regulatory obligations are met. On average, however, Regulated Employees are subject to deferral rates in excess of 70 % of their total Variable Compensation awards. This is well in excess of the minimum 40 % – 60 % regulatory requirements and is a voluntary decision by us.
All Regulated Employees receive 50 % of their deferred Variable Compensation in the form of an REA and 50 % as an RIA. Upon the vesting of each REA tranche, a further minimum six-month retention period applies during which time employees are not permitted to sell the shares. Whilst the specific performance clawback conditions outlined in the Group disclosure section do not apply during the retention period, employees can still forfeit the award if they are subject to termination for Cause.
| | | | |
| Deutsche Bank | | 01 – Management Report | | 223 |
| Financial Report 2012 | | Compensation Report | | |
| | |
| | | | |
| | |
| | | | |
In accordance with Section 5 InstitutsVergV regulations, 50 % of the upfront award (the remaining portion after the deferred percentage is calculated) is also awarded in equity (EUA). At award, the equity is subject to a minimum six-month retention period during which time the shares cannot be sold. Adding the EUA to the deferred portion of the award means that on average Regulated Employees received less than 15 % of their 2012 Variable Compensation as an immediate cash payment (i.e. deferral rates in excess of 85 %).
EUAs are subject to the Breach of Policy conditions during the retention period and will also be forfeited if employees leave the Group voluntarily.
Compensation Disclosure pursuant to Section 8 InstitutsVergV
As described above, we have developed and refined a structured and comprehensive approach in order to identify Regulated Employees in accordance with the InstitutsVergV requirements. The collective compensation elements for this population of employees are detailed in the table below. All Management Board members and Board members of our other “significant institutions” per Section 1 InstitutsVergV are included in the Geschäftsleiter column.
| | | | | | | | | | | | | | | | | | | | | | | | | | | | |
| | | 2012 | |
in€ m. (unless stated otherwise)1 | | CB&S | | | GTB | | | AWM | | | PBC | | | Geschäftsleiter
(Significant
Institutions) | | | NCOU | | | Group
Total | |
Total Compensation | | | 1,375 | | | | 44 | | | | 84 | | | | 25 | | | | 75 | | | | 16 | | | | 1,618 | |
number of employees | | | 1,086 | | | | 26 | | | | 42 | | | | 15 | | | | 36 | | | | 10 | | | | 1,215 | |
thereof Fixed Compensation | | | 339 | | | | 9 | | | | 15 | | | | 5 | | | | 20 | | | | 3 | | | | 391 | |
thereof Variable Compensation | | | 1,036 | | | | 35 | | | | 68 | | | | 19 | | | | 56 | | | | 13 | | | | 1,227 | |
| | | | | | | | | | | | | | | | | | | | | | | | | | | | |
Variable Compensation | | | | | | | | | | | | | | | | | | | | | | | | | | | | |
thereof Deferred Awards | | | 779 | | | | 28 | | | | 57 | | | | 15 | | | | 47 | | | | 10 | | | | 936 | |
thereof Deferred Equity | | | 390 | | | | 14 | | | | 28 | | | | 8 | | | | 23 | | | | 5 | | | | 468 | |
thereof Upfront Awards | | | 257 | | | | 7 | | | | 12 | | | | 4 | | | | 9 | | | | 2 | | | | 290 | |
thereof Upfront Equity2 | | | 125 | | | | 3 | | | | 6 | | | | 2 | | | | 4 | | | | 1 | | | | 141 | |
thereof Awards subject to clawback | | | 904 | | | | 31 | | | | 62 | | | | 17 | | | | 51 | | | | 11 | | | | 1,077 | |
thereof Awards subject to sustained performance metrics | | | 779 | | | | 28 | | | | 57 | | | | 15 | | | | 47 | | | | 10 | | | | 936 | |
| | | | | | | | | | | | | | | | | | | | | | | | | | | | |
Sign On payments3,4 | | | 34 | | | | – | | | | – | | | | – | | | | – | | | | – | | | | 34 | |
number of beneficiaries | | | 25 | | | | – | | | | – | | | | – | | | | – | | | | – | | | | 26 | |
| | | | | | | | | | | | | | | | | | | | | | | | | | | | |
Termination payments | | | 22 | | | | – | | | | 15 | | | | – | | | | 25 | | | | – | | | | 61 | |
number of beneficiaries | | | 91 | | | | – | | | | 7 | | | | – | | | | 3 | | | | – | | | | 101 | |
| |
| 2 | Upfront equity portion of Upfront Awards may be less than 50 % due to the impact of local legal requirements and tax legislation. |
| 4 | Sign-on payments have been disclosed collectively for the Group with the exception of CB&S in order to safeguard employee confidentiality due to the low number of recipients. |
All figures in the above table include the allocation of Infrastructure-related compensation or number of employees according our established cost allocation key. The table contains marginal rounding differences.
Our management structure and personnel was subject to significant change during 2012. All payments made to senior employees on the termination of their employment were made in recognition of their sustained commitment and personal contribution to the success of the Group over a period of time. Of the total value of termination settlements published above, the largest single award was approximately€ 10.4 million (based on the foreign exchange rate on the date of payment) which represented a former contractual obligation.
All deferred awards and the EUA are subject to clawback following a policy or regulatory breach by the employee. In addition, all deferred awards are subject to clawback provisions linked to the performance of the employee, the respective corporate division and the Group as a whole. During the course of 2012, no clawback was applied towards Regulated Employees.
| | | | |
| Deutsche Bank | | 01 – Management Report | | 224 |
| Financial Report 2012 | | Compensation Report | | |
| | |
| | | | |
| | |
| | | | |
Compensation System for Supervisory Board Members
The principles of the compensation of the Supervisory Board members are set forth in our Articles of Association, which our shareholders amend from time to time at the Annual General Meeting. Such compensation provisions were last amended at our Annual General Meeting on May 24, 2007.
The following provisions apply: compensation consists of a fixed remuneration of€ 60,000 per year and a dividend-based bonus of€ 100 per year for every full or fractional€ 0.01 increment by which the dividend we distribute to our shareholders exceeds€ 1.00 per share. Each member of the Supervisory Board also receives annual remuneration linked to our long-term profits of€ 100 for each€ 0.01 by which the average earnings per share (diluted), reported in our financial statements in accordance with the accounting principles to be applied in each case on the basis of the net income figures for the three previous financial years, exceed the amount of€ 4.00.
These amounts are increased by 100 % for every membership in a committee of the Supervisory Board. Committee chairpersons receive an increase of 200 %. These provisions do not apply to the Mediation Committee formed pursuant to Section 27 (3) of the Co-Determination Act. The Supervisory Board Chairman is paid four times the base compensation of a regular member, and does not receive incremental increases for committee work. The deputy to the Supervisory Board Chairman is paid one and a half times the base compensation of a regular member. In addition, the members of the Supervisory Board receive a meeting fee of€ 1,000 for each Supervisory Board and committee meeting they attend. Furthermore, in our interest, the members of the Supervisory Board will be included in any financial liability insurance policy held to an appropriate value by us, with the corresponding premiums being paid by us.
We also reimburse members of the Supervisory Board for all cash expenses and any value added tax (Umsatzsteuer, at present 19 %) they incur in connection with their roles as members of the Supervisory Board. Employee representatives on the Supervisory Board also continue to receive their employee benefits. For Supervisory Board members who served for only part of the year, we pay a portion of the total compensation based on the number of months they served, rounding up to whole months.
The members of the Nomination Committee, which was first formed after the Annual General Meeting in 2008, waived all remuneration, including the meeting fee, for their Nomination Committee work for 2009 and the following years.
Supervisory Board Compensation for Fiscal Year 2012
We compensate our Supervisory Board members after the end of each fiscal year. In January 2013, we paid each Supervisory Board member the fixed portion of their remuneration and meeting fees for services in 2012. In addition, we will in principle pay each Supervisory Board member after the General Meeting in May 2013 a remuneration for their services in 2012 linked to our long-term performance as well as a dividend-based bonus, as defined in our Articles of Association. Assuming that the Annual General Meeting in May 2013 approves the proposed dividend of€ 0.75 per share, the Supervisory Board will receive a total remuneration of€ 2,335,000 (2011:€ 2,608,600).
| | | | |
| Deutsche Bank | | 01 – Management Report | | 225 |
| Financial Report 2012 | | Compensation Report | | |
| | |
| | | | |
| | |
| | | | |
Individual members of the Supervisory Board received the following compensation for the 2012 financial year (excluding statutory value added tax).
| | | | | | | | | | | | | | | | | | | | | | | | | | | | | | | | |
| Members of the Supervisory Board | | Compensation for fiscal year 2012 | | | Compensation for fiscal year 2011 | |
in€ | | | Fixed | | | | Variable | | |
| Meeting
fee |
| | | Total | | | | Fixed | | | | Variable8 | | |
| Meeting
fee |
| | | Total | |
| | | | | | | | | | | | | | | | | | | | | | | | | | | | | | | | |
Dr. Paul Achleitner1 | | | 160,000 | | | | – | | | | 13,000 | | | | 173,000 | | | | – | | | | – | | | | – | | | | – | |
| | | | | | | | | | | | | | | | | | | | | | | | | | | | | | | | |
Dr. Clemens Börsig2 | | | 100,000 | | | | – | | | | 12,000 | | | | 112,000 | | | | 240,000 | | | | 28,800 | | | | 23,000 | | | | 291,800 | |
| | | | | | | | | | | | | | | | | | | | | | | | | | | | | | | | |
Karin Ruck | | | 210,000 | | | | – | | | | 19,000 | | | | 229,000 | | | | 210,000 | | | | 25,200 | | | | 17,000 | | | | 252,200 | |
| | | | | | | | | | | | | | | | | | | | | | | | | | | | | | | | |
Wolfgang Böhr | | | 60,000 | | | | – | | | | 6,000 | | | | 66,000 | | | | 60,000 | | | | 7,200 | | | | 6,000 | | | | 73,200 | |
| | | | | | | | | | | | | | | | | | | | | | | | | | | | | | | | |
Dr. Karl-Gerhard Eick | | | 180,000 | | | | – | | | | 13,000 | | | | 193,000 | | | | 180,000 | | | | 21,600 | | | | 12,000 | | | | 213,600 | |
| | | | | | | | | | | | | | | | | | | | | | | | | | | | | | | | |
Katherine Garrett-Cox3 | | | 60,000 | | | | – | | | | 6,000 | | | | 66,000 | | | | 40,000 | | | | 4,800 | | | | 3,000 | | | | 47,800 | |
| | | | | | | | | | | | | | | | | | | | | | | | | | | | | | | | |
Alfred Herling | | | 120,000 | | | | – | | | | 12,000 | | | | 132,000 | | | | 120,000 | | | | 14,400 | | | | 11,000 | | | | 145,400 | |
| | | | | | | | | | | | | | | | | | | | | | | | | | | | | | | | |
Gerd Herzberg2 | | | 25,000 | | | | – | | | | 4,000 | | | | 29,000 | | | | 60,000 | | | | 7,200 | | | | 6,000 | | | | 73,200 | |
| | | | | | | | | | | | | | | | | | | | | | | | | | | | | | | | |
Sir Peter Job4 | | | – | | | | – | | | | – | | | | – | | | | 75,000 | | | | 12,600 | | | | 8,000 | | | | 95,600 | |
| | | | | | | | | | | | | | | | | | | | | | | | | | | | | | | | |
Prof. Dr. Henning Kagermann | | | 120,000 | | | | – | | | | 12,000 | | | | 132,000 | | | | 120,000 | | | | 14,400 | | | | 12,000 | | | | 146,400 | |
| | | | | | | | | | | | | | | | | | | | | | | | | | | | | | | | |
Peter Kazmierczak5 | | | – | | | | – | | | | – | | | | – | | | | 50,000 | | | | 6,000 | | | | 6,000 | | | | 62,000 | |
| | | | | | | | | | | | | | | | | | | | | | | | | | | | | | | | |
Martina Klee | | | 60,000 | | | | – | | | | 6,000 | | | | 66,000 | | | | 60,000 | | | | 7,200 | | | | 6,000 | | | | 73,200 | |
| | | | | | | | | | | | | | | | | | | | | | | | | | | | | | | | |
Suzanne Labarge | | | 120,000 | | | | – | | | | 12,000 | | | | 132,000 | | | | 120,000 | | | | 14,400 | | | | 11,000 | | | | 145,400 | |
| | | | | | | | | | | | | | | | | | | | | | | | | | | | | | | | |
Maurice Lévy2 | | | 25,000 | | | | – | | | | 3,000 | | | | 28,000 | | | | 60,000 | | | | 7,200 | | | | 5,000 | | | | 72,200 | |
| | | | | | | | | | | | | | | | | | | | | | | | | | | | | | | | |
Peter Löscher1 | | | 40,000 | | | | – | | | | 2,000 | | | | 42,000 | | | | – | | | | – | | | | – | | | | – | |
| | | | | | | | | | | | | | | | | | | | | | | | | | | | | | | | |
Henriette Mark | | | 120,000 | | | | – | | | | 13,000 | | | | 133,000 | | | | 120,000 | | | | 14,400 | | | | 12,000 | | | | 146,400 | |
| | | | | | | | | | | | | | | | | | | | | | | | | | | | | | | | |
Gabriele Platscher | | | 60,000 | | | | – | | | | 6,000 | | | | 66,000 | | | | 60,000 | | | | 7,200 | | | | 6,000 | | | | 73,200 | |
| | | | | | | | | | | | | | | | | | | | | | | | | | | | | | | | |
Dr. Theo Siegert2 | | | 75,000 | | | | – | | | | 8,000 | | | | 83,000 | | | | 145,000 | | | | 17,400 | | | | 13,000 | | | | 175,400 | |
| | | | | | | | | | | | | | | | | | | | | | | | | | | | | | | | |
Rudolf Stockem6 | | | 35,000 | | | | – | | | | 2,000 | | | | 37,000 | | | | – | | | | – | | | | – | | | | – | |
| | | | | | | | | | | | | | | | | | | | | | | | | | | | | | | | |
Dr. Johannes Teyssen | | | 60,000 | | | | – | | | | 6,000 | | | | 66,000 | | | | 60,000 | | | | 7,200 | | | | 6,000 | | | | 73,200 | |
| | | | | | | | | | | | | | | | | | | | | | | | | | | | | | | | |
Marlehn Thieme | | | 120,000 | | | | – | | | | 13,000 | | | | 133,000 | | | | 120,000 | | | | 14,400 | | | | 11,000 | | | | 145,400 | |
| | | | | | | | | | | | | | | | | | | | | | | | | | | | | | | | |
Tilman Todenhöfer | | | 120,000 | | | | – | | | | 12,000 | | | | 132,000 | | | | 120,000 | | | | 14,400 | | | | 11,000 | | | | 145,400 | |
| | | | | | | | | | | | | | | | | | | | | | | | | | | | | | | | |
Prof. Dr. Klaus Rüdiger Trützschler1 | | | 80,000 | | | | – | | | | 7,000 | | | | 87,000 | | | | – | | | | – | | | | – | | | | – | |
| | | | | | | | | | | | | | | | | | | | | | | | | | | | | | | | |
Stefan Viertel | | | 60,000 | | | | – | | | | 6,000 | | | | 66,000 | | | | 60,000 | | | | 7,200 | | | | 6,000 | | | | 73,200 | |
| | | | | | | | | | | | | | | | | | | | | | | | | | | | | | | | |
Renate Voigt7 | | | 60,000 | | | | – | | | | 6,000 | | | | 66,000 | | | | 10,000 | | | | 1,200 | | | | – | | | | 11,200 | |
| | | | | | | | | | | | | | | | | | | | | | | | | | | | | | | | |
Werner Wenning | | | 60,000 | | | | – | | | | 6,000 | | | | 66,000 | | | | 60,000 | | | | 7,200 | | | | 6,000 | | | | 73,200 | |
| | | | | | | | | | | | | | | | | | | | | | | | | | | | | | | | |
Total | | | 2,130,000 | | | | – | | | | 205,000 | | | | 2,335,000 | | | | 2,150,000 | | | | 261,600 | | | | 197,000 | | | | 2,608,600 | |
| | | | | | | | | | | | | | | | | | | | | | | | | | | | | | | | |
| 1 | Member since May 31, 2012. |
| 2 | Member until May 31, 2012. |
| 3 | Member since May 26, 2011. |
| 4 | Member until May 26, 2011. |
| 5 | Member until October 25, 2011. |
| 6 | Member since June 1, 2012. |
| 7 | Member since November 30, 2011. |
| 8 | Variable compensation 2011 for a regular member of€ 7,200 is made up of a dividend-based amount of€ 0 and an amount of€ 7,200 linked to the long-term performance of the company. |
With the exception of Mr. Stockem, all employee-elected members of the Supervisory Board are employed by us. In addition, Dr. Börsig was employed by us as a member of the Management Board until April 2006. The aggregate compensation we and our consolidated subsidiaries paid to such members as a group during the year ended December 31, 2012 for their services as employees or status as former employees (retirement, pension and deferred compensation) was€ 1.6 million.
We do not provide the members of the Supervisory Board with any benefits upon termination of their service on the Supervisory Board, though members who are or were employed by us are entitled to the benefits associated with their termination of such employment. During 2012, we set aside€ 0.08 million for pension, retirement or similar benefits for the members of the Supervisory Board who are or were employed by us.
| | | | |
| Deutsche Bank | | 01 – Management Report | | 226 |
| Financial Report 2012 | | Corporate Responsibility | | |
| | |
| | | | |
| | |
| | | | |
[Page intentionally left blank for SEC filing purposes]
| | | | |
| Deutsche Bank | | 01 – Management Report | | 227 |
| Financial Report 2012 | | Corporate Responsibility | | |
| | |
| | | | |
| | |
| | | | |
[Page intentionally left blank for SEC filing purposes]
| | | | |
| Deutsche Bank | | 01 – Management Report | | 228 |
| Financial Report 2012 | | Employees | | |
| | |
| | | | |
| | |
| | | | |
Employees
As of December 31, 2012 we employed a total of 98,219 staff members as compared to 100,996 as of December 31, 2011. We calculate our employee figures on a full-time equivalent basis, meaning we include proportionate numbers of part-time employees.
The following table shows our numbers of full-time equivalent employees as of December 31, 2012, 2011 and 2010.
| | | | | | | | | | | | |
Employees1 | | Dec 31, 2012 | | | Dec 31, 2011 | | | Dec 31, 2010 | |
Germany | | | 46,308 | | | | 47,323 | | | | 49,265 | |
| | | | | | | | | | | | |
Europe (outside Germany), Middle East and Africa | | | 23,873 | | | | 24,187 | | | | 23,806 | |
| | | | | | | | | | | | |
Asia/Pacific | | | 17,709 | | | | 18,351 | | | | 17,779 | |
| | | | | | | | | | | | |
North America2,3 | | | 9,787 | | | | 10,610 | | | | 10,722 | |
| | | | | | | | | | | | |
Latin America | | | 542 | | | | 525 | | | | 490 | |
| | | | | | | | | | | | |
Total employees3 | | | 98,219 | | | | 100,996 | | | | 102,062 | |
| |
| 1 | Full-time equivalent employees; in 2012, the employees of Mexico previously shown in North America were assigned to Latin America; numbers for 2011 (90 employees) and 2010 (89 employees) have been reclassified to reflect this. In 2012, the change of FTE definition regarding “Mobile Sales Forces” in India resulted in a decrease of 300 (status as of December 31, 2011, prior periods not restated); in 2011, Deutsche Postbank aligned its FTE definition to Deutsche Bank which reduced the Group number as of December 31, 2011 by 260 (prior periods not restated). In 2011, 257 FTE of Sal Oppenheim Germany have been assigned directly to Austria, Luxembourg and Switzerland (Europe outside Germany). |
| 2 | Primarily the United States. |
| 3 | The nominal headcount of The Cosmopolitan of Las Vegas is 4,371 as of December 31, 2012 compared to 4,256 as of December 31, 2011 and compared to 4,147 as of December 31, 2010. The headcount number is composed of full time and part time employees and is not part of the full time equivalent employees figures. |
The number of our employees decreased in 2012 by 2,777 or 2.7 % due to the following factors:
| — | | The number of staff in Corporate Banking & Securities decreased by 1,390 primarily due to tough markets and as a result of the measures initiated in the third quarter 2012. |
| — | | In Global Transaction Banking, the number of employees remained almost on the 2011 level. |
| — | | The number of our staff in Asset & Wealth Management decreased by 473 due to market development and the integration of Asset Management and Wealth Management. |
| — | | The number of Private & Business Clients staff declined by 1,073 mainly due to further progress made with the integration of Deutsche Postbank. |
| — | | The number of staff in areas assigned to the Non-Core Operations Unit declined by 326. |
| — | | In our Infrastructure operations, employee headcount increased by 398 primarily due to regulatory requirements and the further build out of our service centers. |
| | | | |
| Deutsche Bank | | 01 – Management Report | | 229 |
| Financial Report 2012 | | Employees | | |
| | |
| | | | |
| | |
| | | | |
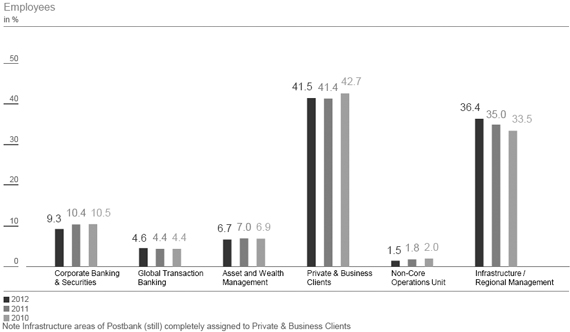
Labor Relations
In Germany, labor unions and employers’ associations generally negotiate collective bargaining agreements on salaries and benefits for employees below the management level. Many companies in Germany, including ourselves and our material German subsidiaries, are members of employers’ associations and are bound by collective bargaining agreements.
Each year, our employers’ association, the Arbeitgeberverband des privaten Bankgewerbes e.V., ordinarily renegotiates the collective bargaining agreements that cover many of our employees. The current agreement reached in June 2012 includes a single payment of€ 350 in June 2012 (apprentices€ 100) and a pay raise of 2.9 % from July 2012 and a second pay rise of 2.5 % from June 2013 on. The agreement so far terminates on April 30, 2014. Also concluded by the agreement are a declaration on the importance of health protection measures in companies, a commitment for starting negotiations on an extension of the early retirement agreement and a commitment for starting negotiations on new rules for work on Saturdays in 2012/2013, which should be finished before renegotiations of this agreement will start in 2014.
| | | | |
| Deutsche Bank | | 01 – Management Report | | 230 |
| Financial Report 2012 | | Employees | | |
| | |
| | | | |
| | |
| | | | |
Our employers’ association negotiates with the following unions:
| — | | ver.di (Vereinigte Dienstleistungsgewerkschaft), a union formed in July 2001 resulting from the merger of five unions, including the former bank unions Deutsche Angestellten Gewerkschaft and Gewerkschaft Handel, Banken und Versicherungen |
| — | | Deutscher Bankangestellten Verband (DBV – Gewerkschaft der Finanzdienstleister) |
| — | | Deutscher Handels- und Industrieangestellten Verband (DHV – Die Berufsgewerkschaft) |
| — | | Komba Gewerkschaft (public service union, only relevant for Postbank) |
| — | | DPVKom – Die Kommunikationsgewerkschaft (only relevant for Postbank) |
German law prohibits us from asking our employees whether they are members of labor unions. Therefore, we do not know how many of our employees are union members. Approximately 15 % of the employees in the German banking industry are unionized. We estimate that less than 15 % of our employees in Germany are unionized (excluding Postbank, which itself has traditionally had a significantly higher unionization rate of approximately 60 %). On a worldwide basis, we estimate that approximately 15 % of our employees are members of labor unions (including Postbank, less than 25 %).
As of December 31, 2012, approximately 33 % of Postbank staff members are civil servants.
Post-Employment Benefit Plans
We sponsor a number of post-employment benefit plans on behalf of our employees, both defined contribution plans and defined benefit plans.
In our globally coordinated accounting process covering defined benefit plans with a defined benefit obligation exceeding€ 2 million our global actuary reviews the valuations provided by locally appointed actuaries in each country.
By applying our global principles for determining the financial and demographic assumptions we ensure that the assumptions are unbiased and mutually compatible and that they follow the best estimate and ongoing plan principles.
For a further discussion on our employee benefit plans see Note 34 “Employee Benefits” to our consolidated financial statements.
| | | | |
| Deutsche Bank | | 01 – Management Report | | 231 |
| Financial Report 2012 | | Employees | | |
| | |
| | | | |
| | |
| | | | |
[Page intentionally left blank for SEC filing purposes]
| | | | |
| Deutsche Bank | | 01 – Management Report | | 232 |
| Financial Report 2012 | | Employees | | |
| | |
| | | | |
| | |
| | | | |
[Page intentionally left blank for SEC filing purposes]
| | | | |
| Deutsche Bank | | 01 – Management Report | | 233 |
| Financial Report 2012 | | Outlook | | |
| | |
| | | | |
| | |
| | | | |
[Page intentionally left blank for SEC filing purposes]
| | | | |
| Deutsche Bank | | 01 – Management Report | | 234 |
| Financial Report 2012 | | Outlook | | |
| | |
| | | | |
| | |
| | | | |
[Page intentionally left blank for SEC filing purposes]
| | | | |
| Deutsche Bank | | 01 – Management Report | | 235 |
| Financial Report 2012 | | Outlook | | |
| | |
| | | | |
| | |
| | | | |
[Page intentionally left blank for SEC filing purposes]
| | | | |
| Deutsche Bank | | 01 – Management Report | | 236 |
| Financial Report 2012 | | Outlook | | |
| | |
| | | | |
| | |
| | | | |
[Page intentionally left blank for SEC filing purposes]
| | | | |
| Deutsche Bank | | 01 – Management Report | | 237 |
| Financial Report 2012 | | Outlook | | |
| | |
| | | | |
| | |
| | | | |
[Page intentionally left blank for SEC filing purposes]
| | | | |
| Deutsche Bank | | 01 – Management Report | | 238 |
| Financial Report 2012 | | Outlook | | |
| | |
| | | | |
| | |
| | | | |
[Page intentionally left blank for SEC filing purposes]
| | | | |
| Deutsche Bank | | 01 – Management Report | | 239 |
| Financial Report 2012 | | Outlook | | |
| | |
| | | | |
| | |
| | | | |
[Page intentionally left blank for SEC filing purposes]
| | | | |
| Deutsche Bank | | 01 – Management Report | | 240 |
| Financial Report 2012 | | Outlook | | |
| | |
| | | | |
| | |
| | | | |
[Page intentionally left blank for SEC filing purposes]
| | | | |
| Deutsche Bank | | 01 – Management Report | | 241 |
| Financial Report 2012 | | Outlook | | |
| | |
| | | | |
| | |
| | | | |
[Page intentionally left blank for SEC filing purposes]
02 –
Consolidated Financial Statements
| | | | |
| Deutsche Bank | | 02 – Consolidated Financial Statements | | 243 |
| Financial Report 2012 | | Consolidated Statement of Income | | |
| | |
| | | | |
| | |
| | | | |
Consolidated Statement of Income
| | | | | | | | | | | | | | | | |
| in€ m. | | Notes | | | 2012 | | | 2011 | | | 2010 | |
| | | | | | | | | | | | | | | | |
Interest and similar income | | | 6 | | | | 32,242 | | | | 34,878 | | | | 28,779 | |
| | | | | | | | | | | | | | | | |
Interest expense | | | 6 | | | | 16,351 | | | | 17,433 | | | | 13,196 | |
| | | | | | | | | | | | | | | | |
Net interest income | | | 6 | | | | 15,891 | | | | 17,445 | | | | 15,583 | |
| | | | | | | | | | | | | | | | |
Provision for credit losses | | | 20 | | | | 1,721 | | | | 1,839 | | | | 1,274 | |
| | | | | | | | | | | | | | | | |
Net interest income after provision for credit losses | | | | | | | 14,170 | | | | 15,606 | | | | 14,309 | |
| | | | | | | | | | | | | | | | |
Commissions and fee income | | | 7 | | | | 11,510 | | | | 11,544 | | | | 10,669 | |
| | | | | | | | | | | | | | | | |
Net gains on financial assets/liabilities at fair value through profit or loss | | | 6 | | | | 5,599 | | | | 3,058 | | | | 3,354 | |
| | | | | | | | | | | | | | | | |
Net gains (losses) on financial assets available for sale | | | 8 | | | | 301 | | | | 123 | | | | 201 | |
| | | | | | | | | | | | | | | | |
Net income (loss) from equity method investments | | | 18 | | | | 159 | | | | (264) | | | | (2,004) | |
| | | | | | | | | | | | | | | | |
Other income (loss) | | | 9 | | | | 281 | | | | 1,322 | | | | 764 | |
| | | | | | | | | �� | | | | | | | |
Total noninterest income | | | | | | | 17,850 | | | | 15,783 | | | | 12,984 | |
| | | | | | | | | | | | | | | | |
Compensation and benefits | | | 34 | | | | 13,526 | | | | 13,135 | | | | 12,671 | |
| | | | | | | | | | | | | | | | |
General and administrative expenses | | | 10 | | | | 15,016 | | | | 12,657 | | | | 10,133 | |
| | | | | | | | | | | | | | | | |
Policyholder benefits and claims | | | | | | | 414 | | | | 207 | | | | 485 | |
| | | | | | | | | | | | | | | | |
Impairment of intangible assets | | | 25 | | | | 1,886 | | | | – | | | | 29 | |
| | | | | | | | | | | | | | | | |
Restructuring activities | | | 11 | | | | 394 | | | | – | | | | – | |
| | | | | | | | | | | | | | | | |
Total noninterest expenses | | | | | | | 31,236 | | | | 25,999 | | | | 23,318 | |
| | | | | | | | | | | | | | | | |
Income before income taxes | | | | | | | 784 | | | | 5,390 | | | | 3,975 | |
| | | | | | | | | | | | | | | | |
Income tax expense | | | 35 | | | | 493 | | | | 1,064 | | | | 1,645 | |
| | | | | | | | | | | | | | | | |
Net income | | | | | | | 291 | | | | 4,326 | | | | 2,330 | |
| | | | | | | | | | | | | | | | |
Net income attributable to noncontrolling interests | | | | | | | 54 | | | | 194 | | | | 20 | |
| | | | | | | | | | | | | | | | |
Net income attributable to Deutsche Bank shareholders | | | | | | | 237 | | | | 4,132 | | | | 2,310 | |
| |
Earnings per Share
| | | | | | | | | | | | | | | | |
| in€ | | Notes | | | 2012 | | | 2011 | | | 2010 | |
| | | | | | | | | | | | | | | | |
Earnings per share:1 | | | 12 | | | | | | | | | | | | | |
| | | | | | | | | | | | | | | | |
Basic | | | | | | € | 0.25 | | | € | 4.45 | | | € | 3.07 | |
| | | | | | | | | | | | | | | | |
Diluted2 | | | | | | € | 0.25 | | | € | 4.30 | | | € | 2.92 | |
| | | | | | | | | | | | | | | | |
Number of shares in million:1 | | | | | | | | | | | | | | | | |
| | | | | | | | | | | | | | | | |
Denominator for basic earnings per share – weighted-average shares outstanding | | | | | | | 934.1 | | | | 928.0 | | | | 753.3 | |
| | | | | | | | | | | | | | | | |
Denominator for diluted earnings per share – adjusted weighted-average shares after assumed conversions | | | | | | | 959.9 | | | | 957.3 | | | | 790.8 | |
| |
| 1 | The number of average basic and diluted shares outstanding has been adjusted for all periods before October 6, 2010 to reflect the effect of the bonus element of the subscription rights issue in connection with the capital increase. |
| 2 | Includes numerator effect of assumed conversions. For further detail please see Note 12 “Earnings per Share”. |
The accompanying notes are an integral part of the Consolidated Financial Statements.
| | | | |
| Deutsche Bank | | 02 – Consolidated Financial Statements | | 244 |
| Financial Report 2012 | | Consolidated Statement of Comprehensive Income | | |
| | |
| | | | |
| | |
| | | | |
Consolidated Statement of Comprehensive Income
| | | | | | | | | | | | |
| in€ m. | | 2012 | | | 2011 | | | 2010 | |
| | | | | | | | | | | | |
Net income recognized in the income statement | | | 291 | | | | 4,326 | | | | 2,330 | |
| | | | | | | | | | | | |
Other comprehensive income | | | | | | | | | | | | |
| | | | | | | | | | | | |
Actuarial gains (losses) related to defined benefit plans, before tax1 | | | (854) | | | | 707 | | | | 135 | |
| | | | | | | | | | | | |
Unrealized net gains (losses) on financial assets available for sale:2 | | | | | | | | | | | | |
Unrealized net gains (losses) arising during the period, before tax | | | 1,875 | | | | (697) | | | | 83 | |
Net (gains) losses reclassified to profit or loss, before tax | | | (162) | | | | (11) | | | | 39 | |
| | | | | | | | | | | | |
Unrealized net gains (losses) on derivatives hedging variability of cash flows:2 | | | | | | | | | | | | |
Unrealized net gains (losses) arising during the period, before tax | | | 42 | | | | (141) | | | | (78) | |
Net (gains) losses reclassified to profit or loss, before tax | | | 45 | | | | 3 | | | | 4 | |
| | | | | | | | | | | | |
Unrealized net gains (losses) on assets classified as held for sale, before tax3 | | | — | | | | 25 | | | | (25) | |
| | | | | | | | | | | | |
Foreign currency translation:2 | | | | | | | | | | | | |
Unrealized net gains (losses) arising during the period, before tax | | | (534) | | | | 1,291 | | | | 920 | |
Net (gains) losses reclassified to profit or loss, before tax | | | 5 | | | | — | | | | (6) | |
| | | | | | | | | | | | |
Unrealized net gains (losses) from equity method investments | | | (38) | | | | (5) | | | | (26) | |
| | | | | | | | | | | | |
Tax on net gains (losses) in other comprehensive income | | | (47) | | | | 75 | | | | 211 | |
| | | | | | | | | | | | |
Other comprehensive income, net of tax | | | 332 | | | | 1,247 | | | | 1,257 | |
| | | | | | | | | | | | |
Total comprehensive income, net of tax | | | 623 | | | | 5,573 | | | | 3,587 | |
| | | | | | | | | | | | |
Attributable to: | | | | | | | | | | | | |
Noncontrolling interests | | | 149 | | | | 155 | | | | 4 | |
Deutsche Bank shareholders | | | 474 | | | | 5,418 | | | | 3,583 | |
| |
| 1 | In the Consolidated Statement of Comprehensive Income, actuarial gains (losses) related to defined benefit plans, before tax are disclosed within other comprehensive income (loss) starting 2011. The corresponding deferred taxes are included in the position tax on net gains (losses) in other comprehensive income. The prior periods were adjusted accordingly. In the Consolidated Balance Sheet, actuarial gains (losses) related to defined benefit plans, net of tax, are recognized in retained earnings. |
| 2 | Excluding unrealized net gains (losses) from equity method investments. |
| 3 | Please refer to Note 26 “Non-current Assets and Disposal Groups Held for Sale” for additional information. |
The accompanying notes are an integral part of the Consolidated Financial Statements.
| | | | |
| Deutsche Bank | | 02 – Consolidated Financial Statements | | 245 |
| Financial Report 2012 | | Consolidated Balance Sheet | | |
| | |
| | | | |
| | |
| | | | |
Consolidated Balance Sheet
| | | | | | | | | | | | |
in€ m. | | Notes | | | Dec 31, 2012 | | | Dec 31, 2011 | |
Assets: | | | | | | | | | | | | |
| | | | | | | | | | | | |
Cash and due from banks | | | | | | | 27,885 | | | | 15,928 | |
| | | | | | | | | | | | |
Interest-earning deposits with banks | | | | | | | 119,548 | | | | 162,000 | |
| | | | | | | | | | | | |
Central bank funds sold and securities purchased under resale agreements | | | 21, 22 | | | | 36,570 | | | | 25,773 | |
| | | | | | | | | | | | |
Securities borrowed | | | 21, 22 | | | | 23,947 | | | | 31,337 | |
| | | | | | | | | | | | |
Financial assets at fair value through profit or loss | | | | | | | | | | | | |
Trading assets | | | | | | | 245,538 | | | | 240,924 | |
Positive market values from derivative financial instruments | | | | | | | 768,316 | | | | 859,582 | |
Financial assets designated at fair value through profit or loss | | | | | | | 187,027 | | | | 180,293 | |
| | | | | | | | | | | | |
Total financial assets at fair value through profit or loss of which€ 89 billion and€ 87 billion were pledged to creditors and can be sold or repledged at December 31, 2012, and 2011, respectively | | | 13, 15, 21, 22, 36 | | | | 1,200,881 | | | | 1,280,799 | |
| | | | | | | | | | | | |
Financial assets available for sale of which€ 0 billion and€ 9 billion were pledged to creditors and can be sold or repledged at December 31, 2012, and 2011, respectively | | | 17, 21, 22 | | | | 49,379 | | | | 45,281 | |
| | | | | | | | | | | | |
Equity method investments | | | 18 | | | | 3,577 | | | | 3,759 | |
| | | | | | | | | | | | |
Loans of which€ 2 billion and€ 3 billion were pledged to creditors and can be sold or repledged each year ending December 31, 2012 and 2011, respectively | | | 19, 20, 21, 22 | | | | 397,279 | | | | 412,514 | |
| | | | | | | | | | | | |
Property and equipment | | | 23 | | | | 4,963 | | | | 5,509 | |
| | | | | | | | | | | | |
Goodwill and other intangible assets | | | 25 | | | | 14,219 | | | | 15,802 | |
| | | | | | | | | | | | |
Other assets | | | 26, 27 | | | | 123,973 | | | | 154,794 | |
| | | | | | | | | | | | |
Assets for current tax | | | 35 | | | | 2,390 | | | | 1,870 | |
| | | | | | | | | | | | |
Deferred tax assets | | | 35 | | | | 7,718 | | | | 8,737 | |
| | | | | | | | | | | | |
Total assets | | | | | | | 2,012,329 | | | | 2,164,103 | |
| | | | | | | | | | | | |
| | | | | | | | | | | | |
| | | | | | | | | | | | |
Liabilities and equity: | | | | | | | | | | | | |
| | | | | | | | | | | | |
Deposits | | | 28 | | | | 577,202 | | | | 601,730 | |
| | | | | | | | | | | | |
Central bank funds purchased and securities sold under repurchase agreements | | | 21, 22 | | | | 36,144 | | | | 35,311 | |
| | | | | | | | | | | | |
Securities loaned | | | 21, 22 | | | | 3,109 | | | | 8,089 | |
| | | | | | | | | | | | |
Financial liabilities at fair value through profit or loss | | | 13, 15, 36 | | | | | | | | | |
Trading liabilities | | | | | | | 54,914 | | | | 63,886 | |
Negative market values from derivative financial instruments | | | | | | | 752,706 | | | | 838,817 | |
Financial liabilities designated at fair value through profit or loss | | | | | | | 109,166 | | | | 118,318 | |
Investment contract liabilities | | | | | | | 7,732 | | | | 7,426 | |
| | | | | | | | | | | | |
Total financial liabilities at fair value through profit or loss | | | | | | | 924,518 | | | | 1,028,447 | |
| | | | | | | | | | | | |
Other short-term borrowings | | | 31 | | | | 69,060 | | | | 65,356 | |
| | | | | | | | | | | | |
Other liabilities | | | 26, 27 | | | | 169,544 | | | | 187,816 | |
| | | | | | | | | | | | |
Provisions | | | 20, 29 | | | | 5,110 | | | | 2,621 | |
| | | | | | | | | | | | |
Liabilities for current tax | | | 35 | | | | 1,589 | | | | 2,524 | |
| | | | | | | | | | | | |
Deferred tax liabilities | | | 35 | | | | 1,455 | | | | 1,789 | |
| | | | | | | | | | | | |
Long-term debt | | | 32 | | | | 158,097 | | | | 163,416 | |
| | | | | | | | | | | | |
Trust preferred securities | | | 32 | | | | 12,091 | | | | 12,344 | |
| | | | | | | | | | | | |
Total liabilities | | | | | | | 1,957,919 | | | | 2,109,443 | |
| | | | | | | | | | | | |
Common shares, no par value, nominal value of€ 2.56 | | | 33 | | | | 2,380 | | | | 2,380 | |
| | | | | | | | | | | | |
Additional paid-in capital | | | | | | | 23,778 | | | | 23,695 | |
| | | | | | | | | | | | |
Retained earnings | | | | | | | 29,198 | | | | 30,119 | |
| | | | | | | | | | | | |
Common shares in treasury, at cost | | | 33 | | | | (60) | | | | (823) | |
| | | | | | | | | | | | |
Accumulated other comprehensive income, net of tax | | | | | | | (1,293) | | | | (1,981) | |
| | | | | | | | | | | | |
Total shareholders’ equity | | | | | | | 54,003 | | | | 53,390 | |
| | | | | | | | | | | | |
Noncontrolling interests | | | | | | | 407 | | | | 1,270 | |
| | | | | | | | | | | | |
Total equity | | | | | | | 54,410 | | | | 54,660 | |
| | | | | | | | | | | | |
Total liabilities and equity | | | | | | | 2,012,329 | | | | 2,164,103 | |
| |
The accompanying notes are an integral part of the Consolidated Financial Statements.
| | | | |
| Deutsche Bank | | 02 – Consolidated Financial Statements | | 246 |
| Financial Report 2012 | | Consolidated Statement of Changes in Equity | | |
Consolidated Statement of Changes in Equity
| | | | | | | | | | | | | | | | | | | | |
in€ m. | | Common shares
(no par value) | | | Additional
paid-in capital | | | Retained
earnings 1 | | | Common
shares in
treasury,
at cost | | | Equity
classified as
obligation to
purchase
common shares | |
Balance as of December 31, 2009 | | | 1,589 | | | | 14,830 | | | | 24,056 | | | | (48) | | | | – | |
| | | | | | | | | | | | | | | | | | | | |
Total comprehensive income, net of tax2 | | | – | | | | – | | | | 2,286 | | | | – | | | | – | |
| | | | | | | | | | | | | | | | | | | | |
Common shares issued | | | 791 | | | | 9,413 | | | | – | | | | – | | | | – | |
| | | | | | | | | | | | | | | | | | | | |
Cash dividends paid | | | – | | | | – | | | | (465) | | | | – | | | | – | |
| | | | | | | | | | | | | | | | | | | | |
Actuarial gains (losses) related to defined benefit plans, net of tax | | | – | | | | – | | | | 94 | | | | – | | | | – | |
| | | | | | | | | | | | | | | | | | | | |
Net change in share awards in the reporting period | | | – | | | | (296) | | | | – | | | | – | | | | – | |
| | | | | | | | | | | | | | | | | | | | |
Treasury shares distributed under share-based compensation plans | | | – | | | | – | | | | – | | | | 1,439 | | | | – | |
| | | | | | | | | | | | | | | | | | | | |
Tax benefits related to share-based compensation plans | | | – | | | | (11) | | | | – | | | | – | | | | – | |
| | | | | | | | | | | | | | | | | | | | |
Additions to Equity classified as obligation to purchase common shares | | | – | | | | – | | | | – | | | | – | | | | (93) | |
| | | | | | | | | | | | | | | | | | | | |
Deductions from Equity classified as obligation to purchase common shares | | | – | | | | – | | | | – | | | | – | | | | 93 | |
| | | | | | | | | | | | | | | | | | | | |
Option premiums and other effects from options on common shares | | | – | | | | (115) | | | | – | | | | – | | | | – | |
| | | | | | | | | | | | | | | | | | | | |
Purchases of treasury shares | | | – | | | | – | | | | – | | | | (15,366) | | | | – | |
| | | | | | | | | | | | | | | | | | | | |
Sale of treasury shares | | | – | | | | – | | | | – | | | | 13,525 | | | | – | |
| | | | | | | | | | | | | | | | | | | | |
Net gains (losses) on treasury shares sold | | | – | | | | – | | | | – | | | | – | | | | – | |
| | | | | | | | | | | | | | | | | | | | |
Other | | | – | | | | (306) | | | | 4 | | | | – | | | | – | |
| | | | | | | | | | | | | | | | | | | | |
Balance as of December 31, 2010 | | | 2,380 | | | | 23,515 | | | | 25,975 | | | | (450) | | | | – | |
| | | | | | | | | | | | | | | | | | | | |
Total comprehensive income, net of tax2 | | | – | | | | – | | | | 4,132 | | | | – | | | | – | |
| | | | | | | | | | | | | | | | | | | | |
Common shares issued | | | – | | | | – | | | | – | | | | – | | | | – | |
| | | | | | | | | | | | | | | | | | | | |
Cash dividends paid | | | – | | | | – | | | | (691) | | | | – | | | | – | |
| | | | | | | | | | | | | | | | | | | | |
Actuarial gains (losses) related to defined benefit plans, net of tax | | | – | | | | – | | | | 666 | | | | – | | | | – | |
| | | | | | | | | | | | | | | | | | | | |
Net change in share awards in the reporting period | | | – | | | | 153 | | | | – | | | | – | | | | – | |
| | | | | | | | | | | | | | | | | | | | |
Treasury shares distributed under share-based compensation plans | | | – | | | | – | | | | – | | | | 1,108 | | | | – | |
| | | | | | | | | | | | | | | | | | | | |
Tax benefits related to share-based compensation plans | | | – | | | | (76) | | | | – | | | | – | | | | – | |
| | | | | | | | | | | | | | | | | | | | |
Additions to Equity classified as obligation to purchase common shares | | | – | | | | – | | | | – | | | | – | | | | – | |
| | | | | | | | | | | | | | | | | | | | |
Deductions from Equity classified as obligation to purchase common shares | | | – | | | | – | | | | – | | | | – | | | | – | |
| | | | | | | | | | | | | | | | | | | | |
Option premiums and other effects from options on common shares | | | – | | | | (131) | | | | – | | | | – | | | | – | |
| | | | | | | | | | | | | | | | | | | | |
Purchases of treasury shares | | | – | | | | – | | | | – | | | | (13,781) | | | | – | |
| | | | | | | | | | | | | | | | | | | | |
Sale of treasury shares | | | – | | | | – | | | | – | | | | 12,300 | | | | – | |
| | | | | | | | | | | | | | | | | | | | |
Net gains (losses) on treasury shares sold | | | – | | | | (32) | | | | – | | | | – | | | | – | |
| | | | | | | | | | | | | | | | | | | | |
Other | | | – | | | | 266 | | | | 37 | | | | – | | | | – | |
| | | | | | | | | | | | | | | | | | | | |
Balance as of December 31, 2011 | | | 2,380 | | | | 23,695 | | | | 30,119 | | | | (823) | | | | – | |
| | | | | | | | | | | | | | | | | | | | |
Total comprehensive income, net of tax2 | | | – | | | | – | | | | 237 | | | | – | | | | – | |
| | | | | | | | | | | | | | | | | | | | |
Common shares issued | | | – | | | | – | | | | – | | | | – | | | | – | |
| | | | | | | | | | | | | | | | | | | | |
Cash dividends paid | | | – | | | | – | | | | (689) | | | | – | | | | – | |
| | | | | | | | | | | | | | | | | | | | |
Actuarial gains (losses) related to defined benefit plans, net of tax | | | – | | | | – | | | | (452) | | | | – | | | | – | |
| | | | | | | | | | | | | | | | | | | | |
Net change in share awards in the reporting period | | | – | | | | (342) | | | | – | | | | – | | | | – | |
| | | | | | | | | | | | | | | | | | | | |
Treasury shares distributed under share-based compensation plans | | | – | | | | – | | | | – | | | | 1,481 | | | | – | |
| | | | | | | | | | | | | | | | | | | | |
Tax benefits related to share-based compensation plans | | | – | | | | 2 | | | | – | | | | – | | | | – | |
| | | | | | | | | | | | | | | | | | | | |
Additions to Equity classified as obligation to purchase common shares | | | – | | | | – | | | | – | | | | – | | | | (4) | |
| | | | | | | | | | | | | | | | | | | | |
Deductions from Equity classified as obligation to purchase common shares | | | – | | | | – | | | | – | | | | – | | | | 4 | |
| | | | | | | | | | | | | | | | | | | | |
Option premiums and other effects from options on common shares | | | – | | | | (63) | | | | – | | | | – | | | | – | |
| | | | | | | | | | | | | | | | | | | | |
Purchases of treasury shares | | | – | | | | – | | | | – | | | | (12,152) | | | | – | |
| | | | | | | | | | | | | | | | | | | | |
Sale of treasury shares | | | – | | | | – | | | | – | | | | 11,434 | | | | – | |
| | | | | | | | | | | | | | | | | | | | |
Net gains (losses) on treasury shares sold | | | – | | | | 77 | | | | – | | | | – | | | | – | |
| | | | | | | | | | | | | | | | | | | | |
Other | | | – | | | | 409 | | | | (17) | | | | – | | | | – | |
| | | | | | | | | | | | | | | | | | | | |
Balance as of December 31, 2012 | | | 2,380 | | | | 23,778 | | | | 29,198 | | | | (60) | | | | – | |
| |
| 1 | The initial acquisition accounting for ABN AMRO, which was finalized at March 31, 2011, resulted in a retrospective adjustment of retained earnings of€ (24) million for December 31, 2010. |
| 2 | Excluding actuarial gains (losses) related to defined benefit plans, net of tax. |
| | | | |
| Deutsche Bank | | 02 – Consolidated Financial Statements | | 247 |
| Financial Report 2012 | | Consolidated Statement of Changes in Equity | | |
| | | | | | | | | | | | | | | | | | | | | | | | | | | | | | | | | | | | |
| Unrealized net
gains (losses) onfinancial assets available for sale,net ofapplicable tax and other |
3 | |
| Unrealized net
gains (losses)
on derivatives hedging
variability of cash flows, net of tax |
3 | |
| Unrealized net
gains (losses)
on assets
classified as held for sale, net of tax |
| |
| Foreign
currency translation, netof
tax |
3 | |
| Unrealized net
gains (losses) from equity method investments |
| |
| Accumulated
other comprehensive income,
net of tax |
2 | |
| Total
shareholders’ equity |
| |
| Noncontrolling
interests |
| | | Total equity | | | |
| | (186) | | | | (134) | | | | – | | | | (3,521) | | | | 61 | | | | (3,780) | | | | 36,647 | | | | 1,322 | | | | 37,969 | | | |
| | | | | | | | | | | | | | | | | | | | | | | | | | | | | | | | | | | | |
| | 73 | | | | (45) | | | | (11) | | | | 1,188 | | | | (26) | | | | 1,179 | | | | 3,465 | | | | (8) | | | | 3,457 | | | |
| | | | | | | | | | | | | | | | | | | | | | | | | | | | | | | | | | | | |
| | – | | | | – | | | | – | | | | – | | | | – | | | | – | | | | 10,204 | | | | – | | | | 10,204 | | | |
| | | | | | | | | | | | | | | | | | | | | | | | | | | | | | | | | | | | |
| | – | | | | – | | | | – | | | | – | | | | – | | | | – | | | | (465) | | | | – | | | | (465) | | | |
| | | | | | | | | | | | | | | | | | | | | | | | | | | | | | | | | | | | |
| | – | | | | – | | | | – | | | | – | | | | – | | | | – | | | | 94 | | | | 12 | | | | 106 | | | |
| | | | | | | | | | | | | | | | | | | | | | | | | | | | | | | | | | | | |
| | – | | | | – | | | | – | | | | – | | | | – | | | | – | | | | (296) | | | | – | | | | (296) | | | |
| | | | | | | | | | | | | | | | | | | | | | | | | | | | | | | | | | | | |
| | – | | | | – | | | | – | | | | – | | | | – | | | | – | | | | 1,439 | | | | – | | | | 1,439 | | | |
| | | | | | | | | | | | | | | | | | | | | | | | | | | | | | | | | | | | |
| | – | | | | – | | | | – | | | | – | | | | – | | | | – | | | | (11) | | | | – | | | | (11) | | | |
| | | | | | | | | | | | | | | | | | | | | | | | | | | | | | | | | | | | |
| | – | | | | – | | | | – | | | | – | | | | – | | | | – | | | | (93) | | | | – | | | | (93) | | | |
| | | | | | | | | | | | | | | | | | | | | | | | | | | | | | | | | | | | |
| | – | | | | – | | | | – | | | | – | | | | – | | | | – | | | | 93 | | | | – | | | | 93 | | | |
| | | | | | | | | | | | | | | | | | | | | | | | | | | | | | | | | | | | |
| | – | | | | – | | | | – | | | | – | | | | – | | | | – | | | | (115) | | | | – | | | | (115) | | | |
| | | | | | | | | | | | | | | | | | | | | | | | | | | | | | | | | | | | |
| | – | | | | – | | | | – | | | | – | | | | – | | | | – | | | | (15,366) | | | | – | | | | (15,366) | | | |
| | | | | | | | | | | | | | | | | | | | | | | | | | | | | | | | | | | | |
| | – | | | | – | | | | – | | | | – | | | | – | | | | – | | | | 13,525 | | | | – | | | | 13,525 | | | |
| | | | | | | | | | | | | | | | | | | | | | | | | | | | | | | | | | | | |
| | – | | | | – | | | | – | | | | – | | | | – | | | | – | | | | – | | | | – | | | | – | | | |
| | | | | | | | | | | | | | | | | | | | | | | | | | | | | | | | | | | | |
| | – | | | | – | | | | – | | | | – | | | | – | | | | – | | | | (302) | | | | 223 | | | | (79) | | | |
| | | | | | | | | | | | | | | | | | | | | | | | | | | | | | | | | | | | |
| | (113) | | | | (179) | | | | (11) | | | | (2,333) | | | | 35 | | | | (2,601) | | | | 48,819 | | | | 1,549 | | | | 50,368 | | | |
| | | | | | | | | | | | | | | | | | | | | | | | | | | | | | | | | | | | |
| | (504) | | | | (47) | | | | 11 | | | | 1,167 | | | | (7) | | | | 620 | | | | 4,752 | | | | 162 | | | | 4,914 | | | |
| | | | | | | | | | | | | | | | | | | | | | | | | | | | | | | | | | | | |
| | – | | | | – | | | | – | | | | – | | | | – | | | | – | | | | – | | | | – | | | | – | | | |
| | | | | | | | | | | | | | | | | | | | | | | | | | | | | | | | | | | | |
| | – | | | | – | | | | – | | | | – | | | | – | | | | – | | | | (691) | | | | – | | | | (691) | | | |
| | | | | | | | | | | | | | | | | | | | | | | | | | | | | | | | | | | | |
| | – | | | | – | | | | – | | | | – | | | | – | | | | – | | | | 666 | | | | (7) | | | | 659 | | | |
| | | | | | | | | | | | | | | | | | | | | | | | | | | | | | | | | | | | |
| | – | | | | – | | | | – | | | | – | | | | – | | | | – | | | | 153 | | | | – | | | | 153 | | | |
| | | | | | | | | | | | | | | | | | | | | | | | | | | | | | | | | | | | |
| | – | | | | – | | | | – | | | | – | | | | – | | | | – | | | | 1,108 | | | | – | | | | 1,108 | | | |
| | | | | | | | | | | | | | | | | | | | | | | | | | | | | | | | | | | | |
| | – | | | | – | | | | – | | | | – | | | | – | | | | – | | | | (76) | | | | – | | | | (76) | | | |
| | | | | | | | | | | | | | | | | | | | | | | | | | | | | | | | | | | | |
| | – | | | | – | | | | – | | | | – | | | | – | | | | – | | | | – | | | | – | | | | – | | | |
| | | | | | | | | | | | | | | | | | | | | | | | | | | | | | | | | | | | |
| | – | | | | – | | | | – | | | | – | | | | – | | | | – | | | | – | | | | – | | | | – | | | |
| | | | | | | | | | | | | | | | | | | | | | | | | | | | | | | | | | | | |
| | – | | | | – | | | | – | | | | – | | | | – | | | | – | | | | (131) | | | | – | | | | (131) | | | |
| | | | | | | | | | | | | | | | | | | | | | | | | | | | | | | | | | | | |
| | – | | | | – | | | | – | | | | – | | | | – | | | | – | | | | (13,781) | | | | – | | | | (13,781) | | | |
| | | | | | | | | | | | | | | | | | | | | | | | | | | | | | | | | | | | |
| | – | | | | – | | | | – | | | | – | | | | – | | | | – | | | | 12,300 | | | | – | | | | 12,300 | | | |
| | | | | | | | | | | | | | | | | | | | | | | | | | | | | | | | | | | | |
| | – | | | | – | | | | – | | | | – | | | | – | | | | – | | | | (32) | | | | – | | | | (32) | | | |
| | | | | | | | | | | | | | | | | | | | | | | | | | | | | | | | | | | | |
| | – | | | | – | | | | – | | | | – | | | | – | | | | – | | | | 303 | | | | (434) | | | | (131) | | | |
| | | | | | | | | | | | | | | | | | | | | | | | | | | | | | | | | | | | |
| | (617) | | | | (226) | | | | – | | | | (1,166) | | | | 28 | | | | (1,981) | | | | 53,390 | | | | 1,270 | | | | 54,660 | | | |
| | | | | | | | | | | | | | | | | | | | | | | | | | | | | | | | | | | | |
| | 1,082 | | | | 67 | | | | – | | | | (423) | | | | (38) | | | | 688 | | | | 925 | | | | 153 | | | | 1,078 | | | |
| | | | | | | | | | | | | | | | | | | | | | | | | | | | | | | | | | | | |
| | – | | | | – | | | | – | | | | – | | | | – | | | | – | | | | – | | | | – | | | | – | | | |
| | | | | | | | | | | | | | | | | | | | | | | | | | | | | | | | | | | | |
| | – | | | | – | | | | – | | | | – | | | | – | | | | – | | | | (689) | | | | (5) | | | | (694) | | | |
| | | | | | | | | | | | | | | | | | | | | | | | | | | | | | | | | | | | |
| | – | | | | – | | | | – | | | | – | | | | – | | | | – | | | | (452) | | | | (4) | | | | (456) | | | |
| | | | | | | | | | | | | | | | | | | | | | | | | | | | | | | | | | | | |
| | – | | | | – | | | | – | | | | – | | | | – | | | | – | | | | (342) | | | | – | | | | (342) | | | |
| | | | | | | | | | | | | | | | | | | | | | | | | | | | | | | | | | | | |
| | – | | | | – | | | | – | | | | – | | | | – | | | | – | | | | 1,481 | | | | – | | | | 1,481 | | | |
| | | | | | | | | | | | | | | | | | | | | | | | | | | | | | | | | | | | |
| | – | | | | – | | | | – | | | | – | | | | – | | | | – | | | | 2 | | | | – | | | | 2 | | | |
| | | | | | | | | | | | | | | | | | | | | | | | | | | | | | | | | | | | |
| | – | | | | – | | | | – | | | | – | | | | – | | | | – | | | | (4) | | | | – | | | | (4) | | | |
| | | | | | | | | | | | | | | | | | | | | | | | | | | | | | | | | | | | |
| | – | | | | – | | | | – | | | | – | | | | – | | | | – | | | | 4 | | | | – | | | | 4 | | | |
| | | | | | | | | | | | | | | | | | | | | | | | | | | | | | | | | | | | |
| | – | | | | – | | | | – | | | | – | | | | – | | | | – | | | | (63) | | | | – | | | | (63) | | | |
| | | | | | | | | | | | | | | | | | | | | | | | | | | | | | | | | | | | |
| | – | | | | – | | | | – | | | | – | | | | – | | | | – | | | | (12,152) | | | | – | | | | (12,152) | | | |
| | | | | | | | | | | | | | | | | | | | | | | | | | | | | | | | | | | | |
| | – | | | | – | | | | – | | | | – | | | | – | | | | – | | | | 11,434 | | | | – | | | | 11,434 | | | |
| | | | | | | | | | | | | | | | | | | | | | | | | | | | | | | | | | | | |
| | – | | | | – | | | | – | | | | – | | | | – | | | | – | | | | 77 | | | | – | | | | 77 | | | |
| | | | | | | | | | | | | | | | | | | | | | | | | | | | | | | | | | | | |
| | – | | | | – | | | | – | | | | – | | | | – | | | | – | | | | 392 | | | | (1,007) | | | | (615) | | | |
| | | | | | | | | | | | | | | | | | | | | | | | | | | | | | | | | | | | |
| | 465 | | | | (159) | | | | – | | | | (1,589) | | | | (10) | | | | (1,293) | | | | 54,003 | | | | 407 | | | | 54,410 | | | |
| | | | |
| 3 | Excluding unrealized net gains (losses) from equity method investments. |
The accompanying notes are an integral part of the Consolidated Financial Statements.
| | | | |
| Deutsche Bank | | 02 – Consolidated Financial Statements | | 248 |
| Financial Report 2012 | | Consolidated Statement of Cash Flows | | |
| | |
| | | | |
| | |
| | | | |
Consolidated Statement of Cash Flows
| | | | | | | | | | | | |
in€ m. | | 2012 | | | 2011 | | | 2010 | |
Net income | | | 291 | | | | 4,326 | | | | 2,330 | |
| | | | | | | | | | | | |
Cash flows from operating activities: | | | | | | | | | | | | |
Adjustments to reconcile net income to net cash provided by (used in) operating activities: | | | | | | | | | | | | |
Provision for credit losses | | | 1,721 | | | | 1,839 | | | | 1,274 | |
Restructuring activities | | | 394 | | | | – | | | | – | |
Gain on sale of financial assets available for sale, equity method investments, and other | | | (626) | | | | (841) | | | | (363) | |
Deferred income taxes, net | | | 720 | | | | (387) | | | | 315 | |
Impairment, depreciation and other amortization, and accretion | | | 3,235 | | | | 3,697 | | | | 4,255 | |
Share of net income from equity method investments | | | (397) | | | | (222) | | | | (457) | |
| | | | | | | | | | | | |
Income adjusted for noncash charges, credits and other items | | | 5,338 | | | | 8,412 | | | | 7,354 | |
| | | | | | | | | | | | |
Adjustments for net change in operating assets and liabilities: | | | | | | | | | | | | |
Interest-earning time deposits with banks | | | 1,279 | | | | (53,427) | | | | (34,806) | |
Central bank funds sold, securities purchased under resale agreements, securities borrowed | | | (3,393) | | | | (8,202) | | | | 26,368 | |
Financial assets designated at fair value through profit or loss | | | (6,561) | | | | (11,582) | | | | (24,502) | |
Loans | | | 11,715 | | | | (7,092) | | | | (2,823) | |
Other assets | | | 32,254 | | | | (17,962) | | | | (5,894) | |
Deposits | | | (25,994) | | | | 66,168 | | | | 22,656 | |
Financial liabilities designated at fair value through profit or loss and investment contract liabilities | | | (9,365) | | | | (8,389) | | | | 53,450 | |
Central bank funds purchased, securities sold under repurchase agreements, securities loaned | | | (4,235) | | | | 12,622 | | | | (40,709) | |
Other short-term borrowings | | | 3,616 | | | | 1,689 | | | | 18,509 | |
Other liabilities | | | (14,017) | | | | 21,476 | | | | 2,851 | |
Senior long-term debt | | | (4,776) | | | | (5,991) | | | | (3,457) | |
Trading assets and liabilities, positive and negative market values from derivative financial instruments, net1 | | | (7,627) | | | | 10,558 | | | | (17,664) | |
Other, net | | | (2,681) | | | | (478) | | | | (5,009) | |
| | | | | | | | | | | | |
Net cash provided by (used in) operating activities | | | (24,447) | | | | 7,802 | | | | (3,676) | |
| | | | | | | | | | | | |
Cash flows from investing activities: | | | | | | | | | | | | |
Proceeds from: | | | | | | | | | | | | |
Sale of financial assets available for sale | | | 7,478 | | | | 21,948 | | | | 10,652 | |
Maturities of financial assets available for sale | | | 12,922 | | | | 10,635 | | | | 4,181 | |
Sale of equity method investments | | | 163 | | | | 336 | | | | 250 | |
Sale of property and equipment | | | 197 | | | | 101 | | | | 108 | |
Purchase of: | | | | | | | | | | | | |
Financial assets available for sale | | | (22,170) | | | | (19,606) | | | | (14,087) | |
Equity method investments | | | (14) | | | | (602) | | | | (145) | |
Property and equipment | | | (614) | | | | (794) | | | | (873) | |
Net cash received in (paid for) business combinations/divestitures | | | 96 | | | | 348 | | | | 8,580 | |
Other, net | | | (703) | | | | (451) | | | | (1,189) | |
| | | | | | | | | | | | |
Net cash provided by (used in) investing activities | | | (2,645) | | | | 11,915 | | | | 7,477 | |
| | | | | | | | | | | | |
Cash flows from financing activities: | | | | | | | | | | | | |
Issuances of subordinated long-term debt | | | 61 | | | | 76 | | | | 1,341 | |
Repayments and extinguishments of subordinated long-term debt | | | (708) | | | | (715) | | | | (229) | |
Issuances of trust preferred securities | | | 17 | | | | 37 | | | | 90 | |
Repayments and extinguishments of trust preferred securities | | | (30) | | | | (45) | | | | (51) | |
Capital increase | | | – | | | | – | | | | 10,060 | |
Purchases of treasury shares | | | (12,152) | | | | (13,781) | | | | (15,366) | |
Sale of treasury shares | | | 11,418 | | | | 12,229 | | | | 13,519 | |
Dividends paid to noncontrolling interests | | | (5) | | | | (4) | | | | (7) | |
Net change in noncontrolling interests | | | (271) | | | | (266) | | | | 200 | |
Cash dividends paid | | | (689) | | | | (691) | | | | (465) | |
| | | | | | | | | | | | |
Net cash provided by (used in) financing activities | | | (2,359) | | | | (3,160) | | | | 9,092 | |
| | | | | | | | | | | | |
Net effect of exchange rate changes on cash and cash equivalents | | | 40 | | | | (964) | | | | 1,911 | |
| | | | | | | | | | | | |
Net increase (decrease) in cash and cash equivalents | | | (29,411) | | | | 15,593 | | | | 14,804 | |
Cash and cash equivalents at beginning of period | | | 81,946 | | | | 66,353 | | | | 51,549 | |
Cash and cash equivalents at end of period | | | 52,535 | | | | 81,946 | | | | 66,353 | |
| | | | | | | | | | | | |
Net cash provided by (used in) operating activities include | | | | | | | | | | | | |
| | | | | | | | | | | | |
Income taxes paid (received), net | | | 1,280 | | | | 1,327 | | | | 784 | |
| | | | | | | | | | | | |
Interest paid | | | 16,518 | | | | 17,743 | | | | 13,740 | |
| | | | | | | | | | | | |
Interest and dividends received | | | 32,644 | | | | 35,216 | | | | 29,456 | |
| | | | | | | | | | | | |
Cash and cash equivalents comprise | | | | | | | | | | | | |
| | | | | | | | | | | | |
Cash and due from banks | | | 27,885 | | | | 15,928 | | | | 17,157 | |
| | | | | | | | | | | | |
Interest-earning demand deposits with banks (not included: time deposits of€ 94,898 m. as of December 31, 2012, and€ 95,982 m. and€ 43,181 m. as of December 31, 2011 and 2010) | | | 24,650 | | | | 66,018 | | | | 49,196 | |
| | | | | | | | | | | | |
Total | | | 52,535 | | | | 81,946 | | | | 66,353 | |
| |
| 1 | The initial acquisition accounting for ABN AMRO, which was finalized at March 31, 2011, resulted in a retrospective adjustment of retained earnings of€ (24) million for December 31, 2010. |
The accompanying notes are an integral part of the Consolidated Financial Statements.
| | | | |
| Deutsche Bank | | 02 – Consolidated Financial Statements | | 249 |
| Financial Report 2012 | | Notes to the Consolidated Financial Statements | | |
| | |
| | | | |
| | |
| | | | |
| | | | |
| Deutsche Bank | | 02 – Consolidated Financial Statements | | 250 |
| Financial Report 2012 | | Notes to the Consolidated Financial Statements 01 – Significant Accounting Policies | | |
| | |
| | | | |
| | |
| | | | |
01 –
Significant Accounting Policies
Basis of Accounting
Deutsche Bank Aktiengesellschaft (“Deutsche Bank” or the “Parent”) is a stock corporation organized under the laws of the Federal Republic of Germany. Deutsche Bank together with all entities in which Deutsche Bank has a controlling financial interest (the “Group”) is a global provider of a full range of corporate and investment banking, private clients and asset management products and services. For a discussion of the Group’s business segment information, see Note 05 “Business Segments and Related Information”.
The accompanying consolidated financial statements are stated in euros, the presentation currency of the Group. All financial information presented in million euros has been rounded to the nearest million. The consolidated financial statements have been prepared in accordance with International Financial Reporting Standards (“IFRS”) as issued by the International Accounting Standards Board (“IASB”) and endorsed by the European Union (“EU”). The Group’s application of IFRS results in no differences between IFRS as issued by the IASB and IFRS as endorsed by the EU.
Risk disclosures under IFRS 7, “Financial Instruments: Disclosures” about the nature and extent of risks arising from financial instruments are incorporated herein by reference to the portions marked by a bracket in the margins of the Risk Report. This is also applicable for capital disclosures as required under IAS 1, “Presentation of Financial Statements.
The preparation of financial statements under IFRS requires management to make estimates and assumptions for certain categories of assets and liabilities. Areas where this is required include the fair value of certain financial assets and liabilities, the reclassification of financial assets, the impairment of loans and provision for off-balance-sheet positions, the impairment of other financial assets and non-financial assets, the recognition and measurement of deferred tax assets, and the accounting for legal and regulatory contingencies and uncertain tax positions. These estimates and assumptions affect the reported amounts of assets and liabilities and disclosure of contingent assets and liabilities at the balance sheet date, and the reported amounts of revenue and expenses during the reporting period. Actual results could differ from management’s estimates. Refer to Note 02 “Critical Accounting Estimates” for a description of the critical accounting estimates and judgments used in the preparation of the financial statements.
Discount Rate for Defined Benefit Pension Plans
In 2012 the Group decided to broaden and hence stabilize the underlying bond portfolio relating to the discount rate applied in the eurozone for defined benefit pension plans by including high quality covered bonds and to refine the curve extrapolation by adjusting the underlying bond portfolio while retaining the overall AA-credit quality of the curve. The refinement resulted in an increase in the discount rate of 70 basis points and consequently reduced the actuarial losses flowing through other comprehensive income by approximately€ 700 million before tax in the year 2012.
Credit Valuation Adjustment (CVA) and Debt Valuation Adjustment (DVA)
In the fourth quarter 2012, the Group’s valuation methodology for incorporating the impact of own credit risk in the fair value of derivative contracts was refined (commonly referred to as Debt Valuation Adjustment). Previously the Group had calculated the effect of own credit risk on derivative liabilities using historic default levels. The refinement in methodology has moved DVA to a market based approach. The impact of the refinement in DVA methodology was a€ 517 million income which has been recognized in the Consolidated Statement of Income. In addition, during the fourth quarter 2012 the Group made refinements to its CVA methodology as greater transparency of the market value of counterparty credit became possible. The impact of this refinement in CVA methodology is a€ 288 million loss which has been recognized in the Consolidated Statement of Income.
| | | | |
| Deutsche Bank | | 02 – Consolidated Financial Statements | | 251 |
| Financial Report 2012 | | Notes to the Consolidated Financial Statements | | |
| | 01 – Significant Accounting Policies | | |
| | |
| | | | |
| | |
| | | | |
Valuation Approach for Collateralized Derivative Contracts
In the second quarter 2011, the Group’s valuation approach for substantially all of its collateralized derivative contracts moved to using the overnight indexed swap (OIS) curve in order to more consistently manage the interest rate and funding risks associated with collateralized derivatives in line with their pricing. This change in approach to OIS did not have a material impact on the Group’s consolidated financial statements in 2011 and 2012.
Assignment of Revenue Components in PBC
The presentation of PBC product revenues was modified in the first quarter 2011 following a review of the assignment of specific revenue components to the product components. In order to facilitate comparability, revenues of€ 73 million were transferred from credit products to deposits and payment services in 2010. This adjustment had no impact on PBC’s total revenues.
Allowance for Loan Losses
The Group applies estimates in determining the allowance for loan losses in its homogeneous loan portfolio which use statistical models based on historical experience. On a regular basis the Group performs procedures to align input parameters and model assumptions with historically evidenced loss levels. Alignment of input parameters and model assumptions in 2010 led to a lower level of provisions for credit losses of
€ 28 million in 2010. No such alignments were made in 2011 and 2012.
Significant Accounting Policies
The following is a description of the significant accounting policies of the Group. Other than as previously described, these policies have been consistently applied for 2010, 2011 and 2012.
Principles of Consolidation
The financial information in the consolidated financial statements includes that for the parent company, Deutsche Bank AG, together with its subsidiaries, including certain special purpose entities (“SPEs”), presented as a single economic unit.
Subsidiaries
The Group’s subsidiaries are those entities which it controls. The Group controls entities when it has the power to govern the financial and operating policies of the entity, generally accompanying a shareholding, either directly or indirectly, of more than one half of the voting rights. The existence and effect of potential voting rights that are currently exercisable or convertible are considered in assessing whether the Group controls an entity.
The Group sponsors the formation of SPEs and interacts with non-sponsored SPEs for a variety of reasons, including allowing clients to hold investments in separate legal entities, allowing clients to invest jointly in alternative assets; for asset securitization transactions; and for buying or selling credit protection. When assessing whether to consolidate an SPE, the Group evaluates a range of factors, including whether (1) the activities of the SPE are being conducted on behalf of the Group according to its specific business needs so that the Group obtains the benefits from the SPE’s operations, (2) the Group has decision-making powers to obtain the majority of the benefits, (3) the Group obtains the majority of the benefits of the activities of the SPE, or (4) the Group retains the majority of the residual ownership risks related to the assets in order to obtain the benefits from its activities.
The consolidation assessment considers the exposures that both the Group and third parties have in relation to the SPE via derivatives, debt and equity instruments and other instruments. The Group consolidates an SPE if an assessment of the relevant factors indicates that it controls the SPE.
Subsidiaries are consolidated from the date on which control is transferred to the Group and are no longer consolidated from the date that control ceases.
| | | | |
| Deutsche Bank | | 02 – Consolidated Financial Statements | | 252 |
| Financial Report 2012 | | Notes to the Consolidated Financial Statements | | |
| | 01 – Significant Accounting Policies | | |
| | |
| | | | |
| | |
| | | | |
The Group reassesses consolidation status at least at every quarterly reporting date. Therefore, any changes in structure are considered when they occur. This includes changes to any contractual arrangements the Group has, including those newly executed with the entity, and is not only limited to changes in ownership.
The Group reassesses its treatment of SPEs for consolidation when there is an overall change in the SPE’s arrangements or when there has been a substantive change in the relationship between the Group and an SPE. The circumstances that would indicate that a reassessment for consolidation is necessary include, but are not limited to, the following:
| — | | substantive changes in ownership of the SPE, such as the purchase of more than an insignificant additional interest or disposal of more than an insignificant interest in the SPE; |
| — | | changes in contractual or governance arrangements of the SPE; |
| — | | additional activities undertaken in the structure, such as providing a liquidity facility beyond the terms established originally or entering into a transaction with an SPE that was not contemplated originally; |
| — | | changes in the financing structure of the entity. |
In addition, when the Group concludes that the SPE might require additional support to continue in business, and such support was not contemplated originally, and, if required, the Group would provide such support for reputational or other reasons, the Group reassesses the need to consolidate the SPE.
The reassessment of control over the existing SPEs does not automatically lead to consolidation or deconsolidation. In making such a reassessment, the Group may need to change its assumptions with respect to loss probabilities, the likelihood of additional liquidity facilities being drawn in the future and the likelihood of future actions being taken for reputational or other purposes. All currently available information, including current market parameters and expectations (such as loss expectations on assets), which would incorporate any market changes since inception of the SPE, is used in the reassessment of consolidation conclusions.
All intercompany transactions, balances and unrealized gains on transactions between Group companies are eliminated on consolidation. Consistent accounting policies are applied throughout the Group for the purposes of consolidation. Issuances of a subsidiary’s stock to third parties are treated as noncontrolling interests.
At the date that control of a subsidiary is lost, the Group a) derecognizes the assets (including attributable goodwill) and liabilities of the subsidiary at their carrying amounts, b) derecognizes the carrying amount of any noncontrolling interests in the former subsidiary (including any components in accumulated other comprehensive income attributable to the subsidiary), c) recognizes the fair value of the consideration received and any distribution of the shares of the subsidiary, d) recognizes any investment retained in the former subsidiary at its fair value and e) recognizes any resulting difference of the above items as a gain or loss in the income statement. Any amounts recognized in prior periods in other comprehensive income in relation to that subsidiary would be reclassified to the consolidated statement of income at the date that control is lost.
Assets held in an agency or fiduciary capacity are not assets of the Group and are not included in the Group’s consolidated balance sheet.
Business Combinations and Noncontrolling Interests
The Group uses the acquisition method to account for business combinations. At the date the Group obtains control of the subsidiary, the cost of an acquisition is measured at the fair value of the consideration given, including any cash or non cash consideration (equity instruments) transferred, any contingent consideration, any previously held equity interest in the acquiree and liabilities incurred or assumed. The excess of the aggregate of the cost of an acquisition and any noncontrolling interest in the acquiree over the Group’s share of the fair value of the identifiable net assets acquired is recorded as goodwill. If the aggregate of the acquisition cost and any noncontrolling interest is below the fair value of the identifiable net assets (negative goodwill), a gain may be reported in other income. Acquisition-related costs are recognized as expenses in the period in which they are incurred.
| | | | |
| Deutsche Bank | | 02 – Consolidated Financial Statements | | 253 |
| Financial Report 2012 | | Notes to the Consolidated Financial Statements | | |
| | 01 – Significant Accounting Policies | | |
| | |
| | | | |
| | |
| | | | |
The accounting at the acquisition date may be based on provisional amounts. Adjustments to the provisional amounts are made by the Group if new information about facts and circumstances that existed at the acquisition date is obtained within one year (referred to as the measurement period) which, if known, would have affected the amounts initially recognized. Where a measurement period adjustment is identified, the Group adjusts the fair values of identifiable assets and liabilities and goodwill in the measurement period as if the accounting for the business combination had been completed at the acquisition date. Comparative information for prior periods presented in financial statements is revised accordingly if the acquisition date relates to prior reporting periods. The effects of measurement period adjustments may also cause changes in depreciation and amortization recognized in prior periods.
In business combinations achieved in stages (“step acquisitions”), a previously held equity interest in the acquiree is remeasured to its acquisition-date fair value and the resulting gain or loss, if any, is recognized in profit or loss. Amounts recognized in prior periods in other comprehensive income associated with the previously held investment would be reclassified to the consolidated statement of income at the date that control is obtained, as if the Group had disposed of the previously held equity interest.
Noncontrolling interests are shown in the consolidated balance sheet as a separate component of equity, which is distinct from the Group’s shareholders’ equity. The net income attributable to noncontrolling interests is separately disclosed on the face of the consolidated statement of income. Changes in the ownership interest in subsidiaries which do not result in a change of control are treated as transactions between equity holders and are reported in additional paid-in capital (APIC).
Associates and Jointly Controlled Entities
An associate is an entity in which the Group has significant influence, but not a controlling interest, over the operating and financial management policy decisions of the entity. Significant influence is generally presumed when the Group holds between 20 % and 50 % of the voting rights. The existence and effect of potential voting rights that are currently exercisable or convertible are considered in assessing whether the Group has significant influence. Among the other factors that are considered in determining whether the Group has significant influence are representation on the board of directors (supervisory board in the case of German stock corporations) and material intercompany transactions. The existence of these factors could require the application of the equity method of accounting for a particular investment even though the Group’s investment is less than 20 % of the voting stock.
A jointly controlled entity exists when the Group has a contractual arrangement with one or more parties to undertake activities through entities which are subject to joint control.
Investments in associates and jointly controlled entities are accounted for under the equity method of accounting. The Group’s share of the results of associates and jointly controlled entities is adjusted to conform to the accounting policies of the Group and are reported in the consolidated statement of income as net income (loss) from equity method investments. The Group’s share in the associate’s profits and losses resulting from intercompany sales is eliminated on consolidation.
If the Group previously held an equity interest in an entity (for example, as available for sale) and subsequently gained significant influence, the previously held equity interest is remeasured to fair value and any gain or loss is recognized in the consolidated statement of income. Any amounts previously recognized in other comprehensive income associated with the equity interest would be reclassified to the consolidated statement of income at the date the Group gains significant influence, as if the Group had disposed of the previously held equity interest.
Under the equity method of accounting, the Group’s investments in associates and jointly controlled entities are initially recorded at cost including any directly related transaction costs incurred in acquiring the associate, and subsequently increased (or decreased) to reflect both the Group’s pro-rata share of the post-acquisition net income (or loss) of the associate or jointly controlled entity and other movements included directly in the equity
| | | | |
| Deutsche Bank | | 02 – Consolidated Financial Statements | | 254 |
| Financial Report 2012 | | Notes to the Consolidated Financial Statements | | |
| | 01 – Significant Accounting Policies | | |
| | |
| | | | |
| | |
| | | | |
of the associate or jointly controlled entity. Goodwill arising on the acquisition of an associate or a jointly controlled entity is included in the carrying value of the investment (net of any accumulated impairment loss). As goodwill is not reported separately it is not specifically tested for impairment. Rather, the entire equity method investment is tested for impairment.
At each balance sheet date, the Group assesses whether there is any objective evidence that the investment in an associate or jointly controlled entity is impaired. If there is objective evidence of impairment, an impairment test is performed by comparing the investment’s recoverable amount, which is the higher of its value in use and fair value less costs to sell, with its carrying amount. An impairment loss recognized in prior periods is only reversed if there has been a change in the estimates used to determine the investment’s recoverable amount since the last impairment loss was recognized. If this is the case the carrying amount of the investment is increased to its higher recoverable amount. That increase is a reversal of an impairment loss.
Equity method losses in excess of the Group’s carrying value of the investment in the entity are charged against other assets held by the Group related to the investee. If those assets are written down to zero, a determination is made whether to report additional losses based on the Group’s obligation to fund such losses.
At the date that the Group ceases to have significant influence over the associate or jointly controlled entity the Group recognizes a gain or loss on the disposal of the equity method investment equal to the difference between the sum of the fair value of any retained investment and the proceeds from disposing of the associate and the then carrying amount of the investment. Amounts recognized in prior periods in other comprehensive income in relation to the associate or jointly controlled entity would be reclassified to the consolidated statement of income.
Any retained investment is accounted for as a financial instrument as described in the section entitled “Financial Assets and Liabilities” as follows.
Non-Current Assets Held for Sale and Discontinued Operations
Individual non-current non-financial assets (and disposal groups) are classified as held for sale if they are available for immediate sale in their present condition subject only to the customary sales terms of such assets (and disposal groups) and their sale is considered highly probable. For a sale to be highly probable, management must be committed to a sales plan and actively looking for a buyer. Furthermore, the assets (and disposal groups) must be actively marketed at a reasonable sales price in relation to their current fair value and the sale should be expected to be completed within one year. Non-current non-financial assets (and disposal groups) which meet the criteria for held for sale classification are measured at the lower of their carrying amount and fair value less costs to sell and are presented within “Other assets” and “Other liabilities” in the balance sheet. The comparatives are not re-presented when non-current assets (and disposal groups) are classified as held for sale. If the disposal group contains financial instruments, no adjustment to their carrying amounts is permitted.
Discontinued operations are presented separately in the income statement if an entity or a component of an entity has been disposed of or is classified as held for sale and (a) represents a separate major line of business or geographical area of operations, (b) is part of a single coordinated plan to dispose of a separate major line of business or geographical area of operations, or (c) is a subsidiary acquired exclusively with a view to resale. Net income (loss) from discontinued operations includes the net total of net income (loss) before tax from discontinued operations and discontinued operations tax expense. Similarly the net cash flows attributable to the operating, investing and financing activities of discontinued operations have to be presented separately. The comparative income statement and cash flow information is re-presented for discontinued operations.
| | | | |
| Deutsche Bank | | 02 – Consolidated Financial Statements | | 255 |
| Financial Report 2012 | | Notes to the Consolidated Financial Statements | | |
| | 01 – Significant Accounting Policies | | |
| | |
| | | | |
| | |
| | | | |
Foreign Currency Translation
The consolidated financial statements are prepared in euro, which is the presentation currency of the Group. Various entities in the Group use a different functional currency, being the currency of the primary economic environment in which the entity operates.
An entity records foreign currency revenues, expenses, gains and losses in its functional currency using the exchange rates prevailing at the dates of recognition.
Monetary assets and liabilities denominated in currencies other than the entity’s functional currency are translated at the period end closing rate. Foreign exchange gains and losses resulting from the translation and settlement of these items are recognized in the consolidated statement of income as net gains (losses) on financial assets/liabilities at fair value through profit or loss in order to align the translation amounts with those recognized from foreign currency related transactions (derivatives) which hedge these monetary assets and liabilities.
Nonmonetary items that are measured at historical cost are translated using the historical exchange rate at the date of the transaction. Translation differences on nonmonetary items which are held at fair value through profit or loss are recognized in profit or loss. Translation differences on available for sale nonmonetary items (equity securities) are included in other comprehensive income. Once the available for sale nonmonetary item is sold, the related cumulative translation difference is transferred to the consolidated statement of income as part of the overall gain or loss on sale of the item.
For purposes of translation into the presentation currency, assets, liabilities and equity of foreign operations are translated at the period end closing rate and items of income and expense are translated into euros at the rates prevailing on the dates of the transactions, or average rates of exchange where these approximate actual rates. The exchange differences arising on the translation of a foreign operation are included in other comprehensive income. For foreign operations that are subsidiaries, the amount of exchange differences attributable to any noncontrolling interest is recognized in noncontrolling interests.
Upon disposal of a foreign subsidiary and associate (which results in loss of control or significant influence over that operation) the total cumulative exchange differences recognized in other comprehensive income are reclassified to profit or loss.
Upon partial disposal of a foreign operation that is a subsidiary and which does not result in loss of control, the proportionate share of cumulative exchange differences is reclassified from other comprehensive income to noncontrolling interests as this is deemed a transaction with equity holders. For a partial disposal of an associate which does not result in a loss of significant influence, the proportionate share of cumulative exchange differences is reclassified from other comprehensive income to profit or loss.
Interest, Fees and Commissions
Revenue is recognized when the amount of revenue and associated costs can be reliably measured, it is probable that economic benefits associated with the transaction will be realized and the stage of completion of the transaction can be reliably measured. This concept is applied to the key revenue generating activities of the Group as follows.
Net Interest Income – Interest from all interest-bearing assets and liabilities is recognized as net interest income using the effective interest method. The effective interest rate is a method of calculating the amortized cost of a financial asset or a financial liability and of allocating the interest income or expense over the relevant period using the estimated future cash flows. The estimated future cash flows used in this calculation include those determined by the contractual terms of the asset or liability, all fees that are considered to be integral to the effective interest rate, direct and incremental transaction costs and all other premiums or discounts.
| | | | |
| Deutsche Bank | | 02 – Consolidated Financial Statements | | 256 |
| Financial Report 2012 | | Notes to the Consolidated Financial Statements 01 – Significant Accounting Policies | | |
| | |
| | | | |
| | |
| | | | |
Once an impairment loss has been recognized on a loan or available for sale debt security financial asset, although the accrual of interest in accordance with the contractual terms of the instrument is discontinued, interest income is recognized based on the rate of interest that was used to discount future cash flows for the purpose of measuring the impairment loss. For a loan this would be the original effective interest rate, but a new effective interest rate would be established each time an available for sale debt security is impaired as impairment is measured to fair value and would be based on a current market rate.
Commission and Fee Income – The recognition of fee revenue (including commissions) is determined by the purpose of the fees and the basis of accounting for any associated financial instruments. If there is an associated financial instrument, fees that are an integral part of the effective interest rate of that financial instrument are included within the effective yield calculation. However, if the financial instrument is carried at fair value through profit or loss, any associated fees are recognized in profit or loss when the instrument is initially recognized, provided there are no significant unobservable inputs used in determining its fair value. Fees earned from services that are provided over a specified service period are recognized over that service period. Fees earned for the completion of a specific service or significant event are recognized when the service has been completed or the event has occurred.
Loan commitment fees related to commitments that are not accounted for at fair value through profit or loss are recognized in commissions and fee income over the life of the commitment if it is unlikely that the Group will enter into a specific lending arrangement. If it is probable that the Group will enter into a specific lending arrangement, the loan commitment fee is deferred until the origination of a loan and recognized as an adjustment to the loan’s effective interest rate.
Performance-linked fees or fee components are recognized when the performance criteria are fulfilled.
The following fee income is predominantly earned from services that are provided over a period of time: investment fund management fees, fiduciary fees, custodian fees, portfolio and other management and advisory fees, credit-related fees and commission income. Fees predominantly earned from providing transaction-type services include underwriting fees, corporate finance fees and brokerage fees.
Expenses that are directly related and incremental to the generation of fee income are presented net in Commissions and Fee Income.
Arrangements involving multiple services or products – If the Group contracts to provide multiple products, services or rights to a counterparty, an evaluation is made as to whether an overall fee should be allocated to the different components of the arrangement for revenue recognition purposes. Structured trades executed by the Group are the principal example of such arrangements and are assessed on a transaction by transaction basis. The assessment considers the value of items or services delivered to ensure that the Group’s continuing involvement in other aspects of the arrangement are not essential to the items delivered. It also assesses the value of items not yet delivered and, if there is a right of return on delivered items, the probability of future delivery of remaining items or services. If it is determined that it is appropriate to look at the arrangements as separate components, the amounts received are allocated based on the relative value of each component.
If there is no objective and reliable evidence of the value of the delivered item or an individual item is required to be recognized at fair value then the residual method is used. The residual method calculates the amount to be recognized for the delivered component as being the amount remaining after allocating an appropriate amount of revenue to all other components.
Financial Assets and Liabilities
The Group classifies its financial assets and liabilities into the following categories: financial assets and liabilities at fair value through profit or loss, loans, financial assets available for sale (“AFS”) and other financial liabilities. The Group does not classify any financial instruments under the held-to-maturity category. Appropriate classification of financial assets and liabilities is determined at the time of initial recognition or when reclassified in the consolidated balance sheet.
| | | | |
| Deutsche Bank | | 02 – Consolidated Financial Statements | | 257 |
| Financial Report 2012 | | Notes to the Consolidated Financial Statements | | |
| | 01 – Significant Accounting Policies | | |
| | |
| | | | |
| | |
| | | | |
Financial instruments classified at fair value through profit or loss and financial assets classified as AFS are recognized on trade date, which is the date on which the Group commits to purchase or sell the asset or issue or repurchase the financial liability. All other financial instruments are recognized on a settlement date basis.
Financial Assets and Liabilities at Fair Value through Profit or Loss
The Group classifies certain financial assets and financial liabilities as either held for trading or designated at fair value through profit or loss. They are carried at fair value and presented as financial assets at fair value through profit or loss and financial liabilities at fair value through profit or loss, respectively. Related realized and unrealized gains and losses are included in net gains (losses) on financial assets/liabilities at fair value through profit or loss. Interest on interest earning assets such as trading loans and debt securities and dividends on equity instruments are presented in interest and similar income for financial instruments at fair value through profit or loss.
Trading Assets and Liabilities – Financial instruments are classified as held for trading if they have been originated, acquired or incurred principally for the purpose of selling or repurchasing them in the near term, or they form part of a portfolio of identified financial instruments that are managed together and for which there is evidence of a recent actual pattern of short-term profit-taking. Trading assets include debt and equity securities, derivatives held for trading purposes, commodities and trading loans. Trading liabilities consist primarily of derivative liabilities and short positions. Also included in this category are physical commodities held by the Group’s commodity trading business, at fair value less costs to sell.
Financial Instruments Designated at Fair Value through Profit or Loss – Certain financial assets and liabilities that do not meet the definition of trading assets and liabilities are designated at fair value through profit or loss using the fair value option. To be designated at fair value through profit or loss, financial assets and liabilities must meet one of the following criteria: (1) the designation eliminates or significantly reduces a measurement or recognition inconsistency; (2) a group of financial assets or liabilities or both is managed and its performance is evaluated on a fair value basis in accordance with a documented risk management or investment strategy; or (3) the instrument contains one or more embedded derivatives unless: (a) the embedded derivative does not significantly modify the cash flows that otherwise would be required by the contract; or (b) it is clear with little or no analysis that separation is prohibited. In addition, the Group allows the fair value option to be designated only for those financial instruments for which a reliable estimate of fair value can be obtained. Financial assets and liabilities which are designated at fair value through profit or loss, under the fair value option, include repurchase and reverse repurchase agreements, certain loans and loan commitments, debt and equity securities and structured note liabilities.
Loan Commitments
Certain loan commitments are designated at fair value through profit or loss under the fair value option. As indicated under the discussion of “Derivatives and Hedge Accounting”, some loan commitments are classified as financial liabilities at fair value through profit or loss. All other loan commitments remain off-balance sheet. Therefore, the Group does not recognize and measure changes in fair value of these off-balance sheet loan commitments that result from changes in market interest rates or credit spreads. However, as specified in the discussion “Impairment of loans and provision for off-balance sheet positions”, these off-balance sheet loan commitments are assessed for impairment individually and where appropriate, collectively.
Loans
Loans include originated and purchased non-derivative financial assets with fixed or determinable payments that are not quoted in an active market and which are not classified as financial assets at fair value through profit or loss or financial assets AFS. An active market exists when quoted prices are readily and regularly available from an exchange, dealer, broker, industry group, pricing service or regulatory agency and those prices represent actual and regularly occurring market transactions on an arm’s length basis.
| | | | |
| Deutsche Bank | | 02 – Consolidated Financial Statements | | 258 |
| Financial Report 2012 | | Notes to the Consolidated Financial Statements | | |
| | 01 – Significant Accounting Policies | | |
| | |
| | | | |
| | |
| | | | |
Loans not acquired in a business combination or in an asset purchase are initially recognized at their transaction price, which is the cash amount advanced to the borrower. In addition, the net of direct and incremental transaction costs and fees are included in the initial carrying amount of loans. These loans are subsequently measured at amortized cost using the effective interest method less impairment.
Loans which have been acquired as either part of a business combination or as an asset purchase are initially recognized at fair value at the acquisition date. This includes loans for which an impairment loss had been established by the acquiree before their initial recognition by the Group. The fair value at the acquisition date incorporates expected cash flows which consider the credit quality of these loans including any incurred losses and becomes the new amortized cost basis. Interest income is recognized using the effective interest method. Subsequent to the acquisition date the Group assesses whether there is objective evidence of impairment in line with the policies described in the section entitled “Impairment of Loans and Provisions for Off Balance Sheet Positions”. If the loans are determined to be impaired then a loan loss allowance is recognized with a corresponding charge to the provision for credit losses line in the consolidated statement of income. Releases of such loan loss allowances established after their initial recognition are included in our provision for credit losses line. Subsequent improvements in the credit quality of such loans for which no loss allowance had been recorded are recognized immediately through an adjustment to the current carrying value and a corresponding gain is recognized in interest income.
Financial Assets Classified as Available for Sale
Financial assets that are not classified as at fair value through profit or loss or as loans are classified as AFS. A financial asset classified as AFS is initially recognized at its fair value plus transaction costs that are directly attributable to the acquisition of the financial asset. The amortization of premiums and accretion of discount are recorded in net interest income. Financial assets classified as AFS are carried at fair value with the changes in fair value reported in other comprehensive income, unless the asset is subject to a fair value hedge, in which case changes in fair value resulting from the risk being hedged are recorded in other income. For monetary financial assets classified as AFS (debt instruments), changes in carrying amounts relating to changes in foreign exchange rate are recognized in the consolidated statement of income and other changes in carrying amount are recognized in other comprehensive income as indicated above. For financial assets classified as AFS that are nonmonetary items (equity instruments), the gain or loss that is recognized in other comprehensive income includes any related foreign exchange component.
Financial assets classified as AFS are assessed for impairment as discussed in the section entitled “Impairment of financial assets classified as Available for Sale”. Realized gains and losses are reported in net gains (losses) on financial assets available for sale. Generally, the weighted-average cost method is used to determine the cost of financial assets. Unrealized gains and losses recorded in other comprehensive income are transferred to the consolidated statement of income on disposal of an available for sale asset and reported in net gains (losses) on financial assets available for sale.
Financial Liabilities
Except for financial liabilities at fair value through profit or loss, financial liabilities are measured at amortized cost using the effective interest method.
Financial liabilities include long-term and short-term debt issued which are initially measured at fair value, which is the consideration received, net of transaction costs incurred. Repurchases of issued debt in the market are treated as extinguishments and any related gain or loss is recorded in the consolidated statement of income. A subsequent sale of own bonds in the market is treated as a reissuance of debt.
| | | | |
| Deutsche Bank | | 02 – Consolidated Financial Statements | | 259 |
| Financial Report 2012 | | Notes to the Consolidated Financial Statements | | |
| | 01 – Significant Accounting Policies | | |
| | |
| | | | |
| | |
| | | | |
Reclassification of Financial Assets
The Group may reclassify certain financial assets out of the financial assets at fair value through profit or loss classification (trading assets) and the AFS classification into the loans classification. For assets to be reclassified there must be a clear change in management intent with respect to the assets since initial recognition and the financial asset must meet the definition of a loan at the reclassification date. Additionally, there must be an intent and ability to hold the asset for the foreseeable future at the reclassification date. There is no single specific period that defines foreseeable future. Rather, it is a matter requiring management judgment. In exercising this judgment, the Group established the following minimum requirements for what constitutes foreseeable future. At the time of reclassification,
| — | | there must be no intent to dispose of the asset through sale or securitization within one year and no internal or external requirement that would restrict the Group’s ability to hold or require sale; and |
| — | | the business plan going forward should not be to profit from short-term movements in price. |
Financial assets proposed for reclassification which meet these criteria are considered based on the facts and circumstances of each financial asset under consideration. A positive management assertion is required after taking into account the ability and plausibility to execute the strategy to hold.
In addition to the above criteria the Group also requires that persuasive evidence exists to assert that the expected repayment of the asset exceeds the estimated fair value and the returns on the asset will be optimized by holding it for the foreseeable future.
Financial assets are reclassified at their fair value at the reclassification date. Any gain or loss already recognized in the consolidated statement of income is not reversed. The fair value of the instrument at reclassification date becomes the new amortized cost of the instrument. The expected cash flows on the financial instruments are estimated at the reclassification date and these estimates are used to calculate a new effective interest rate for the instruments. If there is a subsequent increase in expected future cash flows on reclassified assets as a result of increased recoverability, the effect of that increase is recognized as an adjustment to the effective interest rate from the date of the change in estimate rather than as an adjustment to the carrying amount of the asset at the date of the change in estimate. If there is a subsequent decrease in expected future cash flows the asset would be assessed for impairment as discussed in the section entitled “Impairment of Loans and Provision for Off-Balance Sheet Positions”. Any change in the timing of the cash flows of reclassified assets which are not deemed impaired are recorded as an adjustment to the carrying amount of the asset.
For instruments reclassified from AFS to loans, any unrealized gain or loss recognized in other comprehensive income is subsequently amortized into interest income using the effective interest rate of the instrument. If the instrument is subsequently impaired, any unrealized loss which is held in accumulated other comprehensive income for that instrument at that date is immediately recognized in the consolidated statement of income as a loan loss provision.
To the extent that assets categorized as loans are repaid, restructured or eventually sold and the amount received is less than the carrying value at that time, then a loss would be recognized in the consolidated statement of income as a component of the provision for credit losses, if the loan is impaired, or otherwise in other income, if the loan is not impaired.
Determination of Fair Value
Fair value is defined as the price at which an asset or liability could be exchanged in an arm’s length transaction between knowledgeable, willing parties, other than in a forced or liquidation sale. The fair value of instruments that are quoted in active markets is determined using the quoted prices where they represent those at which regularly and recently occurring transactions take place. The Group uses valuation techniques to establish the fair value of instruments where prices quoted in active markets are not available. Therefore, where possible, parameter inputs to the valuation techniques are based on observable data derived from prices of relevant instruments traded in an active market. These valuation techniques involve some level of management
| | | | |
| Deutsche Bank | | 02 – Consolidated Financial Statements | | 260 |
| Financial Report 2012 | | Notes to the Consolidated Financial Statements | | |
| | 01 – Significant Accounting Policies | | |
| | |
| | | | |
| | |
| | | | |
estimation and judgment, the degree of which will depend on the price transparency for the instrument or market and the instrument’s complexity. Refer to Note 02 “Critical Accounting Estimates” section “Fair Value Estimates – Methods of Determining Fair Value” for further discussion of the accounting estimates and judgments required in the determination of fair value.
Recognition of Trade Date Profit
If there are significant unobservable inputs used in the valuation technique, the financial instrument is recognized at the transaction price and any profit implied from the valuation technique at trade date is deferred. Using systematic methods, the deferred amount is recognized over the period between trade date and the date when the market is expected to become observable, or over the life of the trade (whichever is shorter). Such methodology is used because it reflects the changing economic and risk profile of the instrument as the market develops or as the instrument itself progresses to maturity. Any remaining trade date deferred profit is recognized in the consolidated statement of income when the transaction becomes observable or the Group enters into off-setting transactions that substantially eliminate the instrument’s risk. In the rare circumstances that a trade date loss arises, it would be recognized at inception of the transaction to the extent that it is probable that a loss has been incurred and a reliable estimate of the loss amount can be made. Refer to Note 02 “Critical Accounting Estimates” section “Fair Value Estimates – Methods of Determining Fair Value” for further discussion of the estimates and judgments required in assessing observability of inputs and risk mitigation.
Derivatives and Hedge Accounting
Derivatives are used to manage exposures to interest rate, foreign currency, credit and other market price risks, including exposures arising from forecast transactions. All freestanding contracts that are considered derivatives for accounting purposes are carried at fair value on the consolidated balance sheet regardless of whether they are held for trading or nontrading purposes.
The changes in fair value on derivatives held for trading are included in net gains (losses) on financial assets/liabilities at fair value through profit or loss.
The Group makes commitments to originate loans it intends to sell. Such positions are classified as financial assets/liabilities at fair value through profit or loss and related gains and losses are included in net gains (losses) on financial assets/liabilities at fair value through profit or loss. Loan commitments that can be settled net in cash or by delivering or issuing another financial instrument are classified as derivatives. Market value guarantees provided on specific mutual fund products offered by the Group are also accounted for as derivatives and carried at fair value, with changes in fair value recorded in net gains (losses) on financial assets/liabilities at fair value through profit or loss.
Embedded Derivatives
Some hybrid contracts contain both a derivative and a non-derivative component. In such cases, the derivative component is termed an embedded derivative, with the non-derivative component representing the host contract. If the economic characteristics and risks of embedded derivatives are not closely related to those of the host contract and the hybrid contract itself is not carried at fair value through profit or loss, the embedded derivative is bifurcated and reported at fair value, with gains and losses recognized in net gains (losses) on financial assets/liabilities at fair value through profit or loss. The host contract will continue to be accounted for in accordance with the appropriate accounting standard. The carrying amount of an embedded derivative is reported in the same consolidated balance sheet line item as the host contract. Certain hybrid instruments have been designated at fair value through profit or loss using the fair value option.
Hedge Accounting
For accounting purposes there are three possible types of hedges: (1) hedges of changes in the fair value of assets, liabilities or unrecognized firm commitments (fair value hedges); (2) hedges of the variability of future cash flows from highly probable forecast transactions and floating rate assets and liabilities (cash flow hedges); and (3) hedges of the translation adjustments resulting from translating the functional currency financial statements of foreign operations into the presentation currency of the parent (hedges of net investments in foreign operations).
| | | | |
| Deutsche Bank | | 02 – Consolidated Financial Statements | | 261 |
| Financial Report 2012 | | Notes to the Consolidated Financial Statements | | |
| | 01 – Significant Accounting Policies | | |
| | |
| | | | |
| | |
| | | | |
When hedge accounting is applied, the Group designates and documents the relationship between the hedging instrument and the hedged item as well as its risk management objective and strategy for undertaking the hedging transactions and the nature of the risk being hedged. This documentation includes a description of how the Group will assess the hedging instrument’s effectiveness in offsetting the exposure to changes in the hedged item’s fair value or cash flows attributable to the hedged risk. Hedge effectiveness is assessed at inception and throughout the term of each hedging relationship. Hedge effectiveness is always assessed, even when the terms of the derivative and hedged item are matched.
Hedging derivatives are reported as other assets and other liabilities. In the event that a derivative is subsequently de-designated from a hedging relationship, it is transferred to financial assets/liabilities at fair value through profit or loss.
For hedges of changes in fair value, the changes in the fair value of the hedged asset, liability or unrecognized firm commitment, or a portion thereof, attributable to the risk being hedged, are recognized in the consolidated statement of income along with changes in the entire fair value of the derivative. When hedging interest rate risk, any interest accrued or paid on both the derivative and the hedged item is reported in interest income or expense and the unrealized gains and losses from the hedge accounting fair value adjustments are reported in other income. When hedging the foreign exchange risk of an AFS security, the fair value adjustments related to the security’s foreign exchange exposures are also recorded in other income. Hedge ineffectiveness is reported in other income and is measured as the net effect of changes in the fair value of the hedging instrument and changes in the fair value of the hedged item arising from changes in the market rate or price related to the risk(s) being hedged.
If a fair value hedge of a debt instrument is discontinued prior to the instrument’s maturity because the derivative is terminated or the relationship is de-designated, any remaining interest rate-related fair value adjustments made to the carrying amount of the debt instrument (basis adjustments) are amortized to interest income or expense over the remaining term of the original hedging relationship. For other types of fair value adjustments and whenever a fair value hedged asset or liability is sold or otherwise derecognized, any basis adjustments are included in the calculation of the gain or loss on derecognition.
For hedges of variability in future cash flows, there is no change to the accounting for the hedged item and the derivative is carried at fair value, with changes in value reported initially in other comprehensive income to the extent the hedge is effective. These amounts initially recorded in other comprehensive income are subsequently reclassified into the consolidated statement of income in the same periods during which the forecast transaction affects the consolidated statement of income. Thus, for hedges of interest rate risk, the amounts are amortized into interest income or expense at the same time as the interest is accrued on the hedged transaction.
Hedge ineffectiveness is recorded in other income and is measured as changes in the excess (if any) in the absolute cumulative change in fair value of the actual hedging derivative over the absolute cumulative change in the fair value of the hypothetically perfect hedge.
When hedges of variability in cash flows attributable to interest rate risk are discontinued, amounts remaining in accumulated other comprehensive income are amortized to interest income or expense over the remaining life of the original hedge relationship, unless the hedged transaction is no longer expected to occur in which case the amount will be reclassified into other income immediately. When hedges of variability in cash flows attributable to other risks are discontinued, the related amounts in accumulated other comprehensive income are reclassified into either the same consolidated statement of income caption and period as profit or loss from the forecast transaction, or into other income when the forecast transaction is no longer expected to occur.
| | | | |
| Deutsche Bank | | 02 – Consolidated Financial Statements | | 262 |
| Financial Report 2012 | | Notes to the Consolidated Financial Statements | | |
| | 01 – Significant Accounting Policies | | |
| | |
| | | | |
| | |
| | | | |
For hedges of the translation adjustments resulting from translating the functional currency financial statements of foreign operations (hedges of net investments in foreign operations) into the functional currency of the parent, the portion of the change in fair value of the derivative due to changes in the spot foreign exchange rates is recorded as a foreign currency translation adjustment in other comprehensive income to the extent the hedge is effective; the remainder is recorded as other income in the consolidated statement of income.
Changes in fair value of the hedging instrument relating to the effective portion of the hedge are subsequently recognized in profit or loss on disposal of the foreign operations.
Impairment of Financial Assets
At each balance sheet date, the Group assesses whether there is objective evidence that a financial asset or a group of financial assets is impaired. A financial asset or group of financial assets is impaired and impairment losses are incurred if:
| — | | there is objective evidence of impairment as a result of a loss event that occurred after the initial recognition of the asset and up to the balance sheet date (“a loss event”); |
| — | | the loss event had an impact on the estimated future cash flows of the financial asset or the group of financial assets and |
| — | | a reliable estimate of the loss amount can be made. |
Impairment of Loans and Provision for Off-Balance Sheet Positions
The Group first assesses whether objective evidence of impairment exists individually for loans that are individually significant. It then assesses collectively for loans that are not individually significant and loans which are significant but for which there is no objective evidence of impairment under the individual assessment.
To allow management to determine whether a loss event has occurred on an individual basis, all significant counterparty relationships are reviewed periodically. This evaluation considers current information and events related to the counterparty, such as the counterparty experiencing significant financial difficulty or a breach of contract, for example, default or delinquency in interest or principal payments.
If there is evidence of impairment leading to an impairment loss for an individual counterparty relationship, then the amount of the loss is determined as the difference between the carrying amount of the loan(s), including accrued interest, and the present value of expected future cash flows discounted at the loan’s original effective interest rate or the effective interest rate established upon reclassification to loans, including cash flows that may result from foreclosure less costs for obtaining and selling the collateral. The carrying amount of the loans is reduced by the use of an allowance account and the amount of the loss is recognized in the consolidated statement of income as a component of the provision for credit losses.
The collective assessment of impairment is principally to establish an allowance amount relating to loans that are either individually significant but for which there is no objective evidence of impairment, or are not individually significant but for which there is, on a portfolio basis, a loss amount that is probable of having occurred and is reasonably estimable. The loss amount has three components. The first component is an amount for transfer and currency convertibility risks for loan exposures in countries where there are serious doubts about the ability of counterparties to comply with the repayment terms due to the economic or political situation prevailing in the respective country of domicile. This amount is calculated using ratings for country risk and transfer risk which are established and regularly reviewed for each country in which the Group does business. The second component is an allowance amount representing the incurred losses on the portfolio of smaller-balance homogeneous loans, which are loans to individuals and small business customers of the private and retail business. The loans are grouped according to similar credit risk characteristics and the allowance for each group is determined using statistical models based on historical experience. The third component represents an estimate of incurred losses inherent in the group of loans that have not yet been individually identified or measured as part of the smaller-balance homogeneous loans. Loans that were found not to be impaired when evaluated on an individual basis are included in the scope of this component of the allowance.
| | | | |
| Deutsche Bank | | 02 – Consolidated Financial Statements | | 263 |
| Financial Report 2012 | | Notes to the Consolidated Financial Statements | | |
| | 01 – Significant Accounting Policies | | |
| | |
| | | | |
| | |
| | | | |
Once a loan is identified as impaired, although the accrual of interest in accordance with the contractual terms of the loan is discontinued, the accretion of the net present value of the written down amount of the loan due to the passage of time is recognized as interest income based on the original effective interest rate of the loan.
At each balance sheet date, all impaired loans are reviewed for changes to the present value of expected future cash flows discounted at the loan’s original effective interest rate. Any change to the previously recognized impairment loss is recognized as a change to the allowance account and recorded in the consolidated statement of income as a component of the provision for credit losses.
When it is considered that there is no realistic prospect of recovery and all collateral has been realized or transferred to the Group, the loan and any associated allowance is charged off (the loan and the related allowance are removed from the balance sheet). Individually significant loans where specific loan loss provisions are in place are evaluated at least quarterly on a case-by-case basis. For this category of loans, the number of days past due is an indicator for a charge-off but is not a determining factor. A charge-off will only take place after considering all relevant information, such as the occurrence of a significant change in the borrower’s financial position such that the borrower can no longer pay the obligation, or the proceeds from the collateral are insufficient to completely satisfy the current carrying amount of the loan.
For collectively assessed loans, which are primarily mortgages and consumer finance loans, the timing of a charge-off depends on whether there is any underlying collateral and the Group’s estimate of the amount collectible. For mortgage loans, the portion of the loan which is uncollateralized is charged off when the mortgage becomes 840 days past due, at the latest. For consumer finance loans, any portion of the balance which the Bank does not expect to collect is written off at 180 days past due for credit card receivables, and 270 days past due for other consumer finance loans.
Subsequent recoveries, if any, result in a reduction in the allowance account and are recorded in the consolidated statement of income as a component of the provision for credit losses.
The process to determine the provision for off-balance sheet positions is similar to the methodology used for loans. Any loss amounts are recognized as an allowance in the consolidated balance sheet within provisions and charged to the consolidated statement of income as a component of the provision for credit losses.
If in a subsequent period the amount of a previously recognized impairment loss decreases and the decrease is due to an event occurring after the impairment was recognized, the impairment loss is reversed by reducing the allowance account accordingly. Such reversal is recognized in profit or loss.
Impairment of Financial Assets Classified as Available for Sale
For financial assets classified as AFS, management assesses at each balance sheet date whether there is objective evidence that an individual asset is impaired.
In the case of equity investments classified as AFS, objective evidence includes a significant or prolonged decline in the fair value of the investment below cost. In the case of debt securities classified as AFS, impairment is assessed based on the same criteria as for loans.
If there is evidence of impairment, any amounts previously recognized in other comprehensive income are recognized in the consolidated statement of income for the period, reported in net gains (losses) on financial assets available for sale. This amount is determined as the difference between the acquisition cost (net of any principal repayments and amortization) and current fair value of the asset less any impairment loss on that investment previously recognized in the consolidated statement of income.
| | | | |
| Deutsche Bank | | 02 – Consolidated Financial Statements | | 264 |
| Financial Report 2012 | | Notes to the Consolidated Financial Statements | | |
| | 01 – Significant Accounting Policies | | |
| | |
| | | | |
| | |
| | | | |
When an AFS debt security is impaired, any subsequent decreases in fair value are recognized in the consolidated statement of income as it is considered further impairment. Any subsequent increases are also recognized in the consolidated statement of income until the asset is no longer considered impaired. When the fair value of the AFS debt security recovers to at least amortized cost it is no longer considered impaired and subsequent changes in fair value are reported in other comprehensive income.
Reversals of impairment losses on equity investments classified as AFS are not reversed through the consolidated statement of income; increases in their fair value after impairment are recognized in other comprehensive income.
Derecognition of Financial Assets and Liabilities
Financial Asset Derecognition
A financial asset is considered for derecognition when the contractual rights to the cash flows from the financial asset expire, or the Group has either transferred the contractual right to receive the cash flows from that asset, or has assumed an obligation to pay those cash flows to one or more recipients, subject to certain criteria.
The Group derecognizes a transferred financial asset if it transfers substantially all the risks and rewards of ownership.
The Group enters into transactions in which it transfers previously recognized financial assets but retains substantially all the associated risks and rewards of those assets; for example, a sale to a third party in which the Group enters into a concurrent total return swap with the same counterparty. These types of transactions are accounted for as secured financing transactions.
In transactions in which substantially all the risks and rewards of ownership of a financial asset are neither retained nor transferred, the Group derecognizes the transferred asset if control over that asset is not retained, i.e., if the transferee has the practical ability to sell the transferred asset. The rights and obligations retained in the transfer are recognized separately as assets and liabilities, as appropriate. If control over the asset is retained, the Group continues to recognize the asset to the extent of its continuing involvement, which is determined by the extent to which it remains exposed to changes in the value of the transferred asset.
The derecognition criteria are also applied to the transfer of part of an asset, rather than the asset as a whole, or to a group of similar financial assets in their entirety, when applicable. If transferring a part of an asset, such part must be a specifically identified cash flow, a fully proportionate share of the asset, or a fully proportionate share of a specifically-identified cash flow.
If an existing financial asset is replaced by another asset from the same counterparty on substantially different terms, or if the terms of the financial asset are substantially modified, the existing financial asset is derecognized and a new asset is recognized. Any difference between the respective carrying amounts is recognized in the consolidated statement of income.
Securitization
The Group securitizes various consumer and commercial financial assets, which is achieved via the transfer of these assets to an SPE, which issues securities to investors to finance the acquisition of the assets. Financial assets awaiting securitization are classified and measured as appropriate under the policies in the “Financial Assets and Liabilities” section. The transferred assets may qualify for derecognition in full or in part, under the policy on derecognition of financial assets. Synthetic securitization structures typically involve derivative financial instruments for which the policies in the “Derivatives and Hedge Accounting” section would apply. Those transfers that do not qualify for derecognition may be reported as secured financing or result in the recognition of continuing involvement liabilities. The investors and the securitization vehicles generally have no recourse to the Group’s other assets in cases where the issuers of the financial assets fail to perform under the original terms of those assets.
| | | | |
| Deutsche Bank | | 02 – Consolidated Financial Statements | | 265 |
| Financial Report 2012 | | Notes to the Consolidated Financial Statements | | |
| | 01 – Significant Accounting Policies | | |
| | |
| | | | |
| | |
| | | | |
Interests in the securitized financial assets may be retained in the form of senior or subordinated tranches, interest only strips or other residual interests (collectively referred to as “retained interests”). Provided the Group’s retained interests do not result in consolidation of an SPE, nor in continued recognition of the transferred assets, these interests are typically recorded in financial assets at fair value through profit or loss and carried at fair value. Consistent with the valuation of similar financial instruments, the fair value of retained tranches or the financial assets is initially and subsequently determined using market price quotations where available or internal pricing models that utilize variables such as yield curves, prepayment speeds, default rates, loss severity, interest rate volatilities and spreads. The assumptions used for pricing are based on observable transactions in similar securities and are verified by external pricing sources, where available. Where observable transactions in similar securities and other external pricing sources are not available, management judgment as described in the section entitled “Fair Value Estimates” must be used to determine fair value. The Group may also periodically hold interests in securitized financial assets and record them at amortized cost.
In situations where the Group has a present obligation (either legal or constructive) to provide financial support to an unconsolidated securitization SPE a provision will be created if the obligation can be reliably measured and it is probable that there will be an outflow of economic resources required to settle it.
When an asset is derecognized a gain or loss equal to the difference between the consideration received and the carrying amount of the transferred asset is recorded. When a part of an asset is derecognised, gains or losses on securitization depend in part on the carrying amount of the transferred financial assets, allocated between the financial assets derecognized and the retained interests based on their relative fair values at the date of the transfer.
Derecognition of Financial Liabilities
A financial liability is derecognized when the obligation under the liability is discharged or canceled or expires. If an existing financial liability is replaced by another from the same lender on substantially different terms, or the terms of the existing liability are substantially modified, such an exchange or modification is treated as a derecognition of the original liability and the recognition of a new liability, and the difference in the respective carrying amounts is recognized in the consolidated statement of income.
Repurchase and Reverse Repurchase Agreements
Securities purchased under resale agreements (“reverse repurchase agreements”) and securities sold under agreements to repurchase (“repurchase agreements”) are treated as collateralized financings and are recognized initially at fair value, being the amount of cash disbursed and received, respectively. The party disbursing the cash takes possession of the securities serving as collateral for the financing and having a market value equal to, or in excess of the principal amount loaned. The securities received under reverse repurchase agreements and securities delivered under repurchase agreements are not recognized on, or derecognized from, the balance sheet, unless the risks and rewards of ownership are obtained or relinquished. Securities delivered under repurchase agreements which are not derecognized from the balance sheet and where the counterparty has the right by contract or custom to sell or repledge the collateral are disclosed as such on the face of the consolidated balance sheet.
The Group has chosen to apply the fair value option to certain repurchase and reverse repurchase portfolios that are managed on a fair value basis.
The Group offsets reverse repurchase agreements and repurchase agreements with the same counterparty, maturity, currency and central securities depository (“CSD”) and where there is a legally enforceable right to set off.
Interest earned on reverse repurchase agreements and interest incurred on repurchase agreements is reported as interest income and interest expense, respectively.
| | | | |
| Deutsche Bank | | 02 – Consolidated Financial Statements | | 266 |
| Financial Report 2012 | | Notes to the Consolidated Financial Statements | | |
| | 01 – Significant Accounting Policies | | |
| | |
| | | | |
| | |
| | | | |
Securities Borrowed and Securities Loaned
Securities borrowed transactions generally require the Group to deposit cash with the securities lender. In a securities loaned transaction, the Group generally receives either cash collateral, in an amount equal to or in excess of the market value of securities loaned, or securities. The Group monitors the fair value of securities borrowed and securities loaned and additional collateral is disbursed or obtained, if necessary.
The amount of cash advanced or received is recorded as securities borrowed and securities loaned, respectively.
The securities borrowed are not themselves recognized in the financial statements. If they are sold to third parties, the obligation to return the securities is recorded as a financial liability at fair value through profit or loss and any subsequent gain or loss is included in the consolidated statement of income in net gain (loss) on financial assets/liabilities at fair value through profit or loss. Securities lent to counterparties are also retained on the consolidated balance sheet.
Fees received or paid are reported in interest income and interest expense, respectively. Securities lent to counterparties which are not derecognized from the consolidated balance sheet and where the counterparty has the right by contract or custom to sell or repledge the collateral are disclosed as such on the face of the consolidated balance sheet.
Offsetting Financial Instruments
Financial assets and liabilities are offset, with the net amount presented in the consolidated balance sheet, only if the Group holds a currently enforceable legal right to set off the recognized amounts and there is an intention to settle on a net basis or to realize an asset and settle the liability simultaneously. In all other situations they are presented gross. When financial assets and financial liabilities are offset in the consolidated balance sheet, the associated income and expense items will also be offset in the consolidated statement of income, unless specifically prohibited by an applicable accounting standard.
Property and Equipment
Property and equipment includes own-use properties, leasehold improvements, furniture and equipment and software (operating systems only). Own-use properties are carried at cost less accumulated depreciation and accumulated impairment losses. Depreciation is generally recognized using the straight-line method over the estimated useful lives of the assets. The range of estimated useful lives is 25 to 50 years for property and 3 to 10 years for furniture and equipment (including initial improvements to purchased buildings). Leasehold improvements are capitalized and subsequently depreciated on a straight-line basis over the shorter of the term of the lease and the estimated useful life of the improvement, which generally ranges from 3 to 10 years. Depreciation of property and equipment is included in general and administrative expenses. Maintenance and repairs are also charged to general and administrative expenses. Gains and losses on disposals are included in other income.
Property and equipment are tested for impairment at each quarterly reporting date and an impairment charge is recorded to the extent the recoverable amount, which is the higher of fair value less costs to sell and value in use, is less than its carrying amount. Value in use is the present value of the future cash flows expected to be derived from the asset. After the recognition of impairment of an asset, the depreciation charge is adjusted in future periods to reflect the asset’s revised carrying amount. If an impairment is later reversed, the depreciation charge is adjusted prospectively.
Properties leased under a finance lease are capitalized as assets in property and equipment and depreciated over the terms of the leases.
Investment Property
The Group generally uses the cost model for valuation of investment property, and the carrying value is included on the consolidated balance sheet in other assets. When the Group issues liabilities that are backed by investment
| | | | |
| Deutsche Bank | | 02 – Consolidated Financial Statements | | 267 |
| Financial Report 2012 | | Notes to the Consolidated Financial Statements | | |
| | 01 – Significant Accounting Policies | | |
| | |
| | | | |
| | |
| | | | |
property, which pay a return linked directly to the fair value of, or returns from, specified investment property assets, it has elected to apply the fair value model to those specific investment property assets. The Group engages, as appropriate, external real estate experts to determine the fair value of the investment property by using recognized valuation techniques.
Goodwill and Other Intangible Assets
Goodwill arises on the acquisition of subsidiaries, associates and jointly controlled entities and represents the excess of the aggregate of the cost of an acquisition and any noncontrolling interest in the acquiree over the fair value of the identifiable net assets acquired at the date of the acquisition.
For the purpose of calculating goodwill, fair values of acquired assets, liabilities and contingent liabilities are determined by reference to market values or by discounting expected future cash flows to present value. This discounting is either performed using market rates or by using risk-free rates and risk-adjusted expected future cash flows. Any noncontrolling interest in the acquiree is measured either at fair value or at the noncontrolling interest’s proportionate share of the acquiree’s identifiable net assets (this is determined for each business combination).
Goodwill on the acquisition of subsidiaries is capitalized and reviewed for impairment annually or more frequently if there are indications that impairment may have occurred. For the purposes of impairment testing, goodwill acquired in a business combination is allocated to cash-generating units (“CGUs”), which are the smallest identifiable groups of assets that generate cash inflows largely independent of the cash inflows from other assets or groups of assets and that are expected to benefit from the synergies of the combination and considering the business level at which goodwill is monitored for internal management purposes. In identifying whether cash inflows from an asset (or a group of assets) are largely independent of the cash inflows from other assets (or groups of assets) various factors are considered, including how management monitors the entity’s operations or makes decisions about continuing or disposing of the entity’s assets and operations.
If goodwill has been allocated to a CGU and an operation within that unit is disposed of, the attributable goodwill is included in the carrying amount of the operation when determining the gain or loss on its disposal.
Certain non-integrated investments are not allocated to a CGU. Impairment testing is performed individually for each of these assets.
Goodwill on the acquisition of associates and jointly controlled entities is not disclosed separately, but instead included in the cost of the investments. The entire carrying amount of the equity method investment is reviewed for impairment quarterly, or more frequently if there is an indication that impairment may have occurred.
Intangible assets are recognized separately from goodwill when they are separable or arise from contractual or other legal rights and their fair value can be measured reliably. Intangible assets that have a finite useful life are stated at cost less any accumulated amortization and accumulated impairment losses. Customer-related intangible assets that have a finite useful life are amortized over periods of between 1 and 25 years on a straight-line basis based on their expected useful life. Mortgage servicing rights are carried at cost and amortized in proportion to, and over the estimated period of, net servicing revenue. These assets are tested for impairment and their useful lives reaffirmed at least annually.
Certain intangible assets have an indefinite useful life and hence are not amortized, but are tested for impairment at least annually or more frequently if events or changes in circumstances indicate that impairment may have occurred.
Costs related to software developed or obtained for internal use are capitalized if it is probable that future economic benefits will flow to the Group and the cost can be measured reliably. Capitalized costs are amortized using the straight-line method over the asset’s useful life which is deemed to be either three, five or ten years. Eligible costs include external direct costs for materials and services, as well as payroll and payroll-related
| | | | |
| Deutsche Bank | | 02 – Consolidated Financial Statements | | 268 |
| Financial Report 2012 | | Notes to the Consolidated Financial Statements | | |
| | 01 – Significant Accounting Policies | | |
| | |
| | | | |
| | |
| | | | |
costs for employees directly associated with an internal-use software project. Overhead costs, as well as costs incurred during the research phase or after software is ready for use, are expensed as incurred. Capitalized software costs are tested for impairment either annually if still under development or when there is an indication of impairment once the software is in use.
On acquisition of insurance businesses, the excess of the purchase price over the acquirer’s interest in the net fair value of the identifiable assets, liabilities and contingent liabilities is accounted for as an intangible asset. This intangible asset represents the present value of future cash flows over the reported liability at the date of acquisition. This is known as value of business acquired (“VOBA”).
The VOBA is amortized at a rate determined by considering the profile of the business acquired and the expected depletion in its value. The VOBA acquired is reviewed regularly for any impairment in value and any reductions are charged as an expense to the consolidated statement of income.
Financial Guarantees
Financial guarantee contracts are contracts that require the issuer to make specified payments to reimburse the holder for a loss it incurs because a specified debtor fails to make payments when due in accordance with the terms of a debt instrument.
The Group has chosen to apply the fair value option to certain written financial guarantees that are managed on a fair value basis. Financial guarantees that the Group has not designated at fair value are recognized initially in the financial statements at fair value on the date the guarantee is given. Subsequent to initial recognition, the Group’s liabilities under such guarantees are measured at the higher of the amount initially recognized, less cumulative amortization, and the best estimate of the expenditure required to settle any financial obligation as of the balance sheet date. These estimates are determined based on experience with similar transactions and history of past losses, and management’s determination of the best estimate.
Any increase in the liability relating to guarantees is recorded in the consolidated statement of income in provision for credit losses.
Leasing Transactions
The Group enters into lease contracts, predominantly for premises, as a lessee. The terms and conditions of these contracts are assessed and the leases are classified as operating leases or finance leases according to their economic substance at inception of the lease.
Assets held under finance leases are initially recognized on the consolidated balance sheet at an amount equal to the fair value of the leased property or, if lower, the present value of the minimum lease payments. The corresponding liability to the lessor is included in the consolidated balance sheet as a finance lease obligation. The discount rate used in calculating the present value of the minimum lease payments is either the interest rate implicit in the lease, if it is practicable to determine, or the incremental borrowing rate. Contingent rentals are recognized as an expense in the periods in which they are incurred.
Operating lease rentals payable are recognized as an expense on a straight-line basis over the lease term, which commences when the lessee controls the physical use of the property. Lease incentives are treated as a reduction of rental expense and are also recognized over the lease term on a straight-line basis. Contingent rentals arising under operating leases are recognized as an expense in the period in which they are incurred.
Sale-Leaseback Arrangements
If a sale-leaseback transaction results in a finance lease, any excess of sales proceeds over the carrying amount of the asset is not immediately recognized as income by a seller-lessee but is deferred and amortized over the lease term.
| | | | |
| Deutsche Bank | | 02 – Consolidated Financial Statements | | 269 |
| Financial Report 2012 | | Notes to the Consolidated Financial Statements | | |
| | 01 – Significant Accounting Policies | | |
| | |
| | | | |
| | |
| | | | |
If a sale-leaseback transaction results in an operating lease, the timing of the profit recognition is a function of the difference between the sales price and fair value. When it is clear that the sales price is at fair value, the profit (the difference between the sales price and carrying value) is recognized immediately. If the sales price is below fair value, any profit or loss is recognized immediately, except that if the loss is compensated for by future lease payments at below market price, it is deferred and amortized in proportion to the lease payments over the period the asset is expected to be used. If the sales price is above fair value, the excess over fair value is deferred and amortized over the period the asset is expected to be used.
Employee Benefits
Pension Benefits
The Group provides a number of pension plans. In addition to defined contribution plans, there are retirement benefit plans accounted for as defined benefit plans. The assets of all the Group’s defined contribution plans are held in independently administered funds. Contributions are generally determined as a percentage of salary and are expensed based on employee services rendered, generally in the year of contribution.
All retirement benefit plans accounted for as defined benefit plans are valued using the projected unit-credit method to determine the present value of the defined benefit obligation and the related service costs. Under this method, the determination is based on actuarial calculations which include assumptions about demographics, salary increases and interest and inflation rates. Actuarial gains and losses are recognized in shareholders’ equity and presented in the consolidated statement of comprehensive income in the period in which they occur. The majority of the Group’s benefit plans are funded.
Other Post-Employment Benefits
In addition, the Group maintains unfunded contributory post-employment medical plans for a number of current and retired employees who are mainly located in the United States. These plans pay stated percentages of eligible medical and dental expenses of retirees after a stated deductible has been met. The Group funds these plans on a cash basis as benefits are due. Analogous to retirement benefit plans these plans are valued using the projected unit-credit method. Actuarial gains and losses are recognized in full in the period in which they occur in shareholders’ equity and presented in the consolidated statement of comprehensive income.
Refer to Note 34 “Employee Benefits” for further information on the accounting for pension benefits and other post-employment benefits.
Termination benefits
Termination benefits arise when employment is terminated by the Group before the normal retirement date or whenever an employee accepts voluntary redundancy in exchange for these benefits. The Group recognizes termination benefits as a liability and an expense if the Group is demonstrably committed to a detailed formal plan without realistic possibility of withdrawal. In the case of an offer made to encourage voluntary redundancy, termination benefits are measured based on the number of employees expected to accept the offer. Benefits falling due more than twelve months after the end of the reporting period are discounted to their present value. The discount rate is determined by reference to market yields on high-quality corporate bonds.
Share-Based Compensation
Compensation expense for awards classified as equity instruments is measured at the grant date based on the fair value of the share-based award. For share awards, the fair value is the quoted market price of the share reduced by the present value of the expected dividends that will not be received by the employee and adjusted for the effect, if any, of restrictions beyond the vesting date. In case an award is modified such that its fair value immediately after modification exceeds its fair value immediately prior to modification, a remeasurement takes place and the resulting increase in fair value is recognized as additional compensation expense.
The Group records the offsetting amount to the recognized compensation expense in additional paid-in capital (“APIC”). Compensation expense is recorded on a straight-line basis over the period in which employees perform
| | | | |
| Deutsche Bank | | 02 – Consolidated Financial Statements | | 270 |
| Financial Report 2012 | | Notes to the Consolidated Financial Statements | | |
| | 01 – Significant Accounting Policies | | |
| | |
| | | | |
| | |
| | | | |
services to which the awards relate or over the period of the tranches for those awards delivered in tranches. Estimates of expected forfeitures are periodically adjusted in the event of actual forfeitures or for changes in expectations. The timing of expense recognition relating to grants which, due to early retirement provisions, include a nominal but nonsubstantive service period are accelerated by shortening the amortization period of the expense from the grant date to the date when the employee meets the eligibility criteria for the award, and not the vesting date. For awards that are delivered in tranches, each tranche is considered a separate award and amortized separately.
Compensation expense for share-based awards payable in cash is remeasured to fair value at each balance sheet date and recognized over the vesting period in which the related employee services are rendered. The related obligations are included in other liabilities until paid.
Obligations to Purchase Common Shares
Forward purchases of Deutsche Bank shares, and written put options where Deutsche Bank shares are the underlying, are reported as obligations to purchase common shares if the number of shares is fixed and physical settlement for a fixed amount of cash is required. At inception the obligation is recorded at the present value of the settlement amount of the forward or option. For forward purchases and written put options of Deutsche Bank shares, a corresponding charge is made to shareholders’ equity and reported as equity classified as an obligation to purchase common shares.
The liabilities are accounted for on an accrual basis, and interest costs, which consist of time value of money and dividends, on the liability are reported as interest expense. Upon settlement of such forward purchases and written put options, the liability is extinguished and the charge to equity is reclassified to common shares in treasury.
Deutsche Bank common shares subject to such forward contracts are not considered to be outstanding for purposes of basic earnings per share calculations, but are for dilutive earnings per share calculations to the extent that they are, in fact, dilutive.
Put and call option contracts with Deutsche Bank shares as the underlying where the number of shares is fixed and physical settlement is required are not classified as derivatives. They are transactions in the Group’s equity. All other derivative contracts in which Deutsche Bank shares are the underlying are recorded as financial assets or liabilities at fair value through profit or loss.
Income Taxes
The Group recognizes the current and deferred tax consequences of transactions that have been included in the consolidated financial statements using the provisions of the respective jurisdictions’ tax laws. Current and deferred taxes are charged or credited to other comprehensive income if the tax relates to items that are charged or credited directly to other comprehensive income.
Deferred tax assets and liabilities are recognized for future tax consequences attributable to temporary differences between the financial statement carrying amounts of existing assets and liabilities and their respective tax bases, unused tax losses and unused tax credits. Deferred tax assets are recognized only to the extent that it is probable that sufficient taxable profit will be available against which those unused tax losses, unused tax credits and deductible temporary differences can be utilized.
Deferred tax assets and liabilities are measured based on the tax rates that are expected to apply in the period that the asset is realized or the liability is settled, based on tax rates and tax laws that have been enacted or substantively enacted at the balance sheet date.
Current tax assets and liabilities are offset when (1) they arise from the same tax reporting entity or tax group of reporting entities, (2) the legally enforceable right to offset exists and (3) they are intended to be settled net or realized simultaneously.
| | | | |
| Deutsche Bank | | 02 – Consolidated Financial Statements | | 271 |
| Financial Report 2012 | | Notes to the Consolidated Financial Statements | | |
| | 01 – Significant Accounting Policies | | |
| | |
| | | | |
| | |
| | | | |
Deferred tax assets and liabilities are offset when the legally enforceable right to offset current tax assets and liabilities exists and the deferred tax assets and liabilities relate to income taxes levied by the same taxing authority on either the same tax reporting entity or tax group of reporting entities.
Deferred tax liabilities are provided on taxable temporary differences arising from investments in subsidiaries, branches and associates and interests in joint ventures except when the timing of the reversal of the temporary difference is controlled by the Group and it is probable that the difference will not reverse in the foreseeable future. Deferred income tax assets are provided on deductible temporary differences arising from such investments only to the extent that it is probable that the differences will reverse in the foreseeable future and sufficient taxable income will be available against which those temporary differences can be utilized.
Deferred tax related to fair value re-measurement of AFS investments, cash flow hedges and other items, which are charged or credited directly to other comprehensive income, is also credited or charged directly to other comprehensive income and subsequently recognized in the consolidated statement of income once the underlying gain or loss to which the deferred tax relates is realized.
For share-based payment transactions, the Group may receive a tax deduction related to the compensation paid in shares. The amount deductible for tax purposes may differ from the cumulative compensation expense recorded. At any reporting date, the Group must estimate the expected future tax deduction based on the current share price. If the amount deductible, or expected to be deductible, for tax purposes exceeds the cumulative compensation expense, the excess tax benefit is recognized directly in equity. If the amount deductible, or expected to be deductible, for tax purposes is less than the cumulative compensation expense, the shortfall is recognized in the Group’s consolidated statement of income for the period.
The Group’s insurance business in the United Kingdom (Abbey Life Assurance Company Limited) is subject to income tax on its policyholder’s investment returns (policyholder tax). This tax is included in the Group’s income tax expense/benefit even though it is economically the income tax expense/benefit of the policyholder, which reduces/increases the Group’s liability to the policyholder.
Provisions
Provisions are recognized if the Group has a present legal or constructive obligation as a result of past events, if it is probable that an outflow of resources will be required to settle the obligation, and a reliable estimate can be made of the amount of the obligation.
The amount recognized as a provision is the best estimate of the consideration required to settle the present obligation as of the balance sheet date, taking into account the risks and uncertainties surrounding the obligation.
If the effect of the time value of money is material, provisions are discounted and measured at the present value of the expenditure expected to be required to settle the obligation, using a pre-tax rate that reflects the current market assessments of the time value of money and the risks specific to the obligation. The increase in the provision due to the passage of time is recognized as interest expense.
When some or all of the economic benefits required to settle a provision are expected to be recovered from a third party (for example, because the obligation is covered by an insurance policy), an asset is recognized if it is virtually certain that reimbursement will be received.
Consolidated Statement of Cash Flows
For purposes of the consolidated statement of cash flows, the Group’s cash and cash equivalents include highly liquid investments that are readily convertible into cash and which are subject to an insignificant risk of change in value. Such investments include cash and balances at central banks and demand deposits with banks.
The Group’s assignment of cash flows to the operating, investing or financing category depends on the business model (“management approach”). For the Group the primary operating activity is to manage financial assets
| | | | |
| Deutsche Bank | | 02 – Consolidated Financial Statements | | 272 |
| Financial Report 2012 | | Notes to the Consolidated Financial Statements | | |
| | 01 – Significant Accounting Policies | | |
| | |
| | | | |
| | |
| | | | |
and financial liabilities. Therefore, the issuance and management of long-term borrowings is a core operating activity which is different than for a non-financial company, where borrowing is not a principal revenue producing activity and thus is part of the financing category.
The Group views the issuance of senior long-term debt as an operating activity. Senior long-term debt comprises structured notes and asset-backed securities, which are designed and executed by CB&S business lines and which are revenue generating activities. The other component is debt issued by Treasury, which is considered interchangeable with other funding sources; all of the funding costs are allocated to business activities to establish their profitability.
Cash flows related to subordinated long-term debt and trust preferred securities are viewed differently than those related to senior-long term debt because they are managed as an integral part of the Group’s capital, primarily to meet regulatory capital requirements. As a result they are not interchangeable with other operating liabilities, but can only be interchanged with equity and thus are considered part of the financing category.
The amounts shown in the consolidated statement of cash flows do not precisely match the movements in the consolidated balance sheet from one period to the next as they exclude non-cash items such as movements due to foreign exchange translation and movements due to changes in the group of consolidated companies.
Movements in balances carried at fair value through profit or loss represent all changes affecting the carrying value. This includes the effects of market movements and cash inflows and outflows. The movements in balances carried at fair value are usually presented in operating cash flows.
Insurance
The Group’s insurance business issues two types of contracts:
Insurance Contracts – These are annuity and universal life contracts under which the Group accepts significant insurance risk from another party (the policyholder) by agreeing to compensate the policyholder if a specific uncertain future event adversely affects the policyholder. Such contracts remain insurance contracts until all rights and obligations are extinguished or expire. As allowed by IFRS, the Group retained the accounting policies for insurance contracts which it applied prior to the adoption of IFRS (U.S. GAAP) as described further below.
Non-Participating Investment Contracts (“Investment Contracts”) – These contracts do not contain significant insurance risk or discretionary participation features. These are measured and reported consistently with other financial liabilities, which are classified as financial liabilities at fair value through profit or loss.
Financial assets held to back annuity contracts have been classified as AFS. Financial assets held for other insurance and investment contracts have been designated as fair value through profit or loss under the fair value option.
Insurance Contracts
Premiums for single premium business are recognized as income when received. This is the date from which the policy is effective. For regular premium contracts, receivables are recognized at the date when payments are due. Premiums are shown before deduction of commissions. When policies lapse due to non-receipt of premiums, all related premium income accrued but not received from the date they are deemed to have lapsed, net of related expense, is offset against premiums.
Claims are recorded as an expense when incurred, and reflect the cost of all claims arising during the year, including policyholder profit participations allocated in anticipation of a participation declaration.
The aggregate policy reserves for universal life insurance contracts are equal to the account balance, which represents premiums received and investment returns credited to the policy, less deductions for mortality costs
| | | | |
| Deutsche Bank | | 02 – Consolidated Financial Statements | | 273 |
| Financial Report 2012 | | Notes to the Consolidated Financial Statements | | |
| | 01 – Significant Accounting Policies | | |
| | |
| | | | |
| | |
| | | | |
and expense charges. For other unit-linked insurance contracts the policy reserve represents the fair value of the underlying assets.
For annuity contracts, the liability is calculated by estimating the future cash flows over the duration of the in force contracts discounted back to the valuation date allowing for the probability of occurrence. The assumptions are fixed at the date of acquisition with suitable provisions for adverse deviations (“PADs”). This calculated liability value is tested against a value calculated using best estimate assumptions and interest rates based on the yield on the amortized cost of the underlying assets. Should this test produce a higher value, the liability amount would be reset.
Aggregate policy reserves include liabilities for certain options attached to the Group’s unit-linked pension products. These liabilities are calculated based on contractual obligations using actuarial assumptions.
Liability adequacy tests are performed for the insurance portfolios on the basis of estimated future claims, costs, premiums earned and proportionate investment income. For long duration contracts, if actual experience regarding investment yields, mortality, morbidity, terminations or expenses indicates that existing contract liabilities, along with the present value of future gross premiums, will not be sufficient to cover the present value of future benefits and to recover deferred policy acquisition costs, then a premium deficiency is recognized.
The costs directly attributable to the acquisition of incremental insurance and investment business are deferred to the extent that they are expected to be recoverable out of future margins in revenues on these contracts. These costs will be amortized systematically over a period no longer than that in which they are expected to be recovered out of these future margins.
Investment Contracts
All of the Group’s investment contracts are unit-linked. These contract liabilities are determined using current unit prices multiplied by the number of units attributed to the contract holders as of the balance sheet date.
As this amount represents fair value, the liabilities have been classified as financial liabilities at fair value through profit or loss. Deposits collected under investment contracts are accounted for as an adjustment to the investment contract liabilities. Investment income attributable to investment contracts is included in the consolidated statement of income. Investment contract claims reflect the excess of amounts paid over the account balance released. Investment contract policyholders are charged fees for policy administration, investment management, surrenders or other contract services.
The financial assets for investment contracts are recorded at fair value with changes in fair value, and offsetting changes in the fair value of the corresponding financial liabilities, recorded in profit or loss.
Reinsurance
Premiums ceded for reinsurance and reinsurance recoveries on policyholder benefits and claims incurred are reported in income and expense as appropriate. Assets and liabilities related to reinsurance are reported on a gross basis when material. Amounts ceded to reinsurers from reserves for insurance contracts are estimated in a manner consistent with the reinsured risk. Accordingly, revenues and expenses related to reinsurance agreements are recognized in a manner consistent with the underlying risk of the business reinsured.
All new material reinsurance arrangements are subject to local Board approval. Once transacted they are subject to regular credit risk review including an assessment of the full exposure and any lending and collateral provision. Impairment is determined in accordance with the Group’s accounting policy “Impairment of Financial Assets”.
| | | | |
| Deutsche Bank | | 02 – Consolidated Financial Statements | | 274 |
| Financial Report 2012 | | Notes to the Consolidated Financial Statements | | |
| | 02 – Critical Accounting Estimates | | |
| | |
| | | | |
| | |
| | | | |
02 –
Critical Accounting Estimates
Certain of the accounting policies described in Note 01 “Significant Accounting Policies” require critical accounting estimates that involve complex and subjective judgments and the use of assumptions, some of which may be for matters that are inherently uncertain and susceptible to change. Such critical accounting estimates could change from period to period and may have a material impact on the Group’s financial condition, changes in financial condition or results of operations. Critical accounting estimates could also involve estimates where management could have reasonably used another estimate in the current accounting period. The Group has identified the following significant accounting policies that involve critical accounting estimates.
Fair Value Estimates
Fair value is defined as the price at which an asset or liability could be exchanged in an arm’s length transaction between knowledgeable, willing parties, other than in a forced or liquidation sale.
In reaching estimates of fair value, management judgment needs to be exercised. The areas requiring significant management judgment are identified, documented and reported to senior management as part of the valuation control framework and the standard monthly reporting cycle. The Group’s specialist model validation and valuation groups focus attention on the areas of subjectivity and judgment.
The level of management judgment required in establishing fair value of financial instruments for which there is a quoted price in an active market is minimal. Similarly there is little subjectivity or judgment required for instruments valued using valuation models that are standard across the industry and where all parameter inputs are quoted in active markets.
The level of subjectivity and degree of management judgment required is more significant for those instruments valued using specialized and sophisticated models and those where some or all of the parameter inputs are not observable. Management judgment is required in the selection and application of appropriate parameters, assumptions and modeling techniques. In particular, where data are obtained from infrequent market transactions extrapolation and interpolation techniques must be applied. In addition, where no market data are available, parameter inputs are determined by assessing other relevant sources of information such as historical data, fundamental analysis of the economics of the transaction and proxy information from similar transactions with appropriate adjustments to reflect the terms of the actual instrument being valued and current market conditions. Where different valuation techniques indicate a range of possible fair values for an instrument, management has to establish what point within the range of estimates best represents fair value. Further, some valuation adjustments may require the exercise of management judgment to achieve fair value.
Methods of Determining Fair Value
A substantial percentage of the Group’s financial assets and liabilities carried at fair value are based on, or derived from, observable prices or inputs. The availability of observable prices or inputs varies by product and market, and may change over time. For example, observable prices or inputs are usually available for: liquid securities; exchange traded derivatives; over-the-counter (OTC) derivatives transacted in liquid trading markets such as interest rate swaps, foreign exchange forward and option contracts in G7 currencies; and equity swap and option contracts on listed securities or indices. If observable prices or inputs are available, they are utilized in the determination of fair value and, as such, fair value can be determined without significant judgment. This includes instruments for which the fair value is derived from a valuation model that is standard across the industry and the inputs are directly observable. This is the case for many generic swap and option contracts.
In other markets or for certain instruments, observable prices or inputs are not available, and fair value is determined using valuation techniques appropriate for the particular instrument. For example, instruments subject to valuation techniques include: trading loans and other loans or loan commitments designated at fair value through profit or loss, under the fair value option; new, complex and long-dated OTC derivatives; transactions
| | | | |
| Deutsche Bank | | 02 – Consolidated Financial Statements | | 275 |
| Financial Report 2012 | | Notes to the Consolidated Financial Statements | | |
| | 02 – Critical Accounting Estimates | | |
| | |
| | | | |
| | |
| | | | |
in immature or limited markets; distressed debt securities and loans; private equity securities and retained interests in securitizations of financial assets. The application of valuation techniques to determine fair value involves estimation and management judgment, the extent of which will vary with the degree of complexity and liquidity in the market. Valuation techniques include industry standard models based on discounted cash flow analysis, which are dependent upon estimated future cash flows and the discount rate used. For more complex products, the valuation models include more complex modeling techniques, parameters and assumptions, such as volatility, correlation, prepayment speeds, default rates and loss severity. Management judgment is required in the selection and application of the appropriate parameters, assumptions and modeling techniques. Because the objective of using a valuation technique is to establish the price at which market participants would currently transact, the valuation techniques incorporate all factors that the Group believes market participants would consider in setting a transaction price.
Valuation adjustments are an integral part of the fair value process that requires the exercise of judgment. In making appropriate valuation adjustments, the Group follows methodologies that consider factors such as bid-offer spread valuation adjustments, liquidity, and credit risk (both counterparty credit risk in relation to financial assets and the Group’s own credit risk in relation to financial liabilities which are at fair value through profit or loss).
Under IFRS, if there are significant unobservable inputs used in the valuation technique as of the trade date the financial instrument is recognized at the transaction price and any trade date profit is deferred. Management judgment is required in determining whether there exist significant unobservable inputs in the valuation technique. Once deferred the decision to subsequently recognize the trade date profit requires a careful assessment of the then current facts and circumstances supporting observability of parameters and/or risk mitigation.
The Group has established internal control procedures over the valuation process to provide assurance over the appropriateness of the fair values applied. If fair value is determined by valuation models, the assumptions and techniques within the models are independently validated by a specialist group. Price and parameter inputs, assumptions and valuation adjustments are subject to verification and review processes. If the price and parameter inputs are observable, they are verified against independent sources.
If prices and parameter inputs or assumptions are not observable, the appropriateness of fair value is subject to additional procedures to assess its reasonableness. Such procedures include performing revaluations using independently generated models, assessing the valuations against appropriate proxy instruments, performing sensitivity analysis and extrapolation techniques, and considering other benchmarks. Assessment is made as to whether the valuation techniques yield fair value estimates that are reflective of the way the market operates by calibrating the results of the valuation models against market transactions. These procedures require the application of management judgment.
Other valuation controls include review and analysis of daily profit and loss, validation of valuation through close out profit and loss and Value-at-Risk back-testing.
Fair Value Estimates Used in Disclosures
Under IFRS, the financial assets and liabilities carried at fair value are required to be disclosed according to the valuation method used to determine their fair value. Specifically, segmentation is required between those valued using quoted market prices in an active market (level 1), valuation techniques based on observable parameters (level 2) and valuation techniques using significant unobservable parameters (level 3). This disclosure is provided in Note 15 “Financial Instruments carried at Fair Value”. Management judgment is required in determining the category to which certain instruments should be allocated. This specifically arises when the valuation is determined by a number of parameters, some of which are observable and others are not. Further, the classification of an instrument can change over time to reflect changes in market liquidity and therefore price transparency.
| | | | |
| Deutsche Bank | | 02 – Consolidated Financial Statements | | 276 |
| Financial Report 2012 | | Notes to the Consolidated Financial Statements | | |
| | 02 – Critical Accounting Estimates | | |
| | |
| | | | |
| | |
| | | | |
In addition to the fair value hierarchy disclosure in Note 15 “Financial Instruments carried at Fair Value”, the Group provides a sensitivity analysis of the impact upon the level 3 financial instruments of using a reasonably possible alternative for the unobservable parameter. The determination of reasonably possible alternatives requires significant management judgment.
For financial instruments measured at amortized cost (which includes loans, deposits and short and long term debt issued) the Group discloses the fair value. This disclosure is provided in Note 16 “Fair Value of Financial Instruments not carried at Fair Value”. Generally there is limited or no trading activity in these instruments and therefore the fair value determination requires significant management judgment.
Reclassification of Financial Assets
The Group classifies financial assets into the following categories: financial assets at fair value through profit or loss, financial assets AFS or loans. The appropriate classification of financial assets is determined at the time of initial recognition. In addition, under the amendments to IAS 39 and IFRS 7, “Reclassification of Financial Assets” which were approved by the IASB and endorsed by the EU in October 2008, it is permissible to reclassify certain financial assets out of financial assets at fair value through profit or loss (trading assets) and the AFS classifications into the loans classification. For assets to be reclassified there must be a clear change in management intent with respect to the assets since initial recognition and the financial asset must meet the definition of a loan at the reclassification date. Additionally, there must be an intent and ability to hold the asset for the foreseeable future at the reclassification date. There is no ability for subsequent reclassification back to the trading or AFS classifications. Refer to Note 14 “Amendments to IAS 39 and IFRS 7, ‘Reclassification of Financial Assets’” for further information on the assets reclassified by the Group.
Significant management judgment and assumptions are required to identify assets eligible under the amendments for which expected repayment exceeds estimated fair value. Significant management judgment and assumptions are also required to estimate the fair value of the assets identified (as described in “Fair Value Estimates”) at the date of reclassification, which becomes the amortized cost base under the loan classification. The task facing management in both these matters can be particularly challenging in the highly volatile and uncertain economic and financial market conditions such as those which existed in the third and fourth quarters of 2008. The change of intent to hold for the foreseeable future is another matter requiring significant management judgment. The change in intent is not simply determined because of an absence of attractive prices nor is foreseeable future defined as the period until the return of attractive prices. Refer to Note 01 “Significant Accounting Policies” section “Reclassification of Financial Assets” for the Group’s minimum requirements for what constitutes foreseeable future.
Impairment of Loans and Provision for Off-Balance Sheet Positions
The accounting estimates and judgments related to the impairment of loans and provision for off-balance sheet positions is a critical accounting estimate for the Corporate Banking & Securities (CB&S) and Private & Business Clients (PBC) Corporate Divisions because the underlying assumptions used for both the individually and collectively assessed impairment can change from period to period and may significantly affect the Group’s results of operations.
In assessing assets for impairment, management judgment is required, particularly in circumstances of economic and financial uncertainty, such as those of the recent financial crisis, when developments and changes to expected cash flows can occur both with greater rapidity and less predictability.
The determination of the impairment allowance required for loans which are deemed to be individually significant often requires the use of considerable management judgment concerning such matters as local economic conditions, the financial performance of the counterparty and the value of any collateral held, for which there may not be a readily accessible market. In certain situations, such as for certain leveraged loans, the Group may assess the enterprise value of the borrower to assess impairment. This requires use of considerable management judgment regarding timing of exit and the market value of the borrowing entity. The actual amount of the future cash flows and their timing may differ from the estimates used by management and consequently may cause actual losses to differ from the reported allowances.
| | | | |
| Deutsche Bank | | 02 – Consolidated Financial Statements | | 277 |
| Financial Report 2012 | | Notes to the Consolidated Financial Statements | | |
| | 02 – Critical Accounting Estimates | | |
| | |
| | | | |
| | |
| | | | |
The impairment allowance for portfolios of smaller-balance homogenous loans, such as those to individuals and small business customers of the private and retail business, and for those loans which are individually significant but for which no objective evidence of impairment exists, is determined on a collective basis. The collective impairment allowance is calculated on a portfolio basis using statistical models which incorporate numerous estimates and judgments. The Group performs a regular review of the models and underlying data and assumptions. The probability of defaults, loss recovery rates, and judgments concerning the ability of borrowers in foreign countries to transfer the foreign currency necessary to comply with debt repayments, among other things, are all taken into account during this review. For further discussion of the methodologies used to determine the Group’s allowance for credit losses, see Note 01 “Significant Accounting Policies”. The quantitative disclosures are provided in Note 19 “Loans” and Note 20 “Allowance for Credit Losses”.
Impairment of Other Financial Assets
Equity method investments and financial assets classified as AFS are evaluated for impairment on a quarterly basis, or more frequently if events or changes in circumstances indicate that these assets are impaired. If there is objective evidence of an impairment of an associate or jointly-controlled entity, an impairment test is performed by comparing the investment’s recoverable amount, which is the higher of its value in use and fair value less costs to sell, with its carrying amount. In the case of equity investments classified as AFS, objective evidence of impairment would include a significant or prolonged decline in fair value of the investment below cost. It could also include specific conditions in an industry or geographical area or specific information regarding the financial condition of the company, such as a downgrade in credit rating. In the case of debt securities classified as AFS, impairment is assessed based on the same criteria as for loans. If information becomes available after the Group makes its evaluation, the Group may be required to recognize impairment in the future. Because the estimate for impairment could change from period to period based upon future events that may or may not occur, the Group considers this to be a critical accounting estimate. For additional information see Note 08 “Net Gains (Losses) on Financial Assets Available for Sale” and Note 18 “Equity Method Investments”.
Impairment of Non-financial Assets
Non-financial assets are generally subject to impairment review at each quarterly reporting date. Goodwill and other intangible assets with an indefinite useful life are tested for impairment at least on an annual basis irrespective of whether indicators of impairment exist, or more frequently if events or changes in circumstances, such as an adverse change in business climate, indicate that these assets may be impaired. The Group records impairment losses on assets in this category when the Group believes that their carrying value may not be recoverable. At each reporting date the Group assesses whether there is an indication that a previously recognized impairment loss has reversed. If there is such an indication and the recoverable amount of the impaired asset subsequently increases, then the reversal of an impairment loss (excluding goodwill) is recognized immediately.
The determination of the recoverable amount in the impairment assessment requires estimates based on quoted market prices, prices of comparable businesses, present value or other valuation techniques, or a combination thereof, necessitating management to make subjective judgments and assumptions. Because these estimates and assumptions could result in significant differences to the amounts reported if underlying circumstances were to change, the Group considers this estimate to be critical.
The quantitative disclosures are provided in Note 25 “Goodwill and Other Intangible Assets”.
Deferred Tax Assets
In determining the amount of deferred tax assets, the Group uses historical tax capacity and profitability information and, if relevant, forecasted operating results based upon approved business plans, including a review of the eligible carry-forward periods, available tax planning opportunities and other relevant considerations. Each quarter, the Group re-evaluates its estimate related to deferred tax assets, including its assumptions about future profitability.
| | | | |
| Deutsche Bank | | 02 – Consolidated Financial Statements | | 278 |
| Financial Report 2012 | | Notes to the Consolidated Financial Statements | | |
| | 03 – Recently Adopted and New Accounting Pronouncements | | |
| | |
| | | | |
| | |
| | | | |
The Group believes that the accounting estimate related to the deferred tax assets is a critical accounting estimate because the underlying assumptions can change from period to period and requires significant management judgment. For example, tax law changes or variances in future projected operating performance could result in a change of the deferred tax asset. If the Group was not able to realize all or part of its net deferred tax assets in the future, an adjustment to its deferred tax assets would be charged to income tax expense or directly to equity in the period such determination was made. If the Group was to recognize previously unrecognized deferred tax assets in the future, an adjustment to its deferred tax asset would be credited to income tax expense or directly to equity in the period such determination was made.
For further information on the Group’s deferred taxes (including quantitative disclosures on recognized deferred tax assets) see Note 35 “Income Taxes”.
Legal and Regulatory Contingencies and Uncertain Tax Positions
The Group conducts its business in many different legal, regulatory and tax environments, and, accordingly, legal claims, regulatory proceedings or uncertain income tax positions may arise.
The use of estimates is important in determining provisions for potential losses that may arise from litigation, regulatory proceedings and uncertain income tax positions. The Group estimates and provides for potential losses that may arise out of litigation, regulatory proceedings and uncertain income tax positions to the extent that such losses are probable and can be estimated, in accordance with IAS 37, “Provisions, Contingent Liabilities and Contingent Assets” or IAS 12, “Income Taxes”, respectively. Significant judgment is required in making these estimates and the Group’s final liabilities may ultimately be materially different.
Contingencies in respect of legal matters are subject to many uncertainties and the outcome of individual matters is not predictable with assurance. Significant judgment is required in assessing probability and making estimates in respect of contingencies, and the Group’s final liability may ultimately be materially different. The Group’s total liability in respect of litigation, arbitration and regulatory proceedings is determined on a case-by-case basis and represents an estimate of probable losses after considering, among other factors, the progress of each case, the Group’s experience and the experience of others in similar cases, and the opinions and views of legal counsel. Predicting the outcome of the Group’s litigation matters is inherently difficult, particularly in cases in which claimants seek substantial or indeterminate damages. See Note 29 “Provisions” for information on the Group’s judicial, regulatory and arbitration proceedings.
03 –
Recently Adopted and New Accounting Pronouncements
Recently Adopted Accounting Pronouncements
The following are those accounting pronouncements which are relevant to the Group and which have been adopted during 2012 in the preparation of these consolidated financial statements.
IFRS 7
In October 2010, the IASB issued amendments to IFRS 7, “Disclosures – Transfers of Financial Assets”. The amendments comprise additional disclosures on transfer transactions of financial assets (for example, securitizations), including possible effects of any risks and rewards that may remain with the transferor of the assets. Additional disclosures are also required if a disproportionate amount of transfer transactions are undertaken around the end of a reporting period. The amendments were effective for annual periods beginning on or after July 1, 2011. The adoption of the amendments in the 2012 year-end financial statements did not have a material impact on the Group’s consolidated financial statements.
| | | | |
| Deutsche Bank | | 02 – Consolidated Financial Statements | | 279 |
| Financial Report 2012 | | Notes to the Consolidated Financial Statements | | |
| | 03 – Recently Adopted and New Accounting Pronouncements | | |
| | |
| | | | |
| | |
| | | | |
New Accounting Pronouncements
The following accounting pronouncements were not effective as of December 31, 2012 and therefore have not been applied in preparing these financial statements.
IAS 1
In June 2011, the IASB issued amendments to IAS 1, “Presentation of Financial Statements” to require companies to group together items within other comprehensive income (“OCI”) that may be reclassified to the statement of income. The amendments also reaffirm existing requirements that items in OCI and profit or loss should be presented as either a single statement or two separate statements. The amendments are effective for annual periods beginning on or after July 1, 2012. The standard has been endorsed by the EU. The adoption of the amendments is not expected to have a material impact on the presentation of other comprehensive income in the Group’s consolidated financial statements.
IFRS 10, IFRS 11, IFRS 12, IAS 27 and IAS 28
In May 2011, the IASB issued IFRS 10, “Consolidated Financial Statements”, IFRS 11, “Joint Arrangements”, IFRS 12, “Disclosure of Interests in Other Entities”, a revised version of IAS 27, “Separate Financial Statements”, and a revised version of IAS 28, “Investment in Associates and Joint Ventures” which have been amended for conforming changes based on the issuance of IFRS 10 and IFRS 11. In June 2012, the IASB issued amendments to the transition guidance for IFRS 10-12 which provides relief from all but the prior year comparative periods which need to be restated. Additionally, for IFRS 12, no comparatives are required for disclosures relating to unconsolidated structured entities.
IFRS 10 replaces IAS 27, “Consolidated and Separate Financial Statements” and SIC-12, “Consolidation – Special Purpose Entities”, and establishes a single control model that applies to all entities, including those that were previously considered special purpose entities under SIC-12. An investor controls an investee when it has power over the relevant activities, exposure to variable returns from the investee, and the ability to affect those returns through its power over the investee. The assessment of control is based on all facts and circumstances and the conclusion is reassessed if there is an indication that there are changes in facts and circumstances.
IFRS 11 supersedes IAS 31, “Interests in Joint Ventures” and SIC-13, “Jointly-controlled Entities – Nonmonetary Contributions by Venturers”. IFRS 11 classifies joint arrangements as either joint operations or joint ventures and focuses on the nature of the rights and obligations of the arrangement. IFRS 11 requires the use of the equity method of accounting for joint arrangements by eliminating the option to use the proportionate consolidation method, which is not applied by the Group.
IFRS 12 requires an entity to disclose the nature, associated risks, and financial effects of interests in subsidiaries, joint arrangements, associates and unconsolidated structured entities. IFRS 12 requires more comprehensive disclosure in comparison to IAS 27 or SIC-12.
Each of the standards are effective for annual periods beginning on or after January 1, 2013, with earlier application permitted as long as each of the other standards are also applied early. However, entities are permitted to include any of the disclosure requirements in IFRS 12 into their consolidated financial statements without early adoption of IFRS 12. According to the EU endorsement entities shall apply each of the standards , at the latest, for annual periods beginning on or after January 1, 2014. The Group will apply each of the standards in 2013. While approved by the IASB, the transition guidance for IFRS 10-12 has yet to be endorsed by the EU. The adoption of IFRS 10, IFRS 11 and IFRS 12 is not expected to have a material impact on the Group’s consolidated financial statements.
IAS 19
In June 2011, the IASB issued amendments to IAS 19, “Employee Benefits” (“IAS 19 R”) effective for annual periods beginning on or after January 1, 2013. IAS 19 R introduces the net interest approach which is based on the discount rate used to measure the defined benefit obligation multiplied by the net defined benefit
| | | | |
| Deutsche Bank | | 02 – Consolidated Financial Statements | | 280 |
| Financial Report 2012 | | Notes to the Consolidated Financial Statements | | |
| | 03 – Recently Adopted and New Accounting Pronouncements | | |
| | |
| | | | |
| | |
| | | | |
asset/liability recognized on the balance sheet, both as determined at the start of the reporting period and adjusted for expected changes in the net defined benefit asset/liability due to contributions and benefit payments during the year. This measure of net interest cost replaces the interest cost on the defined benefit obligation and the expected return on plan assets. The standard also requires immediate recognition of re-measurement effects associated with all post-employment benefits through other comprehensive income such as actuarial gains and losses and any deviations between the actual return on plan assets and the return implied by the net interest cost, which is already consistent with the Group’s existing accounting policy. In addition, IAS 19 R requires immediate recognition of any past service cost and will enhance the disclosure requirements for defined benefit plans. The standard has been endorsed by the EU. As required, the Group will adopt the new standard retrospectively for annual periods beginning on or after January 1, 2013. The adoption of the amendments to IAS 19 R is not expected to have a material impact on the consolidated financial statements.
IFRS 13
In May 2011, the IASB issued IFRS 13, “Fair Value Measurement” which establishes a single source of guidance for fair value measurement under IFRS. IFRS 13 provides a revised definition of fair value and guidance on how it should be applied where its use is already required or permitted by other standards within IFRS and introduces more comprehensive disclosure requirements on fair value measurement. IFRS 13 is effective for annual periods beginning on or after January 1, 2013. The standard has been endorsed by the EU. The impact of IFRS 13 is not material to the Group.
Improvements to IFRS 2009-2011 Cycle
In May 2012, the IASB issued amendments to IFRS, which resulted from the IASB’s annual improvement project. They comprise amendments that result in accounting changes for presentation, recognition or measurement purposes as well as terminology or editorial amendments related to a variety of individual IFRS standards. The amendments are effective for annual periods beginning on or after January 1, 2013. The amendments have been endorsed by the EU. The adoption of the amendments will not have a material impact on the Group’s consolidated financial statements.
IAS 32 and IFRS 7
In December 2011, the IASB issued amendments to IAS 32, “Offsetting Financial Assets and Financial Liabilities” (“IAS 32 R”) to clarify the requirements for offsetting financial instruments. IAS 32 R clarifies (a) the meaning of an entity’s current legally enforceable right of set-off; and (b) when gross settlement systems may be considered equivalent to net settlement. The amendments are effective for annual periods beginning on or after January 1, 2014, with earlier application permitted.
In December 2011, the IASB also issued amendments to IFRS 7, “Disclosures – Offsetting Financial Assets and Financial Liabilities” (“IFRS 7 R”) requiring extended disclosures to allow investors to better compare financial statements prepared in accordance with IFRS or U.S. GAAP. The amendments are effective for annual periods beginning on or after January 1, 2013 but also interim periods thereafter.
The Group is currently evaluating the potential impact that the adoption of the amendments will have on its consolidated financial statements.
IFRS 9 (2009) and IFRS 9 (2010)
IFRS 9 (2009) – In November 2009, the IASB issued IFRS 9, “Financial Instruments”, as a first step in its project to replace IAS 39, “Financial Instruments: Recognition and Measurement”. IFRS 9 (2009) introduces new requirements for how an entity should classify and measure financial assets that are in the scope of IAS 39. The standard requires all financial assets to be classified on the basis of the entity’s business model for managing the financial assets, and the contractual cash flow characteristics of the financial asset. A financial asset is measured at amortized cost if two criteria are met: (a) the objective of the business model is to hold the financial asset for the collection of the contractual cash flows, and (b) the contractual cash flows under the instrument solely represent payments of principal and interest. Even if a financial asset meets the criteria to be
| | | | |
| Deutsche Bank | | 02 – Consolidated Financial Statements | | 281 |
| Financial Report 2012 | | Notes to the Consolidated Financial Statements | | |
| | 03 – Recently Adopted and New Accounting Pronouncements | | |
| | |
| | | | |
| | |
| | | | |
measured at amortized cost, it can be designated at fair value through profit or loss under the fair value option, if doing so would significantly reduce or eliminate an accounting mismatch. If a financial asset does not meet the business model and contractual terms criteria to be measured at amortized cost, then it is subsequently measured at fair value. IFRS 9 (2009) also removes the requirement to separate embedded derivatives from financial asset hosts. It requires a hybrid contract with a financial asset host to be classified in its entirety at either amortized cost or fair value. IFRS 9 (2009) requires reclassifications when the entity’s business model changes, which is expected to be an infrequent occurrence; in this case, the entity is required to reclassify affected financial assets prospectively. There is specific guidance for contractually linked instruments that create concentrations of credit risk, which is often the case with investment tranches in a securitization. In addition to assessing the instrument itself against the IFRS 9 (2009) classification criteria, management should also ‘look through’ to the underlying pool of instruments that generate cash flows to assess their characteristics. To qualify for amortized cost, the investment must have equal or lower credit risk than the weighted-average credit risk in the underlying pool of instruments, and those instruments must meet certain criteria. If a ‘look through’ is impracticable, the tranche must be classified at fair value through profit or loss. Under IFRS 9 (2009), all equity investments should be measured at fair value. However, management has an option to present in other comprehensive income unrealized and realized fair value gains and losses on equity investments that are not held for trading. Such designation is available on initial recognition on an instrument-by-instrument basis and is irrevocable. There is no subsequent recycling of fair value gains and losses to profit or loss; however, dividends from such investments will continue to be recognized in profit or loss.
IFRS 9 (2010) – In October 2010, the IASB issued a revised version of IFRS 9, “Financial Instruments” (“IFRS 9 (2010)”). The revised standard adds guidance on the classification and measurement of financial liabilities. IFRS 9 (2010) requires entities with financial liabilities designated at fair value through profit or loss to recognize changes in the fair value due to changes in the liability’s credit risk in other comprehensive income. However, if recognizing these changes in other comprehensive income creates an accounting mismatch, an entity would present the entire change in fair value within profit or loss. There is no subsequent recycling of the amounts recorded in other comprehensive income to profit or loss, but accumulated gains or losses may be transferred within equity.
Based on the amendments to IFRS 9 (2009), IFRS 9 (2010) and IFRS 7, “Mandatory Effective Date and Transition Guidance” issued by the IASB in December 2011, IFRS 9 (2009) and IFRS 9 (2010) are effective for annual periods beginning on or after January 1, 2015, with earlier application permitted. Once adopted, IFRS 9 should be applied to all financial instruments outstanding as of the effective date, as if the classification and measurement under IFRS 9 had always applied, but comparative periods do not need to be restated.
For annual periods beginning before January 1, 2015, an entity may elect to apply either IFRS 9 (2009) or IFRS 9 (2010). While approved by the IASB, both IFRS 9 (2009) and IFRS 9 (2010) have yet to be endorsed by the EU.
In November 2012, the IASB issued an Exposure Draft proposing limited modifications to IFRS 9 (2009) and IFRS 9 (2010). It is unclear at this time what modifications will actually be adopted or if this could impact the effective date and EU endorsement.
| | | | |
| Deutsche Bank | | 02 – Consolidated Financial Statements | | 282 |
| Financial Report 2012 | | Notes to the Consolidated Financial Statements | | |
| | 04 – Acquisitions and Dispositions | | |
| | |
| | | | |
| | |
| | | | |
04 –
Acquisitions and Dispositions
Business Combinations completed in 2012
In 2012, the Group did not undertake any acquisitions accounted for as business combinations.
Business Combinations completed in 2011
In 2011, the Group completed several acquisitions that were accounted for as business combinations. Of these transactions none were individually significant and they are therefore presented as an aggregate in the following table.
Fair Value of Assets Acquired and Liabilities Assumed as of the Acquisition Date
| | | | |
in€ m. | | | |
Cash consideration transferred | | | 13 | |
| | | | |
Fair value of call option held to acquire outstanding interests | | | 10 | |
| | | | |
Fair value of contingent consideration | | | 3 | |
| | | | |
Fair value of pre-existing stakes | | | 12 | |
| | | | |
Total purchase consideration, including fair value of the Group’s equity interest held before the business combination | | | 38 | |
| | | | |
| | | | |
| | | | |
Recognized amounts of identifiable assets acquired and liabilities assumed:1 | | | | |
| | | | |
Cash and cash equivalents | | | 1 | |
| | | | |
Interest-earning time deposits with banks | | | 2 | |
| | | | |
Financial assets at fair value through profit or loss | | | 2 | |
| | | | |
All other assets | | | 21 | |
| | | | |
Long-term debt | | | 10 | |
| | | | |
All other liabilities | | | 2 | |
| | | | |
Total identifiable net assets | | | 14 | |
| | | | |
Goodwill | | | 25 | |
| | | | |
Negative goodwill | | | 1 | |
| | | | |
Total identifiable net assets and goodwill acquired, less negative goodwill | | | 38 | |
| |
1 By major class of assets acquired and liabilities assumed.
Among these transactions was the step-acquisition of the outstanding interests in Deutsche UFG Capital Management (“DUCM”), one of Russia’s largest independent asset management companies. The transaction closed on November 11, 2011, following the exercise of a purchase option on the remaining 60 % stake. DUCM was allocated to Asset & Wealth Management (AWM).
Since acquisition, the aggregated contribution in 2011 to the Group’s net revenues and net profit or loss after tax related to these businesses amounted to€ 2 million and less than€ (1) million, respectively. Had these acquisitions all been effective on January 1, 2011, their impact on the Group’s net revenues and net profit or loss after tax for 2011 would have amounted to€ 4 million and less than€ (1) million, respectively.
Business Combinations completed in 2010
Deutsche Postbank
Following the successful conclusion of the voluntary public takeover offer (“PTO”) by Deutsche Bank to the shareholders of Deutsche Postbank AG (“Postbank”), the PTO settled on December 3, 2010 (“closing date”). Together with Postbank shares already held before the PTO, the Group gained control by holding 113.7 million Postbank shares, equal to 51.98 % of all voting rights in Postbank. Accordingly, the Group commenced consolidation of Postbank Group as of December 3, 2010. Taking into account certain financial instruments on Postbank shares held by the Group prior to the closing, as of December 3, 2010, the consolidation of Postbank was based on a total equity interest of 79.40 %.
The following paragraphs provide detailed disclosures on the Postbank acquisition, specifically: a description of Postbank’s business activities and the expected impact from their integration on the Group; the takeover offer; the Deutsche Bank capital increase; the treatment of the Group’s equity investment and other financial instruments on Postbank shares held at the closing date; a domination and profit and loss transfer agreement with Postbank; the purchase price allocation and other acquisition-related information.
| | | | |
| Deutsche Bank | | 02 – Consolidated Financial Statements | | 283 |
| Financial Report 2012 | | Notes to the Consolidated Financial Statements 04 – Acquisitions and Dispositions | | |
| | |
| | | | |
| | |
| | | | |
Description of Postbank’s business activities and the expected impact from their integration on the Group. Postbank Group is one of the major providers of banking and other financial services in Germany. Its business activities comprise retail banking, business with corporate customers, capital markets activities as well as home savings loans (via the BHW Group which is part of the Postbank Group). In its Transaction Banking division, Postbank offers back office services for other financial services providers. Its business focuses on Germany and is complemented by selected engagements, principally in Western Europe and North America.
The Group’s previous Management Agenda Phase 4 provided for a focus on core businesses in the former Private Clients and Asset Management Group Division (PCAM) and home market leadership. In this context, the majority shareholding in Postbank further strengthened the PCAM Group Division, in particular the PBC Corporate Division, and enabled the Group to strengthen and expand its leading position in the German home market. The combination of Deutsche Bank and Postbank offered significant cost and revenue synergy potential and growth opportunities. Furthermore, the inclusion of Postbank businesses in the Group’s consolidated results increased the level of retail banking earnings and strengthened and diversified the Group’s refinancing basis due to the increased volumes in retail customer deposits.
Takeover Offer. The price per Postbank share offered in the PTO amounted to€ 25.00. The acceptance period under the PTO commenced with the publication of the offer document on October 7, 2010 and ended with expiry of the additional acceptance period on November 24, 2010. The offer was accepted for 48.2 million Postbank shares, corresponding to 22.03 % of the Postbank share capital and voting rights. Therefore, the total cash consideration paid on December 3, 2010 for the Postbank shares acquired in the PTO amounted to€ 1,205 million.
Deutsche Bank announced on November 30, 2010 that it had sold 0.5 million Postbank shares, and on December 3, 2010 that it had sold a further 3.9 million Postbank shares both to a third party for a consideration of€ 23.96 and€ 21.75 per Postbank share, respectively. The sale, which was intended to avoid a delayed completion of the PTO that would have resulted from U.S. merger control proceedings, led to an intermediate legal shareholding of less than 50 % in Postbank. Along with the sale, Deutsche Bank concluded forward purchase contracts corresponding to the aforementioned number of Postbank shares with this third party for a cash consideration of€ 23.96 and€ 21.75 per Postbank share, respectively, plus a transaction fee of approximately€ 0.03 and€ 0.015 per share, respectively. The forward purchase contracts settled on December 10, 2010, following satisfaction of U.S. antitrust review and bank regulatory approval requirements. As a result, the Group increased its shareholding in Postbank to 51.98 % (equal to 113.7 million Postbank shares), the ultimate level achieved through the PTO. Although the shares had been legally sold to a third party, the Group retained the risks and rewards of those shares. It was deemed to be virtually certain that U.S. antitrust approval would be obtained so that the potential voting rights from those shares were included in the consolidation analysis for financial reporting purposes. Accordingly, the date of acquisition of the Postbank Group was determined as December 3, 2010.
Capital Increase of Deutsche Bank. In close coordination with the PTO, Deutsche Bank also implemented a capital increase from authorized capital against cash contributions. The capital increase was completed on October 6, 2010. In total, 308.6 million new registered no-par value shares (common shares) were issued, resulting in gross proceeds of€ 10.2 billion. The net proceeds of€ 10.1 billion raised from the issuance (after expenses of about€ 0.1 billion net of tax) were primarily intended to cover the capital consumption from the consolidation of the Postbank Group, and, in addition, to support the existing capital base.
Treatment of the Group’s equity investment and other financial instruments on Postbank held at the closing date. Prior to obtaining control, the Group directly held 29.95 % of the shares and voting rights of Postbank, giving it the ability to significantly influence Postbank’s financial and operating policies. Accordingly, this investment was accounted for using the equity method.
| | | | |
| Deutsche Bank | | 02 – Consolidated Financial Statements | | 284 |
| Financial Report 2012 | | Notes to the Consolidated Financial Statements 04 – Acquisitions and Dispositions | | |
| | |
| | | | |
| | |
| | | | |
In addition, the Group had subscribed to a mandatory exchangeable bond (“MEB”) issued by Deutsche Post. The MEB was acquired by Deutsche Bank in February 2009 as part of a wider acquisition agreement with Deutsche Post regarding Postbank shares. According to the acquisition agreement, the MEB was to be fully exchanged in 2012 for 60 million Postbank shares, or a 27.42 % stake. For accounting purposes, the MEB constituted an equity investment with risk and reward characteristics substantially similar to an ownership interest in the Postbank shares and therefore was included as part of the equity method investment. Upon recognition of the MEB, the equity method investment also contained an embedded derivative related to a profit sharing agreement with Deutsche Post on Deutsche Bank shares issued which were received as consideration by Deutsche Post. The embedded derivative was bifurcated as the risks and rewards from the profit sharing were not clearly and closely related to the host contract. The initial fair value of the embedded derivative was€ 201 million which reduced the cost of the equity method investment in Postbank. Subsequent changes in the fair value of the options were reflected in profit or loss. The final value of the receivable arising from the embedded derivative, which was no longer remeasured since Deutsche Post sold all Deutsche Bank shares received as consideration for the initial acquisition of 50 million Postbank shares, amounted to€ 677 million. The receivable was reported separately in other assets and, upon maturity of the MEB in February 2012, was offset with the corresponding collateral received (liability).
During the third quarter 2010, the carrying amount of the equity method investment had been adjusted for a charge of approximately€ 2.3 billion recognized in the Group’s income statement within the line item “Net income (loss) from equity method investments”. Since the Group had a clearly documented intention to gain control over Postbank and to commence consolidation in the fourth quarter 2010, this had to be reflected in the determination of the value in use of the equity method investment. Therefore, the charge had been determined based on the carrying amount of the Group’s equity method investment in Postbank as of September 30, 2010 and an assumed fair value of the Postbank shares equal to the price of€ 25.00 offered by Deutsche Bank in the PTO. This charge was allocated to the former Corporate Investments Group Division (CI).
On December 3, 2010, the date when control over Postbank was obtained, the Group remeasured to fair value its existing equity method investment in Postbank in accordance with IFRS 3 R. The fair value of the equity method investment was determined on the basis of the offer price of€ 25.00, totaling an acquisition-date fair value of€ 3,139 million. Considering the net share of profits attributable to the existing Postbank investment in the fourth quarter 2010, the balance of the equity method investment had increased by approximately€ 22 million. Accordingly, as of the closing date, the remeasurement resulted in a corresponding loss of€ 22 million recognized in the Group’s income statement of the fourth quarter 2010 within the line item “Net income (loss) from equity method investments”. In accordance with IFRS 3 R, net losses recognized in other comprehensive income of€ 6 million attributable to the Group’s equity method investment in Postbank up to the closing date have been reclassified to the Group’s income statement of the fourth quarter 2010. These effects were allocated to the former CI Group Division.
Along with the MEB, Deutsche Bank and Deutsche Post had also entered into put and call options for another 26.4 million Postbank shares held by Deutsche Post (12.07 % stake) which were exercisable between February 2012 and February 2013. The put and call options were reported as a derivative financial instrument measured at fair value through profit or loss.
Upon consolidation, the put and call option structure with Deutsche Post on Postbank shares was reclassified to an equity instrument due to the fact that it became a physically settled derivative on shares in a consolidated subsidiary settled for a fixed amount of cash. Therefore, its fair value of€ 560 million (derivative liability) was reclassified into equity (additional paid-in capital). Correspondingly, for the respective shares under the put and call option structure, a liability was recognized at the present value of the expected purchase price, due to the requirement to purchase these shares under the put option agreement. The liability to purchase of€ 1,286 million was recognized with a corresponding debit to equity (additional paid-in capital).
| | | | |
| Deutsche Bank | | 02 – Consolidated Financial Statements | | 285 |
| Financial Report 2012 | | Notes to the Consolidated Financial Statements 04 – Acquisitions and Dispositions | | |
| | |
| | | | |
| | |
| | | | |
Direct Shareholding, MEB and Noncontrolling Interests held in Postbank as of the Acquisition Date
| | | | | | | | |
| | Number of
Postbank shares
(in million) | | | Stake
in
% | |
Direct shareholding in Postbank before the PTO | | | 65.5 | | | | 29.95 | |
| | | | | | | | |
Shares acquired in PTO | | | 48.2 | | | | 22.03 | |
| | | | | | | | |
Total direct ownership | | | 113.7 | | | | 51.98 | |
| | | | | | | | |
MEB | | | 60.0 | | | | 27.42 | |
| | | | | | | | |
Total Group equity interest | | | 173.7 | | | | 79.40 | |
| | | | | | | | |
Noncontrolling interests in Postbank | | | 45.1 | | | | 20.60 | |
| | | | | | | | |
Total Postbank shares | | | 218.8 | | | | 100.00 | |
| |
With the subsequent conversion of the MEB on February 27, 2012, the Group further increased its direct interest in Postbank by 60 million shares or 27.42 ppt. Because the MEB had already been considered as an equity investment in the first place, its conversion did not result in any change in the Group’s consolidated Postbank stake and therefore had no impact on the Group’s total equity and profit or loss. With the exercise of Deutsche Post’s put option on February 28, 2012, the Group’s direct interest and consolidated stake in Postbank further increased by 26.4 million shares or 12.07 ppt. Upon exercise, the recognized liability to purchase Postbank shares was settled. The exercise of the option did not have a material impact on the Group’s total equity.
Domination and profit and loss transfer agreement. Following the approval at the Annual General Meeting of Postbank on June 5, 2012 and entry into the commercial register on June 20, 2012, a domination and profit and loss transfer agreement (“domination agreement”) according to Section 291 Aktiengesetz (“AktG”), the German Stock Corporation Act, between Postbank as dependent company and DB Finanz-Holding GmbH (a wholly-owned subsidiary of Deutsche Bank AG) as controlling company came into force in the second quarter 2012. The domination agreement was irrevocably validated through an order issued by the Higher Regional Court in Cologne on September 11, 2012. The profit and loss transfer had retroactive effect as of January 1, 2012.
According to the domination agreement, the minority shareholders of Postbank are entitled to receive either a cash settlement pursuant to section 305 AktG of€ 25.18 per Postbank share tendered or a compensation payment pursuant to section 304 AktG for each full fiscal year of currently€ 1.66 (after corporate income taxes, before individual income taxes on the level of the shareholder) per Postbank share. The initial two month settlement period to tender the shares is extended until the conclusion of pending award proceedings (“Spruchverfahren”) to examine the adequacy of the compensation and settlement payments. The exact length and outcome of this court procedure cannot be predicted.
In concluding the domination agreement in the second quarter 2012, Deutsche Bank had derecognized from the Group’s total equity the noncontrolling interest in Postbank (€ 248 million) as the minority shareholders ceased to have access to the risks and rewards of ownership of the Postbank shares. Correspondingly, the Group had recorded a liability for the obligation to purchase shares under the cash settlement offer (initial amount of€ 338 million), which also equalled the net present value of the future compensation payments payable to the minority shareholders of Postbank. The liability had been recognized through derecognition of noncontrolling interests and a balancing entry in shareholders’ equity (additional paid-in capital). Accordingly, the Group commenced to fully attribute Postbank’s results to Deutsche Bank shareholders.
Through December 31, 2012, a total of 481,595 Postbank shares (equal to approximately 0.22 % of total Postbank shares outstanding) were tendered by minority shareholders to Deutsche Bank, thereby increasing the Group’s shareholding in Postbank to approximately 94.1 %. In connection with this stake increase, the Group recorded an adjustment to the initial amount of the obligation to purchase Postbank shares, reducing the liability by approximately€ 12 million to€ 326 million. Starting from the date of entry into the commercial register and in revaluing the liability, as of the reporting date the Group also accrued approximately€ 11 million for the expected compensation payments as part of interest expense.
Purchase Price Allocation and Other Acquisition-related Information. Due to closing of the acquisition shortly before year-end 2010 and given its complexity, the initial acquisition accounting for Postbank had not been
| | | | |
| Deutsche Bank | | 02 – Consolidated Financial Statements | | 286 |
| Financial Report 2012 | | Notes to the Consolidated Financial Statements 04 – Acquisitions and Dispositions | | |
| | |
| | | | |
| | |
| | | | |
finalized at December 31, 2010. In completing the acquisition accounting in the fourth quarter 2011, the “Purchase Price Allocation and Other Acquisition-related Information” as of the closing date, which were previously disclosed for Postbank, had been updated to reflect adjustments existing at the acquisition date and identified during the measurement period under IFRS 3 R.
The following table summarizes the final acquisition-date status of the consideration transferred and the fair value of the Postbank equity method investment held before the business combination. In considering certain adjustments made during the measurement period, it also details, as of December 3, 2010, the final fair value amounts of assets acquired and liabilities assumed for the Postbank Group, a noncontrolling interest and goodwill acquired in the business combination. The measurement period adjustments reflected refinements of the initial fair value of certain assets acquired and liabilities assumed. They are based on facts and circumstances existing as of the acquisition date and did not result from intervening events subsequent to the acquisition date. The adjustments were mainly a result of updated information concerning expected cash flows and parameters used for the valuation of the acquired loan portfolio as well as for long-term debt assumed, refined parameters applied in the intangible asset valuation and the finalization of the fair valuation of the derivatives portfolio, with the latter resulting in a nearly proportional increase of financial assets and liabilities at fair value through profit or loss.
Fair Value of Assets Acquired and Liabilities Assumed as of the Acquisition Date
| | | | | | | | | | | | |
| in€ m. | | Provisional
Amounts1 | | | Measurement
Period
Adjustments | | | Final
Amounts | |
| | | | | | | | | | | | |
Consideration transferred | | | | | | | | | | | | |
| | | | | | | | | | | | |
Cash consideration transferred for PTO settlement | | | 1,205 | | | | – | | | | 1,205 | |
| | | | | | | | | | | | |
Deduction for settlement of pre-existing relationship | | | 176 | | | | (73) | | | | 103 | |
| | | | | | | | | | | | |
Net consideration transferred | | | 1,029 | | | | 73 | | | | 1,102 | |
| | | | | | | | | | | | |
Fair value of the Group’s equity interests in Postbank held before the business combination | | | | | | | | | | | | |
| | | | | | | | | | | | |
Equity method investment (excluding embedded derivative)2 | | | 3,139 | | | | – | | | | 3,139 | |
| | | | | | | | | | | | |
Total purchase consideration | | | 4,168 | | | | 73 | | | | 4,241 | |
| | | | | | | | | | | | |
| | | | | | | | | | | | |
| | | | | | | | | | | | |
Recognized amounts of identifiable assets acquired and liabilities assumed3 | | | | | | | | | | | | |
| | | | | | | | | | | | |
Cash and cash equivalents | | | 8,752 | | | | – | | | | 8,752 | |
| | | | | | | | | | | | |
Financial assets at fair value through profit or loss | | | 36,961 | | | | 850 | | | | 37,811 | |
| | | | | | | | | | | | |
Financial assets available for sale | | | 33,716 | | | | 16 | | | | 33,732 | |
| | | | | | | | | | | | |
Loans | | | 129,300 | | | | 577 | | | | 129,877 | |
| | | | | | | | | | | | |
Intangible assets | | | 1,557 | | | | (200) | | | | 1,357 | |
| | | | | | | | | | | | |
All other assets | | | 27,840 | | | | (52) | | | | 27,788 | |
| | | | | | | | | | | | |
Deposits | | | 139,859 | | | | – | | | | 139,859 | |
| | | | | | | | | | | | |
Financial liabilities at fair value through profit or loss | | | 31,983 | | | | 857 | | | | 32,840 | |
| | | | | | | | | | | | |
Long-term debt | | | 38,577 | | | | 754 | | | | 39,331 | |
| | | | | | | | | | | | |
All other liabilities | | | 24,813 | | | | (363) | | | | 24,450 | |
| | | | | | | | | | | | |
Total identifiable net assets | | | 2,894 | | | | (57) | | | | 2,837 | |
| | | | | | | | | | | | |
Noncontrolling interest in Postbank | | | 599 | | | | (12) | | | | 587 | |
| | | | | | | | | | | | |
Deduction for settlement of pre-existing relationship | | | 176 | | | | (73) | | | | 103 | |
| | | | | | | | | | | | |
Total identifiable net assets attributable to Deutsche Bank shareholders | | | 2,119 | | | | 28 | | | | 2,147 | |
| | | | | | | | | | | | |
Goodwill acquired by the Group | | | 2,049 | | | | 45 | | | | 2,094 | |
| | | | | | | | | | | | |
Total identifiable net assets and goodwill acquired attributable to Deutsche Bank shareholders | | | 4,168 | | | | 73 | | | | 4,241 | |
| |
| 1 | Provisional amounts as previously reported in Note 04 “Acquisitions and Dispositions” of Deutsche Bank’s 2010 report. |
| 2 | Included a 29.95 % direct shareholding and the MEB which were both accounted for under the equity method. |
| 3 | By major class of assets acquired and liabilities assumed. |
In finalizing the purchase price allocation during the measurement period, the Group reduced the initial acquisition-date fair values of Postbank’s net assets by€ 57 million. The net decrease mainly related to measurement period adjustments made to the acquisition-date fair values of derivative financial instruments classified as financial assets and liabilities at fair value through profit or loss, certain liabilities classified as long-term debt, the acquired loan and securities portfolio and separately identified intangible assets. Accordingly, the initial amount of goodwill recognized at December 31, 2010 of€ 2,049 million increased by€ 45 million to€ 2,094 million and the noncontrolling interest in Postbank was reduced by€ 12 million. During 2011 and in connection with these adjustments, the Group recorded income before income taxes of€ 6 million.
| | | | |
| Deutsche Bank | | 02 – Consolidated Financial Statements | | 287 |
| Financial Report 2012 | | Notes to the Consolidated Financial Statements 04 – Acquisitions and Dispositions | | |
| | |
| | | | |
| | |
| | | | |
Major Classes of Receivables Acquired from Postbank on December 3, 2010 that the Group Classified as Loans as of the Acquisition Date
| | | | |
in€ m. | | | |
Contractually required cash flows including interest (undiscounted) | | | 153,499 | |
| | | | |
Less: Best estimate at the acquisition date of such contractual cash flows not expected to be collected | | | 3,370 | |
| | | | |
Cash flows expected to be collected1 | | | 150,129 | |
| |
| 1 | Represents undiscounted expected principal and interest cash flows upon acquisition. |
The acquisition-date fair value corresponding to these acquired receivables as derived by the Group amounted to€ 129.9 billion, comprising both loans and advances to customers and to banks. This amount also includes investment securities which the Group classified as loans with a fair value of€ 22.5 billion.
As part of the final purchase price allocation, the Group recognized intangible assets of approximately€ 1.4 billion included in the fair value of identifiable net assets acquired. These amounts represented both intangible assets included in the balance sheet of Postbank as well as those intangible assets which were ultimately identified in the purchase price allocation. The intangible assets mainly comprised customer relationships (€ 588 million), the Postbank trademark (€ 411 million) as well as software (€ 282 million).
Goodwill arising from the acquisition of Postbank was determined under the proportionate interest approach (“partial goodwill method”) pursuant to IFRS 3 R. The goodwill largely reflects the value from revenue and cost synergies expected from the acquisition of Postbank. The goodwill, which had been fully assigned to PBC, is not deductible for tax purposes.
Included in all other liabilities of the opening balance sheet is the acquisition-date fair value of contingent liabilities recognized for certain obligations identified in the purchase price allocation. Their aggregated final amount totaled€ 109 million, compared to the initial amount of€ 110 million recorded at year-end 2010. The timing and actual amount of outflow are uncertain. It is expected that the majority of the liabilities will be settled over the next four years. During 2011 and in relation to a settlement, the respective obligation was reduced and therefore an amount of€ 66 million of these contingent liabilities was reversed to the income statement. The Group continues to analyze the development of these obligations and the potential timing of outflows.
The noncontrolling interests of€ 587 million presented in the table of fair value of assets acquired and liabilities assumed above were determined at their proportionate share of Postbank’s identifiable net assets (“partial goodwill method”) measured at fair value as of the closing date.
Before the business combination, Deutsche Bank and Postbank were parties to certain transactions considered as pre-existing relationships. Among these transactions were various financial instruments included in the course of the parties’ regular interbank and hedging activities, certain bonds issued by the Group or by Postbank which were held by the other party and specific payment services provided to the Group by Postbank. All of these instruments were eliminated upon consolidation of Postbank. The aggregated acquisition-date fair value of the financial instruments totaled€ 103 million, which was considered as a deduction in the determination of the consideration transferred and its allocation to Postbank’s net assets acquired. The settlement of certain of these financial instruments issued by Deutsche Bank and held by Postbank resulted in an extinguishment loss of€ 1 million, which was included in other income of the Group’s consolidated income statement of the fourth quarter 2010.
In addition, the Group and Postbank were parties to a comprehensive, mutually beneficial cooperation agreement. The agreement was entered into in 2008 in context of the acquisition of a noncontrolling interest in Postbank and encompassed financing and investment products, business banking and commercial loans as well as customer-oriented services. The agreement also covered areas such as sourcing and IT-infrastructure.
| | | | |
| Deutsche Bank | | 02 – Consolidated Financial Statements | | 288 |
| Financial Report 2012 | | Notes to the Consolidated Financial Statements 04 – Acquisitions and Dispositions | | |
| | |
| | | | |
| | |
| | | | |
Acquisition-related costs borne by the Group as the acquirer amounted to€ 12 million which were recognized in general and administrative expenses in the Group’s income statement for 2010.
For the year 2011, Postbank contributed net revenues and net income after tax (including amortization of fair value adjustments from the final purchase price allocation) of€ 4.8 billion and€ 798 million, respectively, to the Group’s income statement. Refinements relating to the amortization of the initial fair value adjustments from the purchase price allocation resulted in income before income taxes of€ 166 million recorded in 2011. Net revenues contributed in 2011 included impairment charges of€ 465 million related to Greek government bonds, which resulted in a negative€ 326 million impact on net income after tax.
Following consolidation commencing on December 3, 2010, for the year 2010 Postbank had contributed net revenues and net income after tax (including amortization of fair value adjustments from the purchase price allocation) of€ 423 million and€ 62 million, respectively, to the Group’s income statement. Considering certain transaction and integration costs of€ 48 million recorded on the Group level, the Postbank consolidation impact on PBC’s income before income taxes attributable to Deutsche Bank shareholders in 2010 had amounted to€ 30 million.
If consolidation had been effective as of January 1, 2010, Postbank’s pro-forma contribution to the Group’s net revenues and net income after tax in 2010 would have been€ 3.8 billion and€ 138 million, respectively. This pro-forma performance information was determined on the basis of Postbank’s stand-alone results for the year 2010 and did not include any notional amortization of fair value adjustments from the purchase price allocation for the period January 1, 2010 through December 31, 2010, any consolidation adjustments or the revaluation charge which the Group had actually recorded in the third and fourth quarter of 2010 on its previous equity method investment in Postbank.
ABN AMRO
On April 1, 2010, Deutsche Bank had completed the acquisition of parts of ABN AMRO Bank N.V.’s (“ABN AMRO”) commercial banking activities in the Netherlands for an initial consideration of€ 700 million paid in cash in the second quarter 2010. The amount of the consideration was reduced in the fourth quarter 2010 by€ 13 million to€ 687 million, following preliminary adjustments made to the closing balance sheet of the acquired businesses. The closing of the acquisition followed the approval by the European Commission (EC) and other regulatory bodies. As of the closing date, Deutsche Bank obtained control over the acquired businesses and accordingly commenced consolidation in the second quarter 2010. The acquisition was a key element in Deutsche Bank’s strategy of further expanding its classic banking businesses.
The acquisition included 100 % of the voting equity interests in the acquired businesses and encompassed the following activities:
| — | | two corporate client units in Amsterdam and Eindhoven, serving large corporate clients, |
| — | | 13 commercial branches that serve small and medium-sized enterprises, |
| — | | Rotterdam-based bank Hollandsche Bank Unie N.V. (“HBU”), and |
| — | | IFN Finance B.V., the Dutch part of ABN AMRO’s factoring unit IFN Group. |
The two corporate client units, the 13 branches and HBU were included in a separate legal entity prior to the acquisition which was renamed as Deutsche Bank Nederland N.V. immediately after the acquisition. Both Deutsche Bank Nederland N.V. and IFN Finance B.V. have become direct subsidiaries of Deutsche Bank. The acquired businesses are using the Deutsche Bank brand name and are part of the Group’s Global Transaction Banking Corporate Division (GTB).
At year-end 2010, the initial acquisition accounting for the business combination had not been finalized, in particular pending the finalization of fair value adjustments for certain parts of the opening balance sheet of the acquired businesses. The allocation of the consideration transferred to the acquisition-date fair value of net assets acquired had resulted in preliminary negative goodwill of€ 216 million which was recognized in the
| | | | |
| Deutsche Bank | | 02 – Consolidated Financial Statements | | 289 |
| Financial Report 2012 | | Notes to the Consolidated Financial Statements | | |
| | 04 – Acquisitions and Dispositions | | |
| | |
| | | | |
| | |
| | | | |
Group’s income statement for 2010. The main reason that had led to the recognition of negative goodwill was the divestiture of parts of ABN AMRO’s Dutch commercial banking business and factoring services as required by the EC, following the acquisition of ABN AMRO Holding N.V. by a consortium of The Royal Bank of Scotland, Fortis Bank and Banco Santander in October 2007. The gain recognized was tax-exempt.
Finalization of the initial acquisition accounting for the business combination in the first quarter 2011 resulted in a reduction of€ 24 million in the acquisition-date fair value of net assets acquired. Accordingly, the preliminary negative goodwill of€ 216 million was reduced to€ 192 million. Pursuant to IFRS 3, the finalization of the purchase price allocation had to be applied retrospectively as of the acquisition date. Therefore, retained earnings as of December 31, 2010 were reduced by€ 24 million.
The final summary computation of the consideration transferred and its allocation to net assets acquired as of the acquisition date is presented below.
Fair Value of Assets Acquired and Liabilities Assumed as of the Acquisition Date
| | | | |
in€ m. | | | |
Consideration transferred | | | | |
| | | | |
Cash consideration transferred | | | 700 | |
| | | | |
Purchase price adjustment | | | (13) | |
| | | | |
Total purchase consideration | | | 687 | |
| | | | |
| |
Recognized amounts of identifiable assets acquired and liabilities assumed1 | | | | |
| | | | |
Cash and cash equivalents | | | 113 | |
| | | | |
Interest-earning time deposits with banks | | | 71 | |
| | | | |
Financial assets at fair value through profit or loss | | | 779 | |
| | | | |
Loans | | | 9,802 | |
| | | | |
Intangible assets | | | 168 | |
| | | | |
All other assets | | | 810 | |
| | | | |
Deposits | | | 8,211 | |
| | | | |
Financial liabilities at fair value through profit or loss | | | 895 | |
| | | | |
All other liabilities | | | 1,758 | |
| | | | |
Total identifiable net assets | | | 879 | |
| | | | |
Negative goodwill | | | 192 | |
| | | | |
Total identifiable net assets acquired, less negative goodwill | | | 687 | |
| |
| 1 | By major class of assets acquired and liabilities assumed. |
As part of the purchase price allocation, customer relationships of€ 168 million were identified as amortizing intangible assets. Furthermore, under the terms and conditions of the acquisition, ABN AMRO is providing initial credit risk coverage for 75 % of ultimate credit losses of the acquired loan portfolio (excluding IFN Finance B.V.). The maximum credit risk coverage is capped at 10 % of the portfolio volume. As of the acquisition date, the fair value of the guarantee totaled€ 544 million, subject to amortization over the expected average life-time of the underlying portfolio. In connection with measures initiated in the fourth quarter 2012 to turnaround the acquired commercial banking activities in the Netherlands, the Group settled the credit protection received from the seller.
Financial Assets Acquired from ABN AMRO on April 1, 2010 that the Group Classified as Loans as of the Acquisition Date
| | | | |
in€ m. | | | |
Contractually required cash flows including interest (undiscounted) | | | 11,503 | |
| | | | |
Less: Best estimate at the acquisition date of such contractual cash flows not expected to be collected | | | 245 | |
| | | | |
Cash flows expected to be collected1 | | | 11,258 | |
| |
| 1 | Represents undiscounted expected principal and interest cash flows upon acquisition. |
In respect of acquisition-related costs,€ 15 million were recognized in general and administrative expenses in the Group’s income statement for 2010, and€ 8 million were incurred and recognized in 2009 and 2008.
| | | | |
| Deutsche Bank | | 02 – Consolidated Financial Statements | | 290 |
| Financial Report 2012 | | Notes to the Consolidated Financial Statements 04 – Acquisitions and Dispositions | | |
| | |
| | | | |
| | |
| | | | |
For the year 2011, ABN AMRO accounted for net revenues and a net loss after tax of€ 554 million and€ 153 million, respectively, in the Group’s income statement. This included the amortization of fair value adjustments from the purchase price allocation and an adjustment to the amortization of the upfront premium included in the purchase consideration representing credit protection to be provided by the seller. The latter adjustment was reflected in noninterest expenses and included charges of€ 53 million related to the year 2010 (within segment reporting assigned to Consolidation & Adjustments (C&A)) and€ 34 million related to the first half of 2011 (in segment reporting recorded in GTB). The respective amortization expense for the second half of 2011 amounted to€ 88 million.
Since the acquisition and excluding the above gain recognized from negative goodwill, for the year 2010 the acquired businesses contributed net revenues and net income after tax of€ 405 million and€ 35 million, respectively, to the Group’s income statement. If the acquisition had been effective as of January 1, 2010, the effect on the Group’s net revenues and net income after tax in 2010 (excluding the above mentioned gain from negative goodwill) would have been€ 501 million and€ 77 million, respectively.
Sal. Oppenheim
On March 15, 2010, Deutsche Bank closed the acquisition of 100 % of the voting equity interests in Luxembourg-based Sal. Oppenheim jr. & Cie. S.C.A. (“Sal. Oppenheim S.C.A.”), the holding company of the Sal. Oppenheim Group, for a total purchase price of€ 1,261 million paid in cash. Of the purchase price,€ 275 million was paid for BHF Asset Servicing GmbH (“BAS”), which, at the date of acquisition, had already been classified as asset held for sale and therefore was treated as a separate transaction distinct from the remaining Sal. Oppenheim Group. As all significant legal and regulatory approvals had been obtained by January 29, 2010, the date of acquisition was set at that date and, accordingly, the Group commenced consolidation of Sal. Oppenheim in the first quarter 2010. As of the reporting date, the acquisition-date fair value of the total consideration transferred for the Sal. Oppenheim Group and BAS amounted to€ 1,261 million. According to the framework agreement reached in the fourth quarter 2009, the former shareholders of Sal. Oppenheim S.C.A. have the option of acquiring a long-term shareholding of up to 20 % in the German subsidiary Sal. Oppenheim jr. & Cie. AG & Co. KGaA. As of the reporting date, the acquisition-date fair value of the option is zero.
The acquisition enabled the Group to strengthen its asset and wealth management activities among high-net-worth private clients, family offices and trusts in Europe and especially in Germany. Sal. Oppenheim Group’s independent wealth management activities are being expanded under the established brand name of the traditional private bank, while preserving its private bank character. Its integrated asset management concept for private and institutional clients is to be retained.
As a result of the acquisition, the Group obtained control over Sal. Oppenheim S.C.A., which subsequently became a wholly-owned subsidiary of Deutsche Bank. All Sal. Oppenheim Group operations, including all of its asset and wealth management activities, the investment bank, BHF-BANK Group (“BHF-BANK”), BAS and the private equity fund of funds business managed in the separate holding Sal. Oppenheim Private Equity Partners S.A. were transferred to Deutsche Bank. Upon the acquisition, all of the Sal. Oppenheim Group businesses were integrated into the Group’s AWM Corporate Division, except that BHF-BANK and BAS initially became part of the former CI Group Division. During the second quarter 2010, BHF-BANK and BAS were also transferred to the Corporate Division AWM . For information on the subsequent business designation of BHF-BANK in 2011, please refer to Note 05 “Business Segments and Related Information”.
The sale of BAS to Bank of New York Mellon was consummated in August 2010. Also, as part of the Sal. Oppenheim Group, the Group had acquired Services Généraux de Gestion S.A. and its subsidiaries, which were on-sold in the first quarter 2010. Over the course of 2010, Sal. Oppenheim Group discontinued most of its investment banking activities via sale or wind-down. The Equity Trading & Derivatives and Capital Markets Sales and Research units were acquired by Australia’s Macquarie Group in the second quarter 2010. In December 2010, Deutsche Bank had announced exclusive negotiations with Liechtenstein’s LGT Group concerning the contemplated sale of BHF-BANK. Accordingly, the Group had classified BHF-BANK as a disposal group held for sale as of December 31, 2010. For information on the further development in 2012, please also refer to the Note 26 “Non-Current Assets and Disposal Groups Held for Sale”.
| | | | |
| Deutsche Bank | | 02 – Consolidated Financial Statements | | 291 |
| Financial Report 2012 | | Notes to the Consolidated Financial Statements | | |
| | 04 – Acquisitions and Dispositions | | |
| | |
| | | | |
| | |
| | | | |
As of the reporting date, the acquisition-date fair value of the total consideration transferred for the Sal. Oppenheim Group and BAS was€ 1,261 million. According to the framework agreement reached with the former shareholders of Sal. Oppenheim S.C.A., the purchase price might increase by up to€ 476 million net payable in 2015, provided that certain risk positions (in particular legal and credit risk) do not materialize through 2015. As of the reporting date, the fair value estimate of the contingent consideration is zero.
The final fair value amounts recognized for the Sal. Oppenheim Group (excluding BAS) as of the acquisition date were as follows:
Fair Value of Assets Acquired and Liabilities Assumed as of the Acquisition Date
| | | | |
in€ m. | | | |
Consideration transferred | | | | |
| | | | |
Cash consideration transferred | | | 986 | |
| | | | |
Fair value of contingent consideration | | | – | |
| | | | |
Total purchase consideration | | | 986 | |
| | | | |
| | | | |
| | | | |
Recognized amounts of identifiable assets acquired and liabilities assumed1 | | | | |
| | | | |
Cash and cash equivalents | | | 2,638 | |
| | | | |
Interest-earning time deposits with banks | | | 3,298 | |
| | | | |
Central bank funds sold and securities purchased under resale agreements | | | 889 | |
| | | | |
Financial assets at fair value through profit or loss | | | 6,626 | |
| | | | |
Financial assets available for sale | | | 6,174 | |
| | | | |
Loans | | | 5,609 | |
| | | | |
Intangible assets | | | 162 | |
| | | | |
Assets classified as held for sale | | | 1,884 | |
| | | | |
All other assets | | | 2,677 | |
| | | | |
Deposits | | | 18,461 | |
| | | | |
Central bank funds purchased and securities sold under repurchase agreements | | | 796 | |
| | | | |
Financial liabilities at fair value through profit or loss | | | 5,443 | |
| | | | |
Long-term debt | | | 1,737 | |
| | | | |
Liabilities classified as held for sale | | | 1,836 | |
| | | | |
All other liabilities | | | 1,534 | |
| | | | |
Total identifiable net assets | | | 150 | |
| | | | |
Noncontrolling interests in Sal. Oppenheim Group | | | 8 | |
| | | | |
Total identifiable net assets attributable to Deutsche Bank shareholders | | | 142 | |
| | | | |
Goodwill | | | 844 | |
| | | | |
Total identifiable net assets and goodwill acquired attributable to Deutsche Bank shareholders | | | 986 | |
| |
| 1 | By major class of assets acquired and liabilities assumed. |
The acquisition resulted in the recognition of goodwill of€ 844 million which largely consisted of synergies expected by combining certain operations in the asset and wealth management areas as well as an increased market presence in these businesses in Germany, Luxembourg, Switzerland and Austria. The goodwill was not deductible for tax purposes. Intangible assets included in the identifiable net assets acquired mainly represented software, customer relationships and the Sal. Oppenheim trademark. As part of the acquisition accounting, Deutsche Bank recognized a contingent liability of€ 251 million for a large population of items relating to certain businesses acquired from Sal. Oppenheim Group. The timing and actual amount of outflow are uncertain. It is expected that these obligations will be settled over the next three years. In 2012, the amount of the liability declined to€ 174 million, mainly as a result of the reassessment of inherent obligations. The Group continues to analyze the risks and the potential timing of outflows.
| | | | |
| Deutsche Bank | | 02 – Consolidated Financial Statements | | 292 |
| Financial Report 2012 | | Notes to the Consolidated Financial Statements | | |
| | 04 – Acquisitions and Dispositions | | |
| | |
| | | | |
| | |
| | | | |
Financial Assets Acquired from Sal. Oppenheim that the Group Classified as Loans as of the Acquisition Date
| | | | |
| in€ m. | | | |
| | | | |
Contractually required cash flows including interest (undiscounted) | | | 6,940 | |
| | | | |
Less: Best estimate at the acquisition date of such contractual cash flows not expected to be collected | | | 1,187 | |
| | | | |
Cash flows expected to be collected1 | | | 5,753 | |
| |
| 1 | Represents undiscounted expected principal and interest cash flows upon acquisition. |
Following the acquisition but on the date of closing, Deutsche Bank had made a capital injection of€ 195 million into the new subsidiary Sal. Oppenheim S.C.A. This amount did not form part of the purchase consideration and accordingly was not included in the aforementioned goodwill calculation.
In respect of acquisition-related costs,€ 2 million were recognized in general and administrative expenses in the Group’s income statement for 2010. In addition,€ 11 million were incurred and recognized in 2009.
Following the acquisition, for the year 2010 the Sal. Oppenheim Group (excluding BAS) contributed net revenues and a net loss after tax of€ 568 million and€ 308 million, respectively, to the Group’s income statement. If the acquisition had been effective as of January 1, 2010, the contribution to the Group’s net revenues and net income in 2010 would have been€ 599 million and a loss of€ 336 million, respectively.
Other Business Combinations completed in 2010
Other business combinations, not being individually material, which were finalized in 2010, included the step-acquisition of an additional 47.5 % interest in an existing associate domiciled in the Philippines. The acquisition resulted in a controlling ownership interest of 95 % and the consolidation of the investment in the first quarter 2010. The total consideration of€ 6 million paid in cash was allocated to net assets acquired (including liabilities assumed) of€ 10 million, resulting in negative goodwill of€ 4 million which was recognized in other income in the Group’s income statement of the first quarter 2010. The investment was integrated into CB&S.
Also in 2010, the Group acquired 100 % of the voting rights of a U.S. based investment advisor company for a total consideration of€ 2 million which was fully allocated to goodwill. Consolidation of the company commenced in the fourth quarter 2010. The investment was integrated into CB&S.
The fair value amounts recognized for these business combinations as of the acquisition date were as follows.
Fair Value of Assets Acquired and Liabilities Assumed as of the Acquisition Date
| | | | |
| in€ m. | | | |
| | | | |
Total purchase consideration, including fair value of the Group’s equity interest held before the business combination | | | 8 | |
| | | | |
| | | | |
| | | | |
Recognized amounts of identifiable assets acquired and liabilities assumed:1 | | | | |
| | | | |
Cash and cash equivalents | | | 3 | |
| | | | |
Financial assets available for sale | | | 14 | |
| | | | |
All other assets | | | 1 | |
| | | | |
Long-term debt | | | 7 | |
| | | | |
All other liabilities | | | 1 | |
| | | | |
Total identifiable net assets | | | 10 | |
| | | | |
Noncontrolling interests | | | – | |
| | | | |
Total identifiable net assets attributable to Deutsche Bank shareholders | | | 10 | |
| | | | |
Goodwill | | | 2 | |
| | | | |
Negative goodwill | | | 4 | |
| | | | |
Total identifiable net assets and goodwill acquired attributable to Deutsche Bank shareholders, less negative goodwill | | | 8 | |
| |
| 1 | By major class of assets acquired and liabilities assumed. |
Since the acquisition, these businesses had collectively contributed net revenues and net income after tax of€ 2 million each to the Group’s income statement for the year 2010. If the acquisitions had been effective as of January 1, 2010, the effect on the Group’s net revenues and net income after tax in 2010 also would have been€ 2 million each.
| | | | |
| Deutsche Bank | | 02 – Consolidated Financial Statements | | 293 |
| Financial Report 2012 | | Notes to the Consolidated Financial Statements 04 – Acquisitions and Dispositions | | |
| | |
| | | | |
| | |
| | | | |
Acquisitions and Dispositions of Noncontrolling Interests while Retaining Control
During 2012 and 2011, the Group completed acquisitions and dispositions of noncontrolling interests related to its investments in subsidiaries where the Group is not the sole owner and which did not result in the loss of control over the respective subsidiaries. In accordance with IAS 27 R, they were accounted for as equity transactions between the Group and outside shareholders with no gain or loss recognized in the Group’s income statement. The total consideration transferred in 2012 and 2011 on these transactions amounted to€ 1,371 million and€ 77 million, respectively. The carrying amounts of the related controlling and noncontrolling interests were adjusted to reflect the changes regarding the Group’s interests in these subsidiaries. Any difference between the fair values of the consideration transferred or received and the amounts by which the noncontrolling interests were adjusted is recognized directly in shareholders’ equity.
The following table summarizes the aggregated effect of changes in the Group’s ownership interests recorded for these subsidiaries during 2011 and 2012. Ownership changes during this period mainly related to the consolidated interest in Postbank. Subsequent to the step-acquisition in December 2010, the Group had raised its direct shareholdings in Postbank through the conversion of the MEB and the exercise of the put and call options on Postbank shares in February 2012 as well as through additional shares purchased in the market. In concluding the domination agreement in the second quarter 2012, Deutsche Bank had derecognized from the Group’s total equity the remaining noncontrolling interest of€ 248 million in Postbank as the minority shareholders ceased to have access to the risks and rewards of ownership of the Postbank shares. Through December 31, 2012, a total of 481,595 Postbank shares (equal to approximately 0.22 % of total Postbank shares outstanding) were tendered by minority shareholders to Deutsche Bank under the domination agreement, thereby increasing the Group’s direct shareholding to approximately 94.1 %.
| | | | | | | | |
in€ m. | | 2012 | | | 2011 | |
Deutsche Bank’s ownership interests as of beginning of the period | | | 4,448 | | | | 6,363 | |
| | | | | | | | |
Net increase in Deutsche Bank’s ownership interests | | | 753 | | | | 56 | |
| | | | | | | | |
Deutsche Bank’s share of net income or loss | | | 803 | | | | 822 | |
| | | | | | | | |
Deutsche Bank’s share of other comprehensive income | | | 1,030 | | | | (427) | |
| | | | | | | | |
Deutsche Bank’s share of other equity changes | | | (207) | | | | 375 | |
| | | | | | | | |
Deutsche Bank’s ownership interests at the end of the period | | | 6,827 | | | | 7,189 | |
| |
Dispositions
During 2012, 2011 and 2010, the Group finalized several dispositions of subsidiaries/businesses. These disposals mainly included several businesses the Group had previously classified as held for sale, among them the sale of Postbank’s Indian subsidiary Deutsche Postbank Home Finance Ltd. in the first quarter 2011 and BHF Asset Servicing GmbH in the third quarter 2010, a business already classified held for sale as part of the acquisition of the Sal. Oppenheim Group in the first quarter 2010. The total cash consideration received for these dispositions in 2012, 2011 and 2010 was€ 99 million,€ 368 million and€ 281 million, respectively. The table below includes the assets and liabilities that were included in these disposals.
| | | | | | | | | | | | |
in€ m. | | 2012 | | | 2011 | | | 2010 | |
Cash and cash equivalents | | | – | | | | 21 | | | | 45 | |
All remaining assets | | | 1,937 | | | | 1,383 | | | | 2,180 | |
| | | | | | | | | | | | |
Total assets disposed | | | 1,937 | | | | 1,404 | | | | 2,225 | |
| | | | | | | | | | | | |
Total liabilities disposed | | | 1,592 | | | | 1,039 | | | | 1,932 | |
| |
Also included in these dispositions completed in 2011 and 2010 were several divestitures in which the Group retained noncontrolling interests in the former subsidiaries. None of these disposal transactions were individually significant. The interests retained in the former subsidiaries were recognized initially at fair value as of the date when control was lost, on which date these interests were subsequently accounted for under the equity method. While there was no gain or loss on these dispositions in 2011, the resulting net gain recognized on these divestitures in 2010 totaled€ 15 million, and is included in other income. Of that net gain recognized in 2010,€ 5 million were related to the remeasurement to fair value of the interests retained in these former subsidiaries.
| | | | |
| Deutsche Bank | | 02 – Consolidated Financial Statements | | 294 |
| Financial Report 2012 | | Notes to the Consolidated Financial Statements 05 – Business Segments and Related Information | | |
| | |
| | | | |
| | |
| | | | |
05 –
Business Segments and Related Information
The following segment information has been prepared in accordance with the “management approach”, which requires presentation of the segments on the basis of the internal management reports of the entity which are regularly reviewed by the chief operating decision maker, which is the Deutsche Bank Management Board, in order to allocate resources to a segment and to assess its financial performance.
Business Segments
Following a strategic review the Bank announced in September 2012 changes to the composition of its business segments. Effective in the fourth quarter 2012, the management responsibility for the passive and third-party alternatives businesses, such as exchange traded funds (“ETF’s”), was transferred from CB&S to the newly integrated AWM. Additionally, a NCOU was set up which represents a distinct corporate division besides CB&S, GTB, AWM and PBC and into which non-core assets, liabilities and businesses from CB&S, AWM and PBC, and the entirety of the former CI Group Division, have been assigned. Following further integration of CB&S and GTB activities, a refinement was made to the allocation of coverage costs between both corporate divisions. Prior periods were restated to reflect these changes.
Restating of comparative financial information generally requires some assumptions and judgments. When setting up the NCOU and presenting how the business segments would have looked had the new structure been in place in prior periods, the following assumptions were applied. For businesses and portfolios of assets and liabilities that had already been run as legacy or non-core activities for the prior periods, all associated revenues and costs were extracted and moved into the NCOU, even when parts of the portfolio had already been sold before the date at which the NCOU was established. When restating for certain individual assets and liabilities, which were embedded within larger portfolios previously not treated as run-off or legacy, all revenues and costs associated with the transferred positions were allocated to the NCOU. The financials of similar individual assets and liabilities, which hypothetically would have qualified for the NCOU, have not been transferred to the NCOU if the positions were already disposed of before the date at which the NCOU was established.
The following business segments represent the Group’s organizational structure as reflected in its internal management reporting systems as of December 31, 2012.
Corporate Banking & Securities (CB&S) comprises the Markets and Corporate Finance business divisions. These businesses offer capital markets and financial products worldwide, ranging from sales and trading, mergers and acquisitions advice and the underwriting of stocks and bonds to the tailoring of structured solutions for companies’ complex financial requirements. CB&S serves corporate and institutional clients, ranging from multinational corporations to banks and sovereign organizations.
Global Transaction Banking (GTB) consists of the business divisions Trade Finance and Cash Management Corporates as well as Trust & Securities Services and Cash Management Financial Institutions. It delivers commercial banking products and services to its clients, including domestic and cross-border payments, financing for international trade, as well as the provision of trust, agency, depositary, custody and related services. GTB serves corporate and institutional clients, ranging from medium-sized enterprises to multinational corporations, financial institutions and sovereign organizations.
Asset & Wealth Management (AWM) combines former Private Wealth Management (PWM) and Asset Management (AM) business divisions as well as passive and third-party alternatives businesses for which management responsibility was transferred from CB&S to AWM at the end of 2012 following the strategic review. The integrated division is based on two pillars: Investment Platform and Coverage/Advisory. The Investment Platform offers capabilities across a diverse array of asset classes and provides securities investment management and investment management of third party portfolios including a closed book life insurance
| | | | |
| Deutsche Bank | | 02 – Consolidated Financial Statements | | 295 |
| Financial Report 2012 | | Notes to the Consolidated Financial Statements 05 – Business Segments and Related Information | | |
| | |
| | | | |
| | |
| | | | |
business. Additionally, it provides access to passive investment and a wide range of alternatives businesses. Furthermore, the Investment Platform also offers customized wealth management solutions and private banking services including lending and discretionary portfolio management. Coverage/Advisory is focusing on connecting and engaging with clients. Beside the coverage of Institutional and Key Clients, Coverage/Advisory serves high-net-worth clients and ultra-high-net-worth individuals and family offices by providing customized advice including risk management. Furthermore, a regional dimension of the organization ensures that local characteristics and opportunities are being taken into account in order to define and provide optimal regional client strategies and solutions.
Private & Business Clients (PBC) consist of three business divisions: Advisory Banking Germany, which comprises all of PBC’s activities in Germany excluding Postbank, Advisory Banking International, which covers PBC’s European activities outside Germany and PBC’s activities in Asia including the stake in and partnership with Hua Xia Bank, and Consumer Banking Germany which mainly comprises the contribution of Postbank Group to the consolidated results of Deutsche Bank. PBC offers a full range of retail banking products and services throughout Europe and Asia, including portfolio/fund management and brokerage services and loan and deposit services, as well as traditional current accounts, savings accounts and time deposits. PBC serves retail and affluent clients as well as small corporate customers.
Non-Core Operations Unit (NCOU) manages activities which are no longer considered to be part of the Group’s core business activities and which are therefore subject to targeted de-risking. The NCOU comprises the following major components.
| — | | Credit correlation trading positions, securitization assets, exposures to monoline insurers and assets reclassified under IAS 39, which were assigned from CB&S. |
| — | | Non-core assets from Sal. Oppenheim, predominantly mortgages and loans, real estate funds and participations in private equity investment funds along with other minor investments assigned from AWM. |
| — | | Non-core portfolios within Consumer Banking Germany (Postbank), mainly non-strategic home loans, savings and deposits and other liabilities (e.g., legacy bonds issued by Postbank, unsecured bonds), that were assigned from PBC. |
| — | | The Structured Credit Portfolio (“SCP”), GIIPS bonds, selected Commercial Real Estate loans outside of Germany, and the non-strategic reverse repo portfolio, all from Consumer Banking (Postbank), which were assigned from PBC. |
| — | | Advisory Banking non-core, which contains for the most part retail loans already in run-off that are primarily originated outside of Germany, was assigned from PBC. |
| — | | The former Group Division CI became part of the NCOU. |
The following describes other changes in management responsibilities with a significant impact on segmental reporting:
| — | | Effective in the fourth quarter 2012, the management responsibility for the passive and third-party alternatives businesses, such as ETF’s, was transferred from CB&S to the newly integrated AWM. |
| — | | Following further integration of CB&S and GTB activities, a refinement was made effective in the fourth quarter to the allocation of coverage costs between both corporate divisions. |
| — | | Effective August 15, 2012, Postbank’s Asset Management activities were sold to DWS Group and therefore transferred from the Corporate Division PBC to the Corporate Division AWM. |
| — | | Effective January 1, 2011, BHF-BANK was transferred from the former Business Division PWM within the Corporate Division AWM back to the former Group Division CI. In the second quarter 2010, the BHF-BANK operations had been transferred from the former Group Division CI to the former Business Division PWM. |
| — | | Effective January 1, 2011, the exposure in Actavis Group was transferred from the Corporate Division CB&S to the former Group Division CI. |
| — | | With effect from July 1, 2010, an integrated management structure for the whole of the former CIB Group Division was implemented following changes in the Management Board, and in the responsibility for Corporate Finance and GTB. During the third quarter 2011, the former Capital Markets Sales business unit |
| | | | |
| Deutsche Bank | | 02 – Consolidated Financial Statements | | 296 |
| Financial Report 2012 | | Notes to the Consolidated Financial Statements 05 – Business Segments and Related Information | | |
| | |
| | | | |
| | |
| | | | |
| | | within the Corporate Division GTB was transferred to the Corporate Division CB&S. In addition, a portfolio consisting of short-term lending transactions with German mid-cap clients was transferred from the Corporate Division CB&S to the Corporate Division GTB in order to leverage the adjacencies between the cash management, trade financing and short-term lending activities with these clients. |
Acquisitions and divestitures with significant impact on the Group’s segment operations are described below:
| — | | On October 31, 2012, the Group exited the exposure to Actavis, the generic pharmaceuticals company, upon completion of Watson Pharmaceuticals’ acquisition of Actavis. |
| — | | On November 11, 2011, the Group completed the step-acquisition of Deutsche UFG Capital Management (“DUCM”), one of Russia’s largest independent asset management companies. The transaction followed Deutsche Bank’s exercise of a purchase option on the remaining 60 % stake. Deutsche Bank now fully controls the acquiree, which was previously accounted for under the equity method. DUCM was allocated to the Corporate Division AWM. |
| — | | On December 3, 2010, the Group consolidated Deutsche Postbank AG for the first time following the successful conclusion and settlement of a voluntary public takeover offer. As of that date, the investment in Postbank is included in the Corporate Division PBC. |
| — | | On April 1, 2010, the Group completed the acquisition of parts of the commercial banking activities of ABN AMRO Bank N.V. (“ABN AMRO”) in the Netherlands. These are included in the Corporate Division GTB. |
| — | | On March 15, 2010, the Group acquired the Sal. Oppenheim Group, which was included in the Corporate Division AWM, with the exception of its BHF-BANK operations, which were included in the Group Division CI. |
Measurement of Segment Profit or Loss
Segment reporting requires a presentation of the segment results based on management reporting methods, including a reconciliation between the results of the business segments and the consolidated financial statements, which is presented in the “Reconciliation of Segmental Results of Operations to Consolidated Results of Operations” section of this note. The information provided about each segment is based on the internal management reporting about segment profit or loss, assets and other information which is regularly reviewed by the chief operating decision maker.
Management reporting for the Group is generally based on IFRS. Non-IFRS compliant accounting methods are rarely used and represent either valuation or classification differences. The largest valuation differences relate to measurement at fair value in management reporting versus measurement at amortized cost under IFRS (for example, for certain financial instruments in the Group’s treasury books in CB&S and PBC) and to the recognition of trading results from own shares in revenues in management reporting (mainly in CB&S) and in equity under IFRS. The major classification difference relates to noncontrolling interest, which represents the net share of minority shareholders in revenues, provision for credit losses, noninterest expenses and income tax expenses. Noncontrolling interest is reported as a component of pre-tax income for the businesses in management reporting (with a reversal in C&A) and a component of net income appropriation under IFRS.
Revenues from transactions between the business segments are allocated on a mutually-agreed basis. Internal service providers, which operate on a non-profit basis, allocate their noninterest expenses to the recipient of the service. The allocation criteria are generally based on service level agreements and are either determined based upon “price per unit”, “fixed price” or “agreed percentages”. Since the Group’s business activities are diverse in nature and its operations are integrated, certain estimates and judgments have been made to apportion revenue and expense items among the business segments. In 2012, the Group ceases to disclose a split of the net revenues between revenues from external customers and intersegment revenues, which was previously presented in the section “Segmental Results of Operations”, as this information is not provided to and not reviewed by the chief operating decision maker within the internal management reporting. The change in approach has also been reflected in the information for the comparative years 2011 and 2010.
| | | | |
| Deutsche Bank | | 02 – Consolidated Financial Statements | | 297 |
| Financial Report 2012 | | Notes to the Consolidated Financial Statements 05 – Business Segments and Related Information | | |
| | |
| | | | |
| | |
| | | | |
The management reporting systems follow a “matched transfer pricing concept” in which the Group’s external net interest income is allocated to the business segments based on the assumption that all positions are funded or invested via the wholesale money and capital markets. Therefore, to create comparability with those competitors who have legally independent units with their own equity funding, the Group allocates a net notional interest credit on its consolidated capital (after deduction of certain related charges such as hedging of net investments in certain foreign operations) to the business segments, in proportion to each business segment’s allocated average active equity.
When implementing the changes to the Group’s business segments in the fourth quarter 2012, a review of the information provided to and reviewed by the chief operating decision maker was conducted. Segment assets are presented in the Group’s internal management reporting based on a consolidated view, i.e. the amounts do not include intersegment balances. This consolidated view is deemed more appropriate, especially for the NCOU, as it improves external transparency on the Group’s non-core positions (e.g. assets) and on progress of targeted de-risking activities. The presentation of segment assets in this note has been changed accordingly. Segment assets for the comparative years 2011 and 2010 were restated.
Management uses certain measures for equity and related ratios as part of its internal reporting system because it believes that these measures provide it with a useful indication of the financial performance of the business segments. The Group discloses such measures to provide investors and analysts with further insight into how management operates the Group’s businesses and to enable them to better understand the Group’s results. These measures include:
— Average Active Equity: The Group uses average active equity to calculate several ratios. However, active equity is not a measure provided for in IFRS and therefore the Group’s ratios based on average active equity should not be compared to other companies’ ratios without considering the differences in the calculation. The items for which the average shareholders’ equity is adjusted to calculate average active equity consist of average accumulated other comprehensive income (loss) excluding foreign currency translation (all components net of applicable taxes) and average dividends, for which a proposal is accrued on a quarterly basis and which are paid after the approval by the Annual General Meeting following each year. Tax rates applied in the calculation of average active equity are those used in the financial statements for the individual items and not an average overall tax rate. In the first quarter 2011, the Group changed the methodology used for allocating average active equity to the business segments and to C&A in proportion to their regulatory requirements. Under the new methodology, economic capital as the basis for allocation is substituted by risk-weighted assets and certain regulatory capital deduction items. All other items of the capital allocation framework remained unchanged. The total amount allocated is determined based on the higher of the Group’s overall economic risk exposure or regulatory capital demand. Starting 2012, the Group derives its internal demand for regulatory capital assuming a Core Tier 1 ratio of 9.0 %, reflecting increased regulatory requirements (previously, this was calculated based on a Tier 1 ratio of 10.0 %). The average active equity for 2011 was adjusted accordingly. The year 2010 was not adjusted based on the grounds that the 9 % Core Tier 1 target was communicated only over the course of 2011 for December 31, 2011, but did not exist in and for 2010. As a result, the amount of capital allocated to the segments has increased, predominantly in CB&S. For management reporting purposes goodwill and other intangible assets with indefinite useful lives are explicitly assigned to the respective divisions. If the Group’s average active equity exceeds the higher of the overall economic risk exposure or the regulatory capital demand, this surplus is assigned to C&A.
— Return on Average Active Equity in % is defined as income (loss) before income taxes less pre-tax noncontrolling interest as a percentage of average active equity. These returns, which are based on average active equity, should not be compared to those of other companies without considering the differences in the calculation of such ratios.
| | | | |
| Deutsche Bank | | 02 – Consolidated Financial Statements | | 298 |
| Financial Report 2012 | | Notes to the Consolidated Financial Statements | | |
| | 05 – Business Segments and Related Information | | |
| | |
| | | | |
| | |
| | | | |
Segmental Results of Operations
The following tables present the results of the business segments, including the reconciliation to the consolidated results under IFRS, for the years ended December 31, 2012, 2011 and 2010, respectively.
| | | | | | | | | | | | | | | | | | | | | | | | |
| 2012 | | | | | | | | | | | | | | | | | | |
in€ m. (unless stated otherwise) | | Corporate
Banking &
Securities | | | Global
Transaction
Banking | | | Asset &
Wealth
Management | | | Private &
Business
Clients | | | Non-Core
Operations
Unit | | | Total
Management
Reporting | |
Net revenues1 | | | 15,648 | | | | 4,006 | | | | 4,4664 | | | | 9,541 | | | | 1,058 | | | | 34,719 | |
| | | | | | | | | | | | | | | | | | | | | | | | |
Provision for credit losses | | | 121 | | | | 168 | | | | 18 | | | | 781 | | | | 634 | | | | 1,721 | |
| | | | | | | | | | | | | | | | | | | | | | | | |
Total noninterest expenses | | | 12,637 | | | | 3,169 | | | | 4,288 | | | | 7,221 | | | | 3,305 | | | | 30,619 | |
therein: | | | | | | | | | | | | | | | | | | | | | | | | |
Depreciation, depletion and amortization | | | 5 | | | | 0 | | | | 0 | | | | (0) | | | | 2 | | | | 8 | |
Severance payments | | | 167 | | | | 24 | | | | 43 | | | | 249 | | | | 3 | | | | 487 | |
Policyholder benefits and claims | | | – | | | | – | | | | 414 | | | | – | | | | – | | | | 414 | |
Impairment of intangible assets | | | 1,174 | | | | 73 | | | | 202 | | | | 15 | | | | 421 | | | | 1,886 | |
Restructuring activities | | | 246 | | | | 40 | | | | 104 | | | | – | | | | 3 | | | | 394 | |
| | | | | | | | | | | | | | | | | | | | | | | | |
Noncontrolling interests | | | 17 | | | | – | | | | 0 | | | | 16 | | | | 33 | | | | 66 | |
| | | | | | | | | | | | | | | | | | | | | | | | |
| Income (loss) before income taxes | | | 2,874 | | | | 669 | | | | 160 | | | | 1,524 | | | | (2,914) | | | | 2,313 | |
| | | | | | | | | | | | | | | | | | | | | | | | |
Cost/income ratio | | | 81 % | | | | 79 % | | | | 96 % | | | | 76 % | | | | N/M | | | | 88 % | |
| | | | | | | | | | | | | | | | | | | | | | | | |
Assets2,3 | | | 1,475,090 | | | | 77,378 | | | | 68,408 | | | | 282,603 | | | | 97,265 | | | | 2,000,744 | |
| | | | | | | | | | | | | | | | | | | | | | | | |
| Expenditures for additions to long-lived assets | | | 15 | | | | 1 | | | | 1 | | | | 140 | | | | – | | | | 157 | |
| | | | | | | | | | | | | | | | | | | | | | | | |
Risk-weighted assets | | | 124,939 | | | | 27,093 | | | | 12,451 | | | | 72,695 | | | | 80,295 | | | | 317,472 | |
| | | | | | | | | | | | | | | | | | | | | | | | |
Average active equity | | | 18,236 | | | | 3,012 | | | | 5,888 | | | | 11,865 | | | | 10,189 | | | | 49,191 | |
| | | | | | | | | | | | | | | | | | | | | | | | |
| Pre-tax return on average active equity | | | 16 % | | | | 22 % | | | | 3 % | | | | 13 % | | | | (29) % | | | | 5 % | |
| | | | | | | | | | | | | | | | | | | | | | | | |
1 Includes: | | | | | | | | | | | | | | | | | | | | | | | | |
| | | | | | | | | | | | | | | | | | | | | | | | |
Net interest income | | | 5,368 | | | | 1,805 | | | | 946 | | | | 6,116 | | | | 1,533 | | | | 15,767 | |
| | | | | | | | | | | | | | | | | | | | | | | | |
Net income (loss) from equity method investments | | | 131 | | | | 5 | | | | 6 | | | | 312 | | | | (299) | | | | 155 | |
| | | | | | | | | | | | | | | | | | | | | | | | |
2 Includes: | | | | | | | | | | | | | | | | | | | | | | | | |
| | | | | | | | | | | | | | | | | | | | | | | | |
Equity method investments | | | 751 | | | | 46 | | | | 131 | | | | 2,303 | | | | 307 | | | | 3,538 | |
| |
N/M – Not meaningful
| 3 | Starting 2012, segment assets represent consolidated view, i.e. the amounts do not include intersegment balances. Prior periods were adjusted accordingly. |
| 4 | Includes Abbey Life insurance revenues of€ 420 million with the related policyholder benefits and claims offset in total noninterest expenses. |
| | | | | | | | | | | | | | | | | | | | | | | | |
| 2011 | | | | | | | | | | | | | | | | | | |
in€ m. (unless stated otherwise) | | Corporate
Banking &
Securities | | | Global
Transaction
Banking | | | Asset &
Wealth
Management | | | Private &
Business
Clients | | | Non-Core
Operations
Unit | | | Total
Management
Reporting | |
Net revenues1 | | | 14,109 | | | | 3,608 | | | | 4,2774 | | | | 10,393 | | | | 879 | | | | 33,266 | |
| | | | | | | | | | | | | | | | | | | | | | | | |
Provision for credit losses | | | 90 | | | | 158 | | | | 22 | | | | 1,185 | | | | 385 | | | | 1,840 | |
| | | | | | | | | | | | | | | | | | | | | | | | |
Total noninterest expenses | | | 10,341 | | | | 2,411 | | | | 3,313 | | | | 7,128 | | | | 2,554 | | | | 25,746 | |
therein: | | | | | | | | | | | | | | | | | | | | | | | | |
Depreciation, depletion and amortization | | | 36 | | | | 6 | | | | 25 | | | | 165 | | | | 272 | | | | 504 | |
Severance payments | | | 79 | | | | 14 | | | | 29 | | | | 220 | | | | 60 | | | | 403 | |
Policyholder benefits and claims | | | – | | | | – | | | | 207 | | | | – | | | | – | | | | 207 | |
Impairment of intangible assets | | | – | | | | – | | | | – | | | | – | | | | – | | | | – | |
Restructuring activities | | | – | | | | – | | | | – | | | | – | | | | – | | | | – | |
| | | | | | | | | | | | | | | | | | | | | | | | |
Noncontrolling interests | | | 21 | | | | – | | | | 0 | | | | 178 | | | | 14 | | | | 213 | |
| | | | | | | | | | | | | | | | | | | | | | | | |
| Income (loss) before income taxes | | | 3,657 | | | | 1,039 | | | | 942 | | | | 1,9025 | | | | (2,074) | | | | 5,466 | |
| | | | | | | | | | | | | | | | | | | | | | | | |
Cost/income ratio | | | 73 % | | | | 67 % | | | | 77 % | | | | 69 % | | | | N/M | | | | 77 % | |
| | | | | | | | | | | | | | | | | | | | | | | | |
Assets2,3 | | | 1,591,863 | | | | 85,751 | | | | 68,848 | | | | 270,086 | | | | 134,712 | | | | 2,151,260 | |
| | | | | | | | | | | | | | | | | | | | | | | | |
| Expenditures for additions to long-lived assets | | | 44 | | | | 7 | | | | 37 | | | | 181 | | | | 98 | | | | 367 | |
| | | | | | | | | | | | | | | | | | | | | | | | |
Risk-weighted assets | | | 155,302 | | | | 26,986 | | | | 14,626 | | | | 78,637 | | | | 103,810 | | | | 379,362 | |
| | | | | | | | | | | | | | | | | | | | | | | | |
Average active equity | | | 14,389 | | | | 3,068 | | | | 5,656 | | | | 12,081 | | | | 11,405 | | | | 46,599 | |
| | | | | | | | | | | | | | | | | | | | | | | | |
| Pre-tax return on average active equity | | | 25 % | | | | 34 % | | | | 17 % | | | | 16 % | | | | (18) % | | | | 12 % | |
| | | | | | | | | | | | | | | | | | | | | | | | |
1 Includes: | | | | | | | | | | | | | | | | | | | | | | | | |
| | | | | | | | | | | | | | | | | | | | | | | | |
Net interest income | | | 5,949 | | | | 1,744 | | | | 805 | | | | 6,592 | | | | 2,152 | | | | 17,242 | |
| | | | | | | | | | | | | | | | | | | | | | | | |
Net income (loss) from equity method investments | | | 23 | | | | 2 | | | | 40 | | | | 140 | | | | (471) | | | | (266) | |
| | | | | | | | | | | | | | | | | | | | | | | | |
2 Includes: | | | | | | | | | | | | | | | | | | | | | | | | |
| | | | | | | | | | | | | | | | | | | | | | | | |
Equity method investments | | | 731 | | | | 43 | | | | 154 | | | | 2,043 | | | | 751 | | | | 3,722 | |
| |
N/M – Not meaningful
| 3 | Starting 2012, segment assets represent consolidated view, i.e. the amounts do not include intersegment balances. Prior periods were adjusted accordingly. |
| 4 | Includes Abbey Life insurance revenues of€ 178 million with the related policyholder benefits and claims offset in total noninterest expenses. |
| 5 | Includes a net positive impact of€ 236 million related to the stake in Hua Xia Bank (PBC). |
| | | | |
| Deutsche Bank | | 02 – Consolidated Financial Statements | | 299 |
| Financial Report 2012 | | Notes to the Consolidated Financial Statements | | |
| | 05 – Business Segments and Related Information | | |
| | |
| | | | |
| | |
| | | | |
| | | | | | | | | | | | | | | | | | | | | | | | |
| 2010 | | | | | | |
in€ m. (unless stated otherwise) | | Corporate
Banking &
Securities | | | Global
Transaction
Banking | | | Asset &
Wealth
Management | | | Private &
Business
Clients | | | Non-Core
Operations
Unit | | | Total
Management
Reporting | |
Net revenues1 | | | 16,282 | | | | 3,3794 | | | | 4,5205 | | | | 6,048 | | | | (1,285)6 | | | | 28,944 | |
| | | | | | | | | | | | | | | | | | | | | | | | |
Provision for credit losses | | | 19 | | | | 113 | | | | 14 | | | | 550 | | | | 577 | | | | 1,273 | |
| | | | | | | | | | | | | | | | | | | | | | | | |
Total noninterest expenses | | | 10,920 | | | | 2,386 | | | | 3,905 | | | | 4,408 | | | | 1,690 | | | | 23,308 | |
therein: | | | | | | | | | | | | | | | | | | | | | | | | |
Depreciation, depletion and amortization | | | 41 | | | | 6 | | | | 46 | | | | 73 | | | | 73 | | | | 238 | |
Severance payments | | | 189 | | | | 71 | | | | 60 | | | | 33 | | | | 61 | | | | 414 | |
Policyholder benefits and claims | | | – | | | | – | | | | 486 | | | | – | | | | – | | | | 486 | |
Impairment of intangible assets | | | – | | | | 29 | | | | – | | | | – | | | | – | | | | 29 | |
Restructuring activities | | | – | | | | – | | | | – | | | | – | | | | – | | | | – | |
| | | | | | | | | | | | | | | | | | | | | | | | |
Noncontrolling interests | | | 21 | | | | – | | | | (2) | | | | 8 | | | | (4) | | | | 24 | |
| | | | | | | | | | | | | | | | | | | | | | | | |
Income (loss) before income taxes | | | 5,321 | | | | 880 | | | | 603 | | | | 1,082 | | | | (3,548) | | | | 4,339 | |
| | | | | | | | | | | | | | | | | | | | | | | | |
Cost/income ratio | | | 67 % | | | | 71 % | | | | 86 % | | | | 73 % | | | | N/M | | | | 81 % | |
| | | | | | | | | | | | | | | | | | | | | | | | |
Assets2,3 | | | 1,314,556 | | | | 67,621 | | | | 66,334 | | | | 276,878 | | | | 168,397 | | | | 1,893,785 | |
| | | | | | | | | | | | | | | | | | | | | | | | |
Expenditures for additions to long-lived assets | | | 52 | | | | 1 | | | | 11 | | | | 67 | | | | 776 | | | | 907 | |
| | | | | | | | | | | | | | | | | | | | | | | | |
Risk-weighted assets | | | 139,216 | | | | 26,996 | | | | 15,051 | | | | 87,031 | | | | 75,228 | | | | 343,522 | |
| | | | | | | | | | | | | | | | | | | | | | | | |
Average active equity | | | 13,320 | | | | 2,416 | | | | 5,277 | | | | 3,174 | | | | 9,318 | | | | 33,505 | |
| | | | | | | | | | | | | | | | | | | | | | | | |
Pre-tax return on average active equity | | | 40 % | | | | 36 % | | | | 11 % | | | | 34 % | | | | (38) % | | | | 13 % | |
| | | | | | | | | | | | | | | | | | | | | | | | |
1 Includes: | | | | | | | | | | | | | | | | | | | | | | | | |
| | | | | | | | | | | | | | | | | | | | | | | | |
Net interest income | | | 7,434 | | | | 1,387 | | | | 751 | | | | 3,671 | | | | 2,283 | | | | 15,526 | |
| | | | | | | | | | | | | | | | | | | | | | | | |
Net income (loss) from equity method investments | | | (83) | | | | 1 | | | | 18 | | | | (12) | | | | (1,934) | | | | (2,010) | |
| | | | | | | | | | | | | | | | | | | | | | | | |
2 Includes: | | | | | | | | | | | | | | | | | | | | | | | | |
| | | | | | | | | | | | | | | | | | | | | | | | |
Equity method investments | | | 1,659 | | | | 41 | | | | 208 | | | | 34 | | | | 616 | | | | 2,558 | |
| |
N/M – Not meaningful
| 3 | Starting 2012, segment assets represent consolidated view, i.e. the amounts do not include intersegment balances. Prior periods were adjusted accordingly. |
| 4 | Includes a gain from the recognition of negative goodwill related to the acquisition of parts of ABN AMRO’s commercial banking activities in the Netherlands of€ 208 million as reported in the second quarter 2010. |
| 5 | Includes Abbey Life insurance revenues of€ 511 million with the related policyholder benefits and claims offset in total noninterest expenses. |
| 6 | Includes a charge related to the investment in Deutsche Postbank AG of€ 2,338 million. |
Reconciliation of Segmental Results of Operations to Consolidated Results of Operations
The following table presents a reconciliation of the total results of operations and total assets of the Group’s business segments under management reporting systems to the consolidated financial statements for the years ended December 31, 2012, 2011 and 2010, respectively.
| | | | | | | | | | | | | | | | | | | | | | | | | | | | | | | | | | | | |
| | | 2012 | | | 2011 | | | 2010 | |
in€ m. | | Total
Management
Reporting | | | Consoli-
dation &
Adjustments | | | Total
Consolidated | | | Total
Management
Reporting | | | Consoli-
dation &
Adjustments | | | Total
Consolidated | | | Total
Management
Reporting | | | Consoli-
dation &
Adjustments | | | Total
Consolidated | |
| Net revenues1 | | | 34,719 | | | | (978) | | | | 33,741 | | | | 33,266 | | | | (38) | | | | 33,228 | | | | 28,944 | | | | (377) | | | | 28,567 | |
| | | | | | | | | | | | | | | | | | | | | | | | | | | | | | | | | | | | |
| Provision for credit losses | | | 1,721 | | | | 0 | | | | 1,721 | | | | 1,840 | | | | (1) | | | | 1,839 | | | | 1,273 | | | | 0 | | | | 1,274 | |
| | | | | | | | | | | | | | | | | | | | | | | | | | | | | | | | | | | | |
| Noninterest expenses | | | 30,619 | | | | 617 | | | | 31,236 | | | | 25,746 | | | | 253 | | | | 25,999 | | | | 23,308 | | | | 10 | | | | 23,318 | |
| | | | | | | | | | | | | | | | | | | | | | | | | | | | | | | | | | | | |
| Noncontrolling interests | | | 66 | | | | (66) | | | | – | | | | 213 | | | | (213) | | | | – | | | | 24 | | | | (24) | | | | – | |
| | | | | | | | | | | | | | | | | | | | | | | | | | | | | | | | | | | | |
| Income (loss) before income taxes | | | 2,313 | | | | (1,529) | | | | 784 | | | | 5,466 | | | | (77) | | | | 5,390 | | | | 4,339 | | | | (363) | | | | 3,975 | |
| | | | | | | | | | | | | | | | | | | | | | | | | | | | | | | | | | | | |
| Assets2 | | | 2,000,744 | | | | 11,585 | | | | 2,012,329 | | | | 2,151,260 | | | | 12,843 | | | | 2,164,103 | | | | 1,893,785 | | | | 11,844 | | | | 1,905,630 | |
| | | | | | | | | | | | | | | | | | | | | | | | | | | | | | | | | | | | |
| Risk-weighted assets | | | 317,472 | | | | 16,133 | | | | 333,605 | | | | 379,362 | | | | 1,884 | | | | 381,246 | | | | 343,522 | | | | 2,683 | | | | 346,204 | |
| | | | | | | | | | | | | | | | | | | | | | | | | | | | | | | | | | | | |
| Average active equity3 | | | 49,191 | | | | 5,929 | | | | 55,120 | | | | 46,599 | | | | 3,850 | | | | 50,449 | | | | 33,505 | | | | 7,848 | | | | 41,353 | |
| |
| 1 | Net interest income and noninterest income. |
| 2 | Starting 2012, segment assets represent consolidated view, i.e. the amounts do not include intersegment balances. Prior periods were adjusted accordingly. |
| 3 | The increase in Average Active Equity in C&A reflects the capital build up the bank is undertaking in light of increasing external capital requirements under the Basel 3 framework. |
In 2012, the main components of net revenues in C&A were:
| — | | Timing differences of approximately negative€ 715 million related to positions which were measured at fair value for management reporting purposes and measured at amortized cost under IFRS. These effects will reverse over the life time of the positions. The negative effect included approximately€ 305 million related to economically hedged positions which resulted from the reversal of prior period interest rate effects and from changes in interest rates in both euro and U.S. dollar. Approximately€ 290 million were attributable to |
| | | | |
| Deutsche Bank | | 02 – Consolidated Financial Statements | | 300 |
| Financial Report 2012 | | Notes to the Consolidated Financial Statements 05 – Business Segments and Related Information | | |
| | |
| | | | |
| | |
| | | | |
| | | a narrowing of mid- to long-term spreads on the mark-to-market valuation of U.S. dollar/euro basis swaps related to the Group’s funding. In addition, the narrowing of credit spreads on Group’s own debt contributed mark-to-market losses of approximately€ 115 million to the result in C&A. |
| — | | Hedging of net investments in certain foreign operations decreased net revenues by approximately€ 345 million. |
| — | | The remainder of net revenues was mainly due to net interest income which was not allocated to the business segments and items outside the management responsibility of the business segments. Such items include net funding expenses on non-divisionalized assets/liabilities, e.g. deferred tax assets/liabilities, and net interest income related to tax refunds and accruals. |
Noninterest expenses included litigation related charges of approximately€ 360 million as well as bank levies of€ 213 million, primarily related to Germany, partly offset by the UK due to a credit resulting from a double taxation agreement.
Noncontrolling interests are deducted from income before income taxes of the divisions and reversed in C&A. The decrease in 2012 compared to 2011 was mainly due to Postbank.
Assets in C&A reflect corporate assets, such as deferred tax assets or central clearing accounts, outside the management responsibility of the business segments.
Risk-weighted assets in C&A reflect corporate assets outside the management responsibility of the business segments, primarily those corporate assets related to the Group’s pension schemes. The main driver for the increase of risk-weighted assets was the reclassification of risk-weighted assets related to gross pension fund assets in 2012 to C&A.
Average active equity assigned to C&A reflects the residual amount of equity that is not allocated to the segments as described in the “Measurement of Segment Profit or Loss” section of this Note.
In 2011 and in 2010, the main components of net revenues in C&A were:
| — | | Timing differences from different accounting methods used for management reporting and IFRS amounted to approximately positive€ 25 million and negative€ 210 million in 2011 and 2010, respectively. In 2011, the result was essentially related to two partly offsetting effects. The widening of the credit spread of the Group’s own debt resulted in a mark-to market gain. Economically hedged short-term positions as well as economically hedged debt issuance trades resulted in a net loss, mainly driven by movements in interest rates in both euro and U.S. dollar. In 2010, the latter was the main driver for the mark-to market loss. |
| — | | Hedging of net investments in certain foreign operations decreased net revenues by approximately€ 215 million and€ 245 million, respectively. |
| — | | The remainder of net revenues was due to net interest income which was not allocated to the business segments and items outside the management responsibility of the business segments. Such items include net funding expenses on non-divisionalized assets/liabilities, e.g. deferred tax assets/liabilities, and net interest income related to tax refunds and accruals. |
Noninterest expenses in 2011 were driven by bank levies of€ 247 million, primarily related to Germany and the UK. In 2010, they included the receipt of insurance payments which were partly offset by charges for litigation provisions as well as other items outside the management responsibility of the business segments.
The increase in noncontrolling interests in 2011 compared to 2010 was mainly due to Postbank.
| | | | |
| Deutsche Bank | | 02 – Consolidated Financial Statements Notes to the Consolidated Financial Statements 05 – Business Segments and Related Information | | 301 |
| Financial Report 2012 | | | |
| | | |
| | |
| | | | |
Entity-Wide Disclosures
Net Revenue Components
| | | | | | | | | | | | |
in€ m. | | 2012 | | | 2011 | | | 2010 | |
Corporate Banking & Securities: | | | | | | | | | | | | |
| | | | | | | | | | | | |
Sales & Trading (debt and other products) | | | 9,181 | | | | 8,520 | | | | 9,844 | |
| | | | | | | | | | | | |
Sales & Trading (equity) | | | 2,288 | | | | 2,235 | | | | 2,875 | |
| | | | | | | | | | | | |
Sales & Trading (equity, debt & other) | | | 11,469 | | | | 10,755 | | | | 12,718 | |
| | | | | | | | | | | | |
Origination (debt) | | | 1,417 | | | | 1,056 | | | | 1,200 | |
| | | | | | | | | | | | |
Origination (equity) | | | 518 | | | | 559 | | | | 706 | |
| | | | | | | | | | | | |
Origination (equity & debt) | | | 1,935 | | | | 1,615 | | | | 1,906 | |
| | | | | | | | | | | | |
Advisory | | | 590 | | | | 621 | | | | 573 | |
| | | | | | | | | | | | |
Loan products | | | 1,107 | | | | 1,158 | | | | 1,146 | |
| | | | | | | | | | | | |
Other products | | | 547 | | | | (39) | | | | (62) | |
| | | | | | | | | | | | |
Total Corporate Banking & Securities | | | 15,648 | | | | 14,109 | | | | 16,282 | |
| | | | | | | | | | | | |
| | | | | | | | | | | | |
| | | | | | | | | | | | |
Global Transaction Banking: | | | | | | | | | | | | |
| | | | | | | | | | | | |
Transaction services | | | 4,006 | | | | 3,608 | | | | 3,163 | |
| | | | | | | | | | | | |
Other products | | | – | | | | – | | | | 216 | |
| | | | | | | | | | | | |
Total Global Transaction Banking | | | 4,006 | | | | 3,608 | | | | 3,379 | |
| | | | | | | | | | | | |
| | | | | | | | | | | | |
| | | | | | | | | | | | |
Asset & Wealth Management: | | | | | | | | | | | | |
| | | | | | | | | | | | |
Discretionary portfolio management/fund management | | | 2,108 | | | | 2,104 | | | | 2,178 | |
| | | | | | | | | | | | |
Advisory/brokerage | | | 807 | | | | 789 | | | | 830 | |
| | | | | | | | | | | | |
Credit products | | | 411 | | | | 393 | | | | 378 | |
| | | | | | | | | | | | |
Deposits and payment services | | | 236 | | | | 158 | | | | 142 | |
| | | | | | | | | | | | |
Other products1 | | | 904 | | | | 833 | | | | 993 | |
| | | | | | | | | | | | |
Total Asset & Wealth Management | | | 4,466 | | | | 4,277 | | | | 4,520 | |
| | | | | | | | | | | | |
| | | | | | | | | | | | |
| | | | | | | | | | | | |
Private & Business Clients: | | | | | | | | | | | | |
| | | | | | | | | | | | |
Discretionary portfolio management/fund management | | | 213 | | | | 251 | | | | 313 | |
| | | | | | | | | | | | |
Advisory/brokerage | | | 860 | | | | 914 | | | | 887 | |
| | | | | | | | | | | | |
Credit products | | | 2,149 | | | | 2,099 | | | | 2,117 | |
| | | | | | | | | | | | |
Deposits and payment services | | | 2,064 | | | | 2,085 | | | | 1,962 | |
| | | | | | | | | | | | |
Other products2 | | | 4,255 | | | | 5,044 | | | | 769 | |
| | | | | | | | | | | | |
Total Private & Business Clients | | | 9,541 | | | | 10,393 | | | | 6,048 | |
| | | | | | | | | | | | |
Total Non-Core Operations Unit | | | 1,058 | | | | 879 | | | | (1,285) | |
| | | | | | | | | | | | |
Consolidation & Adjustments | | | (978) | | | | (38) | | | | (377) | |
| | | | | | | | | | | | |
Total3 | | | 33,741 | | | | 33,228 | | | | 28,567 | |
| |
| 1 | Includes revenues from ETF business. |
| 2 | Includes revenues from Postbank since consolidation on December 3, 2010. |
| 3 | Total net revenues presented above include net interest income, net gains (losses) on financial assets/liabilities at fair value through profit or loss and other revenues such as commissions and fee income. |
| | | | |
| Deutsche Bank | | 02 – Consolidated Financial Statements Notes to the Consolidated Financial Statements 05 – Business Segments and Related Information | | 302 |
| Financial Report 2012 | | | |
| | | |
| | |
| | | | |
The following table presents total net revenues (before provisions for credit losses) by geographic area for the years ended December 31, 2012, 2011 and 2010, respectively. The information presented for CB&S, GTB, AWM, PBC and NCOU has been classified based primarily on the location of the Group’s office in which the revenues are recorded. The information for C&A is presented on a global level only, as management responsibility for C&A is held centrally.
| | | | | | | | | | | | |
in€ m. | | 2012 | | | 2011 | | | 2010 | |
Germany: | | | | | | | | | | | | |
CB&S | | | 1,483 | | | | 1,380 | | | | 1,724 | |
GTB | | | 1,256 | | | | 1,213 | | | | 1,159 | |
AWM | | | 1,157 | | | | 1,181 | | | | 1,188 | |
PBC | | | 7,560 | | | | 8,516 | | | | 4,438 | |
NCOU | | | 1,018 | | | | 520 | | | | 360 | |
| | | | | | | | | | | | |
Total Germany | | | 12,473 | | | | 12,808 | | | | 8,869 | |
| | | | | | | | | | | | |
Europe, Middle East and Africa: | | | | | | | | | | | | |
CB&S | | | 5,833 | | | | 5,393 | | | | 5,837 | |
GTB | | | 1,377 | | | | 1,263 | | | | 1,225 | |
AWM | | | 1,218 | | | | 2,070 | | | | 1,912 | |
PBC | | | 1,949 | | | | 1,851 | | | | 1,574 | |
NCOU | | | (422) | | | | (124) | | | | (1,687) | |
| | | | | | | | | | | | |
Total Europe, Middle East and Africa1 | | | 9,955 | | | | 10,453 | | | | 8,861 | |
| | | | | | | | | | | | |
Americas (primarily United States): | | | | | | | | | | | | |
CB&S | | | 5,663 | | | | 4,693 | | | | 5,781 | |
GTB | | | 770 | | | | 627 | | | | 596 | |
AWM | | | 1,666 | | | | 623 | | | | 1,061 | |
PBC | | | – | | | | – | | | | – | |
NCOU | | | 484 | | | | 445 | | | | 15 | |
| | | | | | | | | | | | |
Total Americas | | | 8,584 | | | | 6,389 | | | | 7,453 | |
| | | | | | | | | | | | |
Asia/Pacific: | | | | | | | | | | | | |
CB&S | | | 2,670 | | | | 2,643 | | | | 2,939 | |
GTB | | | 603 | | | | 505 | | | | 400 | |
AWM | | | 424 | | | | 404 | | | | 360 | |
PBC | | | 32 | | | | 27 | | | | 37 | |
NCOU | | | (22) | | | | 38 | | | | 28 | |
| | | | | | | | | | | | |
Total Asia/Pacific | | | 3,707 | | | | 3,617 | | | | 3,763 | |
| | | | | | | | | | | | |
Consolidation & Adjustments | | | (978) | | | | (38) | | | | (377) | |
| | | | | | | | | | | | |
Consolidated net revenues2 | | | 33,741 | | | | 33,228 | | | | 28,567 | |
| |
| 1 | For the years ended December 31, 2012, 2011 and 2010 the United Kingdom accounted for 48 %, 53 % and 70 % of these revenues, respectively. |
| 2 | Consolidated net revenues comprise interest and similar income, interest expenses and total noninterest income (including net commission and fee income). Revenues are attributed to countries based on the location in which the Group’s booking office is located. The location of a transaction on the Group’s books is sometimes different from the location of the headquarters or other offices of a customer and different from the location of the Group’s personnel who entered into or facilitated the transaction. Where the Group records a transaction involving its staff and customers and other third parties in different locations frequently depends on other considerations, such as the nature of the transaction, regulatory considerations and transaction processing considerations. |
| | | | |
| Deutsche Bank | | 02 – Consolidated Financial Statements | | 303 |
| Financial Report 2012 | | Notes to the Consolidated Income Statement 06 – Net Interest Income and Net Gains (Losses) on Financial Assets/Liabilities
at Fair Value through Profit or Loss | | |
| | | |
| | |
| | | | |
Notes to the Consolidated Income Statement
06 –
Net Interest Income and Net Gains (Losses) on Financial Assets/Liabilities at Fair Value through Profit or Loss
Net Interest Income
| | | | | | | | | | | | |
in€ m. | | 2012 | | | 2011 | | | 2010 | |
Interest and similar income: | | | | | | | | | | | | |
Interest-earning deposits with banks | | | 919 | | | | 794 | | | | 691 | |
Central bank funds sold and securities purchased under resale agreements | | | 762 | | | | 977 | | | | 446 | |
Securities borrowed | | | 203 | | | | 155 | | | | 133 | |
Financial assets at fair value through profit or loss | | | 14,124 | | | | 15,376 | | | | 15,589 | |
Interest income on financial assets available for sale | | | 1,449 | | | | 935 | | | | 700 | |
Dividend income on financial assets available for sale | | | 138 | | | | 148 | | | | 137 | |
Loans | | | 13,662 | | | | 14,914 | | | | 10,222 | |
Other | | | 985 | | | | 1,579 | | | | 861 | |
| | | | | | | | | | | | |
Total interest and similar income | | | 32,242 | | | | 34,878 | | | | 28,779 | |
| | | | | | | | | | | | |
Interest expense: | | | | | | | | | | | | |
Interest-bearing deposits | | | 5,725 | | | | 6,779 | | | | 3,800 | |
Central bank funds purchased and securities sold under repurchase agreements | | | 315 | | | | 426 | | | | 301 | |
Securities loaned | | | 421 | | | | 343 | | | | 278 | |
Financial liabilities at fair value through profit or loss | | | 6,637 | | | | 6,515 | | | | 6,019 | |
Other short-term borrowings | | | 342 | | | | 479 | | | | 375 | |
Long-term debt | | | 1,929 | | | | 1,835 | | | | 1,490 | |
Trust preferred securities | | | 842 | | | | 813 | | | | 781 | |
Other | | | 140 | | | | 243 | | | | 152 | |
| | | | | | | | | | | | |
Total interest expense | | | 16,351 | | | | 17,433 | | | | 13,196 | |
| | | | | | | | | | | | |
Net interest income | | | 15,891 | | | | 17,445 | | | | 15,583 | |
| |
Interest income recorded on impaired financial assets was€ 100 million,€ 83 million and€ 146 million for the years ended December 31, 2012, 2011 and 2010, respectively.
Net Gains (Losses) on Financial Assets/Liabilities at Fair Value through Profit or Loss
| | | | | | | | | | | | |
in€ m. | | 2012 | | | 2011 | | | 2010 | |
Trading income: | | | | | | | | | | | | |
Sales & Trading (equity) | | | 1,601 | | | | (1,404) | | | | 133 | |
Sales & Trading (debt and other products) | | | 4,630 | | | | 4,379 | | | | 4,982 | |
Total Sales & Trading | | | 6,230 | | | | 2,975 | | | | 5,115 | |
Other trading income | | | (669) | | | | (226) | | | | (1,457) | |
| | | | | | | | | | | | |
Total trading income | | | 5,561 | | | | 2,749 | | | | 3,658 | |
| | | | | | | | | | | | |
Net gains (losses) on financial assets/liabilities designated at fair value through profit or loss: | | | | | | | | | | | | |
Breakdown by financial asset/liability category: | | | | | | | | | | | | |
Securities purchased/sold under resale/repurchase agreements | | | 14 | | | | (20) | | | | 35 | |
Securities borrowed/loaned | | | (1) | | | | (0) | | | | – | |
Loans and loan commitments | | | 738 | | | | (894) | | | | (331) | |
Deposits | | | (56) | | | | (368) | | | | (13) | |
Long-term debt1 | | | (698) | | | | 1,772 | | | | 83 | |
Other financial assets/liabilities designated at fair value through profit or loss | | | 41 | | | | (181) | | | | (78) | |
| | | | | | | | | | | | |
Total net gains (losses) on financial assets/liabilities designated at fair value through profit or loss | | | 38 | | | | 309 | | | | (304) | |
| | | | | | | | | | | | |
Total net gains (losses) on financial assets/liabilities at fair value through profit or loss | | | 5,599 | | | | 3,058 | | | | 3,354 | |
| |
| 1 | Includes€ 167 million,€ (20) million and€ 39 million from securitization structures for the years ended December 31, 2012, 2011 and 2010, respectively. Fair value movements on related instruments of€ 97 million,€ (108) million and€ 163 million for December 31, 2012, 2011 and 2010, respectively, are reported within trading income. Both are reported under Sales & Trading (debt and other products). The total of these gains and losses represents the Group’s share of the losses in these consolidated securitization structures. |
| | | | |
| Deutsche Bank | | 02 – Consolidated Financial Statements | | 304 |
| Financial Report 2012 | | Notes to the Consolidated Income Statement 07 – Commissions and Fee Income | | |
| | | |
| | |
| | | | |
Combined net interest income and net gains (losses) on financial assets/liabilities at fair value through profit or loss
| | | | | | | | | | | | |
in€ m. | | 2012 | | | 2011 | | | 2010 | |
Net interest income | | | 15,891 | | | | 17,445 | | | | 15,583 | |
| | | | | | | | | | | | |
Net gains (losses) on financial assets/liabilities at fair value through profit or loss | | | 5,599 | | | | 3,058 | | | | 3,354 | |
| | | | | | | | | | | | |
| Total net interest income and net gains (losses) on financial assets/liabilities at fair value through profit or loss | | | 21,490 | | | | 20,503 | | | | 18,937 | |
| | | | | | | | | | | | |
| Net interest income and net gains (losses) on financial assets/liabilities at fair value through profit or loss by Corporate Division/product: | | | | | | | | | | | | |
Sales & Trading (equity) | | | 1,738 | | | | 1,504 | | | | 2,151 | |
Sales & Trading (debt and other products) | | | 8,212 | | | | 8,107 | | | | 9,102 | |
Total Sales & Trading | | | 9,951 | | | | 9,611 | | | | 11,253 | |
Loan products1 | | | 337 | | | | 353 | | | | 171 | |
Remaining products | | | 1,015 | | | | 535 | | | | 353 | |
| | | | | | | | | | | | |
Corporate Banking & Securities2 | | | 11,303 | | | | 10,499 | | | | 11,777 | |
| | | | | | | | | | | | |
Global Transaction Banking | | | 1,869 | | | | 1,842 | | | | 1,451 | |
| | | | | | | | | | | | |
Asset & Wealth Management | | | 1,451 | | | | 991 | | | | 1,179 | |
| | | | | | | | | | | | |
Private & Business Clients | | | 6,221 | | | | 6,623 | | | | 3,875 | |
| | | | | | | | | | | | |
Non-Core Operations Unit | | | 277 | | | | 588 | | | | 321 | |
| | | | | | | | | | | | |
Consolidation & Adjustments | | | 370 | | | | (40) | | | | 333 | |
| | | | | | | | | | | | |
| Total net interest income and net gains (losses) on financial assets/liabilities at fair value through profit or loss | | | 21,490 | | | | 20,503 | | | | 18,937 | |
| |
| 1 | Includes the net interest spread on loans as well as the fair value changes of credit default swaps and loans designated at fair value through profit or loss. |
| 2 | Includes net interest income and net gains (losses) on financial assets/liabilities at fair value through profit or loss of origination, advisory and other products. |
The Group’s trading and risk management businesses include significant activities in interest rate instruments and related derivatives. Under IFRS, interest and similar income earned from trading instruments and financial instruments designated at fair value through profit or loss (e.g., coupon and dividend income), and the costs of funding net trading positions, are part of net interest income. The Group’s trading activities can periodically shift income between net interest income and net gains (losses) of financial assets/liabilities at fair value through profit or loss depending on a variety of factors, including risk management strategies. In order to provide a more business-focused presentation, the Group combines net interest income and net gains (losses) of financial assets/liabilities at fair value through profit or loss by business division and by product within CB&S.
07 –
Commissions and Fee Income
| | | | | | | | | | | | |
in€ m. | | 2012 | | | 2011 | | | 2010 | |
Commission and fee income and expense: | | | | | | | | | | | | |
| | | | | | | | | | | | |
Commission and fee income | | | 13,933 | | | | 14,409 | | | | 13,652 | |
Commission and fee expense | | | 2,422 | | | | 2,865 | | | | 2,983 | |
| | | | | | | | | | | | |
Net commissions and fee income | | | 11,510 | | | | 11,544 | | | | 10,669 | |
| | | | | | | | | | | | |
| | | | | | | | | | | | |
in€ m. | | 2012 | | | 2011 | | | 2010 | |
Net commissions and fee income: | | | | | | | | | | | | |
| | | | | | | | | | | | |
Net commissions and fees from fiduciary activities | | | 3,425 | | | | 3,458 | | | | 3,529 | |
Net commissions, brokers’ fees, mark-ups on securities underwriting and other securities activities | | | 3,418 | | | | 3,665 | | | | 3,873 | |
Net fees for other customer services1 | | | 4,667 | | | | 4,421 | | | | 3,267 | |
| | | | | | | | | | | | |
Net commissions and fee income | | | 11,510 | | | | 11,544 | | | | 10,669 | |
| |
| 1 | The increase from 2010 to 2011 includes commissions related to nonbanking activities of Postbank. |
| | | | |
| Deutsche Bank | | 02 – Consolidated Financial Statements | | 305 |
| Financial Report 2012 | | Notes to the Consolidated Income Statement 09 – Other Income | | |
| | | |
| | |
| | | | |
08 –
Net Gains (Losses) on Financial Assets Available for Sale
| | | | | | | | | | | | |
in€ m. | | 2012 | | | 2011 | | | 2010 | |
Net gains (losses) on financial assets available for sale: | | | | | | | | | | | | |
| | | | | | | | | | | | |
Net gains (losses) on debt securities: | | | 65 | | | | (223) | | | | 58 | |
Net gains (losses) from disposal | | | 116 | | | | 285 | | | | 74 | |
Impairments | | | (51) | | | | (508) | 1 | | | (16) | |
| | | | | | | | | | | | |
Net gains (losses) on equity securities: | | | 206 | | | | 289 | | | | 120 | |
Net gains (losses) from disposal/remeasurement | | | 306 | | | | 383 | | | | 164 | |
Impairments | | | (100) | | | | (94) | | | | (44) | |
| | | | | | | | | | | | |
Net gains (losses) on loans: | | | 55 | | | | 17 | | | | 18 | |
Net gains (losses) from disposal | | | 63 | | | | 24 | | | | 36 | |
Impairments | | | (8) | | | | (7) | | | | (18) | |
Reversal of impairments | | | 0 | | | | – | | | | 0 | |
| | | | | | | | | | | | |
Net gains (losses) on other equity interests: | | | (25) | | | | 39 | | | | 5 | |
Net gains (losses) from disposal | | | (24) | | | | 56 | | | | 40 | |
Impairments | | | (1) | | | | (17) | | | | (35) | |
| | | | | | | | | | | | |
Total net gains (losses) on financial assets available for sale | | | 301 | | | | 123 | | | | 201 | |
| |
| 1 | Includes impairments of€ (527) million on Greek government bonds, partly offset by reversals of impairments on debt securities recorded in prior periods. |
Please refer also to Note 17 “Financial Assets available for Sale” of this report.
09 –
Other Income
| | | | | | | | | | | | |
in€ m. | | 2012 | | | 2011 | | | 2010 | |
Other income: | | | | | | | | | | | | |
| | | | | | | | | | | | |
Net income from investment properties | | | (18) | | | | 33 | | | | (3) | |
Net gains (losses) on disposal of investment properties | | | 31 | | | | 14 | | | | 5 | |
Net gains (losses) on disposal of consolidated subsidiaries | | | 41 | | | | 39 | | | | 18 | |
Net gains (losses) on disposal of loans | | | 4 | | | | (22) | | | | (87) | |
Insurance premiums1 | | | 220 | | | | 214 | | | | 252 | |
Net income from derivatives qualifying for hedge accounting2 | | | (1,081) | | | | 336 | | | | 34 | |
Consolidated investments3 | | | 768 | | | | 570 | | | | 247 | |
Remaining other income | | | 316 | | | | 138 | | | | 298 | |
| | | | | | | | | | | | |
Total other income | | | 281 | | | | 1,322 | | | | 764 | |
| |
| 1 | Net of reinsurance premiums paid. The development is primarily driven by Abbey Life Assurance Company Limited. |
| 2 | The decrease in 2012 compared to 2011 is driven by ineffectiveness related to hedges. |
| 3 | The increase in 2011 compared to 2010 is essentially driven by The Cosmopolitan of Las Vegas, mainly related to the start of its operations at the end of 2010. |
| | | | |
| Deutsche Bank | | 02 – Consolidated Financial Statements | | 306 |
| Financial Report 2012 | | Notes to the Consolidated Income Statement 11 – Restructuring | | |
| | | |
| | |
| | | | |
10 –
General and Administrative Expenses
| | | | | | | | | | | | |
in€ m. | | 2012 | | | 2011 | | | 2010 | |
General and administrative expenses: | | | | | | | | | | | | |
| | | | | | | | | | | | |
IT costs | | | 2,547 | | | | 2,194 | | | | 2,274 | |
Occupancy, furniture and equipment expenses | | | 2,115 | | | | 2,072 | | | | 1,679 | |
Professional service fees | | | 1,870 | | | | 1,632 | | | | 1,616 | |
Communication and data services | | | 907 | | | | 849 | | | | 785 | |
Travel and representation expenses | | | 518 | | | | 539 | | | | 554 | |
Payment, clearing and custodian services | | | 609 | | | | 504 | | | | 418 | |
Marketing expenses | | | 376 | | | | 410 | | | | 335 | |
Consolidated investments1 | | | 760 | | | | 652 | | | | 390 | |
Other expenses2 | | | 5,314 | | | | 3,805 | | | | 2,082 | |
| | | | | | | | | | | | |
Total general and administrative expenses | | | 15,016 | | | | 12,657 | | | | 10,133 | |
| |
| 1 | The increase in consolidated investments in 2011 compared to 2010 is essentially driven by The Cosmopolitan of Las Vegas, mainly related to the start of its operations at the end of 2010. |
| 2 | The increase in 2012 compared to 2011 is mainly driven by litigation related expenses of€ 2.5 billion. See Note 29 “Provisions”, for more detail on litigation. The increase in 2011 compared to 2010 is primarily driven by specific charges in CB&S (€ 655 million litigation related expenses and a specific charge of€ 310 million relating to the impairment of a German VAT claim) and the first time consideration of€ 247 million for the German and UK bank levies. |
11 –
Restructuring
The Group aims to enhance its long-term competitiveness through major reductions in costs, duplication and complexity in the years ahead. The Group plans to invest approximately€ 4 billion over the next three years with the aim of achieving full run-rate annual cost savings of€ 4.5 billion by 2015.
The Group disclosed in its Interim Report as of June 30, 2012 a headcount reduction of approximately 1,900. During the second half of 2012 the Group identified 2,361 headcount that will be reduced through restructuring and other means. Of these reductions, 673 headcount have been reduced through activities that were not eligible for treatment as restructuring charges pursuant to the restructuring program described in the following paragraph, for instance voluntary leavers and retirements where the roles will not be replaced. The remaining 1,688 headcount have been identified as restructuring eligible. The total headcount reductions were identified within the CB&S Corporate Division (1,064 headcount), the AWM Corporate Division (683 headcount) and the NCOU (2 headcount). The headcount reduction for Infrastructure functions was 612 headcount, thereof 497 headcount supported the CB&S Corporate Division and 115 headcount supported the AWM Corporate Division.
In the second half of 2012 the Group’s Management Board approved two phases of restructuring which form part of the planned investment of approximately€ 4 billion. The restructuring expense is comprised of termination benefits, additional expenses covering the acceleration of deferred compensation awards not yet amortized due to the discontinuation of employment and contract termination costs related to real estate. Restructuring expenses of€ 394 million were recognized in the second half of 2012, thereof€ 311 million for termination benefits relating to the reduction of headcount according to the Group’s accounting policy for restructuring expenses. An additional expense amount of€ 83 million was incurred for the acceleration of deferred compensation awards not yet amortized. Of the total amount of€ 394 million, the CB&S Corporate Division was charged€ 246 million, the AWM Corporate Division€ 104 million, the GTB Division€ 41 million and the NCOU Unit€ 3 million respectively, including allocations from Infrastructure functions. Provisions for restructuring as of December 31, 2012 amounted to€ 165 million.
The majority of the remaining approved restructuring expense budget is expected to be utilized in the first half of 2013.
| | | | |
| Deutsche Bank | | 02 – Consolidated Financial Statements | | 307 |
| Financial Report 2012 | | Notes to the Consolidated Income Statement 12 – Earnings per Share | | |
| | | |
| | |
| | | | |
12 –
Earnings per Share
Basic earnings per share amounts are computed by dividing net income (loss) attributable to Deutsche Bank shareholders by the average number of common shares outstanding during the year. The average number of common shares outstanding is defined as the average number of common shares issued, reduced by the average number of shares in treasury and by the average number of shares that will be acquired under physically-settled forward purchase contracts, and increased by undistributed vested shares awarded under deferred share plans.
Diluted earnings per share assumes the conversion into common shares of outstanding securities or other contracts to issue common stock, such as share options, convertible debt, unvested deferred share awards and forward contracts. The aforementioned instruments are only included in the calculation of diluted earnings per share if they are dilutive in the respective reporting period.
Computation of basic and diluted earnings per share
| | | | | | | | | | | | |
in€ m. | | 2012 | | | 2011 | | | 2010 | |
| Net income (loss) attributable to Deutsche Bank shareholders – numerator for basic earnings per share | | | 237 | | | | 4,132 | | | | 2,310 | |
| | | | | | | | | | | | |
Effect of dilutive securities: | | | | | | | | | | | | |
Forwards and options | | | – | | | | – | | | | – | |
Convertible debt | | | – | | | | (13) | | | | 3 | |
| | | | | | | | | | | | |
| Net income (loss) attributable to Deutsche Bank shareholders after assumed conversions ��� numerator for diluted earnings per share | | | 237 | | | | 4,119 | | | | 2,313 | |
| | | | | | | | | | | | |
Number of shares in m. | | | | | | | | | | | | |
| | | | | | | | | | | | |
Weighted-average shares outstanding – denominator for basic earnings per share | | | 934.1 | | | | 928.0 | | | | 753.3 | |
| | | | | | | | | | | | |
Effect of dilutive securities: | | | | | | | | | | | | |
Forwards | | | – | | | | – | | | | – | |
Employee stock compensation options | | | – | | | | – | | | | – | |
Convertible debt | | | – | | | | 1.5 | | | | 2.1 | |
Deferred shares | | | 25.8 | | | | 27.8 | | | | 35.4 | |
Other (including trading options) | | | – | | | | – | | | | – | |
| | | | | | | | | | | | |
Dilutive potential common shares | | | 25.8 | | | | 29.3 | | | | 37.5 | |
| | | | | | | | | | | | |
| Adjusted weighted-average shares after assumed conversions – denominator for diluted earnings per share | | | 959.9 | | | | 957.3 | | | | 790.8 | |
| |
Earnings per share | | | | | | | | | | | | |
in€ | | 2012 | | | 2011 | | | 2010 | |
Basic earnings per share | | | 0.25 | | | | 4.45 | | | | 3.07 | |
| | | | | | | | | | | | |
Diluted earnings per share | | | 0.25 | | | | 4.30 | | | | 2.92 | |
| |
On October 6, 2010, Deutsche Bank AG completed a capital increase with subscription rights. As the subscription price of the new shares was lower than the market price of the existing shares, the capital increase included a bonus element. According to IAS 33, the bonus element is the result of an implicit change in the number of shares outstanding for all periods prior to the capital increase without a fully proportionate change in resources. As a consequence, the weighted average number of shares outstanding has been adjusted retrospectively for all periods before October 6, 2010.
| | | | |
| Deutsche Bank | | 02 – Consolidated Financial Statements | | 308 |
| Financial Report 2012 | | Notes to the Consolidated Balance Sheet 13 – Financial Assets/Liabilities at Fair Value through Profit or Loss | | |
| | | |
| | |
| | | | |
Instruments outstanding and not included in the calculation of diluted earnings per share1
| | | | | | | | | | | | |
Number of shares in m. | | 2012 | | | 2011 | | | 2010 | |
Forward purchase contracts | | | – | | | | – | | | | – | |
| | | | | | | | | | | | |
Convertible debt | | | – | | | | 0.2 | | | | – | |
| | | | | | | | | | | | |
Put options sold | | | 0.0 | | | | – | | | | – | |
| | | | | | | | | | | | |
Call options sold | | | 0.0 | | | | – | | | | – | |
| | | | | | | | | | | | |
Employee stock compensation options | | | 0.3 | | | | 0.3 | | | | 0.4 | |
| | | | | | | | | | | | |
Deferred shares | | | – | | | | – | | | | – | |
| |
| 1 | Not included in the calculation of diluted earnings per share, because to do so would have been anti-dilutive. |
Notes to the Consolidated Balance Sheet
13 –
Financial Assets/Liabilities at Fair Value through Profit or Loss
| | | | | | | | |
in€ m. | | Dec 31, 2012 | | | Dec 31, 2011 | |
Trading assets: | | | | | | | | |
Trading securities | | | 218,411 | | | | 214,087 | |
Other trading assets1 | | | 27,127 | | | | 26,837 | |
| | | | | | | | |
Total trading assets | | | 245,538 | | | | 240,924 | |
| | | | | | | | |
Positive market values from derivative financial instruments | | | 768,316 | | | | 859,582 | |
| | | | | | | | |
Financial assets designated at fair value through profit or loss: | | | | | | | | |
Securities purchased under resale agreements | | | 124,987 | | | | 117,284 | |
Securities borrowed | | | 28,304 | | | | 27,261 | |
Loans | | | 18,248 | | | | 24,220 | |
Other financial assets designated at fair value through profit or loss | | | 15,488 | | | | 11,528 | |
| | | | | | | | |
Total financial assets designated at fair value through profit or loss | | | 187,027 | | | | 180,293 | |
| | | | | | | | |
Total financial assets at fair value through profit or loss | | | 1,200,881 | | | | 1,280,799 | |
| |
| 1 | Includes traded loans of€ 18,152 million and€ 18,039 million at December 31, 2012 and 2011 respectively. |
| | | | | | | | |
in€ m. | | Dec 31, 2012 | | | Dec 31, 2011 | |
Trading liabilities: | | | | | | | | |
Trading securities | | | 53,236 | | | | 60,005 | |
Other trading liabilities | | | 1,678 | | | | 3,881 | |
| | | | | | | | |
Total trading liabilities | | | 54,914 | | | | 63,886 | |
| | | | | | | | |
Negative market values from derivative financial instruments | | | 752,706 | | | | 838,817 | |
| | | | | | | | |
Financial liabilities designated at fair value through profit or loss: | | | | | | | | |
Securities sold under repurchase agreements | | | 82,267 | | | | 93,606 | |
Loan commitments | | | 463 | | | | 1,192 | |
Long-term debt | | | 12,193 | | | | 13,889 | |
Other financial liabilities designated at fair value through profit or loss | | | 14,243 | | | | 9,631 | |
| | | | | | | | |
Total financial liabilities designated at fair value through profit or loss | | | 109,166 | | | | 118,318 | |
| | | | | | | | |
Investment contract liabilities1 | | | 7,732 | | | | 7,426 | |
| | | | | | | | |
Total financial liabilities at fair value through profit or loss | | | 924,518 | | | | 1,028,447 | |
| |
| 1 | These are investment contracts where the policy terms and conditions result in their redemption value equaling fair value. See Note 39 “Insurance and Investment Contracts”, for more detail on these contracts. |
Financial Assets & Liabilities designated at Fair Value through Profit or Loss
The Group has designated various lending relationships at fair value through profit or loss. Lending facilities consist of drawn loan assets and undrawn irrevocable loan commitments. The maximum exposure to credit risk on a drawn loan is its fair value. The Group’s maximum exposure to credit risk on drawn loans, including securities purchased under resale agreements and securities borrowed, was€ 172 billion and€ 169 billion as of December 31, 2012, and 2011, respectively. Exposure to credit risk also exists for undrawn irrevocable loan commitments and is predominantly counterparty credit risk.
| | | | |
| Deutsche Bank | | 02 – Consolidated Financial Statements | | 309 |
| Financial Report 2012 | | Notes to the Consolidated Balance Sheet 14 – Amendments to IAS 39 and IFRS 7, “Reclassification of Financial Assets” | | |
| | | |
| | |
| | | | |
The credit risk on the securities purchased under resale agreements and securities borrowed designated under the fair value option is mitigated by the holding of collateral. The valuation of these instruments takes into account the credit enhancement in the form of the collateral received. As such there is no material movement during the year or cumulatively due to movements in counterparty credit risk on these instruments.
Changes in fair value of loans1 and loan commitments attributable to movements in counterparty credit risk2
| | | | | | | | | | | | | | | | |
| | | Dec 31, 2012 | | | Dec 31, 2011 | |
in€ m. | | Loans | | | Loan
commitments | | | Loans | | | Loan
commitments | |
Notional value of loans and loan commitments exposed to credit risk | | | 3,013 | | | | 39,599 | | | | 5,477 | | | | 46,185 | |
| | | | | | | | | | | | | | | | |
Annual change in the fair value reflected in the Statement of Income | | | 53 | | | | 710 | | | | (88) | | | | (611) | |
| | | | | | | | | | | | | | | | |
Cumulative change in the fair value3 | | | 1 | | | | 674 | | | | (84) | | | | (236) | |
| | | | | | | | | | | | | | | | |
Notional of credit derivatives used to mitigate credit risk | | | 2,212 | | | | 29,588 | | | | 4,055 | | | | 37,289 | |
| | | | | | | | | | | | | | | | |
Annual change in the fair value reflected in the Statement of Income | | | (65) | | | | (922) | | | | 62 | | | | 576 | |
| | | | | | | | | | | | | | | | |
Cumulative change in the fair value3 | | | (50) | | | | (821) | | | | 55 | | | | 425 | |
| |
| 1 | Where the loans are over-collateralized there is no material movement in valuation during the year or cumulatively due to movements in counterparty credit risk. |
| 2 | Determined using valuation models that exclude the fair value impact associated with market risk. |
| 3 | Changes are attributable to loans and loan commitments held at reporting date, which may differ from those held in prior periods. No adjustments are made to prior year to reflect differences in the underlying population. |
Changes in fair value of financial liabilities attributable to movements in the Group’s credit risk1
| | | | | | | | |
in€ m. | | Dec 31, 2012 | | | Dec 31, 2011 | |
Annual change in the fair value reflected in the Statement of Income | | | (213) | | | | 141 | |
| | | | | | | | |
Cumulative change in the fair value | | | (79) | | | | 197 | |
| |
| 1 | The fair value of a financial liability incorporates the credit risk of that financial liability. Changes in the fair value of financial liabilities issued by consolidated SPEs have been excluded as this is not related to the Group’s credit risk but to that of the legally isolated SPE, which is dependent on the collateral it holds. |
The excess of the contractual amount repayable at maturity over the carrying value of financial liabilities1
| | | | | | | | |
in€ | | Dec 31, 2012 | | | Dec 31, 2011 | |
Including undrawn loan commitments2 | | | 41,305 | | | | 45,634 | |
| | | | | | | | |
Excluding undrawn loan commitments | | | 726 | | | | 641 | |
| |
| 1 | Assuming the liability is extinguished at the earliest contractual maturity that the Group can be required to repay. When the amount payable is not fixed, it is determined by reference to conditions existing at the reporting date. |
| 2 | The contractual cash flows at maturity for undrawn loan commitments assume full drawdown of the facility. |
14 –
Amendments to IAS 39 and IFRS 7, “Reclassification of Financial Assets”
Under the amendments to IAS 39 and IFRS 7, issued in October 2008, certain financial assets were reclassified in the second half of 2008 and the first quarter 2009 from the financial assets at fair value through profit or loss and the available for sale classifications into the loans classification. No reclassifications have been made since the first quarter 2009.
The Group identified assets, eligible under the amendments, for which at the reclassification date it had a clear change of intent and ability to hold for the foreseeable future rather than to exit or trade in the short term. The reclassifications were made at the fair value of the assets at the reclassification date.
Reclassified Financial Assets
| | | | | | | | |
in€ bn. (unless stated otherwise) | | Trading assets
reclassified to
loans | | | Financial assets
available for sale
reclassified to
loans | |
Carrying value at reclassification date | | | 26.6 | | | | 11.4 | |
| | | | | | | | |
Unrealized fair value losses in accumulated other comprehensive income | | | – | | | | (1.1) | |
| | | | | | | | |
Effective interest rates at reclassification date: | | | | | | | | |
upper range | | | 13.1% | | | | 9.9% | |
lower range | | | 2.8% | | | | 3.9% | |
| | | | | | | | |
Expected recoverable cash flows at reclassification date | | | 39.6 | | | | 17.6 | |
| |
| | | | |
| Deutsche Bank | | 02 – Consolidated Financial Statements | | 310 |
| Financial Report 2012 | | Notes to the Consolidated Balance Sheet 14 – Amendments to IAS 39 and IFRS 7, “Reclassification of Financial Assets” | | |
| | |
| | | | |
| | |
| | | | |
Carrying values and fair values by asset type of assets reclassified in 2008 and 2009
| | | | | | | | | | | | | | | | |
| | | Dec 31, 2012 | | | Dec 31, 2011 | |
in€ m. | | Carrying value | | | Fair value | | | Carrying value | | | Fair Value | |
Trading assets reclassified to loans: | | | | | | | | | | | | | | | | |
Securitized assets1 | | | 3,599 | | | | 2,783 | | | | 6,733 | | | | 5,501 | |
Debt securities | | | 795 | | | | 757 | | | | 859 | | | | 823 | |
Loans | | | 6,810 | | | | 6,226 | | | | 7,754 | | | | 7,117 | |
| | | | | | | | | | | | | | | | |
Total trading assets reclassified to loans | | | 11,204 | 2 | | | 9,766 | | | | 15,346 | | | | 13,441 | |
| | | | | | | | | | | | | | | | |
Financial assets available for sale reclassified to loans: | | | | | | | | | | | | | | | | |
Securitized assets1 | | | 4,501 | | | | 4,218 | | | | 6,220 | | | | 5,359 | |
Loans | | | 1,293 | | | | 1,446 | | | | 1,337 | | | | 1,427 | |
| | | | | | | | | | | | | | | | |
Total financial assets available for sale reclassified to loans | | | 5,794 | 3 | | | 5,664 | | | | 7,557 | | | | 6,786 | |
| | | | | | | | | | | | | | | | |
Total financial assets reclassified to loans | | | 16,998 | | | | 15,430 | | | | 22,903 | | | | 20,227 | |
| |
| 1 | Securitized assets consist of mortgage- and asset-backed securities. |
| 2 | During 2012 the Group sold assets that were previously classified as trading with a carrying value of€ 3.0 billion, including€ 1.8 billion of mortgage-backed securities and€ 1.2 billion of asset-backed securities. |
| 3 | During 2012 the Group sold assets that were previously classified as available for sale with a carrying value of€ 0.7 billion, including€ 0.6 billion of asset-backed securities. |
Sales of reclassified assets are individually subject to a governance and approval process to determine if a sale is the best course of action for the Group’s overall profitability, capital position and regulatory compliance. During 2012 the Group sold reclassified assets with a carrying value of€ 3.7 billion. Sales in this period resulted in net losses of€ 177 million, driven by losses on disposal reported through other income of€ 93 million and€ 84 million relating to losses deemed to be impairments on disposal. The aforementioned governance and approval process determined that the assets sold were due to circumstances that were not foreseeable at the time of the reclassification, including amendments to the capital rules that led to significantly higher absolute capital requirements for the Group as a whole.
In addition to sales, the decrease in 2012 in the carrying value of reclassified assets previously classified as trading includes€ 540 million attributable to restructuring of loans. The decrease also includes redemptions of€ 695 million of asset-backed securities previously classified as available for sale. Provisions for credit losses taken during the period were mostly against loans formerly classified as trading and securitized assets formerly classified as available for sale.
Unrealized fair value gains (losses) that would have been recognized in profit or loss and net gains (losses) that would have been recognized in other comprehensive income if the reclassifications had not been made
| | | | | | | | | | | | |
in€ m. | | 2012 | | | 2011 | | | 2010 | |
Unrealized fair value gains (losses) on the reclassified trading assets, gross of provisions for credit losses | | | 38 | | | | (11) | | | | 120 | |
| | | | | | | | | | | | |
Impairment losses on the reclassified financial assets available for sale which were impaired | | | (29) | | | | (16) | | | | (7) | |
| | | | | | | | | | | | |
| Net gains (losses) recognized in other comprehensive income representing additional unrealized fair value gains (losses) on the reclassified financial assets available for sale which were not impaired | | | 415 | | | | 133 | | | | 251 | |
| |
| | | | |
| Deutsche Bank | | 02 – Consolidated Financial Statement | | 311 |
| Financial Report 2012 | | Notes to the Consolidated Balance Sheet 15 – Financial Instruments carried at Fair Value | | |
| | | |
| | |
| | | | |
Pre-tax contribution of all reclassified assets to the income statement (after reclassification)
| | | | | | | | | | | | |
in€ m. | | 2012 | | | 2011 | | | 2010 | |
Interest income | | | 578 | | | | 691 | 1 | | | 1,154 | |
| | | | | | | | | | | | |
Provision for credit losses | | | (186) | | | | (186) | | | | (278) | |
| | | | | | | | | | | | |
Other income2 | | | (35) | | | | 34 | | | | 1 | |
| | | | | | | | | | | | |
Income before income taxes on reclassified trading assets | | | 357 | | | | 539 | | | | 877 | |
| | | | | | | | | | | | |
Interest income | | | 139 | | | | 153 | | | | 146 | |
| | | | | | | | | | | | |
Provision for credit losses | | | (228) | | | | (1) | | | | – | |
| | | | | | | | | | | | |
Other income2 | | | (58) | 3 | | | – | | | | (1) | |
| | | | | | | | | | | | |
Income before income taxes on reclassified financial assets available for sale | | | (147) | | | | 152 | | | | 145 | |
| |
| 1 | The significant decrease in Interest income for 2011 is mostly due to the restructuring of loans to Actavis Group that occurred in 2010 and are no longer part of the reclassified asset population. |
| 2 | Predominantly relates to gains and losses from the sale of reclassified assets. |
| 3 | Driven by increased sales of assets that were previously classified as available for sale during 2012. |
15 –
Financial Instruments carried at Fair Value
Valuation Methods and Control
The Group has an established valuation control framework which governs internal control standards, methodologies, and procedures over the valuation process.
Prices Quoted in Active Markets: The fair value of instruments that are quoted in active markets are determined using the quoted prices where they represent those at which regularly and recently occurring transactions take place.
Valuation Techniques: The Group uses valuation techniques to establish the fair value of instruments where prices, quoted in active markets, are not available. Valuation techniques used for financial instruments include modeling techniques, the use of indicative quotes for proxy instruments, quotes from less recent and less regular transactions and broker quotes.
For some financial instruments a rate or other parameter, rather than a price, is quoted. Where this is the case then the market rate or parameter is used as an input to a valuation model to determine fair value. For some instruments, modeling techniques follow industry standard models for example, discounted cash flow analysis and standard option pricing models. These models are dependent upon estimated future cash flows, discount factors and volatility levels. For more complex or unique instruments, more sophisticated modeling techniques are required, and may rely upon assumptions or more complex parameters such as correlations, prepayment speeds, default rates and loss severity.
Frequently, valuation models require multiple parameter inputs. Where possible, parameter inputs are based on observable data or are derived from the prices of relevant instruments traded in active markets. Where observable data is not available for parameter inputs then other market information is considered. For example, indicative broker quotes and consensus pricing information are used to support parameter inputs where they are available. Where no observable information is available to support parameter inputs then they are based on other relevant sources of information such as prices for similar transactions, historic data, economic fundamentals, and research information, with appropriate adjustment to reflect the terms of the actual instrument being valued and current market conditions.
Valuation Adjustments: Valuation adjustments are an integral part of the valuation process. In making appropriate valuation adjustments, the Group follows methodologies that consider factors such as bid/offer spreads, liquidity and counterparty credit risk. Bid/offer spread valuation adjustments are required to adjust mid market valuations to the appropriate bid or offer valuation. The bid or offer valuation is the best representation of the fair value for an instrument, and therefore its fair value. The carrying value of a long position is adjusted from mid to bid, and the carrying value of a short position is adjusted from mid to offer. Bid/offer valuation adjustments are
| | | | |
| Deutsche Bank | | 02 – Consolidated Financial Statements | | 312 |
| Financial Report 2012 | | Notes to the Consolidated Balance Sheet 15 – Financial Instruments carried at Fair Value | | |
| | | |
| | |
| | | | |
determined from bid-offer prices observed in relevant trading activity and in quotes from other broker-dealers or other knowledgeable counterparties. Where the quoted price for the instrument is already a bid/offer price then no additional bid/offer valuation adjustment is necessary. Where the fair value of financial instruments is derived from a modeling technique then the parameter inputs into that model are normally at a mid-market level. Such instruments are generally managed on a portfolio basis and valuation adjustments are taken to reflect the cost of closing out the net exposure the Bank has to each of the input parameters. These adjustments are determined from bid-offer prices observed in relevant trading activity and quotes from other broker-dealers.
Where complex valuation models are used, or where less-liquid positions are being valued, then bid/offer levels for those positions may not be available directly from the market, and therefore the close-out cost of these positions, models and parameters must be estimated. When these adjustments are designed, the Group closely examines the valuation risks associated with the model as well as the positions themselves, and the resulting adjustments are closely monitored on an ongoing basis.
Counterparty Credit Valuation Adjustments (“CVA“s) are required to cover expected credit losses to the extent that the valuation technique does not already include an expected credit loss factor relating to the non-performance risk of the counterparty. The CVA amount is applied to all relevant over-the-counter (“OTC”) derivatives, and is determined by assessing the potential credit exposure to a given counterparty and taking into account any collateral held, the effect of any relevant netting arrangements, expected loss given default and the credit risk, based on available market information, including Credit Default Swap (“CDS”) spreads. Where counterparty CDS spreads are not available, relevant proxies are used.
The fair value of the Group’s financial liabilities which are at fair value through profit or loss (e.g., OTC derivative liabilities and structured note liabilities designated at fair value through profit or loss) incorporates the change in the Group’s own credit risk of the financial liability. For derivative liabilities the Group considers its own creditworthiness by assessing all counterparties’ potential future exposure to the Group, taking into account any collateral posted by the Group, the effect of relevant netting arrangements, expected loss given default and the credit risk of the Group, based on the Group’s market CDS level. The change in the Group’s own credit risk for structured note liabilities is calculated by discounting the contractual cash flows of the instrument using the rate at which similar instruments would be issued at the measurement date.
When determining CVA relating to a specific counterparty and Debt Valuation Adjustments, additional adjustments are made where appropriate to achieve fair value, due to the expected loss estimate of a particular arrangement, or where the credit risk being assessed differs in nature to that described by the available CDS instrument.
Where there is uncertainty in the assumptions used within a modeling technique, an additional adjustment is taken to calibrate the model price to the expected market price of the financial instrument. Typically, such transactions have bid-offer levels which are less observable, and these adjustments aim to estimate the bid-offer by computing the liquidity-premium associated with the transaction. Where a financial instrument is of sufficient complexity that the cost of closing it out would be higher than the cost of closing out its component risks, then an additional adjustment is taken to reflect this.
Validation and Control: The Group has an independent specialised valuation control group within the Finance function which governs and develops the valuation control framework and manages the valuation control processes. The mandate of this specialist function includes the performance of the independent valuation control process for all businesses, the continued development of valuation control methodologies and techniques, as well as devising and governing the formal valuation control policy framework.
Results of the valuation control process are collected and analyzed as part of a standard monthly reporting cycle. Variances of differences outside of preset and approved tolerance levels are escalated both within the Finance function and with Senior Business Management for review, resolution and, if required, adjustment.
| | | | |
| Deutsche Bank | | 02 – Consolidated Financial Statements | | 313 |
| Financial Report 2012 | | Notes to the Consolidated Balance Sheet 15 – Financial Instruments carried at Fair Value | | |
| | | |
| | |
| | | | |
For instruments where fair value is determined from valuation models, the assumptions and techniques used within the models are independently validated by an independent specialist model validation group that is part of the Group’s Risk Management function.
Quotes for transactions and parameter inputs are obtained from a number of third party sources including exchanges, pricing service providers, firm broker quotes and consensus pricing services. Price sources are examined and assessed to determine the quality of fair value information they represent, with greater emphasis given to those possessing greater valuation certainty and relevance. The results are compared against actual transactions in the market to ensure the model valuations are calibrated to market prices.
Price and parameter inputs to models, assumptions and valuation adjustments are verified against independent sources. Where they cannot be verified to independent sources due to lack of observable information, the estimate of fair value is subject to procedures to assess its reasonableness. Such procedures include performing revaluation using independently generated models (including where existing models are independently recalibrated), assessing the valuations against appropriate proxy instruments and other benchmarks, and performing extrapolation techniques. Assessment is made as to whether the valuation techniques produce fair value estimates that are reflective of market levels by calibrating the results of the valuation models against market transactions where possible.
Management Judgment: In reaching estimates of fair value management judgment needs to be exercised. The areas requiring significant management judgment are identified, documented and reported to senior management as part of the valuation control process and the standard monthly reporting cycle. The specialist model validation and valuation groups focus attention on the areas of subjectivity and judgment.
The level of management judgment required in establishing fair value of financial instruments for which there is a quoted price in an active market is usually minimal. Similarly there is little subjectivity or judgment required for instruments valued using valuation models which are standard across the industry and where all parameter inputs are quoted in active markets.
The level of subjectivity and degree of management judgment required is more significant for those instruments valued using specialized and sophisticated models and where some or all of the parameter inputs are not observable. Management judgment is required in the selection and application of appropriate parameters, assumptions and modeling techniques. In particular, where data is obtained from infrequent market transactions then extrapolation and interpolation techniques must be applied. In addition, where no market data is available then parameter inputs are determined by assessing other relevant sources of information such as historical data, fundamental analysis of the economics of the transaction and proxy information from similar transactions and making appropriate adjustment to reflect the actual instrument being valued and current market conditions. Where different valuation techniques indicate a range of possible fair values for an instrument then management has to establish what point within the range of estimates best represents the fair value. Further, some valuation adjustments may require the exercise of management judgment to ensure they achieve fair value.
Fair Value Hierarchy
The financial instruments carried at fair value have been categorized under the three levels of the IFRS fair value hierarchy as follows:
Level 1 – Instruments valued using quoted prices in active markets are instruments where the fair value can be determined directly from prices which are quoted in active, liquid markets and where the instrument observed in the market is representative of that being priced in the Group’s inventory.
These include: high-liquidity treasuries and derivative, equity and cash products traded on high-liquidity exchanges.
| | | | |
| Deutsche Bank | | 02 – Consolidated Financial Statements | | 314 |
| Financial Report 2012 | | Notes to the Consolidated Balance Sheet 15 – Financial Instruments carried at Fair Value | | |
| | | |
| | |
| | | | |
Level 2 – Instruments valued with valuation techniques using observable market data are instruments where the fair value can be determined by reference to similar instruments trading in active markets, or where a technique is used to derive the valuation but where all inputs to that technique are observable.
These include: many OTC derivatives; many investment-grade listed credit bonds; some CDS; many collateralized debt obligations (“CDO”); and many less-liquid equities.
Level 3 – Instruments valued using valuation techniques using market data which is not directly observable are instruments where the fair value cannot be determined directly by reference to market-observable information, and some other pricing technique must be employed. Instruments classified in this category have an element which is unobservable and which has a significant impact on the fair value.
These include: more-complex OTC derivatives; distressed debt; highly-structured bonds; illiquid asset-backed securities (“ABS”); illiquid CDO’s (cash and synthetic); monoline exposures; private equity placements; many commercial real estate (“CRE”) loans; illiquid loans; and some municipal bonds.
Carrying value of the financial instruments held at fair value1
| | | | | | | | | | | | | | | | | | | | | | | | |
| | | Dec 31, 2012 | | | Dec 31, 2011 | |
in€ m. | | Quoted
prices in
active market
(Level 1) | | | Valuation
technique
observable
parameters
(Level 2) | | | Valuation
technique
unobservable
parameters
(Level 3) | | | Quoted
prices in
active market
(Level 1) | | | Valuation
technique
observable
parameters
(Level 2) | | | Valuation
technique
unobservable
parameters
(Level 3) | |
| Financial assets held at fair value: | | | | | | | | | | | | | | | | | | | | | | | | |
Trading securities | | | 107,261 | | | | 100,905 | | | | 10,245 | | | | 99,487 | | | | 103,327 | | | | 11,272 | |
Positive market values from derivative financial instruments | | | 9,707 | | | | 743,401 | | | | 15,208 | | | | 15,947 | | | | 822,009 | | | | 21,626 | |
Other trading assets | | | 671 | | | | 21,772 | | | | 4,684 | | | | 847 | | | | 20,773 | | | | 5,218 | |
Financial assets designated at fair value through profit or loss | | | 5,273 | | | | 177,798 | | | | 3,956 | | | | 6,907 | | | | 168,224 | | | | 5,162 | |
Financial assets available for sale | | | 17,709 | | | | 27,730 | | | | 3,940 | | | | 9,8882 | | | | 31,0982 | | | | 4,295 | |
Other financial assets at fair value3 | | | – | | | | 8,3013 | | | | –4 | | | | – | | | | 7,5113 | | | | –4 | |
| | | | | | | | | | | | | | | | | | | | | | | | |
| Total financial assets held at fair value | | | 140,621 | | | | 1,079,907 | | | | 38,033 | | | | 133,076 | | | | 1,152,942 | | | | 47,573 | |
| | | | | | | | | | | | | | | | | | | | | | | | |
| Financial liabilities held at fair value: | | | | | | | | | | | | | | | | | | | | | | | | |
Trading securities | | | 39,639 | | | | 13,173 | | | | 424 | | | | 35,033 | | | | 24,625 | | | | 347 | |
Negative market values from derivative financial instruments | | | 10,875 | | | | 732,547 | | | | 9,284 | | | | 12,815 | | | | 814,696 | | �� | | 11,306 | |
Other trading liabilities | | | 68 | | | | 1,610 | | | | – | | | | 22 | | | | 3,845 | | | | 14 | |
Financial liabilities designated at fair value through profit or loss | | | 60 | | | | 108,026 | | | | 1,080 | | | | 116 | | | | 116,198 | | | | 2,004 | |
Investment contract liabilities5 | | | – | | | | 7,732 | | | | – | | | | – | | | | 7,426 | | | | – | |
Other financial liabilities at fair value3 | | | 0 | | | | 4,6323 | | | | (176)4 | | | | – | | | | 4,1593 | | | | (250)4 | |
| | | | | | | | | | | | | | | | | | | | | | | | |
| Total financial liabilities held at fair value | | | 50,642 | | | | 867,720 | | | | 10,612 | | | | 47,986 | | | | 970,949 | | | | 13,421 | |
| |
| 1 | Amounts in this table are generally presented on a gross basis, in line with the Group’s accounting policy regarding offsetting of financial instruments, as described in Note 01 “Significant Accounting Policies”. |
| 2 | Prior year amounts have been adjusted to correctly classify€ 5,928 million financial assets available for sale which should have been included in Level 1 of the fair value hierarchy. |
| 3 | Predominantly relates to derivatives qualifying for hedge accounting. |
| 4 | Relates to derivatives which are embedded in contracts where the host contract is held at amortized cost but for which the embedded derivative is separated. The separated embedded derivatives may have a positive or a negative fair value but have been presented in this table to be consistent with the classification of the host contract. The separated embedded derivatives are held at fair value on a recurring basis and have been split between the fair value hierarchy classifications. |
| 5 | These are investment contracts where the policy terms and conditions result in their redemption value equaling fair value. See Note 39 “Insurance and Investment Contracts” for more detail on these contracts. |
There have been no significant transfers of instruments between level 1 and level 2 of the fair value hierarchy.
Valuation Techniques
The following is an explanation of the valuation techniques used in establishing the fair value of the different types of financial instruments that the Group trades.
| | | | |
| Deutsche Bank | | 02 – Consolidated Financial Statements | | 315 |
| Financial Report 2012 | | Notes to the Consolidated Balance Sheet 15 – Financial Instruments carried at Fair Value | | |
| | | |
| | |
| | | | |
Sovereign, Quasi-sovereign and Corporate Debt and Equity Securities: Where there are no recent transactions then fair value may be determined from the last market price adjusted for all changes in risks and information since that date. Where a close proxy instrument is quoted in an active market then fair value is determined by adjusting the proxy value for differences in the risk profile of the instruments. Where close proxies are not available then fair value is estimated using more complex modeling techniques. These techniques include discounted cash flow models using current market rates for credit, interest, liquidity and other risks. For equity securities modeling techniques may also include those based on earnings multiples.
Mortgage- and Other Asset-Backed Securities (MBS/ABS) include residential and commercial MBS and other ABS including CDOs. ABS have specific characteristics as they have different underlying assets and the issuing entities have different capital structures. The complexity increases further where the underlying assets are themselves ABS, as is the case with many of the CDO instruments.
Where no reliable external pricing is available, ABS are valued, where applicable, using either relative value analysis which is performed based on similar transactions observable in the market, or industry-standard valuation models incorporating available observable inputs. The industry standard external models calculate principal and interest payments for a given deal based on assumptions that can be independently price tested. The inputs include prepayment speeds, loss assumptions (timing and severity) and a discount rate (spread, yield or discount margin). These inputs/assumptions are derived from actual transactions, external market research and market indices where appropriate.
Loans: For certain loans fair value may be determined from the market price on a recently occurring transaction adjusted for all changes in risks and information since that transaction date. Where there are no recent market transactions then broker quotes, consensus pricing, proxy instruments or discounted cash flow models are used to determine fair value. Discounted cash flow models incorporate parameter inputs for credit risk, interest rate risk, foreign exchange risk, loss given default estimates and amounts utilized given default, as appropriate. Credit risk, loss given default and utilization given default parameters are determined using information from the loan or CDS markets, where available and appropriate.
Leveraged loans can have transaction-specific characteristics which can limit the relevance of market-observed transactions. Where similar transactions exist for which observable quotes are available from external pricing services then this information is used with appropriate adjustments to reflect the transaction differences. When no similar transactions exist, a discounted cash flow valuation technique is used with credit spreads derived from the appropriate leveraged loan index, incorporating the industry classification, subordination of the loan, and any other relevant information on the loan and loan counterparty.
Over-The-Counter Derivative Financial Instruments: Market standard transactions in liquid trading markets, such as interest rate swaps, foreign exchange forward and option contracts in G7 currencies, and equity swap and option contracts on listed securities or indices are valued using market standard models and quoted parameter inputs. Parameter inputs are obtained from pricing services, consensus pricing services and recently occurring transactions in active markets wherever possible.
More complex instruments are modeled using more sophisticated modeling techniques specific for the instrument and are calibrated to available market prices. Where the model output value does not calibrate to a relevant market reference then valuation adjustments are made to the model output value to adjust for any difference. In less active markets, data is obtained from less frequent market transactions, broker quotes and through extrapolation and interpolation techniques. Where observable prices or inputs are not available, management judgment is required to determine fair values by assessing other relevant sources of information such as historical data, fundamental analysis of the economics of the transaction and proxy information from similar transactions.
| | | | |
| Deutsche Bank | | 02 – Consolidated Financial Statements | | 316 |
| Financial Report 2012 | | Notes to the Consolidated Balance Sheet 15 – Financial Instruments carried at Fair Value | | |
| | |
| | | | |
| | |
| | | | |
Financial Liabilities Designated at Fair Value through Profit or Loss under the Fair Value Option: The fair value of financial liabilities designated at fair value through profit or loss under the fair value option incorporates all market risk factors including a measure of the Group’s credit risk relevant for that financial liability. The financial liabilities include structured note issuances, structured deposits, and other structured securities issued by consolidated vehicles, which may not be quoted in an active market. The fair value of these financial liabilities is determined by discounting the contractual cash flows using the relevant credit-adjusted yield curve. The market risk parameters are valued consistently to similar instruments held as assets, for example, any derivatives embedded within the structured notes are valued using the same methodology discussed in the “Over-The-Counter Derivative Financial Instruments” section above.
Where the financial liabilities designated at fair value through profit or loss under the fair value option are collateralized, such as securities loaned and securities sold under repurchase agreements, the credit enhancement is factored into the fair valuation of the liability.
Investment Contract Liabilities: Assets which are linked to the investment contract liabilities are owned by the Group. The investment contract obliges the Group to use these assets to settle these liabilities. Therefore, the fair value of investment contract liabilities is determined by the fair value of the underlying assets (i.e., amount payable on surrender of the policies).
Analysis of Financial Instruments with Fair Value Derived from Valuation Techniques Containing Significant Unobservable Parameters (Level 3)
Financial instruments categorized in level 3
| | | | | | | | |
in€ m. | | Dec 31, 2012 | | | Dec 31, 2011 | |
Financial assets held at fair value: | | | | | | | | |
Trading securities: | | | | | | | | |
Sovereign and quasi-sovereign obligations | | | 827 | | | | 1,045 | |
Mortgage and other asset-backed securities | | | 3,113 | | | | 3,724 | |
Corporate debt securities and other debt obligations | | | 5,654 | | | | 5,979 | |
Equity securities | | | 651 | | | | 524 | |
| | | | | | | | |
Total trading securities | | | 10,245 | | | | 11,272 | |
| | | | | | | | |
Positive market values from derivative financial instruments | | | 15,208 | | | | 21,626 | |
| | | | | | | | |
Other trading assets | | | 4,684 | | | | 5,218 | |
| | | | | | | | |
Financial assets designated at fair value through profit or loss: | | | | | | | | |
Loans | | | 3,431 | | | | 4,496 | |
Other financial assets designated at fair value through profit or loss | | | 525 | | | | 666 | |
| | | | | | | | |
Total financial assets designated at fair value through profit or loss | | | 3,956 | | | | 5,162 | |
| | | | | | | | |
Financial assets available for sale | | | 3,940 | | | | 4,295 | |
| | | | | | | | |
Other financial assets at fair value | | | – | | | | – | |
| | | | | | | | |
Total financial assets held at fair value | | | 38,033 | | | | 47,573 | |
| | | | | | | | |
Financial liabilities held at fair value: | | | | | | | | |
| | | | | | | | |
Trading securities | | | 424 | | | | 347 | |
| | | | | | | | |
Negative market values from derivative financial instruments | | | 9,284 | | | | 11,306 | |
| | | | | | | | |
Other trading liabilities | | | – | | | | 14 | |
| | | | | | | | |
Financial liabilities designated at fair value through profit or loss: | | | | | | | | |
Loan commitments | | | 471 | | | | 1,194 | |
Long-term debt | | | 538 | | | | 801 | |
Other financial liabilities designated at fair value through profit or loss | | | 71 | | | | 9 | |
| | | | | | | | |
Total financial liabilities designated at fair value through profit or loss | | | 1,080 | | | | 2,004 | |
| | | | | | | | |
Other financial liabilities at fair value | | | (176) | | | | (250) | |
| | | | | | | | |
Total financial liabilities held at fair value | | | 10,612 | | | | 13,421 | |
| |
| | | | |
| Deutsche Bank | | 02 – Consolidated Financial Statements | | 317 |
| Financial Report 2012 | | Notes to the Consolidated Balance Sheet 15 – Financial Instruments carried at Fair Value | | |
| | | |
| | |
| | | | |
Some of the instruments in level 3 of the fair value hierarchy have identical or similar offsetting exposures to the unobservable input. However, according to IFRS they are required to be presented as gross assets and liabilities in the table above.
Trading Securities: Certain illiquid emerging market corporate bonds and illiquid highly structured corporate bonds are included in this level of the hierarchy. In addition, some of the holdings of notes issued by securitization entities, commercial and residential MBS, collateralized debt obligation securities and other ABS are reported here. The decrease in the year is mainly due to a combination of settlements and transfers between levels 2 and 3 due to changes in the observability of input parameters used to value these instruments.
Positive and Negative Market Values from Derivative Instruments categorized in this level of the fair value hierarchy are valued based on one or more significant unobservable parameters. The unobservable parameters may include certain correlations, certain longer-term volatilities, certain prepayment rates, credit spreads and other transaction-specific parameters.
Level 3 derivatives include customized CDO derivatives in which the underlying reference pool of corporate assets is not closely comparable to regularly market-traded indices; certain tranched index credit derivatives; certain options where the volatility is unobservable; certain basket options in which the correlations between the referenced underlying assets are unobservable; longer-term interest rate option derivatives; multi-currency foreign exchange derivatives; and certain credit default swaps for which the credit spread is not observable.
The decrease in the year was due to mark-to-market losses on the instruments, settlements and transfers of derivative assets from level 3 to level 2 of the hierarchy due to improved observability of input parameters used to value these instruments.
Other Trading Instruments classified in level 3 of the fair value hierarchy mainly consist of traded loans valued using valuation models based on one or more significant unobservable parameters. Level 3 loans comprise illiquid leveraged loans and illiquid residential and commercial mortgage loans. The balance was reduced in the year mainly due to sales.
Financial Assets/Liabilities designated at Fair Value through Profit or Loss: Certain corporate loans and structured liabilities which were designated at fair value through profit or loss under the fair value option are categorized in this level of the fair value hierarchy. The corporate loans are valued using valuation techniques which incorporate observable credit spreads, recovery rates and unobservable utilization parameters. Revolving loan facilities are reported in the third level of the hierarchy because the utilization in the event of the default parameter is significant and unobservable.
In addition, certain hybrid debt issuances designated at fair value through profit or loss containing embedded derivatives are valued based on significant unobservable parameters. These unobservable parameters include single stock volatility correlations. The decrease in assets during the period is primarily due to settlements while the decrease in liabilities is mainly due to mark-to-market gains.
Financial Assets Available for Sale include unlisted equity instruments where there is no close proxy and the market is very illiquid.
| | | | |
| Deutsche Bank | | 02 – Consolidated Financial Statements | | 318 |
| Financial Report 2012 | | Notes to the Consolidated Balance Sheet | | |
| | 15 – Financial Instruments carried at Fair Value | | |
| | |
| | | | |
| | |
| | | | |
Reconciliation of financial instruments classified in Level 3
Reconciliation of financial instruments classified in Level 3
| | | | | | | | | | | | | | | | | | | | | | | | | | | | | | | | | | | | | | | | |
| Dec 31, 2012 | | | | | | | Changes in | | | | | | | | | | | | | | | | | | | | | | | | | | | | | | | | | |
in€ m. | | Balance, beginning of year | | | the group of consoli- dated com- panies | | | Total
gains/
losses1 | | | Purchases | | | Sales | | | Issuances5 | | | Settle- ments6 | | | Transfers into Level 37 | | | Transfers
out of
Level 37 | | | Balance, end of year | |
| | | | | | | | | | | | | | | | | | | | | | | | | | | | | | | | | | | | | | | | |
| Financial assets held at fair value: | | | | | | | | | | | | | | | | | | | | | | | | | | | | | | | | | | | | | | | | |
| | | | | | | | | | | | | | | | | | | | | | | | | | | | | | | | | | | | | | | | |
| Trading securities | | | 11,272 | | | | – | | | | 309 | | | | 2,601 | | | | (2,816) | | | | – | | | | (1,453) | | | | 1,877 | | | | (1,545) | | | | 10,245 | |
| | | | | | | | | | | | | | | | | | | | | | | | | | | | | | | | | | | | | | | | |
| Positive market values from derivative financial instruments | | | 21,626 | | | | – | | | | (4,031) | | | | – | | | | – | | | | – | | | | (2,274) | | | | 2,342 | | | | (2,455) | | | | 15,208 | |
| | | | | | | | | | | | | | | | | | | | | | | | | | | | | | | | | | | | | | | | |
| Other trading assets | | | 5,218 | | | | – | | | | 113 | | | | 813 | | | | (1,362) | | | | 900 | | | | (535) | | | | 467 | | | | (930) | | | | 4,684 | |
| | | | | | | | | | | | | | | | | | | | | | | | | | | | | | | | | | | | | | | | |
| Financial assets designated at fair value through profit or loss | | | 5,162 | | | | – | | | | 318 | | | | 384 | | | | (211) | | | | 1,026 | | | | (2,500) | | | | 60 | | | | (283) | | | | 3,956 | |
| | | | | | | | | | | | | | | | | | | | | | | | | | | | | | | | | | | | | | | | |
| Financial assets available for sale | | | 4,295 | | | | – | | | | 1422 | | | | 1,951 | | | | (1,503) | | | | – | | | | (1,077) | | | | 342 | | | | (210) | | | | 3,940 | |
| | | | | | | | | | | | | | | | | | | | | | | | | | | | | | | | | | | | | | | | |
| Other financial assets at fair value | | | – | | | | – | | | | – | | | | – | | | | – | | | | – | | | | – | | | | – | | | | – | | | | – | |
| | | | | | | | | | | | | | | | | | | | | | | | | | | | | | | | | | | | | | | | |
| Total financial assets held at fair value | | | 47,573 | | | | – | | | | (3,149)3.4 | | | | 5,749 | | | | (5,892) | | | | 1,926 | | | | (7,839) | | | | 5,088 | | | | (5,423) | | | | 38,033 | |
| | | | | | | | | | | | | | | | | | | | | | | | | | | | | | | | | | | | | | | | |
| Financial liabilities held at fair value: | | | | | | | | | | | | | | | | | | | | | | | | | | | | | | | | | | | | | | | | |
| | | | | | | | | | | | | | | | | | | | | | | | | | | | | | | | | | | | | | | | |
| Trading securities | | | 347 | | | | – | | | | 8 | | | | – | | | | – | | | | – | | | | (28) | | | | 152 | | | | (55) | | | | 424 | |
| | | | | | | | | | | | | | | | | | | | | | | | | | | | | | | | | | | | | | | | |
| Negative market values from derivative financial instruments | | | 11,306 | | | | – | | | | (469) | | | | – | | | | – | | | | – | | | | (1,480) | | | | 2,195 | | | | (2,268) | | | | 9,284 | |
| | | | | | | | | | | | | | | | | | | | | | | | | | | | | | | | | | | | | | | | |
| Other trading liabilities | | | 14 | | | | – | | | | – | | | | – | | | | – | | | | – | | | | – | | | | – | | | | (14) | | | | – | |
| | | | | | | | | | | | | | | | | | | | | | | | | | | | | | | | | | | | | | | | |
| Financial liabilities designated at fair value through profit or loss | | | 2,004 | | | | – | | | | (845) | | | | – | | | | – | | | | 51 | | | | (247) | | | | 249 | | | | (132) | | | | 1,080 | |
| | | | | | | | | | | | | | | | | | | | | | | | | | | | | | | | | | | | | | | | |
| Other financial liabilities at fair value | | | (250) | | | | – | | | | 129 | | | | – | | | | – | | | | – | | | | (5) | | | | (10) | | | | (40) | | | | (176) | |
| | | | | | | | | | | | | | | | | | | | | | | | | | | | | | | | | | | | | | | | |
| Total financial liabilities held at fair value | | | 13,421 | | | | – | | | | (1,177)3,4 | | | | – | | | | – | | | | 51 | | | | (1,760) | | | | 2,586 | | | | (2,509) | | | | 10,612 | |
| |
| 1 | Total gains and losses predominantly relate to net gains (losses) on financial assets/liabilities at fair value through profit or loss reported in the consolidated statement of income. The balance also includes net gains (losses) on financial assets available for sale reported in the consolidated statement of income and unrealized net gains (losses) on financial assets available for sale and exchange rate changes reported in other comprehensive income, net of tax. Further, certain instruments are hedged with instruments in level 1 or level 2 but the table above does not include the gains and losses on these hedging instruments. Additionally, both observable and unobservable parameters may be used to determine the fair value of an instrument classified within level 3 of the fair value hierarchy; the gains and losses presented below are attributable to movements in both the observable and unobservable parameters. |
| 2 | Total gains and losses on available for sale include a loss of€ 39 million recognized in other comprehensive income, net of tax, and a gain of€ 118 million recognized in the income statement presented in net gains (losses) on financial assets available for sale. |
| 3 | This amount includes the effect of exchange rate changes. For total financial assets held at fair value this effect is a negative€ 129 million and for total financial liabilities held at fair value this is a positive€ 37million. This predominantly relates to derivatives. The effect of exchange rate changes is reported in other comprehensive income, net of tax. |
| 4 | For assets positive balances represent gains, negative balances represent losses. For liabilities positive balances represent losses, negative balances represent gains. |
| 5 | Issuances relate to the cash amount received on the issuance of a liability and the cash amount paid on the primary issuance of a loan to a borrower. |
| 6 | Settlements represent cash flows to settle the asset or liability. For debt and loan instruments this includes principal on maturity, principal amortizations and principal repayments. For derivatives all cash flows are presented in settlements. |
| 7 | Transfers in and transfers out of level 3 during the year are recorded at their fair value at the beginning of year in the table below. For instruments transferred into level 3 the table shows the gains and losses and cash flows on the instruments as if they had been transferred at the beginning of the year. Similarly for instruments transferred out of level 3 the table does not show any gains or losses or cash flows on the instruments during the year since the table is presented as if they have been transferred out at the beginning of the year. |
| | | | |
| Deutsche Bank | | 02 – Consolidated Financial Statements | | 319 |
| Financial Report 2012 | | Notes to the Consolidated Balance Sheet 15 – Financial Instruments carried at Fair Value | | |
| | |
| | | | |
| | |
| | | | |
| | | | | | | | | | | | | | | | | | | | | | | | | | | | | | | | | | | | | | | | |
| Dec 31, 2011 | | | | | | | Changes in | | | | | | | | | | | | | | | | | | | | | | | | | | | | | | | | | |
in€ m. | | Balance,
beginning
of year | | | the group of consoli- dated com- panies | | | Total gains/ losses1 | | | Purchases | | | Sales | | | Issuances5 | | | Settle- ments6 | | | Transfers into Level 37 | | | Transfers out of Level 37 | | | Balance, end of year | |
| | | | | | | | | | | | | | | | | | | | | | | | | | | | | | | | | | | | | | | | |
| Financial assets held at fair value: | | | | | | | | | | | | | | | | | | | | | | | | | | | | | | | | | | | | | | | | |
| | | | | | | | | | | | | | | | | | | | | | | | | | | | | | | | | | | | | | | | |
| Trading securities | | | 14,861 | | | | – | | | | (280) | | | | 3,716 | | | | (3,533) | | | | – | | | | (1,405) | | | | 2,298 | | | | (4,385) | | | | 11,272 | |
| | | | | | | | | | | | | | | | | | | | | | | | | | | | | | | | | | | | | | | | |
| Positive market values from derivative financial instruments | | | 17,843 | | | | – | | | | 3,620 | | | | – | | | | – | | | | – | | | | (1,225) | | | | 4,207 | | | | (2,819) | | | | 21,626 | |
| | | | | | | | | | | | | | | | | | | | | | | | | | | | | | | | | | | | | | | | |
| Other trading assets | | | 6,067 | | | | – | | | | 191 | | | | 1,998 | | | | (3,256) | | | | 712 | | | | (341) | | | | 382 | | | | (535) | | | | 5,218 | |
| | | | | | | | | | | | | | | | | | | | | | | | | | | | | | | | | | | | | | | | |
| Financial assets designated at fair value through profit or loss | | | 3,286 | | | | – | | | | (104) | | | | 174 | | | | (232) | | | | 2,532 | | | | (1,541) | | | | 1,076 | | | | (29) | | | | 5,162 | |
| | | | | | | | | | | | | | | | | | | | | | | | | | | | | | | | | | | | | | | | |
| Financial assets available for sale | | | 4,599 | | | | – | | | | 3852 | | | | 1,328 | | | | (1,226) | | | | – | | | | (991) | | | | 814 | | | | (614) | | | | 4,295 | |
| | | | | | | | | | | | | | | | | | | | | | | | | | | | | | | | | | | | | | | | |
| Other financial assets at fair value | | | – | | | | – | | | | – | | | | – | | | | – | | | | – | | | | – | | | | – | | | | – | | | | – | |
| | | | | | | | | | | | | | | | | | | | | | | | | | | | | | | | | | | | | | | | |
| Total financial assets held at fair value | | | 46,656 | | | | – | | | | 3,8123,4 | | | | 7,216 | | | | (8,247) | | | | 3,244 | | | | (5,503) | | | | 8,777 | | | | (8,382) | | | | 47,573 | |
| | | | | | | | | | | | | | | | | | | | | | | | | | | | | | | | | | | | | | | | |
| Financial liabilities held at fair value: | | | | | | | | | | | | | | | | | | | | | | | | | | | | | | | | | | | | | | | | |
| | | | | | | | | | | | | | | | | | | | | | | | | | | | | | | | | | | | | | | | |
| Trading securities | | | 251 | | | | – | | | | (12) | | | | – | | | | – | | | | – | | | | 121 | | | | 1 | | | | (14) | | | | 347 | |
| | | | | | | | | | | | | | | | | | | | | | | | | | | | | | | | | | | | | | | | |
| Negative market values from derivative financial instruments | | | 10,916 | | | | – | | | | 1,702 | | | | – | | | | – | | | | – | | | | (1,428) | | | | 3,546 | | | | (3,430) | | | | 11,306 | |
| | | | | | | | | | | | | | | | | | | | | | | | | | | | | | | | | | | | | | | | |
| Other trading liabilities | | | 5 | | | | – | | | | 9 | | | | – | | | | – | | | | – | | | | – | | | | – | | | | – | | | | 14 | |
| | | | | | | | | | | | | | | | | | | | | | | | | | | | | | | | | | | | | | | | |
| Financial liabilities designated at fair value through profit or loss | | | 2,070 | | | | – | | | | 622 | | | | – | | | | – | | | | 209 | | | | (422) | | | | 59 | | | | (534) | | | | 2,004 | |
| | | | | | | | | | | | | | | | | | | | | | | | | | | | | | | | | | | | | | | | |
| Other financial liabilities at fair value | | | (239) | | | | – | | | | (95) | | | | – | | | | – | | | | – | | | | (76) | | | | 2 | | | | 158 | | | | (250) | |
| | | | | | | | | | | | | | | | | | | | | | | | | | | | | | | | | | | | | | | | |
| Total financial liabilities held at fair value | | | 13,003 | | | | – | | | | 2,2263,4 | | | | – | | | | – | | | | 209 | | | | (1,805) | | | | 3,608 | | | | (3,820) | | | | 13,421 | |
| |
| 1 | Total gains and losses predominantly relate to net gains (losses) on financial assets/liabilities at fair value through profit or loss reported in the consolidated statement of income. The balance also includes net gains (losses) on financial assets available for sale reported in the consolidated statement of income and unrealized net gains (losses) on financial assets available for sale and exchange rate changes reported in other comprehensive income, net of tax. Further, certain instruments are hedged with instruments in level 1 or level 2 but the table above does not include the gains and losses on these hedging instruments. Additionally, both observable and unobservable parameters may be used to determine the fair value of an instrument classified within level 3 of the fair value hierarchy; the gains and losses presented below are attributable to movements in both the observable and unobservable parameters. |
| 2 | Total gains and losses on available for sale include a loss of€ 76 million recognized in other comprehensive income, net of tax, and a gain of€ 213 million recognized in the income statement presented in net gains (losses) on financial assets available for sale. |
| 3 | This amount includes the effect of exchange rate changes. For total financial assets held at fair value this effect is a positive€ 266 million and for total financial liabilities held at fair value this is a negative€ 57 million. This predominantly relates to derivatives. The effect of exchange rate changes is reported in other comprehensive income, net of tax. |
| 4 | For assets positive balances represent gains, negative balances represent losses. For liabilities positive balances represent losses, negative balances represent gains. |
| 5 | Issuances relate to the cash amount received on the issuance of a liability and the cash amount paid on the primary issuance of a loan to a borrower. |
| 6 | Settlements represent cash flows to settle the asset or liability. For debt and loan instruments this includes principal on maturity, principal amortizations and principal repayments. For derivatives all cash flows are presented in settlements. |
| 7 | Transfers in and transfers out of level 3 during the year are recorded at their fair value at the beginning of year in the table below. For instruments transferred into level 3 the table shows the gains and losses and cash flows on the instruments as if they had been transferred at the beginning of the year. Similarly for instruments transferred out of level 3 the table does not show any gains or losses or cash flows on the instruments during the year since the table is presented as if they have been transferred out at the beginning of the year. |
Sensitivity Analysis of Unobservable Parameters
Where the value of financial instruments is dependent on unobservable parameter inputs, the precise level for these parameters at the balance sheet date might be drawn from a range of reasonably possible alternatives. In preparing the financial statements, appropriate levels for these unobservable input parameters are chosen so that they are consistent with prevailing market evidence and in line with the Group’s approach to valuation control detailed above. Were the Group to have marked the financial instruments concerned using parameter values drawn from the extremes of the ranges of reasonably possible alternatives then as of December 31, 2012 it could have increased fair value by as much as€ 4.0 billion or decreased fair value by as much as€ 3.9 billion. As of December 31, 2011, it could have increased fair value by as much as€ 4.2 billion or decreased fair value by as much as€ 4.5 billion. In estimating these impacts, the Group either re-valued certain financial instruments using reasonably possible alternative parameter values, or used an approach based on its valuation adjustment methodology for bid/offer spread valuation adjustments. Bid/offer spread valuation adjustments reflect the amount that must be paid in order to close out a holding in an instrument or component risk and as such they reflect factors such as market illiquidity and uncertainty.
| | | | |
| Deutsche Bank | | 02 – Consolidated Financial Statements | | 320 |
| Financial Report 2012 | | Notes to the Consolidated Balance Sheet 15 – Financial Instruments carried at Fair Value | | |
| | |
| | | | |
| | |
| | | | |
This disclosure is intended to illustrate the potential impact of the relative uncertainty in the fair value of financial instruments for which valuation is dependent on unobservable input parameters. However, it is unlikely in practice that all unobservable parameters would be simultaneously at the extremes of their ranges of reasonably possible alternatives. Hence, the estimates disclosed above are likely to be greater than the true uncertainty in fair value at the balance sheet date. Furthermore, the disclosure is not predictive or indicative of future movements in fair value.
For many of the financial instruments considered here, in particular derivatives, unobservable input parameters represent only a subset of the parameters required to price the financial instrument, the remainder being observable. Hence for these instruments the overall impact of moving the unobservable input parameters to the extremes of their ranges might be relatively small compared with the total fair value of the financial instrument. For other instruments, fair value is determined based on the price of the entire instrument, for example, by adjusting the fair value of a reasonable proxy instrument. In addition, all financial instruments are already carried at fair values which are inclusive of valuation adjustments for the cost to close out that instrument and hence already factor in uncertainty as it reflects itself in market pricing. Any negative impact of uncertainty calculated within this disclosure, then, will be over and above that already included in the fair value contained in the financial statements.
Breakdown of the sensitivity analysis by type of instrument1
| | | | | | | | | | | | | | | | |
| | | Dec 31, 2012 | | | Dec 31, 2011 | |
in€ m. | | Positive fair value
movement from using
reasonable possible
alternatives | | | Negative fair value
movement from using
reasonable possible
alternatives | | | Positive fair value
movement from using
reasonable possible
alternatives | | | Negative fair value
movement from using
reasonable possible
alternatives | |
Derivatives: | | | | | | | | | | | | | | | | |
Credit | | | 732 | | | | 1,118 | | | | 6192 | | | | 1,1412 | |
Equity | | | 169 | | | | 131 | | | | 238 | | | | 137 | |
Interest related | | | 126 | | | | 85 | | | | 94 | | | | 114 | |
Hybrid | | | 368 | | | | 254 | | | | 415 | | | | 293 | |
Other | | | 286 | | | | 260 | | | | 189 | | | | 170 | |
| | | | | | | | | | | | | | | | |
Securities: | | | | | | | | | | | | | | | | |
Debt securities | | | 1,931 | | | | 1,725 | | | | 2,3262 | | | | 2,2942 | |
Equity securities | | | 19 | | | | 19 | | | | 9 | | | | 9 | |
Mortgage- and asset-backed | | | – | | | | – | | | | 5 | | | | 5 | |
| | | | | | | | | | | | | | | | |
Loans: | | | | | | | | | | | | | | | | |
Leveraged loans | | | – | | | | – | | | | – | | | | – | |
Commercial loans | | | – | | | | – | | | | – | | | | – | |
Traded loans | | | 325 | | | | 288 | | | | 343 | | | | 342 | |
| | | | | | | | | | | | | | | | |
Total | | | 3,956 | | | | 3,880 | | | | 4,238 | | | | 4,505 | |
| |
| 1 | Where the exposure to an unobservable parameter is offset across different instruments then only the net impact is disclosed in the table. |
| 2 | Prior year amounts have been adjusted due to a refinement in the estimate of the sensitivity. |
Total Gains or Losses on Level 3 Instruments held or in Issue at the Reporting Date
The total gains or losses are not due solely to unobservable parameters. Many of the parameter inputs to the valuation of instruments in this level of the hierarchy are observable and the gain or loss is partly due to movements in these observable parameters over the period. Many of the positions in this level of the hierarchy are economically hedged by instruments which are categorized in other levels of the fair value hierarchy. The offsetting gains and losses that have been recorded on all such hedges are not included in the table below, which only shows the gains and losses related to the level 3 classified instruments themselves held at the reporting date.
| | | | |
| Deutsche Bank | | 02 – Consolidated Financial Statements | | 321 |
| Financial Report 2012 | | Notes to the Consolidated Balance Sheet 16 – Fair Value of Financial Instruments not carried at Fair Value | | |
| | |
| | | | |
| | |
| | | | |
| | | | | | | | |
in€ m. | | Dec 31, 2012 | | | Dec 31, 2011 | |
Financial assets held at fair value: | | | | | | | | |
| | | | | | | | |
Trading securities | | | 407 | | | | 113 | |
Positive market values from derivative financial instruments | | | (2,207) | | | | 4,627 | |
Other trading assets | | | (107) | | | | 238 | |
Financial assets designated at fair value through profit or loss | | | 348 | | | | 12 | |
Financial assets available for sale | | | 380 | | | | 334 | |
Other financial assets at fair value | | | – | | | | – | |
| | | | | | | | |
Total financial assets held at fair value | | | (1,179) | | | | 5,324 | |
| | | | | | | | |
Financial liabilities held at fair value: | | | | | | | | |
| | | | | | | | |
Trading securities | | | (14) | | | | (3) | |
Negative market values from derivative financial instruments | | | (867) | | | | (2,775) | |
Other trading liabilities | | | – | | | | 14 | |
Financial liabilities designated at fair value through profit or loss | | | 583 | | | | (765) | |
Other financial liabilities at fair value | | | (114) | | | | 106 | |
| | | | | | | | |
Total financial liabilities held at fair value | | | (412) | | | | (3,423) | |
| | | | | | | | |
Total | | | (1,591) | | | | 1,901 | |
| |
Recognition of Trade Date Profit
If there are significant unobservable inputs used in a valuation technique, the financial instrument is recognized at the transaction price and any trade date profit is deferred. The table below presents the year-to-year movement of the trade date profits deferred due to significant unobservable parameters for financial instruments classified at fair value through profit or loss. The balance is predominantly related to derivative instruments.
| | | | | | | | |
in€ m. | | 2012 | | | 2011 | |
Balance, beginning of year | | | 645 | | | | 622 | |
| | | | | | | | |
New trades during the period | | | 519 | | | | 418 | |
| | | | | | | | |
Amortization | | | (231) | | | | (235) | |
| | | | | | | | |
Matured trades | | | (179) | | | | (142) | |
| | | | | | | | |
Subsequent move to observability | | | (50) | | | | (28) | |
| | | | | | | | |
Exchange rate changes | | | (5) | | | | 10 | |
| | | | | | | | |
Balance, end of year | | | 699 | | | | 645 | |
| |
16 –
Fair Value of Financial Instruments not carried at Fair Value
The valuation techniques used to establish fair value for the Group’s financial instruments which are not carried at fair value in the balance sheet are consistent with those outlined in Note 15 “Financial Instruments carried at Fair Value”.
As described in Note 14 “Amendments to IAS 39 and IFRS 7, “Reclassification of Financial Assets””, the Group reclassified certain eligible assets from the trading and available for sale classifications to loans. The Group continues to apply the relevant valuation techniques set out in Note 15 “Financial Instruments carried at Fair Value”, to the reclassified assets.
Other financial instruments not carried at fair value are not managed on a fair value basis, for example, retail loans and deposits and credit facilities extended to corporate clients. For these instruments fair values are calculated for disclosure purposes only and do not impact the balance sheet or income statement. Additionally, since the instruments generally do not trade there is significant management judgment required to determine these fair values.
| | | | |
| Deutsche Bank | | 02 – Consolidated Financial Statements | | 322 |
| Financial Report 2012 | | Notes to the Consolidated Balance Sheet 16 – Fair Value of Financial Instruments not carried at Fair Value | | |
| | |
| | | | |
| | |
| | | | |
Short-term financial instruments: The carrying value represents a reasonable estimate of fair value for the following financial instruments which are predominantly short-term.
| | |
Assets | | Liabilities |
Cash and due from banks | | Deposits |
| | |
Interest-earning deposits with banks | | Central bank funds purchased and securities sold under repurchase agreements |
| | |
| Central bank funds sold and securities purchased under resale agreements | | Securities loaned |
| | |
Securities borrowed | | Other short-term borrowings |
| | |
Other assets | | Other liabilities |
|
For longer-term financial instruments within these categories, fair value is determined by discounting contractual cash flows using rates which could be earned for assets with similar remaining maturities and credit risks and, in the case of liabilities, rates at which the liabilities with similar remaining maturities could be issued, at the balance sheet date.
Loans: Fair value is determined using discounted cash flow models that incorporate parameter inputs for credit risk, interest rate risk, foreign exchange risk, loss given default estimates and amounts utilized given default, as appropriate. Credit risk, loss given default and utilization given default parameters are determined using information from the loan or credit default swap markets, where available and appropriate.
For retail lending portfolios with a large number of homogenous loans (e.g., German residential mortgages), the fair value is calculated on a portfolio basis by discounting the portfolio’s contractual cash flows using risk-free interest rates. This present value calculation is then adjusted for credit risk by discounting at the margins which could be earned on similar loans if issued at the balance sheet date. For other portfolios the present value calculation is adjusted for credit risk by calculating the expected loss over the estimated life of the loan based on various parameters including probability of default and loss given default and level of collateralization. The fair value of corporate lending portfolios is estimated by discounting a projected margin over expected maturities using parameters derived from the current market values of collateralized loan obligation (“CLO”) transactions collateralized with loan portfolios that are similar to the Group’s corporate lending portfolio.
Securities purchased under resale agreements, securities borrowed, securities sold under repurchase agreements and securities loaned: Fair value is derived from valuation techniques by discounting future cash flows using the appropriate credit risk-adjusted discount rate. The credit risk-adjusted discount rate includes consideration of the collateral received or pledged in the transaction. These products are typically short-term and highly collateralized, therefore the fair value is not significantly different to the carrying value.
Long-term debt and trust preferred securities: Fair value is determined from quoted market prices, where available. Where quoted market prices are not available, fair value is estimated using a valuation technique that discounts the remaining contractual cash at a rate at which an instrument with similar characteristics could be issued at the balance sheet date.
| | | | |
| Deutsche Bank | | 02 – Consolidated Financial Statements | | 323 |
| Financial Report 2012 | | Notes to the Consolidated Balance Sheet 17 – Financial Assets Available for Sale | | |
| | |
| | | | |
| | |
| | | | |
Estimated fair value of financial instruments not carried at fair value on the balance sheet1
| | | | | | | | | | | | | | | | |
| | | Dec 31, 2012 | | | Dec 31, 2011 | |
in€ m. | | Carrying value | | | Fair value | | | Carrying value | | | Fair value | |
Financial assets: | | | | | | | | | | | | | | | | |
| | | | | | | | | | | | | | | | |
Cash and due from banks | | | 27,885 | | | | 27,885 | | | | 15,928 | | | | 15,928 | |
Interest-earning deposits with banks | | | 119,548 | | | | 119,560 | | | | 162,000 | | | | 161,905 | |
Central bank funds sold and securities purchased under resale agreements | | | 36,570 | | | | 36,570 | | | | 25,773 | | | | 25,767 | |
Securities borrowed | | | 23,947 | | | | 23,947 | | | | 31,337 | | | | 31,337 | |
Loans | | | 397,279 | | | | 400,603 | | | | 412,514 | | | | 408,295 | |
Other assets2 | | | 106,878 | | | | 106,851 | | | | 134,699 | | | | 134,660 | |
| | | | | | | | | | | | | | | | |
Financial liabilities: | | | | | | | | | | | | | | | | |
| | | | | | | | | | | | | | | | |
Deposits | | | 577,202 | | | | 577,936 | | | | 601,730 | | | | 602,585 | |
Central bank funds purchased and securities sold under repurchase agreements | | | 36,144 | | | | 36,144 | | | | 35,311 | | | | 35,311 | |
Securities loaned | | | 3,109 | | | | 3,109 | | | | 8,089 | | | | 8,089 | |
Other short-term borrowings | | | 69,060 | | | | 69,059 | | | | 65,356 | | | | 65,348 | |
Other liabilities2 | | | 145,679 | | | | 145,679 | | | | 154,647 | | | | 154,647 | |
Long-term debt | | | 158,097 | | | | 158,117 | | | | 163,416 | | | | 158,245 | |
Trust preferred securities | | | 12,091 | | | | 12,014 | | | | 12,344 | | | | 9,986 | |
| |
| 1 | Amounts generally presented on a gross basis, in line with the Group’s accounting policy regarding offsetting of financial instruments as described in Note 01 “Significant Accounting Policies” |
| 2 | Only includes financial assets or financial liabilities. |
Loans: The difference between fair value and carrying value does not reflect the economic benefits and costs that the Group expects to receive from these instruments. The difference arose predominantly due to an increase in expected default rates and reduction in liquidity as implied from market pricing since initial recognition. These reductions in fair value are offset by an increase in fair value due to interest rate movements on fixed rate instruments.
Long-term debt and trust preferred securities: The difference between fair value and carrying value is due to the effect of changes in the rates at which the Group could issue debt with similar maturity and subordination at the balance sheet date compared to when the instrument was issued.
17 –
Financial Assets Available for Sale
| | | | | | | | |
in€ m. | | Dec 31, 2012 | | | Dec 31, 2011 | |
Debt securities: | | | | | | | | |
German government | | | 9,942 | | | | 5,207 | |
U.S. Treasury and U.S. government agencies | | | 169 | | | | 1,015 | |
U.S. local (municipal) governments | | | 531 | | | | 605 | |
Other foreign governments | | | 16,655 | | | | 10,919 | |
Corporates | | | 14,527 | | | | 18,856 | |
Other asset-backed securities | | | 1,113 | | | | 1,273 | |
Mortgage-backed securities, including obligations of U.S. federal agencies | | | 727 | | | | 731 | |
Other debt securities | | | 491 | | | | 775 | |
| | | | | | | | |
Total debt securities | | | 44,155 | | | | 39,381 | |
| | | | | | | | |
Equity securities: | | | | | | | | |
Equity shares | | | 1,083 | | | | 1,632 | |
Investment certificates and mutual funds | | | 222 | | | | 236 | |
| | | | | | | | |
Total equity securities | | | 1,305 | | | | 1,868 | |
| | | | | | | | |
Other equity interests | | | 966 | | | | 1,116 | |
| | | | | | | | |
Loans | | | 2,954 | | | | 2,916 | |
| | | | | | | | |
Total financial assets available for sale | | | 49,379 | | | | 45,281 | |
| |
| | | | |
| Deutsche Bank | | 02 – Consolidated Financial Statements | | 324 |
| Financial Report 2012 | | Notes to the Consolidated Balance Sheet 18 – Equity Method Investments | | |
| | |
| | | | |
| | |
| | | | |
Financial assets available for sale did not include Greek government bonds as of December 31, 2012. As of December 31, 2011, Greek government bonds had a fair value of€ 211 million.
Please also refer to Note 08 “Net Gains (Losses) on Financial Assets available for Sale” of this report.
18 –
Equity Method Investments
Investments in associates and jointly controlled entities are accounted for using the equity method of accounting.
Significant investees as of December 31, 20121
| | | | |
Investment2 | | Ownership
percentage | |
Hua Xia Bank Company Limited, Beijing3 | | | 19.99% | |
| | | | |
Station Holdco LLC, Wilmington | | | 25.00% | |
| | | | |
Huamao Property Holdings Ltd., George Town3 | | | 0.00% | |
| | | | |
Huarong Rongde Asset Management Company Limited, Beijing | | | 40.70% | |
| | | | |
Harvest Fund Management Company Limited, Shanghai | | | 30.00% | |
| |
| 1 | Representing 75 % of the carrying value of equity method investments. |
| 2 | All significant equity method investments are investments in associates. |
| 3 | The Group has significant influence over the investee through board seats or other measures. |
Summarized aggregated financial information of significant investees
| | | | | | | | |
in€ m. | | Dec 31, 2012 | | | Dec 31, 2011 | |
Total assets | | | 185,470 | | | | 160,016 | |
| | | | | | | | |
Total liabilities | | | 172,781 | | | | 148,282 | |
| | | | | | | | |
Revenues | | | 4,862 | | | | 5,143 | |
| | | | | | | | |
Net income (loss) | | | 1,287 | | | | 1,270 | |
| |
Components of the net income (loss) from all equity method investments
| | | | | | | | | | | | |
in€ m. | | 2012 | | | 2011 | | | 2010 | |
Net income (loss) from equity method investments: | | | | | | | | | | | | |
Pro-rata share of investees’ net income (loss) | | | 397 | | | | 222 | | | | 457 | |
Net gains (losses) on disposal of equity method investments | | | 73 | | | | 29 | | | | 14 | |
Impairments | | | (311) | | | | (515) | | | | (2,475) | |
| | | | | | | | | | | | |
Total net income (loss) from equity method investments | | | 159 | | | | (264) | | | | (2,004) | |
| |
Total net income from equity method investments were€ 159 million in 2012, compared to€ (264) million in 2011. This increase was mainly driven by a positive equity pick-up of€ 311 million from the Group’s investment in Hua Xia Bank Company Limited, partly offsetted by an impairment charge of€ 257 million recognized in the first quarter of 2012 related to Actavis Group before reclassification from equity method investments to held for sale.
For further details on the development of Actavis Group in 2012, please refer to Note 26 “Non-Current Assets and Disposal Groups Held for Sale”.
In 2010 a charge of approximately€ 2.3 billion attributable to the equity method investment in Deutsche Postbank AG prior to consolidation was included. On December 3, 2010, Deutsche Bank gained a controlling majority in Postbank shares and commenced consolidation of the Postbank Group as of that date. As a consequence the Group ceased equity method accounting for its investment in Postbank. Further detail is included in Note 04 “Acquisitions and Dispositions”.
There was no unrecognized share of losses of an investee, neither for the period, nor cumulatively.
| | | | |
| Deutsche Bank | | 02 – Consolidated Financial Statements | | 325 |
| Financial Report 2012 | | Notes to the Consolidated Balance Sheet 18 – Equity Method Investments | | |
| | |
| | | | |
| | |
| | | | |
Equity method investments for which there were published price quotations had a carrying value of€ 2.4 billion and a fair value of€ 1.8 billion as of December 31, 2012, and a carrying value of€ 2.2 billion and a fair value of€ 2.1 billion as of December 31, 2011. According to the Group’s accounting policy relating to Associates and Jointly Controlled Entities, as described in Note 01 “Significant Accounting Policies”, no objective evidence of impairment was determined.
The investees have no significant contingent liabilities to which the Group is exposed.
In 2012 and 2011, none of the Group’s investees experienced any significant restrictions on transferring funds in the form of cash dividends, or repayment of loans or advances.
Hua Xia Bank. On May 6, 2010, Deutsche Bank announced that it had signed a binding agreement to subscribe for newly issued shares in Hua Xia Bank Co. Ltd. (“Hua Xia Bank”) for a total subscription price of RMB 5.6 billion (€ 587 million). Deutsche Bank’s subscription was part of a private placement of Hua Xia Bank shares to its three largest shareholders with an overall issuance value of up to RMB 20.8 billion (€ 2.2 billion). Upon final settlement of the transaction, which was effective with the registration of the new shares on April 26, 2011, this investment increased Deutsche Bank’s equity stake in Hua Xia Bank from 17.12 % to 19.99 % of issued capital.
The purchase of the newly issued shares was subject to substantive regulatory approvals to be granted by various Chinese regulatory agencies. The last substantive regulatory approval, which resulted in Deutsche Bank having a claim to receive the additional shares and the associated voting rights, was received on February 11, 2011.
Upon this date, the new shares to be issued have been taken into consideration when assessing Deutsche Bank’s level of influence in accordance with IAS 28, “Investments in Associates”, because they represent potential voting rights.
As of February 11, 2011, Deutsche Bank’s influence was represented by the existing voting rights of 17.12 % and the potential voting rights of 2.87 %. The resulting 19.99 % of the voting power is considered to evidence significant influence because it is materially equal to the 20 % of the voting power upon which significant influence is generally presumed to exist. Furthermore, Deutsche Bank’s significant influence is evidenced by the fact that Deutsche Bank has successfully negotiated its stake increase with Hua Xia Bank’s management and the other stakeholders and is represented on four of six of Hua Xia Bank Board Committees.
The equity method of accounting has been applied from February 11, 2011.
Upon reclassifying the investment from Financial assets available for sale to Equity method investments in the first quarter 2011, Deutsche Bank used the remeasurement approach by analogy to IFRS 3R, “Business Combinations”. As a result unrealized net gains of€ 263 million previously recorded in Other comprehensive income were reclassified into Net gains (losses) on financial assets available for sale in the income statement.
As of December 31, 2012 and December 31, 2011 the carrying value of the reclassified investment was€ 2.3 billion and€ 2.0 billion, respectively,
| | | | |
| Deutsche Bank | | 02 – Consolidated Financial Statements | | 326 |
| Financial Report 2012 | | Notes to the Consolidated Balance Sheet 20 – Allowance for Credit Losses | | |
| | |
| | | | |
| | |
| | | | |
19 –
Loans
Loans by industry classification
| | | | | | | | |
in€ m. | | Dec 31, 2012 | | | Dec 31, 2011 | |
Banks and insurance | | | 27,849 | | | | 35,308 | |
Manufacturing | | | 23,203 | | | | 22,754 | |
Households (excluding mortgages) | | | 39,373 | | | | 38,657 | |
Households – mortgages | | | 141,601 | | | | 135,531 | |
Public sector | | | 15,378 | | | | 16,412 | |
Wholesale and retail trade | | | 17,026 | | | | 15,045 | |
Commercial real estate activities | | | 45,225 | | | | 46,143 | |
Lease financing | | | 1,021 | | | | 1,679 | |
Fund management activities | | | 16,777 | | | | 24,952 | |
Other | | | 74,659 | | | | 80,576 | |
| | | | | | | | |
Gross loans | | | 402,112 | | | | 417,057 | |
| | | | | | | | |
(Deferred expense)/unearned income | | | 137 | | | | 381 | |
| | | | | | | | |
Loans less (deferred expense)/unearned income | | | 401,975 | | | | 416,676 | |
| | | | | | | | |
Less: Allowance for loan losses | | | 4,696 | | | | 4,162 | |
| | | | | | | | |
Total loans | | | 397,279 | | | | 412,514 | |
| |
20 –
Allowance for Credit Losses
The allowance for credit losses consists of an allowance for loan losses and an allowance for off-balance sheet positions.
Breakdown of the movements in the Group’s allowance for loan losses
| | | | | | | | | | | | | | | | | | | | | | | | | | | | | | | | | | | | |
| | | 2012 | | | 2011 | | | 2010 | |
in€ m. | | Individually
assessed | | | Collectively
assessed | | | Total | | | Individually
assessed | | | Collectively
assessed | | | Total | | | Individually
assessed | | | Collectively
assessed | | | Total | |
| Allowance, beginning of year | | | 2,011 | | | | 2,150 | | | | 4,162 | | | | 1,643 | | | | 1,653 | | | | 3,296 | | | | 2,029 | | | | 1,313 | | | | 3,343 | |
| | | | | | | | | | | | | | | | | | | | | | | | | | | | | | | | | | | | |
| Provision for loan losses | | | 1,115 | | | | 613 | | | | 1,728 | | | | 907 | | | | 925 | | | | 1,832 | | | | 562 | | | | 751 | | | | 1,313 | |
| Net charge-offs: | | | (762) | | | | (324) | | | | (1,086) | | | | (512) | | | | (385) | | | | (897) | | | | (896) | | | | (404) | | | | (1,300) | |
| Charge-offs | | | (798) | | | | (483) | | | | (1,281) | | | | (553) | | | | (512) | | | | (1,065) | | | | (934) | | | | (509) | | | | (1,443) | |
| Recoveries | | | 36 | | | | 158 | | | | 195 | | | | 41 | | | | 127 | | | | 168 | | | | 38 | | | | 104 | | | | 143 | |
| | | | | | | | | | | | | | | | | | | | | | | | | | | | | | | | | | | | |
| Changes in the group of consolidated companies | | | – | | | | – | | | | – | | | | – | | | | (0) | | | | (0) | | | | – | | | | – | | | | – | |
| | | | | | | | | | | | | | | | | | | | | | | | | | | | | | | | | | | | |
| Exchange rate changes/other | | | (98) | | | | (9) | | | | (107) | | | | (26) | | | | (43) | | | | (69) | | | | (53) | | | | (6) | | | | (60) | |
| | | | | | | | | | | | | | | | | | | | | | | | | | | | | | | | | | | | |
| Allowance, end of year | | | 2,266 | | | | 2,430 | | | | 4,696 | | | | 2,011 | | | | 2,150 | | | | 4,162 | | | | 1,643 | | | | 1,653 | | | | 3,296 | |
| |
Activity in the Group’s allowance for off-balance sheet positions (contingent liabilities and lending commitments)
| | | | | | | | | | | | | | | | | | | | | | | | | | | | | | | | | | | | |
| | | 2012 | | | 2011 | | | 2010 | |
in€ m. | | Individually
assessed | | | Collectively
assessed | | | Total | | | Individually
assessed | | | Collectively
assessed | | | Total | | | Individually
assessed | | | Collectively
assessed | | | Total | |
| Allowance, beginning of year | | | 127 | | | | 98 | | | | 225 | | | | 108 | | | | 110 | | | | 218 | | | | 83 | | | | 124 | | | | 207 | |
| | | | | | | | | | | | | | | | | | | | | | | | | | | | | | | | | | | | |
| Provision for off-balance sheet positions | | | (7) | | | | 0 | | | | (7) | | | | 19 | | | | (12) | | | | 7 | | | | (18) | | | | (21) | | | | (39) | |
| | | | | | | | | | | | | | | | | | | | | | | | | | | | | | | | | | | | |
| Usage | | | – | | | | – | | | | – | | | | – | | | | – | | | | – | | | | – | | | | – | | | | – | |
| | | | | | | | | | | | | | | | | | | | | | | | | | | | | | | | | | | | |
| Changes in the group of consolidated companies | | | – | | | | – | | | | – | | | | (0) | | | | 0 | | | | 0 | | | | 42 | | | | – | | | | 42 | |
| | | | | | | | | | | | | | | | | | | | | | | | | | | | | | | | | | | | |
| Exchange rate changes/other | | | (2) | | | | (1) | | | | (3) | | | | (0) | | | | 0 | | | | 0 | | | | 1 | | | | 7 | | | | 8 | |
| | | | | | | | | | | | | | | | | | | | | | | | | | | | | | | | | | | | |
| Allowance, end of year | | | 118 | | | | 97 | | | | 215 | | | | 127 | | | | 98 | | | | 225 | | | | 108 | | | | 110 | | | | 218 | |
| |
In 2010 the Group recorded changes in the group of consolidated companies for off-balance sheet allowances following the consolidation of acquisitions amounting to€ 34 million for Postbank Group and€ 8 million for Sal. Oppenheim/BHF-BANK.
| | | | |
| Deutsche Bank | | 02 – Consolidated Financial Statements | | 327 |
| Financial Report 2012 | | Notes to the Consolidated Balance Sheet 21 – Transfers of Financial Assets | | |
| | |
| | | | |
| | |
| | | | |
21 –
Transfers of Financial Assets
The Group enters into transactions in which it transfers financial assets held on the balance sheet and as a result may either be eligible to derecognize the transferred asset in its entirety or must continue to recognize the transferred asset to the extent of any continuing involvement, depending on certain criteria. These criteria are discussed in Note 01 “Significant Accounting Policies”.
Where financial assets are not eligible to be derecognized, the transfers are viewed as secured financing transactions, with any consideration received resulting in a corresponding liability. The Group is not entitled to use these financial assets for any other purposes. The most common transactions of this nature entered into by the Group are repurchase agreements, securities lending agreements and total return swaps, in which the Group retains substantially all of the associated credit, equity price, interest rate and foreign exchange risks and rewards associated with the assets as well as the associated income streams.
The Group could retain some exposure to the future performance of a transferred asset either through new or existing contractual rights and obligations, however, and still be eligible to derecognize the asset. This on-going involvement will be recognized as a new instrument which may be different from the original financial asset that was transferred. Typical transactions include retaining senior notes of non-consolidated securitizations to which originated loans have been transferred; financing arrangements with SPE’s to which the Group has sold a portfolio of assets; or sales of assets with credit-contingent swaps. The Group’s exposure to such transactions is not considered to be significant as any substantial retention of risks associated with the transferred asset will commonly result in an initial failure to derecognize. Transactions not considered to result in an ongoing involvement include normal warranties on fraudulent activities that could invalidate a transfer in the event of legal action, qualifying pass-through arrangements and standard trustee or administrative fees that are not linked to performance.
Information on asset types and associated transactions that did not qualify for derecognition1
| | | | | | | | |
in€ m. | | Dec 31, 2012 | | | Dec 31, 2011 | |
Carrying amount of transferred assets | | | | | | | | |
| | | | | | | | |
Trading securities not derecognized due to the following transactions: | | | | | | | | |
Repurchase agreements | | | 51,020 | | | | 49,401 | |
Securities lending agreements | | | 36,109 | | | | 31,245 | |
Total return swaps | | | 10,056 | | | | 9,857 | |
Consolidated Group Sponsored Securitizations | | | 1,889 | | | | 2,044 | |
| | | | | | | | |
Total trading securities | | | 99,074 | | | | 92,547 | |
| | | | | | | | |
Other trading assets | | | 1,579 | | | | 2,035 | |
| | | | | | | | |
Financial assets available for sale | | | 992 | | | | 10,225 | |
| | | | | | | | |
Loans | | | 2,723 | | | | 4,461 | |
| | | | | | | | |
Total | | | 104,368 | | | | 109,268 | |
| | | | | | | | |
Carrying amount of associated liabilities | | | 92,372 | | | | 89,927 | |
| |
| 1 | The amendments to IFRS7 introduced an extended transfer definition, therefore widened the scope of the disclosure. See Note 03 “Recently Adopted and New Accounting Pronouncements”. |
| | | | |
| Deutsche Bank | | 02 – Consolidated Financial Statements | | 328 |
| Financial Report 2012 | | Notes to the Consolidated Balance Sheet 21 – Transfers of Financial Assets | | |
| | |
| | | | |
| | |
| | | | |
As of December 31, 2012 the fair value of transferred assets that did not qualify for derecognition and where the associated liability is recourse only to those assets was€ 3.4 billion. They included Trading securities, Financial assets available for sale and Loans with a fair value of€ 1.9 billion,€ 344 million and€ 1.1 billion respectively. The fair value of associated liabilities that have recourse only to such transferred assets was€ 3.4 billion.
Carrying value of assets transferred in which the Group still accounts for the asset to the extent of its continuing involvement:
| | | | | | | | |
in€ m. | | Dec 31, 2012 | | | Dec 31, 2011 | |
Carrying amount of the original assets transferred: | | | | | | | | |
| | | | | | | | |
Trading securities | | | 839 | | | | 1,383 | |
Other trading assets | | | 2,013 | | | | 7,302 | |
| | | | | | | | |
Carrying amount of the assets continued to be recognized: | | | | | | | | |
| | | | | | | | |
Trading securities | | | 805 | | | | 1,367 | |
Other trading assets | | | 300 | | | | 2,078 | |
| | | | | | | | |
Carrying amount of associated liabilities | | | 1,037 | | | | 3,467 | |
| |
The impact on the Group’s Balance Sheet of on-going involvement associated with transferred assets derecognized in full:
| | | | | | | | | | | | |
| | | Dec 31, 2012 | |
in€ m. | | Carrying
value | | | Fair value | | | Maximum
Exposure
to Loss | |
| Loans: | | | | | | | | | | | | |
Securitization notes | | | 1,888 | | | | 1,798 | | | | 2,012 | |
| | | | | | | | | | | | |
| Total Loans | | | 1,888 | | | | 1,798 | | | | 2,012 | |
| | | | | | | | | | | | |
Financial assets held at Fair Value through the P&L: | | | | | | | | | | | | |
Securitization notes | | | 1,143 | | | | 1,143 | | | | 1,143 | |
Non-standard Interest Rate, cross-currency or inflation-linked swap | | | 32 | | | | 32 | | | | 32 | |
| | | | | | | | | | | | |
Total Financial assets held at Fair Value through the P&L | | | 1,175 | | | | 1,175 | | | | 1,175 | |
| | | | | | | | | | | | |
Financial assets available for sale: | | | | | | | | | | | | |
Securitization notes | | | 29 | | | | 29 | | | | 29 | |
Loans | | | – | | | | – | | | | – | |
| | | | | | | | | | | | |
Total Financial assets available for sale | | | 29 | | | | 29 | | | | 29 | |
| | | | | | | | | | | | |
Total financial assets representing on-going involvement | | | 3,092 | | | | 3,002 | | | | 3,216 | |
| | | | | | | | | | | | |
Financial liabilities held at Fair Value through the P&L: | | | | | | | | | | | | |
Non-standard Interest Rate, cross-currency or inflation-linked swap | | | (36) | | | | (36) | | | | – | |
| | | | | | | | | | | | |
Total financial liabilities representing on-going involvement | | | (36) | | | | (36) | | | | – | |
| |
The impact on the Group’s Statement of Income of on-going involvement associated with transferred assets derecognized in full:
| | | | | | | | | | | | |
| | | Dec 31, 2012 | |
in€ m. | | Year-to-
date P&L | | | Cumulative
P&L | | | Gain/(loss)
on disposal | |
Securitization notes | | | 190 | | | | (139) | | | | –1 | |
| | | | | | | | | | | | |
Non-standard IRS, CCS, inflation-linked swap | | | (8) | | | | 407 | | | | 5 | |
| | | | | | | | | | | | |
Other2 | | | – | | | | 21 | | | | 34 | |
| | | | | | | | | | | | |
Net gains/(losses) recognized from on-going involvement in derecognized assets | | | 182 | | | | 289 | | | | 39 | |
| |
| 1 | Typically, sales of assets into securitization vehicles were of assets that were classified as Fair Value through P&L, therefore any gain or loss on disposal is immaterial. |
| 2 | On-going involvement in sold equity positions in the form of a deeply out-of-the-money option, contingent on several unlikely events and therefore not expected to be exercised. As a result, the carrying and fair value of this option is considered to be nil. |
| | | | |
| Deutsche Bank | | 02 – Consolidated Financial Statements | | 329 |
| Financial Report 2012 | | Notes to the Consolidated Balance Sheet 22 – Assets Pledged and Received as Collateral | | |
| | |
| | | | |
| | |
| | | | |
22 –
Assets Pledged and Received as Collateral
The Group pledges assets primarily for repurchase agreements and securities borrowing agreements which are generally conducted under terms that are usual and customary for standard securitized borrowing contracts. In addition, the Group pledges collateral against other borrowing arrangements and for margining purposes on OTC derivative liabilities.
Carrying value of the Group’s assets pledged as collateral for liabilities or contingent liabilities
| | | | | | | | |
in€ m. | | Dec 31, 2012 | | | Dec 31, 2011 | |
Interest-earning deposits with banks | | | 150 | | | | 71 | |
| | | | | | | | |
Financial assets at fair value through profit or loss | | | 89,138 | | | | 83,862 | |
| | | | | | | | |
Financial assets available for sale | | | 6,413 | | | | 11,886 | |
| | | | | | | | |
Loans | | | 57,022 | | | | 45,0521 | |
| | | | | | | | |
Other | | | 570 | | | | 330 | |
| | | | | | | | |
Total | | | 153,293 | | | | 141,201 | |
| |
| 1 | Prior year numbers have been amended. |
Assets transferred where the transferee has the right to sell or repledge are disclosed on the face of the balance sheet. As of December 31, 2012 and December 31, 2011, these amounts were€ 91 billion and€ 99 billion, respectively.
As of December 31, 2012 and December 31, 2011, the Group had received collateral with a fair value of€ 311 billion and€ 304 billion, respectively, arising from securities purchased under reverse repurchase agreements, securities borrowed, derivatives transactions, customer margin loans and other transactions. These transactions were generally conducted under terms that are usual and customary for standard secured lending activities and the other transactions described. The Group, as the secured party, has the right to sell or repledge such collateral, subject to the Group returning equivalent securities upon completion of the transaction. As of December 31, 2012 and December 31, 2011, the Group had resold or repledged€ 261 billion and€ 262 billion, respectively. This was primarily to cover short sales, securities loaned and securities sold under repurchase agreements.
| | | | |
| Deutsche Bank | | 02 – Consolidated Financial Statements | | 330 |
| Financial Report 2012 | | Notes to the Consolidated Balance Sheet 23 – Property and Equipment | | |
| | |
| | | | |
| | |
| | | | |
23 –
Property and Equipment
| | | | | | | | | | | | | | | | | | | | |
in€ m. | | Owner
occupied
properties | | | Furniture and
equipment | | | Leasehold
improvements | | | Construction-
in-progress | | | Total | |
Cost of acquisition: | | | | | | | | | | | | | | | | | | | | |
| | | | | | | | | | | | | | | | | | | | |
Balance as of January 1, 2011 | | | 4,646 | | | | 3,621 | | | | 1,813 | | | | 298 | | | | 10,378 | |
| | | | | | | | | | | | | | | | | | | | |
Changes in the group of consolidated companies | | | (18) | | | | (2) | | | | – | | | | – | | | | (20) | |
Additions | | | 31 | | | | 309 | | | | 111 | | | | 343 | | | | 794 | |
Transfers | | | 1 | | | | 263 | | | | 127 | | | | (209) | | | | 182 | |
Reclassifications (to)/from ‘held for sale’ | | | (354) | | | | (108) | | | | – | | | | (4) | | | | (466) | |
Disposals | | | 57 | | | | 179 | | | | 95 | | | | – | | | | 331 | |
Exchange rate changes | | | 53 | | | | 29 | | | | 17 | | | | 1 | | | | 100 | |
| | | | | | | | | | | | | | | | | | | | |
Balance as of December 31, 2011 | | | 4,302 | | | | 3,933 | | | | 1,973 | | | | 429 | | | | 10,637 | |
| | | | | | | | | | | | | | | | | | | | |
Changes in the group of consolidated companies | | | – | | | | 1 | | | | 3 | | | | – | | | | 4 | |
Additions | | | 18 | | | | 327 | | | | 132 | | | | 137 | | | | 614 | |
Transfers | | | (20) | | | | 42 | | | | 116 | | | | (323) | | | | (185) | |
Reclassifications (to)/from ‘held for sale’ | | | (96) | | | | (6) | | | | – | | | | – | | | | (102) | |
Disposals | | | 146 | | | | 210 | | | | 66 | | | | – | | | | 422 | |
Exchange rate changes | | | (40) | | | | (33) | | | | (12) | | | | (8) | | | | (93) | |
| | | | | | | | | | | | | | | | | | | | |
Balance as of December 31, 2012 | | | 4,018 | | | | 4,054 | | | | 2,146 | | | | 235 | | | | 10,453 | |
| | | | | | | | | | | | | | | | | | | | |
| | | | | |
Accumulated depreciation and impairment: | | | | | | | | | | | | | | | | | | | | |
| | | | | | | | | | | | | | | | | | | | |
Balance as of January 1, 2011 | | | 1,330 | | | | 2,132 | | | | 1,114 | | | | – | | | | 4,576 | |
| | | | | | | | | | | | | | | | | | | | |
Changes in the group of consolidated companies | | | (1) | | | | 1 | | | | – | | | | – | | | | – | |
Depreciation | | | 86 | | | | 389 | | | | 138 | | | | – | | | | 613 | |
Impairment losses | | | 137 | | | | 5 | | | | 1 | | | | – | | | | 143 | |
Reversals of impairment losses | | | – | | | | – | | | | – | | | | – | | | | – | |
Transfers | | | (4) | | | | 76 | | | | (7) | | | | – | | | | 65 | |
Reclassifications (to)/from ‘held for sale’ | | | (94) | | | | 3 | | | | (2) | | | | – | | | | (93) | |
Disposals | | | 19 | | | | 149 | | | | 74 | | | | – | | | | 242 | |
Exchange rate changes | | | 22 | | | | 28 | | | | 16 | | | | – | | | | 66 | |
| | | | | | | | | | | | | | | | | | | | |
Balance as of December 31, 2011 | | | 1,457 | | | | 2,485 | | | | 1,186 | | | | – | | | | 5,128 | |
| | | | | | | | | | | | | | | | | | | | |
Changes in the group of consolidated companies | | | – | | | | (0) | | | | (0) | | | | – | | | | (0) | |
Depreciation | | | 82 | | | | 401 | | | | 155 | | | | – | | | | 638 | |
Impairment losses | | | 0 | | | | 29 | | | | 0 | | | | – | | | | 29 | |
Reversals of impairment losses | | | – | | | | 0 | | | | – | | | | – | | | | 0 | |
Transfers | | | 4 | | | | (1) | | | | (6) | | | | – | | | | (3) | |
Reclassifications (to)/from ‘held for sale’ | | | (3) | | | | (2) | | | | (1) | | | | – | | | | (6) | |
Disposals | | | 54 | | | | 171 | | | | 17 | | | | – | | | | 242 | |
Exchange rate changes | | | (18) | | | | (24) | | | | (12) | | | | – | | | | (54) | |
| | | | | | | | | | | | | | | | | | | | |
Balance as of December 31, 2012 | | | 1,468 | | | | 2,717 | | | | 1,305 | | | | – | | | | 5,490 | |
| | | | | | | | | | | | | | | | | | | | |
| | | | | |
Carrying amount: | | | | | | | | | | | | | | | | | | | | |
| | | | | | | | | | | | | | | | | | | | |
Balance as of December 31, 2011 | | | 2,845 | | | | 1,448 | | | | 787 | | | | 429 | | | | 5,509 | |
| | | | | | | | | | | | | | | | | | | | |
Balance as of December 31, 2012 | | | 2,550 | | | | 1,337 | | | | 841 | | | | 235 | | | | 4,963 | |
| |
Impairment losses on property and equipment are recorded within general and administrative expenses for the income statement.
In 2011 an impairment charge of€ 135 million on owner occupied property was taken for The Cosmopolitan of Las Vegas to reflect lower revenue expectations.
In the first quarter 2011 the Group headquarters in Frankfurt am Main previously accounted for as property and equipment was classified as held for sale. For further details on the assets held for sale please refer to Note 26 “Non-Current Assets and Disposal Groups Held for Sale”. For further information on the subsequent sale-and-leaseback transaction please refer to Note 24 “Leases”.
| | | | |
| Deutsche Bank | | 02 – Consolidated Financial Statements | | 331 |
| Financial Report 2012 | | Notes to the Consolidated Balance Sheet 24 – Leases | | |
| | |
| | | | |
| | |
| | | | |
The carrying value of items of property and equipment on which there is a restriction on sale was€ 181 million as of December 31, 2012.
Commitments for the acquisition of property and equipment were€ 27 million at year-end 2012.
24 –
Leases
The Group is lessee under lease arrangements covering property and equipment.
Finance Lease Commitments
Most of the Group’s finance lease arrangements are made under usual terms and conditions. The Group has one significant lease contract that includes a bargain purchase option to acquire the building at expiration of the leasing contract.
Net Carrying Value of Leasing Assets Held under finance leases
| | | | | | | | |
in€ m. | | Dec 31, 2012 | | | Dec 31, 2011 | |
Land and buildings | | | 90 | | | | 86 | |
Furniture and equipment | | | 2 | | | | 1 | |
Other | | | – | | | | 1 | |
| | | | | | | | |
Net carrying value | | | 92 | | | | 88 | |
| |
Future Minimum Lease Payments Required under the Group’s Finance Leases
| | | | | | | | |
in€ m. | | Dec 31, 2012 | | | Dec 31, 2011 | |
Future minimum lease payments: | | | | | | | | |
not later than one year | | | 10 | | | | 10 | |
later than one year and not later than five years | | | 37 | | | | 39 | |
later than five years | | | 10 | | | | 4 | |
| | | | | | | | |
Total future minimum lease payments | | | 57 | | | | 53 | |
| | | | | | | | |
less: Future interest charges | | | 15 | | | | 7 | |
| | | | | | | | |
Present value of finance lease commitments | | | 42 | | | | 46 | |
| | | | | | | | |
Future minimum lease payments to be received | | | 11 | | | | 14 | |
| | | | | | | | |
Contingent rent recognized in the income statement1 | | | 1 | | | | 1 | |
| |
| 1 | The contingent rent is based on market interest rates, such as three months EURIBOR; below a certain rate the Group receives a rebate. |
Operating Lease Commitments
The Group leases the majority of its offices and branches under long-term agreements. Most of the lease contracts are made under usual terms and conditions, which means they include options to extend the lease by a defined amount of time, price adjustment clauses and escalation clauses in line with general office rental market conditions. However the lease agreements do not include any clauses that impose any restriction on the Group’s ability to pay dividends, engage in debt financing transactions or enter into further lease agreements. The Group has one significant lease contract which contains five options to extend the lease each for a period of five years and there is no purchase option in this specific lease.
Future Minimum Lease Payments Required under the Group’s Operating Leases
| | | | | | | | |
in€ m. | | Dec 31, 2012 | | | Dec 31, 2011 | |
Future minimum rental payments: | | | | | | | | |
not later than one year | | | 880 | | | | 891 | |
later than one year and not later than five years | | | 2,426 | | | | 2,572 | |
later than five years | | | 1,745 | | | | 2,246 | |
| | | | | | | | |
Total future minimum rental payments | | | 5,051 | | | | 5,709 | |
| | | | | | | | |
less: Future minimum rentals to be received | | | 190 | | | | 204 | |
| | | | | | | | |
Net future minimum rental payments | | | 4,861 | | | | 5,505 | |
| |
| | | | |
| Deutsche Bank | | 02 – Consolidated Financial Statements | | 332 |
| Financial Report 2012 | | Notes to the Consolidated Balance Sheet 25 – Goodwill and Other Intangible Assets | | |
| | |
| | | | |
| | |
| | | | |
As of December 31, 2012 the total future minimum rental payments included€ 451 million for the Group headquarters in Frankfurt am Main that was sold and leased back on December 1, 2011. The Group entered into a 181 months leaseback arrangement for the entire facility in connection with the transaction.
In 2012, the rental payments for lease and sublease agreements amounted to€ 852 million. This included charges of€ 860 million for minimum lease payments and€ 22 million for contingent rents as well as€ 30 million related to sublease rentals received.
25 –
Goodwill and Other Intangible Assets
Goodwill
Changes in Goodwill
The changes in the carrying amount of goodwill, as well as gross amounts and accumulated impairment losses of goodwill, for the years ended December 31, 2012, and 2011, are shown below by cash-generating units (“CGU”). Following the re-organization of reportable business segments in the fourth quarter 2012 (for details, please refer to Note 05 “Business Segments and Related Information”), the Group’s former primary CGUs AM and PWM have been merged into one single CGU AWM. In addition, the former Corporate Division and primary CGU CI became part of the newly reportable NCOU Corporate Division, which comprises two separate CGUs labeled as Wholesale Assets and Operating Assets.
Goodwill allocated to cash-generating units
| | | | | | | | | | | | | | | | | | | | | | | | | | | | |
in€ m. | | Corporate
Banking &
Securities | | | Global
Transaction
Banking | | | Asset &
Wealth
Management | | | Private &
Business
Clients | | | Non-Core
Operations
Unit1 | | | Others | | | Total | |
Balance as of January 1, 2011 | | | 3,332 | | | | 487 | | | | 3,724 | | | | 3,025 | | | | – | | | | 194 | | | | 10,762 | |
| | | | | | | | | | | | | | | | | | | | | | | | | | | | |
Goodwill acquired during the year | | | – | | | | – | | | | 25 | | | | – | | | | – | | | | – | | | | 25 | |
| | | | | | | | | | | | | | | | | | | | | | | | | | | | |
Purchase accounting adjustments | | | – | | | | (11) | | | | – | | | | 45 | | | | – | | | | – | | | | 34 | |
| | | | | | | | | | | | | | | | | | | | | | | | | | | | |
Transfers | | | 44 | | | | (44) | | | | – | | | | – | | | | – | | | | – | | | | – | |
| | | | | | | | | | | | | | | | | | | | | | | | | | | | |
| Reclassification from (to) ‘held for sale’ | | | (4) | | | | – | | | | – | | | | (5) | | | | – | | | | – | | | | (9) | |
| | | | | | | | | | | | | | | | | | | | | | | | | | | | |
| Goodwill related to dispositions without being classified as ‘held for sale’ | | | – | | | | – | | | | – | | | | – | | | | – | | | | – | | | | – | |
| | | | | | | | | | | | | | | | | | | | | | | | | | | | |
Impairment losses2 | | | – | | | | – | | | | – | | | | – | | | | – | | | | – | | | | – | |
| | | | | | | | | | | | | | | | | | | | | | | | | | | | |
Exchange rate changes/other | | | 81 | | | | 8 | | | | 68 | | | | 1 | | | | – | | | | 3 | | | | 161 | |
| | | | | | | | | | | | | | | | | | | | | | | | | | | | |
Balance as of December 31, 2011 | | | 3,453 | | | | 440 | | | | 3,817 | | | | 3,066 | | | | – | | | | 197 | | | | 10,973 | |
| | | | | | | | | | | | | | | | | | | | | | | | | | | | |
Gross amount of goodwill | | | 3,453 | | | | 440 | | | | 3,817 | | | | 3,066 | | | | 230 | | | | 692 | | | | 11,698 | |
| | | | | | | | | | | | | | | | | | | | | | | | | | | | |
Accumulated impairment losses | | | – | | | | – | | | | – | | | | – | | | | (230) | | | | (495) | | | | (725) | |
| | | | | | | | | | | | | | | | | | | | | | | | | | | | |
Balance as of January 1, 2012 | | | 3,453 | | | | 440 | | | | 3,817 | | | | 3,066 | | | | – | | | | 197 | | | | 10,973 | |
| | | | | | | | | | | | | | | | | | | | | | | | | | | | |
Goodwill acquired during the year | | | – | | | | – | | | | – | | | | – | | | | – | | | | – | | | | – | |
| | | | | | | | | | | | | | | | | | | | | | | | | | | | |
Purchase accounting adjustments | | | – | | | | – | | | | – | | | | – | | | | – | | | | – | | | | – | |
| | | | | | | | | | | | | | | | | | | | | | | | | | | | |
Transfers | | | (279) | | | | – | | | | 189 | | | | (331) | | | | 421 | | | | – | | | | – | |
| | | | | | | | | | | | | | | | | | | | | | | | | | | | |
| Reclassification from (to) ‘held for sale’ | | | – | | | | (1) | | | | (1) | | | | – | | | | – | | | | – | | | | (2) | |
| | | | | | | | | | | | | | | | | | | | | | | | | | | | |
| Goodwill related to dispositions without being classified as ‘held for sale’ | | | (1) | | | | – | | | | – | | | | – | | | | – | | | | – | | | | (1) | |
| | | | | | | | | | | | | | | | | | | | | | | | | | | | |
Impairment losses2 | | | (1,174) | | | | – | | | | – | | | | – | | | | (421) | | | | – | | | | (1,595) | |
| | | | | | | | | | | | | | | | | | | | | | | | | | | | |
Exchange rate changes/other | | | (46) | | | | (7) | | | | (26) | | | | 1 | | | | – | | | | – | | | | (78) | |
| | | | | | | | | | | | | | | | | | | | | | | | | | | | |
Balance as of December 31, 2012 | | | 1,953 | | | | 432 | | | | 3,979 | | | | 2,736 | | | | – | | | | 197 | | | | 9,297 | |
| | | | | | | | | | | | | | | | | | | | | | | | | | | | |
Gross amount of goodwill | | | 3,127 | | | | 432 | | | | 3,979 | | | | 2,736 | | | | 651 | | | | 684 | | | | 11,609 | |
| | | | | | | | | | | | | | | | | | | | | | | | | | | | |
Accumulated impairment losses | | | (1,174) | | | | – | | | | – | | | | – | | | | (651) | | | | (487) | | | | (2,312) | |
| |
| 1 | Includes primary CGUs NCOU Wholesale Assets and NCOU Operating Assets. |
| 2 | Impairment losses of goodwill are recorded as impairment of intangible assets in the income statement. |
In addition to the primary CGUs, the segments CB&S and NCOU carry goodwill resulting from the acquisition of nonintegrated investments which are not allocated to the respective segments’ primary CGUs. Such goodwill is summarized as “Others” in the table above. The nonintegrated investments in the NCOU consist of Maher Terminals LLC and Maher Terminals of Canada Corp.
| | | | |
| Deutsche Bank | | 02 – Consolidated Financial Statements | | 333 |
| Financial Report 2012 | | Notes to the Consolidated Balance Sheet 25 – Goodwill and Other Intangible Assets | | |
| | |
| | | | |
| | |
| | | | |
In 2012, goodwill changes mainly included impairments of€ (1,595) million recorded in the fourth quarter as a result of the annual goodwill impairment test conducted under the organizational structures both prior to as well as post re-segmentation (for details, please refer to the following section “Goodwill Impairment Test”). In the course of the re-segmentation, a number of businesses were transferred to AWM and to the two NCOU CGUs. Accordingly, goodwill of€ 182 million was reallocated from CB&S to AWM (transfer of the ETF business). Prior to the NCOU impairment, goodwill of€ 369 million had been reallocated to Wholesale Assets (€ 97 million from CB&S and€ 272 million from PBC) and€ 52 million to Operating Assets (from PBC). Furthermore, upon the sale of Postbank’s Asset Management business to the DWS Group in the third quarter 2012, goodwill of€ 7 million was transferred from PBC to AWM.
In 2011, additions to goodwill of€ 25 million related to the step-acquisition of the outstanding interests in Deutsche UFG Capital Management in November 2011. Purchase accounting adjustments recorded against goodwill in 2011 amounted to a net€ 34 million, mainly from refinements of€ 45 million in connection with the finalization of the acquisition accounting for Deutsche Postbank AG (“Postbank”; PBC) and€ (11) million from the conclusion of a contingent purchase consideration payment related to the full acquisition of Deutsche Bank HedgeWorks (GTB) in 2008. With the change in management responsibility for the former Capital Markets Sales business unit in the third quarter 2011 (see Note 05 “Business Segments and Related Information”), goodwill of€ 44 million related to this business was transferred from GTB to CB&S.
Goodwill Impairment Test
For the purposes of impairment testing, goodwill acquired in a business combination is allocated to CGUs. On the basis as described in Note 01 “Significant Accounting Policies”, the Group’s primary CGUs are as outlined above. “Other” goodwill is tested individually for impairment on the level of each of the nonintegrated investments. Goodwill is tested for impairment annually in the fourth quarter by comparing the recoverable amount of each goodwill carrying CGU with its carrying amount. In addition, in accordance with IAS 36, the Group tests goodwill whenever a triggering event is identified. The recoverable amount is the higher of a CGU’s fair value less costs to sell and its value in use.
The carrying amount of a primary CGU is derived using a capital allocation model. The allocation uses the Group’s total equity at the date of valuation. Total equity is adjusted for specific effects related to nonintegrated investments, which are tested separately for impairment as outlined above, and for an add-on adjustment for goodwill attributable to noncontrolling interests. This total carrying amount is allocated to the primary CGUs in a two-step process. In the first step, total equity that is readily identifiable is allocated to the respective individual CGUs. This includes goodwill (plus the add-on adjustment for noncontrolling interests), unamortized other intangible assets as well as certain unrealized net gains and losses recorded directly in equity and noncontrolling interests. In the second step, the remaining balance of the total carrying amount is allocated across the CGUs based on the CGU’s share of risk-weighted assets and certain capital deduction items relative to the Group (each is adjusted for items pertaining to nonintegrated investments). The carrying amount for nonintegrated investments is determined on the basis of their respective equity.
As a result of the Group’s re-segmentation during the fourth quarter 2012 (see Note 05 “Business Segments and Related Information – Business Segments” for details), the annual impairment test had to be conducted both in the structure prior to re-segmentation (“old structure”) and post re-segmentation (“new structure”).
| | | | |
| Deutsche Bank | | 02 – Consolidated Financial Statements | | 334 |
| Financial Report 2012 | | Notes to the Consolidated Balance Sheet 25 – Goodwill and Other Intangible Assets | | |
| | |
| | | | |
| | |
| | | | |
The annual goodwill impairment tests in 2012 resulted in goodwill impairments totaling€ 1,595 million, consisting of€ 1,174 million in the CGU CB&S under the old structure and of€ 421 million in the CGUs Wholesale Assets (€ 369 million) and Operating Assets (€ 52 million) within the Corporate Division NCOU under the new structure.
Sensitivity of impairment in CB&S (old structure) to certain key assumptions
| | | | |
in€ bn. | | Goodwill
impairment | |
Recorded impairment loss | | | 1.2 | |
| | | | |
Discount rate (post tax) | | | | |
Adverse Change (+25 basis points) | | | 2.4 | |
Positive Change (–25 basis points) | �� | | no impairment | |
| | | | |
Long term growth rates | | | | |
Adverse Change (–25 basis points) | | | 1.5 | |
Positive Change (+25 basis points) | | | 0.8 | |
| | | | |
Projected future earnings | | | | |
Adverse Change (–5 %) | | | 3.3 | |
Positive Change (+5 %) | | | no impairment | |
| |
The impairment in CB&S (old structure) was mainly due to an increase in the discount rate, lower earnings projections as a result of a muted market outlook and certain extraordinary items expected in the short to medium term, leading to more conservative revenue growth assumptions, partially offset by planned cost savings. The impairment was determined under the value in use concept using a discounted cash flow (“DCF”) model employing a pre-tax discount rate of 15.0 %, which was determined implicitly based on a post-tax rate of 11.1 %. As CB&S under the old structure included assets subsequently allocated to the CGU NCOU Wholesale Assets, the description of key assumptions, management’s approach to determining the values assigned to key assumptions as well as the uncertainty associated with key assumptions and potential events/circum-stances that could have a negative effect mentioned in the below table for NCOU Wholesale Assets, also apply to CB&S under the old structure. Similarly, the key assumptions for all other primary CGUs under the old structure can be obtained from the key assumptions table for CGUs under the new structure and taking re-segmentation into consideration.
After the impairment test in the old structure, goodwill was reallocated to the CGUs under the new structure applying the concept of relative values for those groups that were identified as businesses in line with IFRS 3. The impairments in the CGUs Wholesale Assets and Operating Assets within the Corporate Division NCOU (new structure) occurred immediately and resulted from overall negative earnings projections as part of the Group’s stated objective of accelerated de-risking of non-core activities. Both impairments were determined under the value in use concept using a DCF model and reflect key assumptions as mentioned below under “key assumptions and sensitivities”. Management believes that no reasonable possible changes in key assumptions would have materially impacted the impairments of goodwill in NCOU Wholesale Assets and Operating Assets under the new structure.
The annual goodwill impairment tests in 2011 and 2010 did not result in an impairment loss of goodwill of the Group’s primary CGUs as the recoverable amounts for these CGUs were higher than their respective carrying amounts.
| | | | |
| Deutsche Bank | | 02 – Consolidated Financial Statements | | 335 |
| Financial Report 2012 | | Notes to the Consolidated Balance Sheet 25 – Goodwill and Other Intangible Assets | | |
| | |
| | | | |
| | |
| | | | |
Recoverable Amount
The Group determines the recoverable amount of its primary CGUs on the basis of value in use and employing a DCF model, which reflects the specifics of the banking business and its regulatory environment. The model calculates the present value of the estimated future earnings that are distributable to shareholders after fulfilling the respective regulatory capital requirements.
The DCF model uses earnings projections and respective capitalization assumptions (with a Core Tier 1 ratio increasing to 10 %) based on five-year financial plans agreed by management and are discounted to their present value. Estimating future earnings and capital requirements involves judgment and the consideration of past and current performances as well as expected developments in the respective markets, and in the overall macroeconomic and regulatory environments. Earnings projections beyond the initial five-year period are, where applicable, adjusted to derive a sustainable level and are, in case of a going concern, assumed to increase by or converge towards a constant long-term growth rate of 3.6 % (2011: 3.6 %). This is based on expectations for the development of gross domestic product and inflation, and are captured in the terminal value.
Key Assumptions and Sensitivities
Key Assumptions: The value in use of a CGU is sensitive to the earnings projections, to the discount rate applied and, to a much lesser extent, to the long-term growth rate. The discount rates applied have been determined based on the capital asset pricing model and comprise a risk-free interest rate, a market risk premium and a factor covering the systematic market risk (beta factor). The values for the risk-free interest rate, the market risk premium and the beta factors are determined using external sources of information. CGU-specific beta factors are determined based on a respective group of peer companies. Variations in all of these components might impact the calculation of the discount rates.
Primary cash-generating units
| | | | | | | | |
| | | Discount rate (pre-tax, determined
implicitly based on post-tax rates) | |
| | 2012 | | | 2011 | |
Corporate Banking & Securities | | | 15.4% | | | | 14.3% | |
Global Transaction Banking | | | 12.6% | | | | 12.1% | |
Asset & Wealth Management | | | 12.7% | | | | N/M1 | |
Private & Business Clients | | | 14.8% | | | | 13.5% | |
Non-Core Operations Unit2 | | | 13.7%/15.8% | | | | N/M | |
| |
N/M – Not meaningful
| 1 | Respective pre-tax discount rates were in 2012 for AWM in old structure 12.7 % (2011: 12.5 %) and for PWM in old structure 12.1 % (2011: 11.9 %). |
| 2 | Comprises of two primary CGUs: NCOU Wholesale Assets (13.7 %) and NCOU Operating Assets (15.8 %). Stated pre-tax discount rates assume worst case post-tax valuation scenarios, whereas both CGUs are valued applying identical post-tax discount rates. Varying pre-tax rates are due to different cash-flow composition and pattern. |
| | | | |
| Deutsche Bank | | 02 – Consolidated Financial Statements | | 336 |
| Financial Report 2012 | | Notes to the Consolidated Balance Sheet 25 – Goodwill and Other Intangible Assets | | |
| | |
| | | | |
| | |
| | | | |
| | | | | | |
Primary cash-generating unit | | Description of key assumptions | | Management’s approach to determining the values assigned to key assumptions | | Uncertainty associated with key assumptions and potential events/ circumstances that could have a negative effect |
| Corporate Banking & Securities | | - Reap benefits from efficiency and cost reduction program announced and launched in 2012 - Capitalize on synergies with other areas of the organization - Focus on client flows and solutions, benefiting from leading client market shares and higher customer penetration - Corporate Finance fee pools and Sales & Trading revenue pools increase slowly, as volatility recedes and economic growth stabilizes - Sustained asset efficiency under new regulatory framework and rigorously managed risk exposure - Continued targeted risk reductions and execution of management action to mitigate the impact of regulatory change | | - The key assumptions have been based on a combination of internal and external studies (consulting firms, research) - Management estimates concerning efficiency and cost reduction program based on progress made to date across various initiatives | | - Potentially weaker macroeconomic environment due to protracted sovereign debt crisis and potential contagion risk leading to slowdown in activity and reduced investor appetite - Structure and content of a range of regulatory changes being drafted in various jurisdictions could have a more severe impact than anticipated - Potential margin compression and increased competition in products with lower capital requirements beyond expected levels - Outcome of litigation cases - Cost savings and expected benefits from Group-wide Operational Excellence Program (OpEx) are not realized as anticipated - Delay in execution of risk mitigation strategies |
| | | | | | |
| Global Transaction Banking | | - Cost savings in light of Group-wide OpEx - Capitalize on synergies resulting from closer co-operation with other areas of the bank - Moderate macroeconomic recovery - Persisting low interest rate levels - Positive development of international trade volumes, cross-border payments and corporate actions - Deepening relationships with Complex Corporates and Institutional Clients in existing regions while pushing further growth in Emerging Markets - Successful turn-around of the commercial banking activities in the Netherlands | | - The key assumptions have been based on a combination of internal and external sources - Macroeconomic trends are supported by studies while internal plans and impact from efficiency initiatives have been based on management assumptions | | - Slowdown of the world economy and continued sovereign debt crisis and its impact on trade volumes, interest rates and foreign exchange rates - Unfavorable margin development and adverse competition levels in key markets and products beyond expected levels - Uncertainty around regulation and its potential implications not yet anticipated - Cost savings in light of Group-wide OpEx do not materialize as anticipated - Outcome of potential legal matters - Benefits from the turn-around measures of the commercial banking activities in the Netherlands are not realized as expected |
| | | | | | |
| Asset & Wealth Management | | - Cost savings in light of Group-wide OpEx and AWM platform optimization from merger of AM, PWM and Passive CB&S to form AWM - Expanding business with ultra high net worth clients - Building out the alternatives and passive/ETF businesses - Home market leadership in Germany through PWM and DWS - Strong coverage of emerging markets - Organic growth strategy in Asia/Pacific and Americas as well as intensified co-operation with CB&S and GTB - Maintained or increased market share in the fragmented competitive environment - AWM’s overall internal strategy continuously driven by - Wealth creation and activation, - Growth of the retirement market, - Insurance outsourcing, - New packaging innovation, - Institutionalization of alternatives, - Separation of alpha and beta, - Climate Change and sustainable investing | | - The key assumptions have been based on a combination of internal and external sources - Macroeconomic data and market data based on DB Research forecasts - Management estimates concerning AWM integration and cost reduction program based on progress made to date across various initiatives and review of duplication | | - Major industry threats, i.e. market volatility, European sovereign debt crisis, increasing costs from regulatory changes - Investors continue to hold assets out of the markets, retreat to cash or simpler, lower fee products - Business/execution risks, i.e. under achievement of 2013 net new money targets if European sovereign debt crisis affects Deutsche Bank’s stability, loss of high quality relationship managers - Difficulties in executing organic growth strategies through certain restrictions, e.g. unable to hire relationship managers - Cost savings following efficiency gains and expected IT/process improvements are not achieved to the extent planned - Uncertainty around regulation and its potential implications not yet anticipated - Potential impact from strategic review of certain parts of the business |
|
| | | | |
| Deutsche Bank | | 02 – Consolidated Financial Statements | | 337 |
| Financial Report 2012 | | Notes to the Consolidated Balance Sheet 25 – Goodwill and Other Intangible Assets | | |
| | |
| | | | |
| | |
| | | | |
| | | | | | |
Primary cash-generating unit | | Description of key assumptions | | Management’s approach to determining the values assigned to key assumptions | | Uncertainty associated with key assumptions and potential events/ circumstances that could have a negative effect |
| Private & Business Clients | | - Cost savings in light of Group-wide OpEx - Leading position in home market Germany, strong position in other European markets and growth options in key Asian countries - Achievement of synergies between Deutsche Bank and Postbank on the revenue and the cost side - Market share gains in Germany using the strong advisory proposition - Leveraging stake in and cooperation with Hua Xia Bank in China and further organic growth in India | | - The key assumptions have been based on a combination of internal and external sources - All assumptions regarding PBC’s future development are supported by respective projects and initiatives - All initiatives were based on a business case developed by management validated by internal and external data | | - Significant economic decline potentially resulting in higher unemployment rates, increasing credit loss provisions and lower business growth - Continued low interest rates - Synergies related to Postbank acquisition are not realized or are realized later than foreseen - Costs to achieve the synergies are higher than foreseen |
| | | | | | |
| Non-Core Operations Unit Wholesale Assets | | - Continued execution of successful de-risking program - Continued capitalization of other divisions sales and distribution networks to facilitate successful de-risking program | | - The key assumptions have been based on a combination of internal and external studies (consulting firms, research) - Management estimates concerning the timing and quantum of disposal costs | | - Potentially weaker macroeconomic environment due to protracted sovereign debt crisis and potential contagion risk leading to slowdown in activity and reduced ability to de-risk at an economically viable level - Structure and content of a range of regulatory changes being drafted in various jurisdictions could have a more severe impact than anticipated - Outcome of litigation cases |
| | | | | | |
| Non-Core Operations Unit Operating Assets | | - Continued efforts to improve the underlying performance of operating assets in preparation for eventual sale | | - The key assumptions have been based on a combination of internal and external studies (consulting firms, research) - Management estimates concerning the timing and quantum of future sale of operating assets | | - Potentially weaker macroeconomic environment due to protracted sovereign debt crisis and potential contagion risk leading to slowdown in activity and reduced ability to dispose of operating assets at an economically viable level - Outcome of litigation cases |
|
Sensitivities: In validating the value in use determined for the CGUs, certain external factors as well as the major value drivers of each CGU are reviewed regularly. Throughout 2012, share prices of banking stocks continued to be volatile, suffering from the pronounced uncertainty of market participants. In this environment, Deutsche Bank’s market capitalization remained below book value. In order to test the resilience of the value in use, key assumptions used in the DCF model (for example, the discount rate and the earnings projections) are sensitized. Management believes that the only CGUs where reasonable possible changes in key assumptions could cause an impairment loss in new structure were CB&S and PBC, for which the recoverable amount exceeded the respective carrying amount by 45 % or€ 9.1 billion (CB&S) and 21 % or€ 2.9 billion (PBC).
Change in certain key assumptions to cause the recoverable to equal the carrying amount
| | | | | | | | |
Change in Key Assumptions | | CB&S | | | PBC | |
Discount rate (post tax) increase from/to | | | 11.1%/13.7% | | | | 10.8%/12.1% | |
| | | | | | | | |
Projected future earnings in each period | | | (21)% | | | | (13)% | |
| | | | | | | | |
Long term growth rates | | | N/M1 | | | | N/M1 | |
| |
| 1 | A rate of 0 % would still lead to a recoverable amount in excess of the carrying amount. |
The recoverable amounts of all remaining primary CGUs were substantially in excess of their respective carrying amounts. A triggering event review as of December 31, 2012 confirmed that there was no indication that the remaining goodwill of the primary CGUs might be impaired.
However, certain political or global risks for the banking industry such as a further escalation of the European sovereign debt crisis, uncertainties regarding the implementation of already adopted regulation and the introduction of legislation that is already under discussion as well as a prospective slowdown of GDP growth may negatively impact the performance forecasts of certain of the Group’s CGUs and, thus, could result in an impairment of goodwill in the future.
| | | | |
| Deutsche Bank | | 02 – Consolidated Financial Statements | | 338 |
| Financial Report 2012 | | Notes to the Consolidated Balance Sheet 25 – Goodwill and Other Intangible Assets | | |
| | |
| | | | |
| | |
| | | | |
Other Intangible Assets
The changes of other intangible assets by asset classes for the years ended December 31, 2012, and 2011, are as follows.
| | | | | | | | | | | | | | | | | | | | | | | | | | | | | | | | | | | | | | | | |
| | | Purchased intangible assets | | | Internally
generated
intangible
assets | | | Total
other
intan-
gible
assets | |
| | | Unamortized | | | Amortized | | | Amortized | | | | |
in€ m. | | Retail
investment
management
agreements | | | Other | | | Total
unamortized
purchased
intangible
assets | | | Customer-
related
intangible
assets | | | Value of
business
acquired | | | Contract-
based
intangible
assets | | | Software
and
other | | | Total
amortized
purchased
intangible
assets | | | Software | | | | |
Cost of acquisition/ manufacture: | | | | | | | | | | | | | | | | | | | | | | | | | | | | | | | | | | | | | | | | |
| | | | | | | | | | | | | | | | | | | | | | | | | | | | | | | | | | | | | | | | |
| Balance as of January 1, 2011 | | | 870 | | | | 418 | | | | 1,288 | | | | 1,689 | | | | 780 | | | | 763 | | | | 857 | | | | 4,089 | | | | 955 | | | | 6,332 | |
| | | | | | | | | | | | | | | | | | | | | | | | | | | | | | | | | | | | | | | | |
| Additions | | | – | | | | 4 | | | | 4 | | | | 30 | | | | 10 | | | | 37 | | | | 28 | | | | 105 | | | | 476 | | | | 585 | |
| Changes in the group of consolidated companies | | | – | | | | 29 | | | | 29 | | | | (247) | | | | – | | | | 32 | | | | – | | | | (215) | | | | (26) | | | | (212) | |
| Disposals | | | – | | | | 1 | | | | 1 | | | | – | | | | – | | | | 1 | | | | 11 | | | | 12 | | | | 11 | | | | 24 | |
| Reclassifications from (to) ‘held for sale’ | | | – | | | | – | | | | – | | | | 26 | | | | – | | | | (165) | | | | 33 | | | | (106) | | | | 6 | | | | (100) | |
| Transfers | | | – | | | | (3) | | | | (3) | | | | – | | | | – | | | | 12 | | | | (3) | | | | 9 | | | | 13 | | | | 19 | |
| Exchange rate changes | | | 24 | | | | (1) | | | | 23 | | | | (2) | | | | 24 | | | | 20 | | | | 5 | | | | 47 | | | | 12 | | | | 82 | |
| | | | | | | | | | | | | | | | | | | | | | | | | | | | | | | | | | | | | | | | |
| Balance as of December 31, 2011 | | | 894 | | | | 446 | | | | 1,340 | | | | 1,496 | | | | 814 | | | | 698 | | | | 909 | | | | 3,917 | | | | 1,425 | | | | 6,682 | |
| | | | | | | | | | | | | | | | | | | | | | | | | | | | | | | | | | | | | | | | |
| Additions | | | – | | | | – | | | | – | | | | 22 | | | | 12 | | | | – | | | | 43 | | | | 77 | | | | 705 | | | | 782 | |
| Changes in the group of consolidated companies | | | – | | | | – | | | | – | | | | – | | | | – | | | | – | | | | – | | | | – | | | | – | | | | – | |
| Disposals | | | – | | | | – | | | | – | | | | – | | | | – | | | | – | | | | 23 | | | | 23 | | | | 18 | | | | 41 | |
| Reclassifications from (to) ‘held for sale’ | | | – | | | | – | | | | – | | | | – | | | | – | | | | – | | | | (1) | | | | (1) | | | | – | | | | (1) | |
| Transfers | | | – | | | | (4) | | | | (4) | | | | – | | | | – | | | | – | | | | 16 | | | | 16 | | | | 153 | | | | 165 | |
| Exchange rate changes | | | (16) | | | | (2) | | | | (18) | | | | 1 | | | | 22 | | | | (12) | | | | (6) | | | | 5 | | | | (4) | | | | (17) | |
| | | | | | | | | | | | | | | | | | | | | | | | | | | | | | | | | | | | | | | | |
| Balance as of December 31, 2012 | | | 878 | | | | 440 | | | | 1,318 | | | | 1,519 | | | | 848 | | | | 686 | | | | 938 | | | | 3,991 | | | | 2,261 | | | | 7,570 | |
| | | | | | | | | | | | | | | | | | | | | | | | | | | | | | | | | | | | | | | | |
| Accumulated amortization and impairment: | | | | | | | | | | | | | | | | | | | | | | | | | | | | | | | | | | | | | | | | |
| | | | | | | | | | | | | | | | | | | | | | | | | | | | | | | | | | | | | | | | |
| Balance as of January 1, 2011 | | | 96 | | | | 1 | | | | 97 | | | | 401 | | | | 104 | | | | 157 | | | | 406 | | | | 1,068 | | | | 334 | | | | 1,499 | |
| | | | | | | | | | | | | | | | | | | | | | | | | | | | | | | | | | | | | | | | |
| Amortization for the year | | | – | | | | – | | | | – | | | | 117 | | | | 22 | | | | 40 | | | | 122 | | | | 301 | | | | 85 | | | | 386 | 1 |
| Changes in the group of consolidated companies | | | – | | | | – | | | | – | | | | – | | | | – | | | | – | | | | (7) | | | | (7) | | | | (6) | | | | (13) | |
| Disposals | | | – | | | | – | | | | – | | | | – | | | | – | | | | – | | | | 9 | | | | 9 | | | | 7 | | | | 16 | |
| Reclassifications from (to) ‘held for sale’ | | | – | | | | – | | | | – | | | | 22 | | | | – | | | | (97) | | | | 27 | | | | (48) | | | | 5 | | | | (43) | |
| Impairment losses | | | – | | | | 2 | | | | 2 | | | | – | | | | – | | | | – | | | | – | | | | – | | | | – | | | | 2 | 2 |
| Reversals of impairment losses | | | – | | | | – | | | | – | | | | – | | | | – | | | | – | | | | – | | | | – | | | | – | | | | – | |
| Transfers | | | – | | | | – | | | | – | | | | (1) | | | | – | | | | 1 | | | | (36) | | | | (36) | | | | 41 | | | | 5 | |
| Exchange rate changes | | | 3 | | | | (1) | | | | 2 | | | | 2 | | | | 4 | | | | 6 | | | | 7 | | | | 19 | | | | 12 | | | | 33 | |
| | | | | | | | | | | | | | | | | | | | | | | | | | | | | | | | | | | | | | | | |
| Balance as of December 31, 2011 | | | 99 | | | | 2 | | | | 101 | | | | 541 | | | | 130 | | | | 107 | | | | 510 | | | | 1,288 | | | | 464 | | | | 1,853 | |
| | | | | | | | | | | | | | | | | | | | | | | | | | | | | | | | | | | | | | | | |
| Amortization for the year | | | – | | | | – | | | | – | | | | 114 | | | | 31 | | | | 37 | | | | 100 | | | | 282 | | | | 174 | | | | 456 | 3 |
| Changes in the group of consolidated companies | | | – | | | | – | | | | – | | | | – | | | | – | | | | – | | | | – | | | | – | | | | – | | | | – | |
| Disposals | | | – | | | | – | | | | – | | | | – | | | | – | | | | – | | | | 20 | | | | 20 | | | | 16 | | | | 36 | |
| Reclassifications from (to) ‘held for sale’ | | | – | | | | – | | | | – | | | | – | | | | – | | | | – | | | | (1) | | | | (1) | | | | – | | | | (1) | |
| Impairment losses | | | 202 | | | | 2 | | | | 204 | | | | 86 | | | | – | | | | – | | | | 3 | | | | 89 | | | | 95 | | | | 388 | 4 |
| Reversals of impairment losses | | | – | | | | – | | | | – | | | | – | | | | – | | | | – | | | | – | | | | – | | | | – | | | | – | |
| Transfers | | | – | | | | – | | | | – | | | | (1) | | | | – | | | | – | | | | 11 | | | | 10 | | | | (2) | | | | 8 | |
| Exchange rate changes | | | (1) | | | | (2) | | | | (3) | | | | 1 | | | | 3 | | | | (2) | | | | (11) | | | | (9) | | | | (8) | | | | (20) | |
| | | | | | | | | | | | | | | | | | | | | | | | | | | | | | | | | | | | | | | | |
| Balance as of December 31, 2012 | | | 300 | | | | 2 | | | | 302 | | | | 741 | | | | 164 | | | | 142 | | | | 592 | | | | 1,639 | | | | 707 | | | | 2,648 | |
| | | | | | | | | | | | | | | | | | | | | | | | | | | | | | | | | | | | | | | | |
| Carrying amount: | | | | | | | | | | | | | | | | | | | | | | | | | | | | | | | | | | | | | | | | |
| | | | | | | | | | | | | | | | | | | | | | | | | | | | | | | | | | | | | | | | |
| As of December 31, 2011 | | | 795 | | | | 444 | | | | 1,239 | | | | 955 | | | | 684 | | | | 591 | | | | 399 | | | | 2,629 | | | | 961 | | | | 4,829 | |
| | | | | | | | | | | | | | | | | | | | | | | | | | | | | | | | | | | | | | | | |
| As of December 31, 2012 | | | 578 | | | | 438 | | | | 1,016 | | | | 778 | | | | 684 | | | | 544 | | | | 346 | | | | 2,352 | | | | 1,554 | | | | 4,922 | |
| |
| 1 | Of which€ 380 million were included in general and administrative expenses and€ 6 million were recorded in commissions and fee income. The latter related to the amortization of mortgage servicing rights. |
| 2 | In 2011, impairments on unamortized intangible assets reflected a charge of€ 2 million recorded in CB&S. The impairment related to the write-down of permits for a renewable energy investment. |
| 3 | The€ 456 million were included in general and administrative expenses. |
| 4 | Of which€ 291 million were included in impairment of intangible assets, consisting of impairments of retail management agreements (€ 202 million), customer-related intangible assets (€ 86 million) and trademarks (€ 2 million). Furthermore,€ 96 million of impairments related to purchased (€ 1 million) and self-developed software (€ 95 million) were recorded in general and administrative expenses. |
| | | | |
| Deutsche Bank | | 02 – Consolidated Financial Statements | | 339 |
| Financial Report 2012 | | Notes to the Consolidated Balance Sheet 25 – Goodwill and Other Intangible Assets | | |
| | |
| | | | |
| | |
| | | | |
Amortized Intangible Assets
In 2012, additions to internally-generated intangible assets of€ 705 million represent the capitalization of expenses incurred in conjunction with the Group’s activities related to the development of internally generated software. Impairments recorded on customer-related intangible assets totaling€ (86) million included€ (73) million in connection with measures initiated in the fourth quarter 2012 to turnaround the acquired commercial banking activities in the Netherlands (GTB) and€ (13) million related to the realignment of PBC’s Consumer Banking proposition. The impairment of self-developed software of€ (95) million was mainly the result of changes in the planned deployment of an IT system in AWM.
In 2011, additions to amortized purchased intangible assets of€ 105 million mainly included capitalized payments pertaining to new servicing arrangements related to the Group’s depository receipts programs (customer-related intangible assets of€ 30 million), capitalized expenses for purchased software (€ 28 million) and deferred policy acquisition costs (€ 10 million) related to incremental costs of acquiring investment management contracts which are commissions payable to intermediaries and business counterparties of the Group’s insurance business (see Note 39 “Insurance and Investment Contracts”). Furthermore, the capitalization of expenses incurred in relation to the Group’s activities related to the development of internally generated software (€ 476 million) contributed to the increase of this intangible asset category.
Changes in the group of consolidated companies in 2011 mainly related to the finalization of the purchase price allocation for the acquisition of Postbank which resulted in net refinements of€ (200) million reflected in several classes of other intangible assets. These included adjustments to customer-related amortizing intangible assets of€ (247) million, mainly representing refinements to customer relationships. Further adjustments related to internally developed software (€ (20) million), beneficial contracts (€ 32 million) and trademarks (net€ 35 million, thereof€ 29 million related to the Postbank trademark which is classified as unamortized other intangible asset).
In 2010, impairments recorded on other intangible assets of€ 41 million included a charge of€ 29 million relating to the client portfolio of an acquired domestic custody services business recorded in GTB and a loss of€ 12 million recorded in the retirement of purchased software included in AWM.
Other intangible assets with finite useful lives are generally amortized over their useful lives based on the straight-line method (except for the VOBA, as explained in Note 01 “Significant Accounting Policies” and Note 39 “Insurance and Investment Contracts”).
Useful lives of other amortized intangible assets by asset class
| | | | |
| | Useful lives in
years | |
Internally generated intangible assets: | | | | |
Software | | | up to 10 | |
| | | | |
Purchased intangible assets: | | | | |
Customer-related intangible assets | | | up to 25 | |
Contract-based intangible assets | | | up to 23 | |
Value of business acquired | | | up to 30 | |
Other | | | up to 80 | |
| |
Unamortized Intangible Assets
Within this asset class, the Group recognizes certain contract-based and marketing-related intangible assets, which are deemed to have an indefinite useful life.
In particular, the asset class comprises the below detailed investment management agreements related to retail mutual funds and certain trademarks. Due to the specific nature of these intangible assets, market prices are ordinarily not observable and, therefore, the Group values such assets based on the income approach, using a post-tax DCF-methodology.
| | | | |
| Deutsche Bank | | 02 – Consolidated Financial Statements | | 340 |
| Financial Report 2012 | | Notes to the Consolidated Balance Sheet 26 – Non-Current Assets and Disposal Groups Held for Sale | | |
| | |
| | | | |
| | |
| | | | |
Retail investment management agreements: These assets, amounting to€ 578 million, relate to the Group’s U.S. retail mutual fund business and is allocated to the AWM CGU. Retail investment management agreements are contracts that give DWS Investments the exclusive right to manage a variety of mutual funds for a specified period. Since these contracts are easily renewable, the cost of renewal is minimal, and they have a long history of renewal, these agreements are not expected to have a foreseeable limit on the contract period. Therefore, the rights to manage the associated assets under management are expected to generate cash flows for an indefinite period of time. This intangible asset was recorded at fair value based upon a valuation provided by a third party at the date of the Group’s acquisition of Zurich Scudder Investments, Inc. in 2002.
In 2012, a loss of€ 202 million was recognized in the income statement as impairment of intangible assets. The impairment loss was predominantly due to declines in the expected development of invested asset flows, considering historical growth trends and impacts from the strategic review of the business conducted in 2012 as well as the competitive environment. In 2011, which also considered the then-announced strategic review of certain parts of the AM business, and 2010, there were no impairments as the recoverable amounts exceeded its carrying amount. The recoverable amount of the asset was calculated as fair value less costs to sell using the multi-period excess earnings method.
Trademarks: The other unamortized intangible assets include the Postbank (allocated to CGU PBC) and the Sal. Oppenheim (allocated to CGU AWM) trademarks, which were acquired in 2010. The Postbank trademark was initially recognised in 2010 at€ 382 million. In finalizing the purchase price allocation in 2011, the fair value of the Postbank trademark increased to€ 411 million. The Sal. Oppenheim trademark was recognised at€ 27 million. Since both trademarks are expected to generate cash flows for an indefinite period of time, they are classified as unamortized intangible assets. Both trademarks were recorded at fair value at the acquisition date, based on third party valuations. Subsequent impairment reviews calculated the fair value less costs to sell of the trademarks based on the income approach using the relief-from-royalty method. Since acquisition, there have been no impairments.
26 –
Non-Current Assets and Disposal Groups Held for Sale
Within the balance sheet, non-current assets and disposal groups held for sale are included in Other assets and Other liabilities.
| | | | | | | | |
in€ m. | | Dec 31, 2012 | | | Dec 31, 2011 | |
Cash, due and deposits from banks, Central bank funds sold and securities purchased under resale agreements | | | 0 | | | | – | |
| | | | | | | | |
Trading assets, Derivatives, Financial assets designated at fair value though P&L | | | – | | | | 2,012 | |
| | | | | | | | |
Financial assets available for sale | | | 4 | | | | 115 | |
| | | | | | | | |
Loans | | | – | | | | – | |
| | | | | | | | |
Property and equipment | | | 2 | | | | 41 | |
| | | | | | | | |
Other assets | | | 101 | | | | 198 | |
| | | | | | | | |
Total assets classified as held for sale | | | 107 | | | | 2,366 | |
| | | | | | | | |
Deposits, Central bank funds purchased and securities sold under resale agreements | | | – | | | | – | |
| | | | | | | | |
Trading liabilities, Derivatives, Financial liabilities designated at fair value though P&L | | | – | | | | – | |
| | | | | | | | |
Long-term debt | | | – | | | | – | |
| | | | | | | | |
Other liabilities | | | 78 | | | | 1,669 | |
| | | | | | | | |
Total liabilities classified as held for sale | | | 78 | | | | 1,669 | |
| |
As of December 31, 2012 and December 31, 2011, there were no unrealized net gains (losses) relating to non-current assets and disposal groups classified as held for sale included in Accumulated other comprehensive income.
| | | | |
| Deutsche Bank | | 02 – Consolidated Financial Statements | | 341 |
| Financial Report 2012 | | Notes to the Consolidated Balance Sheet 26 – Non-Current Assets and Disposal Groups Held for Sale | | |
| | |
| | | | |
| | |
| | | | |
Non-Current Assets and Disposal Groups Held for Sale as of December 31, 2012
In the fourth quarter 2012, the Group classified a wholly owned subsidiary as a disposal group held for sale. The entity belongs to the Corporate Division GTB and provides merchant acquiring services to multi-national clients of the Group. Pursuant to the sales agreement reached with the acquirer, the unit is expected to be sold within one year. The classification of the disposal group to the held for sale category did not lead to an impairment loss.
In the third quarter 2012, the Group classified several disposal groups, mainly consisting of foreclosures, as held for sale within the Corporate Division CB&S. All assets are expected to be sold within one year. The classification as held for sale did not result in an impairment loss.
Within the Corporate Division AWM, the Group had also classified a disposal group, mainly consisting of real estate fund units, as held for sale. The disposal of the unit closed in the first quarter 2013. The classification as held for sale had led to an impairment loss of€ 1 million, which was recognized in Other income in the second quarter 2012.
BHF-BANK
On September 20, 2012, the Group announced that it has reached an agreement with Kleinwort Benson Group, a wholly owned subsidiary of RHJ International, on the sale of BHF-BANK AG. The transaction is subject to regulatory approvals. Closing is not expected to occur before the publication of this report. Given the uncertainty created by outstanding substantive approvals, the Group does not consider held for sale classification appropriate as of year-end 2012 and will not reclassify the disposal group as held for sale until such approvals are given.
Disposals in 2012
| | | | | | |
Division | | Disposal | | Financial impact1 | | Date of the disposal |
Former Corporate Investments | | The exposure in Actavis mainly consisted of€ 4.0 billion in loans and€ 33 million in equity method investments. | | As a result of the substantial progress towards an agreement for a third party to acquire Actavis, the Group recognized an impairment loss of€ 257 million in the first quarter 2012, before its classification as held for sale. The classification as held for sale did not result in any additional impairment loss. Ongoing negotiations with the buyer may result in an adjustment to the contractual purchase price. | | Fourth quarter 2012 |
| | | | | | |
Former Corporate Investments | | Several buildings held as property and equipment. | | None. | | In 2012 |
| | | | | | |
Corporate Banking & Securities | | A disposal group mainly including traded loans, mortgage servicing rights and financial guarantees. | | An impairment loss of€ 22 million was recorded in 2011. | | First quarter 2012 |
| | | | | | |
Asset & Wealth Management | | Several disposal groups and several assets previously acquired as part of the acquisition of the Sal. Oppenheim Group. | | None. | | In 2012 |
|
| 1 | Impairment losses and reversals of impairment losses are included in Other income. |
Change in Classification in 2012
| | | | | | |
Division | | Change in classification | | Financial impact1 | | Date and reason for change
in classification |
Corporate Banking & Securities | | An investment in an associate. | | The classification of the investment as held for sale led to an initial impairment loss of€ 2 million in 2011 and, due to a change in the fair value less cost to sell, to a reversal of that impairment loss of€ 2 million in the first quarter 2012. | | Second quarter 2012, as despite attempts to sell there have not been any buyers. |
|
| 1 | Impairment losses and reversals of impairment losses are included in Other income. |
| | | | |
| Deutsche Bank | | 02 – Consolidated Financial Statements | | 342 |
| Financial Report 2012 | | Notes to the Consolidated Balance Sheet 26 – Non-Current Assets and Disposal Groups Held for Sale | | |
| | |
| | | | |
| | |
| | | | |
Non-Current Assets and Disposal Groups Held for Sale as of December 31, 2011
| | | | | | |
Division | | Non-current assets and disposal groups held for sale | | Financial impact1 | | Additional information |
| Corporate Banking & Securities | | A disposal group, mainly consisting of traded loans, mortgage servicing rights and financial guarantees. | | An impairment loss of€ 22
million was recorded in 2011. | | Disposals in 2012 |
| | | | | | |
| Corporate Banking & Securities | | An investment in an associate and several disposal groups. | | The classification as held for
sale of the investment in an
associate led to an impairment
loss of€ 2 million in 2011. All
other classifications did not
result in any impairment loss. | | Change in
Classification in 2012 |
| | | | | | |
| Asset & Wealth Management | | Several disposal groups, mainly including property and equipment. | | None. | | Disposals in 2012 |
|
| 1 | Impairment losses and reversals of impairment losses are included in Other income. |
Disposals in 2011
| | | | | | |
Division | | Disposal | | Financial impact1 | | Date of the disposal |
Former Corporate Investments | | The Group headquarters in Frankfurt am Main. | | The classification of property
and equipment of€ 592 million
as held for sale in the first
quarter 2011 resulted in an
initial impairment loss of
€ 34 million, with an additional
impairment loss of€ 13 million
recorded in the second quarter
2011. On final settlement in the
fourth quarter 2011 and after
adjustments for retained assets,
the Group sold assets of
€ 528 million, resulting in an
impairment loss of€ 37 million
equal to a reversal of
€ 10 million compared to the
total impairment losses
previously incurred in the first
half 2011. | | Fourth quarter
2011 |
| | | | | | |
| Corporate Banking & Securities | | An investment in an associate, a subsidiary that mainly included a German real estate investment property asset and several disposal groups. | | None. | | In 2011 |
| | | | | | |
| Asset & Wealth Management | | A subsidiary and several assets (previously acquired as part of the acquisition of the Sal. Oppenheim Group). | | None. | | In 2011 |
| | | | | | |
| Private & Business Clients | | A non-core business activity. | | The classification as a disposal
group with related goodwill of
€ 5 million resulted in an
impairment loss of€ 3 million in
2011. | | Second quarter
2011 |
| | | | | | |
| Private & Business Clients | | Postbank’s Indian subsidiary Deutsche Postbank Home Finance Ltd. | | None. | | First quarter 2011 |
|
| 1 | Impairment losses and reversals of impairment losses are included in Other income. |
Change in Classification in 2011
| | | | | | |
Division | | Change in classification | | Financial impact1 | | Date and reason for the
change in classification |
| Former Corporate Investments | | BHF-BANK | | None. | | Second quarter 2011, because
negotiations ended. |
|
| 1 | Impairment losses and reversals of impairment losses are included in Other income. |
| | | | |
| Deutsche Bank | | 02 – Consolidated Financial Statements | | 343 |
| Financial Report 2012 | | Notes to the Consolidated Balance Sheet 28 – Deposits | | |
| | |
| | | | |
| | |
| | | | |
27 –
Other Assets and Other Liabilities
| | | | | | | | |
in€ m. | | Dec 31, 2012 | | | Dec 31, 2011 | |
Other assets: | | | | | | | | |
| | | | | | | | |
Brokerage and securities related receivables | | | | | | | | |
Cash/margin receivables | | | 67,372 | | | | 63,772 | |
Receivables from prime brokerage | | | 6,068 | | | | 9,652 | |
Pending securities transactions past settlement date | | | 4,096 | | | | 3,479 | |
Receivables from unsettled regular way trades | | | 19,758 | | | | 45,907 | |
Total brokerage and securities related receivables | | | 97,295 | | | | 122,810 | |
| | | | | | | | |
Accrued interest receivable | | | 3,216 | | | | 3,598 | |
| | | | | | | | |
Assets held for sale | | | 107 | | | | 2,366 | |
| | | | | | | | |
Other | | | 23,356 | | | | 26,020 | |
| | | | | | | | |
Total other assets | | | 123,973 | | | | 154,794 | |
| |
| | | | | | | | |
| | | | | | | | |
in€ m. | | Dec 31, 2012 | | | Dec 31, 2011 | |
Other liabilities: | | | | | | | | |
| | | | | | | | |
Brokerage and securities related payables | | | | | | | | |
Cash/margin payables | | | 74,646 | | | | 58,419 | |
Payables from prime brokerage | | | 31,078 | | | | 32,255 | |
Pending securities transactions past settlement date | | | 3,029 | | | | 2,823 | |
Payables from unsettled regular way trades | | | 19,257 | | | | 46,236 | |
Total brokerage and securities related payables | | | 128,010 | | | | 139,733 | |
| | | | | | | | |
Accrued interest payable | | | 3,636 | | | | 3,665 | |
| | | | | | | | |
Liabilities held for sale | | | 78 | | | | 1,669 | |
| | | | | | | | |
Other | | | 37,820 | | | | 42,749 | |
| | | | | | | | |
Total other liabilities | | | 169,544 | | | | 187,816 | |
| |
For further details on the assets and liabilities held for sale please refer to Note 26 “Non-Current Assets and Disposal Groups Held for Sale”.
28 –
Deposits
| | | | | | | | |
in€ m. | | Dec 31, 2012 | | | Dec 31, 2011 | |
Noninterest-bearing demand deposits | | | 143,920 | | | | 99,047 | |
| | | | | | | | |
Interest-bearing deposits | | | | | | | | |
Demand deposits | | | 135,030 | | | | 163,618 | |
Time deposits | | | 172,007 | | | | 202,979 | |
Savings deposits | | | 126,245 | | | | 136,087 | |
| | | | | | | | |
Total interest-bearing deposits | | | 433,282 | | | | 502,684 | |
| | | | | | | | |
Total deposits | | | 577,202 | | | | 601,730 | |
| |
| | | | |
| Deutsche Bank | | 02 – Consolidated Financial Statements | | 344 |
| Financial Report 2012 | | Notes to the Consolidated Balance Sheet 29 – Provisions | | |
| | |
| | | | |
| | |
| | | | |
29 –
Provisions
Movements by Class of Provisions
| | | | | | | | | | | | | | | | | | | | |
in€ m. | | Home Savings
Business | | | Operational/
Litigation | | | Restructuring | | | Other1 | | | Total | |
Balance as of January 1, 2011 | | | 866 | | | | 516 | | | | – | | | | 603 | | | | 1,985 | |
| | | | | | | | | | | | | | | | | | | | |
Changes in the group of consolidated companies | | | – | | | | 0 | | | | – | | | | 10 | | | | 10 | |
New provisions | | | 166 | | | | 860 | | | | – | | | | 312 | | | | 1,338 | |
Amounts used | | | (124) | | | | (370) | | | | – | | | | (172) | | | | (666) | |
Unused amounts reversed | | | (5) | | | | (197) | | | | – | | | | (116) | | | | (318) | |
Effects from exchange rate fluctuations/Unwind of discount | | | 16 | | | | 5 | | | | – | | | | 2 | | | | 23 | |
Other | | | – | | | | 7 | | | | – | | | | 182 | | | | 25 | |
| | | | | | | | | | | | | | | | | | | | |
Balance as of December 31, 2011 | | | 919 | | | | 822 | | | | – | | | | 655 | | | | 2,396 | |
| | | | | | | | | | | | | | | | | | | | |
Changes in the group of consolidated companies | | | – | | | | – | | | | – | | | | (7) | | | | (7) | |
New provisions | | | 182 | | | | 2,689 | | | | 326 | | | | 921 | | | | 4,118 | |
Amounts used | | | (130) | | | | (815) | | | | (141) | | | | (181) | | | | (1,267) | |
Unused amounts reversed | | | (4) | | | | (82) | | | | (20) | | | | (225) | | | | (331) | |
Effects from exchange rate fluctuations/Unwind of discount | | | (4) | | | | (10) | | | | 0 | | | | 2 | | | | (12) | |
Other | | | – | | | | – | | | | – | | | | (2) | | | | (2) | |
| | | | | | | | | | | | | | | | | | | | |
Balance as of December 31, 2012 | | | 963 | | | | 2,604 | | | | 165 | | | | 1,163 | | | | 4,895 | |
| |
| 1 | For the remaining portion of provisions as disclosed on the consolidated balance sheet, please see Note 20 “Allowance for Credit Losses”, in which allowances for credit related off-balance sheet positions are disclosed. |
| 2 | Includes mainly reclassifications (to)/from liabilities held for sale. |
Classes of Provisions
Home Savings provisions arise out of the home savings business of Deutsche Postbank Group and Deutsche Bank Bauspar-Aktiengesellschaft. In home savings, a customer enters into a building loan agreement, whereby the customer becomes entitled to borrow on a building loan once the customer has on deposit with the lending bank a targeted amount of money. In connection with the building loan agreement, arrangement fees are charged and interest is paid on deposited amounts at a rate that is typically lower than that paid on other bank deposits. In the event the customer determines not to make the borrowing, the customer becomes entitled to a retroactive interest bonus, reflecting the difference between the low contract savings interest rate and a fixed interest rate, currently substantially above market rate. The home savings provision relates to the potential interest bonus and arrangement fee reimbursement liability. The model for the calculation of the potential interest bonus liability includes parameters for the percentage of customer base impacted, applicable bonus rate, customer status and timing of payment. Other factors impacting the provision are available statistical data relating to customer behavior and the general environment likely to affect the business in the future.
Operational/Litigation provisions arise out of operational risk, which is the potential for failure (including the legal component) in relation to employees, contractual specifications and documentation, technology, infrastructure failure and disasters, external influences and customer relationships. This excludes business and reputational risk. Operational risk issues may result in demands from customers, counterparties and regulatory bodies or in legal proceedings.
Restructuring provisions arise out of restructuring activities. The Group aims to enhance its long-term competitiveness through major reductions in costs, duplication and complexity in the years ahead. For details see Note 11 “Restructuring”.
Other provisions include several specific items arising from a variety of different circumstances, including a contingent liability relating to certain businesses acquired from Sal. Oppenheim Group (see Note 04 “Acquisitions and Dispositions”), deferred sales commissions, the provision for the United Kingdom bank levy and a provision under the credit card business cooperation of Deutsche Bank and Hua Xia Bank (see Note 37 “Related Party Transactions”).
Other provisions also include amounts for mortgage repurchase demands. From 2005 through 2008, as part of Deutsche Bank’s U.S. residential mortgage loan business, Deutsche Bank sold approximately U.S. $ 84 billion
| | | | |
| Deutsche Bank | | 02 – Consolidated Financial Statements | | 345 |
| Financial Report 2012 | | Notes to the Consolidated Balance Sheet 29 – Provisions | | |
| | |
| | | | |
| | |
| | | | |
of private label securities and U.S. $ 71 billion of loans through whole loan sales, including to U.S. government-sponsored entities such as the Federal Home Loan Mortgage Corporation and the Federal National Mortgage Association. Deutsche Bank has been presented with demands to repurchase loans from or to indemnify purchasers, investors or financial insurers with respect to losses allegedly caused by material breaches of representations and warranties. Deutsche Bank’s general practice is to process valid repurchase demands that are presented in compliance with contractual rights.
As of December 31, 2012, Deutsche Bank has approximately U.S. $ 4.6 billion of outstanding mortgage repurchase demands (based on original principal balance of the loans). Against these outstanding demands, Deutsche Bank has established provisions of€ 341 million in 2012. There are other potential mortgage loan repurchase demands that Deutsche Bank anticipates may be made, but Deutsche Bank cannot reliably estimate their timing or amount.
As of December 31, 2012, Deutsche Bank has completed repurchases and otherwise settled claims on loans with an original principal balance of approximately U.S. $ 2.6 billion. In connection with those repurchases and settlements, Deutsche Bank has obtained releases for potential claims on approximately U.S. $ 41.6 billion of loans sold by Deutsche Bank as described above.
Contingent Liabilities
Contingent liabilities can arise from present obligations and from possible obligations arising from past events. The Group recognizes a provision for potential loss only when there is a present obligation arising from a past event that is probable to result in an economic outflow and that can be reliably estimated. For significant contingent liabilities for which the possibility of a future loss is more than remote but less than probable, the Group estimates the possible loss where the Group believes that an estimate can be made.
The Group operates in a legal and regulatory environment that exposes it to significant litigation risks. As a result, the Group is involved in litigation, arbitration and regulatory proceedings in Germany and in a number of jurisdictions outside Germany, including the United States, arising in the ordinary course of business. The legal and regulatory claims for which the Group has taken material provisions or for which there are material contingent liabilities that are more than remote are described below; similar matters are grouped together and some matters consist of a number of claims. The estimated loss in respect of each, where such an estimate can be made, has not been disclosed for individual matters because the Group has concluded that such disclosure can be expected to seriously prejudice their outcome. Where a provision has been taken for a particular claim, no contingent liability is recorded.
In determining for which of the claims the possibility of a loss is more than remote, and then estimating the possible loss for those claims, the Group takes into consideration a number of factors, including but not limited to the nature of the claim and its underlying facts, the procedural posture and litigation history of each case, rulings by the courts or tribunals, the Group’s experience and the experience of others in similar cases (to the extent this is known to the Group), prior settlement discussions, settlements by others in similar cases (to the extent this is known to the Group), available indemnities and the opinions and views of legal counsel and other experts. There are other disclosed matters for which the possibility of a loss is more than remote but for which such an estimate cannot be made. For those matters where an estimate can be made, the Group currently estimates that, as of December 31, 2012, the aggregate future loss of which the possibility is more than remote but less than probable is approximately€ 1.5 billion (2011:€ 2.2 billion). This figure includes contingent liabilities on matters where the Group’s potential liability is joint and several and where the Group expects any such liability to be paid by a third party.
This estimated possible loss, as well as any provisions taken, is based upon currently available information and is subject to significant judgment and a variety of assumptions, variables and known and unknown uncertainties. These uncertainties may include inaccuracies in or incompleteness of the information available to the Group, particularly at the preliminary stages of matters, and assumptions by the Group as to future rulings of courts or other tribunals or the likely actions or positions taken by regulators or adversaries may prove incorrect.
| | | | |
| Deutsche Bank | | 02 – Consolidated Financial Statements | | 346 |
| Financial Report 2012 | | Notes to the Consolidated Balance Sheet 29 – Provisions | | |
| | |
| | | | |
| | |
| | | | |
Moreover, estimates of possible loss for these matters are often not amenable to the use of statistical or other quantitative analytical tools frequently used in making judgments and estimates, and are subject to even greater degrees of uncertainty than in many other areas where the Group must exercise judgment and make estimates.
The matters for which the Group determines that the possibility of a future loss is more than remote will change from time to time, as will the matters as to which an estimate can be made and the estimated possible loss for such matters. Actual results may prove to be significantly higher or lower than the estimate of possible loss in those matters where such an estimate was made. In addition, loss may be incurred in matters with respect to which the Group believed the likelihood of loss was remote. In particular, the estimated aggregate possible loss does not represent the Group’s potential maximum loss exposure for those matters.
The Group may settle litigation or regulatory proceedings prior to a final judgment or determination of liability. It may do so to avoid the cost, management efforts or negative business, regulatory or reputational consequences of continuing to contest liability, even when the Group believes it has valid defenses to liability. It may also do so when the potential consequences of failing to prevail would be disproportionate to the costs of settlement. Furthermore, the Group may, for similar reasons, reimburse counterparties for their losses even in situations where it does not believe that it is legally compelled to do so.
Auction Rate Securities Litigation. Deutsche Bank and Deutsche Bank Securities Inc. (“DBSI”) have been named as defendants in twenty-one actions asserting various claims under the federal securities laws and state common law arising out of the sale of auction rate preferred securities and auction rate securities (together, “ARS”). Of those twenty-one actions, one is pending and twenty have been resolved or dismissed with prejudice. Deutsche Bank and DBSI were the subjects of a putative class action, filed in the United States District Court for the Southern District of New York, asserting various claims under the federal securities laws on behalf of all persons or entities who purchased and continue to hold ARS offered for sale by Deutsche Bank and DBSI between March 17, 2003 and February 13, 2008. In December 2010, the court dismissed the putative class action with prejudice. After initially filing a notice of appeal, the plaintiff voluntarily withdrew and dismissed the appeal in December 2011. Deutsche Bank was also named as a defendant, along with ten other financial institutions, in two putative class actions, filed in the United States District Court for the Southern District of New York, asserting violations of the antitrust laws. The putative class actions allege that the defendants conspired to artificially support and then, in February 2008, restrain the ARS market. On or about January 26, 2010, the court dismissed the two putative class actions. The plaintiffs filed appeals of the dismissals with the Second Circuit Court of Appeals. On March 5, 2013, the Second Circuit affirmed dismissal of the two putative class actions.
Interbank Offered Rates Matters. Deutsche Bank has received subpoenas and requests for information from various regulatory and law enforcement agencies in Europe, North America and Asia Pacific in connection with industry-wide investigations concerning the setting of London Interbank Offered Rate (LIBOR), Euro Interbank Offered Rate (EURIBOR), Tokyo Interbank Offered Rate (TIBOR), Singapore Interbank Offered Rate (SIBOR) and other interbank offered rates. Deutsche Bank is cooperating with these investigations.
In connection with the above-referenced investigations, in the period from mid-2012 to early 2013, three financial institutions entered into settlements with the U.K. Financial Services Authority, U.S. Commodity Futures Trading Commission and U.S. Department of Justice (DOJ). While the terms of the various settlements differed, they all involved significant financial penalties and regulatory consequences. For example, one financial institution’s settlement included a Deferred Prosecution Agreement, pursuant to which the DOJ agreed to defer prosecution of criminal charges against that entity provided that the financial institution satisfies the terms of the Deferred Prosecution Agreement. The terms of the other financial institutions’ settlements included Non-Prosecution Agreements, pursuant to which the DOJ agreed not to file criminal charges against the entities so long as certain conditions are met. In addition, affiliates of two of the financial institutions agreed to plead guilty to a crime in a United States court for related conduct.
| | | | |
| Deutsche Bank | | 02 – Consolidated Financial Statements | | 347 |
| Financial Report 2012 | | Notes to the Consolidated Balance Sheet 29 – Provisions | | |
| | |
| | | | |
| | |
| | | | |
In addition, a number of civil actions, including putative class actions, are pending in federal court in the United States District Court for the Southern District of New York against Deutsche Bank and numerous other banks. All but one of these actions are filed on behalf of certain parties who allege that they held or transacted in U.S. Dollar LIBOR-based derivatives or other financial instruments and sustained losses as a result of collusion or manipulation by the defendants regarding the setting of U.S. Dollar LIBOR. These U.S. Dollar LIBOR civil actions have been consolidated for pre-trial purposes, and Deutsche Bank and the other bank defendants moved to dismiss the amended complaints that had been filed by the end of April 2012. On March 29, 2013, the Court dismissed a substantial portion of plaintiffs’ claims, such as the federal and state antitrust claims. The Court allowed some manipulation claims to proceed and granted plaintiffs’ motion to amend their complaints based on information that emerged in regulatory settlements.
Additional complaints against Deutsche Bank and other banks relating to the alleged manipulation of U.S. Dollar LIBOR have been filed in or otherwise transferred to the Southern District of New York by the Judicial Panel on Multidistrict Litigation but have stayed pending the resolution of the motions to dismiss. Other actions against Deutsche Bank and other banks concerning U.S. Dollar LIBOR are currently pending in other federal district courts, and defendants are seeking to have them transferred to the Southern District of New York. One complaint relating to the alleged manipulation of Yen LIBOR and Euroyen TIBOR has also been filed in the Southern District of New York. Claims for damages are asserted under various legal theories, including violations of the Commodity Exchange Act, state and federal antitrust laws, the Racketeer Influcenced and Corrupt Organizations Act and other state laws.
Kirch Litigation. In May 2002, Dr. Leo Kirch personally and as an assignee of two entities of the former Kirch Group, i.e., PrintBeteiligungs GmbH and the group holding company TaurusHolding GmbH & Co. KG, initiated legal action against Dr. Rolf-E. Breuer and Deutsche Bank alleging that a statement made by Dr. Breuer (then the Spokesman of Deutsche Bank’s Management Board) regarding the Kirch Group in an interview with Bloomberg television on February 4, 2002, was in breach of laws and resulted in financial damage.
On January 24, 2006, the German Federal Supreme Court sustained the action for the declaratory judgment only in respect of the claims assigned by PrintBeteiligungs GmbH. Such action and judgment did not require a proof of any loss caused by the statement made in the interview. PrintBeteiligungs GmbH is the only company of the Kirch Group which was a borrower of Deutsche Bank. Claims by Dr. Kirch personally and by Taurus-Holding GmbH & Co. KG were dismissed. In May 2007, Dr. Kirch filed an action for payment of approximately€ 1.3 billion plus interest as assignee of PrintBeteiligungs GmbH against Deutsche Bank and Dr. Breuer. On February 22, 2011, the District Court Munich I dismissed the lawsuit in its entirety. Dr. Kirch has filed an appeal against the decision. In these proceedings Dr. Kirch has to prove that such statement caused financial damages to PrintBeteiligungs GmbH and the amount thereof.
On December 31, 2005, KGL Pool GmbH filed a lawsuit against Deutsche Bank and Dr. Breuer. The lawsuit is based on alleged claims assigned from various subsidiaries of the former Kirch Group. KGL Pool GmbH seeks a declaratory judgment to the effect that Deutsche Bank and Dr. Breuer are jointly and severally liable for damages as a result of the interview statement and the behavior of Deutsche Bank in respect of several subsidiaries of the Kirch Group. In December 2007, KGL Pool GmbH supplemented this lawsuit by a motion for pay-ment of approximately€ 2.0 billion plus interest as compensation for the purported damages which two subsidiaries of the former Kirch Group allegedly suffered as a result of the statement by Dr. Breuer. On March 31, 2009, the District Court Munich I dismissed the lawsuit in its entirety. KGL Pool GmbH appealed the decision. On December 14, 2012, the appellate court altered the judgment by District Court Munich I and held that Deutsche Bank and Dr. Breuer are liable for damages assigned by one subsidiary of the former Kirch Group and claimed under the motion for payment, rendered a declaratory judgment in favor of certain subsidiaries and dismissed the claims assigned by certain other subsidiaries. On March 12, 2013, the appellate court handed down the written judgment containing the reasons. Deutsche Bank and Dr. Breuer filed a request for leave to appeal with the German Federal Supreme Court. As a next step, the appellate court will request an expert opinion on possible damages to decide on the amount owed under the payment claim.
Mortgage-Related and Asset-Backed Securities Matters. Deutsche Bank AG, along with certain affiliates (collectively referred in these paragraphs to as “Deutsche Bank”), have received subpoenas and requests for information from certain regulators and government entities concerning its activities regarding the origination,
| | | | |
| Deutsche Bank | | 02 – Consolidated Financial Statements | | 348 |
| Financial Report 2012 | | Notes to the Consolidated Balance Sheet 29 – Provisions | | |
| | |
| | | | |
| | |
| | | | |
purchase, securitization, sale and/or trading of mortgage loans, residential mortgage-backed securities (RMBS), collateralized debt obligations, other asset-backed securities, commercial paper and credit derivatives. Deutsche Bank is cooperating fully in response to those subpoenas and requests for information.
Deutsche Bank has been named as defendant in numerous civil litigations in various roles as issuer or underwriter in offerings of RMBS and other asset-backed securities. These cases include putative class action suits, actions by individual purchasers of securities, actions by trustees on behalf of RMBS trusts, and actions by insurance companies that guaranteed payments of principal and interest for particular tranches of securities offerings. Although the allegations vary by lawsuit, these cases generally allege that the RMBS offering documents contained material misrepresentations and omissions, including with regard to the underwriting standards pursuant to which the underlying mortgage loans were issued, or assert that various representations or warranties relating to the loans were breached at the time of origination.
Deutsche Bank and several current or former employees were named as defendants in a putative class action commenced on June 27, 2008, relating to two Deutsche Bank-issued RMBS offerings. Following a mediation, the court has approved a settlement of the case.
Deutsche Bank is a defendant in putative class actions relating to its role, along with other financial institutions, as underwriter of RMBS issued by various third-parties and their affiliates including Countrywide Financial Corporation, IndyMac MBS, Inc., Novastar Mortgage Corporation, and Residential Accredit Loans, Inc. These cases are in various stages up through discovery. On March 29, 2012, the United States District Court for the Southern District of New York dismissed with prejudice and without leave to replead the putative Novastar Mortgage Corporation class action, which the plaintiffs appealed. On March 1, 2013, the United States Court of Appeals for the Second Circuit reversed the dismissal and remanded the case for further proceedings to the District Court.
Deutsche Bank is a defendant in various non-class action lawsuits by alleged purchasers of, and counterparties involved in transactions relating to, RMBS, and their affiliates, including Allstate Insurance Company, Asset Management Fund, Assured Guaranty Municipal Corporation, Bayerische Landesbank, Cambridge Place Investments Management Inc., the Federal Deposit Insurance Corporation (as conservator for Colonial Bank, Franklin Bank S.S.B., Guaranty Bank, Citizens National Bank and Strategica Capital Bank), the Federal Home Loan Bank of Boston, the Federal Home Loan Bank of San Francisco, the Federal Home Loan Bank of Seattle, the Federal Housing Finance Agency (as conservator for Fannie Mae and Freddie Mac), HSBC Bank USA, National Association (as trustee for certain RMBS trusts), Freedom Trust 2011-2, John Hancock, Landesbank Baden-Württemberg, Mass Mutual Life Insurance Company, Moneygram Payment Systems, Inc., Phoenix Light SF Limited (as purported assignee of claims of special purpose vehicles created and/or managed by WestLB AG), Royal Park Investments (as purported assignee of claims of a special-purpose vehicle created to acquire certain assets of Fortis Bank), RMBS Recovery Holdings 4, LLC, VP Structured Products, LLC, Sealink Funding Ltd. (as purported assignee of claims of special purpose vehicles created and/or managed by Sachsen Landesbank and its subsidiaries), Spencerview Asset Management Ltd., The Charles Schwab Corporation, The Union Central Life Insurance Company, The Western and Southern Life Insurance Co., and the West Virginia Investment Management Board. These civil litigations are in various stages up through discovery.
In the actions against Deutsche Bank solely as an underwriter of other issuers’ RMBS offerings, Deutsche Bank has contractual rights to indemnification from the issuers, but those indemnity rights may in whole or in part prove effectively unenforceable where the issuers are now or may in the future be in bankruptcy or otherwise defunct.
On February 6, 2012, the United States District Court for the Southern District of New York issued an order dismissing claims brought by Dexia SA/NV and Teachers Insurance and Annuity Association of America and their affiliates, and on January 4, 2013, the court issued an opinion explaining the basis for this order. The court dismissed some of the claims with prejudice and granted the plaintiffs leave to replead other claims. The plaintiffs repled the claims dismissed without prejudice by filing a new complaint on February 4, 2013.
| | | | |
| Deutsche Bank | | 02 – Consolidated Financial Statements | | 349 |
| Financial Report 2012 | | Notes to the Consolidated Balance Sheet 30 – Credit related Commitments and Contingent Liabilities | | |
| | |
| | | | |
| | |
| | | | |
On July 16, 2012, the Minnesota District Court dismissed with prejudice without leave to replead claims by Moneygram Payment Systems, Inc., which the plaintiffs have appealed. On January 13, 2013, Moneygram filed a summons with notice in New York State Supreme Court seeking to assert claims similar to those dismissed in Minnesota.
On February 4, 2013, pursuant to the terms of a settlement agreement, Stichting Pensioenfonds ABP dismissed two lawsuits that had been filed against Deutsche Bank. The financial terms of the settlement are not material to Deutsche Bank.
A number of entities have threatened to assert claims against Deutsche Bank in connection with various RMBS offerings and other related products, and Deutsche Bank has entered into agreements with a number of these entities to toll the relevant statutes of limitations. It is possible that these potential claims may have a material impact on Deutsche Bank. In addition, Deutsche Bank has entered into settlement agreements with some of these entities, the financial terms of which are not material to Deutsche Bank.
On May 8, 2012, Deutsche Bank reached a settlement with Assured Guaranty Municipal Corporation regarding claims on certain residential mortgage-backed securities (RMBS) issued and underwritten by Deutsche Bank that are covered by financial guaranty insurance provided by Assured. Pursuant to this settlement, Deutsche Bank made a payment of U.S.$ 166 million and agreed to participate in a loss share arrangement to cover a percentage of Assured’s future losses on certain RMBS issued by Deutsche Bank. This settlement resolves two litigations with Assured relating to financial guaranty insurance and limits claims in a third litigation where all the underlying mortgage collateral was originated by Greenpoint Mortgage Funding, Inc. (a subsidiary of Capital One), which is required to indemnify Deutsche Bank.
U.S. Embargoes-Related Matters. Deutsche Bank has received requests for information from regulatory agencies concerning its historical processing of US-Dollar payment orders through U.S. financial institutions for parties from countries subject to U.S. embargo laws and as to whether such processing complied with U.S. and state laws. Deutsche Bank is cooperating with the regulatory agencies.
30 –
Credit related Commitments and Contingent Liabilities
In the normal course of business the Group regularly enters into irrevocable lending commitments as well as contingent liabilities consisting of financial and performance guarantees, standby letters of credit and indemnity agreements on behalf of its customers. Under these contracts the Group is required to perform under an obligation agreement or to make payments to the beneficiary based on third party’s failure to meet its obligations. For these instruments it is not known to the Group in detail if, when and to what extent claims will be made. The Group considers these instruments in monitoring the credit exposure and may require collateral to mitigate inherent credit risk. If the credit risk monitoring provides sufficient perception about a loss from an expected claim, a provision is established and recorded on the balance sheet.
The following table shows the Group’s irrevocable lending commitments and lending related contingent liabilities without considering collateral or provisions. It shows the maximum potential utilization of the Group in case all these liabilities entered into must be fulfilled. The table therefore does not show the expected future cash flows from these liabilities as many of them will expire without being drawn and arising claims will be honored by the customers or can be recovered from proceeds of arranged collateral.
Irrevocable lending commitments and lending related contingent liabilities
| | | | | | | | |
in€ m. | | Dec 31, 2012 | | | Dec 31, 2011 | |
Irrevocable lending commitments | | | 129,657 | | | | 127,995 | |
| | | | | | | | |
Contingent liabilities | | | 68,361 | | | | 73,653 | |
| | | | | | | | |
Total | | | 198,018 | | | | 201,648 | |
| |
| | | | |
| Deutsche Bank | | 02 – Consolidated Financial Statements | | 350 |
| Financial Report 2012 | | Notes to the Consolidated Balance Sheet 32 – Long-Term Dept and Trust Preferred Securities | | |
| | |
| | | | |
| | |
| | | | |
Government Assistance
In the course of its business, the Group regularly applies for and receives government support by means of Export Credit Agency (“ECA”) guarantees covering transfer and default risks for the financing of exports and investments into Emerging Markets and to a lesser extent, developed markets for Structured Trade & Export Finance business. Almost all export-oriented states have established such ECAs to support their domestic exporters. The ECAs act in the name and on behalf of the government of their respective country and are either constituted directly as governmental departments or organized as private companies vested with the official mandate of the government to act on its behalf. Terms and conditions of such ECA guarantees granted for short-term, mid-term and long-term financings are quite comparable due to the fact that most of the ECAs act within the scope of the Organisation for Economic Cooperation and Development (“OECD”) consensus rules. The OECD consensus rules, an intergovernmental agreement of the OECD member states, define benchmarks to ensure that a fair competition between different exporting nations will take place.
In some countries dedicated funding programs with governmental support are offered for ECA-covered financings. On a selective basis, the Group makes use of such programs. In certain financings, the Group also receives government guarantees from national and international governmental institutions as collateral to support financings in the interest of the respective governments. The majority of such ECA guarantees received by the Group were issued either by the Euler-Hermes Kreditversicherungs AG acting on behalf of the Federal Republic of Germany or by the Commodity Credit Corporation acting on behalf of the United States.
31 –
Other Short-Term Borrowings
| | | | | | | | |
in€ m. | | Dec 31, 2012 | | | Dec 31, 2011 | |
Other short-term borrowings: | | | | | | | | |
| | | | | | | | |
Commercial paper | | | 23,616 | | | | 30,807 | |
| | | | | | | | |
Other | | | 45,444 | | | | 34,549 | |
| | | | | | | | |
Total other short-term borrowings | | | 69,060 | | | | 65,356 | |
| |
32 –
Long-Term Debt and Trust Preferred Securities
Long-Term Debt by Earliest Contractual Maturity
| | | | | | | | | | | | | | | | | | | | | | | | | | | | | | | | |
in€ m. | | Due in
2013 | | | Due in
2014 | | | Due in
2015 | | | Due in
2016 | | | Due in
2017 | | | Due after
2017 | | | Total
Dec 31,
2012 | | | Total
Dec 31,
2011 | |
Senior debt: | | | | | | | | | | | | | | | | | | | | | | | | | | | | | | | | |
| | | | | | | | | | | | | | | | | | | | | | | | | | | | | | | | |
Bonds and notes: | | | | | | | | | | | | | | | | | | | | | | | | | | | | | | | | |
Fixed rate | | | 12,382 | | | | 11,154 | | | | 11,682 | | | | 10,418 | | | | 13,313 | | | | 31,063 | | | | 90,012 | | | | 98,4521 | |
Floating rate | | | 10,231 | | | | 4,441 | | | | 2,608 | | | | 2,239 | | | | 3,270 | | | | 6,687 | | | | 29,476 | | | | 37,8551 | |
| | | | | | | | | | | | | | | | | | | | | | | | | | | | | | | | |
Subordinated debt: | | | | | | | | | | | | | | | | | | | | | | | | | | | | | | | | |
| | | | | | | | | | | | | | | | | | | | | | | | | | | | | | | | |
Bonds and notes: | | | | | | | | | | | | | | | | | | | | | | | | | | | | | | | | |
Fixed rate | | | 1,101 | | | | 390 | | | | 708 | | | | 500 | | | | – | | | | 1,519 | | | | 4,218 | | | | 3,3731 | |
Floating rate | | | 4,174 | | | | 178 | | | | 84 | | | | – | | | | – | | | | 131 | | | | 4,567 | | | | 4,0681 | |
| | | | | | | | | | | | | | | | | | | | | | | | | | | | | | | | |
Other | | | 12,033 | | | | 1,384 | | | | 1,917 | | | | 1,000 | | | | 1,930 | | | | 11,559 | | | | 29,824 | | | | 19,668 | |
| | | | | | | | | | | | | | | | | | | | | | | | | | | | | | | | |
Total long-term debt | | | 39,920 | | | | 17,548 | | | | 16,999 | | | | 14,157 | | | | 18,513 | | | | 50,959 | | | | 158,097 | | | | 163,416 | |
| |
| 1 | Prior year amounts have been amended. |
The Group did not have any defaults of principal, interest or other breaches with respect to its liabilities in 2012 and 2011.
| | | | |
| Deutsche Bank | | 02 – Consolidated Financial Statements | | 351 |
| Financial Report 2012 | | Additional Notes 33 – Common Shares | | |
| | |
| | | | |
| | |
| | | | |
Trust Preferred Securities1
| | | | | | | | |
in€ m. | | Dec 31, 2012 | | | Dec 31, 2011 | |
Fixed rate | | | 10,024 | | | | 11,402 | |
| | | | | | | | |
Floating rate | | | 2,067 | | | | 942 | |
| | | | | | | | |
Total trust preferred securities | | | 12,091 | | | | 12,344 | |
| |
| 1 | Perpetual instruments, redeemable at specific future dates at the Group’s option. |
Additional Notes
33 –
Common Shares
Common Shares
Deutsche Bank’s share capital consists of common shares issued in registered form without par value. Under German law, each share represents an equal stake in the subscribed capital. Therefore, each share has a nominal value of€ 2.56, derived by dividing the total amount of share capital by the number of shares.
| | | | | | | | | | | | |
Number of shares | | Issued and
fully paid | | | Treasury shares | | | Outstanding | |
Common shares, January 1, 2011 | | | 929,499,640 | | | | (10,437,280) | | | | 919,062,360 | |
| | | | | | | | | | | | |
Shares issued under share-based compensation plans | | | – | | | | – | | | | – | |
Capital increase | | | – | | | | – | | | | – | |
Shares purchased for treasury | | | – | | | | (381,738,342) | | | | (381,738,342) | |
Shares sold or distributed from treasury | | | – | | | | 367,286,623 | | | | 367,286,623 | |
| | | | | | | | | | | | |
Common shares, December 31, 2011 | | | 929,499,640 | | | | (24,888,999) | | | | 904,610,641 | |
| | | | | | | | | | | | |
Shares issued under share-based compensation plans | | | – | | | | – | | | | – | |
Capital increase | | | – | | | | – | | | | – | |
Shares purchased for treasury | | | – | | | | (381,117,111) | | | | (381,117,111) | |
Shares sold or distributed from treasury | | | – | | | | 405,690,368 | | | | 405,690,368 | |
| | | | | | | | | | | | |
Common shares, December 31, 2012 | | | 929,499,640 | | | | (315,742) | | | | 929,183,898 | |
| |
There are no issued ordinary shares that have not been fully paid.
Shares purchased for treasury consist of shares held by the Group for a period of time, as well as any shares purchased with the intention of being resold in the short-term. In addition, the Group has bought back shares for equity compensation purposes. All such transactions were recorded in shareholders’ equity and no revenues and expenses were recorded in connection with these activities. Treasury stock held as of year-end will mainly be used for future share-based compensation.
Authorized Capital
The Management Board is authorized to increase the share capital by issuing new shares for cash and in some circumstances noncash consideration. As of December 31, 2012, Deutsche Bank AG had authorized but unissued capital of€ 1,152,000,000 which may be issued in whole or in part until April 30, 2016. Further details are governed by Section 4 of the Articles of Association.
| | | | | | |
| Authorized capital | | Consideration | | Pre-emptive rights | | Expiration date |
| | | | | | |
| €230,400,000 | | Cash | | May be excluded pursuant to Section 186 (3) sentence 4 of the Stock Corporation Act | | April 30, 2016 |
| | | | | | |
| €230,400,000 | | Cash or noncash | | May be excluded if the capital increase is for noncash consideration with the intent of acquiring a company or holdings in a company | | April 30, 2016 |
| | | | | | |
| €691,200,000 | | Cash | | May not be excluded | | April 30, 2016 |
|
| | | | |
| Deutsche Bank | | 02 – Consolidated Financial Statements | | 352 |
| Financial Report 2012 | | Additional Notes 34 – Employee Benefits | | |
| | |
| | | | |
| | |
| | | | |
Conditional Capital
The Management Board is authorized to issue once or more than once, participatory notes that are linked with conversion rights or option rights and/or convertible bonds and/or bonds with warrants. The participatory notes, convertible bonds or bonds with warrants may also be issued by affiliated companies of Deutsche Bank AG. For this purpose share capital was increased conditionally upon exercise of these conversion and/or exchange rights or upon mandatory conversion.
| | |
Contingent capital | | Expiration date for the
issuance of conversion
and/or option rights |
€ 230,400,000 | | April 30, 2015 |
| | |
€ 230,400,000 | | April 30, 2016 |
| | |
€ 230,400,000 | | April 30, 2017 |
|
Dividends
The following table presents the amount of dividends proposed or declared for the years ended December 31, 2012, 2011 and 2010, respectively.
| | | | | | | | | | | | |
| | 2012
(proposed) | | | 2011 | | | 2010 | |
Cash dividends declared (in€ m.)1 | | | 697 | | | | 697 | | | | 697 | |
| | | | | | | | | | | | |
Cash dividends declared per common share (in€) | | | 0.75 | | | | 0.75 | | | | 0.75 | |
| |
| 1 | Cash dividend for 2012 is based on the number of shares issued as of December 31, 2012. |
No dividends have been declared since the balance sheet date.
34 –
Employee Benefits
Share-Based Compensation Plans
The Group made grants of share-based compensation under the DB Equity Plan. This plan represents a contingent right to receive Deutsche Bank common shares after a specified period of time. The award recipient is not entitled to receive dividends during the vesting period of the award.
The share awards granted under the terms and conditions of the DB Equity Plan may be forfeited fully or partly if the recipient voluntarily terminates employment before the end of the relevant vesting period. Vesting usually continues after termination of employment in cases such as redundancy or retirement.
In countries where legal or other restrictions hinder the delivery of shares, a cash plan variant of the DB Equity Plan was used for granting awards.
| | | | |
| Deutsche Bank | | 02 – Consolidated Financial Statements | | 353 |
| Financial Report 2012 | | Additional Notes 34 – Employee Benefits | | |
| | |
| | | | |
| | |
| | | | |
The following table sets forth the basic terms of these share plans.
| | | | | | | | |
Grant year(s) | | Deutsche Bank Equity Plan | | Vesting schedule | | Early retirement
provisions | | Eligibility |
2012/ 2011 | | Annual Award | | 1/3: 12 months1 1/3: 24 months1 1/3: 36 months1 | | Yes | | Select employees as annual retention |
| | | | | | | | |
| | Retention/New Hire | | Individual specification | | Yes | | Select employees to attract or retain key staff |
| | | | | | | | |
| | Annual Award – Upfront | | Vesting immediately at grant2 | | No | | Regulated employees |
| | | | | | | | |
2010 | | Annual Award | | Graded vesting in nine equal tranches between 12 months and 45 months | | Yes | | Select employees as annual retention |
| | | | | | | | |
| | | | Or cliff vesting after 45 months | | Yes | | Select employees as annual retention |
| | | | | | | | |
| | Retention/New Hire | | Individual specification | | No | | Select employees to attract or retain key staff |
| | | | | | | | |
2009 | | Annual Award | | 50 %: 24 months 25 %: 36 months 25 %: 48 months | | No | | Select employees as annual retention |
| | | | | | | | |
| | Retention/New Hire | | Individual specification | | No | | Select employees to attract or retain key staff |
|
| 1 | For regulated employees share delivery after a further retention period of six months. For members of the Management Board a different schedule applies. |
| 2 | For regulated employees share delivery after a retention period of six months. For members of the Management Board share delivery after a retention period of three years. |
Furthermore, the Group offers a broad-based employee share ownership plan entitled Global Share Purchase Plan (“GSPP”). Employees in select countries are granted up to ten shares per employee after a savings period of one year and a subsequent vesting period of one more year. As of December 31, 2012, entities in 37 countries enrolled in the new plan.
The Group has other local share-based compensation plans, none of which, individually or in the aggregate, are material to the consolidated financial statements.
Activity for Share Plans
| | | | | | | | |
| | Share units
(in thousands) | | | Weighted-average
grant date fair
value per unit | |
Balance as of December 31, 2010 | | | 68,915 | | | | € 40.31 | |
| | | | | | | | |
Granted | | | 28,022 | | | | € 40.54 | |
Issued | | | (24,150) | | | | € 49.12 | |
Forfeited | | | (3,092) | | | | € 37.86 | |
| | | | | | | | |
Balance as of December 31, 2011 | | | 69,695 | | | | € 37.37 | |
| | | | | | | | |
Granted | | | 38,648 | | | | € 30.00 | |
Issued | | | (43,425) | | | | € 33.80 | |
Forfeited | | | (2,419) | | | | € 38.37 | |
| | | | | | | | |
Balance as of December 31, 2012 | | | 62,499 | | | | € 35.25 | |
| |
The table also includes the grants under the cash plan variant of the DB Equity Plan.
| | | | |
| Deutsche Bank | | 02 – Consolidated Financial Statements | | 354 |
| Financial Report 2012 | | Additional Notes 34 – Employee Benefits | | |
| | |
| | | | |
| | |
| | | | |
Share-based payment transactions resulting in a cash payment give rise to a liability, which amounted to approximately€ 44 million,€ 35 million and€ 33 million for the years ended December 31, 2012, 2011 and 2010, respectively.
As of December 31, 2012, the grant volume of outstanding share awards was approximately€ 2.2 billion. Thereof,€ 1.6 billion had been recognized as compensation expense in the reporting year or prior to that. Hence, compensation expense for deferred share-based compensation not yet recognized amounted to€ 0.6 billion as of December 31, 2012.
In addition to the amounts shown in the table above, approximately 14.8 million shares were issued to plan participants in February 2013, resulting from the vesting of DB Equity Plan awards granted in prior years (thereof 0.6 million units under the cash plan variant of this DB Equity Plan).
Furthermore, in February 2013 the Group granted awards of approximately 23.2 million units, with an average fair value of€ 36.07 per unit under the DB Equity Plan with modified plan conditions for 2013. Approximately 0.7 million units of these grants were made under the cash plan variant of this DB Equity Plan.
Taking into account the units issued and granted in February 2013 the balance of outstanding shares awards as of month-end February 2013 is approximately 71 million units.
Post-employment Benefit Plans
Nature of Plans
The Group sponsors a number of post-employment benefit plans on behalf of its employees, both defined contribution plans and defined benefit plans. The Group’s plans are accounted for based on the nature and substance of the plan.
The Group’s defined benefit plans are classified into retirement benefit plans, such as pension plans, and post-employment medical plans. The majority of the Group’s defined benefit plan commitments relate to beneficiaries of retirement benefit plans in Germany, the United Kingdom and the United States. For such plans, the value of a participant’s accrued benefit is based primarily on each employee’s remuneration and length of service. The Group maintains various external pension trusts to fund the majority of its retirement benefit plan obligations.
The Group also maintains various post-employment medical plans for a number of current and retired employees who are mainly located in the United States. These plans pay stated percentages of medical expenses of eligible retirees after a stated deductible has been met. The Group accrues for these obligations over the service of the employee and pays the benefits from Group assets when the benefits become due. Once a retiree is eligible for Medicare the retiree is no longer eligible under the Group’s medical plan and the Group makes a contribution to a Health Reimbursement Account for that retiree.
The Group’s Pensions Risk Committee oversees risks related to the Group’s post-employment benefit plans around the world. Within this context it develops and maintains guidelines for governance and risk management, including funding, asset allocation and actuarial assumption setting.
The Group’s funding policy is to maintain coverage of the defined benefit obligation (“DBO”) by plan assets within a range of 90 % to 100 % of the obligation, subject to meeting any local statutory requirements. Nevertheless, the Group has determined that certain plans should remain unfunded. Obligations for the Group’s unfunded plans are accrued on the balance sheet.
| | | | |
| Deutsche Bank | | 02 – Consolidated Financial Statements | | 355 |
| Financial Report 2012 | | Additional Notes 34 – Employee Benefits | | |
| | |
| | | | |
| | |
| | | | |
In Germany, the Group is a member of the BVV together with other financial institutions. The BVV offers retirement benefits to eligible employees in Germany as a complement to post-employment benefit promises of the Group. The BVV provides annuities of a fixed amount to individuals on retirement and increases these fixed amounts if surplus assets arise within the BVV. The subsidiary liability for providing the benefits lies with the employer in Germany. The Group classifies the BVV plan as a multi-employer plan and accounts for it as a defined contribution plan since insufficient information is available to identify assets and liabilities relating to the Group’s current and former employees. In 2012, expenses for the contributions to the BVV were€ 51 million (2011:€ 53 million). In addition, the Group’s expenses for defined contribution plans also include annual contributions by Deutsche Postbank AG to the special pension fund for postal civil servants of€ 105 million (2011:€ 112 million).
Reconciliation in Movement of Liabilities and Assets – Impact on Balance sheet
| | | | | | | | | | | | | | | | |
| | | Retirement benefit plans | | | Post-employment medical plans | |
in€ m. | | 2012 | | | 2011 | | | 2012 | | | 2011 | |
Change in defined benefit obligation: | | | | | | | | | | | | | | | | |
| | | | | | | | | | | | | | | | |
Balance, beginning of year | | | 12,974 | | | | 12,071 | | | | 164 | | | | 154 | |
| | | | | | | | | | | | | | | | |
Current service cost | | | 257 | | | | 248 | | | | 4 | | | | 3 | |
Interest cost | | | 619 | | | | 600 | | | | 7 | | | | 7 | |
Contributions by plan participants | | | 19 | | | | 19 | | | | – | | | | – | |
Actuarial loss (gain) | | | 1,503 | | | | 458 | | | | (7) | | | | 18 | |
Exchange rate changes | | | 45 | | | | 136 | | | | (3) | | | | 5 | |
Benefits paid | | | (618) | | | | (563) | | | | (9) | | | | (8) | |
Past service cost (credit) | | | 30 | | | | 21 | | | | – | | | | (15) | |
Acquisitions | | | – | | | | – | | | | – | | | | – | |
Divestitures | | | – | | | | (17) | | | | – | | | | – | |
Settlements/curtailments | | | (2) | | | | (1) | | | | – | | | | – | |
Other1 | | | 3 | | | | 2 | | | | 8 | | | | – | |
| | | | | | | | | | | | | | | | |
Balance, end of year | | | 14,830 | | | | 12,974 | | | | 164 | | | | 164 | |
| | | | | | | | | | | | | | | | |
thereof: in unfunded plans | | | 1,351 | | | | 1,162 | | | | 164 | | | | 164 | |
thereof: in funded plans | | | 13,479 | | | | 11,812 | | | | – | | | | – | |
| | | | | | | | | | | | | | | | |
Change in fair value of plan assets: | | | | | | | | | | | | | | | | |
| | | | | | | | | | | | | | | | |
Balance, beginning of year | | | 12,594 | | | | 11,076 | | | | – | | | | – | |
| | | | | | | | | | | | | | | | |
Expected return on plan assets | | | 577 | | | | 531 | | | | – | | | | – | |
Actuarial gain (loss) | | | 650 | | | | 1,165 | | | | – | | | | – | |
Exchange rate changes | | | 85 | | | | 152 | | | | – | | | | – | |
Contributions by the employer | | | 160 | | | | 117 | | | | – | | | | – | |
Contributions by plan participants | | | 19 | | | | 19 | | | | – | | | | – | |
Benefits paid2 | | | (481) | | | | (464) | | | | – | | | | – | |
Acquisitions | | | – | | | | – | | | | – | | | | – | |
Divestitures | | | – | | | | (12) | | | | – | | | | – | |
Settlements | | | (2) | | | | 9 | | | | – | | | | – | |
Other1 | | | 0 | | | | 1 | | | | – | | | | – | |
| | | | | | | | | | | | | | | | |
Balance, end of year | | | 13,602 | | | | 12,594 | | | | – | | | | – | |
| | | | | | | | | | | | | | | | |
Funded status, end of year | | | (1,228) | | | | (380) | | | | (164) | | | | (164) | |
Past service cost (credit) not recognized | | | 0 | | | | – | | | | – | | | | – | |
Asset ceiling | | | (0) | | | | – | | | | – | | | | – | |
Reclassification as held for sale | | | (0) | | | | – | | | | – | | | | – | |
| | | | | | | | | | | | | | | | |
Net asset (liability) recognized | | | (1,228) | | | | (380) | | | | (164) | | | | (164) | |
| | | | | | | | | | | | | | | | |
thereof: other assets | | | 926 | | | | 1,336 | | | | – | | | | – | |
thereof: other liabilities | | | (2,154) | | | | (1,716) | | | | (164) | | | | (164) | |
| |
| 1 | Includes opening balance of first time application of smaller plans. |
| | | | |
| Deutsche Bank | | 02 – Consolidated Financial Statements | | 356 |
| Financial Report 2012 | | Additional Notes 34 – Employee Benefits | | |
| | |
| | | | |
| | |
| | | | |
Actuarial Methodology and Assumptions
December 31 is the measurement date for all plans. All plans are valued by independent qualified actuaries using the projected unit credit method. The following rates are presented in the form of weighted averages.
| | | | | | | | | | | | |
| | 2012 | | | 2011 | | | 2010 | |
Assumptions used for retirement benefit plans | | | | | | | | | | | | |
| | | | | | | | | | | | |
to determine defined benefit obligations, end of year | | | | | | | | | | | | |
Discount rate | | | 3.9 %1 | | | | 4.8 % | | | | 5.1 % | |
Rate of price inflation | | | 2.4 % | | | | 2.5 % | | | | 2.5 % | |
Rate of nominal increase in future compensation levels | | | 3.2 % | | | | 3.4 % | | | | 3.3 % | |
Rate of nominal increase for pensions in payment | | | 2.3 % | | | | 2.5 % | | | | 2.4 % | |
| | | | | | | | | | | | |
to determine expense, year ended | | | | | | | | | | | | |
Discount rate | | | 4.8 % | | | | 5.1 % | | | | 5.4 % | |
Rate of price inflation | | | 2.5 % | | | | 2.5 % | | | | 2.7 % | |
Rate of nominal increase in future compensation levels | | | 3.4 % | | | | 3.3 % | | | | 3.4 % | |
Rate of nominal increase for pensions in payment | | | 2.5 % | | | | 2.4 % | | | | 2.4 % | |
Expected rate of return on plan assets | | | 4.5 % | | | | 4.9 % | | | | 5.0 % | |
| | | | | | | | | | | | |
Assumptions used for post-employment medical plans | | | | | | | | | | | | |
| | | | | | | | | | | | |
to determine defined benefit obligations, end of year | | | | | | | | | | | | |
Discount rate | | | 3.9 % | | | | 4.5 % | | | | 5.3 % | |
| | | | | | | | | | | | |
to determine expense, year ended | | | | | | | | | | | | |
Discount rate | | | 4.5 % | | | | 5.3 % | | | | 5.9 % | |
| | | | | | | | | | | | |
Assumed life expectancy at age 65 | | | | | | | | | | | | |
| | | | | | | | | | | | |
for a male aged 65 at measurement date | | | 19.9 | | | | 19.4 | | | | 19.4 | |
for a male aged 45 at measurement date | | | 22.2 | | | | 21.6 | | | | 21.6 | |
for a female aged 65 at measurement date | | | 23.2 | | | | 22.9 | | | | 22.8 | |
for a female aged 45 at measurement date | | | 25.4 | | | | 25.0 | | | | 24.9 | |
| |
| 1 | The discount rate applied to determine the defined benefit pension obligations in Germany/eurozone as of December 31, 2012 is 3.7 %. |
For the Group’s most significant plans, the discount rate assumption at each measurement date is set based on a high quality corporate bond yield curve approach reflecting the actual timing and amount of the future benefit payments for the respective plan. A consistent discount rate assumption is used across the eurozone based on the assumption applicable for the Group’s largest plan in Germany. For other plans, the discount rate is based on high quality corporate or government bond yields, as appropriate, at each measurement date with a duration consistent with the respective plan’s obligations.
The price inflation assumptions in the eurozone and the United Kingdom are set with reference to market implied measures of inflation based on inflation swap rates in those markets at each measurement date. For other countries, the price inflation assumptions are typically based on long term forecasts by Consensus Economics Inc.
The assumptions for the nominal increases in future compensation levels and for increases to pensions in payment are developed separately for each plan, where relevant. Each plan is set reflecting a building block approach based on the price inflation assumption and reflecting the Group’s reward structure or policies in each market as well as relevant local statutory and plan-specific requirements.
The expected rate of return on assets is developed separately for each funded plan, using a building block approach recognizing each plan’s target asset allocation at the measurement date and the assumed return on assets for each asset category. The general principle is to use a risk-free rate as a benchmark, with adjustments for the effect of duration and specific relevant factors for each major category of plan assets where appropriate. For example, the expected rate of return for equities and property is derived by adding relevant risk premia to the risk-free rate.
| | | | |
| Deutsche Bank | | 02 – Consolidated Financial Statements | | 357 |
| Financial Report 2012 | | Additional Notes 34 – Employee Benefits | | |
| | |
| | | | |
| | |
| | | | |
Among other assumptions, mortality assumptions can be significant in measuring the Group’s obligations under its defined benefit plans. These assumptions have been set in accordance with current best practice in the respective countries. Future potential improvements in longevity have been considered and included where appropriate.
In determining the obligations and expenses for post-employment medical plans, an annual weighted-average rate of increase of 8.3 % in the per capita cost of covered health care benefits was assumed for 2013. The rate is assumed to decrease gradually to 5.1 % by the end of 2019 and to remain at that level thereafter.
Pension Fund Investments
The Group’s primary investment objective is to immunize broadly the Group to large swings in the funded status of its retirement benefit plans, with some limited amount of risk-taking through duration mismatches and asset class diversification to reduce the Group’s costs of providing the benefits to employees in the long term. The aim is to maximize returns within the Group’s overall risk tolerance. The following rates are presented in the form of weighted averages.
| | | | | | | | | | | | |
| | | | | | Percentage of plan assets | |
| | Target allocation | | | Dec 31, 2012 | | | Dec 31, 2011 | |
Asset categories: | | | | | | | | | | | | |
Equity instruments | | | 10 % | | | | 9 % | | | | 7 % | |
Debt instruments (including Cash and Derivatives) | | | 85 % | | | | 88 % | | | | 87 % | |
Alternative Investments (including Property) | | | 5 % | | | | 3 % | | | | 6 % | |
| | | | | | | | | | | | |
Total asset categories | | | 100 % | | | | 100 % | | | | 100 % | |
| |
The actual return on plan assets for the year 2012 was€ 1,227 million (2011:€ 1,696 million).
Plan assets as of December 31, 2012, include derivative transactions with Group entities with a negative market value of€ 242 million. In addition, there are€ 7 million of securities issued by the Group included in the plan assets.
Impact on Cashflows
The Group expects to pay approximately€ 190 million in regular contributions to its retirement benefit plans in 2013. Furthermore the Group is considering making a contribution to fund the majority of Postbank’s defined benefit obligations in 2013. It is not expected that any plan assets will be returned to the Group during the year ending December 31, 2013.
The table below reflects the benefits expected to be paid by the defined benefit plans in each of the respective periods. The amounts include benefits attributable to employees’ past and estimated future service, and include both amounts paid from the Group’s pension funds in respect of funded plans and by the Group in respect of unfunded plans.
| | | | | | | | |
in€ m. | | Retirement
benefit plans | | | Post-employment
medical plans | |
2013 | | | 582 | | | | 10 | |
| | | | | | | | |
2014 | | | 560 | | | | 10 | |
| | | | | | | | |
2015 | | | 574 | | | | 10 | |
| | | | | | | | |
2016 | | | 595 | | | | 10 | |
| | | | | | | | |
2017 | | | 630 | | | | 11 | |
| | | | | | | | |
2018 – 2022 | | | 3,607 | | | | 55 | |
| |
| | | | |
| Deutsche Bank | | 02 – Consolidated Financial Statements | | 358 |
| Financial Report 2012 | | Additional Notes 34 – Employee Benefits | | |
| | |
| | | | |
| | |
| | | | |
Impact on Equity
The Group applies the policy of recognizing actuarial gains and losses in the period in which they occur. Actuarial gains and losses are taken directly to shareholders’ equity and are presented in the Consolidated Statement of Comprehensive Income and in the Consolidated Statement of Changes in Equity. The following amounts are presented without any tax effects.
| | | | | | | | | | | | |
| | | Amount recognized in
comprehensive income (gain(loss)) | |
in€ m. | | | Dec 31, 2012 | 1 | | | 2012 | | | | 2011 | |
Retirement benefit plans: | | | | | | | | | | | | |
Actuarial gain (loss) | | | 8 | | | | (853) | | | | 707 | |
Asset ceiling | | | (0) | | | | 0 | | | | 2 | |
| | | | | | | | | | | | |
Total retirement benefit plans | | | 8 | | | | (853) | | | | 709 | |
| | | | | | | | | | | | |
Post-employment medical plans: | | | | | | | | | | | | |
Actuarial gain (loss) | | | 14 | | | | 7 | | | | (18) | |
| | | | | | | | | | | | |
Total post-employment medical plans | | | 14 | | | | 7 | | | | (18) | |
| | | | | | | | | | | | |
Total amount recognized | | | 22 | | | | (846) | | | | 691 | |
| |
| 1 | Accumulated since the Group adopted IFRS and inclusive of the impact of exchange rate changes. |
Experience Impacts on Liabilities and Assets
| | | | | | | | | | | | | | | | | | | | |
in€ m. | | Dec 31, 2012 | | | Dec 31, 2011 | | | Dec 31, 2010 | | | Dec 31, 2009 | | | Dec 31, 2008 | |
Retirement benefit plans: | | | | | | | | | | | | | | | | | | | | |
| | | | | | | | | | | | | | | | | | | | |
Defined benefit obligation | | | 14,830 | | | | 12,974 | | | | 12,071 | | | | 9,416 | | | | 8,189 | |
thereof: experience adjustments (loss (gain))1 | | | (117) | | | | 25 | | | | (83) | | | | (72) | | | | 24 | |
| | | | | | | | | | | | | | | | | | | | |
Fair Value of plan assets | | | 13,602 | | | | 12,594 | | | | 11,076 | | | | 9,352 | | | | 8,755 | |
thereof: experience adjustments (gain (loss))1 | | | 650 | | | | 1,165 | | | | 224 | | | | 92 | | | | (221) | |
| | | | | | | | | | | | | | | | | | | | |
Funded status | | | (1,228) | | | | (380) | | | | (995) | | | | (64) | | | | 566 | |
| | | | | | | | | | | | | | | | | | | | |
Post-employment medical plans: | | | | | | | | | | | | | | | | | | | | |
| | | | | | | | | | | | | | | | | | | | |
Defined benefit obligation | | | 164 | | | | 164 | | | | 154 | | | | 136 | | | | 119 | |
thereof: experience adjustments (loss (gain))1 | | | (12) | | | | 8 | | | | 1 | | | | – | | | | (5) | |
| | | | | | | | | | | | | | | | | | | | |
Funded status | | | (164) | | | | (164) | | | | (154) | | | | (136) | | | | (119) | |
| |
| 1 | Amounts arisen in the applicable year. |
Sensitivity to Key Assumptions
The figures presented below reflect the effect of adjusting each assumption in isolation.
| | | | | | | | | | | | | | | | |
| Increase/(decrease) | | Defined benefit obligation as of | | | Expenses for | |
in€ m. | | Dec 31, 2012 | | | Dec 31, 2011 | | | 2013 | | | 2012 | |
Retirement benefit plans sensitivity: | | | | | | | | | | | | | | | | |
Discount rate (50 basis points decrease) | | | 1,090 | | | | 960 | | | | 601 | | | | 5 | |
Rate of price inflation (50 basis points increase) | | | 670 | | | | 555 | | | | 40 | | | | 40 | |
Rate of real increase in future compensation levels (50 basis points increase) | | | 120 | | | | 105 | | | | 10 | | | | 10 | |
Longevity (improvement by ten percent)2 | | | 305 | | | | 255 | | | | 15 | | | | 15 | |
Expected rate of return (50 basis points decrease) | | | – | | | | – | | | | –3 | | | | 65 | |
| | | | | | | | | | | | | | | | |
Post-employment medical plans sensitivity: | | | | | | | | | | | | | | | | |
Health care cost rate (100 basis points increase) | | | 5 | | | | 17 | | | | 0 | | | | 2 | |
Health care cost rate (100 basis points decrease) | | | (4) | | | | (15) | | | | (0) | | | | (1) | |
| |
| 1 | Includes application of the discount rate to the funded status, rather than only the defined benefit obligation, under the new IAS 19 rules which apply from 2013. |
| 2 | Improvement by ten percent on longevity means that the probability of death at each age is reduced by ten percent. The sensitivity has, broadly, the effect of increasing the expected longevity at age 65 by about one year. |
| 3 | Not applicable under the new IAS 19 rules which apply from 2013. |
| | | | |
| Deutsche Bank | | 02 – Consolidated Financial Statements | | 359 |
| Financial Report 2012 | | Additional Notes 35 – Income Taxes | | |
| | |
| | | | |
| | |
| | | | |
Expense of post-employment benefits and selected other employee benefits
| | | | | | | | | | | | |
in€ m. | | 2012 | | | 2011 | | | 2010 | |
Expenses for retirement benefit plans: | | | | | | | | | | | | |
Current service cost | | | 257 | | | | 248 | | | | 243 | |
Interest cost | | | 619 | | | | 600 | | | | 527 | |
Expected return on plan assets | | | (577) | | | | (531) | | | | (490) | |
Past service cost (credit) recognized | | | 30 | | | | 21 | | | | (77) | |
Settlements/curtailments | | | (0) | | | | (9) | | | | (14) | |
| | | | | | | | | | | | |
Total retirement benefit plans | | | 329 | | | | 329 | | | | 189 | |
| | | | | | | | | | | | |
Expenses for post-employment medical plans: | | | | | | | | | | | | |
Current service cost | | | 4 | | | | 3 | | | | 3 | |
Interest cost | | | 7 | | | | 7 | | | | 9 | |
Past service cost (credit) recognized | | | – | | | | (15) | | | | – | |
| | | | | | | | | | | | |
Total post-employment medical plans | | | 11 | | | | (5) | | | | 12 | |
| | | | | | | | | | | | |
Total expenses defined benefit plans | | | 340 | | | | 324 | | | | 201 | |
| | | | | | | | | | | | |
Total expenses for defined contribution plans | | | 375 | | | | 351 | | | | 239 | |
| | | | | | | | | | | | |
Total expenses for post-employment benefits | | | 715 | | | | 675 | | | | 440 | |
| | | | | | | | | | | | |
| | | | | | | | | | | | |
| | | | | | | | | | | | |
Expenses for selected other employee benefits | | | | | | | | | | | | |
Employer contributions to mandatory German social security pension plan | | | 231 | | | | 226 | | | | 171 | |
Expenses for cash retention plans1 | | | 1,133 | | | | 1,014 | | | | 818 | |
Expenses for share-based payments, equity settled1 | | | 1,097 | | | | 1,261 | | | | 1,153 | |
Expenses for share-based payments, cash settled1 | | | 17 | | | | 28 | | | | 24 | |
Expenses for severance payments2 | | | 472 | | | | 461 | | | | 499 | |
| |
| 1 | Including expenses for new hire awards and the acceleration of expenses not yet amortized due to the discontinuation of employment. Thereof,€ 83 million were recognized as part of restructuring expenses in the year 2012. |
| 2 | Excluding the acceleration of expenses for deferred compensation awards not yet amortized. |
Expected expenses for 2013 are€ 315 million for retirement benefit plans and€ 10 million for post-employment medical plans.
The increase in expenses for post-employment benefits in 2011 compared to 2010 is mainly caused by the full-year impact of the consolidation of Postbank in the 2011 expense and the change in indexation of UK occupational pensions in deferment from the Retail Prices Index (RPI) to the Consumer Prices Index (CPI) due to a UK Government announcement which led to a past service credit of€ 104 million recognized in the 2010 expense.
35 –
Income Taxes
| | | | | | | | | | | | |
in€ m. | | 2012 | | | 2011 | | | 2010 | |
Current tax expense (benefit): | | | | | | | | | | | | |
Tax expense (benefit) for current year | | | 728 | | | | 1,683 | | | | 1,339 | |
Adjustments for prior years1 | | | (955) | | | | (232) | | | | (9) | |
| | | | | | | | | | | | |
Total current tax expense (benefit) | | | (227) | | | | 1,451 | | | | 1,330 | |
| | | | | | | | | | | | |
Deferred tax expense (benefit): | | | | | | | | | | | | |
Origination and reversal of temporary difference, unused tax losses and tax credits | | | 574 | | | | (143) | | | | 700 | |
Effect of changes in tax law and/or tax rate | | | 10 | | | | 110 | | | | 7 | |
Adjustments for prior years1 | | | 136 | | | | (354) | | | | (392) | |
| | | | | | | | | | | | |
Total deferred tax expense (benefit) | | | 720 | | | | (387) | | | | 315 | |
| | | | | | | | | | | | |
Total income tax expense (benefit) | | | 493 | | | | 1,064 | | | | 1,645 | |
| |
| 1 | Adjustments for prior years include a current tax benefit of€ 435 million with an offsetting equal amount in deferred tax expense. |
Income tax expense includes policyholder tax attributable to policyholder earnings, amounting to an income tax expense of€ 12 million in 2012, an income tax benefit of€ 28 million in 2011 and an income tax expense of€ 37 million in 2010.
| | | | |
| Deutsche Bank | | 02 – Consolidated Financial Statements | | 360 |
| Financial Report 2012 | | Additional Notes 35 – Income Taxes | | |
| | |
| | | | |
| | |
| | | | |
Total current tax benefit includes benefits from previously unrecognized tax losses, tax credits and deductible temporary differences, which increased the current tax benefit by€ 94 million in 2012. These effects reduced the current tax expense by€ 35 million and by€ 6 million in 2011 and 2010, respectively.
Total deferred tax expense includes benefits from previously unrecognized tax losses (tax credits/deductible temporary differences) and the reversal of previous write-downs of deferred tax assets and expenses arising from write-downs of deferred tax assets, which increased the deferred tax expense by€ 92 million in 2012. In 2011 these effects increased the deferred tax benefit by€ 262 million and increased the deferred tax expense by€ 173 million in 2010.
Difference between applying German statutory (domestic) income tax rate and actual income tax expense
| | | | | | | | | | | | |
in€ m. | | 2012 | | | 2011 | | | 2010 | |
Expected tax expense at domestic income tax rate of 31 % (30.8 % for 2011 and 30.7 % for 2010) | | | 243 | | | | 1,657 | | | | 1,219 | |
| | | | | | | | | | | | |
Foreign rate differential | | | 34 | | | | (28) | | | | 63 | |
| | | | | | | | | | | | |
Tax-exempt gains on securities and other income | | | (495) | | | | (467) | | | | (556) | |
| | | | | | | | | | | | |
Loss (income) on equity method investments | | | (73) | | | | (39) | | | | (87) | |
| | | | | | | | | | | | |
Nondeductible expenses | | | 563 | | | | 297 | | | | 335 | |
| | | | | | | | | | | | |
Impairments of goodwill | | | 630 | | | | – | | | | – | |
| | | | | | | | | | | | |
Deutsche Postbank AG related charge with no tax benefit | | | – | | | | – | | | | 668 | |
| | | | | | | | | | | | |
Changes in recognition and measurement of deferred tax assets | | | (2) | | | | (297) | | | | 167 | |
| | | | | | | | | | | | |
Effect of changes in tax law and/or tax rate | | | 10 | | | | 110 | | | | 7 | |
| | | | | | | | | | | | |
Effect related to share-based payments | | | (17) | | | | 90 | | | | 48 | |
| | | | | | | | | | | | |
Effect of policyholder tax | | | 12 | | | | (28) | | | | 37 | |
| | | | | | | | | | | | |
Other | | | (412) | | | | (231) | | | | (256) | |
| | | | | | | | | | | | |
Actual income tax expense (benefit) | | | 493 | | | | 1,064 | | | | 1,645 | |
| |
The Group is under continuous examinations by tax authorities in various jurisdictions. In 2012 and 2011 “Other” in the preceding table mainly includes the effects of settling these examinations by the tax authorities.
The domestic income tax rate, including corporate tax, solidarity surcharge, and trade tax, used for calculating deferred tax assets and liabilities was 31 % for the year ended December 31, 2012. For 2011 the domestic income tax rate was 30.8 % and for 2010 30.7 %.
Income taxes charged or credited to equity (other comprehensive income/additional paid in capital)
| | | | | | | | | | | | |
in€ m. | | 2012 | | | 2011 | | | 2010 | |
Actuarial gains/losses related to defined benefit plans | | | 399 | | | | (50) | | | | (29) | |
| | | | | | | | | | | | |
Financial assets available for sale: | | | | | | | | | | | | |
Unrealized net gains/losses arising during the period | | | (537) | | | | 173 | | | | (59) | |
Net gains/losses reclassified to profit or loss | | | 6 | | | | (11) | | | | (47) | |
| | | | | | | | | | | | |
Derivatives hedging variability of cash flows: | | | | | | | | | | | | |
Unrealized net gains/losses arising during the period | | | (6) | | | | 92 | | | | 30 | |
Net gains/losses reclassified to profit or loss | | | (13) | | | | (1) | | | | (1) | |
| | | | | | | | | | | | |
Other equity movement: | | | | | | | | | | | | |
Unrealized net gains/losses arising during the period | | | 104 | | | | (129) | | | | 320 | |
Net gains/losses reclassified to profit or loss | | | – | | | | 1 | | | | (3) | |
| | | | | | | | | | | | |
Income taxes (charged) credited to other comprehensive income1 | | | (47) | | | | 75 | | | | 211 | |
| | | | | | | | | | | | |
Other income taxes (charged) credited to equity | | | 34 | | | | 46 | | | | 30 | |
| |
| 1 | Starting in 2011 actuarial gains/losses related to defined benefit plans are presented as part of other comprehensive income. Prior period numbers were adjusted accordingly. |
| | | | |
| Deutsche Bank | | 02 – Consolidated Financial Statements | | 361 |
| Financial Report 2012 | | Additional Notes | | |
| | 35 – Income Taxes | | |
| | |
| | | | |
| | |
| | | | |
Major components of the Group’s gross deferred income tax assets and liabilities
| | | | | | | | |
in€ m. | | | Dec 31, 2012 | | | | Dec 31, 2011 | |
Deferred tax assets: | | | | | | | | |
Unused tax losses | | | 1,802 | | | | 2,375 | |
Unused tax credits | | | 166 | | | | 185 | |
Deductible temporary differences: | | | | | | | | |
Trading activities | | | 12,108 | | | | 10,686 | |
Property and equipment | | | 830 | | | | 806 | |
Other assets | | | 2,758 | | | | 2,560 | |
Securities valuation | | | 524 | | | | 1,209 | |
Allowance for loan losses | | | 750 | | | | 525 | |
Other provisions | | | 1,504 | | | | 1,178 | |
Other liabilities | | | 890 | | | | 775 | |
| | | | | | | | |
Total deferred tax assets pre offsetting | | | 21,332 | | | | 20,299 | |
| | | | | | | | |
Deferred tax liabilities: | | | | | | | | |
Taxable temporary differences: | | | | | | | | |
Trading activities | | | 11,111 | | | | 9,370 | |
Property and equipment | | | 48 | | | | 49 | |
Other assets | | | 1,037 | | | | 1,103 | |
Securities valuation | | | 1,215 | | | | 790 | |
Allowance for loan losses | | | 108 | | | | 348 | |
Other provisions | | | 451 | | | | 414 | |
Other liabilities | | | 1,099 | | | | 1,277 | |
| | | | | | | | |
Total deferred tax liabilities pre offsetting | | | 15,069 | | | | 13,351 | |
| |
Deferred tax assets and liabilities, after offsetting
| | | | | | | | |
in€ m. | | Dec 31, 2012 | | | Dec 31, 2011 | |
Presented as deferred tax assets | | | 7,718 | | | | 8,737 | |
| | | | | | | | |
Presented as deferred tax liabilities | | | 1,455 | | | | 1,789 | |
| | | | | | | | |
Net deferred tax assets | | | 6,263 | | | | 6,948 | |
| |
The change in the balance of deferred tax assets and deferred tax liabilities does not equal the deferred tax expense/(benefit). This is due to (1) deferred taxes that are booked directly to equity, (2) the effects of exchange rate changes on tax assets and liabilities denominated in currencies other than euro, (3) the acquisition and disposal of entities as part of ordinary activities and (4) the reclassification of deferred tax assets and liabilities which are presented on the face of the balance sheet as components of other assets and liabilities.
Items for which no deferred tax assets were recognized
| | | | | | | | |
in€ m. | | | Dec 31, 2012 1 | | | | Dec 31, 2011 1 | |
Deductible temporary differences | | | (332) | | | | (296) | |
| | | | | | | | |
Not expiring | | | (3,069) | | | | (3,342) | |
Expiring in subsequent period | | | (10) | | | | (45) | |
Expiring after subsequent period | | | (2,227) | | | | (2,143) | |
| | | | | | | | |
Unused tax losses | | | (5,306) | | | | (5,530) | |
| | | | | | | | |
Expiring in subsequent period | | | – | | | | – | |
Expiring after subsequent period | | | (287) | | | | (101) | |
| | | | | | | | |
Unused tax credits | | | (287) | | | | (101) | |
| |
| 1 | Amounts in the table refer to deductible temporary differences, unused tax losses and tax credits for federal income tax purposes. |
Deferred tax assets were not recognized on these items because it is not probable that future taxable profit will be available against which the unused tax losses, unused tax credits and deductible temporary differences can be utilized.
As of December 31, 2012 and December 31, 2011, the Group recognized deferred tax assets of€ 1.3 billion and€ 1.5 billion, respectively that exceed deferred tax liabilities in entities which have suffered a loss in either the current or preceding period. This is based on management’s assessment that it is probable that the respective entities will have taxable profits against which the unused tax losses, unused tax credits and deductible temporary differences can be utilized. Generally, in determining the amounts of deferred tax assets to be recognized, management uses historical profitability information and, if relevant, forecasted operating results, based upon approved business plans, including a review of the eligible carry-forward periods, tax planning opportunities and other relevant considerations.
| | | | |
| Deutsche Bank | | 02 – Consolidated Financial Statements | | 362 |
| Financial Report 2012 | | Additional Notes | | |
| | 36 – Derivatives | | |
| | |
| | | | |
| | |
| | | | |
As of December 31, 2012 and December 31, 2011, the Group had temporary differences associated with the Group’s parent company’s investments in subsidiaries, branches and associates and interests in joint ventures of€ 138 million and€ 135 million respectively, in respect of which no deferred tax liabilities were recognized.
36 –
Derivatives
Derivative Financial Instruments and Hedging Activities
Derivative contracts used by the Group include swaps, futures, forwards, options and other similar types of contracts. In the normal course of business, the Group enters into a variety of derivative transactions for both trading and risk management purposes. The Group’s objectives in using derivative instruments are to meet customers’ risk management needs and to manage the Group’s exposure to risks.
In accordance with the Group’s accounting policy relating to derivatives and hedge accounting as described in Note 01 “Significant Accounting Policies”, all derivatives are carried at fair value in the balance sheet regardless of whether they are held for trading or nontrading purposes.
Derivatives held for Trading Purposes
Sales and Trading
The majority of the Group’s derivatives transactions relate to sales and trading activities. Sales activities include the structuring and marketing of derivative products to customers to enable them to take, transfer, modify or reduce current or expected risks. Trading includes market-making, positioning and arbitrage activities. Market-making involves quoting bid and offer prices to other market participants, enabling revenue to be generated based on spreads and volume. Positioning means managing risk positions in the expectation of benefiting from favorable movements in prices, rates or indices. Arbitrage involves identifying and profiting from price differentials between markets and products.
Risk Management
The Group uses derivatives in order to reduce its exposure to market risks as part of its asset and liability management. This is achieved by entering into derivatives that hedge specific portfolios of fixed rate financial instruments and forecast transactions as well as strategic hedging against overall balance sheet exposures. The Group actively manages interest rate risk through, among other things, the use of derivative contracts. Utilization of derivative financial instruments is modified from time to time within prescribed limits in response to changing market conditions, as well as to changes in the characteristics and mix of the related assets and liabilities.
Derivatives qualifying for Hedge Accounting
The Group applies hedge accounting if derivatives meet the specific criteria described in Note 01 “Significant Accounting Policies”.
Fair Value Hedge Accounting
The Group enters into fair value hedges, using primarily interest rate swaps and options, in order to protect itself against movements in the fair value of fixed-rate financial instruments due to movements in market interest rates.
| | | | | | | | | | | | | | | | |
in€ m. | | Assets
2012 | | | Liabilities
2012 | | | Assets
2011 | | | Liabilities
2011 | |
Derivatives held as fair value hedges | | | 7,990 | | | | 2,455 | | | | 7,485 | | | | 2,741 | |
| |
| | | | |
| Deutsche Bank | | 02 – Consolidated Financial Statements | | 363 |
| Financial Report 2012 | | Additional Notes | | |
| | 36 – Derivatives | | |
| | |
| | | | |
| | |
| | | | |
For the years ended December 31, 2012, 2011 and 2010, a loss of€ 0.1 billion, a gain of€ 2.2 billion and a gain of€ 0.7 billion, respectively, were recognized on the hedging instruments. For the same periods, the results on the hedged items, which were attributable to the hedged risk, were losses of€ 0.4 billion,€ 1.5 billion and€ 0.6 billion, respectively.
Cash Flow Hedge Accounting
The Group enters into cash flow hedges, using interest rate swaps, equity index swaps and foreign exchange forwards, in order to protect itself against exposure to variability in interest rates, equities and exchange rates.
| | | | | | | | | | | | | | | | |
in€ m. | | Assets
2012 | | | Liabilities
2012 | | | Assets
2011 | | | Liabilities
2011 | |
Derivatives held as cash flow hedges | | | 137 | | | | 430 | | | | – | | | | 436 | |
| |
Periods when hedged cash flows are expected to occur and when they are expected to affect the income statement
| | | | | | | | | | | | | | | | |
in€ m. | | Within 1 year | | | 1–3 years | | | 3–5 years | | | Over 5 years | |
As of December 31, 2012 | | | | | | | | | | | | | | | | |
Cash inflows from assets | | | 80 | | | | 133 | | | | 89 | | | | 262 | |
Cash outflows from liabilities | | | (26) | | | | (44) | | | | (33) | | | | (51) | |
| | | | | | | | | | | | | | | | |
Net cash flows 2012 | | | 54 | | | | 89 | | | | 56 | | | | 211 | |
| | | | | | | | | | | | | | | | |
As of December 31, 2011 | | | | | | | | | | | | | | | | |
Cash inflows from assets | | | 46 | | | | 83 | | | | 75 | | | | 302 | |
Cash outflows from liabilities | | | (4) | | | | (4) | | | | – | | | | – | |
| | | | | | | | | | | | | | | | |
Net cash flows 2011 | | | 42 | | | | 79 | | | | 75 | | | | 302 | |
| |
Of these expected future cash flows, most will arise in relation to the Group’s largest cash flow hedging program, Maher Terminals LLC.
Cash Flow Hedge Balances
| | | | | | | | | | | | |
in€ m. | | Dec 31, 2012 | | | Dec 31, 2011 | | | Dec 31, 2010 | |
Reported in Equity1 | | | (341) | | | | (427) | | | | (289) | |
of which relates to terminated programs | | | (17) | | | | (26) | | | | (44) | |
| | | | | | | | | | | | |
Gains (losses) posted to equity for the year ended | | | 42 | | | | (141) | | | | (78) | |
Gains (losses) removed from equity for the year ended | | | (45) | | | | (3) | | | | (4) | |
Ineffectiveness recorded within P&L | | | 1 | | | | – | | | | (3) | |
| |
| 1 | Reported in equity refers to accumulated other comprehensive income as presented in the Consolidated Statement of Comprehensive Income. |
As of December 31, 2012 the longest term cash flow hedge matures in 2027.
Net Investment Hedge Accounting
Using foreign exchange forwards and swaps, the Group enters into hedges of translation adjustments resulting from translating the financial statements of net investments in foreign operations into the reporting currency of the parent at period end spot rates.
| | | | | | | | | | | | | | | | |
in€ m. | | Assets
2012 | | | Liabilities
2012 | | | Assets
2011 | | | Liabilities
2011 | |
Derivatives held as net investment hedges | | | 244 | | | | 790 | | | | 76 | | | | 1,610 | |
| |
For the years ended December 31, 2012, 2011 and 2010, losses of€ 357 million,€ 218 million and€ 197 million, respectively, were recognized due to hedge ineffectiveness which includes the forward points element of the hedging instruments.
| | | | |
| Deutsche Bank | | 02 – Consolidated Financial Statements | | 364 |
| Financial Report 2012 | | Additional Notes | | |
| | 37 – Related Party Transactions | | |
| | |
| | | | |
| | |
| | | | |
37 –
Related Party Transactions
Parties are considered to be related if one party has the ability to directly or indirectly control the other party or exercise significant influence over the other party in making financial or operational decisions. The Group’s related parties include
| — | | key management personnel, close family members of key management personnel and entities which are controlled, significantly influenced by, or for which significant voting power is held by key management personnel or their close family members, |
| — | | subsidiaries, joint ventures and associates and their respective subsidiaries, and |
| — | | post-employment benefit plans for the benefit of Deutsche Bank employees. |
The Group has several business relationships with related parties. Transactions with such parties are made in the ordinary course of business and on substantially the same terms, including interest rates and collateral, as those prevailing at the time for comparable transactions with other parties. These transactions also did not involve more than the normal risk of collectibility or present other unfavorable features.
Transactions with Key Management Personnel
Key management personnel are those persons having authority and responsibility for planning, directing and controlling the activities of Deutsche Bank, directly or indirectly. The Group considers the members of the Management Board and of the Supervisory Board of the parent company to constitute key management personnel for purposes of IAS 24.
Compensation expense of key management personnel
| | | | | | | | | | | | |
in€ m. | | 2012 | | | 2011 | | | 2010 | |
Short-term employee benefits | | | 17 | | | | 14 | | | | 23 | |
| | | | | | | | | | | | |
Post-employment benefits | | | 3 | | | | 3 | | | | 3 | |
| | | | | | | | | | | | |
Other long-term benefits | | | 14 | | | | 6 | | | | 3 | |
| | | | | | | | | | | | |
Termination benefits | | | 15 | | | | – | | | | 2 | |
| | | | | | | | | | | | |
Share-based payment | | | 16 | | | | 5 | | | | 11 | 1 |
| | | | | | | | | | | | |
Total | | | 65 | | | | 28 | | | | 42 | |
| |
| 1 | 2010 amount adjusted for expense of€ 5 million in respect of Equity Upfront Awards granted to the members of the Management Board for 2010 financial year. |
The above mentioned table does not contain compensation that employee representatives and former board members on the Supervisory Board have received. The aggregated compensation paid to such members for their services as employees of Deutsche Bank or status as former employees (retirement, pension and deferred compensation) amounted up to€ 1.6 million as of December 31, 2012,€ 2 million as of December 31, 2011 and€ 2 million as of December 31, 2010.
Among the Group’s transactions with key management personnel as of December 31, 2012 were loans and commitments of€ 7 million and deposits of€ 13 million.
In addition, the Group provides banking services, such as payment and account services as well as investment advice, to key management personnel and their close family members.
During 2010 and through the first quarter of 2011, a member of key management personnel received payments from a Group company. At the time the contractual arrangement was closed the payer company was not included in the Group of consolidated companies.
Transactions with Subsidiaries, Joint Ventures and Associates
Transactions between Deutsche Bank AG and its subsidiaries meet the definition of related party transactions. If these transactions are eliminated on consolidation, they are not disclosed as related party transactions.
| | | | |
| Deutsche Bank | | 02 – Consolidated Financial Statements | | 365 |
| Financial Report 2012 | | Additional Notes | | |
| | 37 – Related Party Transactions | | |
| | |
| | | | |
| | |
| | | | |
Transactions between the Group and its associated companies and joint ventures and their respective subsidiaries also qualify as related party transactions.
Loans
| | | | | | | | |
in€ m. | | | 2012 | | | | 2011 | |
Loans outstanding, beginning of year | | | 5,158 | | | | 4,329 | |
| | | | | | | | |
Loans issued during the year | | | 436 | | | | 1,2111 | |
Loan repayment during the year | | | 4,6112 | | | | 307 | |
Changes in the group of consolidated companies | | | 0 | | | | (13) | |
Exchange rate changes/other | | | (58) | | | | (62) | |
| | | | | | | | |
Loans outstanding, end of year3 | | | 925 | | | | 5,158 | |
| | | | | | | | |
Other credit risk related transactions: | | | | | | | | |
| | | | | | | | |
Allowance for loan losses | | | 47 | | | | 53 | |
| | | | | | | | |
Provision for loan losses | | | 47 | | | | 22 | |
| | | | | | | | |
Guarantees and commitments | | | 55 | | | | 262 | |
| |
| 1 | The increase in loans issued during 2011 is mainly related to the restructuring of a loan transaction in the Americas. |
| 2 | The increase in repayments during 2012 is mainly related to the sale of a restructured loan transaction in Europe. |
| 3 | Loans past due were€ 3 million as of December 31, 2012 and nil as of December 31, 2011. For the above loans the Group held collateral of€ 570 million and€ 963 million as of December 31, 2012 and December 31, 2011, respectively. |
Deposits
| | | | | | | | |
in€ m. | | | 2012 | | | | 2011 | |
Deposits outstanding, beginning of year | | | 247 | | | | 220 | |
| | | | | | | | |
Deposits received during the year | | | 284 | | | | 258 | |
| | | | | | | | |
Deposits repaid during the year | | | 284 | | | | 190 | |
| | | | | | | | |
Changes in the group of consolidated companies | | | (3) | | | | (41) | |
| | | | | | | | |
Exchange rate changes/other | | | 1 | | | | 0 | |
| | | | | | | | |
Deposits outstanding, end of year1 | | | 245 | | | | 247 | |
| |
| 1 | The deposits are unsecured. |
Other Transactions
Trading assets and positive market values from derivative financial transactions with associated companies amounted to€ 110 million as of December 31, 2012 and€ 221 million as of December 31, 2011. Trading liabilities and negative market values from derivative financial transactions with associated companies amounted to€ 4 million as of December 31, 2012 and€ 19 million as of December 31, 2011.
Other transactions with related parties also reflected the following:
Xchanging etb GmbH: The Group holds a stake of 49 % in Xchanging etb GmbH and accounts for it under the equity method. Xchanging etb GmbH is the holding company of Xchanging Transaction Bank GmbH (“XTB”). Two of the five executive directors of Xchanging etb GmbH and two members of the supervisory board of XTB are employees of the Group. The Group’s arrangements with Xchanging include two outsourcing agreements with XTB. One agreement relates to the provision of security settlement services and has a contractual maturity of May 2016. The second agreement relates to the service relationship between XTB and Sal. Oppenheim and has a contractual maturity of December 2014. The outsourcing arrangements are aimed at reducing costs without compromising service quality.
In 2012, the Group received services from XTB with a volume of€ 106 million (2011:€ 104 million). In 2012, the Group provided supply services (e.g., IT and IT infrastructure services) with a volume of€ 21 million (2011:€ 20 million), to XTB.
Hua Xia Bank: The Group holds a stake of 19.99 % in Hua Xia Bank and has accounted for this associate under the equity method since February 11, 2011. Further details are included in Note 18 “Equity Method Investments”. In 2006, Deutsche Bank and Hua Xia Bank jointly established a credit card business cooperation as one of the major pillars of their strategic partnership. The cooperation targets the establishment of a future-oriented credit card business in China comprising the international know-how of Deutsche Bank AG in the credit card business and local expertise of Hua Xia Bank. A provision of€ 87 million has been recognized for the cooperation. This provision captures the Group’s estimated obligation from the cooperation as of December 31, 2012.
| | | | |
| Deutsche Bank | | 02 – Consolidated Financial Statements | | 366 |
| Financial Report 2012 | | Additional Notes | | |
| | 38 – Information on Subsidiaries | | |
| | |
| | | | |
| | |
| | | | |
Transactions with Pension Plans
Under IFRS, certain post-employment benefit plans are considered related parties. The Group has business relationships with a number of its pension plans pursuant to which it provides financial services to these plans, including investment management services. The Group’s pension funds may hold or trade Deutsche Bank shares or securities.
Transactions with related party pension plans
| | | | | | | | |
in€ m. | | 2012 | | | 2011 | |
Equity shares issued by the Group held in plan assets | | | 7 | | | | 4 | |
| | | | | | | | |
Fees paid from plan assets to asset managers of the Group | | | 38 | | | | 24 | |
| | | | | | | | |
Market value of derivatives with a counterparty of the Group | | | (242) | | | | 473 | |
| | | | | | | | |
Notional amount of derivatives with a counterparty of the Group | | | 14,251 | | | | 14,244 | |
| |
38 –
Information on Subsidiaries
Deutsche Bank is the direct or indirect holding company for the Group’s subsidiaries.
Significant Subsidiaries
The following table presents the significant subsidiaries Deutsche Bank owns, directly or indirectly as of December 31, 2012.
| | |
Subsidiary | | Place of Incorporation |
Taunus Corporation1 | | Delaware, United States |
Deutsche Bank Securities Inc.2 | | Delaware, United States |
German American Capital Corporation3 | | Delaware, United States |
| | |
Deutsche Bank Trust Corporation4 | | New York, United States |
Deutsche Bank Trust Company Americas5 | | New York, United States |
| | |
Deutsche Bank Luxembourg S.A.6 | | Luxembourg |
| | |
DWS Investment GmbH7 | | Frankfurt am Main, Germany |
| | |
Deutsche Bank Privat- und Geschäftskunden Aktiengesellschaft8 | | Frankfurt am Main, Germany |
| | |
DB Finanz-Holding GmbH9 | | Frankfurt am Main, Germany |
DB Valoren S.à r.l.10 | | Luxembourg |
DB Equity S.à r.l.11 | | Luxembourg |
Deutsche Postbank AG12 | | Bonn, Germany |
| | |
| 1 | Taunus Corporation is one of two top-level holding companies for the group’s subsidiaries in the United States. Effective February 1, 2012, Taunus Corporation is no longer a bank holding company under Federal Reserve Board regulations. |
| 2 | Deutsche Bank Securities Inc. is a U.S. company registered as a broker dealer and investment advisor with the Securities and Exchange Commission, a municipal advisor with the Municipal Securities Rulemaking Board, and a futures commission merchant with the Commodities Future Trading Commission. It is a member of the New York Stock Exchange and various other exchanges. |
| 3 | German American Capital Corporation is engaged in purchasing and holding loans from financial institutions, trading and securitization of mortgage whole loans and mortgage securities, and providing collateralized financing to counterparties. |
| 4 | Deutsche Bank Trust Corporation is a bank holding company under Federal Reserve Board regulations. |
| 5 | Deutsche Bank Trust Company Americas is a New York State-chartered bank and member of the Federal Reserve System. It originates loans and other forms of credit, accepts deposits, arranges financings and provides numerous other commercial banking and financial services. |
| 6 | The primary business of this company comprises Treasury and Markets activities, especially as a major supplier of Euro liquidity for Deutsche Bank Group. Further business activities are the international loan business, where the bank acts as lending office for continental Europe and as risk hub for credit portfolio strategies group, and private banking. The company serves private individuals, affluent clients and small business clients with banking products. |
| 7 | This company, in which DB Capital Markets (Deutschland) GmbH and DB Finanz-Holding GmbH indirectly own 100 % of the equity and voting interests, is a limited liability company. DWS Investment GmbH is the major German investment management company (KAG) managing traditional mutual funds issued by DWS Investment GmbH and issued by DWS Investment S.A. Luxembourg. |
| 8 | The company serves private individuals, affluent clients and small business clients with banking products. |
| 9 | The company holds the majority stake in Deutsche Postbank AG and a part of the group’s stake in DWS Holding & Service GmbH. |
| 10 | This company is a holding company for the group’s subgroups in Australia, New Zealand, and Singapore. It is also the holding company for DB Equity S.à.r.l. |
| 11 | This company holds a part of the group’s stake in Deutsche Postbank AG. |
| 12 | The business activities of this company comprise retail banking, business with corporate customers, money and capital markets activities as well as home savings loans. |
| | | | |
| Deutsche Bank | | 02 – Consolidated Financial Statements | | 367 |
| Financial Report 2012 | | Additional Notes | | |
| | 38 – Information on Subsidiaries | | |
| | |
| | | | |
| | |
| | | | |
The Group owns 100 % of the equity and voting interests in these subsidiaries, except for Deutsche Postbank AG, of which the Group own shares representing approximately 94.1 % of equity and voting rights. Further detail is included in Note 04 “Acquisitions and Dispositions”. These subsidiaries prepare financial statements as of December 31, 2012 and are included in the Group’s consolidated financial statements. Their principal countries of operation are the same as their countries of incorporation.
Subsidiaries may have restrictions on their ability to transfer funds, including payment of dividends and repayment of loans, to Deutsche Bank AG. Reasons for the restrictions include:
| — | | Central bank restrictions relating to local exchange control laws |
| — | | Central bank capital adequacy requirements |
| — | | Local corporate laws, for example limitations regarding the transfer of funds to the parent when the respective entity has a loss carried forward not covered by retained earnings or other components of capital. |
Subsidiaries where the Group owns 50 percent or less of the Voting Rights
The Group also consolidates certain subsidiaries although it owns 50 % or less of the voting rights. Most of those subsidiaries are special purpose entities (“SPEs”) that are sponsored by the Group for a variety of purposes.
In the normal course of business, the Group becomes involved with SPEs, primarily through the following types of transactions: asset securitizations, commercial paper programs, repackaging and investment products, mutual funds, structured transactions, leasing and closed-end funds. The Group’s involvement includes transferring assets to the entities, entering into derivative contracts with them, providing credit enhancement and liquidity facilities, providing investment management and administrative services, and holding ownership or other investment interests in the entities.
Investees where the Group owns more than half of the Voting Rights
The Group owns directly or indirectly more than half of the voting rights of investees but does not have control over these investees when
| — | | another investor has the power over more than half of the voting rights by virtue of an agreement with the Group, or |
| — | | another investor has the power to govern the financial and operating policies of the investee under a statute or an agreement, or |
| — | | another investor has the power to appoint or remove the majority of the members of the board of directors or equivalent governing body and the investee is controlled by that board or body, or when |
| — | | another investor has the power to cast the majority of votes at meetings of the board of directors or equivalent governing body and control of the entity is by that board or body. |
| | | | |
| Deutsche Bank | | 02 – Consolidated Financial Statements | | 368 |
| Financial Report 2012 | | Additional Notes 39 – Insurance and Investment Contracts | | |
| | |
| | | | |
| | |
| | | | |
39 –
Insurance and Investment Contracts
Liabilities arising from Insurance and Investment Contracts
| | | | | | | | | | | | | | | | | | | | | | | | |
| | | Dec 31, 2012 | | | Dec 31, 2011 | |
in€ m. | | Gross | | | Reinsurance | | | Net | | | Gross | | | Reinsurance | | | Net | |
Insurance contracts | | | 4,654 | | | | (73) | | | | 4,581 | | | | 4,706 | | | | (163) | | | | 4,543 | |
| | | | | | | | | | | | | | | | | | | | | | | | |
Investment contracts | | | 7,732 | | | | – | | | | 7,732 | | | | 7,426 | | | | – | | | | 7,426 | |
| | | | | | | | | | | | | | | | | | | | | | | | |
Total | | | 12,386 | | | | (73) | | | | 12,313 | | | | 12,132 | | | | (163) | | | | 11,969 | |
| |
Generally, amounts relating to reinsurance contracts are reported gross unless they have an immaterial impact on their respective balance sheet line items.
Carrying Amount
The following table presents an analysis of the change in insurance and investment contracts liabilities.
| | | | | | | | | | | | | | | | |
| | | 2012 | | | 2011 | |
in€ m. | | Insurance
contracts | | | Investment
contracts | | | Insurance
contracts | | | Investment
contracts | |
Balance, beginning of year | | | 4,706 | | | | 7,426 | | | | 4,899 | | | | 7,898 | |
| | | | | | | | | | | | | | | | |
New business | | | 230 | | | | 153 | | | | 231 | | | | 150 | |
Claims/withdrawals paid | | | (502) | | | | (646) | | | | (490) | | | | (562) | |
Other changes in existing business | | | 94 | | | | 617 | | | | (85) | | | | (284) | |
Exchange rate changes | | | 126 | | | | 182 | | | | 151 | | | | 224 | |
| | | | | | | | | | | | | | | | |
Balance, end of year | | | 4,654 | | | | 7,732 | | | | 4,706 | | | | 7,426 | |
| |
Other changes in existing business for the investment contracts of€ 617 million and€ (284) million are principally attributable to changes in the fair value of underlying assets for the years ended December 31, 2012 and 2011, respectively.
As of December 31, 2012 the Group had insurance contract liabilities of€ 4.7 billion. Of this,€ 2.4 billion represents traditional annuities in payment,€ 1.8 billion universal life contracts and€ 428 million unit linked pension contracts with guaranteed annuity rates. Guaranteed annuity rates give the policyholder the option, on retirement, to take up a traditional annuity at a rate that was fixed at the inception of the policy. The liability of€ 428 million for unit linked pension contracts with guaranteed annuity rates is made up of the unit linked liability of€ 300 million and a best estimate reserve of€ 128 million for the guaranteed annuity rates. The latter is calculated using the differential between the fixed and best estimate rate, the size of the unit linked liability and an assumption on take up rate.
As of December 31, 2011 the Group had insurance contract liabilities of€ 4.7 billion. Of this,€ 2.3 billion represents traditional annuities in payment,€ 2.0 billion universal life contracts and€ 459 million unit linked pension contracts with guaranteed annuity rates (made up of a unit linked liability of€ 323 million and a best estimate reserve of€ 136 million for the guaranteed annuity rates).
Key Assumptions in relation to Insurance Business
The liabilities will vary with movements in interest rates, which are applicable, in particular, to the cost of guaranteed benefits payable in the future, investment returns and the cost of life assurance and annuity benefits where future mortality is uncertain.
| | | | |
| Deutsche Bank | | 02 – Consolidated Financial Statements | | 369 |
| Financial Report 2012 | | Additional Notes 39 – Insurance and Investment Contracts | | |
| | |
| | | | |
| | |
| | | | |
Assumptions are made related to all material factors affecting future cash flows, including future interest rates, mortality and costs. The assumptions to which the long term business amount is most sensitive are the interest rates used to discount the cash flows and the mortality assumptions, particularly those for annuities.
The assumptions are set out below:
Interest Rates
Interest rates are used that reflect a best estimate of future investment returns taking into account the nature and term of the assets used to support the liabilities. Suitable margins for default risk are allowed for in the assumed interest rate.
Mortality
Mortality rates are based on published tables, adjusted appropriately to take into account changes in the underlying population mortality since the table was published, company experience and forecast changes in future mortality. If appropriate, a margin is added to assurance mortality rates to allow for adverse future deviations. Annuitant mortality rates are adjusted to make allowance for future improvements in pensioner longevity. Improvements in annuitant mortality are based on 100 % of the Continuous Mortality Investigation 2011 mortality improvement tables with an ultimate rate of improvement of 1 % per annum.
Costs
For non-linked contracts, allowance is made explicitly for future expected per policy costs.
Other Assumptions
The take-up rate of guaranteed annuity rate options on pension business is assumed to be 67 % for the year ended December 31, 2012 and 66 % for the year ended December 31, 2011.
Key Assumptions impacting Value of Business Acquired (VOBA)
The opening VOBA arising on the purchase of Abbey Life Assurance Company Limited was determined by capitalizing the present value of the future cash flows of the business over the reported liability at the date of acquisition. If assumptions were required about future mortality, morbidity, persistency and expenses, they were determined on a best estimate basis taking into account the business’s own experience. General economic assumptions were set considering the economic indicators at the date of acquisition.
The rate of VOBA amortization is determined by considering the profile of the business acquired and the expected depletion in future value. At the end of each accounting period, the remaining VOBA is tested against the future net profit expected related to the business that was in force at the date of acquisition.
If there is insufficient net profit, the VOBA will be written down to its supportable value.
Key Changes in Assumptions
Upon acquisition of Abbey Life Assurance Company Limited in October 2007, liabilities for insurance contracts were recalculated from a regulatory basis to a best estimate basis in line with the provisions of IFRS 4. The non-economic assumptions set at that time have not been changed but the economic assumptions have been reviewed in line with changes in key economic indicators. For annuity contracts, the liability was valued using the locked-in basis determined at the date of acquisition.
| | | | |
Deutsche Bank Financial Report 2012 | | 02 – Consolidated Financial Statements Additional Notes | | 370 |
| | 40 – Current and Non-Current Assets and Liabilities | | |
| | |
| | | | |
| | |
| | | | |
Sensitivity Analysis (in respect of Insurance Contracts only)
The following table presents the sensitivity of the Group’s profit before tax and equity to changes in some of the key assumptions used for insurance contract liability calculations. For each sensitivity test, the impact of a reasonably possible change in a single factor is shown with other assumptions left unchanged.
| | | | | | | | | | | | | | | | |
| | | Impact on profit before tax | | | Impact on equity | |
in€ m. | | 2012 | | | 2011 | | | 2012 | | | 20112 | |
Variable: | | | | | | | | | | | | | | | | |
| | | | | | | | | | | | | | | | |
Mortality (worsening by ten percent)1 | | | (10) | | | | (12) | | | | (8) | | | | (9) | |
| | | | | | | | | | | | | | | | |
Renewal expense (ten percent increase) | | | (1) | | | | (3) | | | | (1) | | | | (2) | |
| | | | | | | | | | | | | | | | |
Interest rate (one percent increase) | | | 12 | | | | 17 | | | | (151) | | | | (116) | |
| |
| 1 | The impact of mortality assumes a ten percent decrease in annuitant mortality and a ten percent increase in mortality for other business. |
For certain insurance contracts, the underlying valuation basis contains a Provision for Adverse Deviations (“PADs”). For these contracts any worsening of expected future experience would not change the level of reserves held until all the PADs have been eroded while any improvement in experience would not result in an increase to these reserves. Therefore, in the sensitivity analysis, if the variable change represents a worsening of experience, the impact shown represents the excess of the best estimate liability over the PADs held at the balance sheet date. As a result, the figures disclosed in this table should not be used to imply the impact of a different level of change and it should not be assumed that the impact would be the same if the change occurred at a different point in time.
40 –
Current and Non-Current Assets and Liabilities
Asset and liability line item by amounts recovered or settled within or after one year
Asset items as of December 31, 2012
| | | | | | | | | | | | |
| | | Amounts recovered or settled | | | Total | |
in€ m. | | within one year | | | after one year | | | Dec 31, 2012 | |
Cash and due from banks | | | 27,885 | | | | – | | | | 27,885 | |
| | | | | | | | | | | | |
Interest-earning deposits with banks | | | 119,288 | | | | 260 | | | | 119,548 | |
| | | | | | | | | | | | |
| Central bank funds sold and securities purchased under resale agreements | | | 36,451 | | | | 119 | | | | 36,570 | |
| | | | | | | | | | | | |
Securities borrowed | | | 23,851 | | | | 96 | | | | 23,947 | |
| | | | | | | | | | | | |
Financial assets at fair value through profit or loss | | | 1,171,975 | | | | 28,906 | | | | 1,200,881 | |
| | | | | | | | | | | | |
Financial assets available for sale | | | 9,269 | | | | 40,110 | | | | 49,379 | |
| | | | | | | | | | | | |
Equity method investments | | | – | | | | 3,577 | | | | 3,577 | |
| | | | | | | | | | | | |
Loans | | | 125,483 | | | | 271,796 | | | | 397,279 | |
| | | | | | | | | | | | |
Property and equipment | | | – | | | | 4,963 | | | | 4,963 | |
| | | | | | | | | | | | |
Goodwill and other intangible assets | | | – | | | | 14,219 | | | | 14,219 | |
| | | | | | | | | | | | |
Other assets | | | 112,108 | | | | 11,865 | | | | 123,973 | |
| | | | | | | | | | | | |
Assets for current tax | | | 2,125 | | | | 265 | | | | 2,390 | |
| | | | | | | | | | | | |
Total assets before deferred tax assets | | | 1,628,435 | | | | 376,176 | | | | 2,004,611 | |
| | | | | | | | | | | | |
Deferred tax assets | | | | | | | | | | | 7,718 | |
| | | | | | | | | | | | |
Total assets | | | | | | | | | | | 2,012,329 | |
| |
| | | | |
| Deutsche Bank | | 02 – Consolidated Financial Statements | | 371 |
| Financial Report 2012 | | Additional Notes | | |
| | 40 – Current and Non-Current Assets and Liabilities | | |
| | |
| | | | |
| | |
| | | | |
Liability items as of December 31, 2012
| | | | | | | | | | | | |
| | | Amounts recovered or settled | | | Total | |
in€ m. | | within one year | | | after one year | | | Dec 31, 2012 | |
Deposits | | | 544,937 | | | | 32,265 | | | | 577,202 | |
| | | | | | | | | | | | |
| Central bank funds purchased and securities sold under repurchase agreements | | | 36,144 | | | | – | | | | 36,144 | |
| | | | | | | | | | | | |
Securities loaned | | | 3,076 | | | | 33 | | | | 3,109 | |
| | | | | | | | | | | | |
Financial liabilities at fair value through profit or loss | | | 907,615 | | | | 16,903 | | | | 924,518 | |
| | | | | | | | | | | | |
Other short-term borrowings | | | 69,060 | | | | – | | | | 69,060 | |
| | | | | | | | | | | | |
Other liabilities | | | 164,234 | | | | 5,310 | | | | 169,544 | |
| | | | | | | | | | | | |
| Provisions | | | 5,110 | | | | – | | | | 5,110 | |
| | | | | | | | | | | | |
Liabilities for current tax | | | 962 | | | | 627 | | | | 1,589 | |
| | | | | | | | | | | | |
Long-term debt | | | 39,920 | | | | 118,177 | | | | 158,097 | |
| | | | | | | | | | | | |
Trust preferred securities | | | 4,707 | | | | 7,384 | | | | 12,091 | |
| | | | | | | | | | | | |
Total liabilities before deferred tax liabilities | | | 1,775,765 | | | | 180,699 | | | | 1,956,464 | |
| | | | | | | | | | | | |
Deferred tax liabilities | | | | | | | | | | | 1,455 | |
| | | | | | | | | | | | |
Total liabilities | | | | | | | | | | | 1,957,919 | |
| |
Asset items as of December 31, 2011
| | | | | | | | | | | | |
| | | Amounts recovered or settled | | | Total | |
in€ m. | | within one year | | | after one year | | | Dec 31, 2011 | |
Cash and due from banks | | | 15,928 | | | | – | | | | 15,928 | |
| | | | | | | | | | | | |
Interest-earning deposits with banks | | | 160,834 | | | | 1,166 | | | | 162,000 | |
| | | | | | | | | | | | |
| Central bank funds sold and securities purchased under resale agreements | | | 25,297 | | | | 476 | | | | 25,773 | |
| | | | | | | | | | | | |
Securities borrowed | | | 31,310 | | | | 27 | | | | 31,337 | |
| | | | | | | | | | | | |
Financial assets at fair value through profit or loss | | | 1,252,616 | | | | 28,183 | | | | 1,280,799 | |
| | | | | | | | | | | | |
Financial assets available for sale | | | 7,511 | | | | 37,770 | | | | 45,281 | |
| | | | | | | | | | | | |
Equity method investments | | | – | | | | 3,759 | | | | 3,759 | |
| | | | | | | | | | | | |
Loans | | | 133,236 | | | | 279,278 | | | | 412,514 | |
| | | | | | | | | | | | |
Property and equipment | | | – | | | | 5,509 | | | | 5,509 | |
| | | | | | | | | | | | |
Goodwill and other intangible assets | | | – | | | | 15,802 | | | | 15,802 | |
| | | | | | | | | | | | |
Other assets | | | 144,102 | | | | 10,692 | | | | 154,794 | |
| | | | | | | | | | | | |
Assets for current tax | | | 1,646 | | | | 224 | | | | 1,870 | |
| | | | | | | | | | | | |
Total assets before deferred tax assets | | | 1,772,480 | | | | 382,886 | | | | 2,155,366 | |
| | | | | | | | | | | | |
Deferred tax assets | | | | | | | | | | | 8,737 | |
| | | | | | | | | | | | |
Total assets | | | | | | | | | | | 2,164,103 | |
| |
Liability items as of December 31, 2011
| | | | | | | | | | | | |
| | | Amounts recovered or settled | | | Total | |
in€ m. | | within one year | | | after one year | | | Dec 31, 2011 | |
Deposits | | | 568,628 | | | | 33,102 | | | | 601,730 | |
| | | | | | | | | | | | |
Central bank funds purchased and securities sold under repurchase agreements | | | 35,292 | | | | 19 | | | | 35,311 | |
| | | | | | | | | | | | |
| Securities loaned | | | 7,638 | | | | 451 | | | | 8,089 | |
| | | | | | | | | | | | |
Financial liabilities at fair value through profit or loss | | | 1,010,015 | | | | 18,432 | | | | 1,028,447 | |
| | | | | | | | | | | | |
Other short-term borrowings | | | 65,356 | | | | – | | | | 65,356 | |
| | | | | | | | | | | | |
| Other liabilities | | | 179,294 | | | | 8,522 | | | | 187,816 | |
| | | | | | | | | | | | |
Provisions | | | 2,621 | | | | – | | | | 2,621 | |
| | | | | | | | | | | | |
Liabilities for current tax | | | 1,381 | | | | 1,143 | | | | 2,524 | |
| | | | | | | | | | | | |
Long-term debt | | | 30,317 | | | | 133,099 | | | | 163,416 | |
| | | | | | | | | | | | |
Trust preferred securities | | | 2,600 | | | | 9,744 | | | | 12,344 | |
| | | | | | | | | | | | |
| Total liabilities before deferred tax liabilities | | | 1,903,142 | | | | 204,512 | | | | 2,107,654 | |
| | | | | | | | | | | | |
Deferred tax liabilities | | | | | | | | | | | 1,789 | |
| | | | | | | | | | | | |
Total liabilities | | | | | | | | | | | 2,109,443 | |
| |
| | | | |
| Deutsche Bank | | 02 – Consolidated Financial Statements | | 372 |
| Financial Report 2012 | | Additional Notes | | |
| | 41 – Events after the Reporting Date | | |
| | |
| | | | |
| | |
| | | | |
41 –
Events after the Reporting Date
All significant adjusting events that occurred after the reporting date were recognized in the Group’s results of operations, financial position and net assets.
| | | | |
| Deutsche Bank | | 02 – Consolidated Financial Statements | | 373 |
| Annual Report 2012 on Form 20-F | | Additional Notes | | |
| | 42 – Condensed Deutsche Bank AG (Parent Company only) Financial Information | | |
| | |
| | | | |
| | |
| | | | |
42 –
Condensed Deutsche Bank AG (Parent Company only) Financial Information
Condensed Statement of Income
| | | | | | | | | | | | |
in€ m. | | 2012 | | | 2011 | | | 2010 | |
Interest income, excluding dividends from subsidiaries | | | 14,816 | | | | 16,109 | | | | 15,421 | |
| | | | | | | | | | | | |
Dividends received from subsidiaries: | | | | | | | | | | | | |
| | | | | | | | | | | | |
Bank subsidiaries | | | 1,256 | | | | 485 | | | | 302 | |
Nonbank subsidiaries | | | 2,850 | | | | 1,719 | | | | 1,941 | |
| | | | | | | | | | | | |
Interest expense | | | 10,907 | | | | 12,051 | | | | 10,432 | |
| | | | | | | | | | | | |
Net interest and dividend income | | | 8,015 | | | | 6,262 | | | | 7,232 | |
| | | | | | | | | | | | |
Provision for credit losses | | | 361 | | | | 404 | | | | 395 | |
| | | | | | | | | | | | |
Net interest and dividend income after provision for credit losses | | | 7,654 | | | | 5,858 | | | | 6,837 | |
| | | | | | | | | | | | |
Noninterest income: | | | | | | | | | | | | |
| | | | | | | | | | | | |
Commissions and fee income | | | 3,313 | | | | 3,471 | | | | 3,528 | |
Net gains (losses) on financial assets/liabilities at fair value through profit or loss | | | 4,092 | | | | 5,264 | | | | 3,278 | |
Other income (loss)1 | | | (2,652) | | | | (1,619) | | | | (570) | |
| | | | | | | | | | | | |
Total noninterest income | | | 4,753 | | | | 7,116 | | | | 6,236 | |
| | | | | | | | | | | | |
Noninterest expenses: | | | | | | | | | | | | |
| | | | | | | | | | | | |
Compensation and benefits | | | 5,726 | | | | 5,336 | | | | 5,954 | |
General and administrative expenses | | | 6,957 | | | | 4,931 | | | | 4,660 | |
Services provided by (to) affiliates, net | | | (126) | | | | (31) | | | | (120) | |
| | | | | | | | | | | | |
Total noninterest expenses | | | 12,557 | | | | 10,236 | | | | 10,494 | |
| | | | | | | | | | | | |
Income (loss) before income taxes | | | (150) | | | | 2,738 | | | | 2,579 | |
| | | | | | | | | | | | |
Income tax expense (benefit) | | | (173) | | | | 937 | | | | 592 | |
| | | | | | | | | | | | |
Net income (loss) attributable to Deutsche Bank shareholders | | | 23 | | | | 1,801 | | | | 1,987 | |
| |
| 1 | Includes net gains (losses) on financial assets available for sale and impairments/write-ups on investments in subsidiaries. |
| | | | |
| Deutsche Bank | | 02 – Consolidated Financial Statements | | 374 |
| Annual Report 2012 on Form 20-F | | Additional Notes | | |
| | 42 – Condensed Deutsche Bank AG (Parent Company only) Financial Information | | |
| | |
| | | | |
| | |
| | | | |
Condensed Balance Sheet
| | | | | | | | |
in€ m. | | Dec 31, 2012 | | | Dec 31, 2011 | |
Assets: | | | | | | | | |
| | | | | | | | |
Cash and due from banks: | | | | | | | | |
Bank subsidiaries | | | 344 | | | | 470 | |
Other | | | 19,261 | | | | 8,456 | |
| | | | | | | | |
Interest-earning deposits with banks: | | | | | | | | |
Bank subsidiaries | | | 86,498 | | | | 88,200 | |
Other | | | 99,584 | | | | 128,211 | |
| | | | | | | | |
Central bank funds sold, securities purchased under resale agreements, securities borrowed: | | | | | | | | |
Bank subsidiaries | | | 3,394 | | | | 5,802 | |
Nonbank subsidiaries | | | 53,215 | | | | 50,714 | |
Other | | | 15,295 | | | | 19,382 | |
| | | | | | | | |
Financial assets at fair value through profit or loss: | | | | | | | | |
Bank subsidiaries | | | 15,661 | | | | 16,750 | |
Nonbank subsidiaries | | | 22,977 | | | | 26,023 | |
Other | | | 986,434 | | | | 1,073,375 | |
| | | | | | | | |
Financial assets available for sale | | | 13,149 | | | | 9,245 | |
| | | | | | | | |
Investments in associates | | | 881 | | | | 1,314 | |
| | | | | | | | |
Investment in subsidiaries: | | | | | | | | |
Bank subsidiaries | | | 15,345 | | | | 15,056 | |
Nonbank subsidiaries | | | 34,889 | | | | 32,432 | |
| | | | | | | | |
Loans: | | | | | | | | |
| | | | | | | | |
Bank subsidiaries | | | 17,392 | | | | 15,391 | |
Nonbank subsidiaries | | | 74,775 | | | | 87,105 | |
Other | | | 110,523 | | | | 119,308 | |
| | | | | | | | |
Other assets: | | | | | | | | |
Bank subsidiaries | | | 4,126 | | | | 3,811 | |
Nonbank subsidiaries | | | 10,062 | | | | 22,679 | |
Other | | | 108,280 | | | | 115,738 | |
| | | | | | | | |
Total assets | | | 1,692,085 | | | | 1,839,462 | |
| | | | | | | | |
Liabilities and shareholders’ equity: | | | | | | | | |
| | | | | | | | |
Deposits: | | | | | | | | |
Bank subsidiaries | | | 126,615 | | | | 126,857 | |
Nonbank subsidiaries | | | 48,537 | | | | 65,792 | |
Other | | | 278,868 | | | | 292,470 | |
| | | | | | | | |
Central bank funds purchased, securities sold under repurchase agreements and securities loaned: | | | | | | | | |
Bank subsidiaries | | | 1,676 | | | | 6,619 | |
Nonbank subsidiaries | | | 31,101 | | | | 26,883 | |
Other | | | 6,079 | | | | 7,451 | |
| | | | | | | | |
Financial liabilities at fair value through profit or loss: | | | | | | | | |
Bank subsidiaries | | | 12,649 | | | | 13,756 | |
Nonbank subsidiaries | | | 15,056 | | | | 16,632 | |
Other | | | 809,570 | | | | 907,959 | |
| | | | | | | | |
Other short-term borrowings: | | | | | | | | |
Bank subsidiaries | | | 266 | | | | 1,483 | |
Nonbank subsidiaries | | | 17 | | | | 1,224 | |
Other | | | 32,745 | | | | 22,906 | |
| | | | | | | | |
Other liabilities: | | | | | | | | |
Bank subsidiaries | | | 2,862 | | | | 2,859 | |
Nonbank subsidiaries | | | 23,565 | | | | 35,165 | |
Other | | | 135,751 | | | | 129,474 | |
| | | | | | | | |
Long-term debt | | | 127,653 | | | | 142,614 | |
| | | | | | | | |
Total liabilities | | | 1,653,010 | | | | 1,800,144 | |
| | | | | | | | |
Total shareholders’ equity | | | 39,075 | | | | 39,318 | |
| | | | | | | | |
Total liabilities and shareholders’ equity | | | 1,692,085 | | | | 1,839,462 | |
| |
| | | | | | | | |
| | | | |
| Deutsche Bank | | 02 – Consolidated Financial Statements | | 375 |
| Annual Report 2012 on Form 20-F | | Additional Notes | | |
| | 42 – Condensed Deutsche Bank AG (Parent Company only) Financial Information | | |
| | |
| | | | |
| | |
| | | | |
Condensed Statement of Cash Flows
| | | | | | | | | | | | |
in€ m. | | 2012 | | | 2011 | | | 2010 | |
Net cash provided by (used in) operating activities | | | (10,032) | | | | 17,304 | �� | | | 19,151 | |
| | | | | | | | | | | | |
Cash flows from investing activities: | | | | | | | | | | | | |
| | | | | | | | | | | | |
Proceeds from: | | | | | | | | | | | | |
Sale of financial assets available for sale | | | 4,432 | | | | 5,007 | | | | 4,901 | |
Maturities of financial assets available for sale | | | 3,980 | | | | 1,617 | | | | 1,724 | |
Sale of investments in associates | | | 68 | | | | 52 | | | | 144 | |
Sale of property and equipment | | | 55 | | | | 38 | | | | 51 | |
| | | | | | | | | | | | |
Purchase of: | | | | | | | | | | | | |
Financial assets available for sale | | | (13,264) | | | | (7,228) | | | | (5,882) | |
Investments in associates | | | (7) | | | | (7) | | | | (54) | |
Property and equipment | | | (270) | | | | (359) | | | | (571) | |
Net change in investments in subsidiaries | | | (1,953) | | | | (426) | | | | (6,246) | |
Other, net | | | (475) | | | | (418) | | | | (304) | |
| | | | | | | | | | | | |
Net cash provided by (used in) investing activities | | | (7,434) | | | | (1,724) | | | | (6,237) | |
| | | | | | | | | | | | |
Cash flows from financing activities: | | | | | | | | | | | | |
| | | | | | | | | | | | |
Issuances of subordinated long-term debt | | | 22 | | | | 10 | | | | 1,246 | |
Repayments and extinguishments of subordinated long-term debt | | | (396) | | | | (283) | | | | (88) | |
Capital increase | | | – | | | | – | | | | 10,060 | |
Purchases of treasury shares | | | (11,851) | | | | (13,123) | | | | (14,369) | |
Sale of treasury shares | | | 11,148 | | | | 11,595 | | | | 12,709 | |
Cash dividends paid | | | (689) | | | | (691) | | | | (465) | |
| | | | | | | | | | | | |
Net cash provided by (used in) financing activities | | | (1,766) | | | | (2,492) | | | | 9,093 | |
| | | | | | | | | | | | |
Net effect of exchange rate changes on cash and cash equivalents | | | (64) | | | | (207) | | | | 502 | |
Net increase (decrease) in cash and cash equivalents | | | (19,296) | | | | 12,881 | | | | 22,509 | |
Cash and cash equivalents at beginning of period | | | 94,505 | | | | 81,624 | | | | 59,115 | |
Cash and cash equivalents at end of period | | | 75,209 | | | | 94,505 | | | | 81,624 | |
| | | | | | | | | | | | |
Net cash provided by (used in) operating activities include | | | | | | | | | | | | |
| | | | | | | | | | | | |
Income taxes paid (received), net | | | 614 | | | | 432 | | | | (93) | |
| | | | | | | | | | | | |
Interest paid | | | 11,327 | | | | 12,272 | | | | 10,439 | |
| | | | | | | | | | | | |
Interest and dividends received | | | 19,362 | | | | 16,652 | | | | 17,691 | |
| | | | | | | | | | | | |
Cash and cash equivalents comprise | | | | | | | | | | | | |
| | | | | | | | | | | | |
Cash and due from banks | | | 19,604 | | | | 8,926 | | | | 8,956 | |
| | | | | | | | | | | | |
Demand deposits with banks | | | 59,095 | | | | 85,579 | | | | 72,668 | |
| | | | | | | | | | | | |
Total | | | 78,699 | | | | 94,505 | | | | 81,624 | |
| |
Parent Company’s long-term Debt by Remaining Maturities
| | | | | | | | | | | | | | | | | | | | | | | | | | | | | | | | |
By remaining maturities | | Due in
2013 | | | Due in
2014 | | | Due in
2015 | | | Due in
2016 | | | Due in
2017 | | | Due after
2017 | | | Total
Dec 31,
2012 | | | Total
Dec 31,
2011 | |
in€ m. | | | | | | | | | | | | | | | | | | | | | | | | | | | | | | | | |
| | | | | | | | | | | | | | | | | | | | | | | | | | | | | | | | |
Senior debt: | | | | | | | | | | | | | | | | | | | | | | | | | | | | | | | | |
| | | | | | | | | | | | | | | | | | | | | | | | | | | | | | | | |
Bonds and notes: | | | | | | | | | | | | | | | | | | | | | | | | | | | | | | | | |
Fixed rate | | | 10,001 | | | | 8,184 | | | | 10,614 | | | | 10,290 | | | | 10,294 | | | | 19,543 | | | | 68,926 | | | | 73,918 | |
Floating rate | | | 10,502 | | | | 4,809 | | | | 4,599 | | | | 2,758 | | | | 5,197 | | | | 11,920 | | | | 39,785 | | | | 49,102 | |
| | | | | | | | | | | | | | | | | | | | | | | | | | | | | | | | |
Subordinated debt | | | | | | | | | | | | | | | | | | | | | | | | | | | | | | | | |
| | | | | | | | | | | | | | | | | | | | | | | | | | | | | | | | |
Bonds and notes: | | | | | | | | | | | | | | | | | | | | | | | | | | | | | | | | |
Fixed rate | | | 4,312 | | | | 393 | | | | 1,600 | | | | – | | | | 40 | | | | 7,074 | | | | 13,419 | | | | 14,613 | |
Floating rate | | | 4,262 | | | | 326 | | | | 84 | | | | – | | | | – | | | | 851 | | | | 5,523 | | | | 4,981 | |
| | | | | | | | | | | | | | | | | | | | | | | | | | | | | | | | |
Total long-term debt | | | 29,077 | | | | 13,712 | | | | 16,897 | | | | 13,048 | | | | 15,531 | | | | 39,388 | | | | 127,653 | | | | 142,614 | |
| |
| | | | | | | | | | | | | | | | | | | | | | | | | | | | | | | | |
| | | | |
| Deutsche Bank | | 02 – Consolidated Financial Statements | | 376 |
| Annual Report 2012 on Form 20-F | | Additional Notes | | |
| | 43 – Condensed Consolidating Financial Information | | |
| | |
| | | | |
| | |
| | | | |
43 – Condensed Consolidating Financial Information
On June 4, 1999, Deutsche Bank, acting through a subsidiary, acquired all outstanding shares of Deutsche Bank Trust Corporation (formerly Bankers Trust Corporation), a bank holding company headquartered in New York. Deutsche Bank conducts some of its activities in the United States through Deutsche Bank Trust Corporation and its subsidiaries (“DBTC”). On July 10, 2002, Deutsche Bank issued full and unconditional guarantees of DBTC’s outstanding SEC-registered obligations. DBTC is a 100 % owned subsidiary of Deutsche Bank. Set forth below is condensed consolidating financial information regarding the Parent, DBTC and other subsidiaries of Deutsche Bank on a combined basis.
| | | | | | | | | | | | | | | | | | | | |
Condensed Consolidating Statement of Income 2012 in€ m. | | Parent | | | DBTC | | | Other sub-
sidiaries | | | Consolidating
entries | | | Deutsche
Bank AG
consolidated | |
Net interest income: | | | | | | | | | | | | | | | | | | | | |
Interest income, including dividends from subsidiaries | | | 18,922 | | | | 625 | | | | 27,564 | | | | (14,869) | | | | 32,242 | |
Interest expense | | | 10,907 | | | | 151 | | | | 14,406 | | | | (9,113) | | | | 16,351 | |
| | | | | | | | | | | | | | | | | | | | |
Net interest and dividend income | | | 8,015 | | | | 474 | | | | 13,158 | | | | (5,756) | | | | 15,891 | |
| | | | | | | | | | | | | | | | | | | | |
Provision for credit losses | | | 361 | | | | 11 | | | | 1,349 | | | | – | | | | 1,721 | |
| | | | | | | | | | | | | | | | | | | | |
| Net interest and dividend income after provision for credit losses | | | 7,654 | | | | 463 | | | | 11,809 | | | | (5,756) | | | | 14,170 | |
| | | | | | | | | | | | | | | | | | | | |
Noninterest income: | | | | | | | | | | | | | | | | | | | | |
Commissions and fee income | | | 3,313 | | | | 892 | | | | 7,305 | | | | – | | | | 11,510 | |
Net gains (losses) on financial assets/liabilities at fair value through profit or loss | | | 4,092 | | | | (205) | | | | 1,156 | | | | 556 | | | | 5,599 | |
Net gains (losses) on financial assets available for sale | | | 158 | | | | (3) | | | | 127 | | | | 19 | | | | 301 | |
Other income | | | (2,810) | | | | (23) | | | | 1,669 | | | | 1,604 | | | | 440 | |
| | | | | | | | | | | | | | | | | | | | |
Total noninterest income | | | 4,753 | | | | 661 | | | | 10,257 | | | | 2,179 | | | | 17,850 | |
| | | | | | | | | | | | | | | | | | | | |
Noninterest expenses: | | | | | | | | | | | | | | | | | | | | |
Compensation and benefits | | | 5,726 | | | | 433 | | | | 7,367 | | | | – | | | | 13,526 | |
Other expenses | | | 6,831 | | | | 204 | | | | 9,630 | | | | 1,045 | | | | 17,710 | |
| | | | | | | | | | | | | | | | | | | | |
Total noninterest expenses | | | 12,557 | | | | 637 | | | | 16,997 | | | | 1,045 | | | | 31,236 | |
| | | | | | | | | | | | | | | | | | | | |
Income (loss) before income taxes | | | (150) | | | | 487 | | | | 5,069 | | | | (4,622) | | | | 784 | |
| | | | | | | | | | | | | | | | | | | | |
Income tax expense (benefit) | | | (173) | | | | 329 | | | | 801 | | | | (464) | | | | 493 | |
| | | | | | | | | | | | | | | | | | | | |
Net income (loss) | | | 23 | | | | 158 | | | | 4,268 | | | | (4,158) | | | | 291 | |
| | | | | | | | | | | | | | | | | | | | |
Net income (loss) attributable to noncontrolling interests | | | – | | | | – | | | | – | | | | 54 | | | | 54 | |
| | | | | | | | | | | | | | | | | | | | |
| Net income (loss) attributable to Deutsche Bank shareholders | | | 23 | | | | 158 | | | | 4,268 | | | | (4,212) | | | | 237 | |
| | | | | |
| | | | |
| Deutsche Bank | | 02 – Consolidated Financial Statements | | 377 |
| Annual Report 2012 on Form 20-F | | Additional Notes | | |
| | 43 – Condensed Consolidating Financial Information | | |
| | |
| | | | |
| | |
| | | | |
| | | | | | | | | | | | | | | | | | | | |
2011 in€ m. | | Parent | | | DBTC | | | Other sub-
sidiaries | | | Consolidating
entries | | | Deutsche
Bank AG
consolidated | |
Net interest income: | | | | | | | | | | | | | | | | | | | | |
Interest income, including dividends from subsidiaries | | | 18,313 | | | | 506 | | | | 31,367 | | | | (15,308) | | | | 34,878 | |
Interest expense | | | 12,051 | | | | 98 | | | | 16,433 | | | | (11,149) | | | | 17,433 | |
| | | | | | | | | | | | | | | | | | | | |
Net interest and dividend income | | | 6,262 | | | | 408 | | | | 14,934 | | | | (4,159) | | | | 17,445 | |
| | | | | | | | | | | | | | | | | | | | |
Provision for credit losses | | | 404 | | | | 10 | | | | 1,551 | | | | (126) | | | | 1,839 | |
| | | | | | | | | | | | | | | | | | | | |
Net interest and dividend income after provision for credit losses | | | 5,858 | | | | 398 | | | | 13,383 | | | | (4,033) | | | | 15,606 | |
| | | | | | | | | | | | | | | | | | | | |
Noninterest income: | | | | | | | | | | | | | | | | | | | | |
Commissions and fee income | | | 3,471 | | | | 718 | | | | 7,355 | | | | – | | | | 11,544 | |
Net gains (losses) on financial assets/liabilities at fair value through profit or loss | | | 5,264 | | | | (101) | | | | (1,704) | | | | (401) | | | | 3,058 | |
Net gains (losses) on financial assets available for sale | | | (92) | | | | 37 | | | | (133) | | | | 311 | | | | 123 | |
Other income | | | (1,527) | | | | (34) | | | | 1,635 | | | | 984 | | | | 1,058 | |
| | | | | | | | | | | | | | | | | | | | |
Total noninterest income | | | 7,116 | | | | 620 | | | | 7,153 | | | | 894 | | | | 15,783 | |
| | | | | | | | | | | | | | | | | | | | |
Noninterest expenses: | | | | | | | | | | | | | | | | | | | | |
Compensation and benefits | | | 5,336 | | | | 374 | | | | 7,425 | | | | – | | | | 13,135 | |
Other expenses | | | 4,900 | | | | 186 | | | | 8,281 | | | | (503) | | | | 12,864 | |
| | | | | | | | | | | | | | | | | | | | |
Total noninterest expenses | | | 10,236 | | | | 560 | | | | 15,706 | | | | (503) | | | | 25,999 | |
| | | | | | | | | | | | | | | | | | | | |
Income (loss) before income taxes | | | 2,738 | | | | 458 | | | | 4,830 | | | | (2,636) | | | | 5,390 | |
| | | | | | | | | | | | | | | | | | | | |
Income tax expense (benefit) | | | 937 | | | | 40 | | | | 217 | | | | (130) | | | | 1,064 | |
| | | | | | | | | | | | | | | | | | | | |
Net income (loss) | | | 1,801 | | | | 418 | | | | 4,613 | | | | (2,506) | | | | 4,326 | |
| | | | | | | | | | | | | | | | | | | | |
Net income (loss) attributable to noncontrolling interests | | | – | | | | 2 | | | | (2) | | | | 194 | | | | 194 | |
| | | | | | | | | | | | | | | | | | | | |
Net income (loss) attributable to Deutsche Bank shareholders | | | 1,801 | | | | 416 | | | | 4,615 | | | | (2,700) | | | | 4,132 | |
| |
| | | | | | | | | | | | | | | | | | | | |
2010 in€ m. | | Parent | | | DBTC | | | Other sub-
sidiaries | | | Consolidating
entries | | | Deutsche
Bank AG
consolidated | |
Net interest income: | | | | | | | | | | | | | | | | | | | | |
Interest income, including dividends from subsidiaries | | | 17,664 | | | | 627 | | | | 23,571 | | | | (13,083) | | | | 28,779 | |
Interest expense | | | 10,432 | | | | 125 | | | | 12,559 | | | | (9,920) | | | | 13,196 | |
| | | | | | | | | | | | | | | | | | | | |
Net interest and dividend income | | | 7,232 | | | | 502 | | | | 11,012 | | | | (3,163) | | | | 15,583 | |
| | | | | | | | | | | | | | | | | | | | |
Provision for credit losses | | | 395 | | | | 58 | | | | 992 | | | | (171) | | | | 1,274 | |
| | | | | | | | | | | | | | | | | | | | |
Net interest and dividend income after provision for credit losses | | | 6,837 | | | | 444 | | | | 10,020 | | | | (2,992) | | | | 14,309 | |
| | | | | | | | | | | | | | | | | | | | |
Noninterest income: | | | | | | | | | | | | | | | | | | | | |
Commissions and fee income | | | 3,528 | | | | 725 | | | | 6,416 | | | | – | | | | 10,669 | |
Net gains (losses) in financial assets/liabilities at fair value through profit or loss | | | 3,278 | | | | (211) | | | | (712) | | | | 999 | | | | 3,354 | |
Net gains (losses) on financial assets available for sale | | | 11 | | | | (2) | | | | 41 | | | | 151 | | | | 201 | |
Other income | | | (581) | | | | 18 | | | | (1,133) | | | | 456 | | | | (1,240) | |
| | | | | | | | | | | | | | | | | | | | |
Total noninterest income | | | 6,236 | | | | 530 | | | | 4,612 | | | | 1,606 | | | | 12,984 | |
| | | | | | | | | | | | | | | | | | | | |
Noninterest expenses: | | | | | | | | | | | | | | | | | | | | |
Compensation and benefits | | | 5,954 | | | | 450 | | | | 6,267 | | | | – | | | | 12,671 | |
Other expenses | | | 4,540 | | | | 238 | | | | 6,522 | | | | (653) | | | | 10,647 | |
| | | | | | | | | | | | | | | | | | | | |
Total noninterest expenses | | | 10,494 | | | | 688 | | | | 12,789 | | | | (653) | | | | 23,318 | |
| | | | | | | | | | | | | | | | | | | | |
Income (loss) before income taxes | | | 2,579 | | | | 286 | | | | 1,843 | | | | (733) | | | | 3,975 | |
| | | | | | | | | | | | | | | | | | | | |
Income tax expense (benefit) | | | 592 | | | | (59) | | | | 525 | | | | 587 | | | | 1,645 | |
| | | | | | | | | | | | | | | | | | | | |
Net income (loss) | | | 1,987 | | | | 345 | | | | 1,318 | | | | (1,320) | | | | 2,330 | |
| | | | | | | | | | | | | | | | | | | | |
Net income (loss) attributable to noncontrolling interests | | | – | | | | 2 | | | | (2) | | | | 20 | | | | 20 | |
| | | | | | | | | | | | | | | | | | | | |
Net income (loss) attributable to Deutsche Bank shareholders | | | 1,987 | | | | 343 | | | | 1,320 | | | | (1,340) | | | | 2,310 | |
| |
| | | | |
| Deutsche Bank | | 02 – Consolidated Financial Statements | | 378 |
| Annual Report 2012 on Form 20-F | | Additional Notes | | |
| | 43 – Condensed Consolidating Financial Information | | |
| | |
| | | | |
| | |
| | | | |
| | | | | | | | | | | | | | | | | | | | |
Condensed Consolidating Balance Sheet Dec 31, 2012 in€ m. | | Parent | | | DBTC | | | Other
sub-
sidiaries | | | Consolidating
entries | | | Deutsche
Bank AG
consolidated | |
Assets: | | | | | | | | | | | | | | | | | | | | |
| | | | | | | | | | | | | | | | | | | | |
Cash and due from banks | | | 19,605 | | | | 150 | | | | 14,721 | | | | (6,591) | | | | 27,885 | |
Interest-earning deposits with banks | | | 186,082 | | | | 9,964 | | | | 201,436 | | | | (277,934) | | | | 119,548 | |
Central bank funds sold, securities purchased under resale agreements, securities borrowed | | | 71,904 | | | | 11,378 | | | | 85,188 | | | | (107,953) | | | | 60,517 | |
Financial assets at fair value through profit or loss | | | 1,025,072 | | | | 2,889 | | | | 240,322 | | | | (67,402) | | | | 1,200,881 | |
Financial assets available for sale | | | 13,149 | | | | 271 | | | | 54,809 | | | | (18,850) | | | | 49,379 | |
Investments in associates/equity method investments | | | 881 | | | | – | | | | 2,410 | | | | 286 | | | | 3,577 | |
Loans | | | 202,690 | | | | 27,948 | | | | 331,645 | | | | (165,004) | | | | 397,279 | |
Other assets | | | 172,702 | | | | 2,082 | | | | 110,689 | | | | (132,210) | | | | 153,263 | |
| | | | | | | | | | | | | | | | | | | | |
Total assets | | | 1,692,085 | | | | 54,682 | | | | 1,041,220 | | | | (775,658) | | | | 2,012,329 | |
| | | | | | | | | | | | | | | | | | | | |
Liabilities: | | | | | | | | | | | | | | | | | | | | |
| | | | | | | | | | | | | | | | | | | | |
Deposits | | | 454,020 | | | | 25,800 | | | | 392,559 | | | | (295,177) | | | | 577,202 | |
Central bank funds purchased, securities sold under repurchase agreements and securities loaned | | | 38,856 | | | | 2,217 | | | | 106,111 | | | | (107,931) | | | | 39,253 | |
Financial liabilities at fair value through profit or loss | | | 837,275 | | | | 539 | | | | 143,338 | | | | (56,634) | | | | 924,518 | |
Other short-term borrowings | | | 33,028 | | | | 21,365 | | | | 90,528 | | | | (75,861) | | | | 69,060 | |
Other liabilities | | | 162,178 | | | | 1,549 | | | | 75,360 | | | | (61,389) | | | | 177,698 | |
Long-term debt | | | 127,653 | | | | 228 | | | | 129,119 | | | | (98,903) | | | | 158,097 | |
Trust preferred securities | | | – | | | | – | | | | 12,608 | | | | (517) | | | | 12,091 | |
| | | | | | | | | | | | | | | | | | | | |
Total liabilities | | | 1,653,010 | | | | 51,698 | | | | 949,623 | | | | (696,412) | | | | 1,957,919 | |
| | | | | | | | | | | | | | | | | | | | |
Total shareholders’ equity | | | 39,075 | | | | 2,857 | | | | 91,262 | | | | (79,191) | | | | 54,003 | |
| | | | | | | | | | | | | | | | | | | | |
Noncontrolling interests | | | – | | | | 127 | | | | 335 | | | | (55) | | | | 407 | |
| | | | | | | | | | | | | | | | | | | | |
Total equity | | | 39,075 | | | | 2,984 | | | | 91,597 | | | | (79,246) | | | | 54,410 | |
| | | | | | | | | | | | | | | | | | | | |
Total liabilities and equity | | | 1,692,085 | | | | 54,682 | | | | 1,041,220 | | | | (775,658) | | | | 2,012,329 | |
| | | | | |
| | | | | | | | | | | | | | | | | | | | |
Dec 31, 2011 in€ m. | | Parent | | | DBTC | | | Other
sub-
sidiaries | | | Consolidating
entries | | | Deutsche
Bank AG
consolidated | |
Assets: | | | | | | | | | | | | | | | | | | | | |
| | | | | | | | | | | | | | | | | | | | |
Cash and due from banks | | | 8,926 | | | | 135 | | | | 11,429 | | | | (4,562) | | | | 15,928 | |
Interest-earning deposits with banks | | | 216,411 | | | | 17,488 | | | | 234,888 | | | | (306,787) | | | | 162,000 | |
Central bank funds sold, securities purchased under resale agreements, securities borrowed | | | 75,898 | | | | 21 | | | | 80,353 | | | | (99,162) | | | | 57,110 | |
Financial assets at fair value through profit or loss | | | 1,116,148 | | | | 3,343 | | | | 230,771 | | | | (69,463) | | | | 1,280,799 | |
Financial assets available for sale | | | 9,245 | | | | 1,155 | | | | 64,330 | | | | (29,449) | | | | 45,281 | |
Investments in associates/equity method investments | | | 1,314 | | | | – | | | | 2,220 | | | | 225 | | | | 3,759 | |
Loans | | | 221,804 | | | | 27,348 | | | | 355,692 | | | | (192,330) | | | | 412,514 | |
Other assets | | | 189,716 | | | | 2,877 | | | | 156,525 | | | | (162,406) | | | | 186,712 | |
| | | | | | | | | | | | | | | | | | | | |
Total assets | | | 1,839,462 | | | | 52,367 | | | | 1,136,208 | | | | (863,934) | | | | 2,164,103 | |
| | | | | | | | | | | | | | | | | | | | |
Liabilities: | | | | | | | | | | | | | | | | | | | | |
| | | | | | | | | | | | | | | | | | | | |
Deposits | | | 485,119 | | | | 23,708 | | | | 410,402 | | | | (317,499) | | | | 601,730 | |
Central bank funds purchased, securities sold under repurchase agreements and securities loaned | | | 40,953 | | | | 2,813 | | | | 98,830 | | | | (99,196) | | | | 43,400 | |
Financial liabilities at fair value through profit or loss | | | 938,347 | | | | 622 | | | | 154,459 | | | | (64,981) | | | | 1,028,447 | |
Other short-term borrowings | | | 25,613 | | | | 19,901 | | | | 116,041 | | | | (96,199) | | | | 65,356 | |
Other liabilities | | | 167,498 | | | | 2,227 | | | | 111,897 | | | | (86,872) | | | | 194,750 | |
Long-term debt | | | 142,614 | | | | 235 | | | | 144,782 | | | | (124,215) | | | | 163,416 | |
Trust preferred securities | | | – | | | | – | | | | 12,856 | | | | (512) | | | | 12,344 | |
| | | | | | | | | | | | | | | | | | | | |
Total liabilities | | | 1,800,144 | | | | 49,506 | | | | 1,049,267 | | | | (789,474) | | | | 2,109,443 | |
| | | | | | | | | | | | | | | | | | | | |
Total shareholders’ equity | | | 39,318 | | | | 2,731 | | | | 86,355 | | | | (75,014) | | | | 53,390 | |
| | | | | | | | | | | | | | | | | | | | |
Noncontrolling interests | | | – | | | | 130 | | | | 586 | | | | 554 | | | | 1,270 | |
| | | | | | | | | | | | | | | | | | | | |
Total equity | | | 39,318 | | | | 2,861 | | | | 86,941 | | | | 74,460 | | | | 54,660 | |
| | | | | | | | | | | | | | | | | | | | |
Total liabilities and equity | | | 1,839,462 | | | | 52,367 | | | | 1,136,208 | | | | (863,934) | | | | 2,164,103 | |
| | | | | |
| | | | |
| Deutsche Bank | | 02 – Consolidated Financial Statements | | 379 |
| Annual Report 2012 on Form 20-F | | Additional Notes | | |
| | 43 – Condensed Consolidating Financial Information | | |
| | |
| | | | |
| | |
| | | | |
| | | | | | | | | | | | | | | | |
Condensed Consolidating Statement of Cash Flows 2012 in€ m. | | | Parent | | | | DBTC | | |
| Other
subsidiaries |
1 | |
| Deutsche
Bank AG consolidated |
|
Net cash provided by (used in) operating activities | | | (10,032) | | | | (8,225) | | | | (6,190) | | | | (24,447) | |
| | | | | | | | | | | | | | | | |
Cash flows from investing activities: | | | | | | | | | | | | | | | | |
| | | | | | | | | | | | | | | | |
Proceeds from: | | | | | | | | | | | | | | | | |
Sale of financial assets available for sale | | | 4,432 | | | | 43 | | | | 3,003 | | | | 7,478 | |
Maturities of financial assets available for sale | | | 3,980 | | | | 846 | | | | 8,096 | | | | 12,922 | |
Sale of investments in associates/equity method investments | | | 68 | | | | – | | | | 95 | | | | 163 | |
Sale of property and equipment | | | 55 | | | | – | | | | 142 | | | | 197 | |
| | | | | | | | | | | | | | | | |
Purchase of: | | | | | | | | | | | | | | | | |
Financial assets available for sale | | | (13,264) | | | | (31) | | | | (8,875) | | | | (22,170) | |
Investments in associates/equity method investments | | | (7) | | | | – | | | | (7) | | | | (14) | |
Property and equipment | | | (270) | | | | (40) | | | | (304) | | | | (614) | |
| | | | | | | | | | | | | | | | |
Net cash received for business combinations/divestitures | | | (1,953) | | | | – | | | | 2,049 | | | | 96 | |
| | | | | | | | | | | | | | | | |
Other, net | | | (475) | | | | (19) | | | | (209) | | | | (703) | |
| | | | | | | | | | | | | | | | |
Net cash provided by (used in) investing activities | | | (7,434) | | | | 799 | | | | 3,990 | | | | (2,645) | |
| | | | | | | | | | | | | | | | |
Cash flows from financing activities: | | | | | | | | | | | | | | | | |
| | | | | | | | | | | | | | | | |
Issuances of subordinated long-term debt | | | 22 | | | | – | | | | 39 | | | | 61 | |
| | | | | | | | | | | | | | | | |
Repayments and extinguishments of subordinated long-term debt | | | (396) | | | | – | | | | (312) | | | | (708) | |
| | | | | | | | | | | | | | | | |
Issuances of trust preferred securities | | | – | | | | – | | | | 17 | | | | 17 | |
| | | | | | | | | | | | | | | | |
Repayments and extinguishments of trust preferred securities | | | – | | | | – | | | | (30) | | | | (30) | |
| | | | | | | | | | | | | | | | |
Capital increase | | | – | | | | – | | | | – | | | | – | |
| | | | | | | | | | | | | | | | |
Purchases of treasury shares | | | (11,851) | | | | – | | | | (301) | | | | (12,152) | |
| | | | | | | | | | | | | | | | |
Sale of treasury shares | | | 11,148 | | | | – | | | | 270 | | | | 11,418 | |
| | | | | | | | | | | | | | | | |
Cash dividends paid | | | (689) | | | | – | | | | – | | | | (689) | |
| | | | | | | | | | | | | | | | |
Other, net | | | – | | | | (26) | | | | (250) | | | | (276) | |
| | | | | | | | | | | | | | | | |
Net cash provided by (used in) financing activities | | | (1,766) | | | | (26) | | | | (567) | | | | (2,359) | |
| | | | | | | | | | | | | | | | |
Net effect of exchange rate changes on cash and cash equivalents | | | (64) | | | | – | | | | 104 | | | | 40 | |
| | | | | | | | | | | | | | | | |
Net increase (decrease) in cash and cash equivalents | | | (19,296) | | | | (7,452) | | | | (2,663) | | | | (29,411) | |
| | | | | | | | | | | | | | | | |
Cash and cash equivalents at beginning of period | | | 94,505 | | | | 17,032 | | | | (29,591) | | | | 81,946 | |
| | | | | | | | | | | | | | | | |
Cash and cash equivalents at end of period | | | 75,209 | | | | 9,580 | | | | (32,254) | | | | 52,535 | |
| | | | | | | | | | | | | | | | |
Net cash provided by (used in) operating activities include | | | | | | | | | | | | | | | | |
| | | | | | | | | | | | | | | | |
Income taxes paid (received), net | | | 614 | | | | 310 | | | | 356 | | | | 1,280 | |
| | | | | | | | | | | | | | | | |
Interest paid | | | 11,327 | | | | 143 | | | | 5,048 | | | | 16,518 | |
| | | | | | | | | | | | | | | | |
Interest and dividends received | | | 19,362 | | | | 604 | | | | 12,678 | | | | 32,644 | |
| | | | | | | | | | | | | | | | |
Cash and cash equivalents comprise | | | | | | | | | | | | | | | | |
| | | | | | | | | | | | | | | | |
Cash and due from banks | | | 19,604 | | | | 150 | | | | 8,131 | | | | 27,885 | |
| | | | | | | | | | | | | | | | |
Demand deposits with banks | | | 59,095 | | | | 9,430 | | | | (43,875) | | | | 24,650 | |
| | | | | | | | | | | | | | | | |
Total | | | 78,699 | | | | 9,580 | | | | (35,744) | | | | 52,535 | |
| |
| 1 | This column includes amounts for other subsidiaries and intercompany cash flows. |
| | | | |
| Deutsche Bank | | 02 – Consolidated Financial Statements | | 380 |
| Annual Report 2012 on Form 20-F | | Additional Notes | | |
| | 43 – Condensed Consolidating Financial Information | | |
| | |
| | | | |
| | |
| | | | |
| | | | | | | | | | | | | | | | |
2011 in€ m. | | Parent | | | DBTC | | | Other
subsidiaries1 | | | Deutsche
Bank AG
consolidated | |
Net cash provided by (used in) operating activities | | | 17,304 | | | | 5,499 | | | | (15,001) | | | | 7,802 | |
| | | | | | | | | | | | | | | | |
Cash flows from investing activities: | | | | | | | | | | | | | | | | |
| | | | | | | | | | | | | | | | |
Proceeds from: | | | | | | | | | | | | | | | | |
Sale of financial assets available for sale | | | 5,007 | | | | 66 | | | | 16,875 | | | | 21,948 | |
Maturities of financial assets available for sale | | | 1,617 | | | | 1,691 | | | | 7,327 | | | | 10,635 | |
Sale of investments in associates/equity method investments | | | 52 | | | | – | | | | 284 | | | | 336 | |
Sale of property and equipment | | | 38 | | | | – | | | | 63 | | | | 101 | |
| | | | | | | | | | | | | | | | |
Purchase of: | | | | | | | | | | | | | | | | |
Financial assets available for sale | | | (7,228) | | | | (1,154) | | | | (11,224) | | | | (19,606) | |
Investments in associates/equity method investments | | | (7) | | | | – | | | | (595) | | | | (602) | |
Property and equipment | | | (359) | | | | (50) | | | | (385) | | | | (794) | |
| | | | | | | | | | | | | | | | |
Net cash received for business combinations/divestitures | | | – | | | | – | | | | 348 | | | | 348 | |
| | | | | | | | | | | | | | | | |
Other, net | | | (844) | | | | (21) | | | | 414 | | | | (451) | |
| | | | | | | | | | | | | | | | |
Net cash provided by (used in) investing activities | | | (1,724) | | | | 532 | | | | 13,107 | | | | 11,915 | |
| | | | | | | | | | | | | | | | |
Cash flows from financing activities: | | | | | | | | | | | | | | | | |
| | | | | | | | | | | | | | | | |
Issuances of subordinated long-term debt | | | 10 | | | | 8 | | | | 58 | | | | 76 | |
| | | | | | | | | | | | | | | | |
Repayments and extinguishments of subordinated long-term debt | | | (283) | | | | (133) | | | | (299) | | | | (715) | |
| | | | | | | | | | | | | | | | |
Issuances of trust preferred securities | | | – | | | | – | | | | 37 | | | | 37 | |
| | | | | | | | | | | | | | | | |
Repayments and extinguishments of trust preferred securities | | | – | | | | – | | | | (45) | | | | (45) | |
| | | | | | | | | | | | | | | | |
Capital increase | | | – | | | | – | | | | – | | | | – | |
| | | | | | | | | | | | | | | | |
Purchases of treasury shares | | | (13,123) | | | | – | | | | (658) | | | | (13,781) | |
| | | | | | | | | | | | | | | | |
Sale of treasury shares | | | 11,595 | | | | – | | | | 634 | | | | 12,229 | |
| | | | | | | | | | | | | | | | |
Cash dividends paid | | | (691) | | | | – | | | | – | | | | (691) | |
| | | | | | | | | | | | | | | | |
Other, net | | | – | | | | (634) | | | | 364 | | | | (270) | |
| | | | | | | | | | | | | | | | |
Net cash provided by (used in) financing activities | | | (2,492) | | | | (759) | | | | 91 | | | | (3,160) | |
| | | | | | | | | | | | | | | | |
Net effect of exchange rate changes on cash and cash equivalents | | | (207) | | | | 313 | | | | (1,070) | | | | (964) | |
| | | | | | | | | | | | | | | | |
Net increase (decrease) in cash and cash equivalents | | | 12,881 | | | | 5,585 | | | | (2,873) | | | | 15,593 | |
| | | | | | | | | | | | | | | | |
Cash and cash equivalents at beginning of period | | | 81,624 | | | | 11,770 | | | | (27,041) | | | | 66,353 | |
| | | | | | | | | | | | | | | | |
Cash and cash equivalents at end of period | | | 94,505 | | | | 17,355 | | | | (29,914) | | | | 81,946 | |
| | | | | | | | | | | | | | | | |
Net cash provided by (used in) operating activities include | | | | | | | | | | | | | | | | |
| | | | | | | | | | | | | | | | |
Income taxes paid (received), net | | | 432 | | | | 96 | | | | 799 | | | | 1,327 | |
| | | | | | | | | | | | | | | | |
Interest paid | | | 12,272 | | | | 104 | | | | 5,367 | | | | 17,743 | |
| | | | | | | | | | | | | | | | |
Interest and dividends received | | | 16,652 | | | | 548 | | | | 18,016 | | | | 35,216 | |
| | | | | | | | | | | | | | | | |
Cash and cash equivalents comprise | | | | | | | | | | | | | | | | |
| | | | | | | | | | | | | | | | |
Cash and due from banks | | | 8,926 | | | | 135 | | | | 6,867 | | | | 15,928 | |
| | | | | | | | | | | | | | | | |
Demand deposits with banks | | | 85,579 | | | | 17,220 | | | | (36,781) | | | | 66,018 | |
| | | | | | | | | | | | | | | | |
Total | | | 94,505 | | | | 17,355 | | | | (29,914) | | | | 81,946 | |
| |
| 1 | This column includes amounts for other subsidiaries and intercompany cash flows. |
| | | | |
| Deutsche Bank | | 02 – Consolidated Financial Statements | | 381 |
| Annual Report 2012 on Form 20-F | | Additional Notes | | |
| | 43 – Condensed Consolidating Financial Information | | |
| | |
| | | | |
| | |
| | | | |
| | | | | | | | | | | | | | | | |
2010 in€ m. | | | Parent | | | | DBTC | | |
| Other
subsidiaries |
1 | |
| Deutsche
Bank AG consolidated |
|
Net cash provided by (used in) operating activities | | | 19,151 | | | | (1,056) | | | | (21,771) | | | | (3,676) | |
| | | | | | | | | | | | | | | | |
Cash flows from investing activities: | | | | | | | | | | | | | | | | |
| | | | | | | | | | | | | | | | |
Proceeds from: | | | | | | | | | | | | | | | | |
Sale of financial assets available for sale | | | 4,901 | | | | 108 | | | | 5,643 | | | | 10,652 | |
Maturities of financial assets available for sale | | | 1,724 | | | | 914 | | | | 1,543 | | | | 4,181 | |
Sale of investments in associates/equity method investments | | | 144 | | | | – | | | | 106 | | | | 250 | |
Sale of property and equipment | | | 51 | | | | 14 | | | | 43 | | | | 108 | |
| | | | | | | | | | | | | | | | |
Purchase of: | | | | | | | | | | | | | | | | |
Financial assets available for sale | | | (5,882) | | | | (1,549) | | | | (6,656) | | | | (14,087) | |
Investments in associates/equity method investments | | | (54) | | | | – | | | | (91) | | | | (145) | |
Property and equipment | | | (571) | | | | (62) | | | | (240) | | | | (873) | |
| | | | | | | | | | | | | | | | |
Net cash paid for business combinations/divestitures | | | – | | | | – | | | | 8,580 | | | | 8,580 | |
| | | | | | | | | | | | | | | | |
Other, net | | | (6,550) | | | | (21) | | | | 5,382 | | | | (1,189) | |
| | | | | | | | | | | | | | | | |
Net cash provided by (used in) investing activities | | | (6,237) | | | | (596) | | | | 14,310 | | | | 7,477 | |
| | | | | | | | | | | | | | | | |
Cash flows from financing activities: | | | | | | | | | | | | | | | | |
| | | | | | | | | | | | | | | | |
Issuances of subordinated long-term debt | | | 1,246 | | | | – | | | | 95 | | | | 1,341 | |
| | | | | | | | | | | | | | | | |
Repayments and extinguishments of subordinated long-term debt | | | (88) | | | | (418) | | | | 277 | | | | (229) | |
| | | | | | | | | | | | | | | | |
Issuances of trust preferred securities | | | – | | | | – | | | | 90 | | | | 90 | |
| | | | | | | | | | | | | | | | |
Repayments and extinguishments of trust preferred securities | | | – | | | | – | | | | (51) | | | | (51) | |
| | | | | | | | | | | | | | | | |
Capital increase | | | 10,060 | | | | – | | | | – | | | | 10,060 | |
| | | | | | | | | | | | | | | | |
Purchases of treasury shares | | | (14,369) | | | | – | | | | (997) | | | | (15,366) | |
| | | | | | | | | | | | | | | | |
Sale of treasury shares | | | 12,709 | | | | – | | | | 810 | | | | 13,519 | |
| | | | | | | | | | | | | | | | |
Cash dividends paid | | | (465) | | | | – | | | | – | | | | (465) | |
| | | | | | | | | | | | | | | | |
Other, net | | | – | | | | (28) | | | | 221 | | | | 193 | |
| | | | | | | | | | | | | | | | |
Net cash provided by (used in) financing activities | | | 9,093 | | | | (446) | | | | 445 | | | | 9,092 | |
| | | | | | | | | | | | | | | | |
Net effect of exchange rate changes on cash and cash equivalents | | | 502 | | | | 989 | | | | 420 | | | | 1,911 | |
| | | | | | | | | | | | | | | | |
Net decrease in cash and cash equivalents | | | 22,509 | | | | (1,109) | | | | (6,596) | | | | 14,804 | |
| | | | | | | | | | | | | | | | |
Cash and cash equivalents at beginning of period | | | 59,115 | | | | 12,879 | | | | (20,445) | | | | 51,549 | |
| | | | | | | | | | | | | | | | |
Cash and cash equivalents at end of period | | | 81,624 | | | | 11,770 | | | | (27,041) | | | | 66,353 | |
| | | | | | | | | | | | | | | | |
Net cash provided by (used in) operating activities include | | | | | | | | | | | | | | | | |
| | | | | | | | | | | | | | | | |
Income taxes paid (received), net | | | (93) | | | | 139 | | | | 738 | | | | 784 | |
| | | | | | | | | | | | | | | | |
Interest paid | | | 10,439 | | | | 128 | | | | 3,173 | | | | 13,740 | |
| | | | | | | | | | | | | | | | |
Interest and dividends received | | | 17,691 | | | | 617 | | | | 11,148 | | | | 29,456 | |
| | | | | | | | | | | | | | | | |
Cash and cash equivalents comprise | | | | | | | | | | | | | | | | |
| | | | | | | | | | | | | | | | |
Cash and due from banks | | | 8,956 | | | | 229 | | | | 7,972 | | | | 17,157 | |
| | | | | | | | | | | | | | | | |
Demand deposits with banks | | | 72,668 | | | | 11,541 | | | | (35,013) | | | | 49,196 | |
| | | | | | | | | | | | | | | | |
Total | | | 81,624 | | | | 11,770 | | | | (27,041) | | | | 66,353 | |
| |
| 1 | This column includes amounts for other subsidiaries and intercompany cash flows. |
Deutsche Bank AG has, via several subsidiaries, issued “trust preferred” securities that are listed on the New York Stock Exchange. In each such transaction, a Delaware statutory business trust (the “Trust”) issues trust preferred securities (the “Trust Preferred Securities”) in a public offering in the United States. All the proceeds from the sale of the Trust Preferred Securities are invested by the Trust in the Class B Preferred Securities (the “Class B Preferred Securities”) of a 100 % owned subsidiary of Deutsche Bank AG organized in the form of a limited liability company (the “LLC”). The LLC uses all the proceeds from the sale of the Class B Preferred Securities to the Trust to purchase a debt obligation from Deutsche Bank AG (the “Debt Obligation”). The distributions on the Class B Preferred Securities match those of the Trust Preferred Securities. The Trust Preferred Securities and the Class B Preferred Securities pay distributions quarterly in arrears and are redeemable only upon the occurrence of certain events specified in the documents governing the terms of those securities. Subject to limited exceptions, the Class B Preferred Securities generally cannot be redeemed until at least five or ten years after their issuance. The Trust Preferred Securities and the Class B Preferred Securities are each subject to a full and unconditional subordinated guarantee of Deutsche Bank AG. These subordinated guarantees are general and unsecured obligations of Deutsche Bank AG and rank, both as to payment and in liquidation of Deutsche Bank AG, junior in priority of payment to all current and future indebtedness of Deutsche Bank AG and on parity in priority of payment with the most senior preference shares, if any, of Deutsche Bank AG. The Group treats the Class B Preferred Securities of the LLC as Tier 1 or Upper Tier 2 regulatory capital on a consolidated basis. In the above 2012 condensed consolidating balance sheet, a total of € 5.1 billion of the long-term debt of the Parent and Deutsche Bank AG Consolidated represents the Debt Obligations issued by Deutsche Bank AG to the LLC in these transactions.
| | | | |
| Deutsche Bank | | 02 – Consolidated Financial Statements | | 382 |
| Annual Report 2012 on Form 20-F | | Additional Notes | | |
| | 43 – Condensed Consolidating Financial Information | | |
| | |
| | | | |
| | |
| | | | |
Issuances of Trust Preferred Securities
| | | | | | | | |
Trust | | LLC | | Issuance Date | | Earliest Redemption Date | | Parent Long-term Debt1 |
Deutsche Bank Capital Funding Trust VIII | | Deutsche Bank
Capital Funding
LLC VIII | | October 18, 2006 | | January 18, 2013 | | € 455 million |
| | | | | | | | |
Deutsche Bank Contingent Capital Trust II | | Deutsche Bank
Contingent Capital
LLC II | | May 23, 2007 | | May 23, 2017 | | € 607 million |
| | | | | | | | |
Deutsche Bank Capital Funding Trust IX | | Deutsche Bank
Capital Funding
LLC IX | | July 20, 2007 | | February 20, 2013 | | € 872 million |
| | | | | | | | |
Deutsche Bank Capital Funding Trust X | | Deutsche Bank
Capital Funding
LLC X | | November 15, 2007 | | March 15, 2013 | | € 611 million |
| | | | | | | | |
Deutsche Bank Contingent Capital Trust III | | Deutsche Bank
Contingent Capital
LLC III | | February 20, 2008 | | February 20, 2018 | | € 1,498 million |
| | | | | | | | |
Deutsche Bank Contingent Capital Trust V | | Deutsche Bank
Contingent Capital
LLC V | | May 9, 20082 | | June 30, 2018 | | € 1,051 million |
|
| 1 | Amount of long-term debt of the Parent and Deutsche Bank AG Consolidated represented by the Debt Obligations issued by Deutsche Bank AG to the applicable LLC, as of December 31, 2012. |
| 2 | On March 30, 2010 Deutsche Bank AG additionally issued an amount of U.S.$ 120 million. |
| | | | |
| Deutsche Bank | | 02 – Consolidated Financial Statements | | 383 |
| Annual Report 2012 on Form 20-F | | Report of Independent Registered Public Accounting Firm | | |
| | |
| | | | |
| | |
| | | | |
Report of Independent Registered Public Accounting Firm
To the Supervisory Board of
Deutsche Bank Aktiengesellschaft:
We have audited the accompanying consolidated financial statements of Deutsche Bank Aktiengesellschaft and subsidiaries (the “Company”) on pages 243 to 382 of the Financial Report which comprise the consolidated balance sheets as of December 31, 2012 and 2011, and the related consolidated statements of income, comprehensive income, changes in equity, and cash flows for each of the years in the three-year period ended December 31, 2012 including the disclosures described as being part of the financial statements within the Risk Report section on pages 43 to 186 of the Financial Report. These consolidated financial statements are the responsibility of the Company’s management. Our responsibility is to express an opinion on these consolidated financial statements based on our audits.
We conducted our audits in accordance with the standards of the Public Company Accounting Oversight Board (United States). Those standards require that we plan and perform the audit to obtain reasonable assurance about whether the financial statements are free of material misstatement. An audit includes examining, on a test basis, evidence supporting the amounts and disclosures in the financial statements. An audit also includes assessing the accounting principles used and significant estimates made by management, as well as evaluating the overall financial statement presentation. We believe that our audits provide a reasonable basis for our opinion.
In our opinion, the consolidated financial statements referred to above present fairly, in all material respects, the financial position of Deutsche Bank Aktiengesellschaft and subsidiaries as of December 31, 2012 and 2011, and the results of their operations and their cash flows for each of the years in the three-year period ended December 31, 2012, in conformity with International Financial Reporting Standards as issued by the International Accounting Standards Board.
We also have audited, in accordance with the standards of the Public Company Accounting Oversight Board (United States), the Company’s internal control over financial reporting as of December 31, 2012, based on criteria established in Internal Control — Integrated Framework issued by the Committee of Sponsoring Organizations of the Treadway Commission (COSO), and our report dated April 11, 2013 expressed an unqualified opinion on the effectiveness of the Company’s internal control over financial reporting.
Frankfurt am Main, Germany
April 11, 2013
KPMG AG
Wirtschaftsprüfungsgesellschaft
| | | | |
| Deutsche Bank | | 02 – Consolidated Financial Statements | | 384 |
| Financial Report 2012 | | Additional Notes | | |
| | 43 – Shareholdings | | |
| | Subsidiaries | | |
| | |
| | | | |
| | |
| | | | |
[Page intentionally left blank for SEC filing purposes]
| | | | |
| Deutsche Bank | | 02 – Consolidated Financial Statements | | 385 |
| Financial Report 2012 | | Additional Notes | | |
| | 43 – Shareholdings | | |
| | Subsidiaries | | |
| | |
| | | | |
| | |
| | | | |
[Page intentionally left blank for SEC filing purposes]
| | | | |
| Deutsche Bank | | 02 – Consolidated Financial Statements | | 386 |
| Financial Report 2012 | | Additional Notes | | |
| | 43 – Shareholdings | | |
| | Subsidiaries | | |
| | |
| | | | |
| | |
| | | | |
[Page intentionally left blank for SEC filing purposes]
| | | | |
| Deutsche Bank | | 02 – Consolidated Financial Statements | | 387 |
| Financial Report 2012 | | Additional Notes | | |
| | 43 – Shareholdings | | |
| | Subsidiaries | | |
| | |
| | | | |
| | |
| | | | |
[Page intentionally left blank for SEC filing purposes]
| | | | |
| Deutsche Bank | | 02 – Consolidated Financial Statements | | 388 |
| Financial Report 2012 | | Additional Notes | | |
| | 43 – Shareholdings | | |
| | Subsidiaries | | |
| | |
| | | | |
| | |
| | | | |
[Page intentionally left blank for SEC filing purposes]
| | | | |
| Deutsche Bank | | 02 – Consolidated Financial Statements | | 389 |
| Financial Report 2012 | | Additional Notes | | |
| | 43 – Shareholdings | | |
| | Subsidiaries | | |
| | |
| | | | |
| | |
| | | | |
[Page intentionally left blank for SEC filing purposes]
| | | | |
| Deutsche Bank | | 02 – Consolidated Financial Statements | | 390 |
| Financial Report 2012 | | Additional Notes | | |
| | 43 – Shareholdings | | |
| | Subsidiaries | | |
| | |
| | | | |
| | |
| | | | |
[Page intentionally left blank for SEC filing purposes]
| | | | |
| Deutsche Bank | | 02 – Consolidated Financial Statements | | 391 |
| Financial Report 2012 | | Additional Notes | | |
| | 43 – Shareholdings | | |
| | Subsidiaries | | |
| | |
| | | | |
| | |
| | | | |
[Page intentionally left blank for SEC filing purposes]
| | | | |
| Deutsche Bank | | 02 – Consolidated Financial Statements | | 392 |
| Financial Report 2012 | | Additional Notes | | |
| | 43 – Shareholdings | | |
| | Subsidiaries | | |
| | |
| | | | |
| | |
| | | | |
[Page intentionally left blank for SEC filing purposes]
| | | | |
| Deutsche Bank | | 02 – Consolidated Financial Statements | | 393 |
| Financial Report 2012 | | Additional Notes | | |
| | 43 – Shareholdings | | |
| | Subsidiaries | | |
| | |
| | | | |
| | |
| | | | |
[Page intentionally left blank for SEC filing purposes]
| | | | |
| Deutsche Bank | | 02 – Consolidated Financial Statements | | 394 |
| Financial Report 2012 | | Additional Notes | | |
| | 43 – Shareholdings | | |
| | Special Purpose Entities | | |
| | |
| | | | |
| | |
| | | | |
[Page intentionally left blank for SEC filing purposes]
| | | | |
| Deutsche Bank | | 02 – Consolidated Financial Statements | | 395 |
| Financial Report 2012 | | Additional Notes | | |
| | 43 – Shareholdings | | |
| | Special Purpose Entities | | |
| | |
| | | | |
| | |
| | | | |
[Page intentionally left blank for SEC filing purposes]
| | | | |
| Deutsche Bank | | 02 – Consolidated Financial Statements | | 396 |
| Financial Report 2012 | | Additional Notes | | |
| | 43 – Shareholdings | | |
| | Special Purpose Entities | | |
| | |
| | | | |
| | |
| | | | |
[Page intentionally left blank for SEC filing purposes]
| | | | |
| Deutsche Bank | | 02 – Consolidated Financial Statements | | 397 |
| Financial Report 2012 | | Additional Notes | | |
| | 43 – Shareholdings | | |
| | Special Purpose Entities | | |
| | |
| | | | |
| | |
| | | | |
[Page intentionally left blank for SEC filing purposes]
| | | | |
| Deutsche Bank | | 02 – Consolidated Financial Statements | | 398 |
| Financial Report 2012 | | Additional Notes | | |
| | 43 – Shareholdings | | |
| | Special Purpose Entities | | |
| | |
| | | | |
| | |
| | | | |
[Page intentionally left blank for SEC filing purposes]
| | | | |
| Deutsche Bank | | 02 – Consolidated Financial Statements | | 399 |
| Financial Report 2012 | | Additional Notes | | |
| | 43 – Shareholdings | | |
| | Special Purpose Entities | | |
| | |
| | | | |
| | |
| | | | |
[Page intentionally left blank for SEC filing purposes]
| | | | |
| Deutsche Bank | | 02 – Consolidated Financial Statements | | 400 |
| Financial Report 2012 | | Additional Notes | | |
| | 43 – Shareholdings | | |
| | Special Purpose Entities | | |
| | |
| | | | |
| | |
| | | | |
[Page intentionally left blank for SEC filing purposes]
| | | | |
| Deutsche Bank | | 02 – Consolidated Financial Statements | | 401 |
| Financial Report 2012 | | Additional Notes | | |
| | 43 – Shareholdings | | |
| | Special Purpose Entities | | |
| | |
| | | | |
| | |
| | | | |
[Page intentionally left blank for SEC filing purposes]
| | | | |
| Deutsche Bank | | 02 – Consolidated Financial Statements | | 402 |
| Financial Report 2012 | | Additional Notes | | |
| | 43 – Shareholdings | | |
| | Special Purpose Entities | | |
| | |
| | | | |
| | |
| | | | |
[Page intentionally left blank for SEC filing purposes]
| | | | |
| Deutsche Bank | | 02 – Consolidated Financial Statements | | 403 |
| Financial Report 2012 | | Additional Notes | | |
| | 43 – Shareholdings | | |
| | Special Purpose Entities | | |
| | |
| | | | |
| | |
| | | | |
[Page intentionally left blank for SEC filing purposes]
| | | | |
| Deutsche Bank | | 02 – Consolidated Financial Statements | | 404 |
| Financial Report 2012 | | Additional Notes | | |
| | 43 – Shareholdings | | |
| | Special Purpose Entities | | |
| | |
| | | | |
| | |
| | | | |
[Page intentionally left blank for SEC filing purposes]
| | | | |
| Deutsche Bank | | 02 – Consolidated Financial Statements | | 405 |
| Financial Report 2012 | | Additional Notes | | |
| | 43 – Shareholdings | | |
| | Special Purpose Entities | | |
| | |
| | | | |
| | |
| | | | |
[Page intentionally left blank for SEC filing purposes]
| | | | |
| Deutsche Bank | | 02 – Consolidated Financial Statements | | 406 |
| Financial Report 2012 | | Additional Notes | | |
| | 43 – Shareholdings | | |
| | Companies accounted for at equity | | |
| | |
| | | | |
| | |
| | | | |
[Page intentionally left blank for SEC filing purposes]
| | | | |
| Deutsche Bank | | 02 – Consolidated Financial Statements | | 407 |
| Financial Report 2012 | | Additional Notes | | |
| | 43 – Shareholdings | | |
| | Companies accounted for at equity | | |
| | |
| | | | |
| | |
| | | | |
[Page intentionally left blank for SEC filing purposes]
| | | | |
| Deutsche Bank | | 02 – Consolidated Financial Statements | | 408 |
| Financial Report 2012 | | Additional Notes | | |
| | 43 – Shareholdings | | |
| | Companies accounted for at equity | | |
| | |
| | | | |
| | |
| | | | |
[Page intentionally left blank for SEC filing purposes]
| | | | |
| Deutsche Bank | | 02 – Consolidated Financial Statements | | 409 |
| Financial Report 2012 | | Additional Notes | | |
| | 43 – Shareholdings | | |
| | Other companies, where the holding equals or exeeds 20 % | | |
| | |
| | | | |
| | |
| | | | |
[Page intentionally left blank for SEC filing purposes]
| | | | |
| Deutsche Bank | | 02 – Consolidated Financial Statements | | 410 |
| Financial Report 2012 | | Additional Notes | | |
| | 43 – Shareholdings | | |
| | Other companies, where the holding equals or exeeds 20 % | | |
| | |
| | | | |
| | |
| | | | |
[Page intentionally left blank for SEC filing purposes]
| | | | |
| Deutsche Bank | | 02 – Consolidated Financial Statement | | 411 |
| Financial Report 2012 | | Additional Notes | | |
| | 43 – Shareholdings | | |
| | Holdings in large corporations, where the holding exceeds 5% of voting rights | | |
| | |
| | | | |
| | |
| | | | |
[Page intentionally left blank for SEC filing purposes]
[Page intentionally left blank for SEC filing purposes]
| | | | |
| Deutsche Bank | | 03 – Confirmations | | 413 |
| Financial Report 2012 | | Independent Auditors’ Report | | |
| | |
| | | | |
| | |
| | | | |
[Page intentionally left blank for SEC filing purposes]
| | | | |
| Deutsche Bank | | 03 – Confirmations | | 414 |
| Financial Report 2012 | | Independent Auditors’ Report | | |
| | |
| | | | |
| | |
| | | | |
[Page intentionally left blank for SEC filing purposes]
| | | | |
| Deutsche Bank | | 03 – Confirmations | | 415 |
| Financial Report 2012 | | Responsibility Statement by the Management Board | | |
| | |
| | | | |
| | |
| | | | |
[Page intentionally left blank for SEC filing purposes]
| | | | |
| Deutsche Bank | | Report of the Supervisory Board | | 416 |
| Financial Report 2012 | | | | |
| | |
| | | | |
| | |
| | | | |
[Page intentionally left blank for SEC filing purposes]
| | | | |
| Deutsche Bank | | Report of the Supervisory Board | | 417 |
| Financial Report 2012 | | | | |
| | |
| | | | |
| | |
| | | | |
[Page intentionally left blank for SEC filing purposes]
| | | | |
| Deutsche Bank | | Report of the Supervisory Board | | 418 |
| Financial Report 2012 | | | | |
| | |
| | | | |
| | |
| | | | |
[Page intentionally left blank for SEC filing purposes]
| | | | |
| Deutsche Bank | | Report of the Supervisory Board | | 419 |
| Financial Report 2012 | | | | |
| | |
| | | | |
| | |
| | | | |
[Page intentionally left blank for SEC filing purposes]
| | | | |
| Deutsche Bank | | Report of the Supervisory Board | | 420 |
| Financial Report 2012 | | | | |
| | |
| | | | |
| | |
| | | | |
[Page intentionally left blank for SEC filing purposes]
| | | | |
| Deutsche Bank | | Report of the Supervisory Board | | 421 |
| Financial Report 2012 | | | | |
| | |
| | | | |
| | |
| | | | |
[Page intentionally left blank for SEC filing purposes]
| | | | |
| Deutsche Bank | | Report of the Supervisory Board | | 422 |
| Financial Report 2012 | | | | |
| | |
| | | | |
| | |
| | | | |
[Page intentionally left blank for SEC filing purposes]
04 –
Corporate Governance Statement/
Corporate Governance Report
Management Board and Supervisory Board – 424
Reporting and Transparency – 433
Related Party Transactions – 433
Auditing and Controlling – 434
Compliance with the German Corporate Governance Code – 436
| | | | |
| Deutsche Bank | | 04 – Corporate Governance Statement/Corporate Governance Report | | 424 |
| Financial Report 2012 | | Management Board and Supervisory Board | | |
|
Corporate Governance Statement/ Corporate Governance Report |
| | |
| | | | |
All information presented in this Corporate Governance Statement/Corporate Governance Report is shown as of March 25, 2013.
Management Board and Supervisory Board
Management Board
The Management Board is responsible for managing the company. Its members are jointly accountable for the management of the company. The duties, responsibilities and procedures of our Management Board and the committees installed by it are specified in its Terms of Reference, the current version of which is available on our website (www.deutsche-bank.com/corporate-governance).
With effect from June 1, 2012, Dr. Stephan Leithner, Stuart Wilson Lewis and Henry Ritchotte were appointed members of the Management Board for a three-year period.
With effect from the end of the Annual General Meeting on May 31, 2012, Dr. Josef Ackermann stepped down from the bank’s Management Board, which he had chaired since 2006. Dr. Hugo Bänziger and Herrmann-Josef Lamberti stepped down from the bank’s Management Board at the end of the day on May 31, 2012.
The following paragraphs show information on the current members of the Management Board. The information includes the year in which they were born, the year in which they were appointed and the year in which their term expires, their current positions and area of responsibility and their principal business activities outside our company. The members of our Management Board have generally undertaken not to assume chairmanships of supervisory boards of companies outside our consolidated group.
Jürgen Fitschen
Year of birth: 1948
Appointed: 2009
Term expires: 2015
Jürgen Fitschen became a member of our Management Board on April 1, 2009. Since the end of the Annual General Meeting on May 31, 2012, he has been, together with Mr. Jain, Co-Chairman of the Management Board.
Mr. Fitschen has been with Deutsche Bank since 1987, was already a member of the Management Board from 2001 to the beginning of 2002 and has been a member of the Group Executive Committee since 2002 as well as Head of Regional Management since 2005.
Mr. Fitschen studied Economics and Business Administration at the University of Hamburg and graduated in 1975 with a master’s degree in Business Administration.
From 1975 to 1987, he worked at Citibank in Hamburg and Frankfurt am Main in various positions. In 1983 he was appointed member of the Executive Committee Germany of Citibank.
Mr. Fitschen is a member of the Board of Directors of Kühne + Nagel International AG, member of the Supervisory Board of METRO AG and was a member of the Supervisory Board of Schott AG until June 2012.
| | | | |
| Deutsche Bank | | 04 – Corporate Governance Statement/Corporate Governance Report | | 425 |
| Financial Report 2012 | | Management Board and Supervisory Board | | |
| | |
| | | | |
| | |
| | | | |
Anshuman Jain
Year of birth: 1963
First appointed: 2009
Term expires: 2017
Anshuman Jain became a member of our Management Board on April 1, 2009. Since the end of the Annual General Meeting on May 31, 2012, he has been, together with Mr. Fitschen, Co-Chairman of the Management Board.
Mr. Jain joined Deutsche Bank in 1995 and became Head of Global Markets in 2001 as well as a member of the Group Executive Committee in 2002.
Mr. Jain studied Economics at Shri Ram College (Delhi University), graduating in 1983, with a BA, and studied Business Administration at the University of Massachusetts, graduating in 1985 with an MBA in Finance.
After his academic studies, Mr. Jain worked until 1988 for Kidder Peabody, New York, in the area of Derivatives Research. From 1988 to 1995 he set up and ran the global hedge fund coverage group for Merrill Lynch, New York.
Mr. Jain does not have any external directorships subject to disclosure.
Stefan Krause
Year of birth: 1962
First appointed: 2008
Term expires: 2018
Stefan Krause became a member of our Management Board and a member of the Group Executive Committee on April 1, 2008. He is our Chief Financial Officer.
Previously, Mr. Krause spent over 20 years in the automotive industry, holding various senior management positions with a strong focus on Finance and Financial Services. Starting in 1987 at BMW’s Controlling department in Munich, he transferred to the U.S. in 1993, building up and ultimately heading BMW’s Financial Services Division in the Americas. Relocating to Munich in 2001, he became Head of Sales Western Europe (excluding Germany). He was appointed member of the Management Board of BMW Group in May 2002, serving as Chief Financial Officer until September 2007 and subsequently as Chief of Sales & Marketing.
Mr. Krause studied Business Administration in Würzburg and graduated in 1986 with a master’s degree in Business Administration.
Mr. Krause does not have any external directorships subject to disclosure.
Dr. Stephan Leithner
Year of birth: 1966
First appointed: 2012
Term expires: 2015
Dr. Stephan Leithner became a member of our Management Board and a member of the Group Executive Committee on June 1, 2012. He is our CEO Europe (excluding Germany and the UK,) and is responsible for Human Resources, Legal & Compliance and Government & Regulatory Affairs. He joined Deutsche Bank in 2000.
Prior to his current role, Dr. Leithner co-headed the Corporate Finance division and was responsible for Deutsche Bank’s local Corporate Finance Country Coverage teams across Europe and Asia as well as for the Global Financial Institutions Group. His previous roles included responsibility for Deutsche Bank’s German and European M&A business.
| | | | |
| Deutsche Bank | | 04 – Corporate Governance Statement/Corporate Governance Report | | 426 |
| Financial Report 2012 | | Management Board and Supervisory Board | | |
| | |
| | | | |
| | |
| | | | |
Before joining Deutsche Bank in 2000, Dr. Leithner was a partner at McKinsey & Co. He holds a PhD in Finance from the University of St. Gallen, Switzerland.
Mr. Leithner does not have any external directorships subject to disclosure.
Stuart Wilson Lewis
Year of birth: 1965
First appointed: 2012
Term expires: 2015
Stuart Wilson Lewis became a member of our Management Board and a member of the Group Executive Committee on June 1, 2012. He is our Chief Risk Officer. He joined Deutsche Bank in 1996.
Prior to assuming his current role, Mr. Lewis was the Deputy Chief Risk Officer and Chief Risk Officer of the Corporate & Investment Bank of Deutsche Bank from 2010 to 2012. Between 2006 and 2010 he was Chief Credit Officer.
Before joining Deutsche Bank in 1996, he worked at Credit Suisse and Continental Illinois National Bank in London.
He studied at the University of Dundee, where he obtained an LLB (Hons), and he holds an LLM from the London School of Economics. He also attended the College of Law, Guildford.
Mr. Lewis does not have any external directorships subject to disclosure.
Rainer Neske
Year of birth: 1964
First appointed: 2009
Term expires: 2017
Rainer Neske became a member of our Management Board on April 1, 2009. He joined Deutsche Bank in 1990 and in 2000 was appointed member of the Management Board of Deutsche Bank Privat- und Geschäftskunden AG. Since 2003 he has been a member of the Group Executive Committee. From 2003 to 2011, Mr. Neske was Spokesman of the Management Board of Deutsche Bank Privat- und Geschäfts- kunden AG. On our Management Board, he is responsible for our Private & Business Clients division.
Mr. Neske studied Computer Science and Business Administration at the University of Karlsruhe and graduated in 1990 with a master’s degree in Information Technology.
Mr. Neske does not have any external directorships subject to disclosure.
Henry Ritchotte
Year of birth: 1963
First appointed: 2012
Term expires: 2015
Henry Ritchotte became a member of our Management Board and a member of the Group Executive Committee on June 1, 2012. He is our Chief Operating Officer. He joined Deutsche Bank in 1995.
| | | | |
| Deutsche Bank | | 04 – Corporate Governance Statement/Corporate Governance Report | | 427 |
| Financial Report 2012 | | Management Board and Supervisory Board | | |
| | |
| | | | |
| | |
| | | | |
Prior to assuming his current role, Mr. Ritchotte held the position of Chief Operating Officer for the Corporate & Investment Bank from 2010 to 2012, having previously been COO for the Global Markets division. He played a decisive role in the strategic recalibration and further integration of the Corporate & Investment Bank. His previous roles at Deutsche Bank include serving as Head of Global Markets in Tokyo.
Mr. Ritchotte joined Deutsche Bank in 1995 in fixed income sales after starting his career with Merrill Lynch in New York in 1993.
He holds a Bachelor’s degree in History from Haverford College, a Master’s degree in East Asian Studies and an MBA from the University of Chicago.
Mr. Ritchotte does not have any external directorships subject to disclosure.
Group Executive Committee
The Group Executive Committee was established in 2002. It comprises the members of the Management Board and senior representatives from the regions, corporate divisions and certain infrastructure functions appointed by the Management Board. The Co-Chairmen of the Management Board, Mr. Fitschen and Mr. Jain, are also the Co-Chairmen of the Group Executive Committee.
The Group Executive Committee serves as a tool to coordinate our businesses and regions through the following tasks and responsibilities:
| — | | Provision of ongoing information to the Management Board on business developments and particular transactions; |
| — | | Regular review of our business segments; |
| — | | Consultation with and furnishing advice to the Management Board on strategic decisions; |
| — | | Preparation of decisions to be made by the Management Board. |
Supervisory Board
The Supervisory Board appoints, supervises and advises the Management Board and is directly involved in decisions of fundamental importance to the bank. The Management Board regularly informs the Supervisory Board of the intended business policies and other fundamental matters relating to the assets, liabilities, financial and profit situation as well as its risk situation, risk management and risk controlling. A report is made to the Supervisory Board on corporate planning at least once a year. At the proposal of the Chairman’s Committee, the Supervisory Board determines the total compensation of the individual members of the Management Board including the main contract elements and reviews it regularly. The Chairman of the Supervisory Board coordinates work within the Supervisory Board. He maintains regular contact with the Management Board, especially with the Co-Chairmen of the Management Board, and consults with them on strategy, the development of business and risk management. The Supervisory Board Chairman is informed by the Co-Chairmen of the Management Board without delay of important events of substantial significance for the situation and development as well as for the management of Deutsche Bank Group. The types of business that require the approval of the Supervisory Board to be transacted are specified in Section 13 of our Articles of Association. The Supervisory Board meets if required without the Management Board. For the performance of its duties, the Supervisory Board may, at its professional discretion, use the services of auditors, legal advisors and other internal and external consultants.
The duties, procedures and committees of the Supervisory Board are specified in its Terms of Reference. The current version is available on the Deutsche Bank website (www.deutsche-bank.com/corporate-governance).
The members representing our shareholders were elected at the Annual General Meeting on May 29, 2008, except for Ms. Garrett-Cox, who was elected at the Annual General Meeting on May 26, 2011, and Dr. Achleitner, Mr. Löscher and Professor Dr. Trützschler, who were elected at the Annual General Meeting on May 31, 2012. The members elected by employees in Germany were elected on May 8, 2008.
| | | | |
| Deutsche Bank | | 04 – Corporate Governance Statement/Corporate Governance Report | | 428 |
| Financial Report 2012 | | Management Board and Supervisory Board | | |
| | |
| | | | |
| | |
| | | | |
The following table shows information on the current members of our Supervisory Board. The information includes the years in which the members were born, the years in which they were first elected or appointed, the years when their terms expire, their principal occupation and their membership on other companies’ supervisory boards, other nonexecutive directorships and other positions.
| | | | |
Member | | Principal occupation | | Supervisory board memberships and other directorships |
Dr. Paul Achleitner Year of birth: 1956 First elected: 2012 Term expires:2017 | | Chairman of the Supervisory Board of Deutsche Bank AG, Frankfurt | | Bayer AG; Daimler AG; RWE AG (until April 18, 2013); Henkel AG & Co. KGaA; (member of the Shareholders’ Committee) |
| | | | |
Wolfgang Böhr* Year of birth: 1963 First elected: 2008 Term expires: 2013 | | Chairman of the Combined Staff Council Düsseldorf of Deutsche Bank; member of the General Staff Council of Deutsche Bank; member of the Group Staff Council of Deutsche Bank | | Deutscher Bankangestellten Verband (DBV) (Chairman of the Association Council) (since July 2012) |
| | | | |
Dr. Karl-Gerhard Eick Year of birth: 1954 Appointed by the court: 2004 Term expires: 2013 | | Management Consultant, KGE Asset Management Consulting Ltd., London | | CORPUS SIREO Holding GmbH & Co. KG (Chairman) |
| | | | |
Katherine Garrett-Cox Year of birth: 1967 First elected: 2011 Term expires: 2016 | | Chief Executive Officer of Alliance Trust Plc, Dundee | | Alliance Trust Savings Ltd. (Executive Chairman); Alliance Trust Asset Management Ltd. (Chief Executive) |
| | | | |
Alfred Herling* Year of birth: 1952 First elected: 2008 Term expires: 2013 | | Chairman of the Combined Staff Council Wuppertal/Sauerland of Deutsche Bank; Chairman of the General Staff Council of Deutsche Bank; member of the European Staff Council; Chairman of the Group Staff Council of Deutsche Bank | | No memberships or directorships subject to disclosure |
| | | | |
Prof. Dr. Henning Kagermann Year of birth: 1947 First elected: 2000 Term expires: 2013 | | President of acatech – German Academy of Science and Engineering, Munich | | Münchener Rückversicherungs-Gesellschaft Aktiengesellschaft; Nokia Corporation; Deutsche Post AG; Wipro Technologies; BMW Bayerische Motoren Werke AG; Franz Haniel & Cie. GmbH (since November 2012) |
| | | | |
Martina Klee* Year of birth: 1962 First elected: 2008 Term expires: 2013 | | Chairperson of the Staff Council GTO Eschborn/Frankfurt of Deutsche Bank; member of the General Staff Council of Deutsche Bank; member of the Group Staff Council of Deutsche Bank: member of the European Staff Council | | Sterbekasse für die Angestellten der Deutschen Bank VVa.G. |
| | | | |
Suzanne Labarge Year of birth: 1946 First elected: 2008 Term expires: 2013 | | | | Coca-Cola Enterprises Inc.; XL Group Plc |
| | | | |
Peter Löscher Year of birth: 1957 First elected: 2012 Term expires: 2017 | | Chairman of the Management Board of Siemens AG, Munich | | Münchener Rückversicherungs-Gesellschaft Aktiengesellschaft, Thyssen-Bornemisza Group Limited |
| | | | |
Henriette Mark* Year of birth: 1957 First elected: 2003 Term expires: 2013 | | Chairperson of the Combined Staff Council Munich and Southern Bavaria of Deutsche Bank; member of the General Staff Council of Deutsche Bank; member of the Group Staff Council of Deutsche Bank; Chairperson of the European Staff Council | | No memberships or directorships subject to disclosure |
|
| | | | |
| Deutsche Bank | | 04 – Corporate Governance Statement/Corporate Governance Report | | 429 |
| Financial Report 2012 | | Management Board and Supervisory Board | | |
| | |
| | | | |
| | |
| | | | |
| | | | |
Member | | Principal occupation | | Supervisory board memberships and other directorships |
Gabriele Platscher* Year of birth: 1957 First elected: 2003 Term expires: 2013 | | Chairperson of the Combined Staff Council Braunschweig/Hildesheim of Deutsche Bank | | BVV Versicherungsverein des Bankgewerbes a.G. (Deputy Chairperson); BVV Versorgungskasse des Bankgewerbes e.V. (Deputy Chairperson); BVV Pensionsfonds des Bankgewerbes AG (Deputy Chairperson) |
| | | | |
Karin Ruck* Year of birth: 1965 First elected: 2003 Term expires: 2013 | | Deputy Chairperson of the Supervisory Board of Deutsche Bank AG; Senior Advisor Regional Transformation Region Frankfurt/Hesse-East, Deutsche Bank AG; member of the Combined Staff Council Frankfurt branch of Deutsche Bank | | BVV Versicherungsverein des Bankgewerbes a.G.; BVV Versorgungskasse des Bankgewerbes e.V.; BVV Pensionsfonds des Bankgewerbes AG |
| | | | |
Rudolf Stockem* Year of birth: 1956 Promoted to the post as Alternate Member: 2012 Term expires: 2013 | | Trade Union Secretary to ver.di Vereinte Dienstleistungsgesellschaft, Berlin | | Generali Holding Deutschland AG, Deutsche Bank Privat- und Geschäftskunden AG |
| | | | |
Dr. Johannes Teyssen Year of birth: 1959 First elected: 2008 Term expires: 2013 | | Chairman of the Management Board of E.ON SE, Düsseldorf | | E.ON Energie AG (until June 2012); E.ON Ruhrgas AG (until August 2012); Salzgitter AG |
| | | | |
Marlehn Thieme* Year of birth: 1957 First elected: 2008 Term expires: 2013 | | Director Infrastructure/Regional Management Communications Corporate Citizenship Deutsche Bank AG | | No memberships or directorships subject to disclosure |
| | | | |
Tilman Todenhöfer Year of birth: 1943 Appointed by the court: 2001 Term expires: 2013 | | Managing Partner of Robert Bosch Industrietreuhand KG, Stuttgart | | Robert Bosch GmbH; Robert Bosch Internationale Beteiligungen AG (President of the Board of Administration) |
| | | | |
Professor Dr. Klaus Rüdiger Trützschler Year of birth: 1948 First elected: 2012 Term expires: 2017 | | | | Bilfinger SE (until June 30, 2013); Sartorius AG; TAKKT AG (Chairman until January 31, 2013; Deputy Chairman since February 1, 2013); Wuppermann AG (Chairman); Zwiesel Kristallglas AG (Chairman); Wilhelm Werhahn KG |
| | | | |
Stefan Viertel* Year of birth: 1964 First elected: 2008 Term expires: 2013 | | Head of Cash Management Financial Institutions Austria and Hungary, Senior Sales Manager Deutsche Bank AG | | No memberships of directorships subject to disclosure |
| | | | |
Renate Voigt* Year of birth: 1954 Appointed by the court: 2011 Term expires: 2013 | | Chairperson of the Combined Staff Council Stuttgart/Esslingen/Heilbronn of Deutsche Bank | | No memberships of directorships subject to disclosure |
| | | | |
Werner Wenning Year of birth: 1946 First elected: 2008 Term expires: 2013 | | Chairman of the Supervisory Board of E.ON SE, Düsseldorf Chairman of the Supervisory Board of Bayer AG (since October 1, 2012), Leverkusen | | Henkel AG & Co. KGaA (member of the Shareholders’ Committee); HDI VVa.G.; Talanx AG; Freudenberg & Co. KG (member of the Shareholders’ Committee); Siemens AG (since January 23, 2013) |
|
| * | Elected by the employees in Germany; Renate Voigt appointed by the court as employee representative. |
Dr. Clemens Börsig, Maurice Lévy and Dr. Theo Siegert were shareholder representative members of the Supervisory Board until the conclusion of the Annual General Meeting on May 31, 2012. They were replaced by Dr. Paul Achleitner, Peter Löscher and Professor Dr. Klaus Rüdiger Trützschler. Gerd Herzberg was an employee representative member of the Supervisory Board until May 31, 2012, and was subsequently replaced by substitute member Rudolf Stockem for the remainder of the term of office.
In accordance with the German Banking Act, members of the Supervisory Board must be reliable and have the expertise required to perform their control function and to assess and supervise the businesses the company operates. While taking these requirements into account in accordance with Section 5.4.1 of the German Corporate Governance Code, the Supervisory Board established the following objectives for its composition in October 2010 and amended them in October 2012 and March 2013 based on the updated version of the Code published on May 15, 2012. These objectives have also been incorporated into Section 4 of the Terms of Reference for the Supervisory Board (see: www.deutsche-bank.de/corporate-governance).
| | | | |
| Deutsche Bank | | 04 – Corporate Governance Statement/Corporate Governance Report | | 430 |
| Financial Report 2012 | | Management Board and Supervisory Board | | |
| | |
| | | | |
| | |
| | | | |
The Supervisory Board of Deutsche Bank AG must be composed in such a way that its members as a group possess the knowledge, ability and expert experience to properly complete its tasks. In particular, the Supervisory Board members should have sufficient time to perform their mandates. The composition of the Supervisory Board should ensure the Supervisory Board’s qualified control of and advice for the Management Board of an internationally operating, broadly positioned bank and should preserve the reputation of Deutsche Bank Group among the public. In this regard, in particular, attention should be placed on the integrity, personality, willingness to perform, professionalism and independence of the individuals proposed for election. The objective is for the Supervisory Board as a group to have all of the knowledge and experience considered to be essential in consideration of the activities of Deutsche Bank Group.
Furthermore, the Supervisory Board shall have an adequate number of independent members and shall not have more than two former members of the Management Board of Deutsche Bank AG. Under the premise that the performance of the Supervisory Board mandate in itself by the representatives of the employees cannot be reason to doubt fulfillment of the independence criteria according to Section No. 5.4.2, the Supervisory Board shall have a total of at least sixteen members that are independent within the meaning of the Code. In any event, the Supervisory Board shall be composed such that the number of independent members, within the meaning of Code 5.4.2, among the shareholder representatives will be at least six. The members of the Supervisory Board may not exercise functions on a management body of or perform advisory duties at major competitors. Important and not just temporary conflicts of interests shall be avoided. Any member of the Supervisory Board who is a member of the management board of a listed stock corporation shall have no more than three supervisory board mandates outside the group of companies controlled by such stock corporation’s dependent companies or mandates in supervisory bodies of companies that have similar requirements. There is a regular maximum age limit of 70. In well-founded, individual cases, a Supervisory Board member may be elected or appointed for a period that extends at the latest until the end of the fourth Ordinary General Meeting that takes place after he or she has reached the age of 70. This age limit was taken into account in the election proposals to the recent General Meetings and shall also be taken into account for the next Supervisory Board elections or subsequent appointments for Supervisory Board positions that become vacant.
The Supervisory Board respects diversity when proposing members for appointment to the Supervisory Board. In light of the international operations of Deutsche Bank, care should be taken that the Supervisory Board has an appropriate number of members with long-term international experience. Currently, the professional careers and private lives of four members of the Supervisory Board are centered outside Germany. Furthermore, all of the shareholder representatives on the Supervisory Board have several years of international experience from their current or former activities as management board members or CEOs of corporations with international operations. In these two ways, the Supervisory Board believes the international activities of the company are sufficiently taken into account. The objective is to retain the currently existing international profile.
For the election proposals to the General Meeting, the Supervisory Board takes care that there is an appropriate consideration of women. Special importance was already attached to this in the selection process for the last Supervisory Board elections in 2008. In reviewing potential candidates for a new election or subsequent appointments to Supervisory Board positions that have become vacant, qualified women shall be included in the selection process and shall be appropriately considered in the election proposals. In accordance with the fixed targets, and at the proposal of the Supervisory Board, the General Meeting elected Ms. Garrett-Cox to the Supervisory Board at the General Meeting in 2011. Since the Supervisory Board elections in 2003, between 25 % and 40 % of the Supervisory Board members have been women. The Supervisory Board currently counts eight women among its members, which corresponds to 40 %. We shall strive to maintain this number and, as appropriate, to further increase the number of women among the shareholder representatives. It should be taken into account that the Supervisory Board can only influence the composition of the Supervisory Board through its election proposals to the General Meeting (for information on Deutsche Bank’s various diversity initiatives, please see the Annual Review 2012, which is available at www.deutsche-bank.com/ir/en/content/reports_2012.htm, and Deutsche Bank’s Career Portal on the Internet at www.db.com/careers/index_e.html).
| | | | |
| Deutsche Bank | | 04 – Corporate Governance Statement/Corporate Governance Report | | 431 |
| Financial Report 2012 | | Management Board and Supervisory Board | | |
| | |
| | | | |
| | |
| | | | |
In accordance with Section 5.4.2 of the German Corporate Governance Code, the Supervisory Board determined that it has what it considers to be an adequate number of independent members.
Some members of the Supervisory Board are, or were last year, in high-ranking positions at other companies that Deutsche Bank has business relations with. Business transactions with these companies are conducted under the same conditions as those between unrelated third parties. These transactions, in our opinion, do not affect the independence of the members of the Supervisory Board involved.
Standing Committees
The Supervisory Board has established the following five standing committees. The Report of the Supervisory Board in the Financial Report 2012 provides information on the concrete work of the committees over the preceding year.
Chairman’s Committee: The Chairman’s Committee is responsible for all Management Board and Supervisory Board matters. It prepares the decisions for the Supervisory Board on the appointment and dismissal of members of the Management Board, including long-term succession planning. It also submits a proposal to the Supervisory Board for the total remuneration of each members of the Management Board and the compensation system for the Management Board. It is responsible for entering into, amending and terminating the service contracts and other agreements in consideration of the Supervisory Board’s sole authority to decide on the remuneration of the members of the Management Board and provides its approval for ancillary activities, honorary offices or special tasks outside of Deutsche Bank Group performed by Management Board members pursuant to Section 112 of the German Stock Corporation Act and for certain contracts with Supervisory Board members pursuant to Section 114 of the German Stock Corporation Act. Furthermore, it prepares the decisions of the Supervisory Board in the field of corporate governance. The Chairman’s Committee held six meetings in 2012.
The current members of the Chairman’s Committee are Dr. Paul Achleitner (Chairman) (since May 31, 2012), Alfred Herling, Karin Ruck and Tilman Todenhöfer.
Nomination Committee: The Nomination Committee prepares the Supervisory Board’s proposals for the election or appointment of new shareholder representatives to the Supervisory Board. In this context, it is guided by the criteria specified by the Supervisory Board for its composition. The Nomination Committee held three meetings in 2012.
The current members of the Nomination Committee are Dr. Paul Achleitner (Chairman) (since May 31, 2012), Tilman Todenhöfer and Werner Wenning.
Audit Committee: The Audit Committee handles in particular the monitoring of the accounting process, the effectiveness of the internal control system, the risk management system and the internal audit system as well as the external audit including the auditor’s independence, additional services provided by the auditor as well as Compliance. It reviews the documentation relating to the annual and consolidated financial statements and discusses the audit reports with the auditor. It prepares the decisions of the Supervisory Board on the annual financial statements and the approval of the consolidated financial statements and discusses important changes to the audit and accounting methods. The Audit Committee also discusses the quarterly financial statements and the report on the limited review of the quarterly financial statements with the Management Board and the auditor prior to their publication. In addition, the Audit Committee issues the audit mandate to the auditor elected by the General Meeting. It passes the resolution on the compensation paid to the auditor and monitors the auditor’s independence, qualifications and efficiency. The Chairman of the Audit Committee, as well as the Chairman of the Supervisory Board, is entitled to obtain information directly from the Head of Compliance. The Audit Committee is responsible for acknowledging communications about significant reductions in the compliance budget and for taking receipt of and handling the report by the Head of Compliance on the appropriateness and effectiveness of the principles, methods and procedures in accordance with Section 33 (1) sentence 2 No. 5 of the German Securities Trading Act (WpHG) (Compliance Report). The Compliance Report
| | | | |
| Deutsche Bank | | 04 – Corporate Governance Statement/Corporate Governance Report | | 432 |
| Financial Report 2012 | | Management Board and Supervisory Board | | |
| | |
| | | | |
| | |
| | | | |
is issued at least once a year. The Head of Group Audit regularly reports to the Audit Committee on its ongoing work. The Audit Committee is informed about special audits, substantial complaints and other exceptional measures on the part of bank regulatory authorities. It has functional responsibility for receiving and handling complaints concerning accounting, internal accounting controls and issues relating to the audit. Subject to its review, the Audit Committee grants its approval for mandates engaging the auditor for non-audit-related services (in this context, see also the principal Accountant Fees and Services section starting on page 434 of the Corporate Governance Statement/Corporate Governance Report). The Audit Committee held seven meetings in 2012.
The current members of the Audit Committee are Dr. Karl-Gerhard Eick (Chairman), Dr. Paul Achleitner (since May 31, 2012), Henriette Mark, Karin Ruck, Marlehn Thieme and Professor Dr. Klaus Rüdiger Trützschler (since May 31, 2012).
Risk Committee: The Risk Committee advises the Supervisory Board on issues related to the actual and future aggregate risk disposition and aggregate risk strategy and supports the Supervisory Board in monitoring the implementation of this strategy by the Management Board. It handles loans which require a resolution by the Supervisory Board pursuant to law or our Articles of Association. Subject to its review, it grants its approval for the acquisition of shareholdings in other companies that amount to between 2 % and 3 % of our regulatory banking capital if it is likely that the shareholding will not remain in our full or partial possession for more than twelve months. At the meetings of the Risk Committee, the Management Board reports on credit, market, liquidity, operational, litigation and reputational risks. The Management Board also reports on risk strategy, credit portfolios, loans requiring a Supervisory Board approval pursuant to law or our Articles of Association, questions of capital resources and matters of special importance due to the risks they entail. The Risk Committee held six meetings in 2012.
The current members of the Risk Committee are Dr. Paul Achleitner (Chairman) (since May 31, 2012), Professor Dr. Henning Kagermann and Suzanne Labarge.
In addition to these four committees, the Mediation Committee, which is required by German law, makes proposals to the Supervisory Board on the appointment or dismissal of members of the Management Board in cases where the Supervisory Board is unable to reach a two-thirds majority decision with respect to the appointment or dismissal. The Mediation Committee only meets if necessary and did not hold any meetings in 2012.
The current members of the Mediation Committee are Dr. Paul Achleitner (Chairman) (since May 31, 2012), Wolfgang Böhr, Karin Ruck and Tilman Todenhöfer.
Further details regarding the Chairman’s Committee, the Risk Committee, the Audit Committee and the Nomination Committee are regulated in separate Terms of Reference. The current versions are available on our website, along with the Terms of Reference of our Supervisory Board (see: www.deutsche-bank.com/corporate-governance).
Share Plans
For information on our employee share programs, please refer to Note 34 “Employee Benefits” to the Consolidated Financial Statements.
| | | | |
| Deutsche Bank | | 04 – Corporate Governance Statement/Corporate Governance Report | | 433 |
| Financial Report 2012 | | Reporting and Transparency | | |
| | |
| | | | |
| | |
| | | | |
Reporting and Transparency
Directors’ Share Ownership
Management Board. For the Directors’ Share Ownership of the Management Board, please refer to our detailed Compensation Report in the Management Report.
Supervisory Board. The current members of our Supervisory Board held the following numbers of our shares and share awards under our employee share plans.
| | | | |
Members of the Supervisory Board | | Number of shares | | Number of share awards |
Dr. Paul Achleitner | | – | | – |
| | | | |
Wolfgang Böhr | | 545 | | – |
| | | | |
Dr. Karl-Gerhard Eick | | – | | – |
| | | | |
Katherine Garrett-Cox | | – | | – |
| | | | |
Alfred Herling | | 1,090 | | 10 |
| | | | |
Prof. Dr. Henning Kagermann | | – | | – |
| | | | |
Martina Klee | | 989 | | 10 |
| | | | |
Suzanne Labarge | | – | | – |
| | | | |
Peter Löscher | | – | | – |
| | | | |
Henriette Mark | | 649 | | 10 |
| | | | |
Gabriele Platscher | | 901 | | 5 |
| | | | |
Karin Ruck | | 165 | | – |
| | | | |
Rudolf Stockem | | – | | – |
| | | | |
Dr. Johannes Teyssen | | – | | – |
| | | | |
Marlehn Thieme | | 290 | | 10 |
| | | | |
Tilman Todenhöfer | | 1,741 | | – |
| | | | |
Prof. Dr. Klaus Rüdiger Trützschler | | 2,250 | | – |
| | | | |
Stefan Viertel | | 153 | | 10 |
| | | | |
Renate Voigt | | 255 | | 10 |
| | | | |
Werner Wenning | | – | | – |
| | | | |
Total | | 9,028 | | 65 |
|
The members of the Supervisory Board held 9,028 shares, amounting to less than 0.01 % of our shares as of March 25, 2013.
As listed in the “Number of share awards” column in the table, the members who are employees of Deutsche Bank hold matching awards granted under the Global Share Purchase Plan, which are scheduled to be delivered to them on November 1, 2013.
Related Party Transactions
For information on related party transactions please refer to Note 37 “Related Party Transactions”.
| | | | |
| Deutsche Bank | | 04 – Corporate Governance Statement/Corporate Governance Report | | 434 |
| Financial Report 2012 | | Auditing and Controlling | | |
| | |
| | | | |
| | |
| | | | |
Auditing and Controlling
Audit Committee Financial Expert
Our Supervisory Board has determined that Dr. Paul Achleitner, Dr. Karl-Gerhard Eick and Professor Dr. Klaus Rüdiger Trützschler, who are members of its Audit Committee, are “audit committee financial experts”, as such term is defined by the regulations of the Securities and Exchange Commission issued pursuant to Section 407 of the Sarbanes-Oxley Act of 2002. The audit committee financial experts mentioned above are “independent” of us, as defined in Rule 10A-3 under the U.S. Securities Exchange Act of 1934 and Section 100 (5) of the Stock Corporation Act (AktG). According to Sections 107 (4), 100 (5) of the Stock Corporation Act they are well grounded in the fields of accounting and auditing.
Code of Business Conduct and Ethics
Deutsche Bank’s Code of Business Conduct and Ethics describes the values and minimum standards for ethical business conduct that we expect all of our employees to follow. These values and standards govern employee interactions with our clients, competitors, business partners, government and regulatory authorities, and shareholders, as well as with other employees. The Code contains a voluntary commitment from the Management Board and the Group Executive Committee. It reflects our core values and our promise to our stakeholders. In addition, it forms the cornerstone of our policies, which provide guidance on compliance with applicable laws and regulations.
In accordance with Section 406 of the Sarbanes-Oxley Act of 2002, we also adopted a Code of Ethics that sets out special obligations for our Senior Financial Officers. Currently at Deutsche Bank these are the Co-Chairmen of the Management Board, the Chief Financial Officer, the Head of Group Accounting as well as members of the Group Finance Committee. In 2012, no complaints were reported to the Corporate Governance Officer regarding the Code of Ethics for Senior Financial Officers.
The current version of Deutsche Bank’s Code of Business Conduct and Ethics is available on our website at www.deutsche-bank.com/ir/en/content/code_of_ethics.htm.
Principal Accountant Fees and Services
In accordance with German law, our principal accountant is appointed at our General Meeting based on a recommendation of our Supervisory Board. The Audit Committee of our Supervisory Board prepares such a recommendation. Subsequent to the principal accountant’s appointment, the Audit Committee awards the contract and in its sole authority approves the terms and scope of the audit and all audit engagement fees as well as monitors the principal accountant’s independence. KPMG AG Wirtschaftsprüfungsgesellschaft was our principal accountant for the 2011 and 2012 fiscal years, respectively.
The table set forth below contains the aggregate fees billed for each of the last two fiscal years by KPMG AG Wirtschaftsprüfungsgesellschaft and the worldwide member firms of KPMG International in each of the following categories: (1) Audit fees, which are fees for professional services for the audit of our annual financial statements or services that are normally provided by the accountant in connection with statutory and regulatory filings or engagements for those fiscal years, (2) Audit-related fees, which are fees for assurance and related services that are reasonably related to the performance of the audit or review of our financial statements and are not reported as Audit fees; (3) Tax-related fees, which are fees for professional services rendered for tax compliance, tax consulting and tax planning, and (4) All other fees, which are fees for products and services other than Audit fees, Audit-related fees and Tax-related fees. These amounts include expenses and exclude Value Added Tax (VAT).
| | | | |
| Deutsche Bank | | 04 – Corporate Governance Statement/Corporate Governance Report | | 435 |
| Financial Report 2012 | | Auditing and Controlling | | |
| | |
| | | | |
| | |
| | | | |
| | | | | | | | |
Fee category in€ m. | | 2012 | | | 2011 | |
Audit fees | | | 50 | | | | 54 | |
| | | | | | | | |
Audit-related fees | | | 19 | | | | 12 | |
| | | | | | | | |
Tax-related fees | | | 7 | | | | 7 | |
| | | | | | | | |
All other fees | | | 1 | | | | 3 | |
| | | | | | | | |
Total fees1 | | | 76 | | | | 76 | |
| |
| 1 | Totals do not add up due to rounding. |
The Audit fees figure excludes the audit fees for Postbank and its subsidiaries, as they are currently not audited by KPMG. Audit fees decreased as the number of entities to be audited fell year-on-year. The increase in Audit-related fees results from a higher number of Postbank engagements. The Audit-related fees include fees for accounting advisory, due diligence relating to actual or contemplated acquisitions and dispositions, attestation engagements and other agreed-upon procedure engagements. Our Tax-related fees include fees for services relating to the preparation and review of tax returns and related compliance assistance and advice, tax consultation and advice relating to Group tax planning strategies and initiatives and assistance with assessing compliance with tax regulations. All other fees were incurred for project-related advisory services.
United States law and regulations, and our own policies, generally require that all engagements of our principal accountant be pre-approved by our Audit Committee or pursuant to policies and procedures adopted by it. Our Audit Committee has adopted the following policies and procedures for consideration and approval of requests to engage our principal accountant to perform non-audit services. Engagement requests must in the first instance be submitted to the Accounting Engagement Team established and supervised by our Group Finance Committee, whose members consist of our Chief Financial Officer and senior members of our Finance and Tax departments. If the request relates to services that would impair the independence of our principal accountant, the request must be rejected. Our Audit Committee has given its pre-approval for specified assurance, financial advisory and tax services, provided the expected fees for any such service do not exceed€ 1 million. If the engagement request relates to such specified pre-approved services, it may be approved by the Group Finance Committee, which must thereafter report such approval to the Audit Committee. If the engagement request relates neither to prohibited non-audit services nor to pre-approved non-audit services, it must be forwarded by the Group Finance Committee to the Audit Committee for consideration. In addition, to facilitate the consideration of engagement requests between its meetings, the Audit Committee has delegated approval authority to several of its members who are “independent” as defined by the Securities and Exchange Commission and the New York Stock Exchange. Such members are required to report any approvals made by them to the Audit Committee at its next meeting.
Additionally, United States law and regulations permit the pre-approval requirement to be waived with respect to engagements for non-audit services aggregating to no more than five percent of the total amount of revenues we paid to our principal accountant, if such engagements were not recognized by us at the time of engagement and were promptly brought to the attention of our Audit Committee or a designated member thereof and approved prior to the completion of the audit. In 2011 and 2012, the percentage of the total amount of revenues we paid to our principal accountant for non-audit services in each category that was subject to such a waiver was less than 5 % for each year.
| | | | |
| Deutsche Bank | | 04 – Corporate Governance Statement/Corporate Governance Report | | 436 |
| Financial Report 2012 | | Compliance with the German Corporate Governance Code | | |
| | |
| | | | |
| | |
| | | | |
[Page intentionally left blank for SEC filing purposes]
| | | | |
| Deutsche Bank | | 04 – Corporate Governance Statement/Corporate Governance Report | | 437 |
| Financial Report 2012 | | Compliance with the German Corporate Governance Code | | |
| | |
| | | | |
| | |
| | | | |
[Page intentionally left blank for SEC filing purposes]
[Page intentionally left blank for SEC filing purposes]
| | | | |
| Deutsche Bank | | 05 – Supplementary Information | | 439 |
| Financial Report 2012 | | Management Board | | |
| | |
| | | | |
| | |
| | | | |
[Page intentionally left blank for SEC filing purposes]
| | | | |
| Deutsche Bank | | 05 – Supplementary Information | | 440 |
| Financial Report 2012 | | Supervisory Board | | |
| | |
| | | | |
| | |
| | | | |
[Page intentionally left blank for SEC filing purposes]
| | | | |
| Deutsche Bank | | 05 – Supplementary Information | | 441 |
| Financial Report 2012 | | Supervisory Board | | |
| | |
| | | | |
| | |
| | | | |
[Page intentionally left blank for SEC filing purposes]
| | | | |
| Deutsche Bank | | 05 – Supplementary Information | | 442 |
| Financial Report 2012 | | Advisory Boards | | |
| | |
| | | | |
| | |
| | | | |
[Page intentionally left blank for SEC filing purposes]
| | | | |
| Deutsche Bank | | 05 – Supplementary Information | | 443 |
| Financial Report 2012 | | Group Five-Year Record | | |
| | |
| | | | |
| | |
| | | | |
[Page intentionally left blank for SEC filing purposes]
| | | | |
| Deutsche Bank | | 05 – Supplementary Information | | 444 |
| Financial Report 2012 | | Declaration of Backing | | |
| | |
| | | | |
| | |
| | | | |
[Page intentionally left blank for SEC filing purposes]
| | | | |
| Deutsche Bank | | 05 – Supplementary Information | | 445 |
| Financial Report 2012 | | Impressum / Publications | | |
| | |
| | | | |
| | |
| | | | |
[Page intentionally left blank for SEC filing purposes]

| | | | |
| Deutsche Bank | | Supplemental Financial Information (Unaudited) | | S-1 |
| Annual Report 2012 on Form 20-F | | | | |
| |
Supplemental Financial Information (Unaudited) | | |
| | |
| | | | |
Industry Guide 3 Information
Amounts for 2012, 2011, 2010, 2009 and 2008 are prepared in accordance with IFRS, which is consistent with the Group’s Financial Statements.
| | | | |
| Deutsche Bank | | Supplemental Financial Information (Unaudited) | | S-2 |
| Annual Report 2012 on Form 20-F | | | | |
| | |
| | | | |
| | |
| | | | |
Financial Condition
Average balance sheet based upon month-end balances
| | | | | | | | | | | | | | | | | | | | | | | | | | | | | | | | | | | | |
| Average balance sheet and net interest income | | 2012 | | | 2011 | | | 2010 | |
in€ m. (unless stated otherwise) | | Average
balance | | | Interest | | | Average
yield/rate | | | Average
balance | | | Interest | | | Average
yield/rate | | | Average
balance | | | Interest | | | Average
yield/rate | |
Assets: | | | | | | | | | | | | | | | | | | | | | | | | | | | | | | | | | | | | |
| | | | | | | | | | | | | | | | | | | | | | | | | | | | | | | | | | | | |
Interest-earning deposits with banks: | | | | | | | | | | | | | | | | | | | | | | | | | | | | | | | | | | | | |
In German offices | | | 59,605 | | | | 167 | | | | 0.28 % | | | | 29,807 | | | | 330 | | | | 1.11 % | | | | 32,333 | | | | 185 | | | | 0.57 % | |
In Non-German offices | | | 79,477 | | | | 752 | | | | 0.95 % | | | | 66,979 | | | | 464 | | | | 0.69 % | | | | 40,886 | | | | 506 | | | | 1.24 % | |
| | | | | | | | | | | | | | | | | | | | | | | | | | | | | | | | | | | | |
Total interest-earning deposits with banks | | | 139,082 | | | | 919 | | | | 0.66 % | | | | 96,786 | | | | 794 | | | | 0.82 % | | | | 73,219 | | | | 691 | | | | 0.94 % | |
| | | | | | | | | | | | | | | | | | | | | | | | | | | | | | | | | | | | |
| Central bank funds sold and securities purchased under resale agreements: | | | | | | | | | | | | | | | | | | | | | | | | | | | | | | | | | | | | |
In German offices | | | 36,557 | | | | 136 | | | | 0.37 % | | | | 25,556 | | | | 317 | | | | 1.24 % | | | | 1,739 | | | | 23 | | | | 1.35 % | |
In Non-German offices | | | 12,918 | | | | 626 | | | | 4.85 % | | | | 10,851 | | | | 660 | | | | 6.08 % | | | | 11,517 | | | | 423 | | | | 3.67 % | |
| | | | | | | | | | | | | | | | | | | | | | | | | | | | | | | | | | | | |
| Total central bank funds sold and securities purchased under resale agreements | | | 49,475 | | | | 762 | | | | 1.54 % | | | | 36,407 | | | | 977 | | | | 2.68 % | | | | 13,256 | | | | 446 | | | | 3.37 % | |
| | | | | | | | | | | | | | | | | | | | | | | | | | | | | | | | | | | | |
Securities borrowed: | | | | | | | | | | | | | | | | | | | | | | | | | | | | | | | | | | | | |
In German offices | | | 117 | | | | 0 | | | | 0.05 % | | | | 107 | | | | 1 | | | | 0.52 % | | | | 52 | | | | 0 | | | | 0.06 % | |
In Non-German offices | | | 29,626 | | | | 203 | | | | 0.69 % | | | | 34,804 | | | | 154 | | | | 0.44 % | | | | 45,202 | | | | 133 | | | | 0.29 % | |
| | | | | | | | | | | | | | | | | | | | | | | | | | | | | | | | | | | | |
Total securities borrowed | | | 29,743 | | | | 203 | | | | 0.68 % | | | | 34,911 | | | | 155 | | | | 0.44 % | | | | 45,254 | | | | 133 | | | | 0.29 % | |
| | | | | | | | | | | | | | | | | | | | | | | | | | | | | | | | | | | | |
| Interest-earning financial assets at fair value through profit or loss: | | | | | | | | | | | | | | | | | | | | | | | | | | | | | | | | | | | | |
In German offices | | | 43,041 | | | | 1,055 | | | | 2.45 % | | | | 56,787 | | | | 1,590 | | | | 2.80 % | | | | 42,878 | | | | 987 | | | | 2.30 % | |
In Non-German offices | | | 449,521 | | | | 13,069 | | | | 2.91 % | | | | 430,654 | | | | 13,786 | | | | 3.20 % | | | | 445,754 | | | | 14,602 | | | | 3.28 % | |
| | | | | | | | | | | | | | | | | | | | | | | | | | | | | | | | | | | | |
| Total interest-earning financial assets at fair value through profit or loss | | | 492,562 | | | | 14,124 | | | | 2.87 % | | | | 487,441 | | | | 15,376 | | | | 3.15 % | | | | 488,632 | | | | 15,589 | | | | 3.19 % | |
| | | | | | | | | | | | | | | | | | | | | | | | | | | | | | | | | | | | |
Financial assets available for sale: | | | | | | | | | | | | | | | | | | | | | | | | | | | | | | | | | | | | |
In German offices | | | 31,475 | | | | 1,054 | | | | 3.35 % | | | | 35,969 | | | | 614 | | | | 1.71 % | | | | 13,755 | | | | 413 | | | | 3.01 % | |
In Non-German offices | | | 16,347 | | | | 532 | | | | 3.25 % | | | | 13,049 | | | | 469 | | | | 3.60 % | | | | 13,259 | | | | 424 | | | | 3.19 % | |
| | | | | | | | | | | | | | | | | | | | | | | | | | | | | | | | | | | | |
Total financial assets available for sale | | | 47,822 | | | | 1,586 | | | | 3.32 % | | | | 49,018 | | | | 1,083 | | | | 2.21 % | | | | 27,014 | | | | 837 | | | | 3.10 % | |
| | | | | | | | | | | | | | | | | | | | | | | | | | | | | | | | | | | | |
Loans:2 | | | | | | | | | | | | | | | | | | | | | | | | | | | | | | | | | | | | |
In German offices | | | 231,155 | | | | 7,965 | | | | 3.45 % | | | | 236,066 | | | | 9,199 | | | | 3.90 % | | | | 126,181 | | | | 4,741 | | | | 3.76 % | |
In Non-German offices | | | 180,642 | | | | 5,697 | | | | 3.15 % | | | | 174,018 | | | | 5,715 | | | | 3.28 % | | | | 163,391 | | | | 5,481 | | | | 3.35 % | |
| | | | | | | | | | | | | | | | | | | | | | | | | | | | | | | | | | | | |
Total loans | | | 411,797 | | | | 13,662 | | | | 3.32 % | | | | 410,084 | | | | 14,914 | | | | 3.64 % | | | | 289,572 | | | | 10,222 | | | | 3.53 % | |
| | | | | | | | | | | | | | | | | | | | | | | | | | | | | | | | | | | | |
Total other interest-earning assets | | | 71,310 | | | | 986 | | | | 1.38 % | | | | 59,554 | | | | 1,579 | | | | 2.65 % | | | | 56,833 | | | | 861 | | | | 1.52 % | |
| | | | | | | | | | | | | | | | | | | | | | | | | | | | | | | | | | | | |
Total interest-earning assets | | | 1,241,791 | | | | 32,242 | | | | 2.60 % | | | | 1,174,201 | | | | 34,878 | | | | 2.97 % | | | | 993,780 | | | | 28,779 | | | | 2.90 % | |
| | | | | | | | | | | | | | | | | | | | | | | | | | | | | | | | | | | | |
Cash and due from banks | | | 19,446 | | | | | | | | | | | | 17,207 | | | | | | | | | | | | 10,745 | | | | | | | | | |
| | | | | | | | | | | | | | | | | | | | | | | | | | | | | | | | | | | | |
| Noninterest-earning financial assets at fair value through profit or loss: | | | | | | | | | | | | | | | | | | | | | | | | | | | | | | | | | | | | |
In German offices | | | 381,168 | | | | | | | | | | | | 336,977 | | | | | | | | | | | | 294,329 | | | | | | | | | |
In Non-German offices | | | 473,430 | | | | | | | | | | | | 364,241 | | | | | | | | | | | | 434,066 | | | | | | | | | |
| | | | | | | | | | | | | | | | | | | | | | | | | | | | | | | | | | | | |
All other assets | | | 144,500 | | | | | | | | | | | | 157,044 | | | | | | | | | | | | 158,923 | | | | | | | | | |
| | | | | | | | | | | | | | | | | | | | | | | | | | | | | | | | | | | | |
Allowance for credit losses | | | (4,388) | | | | | | | | | | | | (3,600) | | | | | | | | | | | | (3,455) | | | | | | | | | |
| | | | | | | | | | | | | | | | | | | | | | | | | | | | | | | | | | | | |
Total assets | | | 2,255,947 | | | | | | | | | | | | 2,046,070 | | | | | | | | | | | | 1,888,388 | | | | | | | | | |
| | | | | | | | | | | | | | | | | | | | | | | | | | | | | | | | | | | | |
% of assets attributable to Non- German offices | | | 64 % | | | | | | | | | | | | 62 % | | | | | | | | | | | | 71 % | | | | | | | | | |
| | | | | | | | | | | | | | | | | | | | | |
| | | | |
| Deutsche Bank | | Supplemental Financial Information (Unaudited) | | S-3 |
| Annual Report 2012 on Form 20-F | | | | |
| | |
| | | | |
| | |
| | | | |
| | | | | | | | | | | | | | | | | | | | | | | | | | | | | | | | | | | | |
| Average balance sheet and net interest income | | 2012 | | | 2011 | | | 2010 | |
in€ m. (unless stated otherwise) | | Average
balance | | | Interest | | | Average
yield/rate | | | Average
balance | | | Interest | | | Average
yield/rate | | | Average
balance | | | Interest | | | Average
yield/rate | |
Liabilities and equity:1 | | | | | | | | | | | | | | | | | | | | | | | | | | | | | | | | | | | | |
| | | | | | | | | | | | | | | | | | | | | | | | | | | | | | | | | | | | |
Interest-bearing deposits: | | | | | | | | | | | | | | | | | | | | | | | | | | | | | | | | | | | | |
| | | | | | | | | | | | | | | | | | | | | | | | | | | | | | | | | | | | |
In German offices: | | | | | | | | | | | | | | | | | | | | | | | | | | | | | | | | | | | | |
Time deposits | | | 58,071 | | | | 1,684 | | | | 2.90 % | | | | 63,201 | | | | 1,966 | | | | 3.11 % | | | | 38,896 | | | | 681 | | | | 1.75 % | |
Savings deposits | | | 111,408 | | | | 1,679 | | | | 1.51 % | | | | 115,273 | | | | 1,876 | | | | 1.63 % | | | | 51,564 | | | | 735 | | | | 1.43 % | |
Demand deposits | | | 73,234 | | | | 336 | | | | 0.46 % | | | | 69,175 | | | | 586 | | | | 0.85 % | | | | 51,396 | | | | 249 | | | | 0.48 % | |
| | | | | | | | | | | | | | | | | | | | | | | | | | | | | | | | | | | | |
Total in German offices | | | 242,713 | | | | 3,699 | | | | 1.52 % | | | | 247,649 | | | | 4,428 | | | | 1.79 % | | | | 141,856 | | | | 1,665 | | | | 1.17 % | |
| | | | | | | | | | | | | | | | | | | | | | | | | | | | | | | | | | | | |
In Non-German offices: | | | | | | | | | | | | | | | | | | | | | | | | | | | | | | | | | | | | |
Time deposits | | | 128,918 | | | | 1,101 | | | | 0.85 % | | | | 127,100 | | | | 1,090 | | | | 0.86 % | | | | 118,265 | | | | 1,165 | | | | 0.98 % | |
Savings deposits | | | 20,423 | | | | 221 | | | | 1.08 % | | | | 22,430 | | | | 247 | | | | 1.10 % | | | | 21,466 | | | | 226 | | | | 1.05 % | |
Demand deposits | | | 79,062 | | | | 705 | | | | 0.89 % | | | | 79,583 | | | | 1,014 | | | | 1.27 % | | | | 73,931 | | | | 744 | | | | 1.01 % | |
| | | | | | | | | | | | | | | | | | | | | | | | | | | | | | | | | | | | |
Total in Non-German offices | | | 228,403 | | | | 2,027 | | | | 0.89 % | | | | 229,113 | | | | 2,351 | | | | 1.03 % | | | | 213,662 | | | | 2,135 | | | | 1.00 % | |
| | | | | | | | | | | | | | | | | | | | | | | | | | | | | | | | | | | | |
Total interest-bearing deposits | | | 471,116 | | | | 5,726 | | | | 1.22 % | | | | 476,762 | | | | 6,779 | | | | 1.42 % | | | | 355,518 | | | | 3,800 | | | | 1.07 % | |
| | | | | | | | | | | | | | | | | | | | | | | | | | | | | | | | | | | | |
| Central bank funds purchased and securities sold under repurchase agreements: | | | | | | | | | | | | | | | | | | | | | | | | | | | | | | | | | | | | |
In German offices | | | 19,481 | | | | 44 | | | | 0.22 % | | | | 14,978 | | | | 158 | | | | 1.06 % | | | | 3,942 | | | | 32 | | | | 0.81 % | |
In Non-German offices | | | 53,574 | | | | 271 | | | | 0.51 % | | | | 39,464 | | | | 268 | | | | 0.68 % | | | | 48,009 | | | | 269 | | | | 0.56 % | |
| | | | | | | | | | | | | | | | | | | | | | | | | | | | | | | | | | | | |
| Total central bank funds purchased and securities sold under repurchase agreements | | | 73,055 | | | | 315 | | | | 0.43 % | | | | 54,442 | | | | 426 | | | | 0.78 % | | | | 51,951 | | | | 301 | | | | 0.58 % | |
| | | | | | | | | | | | | | | | | | | | | | | | | | | | | | | | | | | | |
Securities loaned: | | | | | | | | | | | | | | | | | | | | | | | | | | | | | | | | | | | | |
In German offices | | | 12 | | | | 0 | | | | 3.27 % | | | | 10 | | | | (2) | | | | (15.80) % | | | | 26 | | | | (2) | | | | (8.35) % | |
In Non-German offices | | | 6,627 | | | | 421 | | | | 6.35 % | | | | 8,169 | | | | 345 | | | | 4.22 % | | | | 8,750 | | | | 280 | | | | 3.21 % | |
| | | | | | | | | | | | | | | | | | | | | | | | | | | | | | | | | | | | |
Total securities loaned | | | 6,639 | | | | 421 | | | | 6.34 % | | | | 8,179 | | | | 343 | | | | 4.20 % | | | | 8,776 | | | | 278 | | | | 3.17 % | |
| | | | | | | | | | | | | | | | | | | | | | | | | | | | | | | | | | | | |
| Interest-bearing financial liabilities at fair value through profit or loss: | | | | | | | | | | | | | | | | | | | | | | | | | | | | | | | | | | | | |
In German offices | | | 22,096 | | | | 728 | | | | 3.30 % | | | | 26,327 | | | | 880 | | | | 3.34 % | | | | 25,130 | | | | 700 | | | | 2.79 % | |
In Non-German offices | | | 196,981 | | | | 5,908 | | | | 3.00 % | | | | 201,708 | | | | 5,635 | | | | 2.79 % | | | | 209,298 | | | | 5,319 | | | | 2.54 % | |
| | | | | | | | | | | | | | | | | | | | | | | | | | | | | | | | | | | | |
| Total interest-bearing financial liabilities at fair value through profit or loss | | | 219,077 | | | | 6,636 | | | | 3.03 % | | | | 228,035 | | | | 6,515 | | | | 2.86 % | | | | 234,428 | | | | 6,019 | | | | 2.57 % | |
| | | | | | | | | | | | | | | | | | | | | | | | | | | | | | | | | | | | |
Other short-term borrowings: | | | | | | | | | | | | | | | | | | | | | | | | | | | | | | | | | | | | |
In German offices | | | 3,140 | | | | 22 | | | | 0.69 % | | | | 5,763 | | | | 57 | | | | 0.99 % | | | | 1,606 | | | | 43 | | | | 2.70 % | |
In Non-German offices | | | 64,080 | | | | 320 | | | | 0.50 % | | | | 59,117 | | | | 422 | | | | 0.71 % | | | | 53,881 | | | | 332 | | | | 0.62 % | |
| | | | | | | | | | | | | | | | | | | | | | | | | | | | | | | | | | | | |
Total other short-term borrowings | | | 67,220 | | | | 342 | | | | 0.51 % | | | | 64,880 | | | | 479 | | | | 0.74 % | | | | 55,487 | | | | 375 | | | | 0.68 % | |
| | | | | | | | | | | | | | | | | | | | | | | | | | | | | | | | | | | | |
Long-term debt and trust preferred securities: | | | | | | | | | | | | | | | | | | | | | | | | | | | | | | | | | | | | |
In German offices | | | 89,052 | | | | 888 | | | | 1.00 % | | | | 91,623 | | | | 910 | | | | 0.99 % | | | | 67,903 | | | | 541 | | | | 0.80 % | |
In Non-German offices | | | 90,435 | | | | 1,884 | | | | 2.08 % | | | | 83,409 | | | | 1,738 | | | | 2.08 % | | | | 87,175 | | | | 1,730 | | | | 1.98 % | |
| | | | | | | | | | | | | | | | | | | | | | | | | | | | | | | | | | | | |
Total long-term debt and trust preferred securities | | | 179,487 | | | | 2,772 | | | | 1.54 % | | | | 175,032 | | | | 2,648 | | | | 1.51 % | | | | 155,078 | | | | 2,271 | | | | 1.46 % | |
| | | | | | | | | | | | | | | | | | | | | | | | | | | | | | | | | | | | |
Total other interest-bearing liabilities | | | 103,946 | | | | 139 | | | | 0.13 % | | | | 71,391 | | | | 243 | | | | 0.34 % | | | | 72,299 | | | | 152 | | | | 0.21 % | |
| | | | | | | | | | | | | | | | | | | | | | | | | | | | | | | | | | | | |
Total interest-bearing liabilities | | | 1,120,540 | | | | 16,351 | | | | 1.46 % | | | | 1,078,721 | | | | 17,433 | | | | 1.62 % | | | | 933,537 | | | | 13,196 | | | | 1.41 % | |
| | | | | | | | | | | | | | | | | | | | | | | | | | | | | | | | | | | | |
Noninterest-bearing deposits: | | | | | | | | | | | | | | | | | | | | | | | | | | | | | | | | | | | | |
In German offices | | | 89,535 | | | | | | | | | | | | 68,403 | | | | | | | | | | | | 40,846 | | | | | | | | | |
In Non-German offices | | | 26,624 | | | | | | | | | | | | 17,207 | | | | | | | | | | | | 13,370 | | | | | | | | | |
| | | | | | | | | | | | | | | | | | | | | | | | | | | | | | | | | | | | |
| Noninterest-bearing financial liabilities at fair value through profit or loss: | | | | | | | | | | | | | | | | | | | | | | | | | | | | | | | | | | | | |
In German offices | | | 361,378 | | | | | | | | | | | | 321,624 | | | | | | | | | | | | 280,320 | | | | | | | | | |
In Non-German offices | | | 464,652 | | | | | | | | | | | | 356,515 | | | | | | | | | | | | 427,702 | | | | | | | | | |
| | | | | | | | | | | | | | | | | | | | | | | | | | | | | | | | | | | | |
All other noninterest-bearing liabilities | | | 136,866 | | | | | | | | | | | | 151,633 | | | | | | | | | | | | 149,801 | | | | | | | | | |
| | | | | | | | | | | | | | | | | | | | | | | | | | | | | | | | | | | | |
Total shareholders’ equity | | | 55,593 | | | | | | | | | | | | 50,547 | | | | | | | | | | | | 41,712 | | | | | | | | | |
| | | | | | | | | | | | | | | | | | | | | | | | | | | | | | | | | | | | |
Noncontrolling interests | | | 759 | | | | | | | | | | | | 1,420 | | | | | | | | | | | | 1,100 | | | | | | | | | |
| | | | | | | | | | | | | | | | | | | | | | | | | | | | | | | | | | | | |
Total equity | | | 56,352 | | | | | | | | | | | | 51,967 | | | | | | | | | | | | 42,812 | | | | | | | | | |
| | | | | | | | | | | | | | | | | | | | | | | | | | | | | | | | | | | | |
Total liabilities and equity | | | 2,255,947 | | | | | | | | | | | | 2,046,070 | | | | | | | | | | | | 1,888,388 | | | | | | | | | |
| | | | | | | | | | | | | | | | | | | | | | | | | | | | | | | | | | | | |
% of liabilities attributable to Non-German offices | | | 56 % | | | | | | | | | | | | 56 % | | | | | | | | | | | | 64 % | | | | | | | | | |
| | | | | | | | | | | | | | | | | | | | | | | | | | | | | | | | | | | | |
Rate spread | | | 1.14 % | | | | | | | | | | | | 1.35 % | | | | | | | | | | | | 1.48 % | | | | | | | | | |
| | | | | | | | | | | | | | | | | | | | | | | | | | | | | | | | | | | | |
| Net interest margin (Net interest income to total interest-earning assets): | | | | | | | | | | | | | | | | | | | | | | | | | | | | | | | | | | | | |
In German offices | | | 1.31 % | | | | | | | | | | | | 1.60 % | | | | | | | | | | | | 1.60 % | | | | | | | | | |
In Non-German offices | | | 1.27 % | | | | | | | | | | | | 1.46 % | | | | | | | | | | | | 1.58 % | | | | | | | | | |
| | | | | | | | | | | | | | | | | | | | | | | | | | | | | | | | | | | | |
Total | | | 1.28 % | | | | | | | | | | | | 1.49 % | | | | | | | | | | | | 1.57 % | | | | | | | | | |
| |
| 1 | The allocation of the assets and liabilities between German and Non-German offices are based on the location of the entity which carries the respective asset or liability. |
| 2 | Categories of loans include impaired loans. |
| | | | |
| Deutsche Bank | | Supplemental Financial Information (Unaudited) | | S-4 |
| Annual Report 2012 on Form 20-F | | | | |
| | |
| | | | |
| | |
| | | | |
Analysis of changes in net interest income
| | | | | | | | | | | | | | | | | | | | | | | | |
| | | 2012 over 2011 due to changes in1 | | | 2011 over 2010 due to changes in1 | |
in€ m. | | Net change | | | Volume | | | Rate | | | Net change | | | Volume | | | Rate | |
Interest and similar income: | | | | | | | | | | | | | | | | | | | | | | | | |
| | | | | | | | | | | | | | | | | | | | | | | | |
Interest-earning deposits with banks: | | | | | | | | | | | | | | | | | | | | | | | | |
German offices | | | (163) | | | | 189 | | | | (352) | | | | 145 | | | | (16) | | | | 161 | |
Non-German offices | | | 288 | | | | 97 | | | | 191 | | | | (42) | | | | 239 | | | | (281) | |
| | | | | | | | | | | | | | | | | | | | | | | | |
| Total interest-earning deposits with banks | | | 125 | | | | 286 | | | | (161) | | | | 103 | | | | 223 | | | | (120) | |
| | | | | | | | | | | | | | | | | | | | | | | | |
| Central bank funds sold and securities purchased under resale agreements: | | | | | | | | | | | | | | | | | | | | | | | | |
German offices | | | (181) | | | | 100 | | | | (281) | | | | 294 | | | | 296 | | | | (2) | |
Non-German offices | | | (34) | | | | 113 | | | | (147) | | | | 237 | | | | (26) | | | | 263 | |
| | | | | | | | | | | | | | | | | | | | | | | | |
| Total central bank funds sold and securities purchased under resale agreements | | | (215) | | | | 213 | | | | (428) | | | | 531 | | | | 270 | | | | 261 | |
| | | | | | | | | | | | | | | | | | | | | | | | |
Securities borrowed: | | | | | | | | | | | | | | | | | | | | | | | | |
German offices | | | (1) | | | | – | | | | (1) | | | | 1 | | | | 1 | | | | – | |
Non-German offices | | | 49 | | | | (26) | | | | 75 | | | | 21 | | | | (36) | | | | 57 | |
| | | | | | | | | | | | | | | | | | | | | | | | |
| Total securities borrowed | | | 48 | | | | (26) | | | | 74 | | | | 22 | | | | (35) | | | | 57 | |
| | | | | | | | | | | | | | | | | | | | | | | | |
Financial assets at fair value through profit or loss: | | | | | | | | | | | | | | | | | | | | | | | | |
German offices | | | (535) | | | | (353) | | | | (182) | | | | 603 | | | | 361 | | | | 242 | |
Non-German offices | | | (717) | | | | 586 | | | | (1,303) | | | | (816) | | | | (488) | | | | (328) | |
| | | | | | | | | | | | | | | | | | | | | | | | |
| Total financial assets at fair value through profit or loss | | | (1,252) | | | | 233 | | | | (1,485) | | | | (213) | | | | (127) | | | | (86) | |
| | | | | | | | | | | | | | | | | | | | | | | | |
Financial assets available for sale | | | | | | | | | | | | | | | | | | | | | | | | |
German offices | | | 440 | | | | (85) | | | | 525 | | | | 201 | | | | 440 | | | | (239) | |
Non-German offices | | | 63 | | | | 110 | | | | (47) | | | | 45 | | | | (7) | | | | 52 | |
| | | | | | | | | | | | | | | | | | | | | | | | |
| Total financial assets available for sale | | | 503 | | | | 25 | | | | 478 | | | | 246 | | | | 433 | | | | (187) | |
| | | | | | | | | | | | | | | | | | | | | | | | |
Loans: | | | | | | | | | | | | | | | | | | | | | | | | |
German offices | | | (1,234) | | | | (188) | | | | (1,046) | | | | 4,458 | | | | 4,276 | | | | 182 | |
Non-German offices | | | (18) | | | | 214 | | | | (232) | | | | 234 | | | | 350 | | | | (116) | |
| | | | | | | | | | | | | | | | | | | | | | | | |
| Total loans | | | (1,252) | | | | 26 | | | | (1,278) | | | | 4,692 | | | | 4,626 | | | | 66 | |
| | | | | | | | | | | | | | | | | | | | | | | | |
| Other interest-earning assets | | | (593) | | | | 576 | | | | (1,169) | | | | 718 | | | | 44 | | | | 674 | |
| | | | | | | | | | | | | | | | | | | | | | | | |
| Total interest and similar income | | | (2,636) | | | | 1,333 | | | | (3,969) | | | | 6,099 | | | | 5,434 | | | | 665 | |
| | | | | | | | | | | | | | | | | | | | | | | | |
Interest expense: | | | | | | | | | | | | | | | | | | | | | | | | |
| | | | | | | | | | | | | | | | | | | | | | | | |
Interest-bearing deposits: | | | | | | | | | | | | | | | | | | | | | | | | |
German offices | | | (729) | | | | (87) | | | | (642) | | | | 2,763 | | | | 1,624 | | | | 1,139 | |
Non-German offices | | | (324) | | | | (7) | | | | (317) | | | | 216 | | | | 157 | | | | 59 | |
| | | | | | | | | | | | | | | | | | | | | | | | |
| Total interest-bearing deposits | | | (1,053) | | | | (94) | | | | (959) | | | | 2,979 | | | | 1,781 | | | | 1,198 | |
| | | | | | | | | | | | | | | | | | | | | | | | |
| Central bank funds purchased and securities sold under repurchase agreements: | | | | | | | | | | | | | | | | | | | | | | | | |
German offices | | | (114) | | | | 38 | | | | (152) | | | | 126 | | | | 114 | | | | 12 | |
Non-German offices | | | 3 | | | | 81 | | | | (78) | | | | (1) | | | | (52) | | | | 51 | |
| | | | | | | | | | | | | | | | | | | | | | | | |
| Total central bank funds purchased and securities sold under repurchase agreements | | | (111) | | | | 119 | | | | (230) | | | | 125 | | | | 62 | | | | 63 | |
| | | | | | | | | | | | | | | | | | | | | | | | |
Securities loaned: | | | | | | | | | | | | | | | | | | | | | | | | |
German offices | | | 2 | | | | – | | | | 2 | | | | – | | | | 1 | | | | (1) | |
Non-German offices | | | 76 | | | | (74) | | | | 150 | | | | 65 | | | | (19) | | | | 84 | |
| | | | | | | | | | | | | | | | | | | | | | | | |
| Total securities loaned | | | 78 | | | | (74) | | | | 152 | | | | 65 | | | | (18) | | | | 83 | |
| | | | | | | | | | | | | | | | | | | | | | | | |
Financial liabilities at fair value through profit or loss: | | | | | | | | | | | | | | | | | | | | | | | | |
German offices | | | (152) | | | | (140) | | | | (12) | | | | 180 | | | | 35 | | | | 145 | |
Non-German offices | | | 273 | | | | (134) | | | | 407 | | | | 316 | | | | (198) | | | | 514 | |
| | | | | | | | | | | | | | | | | | | | | | | | |
| Total financial liabilities at fair value through profit or loss | | | 121 | | | | (274) | | | | 395 | | | | 496 | | | | (163) | | | | 659 | |
| | | | | | | | | | | | | | | | | | | | | | | | |
Other short-term borrowings: | | | | | | | | | | | | | | | | | | | | | | | | |
German offices | | | (35) | | | | (18) | | | | (17) | | | | 14 | | | | 40 | | | | (26) | |
Non-German offices | | | (102) | | | | 42 | | | | (144) | | | | 90 | | | | 43 | | | | 47 | |
| | | | | | | | | | | | | | | | | | | | | | | | |
| Total other short-term borrowings | | | (137) | | | | 24 | | | | (161) | | | | 104 | | | | 83 | | | | 21 | |
| | | | | | | | | | | | | | | | | | | | | | | | |
Long-term debt and trust preferred securities: | | | | | | | | | | | | | | | | | | | | | | | | |
German offices | | | (22) | | | | (27) | | | | 5 | | | | 369 | | | | 217 | | | | 152 | |
Non-German offices | | | 146 | | | | 148 | | | | (2) | | | | 8 | | | | (77) | | | | 85 | |
| | | | | | | | | | | | | | | | | | | | | | | | |
| Total long-term debt and trust preferred securities | | | 124 | | | | 121 | | | | 3 | | | | 377 | | | | 140 | | | | 237 | |
| | | | | | | | | | | | | | | | | | | | | | | | |
| Other interest-bearing liabilities | | | (104) | | | | 77 | | | | (181) | | | | 91 | | | | 1 | | | | 90 | |
| | | | | | | | | | | | | | | | | | | | | | | | |
| Total interest expense | | | (1,082) | | | | (101) | | | | (981) | | | | 4,237 | | | | 1,886 | | | | 2,351 | |
| | | | | | | | | | | | | | | | | | | | | | | | |
| Net change in net interest income | | | (1,554) | | | | 1,434 | | | | (2,988) | | | | 1,862 | | | | 3,548 | | | | (1,686) | |
| |
| 1 | Changes due to combination of volume and rate are allocated proportionally. |
| | | | |
| Deutsche Bank | | Supplemental Financial Information (Unaudited) | | S-5 |
| Annual Report 2012 on Form 20-F | | | | |
| | |
| | | | |
| | |
| | | | |
Investment Portfolio (Securities Available for Sale)
Fair values of the Group’s investment portfolio
| | | | | | | | | | | | |
in€ m. | | Dec 31, 2012 | | | Dec 31, 2011 | | | Dec 31, 2010 | |
Debt securities: | | | | | | | | | | | | |
German government | | | 9,942 | | | | 5,207 | | | | 4,053 | |
U.S. Treasury and U.S. government agencies | | | 169 | | | | 1,015 | | | | 1,632 | |
U.S. local (municipal) governments | | | 531 | | | | 605 | | | | 563 | |
Other foreign governments | | | 16,655 | | | | 10,919 | | | | 17,688 | |
Corporates | | | 14,527 | | | | 18,856 | | | | 19,901 | |
Other asset-backed securities | | | 1,113 | | | | 1,273 | | | | 1,780 | |
Mortgage-backed securities, including obligations of U.S. federal agencies | | | 727 | | | | 731 | | | | 155 | |
Other debt securities | | | 491 | | | | 775 | | | | 442 | |
| | | | | | | | | | | | |
Total debt securities | | | 44,155 | | | | 39,381 | | | | 46,214 | |
| | | | | | | | | | | | |
Equity securities: | | | | | | | | | | | | |
Equity shares | | | 1,083 | | | | 1,632 | | | | 3,296 | |
Investment certificates and mutual funds | | | 222 | | | | 236 | | | | 132 | |
| | | | | | | | | | | | |
Total equity securities | | | 1,305 | | | | 1,868 | | | | 3,428 | |
| | | | | | | | | | | | |
Total | | | 45,460 | | | | 41,249 | | | | 49,642 | |
| |
Fair value, amortized cost and gross unrealized holding gains and losses for the Group’s securities available for sale
| | | | | | | | | | | | | | | | |
| Dec 31, 2012 | | | | | Gross unrealized holding | | | | |
in€ m. | | Fair value | | | gains | | | losses | | | Amortized cost | |
Debt securities: | | | | | | | | | | | | | | | | |
German government | | | 9,942 | | | | 206 | | | | 82 | | | | 9,818 | |
U.S. Treasury and U.S. government agencies | | | 169 | | | | 0 | | | | – | | | | 169 | |
U.S. local (municipal) governments | | | 531 | | | | 34 | | | | – | | | | 496 | |
Other foreign governments | | | 16,655 | | | | 327 | | | | 200 | | | | 16,528 | |
Corporates | | | 14,527 | | | | 501 | | | | 152 | | | | 14,178 | |
Other asset-backed securities | | | 1,113 | | | | 55 | | | | 68 | | | | 1,127 | |
Mortgage-backed securities, including obligations of U.S. federal agencies | | | 727 | | | | 8 | | | | 1 | | | | 720 | |
Other debt securities | | | 491 | | | | 7 | | | | 0 | | | | 484 | |
| | | | | | | | | | | | | | | | |
Total debt securities | | | 44,155 | | | | 1,138 | | | | 503 | | | | 43,520 | |
| | | | | | | | | | | | | | | | |
Equity securities: | | | | | | | | | | | | | | | | |
Equity shares | | | 1,083 | | | | 290 | | | | 10 | | | | 803 | |
Investment certificates and mutual funds | | | 222 | | | | 5 | | | | 1 | | | | 218 | |
| | | | | | | | | | | | | | | | |
Total equity securities | | | 1,305 | | | | 295 | | | | 11 | | | | 1,021 | |
| | | | | | | | | | | | | | | | |
Total securities available for sale | | | 45,460 | | | | 1,433 | | | | 514 | | | | 44,541 | |
| |
| | | | |
| Deutsche Bank | | Supplemental Financial Information (Unaudited) | | S-6 |
| Annual Report 2012 on Form 20-F | | | | |
| | |
| | | | |
| | |
| | | | |
The following table presents the fair value, remaining maturities, approximate weighted-average yields (based on amortized cost) and total amortized cost by maturity distribution of the debt security components of the Group’s investment portfolio as of December 31, 2012:
| | | | | | | | | | | | | | | | | | | | | | | | | | | | | | | | | | | | | | | | |
| | | Up to one year | | | More than one year and up
to five years | | | More than five years and
up to ten years | | | More than ten years | | | Total | |
in€ m. | | Amount | | | Yield | | | Amount | | | Yield | | | Amount | | | Yield | | | Amount | | | Yield | | | Amount | | | Yield | |
| German government | | | 1,008 | | | | 1.28 % | | | | 4,335 | | | | 1.81 % | | | | 1,556 | | | | 2.35 % | | | | 3,043 | | | | 3.74 % | | | | 9,942 | | | | 2.45 % | |
| | | | | | | | | | | | | | | | | | | | | | | | | | | | | | | | | | | | | | | | |
| U.S. Treasury and U.S. government agencies | | | 169 | | | | 2.36 % | | | | – | | | | 0.12 % | | | | – | | | | – | | | | – | | | | – | | | | 169 | | | | 2.35 % | |
| | | | | | | | | | | | | | | | | | | | | | | | | | | | | | | | | | | | | | | | |
| U.S. local (municipal) governments | | | 1 | | | | 2.98 % | | | | – | | | | – | | | | 14 | | | | 0.01 % | | | | 516 | | | | 0.18 % | | | | 531 | | | | 0.18 % | |
| | | | | | | | | | | | | | | | | | | | | | | | | | | | | | | | | | | | | | | | |
| Other foreign governments | | | 2,475 | | | | 1.24 % | | | | 8,050 | | | | 2.37 % | | | | 2,968 | | | | 2.64 % | | | | 3,162 | | | | 2.22 % | | | | 16,655 | | | | 1.33 % | |
| | | | | | | | | | | | | | | | | | | | | | | | | | | | | | | | | | | | | | | | |
| Corporates | | | 2,379 | | | | 3.50 % | | | | 8,032 | | | | 4.77 % | | | | 3,098 | | | | 4.79 % | | | | 1,018 | | | | 5.16 % | | | | 14,527 | | | | 4.59 % | |
| | | | | | | | | | | | | | | | | | | | | | | | | | | | | | | | | | | | | | | | |
| Other asset-backed securities | | | 1 | | | | 1.57 % | | | | 575 | | | | 2.24 % | | | | 49 | | | | 5.70 % | | | | 488 | | | | 5.34 % | | | | 1,113 | | | | 3.70 % | |
| | | | | | | | | | | | | | | | | | | | | | | | | | | | | | | | | | | | | | | | |
| Mortgage-backed securities, including obligations of U.S. federal agencies | | | 62 | | | | 1.69 % | | | | 605 | | | | 2.25 % | | | | 56 | | | | 3.69 % | | | | 4 | | | | 1.75 % | | | | 727 | | | | 2.32 % | |
| | | | | | | | | | | | | | | | | | | | | | | | | | | | | | | | | | | | | | | | |
| Other debt securities | | | 220 | | | | 2.16 % | | | | 105 | | | | 1.83 % | | | | 26 | | | | 2.00 % | | | | 140 | | | | 3.52 % | | | | 491 | | | | 2.47 % | |
| | | | | | | | | | | | | | | | | | | | | | | | | | | | | | | | | | | | | | | | |
| Total fair value | | | 6,315 | | | | 2.19 % | | | | 21,702 | | | | 3.27 % | | | | 7,767 | | | | 4.11 % | | | | 8,371 | | | | 3.19 % | | | | 44,155 | | | | 3.25 % | |
| | | | | | | | | | | | | | | | | | | | | | | | | | | | | | | | | | | | | | | | |
| Total amortized cost | | | 6,295 | | | | | | | | 21,347 | | | | | | | | 7,519 | | | | | | | | 8,359 | | | | | | | | 43,520 | | | | | |
| |
Loans Outstanding
Analysis of the Group’s loan portfolio by industry sector and by the borrower’s country of domicile (in- or outside Germany)
| | | | | | | | | | | | | | | | | | | | |
in€ m. | | Dec 31, 2012 | | | Dec 31, 2011 | | | Dec 31, 2010 | | | Dec 31, 2009 | | | Dec 31, 2008 | |
German: | | | | | | | | | | | | | | | | | | | | |
Banks and insurance | | | 7,949 | | | | 10,177 | | | | 13,858 | | | | 9,527 | | | | 12,397 | |
Manufacturing | | | 8,463 | | | | 9,154 | | | | 8,266 | | | | 7,486 | | | | 7,268 | |
Wholesale and retail trade | | | 4,212 | | | | 3,948 | | | | 3,656 | | | | 2,901 | | | | 3,444 | |
Households | | | 131,047 | | | | 126,462 | | | | 121,641 | | | | 50,936 | | | | 48,514 | |
Commercial real estate activities | | | 20,681 | | | | 21,093 | | | | 20,396 | | | | 13,792 | | | | 13,869 | |
Public sector | | | 9,729 | | | | 10,747 | | | | 18,182 | | | | 5,922 | | | | 5,437 | |
Lease financing | | | 382 | | | | 820 | | | | 799 | | | | 882 | | | | 1,030 | |
Other | | | 16,641 | | | | 17,746 | | | | 20,732 | | | | 13,851 | | | | 13,357 | |
| | | | | | | | | | | | | | | | | | | | |
Total German | | | 199,104 | | | | 200,147 | | | | 207,530 | | | | 105,297 | | | | 105,316 | |
| | | | | | | | | | | | | | | | | | | | |
Non-German: | | | | | | | | | | | | | | | | | | | | |
Banks and insurance | | | 19,900 | | | | 25,131 | | | | 24,940 | | | | 12,475 | | | | 14,601 | |
Manufacturing | | | 14,740 | | | | 13,600 | | | | 12,482 | | | | 9,828 | | | | 11,775 | |
Wholesale and retail trade | | | 12,814 | | | | 11,097 | | | | 9,981 | | | | 8,037 | | | | 8,317 | |
Households | | | 49,927 | | | | 47,726 | | | | 45,711 | | | | 34,739 | | | | 34,862 | |
Commercial real estate activities | | | 24,544 | | | | 25,050 | | | | 23,723 | | | | 15,167 | | | | 13,214 | |
Public sector | | | 5,649 | | | | 5,665 | | | | 5,931 | | | | 3,650 | | | | 4,535 | |
Lease financing | | | 639 | | | | 859 | | | | 1,521 | | | | 1,196 | | | | 1,670 | |
Other | | | 74,795 | | | | 87,782 | | | | 80,073 | | | | 72,309 | | | | 78,077 | |
| | | | | | | | | | | | | | | | | | | | |
Total Non-German | | | 203,008 | | | | 216,910 | | | | 204,362 | | | | 157,401 | | | | 167,051 | |
| | | | | | | | | | | | | | | | | | | | |
Gross loans | | | 402,112 | | | | 417,057 | | | | 411,892 | | | | 262,698 | | | | 272,367 | |
| | | | | | | | | | | | | | | | | | | | |
(Deferred expense)/unearned income | | | 137 | | | | 381 | | | | 867 | | | | 1,250 | | | | 1,148 | |
| | | | | | | | | | | | | | | | | | | | |
Loan less (deferred expense)/unearned income | | | 401,975 | | | | 416,676 | | | | 411,025 | | | | 261,448 | | | | 271,219 | |
| | | | | | | | | | | | | | | | | | | | |
Included in the category Other is Fund Management activities exposure of€ 16.8 billion,€ 25.0 billion,€ 28.0 billion,€ 26.5 billion and€ 31.2 billion for December 31, 2012, 2011, 2010, 2009 and 2008, respectively.
| | | | |
| Deutsche Bank | | Supplemental Financial Information (Unaudited) | | S-7 |
| Annual Report 2012 on Form 20-F | | | | |
| | |
| | | | |
| | |
| | | | |
Loan Maturities and Sensitivity to Changes in Interest Rates
Analysis of maturities of the Group’s loan portfolio (excluding lease financing)
| | | | | | | | | | | | | | | | |
Dec 31, 2012 in€ m. | | Within 1 year | | | After one but
within five years | | | After 5 years | | | Total | |
German: | | | | | | | | | | | | | | | | |
Banks and insurance | | | 1,182 | | | | 5,291 | | | | 1,476 | | | | 7,949 | |
Manufacturing | | | 4,360 | | | | 2,798 | | | | 1,305 | | | | 8,463 | |
Wholesale and retail trade | | | 2,561 | | | | 872 | | | | 779 | | | | 4,212 | |
Households (excluding mortgages) | | | 4,189 | | | | 5,698 | | | | 8,907 | | | | 18,794 | |
Households – mortgages | | | 6,388 | | | | 18,545 | | | | 87,320 | | | | 112,253 | |
Commercial real estate activities | | | 4,259 | | | | 6,509 | | | | 9,913 | | | | 20,681 | |
Public sector | | | 4,128 | | | | 3,027 | | | | 2,574 | | | | 9,729 | |
Other | | | 7,005 | | | | 6,246 | | | | 3,390 | | | | 16,641 | |
| | | | | | | | | | | | | | | | |
Total German | | | 34,072 | | | | 48,986 | | | | 115,664 | | | | 198,722 | |
| | | | | | | | | | | | | | | | |
Non-German: | | | | | | | | | | | | | | | | |
Banks and insurance | | | 13,553 | | | | 4,028 | | | | 2,319 | | | | 19,900 | |
Manufacturing | | | 9,555 | | | | 3,229 | | | | 1,956 | | | | 14,740 | |
Wholesale and retail trade | | | 9,348 | | | | 1,885 | | | | 1,581 | | | | 12,814 | |
Households (excluding mortgages) | | | 7,626 | | | | 8,374 | | | | 4,579 | | | | 20,579 | |
Households – mortgages | | | 6,086 | | | | 2,533 | | | | 20,729 | | | | 29,348 | |
Commercial real estate activities | | | 9,120 | | | | 11,038 | | | | 4,386 | | | | 24,544 | |
Public sector | | | 1,263 | | | | 388 | | | | 3,998 | | | | 5,649 | |
Other | | | 35,006 | | | | 15,954 | | | | 23,835 | | | | 74,795 | |
| | | | | | | | | | | | | | | | |
Total Non-German | | | 91,557 | | | | 47,429 | | | | 63,383 | | | | 202,369 | |
| | | | | | | | | | | | | | | | |
Gross loans | | | 125,629 | | | | 96,415 | | | | 179,047 | | | | 401,091 | |
| | | | | | | | | | | | | | | | |
(Deferred expense)/unearned income | | | 371 | | | | (80) | | | | (154) | | | | 137 | |
| | | | | | | | | | | | | | | | |
Loans less (deferred expense)/unearned income | | | 125,258 | | | | 96,495 | | | | 179,201 | | | | 400,954 | |
| |
Volumes of loans in loan portfolio (excluding lease financing) with residual maturities of more than one year from that date
| | | | | | | | | | | | |
Dec 31, 2012 in€ m. | | After one but
within five years | | | After 5 years | | | Total | |
Fixed rate loans | | | 66,774 | | | | 139,383 | | | | 206,157 | |
Floating or adjustable rate loans | | | 29,721 | | | | 39,818 | | | | 69,539 | |
| | | | | | | | | | | | |
Total | | | 96,495 | | | | 179,201 | | | | 275,696 | |
| |
Risk Elements
The following section provides information about certain risk elements included in the loan portfolio intended to address the requirements of SEC Industry Guide 3 while at the same time reflect the classifications most relevant to how Deutsche Bank Group evaluates the credit quality of its loan portfolio. All potential problem loans, which are defined as loans where known information about possible credit problems of borrowers causes the Group’s management to have serious doubts as to the ability of such borrowers to comply with the present loan repayment terms, are included in this disclosure of risk elements.
Loans 90 days or more Past Due and still accruing
Exposure of loans carried at amortized cost which were 90 days or more past due and still accruing for the last five years
| | | | | | | | | | | | | | | | | | | | |
in€ m. | | Dec 31, 2012 | | | Dec 31, 2011 | | | Dec 31, 2010 | | | Dec 31, 2009 | | | Dec 31, 2008 | |
German | | | 336 | | | | 403 | | | | 288 | | | | 310 | | | | 183 | |
| | | | | | | | | | | | | | | | | | | | |
Non-German | | | 118 | | | | 147 | | | | 14 | | | | 11 | | | | 18 | |
| | | | | | | | | | | | | | | | | | | | |
Total loans 90 days or more past due and still accruing | | | 454 | | | | 550 | | | | 302 | | | | 321 | | | | 201 | |
| |
| | | | |
| Deutsche Bank | | Supplemental Financial Information (Unaudited) | | S-8 |
| Annual Report 2012 on Form 20-F | | | | |
| |
| | |
| | |
| | | | |
Impaired Loans
Breakdown of the Group’s IFRS impaired loans by region based on the borrower’s country of domicile
| | | | | | | | | | | | | | | | | | | | |
in€ m. | | Dec 31, 2012 | | | Dec 31, 20111 | | | Dec 31, 20101 | | | Dec 31, 2009 | | | Dec 31, 2008 | |
Germany | | | 3,615 | | | | 3,721 | | | | 2,051 | | | | 1,665 | | | | 1,573 | |
| | | | | | | | | | | | | | | | | | | | |
Western Europe (excluding Germany) | | | 5,476 | | | | 4,665 | | | | 2,597 | | | | 3,702 | | | | 1,204 | |
| | | | | | | | | | | | | | | | | | | | |
Eastern Europe | | | 344 | | | | 241 | | | | 267 | | | | 151 | | | | 54 | |
| | | | | | | | | | | | | | | | | | | | |
North America | | | 626 | | | | 1,133 | | | | 1,150 | | | | 1,395 | | | | 544 | |
| | | | | | | | | | | | | | | | | | | | |
Central and South America | | | 41 | | | | 40 | | | | 43 | | | | 85 | | | | 234 | |
| | | | | | | | | | | | | | | | | | | | |
Asia/Pacific | | | 233 | | | | 270 | | | | 182 | | | | 157 | | | | 72 | |
| | | | | | | | | | | | | | | | | | | | |
Africa | | | – | | | | 0 | | | | 23 | | | | 27 | | | | – | |
| | | | | | | | | | | | | | | | | | | | |
Other | | | – | | | | 0 | | | | – | | | | 19 | | | | 1 | |
| | | | | | | | | | | | | | | | | | | | |
Total impaired loans | | | 10,335 | | | | 10,070 | | | | 6,313 | | | | 7,201 | | | | 3,682 | |
| |
| 1 | Numbers for 2011 and 2010 adjusted. |
Breakdown of the Group’s IFRS impaired loans by industry sector of the borrower
| | | | | | | | | | | | | | | | | | | | |
in€ m. | | Dec 31, 2012 | | | Dec 31, 20111 | | | Dec 31, 20101 | | | Dec 31, 2009 | | | Dec 31, 2008 | |
Banks and insurance | | | 53 | | | | 118 | | | | 81 | | | | 101 | | | | 156 | |
| | | | | | | | | | | | | | | | | | | | |
Fund management activities | | | 128 | | | | 917 | | | | 833 | | | | 848 | | | | 645 | |
| | | | | | | | | | | | | | | | | | | | |
Manufacturing | | | 926 | | | | 831 | | | | 610 | | | | 698 | | | | 427 | |
| | | | | | | | | | | | | | | | | | | | |
Wholesale and retail trade | | | 554 | | | | 468 | | | | 324 | | | | 346 | | | | 200 | |
| | | | | | | | | | | | | | | | | | | | |
Households | | | 3,707 | | | | 3,402 | | | | 2,143 | | | | 1,659 | | | | 1,209 | |
| | | | | | | | | | | | | | | | | | | | |
Commercial real estate activities | | | 3,358 | | | | 2,945 | | | | 975 | | | | 960 | | | | 172 | |
| | | | | | | | | | | | | | | | | | | | |
Public sector | | | – | | | | 0 | | | | – | | | | 45 | | | | 118 | |
| | | | | | | | | | | | | | | | | | | | |
Other | | | 1,609 | | | | 1,389 | | | | 1,347 | | | | 2,544 | | | | 755 | |
| | | | | | | | | | | | | | | | | | | | |
Total impaired loans | | | 10,335 | | | | 10,070 | | | | 6,313 | | | | 7,201 | | | | 3,682 | |
| |
| 1 | Numbers for 2011 and 2010 adjusted. |
Interest Revenue of Impaired Loans
The following table shows the approximate effect on interest revenue of IFRS impaired loans. It shows the gross interest income that would have been recorded during the reporting period, if those loans had been current in accordance with their original terms and had been outstanding throughout the reporting period or since their origination, if Deutsche Bank Group only helds them for part of the reporting period. It also shows the amount of interest income on those loans that was included in net income for the reporting period.
| | | | |
in€ m. | | 2012 | |
German loans: | | | | |
Gross amount of interest that would have been recorded at original rate | | | 144 | |
Less interest, net of reversals, recognized in interest revenue | | | 67 | |
| | | | |
Reduction of interest revenue | | | 77 | |
| | | | |
Non-German loans: | | | | |
Gross amount of interest that would have been recorded at original rate | | | 182 | |
Less interest, net of reversals, recognized in interest revenue | | | 89 | |
| | | | |
Reduction of interest revenue | | | 94 | |
| | | | |
Total reduction of interest revenue | | | 170 | |
| |
| | | | |
| Deutsche Bank | | Supplemental Financial Information (Unaudited) | | S-9 |
| Annual Report 2012 on Form 20-F | | | | |
| |
| | |
| | |
| | | | |
Renegotiated Loans
Breakdown of the Group’s renegotiated loans representing our troubled debt restructurings
| | | | | | | | | | | | | | | | | | | | |
in€ m. | | Dec 31, 2012 | | | Dec 31, 2011 | | | Dec 31, 2010 | | | Dec 31, 2009 | | | Dec 31, 2008 | |
| Renegotiated loans considered nonimpaired | | | | | | | | | | | | | | | | | | | | |
German | | | 210 | | | | 114 | | | | 65 | | | | 69 | | | | 71 | |
Non-German | | | 678 | | | | 950 | | | | 753 | | | | 119 | | | | 9 | |
| | | | | | | | | | | | | | | | | | | | |
| Total renegotiated loans considered nonimpaired | | | 888 | | | | 1,064 | | | | 818 | | | | 188 | | | | 80 | |
| | | | | | | | | | | | | | | | | | | | |
| Renegotiated loans considered impaired | | | | | | | | | | | | | | | | | | | | |
German | | | 309 | | | | 252 | | | | 96 | | | | 53 | | | | 51 | |
Non-German | | | 1,317 | | | | 1,102 | | | | 301 | | | | 228 | | | | 13 | |
| | | | | | | | | | | | | | | | | | | | |
| Total renegotiated loans considered impaired | | | 1,626 | | | | 1,354 | | | | 397 | | | | 281 | | | | 64 | |
| | | | | | | | | | | | | | | | | | | | |
Renegotiated loans | | | | | | | | | | | | | | | | | | | | |
German | | | 519 | | | | 366 | | | | 160 | | | | 121 | | | | 122 | |
Non-German | | | 1,995 | | | | 2,052 | | | | 1,055 | | | | 348 | | | | 22 | |
| | | | | | | | | | | | | | | | | | | | |
Total renegotiated loans | | | 2,514 | | | | 2,418 | | | | 1,215 | | | | 469 | | | | 144 | |
| |
Renegotiated loan positions have increased generally in recent years due to the deterioration of the global macroeconomic environment. In 2012, the level of the Group’s renegotiated loans increased slightly by€ 96 million or 4 % to€ 2.5 billion compared to prior year-end, as increases in renegotiated loans considered impaired were only partially compensated by an overall decrease in renegotiated loans considered nonimpaired. In 2011, increases included several large transactions in the Group’s commercial real estate activities through the Group’s entities in the UK and the Americas as well as in subsidiaries the Group acquired in 2010 in Germany. Renegotiated loans also increased to a lesser extent in Spain due to the deteriorating home finance market.
It should be noted that these renegotiations are not part of a special modification or restructuring program such as the Fannie Mae “Home Affordable Modification Program”. Rather, new terms (for example modification of interest rates, principal amounts, interest due, maturities, etc.) were arranged depending on the requirements of the individual renegotiation.
| | | | |
| Deutsche Bank | | Supplemental Financial Information (Unaudited) | | S-10 |
| Annual Report 2012 on Form 20-F | | | | |
| |
| | |
| | |
| | | | |
Foreign Outstandings
The following tables list only those countries for which the cross-border outstandings exceeded 0.75 % of the Group’s total assets as of December 31, 2012, 2011 and 2010. As of December 31, 2012, there were no outstandings that exceeded 0.75 % of total assets in any country currently facing debt restructuring or liquidity problems that the Group expects would materially impact the country’s ability to service its obligations.
| | | | | | | | | | | | | | | | | | | | | | | | | | | | |
Dec 31, 2012 in€ m. | | Banks and
other financial
institutions | | | Governments
and Official
institutions | | | Other1 | | | Commit-
ments | | | Net local
country claim | | | Total | | | Percent | |
United States | | | 8,620 | | | | 40,840 | | | | 95,840 | | | | 10,283 | | | | 323,473 | | | | 478,696 | | | | 23.79 % | |
| | | | | | | | | | | | | | | | | | | | | | | | | | | | |
Great Britain | | | 18,398 | | | | 7,615 | | | | 60,911 | | | | 2,966 | | | | 27,012 | | | | 116,902 | | | | 5.81 % | |
| | | | | | | | | | | | | | | | | | | | | | | | | | | | |
Luxembourg | | | 7,098 | | | | 2,549 | | | | 41,569 | | | | 2,470 | | | | 487 | | | | 54,173 | | | | 2.69 % | |
| | | | | | | | | | | | | | | | | | | | | | | | | | | | |
France | | | 6,387 | | | | 15,705 | | | | 18,500 | | | | 6,844 | | | | – | | | | 47,436 | | | | 2.36 % | |
| | | | | | | | | | | | | | | | | | | | | | | | | | | | |
Netherlands | | | 3,190 | | | | 7,899 | | | | 19,076 | | | | 4,222 | | | | 195 | | | | 34,582 | | | | 1.72 % | |
| | | | | | | | | | | | | | | | | | | | | | | | | | | | |
Japan | | | 2,485 | | | | 2,908 | | | | 10,625 | | | | 271 | | | | 13,269 | | | | 29,558 | | | | 1.47 % | |
| | | | | | | | | | | | | | | | | | | | | | | | | | | | |
Italy | | | 5,640 | | | | 11,974 | | | | 6,774 | | | | 1,196 | | | | 1,807 | | | | 27,391 | | | | 1.36 % | |
| | | | | | | | | | | | | | | | | | | | | | | | | | | | |
Spain | | | 7,084 | | | | 4,115 | | | | 6,537 | | | | 681 | | | | 6,580 | | | | 24,997 | | | | 1.24 % | |
| | | | | | | | | | | | | | | | | | | | | | | | | | | | |
Switzerland | | | 2,625 | | | | 812 | | | | 10,591 | | | | 3,772 | | | | 1,323 | | | | 19,123 | | | | 0.95 % | |
| | | | | | | | | | | | | | | | | | | | | | | | | | | | |
Cayman Islands | | | 325 | | | | 124 | | | | 12,223 | | | | 1,846 | | | | 2,659 | | | | 17,177 | | | | 0.85 % | |
| |
| 1 | Other includes commercial and industrial, insurance and other loans. |
| | | | | | | | | | | | | | | | | | | | | | | | | | | | |
Dec 31, 2011 in€ m. | | Banks and
other financial
institutions | | | Governments
and Official
institutions | | | Other1 | | | Commit-
ments | | | Net local
country claim | | | Total | | | Percent | |
United States | | | 8,101 | | | | 29,006 | | | | 83,270 | | | | 10,922 | | | | 321,974 | | | | 453,273 | | | | 20.95 % | |
| | | | | | | | | | | | | | | | | | | | | | | | | | | | |
Great Britain | | | 19,311 | | | | 8,544 | | | | 58,385 | | | | 3,659 | | | | 17,160 | | | | 107,059 | | | | 4.95 % | |
| | | | | | | | | | | | | | | | | | | | | | | | | | | | |
Luxembourg | | | 6,740 | | | | 2,608 | | | | 37,459 | | | | 2,035 | | | | – | | | | 48,841 | | | | 2.26 % | |
| | | | | | | | | | | | | | | | | | | | | | | | | | | | |
France | | | 7,255 | | | | 13,378 | | | | 14,583 | | | | 7,257 | | | | 131 | | | | 42,603 | | | | 1.97 % | |
| | | | | | | | | | | | | | | | | | | | | | | | | | | | |
Italy | | | 5,886 | | | | 10,580 | | | | 7,558 | | | | 412 | | | | 8,867 | | | | 33,303 | | | | 1.54 % | |
| | | | | | | | | | | | | | | | | | | | | | | | | | | | |
Netherlands | | | 2,915 | | | | 6,050 | | | | 19,349 | | | | 4,293 | | | | 111 | | | | 32,717 | | | | 1.51 % | |
| | | | | | | | | | | | | | | | | | | | | | | | | | | | |
Japan | | | 1,968 | | | | 4,663 | | | | 9,003 | | | | 329 | | | | 16,586 | | | | 32,549 | | | | 1.50 % | |
| | | | | | | | | | | | | | | | | | | | | | | | | | | | |
Spain | | | 7,600 | | | | 2,769 | | | | 6,339 | | | | 1,122 | | | | 9,964 | | | | 27,794 | | | | 1.28 % | |
| | | | | | | | | | | | | | | | | | | | | | | | | | | | |
Cayman Islands | | | 511 | | | | 170 | | | | 13,856 | | | | 914 | | | | 2,687 | | | | 18,138 | | | | 0.84 % | |
| | | | | | | | | | | | | | | | | | | | | | | | | | | | |
Switzerland | | | 2,413 | | | | 1,021 | | | | 10,598 | | | | 3,091 | | | | 689 | | | | 17,812 | | | | 0.82 % | |
| | | | | | | | | | | | | | | | | | | | | | | | | | | | |
Ireland | | | 1,574 | | | | 468 | | | | 13,082 | | | �� | 844 | | | | 663 | | | | 16,631 | | | | 0.77 % | |
| |
| 1 | Other includes commercial and industrial, insurance and other loans. |
| | | | | | | | | | | | | | | | | | | | | | | | | | | | |
Dec 31, 2010 in€ m. | | Banks and
other financial
institutions | | | Governments
and Official
institutions | | | Other1 | | | Commit-
ments | | | Net local
country claim | | | Total | | | Percent | |
United States | | | 15,843 | | | | 22,252 | | | | 99,468 | | | | 8,882 | | | | 219,247 | | | | 365,692 | | | | 19.19 % | |
| | | | | | | | | | | | | | | | | | | | | | | | | | | | |
Great Britain | | | 24,894 | | | | 6,257 | | | | 41,990 | | | | 2,049 | | | | 3,111 | | | | 78,301 | | | | 4.11 % | |
| | | | | | | | | | | | | | | | | | | | | | | | | | | | |
Luxembourg | | | 7,522 | | | | 1,656 | | | | 40,577 | | | | 2,131 | | | | – | | | | 51,886 | | | | 2.72 % | |
| | | | | | | | | | | | | | | | | | | | | | | | | | | | |
France | | | 11,170 | | | | 12,337 | | | | 16,694 | | | | 7,041 | | | | – | | | | 47,242 | | | | 2.48 % | |
| | | | | | | | | | | | | | | | | | | | | | | | | | | | |
Italy | | | 8,251 | | | | 14,577 | | | | 6,358 | | | | 903 | | | | 9,536 | | | | 39,625 | | | | 2.08 % | |
| | | | | | | | | | | | | | | | | | | | | | | | | | | | |
Japan | | | 1,678 | | | | 5,051 | | | | 12,884 | | | | 319 | | | | 15,816 | | | | 35,748 | | | | 1.88 % | |
| | | | | | | | | | | | | | | | | | | | | | | | | | | | |
Netherlands | | | 6,835 | | | | 5,142 | | | | 16,966 | | | | 3,407 | | | | – | | | | 32,350 | | | | 1.70 % | |
| | | | | | | | | | | | | | | | | | | | | | | | | | | | |
Spain | | | 10,149 | | | | 3,706 | | | | 6,666 | | | | 1,423 | | | | 9,607 | | | | 31,551 | | | | 1.66 % | |
| | | | | | | | | | | | | | | | | | | | | | | | | | | | |
Switzerland | | | 3,546 | | | | 722 | | | | 11,893 | | | | 3,207 | | | | 678 | | | | 20,046 | | | | 1.05 % | |
| | | | | | | | | | | | | | | | | | | | | | | | | | | | |
Cayman Islands | | | 420 | | | | – | | | | 13,919 | | | | 792 | | | | 4,676 | | | | 19,807 | | | | 1.04 % | |
| | | | | | | | | | | | | | | | | | | | | | | | | | | | |
Ireland | | | 2,727 | | | | 950 | | | | 12,042 | | | | 612 | | | | 1 | | | | 16,332 | | | | 0.86 % | |
| |
| 1 | Other includes commercial and industrial, insurance and other loans. |
| | | | |
| Deutsche Bank | | Supplemental Financial Information (Unaudited) | | S-11 |
| Annual Report 2012 on Form 20-F | | | | |
| | |
| | | | |
| | |
| | | | |
Allowance for Loan Losses
Breakdown of the movements in the Group’s allowance for loan losses
| | | | | | | | | | | | | | | | | | | | |
in€ m. (unless stated otherwise) | | 2012 | | | 2011 | | | 2010 | | | 2009 | | | 2008 | |
Balance, beginning of year | | | 4,162 | | | | 3,296 | | | | 3,343 | | | | 1,938 | | | | 1,705 | |
| | | | | | | | | | | | | | | | | | | | |
Charge-offs: | | | | | | | | | | | | | | | | | | | | |
| | | | | | | | | | | | | | | | | | | | |
German: | | | | | | | | | | | | | | | | | | | | |
Banks and insurance | | | (1) | | | | (2) | | | | (5) | | | | (2) | | | | (2) | |
Manufacturing | | | (42) | | | | (93) | | | | (43) | | | | (43) | | | | (53) | |
Wholesale and retail trade | | | (42) | | | | (26) | | | | (32) | | | | (23) | | | | (41) | |
Households (excluding mortgages) | | | (265) | | | | (273) | | | | (338) | | | | (340) | | | | (330) | |
Households – mortgages | | | (60) | | | | (26) | | | | (26) | | | | (23) | | | | (32) | |
Commercial real estate activities | | | (11) | | | | (13) | | | | (22) | | | | (6) | | | | (19) | |
Public sector | | | (0) | | | | (0) | | | | – | | | | – | | | | – | |
Other | | | (71) | | | | (112) | | | | (49) | | | | (72) | | | | (127) | |
| | | | | | | | | | | | | | | | | | | | |
German total | | | (491) | | | | (546) | | | | (515) | | | | (509) | | | | (604) | |
| | | | | | | | | | | | | | | | | | | | |
Non-German total | | | (789) | | | | (519) | | | | (928) | | | | (713) | | | | (386) | |
| | | | | | | | | | | | | | | | | | | | |
Total charge-offs | | | (1,281) | | | | (1,065) | | | | (1,443) | | | | (1,222) | | | | (990) | |
| | | | | | | | | | | | | | | | | | | | |
Recoveries: | | | | | | | | | | | | | | | | | | | | |
| | | | | | | | | | | | | | | | | | | | |
German: | | | | | | | | | | | | | | | | | | | | |
Banks and insurance | | | 0 | | | | 1 | | | | 1 | | | | 1 | | | | 1 | |
Manufacturing | | | 10 | | | | 18 | | | | 14 | | | | 11 | | | | 14 | |
Wholesale and retail trade | | | 6 | | | | 8 | | | | 6 | | | | 7 | | | | 8 | |
Households (excluding mortgages) | | | 106 | | | | 93 | | | | 63 | | | | 83 | | | | 81 | |
Households – mortgages | | | 15 | | | | 1 | | | | 4 | | | | 1 | | | | 3 | |
Commercial real estate activities | | | 2 | | | | 3 | | | | 4 | | | | 7 | | | | 9 | |
Public sector | | | 0 | | | | 0 | | | | – | | | | – | | | | – | |
Other | | | 19 | | | | 17 | | | | 20 | | | | 25 | | | | 41 | |
| | | | | | | | | | | | | | | | | | | | |
German total | | | 158 | | | | 142 | | | | 112 | | | | 135 | | | | 157 | |
| | | | | | | | | | | | | | | | | | | | |
Non-German total | | | 37 | | | | 26 | | | | 31 | | | | 31 | | | | 55 | |
| | | | | | | | | | | | | | | | | | | | |
Total recoveries | | | 195 | | | | 168 | | | | 143 | | | | 166 | | | | 212 | |
| | | | | | | | | | | | | | | | | | | | |
Net charge-offs | | | (1,086) | | | | (897) | | | | (1,300) | | | | (1,056) | | | | (778) | |
| | | | | | | | | | | | | | | | | | | | |
Provision for loan losses | | | 1,728 | | | | 1,832 | | | | 1,313 | | | | 2,597 | | | | 1,084 | |
| | | | | | | | | | | | | | | | | | | | |
| Other changes (e.g. exchange rate changes, changes in the group of consolidated companies) | | | (107) | | | | (69) | | | | (60) | | | | (137) | | | | (74) | |
| | | | | | | | | | | | | | | | | | | | |
Balance, end of year | | | 4,696 | | | | 4,162 | | | | 3,296 | | | | 3,343 | | | | 1,938 | |
| | | | | | | | | | | | | | | | | | | | |
Percentage of total net charge-offs to average loans for the year | | | 0.27 % | | | | 0.22 % | | | | 0.45 % | | | | 0.39 % | | | | 0.33 % | |
| |
The Group’s allowance for loan losses as of December 31, 2012 was€ 4.7 billion, 52 % of which is related to collectively assessed and 48 % to individually assessed loan losses. The increase in the Group’s allowance for loan losses of€ 534 million mainly relates to€ 1.7 billion of additional loan loss provisions partly offset by€ 1.1 billion of charge-offs.
The Group’s provision for loan losses decreased by€ 104 million or 6 % in 2012 compared to 2011. This decrease was driven by the Group’s collectively assessed loan portfolio, where the Group saw a reduction of€ 312 million or 34 % driven by lower levels of provisioning for non-impaired loans within the Group’s NCOU mainly as a result of de-risking measures along with lower provisioning in the Group’s homogenous Postbank portfolio. The latter decrease however excludes the effect of Postbank releases related to loan loss allowances recorded prior to consolidation. The impact of such releases is reported as interest income on a group level. The increase in provisions for the Group’s individually assessed loans of€ 208 million or 23 % is related to assets which had been reclassified in accordance with IAS 39 in North America and United Kingdom now held in the NCOU.
Net charge-offs increased by€ 189 million or 21 % in 2012. Net charge-offs for the Group’s individually assessed loans were up€ 249 million, mainly related to assets which had been reclassified in accordance with IAS 39.
| | | | |
| Deutsche Bank | | Supplemental Financial Information (Unaudited) | | S-12 |
| Annual Report 2012 on Form 20-F | | | | |
| | |
| | | | |
| | |
| | | | |
The Group’s allowance for loan losses as of December 31, 2011 was€ 4.2 billion, a 26 % increase from prior year end. The increase in the Group’s allowance was principally due to increased new provisions following the first full year consolidation of Postbank and lower net charge-offs compared to the prior year.
The Group’s provision for loan losses showed an increase of€ 520 million or 40 % in 2011, thereof€ 345 million or 61 % related to individually assessed loans, and€ 175 million or 23 % related to the Group’s collectively assessed loan portfolios. The rise in individually assessed provision for loan losses was driven by the first time consolidation of Postbank and furthermore reflected impairment charges taken on a number of exposures in the Americas and in Europe in an overall challenging global economic credit environment. Reduced provisioning levels for IAS 39 reclassified assets partly compensated these increases. Loan loss provisions for the Group’s collectively assessed loan portfolios, which increased by 23 % compared to 2010, were also affected by the first time consolidation of Postbank. Excluding Postbank, the loan loss provision for the Group’s collectively assessed exposure was reduced due to the Group’s retail business in Germany which contributed lower provisions, despite the challenging economic environment.
The Group’s net charge-offs decreased by€ 403 million or 31 % in 2011, almost fully related to the Group’s individually assessed loans, where the Group saw a reduction of€ 384 million fully driven by IAS 39 reclassified assets.
The Group’s allowance for loan losses as of December 31, 2010 was€ 3.3 billion, a 1 % decrease from prior year end. The decrease in the Group’s allowance was principally due to charge-offs, reductions resulting from currency translation and unwinding effects exceeding the Group’s provisions.
The Group’s net charge-offs amounted to€ 1.3 billion in 2010. Of the charge-offs for 2010,€ 896 million were related to the Group’s corporate credit exposure, of which€ 607 million were related to assets which had been reclassified in accordance with IAS 39 in the Group’s United Kingdom and Asia/Pacific portfolios, and€ 404 million was related to the Group’s consumer credit exposures, mainly driven by the Group’s German portfolios.
The Group’s provision for loan losses in 2010 was€ 1.3 billion, principally driven by€ 562 million for the Group’s corporate credit exposures, of which€ 278 million of new provisions were established relating to assets that had been reclassified in accordance with IAS 39, relating predominantly to exposures in Corporate Banking & Securities. The remaining increase reflected impairment charges taken on a number of exposures in the Americas and in Europe in an overall favorable global economic credit environment. Loan loss provisions in the Group’s collectively assessed exposure amounted to€ 751 million, reflecting a significant reduction of the Group’s net credit costs in Spain and India partially offset by increases in Poland, which is lower than the€ 808 million recorded in the prior year, which was predominantly driven by the challenging credit environment in Spain and Poland during 2009.
The Group’s individually assessed loan loss allowance was€ 1.6 billion as of December 31, 2010. The€ 386 million decrease in 2010 comprises net provisions of€ 562 million (including the aforementioned impact from IAS 39 reclassifications), net charge-offs of€ 896 million and a€ 53 million decrease from currency translation and unwinding effects.
The Group’s collectively assessed loan loss allowance totaled€ 1.7 billion as of December 31, 2010, representing an increase of€ 339 million against the level reported for the end of 2009 (€ 1.3 billion). Movements in this component comprised a€ 751 million provision, being partially offset by€ 404 million net charge-offs and a€ 6 million net decrease from currency translation and unwinding effects.
The Group’s allowance for loan losses as of December 31, 2009 was€ 3.3 billion, a 72 % increase from€ 1.9 billion reported for the end of 2008. The increase in the Group’s allowance was principally due to provisions substantially exceeding charge-offs.
| | | | |
| Deutsche Bank | | Supplemental Financial Information (Unaudited) | | S-13 |
| Annual Report 2012 on Form 20-F | | | | |
| | |
| | | | |
| | |
| | | | |
The Group’s gross charge-offs were€ 1.2 billion in 2009. Of the charge-offs for 2009,€ 637 million were related to the Group’s corporate credit exposure, of which€ 414 million was related to assets which had been reclassified in accordance with IAS 39 in the Group’s U.S. and U.K. portfolios, and€ 419 million was related to the consumer credit exposure, mainly driven by the Group’s German portfolios.
The Group’s provision for loan losses in 2009 was€ 2.6 billion, principally driven by€ 1.8 billion for the Group’s corporate credit exposures, of which€ 1.3 billion of new provisions were established relating to assets which had been reclassified in accordance with IAS 39, relating predominantly to exposures in Leveraged Finance. The remaining increase reflected impairment charges taken on a number of exposures in the Americas and in Europe on the back of the overall deteriorating credit environment. Loan loss provisions for PCAM amounted to€ 805 million, predominantly reflecting a more challenging credit environment in Spain and Poland. Provisions in 2009 were positively impacted by changes in certain parameter and model assumptions, which reduced provisions by€ 87 million in CIB and€ 146 million in PCAM.
The Group’s individually assessed loan loss allowance was€ 2.0 billion as of December 31, 2009. The€ 1.1 billion increase in 2009 comprised net provisions of€ 1.8 billion (including the aforementioned impact from IAS 39 reclassifications), net charge-offs of€ 637 million and a€ 100 million decrease from currency translation and unwinding effects.
The Group’s collectively assessed loan loss allowance totaled€ 1.3 billion as of December 31, 2009, representing an increase of€ 353 million against the level reported for the end of 2008 (€ 961 million). Movements in this component include a€ 808 million provision, including a positive impact from changes in certain parameter and model assumptions which reduced provision by€ 87 million, being offset by€ 419 million net charge-offs and a€ 36 million net decrease from currency translation and unwinding effects.
The Group’s allowance for loan losses as of December 31, 2008 was€ 1.9 billion, a 14 % increase from the€ 1.7 billion reported for the end of 2007. The increase in the Group’s allowance was principally due to provisions exceeding our charge-offs.
The Group’s gross charge-offs were€ 990 million in 2008. Of the charge-offs for 2008,€ 626 million were related to the Group’s consumer credit exposures, and€ 364 million to the Group’s corporate credit exposures, mainly driven by its German and U.S. portfolios.
The Group’s provision for loan losses in 2008 was€ 1.1 billion, principally driven by the consumer credit exposure as a result of the deteriorating credit conditions in Spain, higher delinquencies in Germany and Italy, as well as organic growth in Poland. For the Group’s corporate credit exposures,€ 257 million new provisions were established in the second half of 2008 relating to assets which had been reclassified in accordance with IAS 39. Additional loan loss provisions within this portfolio were required on mainly European loans, reflecting the deterioration in credit conditions.
The Group’s individually assessed loan loss allowance was€ 977 million as of December 31, 2008. The€ 47 million increase in 2008 is comprised of net provisions of€ 382 million (including the aforementioned impact from IAS 39 reclassifications), net charge-offs of€ 301 million and a€ 34 million decrease from currency translation and unwinding effects.
The Group’s collectively assessed loan loss allowance totaled€ 961 million as of December 31, 2008, representing an increase of€ 186 million against the level reported for the end of 2007 (€ 775 million). Movements in this component include a€ 702 million provision being offset by€ 477 million net charge-offs, and a€ 39 million net reduction due to exchange rate movements and unwinding effects. Given this increase, the Group’s collectively assessed loan loss allowance is almost at the same level as the individually assessed loan loss allowance.
| | | | |
| Deutsche Bank | | Supplemental Financial Information (Unaudited) | | S-14 |
| Annual Report 2012 on Form 20-F | | | | |
| | |
| | | | |
| | |
| | | | |
The following table presents an analysis of the changes in the non-German component of the allowance for loan losses. As of December 31, 2012, 63 % of the Group’s total allowance was attributable to non-German clients compared to 60 % as of December 31, 2011.
| | | | | | | | | | | | | | | | | | | | |
in€ m. | | 2012 | | | 2011 | | | 2010 | | | 2009 | | | 2008 | |
Balance, beginning of year | | | 2,509 | | | | 2,284 | | | | 2,391 | | | | 995 | | | | 615 | |
| | | | | | | | | | | | | | | | | | | | |
Provision for loan losses | | | 1,152 | | | | 751 | | | | 820 | | | | 2,182 | | | | 752 | |
| | | | | | | | | | | | | | | | | | | | |
Net charge-offs | | | (752) | | | | (493) | | | | (897) | | | | (682) | | | | (330) | |
Charge-offs | | | (789) | | | | (519) | | | | (928) | | | | (713) | | | | (385) | |
Recoveries | | | 37 | | | | 26 | | | | 31 | | | | 31 | | | | 55 | |
| | | | | | | | | | | | | | | | | | | | |
Other changes (e.g. exchange rate changes, changes in the group of consolidated companies) | | | 59 | | | | (33) | | | | (30) | | | | (104) | | | | (42) | |
| | | | | | | | | | | | | | | | | | | | |
Balance, end of year | | | 2,968 | | | | 2,509 | | | | 2,284 | | | | 2,391 | | | | 995 | |
| |
The following table presents the components of the Group’s allowance for loan losses by industry of the borrower, and the percentage of its total loan portfolio accounted for by those industry classifications, on the dates specified. The breakdown between German and non-German borrowers is based on the location of the borrowers.
| | | | | | | | | | | | | | | | | | | | | | | | | | | | | | | | | | | | | | | | |
in€ m. (unless stated otherwise) | | Dec 31, 2012 | | | Dec 31, 2011 | | | Dec 31, 2010 | | | Dec 31, 2009 | | | Dec 31, 2008 | |
German: | | | | | | | | | | | | | | | | | | | | | | | | | | | | | | | | | | | | | | | | |
| | | | | | | | | | | | | | | | | | | | | | | | | | | | | | | | | | | | | | | | |
Individually assessed loan loss allowance: | | | | | | | | | | | | | | | | | | | | | | | | | | | | | | | | | | | | | | | | |
Banks and insurance | | | 1 | | | | 2 % | | | | 13 | | | | 2 % | | | | 1 | | | | 3 % | | | | 2 | | | | 4 % | | | | 1 | | | | 5 % | |
Manufacturing | | | 277 | | | | 2 % | | | | 252 | | | | 2 % | | | | 236 | | | | 2 % | | | | 199 | | | | 3 % | | | | 165 | | | | 3 % | |
Households (excluding mortgages) | | | 94 | | | | 5 % | | | | 78 | | | | 4 % | | | | 42 | | | | 4 % | | | | 18 | | | | 5 % | | | | 21 | | | | 5 % | |
Households – mortgages | | | 14 | | | | 28 % | | | | 12 | | | | 26 % | | | | 4 | | | | 25 % | | | | 3 | | | | 15 % | | | | 5 | | | | 13 % | |
Public sector | | | – | | | | 2 % | | | | – | | | | 3 % | | | | – | | | | 5 % | | | | – | | | | 2 % | | | | – | | | | 2 % | |
Wholesale and retail trade | | | 111 | | | | 1 % | | | | 112 | | | | 1 % | | | | 95 | | | | 1 % | | | | 95 | | | | 1 % | | | | 81 | | | | 1 % | |
Commercial real estate activities | | | 157 | | | | 5 % | | | | 241 | | | | 5 % | | | | 46 | | | | 5 % | | | | 55 | | | | 5 % | | | | 60 | | | | 5 % | |
Other | | | 128 | | | | 4 % | | | | 124 | | | | 4 % | | | | 135 | | | | 5 % | | | | 126 | | | | 5 % | | | | 146 | | | | 5 % | |
| | | | | | | | | | | | | | | | | | | | | | | | | | | | | | | | | | | | | | | | |
| Individually assessed loan loss allowance German total | | | 782 | | | | | | | | 832 | | | | | | | | 559 | | | | | | | | 498 | | | | | | | | 479 | | | | | |
| | | | | | | | | | | | | | | | | | | | | | | | | | | | | | | | | | | | | | | | |
| Collectively assessed loan loss allowance | | | 946 | | | | | | | | 821 | | | | | | | | 453 | | | | | | | | 454 | | | | | | | | 464 | | | | | |
| | | | | | | | | | | | | | | | | | | | | | | | | | | | | | | | | | | | | | | | |
| German total | | | 1,728 | | | | 50 % | | | | 1,653 | | | | 48 % | | | | 1,012 | | | | 50 % | | | | 952 | | | | 40 % | | | | 943 | | | | 39 % | |
| | | | | | | | | | | | | | | | | | | | | | | | | | | | | | | | | | | | | | | | |
| Non-German: | | | | | | | | | | | | | | | | | | | | | | | | | | | | | | | | | | | | | | | | |
| | | | | | | | | | | | | | | | | | | | | | | | | | | | | | | | | | | | | | | | |
Individually assessed loan loss allowance | | | 1,484 | | | | | | | | 1,179 | | | | | | | | 1,084 | | | | | | | | 1,532 | | | | | | | | 499 | | | | | |
| | | | | | | | | | | | | | | | | | | | | | | | | | | | | | | | | | | | | | | | |
Collectively assessed loan loss allowance | | | 1,484 | | | | | | | | 1,327 | | | | | | | | 1,200 | | | | | | | | 859 | | | | | | | | 496 | | | | | |
| | | | | | | | | | | | | | | | | | | | | | | | | | | | | | | | | | | | | | | | |
Non-German total | | | 2,968 | | | | 50 % | | | | 2,507 | | | | 52 % | | | | 2,284 | | | | 50 % | | | | 2,391 | | | | 60 % | | | | 995 | | | | 61 % | |
| | | | | | | | | | | | | | | | | | | | | | | | | | | | | | | | | | | | | | | | |
Total allowance for loan losses | | | 4,696 | | | | 100 % | | | | 4,162 | | | | 100 % | | | | 3,296 | | | | 100 % | | | | 3,343 | | | | 100 % | | | | 1,938 | | | | 100 % | |
| | | | | | | | | | | | | | | | | | | | | | | | | | | | | | | | | | | | | | | | |
| Total individually assessed loan loss allowance | | | 2,266 | | | | | | | | 2,011 | | | | | | | | 1,643 | | | | | | | | 2,030 | | | | | | | | 977 | | | | | |
| | | | | | | | | | | | | | | | | | | | | | | | | | | | | | | | | | | | | | | | |
| Total collectively assessed loan loss allowance | | | 2,430 | | | | | | | | 2,150 | | | | | | | | 1,653 | | | | | | | | 1,313 | | | | | | | | 961 | | | | | |
| | | | | | | | | | | | | | | | | | | | | | | | | | | | | | | | | | | | | | | | |
Total allowance for loan losses | | | 4,696 | | | | | | | | 4,162 | | | | | | | | 3,296 | | | | | | | | 3,343 | | | | | | | | 1,938 | | | | | |
| |
Deposits
The amount of other time deposits in the amount of U.S.$ 100,000 or more in offices in Germany was€ 25.9 billion as of December 31, 2012, thereof with maturities within three months€ 10.8 billion, after three months but within six months€ 4.6 billion, after six months but within one year€ 2.7 billion and after one year€ 7.8 billion. There were no certificates of deposits in offices in Germany as of December 31, 2012.
The amount of certificates of deposits and other time deposits in the amount of U.S.$ 100,000 or more issued by non-German offices was€ 82.1 billion as of December 31, 2012.
Total deposits by foreign depositors in German offices were€ 40.2 billion,€ 49.0 billion and€ 33.2 billion as of December 31, 2012, 2011 and 2010, respectively.
| | | | |
| Deutsche Bank | | Supplemental Financial Information (Unaudited) | | S-15 |
| Annual Report 2012 on Form 20-F | | | | |
| | |
| | | | |
| | |
| | | | |
Return on Equity and Assets
| | | | | | | | | | | | |
| | | 2012 | | | 2011 | | | 2010 | |
Return on average shareholders’ equity (post-tax)1 | | | 0.43 % | | | | 8.17 % | | | | 5.54 % | |
| | | | | | | | | | | | |
Return on average total assets (post-tax)2 | | | 0.01 % | | | | 0.20 % | | | | 0.12 % | |
| | | | | | | | | | | | |
Equity to assets ratio3 | | | 2.46 % | | | | 2.47 % | | | | 2.21 % | |
| | | | | | | | | | | | |
Dividend payout ratio:4 | | | | | | | | | | | | |
Basic earnings per share | | | N/M | | | | 17 % | | | | 24 % | |
| | | | | | | | | | | | |
Diluted earnings per share | | | N/M | | | | 17 % | | | | 26 % | |
| | | | | | | | | | | | |
N/M – Not meaningful
| 1 | Net income (loss) attributable to Deutsche Bank shareholders as a percentage of average shareholders’ equity. |
| 2 | Net income (loss) attributable to Deutsche Bank shareholders as a percentage of average total assets. |
| 3 | Average shareholders’ equity as a percentage of average total assets for each year. |
| 4 | Dividends paid per share in respect of each year as a percentage of the Group’s basic and diluted earnings per share for that year. |
Short-Term Borrowings with an original maturity of one year or less
The difference between the period-end and average balances for central bank funds purchased and securities sold under repurchase agreements mainly arises from fluctuating activity with respect to fixed income securities positions within CB&S. Intra-quarter trading volume, which increases the monthly averages relative to quarter- and year-end, predominantly comprises financing of short-term positions in highly liquid US Treasuries and Agencies, which is a result of the Bank providing liquidity to the market via market-making activity and is largely driven by client demand. These US Treasury and Agency positions are very low risk and have negligible impact on the firm’s liquidity and capital position.
| | | | | | | | | | | | |
in€ m. (unless stated otherwise) | | Dec 31, 2012 | | | Dec 31, 2011 | | | Dec 31, 2010 | |
Central bank funds purchased and securities sold
under repurchase agreements: | | | | | | | | | | | | |
Balance, end of year | | | 36,144 | | | | 35,311 | | | | 27,922 | |
Average balance1 | | | 73,055 | | | | 54,442 | | | | 51,951 | |
Maximum balance at any month-end | | | 97,443 | | | | 70,007 | | | | 75,113 | |
Weighted-average interest rate during the year | | | 0.43 % | | | | 0.78 % | | | | 0.58 % | |
Weighted-average interest rate on year-end balance | | | 0.55 % | | | | 0.44 % | | | | 0.99 % | |
| | | | | | | | | | | | |
Securities loaned: | | | | | | | | | | | | |
Balance, end of year | | | 3,076 | | | | 8,089 | | | | 3,276 | |
Average balance1 | | | 6,419 | | | | 8,179 | | | | 8,776 | |
Maximum balance at any month-end | | | 12,120 | | | | 13,829 | | | | 13,965 | |
Weighted-average interest rate during the year | | | 6.34 % | | | | 4.20 % | | | | 3.17 % | |
Weighted-average interest rate on year-end balance | | | 0.64 % | | | | 1.17 % | | | | 1.57 % | |
| | | | | | | | | | | | |
Commercial paper: | | | | | | | | | | | | |
Balance, end of year | | | 23,616 | | | | 30,807 | | | | 31,322 | |
Average balance1 | | | 25,500 | | | | 28,905 | | | | 24,234 | |
Maximum balance at any month-end | | | 27,125 | | | | 32,500 | | | | 31,322 | |
Weighted-average interest rate during the year | | | 0.44 % | | | | 0.52 % | | | | 0.40 % | |
Weighted-average interest rate on year-end balance | | | 0.48 % | | | | 0.34 % | | | | 0.52 % | |
| | | | | | | | | | | | |
Other: | | | | | | | | | | | | |
Balance, end of year | | | 45,444 | | | | 34,549 | | | | 33,668 | |
Average balance1 | | | 41,720 | | | | 35,975 | | | | 31,253 | |
Maximum balance at any month-end | | | 47,159 | | | | 39,455 | | | | 38,130 | |
Weighted-average interest rate during the year | | | 0.55 % | | | | 0.91 % | | | | 0.89 % | |
Weighted-average interest rate on year-end balance | | | 0.47 % | | | | 0.37 % | | | | 0.31 % | |
| |
| 1 | Based upon month-end balances. |
| | | | |
| Deutsche Bank | | Supplemental Financial Information (Unaudited) | | S-16 |
| Annual Report 2012 on Form 20-F | | | | |
| | |
| | | | |
| | |
| | | | |
Non-GAAP Financial Measures
As discussed on page 4 of the Annual Report 2012 on Form 20-F, this document and other documents Deutsche Bank Group has published or may publish contain non-GAAP financial measures. Non-GAAP financial measures are measures of the Group’s historical or future performance, financial position or cash flows that contain adjustments that exclude or include amounts that are included or excluded, as the case may be, from the most directly comparable measure calculated and presented in accordance with IFRS in the Group’s financial statements.
Pre-Tax Return on Average Active Equity
The pre-tax return on average active equity non-GAAP financial measure is based on IBIT attributable to Deutsche Bank shareholders, as a percentage of the Group’s average active equity, both as defined below.
IBIT attributable to Deutsche Bank Shareholders: The IBIT attributable to Deutsche Bank shareholders non-GAAP financial measure is based on income (loss) before income taxes attributable to Deutsche Bank shareholders (i.e., excluding pre-tax noncontrolling interests) as follows:
| | | | | | | | | | | | | | | | | | | | | | | | | | | | |
| | | | | | | | | | | | 2012 increase (decrease)
from 2011 | | | 2011 increase (decrease)
from 2010 | |
in€ m. | | 2012 | | | 2011 | | | 2010 | | | in€ m. | | | in % | | | in€ m. | | | in % | |
| Income (loss) before income taxes (IBIT) | | | 784 | | | | 5,390 | | | | 3,975 | | | | (4,606) | | | | (85) | | | | 1,414 | | | | 36 | |
| | | | | | | | | | | | | | | | | | | | | | | | | | | | |
| Less pre-tax noncontrolling interests | | | (65) | | | | (209) | | | | (24) | | | | 144 | | | | (69) | | | | (185) | | | | N/M | |
| | | | | | | | | | | | | | | | | | | | | | | | �� | | | | |
| IBIT attributable to Deutsche Bank shareholders | | | 719 | | | | 5,181 | | | | 3,951 | | | | (4,462) | | | | (86) | | | | 1,229 | | | | 31 | |
| |
N/M – Not meaningful
Average Active Equity: The Group calculates active equity to make comparisons to its competitors easier and refers to active equity in several ratios. However, active equity is not a measure provided for in IFRS and you should not compare the Group’s ratios based on average active equity to other companies’ ratios without considering the differences in the calculation. The items for which the Group adjusts the average shareholders’ equity are average accumulated other comprehensive income (loss) excluding foreign currency translation (all components net of applicable taxes), as well as average dividends, for which a proposal is accrued on a quarterly basis and which are paid after the approval by the Annual General Meeting following each year. Tax rates applied in the calculation of average active equity are those used in the financial statements for the individual items and not an average overall tax rate.
| | | | | | | | | | | | | | | | | | | | | | | | | | | | |
| in€ m. | | | | | | | | | | | 2012 increase (decrease)
from 2011 | | | 2011 increase (decrease)
from 2010 | |
(unless stated otherwise) | | 2012 | | | 2011 | | | 2010 | | | in€ m. | | | in % | | | in€ m. | | | in % | |
| Average shareholders’ equity | | | 55,593 | | | | 50,547 | | | | 41,712 | | | | 5,046 | | | | 10 | | | | 8,835 | | | | 21 | |
| | | | | | | | | | | | | | | | | | | | | | | | | | | | |
| Add (deduct): | | | | | | | | | | | | | | | | | | | | | | | | | | | | |
Average accumulated other comprehensive income excluding foreign currency translation, net of applicable tax1 | | | 197 | | | | 519 | | | | 102 | | | | (322) | | | | (62) | | | | 417 | | | | N/M | |
Average dividend accruals | | | (670) | | | | (617) | | | | (461) | | | | (54) | | | | 9 | | | | (156) | | | | 34 | |
| | | | | | | | | | | | | | | | | | | | | | | | | | | | |
Average active equity | | | 55,120 | | | | 50,449 | | | | 41,353 | | | | 4,671 | | | | 9 | | | | 9,096 | | | | 22 | |
| |
N/M – Not meaningful
| 1 | The tax effect on average accumulated other comprehensive income excluding foreign currency translation was€ (338) million,€ (360) million and€ (400) million for the years ended December 31, 2012, 2011 and 2010, respectively. |
| | | | |
| Deutsche Bank | | Supplemental Financial Information (Unaudited) | | S-17 |
| Annual Report 2012 on Form 20-F | | | | |
| | |
| | | | |
| | |
| | | | |
Pre-tax return on average active equity is presented below. For comparison, also presented is the pre-tax return on average shareholders’ equity, which is defined as IBIT attributable to Deutsche Bank shareholders (i.e., excluding pre-tax noncontrolling interests), as a percentage of average shareholders’ equity.
| | | | | | | | | | | | | | | | | | | | |
in % (unless stated otherwise) | | 2012 | | | 2011 | | | 2010 | | | 2012
increase
(decrease)
from 2011 | | | 2011
increase
(decrease)
from 2010 | |
Pre-tax return on average shareholders’ equity | | | 1.3 % | | | | 10.2 % | | | | 9.5 % | | | | (8.9) ppt | | | | 0.7 ppt | |
| | | | | | | | | | | | | | | | | | | | |
Pre-tax return on average active equity | | | 1.3 % | | | | 10.3 % | | | | 9.6 % | | | | (9.0) ppt | | | | 0.7 ppt | |
| |
Leverage Ratio
As part of its balance sheet management, the Group uses an adjusted leverage ratio, which is calculated using adjustments made to reported IFRS total assets and total equity. Such adjusted measures, which are non-GAAP financial measures, are described in “Management Report: Risk Report: Balance Sheet Management” on pages 183 to 184 of the Financial Report.
Basel 3 pro-forma solvency measures
While the Group’s regulatory risk-weighted assets, capital and ratios thereof are set forth throughout this document under the Basel 2.5 capital rules, the Group also sets forth in several places measures of the Group’s regulatory risk-weighted assets, capital and ratios thereof under a pro forma application of the Basel 3 rules, based on the Group’s assumptions as to how such rules will be implemented in European Union and adopted in Germany. These assumptions will be refined over time as the relevant regulators further clarify the applicable rules, as the Group continues to refine the Group’s models and as the Group’s and the industry’s understanding and interpretation of the rules evolve. Because the Basel 3 rules are not yet implemented, such measures are also non-GAAP financial measures. Deutsche Bank Group believes that these pro forma Basel 3 calculations provide useful information to investors as they reflect the Group’s progress against future regulatory capital standards and as many of the Group’s competitors have been describing Basel 3 calculations on a “fully loaded” basis, as described below.
Although rules are still being finalized by legislators and regulatory guidance on implementation is incomplete in many ways, the Group determines pro-forma Common Equity Tier 1 capital (CET1 capital) and pro-forma risk-weighted assets (RWA) according to expected solvency rules under Basel 3. In doing so, the Group makes use of the latest available draft legislation of the European Union, the fourth Capital Requirements Directive (CRD 4) and the Capital Requirements Regulation (CRR). The Group’s interpretation is formally incorporated in policies governed by the same structures and committees as the policies that Deutsche Bank Group uses to calculate RWA or Core Tier 1 capital (CT1 capital) under Basel 2.5.
The “fully loaded” Basel 3 metrics, which are implemented on a pro forma basis, reflect the application of the rules that are expected to govern Deutsche Bank as of 2019 according to that draft legislation. The “transitional” Basel 3 measures account for the probable phase-in of provisions which are expected to be allowed to ease the transition for banks to the “fully loaded” capital rules. As the final implementation of Basel 3 may differ from the Group’s expectations, and the Group’s competitors’ assumptions and estimates regarding such implementation may vary, the Group’s Basel 3 non-GAAP financial measures may not be comparable with similarly labeled measures used by the Group’s competitors.
| | | | |
| Deutsche Bank | | Supplemental Financial Information (Unaudited) | | S-18 |
| Annual Report 2012 on Form 20-F | | | | |
| | |
| | | | |
| | |
| | | | |
The following table presents a reconciliation of the estimated pro-forma CET 1 capital as of December 31, 2012 under Basel 3 rules compared to Basel 2.5 rules, along with the Group’s estimated RWAs and capitalization ratios under Basel 3 rules. Note that these figures are unaudited.
| | | | | | | | | | | | |
| | | | | | Pro forma Dec 31, 2012 | |
in€ billion (unless stated otherwise) | | Reported Dec 31, 2012 | | | CET1 transitional | | | CET1 ‘fully-loaded’ | |
CET1 (Basel 2.5) | | | 38.0 | | | | | | | | | |
RWA (Basel 2.5) | | | 334 | | | | | | | | | |
| | | | | | | | | | | | |
CET1 ratio | | | 11.4 % | | | | | | | | | |
| | | | | | | | | | | | |
CRD 4/CRR impact on CET1 | | | | | | | | | | | | |
Adjustments not impacted by transitional provisions | | | | | | | | | | | | |
- Conversion from securitization deductions to RWA | | | | | | | 1.0 | | | | 1.0 | |
- Debt Value Adjustments (DVA)1 | | | | | | | (0.6) | | | | (0.6) | |
- Prudential valuation adjustments | | | | | | | 0.0 | | | | 0.0 | |
- Other | | | | | | | 0.0 | | | | 0.0 | |
Adjustments impacted by transitional provisions | | | | | | | | | | | | |
- Goodwill and intangibles2 | | | | | | | 11.3 | | | | 0.0 | |
- Expected Loss > impairment | | | | | | | (0.1) | | | | (0.6) | |
- Deferred tax assets subject to full deduction treatment | | | | | | | 0.0 | | | | (1.7) | |
- Excess minority interests3 | | | | | | | 0.0 | | | | (0.1) | |
- Pensions | | | | | | | 0.0 | | | | (0.9) | |
- Gains on AFS equity and debt4 | | | | | | | 0.0 | | | | 0.3 | |
- Other5 | | | | | | | 1.0 | | | | (3.9) | |
| | | | | | | | | | | | |
CET1 (pro-forma Basel 3) | | | | | | | 50.5 | | | | 31.3 | |
| | | | | | | | | | | | |
CRD 4/CRR impact on RWA | | | | | | | | | | | | |
- New charge for Credit Valuation Adjustments (CVA) | | | | | | | 28 | | | | 28 | |
- Reclassification of high risk securitization positions from CET1 capital deductions into RWA | | | | | | | 24 | | | | 24 | |
- New charge for business with Central Counterparties and clearing | | | | | | | 4 | | | | 4 | |
- Other6 | | | | | | | 19 | | | | 12 | |
| | | | | | | | | | | | |
RWA (pro-forma Basel 3) | | | | | | | 408 | | | | 401 | |
| | | | | | | | | | | | |
CET1 ratio (pro-forma Basel 3) | | | | | | | 12.4 % | | | | 7.8 % | |
| |
| 1 | In light of latest CRD 4/CRR proposal DVAs will be subject to transitional provisions and thus reported under “Adjustments impacted by transitional provisions” in the future. |
| 2 | Only eligible goodwill/intangible amount that is put against Additional Tier 1 instruments is shown here. |
| 3 | The Group’s minority interests are not eligible for recognition as CET1 under CRD 4/CRR rules. |
| 4 | Also includes unrealized gains and losses from instruments measured at fair value (other than AFS instruments) and that fall under the treatment of article 32 of CRR. |
| 5 | Includes own shares in trading book, deductions from significant investments in financial sector entities and deferred tax assets from temporary differences that arise from the application of the 10/15 % threshold rule. |
| 6 | Includes changes to Credit Risk and Market Risk RWA calculation as well as RWA related to capital deductions. |
| | | | |
| Deutsche Bank | | Imprint | | S-19 |
| Annual Report 2012 on Form 20-F | | | | |
| | |
| Imprint | | | | |
| | |
| | | | |
Deutsche Bank Aktiengesellschaft
Taunusanlage 12
60262 Frankfurt am Main
Germany
Telephone: +49 69 91 00 0
deutsche.bank@db.com
(This page intentionally left blank)