FORM 6-K
SECURITIES AND EXCHANGE COMMISSION
Washington, D.C. 20549
Report of Foreign Private Issuer
Dated May 6, 2003
Pursuant to Rule 13a-16 or 15d-16
of the Securities Exchange Act of 1934
For the month of May 6, 2003
Commission File Number 001-15244
CREDIT SUISSE GROUP
(Translation of registrant's name into English)
Paradeplatz 8, P.O. Box 1, CH-8070 Zurich, Switzerland
(Address of principal executive offices)
Indicate by check mark whether the registrant files or will file annual reports under cover Form 20-F or Form 40-F.
Form 20-F ![]() Form 40-F
Form 40-F ![]()
Indicate by check mark if the registrant is submitting the Form 6-K in paper as permitted by Regulation S-T Rule 101(b)(1):
Note: Regulation S-T Rule 101(b)(1) only permits the submission in paper of a Form 6-K if submitted solely to provide an attached annual report to security holders.
Indicate by check mark if the registrant is submitting the Form 6-K in paper as permitted by Regulation S-T Rule 101(b)(7):
Note: Regulation S-T Rule 101(b)(7) only permits the submission in paper of a Form 6-K if submitted to furnish a report or other document that the registrant foreign private issuer must furnish and make public under the laws of the jurisdiction in which the registrant is incorporated, domiciled or legally organized (the registrant's "home country"), or under the rules of the home country exchange on which the registrant's securities are traded, as long as the report or other document is not a press release, is not required to be and has not been distributed to the registrant's security holders, and, if discussing a material event, has already been the subject of a Form 6-K submission or other Commission filing on EDGAR.
Indicate by check mark whether by furnishing the information contained in this Form, the registrant is also thereby furnishing the information to the Commission pursuant to Rule 12g3-2(b) under the Securities Exchange Act of 1934.
Yes ![]() No
No ![]()
If "Yes" is marked, indicate below the file number assigned to the registrant in connection with Rule 12g3-2(b): 82-
|
e-mail media.relations@credit-suisse.com |
| CREDIT SUISSE GROUP REPORTS NET PROFIT OF CHF 652 MILLION FOR THE FIRST QUARTER 2003 |  |
| Credit Suisse First Boston Returns to Profitability | |
| Credit Suisse Financial Services Reports | |
| Improved Results Across All Segments | |
Zurich, May 6, 2003 – Credit Suisse Group today announced a net profit of CHF 652 million for the first quarter of 2003, in line with the Group’s preliminary outlook announced on April 25, 2003. Credit Suisse First Boston returned to profitability in the first quarter, due in large part to the significantly improved performance of its Institutional Securities segment. Winterthur’s results recovered further in the first quarter, with both Life & Pensions and Insurance improving their profitability versus the fourth quarter due primarily to increased investment income, tariff increases and lower administration costs. Private Banking recorded a higher segment profit than in the fourth quarter of 2002, as well as net new assets of CHF 1.5 billion. At the same time, Corporate & Retail Banking reported a significant increase in profitability compared to the weak fourth quarter of 2002. Oswald J. Grübel, Co-CEO of Credit Suisse Group and Chief Executive Officer of Credit Suisse Financial Services, stated, "Credit Suisse Group’s first quarter results demonstrate real progress on our goal to return the Group to profitability in 2003. In addition, we are pleased that all of Credit Suisse Financial Services’ segments improved their results in the first quarter, reflecting our targeted measures to reduce costs and adapt the business to prevailing market conditions." John J. Mack, Co-CEO of Credit Suisse Group and Chief Executive Officer of Credit Suisse First Boston, said, "Credit Suisse First Boston’s return to profitability in the first quarter confirms that the measures we have taken to restore our earnings strength are paying off. Last week, we announced the successful conclusion of the sale of Pershing to The Bank of New York. We also finalized the agreement with US regulators last week, which is an important step forward for the Firm and the entire industry in restoring investor confidence." |
1
Group Results
In the first quarter of 2003, Credit Suisse Group reported a net profit of CHF 652 million, including writedowns on the Group’s investments in Swiss Life and Swiss International Airlines of CHF 73 million and CHF 77 million, respectively, and CHF 204 million of amortization of acquired intangible assets and goodwill, after tax. This compared with a net loss of CHF 950 million in the fourth quarter of 2002, in which results were impacted by after-tax exceptional items of CHF 1.3 billion and the one-time positive cumulative effect of a change in accounting principlefor periods prior to 2002 of CHF 520 million. Compared to the first quarter of 2002, net profit increased by CHF 284 million or 77%. The Group’s operating income was CHF 7.0 billion in the first quarter of 2003, up 10% versus the previous quarter but down 16% versus the first quarter of 2002. The Group’s operating expenses decreased 2% versus the fourth quarter to CHF 5.0 billi on and were down 23% compared to the first quarter of 2002.
Earnings per share for the first quarter of 2003 were CHF 0.53, versus a loss of CHF 0.80 for the fourth quarter and a profit of CHF 0.31 for the first quarter of 2002. The Group’s return on equity was 9.2% in the first quarter of 2003, versus -13.0% in the fourth quarter and 4.1% in the first quarter of 2002. The Group’s consolidated BIS tier 1 ratio was 10.0% as of March 31, 2003, up from 9.7% as of December 31, 2002. This increase is attributable to earnings generated in the first quarter, offset by moderate growth in risk-weighted assets in the banking segments and slightly lower equity in the insurance business, and to the positive impact of the Pershing sale transaction that closed on May 1, 2003.
2
Business Unit Results
The segment results described below represent net operating profit before minority interests, excluding exceptional items (at Private Banking, Institutional Securities and CSFB Financial Services segments) and the one-time positive cumulative effect of a change in accounting principle for periods prior to 2002 in the fourth quarter of 2002. For further information on Credit Suisse Group’s first quarter 2003 and fourth quarter 2002 results, please refer to the respective Quarterly Reports, including the reconciliation of operating results to consolidated results contained therein.
All of Credit Suisse Financial Services’ segments improved their performance in the first quarter of 2003 versus the previous quarter. However, as the business unit’s fourth quarter 2002 result benefited from the one-time positive cumulative effect of a change in accounting principle for periods prior to 2002 of CHF 266 million, its first quarter 2003 net profit of CHF 666 million represents a decline of 6% quarter-on-quarter. Compared to the first quarter of 2002, net profit was up 13%. Before the amortization of acquired intangible assets and goodwill, excluding exceptional items in the fourth quarter of 2002 of CHF 73 million and the cumulative effect of a change in accounting principle for periods prior to 2002, first quarter 2003 net operating profit was CHF 690 million, up 29% versus the fourth quarter and up 11% versus the first quarter of 2002.
3
Private Banking reported a segment profit of CHF 371 million in the first quarter 2003, up 10% versus the previous quarter but down 39% compared to the first quarter of 2002. Operating income declined 2% versus the previous quarter to CHF 1.3 billion and was down 21% versus the first quarter of 2002, primarily as a result of reduced transaction volumes in the securities business due to investor passivity and the market-driven lower asset base. First quarter operating expenses decreased 7% versus the fourth quarter and 8% versus the first quarter of 2002.
Corporate & Retail Banking posted a segment profit of CHF 124 million in the first quarter of 2003, up 158% versus the weak fourth quarter but down 15% compared to the first quarter of 2002. Operating income rose 3% quarter-on-quarter to CHF 734 million but was down 7% versus the first quarter of 2002. First quarter operating expenses were down 14% and 3% versus the fourth and first quarters of 2002, respectively. The cost/income ratio was 67.4% for the first quarter of 2003, compared to 80.8% in the fourth quarter of 2002.
Life & Pensions recorded a segment profit of CHF 111 million in the first quarter of 2003, an increase of CHF 96 million versus the first quarter of 2002 and of CHF 18 million compared to the fourth quarter of 2002. Investment income was CHF 1.2 billion for the first quarter of 2003, up CHF 429 million versus the first quarter of 2002. Life & Pensions reported a decrease in gross premiums written of 4%, or CHF 263 million, to CHF 6.5 billion compared to the first quarter of 2002. Adjusted for acquisitions, divestitures and exchange rate impacts, premiums fell 2% versus the first quarter of 2002. The expense ratio for the first quarter of 2003 was 6.8%, compared to 6.4% in the first quarter of 2002.
Insurance reported a segment profit of CHF 92 million in the first quarter of 2003, an increase of CHF 239 million compared to the first quarter of 2002 and of CHF 86 million compared to the fourth quarter of 2002. First quarter 2003 investment income was CHF 289 million, up CHF 202 million versus the first quarter of 2002. Net premiums earned rose CHF 227 million, or 6%, to CHF 4.0 billion versus the first quarter of 2002. Adjusted for acquisitions, divestitures and exchange rate impacts, the premium volume increased 13%. The combined ratio improved 3.2 percentage points in the first quarter to 100.7%, compared to 103.9% in the first quarter of 2002.
The Credit Suisse First Boston business unit reported a net profit of USD 161 million (CHF 221 million) in the first quarter of 2003, compared to a net loss of USD 811 million (CHF 1.3 billion) in the fourth quarter and a net loss of USD 19 million (CHF 32 million) in the first quarter of 2002. Before the amortization of acquired intangible assets and goodwill, excluding exceptional items in the fourth quarter of 2002 of CHF 1.4 billion before tax, or CHF 1.3 billion after tax, and the one-time positive cumulative effect of a change in accounting principle for periods prior to 2002, first quarter net operating profit was USD 292 million (CHF 400 million), compared to a net operating profit of USD 11 million (CHF 15 million) in the fourth quarter and up 88% from a net operating profit of USD 155 million (CHF 259 million) in the first quarter of 2002. Trends in operating income and expenses were affected by a change in reporting for Pershing; effective Jan uary 1, 2003, Pershing’s operating income was reported net of expenses. First quarter operating income increased 24% on a US dollar basis versus the previous quarter, reflecting significantly increased revenues in the Institutional Securities segment. With cost control remaining one of its top priorities, Credit Suisse First Boston significantly improved its pre-tax margin in the first quarter versus both the fourth and first quarters of 2002. Total operating expenses were 16% higher than in the fourth quarter and 16% lower than in the first quarter of 2002. Excluding Pershing, total operating expenses were 27% higher quarter-on-quarter because of increased incentive compensation tied to performance. However, compared to the first quarter of 2002 – again excluding Pershing – operating expenses were down 10% on a 12% reduction in headcount and various cost containment measures.
4
Institutional Securities reported a segment profit of USD 348 million (CHF 476 million) in the first quarter of 2003, up 452% versus the fourth quarter and 60% versus the first quarter of 2002. First quarter 2003 operating income was up 39% versus the prior quarter, to USD 2.6 billion (CHF 3.6 billion), reflecting stronger results in Fixed Income. Compared to the first quarter of 2002, operating income declined 5% as improved Fixed Income results were insufficient to offset industry-wide declines in equities and M&A volumes. Segment operating expenses were consistent with overall Firm trends cited above. In the first quarter of 2003, despite the continuing challenging market environment, the Equity division’s rankings in research, sales and trading generally remained consistent or improved, and Credit Suisse First Boston retained its number one ranking in global high yield new issuances.
CSFB Financial Services reported a segment profit of USD 37 million (CHF 51 million) for the first quarter of 2003, a decline of 23% versus the fourth quarter and 47% versus the first quarter of 2002. This performance reflects lower results from Private Client Services and Pershing, which were impacted by low customer activity and unfavorable market conditions, as well as from Credit Suisse Asset Management, which experienced a decline in assets under management. Operating income for the segment was down 37% compared to the fourth quarter and 43% compared to the first quarter of 2002, and operating expenses were below both periods by 41% and 44%, respectively. Excluding Pershing, operating income was flat compared to the fourth quarter and was down 5% compared to the first quarter of 2002, while operating expenses were below both periods by 3% and 5%, respectively.
5
Net New Assets
Credit Suisse Financial Services reported net new assets of CHF 0.3 billion in the first quarter of 2003, with net inflows of CHF 1.5 billion at Private Banking and of CHF 2.2 billion at Life & Pensions partially offset by a net outflow of CHF 3.4 billion from Corporate & Retail Banking due to a shift from time deposit accounts of corporate clients to transaction accounts, which do not qualify as assets under management. Credit Suisse First Boston reported a net asset outflow of CHF 3.8 billion in the first quarter, as a CHF 1.5 billion net inflow at Private Client Services was offset by net outflows of CHF 5.2 billion from Credit Suisse Asset Management and CHF 0.1 billion from Institutional Securities. For Credit Suisse Group, an overall net asset outflow of CHF 3.5 billion was recorded in the first quarter of 2003, compared with a net asset outflow of CHF 6.6 billion in the fourth quarter of 2002. The Group’s total assets under management were CHF 1,160.5 billion as of March 31, 2003, a decline of 2.9% versus December 31, 2002.
Valuation Adjustments, Provisions and Losses
Total valuation adjustments, provisions and losses of CHF 233 million were recorded in the first quarter of 2003, a decrease of 90% compared with CHF 2.4 billion in the fourth quarter of 2002. Compared to the first quarter of 2002, valuation adjustments, provisions and losses decreased 51%.
Outlook
Given the continued challenging market environment and global uncertainty, Credit Suisse Group remains cautious in its outlook for 2003. The Group made progress towards its goal to return to solid profitability in 2003 but remains exposed to continued volatility in the financial markets, especially as regards the Life & Pensions business.
6
Enquiries
Credit Suisse Group, Media Relations Telephone +41 1 333 8844
Credit Suisse Group, Investor Relations Telephone +41 1 333 4570
The Quarterly Report Q1 2003 and the slide presentation will be available from around 07.30 CET / 06.30 BST / 01.30 EST at www.credit-suisse.com/results/docu.
Credit Suisse Group
Credit Suisse Group is a leading global financial services company headquartered in Zurich. The business unit Credit Suisse Financial Services provides private clients and small and medium-sized companies with Private Banking and financial advisory services, banking products, and Pension and Insurance solutions from Winterthur. The business unit Credit Suisse First Boston, an Investment Bank, serves global institutional, corporate, government and individual clients in its role as a financial intermediary. Credit Suisse Group’s registered shares (CSGN) are listed in Switzerland and Frankfurt, and in the form of American Depositary Shares (CSR) in New York. The Group employs around 73,000 staff worldwide. As of March 31, 2003, it reported assets under management of CH 1,160.5 billion.
Cautionary statement regarding forward-looking information
This press release contains statements that constitute forward-looking statements. In addition, in the future we, and others on our behalf, may make statements that constitute forward-looking statements. Such forward-looking statements may include, without limitation, statements relating to our plans, objectives or goals; our future economic performance or prospects; the potential effect on our future performance of certain contingencies; and assumptions underlying any such statements. Words such as “believes,” “anticipates,” “expects,” "intends” and “plans” and similar expressions are intended to identify forward-looking statements but are not the exclusive means of identifying such statements. We do not intend to update these forward-looking statements except as may be required by applicable laws. By their very nature, forward-looking statements involve inherent risks and uncertainties, both general and specific, and risks exist that predictions, forecasts, projections and other outcomes described or implied in forward-looking statements will not be achieved. We caution you that a number of important factors could cause results to differ materially from the plans, objectives, expectations, estimates and intentions expressed in such forward-looking statements. These factors include (i) market and interest rate fluctuations; (ii) the strength of the global economy in general and the strength of the economies of the countries in which we conduct our operations in particular; (iii) the ability of counterparties to meet their obligations to us; (iv) the effects of, and changes in, fiscal, monetary, trade and tax policies, and currency fluctuations; (v) political and social developments, including war, civil unrest or terrorist activity; (vi) the possibility of foreign exchange controls, expropriation, nationalization or confiscation of assets in countries in which we conduct our operations; (vii) the ability to maintain sufficient liquidity and access capital markets; (viii) operational factors such as systems failure, human error, or the failure to properly implement procedures; (ix) actions taken by regulators with respect to our business and practices in one or more of the countries in which we conduct our operations; (x) the effects of changes in laws, regulations or accounting policies or practices; (xi) competition in geographic and business areas in which we conduct our operations; (xii) the ability to retain and recruit qualified personnel; (xiii) the ability to maintain our reputation and promote our brands; (xiv) the ability to increase market share and control expenses; (xv) technological changes; (xvi) the timely development and acceptance of our new products and services and the perceived overall value of these products and services by users; (xvii) acquisitions, including the ability to integrate successfully acquired businesses; (xviii) the adverse resolution of litigation and other contingencies; and (xix) our success at managing the risks involved in the foregoing. We caution you that the foregoing list of important factors is not exclusive; when evaluating forward-looking statements, you should carefully consider the foregoing factors and other uncertainties and events, as well as the risks identified in our most recently filed Form 20-F and reports on Form 6-K furnished to the US Securities and Exchange Commission.
Cautionary statement regarding non-GAAP financial information
This press release may contain non-GAAP financial information. A reconciliation of such non-GAAP financial information to the most directly comparable measures under generally accepted accounting principles, is posted on our website website at http://www.credit-suisse.com/sec.html.
7
Presentation of Credit Suisse Group’s First Quarter Results 2003 via Webcast and Telephone Conference
| Date | Tuesday, May 6, 2003 |
| Time | 15.00 CET / 14.00 BST / 09.00 EST |
| Speakers | Philip K. Ryan, CFO of Credit Suisse Group |
| Ulrich Körner, CFO of Credit Suisse Financial Services | |
| Barbara Yastine, CFO of Credit Suisse First Boston | |
| All presentations will be held in English. | |
| Webcast | http://www.credit-suisse.com/results |
| Telephone | Europe: +41 91 610 5600 |
| UK: +44 207 866 4111 | |
| USA: +1 412 858 4600 | |
| Reference: “Credit Suisse Group quarterly results” | |
| Q&A | You will have the opportunity to ask the speakers questions via telephone conference following the presentations. |
| Playback | Video on demand – available approximately three hours after the event at http://www.credit-suisse.com/results |
| Telephone – available approximately one hour after the event; please dial: | |
| Europe: +41 91 612 4330 | |
| UK: +44 207 866 4300 | |
| USA: +1 412 858 1440 | |
| Conference ID: 631# | |
| Note | We recommend that you dial in approximately ten minutes before the start of the presentation for the webcast and telephone conference. Further instructions and technical test functions are now available on our website. |
8
QUARTERLY REPORT 2003 Q1

Credit Suisse Group is a leading global financial services company headquartered in Zurich. Credit Suisse Financial Services provides private clients and small and medium-sized companies with private banking and financial advisory services, banking products, and pension and insurance solutions from Winterthur. Credit Suisse First Boston, the investment bank, serves global institutional, corporate, government and individual clients in its role as a financial intermediary. Credit Suisse Group’s registered shares (CSGN) are listed in Switzerland and Frankfurt, and in the form of American Depositary Shares (CSR) in New York. The Group employs around 73,000 staff worldwide.
QUARTERLY REPORT 2003
EDITORIAL
CREDIT SUISSE GROUP FINANCIAL HIGHLIGHTS Q1/2003
AN OVERVIEW OF CREDIT SUISSE GROUP
Equity capital
Net new assets
Operating income and expenses
Valuation adjustments, provisions and losses
Outlook
RISK MANAGEMENT
Overall risk trends
Trading risks
Credit risk exposure
REVIEW OF BUSINESS UNITS | CREDIT SUISSE FINANCIAL SERVICES
Private Banking
Corporate & Retail Banking
Life & Pensions
Insurance
REVIEW OF BUSINESS UNITS | CREDIT SUISSE FIRST BOSTON
Institutional Securities
CSFB Financial Services
RECONCILIATION OF OPERATING TO CONSOLIDATED RESULTS
Reconciliation of operating to consolidated results
CONSOLIDATED RESULTS | CREDIT SUISSE GROUP
LOANS
INFORMATION FOR INVESTORS
Enquiries
Financial Publications
This symbol is used to indicate topics on which further information is available on our website. Go to www.credit-suisse.com/results/bookmarks.html to find links to the relevant information. The additional information -indicated is openly accessible and does not form part of the Quarterly Report. Some areas of Credit Suisse Group’s websites are only available in English.
Cautionary statement regarding forward-looking information
This Quarterly Report contains statements that constitute forward-looking statements. In addition, in the future we, and others on our behalf, may make statements that constitute forward-looking statements. Such forward-looking statements may include, without limitation, statements relating to our plans, objectives or goals; our future economic performance or prospects; the potential effect on our future performance of certain contingencies; and assumptions underlying any such statements.
Words such as "believes," "anticipates," "expects," "intends" and "plans" and similar expressions are intended to identify forward-looking statements but are not the exclusive means of identifying such statements. We do not intend to update these forward-looking statements except as may be required by applicable laws.
By their very nature, forward-looking statements involve inherent risks and uncertainties, both general and specific, and risks exist that predictions, forecasts, projections and other outcomes described or implied in forward-looking statements will not be achieved. We caution you that a number of important factors could cause results to differ materially from the plans, objectives, expectations, estimates and intentions expressed in such forward-looking statements. These factors include (i) market and interest rate fluctuations; (ii) the strength of the global economy in general and the strength of the economies of the countries in which we conduct our operations in particular; (iii) the ability of counterparties to meet their obligations to us; (iv) the effects of, and changes in, fiscal, monetary, trade and tax policies, and currency fluctuations; (v) political and social developments, including war, civil unrest or terrorist activity; (vi) the possibility of foreign exchange controls, expropriation, nationalization or confiscation of assets in countries in which we conduct our operations; (vii) the ability to maintain sufficient liquidity and access capital markets; (viii) operational factors such as systems failure, human error, or the failure to properly implement procedures; (ix) actions taken by regulators with respect to our business and practices in one or more of the countries in which we conduct our operations; (x) the effects of changes in laws, regulations or accounting policies or practices; (xi) competition in geographic and business areas in which we conduct our operations; (xii) the ability to retain and recruit qualified personnel; (xiii) the ability to maintain our reputation and promote our brands; (xiv) the ability to increase market share and control expenses; (xv) technological changes; (xvi) the timely development and acceptance of our new products and services and the perceived overall value of these products and se rvices by users; (xvii) acquisitions, including the ability to integrate successfully acquired businesses; (xviii) the adverse resolution of litigation and other contingencies; and (xix) our success at managing the risks involved in the foregoing.
We caution you that the foregoing list of important factors is not exclusive; when evaluating forward-looking statements, you should carefully consider the foregoing factors and other uncertainties and events, as well as the risks identified in our most recently filed Form 20-F and reports on Form 6-K furnished to the US Securities and Exchange Commission.
Cautionary statement regarding non-GAAP financial information
This Quarterly Report may contain non-GAAP financial information. A reconciliation of such non-GAAP financial information to the most directly comparable measures under generally accepted accounting principles is contained in this report and is posted on our website at www.credit-suisse.com/sec.html.
EDITORIAL

Oswald J. Grübel
Co-CEO Credit Suisse Group
Chief Executive Officer
Credit Suisse Financial Services

John J. Mack
Co-CEO Credit Suisse Group
Chief Executive Officer
Credit Suisse First Boston
Dear shareholders, clients and colleagues
In the first quarter of 2003 Credit Suisse Group returned to profitability. The Group recorded a net profit of CHF 652 million in a challenging environment, after reporting a net loss of CHF 950 million in the previous quarter. The measures that we took across the Group to restore earnings strength and adapt the cost structure to the current business environment are beginning to pay off. The Group expects continuing challenging conditions for the remainder of the year. However, we are fully committed to achieving our goal of profitability in 2003.
All segments of Credit Suisse Financial Services improved profitability and reported better results than in the fourth quarter of 2002. Credit Suisse Financial Services posted a net profit of CHF 666 million in the first quarter of 2003, compared with a net profit of CHF 705 million in the previous quarter, which included the one-time positive cumulative effect of a change in accounting principle in the amount of CHF 266 million for periods prior to 2002. Private Banking recorded an increased segment profit and an increased level of net new assets compared with the fourth quarter of 2002. Corporate & Retail Banking increased its segment profit considerably compared to a weak fourth quarter.
Our insurance segments, Life & Pensions and Insurance, further improved their operating performance in the first quarter of 2003 and both segments increased their segment profits compared to the previous quarter. These improvements resulted primarily from tariff increases and stronger investment income. The realignment of the Winterthur organization has resulted in the merger of its two Corporate Centers and redefined management levels for the countries where the life and non-life businesses are being merged.
Credit Suisse First Boston restored its profitability in the first quarter of 2003, with a net profit of USD 161 million (CHF 221 million) compared to a net loss of USD 811 million (CHF 1.3 billion) in the previous quarter. Its Institutional Securities segment improved significantly from the fourth quarter of 2002, benefiting in particular from a strong performance by the Fixed Income division, notably lower cost levels and credit provisions. In the fourth quarter of 2002, the business unit reached an agreement in principle with certain US regulators involving research analyst independence and IPO allocations to corporate executives, and an ultimate settlement was recently finalized. In addition, certain structural and financial legacies and costs were reduced considerably.
The Group's consolidated BIS tier 1 ratio increased further to 10.0%, compared to 9.7% as of December 31, 2002 reflecting the quarter’s earnings and the sale of Pershing, partly offset by moderate growth in risk-weighted assets in the banking business.
While we are not yet satisfied with our results, we are pleased that the first quarter performance is the first tangible result of our efforts to return the Group to profitability. We expect 2003 to be challenging and will continue to focus on cost control and the strength of our franchises.
Oswald J. Grübel John J. Mack
May 2003
CREDIT SUISSE GROUP FINANCIAL HIGHLIGHTS Q1/2003
| Consolidated income statement | ||||||||||||
| Change | Change | |||||||||||
| in % from | in % from | |||||||||||
| in CHF m | 1Q2003 | 4Q2002 | 1Q2002 | 4Q2002 | 1Q2002 | |||||||
| Operating income | 7,024 | 6,395 | 8,330 | 10 | (16) | |||||||
| Gross operating profit | 2,004 | 1,284 | 1,832 | 56 | 9 | |||||||
| Net profit/(loss) | 652 | (950) | 368 | – | 77 | |||||||
| Return on equity | ||||||||||||
| Change | Change | |||||||||||
| in % from | in % from | |||||||||||
| in % | 1Q2003 | 4Q2002 | 1Q2002 | 4Q2002 | 1Q2002 | |||||||
| Return on equity | 9.2 | (13.0) | 4.1 | – | 124 | |||||||
| Consolidated balance sheet | ||||||||||||
| Change | ||||||||||||
| in % from | ||||||||||||
| in CHF m | 31.03.03 | 31.12.02 | 31.12.02 | |||||||||
| Total assets | 992,143 | 955,656 | 4 | |||||||||
| Shareholders' equity | 31,402 | 31,394 | 0 | |||||||||
| Minority interests in shareholders' equity | 2,879 | 2,878 | 0 | |||||||||
| Capital data | ||||||||||||
| Change | ||||||||||||
| in % from | ||||||||||||
| in CHF m | 31.03.03 | 31.12.02 | 31.12.02 | |||||||||
| BIS risk-weighted assets | 205,548 | 201,466 | 2 | |||||||||
| BIS tier 1 capital | 20,517 | 19,544 | 5 | |||||||||
| of which non-cumulative perpetual preferred securities | 2,146 | 2,162 | (1) | |||||||||
| BIS total capital | 34,685 | 33,290 | 4 | |||||||||
| Capital ratios | ||||||||||||
| in % | 31.03.03 | 31.12.02 | ||||||||||
| BIS tier 1 ratio | Credit Suisse | 7.5 | 7.4 | |||||||||
| Credit Suisse First Boston | 1) | 10.5 | 10.3 | |||||||||
| Credit Suisse Group | 2) | 10.0 | 9.7 | |||||||||
| BIS total capital ratio | Credit Suisse Group | 16.9 | 16.5 | |||||||||
| Assets under management/client assets | ||||||||||||
| Change | ||||||||||||
| in % from | ||||||||||||
| in CHF bn | 31.03.03 | 31.12.02 | 31.12.02 | |||||||||
| Advisory assets under management | 588.5 | 605.6 | (3) | |||||||||
| Discretionary assets under management | 572.0 | 589.7 | (3) | |||||||||
| Total assets under management | 1,160.5 | 1,195.3 | (3) | |||||||||
| Client assets | 1,256.7 | 1,793.2 | (30) | |||||||||
| Net new assets | ||||||||||||
| Change | Change | |||||||||||
| in % from | in % from | |||||||||||
| in CHF bn | 1Q2003 | 4Q2002 | 1Q2002 | 4Q2002 | 1Q2002 | |||||||
| Net new assets | (3.5) | (6.6) | 13.5 | (47) | – | |||||||
| 1) Ratio is based on a tier 1 capital of CHF 11.2 bn (31.12.02: CHF 10.6 bn), of which non-cumulative perpetual preferred securities is CHF 1.0 bn (31.12.02: CHF 1.0 bn). | ||||||||||||
| 2) Ratio is based on a tier 1 capital of CHF 20.5 bn (31.12.02: CHF 19.5 bn), of which non-cumulative perpetual preferred securities is CHF 2.1 bn (31.12.02: CHF 2.2 bn). | ||||||||||||
| Number of employees (full-time equivalents) | |||||||||||
| Change | |||||||||||
| in % from | |||||||||||
| 31.03.03 | 31.12.02 | 31.12.02 | |||||||||
| Switzerland | banking | 20,952 | 21,270 | (1) | |||||||
| insurance | 6,876 | 7,063 | (3) | ||||||||
| Outside Switzerland | banking | 20,726 | 25,057 | (17) | |||||||
| insurance | 24,817 | 25,067 | (1) | ||||||||
| Total employees Credit Suisse Group | 73,371 | 78,457 | (6) | ||||||||
| Share data | |||||||||||
| Change | |||||||||||
| in % from | |||||||||||
| 31.03.03 | 31.12.02 | 31.12.02 | |||||||||
| Shares issued | 1,189,891,720 | 1,189,891,720 | 0 | ||||||||
| To be issued upon conversion of MCS | 1) | 40,413,838 | 40,413,838 | 0 | |||||||
| Shares outstanding | 1,230,305,558 | 1,230,305,558 | 0 | ||||||||
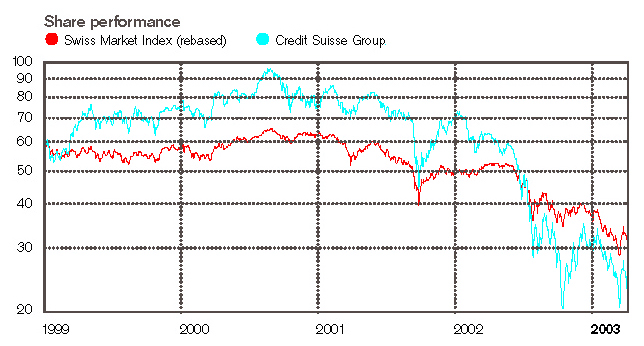
| Share price in CHF | 23.50 | 30.00 | (22) | ||||||||
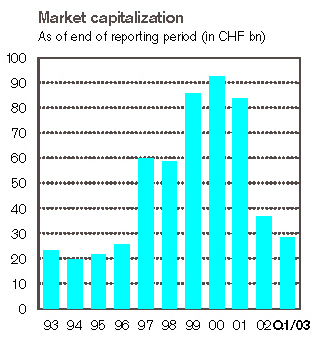
| Market capitalization in CHF m | 28,912 | 36,909 | (22) | ||||||||
| Book value per share in CHF | 23.18 | 23.18 | 0 | ||||||||
| 1) Maximum number of shares related to Mandatory Convertible Securities (MCS) issued by Credit Suisse Group Finance (Guernsey) Ltd. in December 2002. | |||||||||||
| Share price | |||||||||||
| Change | Change | ||||||||||
| in % from | in % from | ||||||||||
| in CHF | 1Q2003 | 4Q2002 | 1Q2002 | 4Q2002 | 1Q2002 | ||||||
| High (closing price) | 34.45 | 35.70 | 73.60 | (4) | (53) | ||||||
| Low (closing price) | 20.70 | 20.60 | 56.50 | 0 | (63) | ||||||
| Earnings per share | |||||||||||
| Change | Change | ||||||||||
| in % from | in % from | ||||||||||
| in CHF | 1Q2003 | 4Q2002 | 1Q2002 | 4Q2002 | 1Q2002 | ||||||
| Basic earnings per share | 0.53 | (0.80) | 0.31 | – | 71 | ||||||
| Diluted earnings per share | 0.53 | (0.80) | 0.31 | – | 71 | ||||||
AN OVERVIEW OF CREDIT SUISSE GROUP

Credit Suisse Group returned to profitability in the first quarter of 2003, reporting a net profit of CHF 652 million, compared with a net loss of CHF 950 million in the fourth quarter of 2002. Compared to the first quarter of 2002, the net profit increased CHF 284 million, or 77%. Credit Suisse Financial Services recorded a net profit of CHF 666 million, with all segments posting improved results. Credit Suisse First Boston recorded a net profit of USD 161 million (CHF 221 million) with a significant improvement in the results of the Institutional Securities segment.
The first quarter 2003 results demonstrate Credit Suisse Group's progress on returning to profitability despite continuing challenging market conditions.
Winterthur’s results continued to recover in the first quarter of 2003, with both Life & Pensions and Insurance improving profitability compared to the previous quarter due to stronger investment income and tariff increases. Private Banking recorded a higher segment profit than in the fourth quarter of 2002, primarily due to lower operating expenses. Corporate & Retail Banking increased its segment profit considerably compared to a weak fourth quarter. Overall, Credit Suisse Financial Services reported a net profit of CHF 666 million in the first quarter of 2003, down 6% compared to the fourth quarter of 2002 and up 13% compared to the corresponding period of the previous year. In the fourth quarter of 2002, Credit Suisse Financial Services’ results benefited from the one-time cumulative effect of a change in accounting principle for periods prior to 2002.
Credit Suisse First Boston posted a first quarter net profit of USD 161 million (CHF 221 million), compared with a net loss of USD 811 million (CHF 1.3 billion) in the previous quarter, which was impacted by exceptional items of USD 813 million (CHF 1.3 billion) after-tax. Compared to the first quarter of 2002, the business unit’s net profit increased USD 180 million (CHF 253 million). Institutional Securities improved its segment result in the first quarter of 2003 significantly compared to the previous quarter, benefiting particularly from strong results in the Fixed Income business. CSFB Financial Services reported a lower segment result compared to the fourth quarter of 2002, mainly due to weak equity markets and lower assets under management.
After accounting for the Corporate Center, which includes writedowns on the Group’s investments in Swiss Life and Swiss International Airlines of CHF 73 million and CHF 77 million, respectively, the Group reported a net profit of CHF 652 million for the first quarter of 2003, compared with a net loss of CHF 950 million in the previous quarter. In the first quarter of 2003, net profit included CHF 204 million of amortization of acquired intangible assets and goodwill after-tax. The fourth quarter 2002 results were impacted by exceptional items of CHF 1.3 billion after-tax and the positive one-time cumulative effect of a change in accounting principle for periods prior to 2002 in the amount of CHF 520 million. Compared to the first quarter of 2002, net profit increased CHF 284 million, or 77%. Earnings per share for the first quarter of 2003 were CHF 0.53 versus a loss of CHF 0.80 for the fourth quarter of 2002 and a profit of CHF 0. 31 for the first quarter of 2002. The Group’s return on equity was 9.2% in the first quarter of 2003 versus -13.0% in the fourth quarter and 4.1% in the first quarter of 2002.
Equity capital
During the first quarter of 2003, Credit Suisse Group further improved its capital base in addition to the improvements reported in the fourth quarter of 2002. The Group’s consolidated BIS tier 1 ratio stood at 10.0% as of March 31, 2003, up from 9.7% as of December 31, 2002. This increase was due to earnings generated in the first quarter of 2003, offset by moderate growth in risk-weighted assets in the banking business and slightly lower equity in the insurance business. The Pershing sale transaction also had a positive impact on core capital.
On the basis of the final local statutory accounts of Winterthur’s operating entities for 2002, which were completed in April 2003, Credit Suisse Group updated Winterthur’s consolidated EU solvency ratio effective December 31, 2002, to 142%. At year-end 2002, the local solvency ratios of Winterthur’s operating entities worldwide continued to exceed regulatory requirements: for the ten largest entities, the average local coverage was above 200% and the lowest ratio was 135% at year-end. The consolidated EU solvency ratio is a supplementary financial disclosure for Winterthur and has no impact on published financial statements and note disclosures, regulatory insurance filings, or the Group’s internal economic risk capital models. This update does not change the Group’s view regarding the capitalization of Winterthur.
Net new assets
Credit Suisse Financial Services reported net new assets of CHF 0.3 billion in the first quarter of 2003, with net inflows of CHF 1.5 billion at Private Banking and CHF 2.2 billion at Life & Pensions, offset by a net outflow of CHF 3.4 billion from Corporate & Retail Banking due to a shift from time deposit into transaction accounts, which do not qualify as assets under management. Credit Suisse First Boston reported a net asset outflow of CHF 3.8 billion in the first quarter of 2003, as CHF 1.5 billion of net new assets from Private Client Services were offset by a net outflow of CHF 5.2 billion from Credit Suisse Asset Management and CHF 0.1 billion from Institutional Securities. For Credit Suisse Group, an overall net asset outflow of CHF 3.5 billion was recorded in the first quarter of 2003, compared with a net asset outflow of CHF 6.6 billion recorded in the fourth quarter of 2002. The Group’s total assets under managem ent stood at CHF 1,160.5 billion as of March 31, 2003, corresponding to a decline of 2.9% versus December 31, 2002.
Operating income and expenses
The Group’s operating income was CHF 7.0 billion in the first quarter of 2003, up 10% on the previous quarter but down 16% on the first quarter of 2002. Credit Suisse Financial Services reported operating income of CHF 3.4 billion in the first quarter of 2003, a decrease of 4% versus the previous quarter and an increase of 3% versus the first quarter of 2002. At Private Banking, operating income decreased 2% versus the previous quarter due to investor passivity and a reduced asset base. Corporate & Retail Banking posted a 3% increase in operating income quarter-on-quarter, mainly driven by higher transaction-based and trading income. At Credit Suisse First Boston, first quarter 2003 operating income increased 24% on a US dollar basis versus the previous quarter to USD 2.9 billion (CHF 4.0 billion), mainly reflecting a significant increase in revenue in the Fixed Income business within Institutional Securities from USD 587 millio n (CHF 806 million) to USD 1.4 billion (CHF 1.9 billion). Compared to the first quarter of 2002, Credit Suisse First Boston’s operating income decreased 11%, reflecting weak market conditions in the mergers and acquisitions and equity new issuance markets. The increase in operating income versus the fourth quarter of 2002 was partially offset by a decline in operating income at CSFB Financial Services of 37% versus the previous quarter, principally related to the sale of Pershing. Excluding Pershing, operating income of CSFB Financial Services was flat compared with the fourth quarter of 2002 and decreased 5% compared to the first quarter of 2002.
The Group’s operating expenses decreased 2% quarter-on-quarter to CHF 5.0 billion, and were down 23% on the first quarter of 2002. At Credit Suisse Financial Services, first quarter operating expenses decreased 7% compared to the previous quarter and 5% versus the first quarter of 2002. At Credit Suisse First Boston, first quarter operating expenses increased 16% versus the previous quarter due to a rise in incentive compensation linked to improved performance and compared to an unusually low fourth quarter incentive compensation level. Compared to the first quarter of 2002, Credit Suisse First Boston’s operating expenses decreased 16%, reflecting headcount reductions and cost containment measures. For the first quarter of 2003, Credit Suisse First Boston’s other operating expenses were down 18% compared with the fourth quarter of 2002 and 15% compared with the first quarter of 2002.
Valuation adjustments, provisions and losses
Total valuation adjustments, provisions and losses were CHF 233 million in the first quarter of 2003 compared with CHF 2.4 billion in the fourth quarter of 2002, which included a charge of CHF 778 million in respect of an adjustment in the method of estimating inherent losses related to lending activities. In the first quarter of 2003, valuation adjustments, provisions and losses included a charge of CHF 32 million related to inherent loan loss risks. Compared to the first quarter of 2002, valuation adjustments, provisions and losses decreased 51%.
Outlook
Credit Suisse Group remains cautious in its outlook for 2003 given the continued challenging market environment and global uncertainty. The Group made progress towards its goal to return to profitability in 2003 but remains exposed to continued volatility in the financial markets.
| Overview of business unit results 1) | |||||||||||||||||||||||||
| Credit Suisse Financial Services | Credit Suisse First Boston | Adjust. incl. Corporate Center | Credit Suisse Group | ||||||||||||||||||||||
| in CHF m | 1Q2003 | 4Q2002 | 1Q2002 | 1Q2003 | 4Q2002 | 1Q2002 | 1Q2003 | 4Q2002 | 1Q2002 | 1Q2003 | 4Q2002 | 1Q2002 | |||||||||||||
| Operating income | 3,393 | 3,517 | 3,306 | 3,915 | 3,321 | 5,338 | (284) | (443) | (314) | 7,024 | 6,395 | 8,330 | |||||||||||||
| Personnel expenses | 1,369 | 1,408 | 1,443 | 2,177 | 1,896 | 3,216 | 93 | 160 | 178 | 3,639 | 3,464 | 4,837 | |||||||||||||
| Other operating expenses | 779 | 896 | 814 | 904 | 1,184 | 1,302 | (302) | (433) | (455) | 1,381 | 1,647 | 1,661 | |||||||||||||
| Operating expenses | 2,148 | 2,304 | 2,257 | 3,081 | 3,080 | 4,518 | (209) | (273) | (277) | 5,020 | 5,111 | 6,498 | |||||||||||||
| Gross operating profit | 1,245 | 1,213 | 1,049 | 834 | 241 | 820 | (75) | (170) | (37) | 2,004 | 1,284 | 1,832 | |||||||||||||
| Depreciation of non-current assets | 2) | 220 | 334 | 205 | 130 | 156 | 207 | 70 | 144 | 69 | 420 | 634 | 481 | ||||||||||||
| Amortization of acquired intangible assets and goodwill | 25 | 92 | 29 | 206 | 308 | 357 | 1 | 3 | (1) | 232 | 403 | 385 | |||||||||||||
| Valuation adjustments, provisions and losses | 81 | 105 | 99 | 176 | 1,977 | 338 | (24) | 342 | 34 | 233 | 2,424 | 471 | |||||||||||||
| Profit/(loss) before extraordinary items, cumulative effect of change in accounting principle and taxes | 919 | 682 | 716 | 322 | (2,200) | (82) | (122) | (659) | (139) | 1,119 | (2,177) | 495 | |||||||||||||
| Extraordinary income/(expenses), net | 7 | 24 | (3) | 0 | 220 | 0 | (56) | 125 | (2) | (49) | 369 | (5) | |||||||||||||
| Cumulative effect of change in accounting principle | 3) | – | 266 | – | – | 254 | – | – | 0 | – | – | 520 | – | ||||||||||||
| Taxes | 3) | (252) | (318) | (119) | (101) | 474 | 50 | (25) | 162 | (18) | (378) | 318 | (87) | ||||||||||||
| Net profit/(loss) before minority interests | 674 | 654 | 594 | 221 | (1,252) | (32) | (203) | (372) | (159) | 692 | (970) | 403 | |||||||||||||
| Minority interests | (8) | 51 | (2) | 0 | 0 | 0 | (32) | (31) | (33) | (40) | 20 | (35) | |||||||||||||
| Net profit/(loss) | 3) | 666 | 705 | 592 | 221 | (1,252) | (32) | (235) | (403) | (192) | 652 | (950) | 368 | ||||||||||||
| 1) The Group’s consolidated results are prepared in accordance with Swiss GAAP, while the Group’s segment reporting principles are applied to the presentation of segment results. The business unit results reflect the results of the separate segments comprising the respective business units as well as certain acquisition-related costs, exceptional items and cumulative effect of change in accounting principle that are not allocated to the segments. For a complete reconciliation of the business unit results to the Group’s consolidated results and a discussion of the material reconciling items, please refer to “Reconciliation of operating to consolidated results”. | |||||||||||||||||||||||||
| 2) Includes amortization of Present Value of Future Profits (PVFP) from the insurance business within Credit Suisse Financial Services. | |||||||||||||||||||||||||
| 3) In 4Q2002, Credit Suisse Group adopted a change in accounting principle relating to the recognition of deferred tax assets on net operating losses. The retroactive application of this change in accounting principle would have resulted in taxes for 4Q2002 and 1Q2002 for Credit Suisse Financial Services of CHF –635 m and CHF –85 m, respectively, for Credit Suisse First Boston of CHF 276 m and CHF 50 m, respectively, and for Credit Suisse Group of CHF –198 m and CHF –53 m, respectively. | |||||||||||||||||||||||||
| Assets under management/client assets | |||||||||||
| Change | |||||||||||
| in % from | |||||||||||
| in CHF bn | 31.03.03 | 31.12.02 | 31.12.02 | ||||||||
| Credit Suisse Financial Services | |||||||||||
| Private Banking | 1) | ||||||||||
| Assets under management | 457.0 | 465.7 | (1.9) | ||||||||
| of which discretionary | 118.2 | 121.5 | (2.7) | ||||||||
| Client assets | 486.3 | 494.8 | (1.7) | ||||||||
| Corporate & Retail Banking | 1) | ||||||||||
| Assets under management | 64.1 | 70.3 | (8.8) | ||||||||
| Client assets | 82.6 | 86.3 | (4.3) | ||||||||
| Life & Pensions | |||||||||||
| Assets under management (discretionary) | 111.7 | 110.8 | 0.8 | ||||||||
| Client assets | 111.7 | 110.8 | 0.8 | ||||||||
| Insurance | |||||||||||
| Assets under management (discretionary) | 31.0 | 30.7 | 1.0 | ||||||||
| Client assets | 31.0 | 30.7 | 1.0 | ||||||||
| Credit Suisse Financial Services | |||||||||||
| Assets under management | 663.8 | 677.5 | (2.0) | ||||||||
| of which discretionary | 1) | 262.1 | 264.2 | (0.8) | |||||||
| Client assets | 711.6 | 722.6 | (1.5) | ||||||||
| Credit Suisse First Boston | |||||||||||
| Institutional Securities | |||||||||||
| Assets under management | 30.8 | 31.3 | (1.6) | ||||||||
| of which Private Equity on behalf of clients (discretionary) | 20.8 | 20.9 | (0.5) | ||||||||
| Client assets | 79.2 | 83.9 | (5.6) | ||||||||
| CSFB Financial Services | |||||||||||
| Assets under management | 465.9 | 486.5 | (4.2) | ||||||||
| of which discretionary | 281.9 | 297.2 | (5.1) | ||||||||
| Client assets | 465.9 | 986.7 | (52.8) | ||||||||
| Credit Suisse First Boston | |||||||||||
| Assets under management | 496.7 | 517.8 | (4.1) | ||||||||
| of which discretionary | 309.9 | 325.5 | (4.8) | ||||||||
| Client assets | 545.1 | 1,070.6 | (49.1) | ||||||||
| Credit Suisse Group | |||||||||||
| Assets under management | 1,160.5 | 1,195.3 | (2.9) | ||||||||
| of which discretionary | 1) | 572.0 | 589.7 | (3.0) | |||||||
| Client assets | 1,256.7 | 1,793.2 | (29.9) | ||||||||
| 1) 2002 comparative figures have been restated to reflect the realignment of the private client business as of 01.01.2003. This entailed moving certain client segments in Switzerland from Private Banking to Corporate & Retail Banking as well as re-evaluating the balances of 2002 discretionary assets. | |||||||||||
| Net new assets | |||||||||||
| Change | Change | ||||||||||
| in % from | in % from | ||||||||||
| in CHF bn | 1Q2003 | 4Q2002 | 1Q2002 | 4Q2002 | 1Q2002 | ||||||
| Credit Suisse Financial Services | |||||||||||
| Private Banking | 1) | 1.5 | 0.9 | 9.2 | 66.7 | (83.7) | |||||
| Corporate & Retail Banking | 1) | (3.4) | (0.2) | (1.4) | – | 142.9 | |||||
| Life & Pensions | 2.2 | (1.3) | 3.0 | – | (26.7) | ||||||
| Credit Suisse Financial Services | 0.3 | (0.6) | 10.8 | – | (97.2) | ||||||
| Credit Suisse First Boston | |||||||||||
| Institutional Securities | (0.1) | – | 3.5 | – | – | ||||||
| CSFB Financial Services | (3.7) | (6.0) | (0.8) | (38.3) | 362.5 | ||||||
| Credit Suisse First Boston | (3.8) | (6.0) | 2.7 | (36.7) | – | ||||||
| Credit Suisse Group | (3.5) | (6.6) | 13.5 | (47.0) | – | ||||||
| 1) 2002 comparative figures have been restated to reflect the realignment of the private client business as of 01.01.2003. This entailed moving certain client segments in Switzerland from Private Banking to Corporate & Retail Banking. | |||||||||||
RISK MANAGEMENT
Credit Suisse Group’s overall position risk fell by 3% in the first quarter of 2003 compared to the previous quarter, predominantly due to further equity position reductions and lower credit risks. Credit Suisse First Boston’s average trading Value-at-Risk, or VaR, increased primarily as a consequence of higher interest rate positions. The Group’s credit risk exposures increased by 3% quarter-on-quarter.
Overall risk trends
Economic risk capital, or ERC, is an emerging best practice for measuring and reporting all quantifiable risks across a financial organization on a consistent and comprehensive basis. It is referred to as “economic” capital because it treats positions solely on an economic basis, irrespective of differences in accounting or regulatory treatment. Credit Suisse Group has established this tool over the last few years to achieve several objectives: to better assess the composition and trend of our risk portfolio; to improve risk control and limits; to allocate capital; to bettter assess our risk-bearing capacity in relation to financial resources; and to provide a benchmark for risk/return analysis by business. ERC is defined as the economic capital needed to remain solvent even under extreme market, business and operational conditions, based on conservative assumptions.
Credit Suisse Group distinguishes among three fundamental sources of risk. Position risk ERC measures the potential unexpected loss in economic value associated with the Group’s portfolio of positions over a 1-year horizon that is exceeded with a given, small probability (1% for daily risk management purposes; 0.03% for capital management purposes). Business risk ERC captures the risk related to the Group’s commission and fee-based activities by estimating the potential worst-case negative margin for these activities during a severe market downturn. Operational risk ERC represents the estimated worst-case loss resulting from inadequate or failed internal processes and systems, human error or external events.
Position risk ERC constitutes the most important risk category. Total 99%, 1-year position risk ERC was down 3% in the first quarter of 2003 compared with the previous quarter, due primarily to further equity position reductions and lower credit risks. At the end of the first quarter of 2003, 51% of the Group’s position risk ERC was with Credit Suisse First Boston, 45% with Credit Suisse Financial Services (of which 68% was with the insurance units and 32% was with the banking units) and 4% with the Corporate Center.
Trading risks
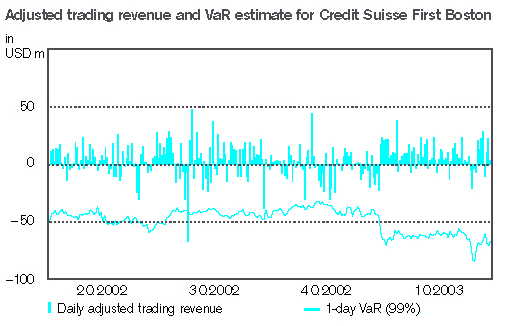
The average 1-day, 99% VaR at Credit Suisse First Boston in the first quarter of 2003 was USD 49.2 million, compared to USD 39.4 million in the fourth quarter of 2002. The increase was primarily attributable to an increase in interest rate positions. As shown in the backtesting chart, Credit Suisse First Boston had no backtesting exceptions in the first quarter of 2003. Over the last 12 months, Credit Suisse First Boston had one backtesting exception (on average, an accurate 1-day, 99% VaR model would have no more than 2.5 exceptions per annum).
Credit risk exposure
Credit-related balance sheet exposure increased 3% for Credit Suisse Group in the first quarter of 2003, as a slight decline in exposure at Credit Suisse Financial Services was offset by an increase in exposure at Credit Suisse First Boston.
Effective in the first quarter of 2003, loans held for sale are no longer reported as part of total due from banks and customers, gross with the related credit provisions reported separately, instead they are presented on a net lower of cost or market basis. This change resulted in a reclassification in the tables on page 10 which impacted both the loans, impaired loans and the valuation accounts as of March 31, 2003.
Impaired loans for Credit Suisse Group declined as of the end of the first quarter due to a reduction in impaired loans at both business units. Total non-performing loans declined 9% at Credit Suisse Financial Services. The decline in impaired loans at Credit Suisse First Boston is primarily attributable to the previously mentioned change in presentation and a decrease in non-performing loans. Coverage of non-performing loans increased slightly for both business units and Credit Suisse Group. Coverage of total impaired loans at Credit Suisse Group improved during the quarter, as coverage at Credit Suisse First Boston improved from 66.5% at December 31, 2002 to 71.6% at March 31, 2003, while coverage of impaired loans declined slightly at Credit Suisse Financial Services. Credit quality for the Group was largely unchanged from year-end 2002.
| Key Position Risk Trends | ||||||||||||
| Change in % from | Change Analysis: Brief Summary | |||||||||||
| in CHF m | 1Q2003 | 4Q2002 | 1Q2002 | 1Q2003 vs 4Q2002 | ||||||||
| Developed Market Fixed Income & Foreign Exchange ERC | 3,922 | 7% | (28%) | Reduced risk-offset between CSFB and Winterthur with respect to interest rate-sensitive positions | ||||||||
| Equity Investment ERC | 3,071 | (16%) | (65%) | Mostly due to lower equity exposures at Winterthur | ||||||||
| Swiss & Retail Lending ERC | 2,057 | (2%) | (3%) | Continued write-off of aged exposures, offsetting increase in default risk due to downgrades | ||||||||
| International Lending ERC | 3,455 | (10%) | (14%) | Reduced exposures and lower US dollar exchange rate | ||||||||
| Emerging Markets ERC | 1,755 | (11%) | (29%) | Exposure reductions in Brazil and counterparty rating upgrade | ||||||||
| Real Estate ERC & Structured Asset ERC | 1) | 4,284 | 1% | (9%) | No material change | |||||||
| Insurance Underwriting ERC | 1,019 | 24% | 15% | Due to refined insurance loss distribution modelling and assumed growth in volume | ||||||||
| Simple sum across risk categories | 19,563 | (4%) | (31%) | Lower Equity and Lending ERC | ||||||||
| Diversification Benefit | (6,465) | (5%) | (39%) | In line with overall risk reduction | ||||||||
| Total position risk ERC | 13,098 | (3%) | (26%) | Lower Equity and ERC | ||||||||
99%, 1-year position risk ERC, excluding foreign exchange translation risk. For an assessment of the total risk profile, operational risk ERC and business risk ERC have to be considered as well. For a more detailed description of the Group’s ERC model, please refer to our Annual Report 2001 and 2002, which are available on our website: www.credit-suisse.com. Note that prior period risk data have been restated for methodology changes. | ||||||||||||
| 1) This category comprises the real estate investments of Winterthur, Credit Suisse First Boston’s commercial real estate exposures, Credit Suisse First Boston’s residential real estate exposures, Credit Suisse First Boston’s asset-backed securities exposures as well as the real estate acquired at auction and real estate for own use in Switzerland. | ||||||||||||
| CSFB trading exposures (1-day, 99% VaR) | |||||
| in USD m | 1Q2003 | 4Q2002 | 3Q2002 | 2Q2002 | |
| Total VaR | |||||
| Period end | 54.5 | 41.3 | 38.9 | 59.3 | |
| Average | 49.2 | 39.4 | 43.7 | 46.4 | |
| Maximum | 76.3 | 46.5 | 57.4 | 59.3 | |
| Minimum | 39.4 | 31.9 | 37.6 | 36.8 | |
| in USD m | 31.03.03 | 31.12.02 | 30.09.02 | 30.06.02 | |
| VaR by risk type | |||||
| Interest rate | 56.9 | 48.3 | 59.3 | 54.7 | |
| Foreign exchange | 15.3 | 10.8 | 7.6 | 18.7 | |
| Equity | 17.6 | 10.1 | 12.1 | 16.5 | |
| Commodity | 0.8 | 1.0 | 1.2 | 0.5 | |
| Subtotal | 90.6 | 70.2 | 80.2 | 90.4 | |
| Diversification benefit | (36.1) | (28.9) | (41.3) | (31.1) | |
| Total | 54.5 | 41.3 | 38.9 | 59.3 | |
Credit Suisse First Boston computes these VaR estimates separately for each risk type and for the whole portfolio using the historical simulation methodology. Diversification benefit reflects the net difference between the sum of the 99% percentile loss for each risk type and for the total portfolio. | |||||
| Total credit risk exposure 1) | |||||||||||||
| Credit Suisse Financial Services | Credit Suisse First Boston | Credit Suisse Group | |||||||||||
| in CHF m | 31.03.03 | 31.12.02 | 31.03.03 | 31.12.02 | 31.03.03 | 31.12.02 | |||||||
| Due from banks | 2) | 29,889 | 32,752 | 56,851 | 44,016 | 57,569 | 39,469 | ||||||
| Due from customers and mortgages | 2) | 133,372 | 132,353 | 72,941 | 82,395 | 205,030 | 213,206 | ||||||
| Total due from banks and customers, gross | 2) | 163,261 | 165,105 | 129,792 | 126,411 | 262,599 | 252,675 | ||||||
| Contingent liabilities | 12,460 | 12,349 | 28,280 | 27,862 | 39,866 | 39,104 | |||||||
| Irrevocable commitments | 2,917 | 2,263 | 80,403 | 86,599 | 84,415 | 90,048 | |||||||
| Total banking products | 178,638 | 179,717 | 238,475 | 240,872 | 386,880 | 381,827 | |||||||
| Loans held for sale | 3) | 0 | – | 18,373 | – | 18,373 | – | ||||||
| Derivative instruments | 4) | 1,957 | 2,375 | 56,230 | 54,243 | 57,016 | 54,757 | ||||||
| Securities lending – banks | 0 | 0 | 37 | 0 | 37 | 0 | |||||||
| Securities lending – customers | 0 | 0 | 30 | 64 | 30 | 64 | |||||||
| Reverse repurchase agreements – banks | 2,052 | 2,270 | 157,862 | 158,544 | 156,312 | 156,397 | |||||||
| Reverse repurchase agreements – customers | 11,989 | 13,944 | 53,399 | 57,571 | 65,081 | 71,384 | |||||||
| Total traded products | 15,998 | 18,589 | 267,558 | 270,422 | 278,476 | 282,602 | |||||||
| Total credit risk exposure, gross | 194,636 | 198,306 | 524,406 | 511,294 | 683,729 | 664,429 | |||||||
| Loan valuation allowances and provisions | (3,820) | (4,092) | (3,271) | (3,817) | (7,092) | (7,911) | |||||||
| Total credit risk exposure, net | 190,816 | 194,214 | 521,135 | 507,477 | 676,637 | 656,518 | |||||||
| 1) Credit Suisse Financial Services/Credit Suisse First Boston reflect business unit amounts. Total consolidated Credit Suisse Group amounts include adjustments and Corporate Center. | |||||||||||||
| 2) Excluding loans held for sale, securities lending and reverse repurchase transactions. | |||||||||||||
| 3) Effective 1Q2003, loans held for sale are presented net of the related loan valuation allowances. | |||||||||||||
| 4) Positive replacement values considering netting agreements. | |||||||||||||
| Total loan portfolio exposure and allowances and provisions for credit risk 1) | |||||||||||||
| Credit Suisse Financial Services | Credit Suisse First Boston | Credit Suisse Group | |||||||||||
| in CHF m | 31.03.03 | 31.12.02 | 31.03.03 | 31.12.02 | 31.03.03 | 31.12.02 | |||||||
| Non-performing loans | 2,749 | 3,004 | 2,616 | 3,351 | 5,365 | 6,355 | |||||||
| Non-interest earning loans | 1,897 | 2,108 | 402 | 217 | 2,299 | 2,325 | |||||||
| Total non-performing loans | 4,646 | 5,112 | 3,018 | 3,568 | 7,664 | 8,680 | |||||||
| Restructured loans | 80 | 52 | 201 | 229 | 281 | 281 | |||||||
| Potential problem loans | 1,726 | 1,723 | 1,123 | 1,685 | 2,848 | 3,408 | |||||||
| Total other impaired loans | 1,806 | 1,775 | 1,324 | 1,914 | 3,129 | 3,689 | |||||||
| Total impaired loans | 6,452 | 6,887 | 4,342 | 5,482 | 10,793 | 12,369 | |||||||
| Total due from banks and customers, gross | 163,261 | 165,105 | 129,792 | 126,411 | 262,599 | 252,675 | |||||||
| Valuation allowances | 3,779 | 4,053 | 3,111 | 3,647 | 6,891 | 7,703 | |||||||
| of which on principal | 3,010 | 3,201 | 2,866 | 3,416 | 5,875 | 6,617 | |||||||
| of which on interest | 769 | 852 | 245 | 231 | 1,016 | 1,086 | |||||||
| Total due from banks and customers, net | 159,482 | 161,052 | 126,681 | 122,764 | 255,708 | 244,972 | |||||||
| Provisions for contingent liabilities and irrevocable commitments | 41 | 39 | 160 | 170 | 201 | 208 | |||||||
| Total valuation allowances and provisions | 3,820 | 4,092 | 3,271 | 3,817 | 7,092 | 7,911 | |||||||
| Ratios | |||||||||||||
| Valuation allowances as % of total non-performing loans | 81.3% | 79.3% | 103.1% | 102.2% | 89.9% | 88.7% | |||||||
| Valuation allowances as % of total impaired loans | 58.6% | 58.9% | 71.6% | 66.5% | 63.8% | 62.3% | |||||||
| 1) Credit Suisse Financial Services/Credit Suisse First Boston reflect business unit amounts. Total consolidated Credit Suisse Group amounts include adjustments and the Corporate Center. | |||||||||||||
REVIEW OF BUSINESS UNITS | CREDIT SUISSE FINANCIAL SERVICES


Credit Suisse Financial Services recorded a net profit of CHF 666 million and a net operating profit, excluding the amortization of acquired intangible assets and goodwill, of CHF 690 million in the first quarter of 2003. Winterthur achieved an improved operating performance through tariff increases, a selective underwriting policy and stronger investment results. Primarily as a result of lower operating expenses, Private Banking recorded a higher segment profit than in the fourth quarter of 2002. Corporate & Retail Banking increased its segment result considerably compared to a weak fourth quarter of 2002.
Credit Suisse Financial Services recorded a net profit of CHF 666 million in the first quarter of 2003, down 6% versus the fourth quarter of 2002 and up 13% versus the corresponding period in the previous year. Fourth quarter 2002 results benefited from the one-time cumulative effect of a change in accounting principle of CHF 266 million for periods prior to 2002. Net operating profit before the amortization of acquired intangible assets and goodwill for the first quarter of 2003 amounted to CHF 690 million. The net operating profit was positively impacted by the investment income in the insurance segments, which increased by CHF 1.1 billion to CHF 1.5 billion compared to the previous quarter.
The refocusing of the European initiative on Private Banking clients is progressing well and has already led to cost improvements. With regard to the realignment of the Winterthur organization, the merger of the two Corporate Centers has been completed and the management levels have been defined in the countries in which the life and non-life businesses are being merged.
Credit Suisse Financial Services made progress towards its goal to return to profitability in 2003 but remains exposed to continued volatility in the financial markets, particularly in Life & Pensions.
Private Banking
In the first quarter of 2003, Private Banking reported a segment profit of CHF 371 million, up 10% versus the previous quarter and down 39% versus the corresponding period in the previous year. Operating income decreased 2% versus the previous quarter to CHF 1.3 billion. The decrease in operating income of 21% versus the first quarter of 2002 was mainly attributable to lower transaction volumes in the securities business due to investor passivity and the market-driven lower asset base. Operating expenses decreased 7% compared to the previous quarter and 8% versus the first quarter of 2002. The gross margin stood at 113.8 bp in the first quarter of 2003, compared with 112.4 bp in the previous quarter and 126.4 bp in the first quarter of 2002.
Net new assets amounted to CHF 1.5 billion in the first quarter of 2003, compared to CHF 0.9 billion in the previous quarter. Assets under management decreased 1.9% versus year-end 2002 to CHF 457.0 billion, due to market performance and the foreign exchange impact.
In Europe, substantial progress was achieved in the refocusing of the European initiative on private banking clients, most significantly in Germany and Spain. In onshore Europe and in Asia, Private Banking achieved above-average growth of net new assets. To protect clients’ capital and improve risk-return profiles, Private Banking launched a number of innovative products, tailored to market conditions, as an alternative to direct investments in equities or fixed income products. In the second quarter of 2003, Private Banking is introducing a new advisory concept that will focus on in-depth client asset and liability management.
Corporate & Retail Banking
Corporate & Retail Banking posted a segment profit of CHF 124 million in the first quarter of 2003, up 158% versus the previous quarter and down 15% versus the corresponding period in the previous year. Operating income rose 3% quarter-on-quarter to CHF 734 million, due primarily to increased commission and trading income, which compensated for the lower interest income. In the first quarter of 2003, the net interest margin stood at 214 bp, down from 219 bp in the previous quarter. Compared with the first quarter of 2002, operating income decreased by 7%, mainly driven by lower transaction-based commission income and the lower interest rate environment.
Operating expenses decreased 14% versus the previous quarter to CHF 473 million, partly due to seasonality. The credit-related provisions recorded were CHF 24 million below the statistical valuation adjustments. In the first quarter of 2003, total impaired loans declined by CHF 397 million to CHF 6.1 billion as of March 31, 2003. The cost/income ratio stood at 67.4% in the first quarter of 2003, compared with 80.8% in the previous quarter. The return on average allocated capital increased quarter-on-quarter from 4.0% to 10.7%.
Assets under management stood at CHF 64.1 billion at the end of the first quarter of 2003, down 8.8% versus year-end 2002. The net asset outflow of CHF 3.4 billion in the first quarter of 2003 was attributable to shifts from time deposit accounts of corporate clients to transaction accounts. These transaction accounts do not qualify as assets under management. In the first quarter of 2003, Corporate & Retail Banking, together with Private Banking, achieved good growth in the Swiss private mortgage business.
Life & Pensions
In the first quarter 2003, Life & Pensions reported a segment profit of CHF 111 million, an increase of CHF 96 million versus the corresponding period in the previous year. Compared to the fourth quarter of 2002, segment profit increased CHF 18 million or 19%. This result was primarily driven by a reduction in administration costs and a positive investment performance.
In the first quarter of 2003, Life & Pensions reported a decrease in gross premiums written of 4%, or CHF 263 million, to CHF 6.5 billion compared to the corresponding period in the previous year. Adjusted for acquisitions, divestitures and exchange rate impacts, premium volume decreased by 2%. The first quarter decline was due both to Life & Pensions’ ongoing selective underwriting and strong reported single premium growth in Italy, the UK and Belgium in the first quarter of 2002. Net new assets in the first quarter of 2003 amounted to CHF 2.2 billion, compared to CHF 3.0 billion in the first quarter of 2002, reflecting lower premium volume.
Administration costs decreased 6% to CHF 322 million, compared to the first quarter of 2002, largely due to cost reduction measures. The total expense ratio in the first quarter of 2003 stood at 6.8%, compared to 6.4% in the corresponding period of the previous year, primarily due to the reduction in premium income and higher amortization of deferred acquisition costs (DAC), in line with the development of investment income.
Investment income increased CHF 429 million to CHF 1.2 billion in the first quarter of 2003, compared to the corresponding period in the previous year. The increase of CHF 888 million compared to the fourth quarter of 2002 partly reflects a decrease in impairments of CHF 481 million, to CHF 268 million, recorded in the first quarter of 2003. In the reporting period, the total return on invested assets amounted to 4.9%, compared with 3.2% in the first quarter of 2002. Current income thereof was 3.9%, whereas realized gains/losses and other income/expenses were 1.1%. The proportion of investments held in equities was 5% as of March 31, 2003, compared with 8% as of December 31, 2002.
Insurance
Insurance reported a segment profit of CHF 92 million in the first quarter of 2003, an increase of CHF 239 million compared to the corresponding period of the previous year. Compared to the fourth quarter of 2002, segment profit increased CHF 86 million. The strong recovery of the Insurance result in the first quarter of 2003 is mainly driven by a significant improvement in the underwriting result due to the continued implementation of tariff increases and a strict underwriting policy, as well as improvements in investment income, compared to the first quarter of 2002. This result was partially offset by charges of CHF 63 million after-tax for the realignment of the organization and the international business portfolio.
In the first quarter of 2003, Insurance’s net premiums earned increased CHF 227 million, or 6%, to CHF 4.0 billion compared to the corresponding period in the previous year. Adjusted for acquisitions, divestitures and exchange rate impacts, the increase was 13%, primarily due to tariff increases across all major markets.
Insurance improved its net underwriting result by CHF 137 million in the first quarter of 2003 versus the corresponding period of the previous year, resulting in a decrease in the combined ratio of 3.2 percentage points to 100.7% in the first quarter of 2003, compared to 103.9% in the first quarter of 2002. This improvement resulted mainly from a decrease in the claims ratio of 4.2 percentage points to 71.0% in the first quarter of 2003 versus the corresponding period in the previous year, reflecting improved pricing and continued streamlining of the portfolio. In addition, fewer large losses resulting from natural catastrophes were reported during the quarter.
In the first quarter of 2003, administration costs decreased by 6% to CHF 472 million versus the corresponding period in the previous year. The overall expense ratio increased 1.0 percentage point to 29.7% in the first quarter of 2003, compared to the corresponding period of the previous year, due to higher policy acquisition costs mainly related to premium growth and the effect of fully integrating the book of business acquired from Prudential plc.
Insurance reported an increase in net investment income of CHF 202 million in the first quarter of 2003, to CHF 289 million, versus the corresponding period in the previous year. Compared with the fourth quarter of 2002, net investment income increased by CHF 230 million. In the first quarter of 2003, total return on invested assets amounted to 3.5%, compared with 1.2% in the first quarter of 2002. Current income was 3.9%, whereas realized gains/losses and other income/expenses were -0.5%. The proportion of investments held in equities was 5% as of March 31, 2003, compared with 7% as of December 31, 2002.
| Credit Suisse Financial Services business unit income statement 1) | |||||||||||
| Change | Change | ||||||||||
| in % from | in % from | ||||||||||
| in CHF m | 1Q2003 | 4Q2002 | 1Q2002 | 4Q2002 | 1Q2002 | ||||||
| Operating income | 2) | 3,393 | 3,517 | 3,306 | (4) | 3 | |||||
| Personnel expenses | 1,369 | 1,405 | 1,443 | (3) | (5) | ||||||
| Other operating expenses | 779 | 897 | 814 | (13) | (4) | ||||||
| Operating expenses | 2,148 | 2,302 | 2,257 | (7) | (5) | ||||||
| Gross operating profit | 1,245 | 1,215 | 1,049 | 2 | 19 | ||||||
| Depreciation of non-current assets | 168 | 256 | 162 | (34) | 4 | ||||||
| Amortization of Present Value of Future Profits (PVFP) | 52 | 62 | 43 | (16) | 21 | ||||||
| Valuation adjustments, provisions and losses | 81 | 105 | 99 | (23) | (18) | ||||||
| Net operating profit before extraordinary and exceptional items, cumulative effect of change in accounting principle and taxes | 944 | 792 | 745 | 19 | 27 | ||||||
| Extraordinary income/(expenses), net | 7 | 24 | (3) | (71) | – | ||||||
| Taxes | 3) 4) | (253) | (332) | (120) | (24) | 111 | |||||
| Net operating profit before exceptional items, cumulative effect of change in accounting principle and minority interests | 698 | 484 | 622 | 44 | 12 | ||||||
| Amortization of acquired intangible assets and goodwill | (25) | (37) | (29) | (32) | (14) | ||||||
| Exceptional items | 0 | (73) | 0 | (100) | – | ||||||
| Tax impact | 1 | 14 | 1 | (93) | – | ||||||
| Cumulative effect of change in accounting principle | 3) | – | 266 | – | – | – | |||||
| Net profit before minority interests | 674 | 654 | 594 | 3 | 13 | ||||||
| Minority interests | (8) | 51 | (2) | – | 300 | ||||||
| Net profit | 666 | 705 | 592 | (6) | 13 | ||||||
| 1) The business unit results reflect the results of the separate segments comprising the business unit. Certain acquisition-related costs, including amortization of acquired intangible assets and goodwill, exceptional items and cumulative effect of change in accounting principle not allocated to the segments are included in the business unit results. For a complete reconciliation of the business unit results to the Group’s consolidated results and a discussion of the material reconciling items, please refer to “Reconciliation of operating to consolidated results”. | |||||||||||
| 2) For the purpose of the consolidated financial statements, operating income for the insurance business is defined as net premiums earned, less claims incurred and change in technical provisions and expenses for processing claims, less commissions, plus net investment income from the insurance business. | |||||||||||
| 3) In 4Q2002, Credit Suisse Group adopted a change in accounting principle relating to the recognition of deferred tax assets on net operating losses. The retroactive application of this change in accounting principle would have resulted in taxes for 4Q2002 and 1Q2002 of CHF –649 m and CHF –86 m, respectively. | |||||||||||
| 4) Excluding tax impact on amortization of acquired intangible assets and goodwill as well as exceptional items. | |||||||||||
| Reconciliation to net operating profit | ||||||||||||
| Change | Change | |||||||||||
| in % from | in % from | |||||||||||
| in CHF m | 1Q2003 | 4Q2002 | 1Q2002 | 4Q2002 | 1Q2002 | |||||||
| Net profit | 666 | 705 | 592 | (6) | 13 | |||||||
| Amortization of acquired intangible assets and goodwill | 25 | 37 | 29 | (32) | (14) | |||||||
| Exceptional items | 0 | 73 | 0 | (100) | – | |||||||
| Tax impact | (1) | (14) | (1) | (93) | – | |||||||
| Cumulative effect of change in accounting principle | – | (266) | – | – | – | |||||||
| Net operating profit | 690 | 535 | 620 | 29 | 11 | |||||||
| Credit Suisse Financial Services business unit key information | |||||||||||
| 1Q2003 | 4Q2002 | 1Q2002 | |||||||||
| Cost/income ratio | 1) | 69.8% | 75.0% | 74.5% | |||||||
| Cost/income ratio (operating) | 2) 3) | 68.3% | 72.7% | 73.2% | |||||||
| Cost/income ratio (operating), banking | 2) | 64.7% | 71.1% | 56.9% | |||||||
| Return on average allocated capital | 1) | 21.8% | 20.8% | 19.1% | |||||||
| Return on average allocated capital (operating) | 2) | 22.6% | 15.4% | 20.0% | |||||||
| Average allocated capital in CHF m | 12,369 | 12,600 | 12,431 | ||||||||
| Growth in assets under management | (2.0%) | (1.3%) | 1.0% | ||||||||
| of which net new assets | 0.0% | (0.1%) | 1.4% | ||||||||
| of which market movement and structural effects | (2.1%) | (1.3%) | – | ||||||||
| of which acquisitions/(divestitures) | – | 0.1% | (0.4%) | ||||||||
| of which discretionary | (0.3%) | (0.7%) | 0.7% | ||||||||
| 31.03.03 | 31.12.02 | ||||||||||
| Assets under management in CHF bn | 663.8 | 677.5 | |||||||||
| Number of employees | 52,871 | 53,755 | |||||||||
| 1) Based on the business unit results including certain acquisition-related costs, exceptional items and cumulative effect of change in accounting principle not allocated to the segments. Please refer to “Reconciliation of operating to consolidated results”. | |||||||||||
| 2) Based on the results of the separate segments comprising the business unit, which exclude certain acquisition-related costs, exceptional items and cumulative effect of change in accounting principle not allocated to the segments. Please refer to “Reconciliation of operating to consolidated results”. | |||||||||||
| 3) Excluding amortization of PVFP from the insurance business within Credit Suisse Financial Services. | |||||||||||
| Overview of business unit Credit Suisse Financial Services 1) | |||||||||||
| Credit | |||||||||||
| Corporate | Suisse | ||||||||||
| Private | & Retail | Life & | Financial | ||||||||
| 1Q2003, in CHF m | Banking | Banking | Pensions | Insurance | Services | ||||||
| Operating income | 2) | 1,310 | 734 | 622 | 727 | 3,393 | |||||
| Personnel expenses | 515 | 300 | 203 | 351 | 1,369 | ||||||
| Other operating expenses | 256 | 173 | 136 | 214 | 779 | ||||||
| Operating expenses | 771 | 473 | 339 | 565 | 2,148 | ||||||
| Gross operating profit | 539 | 261 | 283 | 162 | 1,245 | ||||||
| Depreciation of non-current assets | 57 | 22 | 47 | 42 | 168 | ||||||
| Amortization of Present Value of Future Profits (PVFP) | – | – | 51 | 1 | 52 | ||||||
| Valuation adjustments, provisions and losses | 4 | 77 | – | – | 81 | ||||||
| Net operating profit before extraordinary items and taxes | 478 | 162 | 185 | 119 | 944 | ||||||
| Extraordinary income/(expenses), net | 7 | 0 | 0 | 0 | 7 | ||||||
| Taxes | 3) | (114) | (38) | (74) | (27) | (253) | |||||
| Net operating profit before minority interests | 371 | 124 | 111 | 92 | 698 | ||||||
| Amortization of acquired intangible assets and goodwill | (25) | ||||||||||
| Tax impact | 1 | ||||||||||
| Net profit before minority interests | 674 | ||||||||||
| Minority interests | (8) | ||||||||||
| Net profit | 666 | ||||||||||
| Average allocated capital | 4) | 2,261 | 4,656 | 5,452 | 12,369 | ||||||
| 1) The business unit results reflect the results of the separate segments comprising the business unit. Certain acquisition-related costs, including amortization of acquired intangible assets and goodwill not allocated to the segments are included in the business unit results. For a complete reconciliation of the business unit results to the Group’s consolidated results and a discussion of the material reconciling items, please refer to “Reconciliation of operating to consolidated results”. | |||||||||||
| 2) Operating income for the insurance business is defined as net premiums earned, less claims incurred and change in technical provisions and expenses for processing claims, less commissions, plus net investment income from the insurance business. | |||||||||||
| 3) Excluding tax impact on amortization of acquired intangible assets and goodwill. | |||||||||||
| 4) Life & Pensions and Insurance segments amount represents the average shareholders' equity of “Winterthur” Swiss Insurance Company. | |||||||||||
| Private Banking income statement 1) | |||||||||||
| Change | Change | ||||||||||
| in % from | in % from | ||||||||||
| in CHF m | 1Q2003 | 4Q2002 | 1Q2002 | 4Q2002 | 1Q2002 | ||||||
| Net interest income | 310 | 311 | 326 | 0 | (5) | ||||||
| Net commission and service fee income | 889 | 901 | 1,183 | (1) | (25) | ||||||
| Net trading income | 102 | 114 | 145 | (11) | (30) | ||||||
| Other ordinary income | 9 | 13 | 6 | (31) | 50 | ||||||
| Operating income | 1,310 | 1,339 | 1,660 | (2) | (21) | ||||||
| Personnel expenses | 515 | 502 | 553 | 3 | (7) | ||||||
| Other operating expenses | 256 | 323 | 283 | (21) | (10) | ||||||
| Operating expenses | 771 | 825 | 836 | (7) | (8) | ||||||
| Gross operating profit | 539 | 514 | 824 | 5 | (35) | ||||||
| Depreciation of non-current assets | 57 | 58 | 49 | (2) | 16 | ||||||
| Valuation adjustments, provisions and losses | 2) | 4 | 27 | 11 | (85) | (64) | |||||
| Net operating profit before extraordinary and exceptional items, cumulative effect of change in accounting principle and taxes | 478 | 429 | 764 | 11 | (37) | ||||||
| Extraordinary income/(expenses), net | 7 | 23 | (2) | (70) | – | ||||||
| Taxes | 3) | (114) | (115) | (154) | (1) | (26) | |||||
| Net operating profit before exceptional items, cumulative effect of change in accounting principle and minority interests (segment result) | 371 | 337 | 608 | 10 | (39) | ||||||
| Increased/(decreased) credit-related valuation adjustments | 2) | 0 | (9) | 2 | |||||||
| 1) 2002 comparative figures have been restated to reflect the realignment of the private client business as of 01.01.2003. This entailed moving certain client segments in Switzerland from Private Banking to Corporate & Retail Banking. Certain acquisition-related costs, including amortization of acquired intangible assets and goodwill, exceptional items and cumulative effect of change in accounting principle not allocated to the segments are included in the business unit results. | |||||||||||
| 2) Increased/(decreased) valuation adjustments taken at Group level resulting from the difference between the statistical and actual credit provisions. | |||||||||||
| 3) In 4Q2002, Credit Suisse Group adopted a change in accounting principle relating to the recognition of deferred tax assets on net operating losses. The retroactive application of this change in accounting principle would have resulted in taxes for 4Q2002 and 1Q2002 of CHF –117 m and CHF –140 m, respectively. | |||||||||||
| Private Banking balance sheet information 1) | |||||||||||
| Change | |||||||||||
| in % from | |||||||||||
| in CHF m | 31.03.03 | 31.12.02 | 31.12.02 | ||||||||
| Total assets | 152,910 | 155,363 | (2) | ||||||||
| Due from customers | 33,493 | 35,580 | (6) | ||||||||
| Mortgages | 23,603 | 22,935 | 3 | ||||||||
| 1) 2002 comparative figures have been restated to reflect the realignment of the private client business as of 01.01.2003. This entailed moving certain client segments in Switzerland from Private Banking to Corporate & Retail Banking. | |||||||||||
| Private Banking key information 1) | |||||||||||
| 1Q2003 | 4Q2002 | 1Q2002 | |||||||||
| Cost/income ratio | 2) | 63.2% | 65.9% | 53.3% | |||||||
| Average allocated capital in CHF m | 2,261 | 2,304 | 2,340 | ||||||||
| Pre-tax margin | 2) | 37.0% | 33.8% | 45.9% | |||||||
| Fee income/operating income | 67.9% | 67.3% | 71.3% | ||||||||
| Net new assets in CHF bn | 1.5 | 0.9 | 9.2 | ||||||||
| Growth in assets under management | (1.9%) | (1.3%) | 2.3% | ||||||||
| of which net new assets | 0.3% | 0.2% | 1.8% | ||||||||
| of which market movement and structural effects | (2.2%) | (1.6%) | 0.5% | ||||||||
| of which acquisitions/(divestitures) | – | 0.1% | – | ||||||||
| Net margin | 3) | 32.2 bp | 28.3 bp | 46.3 bp | |||||||
| Gross margin | 4) | 113.8 bp | 112.4 bp | 126.4 bp | |||||||
| 31.03.03 | 31.12.02 | ||||||||||
| Assets under management in CHF bn | 457.0 | 465.7 | |||||||||
| Number of employees | 12,249 | 12,587 | |||||||||
| 1) 2002 comparative figures have been restated to reflect the realignment of the private client business as of 01.01.2003. This entailed moving certain client segments in Switzerland from Private Banking to Corporate & Retail Banking. | |||||||||||
| 2) Based on the segment results, which exclude certain acquisition-related costs, exceptional items and cumulative effect of change in accounting principle not allocated to the segment. | |||||||||||
| 3) Net operating profit before exceptional items, cumulative effect of change in accounting principle and minority interests (segment result)/average assets under management. | |||||||||||
| 4) Operating income/average assets under management. | |||||||||||
| Corporate & Retail Banking income statement 1) | |||||||||||
| Change | Change | ||||||||||
| in % from | in % from | ||||||||||
| in CHF m | 1Q2003 | 4Q2002 | 1Q2002 | 4Q2002 | 1Q2002 | ||||||
| Net interest income | 502 | 521 | 540 | (4) | (7) | ||||||
| Net commission and service fee income | 149 | 131 | 172 | 14 | (13) | ||||||
| Net trading income | 69 | 60 | 63 | 15 | 10 | ||||||
| Other ordinary income | 14 | 1 | 15 | – | (7) | ||||||
| Operating income | 734 | 713 | 790 | 3 | (7) | ||||||
| Personnel expenses | 300 | 297 | 294 | 1 | 2 | ||||||
| Other operating expenses | 173 | 250 | 194 | (31) | (11) | ||||||
| Operating expenses | 473 | 547 | 488 | (14) | (3) | ||||||
| Gross operating profit | 261 | 166 | 302 | 57 | (14) | ||||||
| Depreciation of non-current assets | 22 | 29 | 22 | (24) | 0 | ||||||
| Valuation adjustments, provisions and losses | 2) | 77 | 78 | 88 | (1) | (13) | |||||
| Net operating profit before extraordinary items, cumulative effect of change in accounting principle and taxes | 162 | 59 | 192 | 175 | (16) | ||||||
| Extraordinary income/(expenses), net | 0 | 1 | (1) | (100) | (100) | ||||||
| Taxes | 3) | (38) | (12) | (45) | 217 | (16) | |||||
| Net operating profit before cumulative effect of change in accounting principle and minority interests (segment result) | 124 | 48 | 146 | 158 | (15) | ||||||
| Increased/(decreased) credit-related valuation adjustments | 2) | (24) | 94 | (6) | |||||||
| 1) 2002 comparative figures have been restated to reflect the realignment of the private client business as of 01.01.2003. This entailed moving certain client segments in Switzerland from Private Banking to Corporate & Retail Banking. Certain acquisition-related costs, including amortization of acquired intangible assets and goodwill, not allocated to the segments are included in the business unit results. | |||||||||||
| 2) Increased/(decreased) valuation adjustments taken at Group level resulting from the difference between the statistical and actual credit provisions. | |||||||||||
| 3) In 4Q2002, Credit Suisse Group adopted a change in accounting principle relating to the recognition of deferred tax assets on net operating losses. The retroactive application of this change in accounting principle would not have had an impact on the taxes reported for 4Q2002 and 1Q2002. | |||||||||||
| Corporate & Retail Banking balance sheet information 1) | |||||||||||
| Change | |||||||||||
| in % from | |||||||||||
| in CHF m | 31.03.03 | 31.12.02 | 31.12.02 | ||||||||
| Total assets | 93,104 | 94,203 | (1) | ||||||||
| Due from customers | 26,952 | 27,179 | (1) | ||||||||
| Mortgages | 57,927 | 57,165 | 1 | ||||||||
| Due to customers in savings and investment deposits | 27,830 | 27,081 | 3 | ||||||||
| Due to customers, other | 27,561 | 27,509 | 0 | ||||||||
| 1) 2002 comparative figures have been restated to reflect the realignment of the private client business as of 01.01.2003. This entailed moving certain client segments in Switzerland from Private Banking to Corporate & Retail Banking. | |||||||||||
| Corporate & Retail Banking key information 1) | |||||||||||
| 1Q2003 | 4Q2002 | 1Q2002 | |||||||||
| Cost/income ratio | 2) | 67.4% | 80.8% | 64.6% | |||||||
| Return on average allocated capital | 2) | 10.7% | 4.0% | 11.4% | |||||||
| Average allocated capital in CHF m | 4,656 | 4,815 | 5,116 | ||||||||
| Pre-tax margin | 2) | 22.1% | 8.4% | 24.2% | |||||||
| Personnel expenses/operating income | 40.9% | 41.7% | 37.2% | ||||||||
| Net interest margin | 214 bp | 219 bp | 231 bp | ||||||||
| Loan growth | 0.6% | (1.7%) | 2.3% | ||||||||
| Net new assets in CHF bn | (3.4) | (0.2) | (1.4) | ||||||||
| 31.03.03 | 31.12.02 | ||||||||||
| Deposit/loan ratio | 65.3% | 64.7% | |||||||||
| Assets under management in CHF bn | 64.1 | 70.3 | |||||||||
| Number of employees | 8,929 | 9,038 | |||||||||
| Number of branches | 221 | 223 | |||||||||
| 1) 2002 comparative figures have been restated to reflect the realignment of the private client business as of 01.01.2003. This entailed moving certain client segments in Switzerland from Private Banking to Corporate & Retail Banking. | |||||||||||
| 2) Based on the segment results, which exclude certain acquisition-related costs not allocated to the segment. | |||||||||||
| Life & Pensions income statement 1) | |||||||||||
| Change | Change | ||||||||||
| in % from | in % from | ||||||||||
| in CHF m | 1Q2003 | 4Q2002 | 1Q2002 | 4Q2002 | 1Q2002 | ||||||
| Gross premiums written | 6,499 | 4,218 | 6,762 | 54 | (4) | ||||||
| Reinsurance ceded | (23) | (14) | (96) | 64 | (76) | ||||||
| Net premiums written | 6,476 | 4,204 | 6,666 | 54 | (3) | ||||||
| Change in provision for unearned premiums | (10) | 29 | (39) | – | (74) | ||||||
| Net premiums earned | 6,466 | 4,233 | 6,627 | 53 | (2) | ||||||
| Death and other benefits incurred | (4,100) | (5,373) | (3,813) | (24) | 8 | ||||||
| Change in provision for future policyholder benefits (technical) | (2,871) | 1,116 | (3,289) | – | (13) | ||||||
| Change in provision for future policyholder benefits (separate account) | 2) | 211 | 80 | (141) | 164 | – | |||||
| Dividends to policyholders incurred | (24) | 738 | 135 | – | – | ||||||
| Policy acquisition costs (including change in DAC/PVFP) | (120) | (160) | (80) | (25) | 50 | ||||||
| Administration costs | (322) | (409) | (344) | (21) | (6) | ||||||
| Investment income general account | 1,221 | 333 | 792 | 267 | 54 | ||||||
| Investment income separate account | 2) | (211) | (80) | 141 | 164 | – | |||||
| Interest received and paid | (19) | (39) | (27) | (51) | (30) | ||||||
| Interest on bonuses credited to policyholders | (33) | (41) | (29) | (20) | 14 | ||||||
| Other income/(expenses) | (13) | (24) | 6 | (46) | – | ||||||
| Net operating profit/(loss) before cumulative effect of change in accounting principle and taxes | 185 | 374 | (22) | (51) | – | ||||||
| Taxes | 3) | (74) | (281) | 37 | (74) | – | |||||
| Net operating profit before cumulative effect of change in accounting principle and minority interests (segment result) | 111 | 93 | 15 | 19 | – | ||||||
| 1) The presentation of segment results differs from the presentation of the Group's consolidated results as it reflects the way the insurance business is managed, which is in line with peers in the insurance industry. Certain acquisition-related costs, including amortization of acquired intangible assets and goodwill and cumulative effect of change in accounting principle not allocated to the segments are included in the business unit results. | |||||||||||
| 2) This represents the market impact for separate account (or unit-linked) business, where the investment risk is borne by the policyholder. | |||||||||||
| 3) In 4Q2002, Credit Suisse Group adopted a change in accounting principle relating to the recognition of deferred tax assets on net operating losses. The retroactive application of this change in accounting principle would have resulted in taxes for 4Q2002 and 1Q2002 of CHF –540 m and CHF 63 m, respectively. | |||||||||||
| Life & Pensions key information | |||||||||||
| 1Q2003 | 4Q2002 | 1Q2002 | |||||||||
| Expense ratio | 1) | 6.8% | 13.4% | 6.4% | |||||||
| Growth in gross premiums written | (3.9%) | (13.9%) | 9.3% | ||||||||
| Return on invested assets (excluding separate account business) | |||||||||||
| Current income | 3.9% | 3.6% | 4.0% | ||||||||
| Realized gains/losses and other income/expenses | 1.1% | (2.5%) | (0.8%) | ||||||||
| Total return on invested assets | 2) | 4.9% | 1.2% | 3.2% | |||||||
| Net new assets in CHF bn | 3) | 2.2 | (1.3) | 3.0 | |||||||
| Total sales in CHF m | 4) | 7,372 | 5,283 | 7,783 | |||||||
| 31.03.03 | 31.12.02 | ||||||||||
| Assets under management in CHF bn | 5) | 111.7 | 110.8 | ||||||||
| Technical provisions in CHF m | 108,490 | 105,939 | |||||||||
| Number of employees | 7,629 | 7,815 | |||||||||
| 1) Operating expenses (i.e. policy acquisition costs and administration costs)/net premiums earned. | |||||||||||
| 2) Total return on invested assets includes depreciation on real estate and investment expenses as well as investment income and realized gains and losses. | |||||||||||
| 3) Based on change in technical provisions for traditional business, adjusted for technical interests, net inflow of separate account business and change in off-balance sheet business such as funds. | |||||||||||
| 4) Includes gross premiums written and off-balance sheet sales. | |||||||||||
| 5) Based on savings-related provisions for policyholders plus off-balance sheet assets. | |||||||||||
| Insurance income statement 1) | |||||||||||
| Change | Change | ||||||||||
| in % from | in % from | ||||||||||
| in CHF m | 1Q2003 | 4Q2002 | 1Q2002 | 4Q2002 | 1Q2002 | ||||||
| Gross premiums written | 6,835 | 3,846 | 6,668 | 78 | 3 | ||||||
| Reinsurance ceded | (427) | (299) | (415) | 43 | 3 | ||||||
| Net premiums written | 6,408 | 3,547 | 6,253 | 81 | 2 | ||||||
| Change in provision for unearned premiums and in provision for future policy benefits (health) | (2,430) | 485 | (2,502) | – | (3) | ||||||
| Net premiums earned | 3,978 | 4,032 | 3,751 | (1) | 6 | ||||||
| Claims and annuities incurred, net | (2,826) | (3,034) | (2,819) | (7) | 0 | ||||||
| Dividends to policyholders incurred, net | (45) | 109 | (67) | – | (33) | ||||||
| Policy acquisition costs (including change in DAC/PVFP) | (710) | (647) | (574) | 10 | 24 | ||||||
| Administration costs | (472) | (481) | (503) | (2) | (6) | ||||||
| Underwriting result, net | (75) | (21) | (212) | 257 | (65) | ||||||
| Net investment income | 289 | 59 | 87 | 390 | 232 | ||||||
| Interest received and paid | (47) | (39) | (3) | 21 | – | ||||||
| Other income/(expenses), net | (48) | (69) | (61) | (30) | (21) | ||||||
| Net operating profit/(loss) before cumulative effect of change in accounting principle and taxes | 119 | (70) | (189) | – | – | ||||||
| Taxes | 2) | (27) | 76 | 42 | – | – | |||||
| Net operating profit/(loss) before cumulative effect of change in accounting principle and minority interests (segment result) | 92 | 6 | (147) | – | – | ||||||
| 1) The presentation of segment results differs from the presentation of the Group's consolidated results as it reflects the way the insurance business is managed, which is in line with peers in the insurance industry. Certain acquisition-related costs, including amortization of acquired intangible assets and goodwill and cumulative effect of change in accounting principle not allocated to the segments are included in the business unit results. | |||||||||||
| 2) In 4Q2002, Credit Suisse Group adopted a change in accounting principle relating to the recognition of deferred tax assets on net operating losses. The retroactive application of this change in accounting principle would have resulted in taxes for 4Q2002 and 1Q2002 of CHF 20 m and CHF 36 m, respectively. | |||||||||||
| Insurance key information | |||||||||||
| 1Q2003 | 4Q2002 | 1Q2002 | |||||||||
| Combined ratio (excluding dividends to policyholders) | 100.7% | 103.2% | 103.9% | ||||||||
| Claims ratio | 1) | 71.0% | 75.2% | 75.2% | |||||||
| Expense ratio | 2) | 29.7% | 28.0% | 28.7% | |||||||
| Return on invested assets | |||||||||||
| Current income | 3.9% | 3.9% | 3.9% | ||||||||
| Realized gains/losses and other income/expenses | (0.5%) | (3.4%) | (2.7%) | ||||||||
| Total return on invested assets | 3) | 3.5% | 0.5% | 1.2% | |||||||
| 31.03.03 | 31.12.02 | ||||||||||
| Assets under management in CHF bn | 31.0 | 30.7 | |||||||||
| Technical provisions in CHF m | 31,429 | 28,745 | |||||||||
| Number of employees | 24,064 | 24,315 | |||||||||
| 1) Claims and annuities incurred, net/net premiums earned. | |||||||||||
| 2) Operating expenses (i.e. policy acquisition costs and administration costs)/net premiums earned. | |||||||||||
| 3) Total return on invested assets includes depreciation on real estate and investment expenses as well as investment income and realized gains and losses. | |||||||||||
REVIEW OF BUSINESS UNITS | CREDIT SUISSE FIRST BOSTON


Credit Suisse First Boston reported a net profit of USD 161 million (CHF 221 million) in the first quarter of 2003, compared with a net loss of USD 811 million (CHF 1.3 billion) in the fourth quarter of 2002 and a net loss of USD 19 million (CHF 32 million) in the first quarter of 2002. Excluding the amortization of acquired intangible assets and goodwill, and, for the fourth quarter 2002, exceptional items and the cumulative effect of a change in accounting principle, net operating profit in the first quarter of 2003 was USD 292 million (CHF 400 million), compared with a net operating profit of USD 11 million (CHF 15 million) in the fourth quarter of 2002 and a net operating profit of USD 155 million (CHF 259 million) in the first quarter of 2002.
First quarter 2003 operating income increased 24% compared with the fourth quarter of 2002 to USD 2.9 billion (CHF 4.0 billion), primarily as a result of a 39% increase in the operating income of the Institutional Securities segment. Compared with the first quarter of 2002, Credit Suisse First Boston’s operating income decreased 11%, with the Institutional Securities segment down 5%, reflecting challenging conditions in the mergers and acquisitions and equity new issuance markets. Excluding Pershing, operating income increased 34% compared with the fourth quarter of 2002 and declined 5% compared with the first quarter of 2002.
For the first quarter of 2003, Pershing’s net result of USD 15 million (CHF 21 million) was reported within the operating income of the CSFB Financial Services segment. Pershing’s fourth and first quarter 2002 operating income was USD 195 million (CHF 284 million) and USD 231 million (CHF 388 million), respectively. The fourth and first quarter of 2002 operating expenses for Pershing were USD 156 million (CHF 229 million) and USD 169 million (CHF 284 million), respectively. The sale of Pershing to The Bank of New York Company, Inc. closed on May 1, 2003.
Cost control continues to be a priority, and Credit Suisse First Boston significantly improved its pre-tax margin in the first quarter of 2003 compared with the fourth and first quarter of 2002. Excluding Pershing, operating expenses increased 27% on a rise in incentive compensation linked to improved performance, compared with an unusually low fourth quarter of 2002. Compared to the first quarter of 2002, and excluding Pershing, operating expenses declined 10%, due to a 12% reduction in headcount and cost containment measures. Credit Suisse First Boston is continuing to take measures to bring costs in line with operating income.
First quarter 2003 valuation adjustments, provisions and losses of USD 128 million (CHF 176 million) decreased 81% and 37%, respectively, compared with the fourth and first quarter of 2002. The first quarter of 2003 included a charge of USD 22 million (CHF 30 million) for credit provisions related to the risk of loss inherent in the portfolio of non-impaired loans and commitments compared with a similar charge of USD 340 million (CHF 530 million) in the fourth quarter of 2002 related to a change in estimate for the inherent loss in this portfolio. In the fourth quarter of 2002, Credit Suisse Group released a portion of its reserve for general banking risks, allocating USD 245 million (CHF 382 million) of this release to Credit Suisse First Boston to offset the after-tax impact of this change in estimate of the inherent loan loss. This release was reported as extraordinary income in the Group's consolidated financial statements. Excluding the provision for non-impaired loans and commitments, valuation adjustments, provisions and losses in the first quarter of 2003 declined 66% compared with the fourth quarter of 2002 and 47% compared with the first quarter of 2002. In line with a lower level of corporate credit provisions, impaired loans at the end of the first quarter of 2003 declined 6% on a US dollar basis compared to December 31, 2002, as a result of the impact of held for sale real estate loans presented on the basis of lower of cost or market net of related credit provisions, which, effective March 31, 2003, were no longer reported within the impaired loan exposure. Real estate loans of USD 541 million (CHF 752 million) were included in the impaired loan exposure as of December 31, 2002.
The fourth quarter of 2002 included pre-tax exceptional items of USD 890 million (CHF 1.4 billion), or USD 813 million (CHF 1.3 billion) after tax, consisting of a loss related to the sale of Pershing, a charge related to the agreement in principle with US regulators involving research analyst independence and the allocation of IPO shares to corporate executive officers (a settlement of which was recently finalized), a provision for private litigation involving research analyst independence, certain IPO allocation practices, Enron and other related litigation, and a charge related to a cost reduction program. Additionally, the fourth quarter of 2002 reflected the positive cumulative effect of a change in accounting principle for periods prior to 2002 of USD 162 million (CHF 254 million) relating to the recognition of deferred tax assets on net operating losses.
Assets under management, including private equity, totaled USD 364.4 billion (CHF 496.7 billion) as of March 31, 2003, down 2.2% on a US dollar basis from December 31, 2002, primarily due to market depreciation. Discretionary assets under management as of March 31, 2003, totaled USD 227.3 billion (CHF 309.9 billion), a decrease of 2.9% on a US dollar basis from December 31, 2002. Advisory assets under management as of March 31, 2003, totaled USD 137.1 billion (CHF 186.8 billion), a decrease of 0.9% on a US dollar basis from December 31, 2002.
Institutional Securities
The Institutional Securities segment reported a segment profit of USD 348 million (CHF 476 million) in the first quarter of 2003, compared with USD 63 million (CHF 88 million) in the fourth quarter of 2002 and USD 218 million (CHF 367 million) in the first quarter of 2002. First quarter operating income of USD 2.6 billion (CHF 3.6 billion) increased 39% compared with the fourth quarter of 2002. The increase reflected improved results in the Fixed Income division and lower write-downs related to the non-continuing businesses in the Other division. This increase was partially offset by a decline in Investment Banking’s operating income, due, in part, to the inclusion of a gain in the fourth quarter 2002 operating income resulting from the sale of an investment in Swiss Re. Compared with the first quarter of 2002, operating income declined 5%. Both the Equity and Investment Banking divisions were adversely impacted by weak market condi tions. Operating expenses in the first quarter of 2003 increased 31% compared with the fourth quarter of 2002, reflecting the unusually low personnel expenses in the fourth quarter of 2002, and decreased 11% compared with the first quarter of 2002. First quarter 2003 valuation adjustments, provisions and losses were 83% and 44% lower than the fourth and first quarters of 2002, respectively.
For consistency, the results of certain legacy private equity investments, including investments in mature third-party leverage buyout funds which had been monitored and reported separately within the Investment Banking division, were formally transferred to the Other division in the first quarter of 2003. Accordingly, the operating income of the Investment Banking and Other divisions were reclassified for all periods presented to reflect management’s determination to report results from the non-continuing businesses in the Other division.
Fixed Income's operating income for the first quarter of 2003 increased 142% compared with the fourth quarter of 2002 to USD 1.4 billion (CHF 1.9 billion). The increase was primarily driven by secondary trading in the developed markets credit products business, the seasonal impact of increased customer flow and increased mortgage activity. Additionally, fourth quarter 2002 credit products results were adversely impacted by a write-down on notes issued by affiliates of National Century Financial Enterprises, Inc. First quarter 2003 increases were also recorded in interest rate derivatives, due to a favorable environment with a steep yield curve and increased volatility, and in the leveraged and bank finance business. First quarter 2003 operating income increased 12% compared with the first quarter of 2002, primarily due to an increase in the interest rate products business, particularly in the derivatives area, reflecting a favorable interest rate environment and increased client demand following the decline in the equity markets in early 2002.
First quarter 2003 operating income of the Equity division increased 7% compared with the fourth quarter of 2002 to USD 602 million (CHF 825 million). The increase was principally related to options and structured products derivatives transactions, which benefited from an increase in customer volume compared with relatively low demand during the fourth quarter of 2002. Convertible trading activity also increased in the first quarter of 2003 due to renewed investor interest. Partially offsetting these increases was a decline in the cash customer business, which was adversely impacted by declines in volume, general margin compression and a decrease in equity new issuance activity. Compared with the first quarter of 2002, operating income decreased 30% due to declines in the cash customer business, principally in the United States, for the reasons cited previously. Operating income from derivatives activity was in line with the first quarter of 2002. Despite the challenging market, rankings in research, sales and trading generally remained consistent o r improved.
Investment Banking’s first quarter 2003 operating income, which includes private equity, declined 42% versus the fourth quarter 2002 to USD 545 million (CHF 748 million). The decline was principally attributable to a gain reported in the fourth quarter of 2002 on the sale of an investment in Swiss Re of USD 309 million (CHF 473 million), with the remainder principally attributable to a decrease in equity new issuance revenue. Globally, equity new issuance activity in the reporting period declined 24% compared with the fourth quarter of 2002, but Credit Suisse First Boston continued to exhibit strength in the middle-market sector. Operating income from mergers and acquisitions was comparable to the fourth quarter of 2002, despite a 19% decline in global merger and acquisition industry volume. Results from the leverage and bank finance business benefited from a 60% increase in global high-yield new issuance activity and an increase in market share. High-yield new issuance market share increased from 12% for the fourt h quarter of 2002 to 22% for the first quarter of 2003, and Credit Suisse First Boston retained its number one ranking in global high-yield new issuances. First quarter 2003 operating income decreased 26% compared with the first quarter of 2002, which included a USD 110 million (CHF 185 million) gain on the sale of an investment in Swiss Re, reflecting mainly the impact of a decline in merger and acquisition and equity new issuance operating income. Industry-wide global new issuance activity declined 52% compared with the first quarter of 2002.
Active private equity investments net gains (both realized and unrealized gains and losses) were USD 30 million (CHF 41 million) in the first quarter of 2003, compared with net gains of USD 347 million (CHF 533 million) in the fourth quarter of 2002 and net gains of USD 55 million (CHF 92 million) in the first quarter of 2002, including gains from the sale of an investment in Swiss Re. Management and performance fees were USD 44 million (CHF 60 million) in the first quarter of 2003, compared with USD 50 million (CHF 73 million) in the fourth quarter of 2002 and USD 59 million (CHF 99 million) in the first quarter of 2002. The book value of the active private equity investments was USD 858 million (CHF 1.2 billion) and fair value was USD 902 million (CHF 1.2 billion) as of March 31, 2003.
First quarter 2003 operating income for the Other division was USD 47 million (CHF 64 million), compared with operating losses of USD 208 million (CHF 312 million) and USD 124 million (CHF 210 million) in the fourth and first quarters of 2002, respectively. The increase in operating income was principally related to fewer write-downs on the non-continuing businesses, which include real estate, distressed trading and private equity investments. The aggregate operating loss related to all non-continuing legacy businesses in the first quarter of 2003 was USD 42 million (CHF 57 million) compared with USD 272 million (CHF 401 million) and USD 202 million (CHF 339 million) in the fourth and first quarters of 2002, respectively. Credit Suisse First Boston continues to reduce the net exposure of the non-continuing portfolio as market conditions permit. As of March 31, 2003, the net exposure of the entire non-continuing portfolio, including unfunded commitments on the real estate portfolio, was USD 2.7 billion (CHF 3.7 billion), a decrease of USD 303 million (CHF 495 million) compared with December 31, 2002.
CSFB Financial Services
CSFB Financial Services reported a segment profit of USD 37 million (CHF 51 million) for the first quarter of 2003, a decline of 23% compared with the fourth quarter of 2002 and 47% compared with the first quarter of 2002. Operating income for the first quarter of 2003 was USD 304 million (CHF 416 million), down 37% and 43% from the fourth and first quarters of 2002, respectively, and operating expenses declined 41% and 44%, respectively. Excluding Pershing, operating income was flat compared with the fourth quarter of 2002 and decreased 5% compared with the first quarter of 2002.
Credit Suisse Asset Management’s operating income in the first quarter of 2003 was flat compared to the fourth quarter of 2002. Operating income compared with the first quarter of 2002 declined as a result of market depreciation and asset outflows. Assets under management decreased USD 5.3 billion (CHF 15.2 billion), or 1.8%, compared with December 31, 2002 to USD 291.7 billion (CHF 397.6 billion) due to market declines and a net USD 3.8 billion (CHF 5.2 billion) outflow of assets. Discretionary assets under management decreased USD 5.8 billion (CHF 13.4 billion) compared with December 31, 2002.
Private Client Services’ operating income for the first quarter of 2003 was flat compared with the fourth quarter of 2002 despite a 5.6% decrease in assets under management on a US dollar basis. Compared with the first quarter of 2002, operating income declined, reflecting the weak equity markets. Decreased customer debit balances adversely impacted net interest income and lower trading activity and assets under management resulted in decreased commission and service fee income. Customer debit balances averaged USD 539 million in the first quarter of 2003 compared with USD 637 million and USD 839 million in the fourth and first quarters of 2002, respectively. Total transactions in the first quarter of 2003 totaled 316,900, down from 325,700 and 393,400 in the fourth and first quarters of 2002, respectively. Private Client Services’ net new assets were USD 1.1 billion (CHF 1.5 billion) for the first quarter of 2003.
On a net basis, the first quarter 2003 after-tax operating results of Pershing decreased compared with the fourth and first quarters of 2002. During the first quarter of 2003, trades per day averaged 123,000 compared with 122,600 and 134,300 during the fourth and first quarters of 2002, respectively. In the first quarter of 2003, customer debit balances averaged USD 4.8 billion compared with USD 4.2 billion and USD 4.9 billion in the fourth and first quarters of 2002, respectively.
| Credit Suisse First Boston business unit income statement 1) | |||||||||||
| Change | Change | ||||||||||
| in % from | in % from | ||||||||||
| in USD m | 1Q2003 | 4Q2002 | 1Q2002 | 4Q2002 | 1Q2002 | ||||||
| Operating income | 2,920 | 2,361 | 3,277 | 24 | (11) | ||||||
| Personnel expenses | 1,509 | 1,068 | 1,808 | 41 | (17) | ||||||
| Other operating expenses | 660 | 802 | 775 | (18) | (15) | ||||||
| Operating expenses | 2,169 | 1,870 | 2,583 | 16 | (16) | ||||||
| Gross operating profit | 751 | 491 | 694 | 53 | 8 | ||||||
| Depreciation of non-current assets | 94 | 107 | 123 | (12) | (24) | ||||||
| Valuation adjustments, provisions and losses | 128 | 657 | 202 | (81) | (37) | ||||||
| Net operating profit/(loss) before extraordinary and exceptional items, acquisition-related costs, cumulative effect of change in accounting principle and taxes | 529 | (273) | 369 | – | 43 | ||||||
| Extraordinary income/(expenses), net | 0 | 246 | 0 | – | – | ||||||
| Taxes | 2) 3) | (144) | 138 | (81) | – | 78 | |||||
| Net operating profit before exceptional items, acquisition-related costs, cumulative effect of change in accounting principle and minority interests | 385 | 111 | 288 | 247 | 34 | ||||||
| Acquisition interest | (63) | (57) | (99) | 11 | (36) | ||||||
| Amortization of retention payments | (80) | (97) | (107) | (18) | (25) | ||||||
| Amortization of acquired intangible assets and goodwill | (151) | (209) | (213) | (28) | (29) | ||||||
| Exceptional items | 0 | (890) | 0 | (100) | – | ||||||
| Tax impact | 70 | 169 | 112 | (59) | (38) | ||||||
| Cumulative effect of change in accounting principle | 2) | – | 162 | – | – | – | |||||
| Net profit/(loss) before minority interests | 161 | (811) | (19) | – | – | ||||||
| Minority interests | 0 | 0 | 0 | – | – | ||||||
| Net profit/(loss) | 161 | (811) | (19) | – | – | ||||||
See page 22 for footnotes. | |||||||||||
| Reconciliation to net operating profit | |||||||||||
| Change | Change | ||||||||||
| in % from | in % from | ||||||||||
| in USD m | 1Q2003 | 4Q2002 | 1Q2002 | 4Q2002 | 1Q2002 | ||||||
| Net profit/(loss) | 161 | (811) | (19) | – | – | ||||||
| Amortization of acquired intangible assets and goodwill | 151 | 209 | 213 | (28) | (29) | ||||||
| Exceptional items | 0 | 890 | 0 | (100) | – | ||||||
| Tax impact | (20) | (115) | (39) | (83) | (49) | ||||||
| Cumulative effect of change in accounting principle | – | (162) | – | – | – | ||||||
| Net operating profit | 292 | 11 | 155 | – | 88 | ||||||
| Credit Suisse First Boston business unit income statement 1) | |||||||||||
| Change | Change | ||||||||||
| in % from | in % from | ||||||||||
| in CHF m | 1Q2003 | 4Q2002 | 1Q2002 | 4Q2002 | 1Q2002 | ||||||
| Operating income | 4,001 | 3,401 | 5,505 | 18 | (27) | ||||||
| Personnel expenses | 2,067 | 1,512 | 3,037 | 37 | (32) | ||||||
| Other operating expenses | 904 | 1,184 | 1,302 | (24) | (31) | ||||||
| Operating expenses | 2,971 | 2,696 | 4,339 | 10 | (32) | ||||||
| Gross operating profit | 1,030 | 705 | 1,166 | 46 | (12) | ||||||
| Depreciation of non-current assets | 130 | 156 | 207 | (17) | (37) | ||||||
| Valuation adjustments, provisions and losses | 176 | 993 | 338 | (82) | (48) | ||||||
| Net operating profit/(loss) before extraordinary and exceptional items, acquisition-related costs, cumulative effect of change in accounting principle and taxes | 724 | (444) | 621 | – | 17 | ||||||
| Extraordinary income/(expenses), net | 0 | 383 | 0 | (100) | – | ||||||
| Taxes | 2) 3) | (197) | 220 | (137) | – | 44 | |||||
| Net operating profit before exceptional items, acquisition-related costs, cumulative effect of change in accounting principle and minority interests | 527 | 159 | 484 | 231 | 9 | ||||||
| Acquisition interest | (86) | (80) | (167) | 8 | (49) | ||||||
| Amortization of retention payments | (110) | (142) | (179) | (23) | (39) | ||||||
| Amortization of acquired intangible assets and goodwill | (206) | (308) | (357) | (33) | (42) | ||||||
| Exceptional items | 0 | (1,389) | 0 | (100) | – | ||||||
| Tax impact | 96 | 254 | 187 | (62) | (49) | ||||||
| Cumulative effect of change in accounting principle | 2) | – | 254 | – | – | – | |||||
| Net profit/(loss) before minority interests | 221 | (1,252) | (32) | – | – | ||||||
| Minority interests | 0 | 0 | 0 | – | – | ||||||
| Net profit/(loss) | 221 | (1,252) | (32) | – | – | ||||||
| 1) The business unit results reflect the results of the separate segments comprising the business unit. Certain acquisition-related costs, including acquisition interest, amortization of retention payments and amortization of acquired intangible assets and goodwill, exceptional items and cumulative effect of change in accounting principle not allocated to the segments are included in the business unit results. Certain other items, including brokerage, execution and clearing expenses, contractor costs and expenses related to certain redeemable preferred securities classified as minority interests, have been reclassified in the segment and business unit results and are adjusted at the Corporate Center in accordance with Swiss GAAP and reflected in the Group’s consolidated results. For a complete reconciliation of the business unit results to the Group’s consolidated results and a discussion of the material reconciling items, please refer to “Reconciliation of operating to consolidated results”. | |||||||||||
| 2) In 4Q2002, Credit Suisse Group adopted a change in accounting principle relating to the recognition of deferred tax assets on net operating losses. The retroactive application of this change in accounting principle would have resulted in taxes of CHF 22 m (USD 14 m) for 4Q2002 and would not have had an impact on the taxes reported for 1Q2002. | |||||||||||
| 3) Excluding tax impact on acquisition-related costs as well as exceptional items. | |||||||||||
| Reconciliation to net operating profit | |||||||||||
| Change | Change | ||||||||||
| in % from | in % from | ||||||||||
| in CHF m | 1Q2003 | 4Q2002 | 1Q2002 | 4Q2002 | 1Q2002 | ||||||
| Net profit/(loss) | 221 | (1,252) | (32) | – | – | ||||||
| Amortization of acquired intangible assets and goodwill | 206 | 308 | 357 | (33) | (42) | ||||||
| Exceptional items | 0 | 1,389 | 0 | (100) | – | ||||||
| Tax impact | (27) | (176) | (66) | (85) | (59) | ||||||
| Cumulative effect of change in accounting principle | – | (254) | – | – | – | ||||||
| Net operating profit | 400 | 15 | 259 | – | 54 | ||||||
| Credit Suisse First Boston business unit key information | |||||||||||
| based on CHF amounts | 1Q2003 | 4Q2002 | 1Q2002 | ||||||||
| Cost/income ratio | 1) | 82.0% | 97.4% | 88.5% | |||||||
| Cost/income ratio (operating) | 2) | 77.5% | 83.9% | 82.6% | |||||||
| Return on average allocated capital | 1) | 6.9% | (36.1%) | (0.9%) | |||||||
| Return on average allocated capital (operating) | 2) | 12.4% | 0.4% | 6.9% | |||||||
| Average allocated capital in CHF m | 12,889 | 13,864 | 14,913 | ||||||||
| Pre-tax margin | 1) | 8.2% | (52.0%) | (1.5%) | |||||||
| Pre-tax margin (operating) | 2) | 13.2% | (8.3%) | 5.0% | |||||||
| Personnel expenses/operating income | 1) | 55.6% | 57.1% | 60.2% | |||||||
| Personnel expenses/operating income (operating) | 2) | 51.7% | 44.5% | 55.2% | |||||||
| 31.03.03 | 31.12.02 | ||||||||||
| Number of employees | 19,218 | 23,424 | |||||||||
| 1) Based on the business unit results including certain acquisition-related costs, exceptional items and cumulative effect of change in accounting principle not allocated to the segments. Please refer to “Reconciliation of operating to consolidated results”. | |||||||||||
| 2) Based on the results of the separate segments comprising the business unit, which exclude certain acquisition-related costs, exceptional items and cumulative effect of change in accounting principle not allocated to the segments. Please refer to “Reconciliation of operating to consolidated results”. | |||||||||||
| Overview of business unit Credit Suisse First Boston 1) | |||||||||||||
| in USD m | in CHF m | ||||||||||||
| CSFB | CSFB | ||||||||||||
| Institutional | Financial | Credit Suisse | Institutional | Financial | Credit Suisse | ||||||||
| 1Q2003 | Securities | Services | First Boston | Securities | Services | First Boston | |||||||
| Operating income | 2,616 | 304 | 2,920 | 3,585 | 416 | 4,001 | |||||||
| Personnel expenses | 1,361 | 148 | 1,509 | 1,864 | 203 | 2,067 | |||||||
| Other operating expenses | 574 | 86 | 660 | 787 | 117 | 904 | |||||||
| Operating expenses | 1,935 | 234 | 2,169 | 2,651 | 320 | 2,971 | |||||||
| Gross operating profit | 681 | 70 | 751 | 934 | 96 | 1,030 | |||||||
| Depreciation of non-current assets | 86 | 8 | 94 | 119 | 11 | 130 | |||||||
| Valuation adjustments, provisions and losses | 112 | 16 | 128 | 154 | 22 | 176 | |||||||
| Net operating profit before extraordinary items, acquisition-related costs and taxes | 483 | 46 | 529 | 661 | 63 | 724 | |||||||
| Extraordinary income/(expenses), net | 0 | 0 | 0 | 0 | 0 | 0 | |||||||
| Taxes | 2) | (135) | (9) | (144) | (185) | (12) | (197) | ||||||
| Net operating profit before acquisition-related costs | 348 | 37 | 385 | 476 | 51 | 527 | |||||||
| Acquisition interest | (63) | (86) | |||||||||||
| Amortization of retention payments | (80) | (110) | |||||||||||
| Amortization of acquired intangible assets and goodwill | (151) | (206) | |||||||||||
| Tax impact | 70 | 96 | |||||||||||
| Net profit | 161 | 221 | |||||||||||
| Average allocated capital | 9,092 | 433 | 9,360 | 12,519 | 595 | 12,889 | |||||||
| 1) The business unit results reflect the results of the separate segments comprising the business unit. Certain acquisition-related costs, including acquisition interest, amortization of retention payments and amortization of acquired intangible assets and goodwill, not allocated to the segments are included in the business unit results. Certain other items, including brokerage, execution and clearing expenses, contractor costs and expenses related to certain redeemable preferred securities classified as minority interests, have been reclassified in the segment and business unit results and are adjusted at the Corporate Center in accordance with Swiss GAAP and reflected in the Group’s consolidated results. For a complete reconciliation of the business unit results to the Group’s consolidated results and a discussion of the material reconciling items, please refer to “Reconciliation of operating to consolidated results”. | |||||||||||||
| 2) Excluding tax impact on acquisition-related costs. | |||||||||||||
| Institutional Securities income statement 1) | |||||||||||
| Change | Change | ||||||||||
| in % from | in % from | ||||||||||
| in USD m | 1Q2003 | 4Q2002 | 1Q2002 | 4Q2002 | 1Q2002 | ||||||
| Fixed Income | 2) | 1,422 | 587 | 1,269 | 142 | 12 | |||||
| Equity | 602 | 562 | 855 | 7 | (30) | ||||||
| Investment Banking | 3) | 545 | 936 | 741 | (42) | (26) | |||||
| Other | 2) 3) | 47 | (208) | (124) | – | – | |||||
| Operating income | 2,616 | 1,877 | 2,741 | 39 | (5) | ||||||
| Personnel expenses | 1,361 | 831 | 1,550 | 64 | (12) | ||||||
| Other operating expenses | 574 | 641 | 618 | (10) | (7) | ||||||
| Operating expenses | 1,935 | 1,472 | 2,168 | 31 | (11) | ||||||
| Gross operating profit | 681 | 405 | 573 | 68 | 19 | ||||||
| Depreciation of non-current assets | 86 | 81 | 102 | 6 | (16) | ||||||
| Valuation adjustments, provisions and losses | 112 | 664 | 199 | (83) | (44) | ||||||
| Net operating profit/(loss) before extraordinary and exceptional items, acquisition-related costs, cumulative effect of change in accounting principle and taxes | 483 | (340) | 272 | – | 78 | ||||||
| Extraordinary income/(expenses), net | 0 | 246 | 0 | (100) | – | ||||||
| Taxes | 4) | (135) | 157 | (54) | – | 150 | |||||
| Net operating profit before exceptional items, acquisition-related costs, cumulative effect of change in accounting principle and minority interests (segment result) | 348 | 63 | 218 | 452 | 60 | ||||||
| 1) Certain reclassifications have been made to conform to the current presentation. Certain acquisition-related costs, including acquisition interest, amortization of retention payments and amortization of acquired intangible assets and goodwill, exceptional items and cumulative effect of change in accounting principle not allocated to the segments are included in the business unit results. | |||||||||||
| 2) Reflects the movement of the results of certain non-continuing real estate and distressed assets from Fixed Income to Other. | |||||||||||
| 3) Reflects the movement of the results of certain non-continuing private equity business from Investment Banking to Other. | |||||||||||
| 4) In 4Q2002, Credit Suisse Group adopted a change in accounting principle relating to the recognition of deferred tax assets on net operating losses. The retroactive application of this change in accounting principle would have resulted in taxes of USD 33 m for 4Q2002 and would not have had an impact on the taxes reported for 1Q2002. | |||||||||||
| Institutional Securities income statement 1) | |||||||||||
| Change | Change | ||||||||||
| in % from | in % from | ||||||||||
| in CHF m | 1Q2003 | 4Q2002 | 1Q2002 | 4Q2002 | 1Q2002 | ||||||
| Fixed Income | 2) | 1,948 | 806 | 2,132 | 142 | (9) | |||||
| Equity | 825 | 806 | 1,437 | 2 | (43) | ||||||
| Investment Banking | 3) | 748 | 1,394 | 1,245 | (46) | (40) | |||||
| Other | 2) 3) | 64 | (312) | (210) | – | – | |||||
| Operating income | 3,585 | 2,694 | 4,604 | 33 | (22) | ||||||
| Personnel expenses | 1,864 | 1,166 | 2,603 | 60 | (28) | ||||||
| Other operating expenses | 787 | 947 | 1,039 | (17) | (24) | ||||||
| Operating expenses | 2,651 | 2,113 | 3,642 | 25 | (27) | ||||||
| Gross operating profit | 934 | 581 | 962 | 61 | (3) | ||||||
| Depreciation of non-current assets | 119 | 117 | 171 | 2 | (30) | ||||||
| Valuation adjustments, provisions and losses | 154 | 1,006 | 333 | (85) | (54) | ||||||
| Net operating profit/(loss) before extraordinary and exceptional items, acquisition-related costs, cumulative effect of change in accounting principle and taxes | 661 | (542) | 458 | – | 44 | ||||||
| Extraordinary income/(expenses), net | 0 | 383 | 0 | (100) | – | ||||||
| Taxes | 4) | (185) | 247 | (91) | – | 103 | |||||
| Net operating profit before exceptional items, acquisition-related costs, cumulative effect of change in accounting principle and minority interests (segment result) | 476 | 88 | 367 | 441 | 30 | ||||||
| 1) Certain reclassifications have been made to conform to the current presentation. Certain acquisition-related costs, including acquisition interest, amortization of retention payments and amortization of acquired intangible assets and goodwill, exceptional items and cumulative effect of change in accounting principle not allocated to the segments are included in the business unit results. | |||||||||||
| 2) Reflects the movement of the results of certain non-continuing real estate and distressed assets from Fixed Income to Other. | |||||||||||
| 3) Reflects the movement of the results of certain non-continuing private equity business from Investment Banking to Other. | |||||||||||
| 4) In 4Q2002, Credit Suisse Group adopted a change in accounting principle relating to the recognition of deferred tax assets on net operating losses. The retroactive application of this change in accounting principle would have resulted in taxes of CHF 49 m for 4Q2002 and would not have had an impact on the taxes reported for 1Q2002. | |||||||||||
| Institutional Securities balance sheet information | |||||||||||
| in CHF m | 31.03.03 | 31.12.02 | |||||||||
| Total assets | 621,288 | 588,904 | |||||||||
| Total assets in USD m | 455,757 | 423,611 | |||||||||
| Due from banks | 213,537 | 198,511 | |||||||||
| of which securities lending and reverse repurchase agreements | 157,899 | 156,234 | |||||||||
| Due from customers | 125,552 | 114,775 | |||||||||
| of which securities lending and reverse repurchase agreements | 53,376 | 57,435 | |||||||||
| Mortgages | 14,841 | 14,825 | |||||||||
| Securities and precious metals trading portfolios | 174,533 | 163,480 | |||||||||
| Due to banks | 317,781 | 292,449 | |||||||||
| of which securities borrowing and repurchase agreements | 120,453 | 123,017 | |||||||||
| Due to customers, other | 116,926 | 109,980 | |||||||||
| of which securities borrowing and repurchase agreements | 64,269 | 66,864 | |||||||||
| Institutional Securities key information | |||||||||||
| based on CHF amounts | 1Q2003 | 4Q2002 | 1Q2002 | ||||||||
| Cost/income ratio | 1) | 77.3% | 82.8% | 82.8% | |||||||
| Average allocated capital in CHF m | 12,519 | 13,438 | 14,188 | ||||||||
| Pre-tax margin | 1) | 18.4% | (5.9%) | 9.9% | |||||||
| Personnel expenses/operating income | 1) | 52.0% | 43.3% | 56.5% | |||||||
| 31.03.03 | 31.12.02 | ||||||||||
| Number of employees | 16,332 | 16,524 | |||||||||
| 1) Based on the segment results, which exclude certain acquisition-related costs, exceptional items and cumulative effect of change in accounting principle not allocated to the segment. | |||||||||||
| CSFB Financial Services income statement 1) | |||||||||||
| Change | Change | ||||||||||
| in % from | in % from | ||||||||||
| in USD m | 1Q2003 | 4Q2002 | 1Q2002 | 4Q2002 | 1Q2002 | ||||||
| Net interest income | 12 | 46 | 49 | (74) | (76) | ||||||
| Net commission and service fee income | 246 | 425 | 438 | (42) | (44) | ||||||
| Net trading income | 25 | 19 | 31 | 32 | (19) | ||||||
| Other ordinary income | 21 | (6) | 18 | – | 17 | ||||||
| Operating income | 304 | 484 | 536 | (37) | (43) | ||||||
| Personnel expenses | 148 | 237 | 258 | (38) | (43) | ||||||
| Other operating expenses | 86 | 161 | 157 | (47) | (45) | ||||||
| Operating expenses | 234 | 398 | 415 | (41) | (44) | ||||||
| Gross operating profit | 70 | 86 | 121 | (19) | (42) | ||||||
| Depreciation of non-current assets | 8 | 26 | 21 | (69) | (62) | ||||||
| Valuation adjustments, provisions and losses | 16 | (7) | 3 | – | 433 | ||||||
| Net operating profit before extraordinary and exceptional items, acquisition-related costs, cumulative effect of change in accounting principle and taxes | 46 | 67 | 97 | (31) | (53) | ||||||
| Extraordinary income/(expenses), net | 0 | 0 | 0 | – | – | ||||||
| Taxes | 2) | (9) | (19) | (27) | (53) | ; | (67) | ||||
| Net operating profit before exceptional items, acquisition-related costs, cumulative effect of change in accounting principle and minority interests (segment result) | 37 | 48 | 70 | (23) | (47) | ||||||
| 1) Certain acquisition-related costs, including acquisition interest, amortization of retention payments and amortization of acquired intangible assets and goodwill, exceptional items and cumulative effect of change in accounting principle not allocated to the segments are included in the business unit results. | |||||||||||
| 2) In 4Q2002, Credit Suisse Group adopted a change in accounting principle relating to the recognition of deferred tax assets on net operating losses. The retroactive application of this change in accounting principle would not have had an impact on the taxes reported for 4Q2002 and 1Q2002. | |||||||||||
| CSFB Financial Services income statement 1) | |||||||||||
| Change | Change | ||||||||||
| in % from | in % from | ||||||||||
| in CHF m | 1Q2003 | 4Q2002 | 1Q2002 | 4Q2002 | 1Q2002 | ||||||
| Net interest income | 16 | 67 | 82 | (76) | (80) | ||||||
| Net commission and service fee income | 337 | 625 | 737 | (46) | (54) | ||||||
| Net trading income | 34 | 26 | 52 | 31 | (35) | ||||||
| Other ordinary income | 29 | (11) | 30 | – | (3) | ||||||
| Operating income | 416 | 707 | 901 | (41) | (54) | ||||||
| Personnel expenses | 203 | 346 | 434 | (41) | (53) | ||||||
| Other operating expenses | 117 | 237 | 263 | (51) | (56) | ||||||
| Operating expenses | 320 | 583 | 697 | (45) | (54) | ||||||
| Gross operating profit | 96 | 124 | 204 | (23) | (53) | ||||||
| Depreciation of non-current assets | 11 | 39 | 36 | (72) | (69) | ||||||
| Valuation adjustments, provisions and losses | 22 | (13) | 5 | – | 340 | ||||||
| Net operating profit before extraordinary and exceptional items, acquisition-related costs, cumulative effect of change in accounting principle and taxes | 63 | 98 | 163 | (36) | (61) | ||||||
| Extraordinary income/(expenses), net | 0 | 0 | 0 | – | – | ||||||
| Taxes | 2) | (12) | (27) | (46) | (56) | (74) | |||||
| Net operating profit before exceptional items, acquisition-related costs, cumulative effect of change in accounting principle and minority interests (segment result) | 51 | 71 | 117 | (28) | (56) | ||||||
| 1) Certain acquisition-related costs, including acquisition interest, amortization of retention payments and amortization of acquired intangible assets and goodwill, exceptional items and cumulative effect of change in accounting principle not allocated to the segments are included in the business unit results. | |||||||||||
| 2) In 4Q2002, Credit Suisse Group adopted a change in accounting principle relating to the recognition of deferred tax assets on net operating losses. The retroactive application of this change in accounting principle would not have had an impact on the taxes reported for 4Q2002 and 1Q2002. | |||||||||||
| CSFB Financial Services key information | |||||||||||
| based on CHF amounts | 1Q2003 | 4Q2002 | 1Q2002 | ||||||||
| Cost/income ratio | 1) | 79.6% | 88.0% | 81.4% | |||||||
| Average allocated capital in CHF m | 595 | 701 | 1,098 | ||||||||
| Pre-tax margin | 1) | 15.1% | 13.9% | 18.1% | |||||||
| Personnel expenses/operating income | 1) | 48.8% | 48.9% | 48.2% | |||||||
| Net new assets Credit Suisse Asset Management in CHF bn (discretionary) | (5.2) | (8.7) | (3.9) | ||||||||
| Net new assets Private Client Services in CHF bn | 1.5 | 2.7 | 3.1 | ||||||||
| Growth in assets under management | (4.2%) | (2.7%) | (5.3%) | ||||||||
| Growth in discretionary assets under management – Credit Suisse Asset Management | (4.8%) | (4.6%) | (1.3%) | ||||||||
| of which net new assets | (1.9%) | (3.0%) | (1.1%) | ||||||||
| of which market movement and structural effects | (2.9%) | (1.6%) | (0.2%) | ||||||||
| of which acquisitions/(divestitures) | – | – | – | ||||||||
| Growth in net new assets Private Client Services | 2.1% | 3.6% | 3.2% | ||||||||
| 31.03.03 | 31.12.02 | ||||||||||
| Assets under management in CHF bn | 465.9 | 486.5 | |||||||||
| of which Credit Suisse Asset Management | 397.6 | 412.8 | |||||||||
| of which Private Client Services | 66.3 | 71.7 | |||||||||
| Discretionary assets under management in CHF bn | 281.9 | 297.2 | |||||||||
| of which Credit Suisse Asset Management | 265.3 | 278.7 | |||||||||
| of which mutual funds distributed | 104.9 | 106.5 | |||||||||
| of which Private Client Services | 16.6 | 18.5 | |||||||||
| Advisory assets under management in CHF bn | 184.0 | 189.3 | |||||||||
| Number of employees | 2,886 | 6,900 | |||||||||
| 1) Based on the segment results, which exclude certain acquisition-related costs, exceptional items and cumulative effect of change in accounting principle not allocated to the segment. | |||||||||||
RECONCILIATION OF OPERATING TO CONSOLIDATED RESULTS
Reconciliation of operating to consolidated results
The Group’s consolidated results are prepared in accordance with Swiss GAAP, while the Group’s segment reporting principles are applied to the presentation of segment results, including business unit results. For a description of these reporting principles, please refer to "Operating and Financial Review – Reporting Principles" in the Group's 2002 Annual Report. The business unit results reflect the results of the separate segments constituting the respective business units as well as certain acquisition-related costs, exceptional items and the cumulative effect of a change in accounting principle that are not allocated to the segments. The business unit results also include certain other reclassifications that are adjusted at the Corporate Center in accordance with Swiss GAAP and reflected in the Group’s consolidated results.
The acquisition-related costs and exceptional items excluded from the segment results and from the business unit operating basis results shown below include, among other items, acquisition interest, amortization of retention payments, amortization of acquired intangible assets and goodwill and the exceptional items described in the reviews of business unit results and in the footnotes to the reconciliation tables. The reclassifications shown for the Credit Suisse Financial Services business unit reflect the amortization of acquired intangible assets and goodwill, and for the fourth quarter of 2002, exceptional items and the cumulative effect of a change in accounting principle. The reclassifications shown in the Credit Suisse First Boston business unit reflect acquisition-related costs, and for the fourth quarter 2002, exceptional items and the cumulative effect of a change in accounting principle. Acquisition-related costs and exceptiona l items are excluded from the business unit operating results because management believes that this enables management and investors to assess the operating results or “cash earnings” and key performance indicators of the business. The effect of the change in accounting principle has been excluded from the business unit operating results to the extent that the positive current-period tax benefits resulted from prior-period losses.
The results presented in the column “Adjustments including Corporate Center” include the parent company operations, including Group financing initiatives as well as income and expense items related to centrally managed, own-use real estate, mainly comprised of bank premises within Switzerland. In addition, this column includes consolidation adjustments and adjustments to segment accounts related to management reporting policies and the reversal of certain reclassifications made in the business units.
The adjustments made for the Credit Suisse Financial Services business unit results include valuation adjustments, provisions and losses. This adjustment reflects the difference between the expected credit provisions recorded by Credit Suisse Financial Services’ banking segments and the actual credit provisions for the year, and also includes a charge relating to an adjustment in the method of estimating inherent losses related to lending activities in the fourth quarter of 2002. The impact of this charge, after tax, was fully offset by a release from the reserve for general banking risks, which was recorded as extraordinary income at Credit Suisse Group.
The reclassifications made for the Credit Suisse First Boston business unit results include, among others, the deduction from other operating expenses of brokerage, execution and clearing expenses of Credit Suisse First Boston, reclassified as a reduction of operating income; the deduction from other operating expenses of contractor costs of Credit Suisse First Boston, reclassified as an addition to personnel expenses; and the addition to operating income of expenses related to certain redeemable preferred securities of Credit Suisse First Boston, reclassified as minority interests. Credit Suisse First Boston’s brokerage, execution and clearing expenses and contractor costs are presented in a manner that brings them in line with its US competitors in the investment banking industry and makes it easier for investors to compare the Credit Suisse First Boston business unit’s operating expenses with those of its competitors. Swiss GAAP does not permit the Group to report brokerage, execution and clearing expenses and contractor costs as part of other operating expenses. The presentation of redeemable preferred securities of Credit Suisse First Boston, issued by consolidated special purpose entities, as an expense reducing its operating income, is intended to more fairly present the operating results from its core businesses.
| Credit Suisse Financial Services | Credit Suisse First Boston | ||||||||||||||||
| Re- | Re- | Re- | Re- | Adjust. incl. | Credit | ||||||||||||
| Operating | classifi- | classified | Operating | classifi- | classified | Corporate | Suisse | ||||||||||
| 1Q2003, in CHF m | basis | cations | basis | basis | cations | basis | Center | Group | |||||||||
| Operating income | 3,393 | 3,393 | 4,001 | (86) | 1) | 3,915 | (284) | 7,024 | |||||||||
| Personnel expenses | 1,369 | 1,369 | 2,067 | 110 | 1) | 2,177 | 93 | 3,639 | |||||||||
| Other operating expenses | 779 | 779 | 904 | 904 | (302) | 1,381 | |||||||||||
| Operating expenses | 2,148 | 2,148 | 2,971 | 3,081 | (209) | 5,020 | |||||||||||
| Gross operating profit | 1,245 | 1,245 | 1,030 | 834 | (75) | 2,004 | |||||||||||
| Depreciation of non-current assets | 220 | 220 | 130 | 130 | 70 | 420 | |||||||||||
| Amortization of acquired intangible assets and goodwill | – | 25 | 2) | 25 | – | 206 | 1) | 206 | 1 | 232 | |||||||
| Valuation adjustments, provisions and losses | 81 | 81 | 176 | 176 | (24) | 233 | |||||||||||
| Profit before extraordinary items and taxes | 944 | 919 | 724 | 322 | (122) | 1,119 | |||||||||||
| Extraordinary income/(expenses), net | 7 | 7 | 0 | 0 | (56) | (49) | |||||||||||
| Taxes | (253) | 1 | (252) | (197) | 96 | (101) | (25) | (378) | |||||||||
| Net profit before minority interests | 698 | 674 | 527 | 221 | (203) | 692 | |||||||||||
| Minority interests | (8) | (8) | 0 | 0 | (32) | (40) | |||||||||||
| Net profit | 666 | 221 | (235) | 652 | |||||||||||||
| 1) Reflects acquisition interest of CHF 86 m allocated to operating income, amortization of retention payments of CHF 110 m allocated to personnel expenses and amortization of acquired intangible assets and goodwill of CHF 206 m. | |||||||||||||||||
| 2) Reflects acquisition-related costs of CHF 25 m allocated to amortization of acquired intangible assets and goodwill. | |||||||||||||||||
| Credit Suisse Financial Services | Credit Suisse First Boston | ||||||||||||||||
| Re- | Re- | Re- | Re- | Adjust. incl. | Credit | ||||||||||||
| Operating | classifi- | classified | Operating | classifi- | classified | Corporate | Suisse | ||||||||||
| 4Q2002, in CHF m | basis | cations | basis | basis | cations | basis | Center | Group | |||||||||
| Operating income | 3,517 | 3,517 | 3,401 | (80) | 1) | 3,321 | (443) | 6,395 | |||||||||
| Personnel expenses | 1,405 | 3 | 2) | 1,408 | 1,512 | 384 | 1) 3) | 1,896 | 160 | 3,464 | |||||||
| Other operating expenses | 897 | (1) | 2) | 896 | 1,184 | 1,184 | (433) | 1,647 | |||||||||
| Operating expenses | 2,302 | 2,304 | 2,696 | 3,080 | (273) | 5,111 | |||||||||||
| Gross operating profit | 1,215 | 1,213 | 705 | 241 | (170) | 1,284 | |||||||||||
| Depreciation of non-current assets | 318 | 16 | 2) | 334 | 156 | 156 | 144 | 634 | |||||||||
| Amortization of acquired intangible assets and goodwill | – | 92 | 2) 4) | 92 | – | 308 | 1) | 308 | 3 | 403 | |||||||
| Valuation adjustments, provisions and losses | 105 | 105 | 993 | 984 | 3) | 1,977 | 342 | 2,424 | |||||||||
| Profit/(loss) before extraordinary items, cumulative effect of change in accounting principle and taxes | 792 | 682 | (444) | (2,200) | (659) | (2,177) | |||||||||||
| Extraordinary income/(expenses), net | 24 | 24 | 383 | (163) | 3) | 220 | 125 | 369 | |||||||||
| Cumulative effect of change in accounting principle | – | 266 | 5) | 266 | – | 254 | 5) | 254 | 0 | 520 | |||||||
| Taxes | (332) | 14 | (318) | 220 | 254 | 474 | 162 | 318 | |||||||||
| Net profit/(loss) before minority interests | 484 | 654 | 159 | (1,252) | (372) | (970) | |||||||||||
| Minority interests | 51 | 51 | 0 | 0 | (31) | 20 | |||||||||||
| Net profit/(loss) | 705 | (1,252) | (403) | (950) | |||||||||||||
| 1) Reflects acquisition interest of CHF 80 m allocated to operating income, amortization of retention payments of CHF 142 m allocated to personnel expenses and amortization of acquired intangible assets and goodwill of CHF 308 m. | |||||||||||||||||
| 2) Reflects exceptional items totaling CHF 73 m (CHF 60 m net of tax) in respect of focusing the European initiative on private banking clients allocated as follows: CHF 3 m to personnel expenses, CHF –1 m to operating expenses, CHF 16 m to depreciation of non-current assets and CHF 55 m to amortization of acquired intangible assets and goodwill. | |||||||||||||||||
| 3) Reflects exceptional items of CHF 1,389 m (CHF 1,269 m net of tax) allocated as follows: CHF 242 m to personnel expenses, CHF 984 m to valuation adjustments, provisions and losses and CHF 163 m to extraordinary expenses. | |||||||||||||||||
| 4) Reflects acquisition-related costs of CHF 37 m allocated to amortization of acquired intangible assets and goodwill. | |||||||||||||||||
| 5) Reflects the cumulative effect of a change in accounting principle related to the recognition of deferred tax assets on net operating losses for Credit Suisse Financial Services of CHF 266 m and Credit Suisse First Boston of CHF 254 m. | |||||||||||||||||
| Credit Suisse Financial Services | Credit Suisse First Boston | ||||||||||||||||
| Re- | Re- | Re- | Re- | Adjust. incl. | Credit | ||||||||||||
| Operating | classifi- | classified | Operating | classifi- | classified | Corporate | Suisse | ||||||||||
| 1Q2002, in CHF m | basis | cations | basis | basis | cations | basis | Center | Group | |||||||||
| Operating income | 3,306 | 3,306 | 5,505 | (167) | 1) | 5,338 | (314) | 8,330 | |||||||||
| Personnel expenses | 1,443 | 1,443 | 3,037 | 179 | 1) | 3,216 | 178 | 4,837 | |||||||||
| Other operating expenses | 814 | 814 | 1,302 | 1,302 | (455) | 1,661 | |||||||||||
| Operating expenses | 2,257 | 2,257 | 4,339 | 4,518 | (277) | 6,498 | |||||||||||
| Gross operating profit | 1,049 | 1,049 | 1,166 | 820 | (37) | 1,832 | |||||||||||
| Depreciation of non-current assets | 205 | 205 | 207 | 207 | 69 | 481 | |||||||||||
| Amortization of acquired intangible assets and goodwill | 29 | 2) | 29 | 357 | 1) | 357 | (1) | 385 | |||||||||
| Valuation adjustments, provisions and losses | 99 | 99 | 338 | 338 | 34 | 471 | |||||||||||
| Profit/(loss) before extraordinary items and taxes | 745 | 716 | 621 | (82) | (139) | 495 | |||||||||||
| Extraordinary income/(expenses), net | (3) | (3) | 0 | 0 | (2) | (5) | |||||||||||
| Taxes | (120) | 1 | (119) | (137) | 187 | 50 | (18) | (87) | |||||||||
| Net profit/(loss) before minority interests | 622 | 594 | 484 | (32) | (159) | 403 | |||||||||||
| Minority interests | (2) | (2) | 0 | 0 | (33) | (35) | |||||||||||
| Net profit/(loss) | 592 | (32) | (192) | 368 | |||||||||||||
| 1) Reflects acquisition interest of CHF 167 m allocated to operating income, amortization of retention payments of CHF 179 m allocated to personnel expenses and amortization of acquired intangible assets and goodwill of CHF 357 m. | |||||||||||||||||
| 2) Reflects acquisition-related costs of CHF 29 m allocated to amortization of acquired intangible assets and goodwill. | |||||||||||||||||
CONSOLIDATED RESULTS | CREDIT SUISSE GROUP
| Consolidated income statement | |||||||||||
| Change | Change | ||||||||||
| in % from | in % from | ||||||||||
| in CHF m | 1Q2003 | 4Q2002 | 1Q2002 | 4Q2002 | 1Q2002 | ||||||
| Interest and discount income | 3,341 | 4,119 | 4,652 | (19) | (28) | ||||||
| Interest and dividend income from trading portfolios | 2,026 | 2,204 | 2,648 | (8) | (23) | ||||||
| Interest and dividend income from financial investments | 175 | 156 | 107 | 12 | 64 | ||||||
| Interest expenses | (3,891) | (4,553) | (5,554) | (15) | (30) | ||||||
| Net interest income | 1,651 | 1,926 | 1,853 | (14) | (11) | ||||||
| Commission income from lending activities | 205 | 313 | 200 | (35) | 3 | ||||||
| Commission income from securities and investment transactions | 2,555 | 2,899 | 3,913 | (12) | (35) | ||||||
| Commission income from other services | 241 | 334 | 485 | (28) | (50) | ||||||
| Commission expenses | (187) | (246) | (225) | (24) | (17) | ||||||
| Net commission and service fee income | 2,814 | 3,300 | 4,373 | (15) | (36) | ||||||
| Net trading income | 1,273 | 109 | 1,216 | – | 5 | ||||||
| Premiums earned, net | 10,476 | 8,309 | 10,463 | 26 | 0 | ||||||
| Claims incurred and actuarial provisions | (9,684) | (6,426) | (10,131) | 51 | (4) | ||||||
| Commission expenses, net | (589) | (549) | (444) | 7 | 33 | ||||||
| Investment income from the insurance business | 1,332 | 54 | 1,082 | – | 23 | ||||||
| Net income from the insurance business | 1,535 | 1,388 | 970 | 11 | 58 | ||||||
| Income from the sale of financial investments | 75 | 490 | 249 | (85) | (70) | ||||||
| Income from investments in associates | 43 | (18) | 60 | – | (28) | ||||||
| Income from other non-consolidated participations | 1 | 3 | 7 | (67) | (86) | ||||||
| Real estate income | 43 | 30 | 31 | 43 | 39 | ||||||
| Sundry ordinary income | 210 | 86 | 262 | 144 | (20) | ||||||
| Sundry ordinary expenses | 1) | (621) | (919) | (691) | (32) | (10) | |||||
| Other ordinary income/(expenses), net | (249) | (328) | (82) | (24) | 204 | ||||||
| Operating income | 7,024 | 6,395 | 8,330 | 10 | (16) | ||||||
| Personnel expenses | 3,639 | 3,464 | 4,837 | 5 | (25) | ||||||
| Other operating expenses | 1,381 | 1,647 | 1,661 | (16) | (17) | ||||||
| Operating expenses | 5,020 | 5,111 | 6,498 | (2) | (23) | ||||||
| Gross operating profit | 2,004 | 1,284 | 1,832 | 56 | 9 | ||||||
| Depreciation of non-current assets | 2) | 420 | 634 | 481 | (34) | (13) | |||||
| Amortization of acquired intangible assets | 81 | 165 | 193 | (51) | (58) | ||||||
| Amortization of goodwill | 151 | 238 | 192 | (37) | (21) | ||||||
| Valuation adjustments, provisions and losses from the banking business | 1) | 233 | 2,424 | 471 | (90) | (51) | |||||
| Depreciation, valuation adjustments and losses | 885 | 3,461 | 1,337 | (74) | (34) | ||||||
| Profit/(loss) before extraordinary items, cumulative effect of change in accounting principle and taxes | 1,119 | (2,177) | 495 | – | 126 | ||||||
| Extraordinary income | 9 | 626 | 4 | (99) | 125 | ||||||
| Extraordinary expenses | (58) | (257) | (9) | (77) | – | ||||||
| Cumulative effect of change in accounting principle | 3) | – | 520 | – | – | – | |||||
| Taxes | 3) | (378) | 318 | (87) | – | 334 | |||||
| Net profit/(loss) before minority interests | 692 | (970) | 403 | – | 72 | ||||||
| Minority interests | (40) | 20 | (35) | – | 14 | ||||||
| Net profit/(loss) | 652 | (950) | 368 | – | 77 | ||||||
| 1) Effective in the first quarter 2003, declines in value of debt securities and loans available for sale due to deterioration in creditworthiness are reported in “Sundry ordinary expenses”. In previous years they were recorded in “Valuation adjustments, provisions and losses from the banking business”. | |||||||||||
| 2) Includes amortization of Present Value of Future Profits (PVFP) from the insurance business. | |||||||||||
| 3) In 4Q2002, Credit Suisse Group adopted a change in accounting principle relating to the recognition of deferred tax assets on net operating losses. The retroactive application of this change in accounting principle would have resulted in taxes for Q42002 and 1Q2002 of CHF –198 m and CHF –53 m, respectively. | |||||||||||
| Consolidated balance sheet | |||||||
| Change | |||||||
| in % from | |||||||
| in CHF m | 31.03.03 | 31.12.02 | 31.12.02 | ||||
| Assets | |||||||
| Cash and other liquid assets | 2,440 | 2,551 | (4) | ||||
| Money market papers | 22,921 | 25,125 | (9) | ||||
| Due from banks | 213,829 | 195,778 | 9 | ||||
| Receivables from the insurance business | 12,604 | 12,290 | 3 | ||||
| Due from customers | 185,370 | 182,143 | 2 | ||||
| Mortgages | 96,342 | 94,896 | 2 | ||||
| Securities and precious metals trading portfolios | 183,424 | 173,133 | 6 | ||||
| Financial investments from the banking business | 32,889 | 33,394 | (2) | ||||
| Investments from the insurance business | 131,605 | 128,450 | 2 | ||||
| Non-consolidated participations | 5,011 | 1,792 | 180 | ||||
| Tangible fixed assets | 7,693 | 8,152 | (6) | ||||
| Intangible assets | 15,799 | 18,359 | (14) | ||||
| Accrued income and prepaid expenses | 13,882 | 13,882 | 0 | ||||
| Other assets | 68,334 | 65,711 | 4 | ||||
| Total assets | 992,143 | 955,656 | 4 | ||||
| Subordinated assets | 1) | 5,866 | 6,502 | (10) | |||
| Receivables due from non-consolidated participations | 986 | 728 | 35 | ||||
| Liabilities and shareholders' equity | |||||||
| Money market papers issued | 29,438 | 22,178 | 33 | ||||
| Due to banks | 316,302 | 287,884 | 10 | ||||
| Payables from the insurance business | 8,365 | 10,218 | (18) | ||||
| Due to customers in savings and investment deposits | 41,582 | 39,739 | 5 | ||||
| Due to customers, other | 254,215 | 258,244 | (2) | ||||
| Medium-term notes (cash bonds) | 2,331 | 2,599 | (10) | ||||
| Bonds and mortgage-backed bonds | 84,441 | 81,839 | 3 | ||||
| Accrued expenses and deferred income | 13,384 | 17,463 | (23) | ||||
| Other liabilities | 56,931 | 56,070 | 2 | ||||
| Valuation adjustments and provisions | 12,254 | 11,557 | 6 | ||||
| Technical provisions for the insurance business | 141,498 | 136,471 | 4 | ||||
| Total liabilities | 960,741 | 924,262 | 4 | ||||
| Reserve for general banking risks | 1,739 | 1,739 | 0 | ||||
| Share capital | 1,190 | 1,190 | 0 | ||||
| Capital reserve | 20,710 | 20,710 | 0 | ||||
| Revaluation reserves for the insurance business | 1,044 | 1,504 | (31) | ||||
| Reserve for own shares | 1,950 | 1,950 | 0 | ||||
| Retained earnings | 1,238 | 4,732 | (74) | ||||
| Minority interests | 2,879 | 2,878 | 0 | ||||
| Net profit/(loss) | 652 | (3,309) | – | ||||
| Total shareholders' equity | 31,402 | 31,394 | 0 | ||||
| Total liabilities and shareholders' equity | 992,143 | 955,656 | 4 | ||||
| Subordinated liabilities | 19,207 | 19,704 | (3) | ||||
| Liabilities due to non-consolidated participations | 1,714 | 1,164 | 47 | ||||
| 1) 31.12.02 restated. | |||||||
| Off-balance sheet and fiduciary business | |||||||||||||
| in CHF m | 31.03.03 | 31.12.02 | |||||||||||
| Credit guarantees in form of bills of exchange and other guarantees | 1) | 29,217 | 27,745 | ||||||||||
| Bid bonds, delivery and performance bonds, letters of indemnity, other performance-related guarantees | 4,762 | 4,680 | |||||||||||
| Irrevocable commitments in respect of documentary credits | 3,277 | 3,242 | |||||||||||
| Other contingent liabilities | 2,610 | 3,437 | |||||||||||
| Contingent liabilities | 39,866 | 39,104 | |||||||||||
| Irrevocable commitments | 84,415 | 90,048 | |||||||||||
| Liabilities for calls on shares and other equity instruments | 43 | 43 | |||||||||||
| Confirmed credits | 32 | 32 | |||||||||||
| Total off-balance sheet | 124,356 | 129,227 | |||||||||||
| Fiduciary transactions | 37,247 | 37,703 | |||||||||||
At 31.03.03, market value guarantees reported as derivatives totaled CHF 192.6 bn (31.12.02: CHF 170.4 bn) (nominal value). The associated replacement value reported on-balance sheet totaled CHF 9.2 bn (31.12.02: CHF 10.3 bn). | |||||||||||||
| 1) Including credit guarantees of securities lent as arranger: 31.03.03: CHF 22.5 bn (31.12.02: CHF 20.7 bn). | |||||||||||||
| Derivative instruments | |||||||||||||
| Positive | Negative | Positive | Negative | ||||||||||
| gross | gross | gross | gross | ||||||||||
| Nominal | replacement | replacement | Nominal | replacement | replacement | ||||||||
| value | value | 1) | value | 1) | value | value | 1) | value | 1) | ||||
| in CHF bn | 31.03.03 | 31.03.03 | 31.03.03 | 31.12.02 | 31.12.02 | 31.12.02 | |||||||
| Interest rate products | 14,616.6 | 196.2 | 190.5 | 10,647.2 | 185.4 | 181.0 | |||||||
| Foreign exchange products | 1,613.4 | 31.8 | 32.5 | 1,376.7 | 34.8 | 36.1 | |||||||
| Precious metals products | 16.7 | 0.6 | 2.2 | 19.8 | 0.9 | 2.5 | |||||||
| Equity/index-related products | 369.9 | 14.2 | 14.1 | 347.5 | 12.6 | 13.0 | |||||||
| Other products | 200.0 | 3.9 | 5.2 | 179.4 | 4.3 | 5.0 | |||||||
| Total derivative instruments | 16,816.6 | 246.7 | 244.5 | 12,570.6 | 238.0 | 237.6 | |||||||
| 1) Including replacement values for traded derivatives (futures and traded options) subject to daily margining requirements. Total positive and negative replacement values of traded derivatives amount to CHF 2.9 bn (31.12.02: CHF 1.5 bn) and CHF 1.1 bn (31.12.02: CHF 1.1 bn). | |||||||||||||
| Currency translation rates | ||||||||||||||
| Average rate year-to-date | Closing rate used in the | |||||||||||||
| used in the income statement | balance sheet as of | |||||||||||||
| in CHF | 1Q2003 | 4Q2002 | 1Q2002 | 31.03.03 | 31.12.02 | |||||||||
| 1 USD | 1.37 | 1.56 | 1.68 | 1.3632 | 1.3902 | |||||||||
| 1 EUR | 1.47 | 1.47 | 1.47 | 1.4768 | 1.4550 | |||||||||
| 1 GBP | 2.19 | 2.33 | 2.40 | 2.1493 | 2.2357 | |||||||||
| 100 JPY | 1.15 | 1.24 | 1.27 | 1.1434 | 1.1722 | |||||||||
| Calculation of earnings per share (EPS) | |||||||||||||
| Change | Change | ||||||||||||
| in % from | in % from | ||||||||||||
| 1Q2003 | 4Q2002 | 1Q2002 | 4Q2002 | 1Q2002 | |||||||||
| Net profit/(loss) in CHF m | 652 | (950) | 368 | – | 77 | ||||||||
| Diluted net profit/(loss) in CHF m | 652 | (950) | 368 | – | 77 | ||||||||
| Weighted average shares outstanding | 1) | 1,230,305,558 | 1,193,153,538 | 1,189,051,080 | 3 | 3 | |||||||
| Dilutive impact | 2) | 2,015,114 | 0 | 7,477,415 | – | (73) | |||||||
| Weighted average shares, diluted | 1,232,320,672 | 1,193,153,538 | 1,196,528,495 | 3 | 3 | ||||||||
| Basic earnings per share in CHF | 0.53 | (0.80) | 0.31 | – | 71 | ||||||||
| Diluted earnings per share in CHF | 0.53 | (0.80) | 0.31 | – | 71 | ||||||||
| 1) Adjusted for weighted average shares repurchased. | |||||||||||||
| 2) The calculation for the diluted loss per share in 4Q2002 excludes the effect of the potential exchange of convertible bonds and the potential exercise of options to purchase shares, as the effect would be anti-dilutive. | |||||||||||||
| Income statement of the banking and insurance business 1) | |||||||||||||
| Banking business | |||||||||||||
| (incl. Corporate Center) | Insurance business | 2) | Credit Suisse Group | ||||||||||
| 3 months, in CHF m | 2003 | 2002 | 2003 | 2002 | 2003 | 2002 | |||||||
| Net interest income | 1,655 | 1,835 | – | – | 1,651 | 1,853 | |||||||
| Net commission and service fee income | 2,812 | 4,382 | – | – | 2,814 | 4,373 | |||||||
| Net trading income | 1,286 | 1,216 | – | – | 1,273 | 1,216 | |||||||
| Net income from the insurance business | 3) | – | – | 1,522 | 976 | 1,535 | 970 | ||||||
| Other ordinary income/(expenses), net | (150) | 46 | (114) | (122) | (249) | (82) | |||||||
| Operating income | 5,603 | 7,479 | 1,408 | 854 | 7,024 | 8,330 | |||||||
| Personnel expenses | 3,118 | 4,241 | 521 | 596 | 3,639 | 4,837 | |||||||
| Other operating expenses | 985 | 1,323 | 383 | 338 | 1,381 | 1,661 | |||||||
| Operating expenses | 4,103 | 5,564 | 904 | 934 | 5,020 | 6,498 | |||||||
| Gross operating profit/(loss) | 1,500 | 1,915 | 504 | (80) | 2,004 | 1,832 | |||||||
| Depreciation of non-current assets | 276 | 347 | 143 | 134 | 420 | 481 | |||||||
| Amortization of acquired intangible assets | 81 | 193 | 0 | 0 | 81 | 193 | |||||||
| Amortization of goodwill | 135 | 174 | 16 | 18 | 151 | 192 | |||||||
| Valuation adjustments, provisions and losses from the banking business | 234 | 471 | – | – | 233 | 471 | |||||||
| Depreciation, valuation adjustments and losses | 726 | 1,185 | 159 | 152 | 885 | 1,337 | |||||||
| Profit/(loss) before extraordinary items, taxes and minority interests | 774 | 730 | 345 | (232) | 1,119 | 495 | |||||||
| Extraordinary income | 9 | 4 | 0 | 0 | 9 | 4 | |||||||
| Extraordinary expenses | (1) | (9) | (58) | 0 | (58) | (9) | |||||||
| Taxes | (275) | (166) | (102) | 79 | (378) | (87) | |||||||
| Net profit/(loss) before minority interests | 507 | 559 | 185 | (153) | 692 | 403 | |||||||
| Minority interests | (36) | (38) | (5) | 3 | (40) | (35) | |||||||
| Net profit/(loss) | 471 | 521 | 180 | (150) | 652 | 368 | |||||||
| 1) Income statements for the banking and insurance business are presented on a stand-alone basis. | |||||||||||||
| 2) Represents “Winterthur” Swiss Insurance Company. | |||||||||||||
| 3) Insurance business: expenses due to the handling of both claims and investments are allocated to the income from the insurance business, of which CHF 141 m (3 months 2002: CHF 168 m) are related to personnel expenses and CHF 87 m (3 months 2002: CHF 83 m) to other operating expenses. | |||||||||||||
| Statement of shareholders' equity | |||||||||||||
| 3 months | 3 months | ||||||||||||
| in CHF m | 2003 | 2002 | |||||||||||
| At beginning of financial year | 31,394 | 38,921 | |||||||||||
| Dividends paid to minority interests | (17) | (16) | |||||||||||
| Capital increases, par value and capital surplus | 0 | 10 | |||||||||||
| Changes in scope of consolidation affecting minority interests | (8) | (27) | |||||||||||
| Foreign exchange impact | (199) | (42) | |||||||||||
| Change in revaluation reserves from the insurance business, net | (460) | (274) | |||||||||||
| Minority interests in net profit | 40 | 35 | |||||||||||
| Net profit | 652 | 368 | |||||||||||
| At end of period | 31,402 | 38,975 | |||||||||||
LOANS
| Due from banks | |||||||||
| in CHF m | 31.03.03 | 31.12.02 | |||||||
| Due from banks, gross | 213,918 | 195,866 | |||||||
| Valuation allowance | (89) | (88) | |||||||
| Total due from banks, net | 213,829 | 195,778 | |||||||
| Due from customers and mortgages | |||||||||
| in CHF m | 31.03.03 | 31.12.02 | |||||||
| Due from customers, gross | 1) | 190,482 | 187,617 | ||||||
| Valuation allowance | (5,112) | (5,474) | |||||||
| Due from customers, net | 185,370 | 182,143 | |||||||
| Mortgages, gross | 1) | 98,032 | 97,037 | ||||||
| Valuation allowance | (1,690) | (2,141) | |||||||
| Mortgages, net | 96,342 | 94,896 | |||||||
| Total due from customers and mortgages, net | 281,712 | 277,039 | |||||||
| 1) Effective 1Q2003, loans held for sale are presented net of the related loan valuation allowances. | |||||||||
| Due from customers and mortgages by sector | |||||||||
| in CHF m | 31.03.03 | 31.12.02 | |||||||
| Financial services | 51,293 | 38,279 | |||||||
| Real estate companies | 15,870 | 16,472 | |||||||
| Other services including technology companies | 15,655 | 15,316 | |||||||
| Manufacturing | 13,200 | 13,273 | |||||||
| Wholesale and retail trade | 11,968 | 11,165 | |||||||
| Construction | 4,126 | 4,314 | |||||||
| Transportation | 4,149 | 4,149 | |||||||
| Telecommunications | 2,980 | 2,333 | |||||||
| Health and social services | 2,069 | 2,340 | |||||||
| Hotels and restaurants | 2,468 | 2,390 | |||||||
| Agriculture and mining | 2,390 | 2,317 | |||||||
| Non-profit and international organizations | 180 | 191 | |||||||
| Commercial | 126,348 | 112,539 | |||||||
| Consumers | 88,356 | 92,419 | |||||||
| Public authorities | 5,465 | 5,023 | |||||||
| Lease financings | 3,169 | 3,158 | |||||||
| Professional securities transactions and securitized loans | 65,176 | 71,515 | |||||||
| Due from customers and mortgages, gross | 288,514 | 284,654 | |||||||
| Valuation allowance | (6,802) | (7,615) | |||||||
| Total due from customers and mortgages, net | 281,712 | 277,039 | |||||||
| Collateral of due from customers and mortgages | |||||||||
| Mortgage | Other | Without | Total | ||||||
| in CHF m | collateral | collateral | collateral | 31.03.03 | |||||
| Due from customers | 5,144 | 133,422 | 46,804 | 185,370 | |||||
| Residential properties | 69,310 | ||||||||
| Business and office properties | 12,313 | ||||||||
| Commercial and industrial properties | 11,977 | ||||||||
| Other properties | 2,742 | ||||||||
| Mortgages | 96,342 | 96,342 | |||||||
| Total collateral | 101,486 | 133,422 | 46,804 | 281,712 | |||||
| As of 31.12.02 | 100,002 | 129,300 | 47,737 | 277,039 | |||||
| Loan valuation allowance | |||||||||
| in CHF m | 31.03.03 | 31.12.02 | |||||||
| Due from banks | 89 | 88 | |||||||
| Due from customers | 5,112 | 5,474 | |||||||
| Mortgages | 1,690 | 2,141 | |||||||
| Total loans valuation allowance | 1) 2) | 6,891 | 7,703 | ||||||
| of which on principal | 5,875 | 6,617 | |||||||
| of which on interest | 1,016 | 1,086 | |||||||
| 1) Of which are CHF 5,828 m specific allowances for impaired loans (31.12.02: CHF 6,778 m). | |||||||||
| 2) Effective 1Q2003, valuation allowances related to loans held for sale are netted directly with such loans, and are not presented separately in the total loan valuation allowance. | |||||||||
| Roll forward of loan valuation allowance | |||||||||
| 3 months | 3 months | ||||||||
| in CHF m | 2003 | 2002 | |||||||
| At beginning of financial year | 7,703 | 9,264 | |||||||
| Net additions charged to income statement | 168 | 242 | |||||||
| Net write-offs | (571) | (947) | |||||||
| Reclassified to loans held for sale | (355) | – | |||||||
| Provisions for interest | 42 | 73 | |||||||
| Foreign currency translation impact and other | (96) | 125 | |||||||
| At end of period | 6,891 | 8,757 | |||||||
| Impaired loans 1) | |||||||||
| in CHF m | 31.03.03 | 31.12.02 | |||||||
| With a specific allowance | 10,030 | 11,714 | |||||||
| Without a specific allowance | 763 | 655 | |||||||
| Total impaired loans, gross | 10,793 | 12,369 | |||||||
| Non-performing loans | 5,365 | 6,355 | |||||||
| Non-interest earning loans | 2,299 | 2,325 | |||||||
| Restructured loans | 281 | 281 | |||||||
| Potential problem loans | 2) | 2,848 | 3,408 | ||||||
| Total impaired loans, gross | 10,793 | 12,369 | |||||||
| 1) Effective 1Q2003, loans classified as held for sale are excluded from presentation as impaired. | |||||||||
| 2) Potential problem loans consist of loans where interest payments are being made but where, in the credit officer's assessment, some doubt exists as to the timing and/or certainty of the repayment of contractual principal. | |||||||||
| Securities and precious metals trading portfolios | |||||
| in CHF m | 31.03.03 | 31.12.02 | |||
| Listed on stock exchange | 65,170 | 58,661 | |||
| Unlisted | 85,236 | 76,083 | |||
| Debt instruments | 150,406 | 134,744 | |||
| of which own bonds and medium-term notes | 1,263 | 1,520 | |||
| Listed on stock exchange | 27,862 | 33,208 | |||
| Unlisted | 4,086 | 3,935 | |||
| Equity instruments | 31,948 | 37,143 | |||
| of which own shares | 1,620 | 2,254 | |||
| Precious metals | 1,070 | 1,246 | |||
| Total securities and precious metals trading portfolios | 183,424 | 173,133 | |||
| of which securities rediscountable or pledgeable with central banks | 35,248 | 27,426 | |||
| Investments from the insurance business | |||||||||||
| Gross | Gross | ||||||||||
| Amortized | unrealized | unrealized | |||||||||
| As of 31.03.03, in CHF m | Book value | cost | gains | losses | Fair value | ||||||
| Debt securities issued by Swiss Federal Government, cantonal or local governmental entities | 12,109 | 11,463 | 682 | 36 | 12,109 | ||||||
| Debt securities issued by foreign governments | 28,412 | 27,683 | 865 | 136 | 28,412 | ||||||
| Corporate debt securities | 33,107 | 31,568 | 1,691 | 152 | 33,107 | ||||||
| Other | 8,202 | 7,694 | 520 | 12 | 8,202 | ||||||
| Debt securities | 81,830 | 78,408 | 3,758 | 336 | 81,830 | ||||||
| Equity securities | 6,488 | 6,734 | 137 | 383 | 6,488 | ||||||
| Total securities – available-for-sale | 88,318 | 85,142 | 3,895 | 719 | 88,318 | ||||||
| Debt securities | 251 | – | – | – | – | ||||||
| Equity securities | 51 | – | – | – | – | ||||||
| Total securities – trading | 302 | – | – | – | – | ||||||
| Own shares | 31 | – | – | – | – | ||||||
| Mortgage loans | 10,350 | – | – | – | – | ||||||
| Other loans | 4,163 | – | – | – | – | ||||||
| Real estate | 7,589 | – | – | – | 10,065 | ||||||
| Short-term investments and other | 7,921 | – | – | – | – | ||||||
| Investments from the insurance business | 118,674 | – | – | – | – | ||||||
| Equity securities | 8,861 | – | – | – | – | ||||||
| Debt securities | 2,653 | – | – | – | – | ||||||
| Short-term investments | 1,284 | – | – | – | – | ||||||
| Real estate | 133 | – | – | – | – | ||||||
| Investments where the investment risk is borne by the policyholder | 12,931 | – | – | – | – | ||||||
| Investments from the insurance business | 131,605 | – | – | – | – | ||||||
| Investments from the insurance business 1) | |||||||||||
| Gross | Gross | ||||||||||
| Amortized | unrealized | unrealized | |||||||||
| As of 31.12.02, in CHF m | Book value | cost | gains | losses | Fair value | ||||||
| Debt securities issued by Swiss Federal Government, cantonal or local governmental entities | 10,814 | 9,951 | 863 | 0 | 10,814 | ||||||
| Debt securities issued by foreign governments | 27,110 | 26,337 | 871 | 98 | 27,110 | ||||||
| Corporate debt securities | 29,042 | 27,478 | 1,717 | 153 | 29,042 | ||||||
| Other | 9,685 | 9,157 | 552 | 24 | 9,685 | ||||||
| Debt securities | 76,651 | 72,923 | 4,003 | 275 | 76,651 | ||||||
| Equity securities | 9,052 | 9,171 | 336 | 455 | 9,052 | ||||||
| Total securities – available-for-sale | 85,703 | 82,094 | 4,339 | 730 | 85,703 | ||||||
| Debt securities | 246 | – | – | – | – | ||||||
| Equity securities | 31 | – | – | – | – | ||||||
| Total securities – trading | 277 | – | – | – | – | ||||||
| Own shares | 44 | – | – | – | – | ||||||
| Mortgage loans | 10,175 | – | – | – | – | ||||||
| Other loans | 4,305 | – | – | – | – | ||||||
| Real estate | 7,431 | – | – | – | 10,057 | ||||||
| Short-term investments and other | 7,120 | – | – | – | – | ||||||
| Investments from the insurance business | 115,055 | – | – | – | – | ||||||
| Equity securities | 9,288 | – | – | – | – | ||||||
| Debt securities | 2,841 | – | – | – | – | ||||||
| Short-term investments | 1,069 | – | – | – | – | ||||||
| Real estate | 197 | – | – | – | – | ||||||
| Investments where the investment risk is borne by the policyholder | 13,395 | – | – | – | – | ||||||
| Investments from the insurance business | 128,450 | – | – | – | – | ||||||
| 1) Certain reclassifications have been made to conform to the current presentation. | |||||||||||
INFORMATION FOR INVESTORS
| Credit Suisse Group shares | ||||
| Ticker symbols | ||||
| Stock exchange listings | Bloomberg | Reuters | Telekurs | |
| SWX Swiss Exchange/virt-x | CSGN VX | CSGZn.VX | CSGN,380 | |
| Frankfurt | CSX GR | CSGZn.DE | CSX,013 | |
| New York (ADS) | 1) | CSR US | CSR.N | CSR,065 |
| 1) 1 ADS represents 1 registered share. | ||||
| Swiss security number | 1213853 | |||
| ISIN number | CH0012138530 | |||
| German security number | DE 876 800 | |||
| CUSIP number | 225 401 108 | |||
| Ratings | |||||||||||||||
| Agencies | Credit Suisse Group | Credit Suisse | Credit Suisse First Boston | Winterthur | |||||||||||
| Long term | Short term | Long term | Short term | Long term | Short term | ||||||||||
| Moody’s, New York | Aa3 | – | Aa3 | P1 | Aa3 | P1 | A1 | ||||||||
| Standard & Poor’s, New York | A | A1 | A+ | A1 | A+ | A1 | A | ||||||||
| Fitch Ratings, New York | AA– | F1+ | AA– | F1+ | AA– | F1+ | AA– | ||||||||
| Financial calendar | |
| Second quarter results 2003 | Tuesday, August 5, 2003 |
| Third quarter results 2003 | Tuesday, November 4, 2003 |
Enquiries
Credit Suisse Group
Investor Relations
Gerhard Beindorff, Marc Buchheister
Tel. +41 1 333 4570/+41 1 333 3169
Fax +41 1 333 2587
Credit Suisse Group
Media Relations
Karin Rhomberg Hug, Claudia Kraaz
Tel. +41 1 333 8844
Fax +41 1 333 8877
Financial Publications
Printed financial publications may be ordered from:
Credit Suisse
KIDM 23
Uetlibergstrasse 231
8070 Zurich
Switzerland
Fax +41 1 332 7294
www.credit-suisse.com/results/order.html
In this year’s corporate reports, we have chosen the work of Swiss artist Daniel Grobet to represent Credit Suisse Group’s 360° approach to finance. In his hand-crafted iron sculptures, Daniel achieves a harmonious balance by carefully combining static and dynamic elements.

Credit Suisse Group
Paradeplatz 8 P.O. Box 1
8070 Zurich Switzerland
Tel. +41 1 212 1616
Fax +41 1 333 2587
www.credit-suisse.com
5520124
English
| QUARTERLY RESULTS 2003 | Q1 | |
PRESENTATION
 | CONSOLIDATED RESULTS |
| CREDIT SUISSE FINANCIAL SERVICES |
| CREDIT SUISSE FIRST BOSTON |
| SUMMARY |
| CAUTIONARY STATEMENT REGARDING FORWARD-LOOKING INFORMATION |
 | Slide 1 |
FIRST QUARTER 2003 NET PROFIT OVERVIEW
| in CHF m | Q1/03 | 4Q/02 | 1Q/02 | |||||
| Credit Suisse | ||||||||
| Financial Services | 666 | 705 | 592 | |||||
| Credit Suisse | ||||||||
| First Boston | 221 | (1,252 | ) | (32 | ) | |||
| Corporate Center & adjustments | (235 | ) | (403 | ) | (192 | ) | ||
| Group reported net profit/(loss) | 652 | (950 | ) | 368 | ||||
| Amortization of acquired intangible assets and goodwill | 232 | 348 | 385 | |||||
| Exceptional items (1) | - | 1,462 | - | |||||
| Cumulative effect of change in accounting principle | - | (520 | ) | - | ||||
| Tax impact | (28 | ) | (190 | ) | (67 | ) | ||
| Group net operating profit | 856 | 150 | 686 | |||||
| (1) | for more information about these items, please refer to the "Quarterly Report Q4 and Financial Review 2002" which is posted on our website at www.credit-suisse.com |
| Slide 2 |
HIGHLIGHTS OF Q1 RESULTS
| Demonstrates the success of efforts to return the Group to profitability | ||||
| Lower costs were a factor in all business areas | ||||
| Despite challenges, the Group's franchise has remained strong | ||||
| Return to stronger revenues in CSFB Fixed Income | ||||
| Increased net new assets at Private Banking | ||||
| Selective premium growth at Winterthur, focussing on profitability | ||||
| Delivering on the key priorities set in Q3/02 | ||||
| Further strengthen capital base | ||||
| Realign Winterthur to respond to the new operating environment | ||||
| Refocus and reduce the cost run-rates in European Private Banking | ||||
| Bring costs in line with revenues at CSFB | ||||
| Slide 3 |
OPERATING INCOME
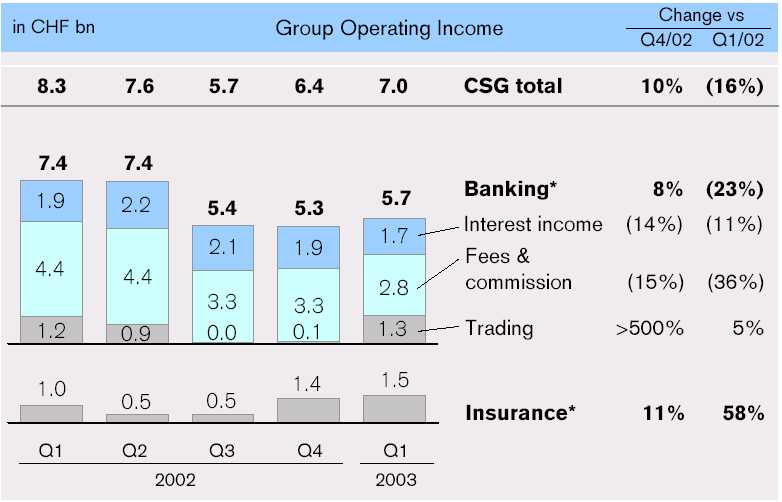
| * excluding other ordinary income/(expenses), net |
| Slide 4 |
OPERATING EXPENSES AND DEPRECIATION
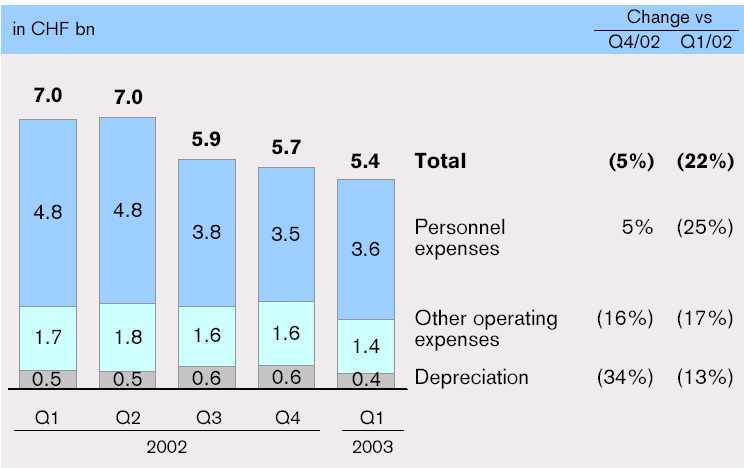
| Slide 5 |
PROVISIONS
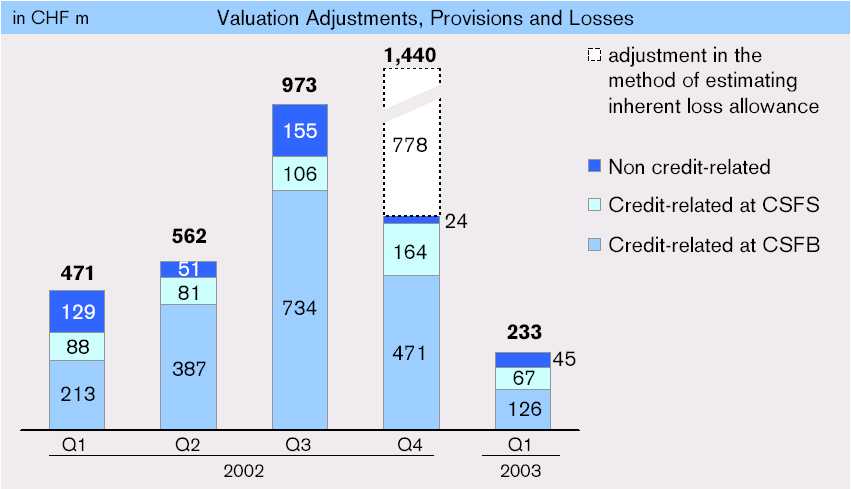
Note: Totals include Corporate Center and adjustments but exclude exceptional provisions of CHF 984 m in Q4/02
| Slide 6 |
IMPAIRED LOANS
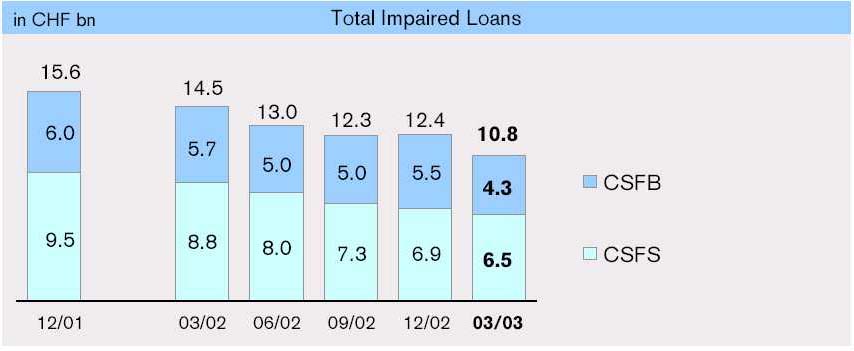
| 6.0% | 5.0% | 5.1% | 4.6% | 4.9% | 4.1% | Impaired loans as % of due from banks and customers (1) | |
| 59.5% | 60.4% | 60.2% | 60.0% | 62.3% | 63.8% | Valuation allowance as % of impaired loans | |
| (1) | due from banks and customers and mortgages (excluding securities lending and reverse repurchase agreements) |
| Slide 7 |
BANKING CAPITAL RATIOS
AS OF MARCH 31, 2003
| in CHF m | Credit Suisse | (1) | Credit Suisse First Boston | (1) | CSG Consolidated | |
| Book equity | 6,739 | 19,659 | 31,402 | |||
| Deduction of goodwill | (275 | ) | (8,145 | ) | (10,022 | ) |
| Other tier 1 adjustments | (246 | ) | (282 | ) | (862 | ) |
| Tier 1 capital | 6,218 | 11,232 | 20,517 | |||
| acquired intangible assets | 70 | 1,881 | (2) | 1,948 | ||
| hybrid capital | - | 1,012 | 2,146 | |||
| BIS risk-weighted assets | 82,801 | 107,320 | 205,548 | |||
| Tier 1 capital ratio | 7.5% | 10.5% | 10.0% | |||
| excl. acquired intangible assets | 7.4% | 9.0% | 9.2% | |||
| (1) | consolidated banking entities Credit Suisse and Credit Suisse First Boston |
| (2) | net of tax liability |
| Slide 8 |
| PRESENTATION | |
| CONSOLIDATED RESULTS |
| CREDIT SUISSE FINANCIAL SERVICES |
| CREDIT SUISSE FIRST BOSTON |
| SUMMARY |
| | CAUTIONARY STATEMENT REGARDING FORWARD-LOOKING INFORMATION |
| Slide 9 |
| CREDIT SUISSE FINANCIAL SERVICES OVERVIEW |
| Results Q1/2003 | Net profit of CHF 666 m, up 13% vs Q1/02 (down 6% vs Q4/02) | |||
| Net operating profit of CHF 690 m, up 11% vs Q1/02 (up 29% vs Q4/02) | ||||
| All segments with improved results vs Q4/02, leading to an ROE of 22.6% | ||||
| Highlights Q1/2003 | Progress in cost management | |||
 | operating expenses in banking segments down 9% vs Q4/02 | |||
| administration costs in insurance segments down 6% vs Q1/02 | |||
| Increasing NNA in Private Banking and improved investment income in insurance segments | ||||
| Realignment of the Winterthur organization well on track | ||||
| Refocusing of European Private Banking almost completed | ||||
| Outlook | Good progress towards our goal to return to solid profitability in 2003 | |||
| CSFS remains exposed to continued volatility in the financial markets, particularly in Life & Pensions | ||||
| Slide 10 |
PRIVATE BANKING
![]()
| Gross margin (bp) | 126 | 120 | 107 | 112 | 114 | |
| NNA(CHF bn) | 9.2 | 5.6 | 3.4 | 0.9 | 1.5 | |
| Q1 | Q2 | Q3 | Q4 | Q1 | ||
| 2002 | 2003 | |||||
| Key Profit & Loss Items | ||||||
| Change vs | ||||||
| in CHF m | Q1/03 | Q4/02 | Q1/02 | |||
| Operating income | 1,310 | (2%) | (21%) | |||
| Operating expenses | 771 | (7%) | (8%) | |||
| Operating income in line with 2H/2002 but down 21% vs Q1/02 | ||||||
| Progress in cost management | ||||||
| Gross margin stable (112bp for Q4/02, restated for transfer of affluent clients to CRB, formerly published 118bp) | ||||||
| Increased net new assets | ||||||
| Slide 11 |
PRIVATE BANKING
REDUCTION IN OPERATING INCOME Q1/03 vs Q1/02
| Lower transaction volume driven by investor passivity (brokerage down 36%, trading income down 30%) | |||
| CHF 75 bn lower AuM base driven by lower equity valuations (53%) and FX impact (47%) | |||
| Lower interest margin on liabilities driven by low interest rate environment | |||
| Slide 12 |
CORPORATE & RETAIL BANKING
| Key Profit & Loss Items | ||||||||
| Change vs | ||||||||
| in CHF m | Q1/03 | Q4/02 | Q1/02 | |||||
| Operating income | 734 | 3% | (7%) | |||||
| Operating expenses | 473 | (14%) | (3%) | |||||
| Provisions (2) | 77 | (1%) | (13%) | |||||
| Operating income slightly up vs Q4/02 while further progress in cost management and a seasonally lower cost level in Q1 | ||||||||
| Effective credit losses CHF 24 m below statistical valuation adjustments | ||||||||
| NNA outflow of CHF 3.4 bn due to shifts from time deposits to transaction accounts in corporate banking | ||||||||
| (1) | operating |
| (2) | valuation adjustments, provisions and losses (provisions based on expected credit losses derived from statistical model) |
| Slide 13 |
LIFE & PENSIONS
| Expense ratio (%) | 6.4 | 14.6 | 14.6 | 13.4 | 6.8 | |||
| Return on invested assets (%) | 3.2 | 0.1 | 1.2 | 1.2 | 4.9 | |||
| Q1 | Q2 | Q3 | Q4 | Q1 | ||||
| 2002 | 2003 | |||||||
| (1) | death and other benefits incurred & change in provision for future policyholder benefits (technical) |
| (2) | excluding separate account business |
| Key Profit & Loss Items | |||||
| in CHF m | Q1/03 | Change vs Q1/02 | |||
| Gross premiums written | 6,499 | (4% | ) | ||
| Benefits & claims (1) | (6,971 | ) | (2% | ) | |
| Policy acquisition costs | (120 | ) | 50% | ||
| Administration costs | (322 | ) | (6% | ) | |
| Investment income (2) | 1,221 | 54% | |||
| Premiums (GPW) down 4% due to selective underwriting / renewals and exceptionally strong single life business in Q1/02 | ||
| Lower administration costs offset by higher acquisition costs mainly due to accelerated DAC depreciation, in line with investment income development | ||
| Expense ratio up slightly by 0.4 ppts to 6.8% | ||
| Investment income significantly improved |
| Slide 14 |
INSURANCE
![]()
| Combined ratio (%) | 103.9 | 103.7 | 102.8 | 103.2 | 100.7 | |||||
| Return on invested assets (%) | 1.2 | (3.8 | ) | 1.6 | 0.5 | 3.5 | ||||
| Q1 | Q2 | Q3 | Q4 | Q1 | ||||||
| 2003 | ||||||||||
| Change vs | ||||
| in CHF m | Q1/03 | Q1/02 | ||
| Net premiums earned | 3,978 | 6 | % | |
| Claims & annuities | (2,826 | ) | 0 | % |
| Policy acquisition costs | (710 | ) | 24 | % |
| Administration costs | (472 | ) | (6 | %) |
| Investment income | 289 | 232 | % | |
| Premiums (NPE) up 6% driven by tariff increases | |
| Lower administration costs offset by higher acquisition costs mainly related to strong organic growth and to the effect of fully integrating the book of business acquired from Prudential plc | |
| Underwriting result improved by CHF 137 m leading to a combined ratio of 100.7% | |
| Investment income up significantly, driven by lower impairments |
| Slide 15 |
| PRESENTATION | |
| CONSOLIDATED RESULTS |
| CREDIT SUISSE FINANCIAL SERVICES |
| CREDIT SUISSE FIRST BOSTON |
| SUMMARY |
| CAUTIONARY STATEMENT REGARDING FORWARD-LOOKING INFORMATION |
| Slide 16 |
CREDIT SUISSE FIRST BOSTON
OVERVIEW
| Results Q1/2003 | | Net operating profit of USD 292 m, up from USD 11 m in Q4/02 | ||
| and up 88% vs Q1/02 | ||||
| Net profit of USD 161 m vs net loss of CHF 811 m in Q4/02 | |||
| and net loss of USD 19 m in Q1/02 | ||||
| Operating income up 24% vs Q4/02, driven by Fixed Income | |||
| Up 34% vs Q4/02 and down 5% vs Q1/02 when adjusting for | |||
| Pershing consolidation differences | ||||
| Substantial reduction in credit provisions | |||
| Highlights Q1/2003 | | Finalized agreement with regulators to settle industry-wide | ||
| investigations | ||||
| Completed sale of Pershing | |||
| Further key senior management appointments | |||
| (Jerry Wood in Fixed Income, Michael Kenneally at CSAM) | ||||
| Recovery of Fixed Income revenue momentum | |||
| Slide 17 |
CREDIT SUISSE FIRST BOSTON
KEY FINANCIAL RESULTS
| 2002 | 2003 | ||||||||||
| in USD m | Q1 | Q2 | Q3 | Q4 | Q1 | ||||||
| Operating income | 3,277 | 3,493 | 2,638 | 2,361 | 2,920 | ||||||
| proforma excl. Pershing | 3,046 | 3,277 | 2,428 | 2,166 | 2,905 | ||||||
| Operating expenses | 2,583 | 2,655 | 2,169 | 1,870 | 2,169 | ||||||
| proforma excl. Pershing | 2,414 | 2,490 | 1,997 | 1,714 | 2,169 | ||||||
| Provisions | 202 | 260 | 560 | 657 | 128 | ||||||
| Net operating profit (1) | 155 | 229 | (255 | ) | 11 | 292 | |||||
| Operating ROE (1) (%) | 6.9 | 9.9 | (11.8 | ) | 0.4 | 12.4 | |||||
| Pre-tax margin (1) (%) | 5.0 | 7.7 | (17.0 | ) | (8.3 | ) | 13.2 | ||||
| Personnel expenses / | |||||||||||
| operating income (1) (%) | 55.2 | 55.0 | 52.7 | 44.5 | 51.7 | ||||||
| Number of employees | 25,970 | 25,265 | 24,961 | 23,424 | 19,218 | (2) | |||||
| (1) | excludes exceptional items, cumulative effect of change in accounting principle and amortization of acquired intangible assets and goodwill |
(2) | Q1/03 excludes Pershing headcount of 3,913 |
| Slide 18 |
INSTITUTIONAL SECURITIES
OVERVIEW
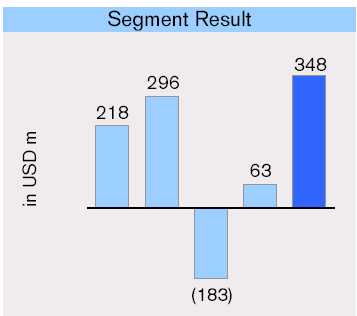 |
| Value at Risk (1-day, 99%) in USD m | |||||||||||
| Period end | 52.5 | 59.3 | 38.9 | 41.3 | 54.5 | ||||||
| Average | 49.2 | 46.4 | 43.7 | 39.4 | 49.2 | ||||||
| Pre-tax (1) | 9.9 | 13.0 | (15.4 | ) | (5.9 | ) | 18.4 | ||||
| Margin(%) | |||||||||||
| Q1 | Q2 | Q3 | Q4 | Q1 | |||||||
| 2002 | 2003 | ||||||||||
| (1) operating | |||||||||||
| Key Profit & Loss Items | |||||||
| Change vs | |||||||
| in USD m | Q1/03 | Q4/02 | Q1/02 | ||||
| Operating income | 2,616 | 39% | (5% | ) | |||
| Personnel expenses | 1,361 | 64% | (12% | ) | |||
| Other operating expenses | 574 | (10% | ) | (7% | ) | ||
| Provisions | 112 | (83% | ) | (44% | ) | ||
| Strong Fixed Income performance but continued low levels of equity new issuance and M&A | ||
| Improved results on non-continuing businesses versus significant write-offs in 2002 | ||
| Personnel expenses reflect increase in incentive compensation due to rise in operating income | ||
| Q4/02 provisions included USD 340 m reserve for losses inherent in non-impaired portfolio | ||
| Slide 19 |
INSTITUTIONAL SECURITIES OPERATING INCOME
| Up 142% vs Q4/02, driven by developed credit products, including increase in investment grade secondary trading, increased mortgage activity and NCFE in Q4/02 | ||||
Increase in interest rate derivatives, favorably impacted by steep yield curve and increased volatility | ||||
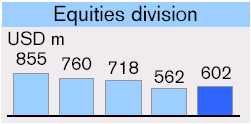 | Up 7% vs Q4/02, driven by customer volume in options and structured product derivatives | |||
| Growth in prime banking business | ||||
| Cash business down due to decline in customer volume, lower margins and reduced equity new issuance | ||||
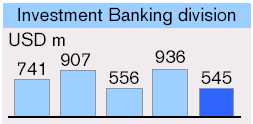 | Down 42% vs Q4/02, (Q4 incl. USD 309 m Swiss Re gain) | |||
| Lower equity new issuance; industry-wide volume fell 24% | ||||
| M&A in line with Q4/02, despite 19% lower industry volume | ||||
Increased high-yield issuance volume and market share | ||||
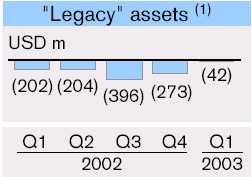 | Significant decrease in write-offs on non-continuing business | |||
| Net exposure reduced to USD 2.7 bn from USD 3.0 bn at 12/02 | ||||
(1) includes provisions
| Slide 20 |
CSFB FINANCIAL SERVICES
OVERVIEW
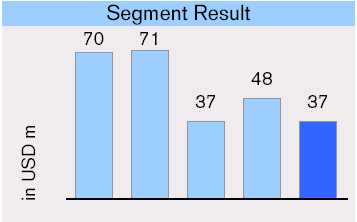
| Net new assets (USD bn) | |||||||||||
| CSAM | (2.3 | ) | (4.1 | ) | (7.9 | ) | (5.8 | ) | (3.8 | ) | |
| PCS | 1.8 | 1.4 | 0.1 | 1.8 | 1.1 | ||||||
| Total | (0.5 | ) | 2.7 | (7.8 | ) | (4.0 | ) | (2.7 | ) | ||
| AuM | 361 | 363 | 336 | 350 | 342 | ||||||
| (USD bn) | |||||||||||
| Pre-tax (1) | 18.1 | 17.9 | 9.6 | 13.9 | 15.1 | ||||||
| Margin (%) | |||||||||||
| Q1 | Q2 | Q3 | Q4 | Q1 | |||||||
2002 | 2003 | ||||||||||
Key Profit & Loss Items | ||||||
Change vs | ||||||
in USD m | Q1/03 | Q4/02 | Q1/02 | |||
| Operating income | 304 | (37% | ) | (43% | ) | |
| proforma excl. Pershing | 289 | 0% | (5% | ) | ||
| Operating expenses | 234 | (41% | ) | (44% | ) | |
| proforma excl. Pershing | 234 | (3% | ) | (5% | ) | |
| Provisions | 16 | – | 443% | |||
| Change to Pershing consolidation distorts comparison to previous quarters – proforma comparison more meaningful | |
| CSAM operating income down, impacted by net outflow of assets, market depreciation and seasonal impact of performance fees | |
| PCS impacted by weak equity market |
| (1) operating |
| Slide 21 |
| PRESENTATION | |
| CONSOLIDATED RESULTS | |
| CREDIT SUISSE FINANCIAL SERVICES | |
| CREDIT SUISSE FIRST BOSTON | |
| SUMMARY | |
| CAUTIONARY STATEMENT REGARDING | |
| FORWARD-LOOKING INFORMATION | |
| Slide 22 |
SUMMARY
| While the level of performance is not yet satisfactory, the Group made progress towards its goal to return to solid profitability in 2003 | ||
| Key priorities for long-term success remain valid | ||
| Continued growth of our client franchise | ||
| Strict cost control | ||
| Sustained profitability | ||
| Strong capital base | ||
| Given the continued challenging market environment and global uncertainty, Credit Suisse Group remains cautious in its outlook for 2003 | ||
| Slide 23 |
Cautionary statement regarding forward-looking information
This presentation contains forward-looking statements within the meaning of the Private Securities Litigation Reform Act of 1995. Forward-looking statements involve inherent risks and uncertainties, and we might not be able to achieve the predictions, forecasts, projections and other outcomes we describe or imply in forward-looking statements. A number of important factors could cause results to differ materially from the plans, objectives, expectations, estimates and intentions we express in these forward-looking statements, including those we identify in "Risk Factors" in our Annual Report on Form 20-F for the fiscal year ended December 31, 2002 filed with the US Securities and Exchange Commission, and in other public filings and press releases. We do not intend to update these forward-looking statements except as may be required by applicable laws. |
 | Slide 24 |
![]()
| SUPPLEMENTS TO THE FIRST QUARTER 2003 PRESENTATION |
CONTENT
| Supplement Slide 1 |
PRIVATE BANKING
DEVELOPMENT OF GROSS MARGIN
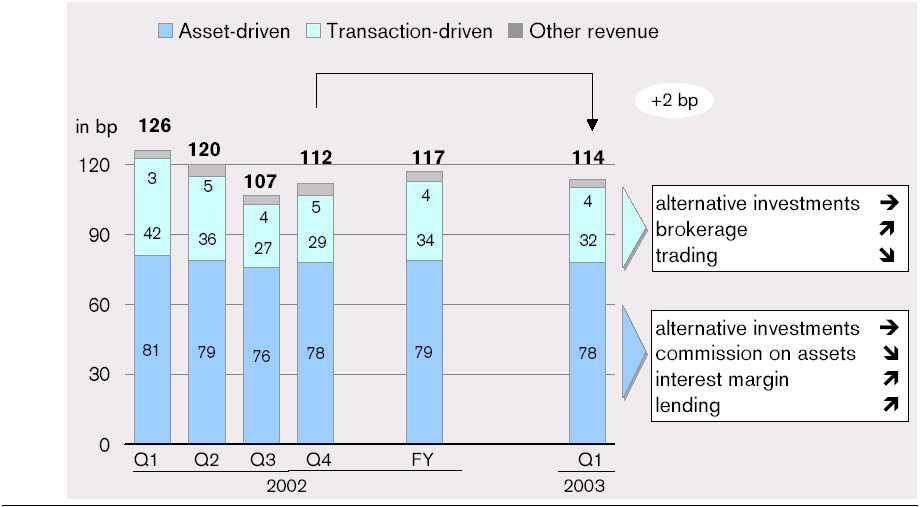
| Supplement Slide 2 |
PRIVATE BANKING
AUM BY PRODUCT & CURRENCY
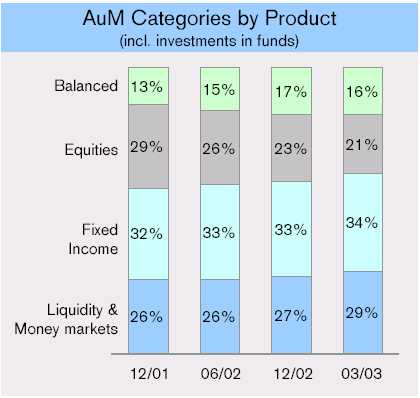 | 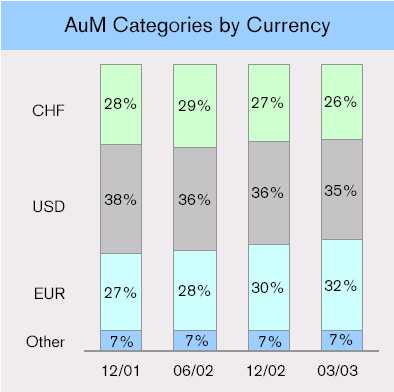 | |
| Supplement Slide 3 |
| WINTERTHUR GROUP INVESTMENT RESULT (1) | (1/2) |
| 2002(1) | 2003(1) | |||||||||||||||||
| 12M/02(1) | Q1 | Q2 | Q3 | Q4 | Q1 | |||||||||||||
| Current income | 5,096 | 1,236 | 1,435 | 1,203 | 1,222 | 1,255 | ||||||||||||
| Realized gains | 5,421 | 1,346 | 1,389 | 2,353 | 333 | 1,327 | ||||||||||||
| Realized losses | (4,738 | ) | (647 | ) | (2,129 | ) | (1,589) | (373 | ) | (633 | ) | |||||||
| Impairments | (3,887 | ) | (942 | ) | (857 | ) | (1,413) | (675 | ) | (328 | ) | |||||||
| Other | (464 | ) | (114 | ) | (100 | ) | (135) | (115 | ) | (111 | ) | |||||||
| Investment Income (P&L) | 1,428 | 879 | (262 | ) | 419 | 392 | 1,510 | |||||||||||
| (1) | general account only |
| Note: Q1 to Q3 2002 reclassified to the current presentation format, including real estate for own use, interest paid from current income and realized gains/losses to other | |
| Supplement Slide 4 |
| WINTERTHUR GROUP INVESTMENT RESULT (1) | (2/2) |
| Development of gross unrealized losses in equity portfolio | |
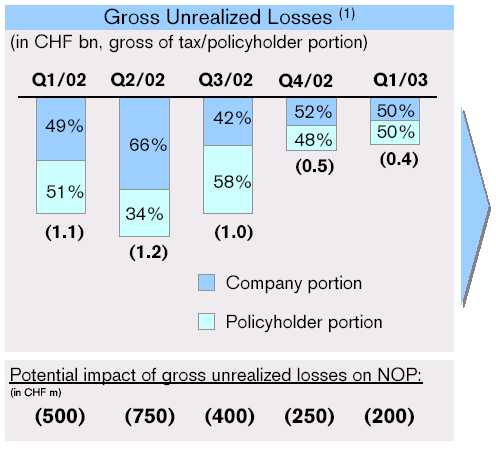
| Given flat markets, unrealized losses are recognized in the P&L after 6 months as an impairment | ||
| NOP impact highly country-specific depending on whether the investment risk is borne by the company or the policyholder | ||
| Further improvement in reducing unrealized losses on equities | ||
| Taking only the NOP-relevant portion into account, unrealized losses decreased 20% to the level of CHF 200 m | ||
| (1) | general account only |
| Supplement Slide 5 |
WINTERTHUR GROUP
INVESTMENT PORTFOLIO – ASSET ALLOCATION
| Responsive to equity market development | ||
| reduction of equity securities from CHF 9.1 bn (7%) to CHF 6.6 bn (5%) in Q1/2003 | ||
| "investment view" equity exposure stands at 5.9 bn (4.6%) (1) | ||
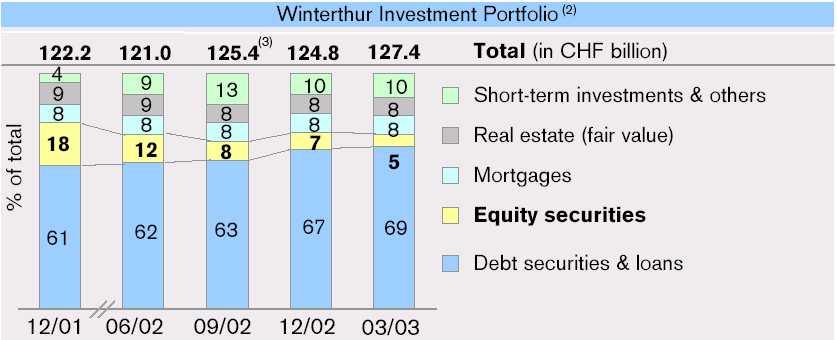
| (1) | investment view excludes CHF 0.7 bn of participations in bond funds and special funds classified as equities under accounting rules |
| (2) | all investments incl. real estate at market value; excluding separate account (i.e. unit-linked) business |
| (3) | reduced by CHF 4.5 bn vs reported figures due to trade accounting on purchased bonds and maturing money market transactions (settlement date) |
| Supplement Slide 6 |
WINTERTHUR GROUP
EQUITY BASE DEVELOPMENT IN 2003
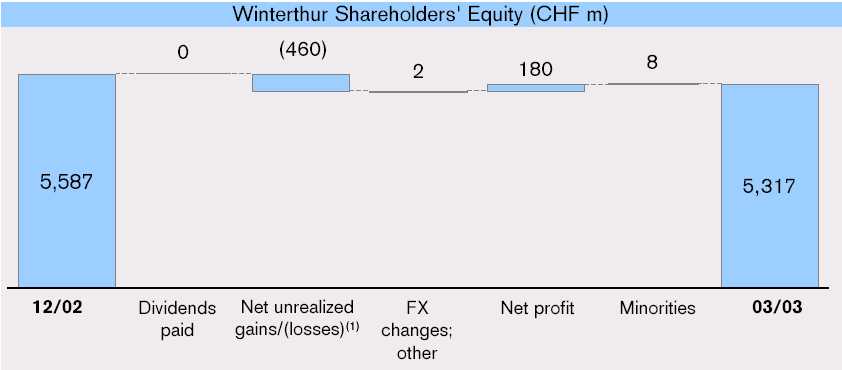
(1) net of tax / shadow
| Supplement Slide 7 |
CREDIT SUISSE FIRST BOSTON
REVENUE DETAIL 2002 AND Q1/03
| Investment Banking Division (1) | ||||||||||
| 2002 | 2003 | |||||||||
| in USD m | Q1 | Q2 | Q3 | Q4 | Q1 | |||||
| Private Equity | 133 | 186 | 141 | 397 | 77 | |||||
| Debt Capital Markets | 100 | 94 | 28 | 64 | 85 | |||||
| Equity Capital Markets | 117 | 153 | 74 | 92 | 29 | |||||
| Advisory | 344 | 444 | 280 | 357 | 296 | |||||
| Other | 47 | 30 | 33 | 26 | 58 | |||||
| Total | 741 | 907 | 556 | 936 | 545 | |||||
| (1) | previous quarters have been restated and reflect the movement of the results of certain non-continuing private equity assets from |
| Investment Banking Division to Other Division | |
| Note: IBD results reflect the impact of various divisional sharing arrangements of operating income amongst the divisions | |
| Supplement Slide 8 |
CREDIT SUISSE FIRST BOSTON
"LEGACY" ASSETS EXPOSURE
| in USD m | "Legacy" Assets Net Exposure | |||||||
| 8,964 | Real Estate | |||||||
| 12/1999 | 11,925 | 1,975 | Distressed | |||||
| 986 | Private Equity (1,228 unfunded commitments) | |||||||
| 4,805 | Real Estate | |||||||
| 12/2000 | 8,026 | 1,498 | Distressed | |||||
| 1,724 | Private Equity (984 unfunded commitments) | |||||||
| 2,925 | Real Estate | |||||||
| 12/2001 | 5,357 | 1,107 | Distressed | |||||
| 1,325 | Private Equity (857 unfunded commitments) | Note: - Unfunded commitments excluded for Private Equity | ||||||
| 1,535 | Real Estate | |||||||
| 12/2002 | 3,031 | 512 | Distressed | |||||
| 984 | Private Equity (785 unfunded commitments) |
| ||||||
| 1,185 | Real Estate | |||||||
| 03/2003 | 2,727 | 508 | Distressed | |||||
| 1,034 | Private Equity (911 unfunded commitments)(1) | |||||||
| (1) | A fund previously reported in the Fixed Income division that is in the process of liquidation has been transferred to "Legacy". The related exposure as of March 31, 2003 was USD 95 m. |
| Supplement Slide 9 |
CREDIT SUISSE FIRST BOSTON
"LEGACY" ASSETS P&L CHARGES
| Charges related to "legacy" assets in CSFB's income statement | ||||||||
| in USD m | Real Estate | Distressed Portfolio | Private Equity | Total | ||||
| Q1/03 | ||||||||
| Operating Income | 7 | (20 | ) | (29 | ) | (42 | ) | |
| Provisions | - | - | - | - | ||||
| Taxes | (2 | ) | 6 | 8 | 12 | |||
| Net Operating Profit/(Loss) | 5 | (14 | ) | (21 | ) | (30 | ) | |
| 2002 | ||||||||
| Operating Income | (120 | ) | (523 | ) | (275 | ) | (919 | ) |
| Provisions | (154 | ) | - | - | (154 | ) | ||
| Taxes | 77 | 147 | 77 | 301 | ||||
| Net Operating Profit/(Loss) | (197 | ) | (377 | ) | (199 | ) | (773 | ) |
| Supplement Slide 10 |
CREDIT SUISSE FIRST BOSTON
COUNTERPARTY EXPOSURE BY INDUSTRY
| Selected CSFB Exposures (as of March 31, 2003) | |||||
| in USD m | |||||
| Industry | Current exposure | Undrawn commitm. | Total exposure | ||
| Telecom service providers | 2,038 | 1,289 | 3,327 | ||
| Telecom manufacturing | 244 | 83 | 327 | ||
| Merchant energy | 1,043 | 253 | 1,296 | ||
| Airlines | 778 | 74 | 852 | ||
Note:
Current exposure equals committed amount (includes only drawn commitments) for lending plus mark-to-market for counterparty trading less credit protection
| Supplement Slide 11 |
Cautionary statement regarding
forward-looking information
This presentation contains forward-looking statements within the meaning of the Private Securities Litigation Reform Act of 1995.
Forward-looking statements involve inherent risks and uncertainties, and we might not be able to achieve the predictions, forecasts, projections and other outcomes we describe or imply in forward-looking statements.
A number of important factors could cause results to differ materially from the plans, objectives, expectations, estimates and intentions we express in these forward-looking statements, including those we identify in “Risk Factors” in our Annual Report on Form 20-F for the fiscal year ended December 31, 2002 filed with the US Securities and Exchange Commission, and in other public filings and press releases.
We do not intend to update these forward-looking statements except as may be required by applicable laws.
| Supplement Slide 12 |
Signatures
Pursuant to the requirements of the Securities Exchange Act of 1934, the registrant has duly caused this report to be signed on its behalf by the undersigned, thereunto duly authorized.
| CREDIT SUISSE GROUP | |
| (Registrant) | |
| Date May 6, 2003 | By: /s/ David Frick |
| (Signature)* | |
| Member of the Executive Board | |
| By: /s/ Karin Rhomberg Hug | |
| (Signature)* | |
| Managing Director |