FORM 6-K
SECURITIES AND EXCHANGE COMMISSION
Washington, D.C. 20549
Report of Foreign Private Issuer
Dated August 5, 2003
Pursuant to Rule 13a-16 or 15d-16
of the Securities Exchange Act of 1934
For the month of August 5, 2003
Commission File Number 001-15244
CREDIT SUISSE GROUP
(Translation of registrant's name into English)
Paradeplatz 8, P.O. Box 1, CH-8070 Zurich, Switzerland
(Address of principal executive offices)
Indicate by check mark whether the registrant files or will file annual reports under cover Form 20-F or Form 40-F.
Form 20-F ![]() Form 40-F
Form 40-F ![]()
Indicate by check mark if the registrant is submitting the Form 6-K in paper as permitted by Regulation S-T Rule 101(b)(1):
Note: Regulation S-T Rule 101(b)(1) only permits the submission in paper of a Form 6-K if submitted solely to provide an attached annual report to security holders.
Indicate by check mark if the registrant is submitting the Form 6-K in paper as permitted by Regulation S-T Rule 101(b)(7):
Note: Regulation S-T Rule 101(b)(7) only permits the submission in paper of a Form 6-K if submitted to furnish a report or other document that the registrant foreign private issuer must furnish and make public under the laws of the jurisdiction in which the registrant is incorporated, domiciled or legally organized (the registrant's "home country"), or under the rules of the home country exchange on which the registrant's securities are traded, as long as the report or other document is not a press release, is not required to be and has not been distributed to the registrant's security holders, and, if discussing a material event, has already been the subject of a Form 6-K submission or other Commission filing on EDGAR.
Indicate by check mark whether by furnishing the information contained in this Form, the registrant is also thereby furnishing the information to the Commission pursuant to Rule 12g3-2(b) under the Securities Exchange Act of 1934.
Yes ![]() No
No ![]()
If "Yes" is marked, indicate below the file number assigned to the registrant in connection with Rule 12g3-2(b): 82-
|
e-mail media.relations@credit-suisse.com |
| CREDIT SUISSE GROUP DOUBLES NET PROFIT IN THE SECOND QUARTER 2003 TO CHF 1.3 BILLION AND REPORTS NET PROFIT OF CHF 2.0 BILLION FOR THE FIRST HALF 2003 |
| Both Business Units Report Significantly Improved Results |
| Financial Highlights | |||||||||
| in CHF million | 2Q2003 | 1Q2003 | Change in % | 6 months | Change in % | ||||
| vs 1Q2003 | 2003 | vs 6m 2002 | |||||||
| Operating income | 7,549 | 7,024 | 7 | 14,573 | -9 | ||||
| Operating expenses | 5,071 | 5,020 | 1 | 10,091 | -23 | ||||
| Net profit | 1,346 | 652 | 106 | 1,998 | n/a | ||||
| Return on equity in % | 18.5 | 9.2 | 101 | 13.8 | n/a | ||||
| Earnings per share (in CHF) | 1.09 | 0.53 | 106 | 1.62 | n/a | ||||
| n/a: not applicable | |||||||||
Zurich, August 5, 2003 – Credit Suisse Group today announced a net profit of CHF 1.3 billion for the second quarter of 2003 and a net profit of CHF 2.0 billion for the first half of 2003. Net profit for the second quarter of 2003 was more than double that of the first quarter of 2003. Credit Suisse First Boston achieved solid results in the second quarter of 2003, driven by strong performance in the Institutional Securities segment. At Credit Suisse Financial Services, both Private Banking and Corporate & Retail Banking increased their operating income substantially, while Winterthur’s results continued to improve in the second quarter of 2003, with reduced administration costs in both insurance segments.
 |
1
Oswald J. Grübel, Co-CEO of Credit Suisse Group and Chief Executive Officer of
Credit Suisse Financial Services, stated, "The doubling of the Group’s net profit in the second quarter of 2003 demonstrates the underlying strength of our businesses. I am pleased that all segments of Credit Suisse Financial Services again reported stronger results compared with the first quarter of 2003, reflecting healthier operating income and the success of our efficiency measures."
John J. Mack, Co-CEO of Credit Suisse Group and Chief Executive Officer of Credit Suisse First Boston, said, "Credit Suisse First Boston’s results firmly underscore its top-line momentum in the second quarter of 2003 and the strength of its franchise. Although many markets remain challenging, we are both confident that the Group will continue to make progress towards its goal of achieving sound profitability in 2003.”
Group Results: Second Quarter of 2003
Credit Suisse Group reported a net profit of CHF 1.3 billion in the second quarter of 2003. The second quarter 2003 net profit increased CHF 694 million compared with the first quarter of 2003 and represents a strong improvement compared with the net loss of CHF 579 million in the second quarter of 2002. The Group’s operating income was CHF 7.5 billion in the second quarter of 2003, up 7% on the first quarter of 2003 and down slightly compared with the second quarter of 2002. The Group’s operating expenses increased 1% compared with the first quarter of 2003 to CHF 5.1 billion – mainly reflecting increased incentive compensation accruals due to improved performance – but were down 23% compared with the second quarter of 2002. The Group’s valuation adjustments, provisions and losses were CHF 131 million in the second quarter of 2003, down 44% or CHF 102 million compared with the first quarter of 2003 and down 77% or CHF 431 million compared with the second quarter of 2002, due predominantly to lower valuations, provisions and losses at Credit Suisse First Boston, reflecting an improved credit environment and recoveries. Earnings per share for the second quarter of 2003 were CHF 1.09, compared with CHF 0.53 for the first quarter of 2003. The Group’s return on equity was 18.5% in the second quarter of 2003, compared with 9.2% for the first quarter of 2003.
2
Credit Suisse Group continued to strengthen its capital base during the second quarter of 2003, due primarily to earnings generation, managed balance sheet growth and the sale of non-core businesses (Pershing). The Group’s consolidated BIS tier 1 ratio was 11.1% as of June 30, 2003, an increase from 10.0% as of March 31, 2003. In cooperation with the Swiss Federal Banking Commission, the capital treatment of the Group’s investment in Winterthur is being refined; this will have an effect on the consolidated BIS capital calculations. The capital charge for the Winterthur Group investment will no longer be reflected as an addition to risk-weighted assets but as a reduction to regulatory capital. Subsequent to final regulatory approval, the revised methodology is expected to be applied as of the period ended September 30, 2003. If this methodology was applied retroactively, the Group’s consolidated BIS tier 1 ratio would be 10.3% as of June 30, 2003, compared with 9.3% as of March 31, 2003.
Winterthur’s announced divestitures of Churchill in the UK, Winterthur Italy and Republic in the US are expected to further improve the Group’s capital base upon completion in the second half of 2003. The synthetic securitization of prime Swiss residential mortgages of approximately CHF 3.0 billion, originated by the Corporate & Retail Banking segment, is also expected to have a positive effect on the Group’s capital position in the second half of 2003.
Group Results: First Half of 2003
The Group reported a net profit of CHF 2.0 billion for the first half of 2003, compared with a net loss of CHF 211 million for the first half of 2002. The Group’s operating income was CHF 14.6 billion for the first six months of 2003, down 9% compared with the first half of 2002, while the Group’s first half 2003 operating expenses decreased 23% to CHF 10.1 billion over the same period in 2002.
3
Credit Suisse Financial Services
| CSFS Business Unit Result | |||||||||
| in CHF million | 2Q2003 | 1Q2003 | Change in % | 6 months | Change in % | ||||
| vs 1Q2003 | 2003 | vs 6m 2002 | |||||||
| Operating income | 3,435 | 3,393 | 1 | 6,828 | 13 | ||||
| Operating expenses | 2,100 | 2,148 | -2 | 4,248 | -8 | ||||
| Business unit result | 808 | 666 | 21 | 1,474 | 400 | ||||
| Net profit | 829 | 684 | 21 | 1,513 | 418 | ||||
Credit Suisse Financial Services reported improved results across all of its segments in the second quarter of 2003. The business unit recorded a net profit of CHF 829 million for the second quarter of 2003, up CHF 145 million compared with the first quarter of 2003 and up CHF 1.1 billion compared with the second quarter of 2002. Taking account of statistical rather than actual credit provisions, Credit Suisse Financial Services reported a business unit profit of CHF 808 million in the second quarter of 2003, corresponding to an increase of CHF 142 million compared with the first quarter of 2003 and of CHF 1.1 billion compared with the second quarter of 2002. Second quarter 2003 operating income of CHF 3.4 billion increased 1% compared with the first quarter of 2003 and was up 26% compared with the second quarter of 2002, while operating expenses were down 2% compared with the first quarter of 2003 and down 12% versus the second quarter of 2002.
| CSFS Segment Results | |||||||||
| in CHF million | 2Q2003 | 1Q2003 | Change in % | 6 months | Change in % | ||||
| vs 1Q2003 | 2003 | vs 6m 2002 | |||||||
| Private Banking | 469 | 371 | 26 | 840 | -22 | ||||
| Corporate & Retail Banking | 157 | 124 | 27 | 281 | 9 | ||||
| Life & Pensions | 117 | 111 | 5 | 228 | n/a | ||||
| Insurance | 102 | 92 | 11 | 194 | n/a | ||||
4
Private Banking reported a segment profit of CHF 469 million in the second quarter of 2003, up 26% compared with the first quarter of 2003 and in line with the strong second quarter of 2002. Operating income increased 9% compared with the first quarter of 2003 – driven mainly by higher transaction-based income – but declined 8% compared with the second quarter of 2002, due mainly to a lower asset base. Operating expenses increased CHF 22 million, or 3%, to CHF 793 million compared with the first quarter of 2003, as the reduction in base salary costs in line with headcount development was exceeded by higher performance-related compensation accruals and charges for headcount reductions. Compared with the second quarter of 2002, operating expenses decreased CHF 89 million, or 10%, reflecting ongoing efficiency measures. The cost/income ratio improved for the third consecutive quarter, declining 4.6 percentage points to 58.6% from the first quarter. The gross margin increased to 120.4 bp in the second quarter of 2003, compared with 113.8 bp in the first quarter of 2003 and 120.1 bp in the second quarter of 2002.
Corporate & Retail Banking reported a segment profit of CHF 157 million in the second quarter of 2003, up 27% compared with the first quarter of 2003 and up 41% compared with the second quarter of 2002. Operating income rose 7% compared with the first quarter of 2003 to CHF 784 million, due mainly to realized gains from the recovery portfolio within other ordinary income, and higher interest and trading income, but was practically unchanged compared with the second quarter of 2002. Second quarter 2003 operating expenses rose by CHF 11 million, or 2%, compared with the first quarter of 2003, to CHF 484 million, due to higher personnel expenses. A reduction in base salary costs in line with headcount development was exceeded by higher performance-related compensation accruals and charges for headcount reductions. Compared with the second quarter of 2002, operating expenses decreased CHF 68 million, or 12%, due to ongoing efficiency measures. The cost/income ratio improved further in the second quarter of 2003 to 64.8%, compared with 67.4% in the first quarter of 2003 and 72.5% in the second quarter of 2002. The return on average allocated capital increased compared with the first quarter of 2003 from 10.7% to 13.3%.
5
Life & Pensions reported a segment profit of CHF 228 million in the first half of 2003, compared with a segment loss of CHF 412 million in the first half of 2002. This result was driven primarily by a significant improvement in investment performance as well as a reduction in administration costs. In the second quarter of 2003, the segment profit increased by CHF 6 million, or 5%, to CHF 117 million, compared with the first quarter of 2003. In the first half of 2003, gross premiums written declined 3%, or CHF 293 million, to CHF 10.0 billion, compared with the first half of 2002. Adjusted for acquisitions, divestitures and exchange rate impacts, the volume of gross premiums written decreased 1% compared with the first half of 2002. Administration costs decreased 17% to CHF 599 million in the first half of 2003, and the expense ratio improved by 0.6 percentage points to 8.4%, compared with the first half of 2002. Investment income increased CHF 1.7 billion to CHF 2.5 billion in the first half of 2003 compared with the first half of 2002, due primarily to a significant decrease in impairments and realized losses on equity investments.
Insurance reported a segment profit of CHF 194 million in the first half of 2003, compared with a segment loss of CHF 637 million in the first half of 2002. This recovery was driven primarily by a significant improvement in the Insurance segment’s underwriting results due to the implementation of broad-based tariff increases, a continued strict underwriting policy, a significant improvement in investment performance and reduced administration costs. In the second quarter of 2003, the segment profit increased by CHF 10 million, or 11%, to CHF 102 million, compared with the first quarter of 2003. For the first half of 2003, net premiums earned rose 4% compared with the first half of 2002, to CHF 8.1 billion, and – adjusted for acquisitions, divestitures and exchange rate impacts – were up 10%. The Insurance segment reported an improvement in net investment income from a loss of CHF 179 million in the first half of 2002 to income of CHF 604 million in the first half of 2003, due primarily to a significant decrease in impairments and realized losses on equity investments.
6
Credit Suisse First Boston
| CSFB Business Unit Result | |||||||||
| in USD million | 2Q2003 | 1Q2003 | Change in % | 6 months | Change in % | ||||
| vs 1Q2003 | 2003 | vs 6m 2002 | |||||||
| Operating income | 3,187 | 2,920 | 9 | 6,107 | -10 | ||||
| Operating expenses | 2,328 | 2,169 | 7 | 4,497 | -14 | ||||
| Net profit | 296 | 161 | 84 | 457 | n/a | ||||
Credit Suisse First Boston’s results are reported and discussed below on a US dollar basis.
At Credit Suisse First Boston, increased operating income and continued cost control were the primary factors driving the improved performance compared with the first quarter of 2003. The business unit reported a net profit of USD 296 million (CHF 395 million) in the second quarter of 2003, compared with a net profit of USD 161 million (CHF 221 million) in the first quarter of 2003 and a net profit of USD 61 million (CHF 101 million) in the second quarter of 2002. Excluding the amortization of acquired intangible assets and goodwill net of tax, net operating profit increased 46% to USD 426 million (CHF 570 million) compared with the first quarter of 2003 and was up 86% compared with the second quarter of 2002. Excluding Pershing, which was sold to The Bank of New York effective May 1, 2003, net operating profit increased 55% compared with the first quarter of 2003 and 105% compared with the second quarter of 2002. Operating income increased 9% from the first quarter of 2003 to USD 3.2 billion (CHF 4.2 billion), mainly reflecting broad performance improvements across products and geographies and continued tight expense controls. Operating expenses rose 7% compared with the first quarter of 2003 – due mainly to increased incentive compensation accruals linked to improved performance – but declined 12% compared with the second quarter of 2002, reflecting headcount reductions and cost containment efforts. For the second quarter of 2003, Credit Suisse First Boston reported an 18.5% operating return on average allocated capital and an 18.3% operating pre-tax margin, compared with an operating return on average allocated capital of 12.4% and an operating pre-tax margin of 13.2% in the first quarter of 2003.
7
| CSFB Segment Results | |||||||||
| in USD million | 2Q2003 | 1Q2003 | Change in % | 6 months | Change in % | ||||
| vs 1Q2003 | 2003 | vs 6m 2002 | |||||||
| Institutional Securities | 470 | 348 | 35 | 818 | 59 | ||||
| CSFB Financial Services | 38 | 37 | 3 | 75 | -47 | ||||
Institutional Securities reported a segment profit of USD 470 million (CHF 628 million) for the second quarter of 2003, compared with USD 348 million (CHF 476 million) in the first quarter of 2003 and USD 296 million (CHF 477 million) in the second quarter of 2002. Operating income increased 10% to USD 2.9 billion (CHF 3.8 billion) from the first quarter of 2003, with the Fixed Income division continuing to report strong results – comparable to first quarter levels – led by leveraged finance and mortgages, where Credit Suisse First Boston ranked number one in global high yield new issues and global commercial mortgage-backed securities transactions. Revenue increased compared with the first quarter of 2003 in both the Equity and Investment Banking divisions. Operating income in the second quarter of 2003 decreased 2% compared with the second quarter of 2002. Expense trends for the segment were consistent with those of Credit Suisse First Boston overall.
8
CSFB Financial Services reported a segment profit of USD 38 million (CHF 50 million) for the second quarter of 2003, up 3% compared with the first quarter of 2003 but down 46% compared with the second quarter of 2002, primarily reflecting the sale of Pershing. Operating income of USD 299 million (CHF 397 million) for the second quarter of 2003 was down 2% compared with the first quarter of 2003 and 46% compared with the second quarter of 2002. Excluding Pershing (whose 2003 net results are shown in operating income net of expenses), operating income increased 3% compared with the first quarter of 2003, due mainly to improved results at Credit Suisse Asset Management, and declined 13% compared with the second quarter of 2002, due mainly to lower results at Private Client Services. In the second quarter of 2003, operating expenses increased 5% compared with the first quarter of 2003 but were down 42% compared with the second quarter of 2002. Excluding Pershing, operating expenses in the second quarter of 2003 were down 5% compared with the second quarter of 2002.
Net New Assets
Credit Suisse Group recorded a net asset inflow of CHF 2.3 billion in the second quarter of 2003, compared with a net asset outflow of CHF 3.5 billion in the first quarter of 2003. The Group’s total assets under management were CHF 1,234.2 billion as of June 30, 2003. This corresponds to an increase of 6.4% compared with March 31, 2003, primarily reflecting the recent improvements in the markets. Credit Suisse Financial Services reported net new assets of CHF 4.8 billion in the second quarter of 2003, with net inflows of CHF 3.8 billion at Private Banking, CHF 0.5 billion at Corporate & Retail Banking and CHF 0.5 billion at Life & Pensions. Credit Suisse First Boston reported a net asset outflow of CHF 2.5 billion in the second quarter of 2003, as CHF 1.0 billion of net new assets at Institutional Securities was offset by net outflows of CHF 3.5 billion from CSFB Financial Services (CHF 1.7 billion from Credit Suisse Asset Management and CHF 1.8 billion from Private Client Services).
9
| Net New Assets and Assets under Management (AuM) in the second quarter of 2003 | |||||
| in CHF billion | Net New Assets | Total AuM | Change in AuM in | ||
| % vs 31.03.03 | |||||
| Private Banking | 3.8 | 493.8 | 8.1 | ||
| Corporate & Retail Banking | 0.5 | 66.8 | 4.2 | ||
| Life & Pensions | 0.5 | 117.0 | 4.7 | ||
| Insurance | n/a | 32.6 | 5.2 | ||
| Credit Suisse Financial Services | 4.8 | 710.2 | 7.0 | ||
| Institutional Securities | 1.0 | 31.0 | 0.6 | ||
| CSFB Financial Services | -3.5 | 493.0 | 5.8 | ||
| Credit Suisse First Boston | -2.5 | 524.0 | 5.5 | ||
| Credit Suisse Group | 2.3 | 1,234.2 | 6.4 | ||
Outlook
Given the current business environment, Credit Suisse Group expects continued sound profitability for 2003, although many of the Group’s markets remain challenging. The Group anticipates that operating income will remain strong in the banking industry – albeit with a seasonally lower third quarter in Private Banking – and expects improved technical results in the insurance segments going forward. Life & Pensions and Credit Suisse First Boston remain exposed to the volatility of the capital markets. A strong client focus, further improvements in efficiency and revenue growth remain the key priorities across the Group.
Enquiries
Credit Suisse Group, Media Relations Telephone +41 1 333 8844
Credit Suisse Group, Investor Relations Telephone +41 1 333 4570
10
Commentary on Results – Non-GAAP Financial Information
For additional information with respect to Credit Suisse Group’s results for the second quarter and first half of 2003, we refer you to the Group’s Quarterly Report Q2 2003, as well as the Group’s slide presentation for analysts and press, posted on the Internet at www.credit-suisse.com/results. This press release may contain non-GAAP financial information. A reconciliation of such non-GAAP financial information to the most directly comparable measures under Swiss Generally Accepted Accounting Principles (as well as other related information) is also included in the Quarterly Report Q2 2003. The segment results described above represent net operating profit before minority interests, excluding acquisition-related costs.
Credit Suisse Group
Credit Suisse Group is a leading global financial services company headquartered in Zurich. The business unit Credit Suisse Financial Services provides private clients and small and medium-sized companies with Private Banking and financial advisory services, banking products, and Pension and Insurance solutions from Winterthur. The business unit Credit Suisse First Boston, an Investment Bank, serves global institutional, corporate, government and individual clients in its role as a financial intermediary. Credit Suisse Group’s registered shares (CSGN) are listed in Switzerland and Frankfurt, and in the form of American Depositary Shares (CSR) in New York. The Group employs around 72,500 staff worldwide. As of June 30, 2003, it reported assets under management of CHF 1,234.2 billion.
Cautionary Statement Regarding Forward-looking Information
This press release contains statements that constitute forward-looking statements. In addition, in the future we, and others on our behalf, may make statements that constitute forward-looking statements. Such forward-looking statements may include, without limitation, statements relating to our plans, objectives or goals; our future economic performance or prospects; the potential effect on our future performance of certain contingencies; and assumptions underlying any such statements. Words such as “believes,” “anticipates,” “expects,” "intends” and “plans” and similar expressions are intended to identify forward-looking statements but are not the exclusive means of identifying such statements. We do not intend to update these forward-looking statements except as may be required by applicable laws. By their very nature, forward-looking statements involve inherent risks and uncertainties, both general and specific, and risks exist that predictions, forecasts, projections and other outcomes described or implied in forward-looking statements will not be achieved. We caution you that a number of important factors could cause results to differ materially from the plans, objectives, expectations, estimates and intentions expressed in such forward-looking statements. These factors include (i) market and interest rate fluctuations; (ii) the strength of the global economy in general and the strength of the economies of the countries in which we conduct our operations in particular; (iii) the ability of counterparties to meet their obligations to us; (iv) the effects of, and changes in, fiscal, monetary, trade and tax policies, and currency fluctuations; (v) political and social developments, including war, civil unrest or terrorist activity; (vi) the possibility of foreign exchange controls, expropriation, nationalization or confiscation of assets in countries in which we conduct our operations; (vii) the ability to maintain sufficient liquidity and access capital markets; (viii) operational factors such as systems failure, human error, or the failure to properly implement procedures; (ix) actions taken by regulators with respect to our business and practices in one or more of the countries in which we conduct our operations; (x) the effects of changes in laws, regulations or accounting policies or practices; (xi) competition in geographic and business areas in which we conduct our operations; (xii) the ability to retain and recruit qualified personnel; (xiii) the ability to maintain our reputation and promote our brands; (xiv) the ability to increase market share and control expenses; (xv) technological changes; (xvi) the timely development and acceptance of our new products and services and the perceived overall value of these products and services by users; (xvii) acquisitions, including the ability to integrate successfully acquired businesses; (xviii) the adverse resolution of litigation and other contingencies; and (xix) our success at managing the risks involved in the foregoing. We caution you that the foregoing list of important factors is not exclusive; when evaluating forward-looking statements, you should carefully consider the foregoing factors and other uncertainties and events, as well as the risks identified in our most recently filed Form 20-F and reports on Form 6-K furnished to the US Securities and Exchange Commission.
Cautionary statement regarding non-GAAP financial information
This press release may contain non-GAAP financial information. A reconciliation of such non-GAAP financial information to the most directly comparable measures under generally accepted accounting principles, is posted on our website at http://www.credit-suisse.com/sec.html.
11
Today’s Presentation of the Results
| Speakers | |
| • | Oswald J. Grübel, Co-CEO of Credit Suisse Group and Chief Executive Officer of Credit Suisse Financial Services |
| • | John J. Mack, Co-CEO of Credit Suisse Group and Chief Executive Officer of Credit Suisse First Boston |
| • | Philip K. Ryan, Chief Financial Officer of Credit Suisse Group |
| • | Ulrich Körner, Chief Financial Officer of Credit Suisse Financial Services |
| • | Barbara Yastine, Chief Financial Officer of Credit Suisse First Boston |
| Analysts’ presentation, Zurich (English) | |
| • | August 5, 2003, 9.00 am CET / 7.00 am GMT / 3.00 am EST at the Credit Suisse Forum St. Peter, Zurich |
| • | Internet: |
| - | Live broadcast at www.credit-suisse.com/results | |
| - | Video playback available approximately 3 hours after the event |
| • | Telephone: |
| - | Live audio dial-in on +41 91 610 5600 (Europe), +44 866 291 4166 (UK), or +1 207 107 0611 (US), ask for “Credit Suisse Group quarterly results”; please dial in 10 minutes before the start of the presentation | |
| - | Telephone replay available approximately 1 hour after the event on | |
| +41 91 612 4330 (Europe), +44 207 866 4300 (UK) or +1 412 858 1440 (US), conference ID 090# | ||
| Media conference, Zurich (English/German) | |
| • | August 5, 2003, 11.00 am CET / 9.00 am GMT / 5.00 am EST at the Credit Suisse Forum St. Peter, Zurich |
| • | Simultaneous interpreting: German – English, English – German |
| • | Internet: |
| - | Live broadcast at www.credit-suisse.com/results | |
| - | Video playback available approximately 3 hours after the event |
| • | Telephone: | |
| - | Live audio dial-in on +41 91 610 5600 (Europe), +44 866 291 4166 (UK), or +1 207 107 0611 (US), ask for “Credit Suisse Group quarterly results”; please dial in 10 minutes before the start of the presentation | |
| - | Telephone replay available approximately 1 hour after the event on +41 91 612 4330 (Europe), +44 207 866 43 00 (UK) or +1 412 858 1440 (US), conference ID 285# (English)or 270# (German) |
12

QUARTERLY REPORT 2003 Q2


Co-CEO Credit Suisse Group
Chief Executive Officer
Credit Suisse Financial Services

Co-CEO Credit Suisse Group
Chief Executive Officer
Credit Suisse First Boston
August 2003
| Consolidated income statement | ||||||||||||||||||
| Change | Change | Change | ||||||||||||||||
| in % from | in % from | in % from | ||||||||||||||||
| 6 months | ||||||||||||||||||
| in CHF m | 2Q2003 | 1Q2003 | 2Q2002 | 1Q2003 | 2Q2002 | 2003 | 2002 | 2002 | ||||||||||
| Operating income | 7,549 | 7,024 | 7,647 | 7 | (1) | 14,573 | 15,977 | (9) | ||||||||||
| Gross operating profit | 2,478 | 2,004 | 1,079 | 24 | 130 | 4,482 | 2,911 | 54 | ||||||||||
| Net profit/(loss) | 1,346 | 652 | (579) | 106 | – | 1,998 | (211) | – | ||||||||||
| Return on equity | ||||||||||||||||||
| Change | Change | Change | ||||||||||||||||
| in % from | in % from | in % from | ||||||||||||||||
| 6 months | ||||||||||||||||||
| in % | 2Q2003 | 1Q2003 | 2Q2002 | 1Q2003 | 2Q2002 | 2003 | 2002 | 2002 | ||||||||||
| Return on equity | 18.5 | 9.2 | (6.6) | 101 | – | 13.8 | (1.2) | – | ||||||||||
| Consolidated balance sheet | ||||||||||||
| Change | Change | |||||||||||
| in % from | in % from | |||||||||||
| in CHF m | 30.06.03 | 31.03.03 | 31.12.02 | 31.03.03 | 31.12.02 | |||||||
| Total assets | 1,016,645 | 992,143 | 955,656 | 2 | 6 | |||||||
| Shareholders' equity | 33,428 | 31,402 | 31,394 | 6 | 6 | |||||||
| Minority interests in shareholders' equity | 2,940 | 2,879 | 2,878 | 2 | 2 | |||||||
| Capital data | ||||||||||||
| Change | Change | |||||||||||
| in % from | in % from | |||||||||||
| in CHF m | 30.06.03 | 31.03.03 | 31.12.02 | 31.03.03 | 31.12.02 | |||||||
| BIS risk-weighted assets | 204,820 | 205,548 | 201,466 | 0 | 2 | |||||||
| BIS tier 1 capital | 22,784 | 20,517 | 19,544 | 11 | 17 | |||||||
| of which non-cumulative perpetual preferred securities | 2,167 | 2,146 | 2,162 | 1 | 0 | |||||||
| BIS total capital | 36,950 | 34,685 | 33,290 | 7 | 11 | |||||||
| Capital ratios | ||||||||
| in % | 30.06.03 | 31.03.03 | 31.12.02 | |||||
| BIS tier 1 ratio | Credit Suisse | 7.5 | 7.5 | 7.4 | ||||
| Credit Suisse First Boston 1) | 11.0 | 10.5 | 10.3 | |||||
| Credit Suisse Group 2) 3) | 11.1 | 10.0 | 9.7 | |||||
| BIS total capital ratio | Credit Suisse Group 3) | 18.0 | 16.9 | 16.5 | ||||
| Assets under management/client assets | ||||||||||||
| Change | Change | |||||||||||
| in % from | in % from | |||||||||||
| in CHF bn | 30.06.03 | 31.03.03 | 31.12.02 | 31.03.03 | 31.12.02 | |||||||
| Advisory assets under management | 628.5 | 588.5 | 605.6 | 7 | 4 | |||||||
| Discretionary assets under management | 605.7 | 572.0 | 589.7 | 6 | 3 | |||||||
| Total assets under management | 1,234.2 | 1,160.5 | 1,195.3 | 6 | 3 | |||||||
| Client assets | 1,324.6 | 1,256.7 | 1,793.2 | 5 | (26) | |||||||
| Net new assets | ||||||||||||||||||
| Change | Change | Change | ||||||||||||||||
| in % from | in % from | in % from | ||||||||||||||||
| 6 months | ||||||||||||||||||
| in CHF bn | 2Q2003 | 1Q2003 | 2Q2002 | 1Q2003 | 2Q2002 | 2003 | 2002 | 2002 | ||||||||||
| Net new assets | 2.3 | (3.5) | 4.2 | – | (45) | (1.2) | 17.7 | – | ||||||||||
| 1) Ratio is based on a tier 1 capital of CHF 11.3 bn (31.03.03: CHF 11.2 bn; 31.12.02: CHF 10.6 bn), of which non-cumulative perpetual preferred securities is CHF 1.0 bn (31.03.03: CHF 1.0 bn; 31.12.02: CHF 1.0 bn). | ||||||||||||||||||
| 2) Ratio is based on a tier 1 capital of CHF 22.8 bn (31.03.03: CHF 20.5 bn; 31.12.02: CHF 19.5 bn), of which non-cumulative perpetual preferred securities is CHF 2.2 bn (31.03.03: CHF 2.1 bn; 31.12.02: CHF 2.2 bn). | ||||||||||||||||||
| 3) In cooperation with the Swiss Federal Banking Commission, the capital treatment of the Group’s investment in Winterthur is being refined; this will have an effect on the consolidated BIS capital calculations. If this new methodology was applied retroactively, the Group’s consolidated BIS tier 1 ratio would be 10.3% (31.03.03: 9.3%; 31.12.02: 9.0%). The Group’s BIS total capital ratio would be 15.7% (31.03.03: 14.9%; 31.12.02: 14.4%). | ||||||||||||||||||
| Number of employees (full-time equivalents) | |||||||||||||
| Change | Change | ||||||||||||
| in % from | in % from | ||||||||||||
| 30.06.03 | 31.03.03 | 31.12.02 | 31.03.03 | 31.12.02 | |||||||||
| Switzerland | banking | 20,541 | 20,952 | 21,270 | (2) | (3) | |||||||
| insurance | 6,797 | 6,876 | 7,063 | (1) | (4) | ||||||||
| Outside Switzerland | banking | 20,108 | 20,726 | 25,057 | (3) | (20) | |||||||
| insurance | 25,055 | 24,817 | 25,067 | 1 | 0 | ||||||||
| Total employees Credit Suisse Group | 72,501 | 73,371 | 78,457 | (1) | (8) | ||||||||
| Share data | |||||||||||
| Change | Change | ||||||||||
| in % from | in % from | ||||||||||
| 30.06.03 | 31.03.03 | 31.12.02 | 31.03.03 | 31.12.02 | |||||||
| Shares issued | 1,189,980,152 | 1,189,891,720 | 1,189,891,720 | 0 | 0 | ||||||
| To be issued upon conversion of MCS 1) | 40,413,838 | 40,413,838 | 40,413,838 | 0 | 0 | ||||||
| Shares outstanding | 1,230,393,990 | 1,230,305,558 | 1,230,305,558 | 0 | 0 | ||||||
| Share price in CHF | 35.65 | 23.50 | 30.00 | 52 | 19 | ||||||
| Market capitalization in CHF m | 43,864 | 28,912 | 36,909 | 52 | 19 | ||||||
| Book value per share in CHF | 24.78 | 23.18 | 23.18 | 7 | 7 | ||||||
| 1) Maximum number of shares related to Mandatory Convertible Securities (MCS) issued by Credit Suisse Group Finance (Guernsey) Ltd. in December 2002. | |||||||||||
| Share price | |||||||||||||||||
| Change | Change | Change | |||||||||||||||
| in % from | in % from | in % from | |||||||||||||||
| 6 months | |||||||||||||||||
| in CHF | 2Q2003 | 1Q2003 | 2Q2002 | 1Q2003 | 2Q2002 | 2003 | 2002 | 2002 | |||||||||
| High (closing price) | 39.30 | 34.45 | 63.50 | 14 | (38) | 39.30 | 73.60 | (47) | |||||||||
| Low (closing price) | 23.25 | 20.70 | 41.65 | 12 | (44) | 20.70 | 41.65 | (50) | |||||||||
| Calculation of earnings per share (EPS) | |||||||||||||||||
| Change | Change | Change | |||||||||||||||
| in % from | in % from | in % from | |||||||||||||||
| 6 months | |||||||||||||||||
| 2Q2003 | 1Q2003 | 2Q2002 | 1Q2003 | 2Q2002 | 2003 | 2002 | 2002 | ||||||||||
| Net profit/(loss) in CHF m | 1,346 | 652 | (579) | 106 | – | 1,998 | (211) | – | |||||||||
| Diluted net profit/(loss) in CHF m | 1,346 | 652 | (579) | 106 | – | 1,998 | (211) | – | |||||||||
| Weighted average shares outstanding | 1,230,330,673 | 1,230,305,558 | 1,189,243,577 | 1) | 0 | 3 | 1,230,318,185 | 1,189,147,860 | 1) | 3 | |||||||
| Dilutive impact 2) | 4,922,814 | 2,015,114 | 0 | 144 | – | 2,258,634 | 0 | – | |||||||||
| Weighted average shares, diluted | 1,235,253,487 | 1,232,320,672 | 1,189,243,577 | 0 | 4 | 1,232,576,819 | 1,189,147,860 | 4 | |||||||||
| Basic earnings per share in CHF | 1.09 | 0.53 | (0.49) | 106 | – | 1.62 | (0.18) | – | |||||||||
| Diluted earnings per share in CHF | 1.09 | 0.53 | (0.49) | 106 | – | 1.62 | (0.18) | – | |||||||||
| 1) Adjusted for weighted average shares repurchased. | |||||||||||||||||
| 2) The calculation for the diluted loss per share in 2Q2002 and for the 6 months 2002 excludes the effect of the potential exchange of convertible bonds and the potential exercise of options to purchase shares, as the effect would be anti-dilutive. | |||||||||||||||||

Equity capital
Net new assets
Operating income and expenses
Valuation adjustments, provisions and losses
Stock-based compensation
Outlook
| Overview of Credit Suisse Group 1) | |||||||||||||||||||||||||
| Credit Suisse Financial Services | Credit Suisse First Boston | Corporate Center | Credit Suisse Group | ||||||||||||||||||||||
| in CHF m | 2Q2003 | 1Q2003 | 2Q2002 | 2Q2003 | 1Q2003 | 2Q2002 | 2Q2003 | 1Q2003 | 2Q2002 | 2Q2003 | 1Q2003 | 2Q2002 | |||||||||||||
| Operating income | 3,435 | 3,451 | 2,655 | 3,996 | 3,752 | 5,276 | 118 | (179) | (284) | 7,549 | 7,024 | 7,647 | |||||||||||||
| Personnel expenses | 1,394 | 1,369 | 1,474 | 2,348 | 2,232 | 3,362 | 82 | 38 | (20) | 3,824 | 3,639 | 4,816 | |||||||||||||
| Other operating expenses | 706 | 779 | 909 | 652 | 667 | 883 | (111) | (65) | (40) | 1,247 | 1,381 | 1,752 | |||||||||||||
| Operating expenses | 2,100 | 2,148 | 2,383 | 3,000 | 2,899 | 4,245 | (29) | (27) | (60) | 5,071 | 5,020 | 6,568 | |||||||||||||
| Gross operating profit | 1,335 | 1,303 | 272 | 996 | 853 | 1,031 | 147 | (152) | (224) | 2,478 | 2,004 | 1,079 | |||||||||||||
| Depreciation of non-current assets 2) | 192 | 220 | 217 | 138 | 130 | 185 | 145 | 70 | 64 | 475 | 420 | 466 | |||||||||||||
| Amortization of acquired intangible assets and goodwill | 27 | 25 | 46 | 201 | 206 | 330 | (5) | 1 | (2) | 223 | 232 | 374 | |||||||||||||
| Valuation adjustments, provisions and losses | 63 | 57 | 103 | 63 | 176 | 420 | 5 | 0 | 39 | 131 | 233 | 562 | |||||||||||||
| Profit/(loss) before extraordinary items and taxes | 1,053 | 1,001 | (94) | 594 | 341 | 96 | 2 | (223) | (325) | 1,649 | 1,119 | (323) | |||||||||||||
| Extraordinary income/(expenses), net | 8 | (51) | 84 | 0 | 0 | 26 | 53 | 2 | 0 | 61 | (49) | 110 | |||||||||||||
| Taxes 3) | (222) | (258) | (378) | (180) | (101) | 0 | 83 | (19) | (39) | (319) | (378) | (417) | |||||||||||||
| Net profit/(loss) before minority interests | 839 | 692 | (388) | 414 | 240 | 122 | 138 | (240) | (364) | 1,391 | 692 | (630) | |||||||||||||
| Minority interests | (10) | (8) | 85 | (19) | (19) | (21) | (16) | (13) | (13) | (45) | (40) | 51 | |||||||||||||
| Net profit/(loss) | 829 | 684 | (303) | 395 | 221 | 101 | 122 | (253) | (377) | 1,346 | 652 | (579) | |||||||||||||
| 1) Business unit results in accordance with Swiss GAAP. For a reconciliation of operating basis business unit results (reflecting the results of the separate segments comprising the business units) to Swiss GAAP basis, please refer to “Reconciliation of operating results to Swiss GAAP”. | |||||||||||||||||||||||||
| 2) Includes amortization of Present Value of Future Profits (PVFP) from the insurance business within Credit Suisse Financial Services. | |||||||||||||||||||||||||
| 3) In 4Q2002, Credit Suisse Group adopted a change in accounting principle relating to the recognition of deferred tax assets on net operating losses. The retroactive application of this change in accounting principle would have resulted in taxes for 2Q2002 for Credit Suisse Financial Services of CHF –196 m, for Credit Suisse First Boston of CHF 192 m, and for Credit Suisse Group of CHF –41 m. | |||||||||||||||||||||||||
| Assets under management/client assets | |||||||||||
| Change | Change | ||||||||||
| in % from | in % from | ||||||||||
| in CHF bn | 30.06.03 | 31.03.03 | 31.12.02 | 31.03.03 | 31.12.02 | ||||||
| Credit Suisse Financial Services | |||||||||||
| Private Banking 1) | |||||||||||
| Assets under management | 493.8 | 457.0 | 465.7 | 8.1 | 6.0 | ||||||
| of which discretionary | 128.3 | 118.2 | 121.5 | 8.5 | 5.6 | ||||||
| Client assets | 522.3 | 486.3 | 494.8 | 7.4 | 5.6 | ||||||
| Corporate & Retail Banking 1) | &nbs p; | ||||||||||
| Assets under management | 66.8 | 64.1 | 70.3 | 4.2 | (5.0) | ||||||
| Client assets | 85.0 | 82.6 | 86.3 | 2.9 | (1.5) | ||||||
| Life & Pensions | |||||||||||
| Assets under management (discretionary) | 117.0 | 111.7 | 110.8 | 4.7 | 5.6 | ||||||
| Client assets | 117.0 | 111.7 | 110.8 | 4.7 | 5.6 | ||||||
| Insurance | |||||||||||
| Assets under management (discretionary) | 32.6 | 31.0 | 30.7 | 5.2 | 6.2 | ||||||
| Client assets | 32.6 | 31.0 | 30.7 | 5.2 | 6.2 | ||||||
| Credit Suisse Financial Services | |||||||||||
| Assets under management | 710.2 | 663.8 | 677.5 | 7.0 | 4.8 | ||||||
| of which discretionary 1) | 279.1 | 262.1 | 264.2 | 6.5 | 5 .6 | ||||||
| Client assets | 756.9 | 711.6 | 722.6 | 6.4 | 4.7 | ||||||
| Credit Suisse First Boston | |||||||||||
| Institutional Securities | |||||||||||
| Assets under management | 31.0 | 30.8 | 31.3 | 0.6 | (1.0) | ||||||
| of which Private Equity on behalf of clients (discretionary) | 20.6 | 20.8 | 20.9 | (1.0) | (1.4) | ||||||
| Client assets | 74.7 | 79.2 | 83.9 | (5.7) | (11.0) | ||||||
| CSFB Financial Services | |||||||||||
| Assets under management | 493.0 | 465.9 | 486.5 | 5.8 | 1.3 | ||||||
| of which discretionary | 299.9 | 281.9 | 297.2 | 6.4 | 0.9 | ||||||
| Client assets | 493.0 | 465.9 | 986.7 | 5.8 | (50.0) | ||||||
| Credit Suisse First Boston | |||||||||||
| Assets under management | 524.0 | 496.7 | 517.8 | 5.5 | 1.2 | ||||||
| of which discretionary | 326.6 | 309.9 | 325.5 | 5.4 | 0.3 | ||||||
| Client assets | 567.7 | 545.1 | 1,070.6 | 4.1 | (47.0) | ||||||
| Credit Suisse Group | |||||||||||
| Assets under management | 1,234.2 | 1,160.5 | 1,195.3 | 6.4 | 3.3 | ||||||
| of which discretionary 1) | 605.7 | 572.0 | 589.7 | 5.9 | 2 .7 | ||||||
| Client assets | 1,324.6 | 1,256.7 | 1,793.2 | 5.4 | (26.1) | ||||||
| 1) 2002 comparative figures have been restated to reflect the realignment of the private client business as of 01.01.2003. This entailed moving certain client segments in Switzerland from Private Banking to Corporate & Retail Banking as well as re-evaluating the balances of 2002 discretionary assets. | |||||||||||
| Net new assets | ||||||||||||||||||
| Change | Change | Change | ||||||||||||||||
| in % from | in % from | in % from | ||||||||||||||||
| 6 months | ||||||||||||||||||
| in CHF bn | 2Q2003 | 1Q2003 | 2Q2002 | 1Q2003 | 2Q2002 | 2003 | 2002 | 2002 | ||||||||||
| Credit Suisse Financial Services | ||||||||||||||||||
| Private Banking 1) | 3.8 | 1.5 | 5.6 | 153.3 | (32.1) | 5.3 | 14.8 | (64.2) | ||||||||||
| Corporate & Retail Banking 1) | 0.5 | (3.4) | 0.3 | – | 66.7 | (2.9) | (1.1) | 163.6 | ||||||||||
| Life & Pensions | 0.5 | 2.2 | 1.3 | (77.3) | (61.5) | 2.7 | 4.3 | (37.2) | ||||||||||
| Credit Suisse Financial Services | 4.8 | 0.3 | 7.2 | – | (33.3) | 5.1 | 18.0 | (71.7) | ||||||||||
| Credit Suisse First Boston | ||||||||||||||||||
| Institutional Securities | 1.0 | (0.1) | 1.4 | – | (28.6) | 0.9 | 4.9 | (81.6) | ||||||||||
| CSFB Financial Services | (3.5) | (3.7) | (4.4) | (5.4) | (20.5) | (7.2) | (5.2) | 38.5 | ||||||||||
| Credit Suisse First Boston | (2.5) | (3.8) | (3.0) | (34.2) | (16.7) | (6.3) | (0.3) | – | ||||||||||
| Credit Suisse Group | 2.3 | (3.5) | 4.2 | – | (45.2) | (1.2) | 17.7 | – | ||||||||||
| 1) 2002 comparative figures have been restated to reflect the realignment of the private client business as of 01.01.2003. This entailed moving certain client segments in Switzerland from Private Banking to Corporate & Retail Banking. | ||||||||||||||||||
Economic Risk Capital
Overall risk trends
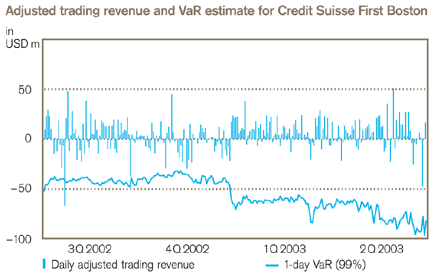
CSFB trading risks
Credit risk exposure
| Key Position Risk Trends | ||||||||
| Change Analysis: Brief Summary | ||||||||
| Change in % from | ||||||||
| in CHF m | 2Q2003 | 1Q2003 | 2Q2002 | 2Q2003 vs 1Q2003 | ||||
| Real Estate ERC & | ||||||||
| Structured Asset ERC 1) | 4,149 | (5%) | (1%) | Lower commercial and residential real estate exposures at CSFB due to securitizations and loan sales as well as lower asset-backed-securities exposures at CSFB following restructurings and pay downs. | ||||
| Developed Market Fixed Income & | ||||||||
| Foreign Exchange ERC | 4,068 | 26% | 1% | Higher foreign exchange exposures at Winterthur and higher credit spread exposures at CSFB. | ||||
| Equity Investment ERC | 3,252 | (4%) | (51%) | Lower traded equity and private equity exposures at CSFB as well as lower equity investment risk at the Corporate Center f ollowing the disposal of the remaining Swiss Life position, partially offset by higher equity position at Winterthur. | ||||
| International Lending ERC | 3,118 | (10%) | (13%) | Reduced lending and counterparty risk at CSFB due to lower exposures, loan sales and counterparty rating upgrades, pa rtially offset by higher credit risk profile associated with Winterthur’s bond portfolio. | ||||
| Swiss & Retail Lending ERC | 1,949 | (5%) | (6%) | Lower lending risk at the CSFS banking and insurance segments | ||||
| Emerging Markets ERC | 1,628 | (7%) | (35%) | Lower Brazil, Venezuela, Russia and South Africa exposures at CSFB. | ||||
| Insurance Underwriting ERC | 1,045 | 3% | 26% | Due to higher Euro exchange rate (no material risk change on a local currency basis). | ||||
| Simple sum across risk categories | 19,209 | |||||||
| Diversification benefit | (7,062) | |||||||
| Total position risk ERC | 12,147 | (3%) | (20%) | |||||
99%, 1-year position risk ERC, excluding foreign exchange translation risk. For an assessment of the total risk profile, operational risk ERC and business risk ERC have to be considered as well. Note that prior period risk data have been restated for methodology changes in order to maintain consistency over time. For a more detailed description of the Group’s ERC model, please refer to Credit Suisse Group's Annual Report 2001 and 2002, which are available on the website: www.credit-suisse.com. | ||||||||
| 1) This category comprises the real estate investments of Winterthur, Credit Suisse First Boston’s commercial real estate exposures, Credit Suisse First Boston’s residential real estate exposures, Credit Suisse First Boston’s asset-backed securities exposures as well as the real estate acquired at auction and real estate for own use in Switzerland. | ||||||||
| CSFB trading exposures (1-day, 99% VaR) | |||||||
| in USD m | 2Q2003 | 1Q2003 | 2Q2002 | ||||
| Total VaR | |||||||
| Period end | 75.6 | 54.5 | 59.3 | ||||
| Average | 64.3 | 49.2 | 46.4 | ||||
| Maximum | 107.9 | 76.3 | 59.3 | ||||
| Minimum | 47.5 | 39.4 | 36.8 | ||||
| in USD m | 30.06.03 | 31.03.03 | 31.12.02 | ||||
| VaR by risk type | |||||||
| Interest rate | 87.2 | 56.9 | 54.7 | ||||
| Foreign exchange | 10.9 | 15.3 | 18.7 | ||||
| Equity | 19.0 | 17.6 | 16.5 | ||||
| Commodity | 0.6 | 0.8 | 0.5 | ||||
| Subtotal | 117.7 | 90.6 | 90.4 | ||||
| Diversification benefit | (42.1) | (36.1) | (31.1) | ||||
| Total | 75.6 | 54.5 | 59.3 | ||||
Credit Suisse First Boston computes these VaR estimates separately for each risk type and for the whole portfolio using the historical simulation methodology. Diversification benefit reflects the net difference between the sum of the 99% percentile loss for each risk type and for the total portfolio. | |||||||
| Total credit risk exposure 1) | |||||||||||||||||||
| Credit Suisse Financial Services | Credit Suisse First Boston | Credit Suisse Group | |||||||||||||||||
| in CHF m | 30.06.03 | 31.03.03 | 31.12.02 | 30.06.03 | 31.03.03 | 31.12.02 | 30.06.03 | 31.03.03 | 31.12.02 | ||||||||||
| Due from banks 2) | 32,482 | 29,889 | 32,752 | 68,037 | 56,851 | 44,016 | 68,939 | 57,569 | 39,469 | ||||||||||
| Due from customers and mortgages 2) | 136,180 | 133,372 | 132,353 | 83,880 | 72,941 | 82,395 | 219,270 | 205,030 | 213,206 | ||||||||||
| Total due from banks and customers, gross 2) | 168,662 | 163,261 | 165,105 | 151,917 | 129,792 | 126,411 | 288,209 | 262,599 | 252,675 | ||||||||||
| Contingent liabilities | 12,330 | 12,460 | 12,349 | 29,586 | 28,280 | 27,862 | 41,056 | 39,866 | 39,104 | ||||||||||
| Irrevocable commitments 3) | 3,670 | 2,917 | 2,263 | 80,773 | 76,281 | 81,884 | 85,036 | 80,293 | 85,333 | ||||||||||
| Total banking products | 184,662 | 178,638 | 179,717 | 262,276 | 234,353 | 236,157 | 414,301 | 382,758 | 377,112 | ||||||||||
| Loans held for sale 4) | 0 | 0 | – | 16,338 | 18,373 | – | 16,338 | 18,373 | – | ||||||||||
| Derivative instruments 5) | 2,390 | 1,957 | 2,375 | 58,478 | 56,230 | 54,243 | 59,618 | 57,016 | 54,757 | ||||||||||
| Securities lending – banks | 0 | 0 | 0 | 0 | 37 | 0 | 0 | 37 | 0 | ||||||||||
| Securities lending – customers | 0 | 0 | 0 | 69 | 30 | 64 | 69 | 30 | 64 | ||||||||||
| Reverse repurchase agreements – banks | 2,311 | 2,052 | 2,270 | 148,620 | 157,862 | 158,544 | 146,443 | 156,312 | 156,397 | ||||||||||
| Reverse repurchase agreements – customers | 8,084 | 11,989 | 13,944 | 52,734 | 53,399 | 57,571 | 60,536 | 65,081 | 71,384 | ||||||||||
| Forward reverse repurchase agreements | 0 | 0 | 0 | 13,855 | 12,262 | 7,617 | 13,855 | 12,262 | 7,617 | ||||||||||
| Total traded products | 12,785 | 15,998 | 18,589 | 273,756 | 279,820 | 278,039 | 280,521 | 290,738 | 290,219 | ||||||||||
| Total credit risk exposure, gross | 197,447 | 194,636 | 198,306 | 552,370 | 532,546 | 514,196 | 711,160 | 691,869 | 667,331 | ||||||||||
| Loan valuation allowances and provisions | (3,480) | (3,820) | (4,092) | (3,053) | (3,271) | (3,817) | (6,532) | (7,092) | (7,911) | ||||||||||
| Total credit risk exposure, net | 193,967 | 190,816 | 194,214 | 549,317 | 529,275 | 510,379 | 704,628 | 684,777 | 659,420 | ||||||||||
| 1) Credit Suisse Financial Services/Credit Suisse First Boston reflect business unit amounts. Total consolidated Credit Suisse Group amounts include adjustments and Corporate Center. | |||||||||||||||||||
| 2) Excluding loans held for sale, securities lending and reverse repurchase transactions. | |||||||||||||||||||
| 3) Excluding forward reverse repurchase agreements. Prior periods restated. | |||||||||||||||||||
| 4) Effective 1Q2003, loans held for sale are presented net of the related loan valuation allowances. | |||||||||||||||||||
| 5) Positive replacement values considering netting agreements. | |||||||||||||||||||
| Total loan portfolio exposure and allowances and provisions for credit risk 1) | |||||||||||||||||||
| Credit Suisse Financial Services | Credit Suisse First Boston | Credit Suisse Group | |||||||||||||||||
| in CHF m | 30.06.03 | 31.03.03 | 31.12.02 | 30.06.03 | 31.03.03 | 31.12.02 | 30.06.03 | 31.03.03 | 31.12.02 | ||||||||||
| Non-performing loans | 2,600 | 2,749 | 3,004 | 1,926 | 2,616 | 3,351 | 4,526 | 5,365 | 6,355 | ||||||||||
| Non-interest earning loans | 1,706 | 1,897 | 2,108 | 437 | 402 | 217 | 2,143 | 2,299 | 2,325 | ||||||||||
| Total non-performing loans | 4,306 | 4,646 | 5,112 | 2,363 | 3,018 | 3,568 | 6,669 | 7,664 | 8,680 | ||||||||||
| Restructured loans | 63 | 80 | 52 | 198 | 201 | 229 | 261 | 281 | 281 | ||||||||||
| Potential problem loans | 1,599 | 1,726 | 1,723 | 965 | 1,123 | 1,685 | 2,565 | 2,848 | 3,408 | ||||||||||
| Total other impaired loans | 1,662 | 1,806 | 1,775 | 1,163 | 1,324 | 1,914 | 2,826 | 3,129 | 3,689 | ||||||||||
| Total impaired loans | 5,968 | 6,452 | 6,887 | 3,526 | 4,342 | 5,482 | 9,495 | 10,793 | 12,369 | ||||||||||
| Total due from banks and customers, gross | 168,662 | 163,261 | 165,105 | 151,917 | 129,792 | 126,411 | 288,209 | 262,599 | 252,675 | ||||||||||
| Valuation allowances | 3,446 | 3,779 | 4,053 | 2,928 | 3,111 | 3,647 | 6,373 | 6,891 | 7,703 | ||||||||||
| of which on principal | 2,749 | 3,010 | 3,201 | 2,692 | 2,866 | 3,416 | 5,441 | 5,875 | 6,617 | ||||||||||
| of which on interest | 697 | 769 | 852 | 236 | 245 | 231 | 932 | 1,016 | 1,086 | ||||||||||
| Total due from banks and customers, net | 165,216 | 159,482 | 161,052 | 148,989 | 126,681 | 122,764 | 281,836 | 255,708 | 244,972 | ||||||||||
| Provisions for contingent liabilities and irrevocable commitments | 34 | 41 | 39 | 125 | 160 | 170 | 159 | 201 | 208 | ||||||||||
| Total valuation allowances and provisions | 3,480 | 3,820 | 4,092 | 3,053 | 3,271 | 3,817 | 6,532 | 7,092 | 7,911 | ||||||||||
| Ratios | |||||||||||||||||||
| Valuation allowances as % of total non-performing loans | 80.0% | 81.3% | 79.3% | 123.9% | 103.1% | 102.2% | 95.6% | 89.9% | 88.7% | ||||||||||
| Valuation allowances as % of total impaired loans | 57.7% | 58.6% | 58.9% | 83.0% | 71.6% | 66.5% | 67.1% | 63.8% | 62.3% | ||||||||||
| 1) Credit Suisse Financial Services/Credit Suisse First Boston reflect business unit amounts. Total consolidated Credit Suisse Group amounts include adjustments and Corporate Center. | |||||||||||||||||||


Private Banking
Corporate & Retail Banking
Life & Pensions
Insurance
| Credit Suisse Financial Services business unit income statement – operating 1) | |||||||||||||||||
| Change | Change | Change | |||||||||||||||
| in % from | in % from | in % from | |||||||||||||||
| 6 months | |||||||||||||||||
| in CHF m | 2Q2003 | 1Q2003 | 2Q2002 | 1Q2003 | 2Q2002 | 2003 | 2002 | 2002 | |||||||||
| Operating income 2) | 3,435 | 3,393 | 2,718 | 1 | 26 | 6,828 | 6,024 | 13 | |||||||||
| Personnel expenses | 1,394 | 1,369 | 1,474 | 2 | (5) | 2,763 | 2,917 | (5) | |||||||||
| Other operating expenses | 706 | 779 | 909 | (9) | (22) | 1,485 | 1,723 | (14) | |||||||||
| Operating expenses | 2,100 | 2,148 | 2,383 | (2) | (12) | 4,248 | 4,640 | (8) | |||||||||
| Gross operating profit | 1,335 | 1,245 | 335 | 7 | 299 | 2,580 | 1,384 | 86 | |||||||||
| Depreciation of non-current assets | 154 | 168 | 174 | (8) | (11) | 322 | 336 | (4) | |||||||||
| Amortization of Present Value of Future Profits (PVFP) | 38 | 52 | 43 | (27) | (12) | 90 | 86 | 5 | |||||||||
| Valuation adjustments, provisions and losses | 90 | 81 | 95 | 11 | (5) | 171 | 194 | (12) | |||||||||
| Net operating profit before extraordinary items, acquisition-related costs and taxes | 1,053 | 944 | 23 | 12 | – | 1,997 | 768 | 160 | |||||||||
| Extraordinary income/(expenses), net | 8 | 7 | 21 | 14 | (62) | 15 | 18 | (17) | |||||||||
| Taxes 3) 4) | (216) | (253) | (380) | (15) | (43) | (469) | (500) | (6) | |||||||||
| Net operating profit/(loss) before acquisition-related costs and minority interests | 845 | 698 | (336) | 21 | – | 1,543 | 286 | 440 | |||||||||
| Amortization of acquired intangible assets and goodwill | (27) | (25) | (46) | 8 | (41) | (52) | (75) | (31) | |||||||||
| Tax impact | 0 | 1 | 0 | (100) | – | 1 | 1 | 0 | |||||||||
| Business unit result before minority interests | 818 | 674 | (382) | 21 | – | 1,492 | 212 | – | |||||||||
| Minority interests | (10) | (8) | 85 | 25 | – | (18) | 83 | – | |||||||||
| Business unit result 5) | 808 | 666 | (297) | 21 | – | 1,474 | 295 | 400 | |||||||||
| Increased/(decreased) credit-related valuation adjustments, net of tax 6) | (21) | (18) | 6 | 17 | – | (39) | 3 | – | |||||||||
| Net profit/(loss) | 829 | 684 | (303) | 21 | – | 1,513 | 292 | 418 | |||||||||
| Reconciliation to net operating profit/(loss) | |||||||||||||||||
| Business unit result | 808 | 666 | (297) | 21 | – | 1,474 | 295 | 400 | |||||||||
| Amortization of acquired intangible assets and goodwill, net of tax | (27) | (24) | (26) | 7) | 13 | 4 | (51) | (54) | 7) | (6) | |||||||
| Net operating profit/(loss) | 835 | 690 | (271) | 21 | – | 1,525 | 349 | 337 | |||||||||
| 1) The operating basis business unit results reflect the results of the separate segments comprising the business unit. Certain acquisition-related costs, including amortization of acquired intangible assets and goodwill, not allocated to the segments are included in the business unit results. Certain other items, including credit-related valuation adjustments resulting from the difference between the statistical and actual credit provisions and gains/losses from sales of investments within the insurance business are presented in the operating basis business unit results based on the Group’s segment reporting principles. For a reconciliation and a discussion of the material reconciling items, please refer to “Reconciliation of operating results to Swiss GAAP”. | |||||||||||||||||
| 2) For the purpose of the consolidated financial statements, operating income for the insurance business is defined as net premiums earned, less claims incurred and change in technical provisions and expenses for processing claims, less commissions, plus net investment income from the insurance business. | |||||||||||||||||
| 3) In 4Q2002, Credit Suisse Group adopted a change in accounting principle relating to the recognition of deferred tax assets on net operating losses. The retroactive application of this change in accounting principle would have resulted in taxes for 2Q2002 and for the 6 months 2002 of CHF –196 m and CHF –282 m, respectively. | |||||||||||||||||
| 4) Excluding tax impact on amortization of acquired intangible assets and goodwill. | |||||||||||||||||
| 5) Represents net profit/(loss) excluding credit-related valuation adjustments resulting from the difference between the statistical and actual credit provisions, net of tax. | |||||||||||||||||
| 6) Increased/(decreased) credit-related valuation adjustments before tax of CHF –27 m, CHF –24 m, CHF 8 m, CHF –51 m and CHF 4 m for 2Q2003, 1Q2003, 2Q2002, 6 months 2003 and 6 months 2002, respectively. | |||||||||||||||||
| 7) Excluding a CHF 20 m write-off relating to a participation. | |||||||||||||||||
| Credit Suisse Financial Services business unit key information | |||||||||||
| 6 months | |||||||||||
| 2Q2003 | 1Q2003 | 2Q2002 | 2003 | 2002 | |||||||
| Cost/income ratio 1) | 66.7% | 68.6% | 97.9% | 67.7% | 84.9% | ||||||
| Cost/income ratio – operating 2) 3) | 65.6% | 68.3% | 94.1% | 66.9% | 82.6% | ||||||
| Cost/income ratio – operating, banking 2) | 60.8% | 64.7% | 64.5% | 62.7% | 60.6% | ||||||
| Return on average allocated capital 1) | 26.0% | 22.4% | (12.9%) | 24.0% | 3.4% | ||||||
| Return on average allocated capital – operating 2) | 26.2% | 22.6% | (11.9%) | 24.2% | 4.4% | ||||||
| Average allocated capital in CHF m | 12,898 | 12,369 | 12,016 | 12,761 | 12,157 | ||||||
| Growth in assets under management | 7.0% | (2.0%) | (5.7%) | 4.8% | (4.7%) | ||||||
| of which net new assets | 0.7% | 0.0% | 1.0% | 0.8% | 2.4% | ||||||
| of which market movement and structural effects | 6.3% | (2.1%) | (6.7%) | 4.1% | (6.7%) | ||||||
| of which acquisitions/(divestitures) | (0.1%) | – | – | (0.1%) | (0.4%) | ||||||
| of which discretionary | 2.6% | (0.3%) | (1.5%) | 2.2% | (0.7%) | ||||||
| 30.06.03 | 31.03.03 | 31.12.02 | |||||||||
| Assets under management in CHF bn | 710.2 | 663.8 | 677.5 | ||||||||
| Number of employees (full-time equivalents) | 52,490 | 52,871 | 53,755 | ||||||||
| 1) Based on the business unit results on a Swiss GAAP basis. | |||||||||||
| 2) Based on the operating basis business unit results, which exclude certain acquisition-related costs not allocated to the segments and reflect certain reclassifications discussed in the “Reconciliation of operating results to Swiss GAAP”. | |||||||||||
| 3) Excluding amortization of PVFP from the insurance business within Credit Suisse Financial Services. | |||||||||||
| Overview of business unit Credit Suisse Financial Services – operating 1) | |||||||||||
| Credit | |||||||||||
| Corporate | Suisse | ||||||||||
| Private | & Retail | Life & | Financial | ||||||||
| 2Q2003, in CHF m | Banking | Banking | Pensions | Insurance | Services | ||||||
| Operating income 2) | 1,429 | 784 | 513 | 709 | 3,435 | ||||||
| Personnel expenses | 546 | 313 | 180 | 355 | 1,394 | ||||||
| Other operating expenses | 247 | 171 | 123 | 165 | 706 | ||||||
| Operating expenses | 793 | 484 | 303 | 520 | 2,100 | ||||||
| Gross operating profit | 636 | 300 | 210 | 189 | 1,335 | ||||||
| Depreciation of non-current assets | 45 | 24 | 34 | 51 | 154 | ||||||
| Amortization of Present Value of Future Profits (PVFP) | – | – | 36 | 2 | 38 | ||||||
| Valuation adjustments, provisions and losses | 19 | 71 | – | – | 90 | ||||||
| Net operating profit before extraordinary items, acquisition-related costs and taxes | 572 | 205 | 140 | 136 | 1,053 | ||||||
| Extraordinary income/(expenses), net | 7 | 1 | 0 | 0 | 8 | ||||||
| Taxes 3) | (110) | (49) | (23) | (34) | (216) | ||||||
| Net operating profit before acquisition-related costs and minority interests | 469 | 157 | 117 | 102 | 845 | ||||||
| Amortization of acquired intangible assets and goodwill | (27) | ||||||||||
| Business unit result before minority interests | 818 | ||||||||||
| Minority interests | (10) | ||||||||||
| Business unit result 4) | 808 | ||||||||||
| Other data: | |||||||||||
| Average allocated capital 5) | 2,349 | 4,721 | 5,828 | 12,898 | |||||||
| 1) The operating basis business unit results reflect the results of the separate segments comprising the business unit. Certain acquisition-related costs, including amortization of acquired intangible assets and goodwill, not allocated to the segments are included in the business unit results. Certain other items, including credit-related valuation adjustments resulting from the difference between the statistical and actual credit provisions and gains/losses from sales of investments within the insurance business are presented in the operating basis business unit results based on the Group’s segment reporting principles. For a reconciliation and a discussion of the material reconciling items, please refer to “Reconciliation of operating results to Swiss GAAP”. | |||||||||||
| 2) Operating income for the insurance business is defined as net premiums earned, less claims incurred and change in technical provisions and expenses for processing claims, less commissions, plus net investment income from the insurance business. | |||||||||||
| 3) Excluding tax impact on amortization of acquired intangible assets and goodwill. | |||||||||||
| 4) Represents net profit excluding credit-related valuation adjustments resulting from the difference between the statistical and actual credit provisions. | |||||||||||
| 5) Amount relating to Life & Pensions and Insurance segments represents the average shareholders' equity of “Winterthur” Swiss Insurance Company. | |||||||||||
| Private Banking income statement 1) | |||||||||||||||||
| Change | Change | Change | |||||||||||||||
| in % from | in % from | in % from | |||||||||||||||
| 6 months | |||||||||||||||||
| in CHF m | 2Q2003 | 1Q2003 | 2Q2002 | 1Q2003 | 2Q2002 | 2003 | 2002 | 2002 | |||||||||
| Net interest income | 301 | 310 | 322 | (3) | (7) | 611 | 648 | (6) | |||||||||
| Net commission and service fee income | 968 | 889 | 1,056 | 9 | (8) | 1,857 | 2,239 | (17) | |||||||||
| Net trading income | 151 | 102 | 142 | 48 | 6 | 253 | 287 | (12) | |||||||||
| Other ordinary income | 9 | 9 | 26 | 0 | (65) | 18 | 32 | (44) | |||||||||
| Operating income | 1,429 | 1,310 | 1,546 | 9 | (8) | 2,739 | 3,206 | (15) | |||||||||
| Personnel expenses | 546 | 515 | 561 | 6 | (3) | 1,061 | 1,114 | (5) | |||||||||
| Other operating expenses | 247 | 256 | 321 | (4) | (23) | 503 | 604 | (17) | |||||||||
| Operating expenses | 793 | 771 | 882 | 3 | (10) | 1,564 | 1,718 | (9) | |||||||||
| Gross operating profit | 636 | 539 | 664 | 18 | (4) | 1,175 | 1,488 | (21) | |||||||||
| Depreciation of non-current assets | 45 | 57 | 52 | (21) | (13) | 102 | 101 | 1 | |||||||||
| Valuation adjustments, provisions and losses 2) | 19 | 4 | 23 | 375 | (17) | 23 | 34 | (32) | |||||||||
| Net operating profit before extraordinary items and taxes | 572 | 478 | 589 | 20 | (3) | 1,050 | 1,353 | (22) | |||||||||
| Extraordinary income/(expenses), net | 7 | 7 | 21 | 0 | (67) | 14 | 19 | (26) | |||||||||
| Taxes 3) | (110) | (114) | (140) | (4) | (21) | (224) | (294) | (24) | |||||||||
| Net operating profit before minority interests (segment result) | 469 | 371 | 470 | 26 | 0 | 840 | 1,078 | (22) | |||||||||
| Other data: | |||||||||||||||||
| Increased/(decreased) credit-related valuation adjustments 2) | (7) | 0 | (9) | – | (22) | (7) | (7) | 0 | |||||||||
| 1) 2002 comparative figures have been restated to reflect the realignment of the private client business as of 01.01.2003. This entailed moving certain client segments in Switzerland from Private Banking to Corporate & Retail Banking. Certain acquisition-related costs, including amortization of acquired intangible assets and goodwill not allocated to the segments are included in the business unit results. | |||||||||||||||||
| 2) Increased/(decreased) credit-related valuation adjustments resulting from the difference between the statistical and actual credit provisions. | |||||||||||||||||
| 3) In 4Q2002, Credit Suisse Group adopted a change in accounting principle relating to the recognition of deferred tax assets on net operating losses. The retroactive application of this change in accounting principle would have resulted in taxes for 2Q2002 and for the 6 months 2002 of CHF –131 m and CHF –271 m, respectively. | |||||||||||||||||
| Private Banking balance sheet information 1) | |||||||||||
| Change | Change | ||||||||||
| in % from | in % from | ||||||||||
| in CHF m | 30.06.03 | 31.03.03 | 31.12.02 | 31.03.03 | 31.12.02 | ||||||
| Total assets | 158,982 | 152,910 | 155,363 | 4 | 2 | ||||||
| Due from customers | 31,948 | 33,493 | 35,580 | (5) | (10) | ||||||
| Mortgages | 24,527 | 23,603 | 22,935 | 4 | 7 | ||||||
| 1) 2002 comparative figures have been restated to reflect the realignment of the private client business as of 01.01.2003. This entailed moving certain client segments in Switzerland from Private Banking to Corporate & Retail Banking. | |||||||||||
| Private Banking key information 1) | |||||||||||
| 6 months | |||||||||||
| 2Q2003 | 1Q2003 | 2Q2002 | 2003 | 2002 | |||||||
| Cost/income ratio 2) | 58.6% | 63.2% | 60.4% | 60.8% | 56.7% | ||||||
| Average allocated capital in CHF m | 2,349 | 2,261 | 2,434 | 2,304 | 2,381 | ||||||
| Pre-tax margin 2) | 40.5% | 37.0% | 39.5% | 38.8% | 42.8% | ||||||
| Fee income/operating income | 67.7% | 67.9% | 68.3% | 67.8% | 69.8% | ||||||
| Net new assets in CHF bn | 3.8 | 1.5 | 5.6 | 5.3 | 14.8 | ||||||
| Growth in assets under management | 8.1% | (1.9%) | (7.3%) | 6.0% | (5.1%) | ||||||
| of which net new assets | 0.8% | 0.3% | 1.1% | 1.1% | 2.8% | ||||||
| of which market movement and structural effects | 7.2% | (2.2%) | (8.3%) | 4.9% | (8.0%) | ||||||
| Net margin 3) | 39.5 bp | 32.2 bp | 36.5 bp | 35.9 bp | 41.5 bp | ||||||
| Gross margin 4) | 120.4 bp | 113.8 bp | 120.1 bp | 117.2 bp | 123.3 bp | ||||||
| 30.06.03 | 31.03.03 | 31.12.02 | |||||||||
| Assets under management in CHF bn | 493.8 | 457.0 | 465.7 | ||||||||
| Number of employees (full-time equivalents) | 11,964 | 12,249 | 12,587 | ||||||||
| 1) 2002 comparative figures have been restated to reflect the realignment of the private client business as of 01.01.2003. This entailed moving certain client segments in Switzerland from Private Banking to Corporate & Retail Banking. | |||||||||||
| 2) Based on the segment results, which exclude certain acquisition-related costs not allocated to the segment. | |||||||||||
| 3) Net operating profit before minority interests (segment result)/average assets under management. | |||||||||||
| 4) Operating income/average assets under management. | |||||||||||
| Corporate & Retail Banking income statement 1) | |||||||||||||||||
| Change | Change | Change | |||||||||||||||
| in % from | in % from | in % from | |||||||||||||||
| 6 months | |||||||||||||||||
| in CHF m | 2Q2003 | 1Q2003 | 2Q2002 | 1Q2003 | 2Q2002 | 2003 | 2002 | 2002 | |||||||||
| Net interest income | 515 | 502 | 520 | 3 | (1) | 1,017 | 1,060 | (4) | |||||||||
| Net commission and service fee income | 147 | 149 | 168 | (1) | (13) | 296 | 340 | (13) | |||||||||
| Net trading income | 76 | 69 | 82 | 10 | (7) | 145 | 145 | 0 | |||||||||
| Other ordinary income | 46 | 14 | 23 | 229 | 100 | 60 | 38 | 58 | |||||||||
| Operating income | 784 | 734 | 793 | 7 | (1) | 1,518 | 1,583 | (4) | |||||||||
| Personnel expenses | 313 | 300 | 312 | 4 | 0 | 613 | 606 | 1 | |||||||||
| Other operating expenses | 171 | 173 | 240 | (1) | (29) | 344 | 434 | (21) | |||||||||
| Operating expenses | 484 | 473 | 552 | 2 | (12) | 957 | 1,040 | (8) | |||||||||
| Gross operating profit | 300 | 261 | 241 | 15 | 24 | 561 | 543 | 3 | |||||||||
| Depreciation of non-current assets | 24 | 22 | 23 | 9 | 4 | 46 | 45 | 2 | |||||||||
| Valuation adjustments, provisions and losses 2) | 71 | 77 | 72 | (8) | (1) | 148 | 160 | (8) | |||||||||
| Net operating profit before extraordinary items and taxes | 205 | 162 | 146 | 27 | 40 | 367 | 338 | 9 | |||||||||
| Extraordinary income/(expenses), net | 1 | 0 | 0 | – | – | 1 | (1) | – | |||||||||
| Taxes 3) | (49) | (38) | (35) | 29 | 40 | (87) | (80) | 9 | |||||||||
| Net operating profit before minority interests (segment result) | 157 | 124 | 111 | 27 | 41 | 281 | 257 | 9 | |||||||||
| Other data: | |||||||||||||||||
| Increased/(decreased) credit-related valuation adjustments 2) | (20) | (24) | 17 | (17) | – | (44) | 11 | – | |||||||||
| 1) 2002 comparative figures have been restated to reflect the realignment of the private client business as of 01.01.2003. This entailed moving certain client segments in Switzerland from Private Banking to Corporate & Retail Banking. Certain acquisition-related costs, including amortization of acquired intangible assets and goodwill, not allocated to the segments are included in the business unit results. | |||||||||||||||||
| 2) Increased/(decreased) credit-related valuation adjustments resulting from the difference between the statistical and actual credit provisions. | |||||||||||||||||
| 3) In 4Q2002, Credit Suisse Group adopted a change in accounting principle relating to the recognition of deferred tax assets on net operating losses. The retroactive application of this change in accounting principle would not have had an impact on the taxes reported for 2Q2002 and for the 6 months 2002. | |||||||||||||||||
| Corporate & Retail Banking balance sheet information 1) | |||||||||||
| Change | Change | ||||||||||
| in % from | in % from | ||||||||||
| in CHF m | 30.06.03 | 31.03.03 | 31.12.02 | 31.03.03 | 31.12.02 | ||||||
| Total assets | 93,624 | 93,104 | 94,203 | 1 | (1) | ||||||
| Due from customers | 26,004 | 26,952 | 27,179 | (4) | (4) | ||||||
| Mortgages | 58,616 | 57,927 | 57,165 | 1 | 3 | ||||||
| Due to customers in savings and investment deposits | 27,848 | 27,830 | 27,081 | 0 | 3 | ||||||
| Due to customers, other | 27,749 | 27,561 | 27,509 | 1 | 1 | ||||||
| 1) 2002 comparative figures have been restated to reflect the realignment of the private client business as of 01.01.2003. This entailed moving certain client segments in Switzerland from Private Banking to Corporate & Retail Banking. | |||||||||||
| Corporate & Retail Banking key information 1) | |||||||||||
| 6 months | |||||||||||
| 2Q2003 | 1Q2003 | 2Q2002 | 2003 | 2002 | |||||||
| Cost/income ratio 2) | 64.8% | 67.4% | 72.5% | 66.1% | 68.5% | ||||||
| Return on average allocated capital 2) | 13.3% | 10.7% | 8.4% | 11.9% | 10.0% | ||||||
| Average allocated capital in CHF m | 4,721 | 4,656 | 5,265 | 4,710 | 5,139 | ||||||
| Pre-tax margin 2) | 26.3% | 22.1% | 18.4% | 24.2% | 21.3% | ||||||
| Personnel expenses/operating income | 39.9% | 40.9% | 39.3% | 40.4% | 38.3% | ||||||
| Net interest margin | 221 bp | 214 bp | 224 bp | 217 bp | 227 bp | ||||||
| Loan growth | (0.3%) | 0.6% | (0.9%) | 0.3% | 1.4% | ||||||
| Net new assets in CHF bn | 0.5 | (3.4) | 0.3 | (2.9) | (1.1) | ||||||
| 30.06.03 | 31.03.03 | 31.12.02 | |||||||||
| Deposit/loan ratio | 65.7% | 65.3% | 64.7% | ||||||||
| Assets under management in CHF bn | 66.8 | 64.1 | 70.3 | ||||||||
| Number of employees (full-time equivalents) | 8,674 | 8,929 | 9,038 | ||||||||
| Number of branches | 221 | 221 | 223 | ||||||||
| 1) 2002 comparative figures have been restated to reflect the realignment of the private client business as of 01.01.2003. This entailed moving certain client segments in Switzerland from Private Banking to Corporate & Retail Banking. | |||||||||||
| 2) Based on the segment results, which exclude certain acquisition-related costs not allocated to the segment. | |||||||||||
| Life & Pensions income statement 1) | |||||||||||||||||
| Change | Change | Change | |||||||||||||||
| in % from | in % from | in % from | |||||||||||||||
| 6 months | |||||||||||||||||
| in CHF m | 2Q2003 | 1Q2003 | 2Q2002 | 1Q2003 | 2Q2002 | 2003 | 2002 | 2002 | |||||||||
| Gross premiums written | 3,466 | 6,499 | 3,496 | (47) | (1) | 9,965 | 10,258 | (3) | |||||||||
| Reinsurance ceded | (13) | (23) | (101) | (43) | (87) | (36) | (197) | (82) | |||||||||
| Net premiums written | 3,453 | 6,476 | 3,395 | (47) | 2 | 9,929 | 10,061 | (1) | |||||||||
| Change in provision for unearned premiums | 0 | (10) | (2) | (100) | (100) | (10) | (41) | (76) | |||||||||
| Net premiums earned | 3,453 | 6,466 | 3,393 | (47) | 2 | 9,919 | 10,020 | (1) | |||||||||
| Death and other benefits incurred | (2,870) | (4,100) | (2,834) | (30) | 1 | (6,970) | (6,647) | 5 | |||||||||
| Change in provision for future policyholder benefits (technical) | (1,098) | (2,871) | (1,071) | (62) | 3 | (3,969) | (4,360) | (9) | |||||||||
| Change in provision for future policyholder benefits (separate account) 2) | (916) | 211 | 687 | – | – | (705) | 546 | – | |||||||||
| Dividends to policyholders incurred | (202) | (24) | 678 | – | – | (226) | 813 | – | |||||||||
| Policy acquisition costs (including change in DAC/PVFP) | (120) | (120) | (118) | – | 2 | (240) | (198) | 21 | |||||||||
| Administration costs | (277) | (322) | (377) | (14) | (27) | (599) | (721) | (17) | |||||||||
| Investment income general account | 1,296 | 1,221 | 4 | 6 | – | 2,517 | 796 | 216 | |||||||||
| Investment income separate account 2) | 916 | (211) | (687) | – | – | 705 | (546) | – | |||||||||
| Interest received and paid | (14) | (19) | 4 | (26) | – | (33) | (23) | 43 | |||||||||
| Interest on bonuses credited to policyholders | (53) | (33) | (47) | 61 | 13 | (86) | (76) | 13 | |||||||||
| Other income/(expenses) | 25 | (13) | 87 | – | (71) | 12 | 93 | (87) | |||||||||
| Net operating profit/(loss) before taxes | 140 | 185 | (281) | (24) | – | 325 | (303) | – | |||||||||
| Taxes 3) | (23) | (74) | (146) | (69) | (84) | (97) | (109) | (11) | |||||||||
| Net operating profit/(loss) before minority interests (segment result) | 117 | 111 | (427) | 5 | – | 228 | (412) | – | |||||||||
| 1) The presentation of segment results differs from the presentation of the Group's consolidated results as it reflects the way the insurance business is managed, which is in line with peers in the insurance industry. Certain acquisition-related costs, including amortization of acquired intangible assets and goodwill not allocated to the segments are included in the business unit results. | |||||||||||||||||
| 2) This represents the market impact for separate account (or unit-linked) business, where the investment risk is borne by the policyholder. | |||||||||||||||||
| 3) In 4Q2002, Credit Suisse Group adopted a change in accounting principle relating to the recognition of deferred tax assets on net operating losses. The retroactive application of this change in accounting principle would have resulted in taxes for 2Q2002 and for the 6 months 2002 of CHF –8 m and CHF 55 m, respectively. | |||||||||||||||||
| Life & Pensions key information | |||||||||||
| 6 months | |||||||||||
| 2Q2003 | 1Q2003 | 2Q2002 | 2003 | 2002 | |||||||
| Expense ratio 1) | 11.5% | 6.8% | 14.2% | 8.4% | 9.0% | ||||||
| Growth in gross premiums written | (0.9%) | (3.9%) | 9.7% | (2.9%) | 9.4% | ||||||
| Return on invested assets (excluding separate account business) | |||||||||||
| Current income | 4.2% | 3.9% | 4.5% | 4.0% | 4.2% | ||||||
| Realized gains/losses and other income/expenses | 0.9% | 1.1% | (4.4%) | 1.0% | (2.5%) | ||||||
| Total return on invested assets 2) | 5.1% | 4.9% | 0.1% | 5.0% | 1.7% | ||||||
| Net new assets in CHF bn 3) | 0.5 | 2.2 | 1.3 | 2.7 | 4.3 | ||||||
| Total sales in CHF m 4) | 4,164 | 7,372 | 4,484 | 11,536 | 12,267 | ||||||
| 30.06.03 | 31.03.03 | 31.12.02 | |||||||||
| Assets under management in CHF bn 5) | 117.0 | 111.7 | 110.8 | ||||||||
| Technical provisions in CHF m | 113,059 | 108,490 | 105,939 | ||||||||
| Number of employees (full-time equivalents) | 7,519 | 7,629 | 7,815 | ||||||||
| 1) Operating expenses (i.e. policy acquisition costs and administration costs)/gross premiums written. Previous periods restated to reflect change in calculation. | |||||||||||
| 2) Total return on invested assets includes depreciation on real estate and investment expenses as well as investment income and realized gains and losses. | |||||||||||
| 3) Based on change in technical provisions for traditional business, adjusted for technical interests, net inflow of separate account business and change in off-balance sheet business such as funds. | |||||||||||
| 4) Includes gross premiums written and off-balance sheet sales. | |||||||||||
| 5) Based on savings-related provisions for policyholders plus off-balance sheet assets. | |||||||||||
| Insurance income statement 1) | |||||||||||||||||
| Change | Change | Change | |||||||||||||||
| in % from | in % from | in % from | |||||||||||||||
| 6 months | |||||||||||||||||
| in CHF m | 2Q2003 | 1Q2003 | 2Q2002 | 1Q2003 | 2Q2002 | 2003 | 2002 | 2002 | |||||||||
| Gross premiums written | 4,037 | 6,835 | 4,122 | (41) | (2) | 10,872 | 10,790 | 1 | |||||||||
| Reinsurance ceded | (236) | (427) | (204) | (45) | 16 | (663) | (619) | 7 | |||||||||
| Net premiums written | 3,801 | 6,408 | 3,918 | (41) | (3) | 10,209 | 10,171 | 0 | |||||||||
| Change in provision for unearned premiums and in provision for future policy benefits (health) | 285 | (2,430) | 65 | – | 338 | (2,145) | (2,437) | (12) | |||||||||
| Net premiums earned | 4,086 | 3,978 | 3,983 | 3 | 3 | 8,064 | 7,734 | 4 | |||||||||
| Claims and annuities incurred, net | (2,945) | (2,826) | (2,976) | 4 | (1) | (5,771) | (5,795) | 0 | |||||||||
| Dividends to policyholders incurred, net | (77) | (45) | 117 | 71 | – | (122) | 50 | – | |||||||||
| Policy acquisition costs (including change in DAC/PVFP) | (726) | (710) | (678) | 2 | 7 | (1,436) | (1,252) | 15 | |||||||||
| Administration costs | (433) | (472) | (479) | (8) | (10) | (905) | (982) | (8) | |||||||||
| Underwriting result, net | (95) | (75) | (33) | 27 | 188 | (170) | (245) | (31) | |||||||||
| Net investment income | 315 | 289 | (266) | 9 | – | 604 | (179) | – | |||||||||
| Interest received and paid | (27) | (47) | (28) | (43) | (4) | (74) | (31) | 139 | |||||||||
| Other income/(expenses), net | (57) | (48) | (104) | 19 | (45) | (105) | (165) | (36) | |||||||||
| Net operating profit/(loss) before taxes | 136 | 119 | (431) | 14 | – | 255 | (620) | – | |||||||||
| Taxes 2) | (34) | (27) | (59) | 26 | (42) | (61) | (17) | 259 | |||||||||
| Net operating profit/(loss) before minority interests (segment result) | 102 | 92 | (490) | 11 | – | 194 | (637) | – | |||||||||
| 1) The presentation of segment results differs from the presentation of the Group's consolidated results as it reflects the way the insurance business is managed, which is in line with peers in the insurance industry. Certain acquisition-related costs, including amortization of acquired intangible assets and goodwill, not allocated to the segments are included in the business unit results. | |||||||||||||||||
| 2) In 4Q2002, Credit Suisse Group adopted a change in accounting principle relating to the recognition of deferred tax assets on net operating losses. The retroactive application of this change in accounting principle would have resulted in taxes for 2Q2002 and for the 6 months 2002 of CHF –22 m and CHF 14 m, respectively. | |||||||||||||||||
| Insurance key information | |||||||||||
| 6 months | |||||||||||
| 2Q2003 | 1Q2003 | 2Q2002 | 2003 | 2002 | |||||||
| Combined ratio (excluding dividends to policyholders) | 100.5% | 100.7% | 103.7% | 100.6% | 103.8% | ||||||
| Claims ratio 1) | 72.1% | 71.0% | 74.7% | 71.6% | 74.9% | ||||||
| Expense ratio 2) | 28.4% | 29.7% | 29.0% | 29.0% | 28.9% | ||||||
| Return on invested assets | |||||||||||
| Current income | 4.1% | 3.9% | 5.0% | 4.0% | 4.4% | ||||||
| Realized gains/losses and other income/expenses | (0.1%) | (0.5%) | (8.8%) | (0.3%) | (5.7%) | ||||||
| Total return on invested assets 3) | 4.0% | 3.5% | (3.8%) | 3.7% | (1.3%) | ||||||
| 30.06.03 | 31.03.03 | 31.12.02 | |||||||||
| Assets under management in CHF bn | 32.6 | 31.0 | 30.7 | ||||||||
| Technical provisions in CHF m | 32,308 | 31,429 | 28,745 | ||||||||
| Number of employees (full-time equivalents) | 24,333 | 24,064 | 24,315 | ||||||||
| 1) Claims and annuities incurred, net/net premiums earned. | |||||||||||
| 2) Operating expenses (i.e. policy acquisition costs and administration costs)/net premiums earned. | |||||||||||
| 3) Total return on invested assets includes depreciation on real estate and investment expenses as well as investment income and realized gains and losses. | |||||||||||
Institutional Securities
CSFB Financial Services
| Credit Suisse First Boston business unit income statement – operating 1) | |||||||||||||||||
| Change | Change | Change | |||||||||||||||
| in % from | in % from | in % from | |||||||||||||||
| 6 months | |||||||||||||||||
| in USD m | 2Q2003 | 1Q2003 | 2Q2002 | 1Q2003 | 2Q2002 | 2003 | 2002 | 2002 | |||||||||
| Operating income | 3,187 | 2,920 | 3,493 | 9 | (9) | 6,107 | 6,770 | (10) | |||||||||
| Personnel expenses | 1,648 | 1,509 | 1,921 | 9 | (14) | 3,157 | 3,729 | (15) | |||||||||
| Other operating expenses | 680 | 660 | 734 | 3 | (7) | 1,340 | 1,509 | (11) | |||||||||
| Operating expenses | 2,328 | 2,169 | 2,655 | 7 | (12) | 4,497 | 5,238 | (14) | |||||||||
| Gross operating profit | 859 | 751 | 838 | 14 | 3 | 1,610 | 1,532 | 5 | |||||||||
| Depreciation of non-current assets | 105 | 94 | 116 | 12 | (9) | 199 | 239 | (17) | |||||||||
| Valuation adjustments, provisions and losses | 49 | 128 | 260 | (62) | (81) | 177 | 462 | (62) | |||||||||
| Net operating profit before extraordinary items, acquisition-related costs and taxes | 705 | 529 | 462 | 33 | 53 | 1,234 | 831 | 48 | |||||||||
| Extraordinary income/(expenses), net | 0 | 0 | 16 | – | (100) | 0 | 16 | (100) | |||||||||
| Taxes 2) 3) | (197) | (144) | (111) | 37 | 77 | (341) | (192) | 78 | |||||||||
| Net operating profit before acquisition-related costs and minority interests | 508 | 385 | 367 | 32 | 38 | 893 | 655 | 36 | |||||||||
| Acquisition interest | (48) | (63) | (99) | (24) | (52) | (111) | (198) | (44) | |||||||||
| Amortization of retention payments | (78) | (80) | (112) | (3) | (30) | (158) | (219) | (28) | |||||||||
| Amortization of acquired intangible assets and goodwill | (150) | (151) | (206) | (1) | (27) | (301) | (419) | (28) | |||||||||
| Tax impact | 64 | 70 | 111 | (9) | (42) | 134 | 223 | (40) | |||||||||
| Net profit before minority interests | 296 | 161 | 61 | 84 | 385 | 457 | 42 | – | |||||||||
| Minority interests | 0 | 0 | 0 | – | – | 0 | 0 | – | |||||||||
| Net profit 4) | 296 | 161 | 61 | 84 | 385 | 457 | 42 | – | |||||||||
| Reconciliation to net operating profit | |||||||||||||||||
| Net profit | 296 | 161 | 61 | 84 | 385 | 457 | 42 | – | |||||||||
| Amortization of acquired intangible assets and goodwill, net of tax | 130 | 131 | 168 | (1) | (23) | 261 | 342 | (24) | |||||||||
| Net operating profit | 426 | 292 | 229 | 46 | 86 | 718 | 384 | 87 | |||||||||
See page 22 for footnotes. | |||||||||||||||||
| Credit Suisse First Boston business unit income statement – operating 1) | |||||||||||||||||
| Change | Change | Change | |||||||||||||||
| in % from | in % from | in % from | |||||||||||||||
| 6 months | |||||||||||||||||
| in CHF m | 2Q2003 | 1Q2003 | 2Q2002 | 1Q2003 | 2Q2002 | 2003 | 2002 | 2002 | |||||||||
| Operating income | 4,243 | 4,001 | 5,598 | 6 | (24) | 8,244 | 11,103 | (26) | |||||||||
| Personnel expenses | 2,195 | 2,067 | 3,078 | 6 | (29) | 4,262 | 6,115 | (30) | |||||||||
| Other operating expenses | 905 | 904 | 1,172 | 0 | (23) | 1,809 | 2,474 | (27) | |||||||||
| Operating expenses | 3,100 | 2,971 | 4,250 | 4 | (27) | 6,071 | 8,589 | (29) | |||||||||
| Gross operating profit | 1,143 | 1,030 | 1,348 | 11 | (15) | 2,173 | 2,514 | (14) | |||||||||
| Depreciation of non-current assets | 138 | 130 | 185 | 6 | (25) | 268 | 392 | (32) | |||||||||
| Valuation adjustments, provisions and losses | 63 | 176 | 420 | (64) | (85) | 239 | 758 | (68) | |||||||||
| Net operating profit before extraordinary items, acquisition-related costs and taxes | 942 | 724 | 743 | 30 | 27 | 1,666 | 1,364 | 22 | |||||||||
| Extraordinary income/(expenses), net | 0 | 0 | 26 | – | (100) | 0 | 26 | (100) | |||||||||
| Taxes 2) 3) | (264) | (197) | (178) | 34 | 48 | (461) | (315) | 46 | |||||||||
| Net operating profit before acquisition-related costs and minority interests | 678 | 527 | 591 | 29 | 15 | 1,205 | 1,075 | 12 | |||||||||
| Acquisition interest | (64) | (86) | (158) | (26) | (59) | (150) | (325) | (54) | |||||||||
| Amortization of retention payments | (102) | (110) | (180) | (7) | (43) | (212) | (359) | (41) | |||||||||
| Amortization of acquired intangible assets and goodwill | (201) | (206) | (330) | (2) | (39) | (407) | (687) | (41) | |||||||||
| Tax impact | 84 | 96 | 178 | (13) | (53) | 180 | 365 | (51) | |||||||||
| Net profit before minority interests | 395 | 221 | 101 | 79 | 291 | 616 | 69 | – | |||||||||
| Minority interests | 0 | 0 | 0 | – | – | 0 | 0 | – | |||||||||
| Net profit 4) | 395 | 221 | 101 | 79 | 291 | 616 | 69 | – | |||||||||
| Reconciliation to net operating profit | |||||||||||||||||
| Net profit | 395 | 221 | 101 | 79 | 291 | 616 | 69 | – | |||||||||
| Amortization of acquired intangible assets and goodwill, net of tax | 175 | 179 | 270 | (2) | (35) | 354 | 561 | (37) | |||||||||
| Net operating profit | 570 | 400 | 371 | 43 | 54 | 970 | 630 | 54 | |||||||||
| 1) The operating basis business unit results reflect the results of the separate segments comprising the business unit. Certain acquisition-related costs, including acquisition interest, amortization of retention payments and amortization of acquired intangible assets and goodwill, not allocated to the segments are included in the business unit results. Certain other items, including brokerage, execution and clearing expenses, contractor and recruitment costs and expenses related to certain redeemable preferred securities classified as minority interests are presented in the operating basis business unit results based on the Group’s segment reporting principles. For a reconciliation and a discussion of the material reconciling items, please refer to “Reconciliation of operating results to Swiss GAAP”. | |||||||||||||||||
| 2) In 4Q2002, Credit Suisse Group adopted a change in accounting principle relating to the recognition of deferred tax assets on net operating losses. The retroactive application of this change in accounting principle would have resulted in taxes for 2Q2002 and for the 6 months 2002 of CHF 14 m (USD 6 m) and CHF –123 m (USD –75 m), respectively. | |||||||||||||||||
| 3) Excluding tax impact on acquisition-related costs. | |||||||||||||||||
| 4) Net profit is identical on an operating and Swiss GAAP basis. | |||||||||||||||||
| Credit Suisse First Boston business unit key information | |||||||||||
| 6 months | |||||||||||
| based on CHF amounts | 2Q2003 | 1Q2003 | 2Q2002 | 2003 | 2002 | ||||||
| Cost/income ratio 1) | 78.5% | 80.7% | 84.0% | 79.6% | 85.8% | ||||||
| Cost/income ratio – operating 2) | 76.3% | 77.5% | 79.2% | 76.9% | 80.9% | ||||||
| Return on average allocated capital 1) | 13.5% | 7.4% | 3.3% | 10.3% | 1.5% | ||||||
| Return on average allocated capital – operating 2) | 18.5% | 12.4% | 9.9% | 15.3% | 8.5% | ||||||
| Average allocated capital in CHF m | 12,305 | 12,889 | 14,958 | 12,649 | 14,769 | ||||||
| Pre-tax margin 1) | 14.9% | 9.1% | 2.3% | 12.1% | 0.6% | ||||||
| Pre-tax margin – operating 2) | 18.3% | 13.2% | 7.7% | 15.8% | 6.4% | ||||||
| Personnel expenses/operating income 1) | 58.8% | 59.5% | 63.7% | 59.1% | 64.0% | ||||||
| Personnel expenses/operating income – operating 2) | 51.7% | 51.7% | 55.0% | 51.7% | 55.1% | ||||||
| 30.06.03 | 31.03.03 | 31.12.02 | |||||||||
| Number of employees (full-time equivalents) | 18,716 | 19,218 | 23,424 | ||||||||
| 1) Based on the business unit results on a Swiss GAAP basis. | |||||||||||
| 2) Based on the operating basis business unit results, which exclude certain acquisition-related costs not allocated to the segments and reflect certain other reclassifications discussed in the “Reconciliation of operating results to Swiss GAAP”. | |||||||||||
| Overview of business unit Credit Suisse First Boston – operating 1) | |||||||||||||
| in USD m | in CHF m | ||||||||||||
| CSFB | CSFB | ||||||||||||
| Institutional | Financial | Credit Suisse | Institutional | Financial | Credit Suisse | ||||||||
| 2Q2003 | Securities | Services | First Boston | Securities | Services | First Boston | |||||||
| Operating income | 2,888 | 299 | 3,187 | 3,846 | 397 | 4,243 | |||||||
| Personnel expenses | 1,492 | 156 | 1,648 | 1,987 | 208 | 2,195 | |||||||
| Other operating expenses | 591 | 89 | 680 | 786 | 119 | 905 | |||||||
| Operating expenses | 2,083 | 245 | 2,328 | 2,773 | 327 | 3,100 | |||||||
| Gross operating profit | 805 | 54 | 859 | 1,073 | 70 | 1,143 | |||||||
| Depreciation of non-current assets | 96 | 9 | 105 | 127 | 11 | 138 | |||||||
| Valuation adjustments, provisions and losses | 56 | (7) | 49 | 73 | (10) | 63 | |||||||
| Net operating profit before extraordinary items, acquisition-related costs and taxes | 653 | 52 | 705 | 873 | 69 | 942 | |||||||
| Taxes 2) | (183) | (14) | (197) | (245) | (19) | (264) | |||||||
| Net operating profit before acquisition-related costs and minority interests | 470 | 38 | 508 | 628 | 50 | 678 | |||||||
| Acquisition interest | (48) | (64) | |||||||||||
| Amortization of retention payments | (78) | (102) | |||||||||||
| Amortization of acquired intangible assets and goodwill | (150) | (201) | |||||||||||
| Tax impact | 64 | 84 | |||||||||||
| Net profit 3) | 296 | 395 | |||||||||||
| Other data: | |||||||||||||
| Average allocated capital | 8,794 | 407 | 9,061 | 11,943 | 552 | 12,305 | |||||||
| 1) The operating basis business unit results reflect the results of the separate segments comprising the business unit. Certain acquisition-related costs, including acquisition interest, amortization of retention payments and amortization of acquired intangible assets and goodwill, not allocated to the segments are included in the business unit results. Certain other items, including brokerage, execution and clearing expenses, contractor and recruitment costs and expenses related to certain redeemable preferred securities classified as minority interests are presented in the operating basis business unit results based on the Group’s segment reporting principles. For a reconciliation and a discussion of the material reconciling items, please refer to “Reconciliation of operating results to Swiss GAAP”. | |||||||||||||
| 2) Excluding tax impact on acquisition-related costs. | |||||||||||||
| 3) Net profit is identical on an operating and Swiss GAAP basis. | |||||||||||||
| Institutional Securities income statement 1) | |||||||||||||||||
| Change | Change | Change | |||||||||||||||
| in % from | in % from | in % from | |||||||||||||||
| 6 months | |||||||||||||||||
| in USD m | 2Q2003 | 1Q2003 | 2Q2002 | 1Q2003 | 2Q2002 | 2003 | 2002 | 2002 | |||||||||
| Fixed Income 2) | 1,441 | 1,422 | 1,263 | 1 | 14 | 2,863 | 2,532 | 13 | |||||||||
| Equity | 746 | 602 | 760 | 24 | (2) | 1,348 | 1,615 | (17) | |||||||||
| Investment Banking 3) | 644 | 545 | 907 | 18 | (29) | 1,189 | 1,648 | (28) | |||||||||
| Other 2) 3) | 57 | 47 | 10 | 21 | 470 | 104 | (114) | – | |||||||||
| Operating income | 2,888 | 2,616 | 2,940 | 10 | (2) | 5,504 | 5,681 | (3) | |||||||||
| Personnel expenses | 1,492 | 1,361 | 1,662 | 10 | (10) | 2,853 | 3,212 | (11) | |||||||||
| Other operating expenses | 591 | 574 | 570 | 3 | 4 | 1,165 | 1,188 | (2) | |||||||||
| Operating expenses | 2,083 | 1,935 | 2,232 | 8 | (7) | 4,018 | 4,400 | (9) | |||||||||
| Gross operating profit | 805 | 681 | 708 | 18 | 14 | 1,486 | 1,281 | 16 | |||||||||
| Depreciation of non-current assets | 96 | 86 | 93 | 12 | 3 | 182 | 195 | (7) | |||||||||
| Valuation adjustments, provisions and losses | 56 | 112 | 252 | (50) | (78) | 168 | 451 | (63) | |||||||||
| Net operating profit before extraordinary items, acquisition-related costs and taxes | 653 | 483 | 363 | 35 | 80 | 1,136 | 635 | 79 | |||||||||
| Extraordinary income/(expenses), net | 0 | 0 | 16 | – | (100) | 0 | 16 | (100) | |||||||||
| Taxes 4) | (183) | (135) | (83) | 36 | 120 | (318) | (137) | 132 | |||||||||
| Net operating profit before acquisition-related costs and minority interests (segment result) | 470 | 348 | 296 | 35 | 59 | 818 | 514 | 59 | |||||||||
| 1) Certain reclassifications have been made to conform to the current presentation. Certain acquisition-related costs, including acquisition interest, amortization of retention payments and amortization of acquired intangible assets and goodwill, not allocated to the segments are included in the business unit results. | |||||||||||||||||
| 2) Reflects the movement of the results of certain non-continuing real estate and distressed assets from Fixed Income to Other. | |||||||||||||||||
| 3) Reflects the movement of the results of certain non-continuing private equity business from Investment Banking to Other. | |||||||||||||||||
| 4) In 4Q2002, Credit Suisse Group adopted a change in accounting principle relating to the recognition of deferred tax assets on net operating losses. The retroactive application of this change in accounting principle would have resulted in taxes for 2Q2002 and for the 6 months 2002 of USD 34 m and USD –20 m, respectively. | |||||||||||||||||
| Institutional Securities income statement 1) | |||||||||||||||||
| Change | Change | Change | |||||||||||||||
| in % from | in % from | in % from | |||||||||||||||
| 6 months | |||||||||||||||||
| in CHF m | 2Q2003 | 1Q2003 | 2Q2002 | 1Q2003 | 2Q2002 | 2003 | 2002 | 2002 | |||||||||
| Fixed Income 2) | 1,917 | 1,948 | 2,021 | (2) | (5) | 3,865 | 4,153 | (7) | |||||||||
| Equity | 995 | 825 | 1,211 | 21 | (18) | 1,820 | 2,648 | (31) | |||||||||
| Investment Banking 3) | 857 | 748 | 1,458 | 15 | (41) | 1,605 | 2,703 | (41) | |||||||||
| Other 2) 3) | 77 | 64 | 23 | 20 | 235 | 141 | (187) | – | |||||||||
| Operating income | 3,846 | 3,585 | 4,713 | 7 | (18) | 7,431 | 9,317 | (20) | |||||||||
| Personnel expenses | 1,987 | 1,864 | 2,665 | 7 | (25) | 3,851 | 5,268 | (27) | |||||||||
| Other operating expenses | 786 | 787 | 908 | 0 | (13) | 1,573 | 1,947 | (19) | |||||||||
| Operating expenses | 2,773 | 2,651 | 3,573 | 5 | (22) | 5,424 | 7,215 | (25) | |||||||||
| Gross operating profit | 1,073 | 934 | 1,140 | 15 | (6) | 2,007 | 2,102 | (5) | |||||||||
| Depreciation of non-current assets | 127 | 119 | 149 | 7 | (15) | 246 | 320 | (23) | |||||||||
| Valuation adjustments, provisions and losses | 73 | 154 | 406 | (53) | (82) | 227 | 739 | (69) | |||||||||
| Net operating profit before extraordinary items, acquisition-related costs and taxes | 873 | 661 | 585 | 32 | 49 | 1,534 | 1,043 | 47 | |||||||||
| Extraordinary income/(expenses), net | 0 | 0 | 26 | – | (100) | 0 | 26 | (100) | |||||||||
| Taxes 4) | (245) | (185) | (134) | 32 | 83 | (430) | (225) | 91 | |||||||||
| Net operating profit before acquisition-related costs and minority interests (segment result) | 628 | 476 | 477 | 32 | 32 | 1,104 | 844 | 31 | |||||||||
| 1) Certain reclassifications have been made to conform to the current presentation. Certain acquisition-related costs, including acquisition interest, amortization of retention payments and amortization of acquired intangible assets and goodwill, not allocated to the segments are included in the business unit results. | |||||||||||||||||
| 2) Reflects the movement of the results of certain non-continuing real estate and distressed assets from Fixed Income to Other. | |||||||||||||||||
| 3) Reflects the movement of the results of certain non-continuing private equity business from Investment Banking to Other. | |||||||||||||||||
| 4) In 4Q2002, Credit Suisse Group adopted a change in accounting principle relating to the recognition of deferred tax assets on net operating losses. The retroactive application of this change in accounting principle would have resulted in taxes for 2Q2002 and for the 6 months 2002 of CHF 58 m and CHF –33 m, respectively. | |||||||||||||||||
| Institutional Securities balance sheet information | |||||||
| in CHF m | 30.06.03 | 31.03.03 | 31.12.02 | ||||
| Total assets | 634,134 | 621,288 | 588,904 | ||||
| Total assets in USD m | 468,757 | 455,757 | 423,611 | ||||
| Due from banks | 215,698 | 213,537 | 198,511 | ||||
| of which securities lending and reverse repurchase agreements | 148,620 | 157,899 | 156,234 | ||||
| Due from customers | 134,799 | 125,552 | 114,775 | ||||
| of which securities lending and reverse repurchase agreements | 52,803 | 53,376 | 57,435 | ||||
| Mortgages | 13,701 | 14,841 | 14,825 | ||||
| Securities and precious metals trading portfolios | 177,785 | 174,533 | 163,480 | ||||
| Due to banks | 324,074 | 317,781 | 292,449 | ||||
| of which securities borrowing and repurchase agreements | 95,179 | 120,453 | 123,017 | ||||
| Due to customers, other | 126,807 | 116,926 | 109,980 | ||||
| of which securities borrowing and repurchase agreements | 64,390 | 64,269 | 66,864 | ||||
| Institutional Securities key information | |||||||||||
| 6 months | |||||||||||
| based on CHF amounts | 2Q2003 | 1Q2003 | 2Q2002 | 2003 | 2002 | ||||||
| Cost/income ratio 1) | 75.4% | 77.3% | 79.0% | 76.3% | 80.9% | ||||||
| Average allocated capital in CHF m | 11,943 | 12,519 | 14,382 | 12,255 | 14,064 | ||||||
| Pre-tax margin 1) | 22.7% | 18.4% | 13.0% | 20.6% | 11.5% | ||||||
| Personnel expenses/operating income 1) | 51.7% | 52.0% | 56.5% | 51.8% | 56.5% | ||||||
| 30.06.03 | 31.03.03 | 31.12.02 | |||||||||
| Number of employees (full-time equivalents) | 15,921 | 16,332 | 16,524 | ||||||||
| 1) Based on the segment results, which exclude certain acquisition-related costs not allocated to the segment. | |||||||||||
| CSFB Financial Services income statement 1) | |||||||||||||||||
| Change | Change | Change | |||||||||||||||
| in % from | in % from | in % from | |||||||||||||||
| 6 months | |||||||||||||||||
| in USD m | 2Q2003 | 1Q2003 | 2Q2002 | 1Q2003 | 2Q2002 | 2003 | 2002 | 2002 | |||||||||
| Net interest income | 13 | 12 | 68 | 8 | (81) | 25 | 117 | (79) | |||||||||
| Net commission and service fee income | 257 | 246 | 447 | 4 | (43) | 503 | 885 | (43) | |||||||||
| Net trading income | 30 | 25 | 32 | 20 | (6) | 55 | 63 | (13) | |||||||||
| Other ordinary income | (1) | 21 | 6 | – | – | 20 | 24 | (17) | |||||||||
| Operating income | 299 | 304 | 553 | (2) | (46) | 603 | 1,089 | (45) | |||||||||
| Personnel expenses | 156 | 148 | 259 | 5 | ; | (40) | 304 | 517 | (41) | ||||||||
| Other operating expenses | 89 | 86 | 164 | 3 | (46) | 175 | 321 | (45) | |||||||||
| Operating expenses | 245 | 234 | 423 | 5 | (42) | 479 | 838 | (43) | |||||||||
| Gross operating profit | 54 | 70 | 130 | (23) | (58) | 124 | 251 | (51) | |||||||||
| Depreciation of non-current assets | 9 | 8 | 23 | 13 | (61) | 17 | 44 | (61) | |||||||||
| Valuation adjustments, provisions and losses | (7) | 16 | 8 | – | – | 9 | 11 | (18) | |||||||||
| Net operating profit before extraordinary items, acquisition-related costs and taxes | 52 | 46 | 99 | 13 | (47) | 98 | 196 | (50) | |||||||||
| Taxes 2) | (14) | (9) | (28) | 56 | (50) | (23) | (55) | (58) | |||||||||
| Net operating profit before acquisition-related costs and minority interests (segment result) | 38 | 37 | 71 | 3 | (46) | 75 | 141 | (47) | |||||||||
| 1) Certain acquisition-related costs, including acquisition interest, amortization of retention payments and amortization of acquired intangible assets and goodwill, not allocated to the segments are included in the business unit results. | |||||||||||||||||
| 2) In 4Q2002, Credit Suisse Group adopted a change in accounting principle relating to the recognition of deferred tax assets on net operating losses. The retroactive application of this change in accounting principle would not have had an impact on the taxes reported for 2Q2002 and for the 6 months 2002. | |||||||||||||||||
| CSFB Financial Services income statement 1) | |||||||||||||||||
| Change | Change | Change | |||||||||||||||
| in % from | in % from | in % from | |||||||||||||||
| 6 months | |||||||||||||||||
| in CHF m | 2Q2003 | 1Q2003 | 2Q2002 | 1Q2003 | 2Q2002 | 2003 | 2002 | 2002 | |||||||||
| Net interest income | 17 | 16 | 109 | 6 | (84) | 33 | 191 | (83) | |||||||||
| Net commission and service fee income | 342 | 337 | 715 | 1 | (52) | 679 | 1,452 | (53) | |||||||||
| Net trading income | 40 | 34 | 52 | 18 | (23) | 74 | 104 | (29) | |||||||||
| Other ordinary income | (2) | 29 | 9 | – | – | 27 | 39 | (31) | |||||||||
| Operating income | 397 | 416 | 885 | (5) | (55) | 813 | 1,786 | (54) | |||||||||
| Personnel expenses | 208 | 203 | 413 | 2 | (50) | 411 | 847 | (51) | |||||||||
| Other operating expenses | 119 | 117 | 264 | 2 | (55) | 236 | 527 | (55) | |||||||||
| Operating expenses | 327 | 320 | 677 | 2 | (52) | 647 | 1,374 | (53) | |||||||||
| Gross operating profit | 70 | 96 | 208 | (27) | (66) | 166 | 412 | (60) | |||||||||
| Depreciation of non-current assets | 11 | 11 | 36 | 0 | (69) | 22 | 72 | (69) | |||||||||
| Valuation adjustments, provisions and losses | (10) | 22 | 14 | – | – | 12 | 19 | (37) | |||||||||
| Net operating profit before extraordinary items, acquisition-related costs and taxes | 69 | 63 | 158 | 10 | (56) | 132 | 321 | (59) | |||||||||
| Taxes 2) | (19) | (12) | (44) | 58 | (57) | (31) | (90) | (66) | |||||||||
| Net operating profit before acquisition-related costs, and minority interests (segment result) | 50 | 51 | 114 | (2) | (56) | 101 | 231 | (56) | |||||||||
| 1) Certain acquisition-related costs, including acquisition interest, amortization of retention payments and amortization of acquired intangible assets and goodwill, not allocated to the segments are included in the business unit results. | |||||||||||||||||
| 2) In 4Q2002, Credit Suisse Group adopted a change in accounting principle relating to the recognition of deferred tax assets on net operating losses. The retroactive application of this change in accounting principle would not have had an impact on the taxes reported for 2Q2002 and for the 6 months 2002. | |||||||||||||||||
| CSFB Financial Services key information | ||||||||||||
| 6 months | ||||||||||||
| based on CHF amounts | 2Q2003 | 1Q2003 | 2Q2002 | 2003 | 2002 | |||||||
| Cost/income ratio 1) | 85.1% | 79.6% | 80.6% | 82.3% | 81.0% | |||||||
| Average allocated capital in CHF m | 552 | 595 | 1,098 | 546 | 1,098 | |||||||
| Pre-tax margin 1) | 17.4% | 15.1% | 17.9% | 16.2% | 18.0% | |||||||
| Personnel expenses/operating income 1) | 52.4% | 48.8% | 46.7% | 50.6% | 47.4% | |||||||
| Net new assets Credit Suisse Asset Management in CHF bn (discretionary) | (1.7) | (5.2) | (6.5) | (6.9) | (10.4) | |||||||
| Net new assets Private Client Services in CHF bn | (1.8) | 1.5 | 2.2 | (0.3) | 5.3 | |||||||
| Growth in assets under management | 5.8% | (4.2%) | (10.7%) | 1.3% | (15.5%) | |||||||
| Growth in discretionary assets under management – Credit Suisse Asset Management | 6.6% | (4.8%) | (10.5%) | 1.5% | (11.6%) | |||||||
| of which net new assets | (0.6%) | (1.9%) | (1.8%) | (2.5%) | (2.9%) | |||||||
| of which market movement and structural effects | 7.2% | (2.9%) | (8.7%) | 3.9% | (8.7%) | |||||||
| Growth in net new assets Private Client Services | (2.7%) | 2.1% | 2.3% | (0.4%) | 5.5% | |||||||
| 30.06.03 | 31.03.03 | 31.12.02 | ||||||||||
| Assets under management in CHF bn | 493.0 | 465.9 | 486.5 | |||||||||
| of which Credit Suisse Asset Management | 421.3 | 397.6 | 412.8 | |||||||||
| of which Private Client Services | 69.3 | 66.3 | 71.7 | |||||||||
| Discretionary assets under management in CHF bn | 299.9 | 281.9 | 297.2 | |||||||||
| of which Credit Suisse Asset Management | 282.8 | 265.3 | 278.7 | |||||||||
| of which mutual funds distributed | 113.3 | 104.9 | 106.5 | |||||||||
| of which Private Client Services | 17.1 | 16.6 | 18.5 | |||||||||
| Advisory assets under management in CHF bn | 193.1 | 184.0 | 189.3 | |||||||||
| Number of employees (full-time equivalents) | 2,795 | 2,886 | 6,900 | |||||||||
| 1) Based on the segment results, which exclude certain acquisition-related costs not allocated to the segment. | ||||||||||||


Introduction
Credit Suisse Financial Services business unit
Credit Suisse First Boston business unit
| Credit Suisse Financial Services | Credit Suisse First Boston | ||||||||||||||||
| Re- | Swiss | Re- | Swiss | Credit | |||||||||||||
| Operating | classifi- | GAAP | Operating | classifi- | GAAP | Corporate | Suisse | ||||||||||
| 2Q2003, in CHF m | basis | cations | basis | basis | cations | basis | Center | 1) | Group | ||||||||
| Operating income | 3,435 | 3,435 | 4,243 | (247) | 2) 3) 5) | 3,996 | 118 | 7,549 | |||||||||
| Personnel expenses | 1,394 | 1,394 | 2,195 | 153 | 2) 3) | 2,348 | 82 | 3,824 | |||||||||
| Other operating expenses | 706 | 706 | 905 | (253) | 3) | 652 | (111) | 1,247 | |||||||||
| Operating expenses | 2,100 | 2,100 | 3,100 | 3,000 | (29) | 5,071 | |||||||||||
| Gross operating profit | 1,335 | 1,335 | 1,143 | 996 | 147 | 2,478 | |||||||||||
| Depreciation of non-current assets | 192 | 192 | 138 | 138 | 145 | 475 | |||||||||||
| Amortization of acquired intangible assets and goodwill | – | 27 | 27 | – | 201 | 2) | 201 | (5) | 223 | ||||||||
| Valuation adjustments, provisions and losses | 90 | (27) | 4) | 63 | 63 | 63 | 5 | 131 | |||||||||
| Profit before extraordinary items and taxes | 1,053 | 1,053 | 942 | 594 | 2 | 1,649 | |||||||||||
| Extraordinary income/(expenses), net | 8 | 8 | 0 | 0 | 53 | 61 | |||||||||||
| Taxes | (216) | (6) | (222) | (264) | 84 | (180) | 83 | (319) | |||||||||
| Net profit before minority interests | 845 | 839 | 678 | 414 | 138 | 1,391 | |||||||||||
| Minority interests | (10) | (10) | 0 | (19) | 5) | (19) | (16) | (45) | |||||||||
| Net profit | 835 | 829 | 678 | 395 | 122 | 1,346 | |||||||||||
| Reconciliation to business unit results | |||||||||||||||||
| Acquisition interests | (64) | 64 | |||||||||||||||
| Amortization of retention payments | (102) | 102 | |||||||||||||||
| Amortization of acquired intangible assets and goodwill | (27) | 27 | (201) | 201 | |||||||||||||
| Tax impact | 0 | 84 | (84) | ||||||||||||||
| Business unit result | 808 | 395 | |||||||||||||||
| 1) Corporate Center includes the parent company operations, including Group financing initiatives, centrally managed, own-use real estate, consisting mainly of bank premises within Switzerland and consolidation adjustments. | |||||||||||||||||
| 2) Reflects acquisition interest of CHF 64 m allocated to operating income, amortization of retention payments of CHF 102 m allocated to personnel expenses and amortization of acquired intangible assets and goodwill of CHF 201 m. | |||||||||||||||||
| 3) Reflects brokerage, execution and clearing expenses of CHF 202 m reclassified from other operating expenses to a reduction of operating income and contractor costs of CHF 39 m and staff recruitment costs of CHF 12 m reclassified from other operating expenses to personnel expenses. | |||||||||||||||||
| 4) Reflects an increase/(decrease) in credit-related valuation adjustments resulting from the difference between statistical and actual credit provisions of CHF –27 m. | |||||||||||||||||
| 5) Reflects expenses of CHF 19 m related to certain redeemable preferred securities reclassified from operating income to minority interests. | |||||||||||||||||
| Credit Suisse Financial Services | Credit Suisse First Boston | ||||||||||||||||
| Re- | Swiss | Re- | Swiss | Credit | |||||||||||||
| Operating | classifi- | GAAP | Operating | classifi- | GAAP | Corporate | Suisse | ||||||||||
| 1Q2003, in CHF m | basis | cations | basis | basis | cations | basis | Center | 1) | Group | ||||||||
| Operating income | 3,393 | 58 | 2) | 3,451 | 4,001 | (249) | 3) 4) 6) | 3,752 | (179) | 7,024 | |||||||
| Personnel expenses | 1,369 | 1,369 | 2,067 | 165 | 3) 4) | 2,232 | 38 | 3,639 | |||||||||
| Other operating expenses | 779 | 779 | 904 | (237) | 4) | 667 | (65) | 1,381 | |||||||||
| Operating expenses | 2,148 | 2,148 | 2,971 | 2,899 | (27) | 5,020 | |||||||||||
| Gross operating profit | 1,245 | 1,303 | 1,030 | 853 | (152) | 2,004 | |||||||||||
| Depreciation of non-current assets | 220 | 220 | 130 | 130 | 70 | 420 | |||||||||||
| Amortization of acquired intangible assets and goodwill | – | 25 | 25 | – | 206 | 3) | 206 | 1 | 232 | ||||||||
| Valuation adjustments, provisions and losses | 81 | (24) | 5) | 57 | 176 | 176 | 0 | 233 | |||||||||
| Profit before extraordinary items and taxes | 944 | 1,001 | 724 | 341 | (223) | 1,119 | |||||||||||
| Extraordinary income/(expenses), net | 7 | (58) | 2) | (51) | 0 | 0 | 2 | (49) | |||||||||
| Taxes | (253) | (5) | (258) | (197) | 96 | (101) | (19) | (378) | |||||||||
| Net profit/(loss) before minority interests | 698 | 692 | 527 | 240 | (240) | 692 | |||||||||||
| Minority interests | (8) | (8) | 0 | (19) | 6) | (19) | (13) | (40) | |||||||||
| Net profit/(loss) | 690 | 684 | 527 | 221 | (253) | 652 | |||||||||||
| Reconciliation to business unit results | |||||||||||||||||
| Acquisition interests | (86) | 86 | |||||||||||||||
| Amortization of retention payments | (110) | 110 | |||||||||||||||
| Amortization of acquired intangible assets and goodwill | (25) | 25 | (206) | 206 | |||||||||||||
| Tax impact | 1 | (1) | 96 | (96) | |||||||||||||
| Business unit result | 666 | 221 | |||||||||||||||
| 1) Corporate Center includes the parent company operations, including Group financing initiatives, centrally managed, own-use real estate, consisting mainly of bank premises within Switzerland and consolidation adjustments. | |||||||||||||||||
| 2) Reflects gains/(losses) from sales of investments within the insurance business of CHF –58 m reclassified from operating income to extraordinary income/(expenses). | |||||||||||||||||
| 3) Reflects acquisition interest of CHF 86 m allocated to operating income, amortization of retention payments of CHF 110 m allocated to personnel expenses and amortization of acquired intangible assets and goodwill of CHF 206 m. | |||||||||||||||||
| 4) Reflects brokerage, execution and clearing expenses of CHF 182 m reclassified from other operating expenses to a reduction of operating income and contractor costs of CHF 46 m and staff recruitment costs of CHF 9 m reclassified from other operating expenses to personnel expenses. | |||||||||||||||||
| 5) Reflects an increase/(decrease) in credit-related valuation adjustments resulting from the difference between statistical and actual credit provisions of CHF –24 m. | |||||||||||||||||
| 6) Reflects expenses of CHF 19 m related to certain redeemable preferred securities reclassified from operating income to minority interests. | |||||||||||||||||
| Credit Suisse Financial Services | Credit Suisse First Boston | ||||||||||||||||
| Re- | Swiss | Re- | Swiss | Credit | |||||||||||||
| Operating | classifi- | GAAP | Operating | classifi- | GAAP | Corporate | Suisse | ||||||||||
| 2Q2002, in CHF m | basis | cations | basis | basis | cations | basis | Center | 1) | Group | ||||||||
| Operating income | 2,718 | (63) | 2) | 2,655 | 5,598 | (322) | 3) 4) 6) | 5,276 | (284) | 7,647 | |||||||
| Personnel expenses | 1,474 | 1,474 | 3,078 | 284 | 3) 4) | 3,362 | (20) | 4,816 | |||||||||
| Other operating expenses | 909 | 909 | 1,172 | (289) | 4) | 883 | (40) | 1,752 | |||||||||
| Operating expenses | 2,383 | 2,383 | 4,250 | 4,245 | (60) | 6,568 | |||||||||||
| Gross operating profit | 335 | 272 | 1,348 | 1,031 | (224) | 1,079 | |||||||||||
| Depreciation of non-current assets | 217 | 217 | 185 | 185 | 64 | 466 | |||||||||||
| Amortization of acquired intangible assets and goodwill | 46 | 46 | 330 | 3) | 330 | (2) | 374 | ||||||||||
| Valuation adjustments, provisions and losses | 95 | 8 | 5) | 103 | 420 | 420 | 39 | 562 | |||||||||
| Profit/(loss) before extraordinary items and taxes | 23 | (94) | 743 | 96 | (325) | (323) | |||||||||||
| Extraordinary income/(expenses), net | 21 | 63 | 2) | 84 | 26 | 26 | 0 | 110 | |||||||||
| Taxes | (380) | 2 | (378) | (178) | 178 | 0 | (39) | (417) | |||||||||
| Net profit/(loss) before minority interests | (336) | (388) | 591 | 122 | (364) | (630) | |||||||||||
| Minority interests | 85 | 85 | 0 | (21) | 6) | (21) | (13) | 51 | |||||||||
| Net profit/(loss) | (251) | (303) | 591 | 101 | (377) | (579) | |||||||||||
| Reconciliation to business unit results | |||||||||||||||||
| Acquisition interests | (158) | 158 | |||||||||||||||
| Amortization of retention payments | (180) | 180 | |||||||||||||||
| Amortization of acquired intangible assets and goodwill | (46) | 46 | (330) | 330 | |||||||||||||
| Tax impact | 0 | 0 | 178 | (178) | |||||||||||||
| Business unit result | (297) | 101 | |||||||||||||||
| 1) Corporate Center includes the parent company operations, including Group financing initiatives, centrally managed, own-use real estate, consisting mainly of bank premises within Switzerland and consolidation adjustments. | |||||||||||||||||
| 2) Reflects gains/(losses) from sales of investments within the insurance business of CHF 63 m reclassified from operating income to extraordinary income/(expenses). | |||||||||||||||||
| 3) Reflects acquisition interest of CHF 158 m allocated to operating income, amortization of retention payments of CHF 180 m allocated to personnel expenses and amortization of acquired intangible assets and goodwill of CHF 330 m. | |||||||||||||||||
| 4) Reflects brokerage, execution and clearing expenses of CHF 185 m reclassified from other operating expenses to a reduction of operating income and contractor costs of CHF 83 m and staff recruitment costs of CHF 21 m reclassified from other operating expenses to personnel expenses. | |||||||||||||||||
| 5) Reflects an increase/(decrease) in credit-related valuation adjustments resulting from the difference between statistical and actual credit provisions of CHF 8 m. | |||||||||||||||||
| 6) Reflects expenses of CHF 21 m related to certain redeemable preferred securities reclassified from operating income to minority interests. | |||||||||||||||||
| Credit Suisse Financial Services | Credit Suisse First Boston | ||||||||||||||||
| Re- | Swiss | Re- | Swiss | Credit | |||||||||||||
| Operating | classifi- | GAAP | Operating | classifi- | GAAP | Corporate | Suisse | ||||||||||
| 6 months 2003, in CHF m | basis | cations | basis | basis | cations | basis | Center | 1) | Group | ||||||||
| Operating income | 6,828 | 58 | 2) | 6,886 | 8,244 | (496) | 3) 4) 6) | 7,748 | (61) | 14,573 | |||||||
| Personnel expenses | 2,763 | 2,763 | 4,262 | 318 | 3) 4) | 4,580 | 120 | 7,463 | |||||||||
| Other operating expenses | 1,485 | 1,485 | 1,809 | (490) | 4) | 1,319 | (176) | 2,628 | |||||||||
| Operating expenses | 4,248 | 4,248 | 6,071 | 5,899 | (56) | 10,091 | |||||||||||
| Gross operating profit | 2,580 | 2,638 | 2,173 | 1,849 | (5) | 4,482 | |||||||||||
| Depreciation of non-current assets | 412 | 412 | 268 | 268 | 215 | 895 | |||||||||||
| Amortization of acquired intangible assets and goodwill | 52 | 52 | 407 | 3) | 407 | (4) | 455 | ||||||||||
| Valuation adjustments, provisions and losses | 171 | (51) | 5) | 120 | 239 | 239 | 5 | 364 | |||||||||
| Profit before extraordinary items and taxes | 1,997 | 2,054 | 1,666 | 935 | (221) | 2,768 | |||||||||||
| Extraordinary income/(expenses), net | 15 | (58) | 2) | (43) | 0 | 0 | 55 | 12 | |||||||||
| Taxes | (469) | (11) | (480) | (461) | 180 | (281) | 64 | (697) | |||||||||
| Net profit before minority interests | 1,543 | 1,531 | 1,205 | 654 | (102) | 2,083 | |||||||||||
| Minority interests | (18) | (18) | 0 | (38) | 6) | (38) | (29) | (85) | |||||||||
| Net profit | 1,525 | 1,513 | 1,205 | 616 | (131) | 1,998 | |||||||||||
| Reconciliation to business unit results | |||||||||||||||||
| Acquisition interests | (150) | 150 | |||||||||||||||
| Amortization of retention payments | (212) | 212 | |||||||||||||||
| Amortization of acquired intangible assets and goodwill | (52) | 52 | (407) | 407 | |||||||||||||
| Tax impact | 1 | (1) | 180 | (180) | |||||||||||||
| Business unit result | 1,474 | 616 | |||||||||||||||
| 1) Corporate Center includes the parent company operations, including Group financing initiatives, centrally managed, own-use real estate, consisting mainly of bank premises within Switzerland and consolidation adjustments. | |||||||||||||||||
| 2) Reflects gains/(losses) from sales of investments within the insurance business of CHF –58 m reclassified from operating income to extraordinary income/(expenses). | |||||||||||||||||
| 3) Reflects acquisition interest of CHF 150 m allocated to operating income, amortization of retention payments of CHF 212 m allocated to personnel expenses and amortization of acquired intangible assets and goodwill of CHF 407 m. | |||||||||||||||||
| 4) Reflects brokerage, execution and clearing expenses of CHF 384 m reclassified from other operating expenses to a reduction of operating income and contractor costs of CHF 85 m and staff recruitment costs of CHF 21 m reclassified from other operating expenses to personnel expenses. | |||||||||||||||||
| 5) Reflects an increase/(decrease) in credit-related valuation adjustments resulting from the difference between statistical and actual credit provisions of CHF –51 m. | |||||||||||||||||
| 6) Reflects expenses of CHF 38 m related to certain redeemable preferred securities reclassified from operating income to minority interests. | |||||||||||||||||
| Credit Suisse Financial Services | Credit Suisse First Boston | ||||||||||||||||
| Re- | Swiss | Re- | Swiss | Credit | |||||||||||||
| Operating | classifi- | GAAP | Operating | classifi- | GAAP | Corporate | Suisse | ||||||||||
| 6 months 2002, in CHF m | basis | cations | basis | basis | cations | basis | Center | Group | |||||||||
| Operating income | 6,024 | (63) | 2) | 5,961 | 11,103 | (674) | 3) 4) 6) | 10,429 | (413) | 15,977 | |||||||
| Personnel expenses | 2,917 | 2,917 | 6,115 | 561 | 3) 4) | 6,676 | 60 | 9,653 | |||||||||
| Other operating expenses | 1,723 | 1,723 | 2,474 | (592) | 4) | 1,882 | (192) | 3,413 | |||||||||
| Operating expenses | 4,640 | 4,640 | 8,589 | 8,558 | (132) | 13,066 | |||||||||||
| Gross operating profit | 1,384 | 1,321 | 2,514 | 1,871 | (281) | 2,911 | |||||||||||
| Depreciation of non-current assets | 422 | 422 | 392 | 392 | 133 | 947 | |||||||||||
| Amortization of acquired intangible assets and goodwill | 75 | 75 | 687 | 3) | 687 | (3) | 759 | ||||||||||
| Valuation adjustments, provisions and losses | 194 | 4 | 5) | 198 | 758 | 758 | 77 | 1,033 | |||||||||
| Profit/(loss) before extraordinary items and taxes | 768 | 626 | 1,364 | 34 | (488) | 172 | |||||||||||
| Extraordinary income/(expenses), net | 18 | 63 | 2) | 81 | 26 | 26 | (2) | 105 | |||||||||
| Taxes | (500) | 2 | (498) | (315) | 365 | 50 | (56) | (504) | |||||||||
| Net profit/(loss) before minority interests | 286 | 209 | 1,075 | 110 | (546) | (227) | |||||||||||
| Minority interests | 83 | 83 | 0 | (41) | 6) | (41) | (26) | 16 | |||||||||
| Net profit/(loss) | 369 | 292 | 1,075 | 69 | (572) | (211) | |||||||||||
| Reconciliation to business unit results | |||||||||||||||||
| Acquisition interests | (325) | 325 | |||||||||||||||
| Amortization of retention payments | (359) | 359 | |||||||||||||||
| Amortization of acquired intangible assets and goodwill | (75) | 75 | (687) | 687 | |||||||||||||
| Tax impact | 1 | (1) | 365 | (365) | |||||||||||||
| Business unit result | 295 | 69 | |||||||||||||||
| 1) Corporate Center includes the parent company operations, including Group financing initiatives, centrally managed, own-use real estate, consisting mainly of bank premises within Switzerland and consolidation adjustments. | |||||||||||||||||
| 2) Reflects gains/(losses) from sales of investments within the insurance business of CHF 63 m reclassified from operating income to extraordinary income/(expenses). | |||||||||||||||||
| 3) Reflects acquisition interest of CHF 325 m allocated to operating income, amortization of retention payments of CHF 359 m allocated to personnel expenses and amortization of acquired intangible assets and goodwill of CHF 687 m. | |||||||||||||||||
| 4) Reflects brokerage, execution and clearing expenses of CHF 390 m reclassified from other operating expenses to a reduction of operating income and contractor costs of CHF 171 m and staff recruitment costs of CHF 31 m reclassified from other operating expenses to personnel expenses. | |||||||||||||||||
| 5) Reflects an increase/(decrease) in credit-related valuation adjustments resulting from the difference between statistical and actual credit provisions of CHF 4 m. | |||||||||||||||||
| 6) Reflects expenses of CHF 41 m related to certain redeemable preferred securities reclassified from operating income to minority interests. | |||||||||||||||||
| Consolidated income statement | |||||||||||||||||
| Change | Change | Change | |||||||||||||||
| in % from | in % from | in % from | |||||||||||||||
| 6 months | |||||||||||||||||
| in CHF m | 2Q2003 | 1Q2003 | 2Q2002 | 1Q2003 | 2Q2002 | 2003 | 2002 | 2002 | |||||||||
| Interest and discount income | 3,513 | 3,341 | 4,626 | 5 | (24) | 6,854 | 9,278 | (26) | |||||||||
| Interest and dividend income from trading portfolios | 2,445 | 2,026 | 2,610 | 21 | (6) | 4,471 | 5,258 | (15) | |||||||||
| Interest and dividend income from financial investments | 172 | 175 | 172 | (2) | 0 | 347 | 279 | 24 | |||||||||
| Interest expenses | (4,268) | (3,891) | (5,232) | 10 | (18) | (8,159) | (10,786) | (24) | |||||||||
| Net interest income | 1,862 | 1,651 | 2,176 | 13 | (14) | 3,513 | 4,029 | (13) | |||||||||
| Commission income from lending activities | 243 | 205 | 207 | 19 | 17 | 448 | 407 | 10 | |||||||||
| Commission income from securities and investment transactions | 2,641 | 2,555 | 3,921 | 3 | (33) | 5,196 | 7,834 | (34) | |||||||||
| Commission income from other services | 258 | 241 | 431 | 7 | (40) | 499 | 916 | (46) | |||||||||
| Commission expenses | (182) | (187) | (200) | (3) | (9) | (369) | (425) | (13) | |||||||||
| Net commission and service fee income | 2,960 | 2,814 | 4,359 | 5 | (32) | 5,774 | 8,732 | (34) | |||||||||
| Net trading income | 1,327 | 1,273 | 889 | 4 | 49 | 2,600 | 2,105 | 24 | |||||||||
| Premiums earned, net | 7,585 | 10,476 | 7,367 | (28) | 3 | 18,061 | 17,830 | 1 | |||||||||
| Claims incurred and actuarial provisions | (8,143) | (9,684) | (5,381) | (16) | 51 | (17,827) | (15,512) | 15 | |||||||||
| Commission expenses, net | (624) | (589) | (575) | 6 | 9 | (1,213) | (1,019) | 19 | |||||||||
| Investment income from the insurance business | 2,523 | 1,332 | (932) | 89 | – | 3,855 | 150 | – | |||||||||
| Net income from the insurance business | 1,341 | 1,535 | 479 | (13) | 180 | 2,876 | 1,449 | 98 | |||||||||
| Income from the sale of financial investments | 147 | 75 | 265 | 96 | (45) | 222 | 514 | (57) | |||||||||
| Income from investments in associates | (2) | 43 | 24 | – | – | 41 | 84 | (51) | |||||||||
| Income from other non-consolidated participations | 15 | 1 | 15 | – | 0 | 16 | 22 | (27) | |||||||||
| Real estate income | 45 | 43 | 57 | 5 | (21) | 88 | 88 | 0 | |||||||||
| Sundry ordinary income | 237 | 210 | 184 | 13 | 29 | 447 | 446 | 0 | |||||||||
| Sundry ordinary expenses 1) | (383) | (621) | (801) | (38) | (52) | (1,004) | (1,492) | (33) | |||||||||
| Other ordinary income/(expenses), net | 59 | (249) | (256) | – | – | (190) | (338) | (44) | |||||||||
| Operating income | 7,549 | 7,024 | 7,647 | 7 | (1) | 14,573 | 15,977 | (9) | |||||||||
| Personnel expenses | 3,824 | 3,639 | 4,816 | 5 | (21) | 7,463 | 9,653 | (23) | |||||||||
| Other operating expenses | 1,247 | 1,381 | 1,752 | (10) | (29) | 2,628 | 3,413 | (23) | |||||||||
| Operating expenses | 5,071 | 5,020 | 6,568 | 1 | (23) | 10,091 | 13,066 | (23) | |||||||||
| Gross operating profit | 2,478 | 2,004 | 1,079 | 24 | 130 | 4,482 | 2,911 | 54 | |||||||||
| Depreciation of non-current assets 2) | 475 | 420 | 466 | 13 | 2 | 895 | 947 | (5) | |||||||||
| Amortization of acquired intangible assets | 78 | 81 | 173 | (4) | (55) | 159 | 366 | (57) | |||||||||
| Amortization of goodwill | 145 | 151 | 201 | (4) | (28) | 296 | 393 | (25) | |||||||||
| Valuation adjustments, provisions and losses from the banking business 1) | 131 | 233 | 562 | (44) | (77) | 364 | 1,033 | (65) | |||||||||
| Depreciation, valuation adjustments and losses | 829 | 885 | 1,402 | (6) | (41) | 1,714 | 2,739 | (37) | |||||||||
| Profit/(loss) before extraordinary items and taxes | 1,649 | 1,119 | (323) | 47 | – | 2,768 | 172 | – | |||||||||
| Extraordinary income | 120 | 9 | 121 | – | (1) | 129 | 125 | 3 | |||||||||
| Extraordinary expenses | (59) | (58) | (11) | 2 | 436 | (117) | (20) | 485 | |||||||||
| Taxes 3) | (319) | (378) | (417) | (16) | (24) | (697) | (504) | 38 | |||||||||
| Net profit/(loss) before minority interests | 1,391 | 692 | (630) | 101 | – | 2,083 | (227) | – | |||||||||
| Minority interests | (45) | (40) | 51 | 13 | – | (85) | 16 | – | |||||||||
| Net profit/(loss) | 1,346 | 652 | (579) | 106 | – | 1,998 | (211) | – | |||||||||
| 1) Effective in the first quarter 2003, declines in value of debt securities and loans available for sale due to deterioration in creditworthiness are reported in “Sundry ordinary expenses”. In previous years they were recorded in “Valuation adjustments, provisions and losses from the banking business”. | |||||||||||||||||
| 2) Includes amortization of Present Value of Future Profits (PVFP) from the insurance business. | |||||||||||||||||
| 3) In 4Q2002, Credit Suisse Group adopted a change in accounting principle relating to the recognition of deferred tax assets on net operating losses. The retroactive application of this change in accounting principle would have resulted in taxes for 2Q2002 and for the 6 months 2002 of CHF –41 m and CHF –94 m, respectively. | |||||||||||||||||
| Consolidated balance sheet | |||||||||||
| Change | Change | ||||||||||
| in % from | in % from | ||||||||||
| in CHF m | 30.06.03 | 31.03.03 | 31.12.02 | 31.03.03 | 31.12.02 | ||||||
| Assets | |||||||||||
| Cash and other liquid assets | 4,016 | 2,440 | 2,551 | 65 | 57 | ||||||
| Money market papers | 21,283 | 22,921 | 25,125 | (7) | (15) | ||||||
| Due from banks | 215,292 | 213,829 | 195,778 | 1 | 10 | ||||||
| Receivables from the insurance business | 12,359 | 12,604 | 12,290 | (2) | 1 | ||||||
| Due from customers | 193,115 | 185,370 | 182,143 | 4 | 6 | ||||||
| Mortgages | 96,816 | 96,342 | 94,896 | 0 | 2 | ||||||
| Securities and precious metals trading portfolios | 187,358 | 183,424 | 173,133 | 2 | 8 | ||||||
| Financial investments from the banking business | 35,053 | 32,889 | 33,394 | 7 | 5 | ||||||
| Investments from the insurance business | 140,045 | 131,605 | 128,450 | 6 | 9 | ||||||
| Non-consolidated participations | 1,594 | 5,011 | 1,792 | (68) | (11) | ||||||
| Tangible fixed assets | 7,726 | 7,693 | 8,152 | 0 | (5) | ||||||
| Intangible assets | 15,447 | 15,799 | 18,359 | (2) | (16) | ||||||
| Accrued income and prepaid expenses | 14,742 | 13,882 | 13,882 | 6 | 6 | ||||||
| Other assets | 71,799 | 68,334 | 65,711 | 5 | 9 | ||||||
| Total assets | 1,016,645 | 992,143 | 955,656 | 2 | 6 | ||||||
| Subordinated assets | 6,361 | 5,866 | 5,479 | 1) | 8 | 16 | |||||
| Receivables due from non-consolidated participations | 864 | 986 | 728 | (12) | 19 | ||||||
| Liabilities and shareholders' equity | |||||||||||
| Money market papers issued | 26,967 | 29,438 | 22,178 | (8) | 22 | ||||||
| Due to banks | 325,887 | 316,302 | 287,884 | 3 | 13 | ||||||
| Payables from the insurance business | 8,556 | 8,365 | 10,218 | 2 | (16) | ||||||
| Due to customers in savings and investment deposits | 42,398 | 41,582 | 39,739 | 2 | 7 | ||||||
| Due to customers, other | 262,342 | 254,215 | 258,244 | 3 | 2 | ||||||
| Medium-term notes (cash bonds) | 2,161 | 2,331 | 2,599 | (7) | (17) | ||||||
| Bonds and mortgage-backed bonds | 80,701 | 84,441 | 81,839 | (4) | (1) | ||||||
| Accrued expenses and deferred income | 16,774 | 13,384 | 17,463 | 25 | (4) | ||||||
| Other liabilities | 57,812 | 56,931 | 56,070 | 2 | 3 | ||||||
| Valuation adjustments and provisions | 12,508 | 12,254 | 11,557 | 2 | 8 | ||||||
| Technical provisions for the insurance business | 147,111 | 141,498 | 136,471 | 4 | 8 | ||||||
| Total liabilities | 983,217 | 960,741 | 924,262 | 2 | 6 | ||||||
| Reserve for general banking risks | 1,733 | 1,739 | 1,739 | 0 | 0 | ||||||
| Share capital | 1,190 | 1,190 | 1,190 | 0 | 0 | ||||||
| Capital reserve | 20,713 | 20,710 | 20,710 | 0 | 0 | ||||||
| Revaluation reserves for the insurance business | 1,704 | 1,044 | 1,504 | 63 | 13 | ||||||
| Reserve for own shares | 1,950 | 1,950 | 1,950 | 0 | 0 | ||||||
| Retained earnings | 1,200 | 1,238 | 4,732 | (3) | (75) | ||||||
| Minority interests | 2,940 | 2,879 | 2,878 | 2 | 2 | ||||||
| Net profit/(loss) | 1,998 | 652 | (3,309) | 206 | – | ||||||
| Total shareholders' equity | 33,428 | 31,402 | 31,394 | 6 | 6 | ||||||
| Total liabilities and shareholders' equity | 1,016,645 | 992,143 | 955,656 | 2 | 6 | ||||||
| Subordinated liabilities | 20,186 | 20,418 | 1) | 20,932 | 1) | (1) | (4) | ||||
| Liabilities due to non-consolidated participations | 1,390 | 1,714 | 1,164 | (19) | 19 | ||||||
| 1) Restated. | |||||||||||
| Off-balance sheet and fiduciary business | |||||
| in CHF m | 30.06.03 | 31.12.02 | |||
| Credit guarantees in form of bills of exchange and other guarantees 1) | 30,310 | 27,745 | |||
| Bid bonds, delivery and performance bonds, letters of indemnity, other performance-related guarantees | 4,848 | 4,680 | |||
| Irrevocable commitments in respect of documentary credits | 3,077 | 3,242 | |||
| Other contingent liabilities | 2,821 | 3,437 | |||
| Contingent liabilities | 41,056 | 39,104 | |||
| Irrevocable commitments | 98,891 | 92,950 | 2) | ||
| Liabilities for calls on shares and other equity instruments | 39 | 43 | |||
| Confirmed credits | 55 | 32 | |||
| Total off-balance sheet | 140,041 | 132,129 | |||
| Fiduciary transactions | 36,407 | 37,703 | |||
At 30.06.03, market value guarantees reported as derivatives totaled CHF 220.5 bn (31.12.02: CHF 170.4 bn) (nominal value). The associated replacement value reported on-balance sheet totaled CHF 5.8 bn (31.12.02: CHF 10.3 bn). | |||||
| 1) Including credit guarantees of securities lent as arranger: 30.06.03: CHF 23.7 bn (31.12.02: CHF 20.7 bn). | |||||
| 2) 31.12.02 restated. | |||||
| Derivative instruments | |||||||||||||
| Positive | Negative | Positive | Negative | ||||||||||
| gross | gross | gross | gross | ||||||||||
| Nominal | replacement | replacement | Nominal | replacement | replacement | ||||||||
| value | value | 1) | value | 1) | value | value | 1) | value | 1) | ||||
| in CHF bn | 30.06.03 | 30.06.03 | 30.06.03 | 31.12.02 | 31.12.02 | 31.12.02 | |||||||
| Interest rate products | 11,855.4 | 227.5 | 219.0 | 10,647.2 | 185.4 | 181.0 | |||||||
| Foreign exchange products | 1,794.9 | 37.5 | 38.2 | 1,376.7 | 34.8 | 36.1 | |||||||
| Precious metals products | 15.6 | 0.6 | 2.4 | 19.8 | 0.9 | 2.5 | |||||||
| Equity/index-related products | 419.1 | 16.5 | 17.6 | 347.5 | 12.6 | 13.0 | |||||||
| Other products | 243.7 | 3.7 | 5.3 | 179.4 | 4.3 | 5.0 | |||||||
| Total derivative instruments | 14,328.7 | 285.8 | 282.5 | 12,570.6 | 238.0 | 237.6 | |||||||
| 1) Including replacement values for traded derivatives (futures and traded options) subject to daily margining requirements. Total positive and negative replacement values of traded derivatives amount to CHF 4.0 bn (31.12.02: CHF 1.5 bn) and CHF 3.0 bn (31.12.02: CHF 1.1 bn). | |||||||||||||
| Currency translation rates | ||||||||||||||
| Average rate year-to-date | Closing rate used in the | |||||||||||||
| used in the income statement | balance sheet as of | |||||||||||||
| in CHF | 2Q2003 | 1Q2003 | 2Q2002 | 30.06.03 | 31.03.03 | 31.12.02 | ||||||||
| 1 USD | 1.35 | 1.37 | 1.64 | 1.3528 | 1.3632 | 1.3902 | ||||||||
| 1 EUR | 1.49 | 1.47 | 1.47 | 1.5461 | 1.4768 | 1.4550 | ||||||||
| 1 GBP | 2.18 | 2.19 | 2.36 | 2.2357 | 2.1493 | 2.2357 | ||||||||
| 100 JPY | 1.14 | 1.15 | 1.26 | 1.1290 | 1.1434 | 1.1722 | ||||||||
| Income statement of the banking and insurance business 1) | |||||||||||||
| Banking business | |||||||||||||
| (incl. Corporate Center) | Insurance business | 2) | Credit Suisse Group | ||||||||||
| 6 months, in CHF m | 2003 | 2002 | 2003 | 2002 | 2003 | 2002 | |||||||
| Net interest income | 3,514 | 3,992 | – | – | 3,513 | 4,029 | |||||||
| Net commission and service fee income | 5,756 | 8,740 | – | – | 5,774 | 8,732 | |||||||
| Net trading income | 2,602 | 2,105 | – | – | 2,600 | 2,105 | |||||||
| Net income from the insurance business 3) | – | – | 2,894 | 1,457 | 2,876 | 1,449 | |||||||
| Other ordinary income/(expenses), net | 69 | (45) | (269) | (286) | (190) | (338) | |||||||
| Operating income | 11,941 | 14,792 | 2,625 | 1,171 | 14,573 | 15,977 | |||||||
| Personnel expenses | 6,433 | 8,524 | 1,030 | 1,129 | 7,463 | 9,653 | |||||||
| Other operating expenses | 1,927 | 2,643 | 696 | 753 | 2,628 | 3,413 | |||||||
| Operating expenses | 8,360 | 11,167 | 1,726 | 1,882 | 10,091 | 13,066 | |||||||
| Gross operating profit/(loss) | 3,581 | 3,625 | 899 | (711) | 4,482 | 2,911 | |||||||
| Depreciation of non-current assets | 631 | 672 | 264 | 276 | 895 | 947 | |||||||
| Amortization of acquired intangible assets | 159 | 366 | 0 | 0 | 159 | 366 | |||||||
| Amortization of goodwill | 264 | 358 | 32 | 34 | 296 | 393 | |||||||
| Valuation adjustments, provisions and losses from the banking business | 364 | 1,034 | – | – | 364 | 1,033 | |||||||
| Depreciation, valuation adjustments and losses | 1,418 | 2,430 | 296 | 310 | 1,714 | 2,739 | |||||||
| Profit/(loss) before extraordinary items, taxes and minority interests | 2,163 | 1,195 | 603 | (1,021) | 2,768 | 172 | |||||||
| Extraordinary income | 102 | 62 | 27 | 63 | 129 | 125 | |||||||
| Extraordinary expenses | (32) | (20) | (85) | 0 | (117) | (20) | |||||||
| Taxes | (540) | (377) | (158) | (126) | (697) | (504) | |||||||
| Net profit/(loss) before minority interests | 1,693 | 860 | 387 | (1,084) | 2,083 | (227) | |||||||
| Minority interests | (74) | (77) | (10) | 93 | (85) | 16 | |||||||
| Net profit/(loss) | 1,619 | 783 | 377 | (991) | 1,998 | (211) | |||||||
| 1) Income statements for the banking and insurance business are presented on a stand-alone basis. | |||||||||||||
| 2) Represents “Winterthur” Swiss Insurance Company. | |||||||||||||
| 3) Insurance business: expenses due to the handling of both claims and investments are allocated to the income from the insurance business, of which CHF 282 m (6 months 2002: CHF 265 m) are related to personnel expenses and CHF 219 m (6 months 2002: CHF 213 m) to other operating expenses. | |||||||||||||
| Statement of shareholders' equity | |||||
| 6 months | |||||
| in CHF m | 2003 | 2002 | |||
| At beginning of financial year | 31,394 | 38,921 | |||
| Dividends paid | (123) | 0 | |||
| Dividends paid to minority interests | (103) | (117) | |||
| Capital increases, par value and capital surplus | 2 | 15 | |||
| Changes in scope of consolidation affecting minority interests | (16) | (36) | |||
| Foreign exchange impact | (31) | (1,724) | |||
| Change in revaluation reserves from the insurance business, net | 228 | (374) | |||
| Change in reserve for general banking risks, net | (6) | 0 | |||
| Minority interests in net profit | 85 | (16) | |||
| Net profit | 1,998 | (211) | |||
| At end of period | 33,428 | 36,458 | |||
| Due from banks | |||||
| in CHF m | 30.06.03 | 31.12.02 | |||
| Due from banks, gross | 215,382 | 195,866 | |||
| Valuation allowance | (90) | (88) | |||
| Total due from banks, net | 215,292 | 195,778 | |||
| Due from customers and mortgages | |||||
| in CHF m | 30.06.03 | 31.12.02 | |||
| Due from customers, gross 1) | 197,853 | 187,617 | |||
| Valuation allowance | (4,738) | (5,474) | |||
| Due from customers, net | 193,115 | 182,143 | |||
| Mortgages, gross 1) | 98,361 | 97,037 | |||
| Valuation allowance | (1,545) | (2,141) | |||
| Mortgages, net | 96,816 | 94,896 | |||
| Total due from customers and mortgages, net | 289,931 | 277,039 | |||
| 1) Effective 1Q2003, loans held for sale are presented net of the related loan valuation allowances. | |||||
| Due from customers and mortgages by sector | |||||
| in CHF m | 30.06.03 | 31.12.02 | 1) | ||
| Financial services | 62,436 | 43,553 | |||
| Real estate companies | 15,849 | 16,472 | |||
| Other services including technology companies | 15,010 | 15,316 | |||
| Manufacturing | 12,771 | 13,273 | |||
| Wholesale and retail trade | 10,410 | 11,165 | |||
| Construction | 4,385 | 4,314 | |||
| Transportation | 3,909 | 4,149 | |||
| Telecommunications | 2,123 | 2,333 | |||
| Health and social services | 1,969 | 2,340 | |||
| Hotels and restaurants | 2,227 | 2,390 | |||
| Agriculture and mining | 2,660 | 2,317 | |||
| Non-profit and international organizations | 180 | 191 | |||
| Commercial | 133,929 | 117,813 | |||
| Consumers | 93,050 | 87,145 | |||
| Public authorities | 5,243 | 5,023 | |||
| Lease financings | 3,323 | 3,158 | |||
| Professional securities transactions and securitized loans | 60,669 | 71,515 | |||
| Due from customers and mortgages, gross | 296,214 | 284,654 | |||
| Valuation allowance | (6,283) | (7,615) | |||
| Total due from customers and mortgages, net | 289,931 | 277,039 | |||
| 1) 31.12.02 restated. | |||||
| Collateral of due from customers and mortgages | |||||||||
| Mortgage | Other | Without | Total | ||||||
| in CHF m | collateral | collateral | collateral | 30.06.03 | |||||
| Due from customers | 5,294 | 143,694 | 44,127 | 193,115 | |||||
| Residential properties | 70,713 | ||||||||
| Business and office properties | 11,664 | ||||||||
| Commercial and industrial properties | 12,042 | ||||||||
| Other properties | 2,397 | ||||||||
| Mortgages | 96,816 | 96,816 | |||||||
| Total collateral | 102,110 | 143,694 | 44,127 | 289,931 | |||||
| As of 31.12.02 | 100,002 | 129,300 | 47,737 | 277,039 | |||||
| Loan valuation allowance | |||||
| in CHF m | 30.06.03 | 31.12.02 | |||
| Due from banks | 90 | 88 | |||
| Due from customers | 4,738 | 5,474 | |||
| Mortgages | 1,545 | 2,141 | |||
| Total loans valuation allowance 1) 2) | 6,373 | 7,703 | |||
| of which on principal | 5,441 | 6,617 | |||
| of which on interest | 932 | 1,086 | |||
| 1) Of which are CHF 5,453 m specific allowances for impaired loans (31.12.02: CHF 6,778 m). | |||||
| 2) Effective 1Q2003, valuation allowances related to loans held for sale are netted directly with such loans, and are not presented separately in the total loan valuation allowance. | |||||
| Roll forward of loan valuation allowance | |||||
| 6 months | |||||
| in CHF m | 2003 | 2002 | |||
| At beginning of financial year | 7,703 | 9,264 | |||
| Net additions charged to income statement | 272 | 779 | |||
| Net write-offs | (1,286) | (2,088) | |||
| Reclassified to loans held for sale | (355) | – | |||
| Provisions for interest | 69 | 109 | |||
| Foreign currency translation impact and other | (30) | (202) | |||
| At end of period | 6,373 | 7,862 | |||
| Impaired loans 1) | |||||
| in CHF m | 30.06.03 | 31.12.02 | |||
| With a specific allowance | 8,706 | 11,714 | |||
| Without a specific allowance | 789 | 655 | |||
| Total impaired loans, gross | 9,495 | 12,369 | |||
| Non-performing loans | 4,526 | 6,355 | |||
| Non-interest earning loans | 2,143 | 2,325 | |||
| Restructured loans | 261 | 281 | |||
| Potential problem loans 2) | 2,565 | 3,408 | |||
| Total impaired loans, gross | 9,495 | 12,369 | |||
| 1) Effective 1Q2003, loans classified as held for sale are excluded from presentation as impaired. | |||||
| 2) Potential problem loans consist of loans where interest payments are being made but where, in the credit officer's assessment, some doubt exists as to the timing and/or certainty of the repayment of contractual principal. | |||||
| Securities and precious metals trading portfolios | |||||
| in CHF m | 30.06.03 | 31.12.02 | |||
| Listed on stock exchange | 66,192 | 58,661 | |||
| Unlisted | 81,319 | 76,083 | |||
| Debt instruments | 147,511 | 134,744 | |||
| of which own bonds and medium-term notes | 1,013 | 1,520 | |||
| Listed on stock exchange | 32,134 | 33,208 | |||
| Unlisted | 6,689 | 3,935 | |||
| Equity instruments | 38,823 | 37,143 | |||
| of which own shares | 2,241 | 2,254 | |||
| Precious metals | 1,024 | 1,246 | |||
| Total securities and precious metals trading portfolios | 187,358 | 173,133 | |||
| of which securities rediscountable or pledgeable with central banks | 34,006 | 27,426 | |||
| Investments from the insurance business | |||||||||||
| Gross | Gross | ||||||||||
| Amortized | unrealized | unrealized | |||||||||
| As of 30.06.03, in CHF m | Book value | cost | gains | losses | Fair value | ||||||
| Debt securities issued by Swiss Federal Government, cantonal or local governmental entities | 11,844 | 11,524 | 372 | 52 | 11,844 | ||||||
| Debt securities issued by foreign governments | 27,101 | 25,897 | 1,253 | 49 | 27,101 | ||||||
| Corporate debt securities | 40,877 | 38,437 | 2,548 | 108 | 40,877 | ||||||
| Other | 9,172 | 8,599 | 584 | 11 | 9,172 | ||||||
| Debt securities | 88,994 | 84,457 | 4,757 | 220 | 88,994 | ||||||
| Equity securities | 6,913 | 6,615 | 407 | 109 | 6,913 | ||||||
| Total securities – available-for-sale | 95,907 | 91,072 | 5,164 | 329 | 95,907 | ||||||
| Debt securities | 239 | – | – | – | – | ||||||
| Equity securities | 63 | – | – | – | – | ||||||
| Total securities – trading | 302 | – | – | – | – | ||||||
| Own shares | 36 | – | – | – | – | ||||||
| Mortgage loans | 10,839 | – | – | – | – | ||||||
| Other loans | 4,268 | – | – | – | – | ||||||
| Real estate | 7,704 | – | – | – | 10,369 | ||||||
| Short-term investments and other | 6,133 | – | – | – | – | ||||||
| Investments from the insurance business | 125,189 | – | – | – | – | ||||||
| Equity securities | 10,412 | – | – | – | – | ||||||
| Debt securities | 2,896 | – | – | – | – | ||||||
| Short-term investments | 1,382 | – | – | – | – | ||||||
| Real estate | 166 | – | – | – | – | ||||||
| Investments where the investment risk is borne by the policyholder | 14,856 | – | – | – | – | ||||||
| Investments from the insurance business | 140,045 | – | – | – | – | ||||||
| Investments from the insurance business 1) | |||||||||||
| Gross | Gross | ||||||||||
| Amortized | unrealized | unrealized | |||||||||
| As of 31.12.02, in CHF m | Book value | cost | gains | losses | Fair value | ||||||
| Debt securities issued by Swiss Federal Government, cantonal or local governmental entities | 10,814 | 9,951 | 863 | 0 | 10,814 | ||||||
| Debt securities issued by foreign governments | 27,110 | 26,337 | 871 | 98 | 27,110 | ||||||
| Corporate debt securities | 29,042 | 27,478 | 1,717 | 153 | 29,042 | ||||||
| Other | 9,685 | 9,157 | 552 | 24 | 9,685 | ||||||
| Debt securities | 76,651 | 72,923 | 4,003 | 275 | 76,651 | ||||||
| Equity securities | 9,052 | 9,171 | 336 | 455 | 9,052 | ||||||
| Total securities – available-for-sale | 85,703 | 82,094 | 4,339 | 730 | 85,703 | ||||||
| Debt securities | 246 | – | – | – | – | ||||||
| Equity securities | 31 | – | – | – | – | ||||||
| Total securities – trading | 277 | – | – | – | – | ||||||
| Own shares | 44 | – | – | – | – | ||||||
| Mortgage loans | 10,175 | – | – | – | – | ||||||
| Other loans | 4,305 | – | – | – | – | ||||||
| Real estate | 7,431 | – | – | – | 10,057 | ||||||
| Short-term investments and other | 7,120 | – | – | – | – | ||||||
| Investments from the insurance business | 115,055 | – | – | – | – | ||||||
| Equity securities | 9,288 | – | – | – | – | ||||||
| Debt securities | 2,841 | – | – | – | – | ||||||
| Short-term investments | 1,069 | – | – | – | – | ||||||
| Real estate | 197 | – | – | – | – | ||||||
| Investments where the investment risk is borne by the policyholder | 13,395 | – | – | – | – | ||||||
| Investments from the insurance business | 128,450 | – | – | – | – | ||||||
| 1) Certain reclassifications have been made to conform to the current presentation. | |||||||||||
| Financial calendar | |
| Third quarter results 2003 | Tuesday, November 4, 2003 |
| Fourth quarter/full-year results 2003 | Thursday, February 12, 2004 |
| Annual General Meeting | Friday, April 30, 2004 |
| Credit Suisse Group shares | ||||
| Ticker symbols | ||||
| Stock exchange listings | Bloomberg | Reuters | Telekurs | |
| SWX Swiss Exchange/virt-x | CSGN VX | CSGZn.VX | CSGN,380 | |
| Frankfurt | CSX GR | CSGZn.DE | CSX,013 | |
| New York (ADS) 1) | CSR US | CSR.N | CSR,065 | |
| 1) 1 ADS represents 1 registered share. | ||||
| Swiss security number | 1213853 | |||
| ISIN number | CH0012138530 | |||
| German security number | DE 876 800 | |||
| CUSIP number | 225 401 108 | |||
| Ratings | |||||||
| Moody’s | Standard & Poor’s | Fitch Ratings | |||||
| Credit Suisse Group | |||||||
| Short term | | A-1 | F-1+ | ||||
| Long term | Aa3 | A | AA- | ||||
| Outlook | Negative | Stable | Negative | ||||
| Credit Suisse | |||||||
| Short term | P-1 | A-1 | F-1+ | ||||
| Long term | Aa3 | A+ | AA- | ||||
| Outlook | Negative | Stable | Negative | ||||
| Credit Suisse First Boston | |||||||
| Short term | P-1 | A-1 | F-1+ | ||||
| Long term | Aa3 | A+ | AA- | ||||
| Outlook | Negative | Stable | Negative | ||||
| Winterthur | |||||||
| Insurer Financial Strength | A1 | A | AA | ||||
| Credit | A2 | A | AA- | ||||
| Outlook | Negative | Negative | Negative | ||||
Enquiries
Credit Suisse Group
Investor Relations
Gerhard Beindorff, Marc Buchheister
Tel. +41 1 333 4570/+41 1 333 3169
Fax +41 1 333 2587
Credit Suisse Group
Media Relations
Karin Rhomberg Hug, Claudia Kraaz
Tel. +41 1 333 8844
Fax +41 1 333 8877
Financial Publications
Printed financial publications may be ordered from:
Credit Suisse
KIDM 23
Uetlibergstrasse 231
8070 Zurich
Switzerland
Fax +41 1 332 7294
www.credit-suisse.com/results/order.html

Credit Suisse Group
Paradeplatz 8 P.O. Box 1
8070 Zurich Switzerland
Tel. +41 1 212 1616
Fax +41 1 333 2587
www.credit-suisse.com
| QUARTERLY RESULTS 2003 | Q2 | |
 | ||
PRESENTATION
| RESULTS OVERVIEW | |||
| CONSOLIDATED RESULTS | 4 | ||
| CREDIT SUISSE FINANCIAL SERVICES | 11 | ||
| CREDIT SUISSE FIRST BOSTON | 19 | ||
| ADDITIONAL INFORMATION | 26 | ||
| DISCLAIMER | 45 |
 | Slide 1 |
RESULTS OVERVIEW
| in CHF m | Q2/03 | Q1/03 | Q2/02 | 6M/03 | 6M/02 | ||||||||
| Credit Suisse | |||||||||||||
| Financial Services | 829 | 684 | (303 | ) | 1,513 | 292 | |||||||
| Credit Suisse First Boston | 395 | 221 | 101 | 616 | 69 | ||||||||
| Corporate Center & adjustments | 122 | (253 | ) | (377 | ) | (131 | ) | (572 | ) | ||||
| Net profit/(loss) | 1,346 | 652 | (579 | ) | 1,998 | (211 | ) | ||||||
| Amortization of acquired intangible assets and goodwill | 223 | 232 | 354 | 455 | 739 | ||||||||
| Tax impact | (26 | ) | (28 | ) | (60 | ) | (55 | ) | (127 | ) | |||
| Net operating profit | 1,543 | 856 | (285 | ) | 2,398 | 401 | |||||||
| Basic earnings per share (in CHF) | 1.09 | 0.53 | (0.49 | ) | 1.62 | (0.18 | ) | ||||||
| Return on equity (annualized) | 18.5% | 9.2% | (6.6% | ) | 13.8% | (1.2% | ) | ||||||
| Slide 2 |
KEY TRENDS IN Q2/03
| Substantial progress achieved in our efforts to return the Group to sound profitability | |
| CSFS banking businesses improved results due to higher operating income and efficiency measures | |
| Slightly higher results at Winterthur, driven mainly by reduced administration costs | |
| CSFB results driven primarily by continued strength in Fixed Income, improvements in Equity and Investment Banking, and lower credit provisions | |
| Further strengthening of capital base achieved due primarily to earnings generation and managed balance sheet growth | |
| Improved net new assets generation across all segments |
| Slide 3 |
PRESENTATION
| RESULTS OVERVIEW | Slide | 1 | |
| CONSOLIDATED RESULTS | |||
| CREDIT SUISSE FINANCIAL SERVICES | Slide | 11 | |
| CREDIT SUISSE FIRST BOSTON | Slide | 19 | |
| ADDITIONAL INFORMATION | Slide | 26 | |
| DISCLAIMER | Slide | 45 |
| Slide 4 |
OPERATING INCOME
| in CHF bn | ||||||||||
| 7.6 | 5.7 | 6.4 | 7.0 | 7.5 | ||||||
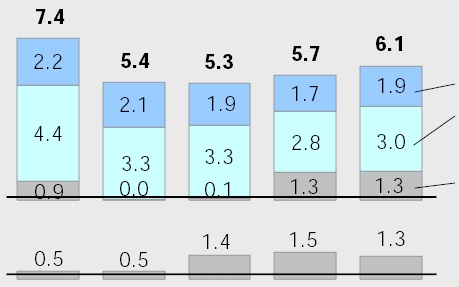 | ||||||||||
| Q2 | Q3 | Q4 | Q1 | Q2 | ||||||
| 2002 | 2003 | |||||||||
| r vs | r vs 6M/02 | ||||||
| Q1/03 | Q2/02 | ||||||
| Total | 7% | (1% | ) | (9% | ) | ||
| Banking* | 7% | (17% | ) | (20% | ) | ||
| Interest income | 13% | (14% | ) | (13% | ) | ||
| Fee and commission | |||||||
| income | 5% | (32% | ) | (34% | ) | ||
| Trading income | 4% | 49% | 24% | ||||
| Insurance* | (13% | ) | 180% | 98% | |||
| * excluding "Other ordinary income/(expenses), net" |
| Slide 5 |
OPERATING EXPENSES AND DEPRECIATION
| in CHF bn | r vs | rvs | ||||||||||||
| Q1/03 | Q2/02 | 6M/02 | ||||||||||||
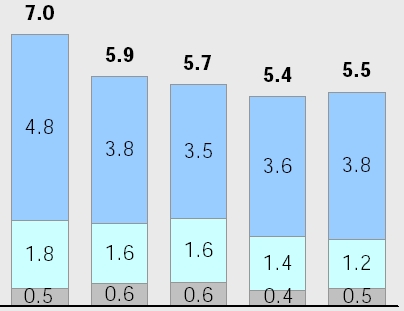 | ||||||||||||||
| Total | 2% | (21%) | (22%) | |||||||||||
| Personnel expenses | 5% | (21%) | (23%) | |||||||||||
| Other operating expenses | (10%) | (29%) | (23%) | |||||||||||
| Depreciation | 13% | 2% | (5%) | |||||||||||
| Q2 | Q3 | Q4 | Q1 | Q2 | ||||||||||
| 2002 | 2003 | |||||||||||||
| Slide 6 |
PROVISIONS
| in CHF m Valuation adjustments, provisions and losses | ||
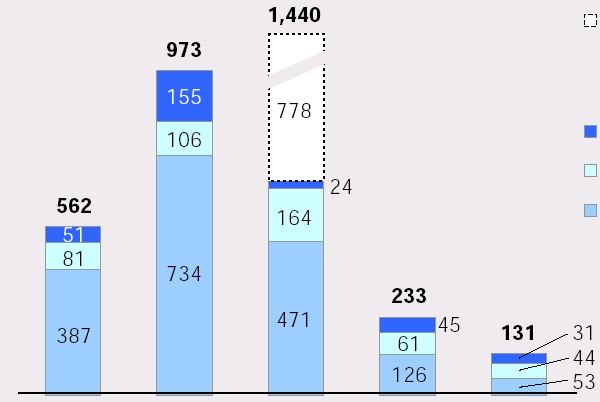 | Adjustment in the
Credit-related at CSFS Credit-related at CSFB | |
| Q2 | Q3 | Q4 | Q1 | Q2 | ||
| 2002 | 2003 | |||||
Note: Totals include Corporate Center and adjustments but exclude exceptional provisions of CHF 984 m in Q4/02
| Slide 7 |
IMPAIRED LOANS
| in CHF bn | Total impaired loans |
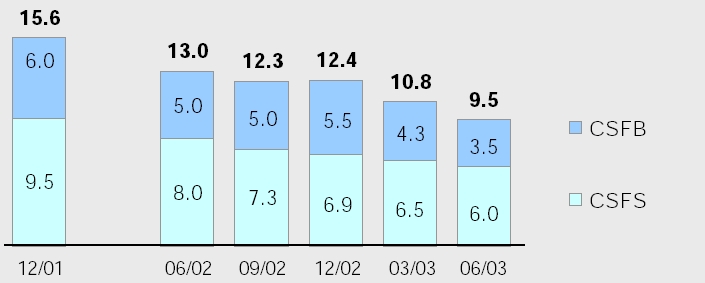 | |
| 6.0 | 5.1 | 4.6 | 4.9 | 4.1 | 3.3 | Impaired loans as % of due | ||
| from banks and customers(1) | ||||||||
| 59.5 | 60.2 | 60.0 | 62.3 | 63.8 | 67.1 | Valuation allowance as % of | ||
| impaired loans | ||||||||
| (1) due from banks and customers and mortgages (excluding securities lending and reverse repurchase agreements) | |
| Slide 8 |
CALCULATION OF CONSOLIDATED
BIS(1) CAPITAL RATIOS
| New decree on methodology for calculation of Credit Suisse Group's consolidated capital ratios expected to be released by EBK(2) in the second half of 2003 | |||
| Capital charge for the Winterthur Group investment will no longer be reflected as an addition to risk-weighted assets but as a deduction from regulatory capital | |||
| 50% of Winterthur Group's adjusted net asset value to be deducted from tier 1 capital and remaining 50% from total capital | |||
| Tier 1 capital deductions also include 100% of goodwill, own shares and minority interests of Winterthur Group | |||
| New methodology to reflect a bancassurance group perspective | |||
| (1) | BIS = Bank for International Settlement |
| (2) | EBK = Eidgenössische Bankenkommission (Swiss Federal Banking Commission) |
| Slide 9 |
BIS CAPITAL RATIOS
AS OF JUNE 30, 2003
| in CHF m | Credit Suisse | (1) | Credit Suisse First Boston | (1) | Consolidated (current methodology) | Consolidated (new methodology) | ||||
| Book equity | 7,210 | 19,830 | 33,428 | 33,428 | ||||||
| Deduction of goodwill | (262 | ) | (7,986 | ) | (9,847 | ) | (9,847 | ) | ||
| Deduction of 50% of Winterthur's adjusted net asset value | – | – | – | (2,297 | ) | |||||
| Other tier 1 adjustments | (525 | ) | (575 | ) | (797 | ) | (797 | ) | ||
| Tier 1 capital | 6,423 | 11,269 | 22,784 | 20,487 | ||||||
| Acquired intangible assets | 66 | 1,821 | (2) | 1,884 | (2) | 1,884 | (2) | |||
| Hybrid capital | – | 1,041 | 2,167 | 2,167 | ||||||
| Risk-weighted assets | 85,443 | 102,829 | 204,820 | 199,108 | ||||||
| Tier 1 capital ratio | 7.5% | 11.0% | 11.1% | 10.3% | ||||||
| excl. acquired intangible assets | 7.4% | 9.4% | 10.3% | 9.5% | ||||||
| (1) | consolidated banking entities Credit Suisse and Credit Suisse First Boston |
| (2) | net of tax liability |
| Slide 10 |
| PRESENTATION | |||
| RESULTS OVERVIEW | 1 | ||
| CONSOLIDATED RESULTS | 4 | ||
| CREDIT SUISSE FINANCIAL SERVICES | |||
| CREDIT SUISSE FIRST BOSTON | 19 | ||
| ADDITIONAL INFORMATION | 26 | ||
| DISCLAIMER | 45 | ||
| Slide 11 |
| CREDIT SUISSE FINANCIAL SERVICES | |
| OVERVIEW | (1/2) |
| Results |  | Second quarter net profit of CHF 829 m, up 21% or CHF 145 m vs first quarter of 2003 | ||
 | First half 2003 net profit of CHF 1.5 bn, up CHF 1.2 bn vs first half of 2002 | |||
| All segments with improved results vs previous quarter | |||
| ROE of 26.0% in second quarter and 24.0% in first half of 2003 | |||
Highlights banking segments | | Operating income up 8% vs Q1/03 on higher business volumes | ||
| Substantial increase in AuM of CHF 40 bn or 8% to CHF 561 bn vs Q1/03; net new assets of CHF 4.3 bn in Q2/03 | |||
| Cost base practically unchanged vs Q1/03 and down CHF 237 m or 9% vs first half of 2002 | |||
| Further efficiency gains led to an improvement of 3.9 ppts in the operating cost/income ratio to 60.8% (vs Q1/03) | |||
| Slide 12 |
| CREDIT SUISSE FINANCIAL SERVICES | |
| OVERVIEW | (2/2) |
| Highlights insurance segments | | Further efficiency gains (Insurance combined ratio and Life & Pensions expense ratio down vs first half of 2002) | |
| Administration costs further reduced, down 12% vs first quarter of 2003 | ||
| Introduction of a new employee benefit model in Switzerland | ||
| Announced divestitures of Winterthur Italy, Churchill (UK) and Republic (US) |
| Slide 13 |
PRIVATE BANKING
| Segment result |
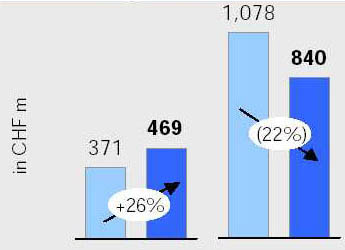 |
| Gross margin (bp) | 114 | 120 | 123 | 117 | ||||
| C/I-ratio (%) | 63.2 | 58.6 | 56.7 | 60.8 | ||||
| Net new assets (CHF bn) | 1.5 | 3.8 | 14.8 | 5.3 | ||||
| Q1 | Q2 | 2002 | 2003 | |||||
| 2003 | 6 months | |||||||
| Key profit & loss items | |||||||
| in CHF m | Q2/03 | Q1/03 | 6M/03 | 6M/02 | |||
| Operating income | 1,429 | 9% | 2,739 | (15%) | |||
| Operating expenses | 793 | 3% | 1,564 | (9%) | |||
| Operating income up 9% and gross margin up 6 bp (to 120 bp) vs Q1/03 |
| Cost/income ratio of 58.6% in Q2/03 improved for the third quarter in a row |
| Improvement in net new asset generation by CHF 2.3 bn vs Q1/03 and AuM up CHF 37 bn to CHF 494 bn |
| Asian and European Private Banking achieved above-average growth in net new assets |
| Slide 14 |
CORPORATE & RETAIL BANKING
| Segment result |
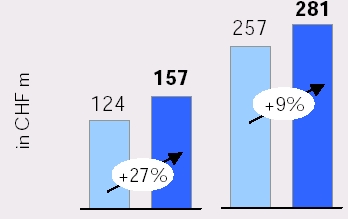 |
| Net interest | ||||||||
| margin (bp) | 214 | 221 | 227 | 217 | ||||
| Cost/Income | ||||||||
| ratio (%) | 67.4 | 64.8 | 68.5 | 66.1 | ||||
| ROE (%) | 10.7 | 13.3 | 10.0 | 11.9 | ||||
| Q1 | Q2 | 2002 | 2003 | |||||
| 2003 | 6 months | |||||||
| Key profit & loss items | ||||||||
| in CHF m | Q2/03 | Q1/03 | 6M/03 | 6M/02 | ||||
| Operating income | 784 | 7% | 1,518 | (4% | ) | |||
| Operating expenses | 484 | 2% | 957 | (8% | ) | |||
| Provisions (1) | 71 | (8% | ) | 148 | (8% | ) | ||
| Operating income up 7% vs previous quarter | |
| Net interest margin up 7 bp to 221 bp vs Q1/03 | |
| Cost/income ratio down 2.6 ppts vs Q1/03 to 64.8% – lowest ratio in the last five quarters | |
| Further improved credit portfolio (effective credit risks & impaired loans) |
(1) valuation adjustments, provisions and losses (provisions based on expected credit losses derived from statistical model)
| Slide 15 |
LIFE & PENSIONS
| Segment result | ||||||||
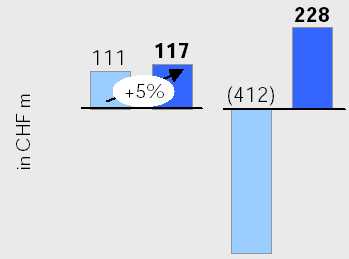 | ||||||||
| Expense | ||||||||
| ratio (%) | 6.8 | 11.5 | 9.0 | 8.4 | ||||
| Return on invested assets (%) | 4.9 | 5.1 | 1.7 | 5.0 | ||||
| Q1 | Q2 | 2002 | 2003 | |||||
| 2003 | 6 months | |||||||
| (1) | death and other benefits incurred & change in provision for future policyholder benefits |
| (2) | excluding separate account business |
| Key profit & loss items | ||||
| in CHF m | 6M/03 | 6M/02 | ||
| Gross premiums written | 9,965 | (3% | ) | |
| Benefits & claims(1) | (10,939 | ) | (1% | ) |
| Policy acquisition costs | (240 | ) | 21% | |
| Administration costs | (599 | ) | (17% | ) |
| Investment income(2) | 2,517 | 216% | ||
| Premiums down 3% vs 6M/02 due to selective underwriting | |
| Administration costs down 17% vs 6M/02 | |
| Expense ratio of 8.4% for 6M/03, down 0.6 ppts vs 6M/02 | |
| Investment return of 5.0% in 6M/03 (current income of 4.0% & realized gains/losses of 1.0%) |
| Slide 16 |
INSURANCE
| Segment result | ||||||||
 | ||||||||
| Combined | ||||||||
| ratio (%) | 100.7 | 100.5 | 103.8 | 100.6 | ||||
| Return on invested assets (%) | 3.5 | 4.0 | (1.3 | ) | 3.7 | |||
| Q1 | Q2 | 2002 | 2003 | |||||
| 2003 | 6 months | |||||||
| Key profit & loss items | ||||
| in CHF m | 6M/03 | 6M/02 | ||
| Net premiums earned | 8,064 | 4% | ||
| Claims & annuities | (5,771 | ) | 0% | |
| Policy acquisition costs | (1,436 | ) | 15% | |
| Administration costs | (905 | ) | (8% | ) |
| Investment income | 604 | – | ||
| Premiums up 4% vs 6M/02 due to increased tariffs | |
| Underwriting result improved by CHF 75 m vs 6M/02 (combined ratio reduced to 100.6%) | |
| Claims ratio down 3.3 ppts vs 6M/02 (pricing, portfolio streamlining and few natural catastrophes) | |
| Administration costs down 8% vs 6M/02 | |
| Investment return of 3.7% in 6M/03 (current income of 4.0% & realized gains/losses of -0.3%) |
| Slide 17 |
CREDIT SUISSE FINANCIAL SERVICES
OUTLOOK
| Outlook for 2003 | |||||
| Given current business environment, CSFS expects continued | ||||
| sound profitability in 2003 supported by: | |||||
| Overall: | progress in implementation of efficiency measures | |||
| Banking: | continued strong operating income expected in the | |||
| banking industry, albeit a seasonally lower result | |||||
| in Private Banking in the third quarter | |||||
| Winterthur: | improved technical results | |||
| Life & Pensions remains exposed to volatility of the capital markets | ||||
| Slide 18 |
| PRESENTATION | |||
| RESULTS OVERVIEW | Slide | 1 |
| CONSOLIDATED RESULTS | Slide | 4 |
| CREDIT SUISSE FINANCIAL SERVICES | Slide | 11 |
| CREDIT SUISSE FIRST BOSTON | ||
| ADDITIONAL INFORMATION | Slide | 26 |
| DISCLAIMER | Slide | 45 |
| Slide 19 |
CREDIT SUISSE FIRST BOSTON
OVERVIEW
| Results Q2/03 | | Net operating profit(1)of USD 426 m, up from USD 292 m in | ||
| Q1/03 (net profit of USD 296 m vs USD 161 m in Q1/03) | ||||
| Operating income up 9% vs Q1/03, driven by continued | |||
| strength in Fixed Income and improvements in Equity and | ||||
| Investment Banking | ||||
| Comparable to Q2/02 excluding Pershing | |||
| Substantial reduction in credit provisions | |||
| Highlights | | Significant improvement in financial benchmarks – operating | ||
| ROE(2)of 18.5%; operating pre-tax margin(2)of 18.3% | ||||
| Acquired Volaris Advisors, a firm specializing in equity options | |||
| strategies, to enhance Private Client Services platform | ||||
| (1) | excludes amortization of acquired intangible assets and goodwill |
| (2) | excludes acquisition related costs |
| Slide 20 |
CREDIT SUISSE FIRST BOSTON
KEY FINANCIAL RESULTS
| in USD m | Q2/03 | Q1/03 | 6M/03 | 6M/02 | |||||
| Operating income | 3,187 | 2,920 | 6,107 | 6,770 | |||||
| pro forma excluding Pershing | 3,187 | 2,905 | 6,092 | 6,330 | |||||
| Operating expenses | 2,328 | 2,169 | 4,497 | 5,238 | |||||
| pro forma excluding Pershing | 2,328 | 2,169 | 4,497 | 4,904 | |||||
| Provisions (1) | 49 | 128 | 177 | 462 | |||||
| Net operating profit (2) | 426 | 292 | 718 | 384 | |||||
| pro forma excluding Pershing | 426 | 277 | 703 | 329 | |||||
| Operating ROE (2) | 18.5% | 12.4% | 15.3% | 8.5% | |||||
| Operating pre-tax margin (2) | 18.3% | 13.2% | 15.8% | 6.4% | |||||
| Personnel expenses/operating income (2) | 51.7% | 51.7% | 51.7% | 55.1% | |||||
| Number of employees (3) | 18,716 | 19,218 | – | – |
| (1) | valuation adjustments, provisions and losses |
| (2) | excludes acquisition related costs |
| (3) | full-time equivalents; Q1/03 excludes Pershing headcount of 3,913 |
| Slide 21 |
INSTITUTIONAL SECURITIES
OVERVIEW
| Segment result | |
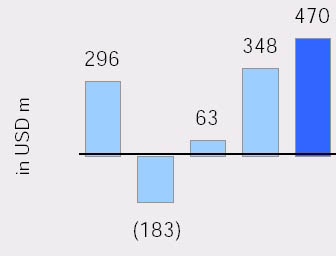 |
| Value-at-Risk (1-day, 99%) in USD m | ||||||||||||
| Average | 46.4 | 43.7 | 39.4 | 49.2 | 64.3 | |||||||
| Pre-tax (1) | 13.0 | (15.4 | ) | (5.9 | ) | 18.4 | 22.7 | |||||
| Margin(%) | ||||||||||||
| Q2 | Q3 | Q4 | Q1 | Q2 | ||||||||
| 2002 | 2003 | |||||||||||
| (1) | excluding acquisition-related costs | |||||||||||
| (2) | valuation adjustments, provisions and losses | |||||||||||
| Key Profit & Loss Items | |||||||||
| in USD m | Q2/03 | Q1/03 | 6M/03 | 6M/02 | |||||
| Operating income | 2,888 | 10% | 5,504 | (3% | ) | ||||
| Personnel expenses | 1,492 | 10% | 2,853 | (11% | ) | ||||
| Other operating exp. | 591 | 3% | 1,165 | (2% | ) | ||||
| Provisions(2) | 56 | (50% | ) | 168 | (63% | ) | |||
| Continued strong results for Fixed Income | ||
| Improved Equity & Banking compared with Q1/03 | ||
| Personnel expenses reflect increase in incentive compensation accruals due to rise in performance | ||
| Provisions reflect an improved credit environment | ||
| Increased risk portfolio driven by interest rate exposure, better risk/reward opportunities versus unusually low year-end levels |
| Slide 22 |
INSTITUTIONAL SECURITIES
OPERATING INCOME
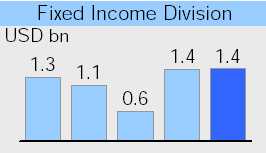 | Strong results across all business lines, up 1% vs Q1/03 | ||||
| Emerging markets and leveraged and bank finance favorably impacted by tighter credit spreads and demand for higher yielding fixed income products | |||||
| Credit products performed well on the strength of the collateralized mortgage business | |||||
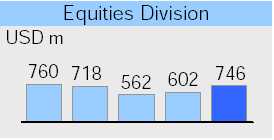 | 24% increase compared with Q1/03 | ||||
| Derivative results increased, particularly convertibles | |||||
| Improvement in cash trading versus Q1/03, particularly in US and Asia, although activity levels remain very low | |||||
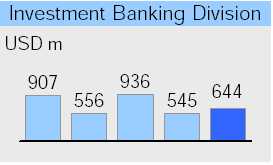 | Up 18% vs Q1/03 – primarily attributable to higher equity and high yield new issuance activity, with improved industry volume – up 145% and 96%, respectively | ||||
| CSFB ranked number one in high yield new issuance | |||||
| Private equity revenue substantially below Q2/02, which included a USD 114 m gain on Swiss Re investment |
| Q2 | Q3 | Q4 | Q1 | Q2 | ||||||
| 2002 | 2003 | |||||||||
| Slide 23 |
CSFB FINANCIAL SERVICES
OVERVIEW
| Segment result |
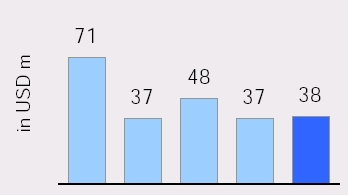 |
| Net new assets (USD bn) | |||||||||||
| CSAM | (4.1 | ) | (7.9 | ) | (5.8 | ) | (3.8 | ) | (1.3 | ) | |
| PCS | 1.4 | 0.1 | 1.8 | 1.1 | (1.3 | ) | |||||
| Total | 2.7 | (7.8 | ) | (4.0 | ) | (2.7 | ) | (2.6 | ) | ||
| AuM | 363 | 336 | 350 | 342 | 364 | ||||||
| (USD bn) | |||||||||||
| Pre-tax (1) | 17.9 | 9.6 | 13.9 | 15.1 | 17.4 | ||||||
| margin (%) | |||||||||||
| Q2 | Q3 | Q4 | Q1 | Q2 | |||||||
| 2002 | 2003 | ||||||||||
| Key profit & loss items | |||||||||
 vs vs | vs | ||||||||
| in USD m | Q2/03 | Q1/03 | 6M/03 | 6M/02 | |||||
| Operating income | 299 | (2% | ) | 603 | (45%) | ||||
| pro forma excl. Pershing | 299 | 3% | 588 | (9%) | |||||
| Operating expenses | 245 | 5% | 479 | (43%) | |||||
| pro forma excl. Pershing | 245 | 5% | 479 | (5%) | |||||
| CSAM Q2/03 operating income up vs Q1/03, comparable to Q2/02 | ||
| PCS operating income flat in Q1/03 and down 27% vs Q2/02 due to lower transaction level and margin balances | ||
| CSAM asset outflows much reduced | ||
| Pre-tax margin returned to Q2/02 level | ||
| (1) | excluding certain acquisition-related costs |
| Slide 24 |
CREDIT SUISSE FIRST BOSTON
OUTLOOK
| Second quarter results indicate Credit Suisse First Boston is headed in the right direction and is continuing to gain momentum | ||||
| Outlook | ||||
| for 2003 | ||||
| The business environment, however, remains challenging, with many of our markets operating at historically low levels | ||||
| Slide 25 |
| PRESENTATION | |||
| RESULTS OVERVIEW | Slide | 1 | |
| CONSOLIDATED RESULTS | Slide | 4 | |
| CREDIT SUISSE FINANCIAL SERVICES | Slide | 11 | |
| CREDIT SUISSE FIRST BOSTON | Slide | 19 | |
| ADDITIONAL INFORMATION | |||
| DISCLAIMER | Slide | 45 | |
| Slide 26 |
ADDITIONAL INFORMATION
INDEX
| Slide 27 |
ACCOUNTING FOR STOCK-BASED COMPENSATION
| Future stock option awards – Group-wide | Future stock awards | ||||||||
| CSFB | CSFS & Group Corporate Center | ||||||||
| Vesting | | 1/3rd per year over the three years following grant | | 1/3rd per year over the three years following grant | | Immediately upon grant | |||
| Blocking | | No further blocking | | Blocked for four years following grant | | Blocked for four years following grant | |||
| P&L recognition | | Fair value to be expensed over vesting period | | Fair value to be expensed over vesting period | | Expensed at grant as current compensation cost | |||
| P&L impact | | Phasing-in over three years of cost not previously recognized | | Lower expense in 2003 as deferred portion is recognized over next three years | | No change | |||
| Slide 28 |
CALCULATION OF CONSOLIDATED BIS CAPITAL
ACCORDING TO NEW METHODOLOGY
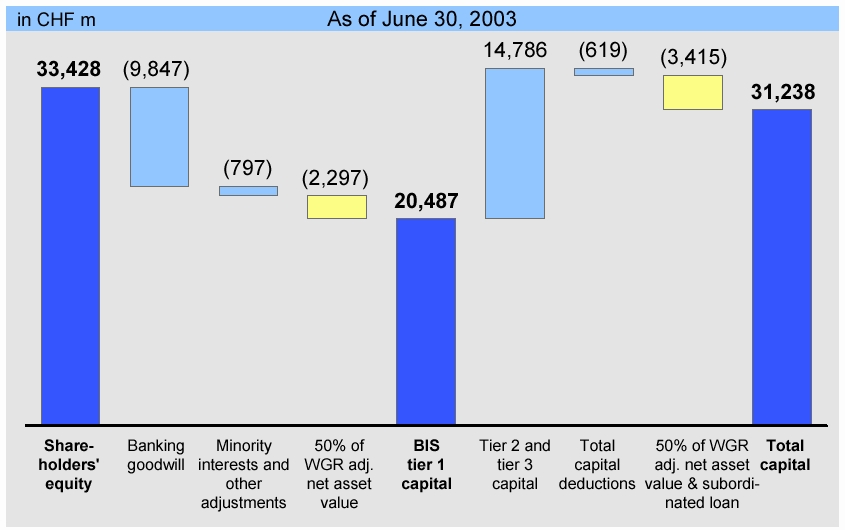
| Slide 29 |
| CALCULATION OF WINTERHUR'S | |
| ADJUSTED NET ASSET VALUE | |
| In this context, Winterthur Group's adjusted net asset value is to be understood as its contribution to consolidated tier 1 capital | |
| in CHF m | 30.06.03 | 31.12.02 | ||
| Winterthur shareholders' equity | 6,338 | 5,587 | ||
| - Minority interests | (669 | ) | (599 | ) |
| - Goodwill | (1,050 | ) | (1,082 | ) |
| - Own shares | (26 | ) | (44 | ) |
| Winterthur adjusted net asset value | (4,593 | ) | (3,863 | ) |
| Slide 30 | ||||
| PRIVATE BANKING |
| DEVELOPMENT OF GROSS MARGIN |
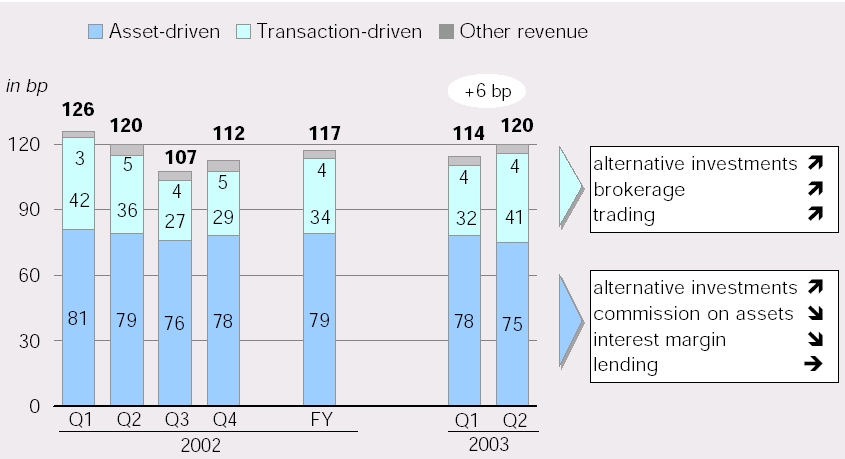
| Slide 31 |
| PRIVATE BANKING |
| AUM BY PRODUCT & CURRENCY |
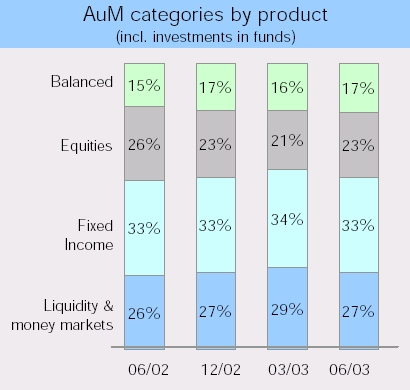 | 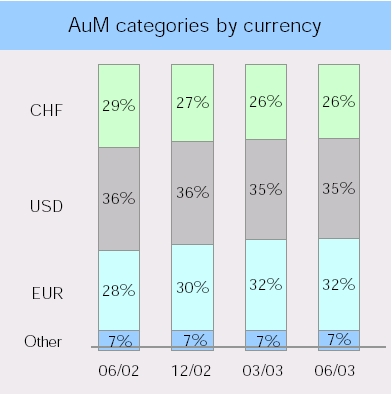 |
| Slide 32 |
| WINTERTHUR GROUP INVESTMENT RESULT(1) | (1/2) |
| 2002(1) | 2003(1) | |||||||||||
| Q1 | Q2 | Q3 | Q4 | Q1 | Q2 | |||||||
| Current income | 1,236 | 1,435 | 1,203 | 1,222 | 1,255 | 1,394 | ||||||
| Realized gains | 1,346 | 1,389 | 2,353 | 333 | 1,327 | 821 | ||||||
| Realized losses | (647 | ) | (2,129 | ) | (1,589 | ) | (373 | ) | (633 | ) | (411 | ) |
| Impairments | (942 | ) | (857 | ) | (1,413 | ) | (675 | ) | (328 | ) | (52 | ) |
| Other | (114 | ) | (100 | ) | (135 | ) | (115 | ) | (111 | ) | (141 | ) |
| Investment income (P&L) | 879 | (262 | ) | 419 | 392 | 1,510 | 1,611 | |||||
| (1) general account only | |
| Note: | Q1 to Q3 2002 reclassified to the current presentation format, including real estate for own use, interest paid from current income and realized gains/losses |
| Slide 33 |
| WINTERTHUR GROUP INVESTMENT RESULT | (2/2) |
| Development of gross unrealized losses in equity portfolio |
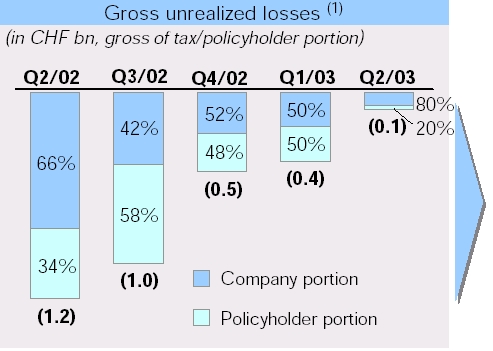 |
| Potential impact of gross unrealized losses on NOP: | |||||||||
| (in CHF m) | |||||||||
| (750 | ) | (400 | ) | (250 | ) | (200 | ) | (75 | ) |
| Given flat markets, unrealized losses are recognized in the P&L after 6 months as an impairment | ||
| NOP impact highly country-specific depending on whether the investment risk is borne by the company or the policyholder | ||
| Further reduction in unrealized losses on equities | ||
| Taking only the NOP-relevant portion into account, unrealized losses decreased to CHF 75 m | ||
| (1) general account only |
| Slide 34 |
WINTERTHUR GROUP
INVESTMENT PORTFOLIO – ASSET ALLOCATION
| Responsive to equity market developments | ||
| - | Increase in equity securities from CHF 6.6 bn (5.0%) to CHF 7.0 bn (5.3%) in Q2/03 | |
| - | "Investment view" equity exposure stands at CHF 6.2 bn (4.7%)(1) | |
| Winterthur investment portfolio(2) |
 | Total (in CHF billion) | |
| Short-term investments & others | ||
| Real estate (fair value) | ||
| Mortgages | ||
| Equity securities | ||
| Debt securities & loans | ||
| (1) investment view excludes CHF 0.8 bn of participations in bond funds and special funds classified as equities under accounting rules | |
| (2) all investments incl. real estate at market value; excluding separate account (i.e. unit-linked) business | |
| (3) reduced by CHF 4.5 bn vs reported figures due to trade accounting on purchased bonds and maturing money market transactions (settlement date) | |
| Slide 35 |
| WINTERTHUR GROUP | |
| EQUITY BASE DEVELOPMENT IN 2003 | |
| Significant increase of CHF 751 million in shareholder's equity in 6M/03 | |
| Winterthur shareholders' equity (CHF m) | |
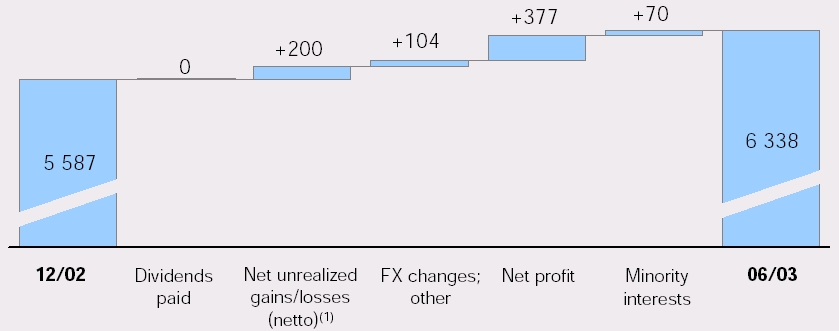 | |
| (1) net of tax and policyholder participation | |
| Slide 36 |
| WINTERTHUR INSURANCE | ||
| SPLIT BY LINE OF BUSINESS & COMBINED RATIOS | ||
| Net premiums earned 6M/03: | Combined ratio | |
| CHF 8.1bn | 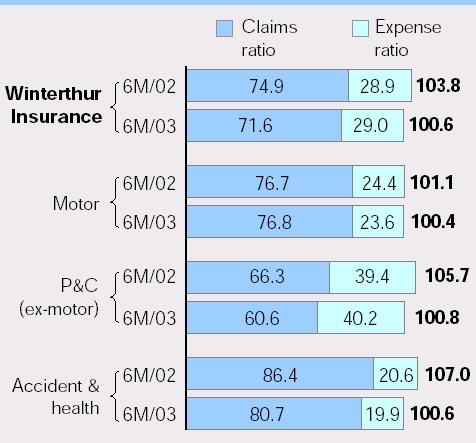 | |
| Change vs 6M/02: | ||
| +4% (+10.2% organic(1)) | ||
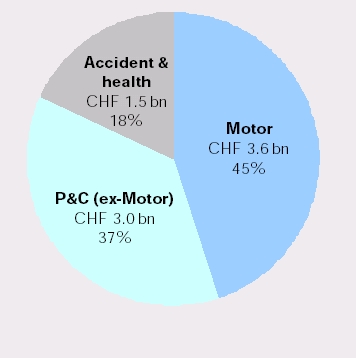 | ||
| (1) in local currencies | ||
| Slide 37 | ||
| LIFE & PENSIONS | |
| TECHNICAL RESERVES AS OF JUNE 30, 2003 | |
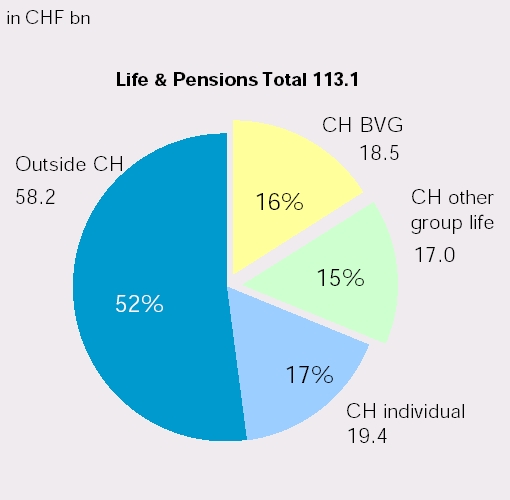 | |||||
| CH BVG | |||||
| Savings capital in collective foundations and independent pensions funds, thereof in 2004 | |||||
| 35% renewable and subject to 2.0% guaranteed interest rate in 2004 (“Winterthur model”) | |||||
| 65% not renewable for 2004 and subject to the BVG rate in 2004(1) | |||||
| CH other group life | |||||
| Reserves for business not directly related to the BVG rate | |||||
| (1) to be decided by the Swiss Federal Council in the second half of 2003, potential reduction to 2.0% indicated in second quarter 2003 | ||
| Slide 38 | ||
| THE WINTERTHUR MODEL KEY ELEMENTS | (1/2) |
| Separation of the insurance and pensions relationship as of January 1, 2004 |
| Slide 39 |
| THE WINTERTHUR MODEL DETAILS 2004 | (2/2) |
| Offer for 2004 | |||||
 | Interest: | ||||
| • | Mandatory benefits | BVG/LPP guaranteed rate + bonus | Goal: interest rate guaranteed by Winterthur | ||
| (2% insured with WL) | Life together with any bonuses should reach at | ||||
| least the BVG/LPP minimum interest rate – | |||||
| • | Extra-mandatory benefits | 2% + bonus | temporary cover shortfall possible | ||
| Conversion rate: | |||||
| • | Mandatory benefits | BVG/LPP guaranteed rate + bonus | |||
| • | Extra-mandatory benefits | Men: 5.835% | Extra-mandatory benefits: adjustment to current | ||
| Women: 5.454% | life expectancy figures | ||||
 | Interest: | ||||
| • | Mandatory benefits | 2% + bonus | Guaranteed interest rate is based on returns | ||
| from risk-free investments | |||||
| • | Extra-mandatory benefits | 2% + bonus | |||
| Conversion rate: | |||||
| • | Mandatory benefits | BVG/LPP guaranteed rate | |||
| • | Extra-mandatory benefits | Men: 5.835% | Extra-mandatory benefits: adjustment to | ||
| Women: 5.454% | current life expectancy figures 1) | ||||
| 1) Compensation by means of single premium possible | |||||
| Slide 40 |
CREDIT SUISSE FIRST BOSTON
OPERATING INCOME DETAIL 2002 AND 2003
| Investment Banking Division(1) | |||||||||||||
| 2002 | 2003 | ||||||||||||
| in USD m | Q1 | Q2 | Q3 | Q4 | Q1 | Q2 | |||||||
| Private equity | 133 | 186 | 141 | 397 | 77 | 111 | |||||||
| Debt capital markets | 100 | 94 | 28 | 64 | 85 | 95 | |||||||
| Equity capital markets | 117 | 153 | 74 | 92 | 29 | 119 | |||||||
| Advisory | 344 | 444 | 280 | 357 | 296 | 283 | |||||||
| Other | 47 | 30 | 33 | 26 | 58 | 36 | |||||||
| Total | 741 | 907 | 556 | 936 | 545 | 644 | |||||||
| (1) | previous quarters have been restated to reflect the movement of the results of certain non-continuing private equity assets from the Investment Banking Division to the "Other Division" |
| Note: IBD results reflect the impact of various divisional sharing arrangements of operating income amongst the divisions | |
| Slide 41 |
CREDIT SUISSE FIRST BOSTON
| "LEGACY" ASSETS | (1/2) | ||||||||||
| in USD m | "Legacy" Assets Net Exposure | ||||||||||
 | 8,964 | Real estate | |||||||||
| 12/1999 | 11,925 | 1,975 | Distressed | ||||||||
| 986 | Private equity (1,228 unfunded commitment) | ||||||||||
| 4,805 | Real estate | |||||||||
| 8,026 | 1,498 | Distressed | |||||||||
| 12/2000 | 1,724 | Private equity (984 unfunded commitment) | |||||||||
| 2,925 | Real estate | |||||||||
| 5,357 | 1,107 | Distressed | |||||||||
| 12/2001 | 1,325 | Private equity (857 unfunded commitment) | |||||||||
| 1,535 | Real estate | |||||||||
| 3,031 | 512 | Distressed | |||||||||
| 12/2002 | 984 | Private equity (785 unfunded commitment) | |||||||||
| 1,185 | Real estate | |||||||||
| Note: | |||||||||||
| 03/2003 | 2,727 | 508 | Distressed | – | Unfunded commitments | ||||||
| excluded for private equity | |||||||||||
| 1,034 | Private equity (911 unfunded commitment) | ||||||||||
| – | Unfunded commitments | ||||||||||
 | 1,052 | Real estate | included for real estate | ||||||||
| 06/2003 | 2,498 | 539 | Distressed | – | Private equity unfunded | ||||||
| commitments include | |||||||||||
| 907 | Private equity (863 unfunded commitment) | employee commitments | |||||||||
| Slide 42 |
CREDIT SUISSE FIRST BOSTON
| "LEGACY" ASSETS | (2/2) | ||||||||
| Charges related to "legacy" assets in CSFB's income statement | |||||||||
| in USD m | Real estate | Distressed portfolio | Private equity | Total | |||||
| 6M/03 | |||||||||
| Operating income | 6 | (29 | ) | (28 | ) | (51 | ) | ||
| Provisions | – | – | – | – | |||||
| Taxes | (2 | ) | 8 | 8 | 14 | ||||
| Net operating profit/(loss) | 4 | (21 | ) | (20 | ) | (37 | ) | ||
| 6M/02 | |||||||||
| Operating income | (43 | ) | (167 | ) | (83 | ) | (293 | ) | |
| Provisions | (113 | ) | – | – | (113 | ) | |||
| Taxes | 44 | 47 | 23 | 114 | |||||
| Net operating profit/(loss) | (112 | ) | (120 | ) | (60 | ) | (292 | ) | |
| Slide 43 |
CREDIT SUISSE FIRST BOSTON
C OUNTERPARTY EXPOSURE BY INDUSTRY
| Selected CSFB exposures (as of June 30, 2003) | |||||||||
| in USD m | Current exposure | Undrawn commitments | Reserves | Net exposure | |||||
| Telecommunications | 1,518 | 1,549 | (293 | ) | 2,774 | ||||
| Telecommunications | |||||||||
| manufacturers | 34 | 200 | (14 | ) | 220 | ||||
| Merchant energy | 1,074 | 113 | (224 | ) | 963 | ||||
| Airlines | 695 | 53 | (172 | ) | 576 | ||||
| Note: | |
| Current exposure equals committed amount (includes only drawn commitments) for lending plus mark-to-market for counterparty trading less credit protection. |
| Slide 44 |
DISCLAIMER
Cautionary Statement regarding forward-looking information Forward-looking statements involve inherent risks and uncertainties, and we might not be able to achieve the predictions, forecasts, projections and other outcomes we describe or imply in forward-looking statements. A number of important factors could cause results to differ materially from the plans, objectives, expectations, estimates and intentions we express in these forward-looking statements, including those we identify in "Risk Factors" in our Annual Report on Form 20-F for the fiscal year ended December 31, 2002 filed with the US Securities and Exchange Commission, and in other public filings and press releases. We do not intend to update these forward-looking statements except as may be required by applicable laws. Quarterly Report 2003/Q2 — Non-GAAP Financial Information | ||
| Slide 45 |
| Compensation Philosophy and Option Reduction Program |
| Zurich August 5, 2003 |
COMPENSATION PHILOSOPHY
OVERVIEW
| Successful change in compensation culture over past two years | |
| Compensation plans are designed to: | |
 | Align employee and shareholder interests | |
| Attract and retain key people | |
| Reward employees for performance and offer future-oriented incentives | |
| Ensure that compensation structure is in line with industry benchmarks | |
| Stock option awards will continue to be part of compensation plans, but at a lower level | |
| The Group will implement the following changes: | |
| Reduce future annual issuance of option awards in favor of stock | |
| Introduce three-year vesting on future option awards and, at CSFB only, on stock awards | |
| Expense the fair value of future option awards over the respective vesting period | |
| Launch an option reduction program | |
| Slide 1 |
| COMPENSATION PHILOSOPHY |
| OPTION REDUCTION PROGRAM |
| Purpose of option reduction program: | ||
| Reduce the number of options outstanding | ||
| Exchange previously awarded option grants for equity-based awards that provide a more effective means of rewarding and retaining our best people | ||
| Offer to exchange existing options on a value-for-value basis under applicable accounting rules | ||
| Open to all current employees to exchange old options(1) with an exercise price | ||
| equal to or greater than CHF 60 for either new options, restricted or phantom shares or a 50/50 combination thereof | ||
| greater than CHF 30 and below CHF 60 for either restricted or phantom shares | ||
| New options to be granted with an exercise price of 10% above market price on the valuation date (which is currently September 5, 2003) | ||
| Provisional timing: commencement of tender offer on August 6, 2003, and closing on September 9, 2003 | ||
| No significant P&L impact expected in 2003 from the option reduction program | ||
| (1) | meaning eligible vested options originally granted on or after December 31, 1999 |
| Slide 2 |
| ACCOUNTING FOR |
| EQUITY-BASED COMPENSATION |
| Fair value of future stock option awards to be expensed over the respective 3-year vesting period as of the financial year 2003, with vesting starting in 2004 | ||
| Credit Suisse First Boston to adopt three-year vesting approach for stock awards in future compensation cycles, in line with industry practice | ||
| Future stock awards will result in deferred recognition of the related compensation costs over the vesting period | ||
| Implementation of this deferral is expected to result in a decrease of around 3% points in the compensation-to-revenue ratio at CSFB for the second half of 2003 | ||
| Credit Suisse Financial Services and Group Corporate Center to continue to vest stock awards at grant, with four-year blocking period | ||
| Slide 3 |
DISCLAIMER
Credit Suisse Group ("CSG") has not commenced the exchange offer to which this communication pertains. Holders of CSG options are strongly advised to read the Schedule TO, the Offer to Exchange and other documents related to the exchange offer to be filed with the Securities and Exchange Commission when they become available because they will contain important information. Holders of CSG options may obtain copies of these documents for free, when available, at the Securities and Exchange Commission website at www.sec.gov or from CSG's Human Resources department.
Cautionary Statement Regarding Forward-looking Information
This communication contains statements that constitute forward-looking statements. In addition, in the future we, and others on our behalf, may make statements that constitute forward-looking statements. Such forward-looking statements may include, without limitation, statements relating to our plans, objectives or goals; our future economic performance or prospects; the potential effect on our future performance of certain contingencies; and assumptions underlying any such statements. Words such as "believes," "anticipates," "expects," "intends" and "plans" and similar expressions are intended to identify forward-looking statements but are not the exclusive means of identifying such statements. By their very nature, forward-looking statements involve inherent risks and uncertainties, both general and specific, and risks exist that predictions, forecasts, projections and other outcomes described or implied in forward-looking statements will not be achieved. We caution you that a number of important factors could cause results to differ materially from the plans, objectives, expectations, estimates and intentions expressed in such forward-looking statements. These factors include (i) market and interest rate fluctuations; (ii) the strength of the global economy in general and the strength of the economies of the countries in which we conduct our operations in particular; (iii) the ability of counterparties to meet their obligations to us; (iv) the effects of, and changes in, fiscal, monetary, trade and tax policies, and currency fluctuations; (v) political and social developments, including war, civil unrest or terrorist activity; (vi) the possibility of foreign exchange controls, expropriation, nationalization or confiscation of assets in countries in which we conduct our operations; (vii) the ability to maintain sufficient liquidity and access capital markets; (viii) operational factors such as systems failure, human error, or the failure to p roperly implement procedures; (ix) actions taken by regulators with respect to our business and practices in one or more of the countries in which we conduct our operations; (x) the effects of changes in laws, regulations or accounting policies or practices; (xi) competition in geographic and business areas in which we conduct our operations; (xii) the ability to retain and recruit qualified personnel; (xiii) the ability to maintain our reputation and promote our brands; (xiv) the ability to increase market share and control expenses; (xv) technological changes; (xvi) the timely development and acceptance of our new products and services and the perceived overall value of these products and services by users; (xvii) acquisitions, including the ability to integrate successfully acquired businesses; (xviii) the adverse resolution of litigation and other contingencies; and (xix) our success at managing the risks involved in the foregoing. We caution you that the foregoing list of important factors is not exclus ive; when evaluating forward-looking statements, you should carefully consider the foregoing factors and other uncertainties and events, as well as the risks identified in our most recently filed Form 20-F and reports on Form 6-K furnished to the US Securities and Exchange Commission. CSG disclaims any intention or obligation to update or revise any forward-looking statements, whether as a result of new information, future events or otherwise except as may be required by applicable laws.
| Slide 4 |
Signatures
Pursuant to the requirements of the Securities Exchange Act of 1934, the registrant has duly caused this report to be signed on its behalf by the undersigned, thereunto duly authorized.
| CREDIT SUISSE GROUP | |
| (Registrant) | |
| Date August 5, 2003 | By: /s/ David Frick |
| (Signature)* | |
| Member of the Executive Board | |
| /s/ Karin Rhomberg Hug | |
| * Print the name and title of the signing officer under his signature. | Managing Director |