UNITED STATES
SECURITIES AND EXCHANGE COMMISSION
Washington, D.C. 20549
Form 6-K
REPORT OF FOREIGN PRIVATE ISSUER PURSUANT TO RULE 13a-16 OR 15d-16
UNDER THE SECURITIES EXCHANGE ACT OF 1934
For the month of February 15, 2007
Commission File Number 001-15244
CREDIT SUISSE GROUP
(Translation of registrant’s name into English)
Paradeplatz 8, P.O. Box 1, CH-8070 Zurich, Switzerland
(Address of principal executive office)
Indicate by check mark whether the registrant files or will file annual reports under cover of Form 20-F or Form 40-F.
Form 20-F | Form 40-F |


Indicate by check mark if the registrant is submitting the Form 6-K in paper as permitted by Regulation S-T Rule 101(b)(1):
Note: Regulation S-T Rule 101(b)(1) only permits the submission in paper of a Form 6-K if submitted solely to provide an attached annual report to security holders.
Indicate by check mark if the registrant is submitting the Form 6-K in paper as permitted by Regulation S-T Rule 101(b)(7):
Note: Regulation S-T Rule 101(b)(7) only permits the submission in paper of a Form 6-K if submitted to furnish a report or other document that the registrant foreign private issuer must furnish and make public under the laws of the jurisdiction in which the registrant is incorporated, domiciled or legally organized (the registrant’s “home country”), or under the rules of the home country exchange on which the registrant’s securities are traded, as long as the report or other document is not a press release, is not required to be and has not been distributed to the registrant’s security holders, and, if discussing a material event, has already been the subject of a Form 6-K submission or other Commission filing on EDGAR.
Indicate by check mark whether the registrant by furnishing the information contained in this Form is also thereby furnishing the information to the Commission pursuant to Rule 12g3-2(b) under the Securities Exchange Act of 1934.
Yes | No |


If “Yes” is marked, indicate below the file number assigned to the registrant in connection with Rule 12g3-2(b): 82-.
| CREDIT SUISSE GROUP | |
Paradeplatz 8 P.O. Box CH-8070 Zurich Switzerland | Telephone +41 844 33 88 44 Fax +41 44 333 88 77 media.relations@credit-suisse.com
| |

Media Release
Credit Suisse Group Reports Net Income of CHF 11.3 Billion for 2006
Credit Suisse Group today reported net income of CHF 11,327 million for the full year 2006, up 94% compared to net income of CHF 5,850 million for 2005. Net income for 2006 included a net capital gain of CHF 1,817 million from the sale of Winterthur, which was recorded in the fourth quarter.
Basic earnings per share from continuing operations were CHF 7.53 for the full year 2006, compared to CHF 3.98 for 2005. Basic earnings per share were CHF 10.30 for the full year 2006, compared to CHF 5.17 for 2005.
Fourth-quarter 2006 net income totaled CHF 4,673 million, compared to net income of CHF 1,103 million in the fourth quarter of 2005.
Credit Suisse recorded net new assets of CHF 95.4 billion for the full year 2006.
Financial highlights |
|
|
|
|
|
|
|
|
|
|
|
in CHF million |
| 12 mths |
| Change in % vs |
| 4Q2006 |
| Change in % |
| Change in % |
|
|
| 2006 |
| 12 mths 2005 |
|
|
| vs 3Q2006 |
| vs 4Q2005 |
|
Net revenues |
| 38,603 |
| 27 |
| 10,814 |
| 34 |
| 43 |
|
Total operating expenses |
| 24,414 |
| 5 |
| 6,520 |
| 15 |
| 0 |
|
Income from continuing operations |
| 8,281 |
| 83 |
| 2,599 |
| 77 |
| 284 |
|
Income from discontinued operations, |
|
|
|
|
|
|
|
|
|
|
|
net of tax |
| 3,070 |
| 134 |
| 2,074 |
| 389 |
| 387 |
|
Net income |
| 11,327 |
| 94 |
| 4,673 |
| 147 |
| 324 |
|
Return on equity |
| 27.5 | % | — |
| 44.1 | % | — |
| — |
|
Basic earnings per share from |
|
|
|
|
|
|
|
|
|
|
|
continuing operations (CHF) |
| 7.53 |
| — |
| 2.42 |
| — |
| — |
|
Basic earnings per share (CHF) |
| 10.30 |
| — |
| 4.35 |
| — |
| — |
|
BIS tier 1 ratio (as of December 31) |
| 13.9 | % | — |
| — |
| — |
| — |
|
Zurich, February 15, 2007 "2006 was a record year for Credit Suisse. Our integrated banking model proved successful and provided us with an effective platform to capture the growth opportunities arising from high levels of client activity, while at the same time significantly improving our profitability," stated Oswald J. Grübel, CEO of Credit Suisse.
He added: "In our first year as an integrated bank, we have made excellent progress in strengthening our operating efficiency but there is still great potential for further improvement as we continue to invest in the growth of our business."
He concluded: "Our clients have responded well to our integrated approach and Credit Suisse now has excellent opportunities for further growth in the context of globalization, which we believe will create dynamic markets for the foreseeable future."
| Media Release |
February 15, 2007 Page 2/8 |

Segment results |
|
|
|
|
|
|
|
|
|
| |
in CHF million |
| 12 mths |
| Change in % vs |
| 4Q2006 |
| Change in % |
| Change in % |
|
|
| 2006 |
| 12 mths 2005 |
|
|
| vs 3Q2006 |
| vs 4Q2005 |
|
Investment | Net revenues | 20,469 |
| 32 |
| 6,085 |
| 45 |
| 63 |
|
Banking | Total operating expenses | 14,556 |
| 4 |
| 3,723 |
| 8 |
| 8 |
|
| Income from continuing |
|
|
|
|
|
|
|
|
|
|
| operations before taxes | 5,951 |
| 272 |
| 2,342 |
| 209 |
| — |
|
Private | Net revenues | 11,678 |
| 11 |
| 2,973 |
| 11 |
| 9 |
|
Banking | Total operating expenses | 7,155 |
| 8 |
| 1,871 |
| 11 |
| 9 |
|
| Income from continuing |
|
|
|
|
|
|
|
|
|
|
| operations before taxes | 4,596 |
| 16 |
| 1,143 |
| 12 |
| 11 |
|
Asset | Net revenues | 2,861 |
| 2 |
| 738 |
| 7 |
| (3) |
|
Management | Total operating expenses | 2,352 |
| 31 |
| 648 |
| 21 |
| 26 |
|
| Income from continuing |
|
|
|
|
|
|
|
|
|
|
| operations before taxes | 508 |
| (50) |
| 89 |
| (44) |
| (63) |
|
Investment Banking
The Investment Banking segment reported record income from continuing operations before taxes of CHF 5,951 million for the full year 2006, an increase of CHF 4,352 million compared to 2005, with strong contributions across the underwriting, advisory, fixed income trading and equity trading businesses. Excluding the CHF 508 million of credits from insurance settlements for litigation and related costs in 2006 and the CHF 960 million charge to increase litigation reserves in 2005, income from continuing operations before taxes rose 113% in 2006. Net revenues increased 32% to a record level in 2006, driven by a strong performance across all key business areas and regions amid favorable market conditions, high levels of deal activity and improved market share in certain products. Total operating expenses for the full year increased 4%, or 15% excluding the insurance settlements and litigation charge. The compensation/revenue ratio was 50.1% in 2006, compared to 55.5% for 2005. The pre-tax income margin was 29.1%, or 26.6% excluding the insurance settlements, compared to 16.5% excluding the litigation charge in 2005.
In the fourth quarter of 2006, income from continuing operations before taxes totaled a record CHF 2,342 million, an increase of CHF 2,056 million compared to the fourth quarter of 2005. Net revenues grew 63% to a record level in the fourth quarter of 2006, benefiting from strong performances in both the investment banking and trading businesses. Total operating expenses rose 8% compared to the fourth quarter of 2005, primarily reflecting higher compensation expenses in line with higher revenues, partly offset by a decrease in other expenses due to improvements in operating efficiency. The compensation/revenue ratio was 42.2% in the fourth quarter of 2006, compared to 53.5% in the first three quarters of the year. The pre-tax income margin was 38.5% in the fourth quarter of 2006, compared to 7.7% in the fourth quarter of 2005.
Private Banking
The Private Banking segment, which comprises the Wealth Management and Corporate & Retail Banking businesses, reported record income from continuing operations before taxes of CHF 4,596 million for the full year 2006, an increase of 16% compared to 2005.
In the fourth quarter of 2006, income from continuing operations before taxes was CHF 1,143 million, an increase of 11% compared to the fourth quarter of 2005.
| Media Release |
February 15, 2007 Page 3/8 |

The Wealth Management business reported record income from continuing operations before taxes of CHF 3,237 million for the full year 2006, an improvement of 22% compared to 2005. Net revenues grew 15% and total operating expenses rose 12%. The pre-tax income margin was 39.6% for 2006, compared to 37.3% in 2005.
In the fourth quarter of 2006, income from continuing operations before taxes amounted to CHF 811 million, up 15% from the fourth quarter of 2005. This increase reflected strong net revenues driven by higher commissions and fees, mainly from brokerage, product issuances and asset-based fees, as well as higher net interest income from higher liability margins and liability volumes. The growth in net revenues more than offset a 10% rise in total operating expenses, driven primarily by higher personnel expenses related to strategic investments in the global business and higher performance-related compensation expenses. The pre-tax income margin was 39.0% for the fourth quarter of 2006, compared to 37.6% in the fourth quarter of 2005.
The Corporate & Retail Banking business reported a 4% increase in income from continuing operations before taxes to CHF 1,359 million for the full year 2006, compared to 2005. Net revenues increased 4% in 2006 and total operating expenses rose 1%. The pre-tax income margin was 38.9% for 2006, compared to 38.7% in 2005.
In the fourth quarter of 2006, income from continuing operations before taxes was CHF 332 million, an increase of 3%, compared to the same period of 2005. Net revenues grew 6%, driven by higher asset-based commissions and fees and increased net interest income. Total operating expenses rose by 7% due to higher compensation and benefits, primarily reflecting higher performance-related compensation expenses. The pre-tax income margin was 37.1% for the fourth quarter of 2006, compared to 38.0% in the fourth quarter of 2005.
Asset Management
The Asset Management segment reported income from continuing operations before taxes of CHF 508 million for the full year 2006, a decline of 50% compared to 2005. This decrease reflects lower private equity and other investment-related gains, which are cyclical in nature, and higher operating expenses, partly due to the realignment of the business in 2006. Net revenues rose 2% compared to the previous year and net revenues before private equity and other investment-related gains grew 12%, reflecting the growth in assets under management. Private equity and other investment-related gains totaled CHF 502 million in 2006, a decrease of 28% from 2005. Total operating expenses rose 31% in 2006, including CHF 225 million of realignment costs. The pre-tax income margin was 17.8% for 2006, compared to 35.9% in 2005. As of December 31, 2006, assets under management totaled CHF 669.9 billion, an increase of 14% from December 31, 2005.
In the fourth quarter of 2006, income from continuing operations before taxes totaled CHF 89 million, a decrease of 63% compared to the fourth quarter of 2005. Net revenues declined 3% in the fourth quarter of 2006 compared to the same period of the previous year. Net revenues before private equity and other investment-related gains improved by 18%, compared to the fourth quarter of 2005, reflecting the growth in assets under management. Private equity and other investment-related gains totaled CHF 92 million in the fourth quarter of 2006, a decrease of 56% compared to the same period of 2005. Total operating expenses increased 26% in the fourth quarter of 2006, primarily reflecting higher compensation and benefits related to the ongoing efforts to hire new investment talent and build product development and
| Media Release |
February 15, 2007 Page 4/8 |

distribution capabilities and other expenses related to the realignment of Asset Management. The pre-tax income margin was 12.1% for the fourth quarter of 2006, compared to 31.8% in the fourth quarter of 2005. Credit Suisse continued to realign Asset Management in the fourth quarter of 2006 as part of the previously announced strategy to reposition businesses with low profitability, reshape the product offering, improve investment and sales processes, and reduce the overall cost base.
Net New Assets
The Wealth Management business generated CHF 50.5 billion of net new assets in 2006, an increase of 18% compared to 2005. In the fourth quarter of 2006, Wealth Management recorded CHF 8.6 billion of net new assets. The Asset Management business reported CHF 50.8 billion of net new assets in 2006, including money market assets of CHF 33.4 billion and alternative investment assets of CHF 12.5 billion. In the fourth quarter, Asset Management recorded a net outflow of CHF 2.9 billion. Overall, Credit Suisse recorded CHF 95.4 billion of net new assets for the full year 2006, including net new assets of CHF 6.9 billion in the fourth quarter. Total assets under management were CHF 1,485.1 billion as of December 31, 2006, an increase of 13% from December 31, 2005.
Sale of the Insurance Business
On December 22, 2006, Credit Suisse Group completed the sale of Winterthur for cash consideration of CHF 12.3 billion. The Group realized a net capital gain of CHF 1,817 million on the transaction. As a result of the sale of Winterthur, the results of Winterthur’s operations are reported as income from discontinued operations, net of tax. Income from discontinued operations in the fourth quarter of 2006 was CHF 2,074 million, including the gain from the sale. For the full year 2006, income from discontinued operations was CHF 3,070 million, compared to CHF 1,310 million for the full year 2005.
Dividend Proposal and Share Repurchase Program
The Board of Directors of Credit Suisse Group will propose a cash dividend of CHF 2.24 per share for the financial year 2006 and a par value reduction of CHF 0.46 per share at the Annual General Meeting on May 4, 2007. This compares to a dividend of CHF 2.00 per share for the financial year 2005.
The Board of Directors will also propose a share repurchase program of up to CHF 8 billion at the Annual General Meeting. Subject to the approval of shareholders, the program will commence after the Annual General Meeting and run for a maximum of three years.
Outlook
Credit Suisse believes that the growth prospects for the global economy will remain good and expects client activity to continue at around the levels of 2006. Interest rates are unlikely to increase significantly and valuations for equities are still relatively low. High corporate earnings will attract capital flows into the equity markets, which will continue to trend higher with occasional corrections. Credit Suisse has had a good start to 2007 and is well positioned to capture these growth opportunities with its integrated banking model.
Information
Media Relations Credit Suisse, telephone +41 844 33 88 44, media.relations@credit-suisse.com
Investor Relations Credit Suisse, telephone +41 44 333 71 49, investor.relations@credit-suisse.com
| Media Release |
February 15, 2007 Page 5/8 |

For additional information on Credit Suisse Group’s fourth-quarter and full-year 2006 results, please refer to the Group’s Quarterly Report Q4/2006, as well as the Group’s slide presentation for analysts and the press, which are available on the Internet at: www.credit-suisse.com/results
Credit Suisse Group
As one of the world's leading banks, Credit Suisse provides its clients with investment banking, private banking and asset management services worldwide. Credit Suisse offers advisory services, comprehensive solutions and innovative products to companies, institutional clients and high-net-worth private clients globally, as well as retail clients in Switzerland. Credit Suisse is active in over 50 countries and employs approximately 45,000 people. Credit Suisse's parent company, Credit Suisse Group, is a leading global financial services company headquartered in Zurich. Credit Suisse Group's registered shares (CSGN) are listed in Switzerland and, in the form of American Depositary Shares (CS), in New York. Further information about Credit Suisse can be found at www.credit-suisse.com.
Cautionary Statement Regarding Forward-Looking Information
This press release contains statements that constitute forward-looking statements. In addition, in the future we, and others on our behalf, may make statements that constitute forward-looking statements. Such forward-looking statements may include, without limitation, statements relating to our plans, objectives or goals; our future economic performance or prospects; the potential effect on our future performance of certain contingencies; and assumptions underlying any such statements.
Words such as “believes,” “anticipates,” “expects,” "intends” and “plans” and similar expressions are intended to identify forward-looking statements but are not the exclusive means of identifying such statements. We do not intend to update these forward-looking statements except as may be required by applicable laws.
By their very nature, forward-looking statements involve inherent risks and uncertainties, both general and specific, and risks exist that predictions, forecasts, projections and other outcomes described or implied in forward-looking statements will not be achieved. We caution you that a number of important factors could cause results to differ materially from the plans, objectives, expectations, estimates and intentions expressed in such forward-looking statements. These factors include (i) market and interest rate fluctuations; (ii) the strength of the global economy in general and the strength of the economies of the countries in which we conduct our operations in particular; (iii) the ability of counterparties to meet their obligations to us; (iv) the effects of, and changes in, fiscal, monetary, trade and tax policies, and currency fluctuations; (v) political and social developments, including war, civil unrest or terrorist activity; (vi) the possibility of foreign exchange controls, expropriation, nationalization or confiscation of assets in countries in which we conduct our operations; (vii) the ability to maintain sufficient liquidity and access capital markets; (viii) operational factors such as systems failure, human error, or the failure to implement procedures properly; (ix) actions taken by regulators with respect to our business and practices in one or more of the countries in which we conduct our operations; (x) the effects of changes in laws, regulations or accounting policies or practices; (xi) competition in geographic and business areas in which we conduct our operations; (xii) the ability to retain and recruit qualified personnel; (xiii) the ability to maintain our reputation and promote our brand; (xiv) the ability to increase market share and control expenses; (xv) technological changes; (xvi) the timely development and acceptance of our new products and services and the perceived overall value of these products and services by users; (xvii) acquisitions, including the ability to integrate acquired businesses successfully, and divestitures, including the ability to sell non-core assets; (xviii) the adverse resolution of litigation and other contingencies; and (xix) our success at managing the risks involved in the foregoing.
We caution you that the foregoing list of important factors is not exclusive; when evaluating forward-looking statements, you should carefully consider the foregoing factors and other uncertainties and events, as well as the risks identified in our most recently filed Form 20-F and reports on Form 6-K furnished to the US Securities and Exchange Commission.
| Media Release |
February 15, 2007 Page 6/8 |

Presentation of the fourth-quarter and full-year 2006 results
Analyst and Media Conference
§ | Thursday, February 15, 2007 |
| 09:30 CET / 08:30 GMT / 03:30 EST |
Credit Suisse Forum St. Peter, Zurich
§ | Simultaneous interpreting: German – English, English – German |
§ | Speakers |
Oswald J. Grübel, Chief Executive Officer of Credit Suisse
| Renato Fassbind, Chief Financial Officer of Credit Suisse |
§ | Internet |
Live broadcast at: www.credit-suisse.com/results
Video playback available approximately 3 hours after the event
§ | Telephone |
| Live audio dial-in on +41 91 610 5600 (Europe), +44 207 107 0611 (UK) and |
+1 866 291 4166 (US); ask for "Credit Suisse Group quarterly results".
Please dial in 10-15 minutes before the start of the presentation.
| Telephone replay available approximately 1 hour after the event on +41 91 612 4330 (Europe), |
+44 207 108 6233 (UK) and +1 866 416 2558 (US); conference ID English – 596#, conference
ID German – 311#.
 |
Credit Suisse Group |
| Quarterly Report 2006/Q4 |
 |
| Cover: Manish Kumar, Investment Banking (CMOS), New York Photographer: John Wildgoose |
| Financial calendar : please see inside back cover. |
| Credit Suisse Group financial highlights | ||||||||||||||||||
| 12 months | ||||||||||||||||||
| in CHF m, except where indicated | 4Q 2006 | 3Q 2006 | 4Q 2005 | Change in % from 3Q 2006 | Change in % from 4Q 2005 | 2006 | 2005 | Change in % from 2005 | ||||||||||
| Consolidated statements of income | ||||||||||||||||||
| Net revenues | 10,814 | 8,076 | 7,566 | 34 | 43 | 38,603 | 30,489 | 27 | ||||||||||
| Income from continuing operations before taxes,minority interests, extraordinary items andcumulative effect of accounting changes | 4,314 | 2,460 | 1,059 | 75 | 307 | 14,300 | 7,401 | 93 | ||||||||||
| Income from continuing operations beforeextraordinary items and cumulative effectof accounting changes | 2,599 | 1,468 | 677 | 77 | 284 | 8,281 | 4,526 | 83 | ||||||||||
| Income from discontinued operations, net of tax | 2,074 | 424 | 426 | 389 | 387 | 3,070 | 1,310 | 134 | ||||||||||
| Net income | 4,673 | 1,892 | 1,103 | 147 | 324 | 11,327 | 5,850 | 94 | ||||||||||
| Return on equity | 44.1% | 18.9% | 11.2% | – | – | 27.5% | 15.4% | – | ||||||||||
| Earnings per share, in CHF | ||||||||||||||||||
| Basic earnings per share from continuing operationsbefore cumulative effect of accounting changes | 2.42 | 1.35 | 0.59 | – | – | 7.53 | 3.98 | – | ||||||||||
| Basic earnings per share | 4.35 | 1.74 | 0.98 | – | – | 10.30 | 5.17 | – | ||||||||||
| Diluted earnings per share from continuing operationsbefore cumulative effect of accounting changes | 2.29 | 1.29 | 0.59 | – | – | 7.19 | 3.90 | – | ||||||||||
| Diluted earnings per share | 4.12 | 1.67 | 0.95 | 9.83 | 5.02 | |||||||||||||
| Cost/income ratio – reported | 60.3% | 70.0% | 86.5% | – | – | 63.2% | 76.2% | – | ||||||||||
| Cost/income ratio1) | 65.7% | 75.9% | 93.1% | – | – | 69.6% | 81.6% | – | ||||||||||
| Net new assets, in CHF bn | 6.9 | 31.1 | 8.0 | – | – | 95.4 | 57.4 | – | ||||||||||
| in CHF m, except where indicated | 31.12.06 | 30.09.06 | 31.12.05 | Change in % from 30.09.06 | Change in % from 31.12.05 | |||||||
| Assets under management, in CHF bn | 1,485.1 | 1,441.3 | 1,319.4 | 3.0 | 12.6 | |||||||
| Consolidated balance sheets | ||||||||||||
| Total assets | 1,255,956 | 2) | 1,473,113 | 1,339,052 | (15) | (6) | ||||||
| Shareholders' equity | 43,586 | 41,643 | 42,118 | 5 | 3 | |||||||
| Consolidated BIS capital data | ||||||||||||
| Risk-weighted assets | 253,676 | 252,139 | 232,891 | 1 | 9 | |||||||
| Tier 1 ratio | 13.9% | 10.8% | 11.3% | – | – | |||||||
| Total capital ratio | 18.4% | 13.2% | 13.7% | – | – | |||||||
| Number of employees | ||||||||||||
| Switzerland – Banking | 20,353 | 20,261 | 20,194 | 0 | 1 | |||||||
| Outside Switzerland – Banking | 24,518 | 24,456 | 24,370 | 0 | 1 | |||||||
| Winterthur | 0 | 2) | 18,984 | 18,959 | – | – | ||||||
| Number of employees (full-time equivalents) | 44,871 | 63,701 | 63,523 | (30) | (29) | |||||||
| Stock market data | ||||||||||||
| Share price per common share, in CHF | 85.25 | 72.35 | 67.00 | 18 | 27 | |||||||
| High (closing price) year-to-date, in CHF | 85.35 | 74.20 | 68.50 | 15 | 25 | |||||||
| Low (closing price) year-to-date, in CHF | 62.70 | 62.70 | 46.85 | 0 | 34 | |||||||
| Share price per American Depositary Share, in USD | 69.85 | 57.95 | 50.95 | 21 | 37 | |||||||
| Market capitalization, in CHF m | 90,575 | 77,946 | 75,399 | 16 | 20 | |||||||
| Market capitalization, in USD m | 74,213 | 62,432 | 57,337 | 19 | 29 | |||||||
| Book value per share, in CHF | 41.02 | 38.65 | 37.43 | 6 | 10 | |||||||
| Share information | ||||||||||||
| Shares issued | 1,214,862,013 | 1,214,054,870 | 1,247,752,166 | 0 | (3) | |||||||
| Treasury shares | (152,394,952) | (136,710,156) | (122,391,983) | 11 | 25 | |||||||
| Shares outstanding | 1,062,467,061 | 1,077,344,714 | 1,125,360,183 | (1) | (6) | |||||||
| 1) Excludes minority interest revenues of CHF 998 million, CHF 640 million, CHF 554 million, CHF 3,663 million and CHF 2,074 million and minority interest expenses of CHF 71 million, CHF 10 million, CHF 15 million, CHF 103 million and CHF 32 million in 4Q 2006, 3Q 2006, 4Q 2005, 12 months 2006 and 12 months 2005, respectively, from the consolidation of certain private equity funds and other entities in which the Group does not have a significant economic interest in such revenues and expenses. 2) The Group completed the sale of Winterthur to AXA on December 22, 2006. | ||||||||||||
Contents |
Credit Suisse Group
Contents
Enquiries
Message from the Chief Executive Officer
Dear shareholders, clients and colleagues
Strong annual results with basic earnings per share from continuing operations of CHF 7.53
Returning capital to our shareholders
Investment Banking delivers strong results
Continued expansion in Private Banking
Realignment of Asset Management
Strategic priorities going forward
Outlook
Credit Suisse Group
Summary of segment results
Investment Banking
Private Banking
Asset Management
Credit Suisse Group consolidated results
Net revenues
Provision for credit losses
Total operating expenses
Income tax expense
Minority interests
Discontinued operations
Recent developments
Dividend proposal and share repurchase program
Factors affecting results of operations
Credit Suisse Group structure
Investment Banking
Private Banking
Wealth Management
Corporate & Retail Banking
Asset Management
Assets under management
Assets under management
Client assets
Net new assets
Capital
Credit Suisse Group
Credit Suisse
Risk management
Economic Risk Capital trends
Trading risks
Loan exposure
Condensed consolidated financial statements
Consolidated statements of income (unaudited)
Consolidated balance sheets (unaudited)
Consolidated statements of changes in shareholders’ equity (unaudited)
Comprehensive income (unaudited)
Consolidated statements of cash flows (unaudited)
Consolidated statements of cash flows - continued (unaudited)
Notes to the condensed consolidated financial statements unaudited
Summary of significant accounting policies
Basis of presentation
Recently adopted accounting standards
EITF 04-5, FSP SOP 78-9-1 and EITF 96-16
SFAS 123R
SFAS 154
SFAS 155
SFAS 156
FSP FTB 85-4-1
FSP FIN 46(R)-6
SFAS 158
SAB 108
Standards to be adopted in future periods
FIN 48
SFAS 157
Discontinued operations
Segment reporting
Interest and dividend income and interest expense
Trading activities
Commissions and fees
Loans
Accumulated other comprehensive income
Earnings per share
Pension
Guarantees and commitments
Guarantees
Disposal-related contingencies and other indemnifications
Disposal-related contingencies
Other indemnifications
Other commitments
Variable interest entities
Collateralized debt obligations
Commercial paper conduits
Financial intermediation
Litigation
Information for investors
Foreign currency translation rates
Cautionary statement regarding forward-looking information
| Enquiries |
| Credit Suisse Group Investor Relations Ian Roundell, Marc Buchheister Tel. +41 44 333 7149 Fax +41 44 333 2587 investor.relations@credit-suisse.com Credit Suisse Group Media Relations Charles Naylor, Andrés Luther Tel. +41 844 33 8844 Fax +41 44 333 8877 media.relations@credit-suisse.com |
Message from the Chief Executive Officer |
 |
| Oswald J. Grübel |
| Chief Executive Officer |
| Dear shareholders, clients and colleagues |
| 2006 was a record year for Credit Suisse. Our integrated banking model proved successful and provided us with an effective platform to capture the growth opportunities arising from high levels of client activity while significantly improving our profitability. We are particularly pleased with our performance in Investment Banking. In our first year as an integrated bank we made excellent progress in strengthening our operating efficiency but there is still great potential for further improvement as we continue to invest in the growth of our business. Our clients have responded well to our integrated approach and Credit Suisse now has excellent opportunities for further growth in the context of globalization, which we believe will create dynamic markets for the foreseeable future. |
| Strong annual results with basic earnings per share from continuing operations of CHF 7.53 |
| Credit Suisse Group reported a significant improvement in profitability in 2006, driven by good net revenues and improved operating efficiency. Net income totaled CHF 11.3 billion, including a net capital gain of CHF 1.8 billion from the sale of Winterthur, which was recorded in the fourth quarter of 2006. Income from continuing operations was CHF 8.3 billion or CHF 7.53 per share. Basic earnings per share were CHF 10.30. Our return on equity improved significantly to 27.5% in 2006 from 15.4% in 2005. In the fourth quarter of 2006, net income rose to CHF 4.7 billion, compared to CHF 1.1 billion in the fourth quarter of 2005. We generated net new assets of CHF 95.4 billion in 2006, compared to CHF 57.4 billion in 2005. |
| Returning capital to our shareholders |
| Credit Suisse Group today has the strongest capital base in its history. We are pleased that we have the requisite resources to grow our business while, at the same time, returning capital to our shareholders. At the forthcoming Annual General Meeting on May 4, 2007, the Board of Directors of Credit Suisse Group will ask the shareholders to approve a further share buyback program of up to CHF 8 billion over three years. It will also propose a distribution of CHF 2.70 per share for the financial year 2006, comprising a cash dividend of CHF 2.24 per share and a par value reduction of CHF 0.46 per share. |
| Investment Banking delivers strong results |
| We achieved record results in Investment Banking in 2006, reflecting a strong performance in all key businesses and regions amid favorable market conditions, high levels of client activity and improved market share in a range of products. Against this backdrop, we generated record revenues in advisory and debt and equity underwriting and significantly increased our trading revenues. Income from continuing operations before taxes grew by 272% compared to 2005. Excluding credits from insurance settlements for litigation and related costs in 2006 and a charge to increase litigation reserves in 2005, income from continuing operations before taxes grew by 113%. Our strong results reflect continued progress against our strategy to deliver a more profitable business. Highlights in Investment Banking in 2006 included our continued leadership position in some of the world’s fastest growing emerging markets, such as China, Russia, Brazil and Mexico. This was demonstrated, among other things, by our number one market share ranking in equity issuance and announced mergers and acquisitions in Latin America and our recognition as the “China Equity House” in International Financing Review’s Asia Awards 2006. Credit Suisse was presented with the “European IPO House of the Year” award in the annual Financial News Awards for Excellence in Investment Banking for 2006. In addition The Banker magazine’s annual Investment Banking Awards 2006 recognized Credit Suisse as the “Best Bank of the Year for IPOs.” We also maintained our leadership position in other important growth areas such as commercial mortgage-backed securities, leveraged finance and financial sponsors. We advised on a number of notable transactions that were announced in the fourth quarter of the year, including Google Inc.’s acquisition of YouTube, the sale of Raytheon Aircraft Company to Hawker Beechcraft Corporation and the acquisition of Corus Group plc by Tata Steel. |
| Continued expansion in Private Banking |
| In our Private Banking segment, which comprises the Wealth Management and Corporate & Retail Banking businesses, we delivered very strong results with significantly higher net revenues in 2006. This revenue growth outpaced an increase in total operating expenses driven partly by ongoing strategic investments in the Wealth Management business. This resulted in record income from continuing operations before taxes for 2006. Asset gathering also reached a record level, with net new assets of CHF 50.5 billion in Wealth Management, representing a growth rate of 7.3%. We continued to expand our global reach in Wealth Management through 2006 and announced the launch of new onshore operations in Brazil, Russia, Australia, Qatar and Lebanon. |
| Realignment of Asset Management |
| In our Asset Management segment, we generated strong net new assets of CHF 50.8 billion in 2006, including alternative investment assets of CHF 12.5 billion. Our net revenues before private equity and other investment-related gains increased 12%, driven by higher asset management revenues and private equity commissions and fees. Income from continuing operations before taxes decreased by half compared to 2005, reflecting higher total operating expenses, partly due to realignment expenses, and lower private equity and other investment-related gains. We achieved further progress in the realignment of Asset Management during the fourth quarter of the year, as part of the previously announced strategy to reposition businesses with low profitability, reshape the product offering, improve investment and sales processes and reduce the overall cost base. In addition, we continued to invest in expanding the geographic footprint of our Asset Management business in key markets in 2006, while also taking steps to broaden our alternative investment business with a series of strategic alliances aimed at adding new capabilities and at increasing our product offering. |
| Strategic priorities going forward |
| We have defined three clear strategic priorities in order to accelerate the expansion of our business going forward. We will continue to capitalize on our integrated banking model by building on a series of targeted internal initiatives that drive revenue growth and reduce costs. We will deploy our capital as efficiently as possible. The target for our investments is an annual rate of return of 20% or above in the medium term. We will continue to expand our activities in high-growth markets and products. For example, we signed an agreement to acquire the Brazilian asset manager Hedging-Griffo in the fourth quarter of 2006. This strategic step will help us to leverage our integrated banking model in Brazil to provide a comprehensive range of investment banking, private banking and asset management services to onshore clients in this market. We also aim to realize our third priority through measures such as the expansion of our activities in dynamic emerging markets and the growth of leading businesses and products, including alternative investments and structured products. Our objective is to generate long-term, sustainable returns. We will therefore focus on and invest in businesses which fit our model and are in line with that objective. |
| Outlook |
| The growth prospects for the global economy remain good and we expect client activity to continue at around the levels of 2006. Interest rates are unlikely to increase significantly and valuations for equities are still relatively low. High corporate earnings will attract capital flows into the equity markets, which will continue to trend higher with occasional corrections. We have had a good start to 2007 and are well positioned to capture these growth opportunities with our integrated banking model. Yours sincerely Oswald J. Grübel February 2007 |
Credit Suisse Group |
| Credit Suisse Group reported net income of CHF 4,673 million in the fourth quarter of 2006, an increase of CHF 3,570 million compared to the fourth quarter of 2005. Fourth quarter net income included a net capital gain of CHF 1,817 million from the sale of Winterthur. Net income for the full year 2006 was CHF 11,327 million, an increase of CHF 5,477 million, or 94%, compared to the full year 2005. Income from continuing operations in 2006 was CHF 8,281 million, an increase of 83%. In the fourth quarter, Investment Banking results improved significantly as a result of favorable market conditions and increased client and deal activity. Private Banking also reported good results as higher revenues associated with client activity were partially offset by higher compensation expenses, including costs of strategic investments in the Wealth Management business. Asset Management results declined reflecting lower private equity and other investment-related gains and higher compensation and other operating expenses, partly due to the business realignment. |
Summary of segment results |
| Investment Banking |
| Investment Banking reported record income from continuing operations before taxes of CHF 2,342 million in the fourth quarter of 2006, an increase of CHF 2,056 million compared to the fourth quarter of 2005. These results reflected strong performance across all key business areas and regions amid favorable market conditions, high levels of deal activity and improved market share in certain products. For the full year 2006, Investment Banking reported income from continuing operations before taxes of CHF 5,951 million, an increase of CHF 4,352 million compared to the full year 2005. Excluding the CHF 508 million credits from insurance settlements for litigation and related costs in 2006 and the CHF 960 million charge to increase litigation reserves in 2005, income from continuing operations before taxes for the full year 2006 increased 113% compared to the full year 2005. |
| Private Banking |
| Private Banking reported record income from continuing operations before taxes of CHF 1,143 million in the fourth quarter of 2006, CHF 117 million, or 11%, above the fourth quarter of 2005. The fourth quarter of 2006 was characterized by strong equity markets, which led to strong client activity and a 9% increase in revenues. Operating expenses increased 9%, reflecting ongoing strategic investments in international growth in the Wealth Management business and new business initiatives in Corporate & Retail Banking. Full year 2006 income from continuing operations before taxes was a record CHF 4,596 million, 16% higher than in 2005. Private Banking reported net new assets of CHF 9.7 billion in the fourth quarter of 2006 and CHF 52.2 billion in full year 2006. Assets under management were CHF 940.3 billion as of December 31, 2006, an increase of 12.3% compared to December 31, 2005. |
| Asset Management |
| Asset Management income from continuing operations before taxes was CHF 89 million in the fourth quarter of 2006, a decrease of CHF 152 million, or 63%, from the fourth quarter of 2005. This reflected lower private equity and other investment-related gains compared to the strong fourth quarter of 2005 and higher operating expenses, partly due to realignment costs. Full year 2006 income from continuing operations before taxes was CHF 508 million, a decrease of 50% from the full year 2005. Asset Management reported a net asset outflow of CHF 2.9 billion in the fourth quarter of 2006 and net new assets of CHF 50.8 billion in full year 2006. Assets under management increased to CHF 669.9 billion as of December 31, 2006 from CHF 589.4 billion as of December 31, 2005. |
Credit Suisse Group consolidated results |
| The Group recorded net income of CHF 4,673 million in the fourth quarter of 2006, an increase of CHF 3,570 million compared to the fourth quarter of 2005. Fourth quarter net income included a net capital gain of CHF 1,817 million from the sale of Winterthur. Basic earnings per share increased to CHF 4.35, compared with CHF 0.98 in the fourth quarter of 2005. The return on equity in the fourth quarter of 2006 was 44.1% compared to 11.2% in the fourth quarter of 2005. |
| Income from continuing operations before extraordinary items and cumulative effect of accounting changes for the fourth quarter of 2006 was CHF 2,599 million or CHF 2.42 per share. This compares to CHF 677 million or CHF 0.59 per share in the fourth quarter of 2005. |
| Full year net income was CHF 11,327 million, an increase of 5,477 million, or 94%, compared to full year 2005. Full year 2006 basic earnings per share improved to CHF 10.30. Full year 2006 return on equity was 27.5%, compared to 15.4% in 2005. For the full years 2006 and 2005, income from continuing operations before extraordinary items and cumulative effect of accounting changes was CHF 8,281 million and CHF 4,526 million, or CHF 7.53 and CHF 3.98 per share, respectively. |
| Net revenues |
| The Group reported net revenues of CHF 10,814 million in the fourth quarter of 2006, an increase of CHF 3,248 million, or 43%, compared to the fourth quarter of 2005. Full year 2006 net revenues were CHF 38,603 million, 27% above full year 2005. |
| Net interest income was 9% higher in the fourth quarter of 2006 compared to the fourth quarter of 2005, primarily reflecting an increase in Private Banking largely due to an increase in liability margins and volumes. |
| Commissions and fees increased 25% compared to the fourth quarter of 2005, primarily as a result of higher underwriting and advisory fees in Investment Banking, and to a lesser extent, higher brokerage and issuing fees in Private Banking due to stronger client activity. |
| The following tables set forth an overview of segment results for the fourth quarter of 2006 and 2005, respectively: | ||||||||||||
| 4Q 2006, in CHF m | Investment Banking | Private Banking | Asset Management | Corporate Center | 1) | Credit Suisse Group | ||||||
| Net revenues | 6,085 | 2,973 | 738 | 1,018 | 10,814 | |||||||
| Provision for credit losses | 20 | (41) | 1 | 0 | (20) | |||||||
| Compensation and benefits | 2,566 | 1,037 | 327 | 170 | 4,100 | |||||||
| Other expenses | 1,157 | 834 | 321 | 108 | 2,420 | |||||||
| Total operating expenses | 3,723 | 1,871 | 648 | 278 | 6,520 | |||||||
| Income from continuing operations before taxes and minority interests | 2,342 | 1,143 | 89 | 740 | 4,314 | |||||||
| 4Q 2005, in CHF m | Investment Banking | Private Banking | Asset Management | Corporate Center | 1) | Credit Suisse Group | ||||||
| Net revenues | 3,735 | 2,716 | 757 | 358 | 7,566 | |||||||
| Provision for credit losses | (13) | (21) | 0 | 0 | (34) | |||||||
| Compensation and benefits | 2,136 | 888 | 252 | 708 | 3,984 | |||||||
| Other expenses | 1,326 | 823 | 264 | 144 | 2,557 | |||||||
| Total operating expenses | 3,462 | 1,711 | 516 | 852 | 6,541 | |||||||
| Income/(loss) from continuing operations before taxes and minority interests | 286 | 1,026 | 241 | (494) | 1,059 | |||||||
| 1) Includes consolidation eliminations, revenues and expenses from certain parent company investments and certain other revenues and expenses not allocated to the segments. Also includes minority interest revenues of CHF 998 million and CHF 554 million in 4Q 2006 and 4Q 2005, respectively, and minority interest expenses of CHF 71 million and CHF 15 million in 4Q 2006 and 4Q 2005, respectively, from the consolidation of certain private equity funds and other entities in which the Group does not have a significant economic interest in such income. | ||||||||||||
| The following table presents the Group's condensed consolidated statements of income: | ||||||||||||||||||
| 12 months | ||||||||||||||||||
| in CHF m | 4Q 2006 | 3Q 2006 | 4Q 2005 | Change in % from 3Q 2006 | Change in % from 4Q 2005 | 2006 | 2005 | Change in % from 2005 | ||||||||||
| Net revenues | 10,814 | 8,076 | 7,566 | 34 | 43 | 38,603 | 30,489 | 27 | ||||||||||
| Provision for credit losses | (20) | (40) | (34) | (50) | (41) | (111) | (144) | (23) | ||||||||||
| Compensation and benefits | 4,100 | 3,427 | 3,984 | 20 | 3 | 15,697 | 13,974 | 12 | ||||||||||
| Other expenses | 2,420 | 2,229 | 2,557 | 9 | (5) | 8,717 | 9,258 | (6) | ||||||||||
| Total operating expenses | 6,520 | 5,656 | 6,541 | 15 | 0 | 24,414 | 23,232 | 5 | ||||||||||
| Income from continuing operations before taxes,minority interests, extraordinary items andcumulative effect of accounting changes | 4,314 | 2,460 | 1,059 | 75 | 307 | 14,300 | 7,401 | 93 | ||||||||||
| Income tax expense/(benefit) | 805 | 367 | (108) | 119 | – | 2,389 | 927 | 158 | ||||||||||
| Minority interests | 910 | 625 | 490 | 46 | 86 | 3,630 | 1,948 | 86 | ||||||||||
| Income from continuing operations beforeextraordinary items and cumulative effectof accounting changes | 2,599 | 1,468 | 677 | 77 | 284 | 8,281 | 4,526 | 83 | ||||||||||
| Income from discontinued operations, net of tax | 2,074 | 424 | 426 | 389 | 387 | 3,070 | 1,310 | 134 | ||||||||||
| Extraordinary items, net of tax | 0 | 0 | 0 | – | – | (24) | 0 | – | ||||||||||
| Cumulative effect of accounting changes, net of tax | 0 | 0 | 0 | – | – | 0 | 14 | (100) | ||||||||||
| Net income | 4,673 | 1,892 | 1,103 | 147 | 324 | 11,327 | 5,850 | 94 | ||||||||||
| Trading revenues increased 130% compared to the fourth quarter of 2005, primarily reflecting Investment Banking’s strong trading revenues in the fourth quarter of 2006, in particular in fixed income. |
| Other revenues in the fourth quarter of 2006 increased 46%, compared to the fourth quarter of 2005, which was the result of higher minority interest-related revenues from consolidated private equity funds and other entities in which the Group does not have a significant economic interest in such revenues. |
| Provision for credit losses |
| The Group reported a net release of provisions for credit losses of CHF 20 million in the fourth quarter of 2006 compared to a net release of CHF 34 million in the fourth quarter of 2005. For the full year 2006, the net release of provision for credit losses was CHF 111 million compared to CHF 144 million in 2005. While the credit environment is likely to remain favorable in the near term, we do not expect these very benign conditions to continue. |
| Total operating expenses |
| The Group reported total operating expenses of CHF 6,520 million in the fourth quarter of 2006, CHF 21 million below the fourth quarter of 2005. Compensation and benefits increased CHF 116 million, or 3%, to CHF 4,100 million compared to the fourth quarter of 2005, which included a CHF 630 million expense, recorded in the Corporate Center, relating to a change in the Group’s accounting for share-based compensation awards subject to a non-competition provision that have scheduled vesting beyond an employee’s eligibility for early retirement. In the fourth quarter of 2006, compensation and benefits primarily reflected higher performance-based compensation in Investment Banking and Private Banking. |
| Other expenses in the fourth quarter of 2006 were CHF 2,420 million, a decrease of CHF 137 million, or 5%, compared to the fourth quarter of 2005 primarily reflecting lower professional fees, a credit from an insurance settlement and lower travel and entertainment expenses in Investment Banking offset by realignment costs in Asset Management. |
| For the full year 2006, the Group reported total operating expenses of CHF 24,414 million, an increase of CHF 1,182 million, or 5%, compared to the previous year. Full year 2006 expenses included credits from insurance settlements for litigation and related costs of CHF 508 million. Full year 2005 expenses included the reserve for private litigation matters of CHF 960 million and a CHF 630 million expense relating to the above-mentioned change in the Group’s accounting for share-based compensation awards. Excluding these items, total operating expenses increased 15%, primarily as a result of higher performance-based compensation expenses in Investment Banking and Private Banking. |
| Income tax expense |
| The Group recorded income tax expense of CHF 805 million in the fourth quarter of 2006 reflecting the Group's higher income from continuing operations before taxes. This compared to a net tax benefit of CHF 108 million in the fourth quarter of 2005, reflecting the release of tax contingency accruals and the impact of the above-mentioned change in the Group’s accounting for share-based compensation awards. |
| The Group tax expense is not affected by minority interest revenues and expenses from consolidated private equity and other entities in which the Group does not have a significant economic interest in such revenues and expenses. The amount of non-taxable income relating to these investments varies from one period to the next and was CHF 927 million in the fourth quarter of 2006 compared to CHF 539 million in the fourth quarter of 2005. The Group’s effective tax rate in the fourth quarter of 2006 was 19%. Excluding the effect of non-taxable income from these investments, the Group’s effective tax rate in the fourth quarter of 2006 was 24%. The Group’s effective tax rate in the fourth quarter of 2005 was negative as a result of the release of tax contingency accruals and the impact of the above-mentioned change in the Group’s accounting for share-based awards. |
| Minority interests |
| Minority interests were CHF 910 million in the fourth quarter of 2006, an increase of CHF 420 million compared to the fourth quarter of 2005. This increase was primarily due to revenues from certain private equity funds and other entities that were consolidated for the first time in 2006. For further details, see “Notes to the condensed consolidated financial statements - unaudited - Recently adopted accounting standards.” |
| The Group’s net revenues and operating expenses reflect the consolidation of certain private equity funds and other entities in which the Group does not have a significant economic interest in such revenues and expenses. The consolidation of these entities does not affect net income as the amounts recorded in net revenues and expenses are offset by corresponding amounts reported as minority interests. This minority interest income, which is reported in the Corporate Center, was CHF 927 million in the fourth quarter of 2006, and is comprised of revenues of CHF 998 million, primarily other revenues, and compensation and other expenses of CHF 71 million. |
| Discontinued operations |
| On December 22, 2006, the Group completed the sale of Winterthur for cash consideration of CHF 12.3 billion. The Group realized a net capital gain of CHF 1,817 million on the transaction. As a result of the sale of Winterthur, the results of operations of Winterthur are reflected in Income from discontinued operations, net of tax in the consolidated statements of income for all periods presented. Income from discontinued operations in the fourth quarter of 2006 was CHF 2,074 million, including the gain from the sale. For full year 2006, income from discontinued operations was CHF 3,070 million compared to CHF 1,310 million for full year 2005. |
| For further details, see “Notes to the condensed consolidated financial statements - unaudited - Discontinued operations.” |
 |
 |
 |
Credit Suisse Group structure |
| The Group’s business consists of three segments: Investment Banking, Private Banking and Asset Management. The three segments are complemented by Shared Services, which provides support in the areas of finance, legal and compliance, risk management and information technology. Prior period results presented in this Quarterly Report have been revised to reflect the operational and management structure in place during 2006. |
| The Group’s segments are managed and reported on a pre-tax basis. Minority interest-related revenues and expenses resulting from the consolidation of certain private equity funds and other entities in which the Group does not have a significant economic interest in such revenues and expenses are reported in the Corporate Center. Net income is unaffected by the consolidation of these entities due to offsetting minority interests. |
 |
Recent developments |
| Credit Suisse remains focused on its strategy to provide more value to its clients through its integrated banking model and active growth of its global footprint. During the fourth quarter of 2006, Credit Suisse announced additional onshore operations in the high-growth market of Brazil through the acquisition of Hedging-Griffo. Hedging-Griffo is a leading asset management company with a large and well-established client base and also serves high-net-worth individuals through its private banking platform in Brazil. It manages CHF 9.2 billion in assets under management for high-net worth individuals in Brazil and over the past three years has increased these assets at an average annual growth rate of 38.5%. This acquisition will support Credit Suisse’s integrated banking model by adding significant scale to its onshore asset management business, strengthen its private banking businesses and complement Credit Suisse’s position as a premier investment bank in Brazil. This transaction is expected to close by the middle of 2007, subject to regulatory approval. |
Dividend proposal and share repurchase program |
| Credit Suisse Group’s Board of Directors will propose a distribution of CHF 2.70 per share to the shareholders at the Annual General Meeting on May 4, 2007. The proposed distribution consists of a cash dividend of CHF 2.24, to be paid out on May 10, 2007, and a par value reduction of CHF 0.46, to be paid out on July 18, 2007. Both distributions are subject to approval at the Annual General Meeting. |
| The Board of Directors will also propose a new share repurchase program of up to CHF 8 billion at the Annual General Meeting. If approved by the shareholders, the program will commence after the Annual General Meeting and last for a maximum of three years. The shares would be repurchased through a second trading line on virt-x and cancelled. |
Factors affecting results of operations |
| The fourth quarter of 2006 was characterized by strong global equity markets, supported by solid company earnings and economic growth, modest inflation fears and a favorable interest rate environment across all regions. US stock markets were consistently buoyant throughout the period, as all major indices reported an increase, with the Dow Jones Industrial Average up 7%, the S&P 500 up 6% and the Nasdaq Composite Index up 7%. |
| European stock markets also improved during the quarter, as the Swiss Market Index increased 4%, the FTSE 100 4% and the German DAX 10%. Key markets in Asia also showed improvement, with the Nikkei increasing 7% during the quarter. Positive market developments resulted in strong trading conditions across all markets. |
| US interest rates were steady as the US Federal Reserve held the target federal funds rate at 5.25% during the fourth quarter of 2006. The European Central Bank raised its target rate in the quarter, reaching a five-year high of 3.5%, and indicated that further increases could be expected, although at a slower pace. The Bank of Japan kept its key interest rate stable at 0.25%, reflecting the recent weak economic data. The Swiss National Bank raised its target three-month Libor by 0.25% in December, citing expected continued economic growth throughout 2007. |
| Global debt underwriting activity recovered from two consecutive quarters of decreasing volumes to set an annual issuance record. The fourth quarter of 2006 ranked as the second highest quarter ever. A high level of financing activity and mergers and acquisitions activity across many sectors helped drive debt issuance volume, with both investment grade and high-yield debt volumes up from the fourth quarter of 2005. |
| Global equity underwriting volumes reached record levels in the quarter and for the year, driven by the continued recovery in the initial public offering market and the revival of convertible issuances. Global initial public offering volume rose for the third successive year, surpassing the previous record in 2000. On a regional basis, Europe accounted for the largest number and dollar volume of IPOs, and China was highest on an individual country basis. |
| The volume of announced mergers and acquisitions transactions in the fourth quarter represented the busiest quarter of the year and was higher than the fourth quarter of 2005. The total volume of announced mergers and acquisitions transactions in 2006 exceeded the previous record set in 2000. Financial sponsors continued to drive mergers and acquisitions activity, and European volume growth outpaced the US compared to the prior year. |
Investment Banking |
| Investment Banking provides financial advisory, lending and capital raising services and sales and trading to institutional, corporate and government clients worldwide. |
| Investment Banking reported record income from continuing operations before taxes of CHF 2,342 million in the fourth quarter of 2006, an increase of CHF 2,056 million, compared to the fourth quarter of 2005. These results reflected strong performance across all key business areas and regions amid favorable market conditions, high levels of deal activity and improved market share in certain products. The weakening of the average rate of the US dollar against the Swiss franc from the fourth quarter of 2005 adversely affected revenues and favorably impacted expenses. |
| For the full year 2006, Investment Banking reported income from continuing operations before taxes of CHF 5,951 million, an increase of CHF 4,352 million compared to the full year 2005. Excluding the CHF 508 million of credits from insurance settlements for litigation and related costs in 2006 and the CHF 960 million charge to increase litigation reserves in 2005, income from continuing operations before taxes for the full year 2006 increased 113% compared to the full year 2005. |
| Investment Banking’s progress in implementing its strategy to deliver a more profitable franchise positioned it to capitalize on favorable market conditions prevalent during 2006. Consequently, Investment Banking was able to achieve a number of its financial objectives set out in December 2004 and continues to make incremental progress in other areas of its strategy. For the full year 2006, Investment Banking delivered strong revenue growth and began to make progress on cost management initiatives. |
| Investment Banking will continue to build upon its existing strong franchises, including the emerging markets, leveraged finance and mortgage businesses. In 2006, Credit Suisse maintained its leading position in some of the fastest growing emerging markets, including China, Russia, Brazil and Mexico. The acquisition of Hedging-Griffo is expected to complement Credit Suisse’s position as a premier investment bank in Brazil. In addition, Investment Banking will continue to grow businesses where there are gaps to peers, such as prime services, commodities and derivatives, with an aim to further diversify its revenue mix and reduce earnings volatility. With this foundation in place, Investment Banking is well positioned to leverage revenue synergies obtained through the integrated bank, with a strong focus on delivering solutions and support to Private Banking and Asset Management clients. |
| In the fourth quarter of 2006, pre-tax income margin was 38.5%, and pre-tax return on average economic risk capital was 58.2%, compared to 7.7% and 10.8%, respectively, in the fourth quarter of 2005. For the full year 2006, pre-tax income margin was 29.1%, and pre-tax return on average economic risk capital was 40.3%. Excluding the insurance settlements, pre-tax income margin for the full year 2006 was 26.6%, and pre-tax return on average economic risk capital was 37.1%. |
| Net revenues were a record CHF 6,085 million, up CHF 2,350 million, or 63%, in the fourth quarter of 2006 compared to the fourth quarter of 2005, reflecting strong performance in both the investment banking and trading businesses. This revenue growth was well diversified, spread across most product classes and regions. In US dollar terms, net revenues were up 75%, compared to the fourth quarter of 2005. For the full year 2006, net revenues were CHF 20,469 million, up CHF 4,922 million, or 32%, compared to the full year 2005. |
| Provisions for credit losses were CHF 20 million in the fourth quarter of 2006, compared to a net release of CHF 13 million in the fourth quarter of 2005. Compared to September 30, 2006, total impaired loans decreased CHF 65 million to CHF 188 million, and valuation allowances as a percentage of total impaired loans increased 35 percentage points to 136% as of December 31, 2006. The overall credit environment continued to be favorable in the fourth quarter of 2006. While the credit environment is likely to remain favorable in the near term, the very benign credit environment is not expected to continue, which may result in a modest increase in net new provision levels towards the end of 2007. |
| Total operating expenses were CHF 3,723 million in the fourth quarter of 2006, up CHF 261 million, or 8%, compared to the fourth quarter of 2005. In US dollar terms, total operating expenses were up 15% compared to the fourth quarter of 2005. Compensation and benefits increased CHF 430 million, or 20%, due primarily to higher compensation expenses in line with higher revenues, with discretionary bonus representing a considerable portion of the total amount. Compensation and benefits for a given year are determined by the strength and breadth of business results, staffing levels and the impact of share-based compensation programs. The compensation/ revenue ratio of 42.2% in the fourth quarter of 2006 was significantly lower than the 53.5% in the first three quarters of 2006 due to the strong revenue performance in the quarter. Other expenses decreased CHF 169 million, or 13%, from the fourth quarter of 2005, indicating progress made in improving Investment Banking’s operating efficiency. Other expenses in the fourth quarter of 2006 reflected lower professional fees, a credit from an insurance settlement for litigation and related costs of CHF 34 million and lower travel and entertainment expenses, partially offset by higher commissions in line with higher transaction volumes. Other expenses in the fourth quarter of 2005 included a contingency accrual of CHF 28 million for value-added tax and CHF 24 million for premiums paid for policies acquired in the expanded life insurance finance business. |
| For the full year 2006, total operating expenses were CHF 14,556 million, up CHF 535 million, or 4%, compared to the full year 2005. Excluding the 2006 insurance settlements and the 2005 litigation charge, total operating expenses increased CHF 2,003 million, or 15%. Compensation and benefits increased CHF 1,640 million, or 19%, due to higher compensation expenses in line with higher revenues, with discretionary bonus representing a considerable portion of the total amount. The compensation/revenue ratio of 50.1% in 2006 was below the targeted level of 53.5% and a decline from 55.5% for the full year 2005. Other expenses decreased CHF 1,105 million, or 20%, compared to the full year 2005. Excluding the insurance settlements and the litigation charge, other expenses were up CHF 363 million, or 8%, from the full year 2005, due primarily to higher commissions in line with higher business activity, higher professional fees due to increased deal activity and the Centers of Excellence start-up initiatives and higher premises and equipment expenses. |
| The following table presents the results of the Investment Banking segment: | ||||||||||||||||||
| 12 months | ||||||||||||||||||
| in CHF m | 4Q 2006 | 3Q 2006 | 4Q 2005 | Change in % from 3Q 2006 | Change in % from 4Q 2005 | 2006 | 2005 | Change in % from 2005 | ||||||||||
| Net interest income | 347 | 688 | 421 | (50) | (18) | 2,640 | 3,372 | (22) | ||||||||||
| Commissions and fees | 2,836 | 1,853 | 1,984 | 53 | 43 | 8,941 | 6,709 | 33 | ||||||||||
| Trading revenues | 2,713 | 1,580 | 1,203 | 72 | 126 | 8,368 | 4,931 | 70 | ||||||||||
| Other revenues | 189 | 70 | 127 | 170 | 49 | 520 | 535 | (3) | ||||||||||
| Total noninterest revenues | 5,738 | 3,503 | 3,314 | 64 | 73 | 17,829 | 12,175 | 46 | ||||||||||
| Net revenues | 6,085 | 4,191 | 3,735 | 45 | 63 | 20,469 | 15,547 | 32 | ||||||||||
| Provision for credit losses | 20 | (19) | (13) | – | – | (38) | (73) | (48) | ||||||||||
| Compensation and benefits | 2,566 | 2,241 | 2,136 | 15 | 20 | 10,261 | 8,621 | 19 | ||||||||||
| Other expenses | 1,157 | 1,211 | 1,326 | (4) | (13) | 4,295 | 1) | 5,400 | 2) | (20) | ||||||||
| Total operating expenses | 3,723 | 3,452 | 3,462 | 8 | 8 | 14,556 | 14,021 | 4 | ||||||||||
| Income from continuingoperations before taxes | 2,342 | 758 | 286 | 209 | – | 5,951 | 1,599 | 272 | ||||||||||
| 1) Includes credits from insurance settlements for litigation and related costs of CHF 508 million, of which CHF 34 million relates to 4Q 2006. 2) Includes a CHF 960 million charge to increase the reserve for certain private litigation matters. | ||||||||||||||||||
| The following table presents the revenue details of the Investment Banking segment: | ||||||||||||||||||
| 12 months | ||||||||||||||||||
| in CHF m | 4Q 2006 | 3Q 2006 | 4Q 2005 | Change in % from 3Q 2006 | Change in % from 4Q 2005 | 2006 | 2005 | Change in % from 2005 | ||||||||||
| Debt underwriting | 686 | 451 | 394 | 52 | 74 | 2,206 | 1,484 | 49 | ||||||||||
| Equity underwriting | 484 | 224 | 343 | 116 | 41 | 1,270 | 931 | 36 | ||||||||||
| Underwriting | 1,170 | 675 | 737 | 73 | 59 | 3,476 | 2,415 | 44 | ||||||||||
| Advisory and other fees | 785 | 377 | 448 | 108 | 75 | 1,900 | 1,475 | 29 | ||||||||||
| Total investment banking | 1,955 | 1,052 | 1,185 | 86 | 65 | 5,376 | 3,890 | 38 | ||||||||||
| Fixed income | 2,755 | 2,137 | 1,566 | 29 | 76 | 9,598 | 7,004 | 37 | ||||||||||
| Equity | 1,596 | 1,062 | 1,021 | 50 | 56 | 5,881 | 4,340 | 36 | ||||||||||
| Total trading | 4,351 | 3,199 | 2,587 | 36 | 68 | 15,479 | 11,344 | 36 | ||||||||||
| Other (including loan portfolio) | (221) | (60) | (37) | 268 | 497 | (386) | 313 | – | ||||||||||
| Net revenues | 6,085 | 4,191 | 3,735 | 45 | 63 | 20,469 | 15,547 | 32 | ||||||||||
| Total investment banking revenues include debt underwriting, equity underwriting and advisory and other fees. In the fourth quarter of 2006, investment banking revenues were a record CHF 1,955 million, up CHF 770 million, or 65%, compared to the fourth quarter of 2005, reflecting record revenues in all key businesses, which were positively impacted by favorable market conditions, high levels of deal activity and volumes and improved market share in certain products in the quarter. For the full year 2006, total investment banking revenues were also a record CHF 5,376 million, up CHF 1,486 million, or 38%, from the full year 2005. These results reflected Credit Suisse’s participation in several high profile transactions, certain improvements in market share and an increase in the breadth and diversity of the business. Credit Suisse's emerging markets business demonstrated increased strength during the year with a number one market share ranking in equity issuance and announced mergers and acquisitions in Latin America for the full year 2006 and its recognition as the "China Equity House" from International Financing Review’s Asia Awards 2006. |
| Debt underwriting revenues were CHF 686 million in the fourth quarter of 2006, up CHF 292 million, or 74%, compared to the fourth quarter of 2005. These results primarily reflected significantly higher revenues in leveraged finance, which benefited from higher industry-wide issuance volumes, improved market share and continued strength in the financial sponsor client base. During the quarter, Credit Suisse executed the combined high-yield bond offering and syndicated loan facility in connection with the leveraged buyout of Freescale Semiconductor by a private equity consortium, representing the largest amount of high-yield net new money raised in a single day. The investment grade capital markets business had good revenue growth compared to the fourth quarter of 2005, in line with the focus on profitability in this business. For the full year 2006, debt underwriting revenues were CHF 2,206 million, up CHF 722 million, or 49%, compared to the full year 2005, due primarily to more favorable market conditions and increased market share. For the full year 2006, Credit Suisse ranked third in global high-yield securities new issuance volumes. |
| Equity underwriting revenues in the fourth quarter of 2006 were CHF 484 million, up CHF 141 million, or 41%, compared to the fourth quarter of 2005, primarily reflecting higher industry-wide equity issuance activity and improved global equity market share. For the full year 2006, equity underwriting revenues were CHF 1,270 million, up CHF 339 million, or 36%, from the full year 2005, primarily reflecting record industry-wide equity issuance volumes resulting from improvement in both the initial public offering and convertibles markets. Credit Suisse ranked fourth in global initial public offering market share for the full year 2006, down from first in the full year 2005, despite its higher global initial public offering new issuance volumes in 2006 in line with industry trends. Credit Suisse also maintained a leading position in financial sponsor-backed equity offerings. During the quarter, Credit Suisse was a joint bookrunner in the largest initial public offering to date for the Industrial and Commercial Bank of China Limited, China’s leading commercial bank, and also participated in a number of other key equity transactions across a broad range of industries and geographies. The Banker magazine's annual Investment Banking Awards 2006 recognized Credit Suisse as the "Best Bank of the Year for IPOs." In Europe, Credit Suisse was presented with the "European IPO House of the Year” award in the annual Financial News Awards for Excellence in Investment Banking for 2006. |
| Advisory and other fees were CHF 785 million in the fourth quarter of 2006, up CHF 337 million, or 75%, compared to the fourth quarter of 2005, due primarily to increased activity and a number of high-fee transactions in the fourth quarter of 2006. Credit Suisse ranked fourth in global announced mergers and acquisitions and seventh in global completed mergers and acquisitions in the fourth quarter of 2006, up from thirteenth and eighth, respectively, in the fourth quarter of 2005. Notable transactions announced in the fourth quarter of 2006 reflected the breadth of Credit Suisse’s advisory business and included Google, Inc.’s acquisition of YouTube, the sale of Raytheon Aircraft Company to Hawker Beechcraft Corporation and the acquisition of Corus Group plc by Tata Steel. For the full year 2006, advisory and other fees increased CHF 425 million, or 29%, to CHF 1,900 million compared to the full year 2005, primarily due to a significant increase in industry-wide activity and increased market share. For the full year 2006, Credit Suisse ranked sixth in global announced mergers and acquisitions, up from tenth for the full year 2005 and reflecting the largest market share increase among the top ten ranked banks. For the full year 2006, Credit Suisse ranked eighth in global completed mergers and acquisitions, with improved market share from the full year 2005. The advisory and other fees results also reflected significantly higher revenues from the private fund group, which raises capital for hedge funds, private equity funds and real estate funds. |
| Total trading revenues include results from fixed income and equity sales and trading. Total trading revenues for the fourth quarter of 2006 were CHF 4,351 million, up CHF 1,764 million, or 68%, compared to the fourth quarter of 2005, due to strong performance in both fixed income and equity trading. For the full year 2006, total trading revenues were CHF 15,479 million, up CHF 4,135 million, or 36%, compared to the full year 2005. |
| Investment Banking’s average daily VaR in the fourth quarter of 2006 was CHF 71 million, flat from the fourth quarter of 2005 and down from CHF 80 million in the third quarter of 2006. Compared to the third quarter of 2006, average daily VaR decreased mainly due to reduced equity and interest rate exposures, although commodity risk increased. Average economic risk capital increased CHF 2.4 billion to CHF 16.9 billion, compared to the fourth quarter of 2005, in line with the strategy to extend incremental capital to support high-growth and high-margin activities. |
| Fixed income trading generated revenues of CHF 2,755 million in the fourth quarter of 2006, up CHF 1,189 million, or 76%, compared to the fourth quarter of 2005. These results reflected the second highest level of fixed income trading revenues for a quarter and primarily reflected higher revenues in the commercial mortgage-backed securities, emerging markets trading, global foreign exchange and leveraged finance businesses. Credit spreads remained narrow in the quarter resulting in continued liquidity in the marketplace and solid activity levels. The commercial mortgage-backed securities business was positively impacted by a number of large deals in the quarter. Investment Banking continued to expand its residential mortgage-backed securities business, and revenues in the fourth quarter of 2006 were flat compared to the fourth quarter of 2005, despite softer US market conditions. The high-yield market had significant new issue supply in the quarter which benefited the trading results in the leveraged finance business. In addition, the commodities business continued its revenue growth in the fourth quarter. For the full year 2006, fixed income trading recorded revenues of CHF 9,598 million, an increase of CHF 2,594 million, or 37%, from the full year 2005, due primarily to strong performance in the commercial mortgage-backed securities, global foreign exchange and leveraged finance businesses. |
| Equity trading revenues of CHF 1,596 million increased CHF 575 million, or 56%, compared to the fourth quarter of 2005, due primarily to higher revenues in the derivatives and cash businesses and equity proprietary trading. These results reflected the second highest level of equity trading revenues for a quarter. The derivatives business improved significantly from the weak performance in the fourth quarter of 2005 and the uneven performance in the third quarter of 2006. Market conditions in the derivatives business improved in the US and Asia in the fourth quarter of 2006, and the business had high levels of client-driven activity. The cash businesses benefited from an increase in deal activity in most regions, stronger secondary markets and continued strong performance from the advanced execution services business. Equity proprietary trading had a strong performance across most strategies and regions amid positive market conditions. For the full year 2006, equity trading had revenues of CHF 5,881 million, up CHF 1,541 million, or 36%, compared to the full year 2005, due primarily to higher revenues in the cash, convertibles and derivatives businesses. Credit Suisse was ranked number one among high-touch clients in Institutional Investor’s 2006 All-America Research Team analyst rankings. |
| Primarily as a result of losses on credit default swaps used to hedge the loan portfolio, other (including loan portfolio) had a loss of CHF 221 million in the fourth quarter of 2006 compared to a loss of CHF 37 million in the fourth quarter of 2005, which reflected gains on credit default swaps. For the full year 2006, other (including loan portfolio) had losses of CHF 386 million compared to revenues of CHF 313 million for the full year 2005. These results reflected lower gains from private equity-related investments not managed as part of Asset Management and losses on credit default swaps used to hedge the loan portfolio compared to gains on such credit default swaps in 2005. |
| The following tables present key information of the Investment Banking segment: | ||||||||||||
| 12 months | ||||||||||||
| 4Q 2006 | 3Q 2006 | 4Q 2005 | 2006 | 2005 | ||||||||
| Cost/income ratio | 61.2% | 82.4% | 92.7% | 71.1% | 90.2% | |||||||
| Pre-tax income margin | 38.5% | 18.1% | 7.7% | 29.1% | 10.3% | |||||||
| Compensation/revenue ratio | 42.2% | 53.5% | 57.2% | 50.1% | 55.5% | |||||||
| Average economic risk capital, in CHF m | 16,853 | 15,811 | 14,429 | 15,853 | 12,581 | |||||||
| Pre-tax return on average economic risk capital1) | 58.2% | 21.9% | 10.8% | 40.3% | 15.4% | |||||||
| Average one-day, 99% VaR, in CHF m | 71 | 80 | 71 | 79 | 66 | |||||||
| 1) Calculated using a return excluding interest costs for allocated goodwill. | ||||||||||||
| 31.12.06 | 30.09.06 | 31.12.05 | Change in % from 30.09.06 | Change in % from 31.12.05 | ||||||||
| Total loans, in CHF m | 44,285 | 42,309 | 34,762 | 5 | 27 | |||||||
| Non-performing loans/total loans | 0.3% | 0.5% | 0.4% | – | – | |||||||
| Impaired loans/total loans | 0.4% | 0.6% | 1.5% | – | – | |||||||
 |
 |
 |
Private Banking |
| Private Banking provides comprehensive advice and a broad range of investment products and services tailored to the complex needs of high-net-worth individuals all over the world through its Wealth Management business. In Switzerland, Private Banking provides banking products and services to business and retail clients through its Corporate & Retail Banking business. |
| Private Banking reported income from continuing operations before taxes of CHF 1,143 million in the fourth quarter of 2006, CHF 117 million, or 11%, above the fourth quarter of 2005. The good result was primarily driven by strong revenues, which were the second best quarterly revenues despite the seasonal slowdown in December. The fourth quarter of 2006 was characterized by good equity markets, which led to strong client activity. Net revenues for the fourth quarter of 2006 were CHF 2,973 million, up CHF 257 million, or 9%, compared to the fourth quarter of 2005. This growth was mainly from higher commissions and fees and net interest income. Total operating expenses of CHF 1,871 million in the fourth quarter of 2006 increased CHF 160 million, or 9%, compared to the fourth quarter of 2005. This increase was mainly driven by ongoing strategic investments in international growth in the Wealth Management business and new business initiatives in Corporate & Retail Banking. In addition, there were higher performance-related compensation expenses. Full year 2006 income from continuing operations before taxes was a record CHF 4,596 million, CHF 630 million, or 16%, higher than in 2005, reflecting an increase in net revenues of CHF 1,183 million, or 11%, and an increase in total operating expenses of CHF 555 million, or 8%, compared to full year 2005. Assets under management were CHF 940.3 billion as of December 31, 2006 compared to CHF 837.6 billion as of December 31, 2005, an increase of 12.3%, reflecting strong asset generation and higher equity valuations, offset in part by the adverse impact of foreign exchange-related movements, mainly the weaker US dollar. Net new assets were CHF 9.7 billion in the fourth quarter of 2006, leading to full year 2006 net new assets of CHF 52.2 billion, CHF 1.8 billion, or 3.6%, above the record level attained for 2005. |
| Credit Suisse remains focused on its strategy to provide more value to its clients through its integrated bank model, actively growing its global footprint and maintaining a market leading position in the Wealth Management business. During the fourth quarter of 2006, Credit Suisse announced additional onshore operations in the high-growth market of Brazil through the acquisition of Hedging-Griffo. Hedging-Griffo is a leading asset management company with a large and well-established client base and also serves high-net-worth individuals through its private banking platform in Brazil. In addition to increasing the scope and geographic reach of its franchise, Credit Suisse is also dedicated to providing more value to its clients through the continuing improvement of its existing services and new, innovative products. In response to client demand, Private Banking introduced more than 350 products in the fourth quarter of 2006, particularly tailor-made solutions in structured investments. Corporate & Retail Banking relaunched its consumer financing business in the fourth quarter of 2006 through BANK-now, a specialized bank which serves as a supplier of consumer credit and car leasing in Switzerland. Credit Suisse established BANK-now to provide a more targeted response to the Swiss consumer financing needs, a market which has grown between 3% and 5% per annum over the last few years. |
| In the fourth quarter of 2006, Private Banking had strong net revenues of CHF 2,973 million, which were CHF 257 million, or 9%, higher than in the fourth quarter of 2005. The increase in revenues was mainly driven by higher commissions and fees of CHF 1,702 million, which were up CHF 167 million, or 11%, primarily from higher brokerage and issuing fees due to stronger client activity. In addition, asset-based commissions and fees increased due to the higher level of assets under management. Net interest income increased CHF 146 million, or 16%, largely due to an increase in liability margins and volumes partially offset by asset margin pressure. Full year 2006 net revenues were CHF 11,678 million, an increase of CHF 1,183 million, or 11%, compared to 2005, primarily reflecting higher commissions and fees and net interest income. |
| Provisions for credit losses benefited from the continued favorable credit environment, resulting in net releases of CHF 41 million in the fourth quarter of 2006, compared to net releases of CHF 21 million in the fourth quarter of 2005. For the full year 2006, net releases of provisions for credit losses amounted to CHF 73 million, compared to net releases of CHF 71 million for 2005. |
| Private Banking had total operating expenses of CHF 1,871 million for the fourth quarter of 2006, an increase of CHF 160 million, or 9%, compared to the fourth quarter of 2005. Compensation and benefits increased CHF 149 million, or 17%, driven by higher personnel expenses related to strategic investments in Wealth Management’s global franchise and higher performance-related compensation expenses. The increase in performance-related compensation expenses was due to the improved results and the decision taken in the third quarter of 2006 to extend vesting for performance-related stock awards earned in 2006 and granted in 2007. The equivalent decision was taken in the fourth quarter of 2005, leading to lower compensation expenses as a result of a higher portion of deferred compensation. Other expenses increased CHF 11 million, or 1%, compared to the fourth quarter of 2005. Total operating expenses for the full year 2006 increased CHF 555 million, or 8%, to CHF 7,155 million, mainly reflecting strategic investments in Wealth Management’s global franchise and higher performance-related compensation expenses in line with the better results. |
| Private Banking reported a pre-tax income margin of 38.4% for the fourth quarter of 2006, an increase of 0.6 percentage points compared to the fourth quarter of 2005, as increased revenues and higher releases of credit provisions outpaced the growth in operating expenses. The full year 2006 pre-tax income margin increased 1.6 percentage points to 39.4% compared to 2005, primarily reflecting the strong increase in net revenues. As of December 31, 2006, assets under management for Private Banking totaled CHF 940.3 billion, an increase of CHF 102.7 billion, or 12.3%, compared to December 31, 2005. This increase was due to strong asset generation and higher equity valuations, offset in part by the adverse impact of foreign exchange-related movements, mainly the weaker US dollar. |
| The following table presents the results of the Private Banking segment: | ||||||||||||||||||
| 12 months | ||||||||||||||||||
| in CHF m | 4Q 2006 | 3Q 2006 | 4Q 2005 | Change in % from 3Q 2006 | Change in % from 4Q 2005 | 2006 | 2005 | Change in % from 2005 | ||||||||||
| Net interest income | 1,070 | 1,009 | 924 | 6 | 16 | 4,095 | 3,716 | 10 | ||||||||||
| Commissions and fees | 1,702 | 1,508 | 1,535 | 13 | 11 | 6,623 | 5,812 | 14 | ||||||||||
| Trading revenues | 151 | 124 | 236 | 22 | (36) | 751 | 793 | (5) | ||||||||||
| Other revenues | 50 | 41 | 21 | 22 | 138 | 209 | 174 | 20 | ||||||||||
| Total noninterest revenues | 1,903 | 1,673 | 1,792 | 14 | 6 | 7,583 | 6,779 | 12 | ||||||||||
| Net revenues | 2,973 | 2,682 | 2,716 | 11 | 9 | 11,678 | 10,495 | 11 | ||||||||||
| Provision for credit losses | (41) | (19) | (21) | 116 | 95 | (73) | (71) | 3 | ||||||||||
| Compensation and benefits | 1,037 | 910 | 888 | 14 | 17 | 4,038 | 3,588 | 13 | ||||||||||
| Other expenses | 834 | 769 | 823 | 8 | 1 | 3,117 | 3,012 | 3 | ||||||||||
| Total operating expenses | 1,871 | 1,679 | 1,711 | 11 | 9 | 7,155 | 6,600 | 8 | ||||||||||
| Income from continuing operations before taxes | 1,143 | 1,022 | 1,026 | 12 | 11 | 4,596 | 3,966 | 16 | ||||||||||
| The following tables present key information of the Private Banking segment: | ||||||||||||
| 12 months | ||||||||||||
| 4Q 2006 | 3Q 2006 | 4Q 2005 | 2006 | 2005 | ||||||||
| Cost/income ratio | 62.9% | 62.6% | 63.0% | 61.3% | 62.9% | |||||||
| Pre-tax income margin | 38.4% | 38.1% | 37.8% | 39.4% | 37.8% | |||||||
| Net new assets, in CHF bn | 9.7 | 11.1 | 8.9 | 52.2 | 50.4 | |||||||
| Average economic risk capital, in CHF m | 4,304 | 4,466 | 4,743 | 4,525 | 4,714 | |||||||
| Pre-tax return on average economic risk capital1) | 108.2% | 93.4% | 88.2% | 103.4% | 85.5% | |||||||
| 1) Calculated using a return excluding interest costs for allocated goodwill. | ||||||||||||
| 31.12.06 | 30.09.06 | 31.12.05 | Change in % from 30.09.06 | Change in % from 31.12.05 | ||||||||
| Assets under management, in CHF bn | 940.3 | 904.2 | 837.6 | 4.0 | 12.3 | |||||||
 |
 |
Wealth Management |
| Wealth Management reported income from continuing operations before taxes of CHF 811 million for the fourth quarter of 2006, up CHF 108 million, or 15%, from the fourth quarter of 2005. Net revenues amounted to CHF 2,077 million in the fourth quarter of 2006, an increase of CHF 209 million, or 11%, compared to the fourth quarter of 2005, mainly from higher commissions and fees from brokerage and product issuances, reflecting the stronger client activity, and higher net interest income from higher liability margins and liability volumes. Net releases of provisions for credit losses in the fourth quarter of 2006 amounted to CHF 17 million, mainly in relation to the resolution of a single exposure. |
| Total operating expenses in the fourth quarter of 2006 of CHF 1,283 million were CHF 120 million, or 10%, higher compared to the fourth quarter of 2005, primarily driven by an increase in compensation and benefits. This increase primarily reflected higher personnel expenses related to strategic investments in the global franchise, and higher performance-related compensation expenses. In the full year 2006, Wealth Management added 115 relationship managers, of which over 40 were added in the fourth quarter, bringing the total number of relationship managers to more than 2,800. The increase in performance-related compensation expenses was due to the improved results and the above mentioned decision to extend vesting for performance-related stock awards taken in the third quarter of 2006. Other expenses were flat compared to the fourth quarter of 2005. Compared to the third quarter of 2006, other expenses increased CHF 37 million, or 7%, reflecting higher commission expenses, project costs associated with the merger of Clariden Leu and higher marketing and sales costs, partly offset by the release of a provision. |
| The pre-tax income margin for the fourth quarter of 2006 was 39.0%, 1.4 percentage points higher compared to the fourth quarter of 2005, driven by the increase in net revenues and net releases of credit provisions, offset in part by higher operating expenses. |
| Full year 2006 income from continuing operations before taxes was CHF 3,237 million, an increase of CHF 576 million, or 22%, compared to 2005. Net revenues were CHF 8,181 million for the full year of 2006, an increase of CHF 1,056 million, or 15%, compared to 2005, primarily due to higher commissions and fees from brokerage and product issuances, reflecting the stronger client activity, increased asset-based commissions due to increased assets under management and higher net interest income, largely due to an increase in liability margins and volumes. Total operating expenses for the full year 2006 increased CHF 524 million, or 12%, to CHF 4,963 million, primarily reflecting strategic investments in the global franchise and higher performance-related compensation expenses in line with the better results. As a result, the full year 2006 pre-tax income margin improved 2.3 percentage points to 39.6%, reflecting the strong increase in net revenues, which was greater than the increase in expenses primarily from the ongoing strategic investments. |
| During the fourth quarter of 2006, Wealth Management's net new assets amounted to CHF 8.6 billion, mainly driven by inflows in the European onshore business and Asia. This reflected a seasonal slowdown but was an increase of CHF 1.8 billion, or 26.5%, compared to the fourth quarter of 2005. Net new assets for the full year 2006 were a record CHF 50.5 billion, an increase of CHF 7.7 billion, or 18.0%, compared to 2005, and a growth rate of 7.3%, exceeding the 6% mid-term target and showing continued momentum in asset gathering. As of December 31, 2006, assets under management amounted to CHF 784.2 billion, an increase of CHF 90.9 billion, or 13.1%, as a result of strong net new asset growth and higher valuations. The gross margin on assets under management was 108.6 basis points for the fourth quarter of 2006, up 7.9 basis points from the third quarter of 2006, which was impacted by lower transaction-based revenues. The gross margin on assets under management for the full year 2006 was 111.6 basis points, reflecting a slight decrease of 1.0 basis points compared to 2005. This decrease was primarily driven by the decline in the asset-based margin from the slower growth of underlying net interest income compared to the growth in average assets under management and the dilution effect from the continuing strong growth in net new assets. |
| The following table presents the results of the Wealth Management business: | ||||||||||||||||||
| 12 months | ||||||||||||||||||
| in CHF m | 4Q 2006 | 3Q 2006 | 4Q 2005 | Change in % from 3Q 2006 | Change in % from 4Q 2005 | 2006 | 2005 | Change in % from 2005 | ||||||||||
| Net interest income | 488 | 453 | 396 | 8 | 23 | 1,916 | 1,625 | 18 | ||||||||||
| Total noninterest revenues | 1,589 | 1,390 | 1,472 | 14 | 8 | 6,265 | 5,500 | 14 | ||||||||||
| Net revenues | 2,077 | 1,843 | 1,868 | 13 | 11 | 8,181 | 7,125 | 15 | ||||||||||
| Provision for credit losses | (17) | (2) | 2 | – | – | (19) | 25 | – | ||||||||||
| Compensation and benefits | 714 | 629 | 596 | 14 | 20 | 2,780 | 2,367 | 17 | ||||||||||
| Other expenses | 569 | 532 | 567 | 7 | 0 | 2,183 | 2,072 | 5 | ||||||||||
| Total operating expenses | 1,283 | 1,161 | 1,163 | 11 | 10 | 4,963 | 4,439 | 12 | ||||||||||
| Income from continuing operations before taxes | 811 | 684 | 703 | 19 | 15 | 3,237 | 2,661 | 22 | ||||||||||
| The following tables present key information of the Wealth Management business: | ||||||||||||
| 12 months | ||||||||||||
| 4Q 2006 | 3Q 2006 | 4Q 2005 | 2006 | 2005 | ||||||||
| Cost/income ratio | 61.8% | 63.0% | 62.3% | 60.7% | 62.3% | |||||||
| Pre-tax income margin | 39.0% | 37.1% | 37.6% | 39.6% | 37.3% | |||||||
| Net new assets, in CHF bn | 8.6 | 10.9 | 6.8 | 50.5 | 42.8 | |||||||
| Net new asset growth (rolling four quarter average) | 7.3% | 7.2% | 7.5% | 7.3% | 7.5% | |||||||
| Net new asset growth | 4.6% | 6.1% | 4.0% | 7.3% | 7.5% | |||||||
| Gross margin on assets under management | 108.6 bp | 100.7 bp | 109.4 bp | 111.6 bp | 112.6 bp | |||||||
| of which asset-based | 70.0 bp | 69.3 bp | 70.3 bp | 70.8 bp | 72.6 bp | |||||||
| of which transaction-based | 38.6 bp | 31.4 bp | 39.1 bp | 40.8 bp | 40.1 bp | |||||||
| Net margin (pre-tax) on assets under management | 42.4 bp | 37.4 bp | 41.2 bp | 44.1 bp | 42.0 bp | |||||||
| 31.12.06 | 30.09.06 | 31.12.05 | Change in % from 30.09.06 | Change in % from 31.12.05 | ||||||||
| Assets under management, in CHF bn | 784.2 | 753.2 | 693.3 | 4.1 | 13.1 | |||||||
 |
 |
Corporate & Retail Banking |
| Corporate & Retail Banking reported income from continuing operations before taxes of CHF 332 million for the fourth quarter of 2006, up CHF 10 million, or 3%, from the fourth quarter of 2005. Net revenues were CHF 896 million for the fourth quarter of 2006, an increase of CHF 49 million, or 6%, compared to the fourth quarter of 2005. This revenue growth was due to an increase in asset-based commissions and fees and increased net interest income. The increase in net interest income was largely due to an increase in liability margins and asset and liability volumes, partially offset by asset margin pressure. Net releases of provisions for credit losses amounted to CHF 24 million in the fourth quarter of 2006 compared to net releases of CHF 23 million in the fourth quarter of 2005, reflecting the continued favorable credit environment. Corporate & Retail Banking expects reductions in future releases of credit provisions due to a decline in the amount of impaired loans. |
| Total operating expenses in the fourth quarter of 2006 were CHF 588 million, CHF 40 million, or 7%, above the fourth quarter of 2005. This increase was primarily driven by higher compensation and benefits mainly due to higher performance-related compensation expenses in line with the better result. Additionally, the increase in performance-related compensation expenses was due to the above-mentioned decision to extend vesting for performance-related stock awards taken in the third quarter of 2006. Compared to the fourth quarter of 2005, other expenses increased CHF 8 million, or 3%, reflecting costs related to BANK-now and the launch of a new credit card in cooperation with the second largest retailer in Switzerland. Compared to the third quarter of 2006, other expenses increased CHF 28 million, or 12%, also reflecting higher marketing and sales costs. The pre-tax income margin was 37.1% for the fourth quarter of 2006, down 0.9 percentage points compared to the fourth quarter of 2005, as higher net revenues were offset by higher operating expenses. |
| For the full year 2006, income from continuing operations before taxes increased CHF 54 million, or 4%, to CHF 1,359 million compared to 2005. Net revenues increased CHF 127 million, or 4%, to CHF 3,497 million, due to increased net interest income, reflecting higher liability margins, and higher asset-based commissions and fees. Total operating expenses were CHF 2,192 million, an increase of CHF 31 million, or 1%, mainly reflecting higher compensation and benefits. The pre-tax income margin for the full year 2006 was 38.9%, an increase of 0.2 percentage points compared to 2005, driven by higher net revenues. |
| In the fourth quarter of 2006, Corporate & Retail Banking reported a pre-tax return on average economic risk capital of 49.7%, up 7.3 percentage points compared to the fourth quarter of 2005. The full year 2006 pre-tax return on average economic risk capital was 49.0%, an increase of 7.1 percentage points compared to 2005. The increase in both the fourth quarter and for the full year 2006 reflects a decrease in the average economic risk capital, based on the risk profile of the lending portfolio, and indicating strong profitability in a very competitive and mature market. |
| The following table presents the results of the Corporate & Retail Banking business: | ||||||||||||||||||
| 12 months | ||||||||||||||||||
| in CHF m | 4Q 2006 | 3Q 2006 | 4Q 2005 | Change in % from 3Q 2006 | Change in % from 4Q 2005 | 2006 | 2005 | Change in % from 2005 | ||||||||||
| Net interest income | 582 | 556 | 528 | 5 | 10 | 2,179 | 2,092 | 4 | ||||||||||
| Total noninterest revenues | 314 | 283 | 319 | 11 | (2) | 1,318 | 1,278 | 3 | ||||||||||
| Net revenues | 896 | 839 | 847 | 7 | 6 | 3,497 | 3,370 | 4 | ||||||||||
| Provision for credit losses | (24) | (17) | (23) | 41 | 4 | (54) | (96) | (44) | ||||||||||
| Compensation and benefits | 323 | 281 | 291 | 15 | 11 | 1,258 | 1,221 | 3 | ||||||||||
| Other expenses | 265 | 237 | 257 | 12 | 3 | 934 | 940 | (1) | ||||||||||
| Total operating expenses | 588 | 518 | 548 | 14 | 7 | 2,192 | 2,161 | 1 | ||||||||||
| Income from continuing operations before taxes | 332 | 338 | 322 | (2) | 3 | 1,359 | 1,305 | 4 | ||||||||||
| The following tables present key information of the Corporate & Retail Banking business: | ||||||||||||
| 12 months | ||||||||||||
| 4Q 2006 | 3Q 2006 | 4Q 2005 | 2006 | 2005 | ||||||||
| Cost/income ratio | 65.6% | 61.7% | 64.7% | 62.7% | 64.1% | |||||||
| Pre-tax income margin | 37.1% | 40.3% | 38.0% | 38.9% | 38.7% | |||||||
| Net new assets, in CHF bn | 1.1 | 0.2 | 2.1 | 1.7 | 7.6 | |||||||
| Average economic risk capital, in CHF m | 2,683 | 2,816 | 3,041 | 2,781 | 3,122 | |||||||
| Pre-tax return on average economic risk capital1) | 49.7% | 48.1% | 42.4% | 49.0% | 41.9% | |||||||
| 1) Calculated using a return excluding interest costs for allocated goodwill. | ||||||||||||
| 31.12.06 | 30.09.06 | 31.12.05 | Change in % from 30.09.06 | Change in % from 31.12.05 | ||||||||
| Assets under management, in CHF bn | 156.1 | 151.0 | 144.3 | 3.4 | 8.2 | |||||||
| Mortgage loans, in CHF bn | 66.0 | 66.0 | 66.3 | 0.0 | (0.5) | |||||||
| Other loans, in CHF bn | 33.9 | 33.9 | 28.3 | 0.0 | 19.8 | |||||||
| Non-performing loans/total loans | 1.3% | 1.4% | 1.9% | – | – | |||||||
| Impaired loans/total loans | 1.8% | 1.9% | 2.6% | – | – | |||||||
| Number of branches | 215 | 215 | 215 | 0 | 0 | |||||||
 |
 |
Asset Management |
| Asset Management combines the discretionary investment management functions of Credit Suisse and offers products across a broad range of investment classes, from equity, fixed income and multi-asset class products to alternative investments such as real estate, hedge funds, private equity and volatility management. Asset Management manages portfolios, mutual funds and other investment vehicles for institutional, government and private clients. Products are offered through both proprietary and third party distribution channels. |
| Asset Management reported income from continuing operations before taxes of CHF 89 million in the fourth quarter of 2006, a decrease of CHF 152 million, or 63%, from the fourth quarter of 2005, reflecting a decline in net revenues and higher operating expenses. The decrease in net revenues resulted primarily from lower private equity and other investment-related gains compared to the strong fourth quarter of 2005. For the full year 2006, income from continuing operations before taxes was CHF 508 million, a decrease of CHF 498 million, or 50%, from the full year 2005, reflecting lower private equity and other investment-related gains as well as higher operating expenses, partly due to CHF 225 million of realignment costs in 2006. |
| The realignment of Asset Management continued during the fourth quarter of 2006 as part of the previously announced strategy to strengthen its business through repositioning franchises with low profitability, reshaping the product offering, improving investment and sales processes and reducing the overall cost base. Realignment costs of CHF 33 million in the fourth quarter of 2006 included severance costs of CHF 20 million and intangible asset impairments of CHF 13 million. These realignment costs reflect the substantial completion of the targeted headcount reduction. Asset Management is on track to put its business on a solid and sustainable platform for future growth in 2007 and beyond by leveraging existing strengths and improving the product portfolio. |
| The following table presents the results of the Asset Management segment: | ||||||||||||||||||
| 12 months | ||||||||||||||||||
| in CHF m | 4Q 2006 | 3Q 2006 | 4Q 2005 | Change in % from 3Q 2006 | Change in % from 4Q 2005 | 2006 | 2005 | Change in % from 2005 | ||||||||||
| Net interest income | (12) | (14) | (22) | (14) | (45) | (65) | (68) | (4) | ||||||||||
| Commissions and fees | 623 | 581 | 539 | 7 | 16 | 2,329 | 2,076 | 12 | ||||||||||
| Trading revenues | 24 | 16 | 10 | 50 | 140 | 34 | 41 | (17) | ||||||||||
| Other revenues | 103 | 109 | 230 | (6) | (55) | 563 | 752 | (25) | ||||||||||
| Total noninterest revenues | 750 | 706 | 779 | 6 | (4) | 2,926 | 2,869 | 2 | ||||||||||
| Net revenues | 738 | 692 | 757 | 7 | (3) | 2,861 | 2,801 | 2 | ||||||||||
| Provision for credit losses | 1 | (1) | 0 | – | – | 1 | 0 | – | ||||||||||
| Compensation and benefits | 327 | 286 | 252 | 14 | 30 | 1,129 | 947 | 19 | ||||||||||
| Other expenses | 321 | 249 | 264 | 29 | 22 | 1,223 | 848 | 44 | ||||||||||
| of which commission expenses | 110 | 95 | 86 | 16 | 28 | 370 | 295 | 25 | ||||||||||
| Total operating expenses | 648 | 535 | 516 | 21 | 26 | 2,352 | 1,795 | 31 | ||||||||||
| Income from continuing operations before taxes | 89 | 158 | 241 | (44) | (63) | 508 | 1,006 | (50) | ||||||||||
| Asset Management continues to focus on strengthening its presence in key markets and building its investment platform in attractive, high-margin businesses. This was demonstrated in the fourth quarter of 2006 when Credit Suisse announced additional onshore operations in the high-growth market of Brazil, through the acquisition of Hedging-Griffo, a leading asset management company with a large and well-established client base. It manages CHF 9.2 billion in assets under management for high-net worth individuals in Brazil and over the past three years has increased these assets at an average annual growth rate of 38.5%. |
| Assets under management increased from CHF 659.6 billion as of September 30, 2006 to CHF 669.9 billion as of December 31, 2006, primarily reflecting market and foreign exchange-related movements of CHF 13.2 billion. In the fourth quarter, Asset Management had net asset outflows of CHF 2.9 billion, mainly due to cyclical redemptions in US money market funds. Assets under management increased CHF 80.5 billion from CHF 589.4 billion as of December 31, 2005, reflecting net new assets of CHF 50.8 billion and market and foreign exchange-related movements of CHF 29.7 billion. Net new assets for the full year 2006 included money market assets of CHF 33.4 billion and alternative investments of CHF 12.5 billion. These substantial asset inflows demonstrate Asset Management’s asset gathering capabilities despite the realignment. |
| Fourth quarter 2006 net revenues were CHF 738 million, a decrease of CHF 19 million, or 3%, from the fourth quarter of 2005. Net revenues before private equity and other investment-related gains were CHF 646 million, an increase of CHF 97 million, or 18%, compared to the fourth quarter of 2005, reflecting the growth in assets under management. Asset management revenues, which consist of management fees from asset management, performance fees and fund administration services provided to clients, increased CHF 72 million, or 14%, compared to the fourth quarter of 2005, mainly driven by the growth in assets under management and higher year-end performance fees. Private equity commissions and fees, which include private equity fund management fees, increased CHF 25 million, or 53%, compared to the fourth quarter of 2005, primarily reflecting higher placement fees for fund raising commitments in connection with private equity funds. Full year 2006 net revenues before private equity and other investment-related gains were CHF 2,359 million, an increase of CHF 256 million, or 12%, compared to the full year 2005. Full year 2006 asset management revenues increased CHF 197 million, or 10%, compared to full year 2005, reflecting higher assets under management. Full year 2006 private equity commissions and fees increased CHF 59 million, or 30%, compared to full year 2005, reflecting increased placement fees. |
| The following table presents the revenue details of the Asset Management segment: | ||||||||||||||||||
| 12 months | ||||||||||||||||||
| in CHF m | 4Q 2006 | 3Q 2006 | 4Q 2005 | Change in % from 3Q 2006 | Change in % from 4Q 2005 | 2006 | 2005 | Change in % from 2005 | ||||||||||
| Asset management revenues | 574 | 535 | 502 | 7 | 14 | 2,106 | 1,909 | 10 | ||||||||||
| Private equity commissions and fees | 72 | 68 | 47 | 6 | 53 | 253 | 194 | 30 | ||||||||||
| Net revenues before private equityand other investment-related gains | 646 | 603 | 549 | 7 | 18 | 2,359 | 2,103 | 12 | ||||||||||
| Private equity and other investment-related gains | 92 | 89 | 208 | 3 | (56) | 502 | 698 | (28) | ||||||||||
| Net revenues | 738 | 692 | 757 | 7 | (3) | 2,861 | 2,801 | 2 | ||||||||||
| In the fourth quarter of 2006, Asset Management recorded private equity and other investment-related gains of CHF 92 million, a decrease of CHF 116 million, or 56%, from the strong fourth quarter of 2005. Private equity gains, which include gains on investments and performance-related carried interest, are cyclical in nature and in 2005 were considered to be at the high end of the private equity cycle. The fourth quarter of 2006 included a write-down of CHF 36 million on a single investment. Full year 2006 private equity and other investment-related gains were CHF 196 million, or 28%, lower than the strong full year 2005 gains. |
| The following tables present key information of the Asset Management segment: | ||||||||||||
| 12 months | ||||||||||||
| 4Q 2006 | 3Q 2006 | 4Q 2005 | 2006 | 2005 | ||||||||
| Cost/income ratio | 87.8% | 77.3% | 68.2% | 82.2% | 64.1% | |||||||
| Pre-tax income margin | 12.1% | 22.8% | 31.8% | 17.8% | 35.9% | |||||||
| Net new assets, in CHF bn | (2.9) | 21.2 | (0.8) | 50.8 | 19.6 | |||||||
| of which private equity | 0.1 | 1.4 | 1.3 | 6.5 | 4.6 | |||||||
| of which advisory assets | 1.0 | 1.2 | 3.2 | 3.6 | 5.3 | |||||||
| Gross margin on assets under management | 44.2 bp | 43.4 bp | 54.0 bp | 45.3 bp | 54.5 bp | |||||||
| Gross margin on assets under management, excludingprivate equity and other investment-related gains | 38.7 bp | 37.8 bp | 39.1 bp | 37.3 bp | 40.9 bp | |||||||
| Net margin (pre-tax) on assets under management | 5.3 bp | 9.9 bp | 17.2 bp | 8.0 bp | 19.6 bp | |||||||
| Average economic risk capital, in CHF m | 1,436 | 1,438 | 1,276 | 1,382 | 1,097 | |||||||
| Pre-tax return on average economic risk capital1) | 32.4% | 51.8% | 84.3% | 44.7% | 99.9% | |||||||
| 1) Calculated using a return excluding interest costs for allocated goodwill. | ||||||||||||
| in CHF bn | 31.12.06 | 30.09.06 | 31.12.05 | Change in % from 30.09.06 | Change in % from 31.12.05 | |||||||
| Assets under management | 669.9 | 659.6 | 589.4 | 1.6 | 13.7 | |||||||
| Private equity investments | 2.5 | 2.1 | 1.4 | 19.0 | 78.6 | |||||||
| Total operating expenses for the fourth quarter of 2006 were CHF 648 million, an increase of CHF 132 million, or 26%, compared to the same quarter of 2005. Compensation and benefits were CHF 327 million, an increase of CHF 75 million, or 30%, reflecting the ongoing efforts to hire new investment talent and build product development and distribution capabilities. In addition, compensation and benefits included CHF 20 million of severance related to the realignment. Other expenses were CHF 321 million, an increase of CHF 57 million, or 22%, primarily due to higher commission expenses of CHF 24 million, mainly reflecting higher assets under management, a CHF 22 million provision relating to a non-proprietary third-party hedge fund product and intangible asset impairments of CHF 13 million relating to the realignment. Full year 2006 total operating expenses were CHF 2,352 million, an increase of CHF 557 million, or 31%, compared to the full year 2005, reflecting a 19% increase in compensation and benefits and a 44% increase in other expenses, including operating expenses of CHF 225 million relating to the realignment. |
| The following table presents total assets under management of the Asset Management segment by asset class: | ||||||||||||
| in CHF bn | 31.12.06 | 30.09.06 | 31.12.05 | Change in % from 30.09.06 | Change in % from 31.12.05 | |||||||
| Money market | 101.2 | 93.7 | 64.1 | 8.0 | 57.9 | |||||||
| Fixed income | 107.1 | 1) | 118.8 | 110.0 | (9.8) | (2.6) | ||||||
| Balanced | 277.3 | 264.0 | 254.6 | 5.0 | 8.9 | |||||||
| Equities | 47.0 | 47.8 | 47.7 | (1.7) | (1.5) | |||||||
| Alternative2) | 137.3 | 135.3 | 113.0 | 1.5 | 21.5 | |||||||
| of which private equity | 30.2 | 30.6 | 25.5 | (1.3) | 18.4 | |||||||
| Total assets under management | 669.9 | 659.6 | 589.4 | 1.6 | 13.7 | |||||||
| of which discretionary assets | 573.7 | 566.4 | 500.3 | 1.3 | 14.7 | |||||||
| of which advisory assets | 96.2 | 93.2 | 89.1 | 3.2 | 8.0 | |||||||
| 1) Reflects reclassifications of approximately CHF 10 billion to money market assets and balanced assets. 2) Alternative includes private equity, funds of hedge funds, real estate and indexed products. | ||||||||||||
| Pre-tax income margin for the fourth quarter of 2006 was 12.1%, down 19.7 percentage points from the fourth quarter of 2005, chiefly reflecting the 26% increase in fourth quarter 2006 operating expenses and the decline in private equity and other investment-related gains. Full year 2006 pre-tax income margin was 17.8%, an 18.1 percentage point decrease compared to full year 2005, mainly driven by the significant increases in total operating expenses and lower private equity and other investment-related gains. |
| Gross margin on assets under management was 44.2 basis points in the fourth quarter of 2006 compared to 54.0 basis points in the fourth quarter of 2005, reflecting the 56% decrease in private equity and other investment-related gains. Gross margin on assets under management, excluding private equity and other investment-related gains, was 38.7 basis points in the fourth quarter of 2006 compared to 39.1 basis points in the fourth quarter of 2005. Gross margin on assets under management, excluding private equity and other investment-related gains, was 37.3 basis points for the full year 2006 compared to 40.9 basis points for the full year 2005, primarily as a result of the change in asset mix. |
| Pre-tax return on average economic risk capital was 32.4% in the fourth quarter of 2006 compared to 84.3% in the fourth quarter of 2005, reflecting higher position risk from growth initiatives in alternative investments. |
 |
 |
 |
Assets under management |
| Assets under management |
| Assets under management comprise assets which are placed with Group entities for investment purposes and include discretionary and advisory counterparty assets. |
| Discretionary assets are assets for which the customer fully transfers the discretionary power to a Group entity with a management mandate. Advisory assets include assets placed with the Group where the client is provided access to investment advice but retains discretion over investment decisions. |
| As of December 31, 2006, the Group’s assets under management amounted to CHF 1,485.1 billion, an increase of CHF 43.8 billion, or 3.0%, compared to September 30, 2006. Private Banking assets under management increased CHF 36.1 billion in the fourth quarter of 2006, as a result of higher market valuations and net new asset growth. Asset Management reported an increase in assets under management of CHF 10.3 billion, as market and foreign exchange-related movements were offset in part by net asset outflows. |
| Compared to December 31, 2005, the Group’s assets under management increased by CHF 165.7 billion, or 12.6%, as of December 31, 2006. Private Banking recorded an increase in assets under management of CHF 102.7 billion, or 12.3%, from December 31, 2005 due to strong net new asset growth and higher equity valuations, which was offset in part by the adverse impact of foreign exchange-related movements. Asset Management recorded an increase of CHF 80.5 billion, or 13.7%, in assets under management from December 31, 2005, due to net new assets of CHF 50.8 billion and market and foreign exchange-related movements of CHF 29.7 billion. |
| The following table sets forth information on assets under management: | ||||||||||||
| in CHF bn | 31.12.06 | 30.09.06 | 31.12.05 | Change in % from 30.09.06 | Change in % from 31.12.05 | |||||||
| Private Banking | 940.3 | 904.2 | 837.6 | 4.0 | 12.3 | |||||||
| Asset Management | 669.9 | 659.6 | 589.4 | 1.6 | 13.7 | |||||||
| Less assets managed on behalf of other segments | (125.1) | (122.5) | (107.6) | 2.1 | 16.3 | |||||||
| Credit Suisse Group | 1,485.1 | 1,441.3 | 1,319.4 | 3.0 | 12.6 | |||||||
| of which discretionary | 656.2 | 646.5 | 578.4 | 1.5 | 13.5 | |||||||
| of which advisory | 828.9 | 794.8 | 741.0 | 4.3 | 11.9 | |||||||
| The level of assets under management in Investment Banking is not considered a key performance indicator and as a result, Investment Banking balances are no longer included in assets under management. | ||||||||||||
| Client assets |
| Client assets is a broader measure than assets under management as it includes transactional and custody accounts (assets held solely for transaction-related or safekeeping/custody purposes) and assets of corporate clients and public institutions used primarily for cash management or transaction-related purposes. |
| The following table sets forth information on client assets: | ||||||||||||
| in CHF bn | 31.12.06 | 30.09.06 | 31.12.05 | Change in % from 30.09.06 | Change in % from 31.12.05 | |||||||
| Private Banking | 1,069.7 | 1,029.1 | 951.9 | 3.9 | 12.4 | |||||||
| Asset Management | 676.4 | 666.0 | 596.0 | 1.6 | 13.5 | |||||||
| Less client assets managed on behalf of other segments | (125.1) | (122.5) | (107.6) | 2.1 | 16.3 | |||||||
| Credit Suisse Group | 1,621.0 | 1,572.6 | 1,440.3 | 3.1 | 12.5 | |||||||
| The level of assets under management in Investment Banking is not considered a key performance indicator and as a result, Investment Banking balances are no longer included in client assets. | ||||||||||||
| Net new assets |
| Net new assets include individual cash and securities transactions and new or repaid loans. Interest and dividend income credited to clients, commissions, interest and fees charged for banking services are not considered as they do not reflect success in acquiring assets under management. Changes due to currency and market movements as well as asset inflows and outflows due to the acquisition or divestiture of businesses are not part of net new assets. |
| Net new assets were CHF 6.9 billion in the fourth quarter of 2006, a decrease of CHF 24.2 billion compared to the third quarter of 2006. Inflows mainly from the European onshore business and Asia contributed to net new assets of CHF 9.7 billion in Private Banking. In the fourth quarter, Asset Management had net asset outflows of CHF 2.9 billion, in comparison to strong inflows of CHF 21.2 billion in the third quarter of 2006, mainly due to cyclical redemptions in US money market funds. |
| For the full year 2006, the Group recorded net new assets of CHF 95.4 billion, an increase of CHF 38.0 billion compared to full year 2005. Private Banking’s net new assets of CHF 52.2 billion increased by CHF 1.8 billion, or 3.6%, above the record level attained for 2005. Asset Management generated net new assets of CHF 50.8 billion, an increase of CHF 31.2 billion compared to the full year 2005, primarily in money market and alternative investment assets. |
| The following table sets forth information on net new assets: | ||||||||||||
| 12 months | ||||||||||||
| in CHF bn | 4Q 2006 | 3Q 2006 | 4Q 2005 | 2006 | 2005 | |||||||
| Private Banking | 9.7 | 11.1 | 8.9 | 52.2 | 50.4 | |||||||
| Asset Management | (2.9) | 21.2 | (0.8) | 50.8 | 19.6 | |||||||
| Less net new assets managed on behalf of other segments | 0.1 | (1.2) | (0.1) | (7.6) | (12.6) | |||||||
| Credit Suisse Group | 6.9 | 31.1 | 8.0 | 95.4 | 57.4 | |||||||
| The level of assets under management in Investment Banking is not considered a key performance indicator and as a result, Investment Banking balances are no longer included in net new assets. | ||||||||||||
 |
Capital |
| Credit Suisse Group |
| The Group’s consolidated BIS tier 1 ratio was 13.9% as of December 31, 2006, an increase from 10.8% as of September 30, 2006. Risk-weighted assets increased compared to the third quarter of 2006, primarily reflecting an increase in capital requirements in the leveraged finance and commodities trading businesses partially offset by a decrease in market risk equivalents. Tier 1 capital increased CHF 8,017 million from September 30, 2006, with the positive contribution of net income offset by additional dividend accruals and the deduction for shares repurchased through the Group’s share buyback program. In addition, the deduction relating to investment in insurance entities was significantly reduced due to the sale of Winterthur. The Group continued the share buyback program approved by the shareholders at the Annual General Meeting in 2005, repurchasing 76.4 million common shares in the amount of CHF 5.0 billion since the initiation of the program through December 31, 2006. In the fourth quarter of 2006, 13.7 million common shares in the amount of CHF 1.1 billion were repurchased. The Group’s shareholders’ equity increased from CHF 41.6 billion as of September 30, 2006 to CHF 43.6 billion as of December 31, 2006, primarily due to the fourth quarter net income partially offset by the change in US GAAP pension accounting requiring an employer to recognize the funded status of a defined benefit plan on the balance sheet, which reduced shareholders’ equity by CHF 1.8 billion. This change in US GAAP pension accounting had no effect on Tier 1 capital. |
| For further details, see “Notes to the condensed consolidated financial statements - unaudited - Recently adopted accounting standards - SFAS 158.” |
| Credit Suisse |
| Credit Suisse, the bank, reported a consolidated BIS tier 1 ratio of 11.4% as of December 31, 2006 compared to 9.5% as of September 30, 2006. Risk-weighted assets decreased compared to the third quarter of 2006, primarily reflecting a decrease in market risk equivalents partially offset by an increase in capital requirements in the leveraged finance and commodities trading businesses. Tier 1 capital increased CHF 4,294 million from September 30, 2006, with the positive contribution of net income and a reduction in accruals related to future dividend payments. The shareholder’s equity of Credit Suisse increased from CHF 24.4 billion as of September 30, 2006 to CHF 26.0 billion as of December 31, 2006, primarily due to the fourth quarter net income partially offset by the change in US GAAP pension accounting. |
| The following table sets forth details of BIS data (risk-weighted assets, capital and ratios): | ||||||||||||||
| Credit Suisse Group | Credit Suisse | |||||||||||||
| in CHF m, except where indicated | 31.12.06 | 30.09.06 | 31.12.05 | 31.12.06 | 30.09.06 | 31.12.05 | ||||||||
| Risk-weighted positions | 240,095 | 236,448 | 218,899 | 219,927 | 219,060 | 200,904 | ||||||||
| Market risk equivalents | 13,581 | 15,691 | 13,992 | 12,746 | 14,691 | 12,499 | ||||||||
| Risk-weighted assets | 253,676 | 252,139 | 232,891 | 232,673 | 233,751 | 213,403 | ||||||||
| Total shareholders' equity | 43,586 | 41,643 | 42,118 | 26,045 | 24,353 | 25,788 | ||||||||
| Reconciliation to tier 1 capital: | ||||||||||||||
| Non-cumulative perpetual preferred securities | 2,167 | 2,167 | 2,170 | 1,065 | 1,055 | 1,044 | ||||||||
| Investment in insurance entities | (22) | (4,321) | (4,179) | (22) | (13) | (12) | ||||||||
| Adjustments for goodwill, minority interests, disallowed unrealized gains on fair value measurement, own shares, dividend accruals and pensions | (10,584) | (12,359) | (13,761) | (488) | (3,089) | (6,257) | ||||||||
| Tier 1 capital | 35,147 | 27,130 | 26,348 | 26,600 | 22,306 | 20,563 | ||||||||
| Tier 1 ratio | 13.9% | 10.8% | 11.3% | 11.4% | 9.5% | 9.6% | ||||||||
| Total BIS regulatory capital | 46,764 | 33,269 | 31,918 | 38,441 | 33,235 | 29,815 | ||||||||
| Total BIS regulatory capital ratio | 18.4% | 13.2% | 13.7% | 16.5% | 14.2% | 14.0% | ||||||||
| The Swiss Federal Banking Commission has advised that Credit Suisse Group and Credit Suisse may continue to include as tier 1 capital CHF 2.2 billion and CHF 6.2 billion, respectively, as of December 31, 2006 (September 30, 2006: CHF 2.2 billion and CHF 6.3 billion, respectively and December 31, 2005: CHF 2.2 billion and CHF 6.5 billion, respectively) of equity from VIEs that are deconsolidated under FIN 46(R). | ||||||||||||||
Risk management |
| Credit Suisse Group’s overall position risk, measured on the basis of Economic Risk Capital (ERC), increased 9% in the fourth quarter of 2006 compared with the third quarter of 2006. Average Value-at-Risk (VaR) for the Group’s trading books decreased 13% during the fourth quarter of 2006 to CHF 70 million, mainly due to reduced interest rate and equity exposure. The loan portfolios across the Group continued to benefit from a favorable credit environment, resulting in a net release of provisions for credit losses of CHF 20 million in the fourth quarter of 2006. |
| Economic Risk Capital trends |
| The Group assesses risk and economic capital adequacy using its ERC model. ERC is designed to measure all quantifiable risks associated with the Group’s activities on a consistent and comprehensive basis. The Group assigns ERC for position risk, operational risk and other risk. Position risk measures the potential annual economic loss associated with market and credit exposures that is exceeded with a given, small probability (1% for risk management purposes, 0.03% for capital management purposes). It is not a measure of the potential impact on reported earnings, as non-trading activities generally are not marked to market through earnings. |
| The Group continually reviews the methodology used to measure ERC in order to make sure the model remains relevant as markets and business strategies evolve. If the ERC methodology changes based on these reviews, prior period balances are restated in order to show meaningful trends. |
| In the fourth quarter of 2006, the Group's one-year, 99% position risk ERC increased 9% compared to the third quarter of 2006, mainly due to increases in commercial real estate loan originations, interest rate risk on trading positions and emerging market exposures, primarily Eastern Europe and Asia. |
| The following table sets forth the Group's risk profile, using ERC as the common risk measure: | |||||||||
| in CHF m | 31.12.06 | Change in % from 30.09.06 | Change analysis: brief summary 31.12.06 vs 30.09.06 | ||||||
| Fixed income trading ERC1) | 2,692 | 19% | Increased interest rate, foreign exchange and commodity exposures in Investment Banking. | ||||||
| Equity trading & investment ERC | 2,432 | 8% | Due to an increase in funded private equity positions in Asset Management. | ||||||
| Swiss corporate & retail lending ERC | 2,090 | (4%) | Lower due to further improvements in the credit risk profile. | ||||||
| International lending ERC & counterparty ERC | 2,965 | 6% | Higher in Investment Banking due to increased leveraged finance exposure. | ||||||
| Emerging markets ERC | 1,645 | 13% | Increased emerging market exposures in Investment Banking, primarily in Eastern Europe and Asia. | ||||||
| Real estate ERC & structured asset ERC2) | 4,981 | 14% | Increased commercial real estate loan originations and residential loan inventory in Investment Banking. | ||||||
| Simple sum across risk categories | 16,805 | 10% | |||||||
| Diversification benefit | (4,816) | 12% | |||||||
| Position Risk ERC (99%) | 11,989 | 9% | |||||||
| Prior period balances have been restated for methodology changes in order to show meaningful trends. | |||||||||
| 1) This category comprises fixed income trading exposures, foreign exchange exposures, commodity exposures and insurance (investment banking). 2) This category comprises the real estate investments of the Group, commercial and residential real estate and asset-backed securities exposures and real estate acquired at auction. | |||||||||
| The following table sets forth the trading-related market risk exposure for Credit Suisse Group andInvestment Banking, as measured by scaled one-day, 99% VaR: | ||||||||||||||||||||||||||||||
| 4Q 2006 | 3Q 2006 | 4Q 2005 | ||||||||||||||||||||||||||||
| in CHF m | Minimum | Maximum | Average | 31.12.06 | Minimum | Maximum | Average | 30.09.06 | Minimum | Maximum | Average | 31.12.05 | ||||||||||||||||||
| Credit Suisse Group | ||||||||||||||||||||||||||||||
| Interest rate & credit spread | 42 | 63 | 49 | 62 | 43 | 63 | 51 | 46 | 36 | 74 | 57 | 69 | ||||||||||||||||||
| Foreign exchange rate | 9 | 28 | 19 | 24 | 11 | 30 | 20 | 17 | 6 | 19 | 11 | 11 | ||||||||||||||||||
| Equity | 44 | 69 | 57 | 57 | 49 | 73 | 61 | 60 | 40 | 63 | 49 | 57 | ||||||||||||||||||
| Commodity | 6 | 16 | 12 | 15 | 6 | 15 | 9 | 8 | 5 | 15 | 10 | 11 | ||||||||||||||||||
| Diversification benefit | – | 1) | – | 1) | (67) | (69) | – | 1) | – | 1) | (61) | (78) | – | 1) | – | 1) | (58) | (61) | ||||||||||||
| Total | 53 | 99 | 70 | 89 | 53 | 106 | 80 | 53 | 51 | 88 | 69 | 87 | ||||||||||||||||||
| Investment Banking | ||||||||||||||||||||||||||||||
| Interest rate & credit spread | 41 | 63 | 48 | 62 | 41 | 63 | 50 | 43 | 49 | 73 | 60 | 68 | ||||||||||||||||||
| Foreign exchange rate | 8 | 27 | 19 | 24 | 11 | 30 | 20 | 17 | 6 | 20 | 11 | 11 | ||||||||||||||||||
| Equity | 44 | 70 | 57 | 57 | 49 | 73 | 61 | 60 | 40 | 63 | 49 | 57 | ||||||||||||||||||
| Commodity | 6 | 16 | 12 | 15 | 6 | 15 | 9 | 8 | 4 | 15 | 9 | 11 | ||||||||||||||||||
| Diversification benefit | – | 1) | – | 1) | (65) | (69) | – | 1) | – | 1) | (60) | (75) | – | 1) | – | 1) | (58) | (60) | ||||||||||||
| Total | 52 | 100 | 71 | 89 | 53 | 106 | 80 | 53 | 57 | 88 | 71 | 87 | ||||||||||||||||||
| Represents 10-day VaR scaled to a one-day holding period. | ||||||||||||||||||||||||||||||
| 1) As the minimum and maximum occur on different days for different risk types, it is not meaningful to calculate a portfolio diversification benefit. | ||||||||||||||||||||||||||||||
| Trading risks |
| The Group primarily assumes trading risks through the trading activities of the Investment Banking segment. The other segments also engage in trading activities, but to a much lesser extent. Trading risks are measured using VaR as one of a range of risk measurement tools. VaR is the potential loss in fair value of trading positions due to adverse market movements over a defined time horizon and for a specified confidence level. In order to show the aggregate market risk in the Group’s trading books, the table above shows the trading-related market risk on a consolidated basis, as measured by a 10-day VaR scaled to a one-day holding period and based on a 99% confidence level. This means that there is a 1-in-100 chance of incurring a daily mark-to-market trading loss that is at least as large as the reported VaR. |
| Credit Suisse Group’s average one-day, 99% VaR in the fourth quarter of 2006 was CHF 70 million compared to CHF 80 million during the third quarter of 2006. This was mainly due to reduced interest rate and equity exposure. The VaR increased significantly towards the end of the fourth quarter due to increased interest rate, credit and foreign exchange exposure in the fixed income area, as well as increased commodities exposure. Various techniques are used to assess the accuracy of the VaR model, including backtesting. Daily backtesting profit and loss is compared with VaR calculated using a one-day holding period. Backtesting profit and loss is a subset of actual trading revenue and includes only the profit and loss effects due to movements in financial market variables such as interest rates, equity prices and foreign exchange rates on the previous night’s positions. On average, an accurate one-day, 99% VaR model should have no more than four backtesting exceptions per year. A backtesting exception occurs when the daily loss exceeds the daily VaR estimate. |
| Credit Suisse Group had no backtesting exceptions during the fourth quarter of 2006 and four backtesting exceptions for the full year 2006. The four exceptions occurred during the second quarter of 2006, after a period of two years with no exceptions. The exceptions were driven by equity and foreign exchange positions during May. During this period, market volatility for those positions was significantly larger than the volatility reflected in the VaR model, which uses historic data for the preceding two years. The VaR model is also subject to continuous assessment and evaluation to ensure it remains accurate given current market conditions and positions. |
| The histogram entitled “Credit Suisse Group trading revenue” reflects the distribution of daily actual trading revenues during the fourth quarters of 2006 and 2005. The width of this distribution provides another indication of the day-to-day risk in our trading activities. |
 |
 |
| Loan exposure |
| The Group’s total loan exposure increased 1% to CHF 208.1 billion as of December 31, 2006 compared with September 30, 2006, primarily due to increases in loans to financial institutions and real estate loans in Investment Banking. |
| Compared to September 30, 2006, the Group’s total non-performing loans declined 11% and total impaired loans declined 9% as of December 31, 2006. Both Private Banking and Investment Banking reported reductions in total impaired loans during the fourth quarter. |
| In the fourth quarter of 2006, the Group recorded a net release of provisions for credit losses of CHF 20 million, compared to a net release of provisions of CHF 40 million in the third quarter of 2006. The additions, releases and recoveries included in determining the allowance for loan losses are presented in the following tables. |
| Coverage of total impaired loans by valuation allowances at the Group increased from 65% as of September 30 to 70% as of December 31, 2006, while coverage of total non-performing loans improved from 85% to 93%. Improvement was reported in both Private Banking and Investment Banking. |
| The following table sets forth the gross loan exposure for the Group and its primary lending segments: | ||||||||||||||||||||
| Investment Banking | Private Banking | Credit Suisse Group | ||||||||||||||||||
| in CHF m | 31.12.06 | 30.09.06 | 31.12.05 | 31.12.06 | 30.09.06 | 31.12.05 | 31.12.06 | 30.09.06 | 31.12.05 | 1) | ||||||||||
| Consumer loans: | ||||||||||||||||||||
| Mortgages | 0 | 0 | 0 | 76,465 | 75,977 | 75,122 | 76,465 | 75,977 | 80,779 | |||||||||||
| Loans collateralized by securities | 0 | 0 | 0 | 16,197 | 16,846 | 17,203 | 16,197 | 16,846 | 17,207 | |||||||||||
| Other | 1,110 | 991 | 816 | 3,645 | 3,843 | 2,960 | 4,755 | 4,834 | 3,787 | |||||||||||
| Consumer loans | 1,110 | 991 | 816 | 96,307 | 96,666 | 95,285 | 97,417 | 97,657 | 101,773 | |||||||||||
| Corporate loans: | ||||||||||||||||||||
| Real estate | 1,491 | 497 | 508 | 25,770 | 25,265 | 24,728 | 27,261 | 25,762 | 26,597 | |||||||||||
| Commercial & industrial loans | 22,616 | 23,867 | 16,204 | 40,765 | 40,778 | 37,747 | 63,553 | 64,816 | 55,295 | |||||||||||
| Loans to financial institutions | 18,658 | 16,501 | 16,979 | 762 | 747 | 615 | 19,420 | 17,248 | 19,794 | |||||||||||
| Governments and public institutions | 736 | 771 | 784 | 1,216 | 1,251 | 1,380 | 1,952 | 2,022 | 4,389 | |||||||||||
| Corporate loans | 43,501 | 41,636 | 34,475 | 68,513 | 68,041 | 64,470 | 112,186 | 109,848 | 106,075 | |||||||||||
| Loans, gross | 44,611 | 42,627 | 35,291 | 164,820 | 164,707 | 159,755 | 209,603 | 207,505 | 207,848 | |||||||||||
| (Unearned income)/deferred expenses, net | (71) | (63) | (64) | 78 | 84 | 118 | 8 | 21 | 64 | |||||||||||
| Allowance for loan losses | (255) | (255) | (465) | (1,228) | (1,271) | (1,726) | (1,484) | (1,527) | (2,241) | |||||||||||
| Total loans, net | 44,285 | 42,309 | 34,762 | 163,670 | 163,520 | 158,147 | 208,127 | 205,999 | 205,671 | |||||||||||
| This disclosure presents the lending exposure of the Group from a risk management perspective. This presentation differs from other disclosures in this document. | ||||||||||||||||||||
| The following table sets forth the impaired loan portfolio for the Group and its primary lending segments: | ||||||||||||||||||||
| Investment Banking | Private Banking | Credit Suisse Group | ||||||||||||||||||
| in CHF m | 31.12.06 | 30.09.06 | 31.12.05 | 31.12.06 | 30.09.06 | 31.12.05 | 31.12.06 | 30.09.06 | 31.12.05 | 1) | ||||||||||
| Non-performing loans | 152 | 207 | 143 | 895 | 1,002 | 1,157 | 1,047 | 1,209 | 1,323 | |||||||||||
| Non-interest earning loans | 2 | 10 | 11 | 543 | 570 | 830 | 545 | 580 | 845 | |||||||||||
| Total non-performing loans | 154 | 217 | 154 | 1,438 | 1,572 | 1,987 | 1,592 | 1,789 | 2,168 | |||||||||||
| Restructured loans | 0 | 0 | 55 | 22 | 21 | 21 | 22 | 21 | 77 | |||||||||||
| Potential problem loans | 34 | 36 | 303 | 483 | 492 | 726 | 517 | 529 | 1,074 | |||||||||||
| Total other impaired loans | 34 | 36 | 358 | 505 | 513 | 747 | 539 | 550 | 1,151 | |||||||||||
| Total impaired loans, gross | 188 | 253 | 512 | 1,943 | 2,085 | 2,734 | 2,131 | 2,339 | 3,319 | |||||||||||
| Valuation allowances as % of | ||||||||||||||||||||
| Total non-performing loans | 166% | 118% | 302% | 85% | 81% | 87% | 93% | 85% | 103% | |||||||||||
| Total impaired loans | 136% | 101% | 91% | 63% | 61% | 63% | 70% | 65% | 68% | |||||||||||
| The following table sets forth the movements in the allowance for loan losses for the Group and its primary lending segments: | ||||||||||||||||||||
| Investment Banking | Private Banking | Credit Suisse Group | ||||||||||||||||||
| in CHF m | 4Q 2006 | 3Q 2006 | 4Q 2005 | 4Q 2006 | 3Q 2006 | 4Q 2005 | 4Q 2006 | 3Q 2006 | 4Q 2005 | 1) | ||||||||||
| Balance beginning of period | 255 | 376 | 418 | 1,271 | 1,359 | 1,976 | 1,527 | 1,736 | 2,445 | |||||||||||
| Net additions chargedto income statement | 16 | (35) | 5 | (42) | (19) | (20) | (25) | (54) | (9) | |||||||||||
| Gross write-offs | (33) | (111) | (58) | (42) | (82) | (239) | (76) | (192) | (307) | |||||||||||
| Recoveries | 19 | 2 | 81 | 49 | 7 | 6 | 68 | 10 | 86 | |||||||||||
| Net write-offs | (14) | (109) | 23 | 7 | (75) | (233) | (8) | (182) | (221) | |||||||||||
| Allowances acquired/(deconsolidated) and provisions for interest | 3 | 16 | 13 | (5) | 3 | 0 | (1) | 18 | 9 | |||||||||||
| Foreign currency translation impactand other adjustments, net | (5) | 7 | 6 | (3) | 3 | 3 | (9) | 9 | 17 | |||||||||||
| Balance end of period | 255 | 255 | 465 | 1,228 | 1,271 | 1,726 | 1,484 | 1,527 | 2,241 | |||||||||||
| Provision for credit losses disclosed in the Credit Suisse Group unaudited condensed consolidated statements of income also includes provisions for lending-related exposure of CHF 5 million, CHF 14 million and CHF -25 million for 4Q 2006, 3Q 2006 and 4Q 2005, respectively. | ||||||||||||||||||||
| 1) Not adjusted for discontinued operations. | ||||||||||||||||||||
Condensed consolidated financial statements |
Consolidated statements of income (unaudited) |
| 12 months | ||||||||||||||||||
| in CHF m | 4Q 2006 | 3Q 2006 | 4Q 2005 | Change in % from 3Q 2006 | Change in % from 4Q 2005 | 2006 | 2005 | Change in % from 2005 | ||||||||||
| Interest and dividend income | 13,017 | 12,825 | 10,391 | 1 | 25 | 50,269 | 36,116 | 39 | ||||||||||
| Interest expense | (11,590) | (11,218) | (9,085) | 3 | 28 | (43,703) | (29,198) | 50 | ||||||||||
| Net interest income | 1,427 | 1,607 | 1,306 | (11) | 9 | 6,566 | 6,918 | (5) | ||||||||||
| Commissions and fees | 5,069 | 3,919 | 4,044 | 29 | 25 | 17,647 | 14,323 | 23 | ||||||||||
| Trading revenues | 2,956 | 1,693 | 1,286 | 75 | 130 | 9,428 | 5,634 | 67 | ||||||||||
| Other revenues | 1,362 | 857 | 930 | 59 | 46 | 4,962 | 3,614 | 37 | ||||||||||
| Total noninterest revenues | 9,387 | 6,469 | 6,260 | 45 | 50 | 32,037 | 23,571 | 36 | ||||||||||
| Net revenues | 10,814 | 8,076 | 7,566 | 34 | 43 | 38,603 | 30,489 | 27 | ||||||||||
| Provision for credit losses | (20) | (40) | (34) | (50) | (41) | (111) | (144) | (23) | ||||||||||
| Compensation and benefits | 4,100 | 3,427 | 3,984 | 20 | 3 | 15,697 | 13,974 | 12 | ||||||||||
| Other expenses | 2,420 | 2,229 | 2,557 | 9 | (5) | 8,717 | 9,258 | (6) | ||||||||||
| Total operating expenses | 6,520 | 5,656 | 6,541 | 15 | 0 | 24,414 | 23,232 | 5 | ||||||||||
| Income from continuing operations before taxes,minority interests, extraordinary items andcumulative effect of accounting changes | 4,314 | 2,460 | 1,059 | 75 | 307 | 14,300 | 7,401 | 93 | ||||||||||
| Income tax expense | 805 | 367 | (108) | 119 | – | 2,389 | 927 | 158 | ||||||||||
| Minority interests | 910 | 625 | 490 | 46 | 86 | 3,630 | 1,948 | 86 | ||||||||||
| Income from continuing operations beforeextraordinary items and cumulative effectof accounting changes | 2,599 | 1,468 | 677 | 77 | 284 | 8,281 | 4,526 | 83 | ||||||||||
| Income from discontinued operations, net of tax | 2,074 | 424 | 426 | 389 | 387 | 3,070 | 1,310 | 134 | ||||||||||
| Extraordinary items, net of tax | 0 | 0 | 0 | – | – | (24) | 0 | – | ||||||||||
| Cumulative effect of accounting changes, net of tax | 0 | 0 | 0 | – | – | 0 | 14 | (100) | ||||||||||
| Net income | 4,673 | 1,892 | 1,103 | 147 | 324 | 11,327 | 5,850 | 94 | ||||||||||
| 12 months | ||||||||||||
| in CHF | 4Q 2006 | 3Q 2006 | 4Q 2005 | 2006 | 2005 | |||||||
| Basic earnings per share | ||||||||||||
| Income from continuing operations before cumulative effect of accounting changes | 2.42 | 1.35 | 0.59 | 7.53 | 3.98 | |||||||
| Income from discontinued operations, net of tax | 1.93 | 0.39 | 0.39 | 2.79 | 1.18 | |||||||
| Extraordinary items, net of tax | 0.00 | 0.00 | 0.00 | (0.02) | 0.00 | |||||||
| Cumulative effect of accounting changes, net of tax | 0.00 | 0.00 | 0.00 | 0.00 | 0.01 | |||||||
| Net income available for common shares | 4.35 | 1.74 | 0.98 | 10.30 | 5.17 | |||||||
| Diluted earnings per share | ||||||||||||
| Income from continuing operations before cumulative effect of accounting changes | 2.29 | 1.29 | 0.59 | 7.19 | 3.90 | |||||||
| Income from discontinued operations, net of tax | 1.83 | 0.38 | 0.36 | 2.66 | 1.11 | |||||||
| Extraordinary items, net of tax | 0.00 | 0.00 | 0.00 | (0.02) | 0.00 | |||||||
| Cumulative effect of accounting changes, net of tax | 0.00 | 0.00 | 0.00 | 0.00 | 0.01 | |||||||
| Net income available for common shares | 4.12 | 1.67 | 0.95 | 9.83 | 5.02 | |||||||
Consolidated balance sheets (unaudited) |
| in CHF m | 31.12.06 | 30.09.06 | 31.12.05 | Change in % from 30.09.06 | Change in % from 31.12.05 | |||||||
| Assets | ||||||||||||
| Cash and due from banks | 29,040 | 29,802 | 27,577 | (3) | 5 | |||||||
| Interest-bearing deposits with banks | 8,128 | 6,869 | 6,143 | 18 | 32 | |||||||
| Central bank funds sold, securities purchased under resaleagreements and securities borrowing transactions | 319,048 | 337,445 | 352,281 | (5) | (9) | |||||||
| Securities received as collateral | 32,385 | 38,145 | 23,950 | (15) | 35 | |||||||
| Trading assets | 450,780 | 468,654 | 435,250 | (4) | 4 | |||||||
| of which encumbered | 141,404 | 172,706 | 151,793 | (18) | (7) | |||||||
| Investment securities | 21,394 | 21,802 | 121,565 | (2) | (82) | |||||||
| of which encumbered | 54 | 54 | 2,456 | 0 | (98) | |||||||
| Other investments | 20,478 | 19,835 | 20,736 | 3 | (1) | |||||||
| Loans, net | 208,127 | 205,999 | 205,671 | 1 | 1 | |||||||
| Allowance for loan losses | 1,484 | 1,527 | 2,241 | (3) | (34) | |||||||
| Premises and equipment | 5,990 | 5,890 | 7,427 | 2 | (19) | |||||||
| Goodwill | 11,023 | 11,220 | 12,932 | (2) | (15) | |||||||
| Other intangible assets | 476 | 522 | 3,091 | (9) | (85) | |||||||
| Assets of discontinued operations held-for-sale | 0 | 180,784 | 1,378 | (100) | (100) | |||||||
| Other assets | 149,087 | 146,146 | 121,051 | 2 | 23 | |||||||
| of which encumbered | 26,426 | 34,112 | 4,860 | (23) | 444 | |||||||
| Total assets | 1,255,956 | 1,473,113 | 1,339,052 | (15) | (6) | |||||||
| Liabilities and shareholders' equity | ||||||||||||
| Deposits | 388,378 | 390,437 | 364,238 | (1) | 7 | |||||||
| Central bank funds purchased, securities sold under repurchaseagreements and securities lending transactions | 288,444 | 314,531 | 309,803 | (8) | (7) | |||||||
| Obligation to return securities received as collateral | 32,385 | 38,145 | 23,950 | (15) | 35 | |||||||
| Trading liabilities | 198,422 | 212,942 | 194,225 | (7) | 2 | |||||||
| Short-term borrowings | 21,556 | 22,742 | 19,472 | (5) | 11 | |||||||
| of which reported at fair value | 2,764 | 2,882 | – | (4) | – | |||||||
| Provisions from the insurance business | – | – | 145,039 | – | – | |||||||
| Long-term debt | 147,832 | 149,917 | 132,975 | (1) | 11 | |||||||
| of which reported at fair value | 44,709 | 48,946 | – | (9) | – | |||||||
| Liabilities of discontinued operations held-for-sale | 0 | 171,838 | 1,330 | (100) | (100) | |||||||
| Other liabilities | 120,035 | 115,381 | 98,055 | 4 | 22 | |||||||
| Minority interests | 15,318 | 15,537 | 7,847 | (1) | 95 | |||||||
| Total liabilities | 1,212,370 | 1,431,470 | 1,296,934 | (15) | (7) | |||||||
| Share capital | 607 | 607 | 624 | 0 | (3) | |||||||
| Additional paid-in capital | 24,817 | 24,364 | 24,639 | 2 | 1 | |||||||
| Retained earnings | 32,306 | 27,652 | 24,584 | 17 | 31 | |||||||
| Treasury shares, at cost | (9,111) | (7,759) | (5,823) | 17 | 56 | |||||||
| Accumulated other comprehensive income/(loss) | (5,033) | (3,221) | (1,906) | 56 | 164 | |||||||
| Total shareholders' equity | 43,586 | 41,643 | 42,118 | 5 | 3 | |||||||
| Total liabilities and shareholders' equity | 1,255,956 | 1,473,113 | 1,339,052 | (15) | (6) | |||||||
| 31.12.06 | 30.09.06 | 31.12.05 | Change in % from 30.09.06 | Change in % from 31.12.05 | ||||||||
| Additional share information | ||||||||||||
| Par value, in CHF | 0.50 | 0.50 | 0.50 | 0 | 0 | |||||||
| Shares issued | 1,214,862,013 | 1,214,054,870 | 1,247,752,166 | 0 | (3) | |||||||
| Treasury shares | 152,394,952 | 136,710,156 | 122,391,983 | 11 | 25 | |||||||
Consolidated statements of changes in shareholders’ equity (unaudited) |
| 12 months, in CHF m, except common shares outstanding | Common shares outstanding | Common shares | Additional paid-in capital | Retained earnings | Common shares in treasury at cost | Accumulated other com- prehensive income/(loss) | Total | |||||||||
| Balance January 1, 2005 | 1,110,819,481 | 607 | 23,435 | 20,501 | (4,547) | (3,723) | 36,273 | |||||||||
| Net income | – | – | – | 5,850 | – | – | 5,850 | |||||||||
| Other comprehensive income, net of tax | – | – | – | – | – | 1,817 | 1,817 | |||||||||
| Issuance of common shares | 33,845,949 | 17 | 1,225 | – | – | – | 1,242 | |||||||||
| Issuance of treasury shares | 204,885,180 | – | (40) | – | 10,792 | – | 10,752 | |||||||||
| Repurchase of treasury shares | (265,256,516) | – | – | – | (13,929) | – | (13,929) | |||||||||
| Share-based compensation | 41,066,089 | – | 19 | – | 1,861 | – | 1,880 | |||||||||
| Cash dividends paid | – | – | – | (1,767) | – | – | (1,767) | |||||||||
| Balance December 31, 2005 | 1,125,360,183 | 624 | 24,639 | 24,584 | (5,823) | (1,906) | 42,118 | |||||||||
| Balance January 1, 2006 | 1,125,360,183 | 1) | 624 | 24,639 | 24,584 | (5,823) | (1,906) | 42,118 | ||||||||
| Net income | – | – | – | 11,327 | – | – | 11,327 | |||||||||
| Cumulative effect of accounting changes, net of tax | – | – | – | 41 | – | (1,778) | (1,737) | |||||||||
| Other comprehensive income/(loss), net of tax | – | – | – | – | – | (1,349) | (1,349) | |||||||||
| Issuance of common shares | 1,109,847 | – | 48 | – | – | – | 48 | |||||||||
| Cancellation of repurchased shares2) | – | (17) | (608) | (1,316) | 1,941 | – | 0 | |||||||||
| Issuance of treasury shares | 238,906,412 | – | (67) | – | 17,352 | – | 17,285 | |||||||||
| Repurchase of treasury shares | (323,036,898) | 3) | – | – | – | (23,461) | – | (23,461) | ||||||||
| Share-based compensation | 20,127,517 | – | 805 | – | 880 | – | 1,685 | |||||||||
| Cash dividends paid | – | – | – | (2,330) | – | – | (2,330) | |||||||||
| Balance December 31, 2006 | 1,062,467,061 | 4) | 607 | 24,817 | 32,306 | (9,111) | (5,033) | 43,586 | ||||||||
| 1) At par value CHF 0.50 each, fully paid, net of 122,391,983 treasury shares. In addition to the treasury shares, a maximum of 217,698,047 unissued shares (conditional and authorized capital) were available for issuance without further approval of the shareholders. 2) 34,000,000 treasury shares were cancelled in the third quarter of 2006. 3) Includes 50,282,800 shares repurchased in connection with Credit Suisse Group's share buyback program. 4) At par value CHF 0.50 each, fully paid, net of 152,394,952 treasury shares. In addition to the treasury shares, a maximum of 198,476,240 unissued shares (conditional and authorized capital) were available for issuance without further approval of the shareholders. | ||||||||||||||||
Comprehensive income (unaudited) |
| 12 months | ||||||||||||
| in CHF m | 4Q 2006 | 3Q 2006 | 4Q 2005 | 2006 | 2005 | |||||||
| Net income | 4,673 | 1,892 | 1,103 | 11,327 | 5,850 | |||||||
| Adoption of SFAS 158, net of tax | (1,778) | – | – | (1,778) | – | |||||||
| Other comprehensive income/(loss), net of tax | (34) | 1,136 | 75 | (1,349) | 1,817 | |||||||
| Comprehensive income | 2,861 | 3,028 | 1,178 | 8,200 | 7,667 | |||||||
Consolidated statements of cash flows (unaudited) |
| 12 months | ||||||
| in CHF m | 2006 | 2005 | ||||
| Operating activities of continuing operations | ||||||
| Net income | 11,327 | 5,850 | ||||
| (Income)/loss from discontinued operations, net of tax | (3,070) | (1,310) | ||||
| Income from continuing operations | 8,257 | 4,540 | ||||
| Adjustments to reconcile net income to net cash provided by/(used in) operating activities of continuing operations | ||||||
| Impairment, depreciation and amortization | 1,029 | 938 | ||||
| Provision for credit losses | (111) | (144) | ||||
| Deferred tax provision | 646 | (582) | ||||
| Share of net income from equity method investments | (24) | (123) | ||||
| Cumulative effect of accounting changes, net of tax | 0 | (14) | ||||
| Trading assets and liabilities | (26,113) | (7,310) | ||||
| (Increase)/decrease in accrued interest, fees receivable and other assets | (61,793) | (29,962) | ||||
| Increase/(decrease) in accrued expenses and other liabilities | 28,561 | 5,677 | ||||
| Other, net | 1,003 | 674 | ||||
| Total adjustments | (56,802) | (30,846) | ||||
| Net cash provided by/(used in) operating activities of continuing operations | (48,545) | (26,306) | ||||
| Investing activities of continuing operations | ||||||
| (Increase)/decrease in interest-bearing deposits with banks | (2,580) | (1,435) | ||||
| (Increase)/decrease in central bank funds sold, securities purchased under resale agreements and securities borrowing transactions | 8,931 | (47,115) | ||||
| Purchase of investment securities | (2,980) | (14,280) | ||||
| Proceeds from sale of investment securities | 1,256 | 413 | ||||
| Maturities of investment securities | 5,035 | 7,599 | ||||
| Investments in subsidiaries and other investments | (6,209) | (2,486) | ||||
| Proceeds from sale of other investments | 2,100 | 1,655 | ||||
| (Increase)/decrease in loans | (23,159) | (18,235) | ||||
| Proceeds from sales of loans | 3,142 | 2,158 | ||||
| Capital expenditures for premises and equipment and other intangible assets | (1,530) | (977) | ||||
| Proceeds from sale of premises and equipment and other intangible assets | 34 | 54 | ||||
| Other, net | (86) | 278 | ||||
| Net cash provided by/(used in) investing activities of continuing operations | (16,046) | (72,371) | ||||
Consolidated statements of cash flows - continued (unaudited) |
| 12 months | ||||||
| in CHF m | 2006 | 2005 | ||||
| Financing activities of continuing operations | ||||||
| Increase/(decrease) in deposits | 38,533 | 44,649 | ||||
| Increase/(decrease) in short-term borrowings | 3,091 | 2,194 | ||||
| Increase/(decrease) in central bank funds purchased, securities sold under repurchase agreements and securities lending transactions | (1,416) | 37,065 | ||||
| Issuances of long-term debt | 75,921 | 54,415 | ||||
| Repayments of long-term debt | (51,295) | (34,739) | ||||
| Issuances of common shares | 48 | 4 | ||||
| Issuances of treasury shares | 17,285 | 10,752 | ||||
| Repurchase of treasury shares | (23,461) | (13,929) | ||||
| Dividends paid/capital repayments (including minority interests and trust preferred securities) | (2,346) | (1,782) | ||||
| Other, net | 2,703 | 1,395 | ||||
| Net cash provided by/(used in) financing activities of continuing operations | 59,063 | 100,024 | ||||
| Effect of exchange rate changes on cash and due from banks | (515) | 3,929 | ||||
| Discontinued operations | ||||||
| Net cash provided by/(used in) operating activities of discontinued operations | (38) | 5,464 | ||||
| Net cash provided by/(used in) investing activities of discontinued operations | (4,424) | (7,812) | ||||
| Net cash provided by/(used in) financing activities of discontinued operations | (332) | (999) | ||||
| Proceeds from sale of stock | 12,300 | 0 | ||||
| Net increase/(decrease) in cash and due from banks | 1,463 | 1,929 | ||||
| Cash and due from banks at beginning of period | 27,577 | 25,648 | ||||
| Cash and due from banks at end of period | 29,040 | 27,577 | ||||
| Supplemental disclosures of cash flow information (unaudited) | ||||||
| 12 months | ||||||
| in CHF m | 2006 | 2005 | ||||
| Cash paid during the year for income taxes | 1,774 | 2,086 | ||||
| Cash paid during the year for interest | 42,519 | 28,283 | ||||
| Assets acquired and liabilities assumed in business acquisitions | ||||||
| Fair value of assets acquired | 199 | 729 | ||||
| Fair value of liabilities assumed | 60 | 549 | ||||
| Assets and liabilities sold in business divestitures | ||||||
| Assets sold | 183,691 | 0 | ||||
| Liabilities sold | 174,694 | 0 | ||||
Notes to the condensed consolidated financial statements - unaudited |
Summary of significant accounting policies |
| Basis of presentation |
| The accompanying unaudited condensed consolidated financial statements of Credit Suisse Group (the Group) are prepared in accordance with accounting principles generally accepted in the United States of America (US GAAP) and are stated in Swiss francs (CHF). These condensed consolidated financial statements should be read in conjunction with the US GAAP consolidated financial statements and notes thereto for the year ended December 31, 2005, included in Credit Suisse Group’s Annual Report 2005. For a description of the Group’s significant accounting policies, see note 1 “Summary of significant accounting policies” of the aforementioned consolidated financial statements. |
| Due to the Group’s sale of Winterthur, which was completed on December 22, 2006, the results of operations of the Winterthur businesses sold, which were previously reported as a separate segment of the Group, are reflected in Income from discontinued operations, net of tax in the consolidated statements of income for all periods presented. |
| Certain financial information, which is normally included in annual consolidated financial statements prepared in accordance with US GAAP but not required for interim reporting purposes have been condensed or omitted. Certain reclassifications have been made to the prior period’s consolidated financial statements to conform to the current period’s presentation. These condensed consolidated financial statements reflect, in the opinion of management, all adjustments that are necessary for a fair presentation of the condensed consolidated financial statements for the periods presented. |
| In preparing these condensed consolidated financial statements, management is required to make estimates and assumptions, which affect the reported amounts of assets and liabilities and disclosure of contingent assets and liabilities at the date of the condensed consolidated balance sheets and the reported amounts of revenues and expenses during the reporting period. Actual results could differ from those estimates. |
| Recently adopted accounting standards |
| EITF 04-5, FSP SOP 78-9-1 and EITF 96-16 |
| In June 2005, the Financial Accounting Standards Board (FASB) ratified Emerging Issues Task Force (EITF) Issue No. 04-5, “Determining Whether a General Partner, or the General Partners as a Group, Controls a Limited Partnership or Similar Entity When the Limited Partners Have Certain Rights” (EITF 04-5). EITF 04-5 provides a framework for evaluating whether a general partner or a group of general partners controls a limited partnership and therefore should consolidate it. EITF 04-5 states that the presumption of general partner control is overcome only when the limited partners have substantive “kick-out rights” or “participating rights.” These rights would allow a simple majority of the limited partners to dissolve or liquidate the partnership or otherwise remove the general partner “without cause” or effectively participate in significant decisions made in the ordinary course of the partnership business. EITF 04-5 was effective upon ratification for all newly formed limited partnerships and for existing limited partnership agreements that have been modified. This guidance was effective for the Group with respect to existing unmodified partnerships as of January 1, 2006. |
| As a result of the ratification of EITF 04-5, EITF Issue No. 96-16, “Investor’s Accounting for an Investee When the Investor Has a Majority of the Voting Interest but the Minority Shareholder or Shareholders Have Certain Approval or Veto Rights” (EITF 96-16) was updated and FASB Staff Position (FSP) No. SOP 78-9-1, “Interaction of American Institute of Certified Public Accountants (AICPA) Statement of Position (SOP) 78-9 and EITF Issue No. 04-5” (FSP SOP 78-9-1) was issued. The amendments to EITF 96-16 were effective on a prospective basis upon issuance, whereas, similar to EITF 04-5, FSP SOP 78-9-1 was effective upon issuance for all new partnerships formed and for existing partnership agreements modified after June 29, 2005, and was effective for the Group with respect to existing unmodified partnerships as of January 1, 2006. |
| The changes to EITF 96-16 and the provisions of EITF 04-5 and FSP SOP 78-9-1 in effect during 2005 did not have a material impact on the Group’s financial condition, results of operations or cash flows. As of January 1, 2006, the Group increased its assets and liabilities by CHF 8.2 billion, primarily due to the consolidation of certain unmodified private equity partnerships which existed prior to June 29, 2005. |
| SFAS 123R |
| In December 2004, the FASB issued Statement of Financial Accounting Standards (SFAS) No. 123 (Revised 2004), “Share-Based Payment” (SFAS 123R). SFAS 123R was effective for annual reporting periods beginning after June 15, 2005. The Group early adopted SFAS 123R as of January 1, 2005, applying the modified prospective method. The Group’s policy is to expense share-based awards over the requisite service period. |
| The most significant accounting implications of the adoption of SFAS 123R for the Group were as follows: (i) inclusion of forfeitures in the estimate of compensation expense determined at the grant date rather than as they occur. The Group recorded a cumulative adjustment of approximately CHF 14 million during the first quarter of 2005 to reverse the expense previously recognized on all outstanding unvested awards expected to be forfeited. For new grants after January 1, 2005, forfeitures have been included in the initial estimation of the compensation expense at the grant date; (ii) recognition of compensation cost for all outstanding unvested awards as of January 1, 2005 that were previously accounted for under APB 25 and for which no expense was previously recognized, based on the original grant-date fair value of each award over the remaining requisite service period of the respective award (the recognition of this expense was not material); and (iii) adoption of changes to the presentation of the statement of cash flows in accordance with the revised standard. |
| In a December 2005 speech, the US Securities and Exchange Commission (SEC) staff provided further guidance on SFAS 123R, relating to accounting for share-based compensation awards subject to a non-competition provision that have scheduled vesting beyond an employee’s eligibility for early retirement. The SEC staff noted that such share-based awards should generally be expensed over the period from the grant date to the date an employee becomes eligible for early retirement, rather than over the entire vesting, or stated service period, unless the non-competition provision and other factors establish an in-substance requisite service period that extends beyond the early retirement date. As a result of the December 2005 guidance, and based on subsequent discussions with the SEC staff, the Group recorded in the fourth quarter of 2005 an incremental expense to reflect the full-year cost of its 2005 share-based awards. This incremental expense reflected the attribution of the total cost of these awards over the period from the grant date to the date the employee becomes eligible for early retirement rather than over the vesting period that ranged from three to five years. |
| The impact of the Group’s change in accounting was to increase fourth quarter and full-year 2005 compensation and benefits by CHF 630 million, and to decrease fourth quarter and full-year 2005 net income by CHF 421 million. This non-cash charge, recorded in the Corporate Center, represented the recognition of compensation expense for share-based awards granted in 2005 that otherwise would have been recorded in the segments, principally Investment Banking, generally over vesting periods of three to five years. |
| The share-based awards granted in March 2006 provide for early retirement eligibility no earlier than two years after the award grant date. These awards will be recorded as compensation expense in the Group’s segments over the period from the grant date of March 2006 to the date an employee becomes eligible for early retirement if earlier than the three to five year vesting period. |
| SFAS 154 |
| In May 2005, the FASB issued SFAS No. 154, “Accounting Changes and Error Corrections, a replacement of APB Opinion No. 20, ‘Accounting Changes’ (APB 20) and FASB Statement No. 3, ‘Reporting Accounting Changes in Interim Financial Statements (an Amendment of APB Opinion No. 28, ‘Interim Financial Reporting’)’” (SFAS 154). SFAS 154 requires retrospective application, unless impracticable, to prior periods’ financial statements for voluntary changes in accounting principles and changes required by an accounting pronouncement in the unusual circumstances in which the pronouncement does not include specific transition provisions. This statement also requires that a change in depreciation, amortization or depletion method for long-lived, nonfinancial assets should be accounted for as a change in accounting estimate effected by a change in accounting principle (i.e., as a retrospective application). The guidance for reporting the correction of an error in previously issued financial statements and the change of an accounting estimate does not change from APB 20. SFAS 154 was effective for the Group as of January 1, 2006. The adoption of SFAS 154 did not have a material impact on the Group’s financial condition, results of operations or cash flows. |
| SFAS 155 |
| In February 2006, the FASB issued SFAS No. 155, “Accounting for Certain Hybrid Financial Instruments” (SFAS 155), which amends SFAS No. 133, “Accounting for Derivative Instruments and Hedging Activities” (SFAS 133) and SFAS No. 140, “Accounting for Transfers and Servicing of Financial Assets and Extinguishments of Liabilities” (SFAS 140). Under SFAS 155, hybrid financial instruments which contain embedded derivatives that would otherwise require bifurcation may be accounted for at fair value, with changes in fair value recognized in the statement of income. The fair value designation may be applied on an instrument-by-instrument basis; however, the election to apply fair value accounting is irrevocable. SFAS 155 is effective for those instruments acquired or issued on or after an entity’s fiscal year beginning after September 15, 2006, with early adoption permitted as of the beginning of a fiscal year for which an entity has not previously issued interim financial statements. SFAS 155 allows limited retrospective application for existing bifurcated hybrid financial instruments. The Group elected to early adopt SFAS 155 as of January 1, 2006, and the impact of adoption was an increase to the Group’s consolidated retained earnings of CHF 33 million, which included gross gains after tax of CHF 119 million and gross losses after tax of CHF 86 million and a corresponding decrease to the Group’s consolidated liabilities of CHF 33 million as of January 1, 2006. |
| SFAS 156 |
| In March 2006, the FASB issued SFAS No. 156, “Accounting for Servicing of Financial Assets” (SFAS 156), which amended SFAS 140. SFAS 156 requires that all separately recognized servicing rights after the effective date be initially measured at fair value and permits separately recognized servicing rights to be accounted for at fair value in subsequent periods with changes in fair value recognized in the statement of income. SFAS 156 permits an irrevocable election to apply fair value measurement for classes of servicing rights based on the different valuation and risk characteristics of the underlying assets and the method in which the economic risks are managed. SFAS 156 is effective on a prospective basis for fiscal years beginning after September 15, 2006, with early adoption permitted as of the beginning of a fiscal year for which an entity has not previously issued interim financial statements. SFAS 156 allows limited retrospective application for existing separately recognized servicing rights. The Group elected to early adopt SFAS 156 as of January 1, 2006. The adoption of SFAS 156 did not have a material impact on the Group’s financial condition, results of operations or cash flows. |
| FSP FTB 85-4-1 |
| In March 2006, the FASB issued FSP No. FTB 85-4-1, “Accounting for Life Settlement Contracts by Third-Party Investors” (FSP FTB 85-4-1). FSP FTB 85-4-1 allows a contract-by-contract election to account for life settlement contracts on either a fair value basis, with changes in fair value recognized in the statement of income, or through use of the investment method. Under the investment method, the initial investment and continuing costs are capitalized; no income is recognized until death of the insured party. The guidance of FSP FTB 85-4-1 is effective for fiscal years beginning after June 15, 2006, with early adoption permitted; however, upon adoption, limited retrospective application of the measurement guidance is required. The Group elected to early adopt FSP FTB 85-4-1 as of January 1, 2006, and the impact of adoption was an increase to the Group’s consolidated assets and retained earnings of CHF 27 million net of tax. |
| FSP FIN 46(R)-6 |
| In April 2006, the FASB issued FSP No. FIN 46(R)-6, “Determining the Variability to Be Considered in Applying FASB Interpretation No. 46(R)” (FSP FIN 46(R)-6). FSP FIN 46(R)-6 provides guidance regarding how contracts or arrangements that create or reduce variability should be assessed when determining if they are variable interest entities (VIEs) and when assessing the need for consolidation of VIEs. FSP FIN 46(R)-6 requires that evaluations of the variability created or absorbed in an entity from its contracts or arrangements be based on an analysis of the entity’s design. In evaluating the design of an entity, an analysis must be performed as to the potential risks to which the entity is exposed as well as the risks that the entity was designed to create and pass along to its interest holders based on the purpose for which the entity was formed. The guidance of FSP FIN 46(R)-6 was adopted by the Group and applied effective July 1, 2006 to all new entities as well as entities previously analyzed under FIN 46(R) “Consolidation of Variable Interest Entities - An Interpretation of ARB No. 51” (FIN 46(R)) when a reconsideration event occurs. FSP FIN 46(R)-6 did not have a material impact on the Group’s financial condition, results of operations or cash flows. |
| SFAS 158 |
| In September 2006, the FASB issued SFAS No. 158, “Employers’ Accounting for Defined Benefit Pension and Other Postretirement Plans - an amendment of FASB Statements No. 87, 88, 106 and 132(R)” (SFAS 158). SFAS 158 requires an employer to: i) recognize in the statement of financial condition the funded status of a defined benefit plan on a prospective basis; ii) recognize as a component of other comprehensive income, net of tax, the actuarial gains or losses and prior service costs or credits that arise during the period but are not recognized as components of net periodic benefit cost pursuant to SFAS No. 87, “Employers’ Accounting for Pensions” (SFAS 87) or No. 106, “Employers’ Accounting for Postretirement Benefits Other than Pensions” (SFAS 106). Amounts recognized in accumulated other comprehensive income, including gains or losses, prior service costs or credits and transition assets or obligations remaining from the initial application of SFAS 87 and 106, are to be adjusted as they are subsequently recognized as a component of net periodic benefit cost; iii) measure the defined benefit plan assets and obligations at the date of the employer’s fiscal year-end statement of financial condition; and iv) disclose in the notes to the financial statements additional information about certain effects on net periodic benefit cost for the next fiscal year that arise from delayed recognition of the gains or losses, prior service costs or credits and transition asset or obligation. SFAS 158 recognition provisions associated with the funded status of a defined benefit plan are effective as of the end of the fiscal year ending after December 15, 2006. The provision to measure plan assets and benefit obligations as of the date of the employer’s fiscal year-end statement of financial condition is effective for fiscal years ending after December 15, 2008 with early adoption permitted. The cumulative effect of the Group initially adopting the recognition provisions of SFAS 158 as of December 31, 2006 was an after tax decrease in Accumulated other comprehensive income and consolidated net assets of CHF 1.8 billion. For further details on the impact of initially applying SFAS 158, refer to the notes entitled “Accumulated other comprehensive income” and “Pension”. |
| The Group does not intend to early adopt the measurement date provisions and is currently evaluating the impact of the provisions for adoption in 2008. |
| SAB 108 |
| In September 2006, the SEC issued Staff Accounting Bulletin No. 108 on Quantifying Misstatements (SAB 108). SAB 108 requires registrants to use both a balance sheet approach and an income statement approach when quantifying and evaluating the materiality of a misstatement. In addition, SAB 108 provides guidance on correcting errors under this approach as well as providing transition guidance on correcting errors that existed prior to application of SAB 108. The guidance in SAB 108 is effective for the first fiscal year ending after November 15, 2006 with early adoption permitted. The adoption of SAB 108 as of December 31, 2006 did not have a material impact on the Group’s financial condition, results of operations or cash flows nor were any prior periods restated. |
| Standards to be adopted in future periods |
| FIN 48 |
| In July 2006, the FASB issued FASB Interpretation No. 48, “Accounting for Uncertainty in Income Taxes - An Interpretation of FASB Statement No. 109” (FIN 48). FIN 48 addresses the accounting for uncertainty in income tax positions by prescribing a consistent recognition threshold and measurement attribute for income tax positions taken or expected to be taken in an income tax return. FIN 48 also provides guidance on derecognition, classification, interest and penalties, accounting in interim periods, disclosure and transition. |
| FIN 48 requires a two-step process in evaluating income tax positions. In the first step, an enterprise determines whether it is more likely than not that an income tax position will be sustained upon examination, including resolution of any related appeals or litigation processes, based on the technical merits of the position. Income tax positions meeting the more-likely-than-not recognition threshold are then measured to determine the amount of benefit eligible for recognition in the financial statements. Each income tax position is measured at the largest amount of benefit that is more likely than not to be realized upon ultimate settlement. |
| The provisions of FIN 48 are effective for fiscal years beginning after December 15, 2006. The adoption of FIN 48 as of January 1, 2007 did not result in a material change to the Group’s financial condition, results of operations or cash flows. |
| SFAS 157 |
| In September 2006, the FASB issued SFAS No. 157, “Fair Value Measurements” (SFAS 157). SFAS 157 establishes a single authoritative definition of fair value, sets out a framework for measuring fair value, and requires additional disclosures for instruments carried at fair value. The statement applies only to fair value measurements which are already required or permitted by other accounting standards. It will affect current practice by eliminating the EITF 02-3 guidance which prohibits the recognition of gains or losses at the inception of derivative transactions whose fair value is primarily estimated based upon unobservable market data. SFAS 157 will also eliminate the use of blockage factors on instruments that trade in an active market by brokers, dealers and investment companies that have been applying the applicable AICPA Audit and Accounting Guides. SFAS 157 is effective for financial statements issued for fiscal years beginning after November 15, 2007, with early adoption permitted. The Group is currently evaluating the impact of adopting SFAS 157. |
Discontinued operations |
| On December 22, 2006, the Group completed the sale of Winterthur to AXA for cash consideration of CHF 12.3 billion. In addition, AXA repaid approximately CHF 1.1 billion of debt outstanding between the Group and Winterthur at the time of the sale agreement. As a result of the completed sale, a net capital gain on the sale of CHF 1,817 million was recognized. The Group did not provide any indemnification in respect of Winterthur’s insurance reserves in the sale agreement. |
| According to the sale agreement, certain banking and service agreements will continue to exist for a period not to exceed three years. These agreements may be terminated or renewed at any time. The revenues and costs associated with these agreements are considered insignificant. |
| The results of operations of the businesses sold are reflected in Income from discontinued operations, net of tax in the consolidated statements of income for all periods presented. From the announcement of the agreement for the sale in June 2006 until its completion, the assets and liabilities of Winterthur have been presented as Assets of discontinued operations held-for-sale and Liabilities of discontinued operations held-for-sale , respectively, in the consolidated balance sheets. The consolidated balance sheet as of December 31, 2005 has not been reclassified to reflect the discontinued operations. |
| The following table summarizes the Income from discontinued operations: | ||||||||||||
| 12 months | ||||||||||||
| in CHF m | 4Q 2006 | 3Q 2006 | 4Q 2005 | 2006 | 2005 | |||||||
| Total revenues | 7,499 | 6,612 | 6,716 | 29,718 | 30,363 | |||||||
| Total expenses | (7,199) | (6,136) | (6,094) | (28,123) | (28,621) | |||||||
| Income before taxes from discontinued operations | 300 | 476 | 622 | 1,595 | 1,742 | |||||||
| Net capital gain on disposal of stock | 1,817 | – | – | 1,817 | – | |||||||
| Income tax expense | 43 | 52 | 196 | 342 | 432 | |||||||
| Income from discontinued operations, net of tax | 2,074 | 424 | 426 | 3,070 | 1,310 | |||||||
| The following table summarizes the assets, liabilities and accumulated other comprehensive income/(loss) of discontinued operations as of December 22, 2006, the date of sale, which are no longer included in the consolidated balance sheet as of December 31, 2006: | ||||
| in CHF m | 22.12.2006 | |||
| Assets | ||||
| Cash and due from banks | 4,347 | |||
| Trading assets | 25,402 | |||
| Investment securities | 98,004 | |||
| Real estate held for investment | 8,321 | |||
| Loans, net of allowance for loan losses | 15,856 | |||
| Assets held for separate accounts | 7,321 | |||
| Other assets | 24,440 | |||
| Assets of discontinued operations | 183,691 | |||
| Liabilities | ||||
| Technical provisions from the insurance business | 154,584 | |||
| Liabilities held for separate accounts | 7,321 | |||
| Other liabilities | 12,789 | |||
| Liabilities of discontinued operations | 174,694 | |||
| Accumulated other comprehensive income/(loss), net of tax | ||||
| Gains/(losses) on cash flow hedge | (39) | |||
| Cumulative translation adjustment | (559) | |||
| Unrealized gains/(losses) on securities | 285 | |||
| Minimum pension liability adjustment | (92) | |||
| Accumulated other comprehensive income/(loss) related to discontinued operations | (405) | |||
Segment reporting |
| The results of operations of Winterthur, which were reported as a separate segment of the Group prior to the second quarter of 2006, are now reflected in Income from discontinued operations, net of tax for all periods presented. For further details regarding the sale of Winterthur, see the note entitled “Discontinued operations.” |
| Net revenues | ||||||||||||
| 12 months | ||||||||||||
| in CHF m | 4Q 2006 | 3Q 2006 | 4Q 2005 | 2006 | 2005 | |||||||
| Investment Banking | 6,085 | 4,191 | 3,735 | 20,469 | 15,547 | |||||||
| Private Banking | 2,973 | 2,682 | 2,716 | 11,678 | 10,495 | |||||||
| Asset Management | 738 | 692 | 757 | 2,861 | 2,801 | |||||||
| Corporate Center1) | 1,018 | 511 | 358 | 3,595 | 1,646 | |||||||
| Credit Suisse Group | 10,814 | 8,076 | 7,566 | 38,603 | 30,489 | |||||||
| 1) Includes minority interest revenues of CHF 998 million, CHF 640 million, CHF 554 million, CHF 3,663 million and CHF 2,074 million in 4Q 2006, 3Q 2006, 4Q 2005, 12 months 2006 and 12 months 2005, respectively, from the consolidation of certain private equity funds and other entities in which the Group does not have a significant economic interest in such revenues. | ||||||||||||
| Income from continuing operations before taxes, minority interests, extraordinary items and cumulative effect of accounting changes | ||||||||||||
| 12 months | ||||||||||||
| in CHF m | 4Q 2006 | 3Q 2006 | 4Q 2005 | 2006 | 2005 | |||||||
| Investment Banking | 2,342 | 758 | 286 | 5,951 | 1,599 | |||||||
| Private Banking | 1,143 | 1,022 | 1,026 | 4,596 | 3,966 | |||||||
| Asset Management | 89 | 158 | 241 | 508 | 1,006 | |||||||
| Corporate Center1) | 740 | 522 | (494) | 3,245 | 830 | |||||||
| Credit Suisse Group | 4,314 | 2,460 | 1,059 | 14,300 | 7,401 | |||||||
| 1) Includes minority interest income of CHF 927 million, CHF 630 million, CHF 539 million, CHF 3,560 million and CHF 2,042 million in 4Q 2006, 3Q 2006, 4Q 2005, 12 months 2006 and 12 months 2005, respectively, from the consolidation of certain private equity funds and other entities in which the Group does not have a significant economic interest in such income. | ||||||||||||
| Total assets | ||||||
| in CHF m | 31.12.06 | 31.12.05 | ||||
| Investment Banking | 1,046,557 | 957,513 | ||||
| Private Banking | 340,741 | 298,117 | ||||
| Asset Management | 20,448 | 21,572 | ||||
| Corporate Center and other1) | (151,790) | 61,850 | ||||
| Credit Suisse Group | 1,255,956 | 1,339,052 | ||||
| 1) December 31, 2005 includes CHF 178.7 billion of assets related to Winterthur, which was reported as a separate segment of the Group prior to the second quarter of 2006. | ||||||
Interest and dividend income and interest expense |
| The following table sets forth the details of interest and dividend income and interest expense: | ||||||||||||
| 12 months | ||||||||||||
| in CHF m | 4Q 2006 | 3Q 2006 | 4Q 2005 | 2006 | 2005 | |||||||
| Interest income on loans | 2,029 | 1,907 | 1,670 | 7,509 | 6,091 | |||||||
| Interest income on investment securities | 190 | 181 | 160 | 696 | 517 | |||||||
| Interest and dividend income on trading assets | 4,300 | 4,528 | 3,636 | 17,659 | 13,794 | |||||||
| Central bank funds sold, securities purchased under resale agreementsand securities borrowing transactions | 4,927 | 4,836 | 3,954 | 19,141 | 12,684 | |||||||
| Other | 1,571 | 1,373 | 971 | 5,264 | 3,030 | |||||||
| Total interest and dividend income | 13,017 | 12,825 | 10,391 | 50,269 | 36,116 | |||||||
| Interest expense on deposits | (3,559) | (3,256) | (2,414) | (12,396) | (7,520) | |||||||
| Interest expense on short-term borrowings | (193) | (156) | (104) | (630) | (355) | |||||||
| Interest expense on trading liabilities | (1,498) | (1,615) | (1,266) | (6,606) | (4,845) | |||||||
| Central bank funds purchased, securities sold under repurchaseagreements and securities lending transactions | (4,644) | (4,550) | (3,810) | (17,878) | (11,674) | |||||||
| Interest expense on long-term debt | (1,168) | (1,131) | (1,193) | (4,471) | (3,957) | |||||||
| Other | (528) | (510) | (298) | (1,722) | (847) | |||||||
| Total interest expense | (11,590) | (11,218) | (9,085) | (43,703) | (29,198) | |||||||
| Net interest income | 1,427 | 1,607 | 1,306 | 6,566 | 6,918 | |||||||
Trading activities |
| The following table sets forth the details of trading-related revenues: | ||||||||||||
| 12 months | ||||||||||||
| in CHF m | 4Q 2006 | 3Q 2006 | 4Q 2005 | 2006 | 2005 | |||||||
| Trading revenues | 2,956 | 1,693 | 1,286 | 9,428 | 5,634 | |||||||
| Interest and dividend income on trading assets | 4,300 | 4,528 | 3,636 | 17,659 | 13,794 | |||||||
| Interest expense on trading liabilities | (1,498) | (1,615) | (1,266) | (6,606) | (4,845) | |||||||
| Trading interest income, net | 2,802 | 2,913 | 2,370 | 11,053 | 8,949 | |||||||
| Total trading-related revenues | 5,758 | 4,606 | 3,656 | 20,481 | 14,583 | |||||||
| The following table sets forth the details of trading assets and liabilities: | ||||||
| in CHF m | 31.12.06 | 31.12.05 | ||||
| Trading assets | ||||||
| Debt securities | 214,276 | 198,815 | ||||
| Equity securities1) | 149,684 | 156,559 | ||||
| Derivative instruments | 58,152 | 55,192 | ||||
| Other | 28,668 | 24,684 | ||||
| Total trading assets | 450,780 | 435,250 | ||||
| Trading liabilities | ||||||
| Short positions | 139,786 | 137,618 | ||||
| Derivative instruments | 58,636 | 56,607 | ||||
| Total trading liabilities | 198,422 | 194,225 | ||||
| 1) Includes convertible bonds. | ||||||
Commissions and fees |
| The following table sets forth the details of commissions and fees: | ||||||||||||
| 12 months | ||||||||||||
| in CHF m | 4Q 2006 | 3Q 2006 | 4Q 2005 | 2006 | 2005 | |||||||
| Commissions from lending business | 469 | 352 | 284 | 1,602 | 1,162 | |||||||
| Investment and portfolio management fees | 1,387 | 1,279 | 1,212 | 5,241 | 4,579 | |||||||
| Commissions for other securities business | 58 | 57 | 24 | 212 | 179 | |||||||
| Commissions and fees from fiduciary activities | 1,445 | 1,336 | 1,236 | 5,453 | 4,758 | |||||||
| Underwriting fees | 895 | 538 | 781 | 2,755 | 2,522 | |||||||
| Brokerage fees | 1,303 | 1,118 | 1,004 | 5,129 | 3,634 | |||||||
| Commissions, brokerage securities underwriting and other securities activities | 2,198 | 1,656 | 1,785 | 7,884 | 6,156 | |||||||
| Fees for other customer services | 957 | 575 | 739 | 2,708 | 2,247 | |||||||
| Commissions and fees | 5,069 | 3,919 | 4,044 | 17,647 | 14,323 | |||||||
Loans |
| The following table sets forth details of the domestic (Switzerland) and foreign loan portfolio: | ||||||
| in CHF m | 31.12.06 | 31.12.05 | ||||
| Banks | 24 | 1,801 | ||||
| Commercial | 44,253 | 43,972 | ||||
| Consumer | 82,133 | 81,388 | ||||
| Public authorities | 1,263 | 3,481 | ||||
| Lease financings | 3,360 | 2,979 | ||||
| Switzerland | 131,033 | 133,621 | ||||
| Banks | 8,940 | 8,555 | ||||
| Commercial | 55,424 | 46,110 | ||||
| Consumer | 13,073 | 18,398 | ||||
| Public authorities | 905 | 1,026 | ||||
| Lease financings | 228 | 138 | ||||
| Foreign | 78,570 | 74,227 | ||||
| Loans, gross | 209,603 | 207,848 | ||||
| Deferred expenses, net | 8 | 64 | ||||
| Allowance for loan losses | (1,484) | (2,241) | ||||
| Total loans, net | 208,127 | 205,671 | ||||
| As of December 31, 2006, the Group held CHF 14.3 billion in restricted loans, which represented collateral on secured borrowings, and CHF 4.7 billion in loans held in trusts, which are consolidated under FIN 46(R) as a result of failed sales. |
| The following table sets forth the movements in the allowance for loan losses: | ||||||||||||
| 12 months | ||||||||||||
| in CHF m | 4Q 2006 | 3Q 2006 | 4Q 2005 | 2006 | 2005 | |||||||
| Balance beginning of period | 1,527 | 1,736 | 2,445 | 2,241 | 3,038 | |||||||
| Discontinued operations | 0 | 0 | 0 | (51) | 0 | |||||||
| Net additions charged to income statement | (25) | (54) | (9) | (128) | (134) | |||||||
| Gross write-offs | (76) | (192) | (307) | (731) | (967) | |||||||
| Recoveries | 68 | 10 | 86 | 141 | 136 | |||||||
| Net write-offs | (8) | (182) | (221) | (590) | (831) | |||||||
| Provisions for interest | (1) | 18 | 9 | 48 | 67 | |||||||
| Foreign currency translation impact and other adjustments, net | (9) | 9 | 17 | (36) | 101 | |||||||
| Balance end of period | 1,484 | 1,527 | 2,241 | 1,484 | 2,241 | |||||||
| Prior year periods not adjusted for discontinued operations. | ||||||||||||
| The following table sets forth details of impaired loans, with or without a specific allowance. Loans are considered impaired when it is considered probable that the Group will not collect all amounts due under the loan terms. | ||||||
| in CHF m | 31.12.06 | 31.12.05 | ||||
| With a specific allowance | 1,802 | 2,803 | ||||
| Without a specific allowance | 329 | 516 | ||||
| Total impaired loans, gross | 2,131 | 3,319 | ||||
| Specific allowance for impaired loans1) | 1,091 | 1,847 | ||||
| 1) Included in the allowances for loan losses. | ||||||
Accumulated other comprehensive income |
| The following table sets forth the movements of accumulated other comprehensive income/(loss), net of tax: | ||||||||||||||||
| in CHF m | Gains/(losses) on cash flow hedge | Cumulative translation adjustment | Unrealized gains/ (losses) on securities | Minimum pension liability adjustment | Actuarial gains/ (losses) | Net prior service cost/ (credit) | Accumulated other com- prehensive income/ (loss) | |||||||||
| Balance January 1, 2005 | 27 | (3,998) | 1,068 | (820) | – | – | (3,723) | |||||||||
| Increase/(decrease) | 40 | 1,511 | 539 | 178 | – | – | 2,268 | |||||||||
| Reclassification adjustments, included in net income | 10 | (10) | (451) | 0 | – | – | (451) | |||||||||
| Balance December 31, 2005 | 77 | (2,497) | 1,156 | (642) | – | – | (1,906) | |||||||||
| Balance January 1, 2006 | 77 | (2,497) | 1,156 | (642) | – | – | (1,906) | |||||||||
| Increase/(decrease) | (115) | (832) | (528) | 101 | – | – | (1,374) | |||||||||
| Decrease due to equity method investments | (40) | – | – | – | – | – | (40) | |||||||||
| Reclassification adjustments, included in net income | 36 | 451 | (514) | 92 | – | – | 65 | |||||||||
| Adoption of SFAS 158, net of tax | – | – | – | 449 | (2,110) | (117) | (1,778) | |||||||||
| Balance December 31, 2006 | (42) | (2,878) | 114 | 0 | (2,110) | (117) | (5,033) | |||||||||
Earnings per share |
| The following table sets forth details of the calculation of earnings per share (EPS): | ||||||||||||
| 12 months | ||||||||||||
| in CHF m | 4Q 2006 | 3Q 2006 | 4Q 2005 | 2006 | 2005 | |||||||
| Income from continuing operations before cumulative effect of accounting changes | 2,599 | 1,468 | 677 | 8,281 | 4,526 | |||||||
| Income from discontinued operations, net of tax | 2,074 | 424 | 426 | 3,070 | 1,310 | |||||||
| Extraordinary items, net of tax | 0 | 0 | 0 | (24) | 0 | |||||||
| Cumulative effect of accounting changes, net of tax | 0 | 0 | 0 | 0 | 14 | |||||||
| Net income – as reported | 4,673 | 1,892 | 1,103 | 11,327 | 5,850 | |||||||
| Net income available for common shares for basic EPS1) | 4,673 | 1,892 | 1,073 | 11,327 | 5,759 | |||||||
| Net income available for common shares for diluted EPS2) | 4,673 | 1,892 | 1,120 | 11,327 | 5,950 | |||||||
| Weighted-average common shares outstanding for basic EPS, in m | 1,074.6 | 1,084.4 | 1,090.2 | 1,099.9 | 1,114.6 | |||||||
| Effect of dilutive securities | ||||||||||||
| Convertible securities | – | – | 30.7 | – | 32.9 | |||||||
| Share options and warrants | 12.8 | 12.1 | 13.5 | 14.2 | 10.3 | |||||||
| Share awards | 47.9 | 38.7 | 48.5 | 38.2 | 27.9 | |||||||
| Adjusted weighted-average common shares for diluted EPS3) | 1,135.3 | 1,135.2 | 1,182.9 | 1,152.3 | 1,185.7 | |||||||
| Basic earnings per share, in CHF | ||||||||||||
| Income from continuing operations before cumulative effect of accounting changes | 2.42 | 1.35 | 0.59 | 7.53 | 3.98 | |||||||
| Income from discontinued operations, net of tax | 1.93 | 0.39 | 0.39 | 2.79 | 1.18 | |||||||
| Extraordinary items, net of tax | 0.00 | 0.00 | 0.00 | (0.02) | 0.00 | |||||||
| Cumulative effect of accounting changes, net of tax | 0.00 | 0.00 | 0.00 | 0.00 | 0.01 | |||||||
| Net income available for common shares | 4.35 | 1.74 | 0.98 | 10.30 | 5.17 | |||||||
| Diluted earnings per share, in CHF | ||||||||||||
| Income from continuing operations before cumulative effect of accounting changes | 2.29 | 1.29 | 0.59 | 7.19 | 3.90 | |||||||
| Income from discontinued operations, net of tax | 1.83 | 0.38 | 0.36 | 2.66 | 1.11 | |||||||
| Extraordinary items, net of tax | 0.00 | 0.00 | 0.00 | (0.02) | 0.00 | |||||||
| Cumulative effect of accounting changes, net of tax | 0.00 | 0.00 | 0.00 | 0.00 | 0.01 | |||||||
| Net income available for common shares | 4.12 | 1.67 | 0.95 | 9.83 | 5.02 | |||||||
| 1) The allocation of undistributed income related to the mandatory convertible securities is a reduction to the net income available to common shareholders for the purposes of the basic earnings per share calculation. 2) Under the if-converted method for calculating diluted earnings per share, the interest on the mandatory convertible securities is included when the effect is dilutive. 3) Weighted-average potential common shares relating to instruments that were not dilutive for the respective periods (and therefore not included in the EPS-calculation above), but could potentially dilute earnings per share in the future were 35.2 million, 46.1 million, 51.3 million, 38.0 million and 56.0 million for 4Q 2006, 3Q 2006, 4Q 2005, 12 months 2006 and 12 months 2005, respectively. | ||||||||||||
Pension |
| The following table sets forth details of the net periodic pension cost for the Swiss and international defined benefit pension and other post-retirement defined benefit plans: | ||||||||||||
| 12 months | ||||||||||||
| in CHF m | 4Q 2006 | 3Q 2006 | 4Q 2005 | 2006 | 2005 | |||||||
| Service costs on benefit obligation | 86 | 80 | 73 | 335 | 272 | |||||||
| Interest costs on benefit obligation | 124 | 124 | 131 | 494 | 522 | |||||||
| Expected return on plan assets | (175) | (172) | (171) | (692) | (680) | |||||||
| Amortization of | ||||||||||||
| Unrecognized transition obligation/(asset) | 0 | 0 | 0 | (1) | (2) | |||||||
| Prior service cost | 7 | 8 | 8 | 31 | 31 | |||||||
| Unrecognized (gains)/losses | 33 | 30 | 13 | 130 | 56 | |||||||
| Net periodic pension costs | 75 | 70 | 54 | 297 | 199 | |||||||
| Settlement (gains)/losses | 0 | 0 | 0 | (5) | 0 | |||||||
| Curtailment (gains)/losses | 0 | 0 | 1 | (9) | 0 | |||||||
| Total pension costs | 75 | 70 | 55 | 283 | 199 | |||||||
| Credit Suisse Group previously disclosed in its consolidated financial statements for the year ended December 31, 2005 that it expected to contribute CHF 348 million to the defined benefit pension plans in 2006. The calculation of the expected contributions for 2006 was subsequently revised to reflect the current funding status, resulting in an increase of anticipated contributions. As of December 31, 2006, contributions of CHF 382 million have been made. The Group presently anticipates contributing CHF 372 million to fund its defined benefit pension plans in 2007. |
| The following table sets forth the changes in the consolidated balance sheet as of December 31, 2006 arising from the adoption of SFAS 158: | ||||||||
| in CHF m | Before application of SFAS 158 | Adjustments | After application of SFAS 158 | |||||
| Other intangible assets including intangible assets for minimum pension liability | 478 | (2) | 476 | |||||
| Other assets including prepaid pension/post-retirement cost | 150,334 | (1,247) | 149,087 | |||||
| Other liabilities including accrued pension/post-retirement cost and deferred income taxes | 119,506 | 529 | 120,035 | |||||
| Accumulated other comprehensive income/(loss), net of tax | (3,255) | (1,778) | (5,033) | |||||
Guarantees and commitments |
| Guarantees |
| The following tables set forth details of contingent liabilities associated with guarantees: | ||||||||||
| As of December 31, 2006, in CHF m | Total gross amount | Total net amount | 1) | Carrying value | Collateral received | |||||
| Credit guarantees and similar instruments | 10,308 | 7,909 | 8 | 4,966 | ||||||
| Performance guarantees and similar instruments | 11,131 | 9,925 | 162 | 3,145 | ||||||
| Securities lending indemnifications | 36,834 | 36,834 | – | 36,834 | ||||||
| Derivatives | 680,329 | 680,329 | 5,211 | – | 2) | |||||
| Other guarantees3) | 3,511 | 3,511 | 3 | 1,496 | ||||||
| Total guarantees | 742,113 | 738,508 | 5,384 | 46,441 | ||||||
| As of December 31, 2005, in CHF m | Total gross amount | Total net amount | 1) | Carrying value | Collateral received | |||||
| Credit guarantees and similar instruments | 9,976 | 7,616 | 11 | 3,484 | ||||||
| Performance guarantees and similar instruments | 8,275 | 7,425 | 233 | 3,737 | ||||||
| Securities lending indemnifications | 35,456 | 35,456 | – | 35,456 | ||||||
| Derivatives | 437,399 | 437,399 | 4,238 | – | 2) | |||||
| Other guarantees3) | 3,552 | 3,552 | 25 | 1,691 | ||||||
| Total guarantees | 494,658 | 491,448 | 4,507 | 44,368 | ||||||
| 1) Total net amount equals gross amount less any participations. 2) Collateral for derivatives accounted for as guarantees is not considered significant. 3) Contingent considerations in business combinations, residual value guarantees and other indemnifications. | ||||||||||
| Guarantees provided by the Group are broadly classified as follows: Credit guarantees and similar instruments, Performance guarantees and similar instruments, Securities lending indemnifications, Derivatives and Other guarantees . Readers are referred to note 34 “Guarantees and commitments” in the Credit Suisse Group Annual Report 2005 for a detailed description of guarantees. |
| Deposit-taking banks in Switzerland and certain other European countries are required to ensure the payout of privileged deposits in case of specified restrictions or compulsory liquidation of a deposit-taking bank. Upon occurrence of a payout event, the Group’s contribution will be calculated based on its share of privileged deposits in proportion to the total privileged deposits. These guarantees are reflected in Other guarantees in the table above. The Group believes that the likelihood of having to pay under these agreements is remote. |
| Disposal-related contingencies and other indemnifications |
| The Group has certain guarantees for which its maximum contingent liability cannot be quantified. These guarantees are not reflected in the table above and are discussed below. |
| Disposal-related contingencies |
| In connection with the sale of assets or businesses, the Group sometimes provides the acquirer with certain indemnification provisions. These indemnification provisions vary by counterparty in scope and duration and depend upon the type of assets or businesses sold. These indemnification provisions generally shift the potential risk of certain unquantifiable and unknowable loss contingencies (e.g. relating to litigation, tax and intellectual property matters) from the acquirer to the seller. The Group closely monitors all such contractual agreements to ensure that indemnification provisions are adequately provided for in the Group’s consolidated financial statements. |
| Other indemnifications |
| The Group provides indemnifications to certain counterparties in connection with its normal operating activities, for which it is not possible to estimate the maximum amount it could be obligated to pay. As a normal part of issuing its own securities, the Group typically agrees to reimburse holders for additional tax withholding charges or assessments resulting from changes in applicable tax laws or the interpretation of those laws. Securities that include these agreements to pay additional amounts generally also include a related redemption or call provision if the obligation to pay the additional amounts results from a change in law or its interpretation and the obligation cannot be avoided by the issuer taking reasonable steps to avoid the payment of additional amounts. Since such potential obligations are dependent on future changes in tax laws, the related liabilities the Group may incur as a result of such changes cannot be reasonably estimated. In light of the related call provisions typically included, the Group does not expect any potential liabilities in respect of tax gross-ups to be material. |
| The Group is a member of numerous securities exchanges and clearing houses and may, as a result of its membership arrangements, be required to perform if another member defaults. The Group has determined that it is not possible to estimate the maximum amount of these obligations and believes that any potential requirement to make payments under these arrangements is remote. |
| Other commitments |
| The following table sets forth details of other commitments: | ||||||||
| As of December 31, 2006, in CHF m | Total gross amount | Total net amount | 1) | Collateral received | ||||
| Irrevocable commitments under documentary credits | 5,365 | 4,984 | 2,710 | |||||
| Loan commitments | 233,083 | 231,771 | 139,189 | |||||
| Forward reverse repurchase agreements | 5,697 | 5,697 | 5,697 | |||||
| Other commitments | 4,966 | 4,966 | 159 | |||||
| Total other commitments | 249,111 | 247,418 | 147,755 | |||||
| As of December 31, 2005, in CHF m | Total gross amount | Total net amount | 1) | Collateral received | ||||
| Irrevocable commitments under documentary credits | 5,345 | 5,042 | 2,761 | |||||
| Loan commitments | 199,825 | 199,555 | 126,385 | |||||
| Forward reverse repurchase agreements | 15,472 | 15,472 | 15,472 | |||||
| Other commitments | 4,360 | 4,360 | 582 | |||||
| Total other commitments | 225,002 | 224,429 | 145,200 | |||||
| 1) Total net amount equals gross amount less any participations. | ||||||||
| Other commitments of the Group are broadly classified as follows: Irrevocable commitments under documentary credits, Loan commitments, Forward reverse repurchase agreements and Other commitments. See note 34 “Guarantees and commitments” of the Credit Suisse Group Annual Report 2005 for a detailed description of other off-balance sheet commitments. |
Variable interest entities |
| FIN 46(R) requires the Group to consolidate all variable interest entities (VIEs) for which it is the primary beneficiary, defined as the entity that will absorb a majority of expected losses, receive a majority of the expected residual returns, or both. The Group consolidates all VIEs for which it is the primary beneficiary. |
| As a normal part of its business, the Group engages in transactions with entities that are considered VIEs. These transactions include selling or purchasing assets, acting as a counterparty in derivatives transactions and providing liquidity, credit or other support. Transactions with VIEs are generally executed to facilitate securitization activities or to meet specific client needs, such as providing liquidity or investment opportunities, and as part of these activities, the Group may retain interests in VIEs. In general, investors in consolidated VIEs do not have recourse to the Group in the event of a default, except where a guarantee was provided to the investors or where the Group is the counterparty to a derivative transaction involving VIEs. |
| The Group’s involvement with VIEs may be broadly grouped into three primary categories: Collateralized debt obligations (CDOs), Commercial paper conduits (CP conduits) and Financial intermediation. Further details are available in note 1 “Summary of significant accounting policies”, note 2 “Recently issued accounting standards” and note 36 “Variable interest entities” of Credit Suisse Group’s Annual Report 2005 regarding the Group’s policy on consolidation of VIEs and the nature of the Group’s involvement with these entities. |
| The following table sets forth the total assets by category related to non-consolidated VIEs: | ||||||
| Carrying value of VIEs' total assets | ||||||
| in CHF m | 31.12.06 | 31.12.05 | ||||
| Collateralized debt obligations | 15,636 | 20,515 | ||||
| Commercial paper conduits | 7,038 | 8,528 | ||||
| Financial intermediation | 90,538 | 78,909 | ||||
| Total | 113,212 | 107,952 | ||||
| The following table sets forth the total assets by category related to VIEs consolidated as a result of the Group being the primary beneficiary: | ||||||
| VIEs' total assets | ||||||
| in CHF m | 31.12.06 | 31.12.05 | ||||
| Collateralized debt obligations | 6,539 | 3,365 | ||||
| Commercial paper conduits | 1 | 1 | ||||
| Financial intermediation | 15,006 | 14,032 | ||||
| Total assets consolidated pursuant to FIN 46(R) | 21,546 | 17,398 | ||||
| Collateralized debt obligations |
| As part of its structured finance business, the Group purchases loans and other debt obligations from and on behalf of clients for the purpose of securitization. |
| The Group has consolidated all CDO VIEs for which it is the primary beneficiary resulting in the inclusion by the Group of approximately CHF 6.5 billion and CHF 3.4 billion of assets and liabilities of these VIEs as of December 31, 2006 and December 31, 2005, respectively. The increase in the total assets consolidated primarily reflected the application of FSP FIN 46(R)-6. The beneficial interests issued by these VIEs are payable solely from the cash flows of the related collateral, and the creditors of these VIEs do not have recourse to the Group in the event of default. |
| The Group also retains certain debt and equity interests in open CDO VIEs that are not consolidated because the Group is not the primary beneficiary. The Group’s exposure in these CDO transactions typically consists of the interests retained in connection with its underwriting or market-making activities. The Group’s maximum loss exposure is equal to the carrying value of these retained interests, which are reported as trading assets and carried at fair value and totaled CHF 1.7 billion and CHF 1.0 billion as of December 31, 2006 and December 31, 2005, respectively. |
| Commercial paper conduits |
| The Group continues to act as the administrator and provider of liquidity and credit enhancement facilities for several CP conduits. The Group does not sell assets to the CP conduits and does not have any ownership interest in the CP conduits. |
| The Group’s commitments to CP conduits consist of obligations under liquidity and credit enhancement agreements. |
| As of December 31, 2006 the Group’s maximum loss exposure to non-consolidated CP conduits was CHF 12.5 billion, which consisted of CHF 7.0 billion of funded assets and the CP conduits’ commitments to purchase CHF 5.5 billion of additional assets. As of December 31, 2005, the Group’s maximum loss exposure was CHF 14.2 billion. |
| The Group believes that the likelihood of incurring a loss equal to this maximum exposure is remote because the assets held by the CP conduits, after giving effect to related asset-specific credit enhancements primarily provided by the clients, must be considered investment grade when acquired by the CP conduits. |
| Financial intermediation |
| The Group has significant involvement with VIEs in its role as a financial intermediary on behalf of clients. The investors typically retain the risk of loss on such transactions but the Group may provide principal protection on the securities to limit the investors’ exposure to downside risk. |
| As a financial intermediary, the Group may administer or sponsor the VIE, transfer assets to the VIE, provide collateralized financing, act as a derivatives counterparty, advise on the transaction, act as investment advisor or investment manager, act as underwriter or placement agent or provide credit enhancement, liquidity or other support to the VIE. The Group also owns securities issued by the VIEs structured to provide clients with investment opportunities, for market-making purposes and as investments. The Group’s maximum loss exposure to non-consolidated VIEs related to financial intermediation activities was CHF 19.1 billion and CHF 12.8 billion as of December 31, 2006 and December 31, 2005, respectively, which represents the notional amount of any guarantees from the Group and the fair value of all other Group interests held, rather than the amount of total assets of the VIEs. Further, the Group considers the likelihood of incurring a loss equal to the maximum exposure to be remote because of the Group’s risk mitigation efforts, including hedging strategies and the risk of loss that is retained by investors. |
Litigation |
| The Group has provided reserves for litigation, claims and proceedings in accordance with SFAS No. 5, “Accounting for Contingencies.” The Group recorded in the second quarter of 2005 a CHF 960 million (USD 750 million) charge before tax, CHF 624 million after tax, in Investment Banking, to increase the reserve for private litigation involving Enron, certain IPO allocation practices, research analyst independence and other related litigation. The charge was in addition to the reserve for these private litigation matters of CHF 702 million (USD 450 million) before tax originally established in 2002 and brings the total reserve for these private litigation matters as of December 31, 2006, to CHF 1.2 billion (USD 1.0 billion) after deductions for settlements that have since taken place. |
| The Group is involved in a number of other judicial, regulatory and arbitration proceedings concerning the matters arising in connection with the conduct of its businesses. These actions have been brought on behalf of various classes of claimants and, unless specified, seek damages of material and/or indeterminate amounts. The Group believes, based on currently available information and advice of counsel, that the results of such proceedings, in the aggregate, are not likely to have a material adverse effect on its financial condition but might be material to operating results for any particular period, depending, in part, upon the operating results for such period. |
| It is inherently difficult to predict the outcome of many of these matters. In presenting the condensed consolidated financial statements, management makes estimates regarding the outcome of these matters and records a reserve and takes a charge to income when losses with respect to such matters are probable and can be reasonably estimated. Estimates, by their nature, are based on judgment and currently available information and involve a variety of factors, including, but not limited to, the type and nature of the litigation, claim or proceeding, the progress of the matter, the advice of legal counsel, the Group’s defenses and its experience in similar cases or proceedings as well as its assessment of matters, including settlements, involving other defendants in similar or related cases or proceedings. |
| Further charges or releases of litigation reserves may be necessary in the future as developments in such litigation, claims or proceedings warrant. |
Information for investors |
| Ticker symbols / Stock exchange listings | ||||||||
| Bloomberg | Reuters | Telekurs | ||||||
| SWX Swiss Exchange/virt-x | CSGN VX | CSGN.VX | CSGN,380 | |||||
| New York Stock Exchange (ADS)1) | CS US | CS.N | CS,065 | |||||
| CSG share | ADS | |||||||
| Swiss security number | 1213853 | 570660 | ||||||
| ISIN number | CH0012138530 | US2254011081 | ||||||
| CUSIP number | 225 401 108 | |||||||
| 1) One ADS represents one common share. | ||||||||
| Credit Suisse Group’s common shares are listed on the Swiss Exchange/virt-x. In addition, Credit Suisse Group has a sponsored level II American Depositary Shares (ADS) program listed on the New York Stock Exchange for which Deutsche Bank Trust Company Americas acts as depositary. Each ADS represents one common share of the Group. |
| Further information about historic share prices and other share-related statistics can be found in the Credit Suisse Group financial highlights section of this document and at www.credit-suisse.com/investors. |
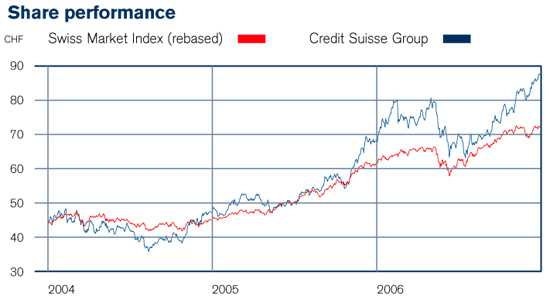 |
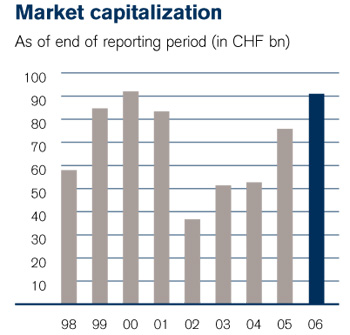 |
| Ratings | ||||||||||
| Moody's | Standard & Poor's | Fitch Ratings | ||||||||
| Credit Suisse Group | Short term | – | A-1 | F1+ | ||||||
| Long term | Aa3 | A+ | AA- | |||||||
| Outlook | Stable | Stable | Stable | |||||||
| Credit Suisse | Short term | P-1 | A-1+ | F1+ | ||||||
| Long term | Aa3 | AA- | AA- | |||||||
| Outlook | Stable | Stable | Stable | |||||||
| Foreign currency translation rates |
| The following table sets forth principal Swiss franc foreign exchange rates: | ||||||||||||||
| Average rate | Closing rate | |||||||||||||
| in CHF | 4Q 2006 | 3Q 2006 | 4Q 2005 | 31.12.06 | 30.09.06 | 31.12.05 | ||||||||
| 1 USD | 1.23 | 1.24 | 1.30 | 1.2208 | 1.2540 | 1.3137 | ||||||||
| 1 EUR | 1.59 | 1.58 | 1.55 | 1.6085 | 1.5884 | 1.5572 | ||||||||
| 1 GBP | 2.37 | 2.31 | 2.28 | 2.3987 | 2.3423 | 2.2692 | ||||||||
| 100 JPY | 1.05 | 1.07 | 1.12 | 1.0260 | 1.0620 | 1.1190 | ||||||||
| Cautionary statement regarding forward-looking information |
| This Quarterly Report contains statements that constitute forward-looking statements. In addition, in the future we, and others on our behalf, may make statements that constitute forward-looking statements. Such forward-looking statements may include, without limitation, statements relating to our plans, objectives or goals; our future economic performance or prospects; the potential effect on our future performance of certain contingencies; and assumptions underlying any such statements. |
| Words such as “believes,” “anticipates,” “expects,” “intends” and “plans” and similar expressions are intended to identify forward-looking statements but are not the exclusive means of identifying such statements. We do not intend to update these forward-looking statements except as may be required by applicable laws. |
| By their very nature, forward-looking statements involve inherent risks and uncertainties, both general and specific, and risks exist that predictions, forecasts, projections and other outcomes described or implied in forward-looking statements will not be achieved. We caution you that a number of important factors could cause results to differ materially from the plans, objectives, expectations, estimates and intentions expressed in such forward-looking statements. These factors include (i) market and interest rate fluctuations; (ii) the strength of the global economy in general and the strength of the economies of the countries in which we conduct our operations in particular; (iii) the ability of counterparties to meet their obligations to us; (iv) the effects of, and changes in, fiscal, monetary, trade and tax policies, and currency fluctuations; (v) political and social developments, including war, civil unrest or terrorist activity; (vi) the possibility of foreign exchange controls, expropriation, nationalization or confiscation of assets in countries in which we conduct our operations; (vii) the ability to maintain sufficient liquidity and access capital markets; (viii) operational factors such as systems failure, human error, or the failure to implement procedures properly; (ix) actions taken by regulators with respect to our business and practices in one or more of the countries in which we conduct our operations; (x) the effects of changes in laws, regulations or accounting policies or practices; (xi) competition in geographic and business areas in which we conduct our operations; (xii) the ability to retain and recruit qualified personnel; (xiii) the ability to maintain our reputation and promote our brand; (xiv) the ability to increase market share and control expenses; (xv) technological changes; (xvi) the timely development and acceptance of our new products and services and the perceived overall value of these products and services by users; (xvii) acquisitions, including the ability to integrate acquired businesses successfully, and divestitures, including the ability to sell non-core assets; (xviii) the adverse resolution of litigation and other contingencies; and (xix) our success at managing the risks involved in the foregoing. |
| We caution you that the foregoing list of important factors is not exclusive; when evaluating forward-looking statements, you should carefully consider the foregoing factors and other uncertainties and events, as well as the risks identified in our most recently filed Form 20-F and reports on Form 6-K furnished to the US Securities and Exchange Commission. |
| Financial calendar | ||||
| First quarter results 2007 | Wednesday, May 2, 2007 | |||
| Annual General Meeting | Friday, May 4, 2007 | |||
| Dividend payment | Thursday, May 10, 2007 | |||
| Par value reduction | Wednesday, July 18, 2007 | |||
| Second quarter results 2007 | Thursday, August 2, 2007 | |||
| Credit Suisse Group |
| Paradeplatz 8 |
| 8070 Zurich |
| Switzerland |
| Tel.+41 44 212 16 16 |
| Fax+41 44 333 25 87 |
| www.credit-suisse.com |
| 5520154 English |

Fourth Quarter and
Full Year Results 2006
Zurich
February 15, 2007
Oswald J. Grübel, Chief Executive Officer

Cautionary statement
Cautionary statement regarding forward-looking and non-GAAP information
This presentation contains forward-looking statements within the meaning of the Private
Securities Litigation Reform Act of 1995.
Forward-looking statements involve inherent risks and uncertainties, and we might not be
able to achieve the predictions, forecasts, projections and other outcomes we describe
or imply in forward-looking statements.
A number of important factors could cause results to differ materially from the plans,
objectives, expectations, estimates and intentions we express in these forward-looking
statements, including those we identify in "Risk Factors" in our Annual Report on Form
20-F for the fiscal year ended December 31, 2005 filed with the US Securities and
Exchange Commission, and in other public filings and press releases.
We do not intend to update these forward-looking statements except as may be required
by applicable laws.
This presentation contains non-GAAP financial information. Information needed to
reconcile such non-GAAP financial information to the most directly comparable measures
under GAAP can be found in Credit Suisse Group's fourth quarter report 2006.
Fourth quarter and full year results 2006
Slide 2
Record results in 2006
CHF bn
Change
in %
Fourth quarter and full year results 2006
Slide 3
2006
2005
Net revenues 1)
34.9
28.4
23
Total operating expenses 1)
24.3
23.2
5
Pre-tax income 1)
10.7
5.4
100
Income from continuing operations
8.3
4.5
83
Income from discontinued operations
3.1
1.3
134
Net income
11.3
5.9
94
Basic earnings per share (in CHF)
10.30
5.17
99
from continuing operations (in CHF)
7.53
3.98
89
Return on equity (in %)
27.5
15.4
1) Excluding minority interest revenues of CHF 3,663 m, CHF 2,074 m and minority interest expenses of CHF 103 m, CHF 32 m in 2006 and 2005,
respectively, from the consolidation of certain private equity funds and other entities in which the Group does not have a significant economic interest

Financial Review
Renato Fassbind, Chief Financial Officer
Financial highlights fourth quarter 2006
CHF m
2)
Fourth quarter and full year results 2006
Slide 5
4Q06
3Q06
4Q05
Investment Banking
2,342
758
286
Private Banking
1,143
1,022
1,026
Asset Management
89
158
241
Corporate Center 1)
(187)
(108)
(1,033)
Pre-tax income 1)
3,387
1,830
520
Income from continuing operations
2,599
1,468
677
Income from discontinued operations
2,074
424
426
Net income
4,673
1,892
1,103
Basic earnings per share (in CHF)
4.35
1.74
0.98
from continuing operations (in CHF)
2.42
1.35
0.59
1) Excluding minority interest revenues of CHF 998 m, CHF 640 m, CHF 554 m and minority interest expenses of CHF 71 m, CHF 10 m, CHF 15 m in 4Q06, 3Q06,
4Q05, respectively, from the consolidation of certain private equity funds and other entities in which the Group does not have a significant economic interest
2) Includes a charge of CHF 630 m in relation to the change in accounting for share-based compensation awards
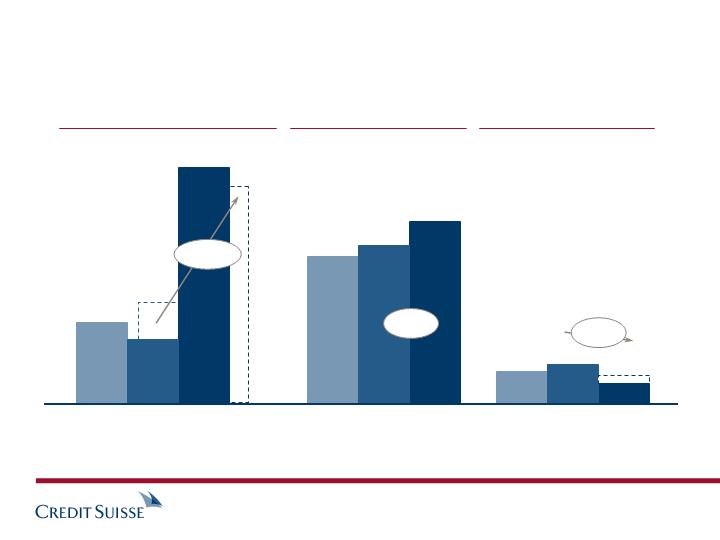
Annual pre-tax income by division
CHF m
1) Excluding charge of CHF 960 m to increase the reserve for certain private litigation matters
2) Excluding credits of CHF 508 m from insurance settlements for litigation and related costs
3) Excluding realignment costs of CHF 225 m
Investment Banking
Private Banking
Asset Management
2006
2005
2004
+16%
2,023
4,596
3,966
3,717
1,006
816
3)
508
2006
2005
2004
2006
2005
2004
5,951
2)
5,443
2,559
+113%
1)
733
(27)%
1,599
Fourth quarter and full year results 2006
Slide 6
Investment Banking with record fourth quarter and full
year results
Highlights fourth quarter 2006
Record revenues and pre-tax
income, reflecting strong
performance across all key
business areas and regions
Results demonstrate progress
towards a more profitable
integrated bank
Improving cost ratios in line with
commitment to improve operating
efficiency over time
Fourth quarter and full year results 2006
Slide 7
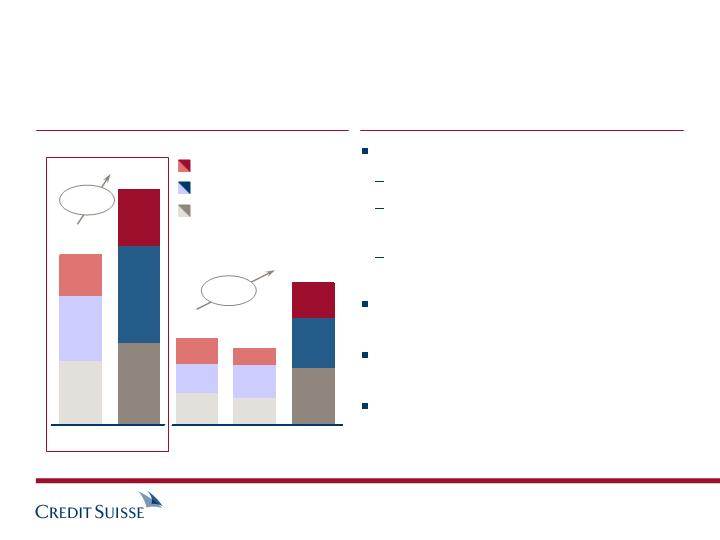
Underwriting and advisory with record revenues in all key
businesses
Record results driven by
high levels of deal activity
improved market shares in M&A and
equities
increased breadth and diversity of
businesses
Best Bank of the Year for IPOs
(The Banker)
Best China Equity House
(International Financing Review)
#1 in Latin America M&A and Equities
for 2006
Underwriting and advisory revenues
CHF m
Comments on 4Q06
2005
2006
4Q05
3Q06
4Q06
3,890
5,376
1,185
1,052
1,955
Equity underwriting
Debt underwriting
Advisory and other fees
+38%
+65%
Fourth quarter and full year results 2006
Slide 8
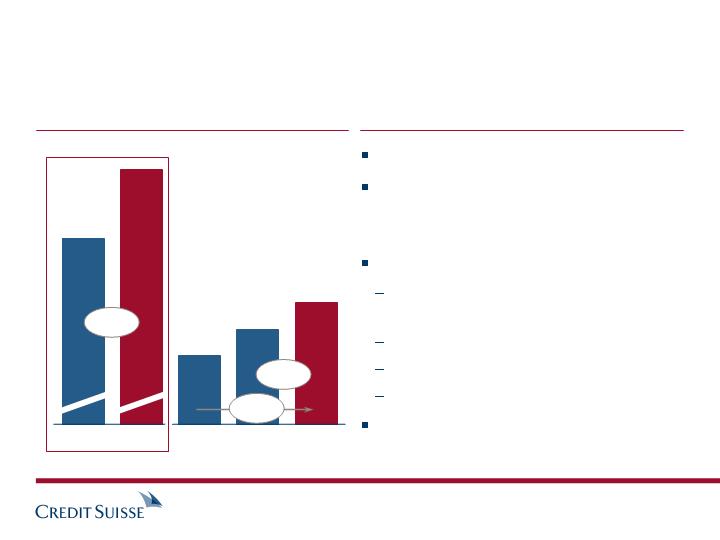
1'566
2'137
2'755
7,004
9,598
Strong fixed income trading results
2nd highest level of quarterly revenues
Credit spreads remained narrow
resulting in continued liquidity and solid
activity levels
Strong revenue growth in
commercial mortgage-backed
securities
emerging markets trading
global foreign exchange and
leveraged finance businesses
Solid growth in commodities trading
Fixed income trading revenues
CHF m
Comments on 4Q06
2005
2006
4Q05
3Q06
4Q06
+29%
+37%
+76%
Fourth quarter and full year results 2006
Slide 9
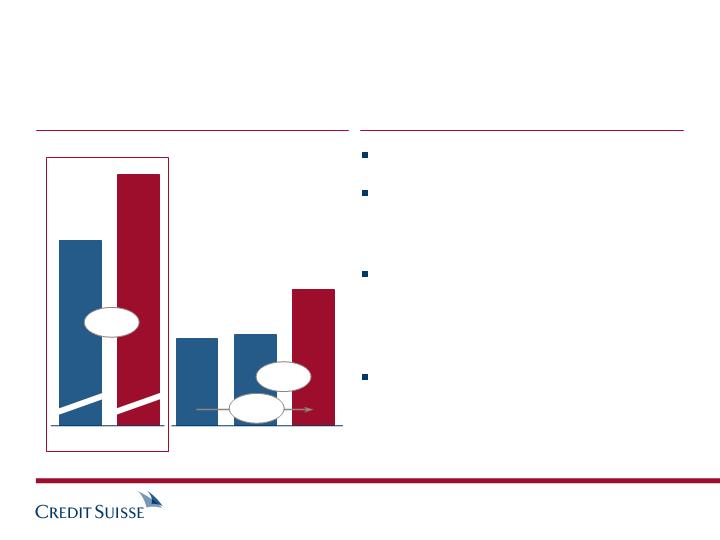
1,021
1,062
1,596
4,340
5,881
Significantly improved equity trading performance
2nd highest level of quarterly revenues
Improved results in derivatives
benefiting from high levels of client-
driven activity
Strong results in cash businesses, with
an increase in deal activity, stronger
secondary markets and good
performance in AES
Equity proprietary trading reported
strong results across most regions and
strategies
Equity trading revenues
CHF m
Comments on 4Q06
2005
2006
4Q05
3Q06
4Q06
+50%
+36%
+56%
AES = Advanced Execution Services
Fourth quarter and full year results 2006
Slide 10
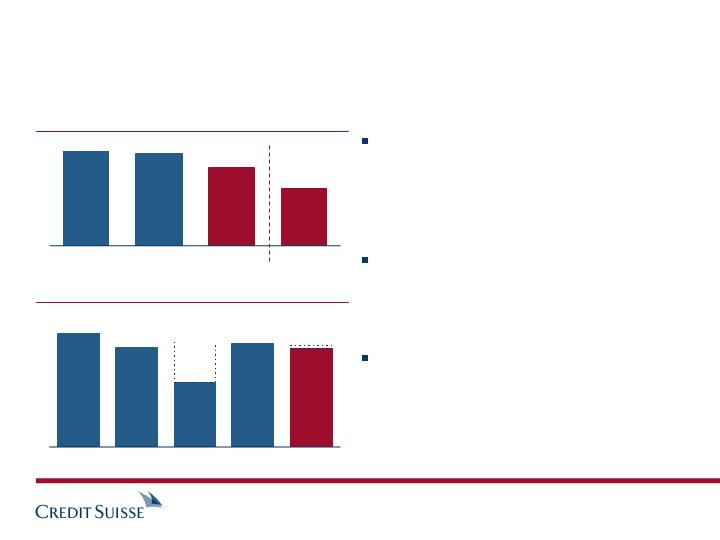
Cost reduction program gaining traction and yielding
positive initial results
1) Excluding credits of CHF 474 m and CHF 34 m, from insurance
settlements for litigation and related costs in 2Q06 and 4Q06, respectively
Compensation / Revenue ratio in %
2004
2005
2006
Other expenses
CHF m
4Q06
Continuing to execute a program to
achieve sustainable, long-term cost /
income ratio reductions
2006 compensation / revenue ratio
down from previous years and quarters
4Q06 non-compensation expenses
down from 3Q06 and 4Q05
4Q05
1Q06
2Q06
3Q06
4Q06
1,233 1)
1,191 1)
Fourth quarter and full year results 2006
Slide 11
56.5
55.5
50.1
42.2
1,326
1,168
759
1,211
1,157
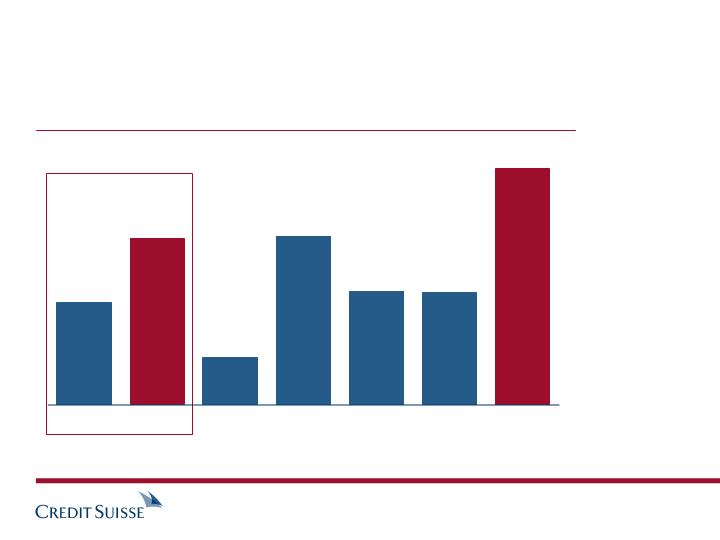
Progress in increasing the pre-tax margin
1) Excluding charge to increase the reserve for certain private litigation of CHF 960 m; reported margin was 10%
2) Excluding credits of CHF 474 m and CHF 34 m, from insurance settlements for litigation and related costs in 2Q06 and 4Q06, respectively;
reported margins were 29%, 39% and 29% in 2006, 4Q06 and 2Q06, respectively
Investment Banking pre-tax margin 1)
2005 1)
2006 2)
4Q05
1Q06
2Q06 2)
4Q06 2)
3Q06
Fourth quarter and full year results 2006
Slide 12
17%
27%
8%
27%
18%
18%
38%
Private Banking achieves record profitability in 2006
Highlights
Strong fourth quarter performances
in WM and CRB
Improving pre-tax income margins in
2006 while expanding investments
in high growth markets
Wealth Management achieved
overall profit in European onshore
business one year ahead of plan
WM = Wealth Management; CRB = Corporate & Retail Banking
Fourth quarter and full year results 2006
Slide 13
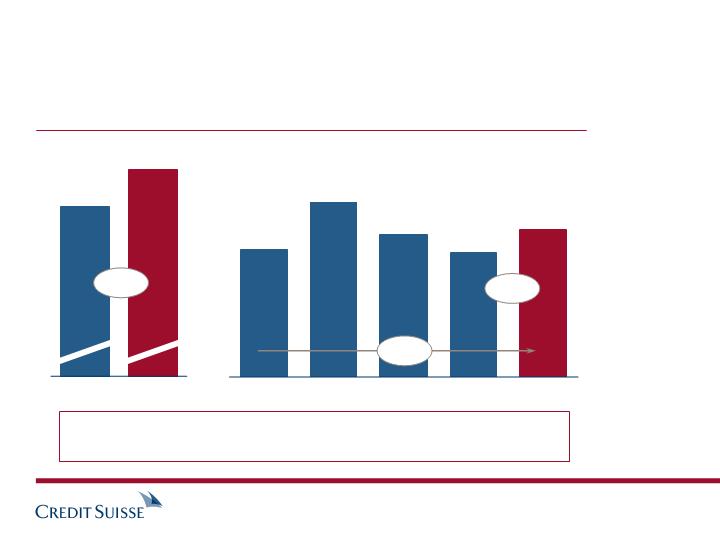
703
963
779
684
811
Increased profitability due to international expansion and
strong client activity
2005
2006
Wealth Management: Pre-tax income
CHF m
4Q05
1Q06
2Q06
3Q06
4Q06
+19%
+15%
+22%
2,661
3,237
Pre-tax income margin in %
37.3 39.6 37.6 43.2 38.3 37.1 39.0
Fourth quarter and full year results 2006
Slide 14
1,868
2,227
2,034
1,843
2,077
8,181
7,125
Wealth Management with solid revenue growth and stable
gross margin for the year
Net revenues and gross margin on AuM
CHF m and basis points (bp)
2005
2006
4Q05
1Q06
2Q06
+13%
+15%
+11%
109 bp
125 bp
113 bp
101 bp
109 bp
Gross margin on AuM
Basis points
2005
2006
113
112
Transaction-
based
Asset-
based
3Q06
4Q06
Fourth quarter and full year results 2006
Slide 15
73
40
71
41
42.8
14.5
16.5
10.9
8.6
50.5
Continued strength in asset gathering in
Wealth Management
693.3
40.4
50.5
784.2
+13.1%
Assets under management (AuM)
CHF bn
2005
1Q06
2Q06
3Q06
4Q06
31.12.2005
Net new
assets
Market and
FX related
movements
31.12.2006
2006
Net new assets (NNA)
CHF bn
Fourth quarter and full year results 2006
Slide 16
Rolling four quarters NNA growth on AuM in %
7.5
7.8
8.6
7.2
7.3
7.3
567
532
596
629
569
2,072
2,183
714
2,367
2,780
Improving pre-tax income margin while continuing
international expansion
Wealth Management: Total operating expenses
CHF m
2005
2006
4Q05
3Q06
4Q06
1,163
4,439
4,963
1,283
1,161
Up 17% from FY05, due to strategic
investments in international front-
office recruitment (added net 115
relationship managers in 2006) and
performance-related compensation
Compensation and benefits
Up 5% from FY05, mainly due to
higher commission expenses and
ongoing international business
growth
Other expenses
Fourth quarter and full year results 2006
Slide 17
Pre-tax income margin in%
37.3
39.6
37.6
37.1
39.0
322
338
1,359
1,305
332
Corporate & Retail Banking with continued high
profitability
2005
2006
4Q05
3Q06
4Q06
+4%
(2)%
+3%
Increase in 2006 pre-tax margin
reflecting revenue growth of 4%
and cost increase of 1%
Future releases of credit
provisions expected to slow
down due to a decline in the
amount of impaired loans
1) Negative numbers show net releases of provisions
Pre-tax income
CHF m
Fourth quarter and full year results 2006
Slide 18
Pre-tax income margin in%
38.7
38.9
38.0
40.3
37.1
Provisions for credit losses in CHF bn 1)
(96)
(54)
(23)
(17)
(24)
Asset Management completes business realignment while
launching growth initiatives in high margin areas
Highlights 2006
2006 results impacted by
realignment costs and lower
investment related gains
Strong growth in net new assets
with CHF 51 billion in 2006
Launch of several growth initiatives
in high margin areas including
acquisition of Hedging-Griffo
Fourth quarter and full year results 2006
Slide 19
549
550
560
603
646
Increased recurring revenue base growth, but lower
investment-related gains in 2006
2005
2006
4Q05
1Q06
2Q06
3Q06
4Q06
+7%
+18%
+12%
698
502
2,103
2,359
1) Based on revenues before private equity and other investment-related gains
(28)%
Net revenues
CHF m
Fourth quarter and full year results 2006
Slide 20
208
206
115
89
92
Asset management
revenues and
private equity
commissions
Private equity and
other investment-
related gains
Gross margin on AuM in basis points 1)
40.9
37.3
39.1
36.2
36.5
37.8
38.7
Strong net new assets and good growth in assets under
management during 2006
1Q
2Q
3Q
4Q
2005
FY
Net new assets (NNA)
CHF bn
Assets under management (AuM)
CHF bn
589.4
50.8
29.7
669.9
31.12.2005
Market and
FX related
movements
Net new
assets
31.12.2006
+13.7%
1Q
2Q
3Q
4Q
FY
2006
17.0
15.5
21.2
(2.9)
50.8
3.9
11.4
5.1
(0.8)
19.6
Fourth quarter and full year results 2006
Slide 21
NNA growth on AuM
2006: 8.6%
2005: 4.2%
7%
15%
16%
21%
41%
48
64
110
113
255
47
101
107
137
277
Equities
Money
Markets
Fixed
Income
Alternative
Balanced
31.12.2006
31.12.2005
As of 31.12.2006
Well-diversified asset class mix
Assets under management by asset class
CHF bn
Balanced
Alternative
Fixed income
Money
markets
Equities
Change
9%
21%
(3%)
58%
(2%)
Note: Includes reclassifications of approx. CHF 10 bn from fixed income to money market and balanced
Fourth quarter and full year results 2006
Slide 22
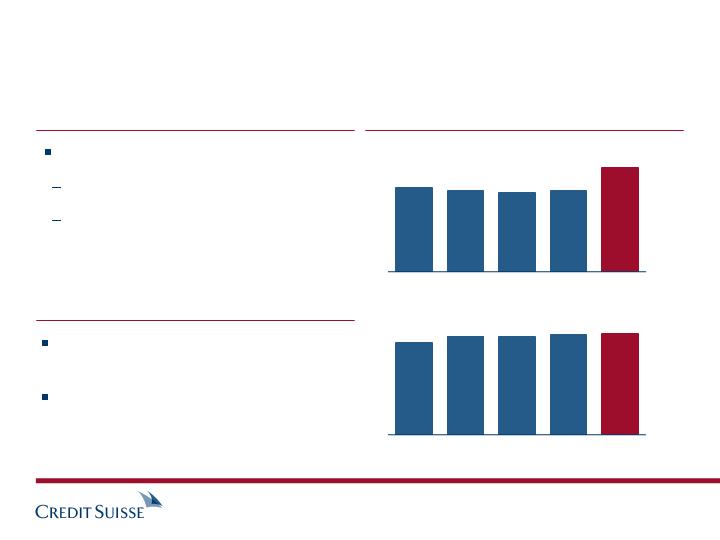
233
248
245
252
254
11.3
10.8
10.6
10.8
13.9
Increased capital payout and strong capital position
BIS Tier 1 data
Tier 1 ratio
(%)
Risk-weighted assets
(CHF bn)
4Q05
3Q06
4Q06
2Q06
1Q06
4Q05
3Q06
4Q06
2Q06
1Q06
Capital payout (per share)
Share repurchases
1) Subject to approval at shareholder meeting in May 2007
Fourth quarter and full year results 2006
Slide 23
Increased 2006 payout to CHF 2.70 1)
Regular cash dividend of CHF 2.24
Capital return of CHF 0.46 in form of
par value reduction
Launch new three-year program worth
up to CHF 8 bn 1)
Complete current CHF 6 bn program
in April 2007
12
11
14
44
7
31
16
15
28
Credit Suisse performance indicators
2004
2005
2006
in %
1) from continuing operations as reported in respective period
2) Excluding minority interest revenues before tax of CHF 1,088 m, CHF 2,074 m, CHF 3,663 m and minority interest expenses before tax of CHF 16 m,
CHF 32 m, CHF 103 m in 2004, 2005 and 2006, respectively, from the consolidation of certain private equity funds and other entities in which
the Group does not have a significant economic interest
2004
2005
2006
in %
2004
2005
2006
in %
2004
2005
2006
in %
2004
2005
2006
in %
2004
2005
2006
in %
Fourth quarter and full year results 2006
Slide 24
84
238
5
3
5
7
75
82
70
Diluted EPS
growth 1)
NNA growth
(on assets under
management)
Cost /
Income
ratio 2)
Return on
equity
Total
shareholder
return
BIS Tier 1
capital ratio

Closing Remarks
Questions & Answers
SIGNATURES
Pursuant to the requirements of the Securities Exchange Act of 1934, the registrant has duly caused this report to be signed on its behalf by the undersigned, thereunto duly authorized.
|
| CREDIT SUISSE GROUP |
|
| (Registrant) |
|
|
|
| By: | /s/ Urs Rohner |
|
| (Signature)* |
|
| General Counsel |
Date: February 15, 2007 |
|
|
|
| /s/ Charles Naylor |
*Print the name and title under the signature of the signing officer. |
| Head of Corporate Communications |