UNITED STATES
SECURITIES AND EXCHANGE COMMISSION
Washington, D.C. 20549
______________
Form 6-K
______________
REPORT OF FOREIGN PRIVATE ISSUER PURSUANT TO RULE 13a-16 OR 15d-16
UNDER THE SECURITIES EXCHANGE ACT OF 1934
October 21, 2010
Commission File Number 001-15244
CREDIT SUISSE GROUP AG
(Translation of registrant’s name into English)
Paradeplatz 8, P.O. Box 1, CH-8070 Zurich, Switzerland
(Address of principal executive office)
______________
Commission File Number 001-33434
CREDIT SUISSE AG
(Translation of registrant’s name into English)
Paradeplatz 8, P.O. Box, CH-8070 Zurich, Switzerland
(Address of principal executive office)
______________
Indicate by check mark whether the registrant files or will file annual reports under cover of Form 20-F or Form 40-F.
Form 20-F  | Form 40-F  |
Indicate by check mark if the registrant is submitting the Form 6-K in paper as permitted by Regulation S-T Rule 101(b)(1):
Note: Regulation S-T Rule 101(b)(1) only permits the submission in paper of a Form 6-K if submitted solely to provide an attached annual report to security holders.
Indicate by check mark if the registrant is submitting the Form 6-K in paper as permitted by Regulation S-T Rule 101(b)(7):
Note: Regulation S-T Rule 101(b)(7) only permits the submission in paper of a Form 6-K if submitted to furnish a report or other document that the registrant foreign private issuer must furnish and make public under the laws of the jurisdiction in which the registrant is incorporated, domiciled or legally organized (the registrant’s “home country”), or under the rules of the home country exchange on which the registrant’s securities are traded, as long as the report or other document is not a press release, is not required to be and has not been distributed to the registrant’s security holders, and, if discussing a material event, has already been the subject of a Form 6-K submission or other Commission filing on EDGAR.
Indicate by check mark whether the registrant by furnishing the information contained in this Form is also thereby furnishing the information to the Commission pursuant to Rule 12g3-2(b) under the Securities Exchange Act of 1934.
Yes | No |
If “Yes” is marked, indicate below the file number assigned to the registrant in connection with Rule 12g3-2(b): 82-.
| CREDIT SUISSE GROUP AG | ||
Paradeplatz 8 P.O. Box CH-8070 Zurich Switzerland | Telephone +41 844 33 88 44 Fax +41 44 333 88 77 media.relations@credit-suisse.com | |
Media Release |
Credit Suisse Group reports net income of CHF 0.6 billion in 3Q10; underlying net income of CHF 1 billion*; total net new assets of CHF 14.6 billion and tier 1 ratio of 16.7% |
All divisions profitable in a difficult quarter characterized by low market volumes and subdued client activity. Continued disciplined investments position Credit Suisse well for market recovery Private Banking: encouraging performance in an environment marked by very low client activity o Pre-tax income of CHF 836 million o Net new assets of CHF 12.6 billion in Private Banking o Wealth Management Clients with pre-tax income of CHF 612 million and gross margin at 118 basis points o Corporate & Institutional Clients with pre-tax income of CHF 224 million with continued strong pre-tax profit margin Investment Banking: solid market share performance in a weak revenue environment o Pre-tax income of CHF 395 million o Solid revenues in fixed income sales and trading, and underwriting and advisory o Equities down vs. previous quarter due to lower industry-wide client volumes Asset Management: continued progress in implementing strategy and building third-party capital and fee-based business model o Pre-tax income of CHF 135 million o Agreement to acquire noncontrolling stake in York Capital Management furthers strategy to build higher margin, capital-efficient business o Net new assets of CHF 3.6 billion continues trend with positive inflows for the fifth consecutive quarter Results in 9M10 continue to underscore value of Credit Suisse’s strategy, business model and sustainability of performance: o Net income of CHF 4.3 billion o Return on equity of 15.9% o Total net new assets of CHF 55.1 billion |
| Media Release | |
October 21, 2010 Page 2/8 |
Zurich, October 21, 2010 Credit Suisse Group reported net income of CHF 609 million in 3Q10 compared to CHF 1,593 million in 2Q10. Core net revenues were CHF 6,284 million in 3Q10 compared to CHF 8,420 million in 2Q10. Underlying net income was CHF 960 million. The return on equity was 7.0% in 3Q10 with the underlying return on equity at 11.2%. Diluted earnings per share were CHF 0.48. The tier 1 ratio was 16.7% as of the end of 3Q10.
Brady W. Dougan, Chief Executive Officer, said: “Delivering underlying net income of one billion Swiss francs was a solid result in a quarter characterized by challenging conditions with low market volumes and subdued client activity. We are continuing to make disciplined investments in client-focused, capital- efficient, high-return businesses. These investments have expanded our market share in the targeted businesses and are producing strong net new assets. Our strategy had already anticipated the impact of tighter regulation, both in Investment Banking, where we have exited less capital-efficient businesses, and in Private Banking, where we have continued to build our global on and off-shore presence. We have built a business model, global platform and a strong market position which will enable us to deliver high returns and generate stro ng cash flow as markets improve.”
He added: “We saw an encouraging performance in Private Banking, which continued to attract strong net new assets with a particularly strong performance from Asia Pacific, where we saw annualized growth of over 20%. This underscores the trust clients have in Credit Suisse. Revenues have remained relatively subdued and this business is near a cyclical low characterized by the low interest rate environment and further impacted by low levels of client activity. However, we believe the prospects for growth remain very attractive and our Private Bank is poised to capitalize as markets improve thanks to our disciplined investment in our global platform. In Switzerland, our Corporate & Institutional Clients business, which is an important provider of financing and services to the Swiss economy, achieved another strong result and maintained a str ong pre-tax profit margin.”
With regard to Investment Banking, he said: “We are encouraged by our continued momentum in gaining market share. Fixed income and our underwriting and advisory businesses achieved a solid performance reflecting our improving competitive position. In equities the performance of our client-focused business was in line with industry volume. Equities has also shown lower overall revenue volatility year to date than the industry, underscoring our continued strong client-focused market positions.”
On the performance of Asset Management, he said “We are pleased with the strategic progress, the solid result and the strong net asset inflows. The announced acquisition of a noncontrolling interest in York Capital Management is an important next step in the continuing implementation of a strategy focused on high margin, capital-efficient businesses capable of leveraging our global platform.”
He concluded: “Our results for the first nine months, with a return on equity of 15.9%, underscore that our business model is able to produce strong returns over the cycle. We anticipated much of the regulatory change, both in terms of capital requirements and the new cross-border regime. This means that we are well placed to meet these new requirements and at the same time compete and deliver attractive returns to our shareholders.”
| Media Release | |
October 21, 2010 Page 3/8 |
| in CHF million | 9M10 | 9M09 | 3Q10 | 2Q10 | 3Q09 | Change in % | Change in % |
| 3Q10 vs. 2Q10 | 3Q10 vs. 3Q09 | ||||||
| Net income attributable to shareholders | 4,257 | 5,931 | 609 | 1,593 | 2,354 | (62) | (74) |
| Diluted earnings per share (CHF) | 3.29 | 4.59 | 0.48 | 1.15 | 1.81 | (58) | (73) |
| Return on equity attributable to shareholders (annualized) | 15.9% | 21.8% | 7% | 17.8% | 25.1% | - | - |
| Tier 1 ratio (end of period) | - | - | 16.7% | 16.3% | 16.4% | - | - |
Core results 1) | |||||||
| Net revenues | 23,665 | 27,084 | 6,284 | 8,420 | 8,917 | (25) | (30) |
| Provision for credit losses | (56) | 546 | (26) | 20 | 53 | - | - |
| Total operating expenses | 18,228 | 19,300 | 5,557 | 6,594 | 6,244 | (16) | (11) |
| Income from continuing operations before taxes | 5,493 | 7,238 | 753 | 1,806 | 2,620 | (58) | (71) |
1) Core Results include the results of the three segments, the Corporate Center and discontinued operations, but do not include noncontrolling interests without significant economic interest. | |||||||
Segment Results
Private Banking
Private Banking, which comprises the Wealth Management Clients and Corporate & Institutional Clients businesses, reported income before taxes of CHF 836 million in 3Q10. This included non-credit related provisions from auction rate securities (ARS) of CHF 44 million. While this was a solid result in view of the subdued 3Q10 market environment, characterized by a seasonal slowdown, it was 4% below the 2Q10 level. This reflected a 6% decline in net revenues to CHF 2,826 million, mainly due to lower brokerage fees, while total operating expenses decreased 5%.
The Wealth Management Clients business reported income before taxes of CHF 612 million in 3Q10, down 3% from 2Q10. Net revenues were 5% lower than in 2Q10. Recurring revenues were down 4% reflecting a decrease in net interest income and lower recurring commissions and fees. Transaction-based revenues declined 9%, mainly related to significantly lower brokerage fees and foreign exchange income from client transactions, reflecting the seasonal slowdown and particularly low client activity. The gross margin was 118 basis points, down 2 basis points from 2Q10, reflecting mainly the decrease in net revenues and the 3.4% lower average assets under management. Despite the non-credit related provisions from ARS, operating expenses decreased 5% from reductions across most expense ca tegories, including IT costs and seasonally lower marketing and sales expenses as a major driver.
The Corporate & Institutional Clients business, which is an important provider of financing and services to the Swiss economy, reported income before taxes of CHF 224 million in 3Q10, down 7% from 2Q10. Net revenues declined 7% compared to 2Q10 reflecting a 5% decline in net interest income and 12% lower non-interest income. The decrease in net interest income mainly reflected lower loan margins on slightly lower average volumes and slightly lower deposit margins on stable average volumes. Non-interest income declined to CHF 153 million as fair value losses related to Clock Finance, a synthetic collateralized loan portfolio, totaled CHF 21 million compared to losses of CHF 1 million in 2Q10 . Excluding Clock Finance losses, underlying non-interest income remained stable. Despite the higher number of corporate insolvencies in Switzerland, further net releases of provision for credit losses of CHF 16 million were booked in 3Q10 after releases of CHF 13 million in 2Q10.
| Media Release | |
October 21, 2010 Page 4/8 |
Investment Banking
Investment Banking reported income before taxes of CHF 395 million in 3Q10, down 50% compared to 2Q10, as the business was impacted by a decline in client volumes that was exacerbated by a seasonal slowdown. Net revenues of CHF 3,421 million were underpinned by solid fixed income sales and trading as well as underwriting and advisory business despite the challenging market conditions, with market share momentum maintained across most products. Compared to 2Q10, net revenues declined 17%, reflecting a particularly weak July, normal summer seasonality in August and some improvement in September. Investment Banking’s results reflected net fair value losses on Credit Suisse debt of CHF 57 million in 3Q10, compared to CHF 62 million in 2Q10. The results were also impacted by debt valuation adjustment (DVA) losses of CHF 172 million in 3Q10 comp ared to DVA gains of CHF 121 million in 2Q10, relating to structured note liabilities. The pre-tax income margin was 11.5% compared to 19.1% in 2Q10. The pre-tax return on average utilized economic capital was 8.5% in 3Q10, compared to 15.8% in 2Q10.
Fixed income sales and trading results were higher than in the prior quarter, driven by strong revenues in US residential mortgage backed securities (RMBS) trading and credit businesses with solid results in global rates and emerging markets. Equity sales and trading results reflected our client-focused business model which saw continued momentum in market share and was impacted by lower client volume. Underwriting and advisory results were solid and in line with industry-wide capital issuance levels and M&A activity. Debt underwriting revenues were strong, driven by higher industry-wide issuance levels, particularly in high yield while revenues in the equity underwriting and advisory businesses reflected continued weakness in equity issuance levels and completed M&A volumes compared to historical levels.
Compensation and benefits of CHF 1,872 million in 3Q10 were lower than 2Q10, primarily reflecting the foreign exchange translation impact. In US dollars, compensation and benefits increased slightly compared to 2Q10, reflecting a small increase in performance-related compensation and benefits largely offset by a decrease in social security taxes on share award deliveries. Total other operating expenses decreased 9% from 2Q10, primarily reflecting the foreign currency translation impact, a slight decrease in commission expenses and a decrease in general and administrative expenses across most expense categories.
Risk-weighted assets of USD 151 billion as of the end of 3Q10 rose from USD 142 billion in 2Q10, primarily related to higher lending commitments in leveraged finance and corporate banking, the foreign exchange translation impact on the operational risk component and increase in other client-related risk-weighted asset usage. Average one-day, 99% Value at Risk was CHF 118 million in 3Q10, compared to CHF 117 million in 2Q10.
Asset Management
Asset Management reported income before taxes of CHF 135 million in 3Q10 compared to CHF 22 million in 2Q10, with net revenues of CHF 582 million compared to CHF 502 million in 2Q10, primarily reflecting higher investment-related gains and increased fee-based revenues partially offset by lower income from equity participations and 2Q10 gains of CHF 36 million from the sale of securities purchased from Credit Suisse money market funds. Net revenues before investment-related gains and securities purchased from Credit Suisse money market funds were up 2%. The increase in fee-based revenues was driven by higher performance fees and carried interest, partially offset by lower asset management and placement, transaction and other fees.
| Media Release | |
October 21, 2010 Page 5/8 |
Income from equity participations declined, reflecting a loss from the reduction in our ownership interest in Aberdeen to 21.0% from 21.9% due to an issuance of shares by Aberdeen. Total operating expenses were down 7% reflecting a decrease in compensation and benefits and lower commission expenses.
In 3Q10, Asset Management agreed to acquire a significant noncontrolling interest in York Capital Management (York), a leading global event-driven hedge fund manager, with the transaction expected to close in the fourth quarter of 2010. In addition, Asset Management expects to enter into arrangements to provide distribution services to York funds on a non-exclusive basis. The acquisition was part of the implementation of Credit Suisse’s strategy to focus on higher margin, capital-efficient businesses able to leverage our global platform.
| in CHF million | 3Q10 | 2Q10 | 3Q09 | Change in % | Change in % | |
| vs. 2Q10 | vs. 3Q09 | |||||
| Private | Net revenues | 2,826 | 2,991 | 2,833 | (6) | 0 |
| Banking | Provision for credit losses | (8) | 3 | 35 | - | - |
| Total operating expenses | 1,998 | 2,114 | 1,931 | (5) | 3 | |
| Income before taxes | 836 | 874 | 867 | (4) | (4) | |
| Investment | Net revenues | 3,421 | 4,099 | 5,046 | (17) | (32) |
| Banking | Provision for credit losses | (18) | 17 | 18 | - | - |
| Total operating expenses | 3,044 | 3,298 | 3,282 | (8) | (7) | |
| Income before taxes | 395 | 784 | 1,746 | (50) | (77) | |
| Asset | Net revenues | 582 | 502 | 765 | 16 | (24) |
| Management | Provision for credit losses | 0 | 0 | 0 | - | - |
| Total operating expenses | 447 | 480 | 454 | (7) | (2) | |
| Income before taxes | 135 | 22 | 311 | - | (57) | |
Net New Assets
Private Banking recorded strong net new assets of CHF 12.6 billion in 3Q10. Wealth Management Clients contributed net new assets of CHF 12.4 billion benefiting from substantial inflows in the international businesses, including strong contributions from emerging markets. The annualized quarterly growth rate in net new assets in Wealth Management Clients was 6.2% in 3Q10. Corporate & Institutional Clients acquired net new assets of CHF 0.2 billion.
Asset Management reported net new assets of CHF 3.6 billion including net inflows of CHF 5.2 billion in alternative investments, primarily in real estate & commodities, emerging markets, exchange traded funds (ETFs) and index strategies, and outflows of CHF 1.5 billion in traditional investments, as outflows in the Swiss advisory business and fixed income & equities were partially offset by inflows in multi-asset class solutions.
The Group’s total assets under management were CHF 1,251.2 billion as of the end of 3Q10, up 0.7% from the end of 2Q10, primarily reflecting positive market performance and net new assets in Private Banking and Asset Management, partially offset by adverse foreign exchange-related movements.
| Media Release | |
October 21, 2010 Page 6/8 |
Benefits of the integrated bank
Credit Suisse generated CHF 1.0 billion in collaboration revenues from the integrated bank in 3Q10 compared to CHF 1.2 billion in 2Q10, bringing the total in 9M10 to CHF 3.2 billion.
Capital position
Credit Suisse’s capital position remains very strong. The tier 1 ratio was 16.7% as of the end of 3Q10, compared to 16.3% as of the end of 2Q10.
First nine months of 2010
Credit Suisse Group reported net income of CHF 4,257 million in 9M10, compared to CHF 5,931 million in the prior-year period. Core net revenues were CHF 23,665 million compared to CHF 27,084 million in the prior-year period. The return on equity was 15.9% and diluted earnings per share were CHF 3.29. Total net new assets were CHF 55.1 billion.
| Nine Months | ||||
| in CHF billion | 9M10 | 9M09 | % change | |
| Financial Highlights | Net income attributable to shareholders | 4,257 | 5,931 | (28) |
| Diluted earnings per share (CHF) | 3.29 | 4.59 | (28) | |
| Return on equity attributable to shareholders (annualized) | 15.9% | 21.8% | - | |
| Private Banking | Income before taxes | 2,602 | 2,794 | (7) |
| Investment Banking | Income before taxes | 2,973 | 5,815 | (49) |
| Asset Management | Income before taxes | 323 | (124) | - |
* Underlying net income (3Q10): Excludes net fair value charges on Credit Suisse vanilla debt of CHF 589 million (before tax) due to tightening credit spreads and cross currency swaps relating to Credit Suisse long-term debt, a non-taxable benefit of CHF 43 million relating to the UK levy on variable compensation and litigation charges of CHF 73 million (before tax), yielding underlying net income adjusted for a normalized tax rate of CHF 960 million.
Information
Media Relations Credit Suisse AG, telephone +41 844 33 88 44, media.relations@credit-suisse.com
Investor Relations Credit Suisse AG, telephone +41 44 333 71 49, investor.relations@credit-suisse.com
Credit Suisse AG
Credit Suisse AG is one of the world's leading financial services providers and is part of the Credit Suisse group of companies (referred to here as 'Credit Suisse'). As an integrated bank, Credit Suisse offers clients its combined expertise in the areas of private banking, investment banking and asset management. Credit Suisse provides advisory services, comprehensive solutions and innovative products to companies, institutional clients and high-net-worth private clients globally, as well as to retail clients in Switzerland. Credit Suisse is headquartered in Zurich and operates in over 50 countries worldwide. The group employs approximately 50,500 people. The registered shares (CSGN) of Credit Suisse's parent company, Credit Suisse Group AG, are listed in Switzerland and, in the form of American Depositary Shares (CS), in New York. Further informa tion about Credit Suisse can be found at www.credit-suisse.com.
Cautionary statement regarding forward-looking information and non-GAAP information
This press release contains statements that constitute forward-looking statements within the meaning of the Private Securities Litigation Reform Act. In addition, in the future we, and others on our behalf, may make statements that constitute forward-looking statements. Such forward-looking statements may include, without limitation, statements relating to the following:
| – | our plans, objectives or goals; |
| – | our future economic performance or prospects; |
| Media Release | |
October 21, 2010 Page 7/8 |
| – | the potential effect on our future performance of certain contingencies; and |
| – | assumptions underlying any such statements. |
Words such as “believes,” “anticipates,” “expects,” “intends” and “plans” and similar expressions are intended to identify forward-looking statements but are not the exclusive means of identifying such statements. We do not intend to update these forward-looking statements except as may be required by applicable securities laws. By their very nature, forward-looking statements involve inherent risks and uncertainties, both general and specific, and risks exist that predictions, forecasts, projections and other outcomes described or implied in forward-looking statements will not be achieved. We caution you that a number of important factors could cause results to differ materially from the plans, objectives, expectations, estimates and intentions expressed in such forward-looking statements . These factors include:
| – | the ability to maintain sufficient liquidity and access capital markets; |
| – | market and interest rate fluctuations; |
| – | the strength of the global economy in general and the strength of the economies of the countries in which we conduct our operations, in particular the risk of a continued US or global economic downturn in 2010 and beyond; |
| – | the direct and indirect impacts of continuing deterioration of subprime and other real estate markets; |
| – | further adverse rating actions by credit rating agencies in respect of structured credit products or other credit-related exposures or of monoline insurers; |
| – | the ability of counterparties to meet their obligations to us; |
| – | the effects of, and changes in, fiscal, monetary, trade and tax policies, and currency fluctuations; |
| – | political and social developments, including war, civil unrest or terrorist activity; |
| – | the possibility of foreign exchange controls, expropriation, nationalization or confiscation of assets in countries in which we conduct our operations; |
| – | operational factors such as systems failure, human error, or the failure to implement procedures properly; |
| – | actions taken by regulators with respect to our business and practices in one or more of the countries in which we conduct our operations; |
| – | the effects of changes in laws, regulations or accounting policies or practices; |
| – | competition in geographic and business areas in which we conduct our operations; |
| – | the ability to retain and recruit qualified personnel; |
| – | the ability to maintain our reputation and promote our brand; |
| – | the ability to increase market share and control expenses; |
| – | technological changes; |
| – | the timely development and acceptance of our new products and services and the perceived overall value of these products and services by users; |
| – | acquisitions, including the ability to integrate acquired businesses successfully, and divestitures, including the ability to sell non-core assets; |
| – | the adverse resolution of litigation and other contingencies; |
| – | the ability to achieve our cost efficiency goals and other cost targets; and |
| – | our success at managing the risks involved in the foregoing. |
We caution you that the foregoing list of important factors is not exclusive. When evaluating forward-looking statements, you should carefully consider the foregoing factors and other uncertainties and events, as well as the information set forth in our Annual Report 2009 under IX – Additional information – Risk Factors.
This press release contains non-GAAP financial information. Information needed to reconcile such non-GAAP financial information to the most directly comparable measures under GAAP can be found in the Credit Suisse Financial Release 3Q10.
| Media Release | |
October 21, 2010 Page 8/8 |
Presentation of Credit Suisse Group’s 3Q10 results via audio webcast and telephone conference
Date Thursday, October 21, 2010
Time 09:00 Zurich / 08:00 London / 03:00 New York
Speakers Brady W. Dougan, Chief Executive Officer
David Mathers, Chief Financial Officer
The presentations will be held in English.
Audio webcast www.credit-suisse.com/results
Telephone Switzerland: +41 44 580 40 01
Europe: +44 1452 565 510
US: +1 866 389 9771
Reference: Credit Suisse Group quarterly results
| Q&A session | You will have the opportunity to ask questions during the telephone conference following the presentations. |
Playback Playback available approximately 2 hours after the event at
www.credit-suisse.com/results or on the telephone numbers below:
Switzerland:+41 44 580 34 56
Europe: +44 1452 550 000
US: +1 866 247 4222
Conference ID: 16597995#

Third Quarter 2010 Results
Zurich
October 21, 2010

Cautionary statement regarding forward-looking and non-GAAP information
This presentation contains forward-looking statements within the meaning of the Private Securities
Litigation Reform Act of 1995. Forward-looking statements involve inherent risks and uncertainties,
and we might not be able to achieve the predictions, forecasts, projections and other outcomes we
describe or imply in forward-looking statements.
Litigation Reform Act of 1995. Forward-looking statements involve inherent risks and uncertainties,
and we might not be able to achieve the predictions, forecasts, projections and other outcomes we
describe or imply in forward-looking statements.
A number of important factors could cause results to differ materially from the plans, objectives,
expectations, estimates and intentions we express in these forward-looking statements, including
those we identify in "Risk Factors" in our Annual Report on Form 20-F for the fiscal year ended
December 31, 2009 filed with the US Securities and Exchange Commission, and in other public
filings and press releases. We do not intend to update these forward-looking statements except as
may be required by applicable laws.
This presentation contains non-GAAP financial information. Information needed to reconcile such
non-GAAP financial information to the most directly comparable measures under GAAP can be
found in Credit Suisse Group's third quarter report 2010.
non-GAAP financial information to the most directly comparable measures under GAAP can be
found in Credit Suisse Group's third quarter report 2010.
Third Quarter 2010 Results
Slide 1
Cautionary statement
Third quarter 2010 results detail
David Mathers, Chief Financial Officer
Introduction
Brady W. Dougan, Chief Executive Officer
Regulatory capital review
David Mathers, Chief Financial Officer
Summary
Brady W. Dougan, Chief Executive Officer
Third Quarter 2010 Results
Slide 2
3Q10:
Good result in a
quarter characterized
by challenging
conditions with low
market volumes and
subdued client
activity
quarter characterized
by challenging
conditions with low
market volumes and
subdued client
activity
Strongly positioned
with a distinctive
strategy
with a distinctive
strategy
§ Anticipated regulatory changes
§ Client-focused and capital-efficient business model
§ Ability to deliver high returns and book value accretion
§ Underlying net income of CHF 1 bn and underlying RoE of 11%
(CHF 4.0 bn and 15% in 9M10)
(CHF 4.0 bn and 15% in 9M10)
§ Solid pre-tax income in Private Bank with continued strong Wealth
Management inflows of CHF 12.4 bn; gross margin at 118 bp
Management inflows of CHF 12.4 bn; gross margin at 118 bp
§ Investment Banking with maintained market share performance in a weak
revenue environment, exacerbated by the seasonal slowdown
revenue environment, exacerbated by the seasonal slowdown
§ Asset Management with continued progress to grow its core business; net
new assets of CHF 3.6 bn represent positive asset flows for the fifth
consecutive quarter
new assets of CHF 3.6 bn represent positive asset flows for the fifth
consecutive quarter
Third Quarter 2010 Results
Slide 3
Introduction
Third quarter 2010 results detail
David Mathers, Chief Financial Officer
Introduction
Brady W. Dougan, Chief Executive Officer
Regulatory capital review
David Mathers, Chief Financial Officer
Summary
Brady W. Dougan, Chief Executive Officer
Third Quarter 2010 Results
Slide 4
Core results in CHF bn 3Q10 2Q10 3Q09 9M10 9M09
Net revenues
Pre-tax income
Net income attributable to shareholders
Diluted earnings per share in CHF
Return on equity
Net new assets in CHF bn
Underlying results
Third Quarter 2010 Results
Slide 5
6.3 8.4 8.9 23.7 27.1
0.8 1.8 2.6 5.5 7.2
0.6 1.6 2.4 4.3 5.9
0.48 1.15 1.81 3.29 4.59
7% 18% 25% 16% 22%
14.6 14.5 16.7 55.1 31.7
Net revenues
Pre-tax income
Net income
Return on equity
6.9 7.5 9.0 23.1 27.7
1.4 1.6 2.9 5.7 8.6
1.0 1.1 2.2 4.0 6.3
11% 12% 23% 15% 23%
Results overview

1) Excluding non-credit related provisions of CHF 44 m related to ARS in 3Q10
Third Quarter 2010 Results
Slide 6
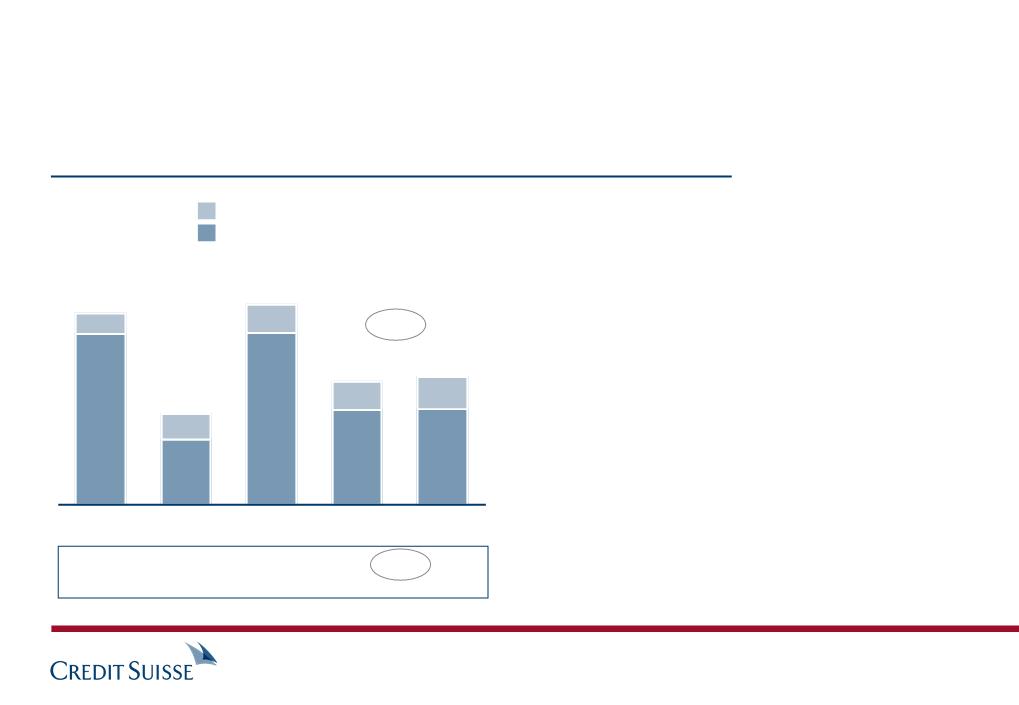
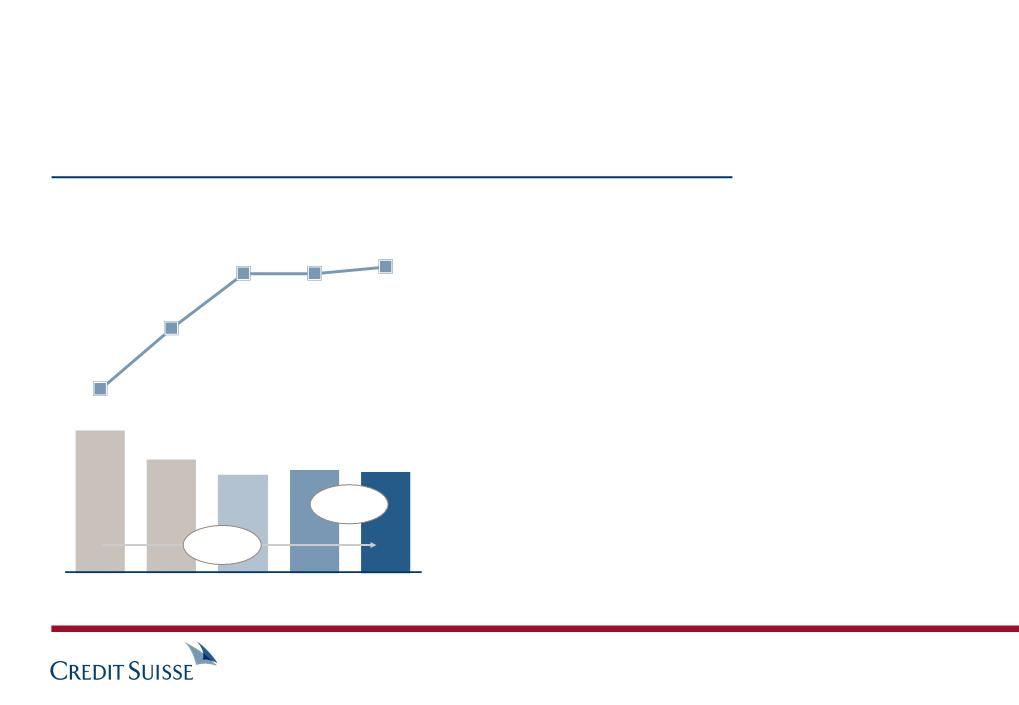
Private Banking with continued strong asset inflows and
solid pre-tax income, despite seasonally low client activity
solid pre-tax income, despite seasonally low client activity
§ Continued strong net new assets evidencing the strength and resilience of our
business model
business model
– Net new assets of CHF 12.4 bn in Wealth Management at 6.2% annualized growth
rate with 20% growth in Asia Pacific
rate with 20% growth in Asia Pacific
– 9M10 net new assets in Wealth Management of CHF 37.2 bn and in total
CHF 45.0 bn for Private Banking, already exceeding FY 2009 amounts
CHF 45.0 bn for Private Banking, already exceeding FY 2009 amounts
§ Solid pre-tax income, despite seasonal summer slowdown leading to lower
brokerage revenues
brokerage revenues
– Underlying pre-tax income of CHF 880 m1) ahead of 2Q10 and 3Q09
– Gross margin at 118 basis points in Wealth Management
§ Continued upgrading of relationship managers (up 60 net, 140 gross)
§ Corporate & Institutional Clients business continues to deliver strong results
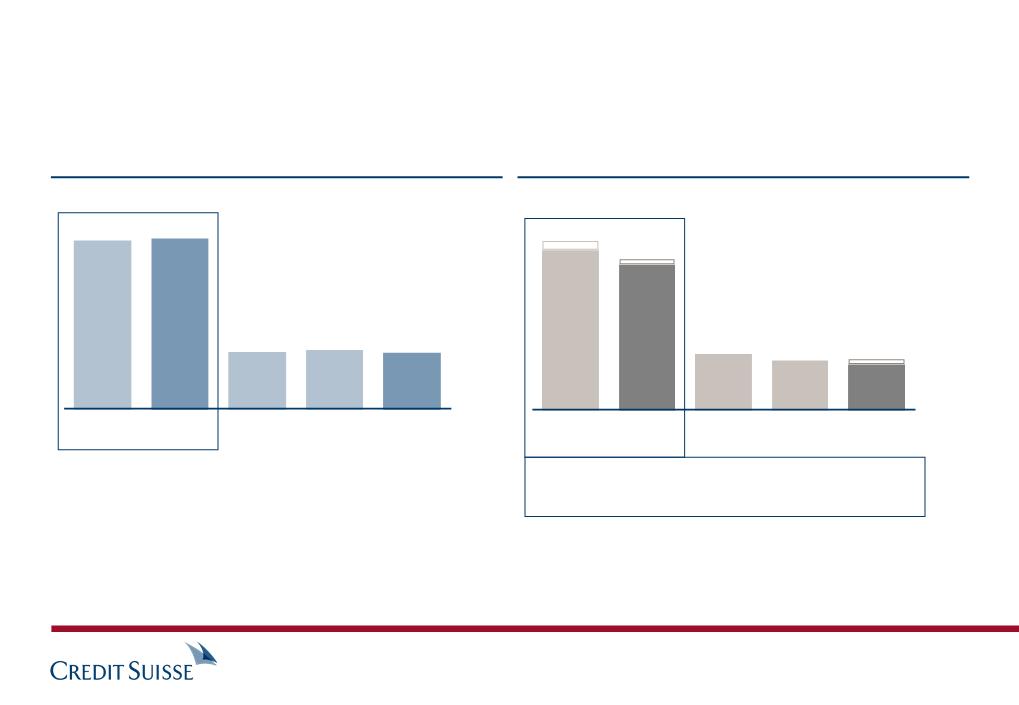
633
2,106
723
612
2,516
7,299
2,429
2,385
7,365
1) Excluding proceeds from captive insurance settlements of CHF 100 m in 1Q09
2) Excluding non-credit related provisions of CHF 44 m related to ARS in 3Q10
Pre-tax income
CHF m
3Q09
2Q10
3Q10
Pre-tax income margin in %
29 27 30 25 28
1)
9M09
9M10
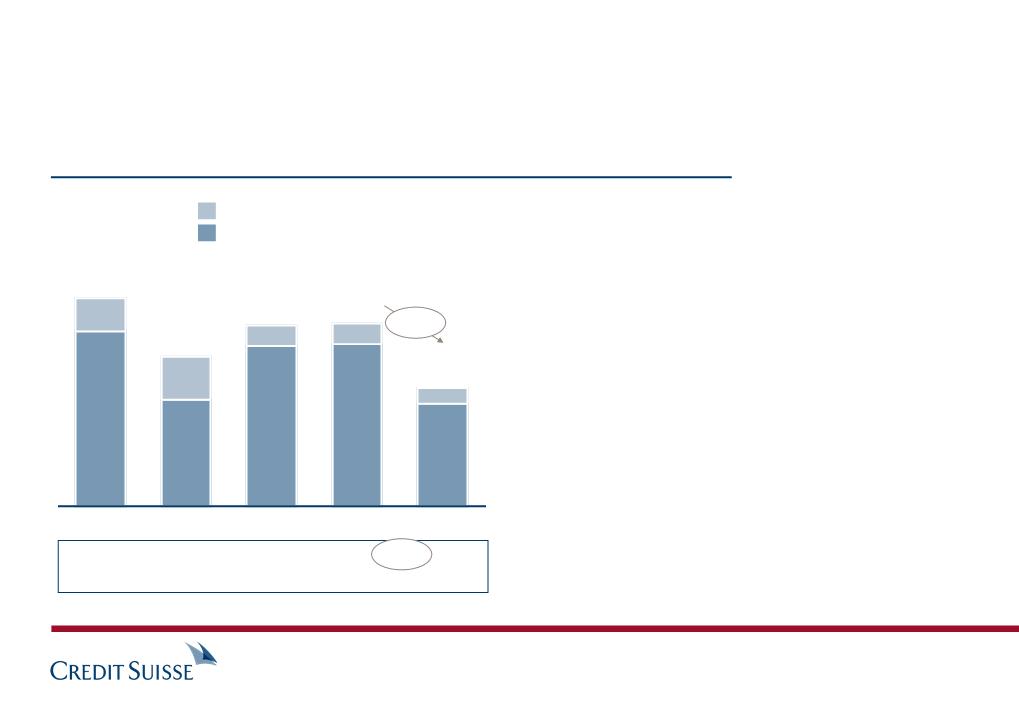
Net revenues
CHF m
3Q09
2Q10
3Q10
9M09
9M10
§ Client sentiment continued to be risk-
averse
averse
§ Seasonal 3Q slowdown leading to low
brokerage fees
brokerage fees
656
1)
2)
2)
1,966
2)
2)
§ Expenses down 8% vs. 2Q10
Third Quarter 2010 Results
Slide 7
2)
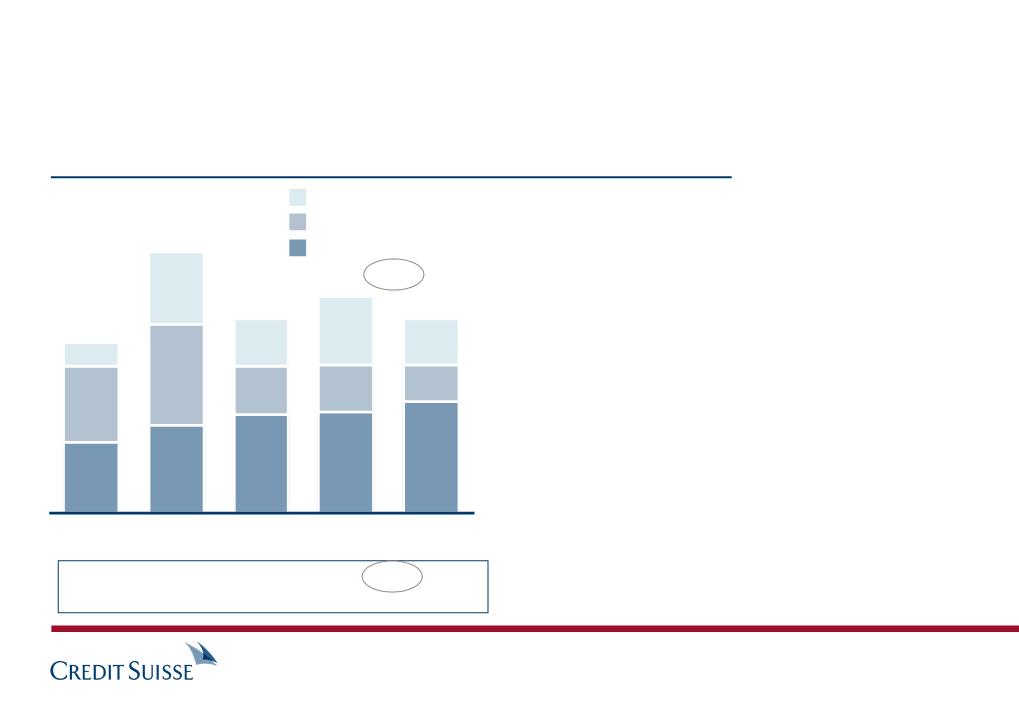
Wealth Management with solid pre-tax income, despite seasonal
summer slowdown
summer slowdown
45
47
46
46
47
44
44
45
29
29
28
29
Net new assets (NNA) in 2010
CHF bn
9M
Asia Pacific
Americas
EMEA
Switzerland
1Q
2Q
12.9
11.9
3Q
12.4
37.2
Net new assets growth rate in %
6.4% 5.8% 6.2% 6.2%
Gross margin on revenues in 2010
Basis points
NNA in CHF bn by region in 3Q10 were 1.2 from Switzerland, 4.3 from EMEA, 3.1 from Americas and 3.8 from Asia Pacific NNA growth rates are annualized
9M
1Q
2Q
3Q
Average AuM in CHF bn
814 837 809 820
Recurring
commissions
& fees
commissions
& fees
Recurring net
interest
income
interest
income
Transaction-
based revenues
based revenues
121
120
118
120
10.9
6.7
12.3
7.3
Third Quarter 2010 Results
Slide 8
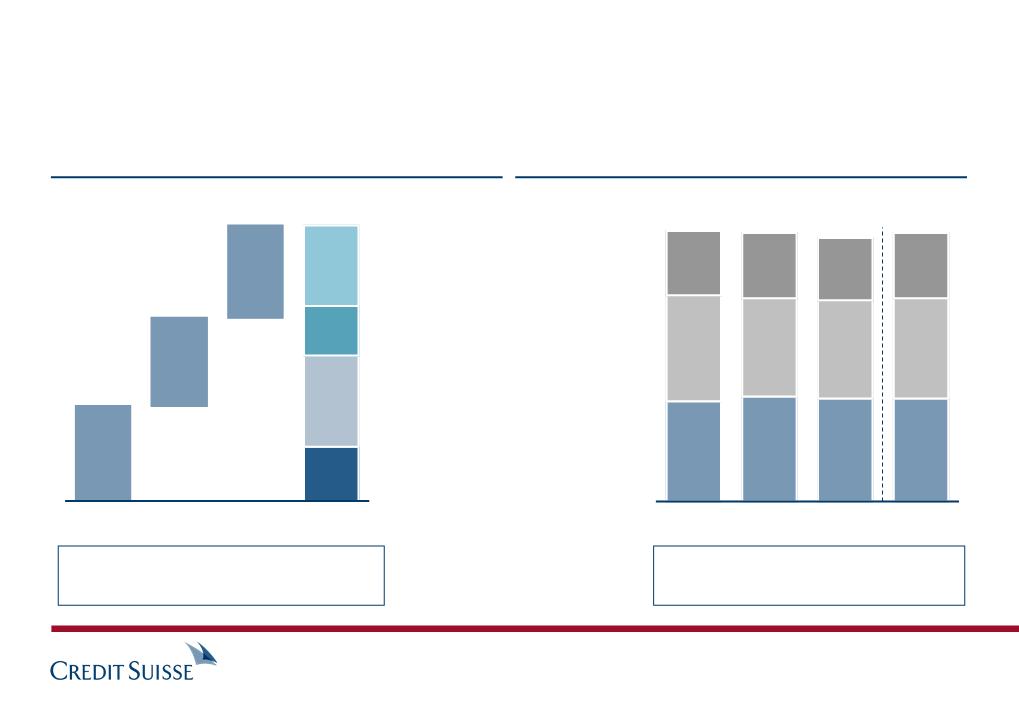
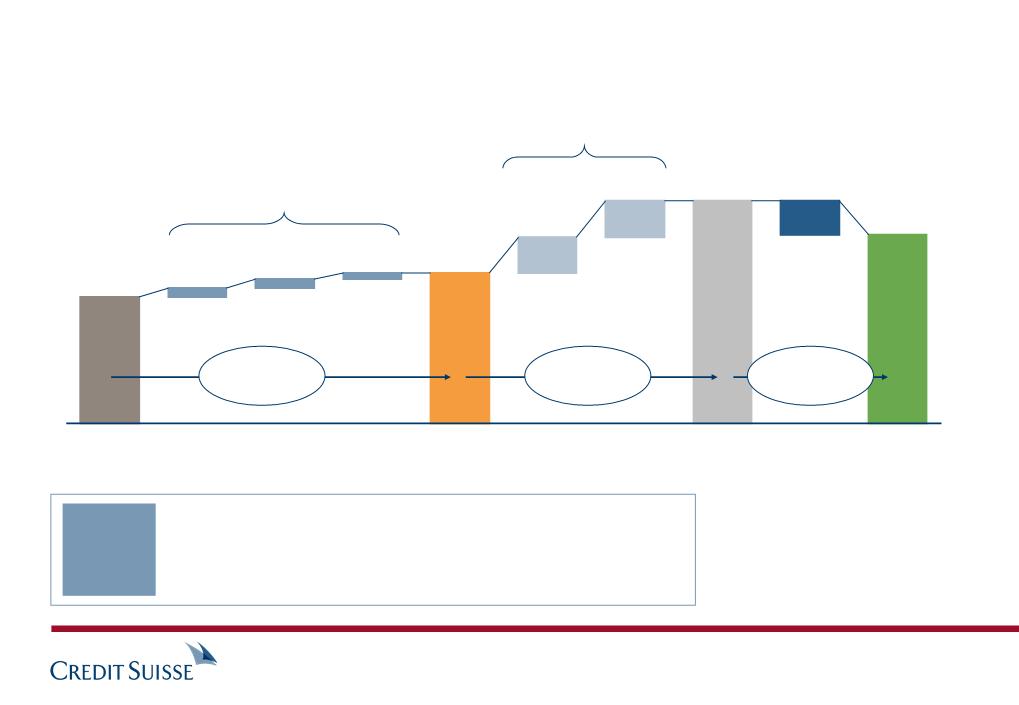
Wealth Management with continued strong asset inflows, but
lower brokerage fees affecting the gross margin
lower brokerage fees affecting the gross margin
Swiss booking
center
center
Global,
(onshore &
offshore)
(onshore &
offshore)
§ Globally diversified inflows
§ Switzerland with superior value proposition
beyond client confidentiality
beyond client confidentiality
§ Further expanding of HNWI market share
(11) bn
Wealth
Management
Management
Further upside potential on margin
§ Broadening product & service offering
§ Reaching full productivity of recently added
relationship managers
relationship managers
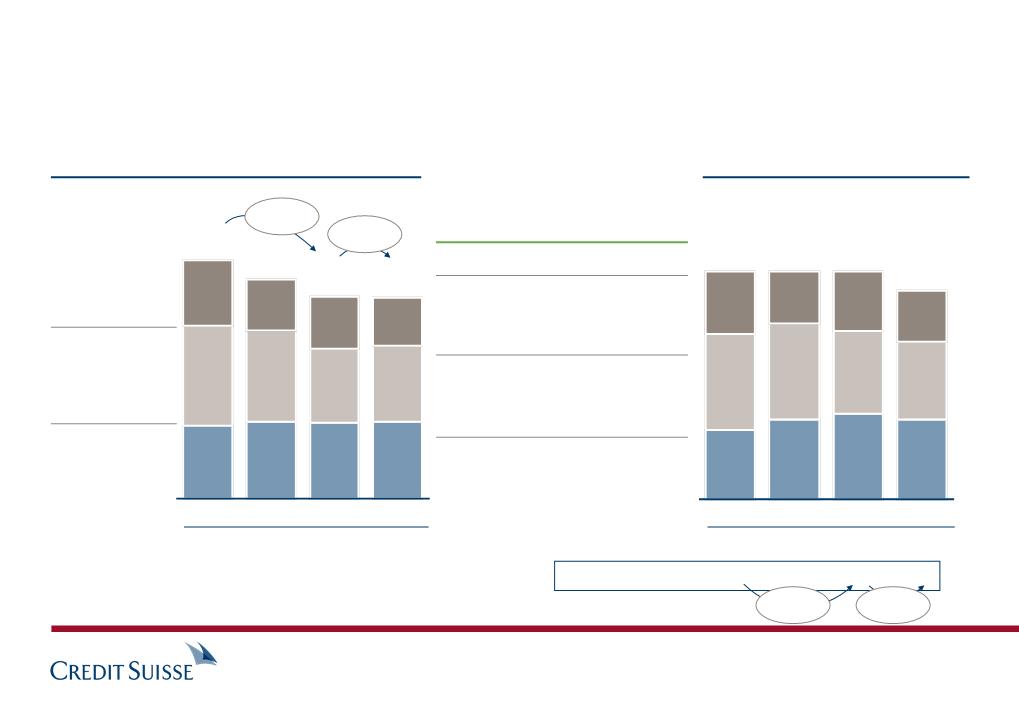
96
+24 bn
+13 bn
+6 bn
Higher
Lower
(4) bn
+20 bn
+8 bn
+8 bn
2009
Net new assets
(CHF)
(CHF)
9M10
112
2009
Gross margin
(basis points)
(basis points)
9M10
Breadth, depth and
maturity of product
offering
maturity of product
offering
103
114
111
119
114
119
HNWI+ only
Switzerland
(onshore)
Mature
markets
markets
(offshore)
Emerging
markets
markets
(offshore)
International
booking centers
(excluding US)
booking centers
(excluding US)
+8 bn
+12 bn
135
142
Third Quarter 2010 Results
Slide 9
§ Current net new assets trends expected to continue
§ Relative gross margin contribution expected to remain stable, with upside when markets improve
§ Western Europe "Big-4" (Germany, Italy, UK,
France) account for AuM of CHF 106 bn
France) account for AuM of CHF 106 bn
§ AuM at risk of some CHF 25 to 35 bn, assuming
adverse events in all markets
adverse events in all markets
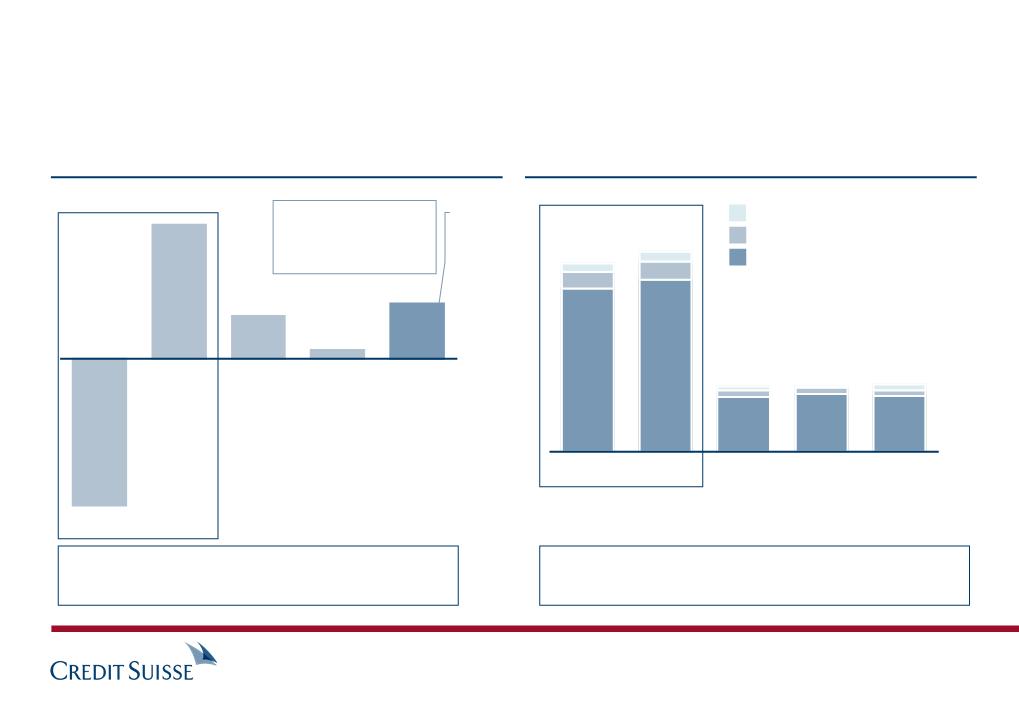
Mature offshore business is shrinking - more than offset by growth
in other businesses with similar margins
in other businesses with similar margins
588
680
144
224
241
Pre-tax income
CHF m
§ Continued strong pre-tax margin
§ Net releases from credit provisions,
reflecting quality of the loan book
reflecting quality of the loan book
§ Stable revenues with higher
contribution from commissions and
fees
contribution from commissions and
fees
§ Strong net new assets of CHF 7.8 bn
during 9M10
during 9M10
Fair value change on loan hedges
(88) (34) (61) (1) (21)
Provision for credit losses
130 (42) 40 (13) (16)
3Q09
2Q10
3Q10
Pre-tax income margin in %
43 50 36 51 51
9M09
9M10
1) Excluding fair value change on loan hedges
Third Quarter 2010 Results
Slide 10
1)
Corporate & Institutional Client business continues to deliver
strong results
strong results

Third Quarter 2010 Results
Slide 11
Investment Banking results impacted by weaker client trading
volumes, exacerbated by seasonality
volumes, exacerbated by seasonality
§ Results reflect a particularly weak July, normal summer seasonality in August
and some improvement in September
and some improvement in September
§ Solid fixed income sales and trading results driven by strong results in US
RMBS trading and Credit businesses; solid contribution from Rates and
Emerging Markets
RMBS trading and Credit businesses; solid contribution from Rates and
Emerging Markets
§ Equity sales and trading results impacted by lower industry-wide volumes
in Cash Equities, seasonal decline in Prime Services and weaker client flows
in Derivatives compared with a particularly strong 2Q10
in Cash Equities, seasonal decline in Prime Services and weaker client flows
in Derivatives compared with a particularly strong 2Q10
§ Solid underwriting and advisory performance in light of muted activity
levels; continued strong pipeline; capital markets trends showed improvement
in September
levels; continued strong pipeline; capital markets trends showed improvement
in September
Net revenues in USD
Net revenues in CHF
Pre-tax income
Pre-tax income margin
Pre-tax return on economic capital
Investment Banking (CHF bn) 3Q10 2Q10 3Q09 9M10 9M09
Note: Excluding impact of movements in spreads on own debt of CHF (57) m, CHF (62) m, CHF (251) m, CHF (178) m and CHF (155) m in 3Q10, 2Q10, 3Q09, 9M10 and 9M09, respectively.
(16)%
(9)%
Third Quarter 2010 Results
Slide 12
3.5 3.8 5.0 12.2 15.9
3.5 4.2 5.3 12.9 17.7
0.5 0.8 2.0 3.2 6.0
13% 20% 38% 24% 34%
9% 17% 41% 22% 38%
Investment Banking impacted by challenging market conditions,
seasonal trends and the strengthening Swiss franc
seasonal trends and the strengthening Swiss franc
Debt underwriting
Fixed income sales and trading
3Q10
3Q09
2Q10
1Q10
4Q09
§ Strong results in Structured Products driven by
continued resilience in non-agency US RMBS
trading
continued resilience in non-agency US RMBS
trading
§ Strong results in Credit businesses driven by
client flows and record high yield new issue
activity
client flows and record high yield new issue
activity
§ Solid contribution from Rates and Emerging
Markets
Markets
§ Flow-sales force expansion largely complete and
impact of investments starting to materialize;
better penetration with key clients and improved
breadth and intensity of coverage
impact of investments starting to materialize;
better penetration with key clients and improved
breadth and intensity of coverage
1) Excludes impact of movements in spreads on own debt
Fixed income sales & trading and underwriting revenues 1)
CHF bn
2.0
1.5
0.5
3.2
2.7
0.5
1.4
1.0
0.4
3.0
2.7
0.3
1.5
0.5
+3%
+12%
Third Quarter 2010 Results
Slide 13
in USD bn
2.9 1.4 3.0 1.8 2.0
2.0
Increased fixed income revenues
3Q10
3Q09
2Q10
1Q10
4Q09
§ Revenue decline across most major businesses despite
continued market share strength
continued market share strength
− Lower revenues in Cash Equities driven by an industry-
wide decline in volumes, particularly in electronic
trading
wide decline in volumes, particularly in electronic
trading
− Seasonal decline in Prime Services revenues
− Lower revenues from Derivatives driven by weaker
client flows
client flows
§ Maintained market share strength
− Ranked #1 in market share for global cash products
− Top 3 position in Prime Services
§ Revenues include debit valuation adjustments (DVA) on fair
valued structured note liabilities of CHF (118) m, CHF 64 m
and CHF (19) m in 3Q10, 2Q10 and 1Q10, respectively
valued structured note liabilities of CHF (118) m, CHF 64 m
and CHF (19) m in 3Q10, 2Q10 and 1Q10, respectively
1) Excludes impact of movements in spreads on own debt
2) Source: Leading market share analysis provider
Equity sales & trading and underwriting revenues 1)
CHF bn
Equity underwriting
Equity sales and trading
2.2
1.9
0.3
1.6
1.1
0.5
1.9
1.7
0.2
1.9
1.7
0.2
1.3
1.1
0.2
(35)%
(30)%
Third Quarter 2010 Results
Slide 14
2)
in USD bn
2.1 1.6 1.8 1.8 1.2
2.1 1.6 1.8 1.8 1.2
Equity revenues affected by lower industry-wide trading volumes
1) Underwriting revenues are also included in the Securities view revenues on slides 13 and 14
Advisory and underwriting 1)
CHF bn
3Q09
2Q10
3Q10
Debt underwriting
Advisory
Equity underwriting
4Q09
1Q10
0.3
0.4
0.1
0.8
1.2
0.3
0.4
0.5
0.2
0.9
0.2
0.5
0.3
1.0
0.2
0.5
0.2
0.2
0.5
§ Resilient results driven by strong debt
issuance levels, partially offset by
continued weak equity issuance and
lower completed M&A volumes
issuance levels, partially offset by
continued weak equity issuance and
lower completed M&A volumes
§ Pipeline significantly above year-ago
levels across products; execution of
pipeline subject to market conditions
levels across products; execution of
pipeline subject to market conditions
(10)%
Third Quarter 2010 Results
Slide 15
0.9
(2)%
in USD bn
0.7 1.2 0.8 0.9 0.9
Solid results in advisory and underwriting
0
11
30
39
33
8
5
6
23
29
5
1
1
1
<(25)
(25)-0
0-25
25-50
50-75
75-100
100-125
>125
Client-focused model evident from revenue mix and lower daily
revenue volatility
revenue volatility
§ Successful client-focused strategy
resulting in 89% contribution from direct
client revenues
resulting in 89% contribution from direct
client revenues
§ Indirect client revenues and arbitrage
trading constitute 9% and 2% of total
Investment Banking net revenues,
respectively
trading constitute 9% and 2% of total
Investment Banking net revenues,
respectively
Contribution to Investment Banking net revenues (9M10)
1) Direct client revenues consist primarily of fees and commissions, gains and losses
from matching of client trades and revenues from client financing activities
from matching of client trades and revenues from client financing activities
2) Indirect client revenues consist of gains, losses and financing on inventory
positions held for market making activities
positions held for market making activities
Credit Suisse 9M10 daily revenue distribution
§ As in previous quarters, 3Q10 daily revenue
distribution was generally tightly concentrated
distribution was generally tightly concentrated
– No outsized daily gains or losses
– Only one loss day in 3Q10 and three loss
days YTD, each smaller than CHF (25)m
days YTD, each smaller than CHF (25)m
CHF m
11%
Fixed Income Sales
& Trading 35%
& Trading 35%
Equity
Sales &
Trading
Sales &
Trading
32%
Underwriting
& Advisory
22%
Direct client revenues 1)
Indirect client revenues
and arbitrage trading 2)
and arbitrage trading 2)
1H 10
3Q10
Third Quarter 2010 Results
Slide 16
Investment Banking average 1-Day VaR (USD m)
§ The 9% increase in VaR from 2Q10 primarily reflects
increased risk usage in support of client businesses, including
interest rate and credit, foreign exchange and equities
increased risk usage in support of client businesses, including
interest rate and credit, foreign exchange and equities
§ No backtesting exceptions in 3Q10
105
Investment Banking RWAs (period end in USD bn)
§ Continued focus on disciplined alignment of capital to high-
returning, client businesses
returning, client businesses
§ Increase from 2Q10 primarily relating to:
− Higher lending commitments in Leveraged Finance and
Corporate Banking
Corporate Banking
− FX translation impact on operational risk component
− Increases in other client-related RWA usage
1H08
2H08
1H09
2H09
1H10
2Q10
102
89
156
205
253
99
1Q10
139
Exit businesses
26
113
140
17
123
144
127
17
2Q09
4Q09
1Q10
2Q10
142
15
127
4Q08
163
34
129
151
3Q10
114
14
137
3Q10
Third Quarter 2010 Results
Slide 17
Continued discipline in allocating capital
3,080
866
Commission expenses
G&A expenses
2)
3,595
2,644
951
Investment Banking compensation expenses (CHF m)
Investment Banking non-compensation expenses (CHF m)
3Q09
2Q10
1) Excluding fair value on own debt and excluding UK bonus levy
2) Excludes litigation charges of 29 m, 47 m, 383 m, 29 m and 430 m in 3Q10, 3Q09, 2Q09, 9M10 and 9M09
9M10
§ Decreases across most expense categories including legal,
advertising and travel and entertainment expenses as well as
favorable FX translation impact
advertising and travel and entertainment expenses as well as
favorable FX translation impact
2,214
6,210
7,782
9M09
2,014
1,107
3Q10
§ Consistent approach to compensation accrual reflecting risk-
adjusted profitability and competitive market conditions
adjusted profitability and competitive market conditions
§ 9M10 compensation expenses down 20% from 9M09;
Investment Banking compensation/revenue1) ratio of 54% in
3Q10 and 48% for 9M10
Investment Banking compensation/revenue1) ratio of 54% in
3Q10 and 48% for 9M10
§ Credit Suisse Group compensation/revenue ratio1) of 50% in
3Q10 and 47% for 9M10
3Q10 and 47% for 9M10
806
301
2,129
1,284
933
351
1,872
1,143
848
295
3Q09
2Q10
9M10
9M09
3Q10
Third Quarter 2010 Results
Slide 18
Compensation and non-compensation expenses
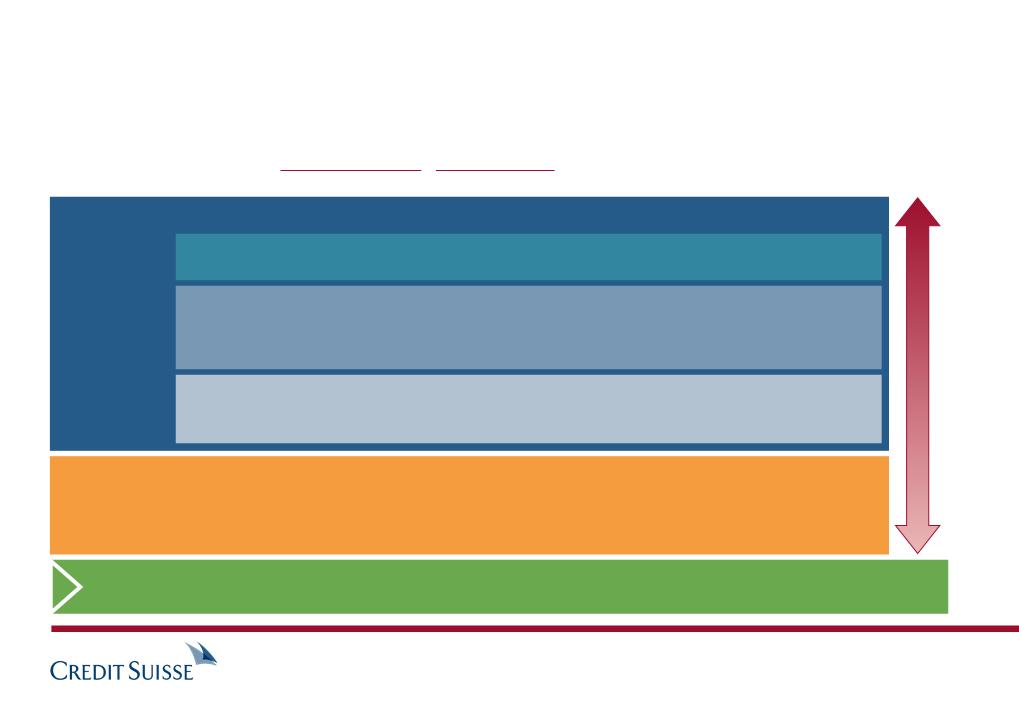
Competency
Asset
Allocation
Allocation
Alternative
Investments
Investments
Swiss
platform
platform
Product suite
Collaboration
§ MACS (private &
institutional clients)
institutional clients)
§ Private Equity /
Hedge Funds
Hedge Funds
§ ETFs / Index
strategies
strategies
§ Commodities
§ Fixed Income
and Equities
and Equities
§ Key discretionary mandate capability for Private Bank
§ Access to UHNWI & HNWI and institutional clients
§ Utilizing technology & financing from the Investment Bank
§ Joint product development and sales with IB
§ Product for our Swiss and European clients in the
Private Bank
Private Bank
Leverage the
integrated bank
integrated bank
Build leading investment
capabilities via in-house
funds and partnerships
capabilities via in-house
funds and partnerships
Build higher margin,
capital-efficient business
capital-efficient business
Strategic Pillars
Third Quarter 2010 Results
Slide 19
Asset Management focused on core competencies that
capitalize on the strength of Credit Suisse's global footprint
capitalize on the strength of Credit Suisse's global footprint
Leverage the
integrated bank
integrated bank
Build leading
investment
capabilities with
superior performance
investment
capabilities with
superior performance
§ York Capital Management is a premier USD 14 bn hedge fund with 19-
year track record and broad-based product platform
year track record and broad-based product platform
§ Joint equity ownership aligns interests and helps retain best investment
talent
talent
Build higher margin,
capital-efficient
business
capital-efficient
business
§ Investment in management company, not underlying funds
– Reflects capital-light approach with focus on recurring fee income
– Consistent with recently enacted US financial reforms
Third Quarter 2010 Results
Slide 20
Pending acquisition of minority stake in York Capital important
step in executing on Asset Management strategy
step in executing on Asset Management strategy
§ Fills gap in our product offering to institutional and wealth management
clients
clients
§ Combines York’s world-class product suite with Credit Suisse’ global
distribution
distribution
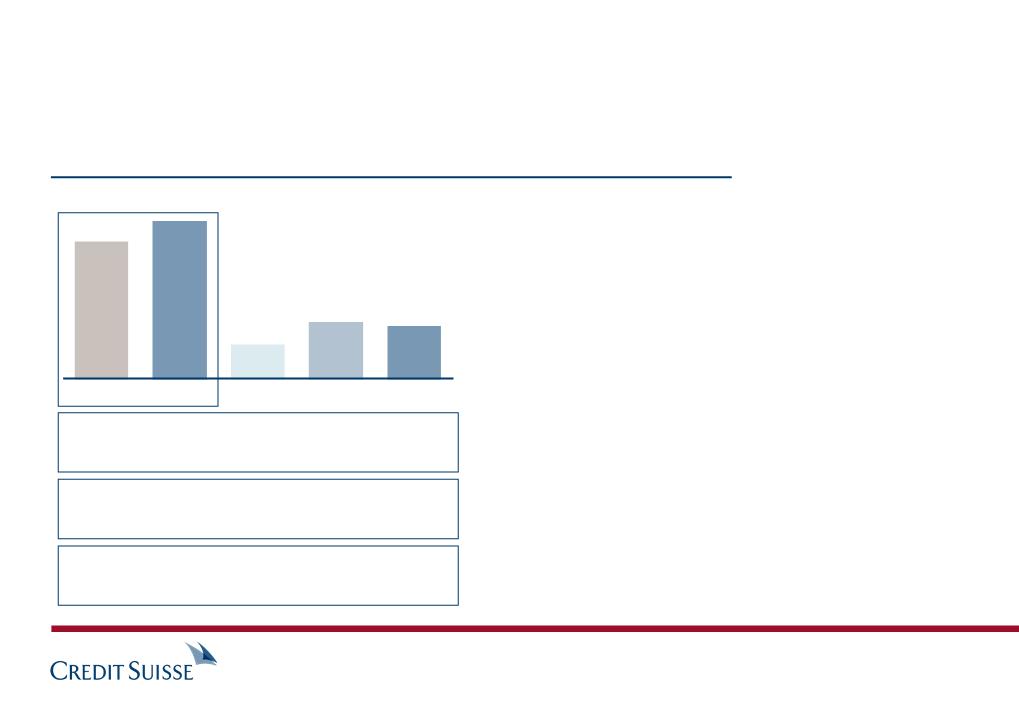
(352)
323
104
135
22
Pre-tax income
CHF m
3Q09
2Q10
3Q10
9M09
9M10
1)
Fee-based revenues
CHF m
9M09
9M10
3Q09
2Q10
3Q10
Performance fees and carried interest
Management fees
Placement, transaction and other fees
Fee-based margin on average AuM
38 39 38 37 40
1,171
1,241
408
406
421
1) Excluding gain on sale of business of CHF 21 m in 2Q09 and CHF 207 m in 3Q09
1)
Pre-tax income margin in %
(36) 19 19 4 23
From 2Q10
§ Revenues up 16%
§ Expenses down 7%
Third Quarter 2010 Results
Slide 21
Asset Management continues progress in 2010
Net new assets
CHF bn
§ Strong inflows of CHF 5.2 bn in alternative
investments
investments
– Strong inflows in real estate, commodity
funds and ETFs
funds and ETFs
– Continued inflows from emerging market
product offerings
product offerings
– Resilient private equity fund-of-fund flows
§ Outflows of CHF 1.6 bn mainly in lower
margin assets
margin assets
1Q10
2Q10
3Q10
Annualized net new asset growth %
(3.7) 3.9 10.8 1.2 3.4 5.2
1H09
2H09
9M10
(7.6)
11.2
1.3
3.6
8.0
16.1
Third Quarter 2010 Results
Slide 22
Asset Management with positive asset inflows for the fifth
consecutive quarter
consecutive quarter
Third quarter 2010 results detail
David Mathers, Chief Financial Officer
Introduction
Brady W. Dougan, Chief Executive Officer
Regulatory capital review
David Mathers, Chief Financial Officer
Summary
Brady W. Dougan, Chief Executive Officer
Third Quarter 2010 Results
Slide 23
2008
2009
Basel 2 risk-weighted assets (in CHF bn) and capital ratios (in %)
2007
10.0
13.3
257
324
(30)%
16.3
222
2Q10
16.3
233
1) Excluding hybrid capital of CHF 11.5 bn
(2)%
§ Increase strong Basel II tier 1 ratio to
16.7%
16.7%
§ Core tier 1 ratio of 12.1% 1)
§ Regulatory leverage ratio increased to
4.3%
(vs. 3.9% in 2Q10)
4.3%
(vs. 3.9% in 2Q10)
§ Consistent dividend accrual policy in line
with historic payout ratio
with historic payout ratio
228
16.7%
3Q10
Third Quarter 2010 Results
Slide 24
Maintained leading capital position
Basel 2
(3Q10)
(3Q10)
Basel
2.5
2.5
Gross-up of
Deductions
Deductions
CVA &
other
other
Stressed
VaR
VaR
Basel 3
(after
mitigation)
(after
mitigation)
IDR /
Migration
Migration
Securi-
tization
tization
Basel 3
(before
mitigation)
(before
mitigation)
Mitigation
impact
impact
Change
to Basel 2.5
to Basel 2.5
Change
to Basel 3
to Basel 3
Mitigation
impact
impact
Businesses
primarily
affected
primarily
affected
§ Emerging
markets
markets
§ Credit
§ Credit
§ Structured
products
products
§ Structured
products
products
§ "Exit
businesses"
businesses"
§ Rates
§ Foreign
exchange
exchange
§ Equities
§ Emerging
markets
markets
§ Credit
§ Equity
derivatives
derivatives
CHF bn
228
+15
+20
+10
330 to
350
350
+65
Approx.
270
270
+65
Approx.
400
400
(50) to
(70)
(70)
Note: Estimates based on current positions; certain Basel 3 methodology changes are still subject to validation
+45
+130
Third Quarter 2010 Results
Slide 25
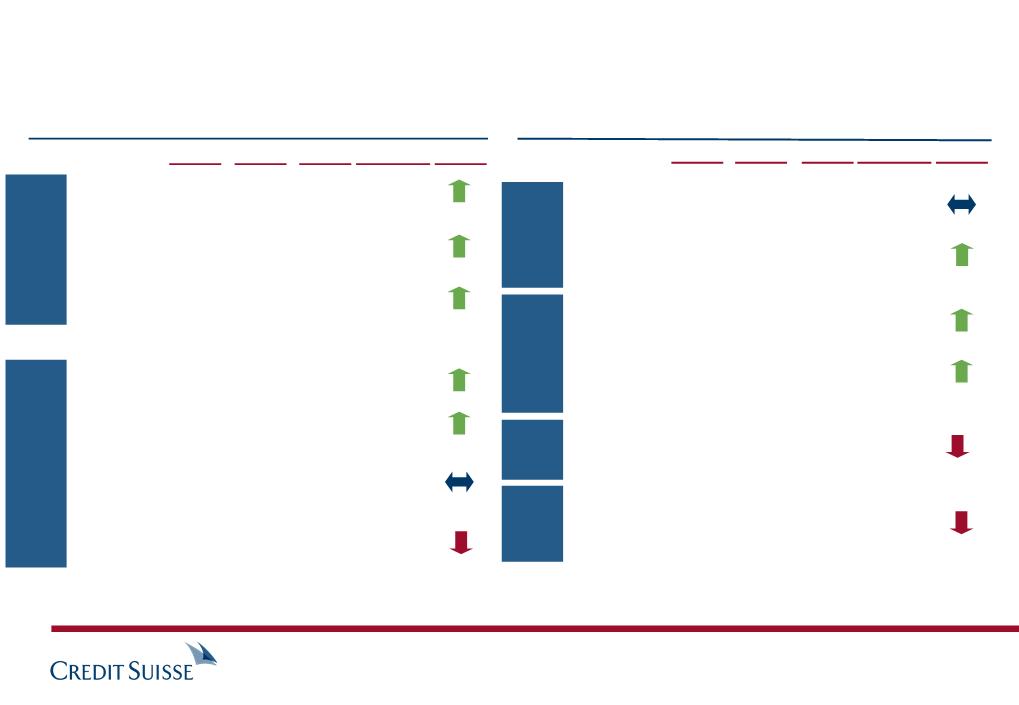
Risk-weighted assets projection under Basel rule changes
Exit
businesses
businesses
§ RWA-equivalent reduction of CHF 20 to 25 bn
Businesses
primarily affected
primarily affected
Mitigating and reduction impact (approximated amounts)
Structured
products
products
§ Anticipate roughly CHF 3 bn nominal reduction in low rated positions,
reflecting change in asset mix and risk reductions by 2012
reflecting change in asset mix and risk reductions by 2012
§ RWA-equivalent reduction of CHF 15 to 20 bn
Emerging
markets
markets
§ CHF 5 bn RWA-equivalent reduction achieved through refocusing the
business towards a more flow-based model
business towards a more flow-based model
Derivatives
§ CHF 5 to 10 bn RWA-equivalent reduction related to uncollateralized
exposures that will either mature by 2012, or that can be collateralized /
hedged
exposures that will either mature by 2012, or that can be collateralized /
hedged
§ CHF 5 to 10 bn RWA-equivalent reduction resulting from a shift of OTC
derivatives to central counterparties clearing
derivatives to central counterparties clearing
Third Quarter 2010 Results
Slide 26
Background on CHF 50 to CHF 70 bn RWA mitigation impact
§ Starting point: CHF 27.5 bn core tier 1 capital (excl. hybrids)
Assumptions underlying the capital projections
1) Bloomberg consensus to 2012. Kept constant for 2013. Net income shown is not endorsed or verified and is used solely for illustrative purposes. Actual net income may differ significantly.
2) Primarily for residual deferred tax assets, pension plan adjustments, and participations in financial institutions
Common Equity Capital Ratio
§ Net income based on market expectations1); assumes
dividend payout ratio of 30%
dividend payout ratio of 30%
§ Based on Basel 3 RWA of CHF 340 bn (net of mitigation)
§ 5% organic RWA growth p.a. to 2012 to CHF 375 bn; kept
constant thereafter (i.e. in line with constant net income)
constant thereafter (i.e. in line with constant net income)
§ Net income kept constant from 2013 level1); dividend
payout ratio of 30%
payout ratio of 30%
§ Regulatory deductions to capital of approx. CHF 6 bn2)
phased-in from 2014 to 2018 on a straight-line basis
phased-in from 2014 to 2018 on a straight-line basis
§ Deferred tax assets on net operating losses to be utilized by 2014
(only 50% utilized in "stressed scenario")
(only 50% utilized in "stressed scenario")
§ Partial phase-out of "Claudius" notes by 2019
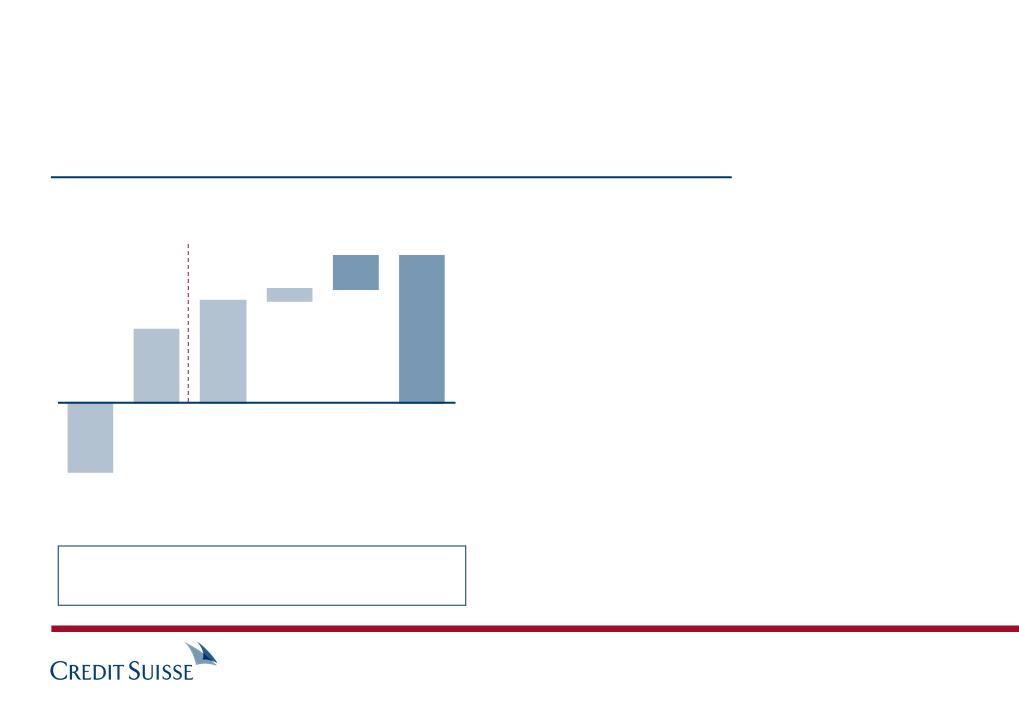
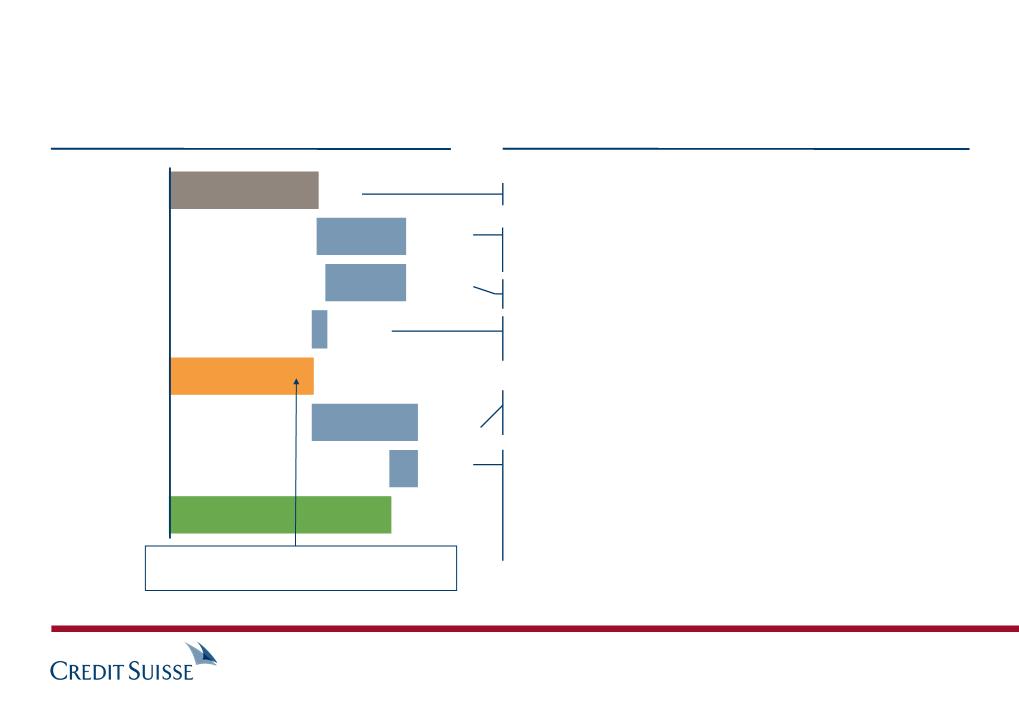
Basel 2 in 3Q10
Retained earnings
4Q10 to 2013
4Q10 to 2013
Increased RWA with
Basel 2.5 & Basel 3
Basel 2.5 & Basel 3
Basel 3 in 2013
Retained earnings
2014 to 2019
2014 to 2019
Phase-in of
deductions
deductions
Basel 3 in 2019
+7%
12%
12%
(6)%
+9%
(2)%
18%
Business growth
(1)%
Would be still over 10% under a "stressed
scenario" with 50% lower net income
scenario" with 50% lower net income
Third Quarter 2010 Results
Slide 27
Capital simulation under Basel 3 (for illustrative purposes only)
Views on the viability of the contingent convertible market
Who
Why
§ Traditional holders of bank capital notes will seek to replace holdings as they are being
called or mature
called or mature
§ Sovereign Wealth Funds and other funds will seek opportunities to invest in new asset
classes - especially as high-trigger CoCo mimics their deep-value investment thesis
classes - especially as high-trigger CoCo mimics their deep-value investment thesis
§ Superior economic value, higher yield and 'out-of-the-money' conversion may be viewed as
an attractive investment proposition also for more traditional investor groups
an attractive investment proposition also for more traditional investor groups
§ In a continued low interest rates environment, there is significant institutional and retail
investor appetite for higher-yielding assets
investor appetite for higher-yielding assets
§ Substantial current inventory of bank capital notes that will be called or mature
– Current Tier 1 and Tier 2 capital market outstanding estimated at EUR 450 bn
§ CoCo structure arguably a superior value to investors compared to a traditional
bankruptcy / liquidation scenario
bankruptcy / liquidation scenario
§ Substantial 'out-of-the-money' conversion, especially on low-trigger CoCo, should allow
for participation of traditional fixed income investor groups
for participation of traditional fixed income investor groups
Note: source Dealogic
Third Quarter 2010 Results
Slide 28

High trigger:
§ 3% of RWA requirement; 7% tier 1 trigger point
§ May replace existing hybrid capital
Note: Based on CHF 340 bn of Basel 3 risk-weighted assets 1) Inflated due to sizable issuance volumes in 2008; would be around 500 bps otherwise
Current
capital/funding components
capital/funding components
Future
capital/funding components
capital/funding components
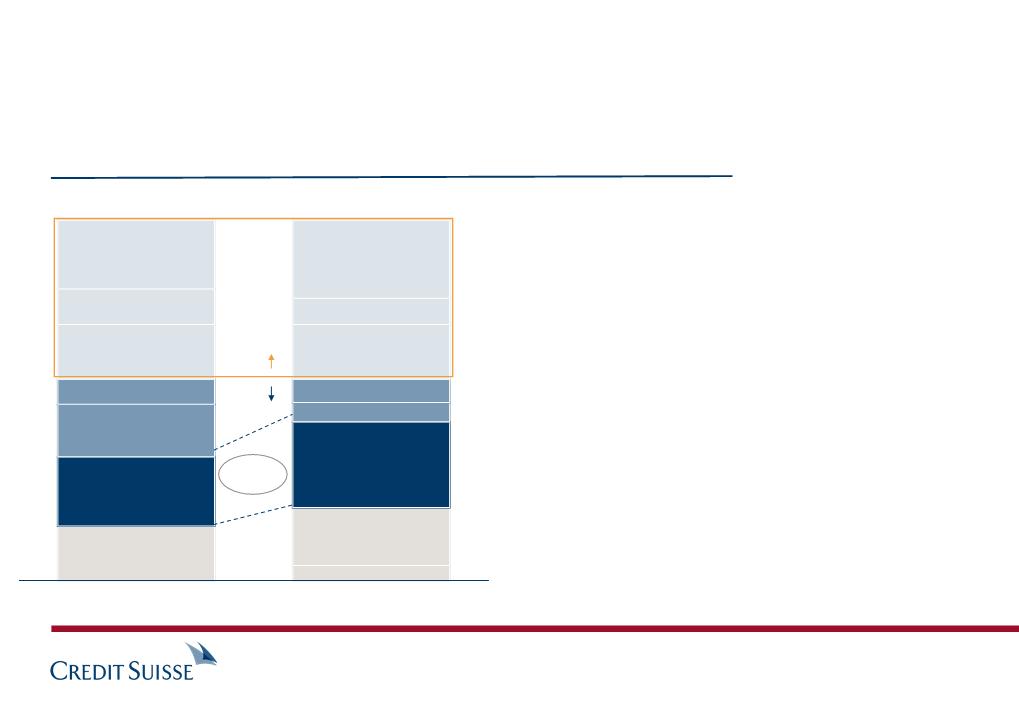
Lower
tier 2 capital
tier 2 capital
Hybrid capital
34
"Claudius"
Upper
tier 2 capital
tier 2 capital
Shareholders'
equity
equity
192
Senior
long-term
debt
long-term
debt
Total
Regulatory
debt capital
debt capital
§ Weighted
spread: 480 bps
spread: 480 bps
§ Implied annual
spread costs:
CHF 1.2 bn
spread costs:
CHF 1.2 bn
750 bps1)
500 bps
350 bps
Indicative spreads
to senior debt:
to senior debt:
192
20
10
34
Senior long term debt:
§ Larger CoCo & equity balances imply a reduced requirement to fund
via senior bond markets
via senior bond markets
§ Spreads on senior bonds may price tighter, as the risk-profile of the
issuer improves and the theoretical liquidation value increases
issuer improves and the theoretical liquidation value increases
3.3
11.5
2.0
130
128
Low trigger:
§ 6% of RWA requirement; 5% tier 1 trigger point
§ May replace existing Tier 2 capital
28
Third Quarter 2010 Results
Slide 29
11.0
100 bps
CoCo:
§ CoCo structures (and excess equity) to fully substitute current
subordinated capital bonds
subordinated capital bonds
§ While the total amount of regulatory capital will increase, the average
"unit price" may come down, depending on spread assumptions
"unit price" may come down, depending on spread assumptions
Changes in the capital structure (for illustrative purposes only)
Third quarter 2010 results detail
David Mathers, Chief Financial Officer
Introduction
Brady W. Dougan, Chief Executive Officer
Regulatory capital review
David Mathers, Chief Financial Officer
Summary
Brady W. Dougan, Chief Executive Officer
Third Quarter 2010 Results
Slide 30

Questions & Answers
Third Quarter 2010 Results
Slide 31

3Q10:
Good result in a
quarter characterized
by challenging
conditions with low
market volumes and
subdued client
activity
quarter characterized
by challenging
conditions with low
market volumes and
subdued client
activity
Strongly positioned
with a distinctive
strategy
with a distinctive
strategy
§ Anticipated regulatory changes
§ Client-focused and capital-efficient business model
§ Ability to deliver high returns and book value accretion
§ Underlying net income of CHF 1 bn and underlying RoE of 11%
(CHF 4.0 bn and 15% in 9M10)
(CHF 4.0 bn and 15% in 9M10)
§ Solid pre-tax income in Private Bank with continued strong Wealth
Management inflows of CHF 12.4 bn; gross margin at 118 bp
Management inflows of CHF 12.4 bn; gross margin at 118 bp
§ Investment Banking with maintained market share performance in a
weak revenue environment, exacerbated by the seasonal slowdown
weak revenue environment, exacerbated by the seasonal slowdown
§ Asset Management with continued progress to grow its core
business; net new assets of CHF 3.6 bn represent positive asset
flows for the fifth consecutive quarter
business; net new assets of CHF 3.6 bn represent positive asset
flows for the fifth consecutive quarter
Third Quarter 2010 Results
Slide 32
Summary

Slide
34
35
36
37
38
39
40 to 41
42
Third Quarter 2010 Results
Slide 33
Appendix
Reconciliation from reported to underlying results
Collaboration revenues
Gross margin analysis in Wealth Management Clients business
Market share momentum in the Investment Bank
Balance sheet structure
Commercial mortgage exposures detail
Loan portfolio characteristics
Underlying results in the Corporate Center
Net revenues
Prov. for credit losses / (release)
Total operating expenses
Pre-tax income
Income tax expense
Noncontrolling interests
Net income
Return on equity
3Q10
reported
reported
3Q10
underlying
underlying
Impact from
the tightening
of spreads on
own debt1)
the tightening
of spreads on
own debt1)
UK
bonus levy
bonus levy
Normalization
to tax rate of
28%
to tax rate of
28%
CHF bn
1) Including fair valuation gains/losses on cross currency swaps relating to our long-term debt Note: numbers may not add to total due to rounding
Litigation
provisions
provisions
Third Quarter 2010 Results
Slide 34
6,284 589 - - - 6,873
(26) - - - - (26)
5,557 - 43 (73) - 5,527
753 589 (43) 73 - 1,372
117 170 - 30 67 384
(27) - - - - (27)
609 419 (43) 43 (67) 961
7.0% 11.2%
Underlying return on equity of 14.9% in 9M10
Reconciliation to underlying results
CHF bn
§ Stable revenues, whilst impacted by lower client
activity
activity
§ The pipeline on tailored-solutions for
Private Banking clients continues to build
Private Banking clients continues to build
1Q10
2Q10
Collaboration revenues
§ 9M10 already significantly exceeds FY 2009
§ CHF 8.6 bn of assets referrals for Private Banking
– Net new assets of CHF 3.6 bn
– Custody assets of CHF 5.0 bn
§ Generated CHF 2.0 bn in new mandates for
Asset Management
Asset Management
Asset referrals
3Q10
9M10
1.0
1.2
1.0
3.2
Third Quarter 2010 Results
Slide 35
Collaboration revenues
40
46
49
46
55
55
48
45
36
30
34
29
Quarterly average
2007
2008
2009
9M10
2,910
2,674
2,468
2,455
Net revenues
CHF m
Recurring
commissions
& fees
commissions
& fees
Recurring net
interest income
interest income
Transaction-
based revenues
based revenues
(15)%
(1)%
(15)%
Revenue drivers going forward
1,214
1,120
901
924
898
939
927
941
798
616
640
590
+9%
§ Increase in overall interest rate
environment
environment
§ Client activity (brokerage, product
issuing fees)
issuing fees)
§ Integrated solutions revenues
§ Level and mix of managed
investment products
investment products
§ Performance fees
AuM = Assets under Management
Quarterly average
2007
2008
2009
9M10
131
131
131
120
Gross margin
Basis points
§ Overall: Higher AuM
Third Quarter 2010 Results
Slide 36
Avg. AuM (CHF bn) 888 817 755 820
Wealth Management with stable revenues but reduction in
transaction-related and interest-related gross margin
transaction-related and interest-related gross margin
Source: Thomson Financial, Dealogic, Tradeweb, Euromoney magazine and Greenwich Associates
Note: Emerging markets fee data includes India, China, Indonesia, Brazil, Mexico, Russia, Middle East and Africa
1) YTD 9M10 represents most current data available
2) Represents trend compared to FY09
Securities
2) Rank based on a leading market share analysis provider;
market share based on Credit Suisse estimates
market share based on Credit Suisse estimates
3) Based on Credit Suisse estimates
4) Represents leveraged loans secondary trading
Underwriting and advisory
Fixed
Income
Income
2007
YTD 9M101)
2008
US cash
equities 2)
equities 2)
#2/12%
#4/12%
#5/12%
US electronic
trading 2)
trading 2)
#1/8%
#1/8%
#1/8%
Prime
services 2)
services 2)
Top 3/
>10%
Top 6/
~6%
Top 3/
>10%
Foreign
exchange
exchange
#8/4%
#14/2%
#9/3%
RMBS pass
- -throughs
- -throughs
#1/19%
#1/18%
#1/18%
Leveraged
loans 4)
loans 4)
#2/19%
#4/13%
#2/16%
2009
Equities
US rates
#6/9%
#10/5%
#8/6%
Trend2)
2007
YTD 9M10
2008
2009
Trend2)
(Rank/market share)
(Rank/market share)
#1/13%
#1/11%
#3/13%
NA
#1/19%
#3/13%
#5 - #6
9% - 10%
3)
3)
DCM
Investment
grade global
grade global
#10/4%
#13/3%
#12/4%
#5/5%
High yield
global
global
#4/9%
#2/11%
#3/11%
#3/10%
ECM
ECM global
#7/6%
#7/6%
#7/5%
#7/5%
Emerging
Markets
Markets
M&A
Global
announced
announced
#5/16%
#6/20%
#7/17%
#4/16%
Global
completed
completed
#8/15%
#8/18%
#7/19%
#5/16%
Total fees
#1/12%
#2/8%
#1/8%
#2/7%
Third Quarter 2010 Results
Slide 37
Continued client market share momentum; upside potential
remains
remains
Assets
Equity & liabilities
Asset and liabilities by category (end 3Q10 in CHF bn)
Reverse 222
repo
Encumbered 99
trading assets
1,067
1,067
Funding- 152
neutral assets 1)
Cash 2) 51
Unencumbered 165
liquid assets 4)
Customer 217
loans
Other 161
illiquid assets
Repo 243
Short positions 78
Funding- 152
neutral liabilities 1)
Short-term debt 2) 49
Other short-term liab 3) 50
Customer 271
deposits
Long-term debt 179
Total equity 45
125%
coverage
Match
funded
funded
§ Strong balance sheet structure and liquidity
maintained; well-positioned to succeed in
changing regulatory environment
maintained; well-positioned to succeed in
changing regulatory environment
§ 44% of balance sheet is match funded
§ Stable and low cost deposit base as key
funding advantage
funding advantage
§ Regulatory leverage ratio at 4.3%
§ 17% of balance sheet financed by long-term
debt (vs. 12% at end 2006)
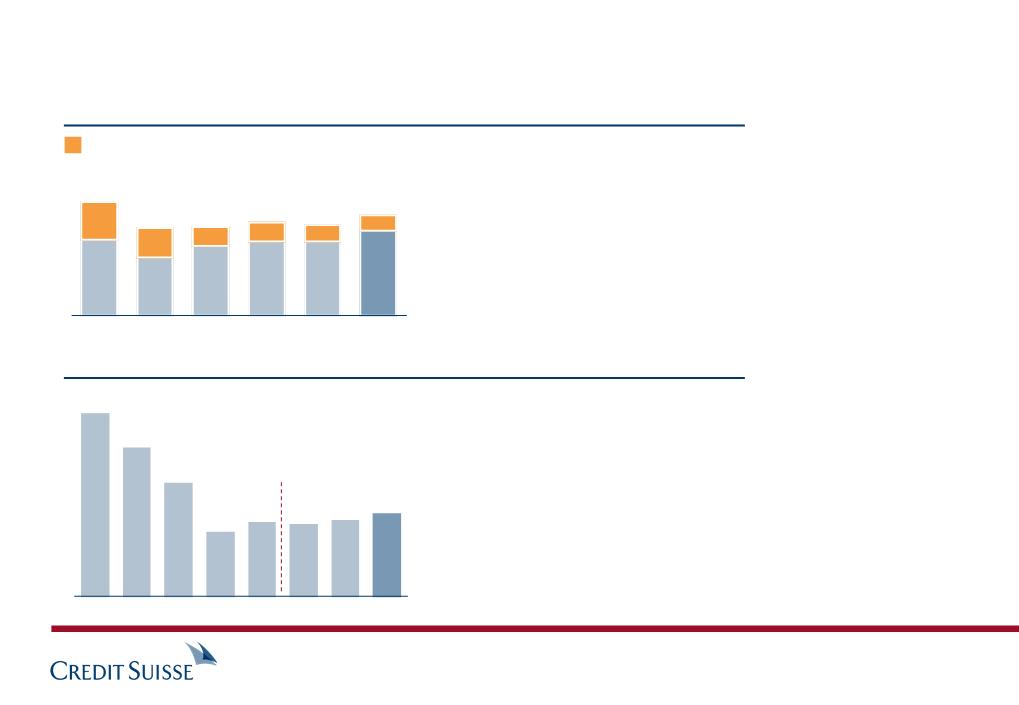
debt (vs. 12% at end 2006)
§ Further lengthened long-term debt profile to
6.6 years duration (vs. 4.9 at end 2006) 5)
6.6 years duration (vs. 4.9 at end 2006) 5)
473
594
Third Quarter 2010 Results
Slide 38
1) Primarily brokerage receivables/payables, positive/negative replacement values and cash collateral
2) Includes due from/to banks
3) Primarily includes excess of funding neutral liabilities (brokerage payables) over corresponding assets
4) Primarily includes unencumbered trading assets, investment securities and excess reverse repo agreements, after
haircuts
haircuts
5) weighted average, assuming that callable securities are redeemed at final maturity, latest in 2030
Maintained strong funding structure
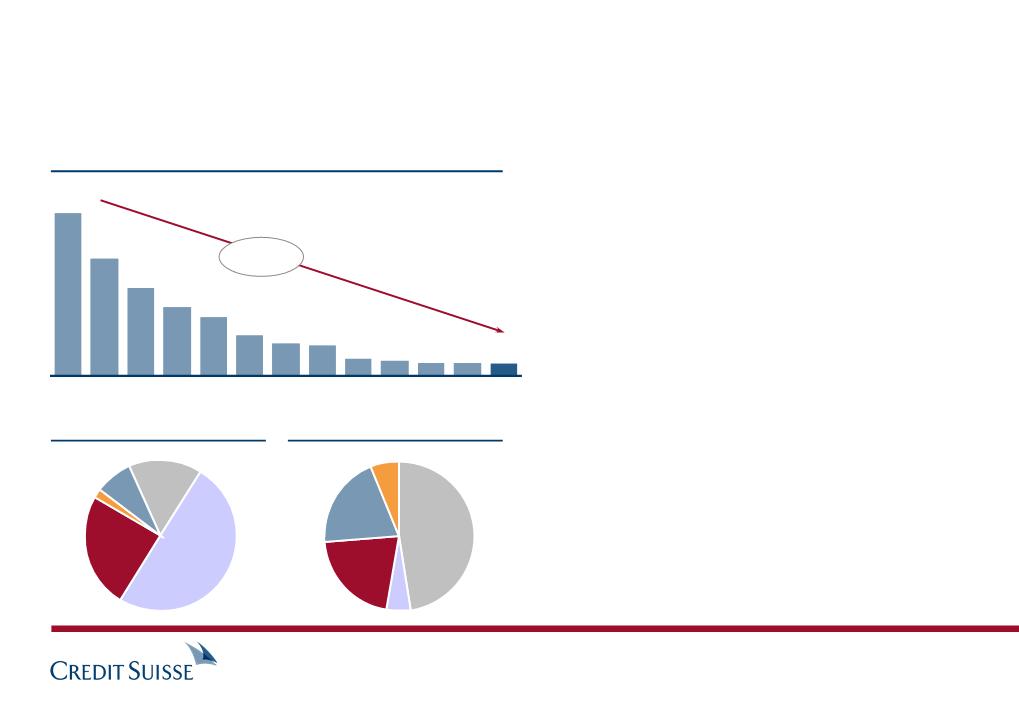
7
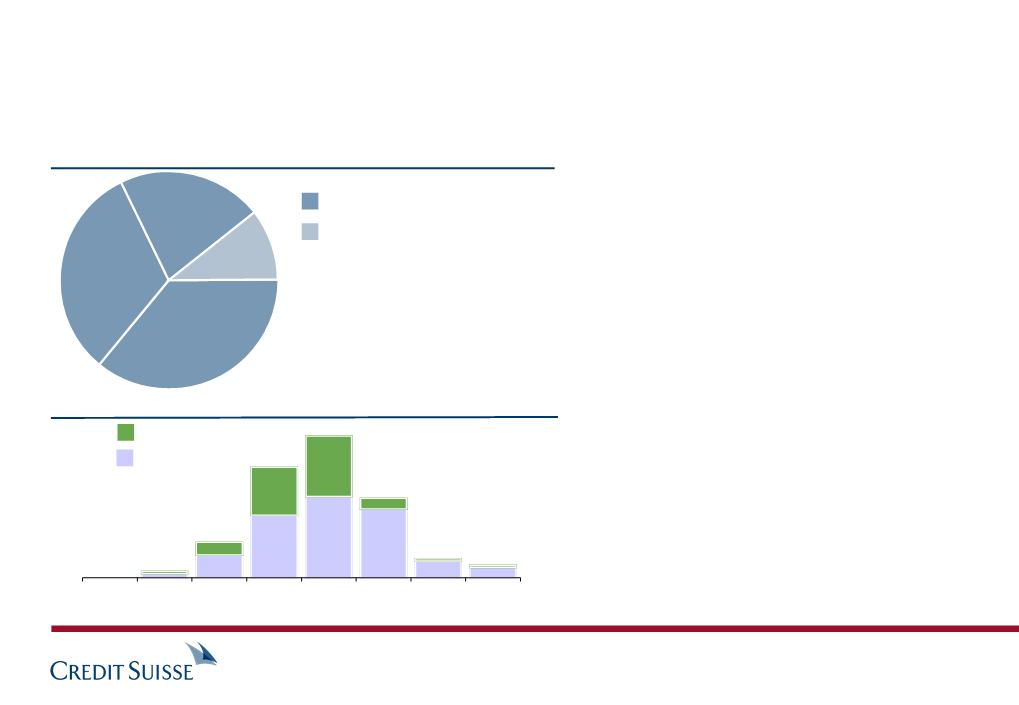
1) This price represents the average mark on loans and bonds combined
36
26
(93)%
19
15
13
9
3Q07
4Q07
1Q08
2Q08
3Q08
4Q08
1Q09
Commercial mortgages (CHF bn)
Exposure by region
§ Further reductions in exposure
achieved in 3Q10 due to sales and FX
movements
achieved in 3Q10 due to sales and FX
movements
§ Average price of remaining positions
is 48% (from 44% in 2Q10)1)
is 48% (from 44% in 2Q10)1)
§ Positions are fair valued;
no reclassifications to accrual book
no reclassifications to accrual book
Other
6%
Asia
8%
Germany
25%
US
16%
UK
2%
Other
Continental
Europe
Europe
50%
Office
47%
47%
Retail
5%
Hotel
21%
Multi-
family
family
20%
Exposure by loan type
2Q09
7
3.6
3Q09
3.1
4Q09
2.7
1Q10
2.6
2Q10
2.4
3Q10
Third Quarter 2010 Results
Slide 39
Commercial mortgage exposure reduction in Investment Banking
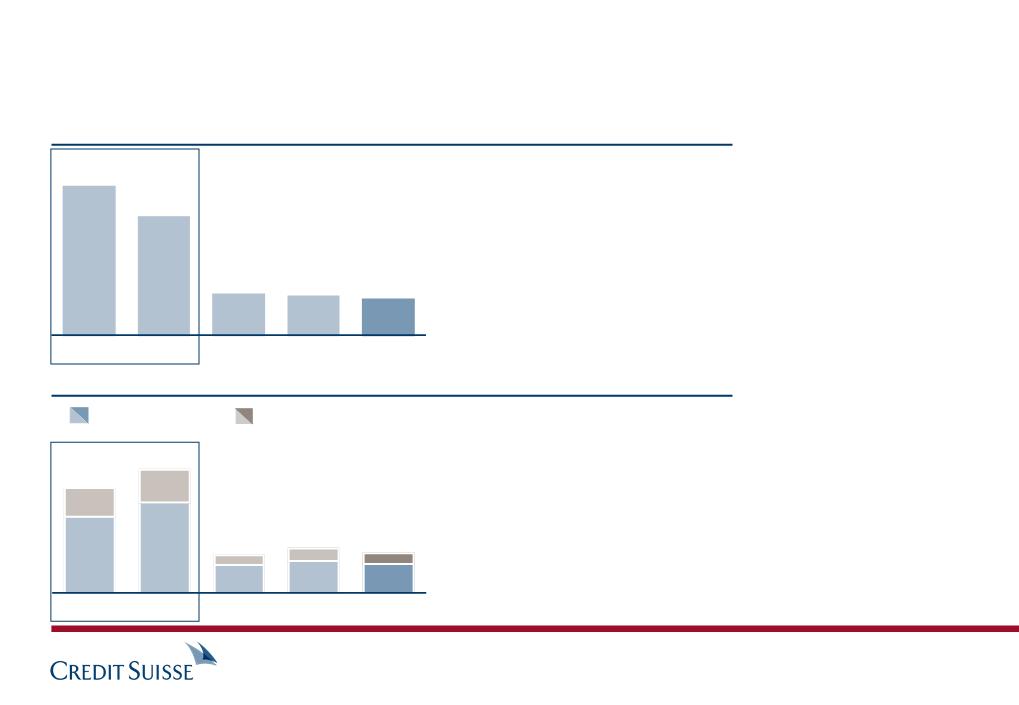
Developed market lending
§ Corporate loan portfolio 78% is investment grade, and is mostly
(91%) accounted for on a fair value basis
(91%) accounted for on a fair value basis
§ Fair value is a forward looking view which balances accounting
risks, matching treatment of loans and hedges
risks, matching treatment of loans and hedges
§ Loans are carried at an average mark of approx. 99% with
average mark of 96% in non-investment grade portfolio
average mark of 96% in non-investment grade portfolio
§ Continuing good performance of individual credits: limited
specific provisions during the quarter
specific provisions during the quarter
Unfunded
commitments
commitments
Loans
Hedges
CHF bn
Emerging market lending
§ Well-diversified by name and evenly spread between EMEA,
Americas and Asia and approx. 30% accounted for on a fair
value basis
Americas and Asia and approx. 30% accounted for on a fair
value basis
§ Emerging market loans are carried at an average mark of
approx. 97%
approx. 97%
§ No significant provisions during the quarter
Note: Average mark data is net of fair value discounts and credit
provisions
provisions
46
8
(17)
Loans
Hedges
CHF bn
15
(9)
Third Quarter 2010 Results
Slide 40
Investment Banking loan book
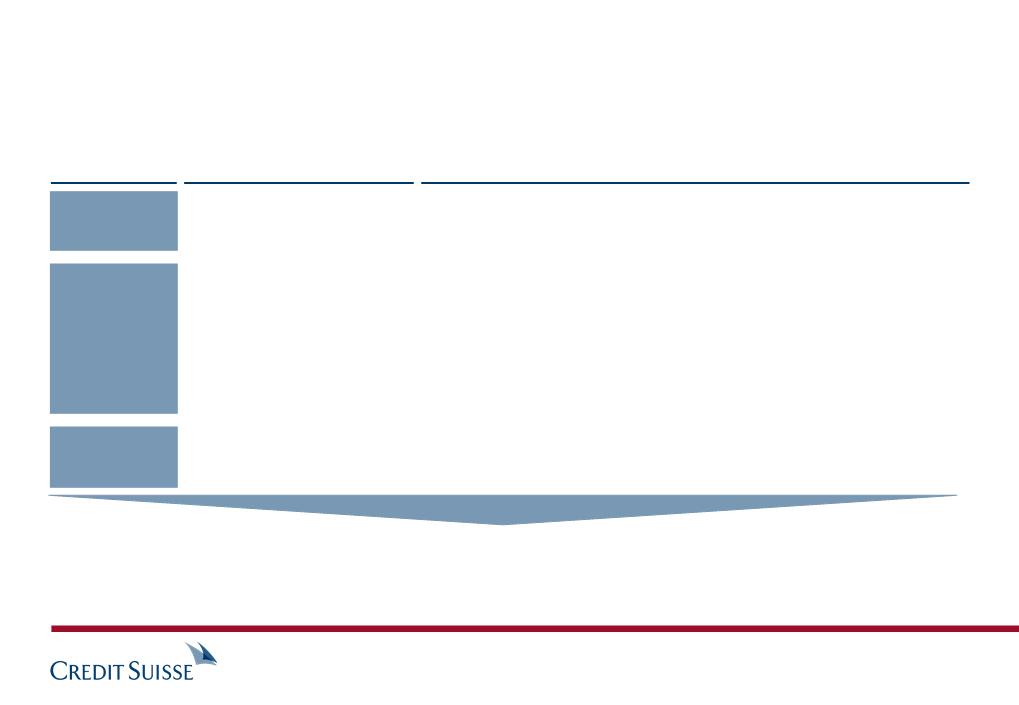
6% BB+ to BB
2% BB- and below
Portfolio ratings
composition, by CRM
transaction rating
composition, by CRM
transaction rating
Private Banking Loan Book
LTV = Loan to value
Total: CHF 182 bn
65%
27%
BBB
AAA to A
Total loan book of CHF 182 bn focused on Switzerland and 85% collateralized; primarily on accrual accounting basis
Third Quarter 2010 Results
Slide 41
Wealth Management Clients: CHF 132 bn
§ Portfolio remains geared towards mortgages (CHF 90 bn) and securities-backed
lending (CHF 35 bn) with conservative lending standards
lending (CHF 35 bn) with conservative lending standards
§ Residential real-estate: Prices for real-estate increase in most regions, especially in
Zurich, lake Geneva region and major tourist spots, slightly declining in structurally
weaker regions; outlook: flat with risk of some price falls only conceivable in the
Lake Geneva region and certain tourist regions
Zurich, lake Geneva region and major tourist spots, slightly declining in structurally
weaker regions; outlook: flat with risk of some price falls only conceivable in the
Lake Geneva region and certain tourist regions
Corporate & Institutional Clients: CHF 50 bn
§ Over 67% collateralized by mortgages and securities
§ Counterparties mainly Swiss corporates incl. real-estate industry
§ Sound credit quality with relatively low concentrations;
§ Stabilization of portfolio quality in line with continued recovery of Swiss
economy
economy
§ Ship finance portfolio (CHF 6 bn) remains under special focus due to
increased risk level caused by overcapacity in the market
increased risk level caused by overcapacity in the market
§ Commercial real-estate: Prices slightly increase for office space, prices for retail
space move sideways; outlook negative for both office and retail
space due to a slack/ decrease in demand coupled with still growing floorspace;
central and prime locations less affected by this decline in prices
space move sideways; outlook negative for both office and retail
space due to a slack/ decrease in demand coupled with still growing floorspace;
central and prime locations less affected by this decline in prices
Private Banking loan book

82 126 (613) (405)
(266) (982) 528 (720)
- 216 - 216
- 447 (43) 404
(184) (193) (128) (505)
Reported pre-tax income / (loss)
Impact from the movement of spreads on own debt1)
Litigation provisions
UK bonus levy
Underlying pre-tax income / (loss)
CHF m
2Q10
1Q10
9M10
1) Including fair valuation gains/losses on cross currency swaps relating to our long-term debt Note: numbers may not add to total due to rounding
The underlying Corporate Center pre-tax loss for 9M10 of CHF (505) m reflects
§ consolidation and elimination adjustments
§ expenses for centrally sponsored projects
§ certain expenses and revenues that have not been allocated to the segments
3Q10
Third Quarter 2010 Results
Slide 42
Underlying results in the Corporate Center

SIGNATURES
Pursuant to the requirements of the Securities Exchange Act of 1934, the registrant has duly caused this report to be signed on its behalf by the undersigned, thereunto duly authorized.
| CREDIT SUISSE GROUP AG and CREDIT SUISSE AG | ||
| (Registrant) | ||
| By: | /s/ Romeo Cerutti | |
| (Signature)* | ||
| General Counsel | ||
| Credit Suisse Group AG and Credit Suisse AG | ||
| Date: October 21, 2010 | ||
| /s/ Charles Naylor | ||
| Head of Corporate Communications | ||
| *Print the name and title under the signature of the signing officer. | Credit Suisse Group AG and Credit Suisse AG |