UNITED STATES
SECURITIES AND EXCHANGE COMMISSION
Washington, D.C. 20549
______________
Form 6-K
______________
REPORT OF FOREIGN PRIVATE ISSUER PURSUANT TO RULE 13a-16 OR 15d-16
UNDER THE SECURITIES EXCHANGE ACT OF 1934
April 27, 2011
Commission File Number 001-15244
CREDIT SUISSE GROUP AG
(Translation of registrant’s name into English)
Paradeplatz 8, P.O. Box 1, CH-8070 Zurich, Switzerland
(Address of principal executive office)
______________
Commission File Number 001-33434
CREDIT SUISSE AG
(Translation of registrant’s name into English)
Paradeplatz 8, P.O. Box, CH-8070 Zurich, Switzerland
(Address of principal executive office)
______________
Indicate by check mark whether the registrant files or will file annual reports under cover of Form 20-F or Form 40-F.
Form 20-F  | Form 40-F  |
Indicate by check mark if the registrant is submitting the Form 6-K in paper as permitted by Regulation S-T Rule 101(b)(1):
Note: Regulation S-T Rule 101(b)(1) only permits the submission in paper of a Form 6-K if submitted solely to provide an attached annual report to security holders.
Indicate by check mark if the registrant is submitting the Form 6-K in paper as permitted by Regulation S-T Rule 101(b)(7):
Note: Regulation S-T Rule 101(b)(7) only permits the submission in paper of a Form 6-K if submitted to furnish a report or other document that the registrant foreign private issuer must furnish and make public under the laws of the jurisdiction in which the registrant is incorporated, domiciled or legally organized (the registrant’s “home country”), or under the rules of the home country exchange on which the registrant’s securities are traded, as long as the report or other document is not a press release, is not required to be and has not been distributed to the registrant’s security holders, and, if discussing a material event, has already been the subject of a Form 6-K submission or other Commission filing on EDGAR.
Indicate by check mark whether the registrant by furnishing the information contained in this Form is also thereby furnishing the information to the Commission pursuant to Rule 12g3-2(b) under the Securities Exchange Act of 1934.
Yes | No |
If “Yes” is marked, indicate below the file number assigned to the registrant in connection with Rule 12g3-2(b): 82-.
| CREDIT SUISSE GROUP AG | ||
Paradeplatz 8 P.O. Box CH-8070 Zurich Switzerland | Telephone +41 844 33 88 44 Fax +41 44 333 88 77 media.relations@credit-suisse.com | |
Media Release
Credit Suisse Group reports underlying* pre-tax profit of CHF 2.2 billion and underlying net income of CHF 1.6 billion; underlying return on equity 18.8%
Including fair value losses of CHF 617 million, CHF 467 million after tax, on own debt and stand-alone derivatives relating to own funding liabilities, pre-tax profit was CHF 1.6 billion and net income CHF 1.1 billion, return on equity of 13.4%
Net new assets totalled CHF 19.1 billion; very strong capital position with a tier 1 ratio of 18.2%
| · | Private Banking pre-tax income of CHF 0.9 billion with net new assets of CHF 18.0 billion |
| · | Investment Banking pre-tax income of CHF 1.3 billion; strong fixed income and solid equity sales and trading results; solid underwriting and advisory results; continued positive market share momentum |
| · | Asset Management pre-tax income of CHF 172 million; building fee-based revenues, net new assets of CHF 4.5 billion |
| · | Overall strong, high-quality operating results, evidencing continued client momentum and market share gains across businesses |
| · | Credit Suisse continued to build on an already very high capital position; tier 1 ratio of 18.2%, Core tier 1 ratio of 13.0%, announced two transactions to create up to 70% of its maximum potential issuance of high-trigger contingent capital suggested under the proposed Swiss regulations and capital requirements by 2019; deferred tax assets reduced by CHF 0.8 billion |
| · | During 1Q11 Credit Suisse continued to work closely with regulators to help build a more stable financial system. In line with its expectations, regulatory trends show progress in developing a more level playing field for the global banking industry |
Zurich, April 27, 2011 Credit Suisse reported underlying core results as follows: pre-tax income of 2.2 billion, net income of CHF 1.6 billion on net revenue of CHF 8.4 billion and return on equity of 18.8%. This excludes fair value losses of CHF 617 million (CHF 467 million after tax) on own debt and stand-alone derivatives relating to own funding liabilities. Net income attributable to shareholders was CHF 1.1 billion in 1Q11 on net revenues of CHF 8.2 billion and a return on equity attributable to shareholders of 13.4%. Diluted earnings per share were
| Media Release | |
April 27, 2011 Page 2/7 |
CHF 0.90 and the tier 1 ratio was 18.2% as of the end of 1Q11. The weakening of the average rate of the US dollar and euro against the Swiss franc adversely affected results in 1Q11 compared to the previous year period.
Brady W. Dougan, Chief Executive Officer, said: “With an underlying return on equity of 18.8% we have provided further evidence that our business model generates stable, high-quality earnings. In a quarter marked by significant market uncertainty, we have maintained our strong momentum with clients, gaining market share and generating CHF 19.1 billion net new assets. At the same time, we have continued to work with regulators to help build a more robust financial system, spearheading the creation of a market for contingent convertible capital. I am convinced that clients and investors will recognize that, by being an early adopter of new regulatory requirements, Credit Suisse is extremely well positioned and will be better placed to create significant value for them.”
Commenting on Private Banking, he said: “We achieved a good performance in Private Banking with continued positive client momentum and inflow of assets. This is the result of our longstanding efforts to build a multi-shore business and a comprehensive advisory process in Wealth Management, where we achieved an excellent result with CHF 15.7 billion in net new assets.”
Commenting on Investment Banking, he said: “Our Investment Bank continues to win market share with strong fixed income and solid equity sales and trading results as well as a solid performance in underwriting and advisory. The environment for fixed income trading improved in the first quarter and we are particularly pleased that the investment in this part of our business has begun to show a material impact on our performance. We also maintained our strong position in equity sales and trading. Our pipeline in underwriting and advisory remains strong and we are well positioned to capture increases in issuance levels and M&A activity.”
Commenting on Asset Management, he said: “In Asset Management we continue to successfully execute our strategy including our acquisitions such as Hedging-Griffo in Brazil and our stake in York Capital. There has been continued improvement in investment performance, performance fees have continued to grow and we believe there is further upside potential. We are also pleased with our steady quarterly net asset inflows.”
Commenting on the regulatory environment, he said: “In light of the financial crisis, banks need to embrace a stronger capital regime and with Basel III we have the framework to allow for consistent capital treatment globally. In 2010 the Swiss Expert Commission made proposals on how the Swiss large banks could address the too-big-to-fail issue. We support the Expert Commission’s proposals and believe they can be implemented without a large impact on our competitive position under Basel III. We are encouraged that measures proposed by regulators outside of Switzerland suggest that progress toward a more level playing field is being made.”
Commenting on the outlook, he said: “We expect the market environment to remain constructive. We also expect clients to remain active with an increased appetite for higher return assets and comprehensive advisory services. However, the macroeconomic recovery continues to be gradual and impacted by external and market events. Nonetheless, we have substantial momentum across all of our client based businesses and we remain well prepared to continue to capitalize on our improved market position.”
| Media Release | |
April 27, 2011 Page 3/7 |
| in CHF million (unless otherwise stated) | 1Q11 | 4Q10 | 1Q10 | Change in % | Change in % |
| vs. 4Q10 | vs. 1Q10 | ||||
| Net income attributable to shareholders | 1,139 | 841 | 2,055 | 35 | (45) |
| Diluted earnings per share (CHF) | 0.90 | 0.59 | 1.63 | 53 | (45) |
| Return on equity attributable to shareholders (annualized) | 13.4% | 9.8% | 22.3% | - | - |
| Tier 1 ratio (end of period) | 18.2% | 17.2% | 16.4% | - | - |
| Assets under management from continuing operations (CHF billion) | 1,282.4 | 1,253.0 | 1,270.9 | 2.3 | 0.9 |
| Core results | |||||
| Net revenues | 7,813 | 6,960 | 8,961 | 12 | (13) |
| Provision for credit losses | (7) | (23) | (50) | (70) | (86) |
| Total operating expenses | 6,195 | 5,676 | 6,077 | 9 | 2 |
| Income from continuing operations before taxes* | 1,625 | 1,307 | 2,934 | 24 | (45) |
Underlying results** | |||||
| Net revenues | 8,430 | 7,146 | 8,759 | 18 | (3.8) |
| Pre-tax income | 2,242 | 1,493 | 2,732 | 50.2 | (17.9) |
| Net income attributable to shareholders | 1,606 | 987 | 1,926 | 62.7 | (16.6) |
| Return on equity attributable to shareholders (annualized) | 18.8% | 11.5% | 20.9% | - | - |
| *Includes the results of the three segments and the Corporate Center, but does not include noncontrolling interests without significant economic interest. | |||||
| **Excluding fair value losses of CHF 617 million (CHF 467 million after tax) on own debt and stand-alone derivatives relating to own funding liabilities. | |||||
Segment Results
Private Banking
Private Banking, which comprises the Wealth Management Clients and Corporate & Institutional Clients businesses, reported income before taxes of CHF 855 million in 1Q11, down 4% compared to 1Q10. Net revenues were stable at CHF 2,896 million. This reflected 13% higher transaction-based revenues from an increase in client activity, offset by 5% lower recurring commissions and fees and a 3% lower net interest income. The decline in recurring commissions and fees was mainly from lower investment product management fees, primarily due to the positive impact from a change in estimate for prior-year fee accruals in 1Q10. Total operating expenses increased, reflecting slightly higher compensation and benefits, mainly from increased headcount. Provision for credit losses remained on a low level of CHF 12 million.
The Wealth Management Clients business reported income before taxes of CHF 623 million in 1Q11, down 8% compared to 1Q10, as stable net revenues and lower provision for credit losses were outweighed by slightly higher operating expenses. Net revenues reflected 4% lower net interest income and 5% lower recurring commissions and fees. This was offset by 11% higher transaction-based revenues, driven by higher brokerage and product issuing fees from an increased client activity, higher foreign exchange income from client transactions and revenues from integrated solutions. The gross margin of 118 basis points decreased 3 basis points from the prior year quarter as a lower margin related to recurring commissions and fees and net interest income was only partially offset by a higher transaction-based margin.
| Media Release | |
April 27, 2011 Page 4/7 |
The Corporate & Institutional Clients business, an important provider of financing for the Swiss economy, reported strong income before taxes of CHF 232 million, up 8% from 1Q10. A 6% increase in net revenues was accompanied by stable operating expenses and no provision for credit losses. Revenues were driven by a strong increase in transaction-based revenues.
Investment Banking
Investment Banking reported pre-tax income of CHF 1,343 million, down 25% compared to 1Q10 and up 141% from 4Q10. Net revenues of CHF 4,929 million were down 6% from 1Q10 and were up 42% from 4Q10. In US dollars, net revenues were 8% higher compared to 1Q10 and 49% higher compared to 4Q10, while pre-tax income was 15% lower compared to 1Q10 and 154% higher compared to 4Q10.
Net revenues included strong fixed income and solid equity sales and trading results, reflecting our franchise build-out, an improved market environment, an increase in client trading volumes and continued market share momentum. Our underwriting and advisory results were solid although lower than the seasonally strong 4Q10. Results reflected fair value losses on Credit Suisse vanilla debt and debit valuation adjustments (DVA) relating to certain structured note liabilities. Compensation and benefits of CHF 2,408 million in 1Q11 were higher than 1Q10, reflecting primarily higher social security taxes relating to share award deliveries in 1Q11. The average one-day, 99% risk management value-at-risk (VaR) was CHF 93 million in 1Q11, compared to CHF 104 million in 4Q10.
Asset Management
Asset Management reported pre-tax income of CHF 172 million, up 4% compared to 1Q10 and down 4% compared to 4Q10. Net revenues were down 6% from 1Q10 and 4% from 4Q10. Net revenues before investment-related gains and securities purchased from our money market funds were CHF 431 million, up 9% compared to 1Q10, reflecting improved results in diversified investments, alternative investments and traditional investments. Operating expenses of CHF 419 million were down 10% compared to 1Q10 with lower compensation and benefits, general and administrative and commission expenses. Assets under management were CHF 436 billion, up 2% compared to 4Q10, with positive market performance and net new assets.
Net New Assets
Private Banking recorded net new assets of CHF18.0 billion. The Wealth Management Clients business contributed net new assets of CHF 15.7 billion. Corporate & Institutional Clients contributed net new assets of CHF 2.3 billion. Compared to the end of 1Q10, assets under management were up 1.3%, reflecting net new assets and positive equity and bond market movements, mostly offset by adverse foreign exchange-related movements, mainly from the weakening of the euro and the US dollar during this period.
Asset Management reported net new assets of CHF 4.5 billion in 1Q11, including net inflows of CHF 3.9 billion in traditional investments, as inflows in multi-asset class solutions, equities and fixed income were partially offset by outflows from Swiss advisory and net inflows of CHF 0.6 billion in alternative investments, as inflows in real estate and commodities and exchange traded funds (ETFs) were mostly offset by private equity realizations and outflows in hedge funds. Compared to 1Q10, assets under management were stable with net new assets and positive market performance offset by adverse foreign exchange-related movements.
| Media Release | |
April 27, 2011 Page 5/7 |
Credit Suisse Group’s total assets under management were CHF 1,282.4 billion, stable compared to 1Q10 and up CHF 29 billion, or 2.3%, compared to the end of 4Q10, reflecting net new assets and positive market performance.
| in CHF million | 1Q11 | 4Q10 | 1Q10 | Change in % | Change in % | |
| vs. 4Q10 | vs. 1Q10 | |||||
| Private | Net revenues | 2,896 | 2,914 | 2,900 | (1) | 0 |
| Banking | Provision for credit losses | 12 | 4 | 19 | 200 | (37) |
| Total operating expenses | 2,029 | 2,086 | 1,989 | (3) | 2 | |
| Income before taxes | 855 | 824 | 892 | 4 | (4) | |
| Investment | Net revenues | 4,929 | 3,478 | 5,216 | 42 | (6) |
| Banking | Provision for credit losses | (19) | (27) | (69) | (30) | (72) |
| Total operating expenses | 3,605 | 2,947 | 3,491 | 22 | 3 | |
| Income before taxes | 1,343 | 558 | 1,794 | 141 | (25) | |
| Asset | Net revenues | 591 | 617 | 631 | (4) | (6) |
| Management | Provision for credit losses | 0 | 0 | 0 | - | - |
| Total operating expenses | 419 | 437 | 465 | (4) | (10) | |
| Income/(loss) before taxes | 172 | 180 | 166 | (4) | 4 | |
Capital and liquidity
Credit Suisse’s capital position remains very high. The tier 1 ratio was 18.2% as of the end of 1Q11, compared to 17.2% as of the end of 4Q10 and 16.4% as of the end of 1Q10. Core tier 1 ratio was 13.0% as of the end of 1Q11 compared to 12.2% at the end of 4Q10. Our total shareholders’ equity increased CHF 0.8 billion to CHF 34.1 billion as of the end of 1Q11 from CHF 33.3 billion as of the end of 4Q10. Net deferred tax assets decreased CHF 0.8 billion. Risk-weighted assets decreased 3% to CHF 212.2 billion as of the end of 1Q11.
Credit Suisse Group has worked closely with its primary regulator, FINMA, and the Swiss National Bank to agree the terms of two landmark buffer capital transactions, announced in February, to fulfil what will be required of large Swiss banks under proposed Swiss capital adequacy regulations. With these transactions Credit Suisse Group has already secured more than 70% of its maximum potential issuance of high-trigger contingent capital suggested under the proposed Swiss regulations.
Collaboration revenues
Revenues from the collaboration between Private Banking, Investment Banking and Asset Management were CHF 1.1 billion for 1Q11 or 14.1% of net revenues.
*Excluding fair value losses of CHF 617 million (CHF 467 million after tax) on own debt and stand-alone derivatives relating to own funding liabilities.
Information
Media Relations Credit Suisse AG, telephone +41 844 33 88 44, media.relations@credit-suisse.com
Investor Relations Credit Suisse AG, telephone +41 44 333 71 49, investor.relations@credit-suisse.com
| Media Release | |
April 27, 2011 Page 6/7 |
Credit Suisse AG
Credit Suisse AG is one of the world's leading financial services providers and is part of the Credit Suisse group of companies (referred to here as 'Credit Suisse'). As an integrated bank, Credit Suisse offers clients its combined expertise in the areas of private banking, investment banking and asset management. Credit Suisse provides advisory services, comprehensive solutions and innovative products to companies, institutional clients and high-net-worth private clients globally, as well as to retail clients in Switzerland. Credit Suisse is headquartered in Zurich and operates in over 50 countries worldwide. The group employs approximately 50,100 people. The registered shares (CSGN) of Credit Suisse's parent company, Credit Suisse Group AG, are listed in Switzerland and, in the form of American Depositary Shares (CS), in New York. Further information about Credit Suisse can be found at www.credit-suisse.com.
Cautionary statement regarding forward-looking information and non-GAAP information
This press release contains statements that constitute forward-looking statements within the meaning of the Private Securities Litigation Reform Act. In addition, in the future we, and others on our behalf, may make statements that constitute forward-looking statements. Such forward-looking statements may include, without limitation, statements relating to the following:
| – | our plans, objectives or goals; |
| – | our future economic performance or prospects; |
| – | the potential effect on our future performance of certain contingencies; and |
| – | assumptions underlying any such statements. |
Words such as “believes,” “anticipates,” “expects,” “intends” and “plans” and similar expressions are intended to identify forward-looking statements but are not the exclusive means of identifying such statements. We do not intend to update these forward-looking statements except as may be required by applicable securities laws. By their very nature, forward-looking statements involve inherent risks and uncertainties, both general and specific, and risks exist that predictions, forecasts, projections and other outcomes described or implied in forward-looking statements will not be achieved. We caution you that a number of important factors could cause results to differ materially from the plans, objectives, expectations, estimates and intentions expressed in such forward-looking statements. These factors include:
| – | the ability to maintain sufficient liquidity and access capital markets; |
| – | market and interest rate fluctuations and interest rate levels; |
| – | the strength of the global economy in general and the strength of the economies of the countries in which we conduct our operations, in particular the risk of continued slow economic recovery in the US or other developed countries in 2011 and beyond; |
| – | the direct and indirect impacts of continuing deterioration or slow recovery in residential and commercial real estate markets; |
| – | adverse rating actions by credit rating agencies in respect of sovereign issuers, structured credit products or other credit-related exposures; |
| – | the ability of counterparties to meet their obligations to us; |
| – | the effects of, and changes in, fiscal, monetary, trade and tax policies, and currency fluctuations; |
| – | political and social developments, including war, civil unrest or terrorist activity; |
| – | the possibility of foreign exchange controls, expropriation, nationalization or confiscation of assets in countries in which we conduct our operations; |
| – | operational factors such as systems failure, human error, or the failure to implement procedures properly; |
| – | actions taken by regulators with respect to our business and practices in one or more of the countries in which we conduct our operations; |
| – | the effects of changes in laws, regulations or accounting policies or practices; |
| – | competition in geographic and business areas in which we conduct our operations; |
| – | the ability to retain and recruit qualified personnel; |
| – | the ability to maintain our reputation and promote our brand; |
| – | the ability to increase market share and control expenses; |
| – | technological changes; |
| – | the timely development and acceptance of our new products and services and the perceived overall value of these products and services by users; |
| – | acquisitions, including the ability to integrate acquired businesses successfully, and divestitures, including the ability to sell non-core assets; |
| – | the adverse resolution of litigation and other contingencies; |
| – | the ability to achieve our cost efficiency goals and cost targets; and |
| – | our success at managing the risks involved in the foregoing. |
We caution you that the foregoing list of important factors is not exclusive. When evaluating forward-looking statements, you should carefully consider the foregoing factors and other uncertainties and events, as well as the information set forth in our Annual Report 2010 under IX – Additional information – Risk Factors.
This press release contains non-GAAP financial information. Information needed to reconcile such non-GAAP financial information to the most directly comparable measures under GAAP can be found in the Credit Suisse Financial Release 1Q11.
| Media Release | |
April 27, 2011 Page 7/7 |
Presentation of Credit Suisse Group’s 1Q11 results via audio webcast and telephone conference
| Date | Wednesday, April 27, 2011 | ||
| Time | 09:00 Zurich / 08:00 London / 03:00 New York | ||
| Speakers | Brady W. Dougan, Chief Executive Officer David Mathers, Chief Financial Officer The presentations will be held in English. | ||
| Audio webcast | www.credit-suisse.com/results | ||
| Telephone | Switzerland: | +41 44 580 40 01 | |
| Europe: | +44 1452 565 510 | ||
| US: | +1 866 389 9771 | ||
| Reference: Credit Suisse Group quarterly results | |||
| Q&A session | You will have the opportunity to ask questions during the telephone conference following the presentations. | ||
| Playback | Playback available approximately 2 hours after the event at | ||
| www.credit- suisse.com/results or on the telephone numbers below: | |||
| Switzerland: | +41 44 580 34 56 | ||
| Europe: | +44 1452 550 000 | ||
| US: | +1 866 247 4222 | ||
| Conference ID: 56853338# | |||

First Quarter Results 2011
Zurich
April 27, 2011

Cautionary statement regarding forward-looking and non-GAAP information
This presentation contains forward-looking statements within the meaning of the Private Securities
Litigation Reform Act of 1995. Forward-looking statements involve inherent risks and uncertainties,
and we might not be able to achieve the predictions, forecasts, projections and other outcomes we
describe or imply in forward-looking statements.
Litigation Reform Act of 1995. Forward-looking statements involve inherent risks and uncertainties,
and we might not be able to achieve the predictions, forecasts, projections and other outcomes we
describe or imply in forward-looking statements.
A number of important factors could cause results to differ materially from the plans, objectives,
expectations, estimates and intentions we express in these forward-looking statements, including
those we identify in "Risk Factors" in our Annual Report on Form 20-F for the fiscal year ended
December 31, 2010 filed with the US Securities and Exchange Commission, and in other public
filings and press releases. We do not intend to update these forward-looking statements except as
may be required by applicable laws.
This presentation contains non-GAAP financial information. Information needed to reconcile such
non-GAAP financial information to the most directly comparable measures under GAAP can be
found in Credit Suisse Group's first quarter report 2011.
non-GAAP financial information to the most directly comparable measures under GAAP can be
found in Credit Suisse Group's first quarter report 2011.
First Quarter Results 2011
Slide 1
Cautionary statement

First quarter 2011 results detail
David Mathers, Chief Financial Officer
Introduction
Brady W. Dougan, Chief Executive Officer
Summary
Brady W. Dougan, Chief Executive Officer
First Quarter Results 2011
Slide 2

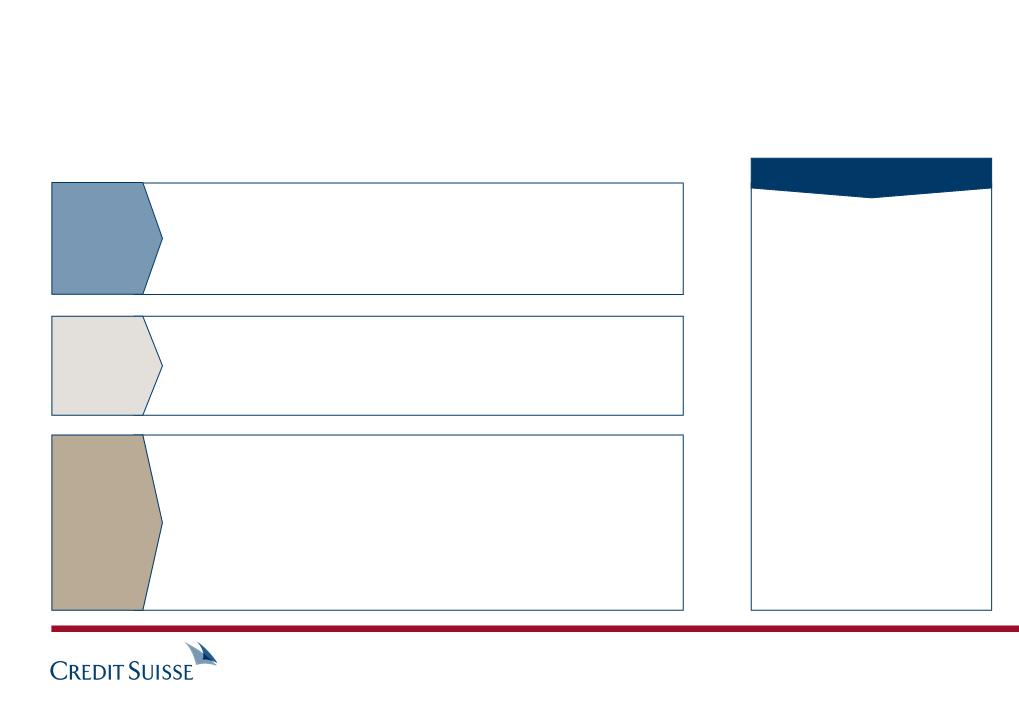
Delivering
client-focused
franchise
client-focused
franchise
Balanced and
high quality
results
high quality
results
Further
strengthened
our capital
position
strengthened
our capital
position
§ Underlying results: pre-tax income of CHF 2.2 bn, net income of CHF 1.6 bn and
after-tax return on equity of 19%
after-tax return on equity of 19%
§ Net new assets of CHF 19 bn
§ Basel 2 tier 1 capital ratio of 18.2% and core tier 1 ratio of 13.0%
§ Executed more than 70% of required high trigger Contingent Capital
§ Shareholders’ equity up 2% (CHF 0.8 bn) and deferred tax assets down 9% (CHF 0.8 bn)
§ Strong liquidity and funding position as competitive advantage
§ Global regulatory trends indicating emergence of a more level playing field
Private Banking with strong inflows and improved transaction revenues offsetting decline in net
interest income
interest income
Investment Banking with record first quarter revenues (in USD) driven by continued market
share momentum and beneficial impact of client flow-sales expansion
share momentum and beneficial impact of client flow-sales expansion
Asset Management with solid inflows and higher quality results reflecting increased fee-based
revenues and reduced expenses
revenues and reduced expenses
First Quarter Results 2011
Slide 3
Introduction
First quarter 2011 results detail
Introduction
Summary
First Quarter Results 2011
Slide 4
Reported in CHF bn
Net revenues
Pre-tax income
Net income attributable to shareholders
Diluted earnings per share in CHF
A reconciliation from reported results to underlying results can be found in the appendix of this presentation
Net revenues
Pre-tax income
Net income attributable to shareholders
Diluted earnings per share in CHF
Pre-tax income margin
Return on equity
Net new assets in CHF bn
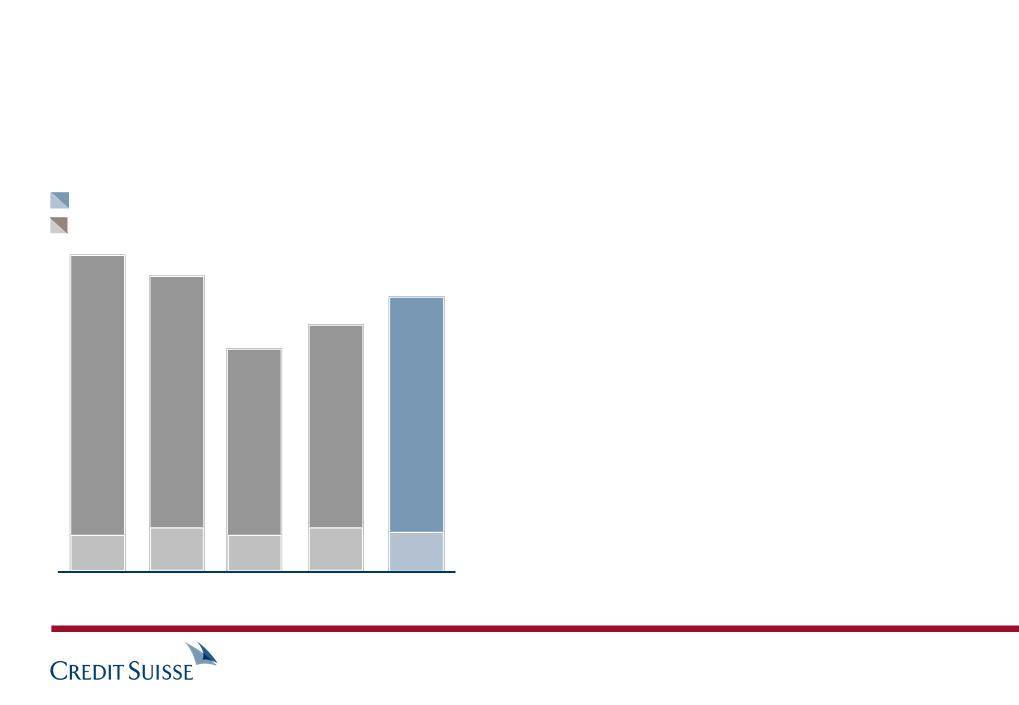
Underlying in CHF bn 1Q11 4Q10 3Q10 2Q10 1Q10
First Quarter Results 2011
Slide 5
8.4 7.1 6.9 7.5 8.8
2.2 1.5 1.4 1.6 2.7
1.6 1.0 1.0 1.1 1.9
1.28 0.71 0.76 0.74 1.53
27% 21% 20% 21% 31%
19% 12% 11% 12% 21%
19.1 13.9 14.6 14.5 26.0
7.8 7.0 6.3 8.4 9.0
1.6 1.3 0.8 1.8 2.9
1.1 0.8 0.6 1.6 2.1
0.90 0.59 0.48 1.15 1.63
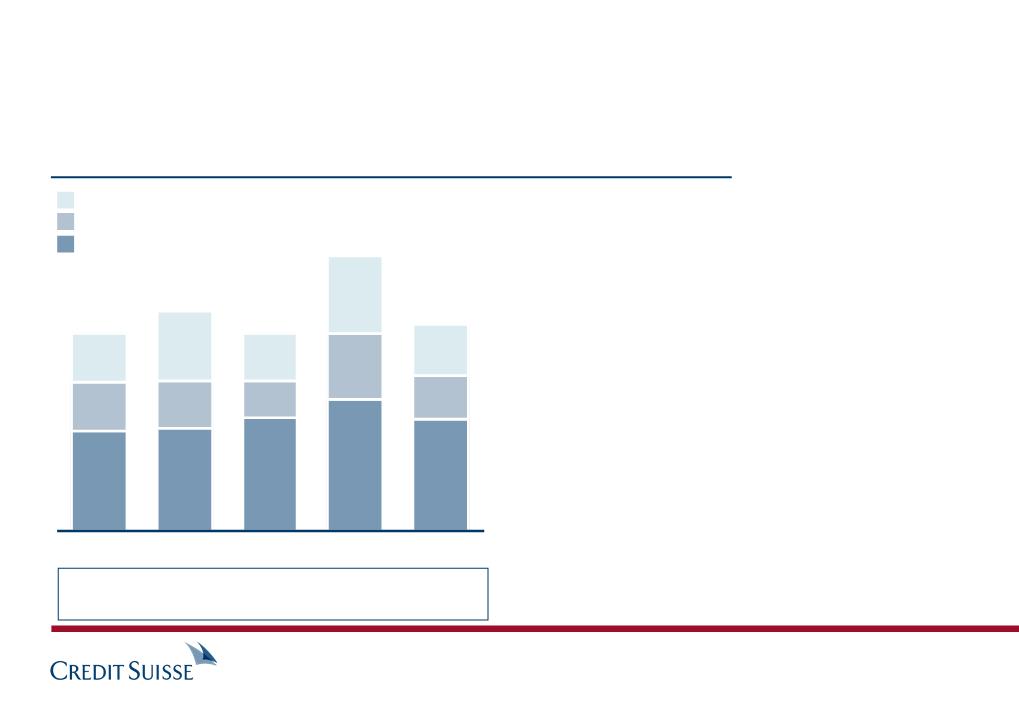
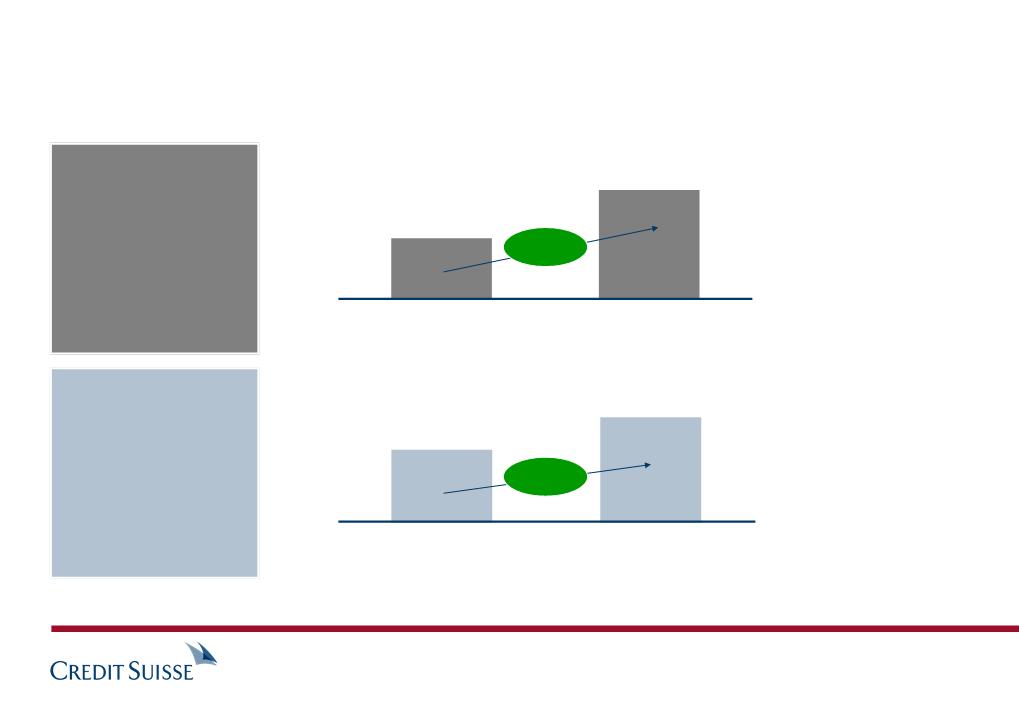
Core results overview
§ Pre-tax margin of 30% in 1Q11
§ 1Q11 expenses of CHF 2 bn in line with 2010 quarterly run-rate, reflecting continued investment
into our international franchise offset by ongoing cost saving measures
into our international franchise offset by ongoing cost saving measures
§ Continue to upgrade relationship manager population while keeping headcount stable
§ Productivity gains from front-to-back efficiency enhancements
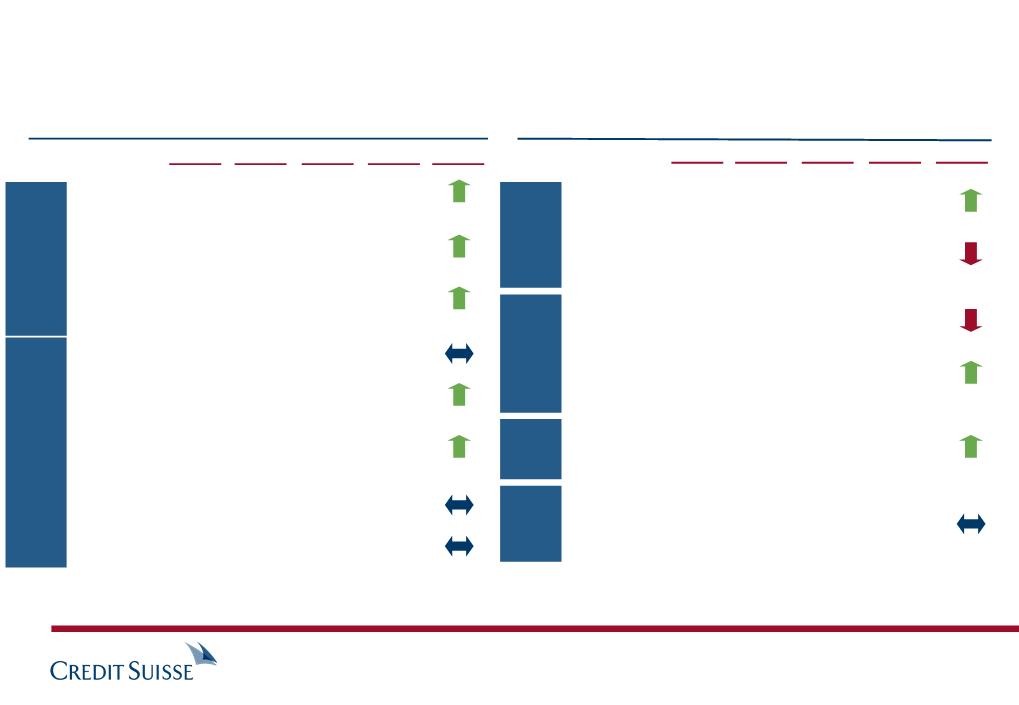
Strong
asset
inflows
asset
inflows
§ Net new assets of CHF 18 bn, with very strong inflows in Wealth Management of
CHF 15.7 bn, representing an annual growth rate of 7.8%
CHF 15.7 bn, representing an annual growth rate of 7.8%
§ Evidence of clients’ trust in Credit Suisse multi-shore business model
§ Net interest income suffered from an FX-related decrease in average deposits and lower
reinvestment rates
reinvestment rates
§ Transaction-based revenues increased due to higher brokerage and product issuing fees,
including stronger demand for structured products
including stronger demand for structured products
§ Continue to benefit from strength of our Swiss businesses in an environment with strong
economic fundamentals
economic fundamentals
Diverging
revenue
trends
revenue
trends
Continue
focus on
efficiency
focus on
efficiency
First Quarter Results 2011
Slide 6
Private Banking with solid performance despite ongoing low
interest environment
interest environment

Net revenues
Provisions for credit losses
Total operating expenses
Pre-tax income
Pre-tax income margin
Gross margin in basis points
Net new assets in CHF bn
Number of relationship managers
CHF m 1Q11 4Q10 3Q10 2Q10 1Q10
First Quarter Results 2011
Slide 7
2,433 2,464 2,385 2,516 2,464
12 14 8 16 32
1,798 1,844 1,765 1,867 1,755
623 606 612 633 677
26% 25% 26% 25% 28%
118 120 118 120 121
15.7 8.1 12.4 11.9 12.9
4,200 4,200 4,190 4,130 4,110
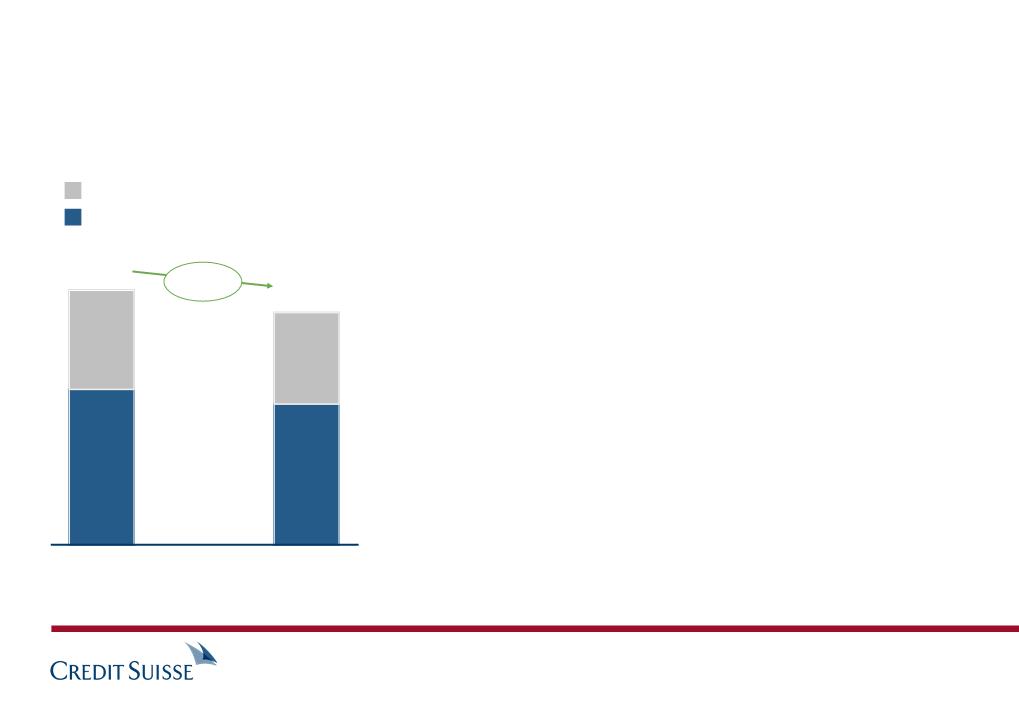
Wealth Management with strong asset inflows and
stable results
stable results
1Q10
921
+149
Increase
assuming stable
FX rates
assuming stable
FX rates
Transaction-
based
revenues
based
revenues
Net interest
income
income
Recurring
commissions
& fees
commissions
& fees
956
587
2,464
1Q11
880
904
649
2,433
(180)
Impact from
stronger
Swiss franc
stronger
Swiss franc
§ Higher brokerage and product issuing fees,
including stronger demand for structured products,
reflecting increased client activity
including stronger demand for structured products,
reflecting increased client activity
§ Mainly reflects gain from change in estimate for fee
accruals that benefited 1Q10
accruals that benefited 1Q10
§ Low fee level continues to reflect risk-averse asset
mix
mix
§ Mainly reflects reduction in average deposit
volumes (FX-related) and lower margins
volumes (FX-related) and lower margins
§ Ongoing impact from low interest rate environment
Net revenues in CHF m
Strengthening of Swiss franc negatively
impacted pre-tax income by CHF 130 m
impacted pre-tax income by CHF 130 m
+11%
(5)%
(4)%
+6%
First Quarter Results 2011
Slide 8
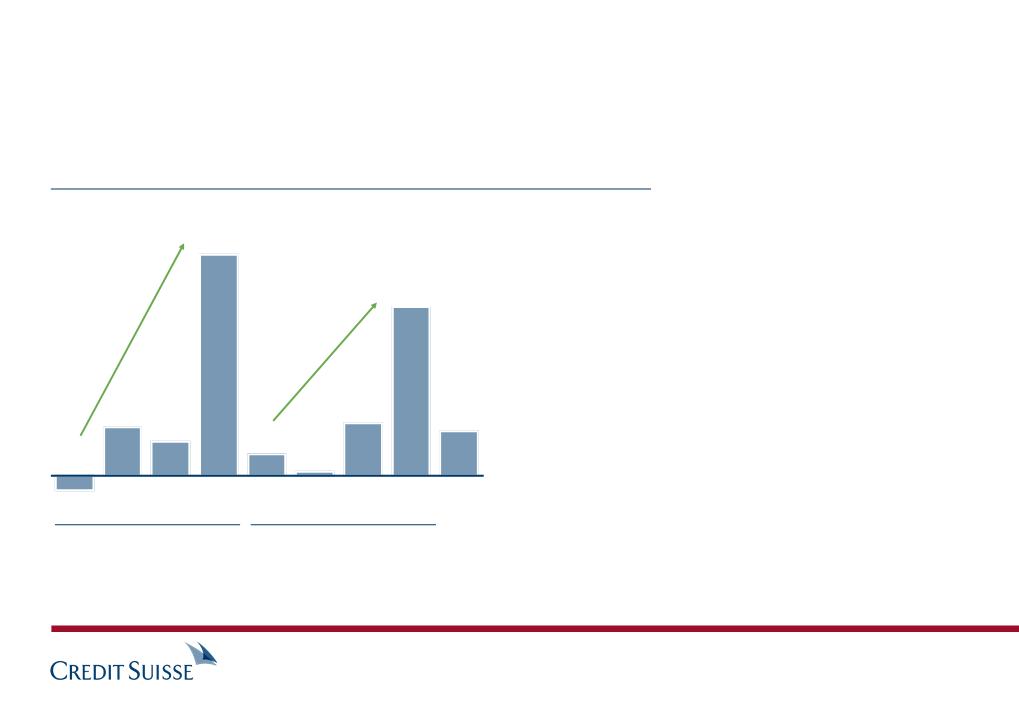
Adverse foreign exchange impact masks underlying
growth trend in Wealth Management
growth trend in Wealth Management
Wealth Management - Net interest income in CHF m
2008
Quarterly average
939
880
2009
2010
§ Interest income suffered due to a FX rate-driven decrease
in average deposit volumes and a continued roll-over of
the portfolio at a low reinvestment rate
in average deposit volumes and a continued roll-over of
the portfolio at a low reinvestment rate
§ Scenario analysis:
– a roll-off at current low rates would lead to approx.
CHF 20 m reduction in quarterly revenues
CHF 20 m reduction in quarterly revenues
– a 100 bp parallel shift in major interest rates would lead
to approx. CHF 75 to 100 m additional quarterly
revenues over time
to approx. CHF 75 to 100 m additional quarterly
revenues over time
927
937
1Q11
Note: Scenario analysis assumes stable volumes
First Quarter Results 2011
Slide 9
Short-term pressure but mid-term potential in net interest
income
income
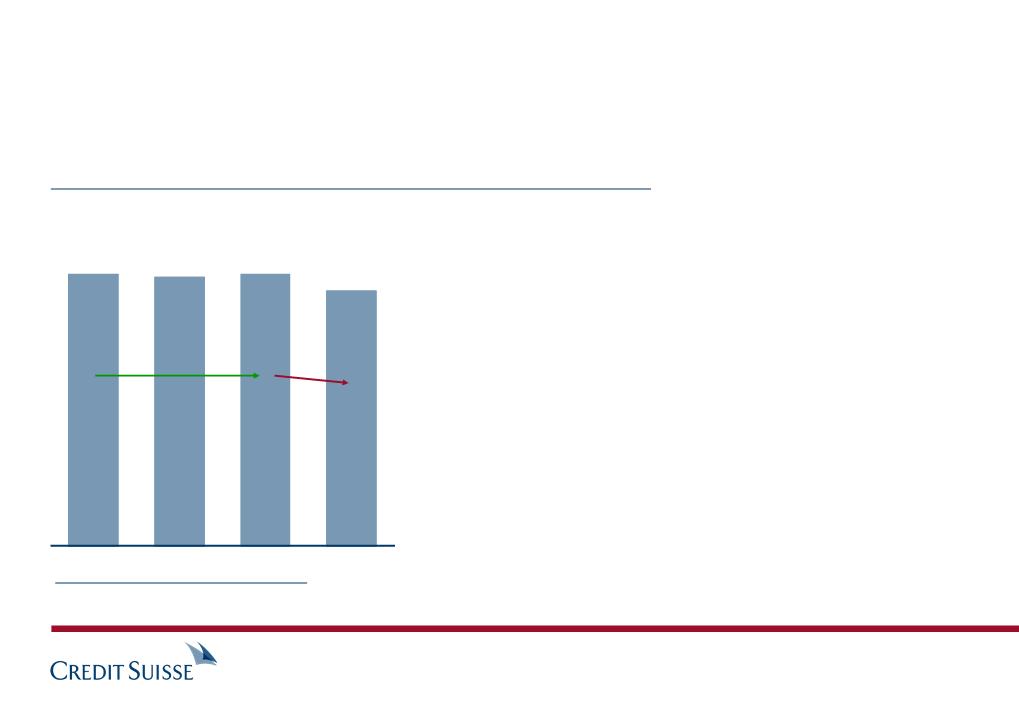
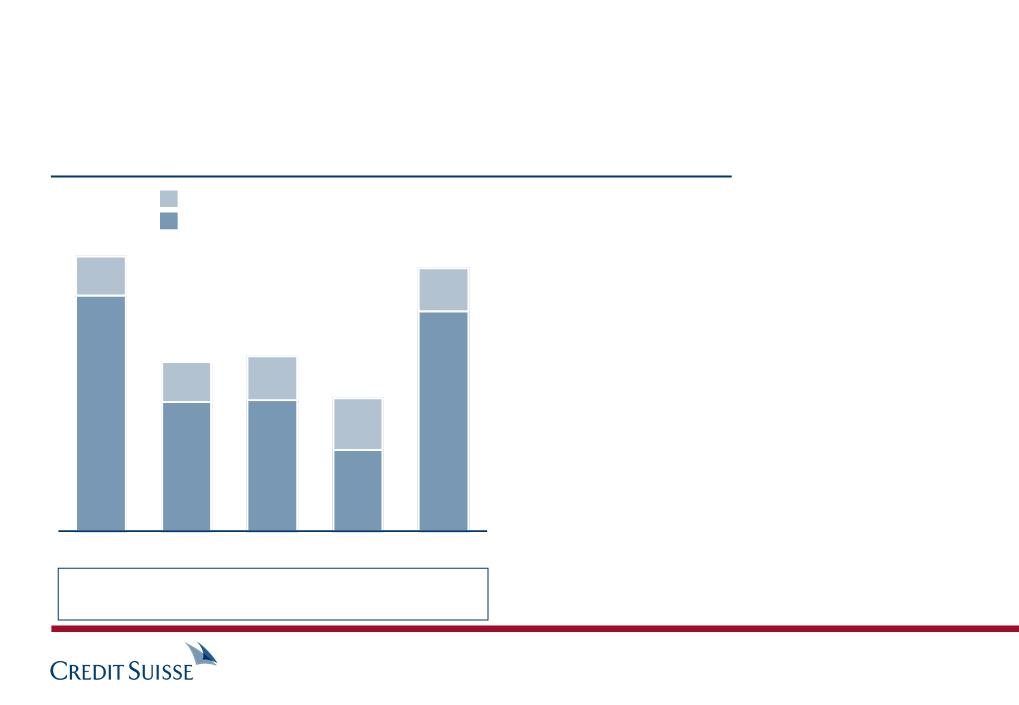
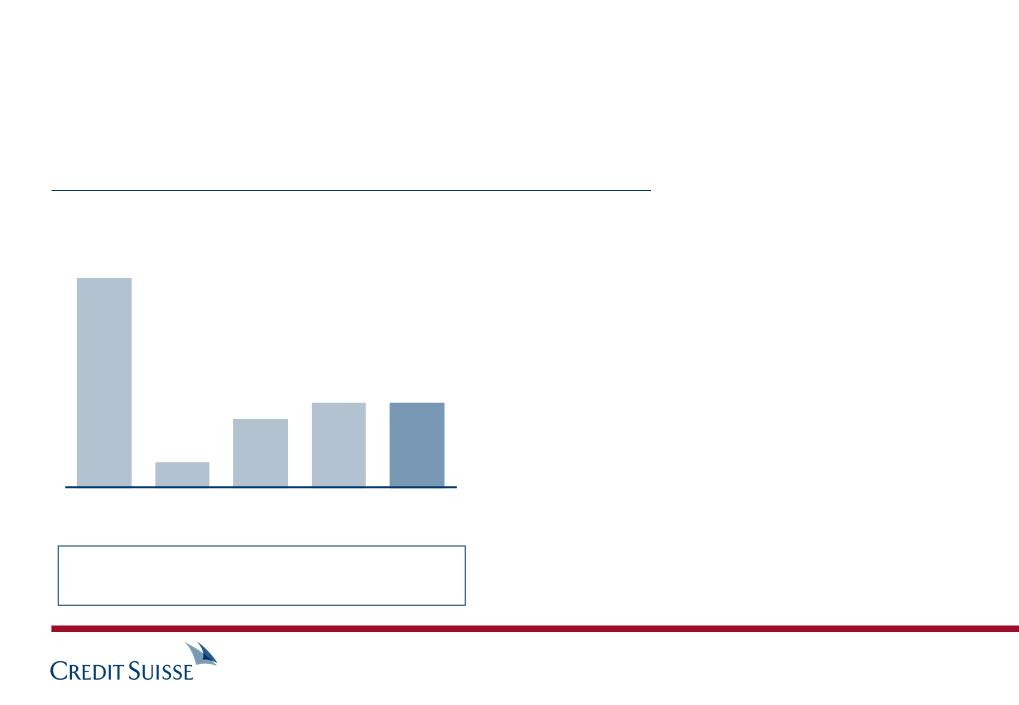
Wealth Management - Transaction-based revenues in CHF m
798
616
649
640
601
2007
Quarterly average
2009
2010
1Q11
2008
Brokerage & product issuing revenues
Other transaction-based revenues
§ Since 2007, lower client activity and change in
product mix negatively affected revenues
product mix negatively affected revenues
§ Client behavior expected to normalize over
time
time
– seeing signs of a recovery since 3Q10 low-
point
point
§ Further upside from integrated solutions
revenues from intensified collaboration with
Investment Banking
revenues from intensified collaboration with
Investment Banking
First Quarter Results 2011
Slide 10
Recent recovery in transaction-based revenues

Net new assets in CHF bn
Annualized net new assets growth in %
6.4 5.8 6.2 4.0 7.8
1Q10
2Q10
3Q10
4Q10
1Q11
15.7
EMEA
Americas
Asia Pacific
Switzerland
12.9
11.9
12.4
8.1
4.0
3.0
4.0
4.7
§ 1Q11 growth rate of 7.8% well above
our 6% target growth rate
our 6% target growth rate
§ Total inflows of CHF 140 bn since
2008 evidencing significant market
share gains
2008 evidencing significant market
share gains
§ Broad inflows across all client
segments with strong contribution
from emerging markets
segments with strong contribution
from emerging markets
First Quarter Results 2011
Slide 11
Wealth Management with continued strong and broadly
distributed net new asset inflows
distributed net new asset inflows
Highlights
1Q11
1Q11
Net revenues
Provisions for credit losses
Total operating expenses
Pre-tax income
Pre-tax income margin
Net new assets in CHF bn
CHF m 1Q11 4Q10 3Q10 2Q10 1Q10
§ Maintained very strong pre-tax margin at 50%
§ Solid net new assets of CHF 2.3 bn
§ Continued low credit provisions, reflecting quality of the loan book
First Quarter Results 2011
Slide 12
463 450 441 475 436
0 (10) (16) (13) (13)
231 242 233 247 234
232 218 224 241 215
50% 48% 51% 51% 49%
2.3 1.5 0.2 1.9 5.7
Corporate & Institutional Clients business continues to
deliver strong results
deliver strong results
Solid
underwriting
and advisory
results
underwriting
and advisory
results
§ Strong debt underwriting revenues, driven by continued strength in high yield
issuance volumes
issuance volumes
§ Solid results in equity underwriting and advisory, although lower compared to the
seasonally strong 4Q10, driven by lower industry-wide issuance volumes and
completed M&A activity
seasonally strong 4Q10, driven by lower industry-wide issuance volumes and
completed M&A activity
§ Revenues continued to be solid reflecting an increase in client volumes
§ Sustained strong market share positions across key businesses
§ Record revenues in Derivatives and stable results in Cash Equities and Prime
Services
Services
Solid equity
sales and
trading
results
sales and
trading
results
§ Strong revenues reflecting franchise build-out, market share gains, increased
client activity and an improved market environment from 4Q10
client activity and an improved market environment from 4Q10
§ Strong results in Securitized Products, Rates and Credit
§ Impact of sales force expansion continues to materialize, with further opportunity
to capitalize on increasing client volumes
to capitalize on increasing client volumes
Strong fixed
income sales
and trading
results
income sales
and trading
results
First Quarter Results 2011
Slide 13
Strong Investment Banking results
Net revenues (USD)
Pre-tax income (USD)
.
5,367 3,618 3,456 3,793 4,986
1,499 624 467 794 1,756
.
Net revenues
Provisions for credit losses
Compensation and benefits
Other operating expenses
Pre-tax income
Pre-tax income margin
CHF m 1Q11 4Q10 3Q10 2Q10 1Q10
Note: Excluding impact of movements in spreads on own debt of CHF (52) m, CHF (54) m, CHF (57) m, CHF (62) m and CHF (59) m in 1Q11, 4Q10, 3Q10, 2Q10 and 1Q10, respectively.
Including debit valuation adjustments (DVA) related to certain structured note liabilities of CHF (85) m, CHF 15 m, CHF (172) m, CHF 121 m and CHF (37) m in 1Q11, 4Q10, 3Q10, 2Q10
and1Q10, respectively.
and1Q10, respectively.
Significant quarter-on-quarter revenue momentum in USD
First Quarter Results 2011
Slide 14
4,981 3,532 3,478 4,161 5,275
(19) (27) (18) 17 (69)
2,408 1,823 1,872 2,014 2,324
1,198 1,124 1,172 1,284 1,167
1,394 612 452 846 1,853
28% 17% 13% 20% 35%
Investment Banking delivered strong results in 1Q11
1) Excludes impact of movements in spreads on own debt and includes DVA of CHF (20) m, CHF 5 m,
CHF (54) m, CHF 57 m and CHF (17) m in 1Q11, 4Q10, 3Q10, 2Q10 and 1Q10, respectively
CHF (54) m, CHF 57 m and CHF (17) m in 1Q11, 4Q10, 3Q10, 2Q10 and 1Q10, respectively
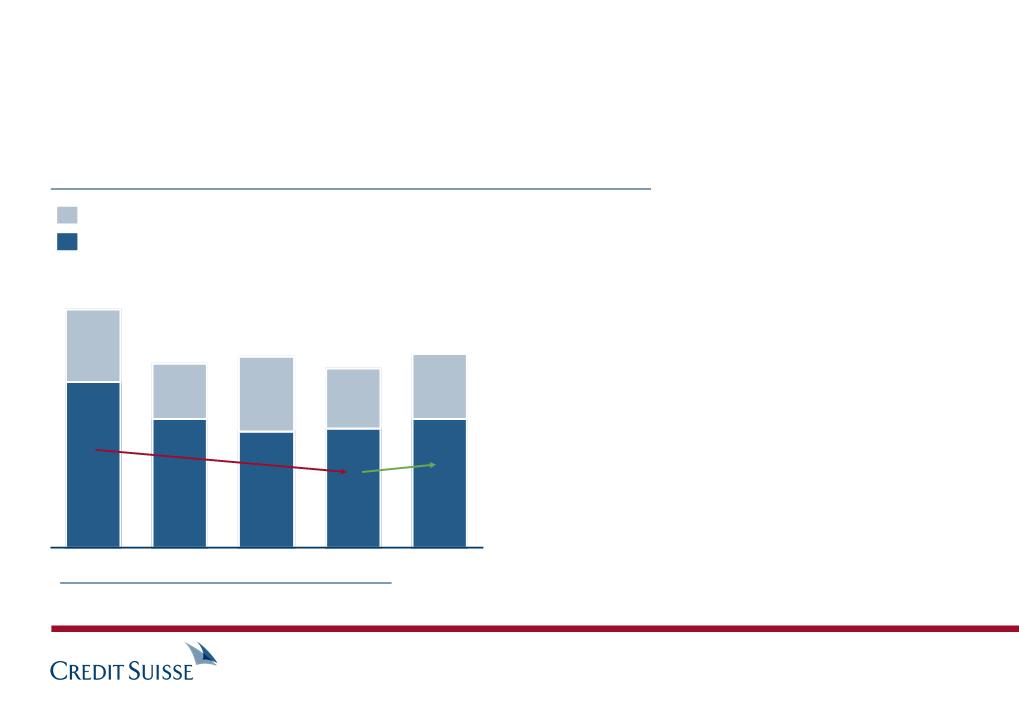
Fixed income sales & trading and underwriting revenues in CHF bn 1)
Debt underwriting
Fixed income sales and trading
2.0
1.5
0.5
3.2
2.7
0.5
2.0
1.5
0.5
1.5
0.9
0.6
1Q10
2Q10
3Q10
4Q10
1Q11
in USD bn
3.0 1.8 2.0 1.6 3.3
3.0
2.5
0.5
§ Increased client activity and revenues across most
businesses; in US dollar terms revenues increased
10% from 1Q10
businesses; in US dollar terms revenues increased
10% from 1Q10
§ Strong revenues in Securitized Products, driven by
increased client flows in non-agency RMBS
increased client flows in non-agency RMBS
§ Credit performance driven by robust Leveraged
Finance trading and strong new issue activity
Finance trading and strong new issue activity
§ Strong results in Rates, benefitting from higher
client flows, expanded footprint and higher interest
rate volatility
client flows, expanded footprint and higher interest
rate volatility
First Quarter Results 2011
Slide 15
Strong fixed income revenues reflecting franchise build-out,
improved market share and an increase in client activity from 4Q10
improved market share and an increase in client activity from 4Q10
100%
119%
10.5%
4.9%
2.2%
1.1%
1Q10
1Q11
Credit
FX
Global
Rates
Rates
Emerging
Markets
Markets
Indexed sales credits
§ Sales force expansion
in 2010 enabled
broader and deeper
product offering
in 2010 enabled
broader and deeper
product offering
§ Sales credit growth
particularly strong in
Rates and FX
particularly strong in
Rates and FX
§ Significant revenue
opportunity remains
across products
opportunity remains
across products
Contribution to fixed income sales credit growth 1)
1) Sales credits limited to secondary trading activity; excludes all capital
markets and advisory revenues and new issue-related sales credits
markets and advisory revenues and new issue-related sales credits
First Quarter Results 2011
Slide 16
Impact of sales force expansion continues to materialize, with
further opportunity to capitalize on increasing client volumes
further opportunity to capitalize on increasing client volumes
1) Excludes impact of movements in spreads on own debt and includes DVA of CHF (65) m, CHF 10 m,
CHF (118) m, CHF 64 m and CHF (19) m in 1Q11, 4Q10, 3Q10, 2Q10 and 1Q10, respectively
CHF (118) m, CHF 64 m and CHF (19) m in 1Q11, 4Q10, 3Q10, 2Q10 and 1Q10, respectively
2) Source: Greenwich Associates for rank and Credit Suisse estimates for market share
Equity sales & trading and underwriting revenues in CHF bn 1)
Equity underwriting
Equity sales and trading
§ Record revenues in Derivatives driven by increased
client flows, an improvement in corporate derivatives
and a more favorable trading environment
client flows, an improvement in corporate derivatives
and a more favorable trading environment
§ Stable results in Cash Equities and Prime Services
on mixed market trends and continued market share
gains
on mixed market trends and continued market share
gains
§ Maintained #1 positions and improved market share
in US cash equities trading and US electronic
trading 2)
in US cash equities trading and US electronic
trading 2)
§ Revenues reflect adverse foreign exchange impact of
a strengthening Swiss franc; in US dollar terms,
revenues were slightly higher compared to 1Q10
a strengthening Swiss franc; in US dollar terms,
revenues were slightly higher compared to 1Q10
1.9
1.7
0.2
1.7
1.4
0.3
1.3
1.1
0.2
1.9
1.7
0.2
1Q10
2Q10
3Q10
4Q10
1Q11
in USD bn
1.8 1.8 1.2 1.7 1.9
1.7
1.5
0.2
First Quarter Results 2011
Slide 17
Equity revenues continued to be solid, driven by increased
client volumes and sustained market share positions
client volumes and sustained market share positions
1) Underwriting revenues are also included in the Securities view revenues on slides 15 and 17
Advisory and underwriting in CHF bn 1)
Advisory
Debt underwriting
Equity underwriting
0.9
0.2
0.5
0.2
1.2
0.3
0.3
0.6
1.0
0.3
0.5
0.2
0.9
0.2
0.2
0.5
§ Solid debt underwriting revenues driven by
continued strong high yield issuance volumes and
improved market share
continued strong high yield issuance volumes and
improved market share
§ Equity underwriting revenues stable compared to
1Q10, but lower than a strong 4Q10 given a
decline in industry-wide issuance levels
1Q10, but lower than a strong 4Q10 given a
decline in industry-wide issuance levels
§ Advisory results reflect lower industry-wide
completed M&A activity vs. 4Q10; M&A and
capital markets pipelines remain strong
completed M&A activity vs. 4Q10; M&A and
capital markets pipelines remain strong
§ Improved or maintained market share across key
products
products
1Q10
2Q10
3Q10
4Q10
1Q11
in USD bn
0.8 0.9 0.9 1.3 1.0
0.9
0.2
0.2
0.5
First Quarter Results 2011
Slide 18
Solid advisory and underwriting revenues, although lower than
a seasonally strong 4Q10
a seasonally strong 4Q10
Securities
3. Represents leveraged loans secondary trading
4. Emerging markets fee data includes India, China, Indonesia, Brazil, Mexico, Russia, Middle East and
Africa
Africa
Underwriting and advisory
Fixed
Income
Income
2008
Current
2009
US cash
equities 1)
equities 1)
#2/12%
#5/12%
US electronic
trading 1)
trading 1)
#1/8%
#1/8%
Prime
services 2)
services 2)
Top 3/
>10%
Top 3/
>10%
Foreign
exchange
exchange
#8/4%
#9/3%
RMBS pass
-throughs
-throughs
#1/19%
#1/18%
Leveraged
loans 3)
loans 3)
#2/19%
#2/16%
2010
Equities
US rates
#8/7%
#8/6%
Trend
2008
1Q11
2009
2010
Trend
(Rank/market share)
(Rank/market share)
#1/13%
#1/11%
#3/13%
NA
#1/17%
#3/13%
#7/8%
Source: Dealogic, Tradeweb, Euromoney magazine and Greenwich Associates
1. Market share based on Credit Suisse estimates; rank based on Greenwich Associates
2. Based on Credit Suisse estimates
DCM
Investment
grade global
grade global
#8/5%
#12/4%
#8/4%
High yield
global
global
#4/9%
#3/7%
#3/8%
ECM
ECM global
#7/6%
#7/5%
#6/6%
Emer-
ging
Markets
ging
Markets
M&A
Global
announced
announced
#8/12%
#8/13%
#3/16%
Global
completed
completed
#9/13%
#7/16%
#4/15%
Total
fees4)
fees4)
#1/12%
#1/8%
#1/8%
#1/14%
#1/12%
#3/13%
NA
#1/18%
#3/13%
#7/8%
#12/3%
#2/10%
#5/7%
#4/19%
#10/10%
#1/8%
High yield
secondary
secondary
#5/11%
#5/11%
#7/10%
#7/10%
First Quarter Results 2011
Slide 19
Continued client market share momentum; upside potential remains
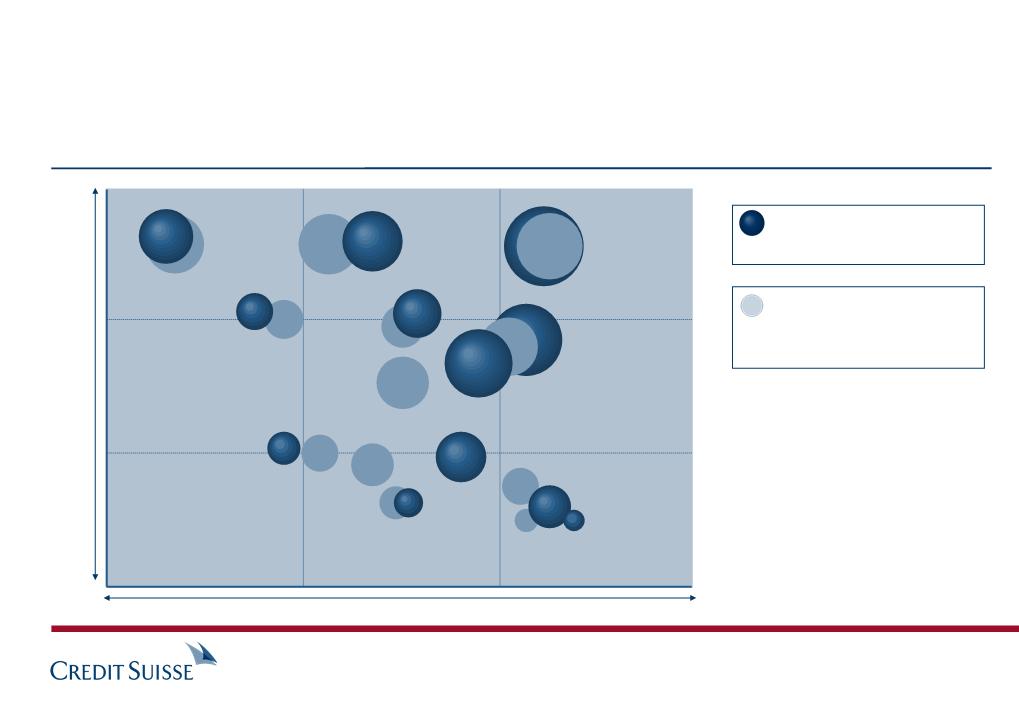
Leveraged finance
Rates
Securitized products
Equity derivatives
Prime Services
M&A
FX
Investment grade
Emerging markets
Cash equities
Equity capital
markets
Commodities
Revenue contribution in
1Q 2011
1Q 2011
Market environment
Credit
Suisse
market
share
Suisse
market
share
Strong
Worse than historic levels
Better than historic levels
Upside
potential
potential
Average quarterly revenue
contribution in FY 2010
contribution in FY 2010
Revenue contribution from major business lines
First Quarter Results 2011
Slide 20
Improved revenues across most businesses driven by higher client
activity, market share gains and a more favorable market environment
activity, market share gains and a more favorable market environment
1,167
305
Commission expenses
G&A expenses
1,284
933
351
Investment Banking compensation expenses in CHF m
Investment Banking non-compensation expenses in CHF m
§ Increase in G&A from 4Q10 driven by a CHF 34 m increase
in litigation provisions, higher professional and consulting
fees driven by regulatory changes, and non-income taxes
in litigation provisions, higher professional and consulting
fees driven by regulatory changes, and non-income taxes
§ 1Q11 commission expenses reflect the reclassification of
CHF 22 m of commodities storage costs from contra
revenue to commission expense
CHF 22 m of commodities storage costs from contra
revenue to commission expense
862
2,014
2,324
1,823
1,172
§ Increase from 1Q10 driven by higher social security taxes of
CHF 70 m relating to share award deliveries in 1Q11 (prior
year deliveries occurred in 2Q10)
CHF 70 m relating to share award deliveries in 1Q11 (prior
year deliveries occurred in 2Q10)
§ Compensation/revenue ratio of 48% in 1Q11 compared to
49% in full-year 2010 and 44% in 1Q10
49% in full-year 2010 and 44% in 1Q10
877
295
1,872
1,124
823
301
2,408
1,197
887
310
3Q10
4Q10
2Q10
1Q10
1Q11
3Q10
4Q10
2Q10
1Q10
1Q11
Note: Compensation/revenue ratio excluding fair value on own debt
First Quarter Results 2011
Slide 21
Compensation and non-compensation expenses
§ Solid asset inflows of CHF 4.5 bn in 1Q11
§ Positive inflows for the seventh consecutive quarter, reflecting strong
investment performance and an expansion of our product offering
investment performance and an expansion of our product offering
Growing fee-
based revenues
based revenues
§ Fee-based revenues up 9% from 1Q10, adjusted for FX impact
§ Potential upside from performance fees
§ Positive fund raising trends result in higher placement fees
§ Total operating expenses down 4% from 1Q10, adjusted for FX impact
§ Disciplined approach to spending and execution of efficiency programs
§ Further efficiency initiatives in the pipeline
Significant and
sustainable
expense
reductions
sustainable
expense
reductions
Continued
business
momentum
business
momentum
First Quarter Results 2011
Slide 22
Better results through increased scale, strong investment performance
and a general improvement in efficiency
and a general improvement in efficiency
Asset Management delivers better and higher quality results
Net revenues
Compensation and benefits
Other operating expenses
Pre-tax income
Pre-tax income margin
Net new assets in CHF bn
CHF m 1Q11 4Q10 3Q10 2Q10 1Q10
First Quarter Results 2011
Slide 23
591 617 582 502 631
260 250 261 289 282
159 187 186 191 183
172 180 135 22 166
29% 29% 23% 4% 26%
4.5 4.5 3.6 1.3 11.2
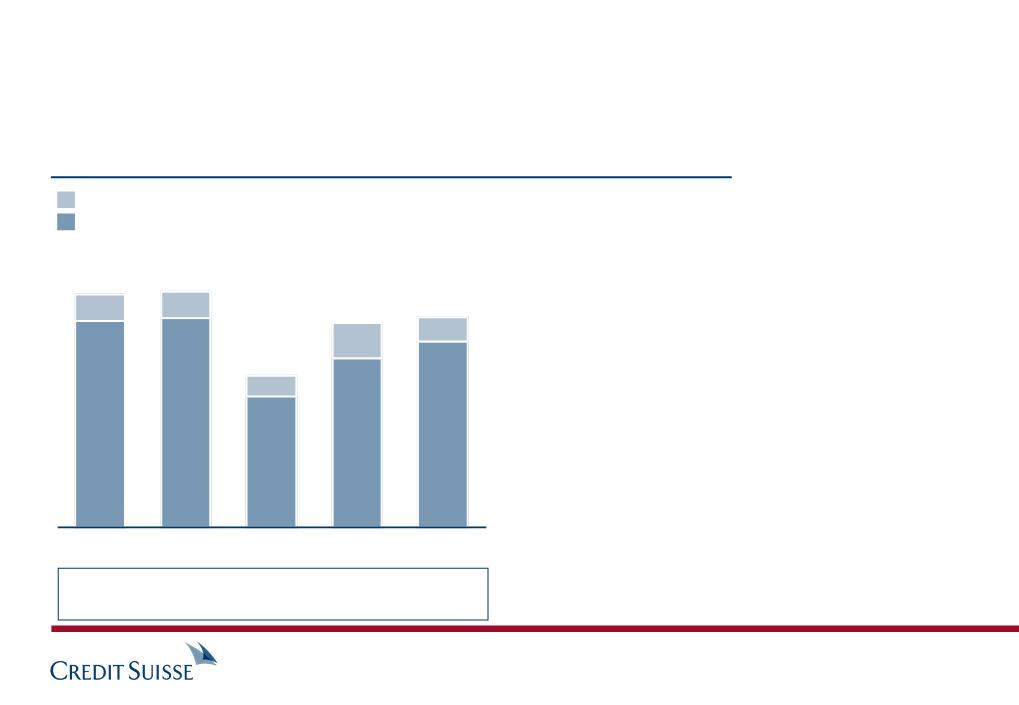
Asset Management consistently building sound profitability
and steady asset inflows
and steady asset inflows
11.2
4.5
1.3
4.5
3.6
Net new assets in CHF bn
Annualized net new assets growth in %
10.8 1.2 3.4 4.3 4.2
1Q10
2Q10
3Q10
4Q10
1Q11
MACS = multi-asset class solutions
§ Strong inflows in asset allocation (MACS)
driven by improving investment performance
driven by improving investment performance
§ Equities and single-manager hedge fund
inflows reflect solid performance, expanded
product offering and renewed client interest
inflows reflect solid performance, expanded
product offering and renewed client interest
First Quarter Results 2011
Slide 24
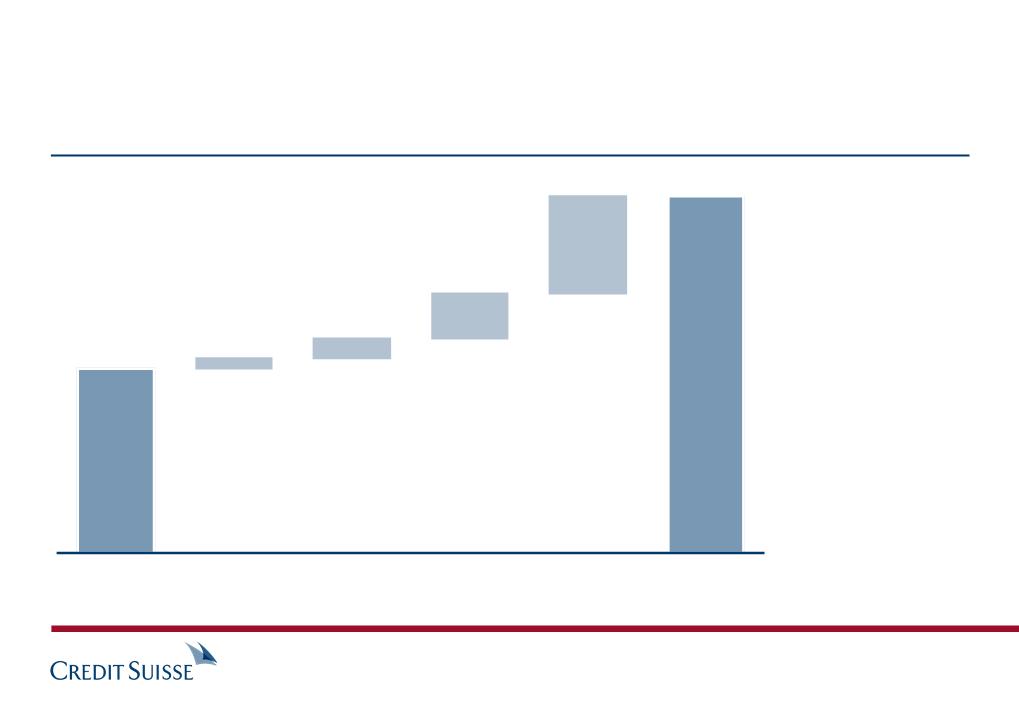
Solid net new asset inflows in Asset Management
1Q10
(28)
+65
Underlying
growth
growth
433
1Q11
443
Business
divestitures
divestitures
CHF m
405
Fee-based gross margin in basis points
41
41
+9%
Stable
Foreign
exchange
exchange
(27)
Total operating
expenses in CHF m
expenses in CHF m
465
419
Proforma
(30)
+14
435
(30)
(4)%
First Quarter Results 2011
Slide 25
Asset Management fee-based revenue with underlying
growth; progress in driving efficiency gains
growth; progress in driving efficiency gains
Performance fees and carried interest in CHF m
1Q
2Q
(11)
37
3Q
4Q
1Q11
34
2009
1Q
2Q
3Q
4Q
2010
26
168
16
3
40
128
§ Performance fee recognition typically
semi-annual (Hedging Griffo) or
annual (York Capital)
semi-annual (Hedging Griffo) or
annual (York Capital)
§ Full year impact of annual performance
fees from York Capital expected in 4Q11
fees from York Capital expected in 4Q11
§ Carried interest earned upon investment
realizations
realizations
First Quarter Results 2011
Slide 26
Seasonality of performance fees with upside potential
Italy
Spain
Portugal
Greece
Ireland
Total Net
Gross
Gross
Net
Exposure in EUR bn
Sovereigns
Financial
institutions
institutions
Corporates /
Other
Other
Other exposures to
First Quarter Results 2011
Slide 27
2.3 0.3 1.0 0.9
0.1 0.1 0.9 0.9
0.2 0.0 0.1 0.1
0.1 0.0 0.1 0.1
0.0 0.0 0.3 0.4
2.7 0.4 2.4 2.4
4.5 5.6
Selected European risk exposures at end 1Q11
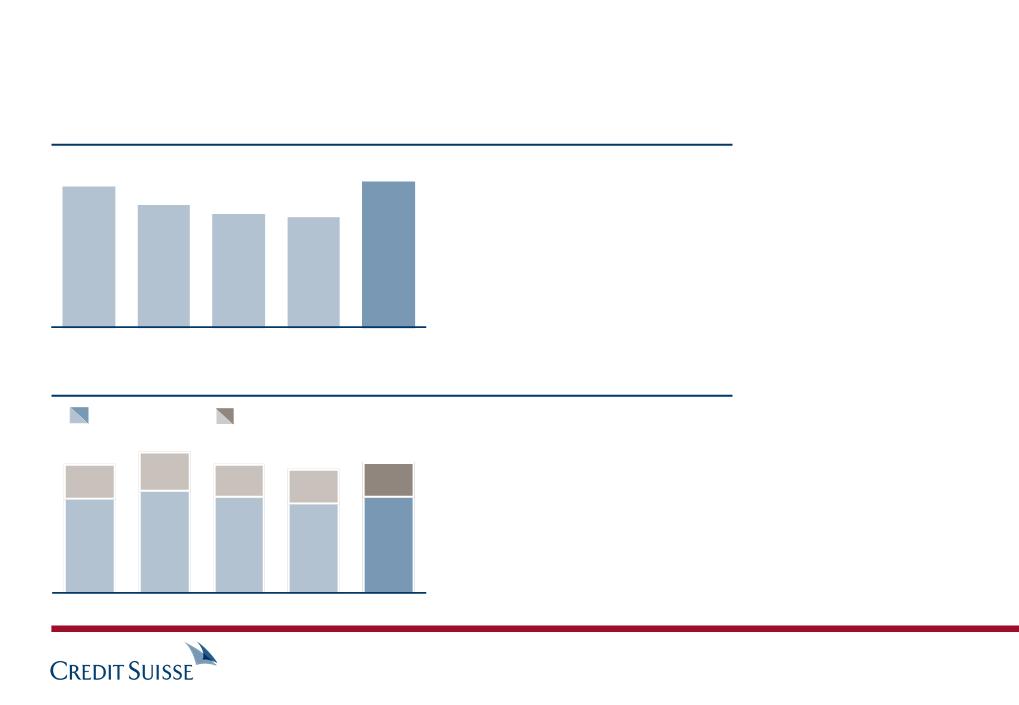
Basel 2 risk-weighted assets in CHF bn and tier 1 capital ratios in %
10.0
13.3
257
324
16.3
222
2010
1Q11
Strong capital base
§ Basel 2 tier 1 ratio of 18.2%
§ Core tier 1 ratio of 13.0%
§ Proforma Basel 2.5 core tier 1 ratio of
10.2%
10.2%
§ Regulatory capital reflects CHF 423 m
deduction for quarterly dividend accrual
(amount in line with dividend for FY 2010)
deduction for quarterly dividend accrual
(amount in line with dividend for FY 2010)
2008
2009
2007
(35)%
(3)%
18.2
219
212
Tier 1 ratio
Core tier 1 ratio
8.7
8.6
10.8
17.2
13.0
12.2
First Quarter Results 2011
Slide 28
Maintained leading capital position
Capital development in CHF bn
31.2
34.1
(2.2)
(0.7)
Dividend accrual
2010 and 1Q11
2010 and 1Q11
FVOD3)
Shareholders’
equity
equity
Regulatory
deductions
deductions
Common Equity
Tier 1 Capital1)
Tier 1 Capital1)
End
1Q11
1Q11
January
1, 2013
Consensus2)
earnings 2011-12
Consensus dividends
2011-20122)
2011-20122)
Common Equity
Tier 1 Capital
Tier 1 Capital
11.5
(2.5)
40.2
Risk-weighted assets development in CHF bn
212
Basel 2
end 1Q11
end 1Q11
330 to 350
Basel 34)
by Jan. 1st
by Jan. 1st
2013
+ 181
(50 to 70)
Basel 2.5 & 3
changes
changes
Mitigation
1) Applying January 1, 2013 Basel 3 capital rules 2) Bloomberg consensus net income and dividend estimates for 2011 and 2012 adjusted for 1Q11 net income and dividend accrual. Not endorsed or
verified and is used solely for illustrative purposes. Actual net income may differ significantly. 3) FVOD = fair value changes from movements in spreads on own debt and structured notes, net of tax
4) Assumes no gross increase in RWA from business growth
verified and is used solely for illustrative purposes. Actual net income may differ significantly. 3) FVOD = fair value changes from movements in spreads on own debt and structured notes, net of tax
4) Assumes no gross increase in RWA from business growth
Proforma CET1
ratio 9.2%
end 1Q11
ratio 9.2%
end 1Q11
Proforma CET1
ratio 11.8%
Jan 1, 2013
ratio 11.8%
Jan 1, 2013
Approx. 400
First Quarter Results 2011
Slide 29
Common Equity Tier 1 ratio simulation for January 1, 2013 (Basel 3)
5.0
5.5
End
2010
2010
End
1Q11
1Q11
1Q11
"earn-out"
"earn-out"
CHF bn
3.2
3.5
9.0
8.2
(9)%
Net DTA on net operating losses
Net DTA on timing differences
§ Significant DTA utilization in 1Q11
– Net DTA on net operating losses reduced by CHF 0.5 bn,
driven by profitable US businesses, resulting in a higher
effective Group tax rate
driven by profitable US businesses, resulting in a higher
effective Group tax rate
– Net DTA on timing differences reduced by CHF 0.3 bn
§ Net DTA on net operating losses expected to be substantially
reduced by the beginning of 2014
reduced by the beginning of 2014
§ Any residual balance of net DTA on timing differences by
1.1.2014 not expected to lead to regulatory capital deduction
under the “15% limit on specific items under Basel 3”
1.1.2014 not expected to lead to regulatory capital deduction
under the “15% limit on specific items under Basel 3”
First Quarter Results 2011
Slide 30
Reduction in net deferred tax assets (DTA)
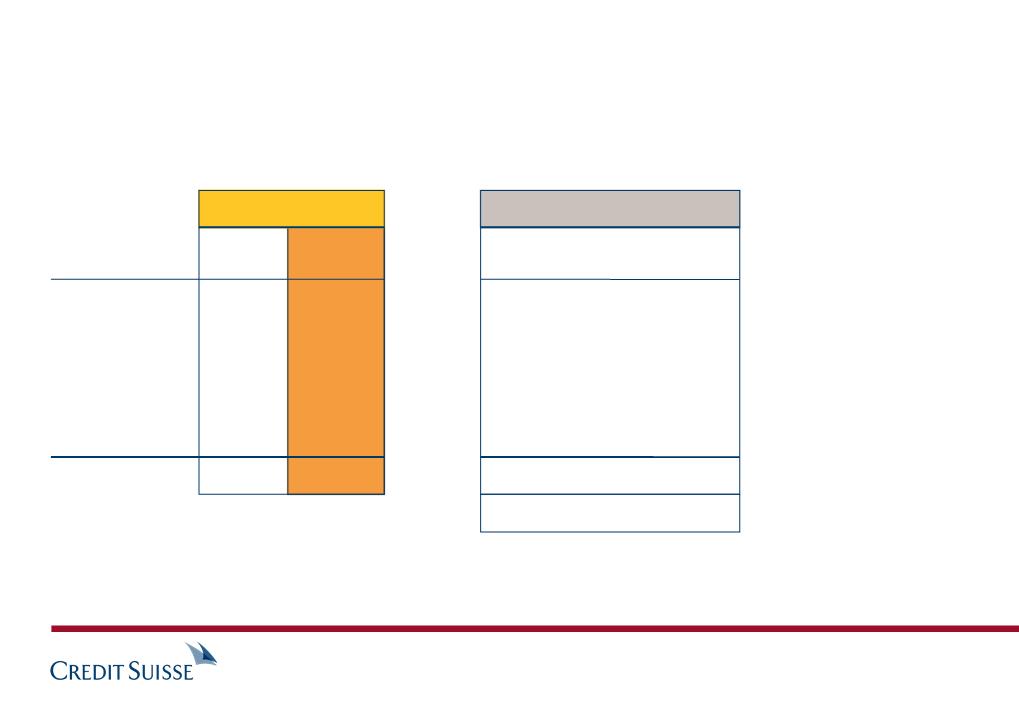
1) Based on CHF 340 bn of Basel 3 risk-weighted assets
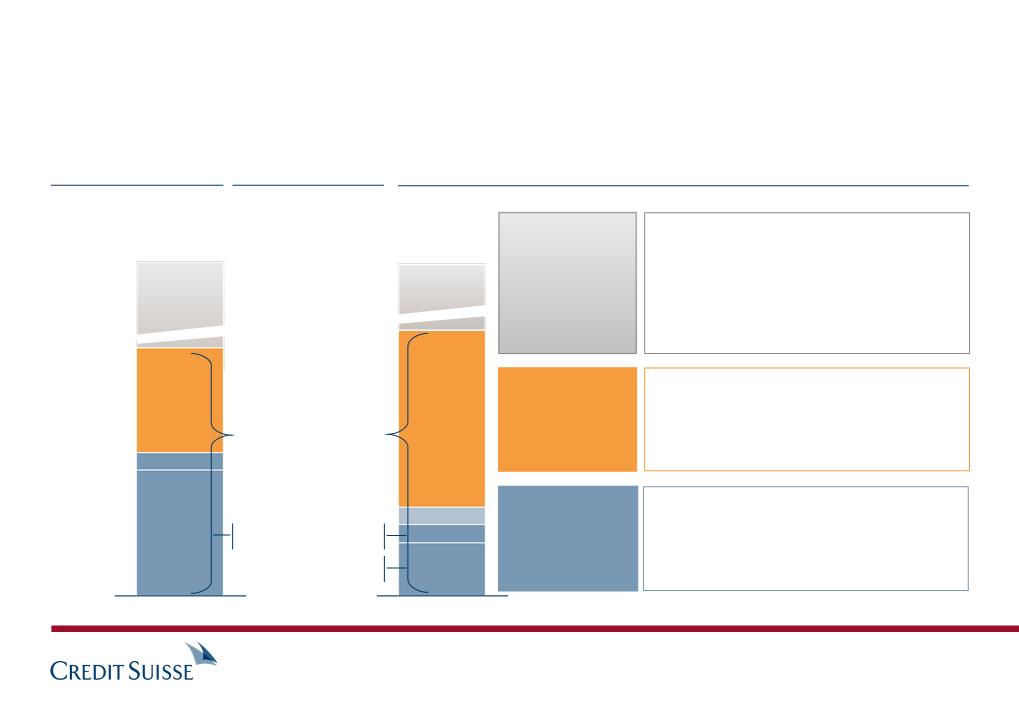
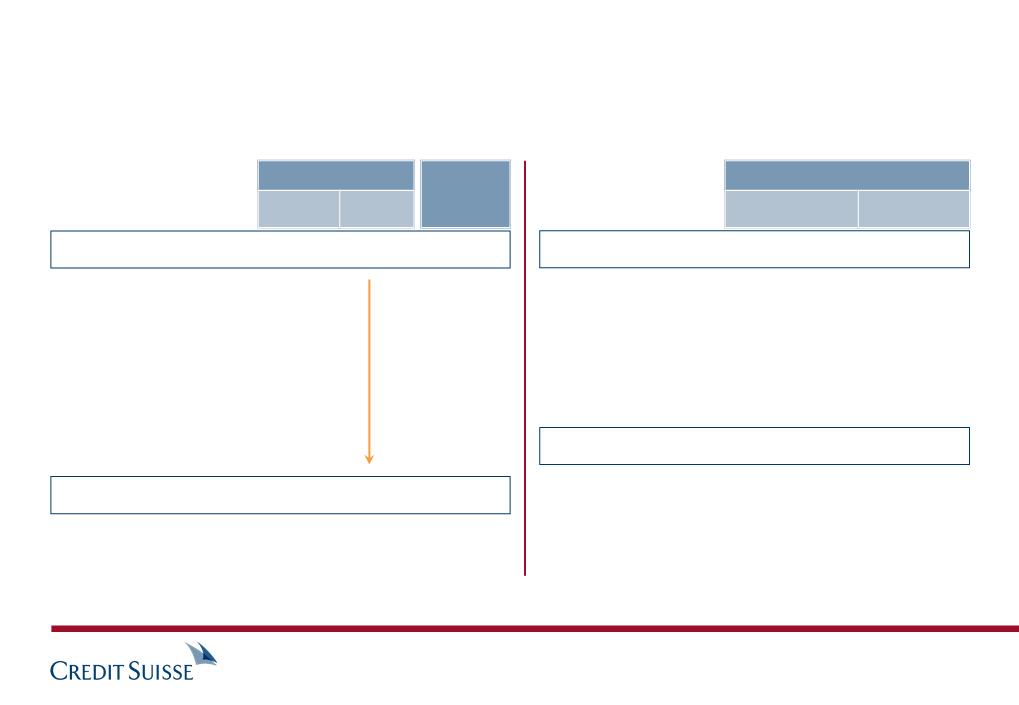
20
End 1Q11 capital/
funding components
funding components
Indicative spreads
over senior debt
over senior debt
CHF bn
6
2
2
Low trigger con-
tingent capital
tingent capital
6% of RWA
5% trigger point
Senior
long-term
debt
long-term
debt
137
134
164
Total
164
Senior long-term
debt
debt
Hybrid
tier 1
capital
(& Claudius
notes)
(& Claudius
notes)
Tier 2
capital
capital
475 bp
440 bp
14
11
27
625 bp
(at time of issuance)
Future capital / funding components1)
High trigger con-
tingent capital
tingent capital
3% of RWA
7% trigger point
30
§ Expected to price in line with tier 2 debt
§ May reflect new developments in
regulations around acceptable
structures (e.g. write-down features)
regulations around acceptable
structures (e.g. write-down features)
§ Completed CHF 6 bn private placement
and USD 2 bn public offering in Feb-11
and USD 2 bn public offering in Feb-11
§ Secured over 70% of requirement
§ Increased contingent capital and equity
balances imply a lower funding
requirement via senior bond markets
balances imply a lower funding
requirement via senior bond markets
§ Spreads may price tighter, as the risk
profile improves and the theoretical
liquidation value increases
profile improves and the theoretical
liquidation value increases
High trigger
tier 2 BCN
tier 2 BCN
2
First Quarter Results 2011
Slide 31
New regulatory regime compared to current subordinated capital
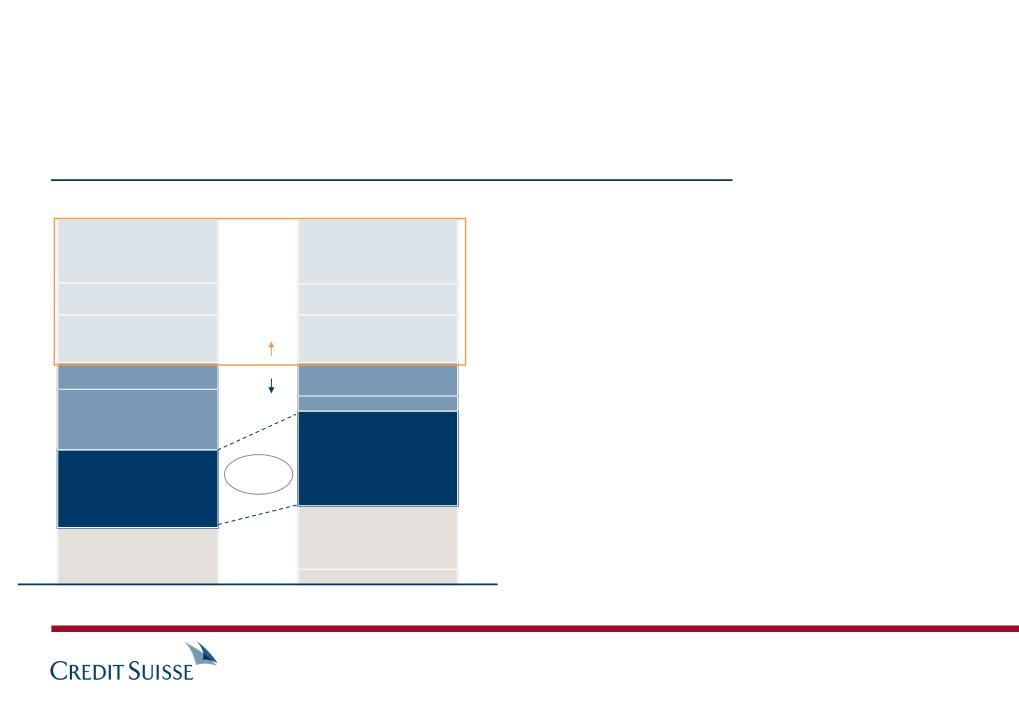
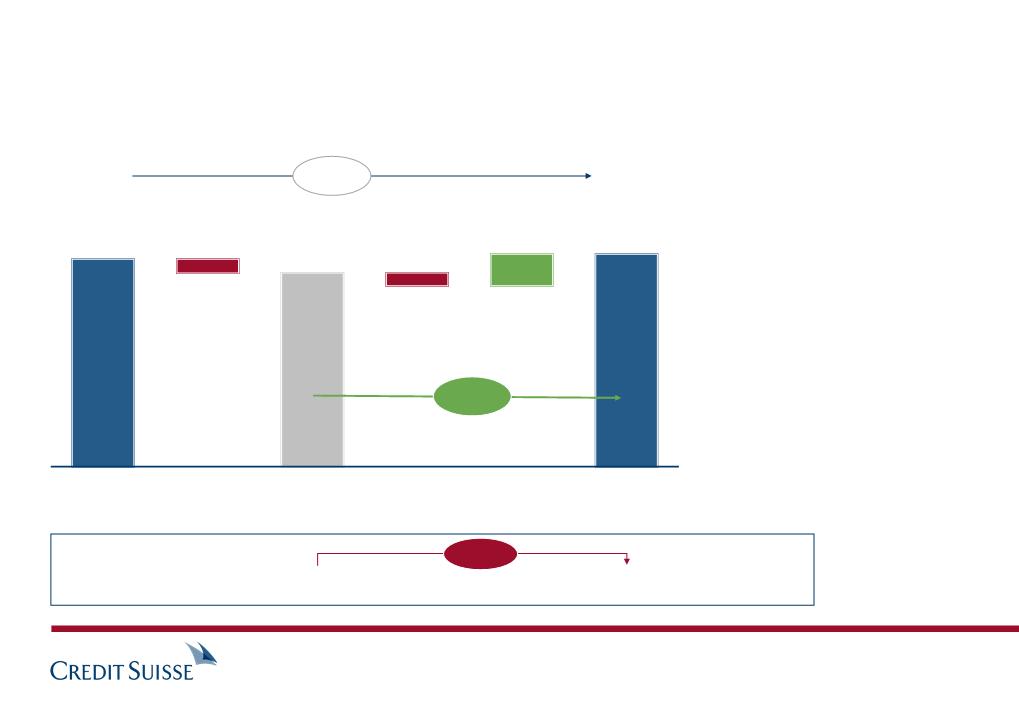
Assets
Equity & liabilities
Asset and liabilities by category (end 1Q11 in CHF bn)
1) Primarily brokerage receivables/payables, positive/negative replacement values and cash collateral
2) Includes due from/to banks
3) Primarily includes excess of funding neutral liabilities (brokerage payables) over corresponding assets
4) Primarily includes unencumbered trading assets, investment securities and excess reverse repo
agreements, after haircuts
agreements, after haircuts
Note: Basel 3 liquidity rules and calculation of NSFR and LCR ratios are not finalized; statements and ratios
shown here are based on interpretation of current proposals
shown here are based on interpretation of current proposals
Reverse 177
repo
Encumbered 88
trading assets
1,016
1,016
Funding- 133
neutral assets 1)
Cash 2) 75
Unencumbered 168
liquid assets 4)
Customer 217
loans
Other 158
illiquid assets
Repo 178
Short positions 87
Funding- 133
neutral liabilities 1)
Short-term debt 2) 92
Other short-term liab 3) 42
Customer 265
deposits
Long-term debt 176
Total equity 43
122%
coverage
Match
funded
funded
§ Well prepared for Basel 3 liquidity and funding requirements
– Excess short-term (30 days) liquidity of CHF 119 bn
represents a ratio of 127% under Swiss regulation; approach
similar to the Basel 3 "Liquidity coverage ratio (LCR)"
represents a ratio of 127% under Swiss regulation; approach
similar to the Basel 3 "Liquidity coverage ratio (LCR)"
– Basel 3 "Net Stable Funding Ratio (NSFR)" (1-year)
estimated at around 94%, with future funding plans projected
to raise the ratio to over 100% by 2013
estimated at around 94%, with future funding plans projected
to raise the ratio to over 100% by 2013
§ Regulatory leverage ratio at 4.7% (vs. 4.2% at 1Q10)
§ Funding spreads remain amongst the tightest of the peer group
§ Already completed more than 40% of CHF 16 bn long-term
debt funding plan for year 2011
debt funding plan for year 2011
398
618
First Quarter Results 2011
Slide 32
Strong funding and liquidity position
Annual rate of return on equity above 15% reflecting
increased capital requirements under Basel 3
increased capital requirements under Basel 3
14%
2009
2010
2013 to 2015
target
target
Greater
than 15%
than 15%
21%
1Q11
19%
16%
22%
§ 2010 returns were ahead of cost of equity under Basel 2
§ 2010 return under Basel 3 capital requirement is lower,
but does not reflect any mitigating actions (re-pricing,
portfolio realignments and run-off of CHF 0.5 bn losses
in "Exit" businesses)
but does not reflect any mitigating actions (re-pricing,
portfolio realignments and run-off of CHF 0.5 bn losses
in "Exit" businesses)
§ 1Q11 returns well ahead of cost of equity under Basel 3
2010
Based on end 2010, Basel 2
implied minimum equity
implied minimum equity
Credit Suisse Group
After-tax return on equity
After-tax return on equity
Investment Banking
Pro-forma after-tax return on equity
Pro-forma after-tax return on equity
1Q11
Based on Jan 1, 2013, Basel 3
implied minimum equity
implied minimum equity
11%
16%
2010
1Q11
Implied minimum equity calculation: Basel 2 assumes 12.5% target core tier 1 ratio with hybrid capital representing buffer capital; Basel 3 assumed 10% CET1 ratio per Swiss capital regime proposals
Proforma returns based on 2010 and 1Q11 effective Group tax rate
23%
pro-forma
based on Basel 2
implied minimum
equity
based on Basel 2
implied minimum
equity
Underlying
First Quarter Results 2011
Slide 33
First quarter 2011 results detail
Introduction
Summary
First Quarter Results 2011
Slide 34
Delivering
client-focused
franchise
client-focused
franchise
Balanced and
high quality
results
high quality
results
Further
strengthened
our capital
position
strengthened
our capital
position
§ Underlying results: pre-tax income of CHF 2.2 bn, net income of CHF 1.6 bn and
after-tax return on equity of 19%
after-tax return on equity of 19%
§ Net new assets of CHF 19 bn
§ Basel 2 tier 1 capital ratio of 18.2% and core tier 1 ratio of 13.0%
§ Executed more than 70% of required high trigger Contingent Capital
§ Shareholders’ equity up 2% (CHF 0.8 bn) and deferred tax assets down 9% (CHF 0.8 bn)
§ Strong liquidity and funding position as competitive advantage
§ Global regulatory trends indicating emergence of a more level playing field
Private Banking with strong inflows and improved transaction revenues offsetting decline in
net interest income
net interest income
Investment Banking with record first quarter revenues (in USD) driven by continued market
share momentum and beneficial impact of client flow-sales expansion
share momentum and beneficial impact of client flow-sales expansion
Asset Management with solid inflows and higher quality results reflecting increased fee-
based revenues and reduced expenses
based revenues and reduced expenses
First Quarter Results 2011
Slide 35
Summary

Slides
37 to 38
39
40
41
42
43
44
45
46 to 47
First Quarter Results 2011
Slide 36
Appendix
Reconciliation to underlying results
Underlying results in the Corporate Center
Collaboration revenues
Investment Banking capital simulation
Optimizing returns in Investment Banking
Regulatory capital (Basel 2) roll-forward
Basel 2.5 impact by division
Commercial mortgage exposures detail
Loan portfolio characteristics
1) Including fair valuation gains/losses on stand-alone derivatives related to certain of our funding liabilities
1Q11
reported
reported
1Q11
underlying
underlying
Impact from
the movement
of spreads on
own debt1)
the movement
of spreads on
own debt1)
CHF m
Net revenues
Provisions for credit losses / (release))
Total operating expenses
Pre-tax income
Income tax expense
Net income
Return on equity
First Quarter Results 2011
Slide 37
7.813 0.617 8.430
(0.007) - (0.007)
6.195 - 6.195
1.625 0.617 2.242
0.462 0.150 0.615
1.139 0.467 1.606
13.4% 18.8%
Reconciliation from reported to underlying results 1Q11
Net revenues
Prov. for credit losses / (release)
Total operating expenses
Pre-tax income
Income tax expense
Discontinued operations
Noncontrolling interests
Net income
Return on equity
2010
reported
reported
2010
underlying
underlying
Impact from
movements in
spreads on
own debt1)
movements in
spreads on
own debt1)
UK
bonus levy
bonus levy
Normalization
to tax rate of
28%
to tax rate of
28%
CHF m
1) Including fair valuation gains/losses on stand-alone derivatives related to certain of our funding liabilities
Litigation
provisions
provisions
First Quarter Results 2011
Slide 38
30,625 (343) - - - 30,282
(79) - - - - (79)
23,904 - (404) (289) - 23,211
6,800 (343) 404 289 - 7,150
1,548 (124) - 116 488 2,028
(19) - - - - (19)
(135) - - - - (135)
5,098 (219) 404 173 (488) 4,968
14.4% 14.1%
Reconciliation from reported to underlying results 2010

Reported pre-tax income / (loss)
Losses/(gains) from the movement of spreads on own debt1)
Impairment in a equity method investment
Litigation provisions
UK bonus levy
Litigation and settlement expenses
Reclassification of gain to discontinued operations2)
Adjusted pre-tax income / (loss)
CHF m
2010
2009
1) Including fair valuation gains/losses on stand-alone derivatives related to certain of our funding liabilities
2) Gain on sale of part of Asset Management's traditional fund business Note: numbers may not add to total due to rounding
The underlying Corporate Center pre-tax loss reflects:
– consolidation and elimination adjustments
– expenses for centrally sponsored projects
– certain expenses and revenues that have not been allocated to the segments
1Q11
First Quarter Results 2011
Slide 39
(1,948) (660) (745)
327 (590) 562
- - 47
- 216 -
- 404 -
818 - -
228 - -
(575) (630) (136)
Results in the Corporate Center
CHF bn
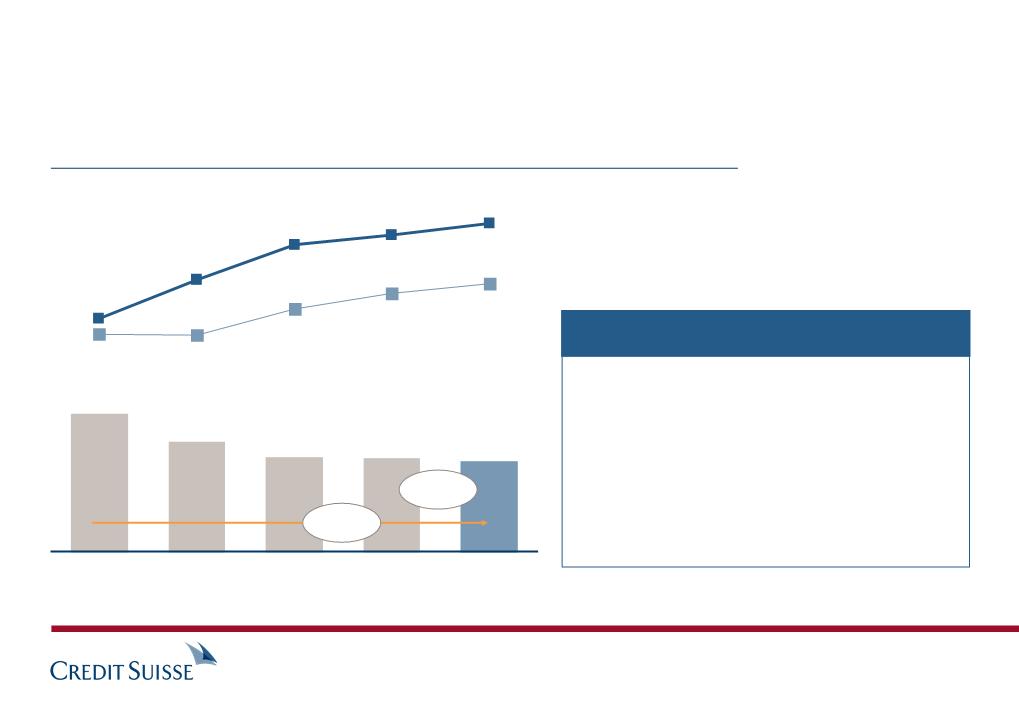
§ Collaboration revenues are up 10% vs. 1Q10
across all regions
across all regions
§ As markets normalize, we expect revenues to
increase in line with overall performance
increase in line with overall performance
§ The pipeline on tailored solutions for Private
Banking clients continues to build
Banking clients continues to build
1Q10
2Q10
3Q10
1Q11
4Q10
14.3%
15.9%
17.2%
14.1%
11.2%
Collaboration revenues
Core results net revenues
1.0
9.0
1.2
8.4
1.0
6.3
1.2
7.0
1.1
7.8
First Quarter Results 2011
Slide 40
Collaboration revenues
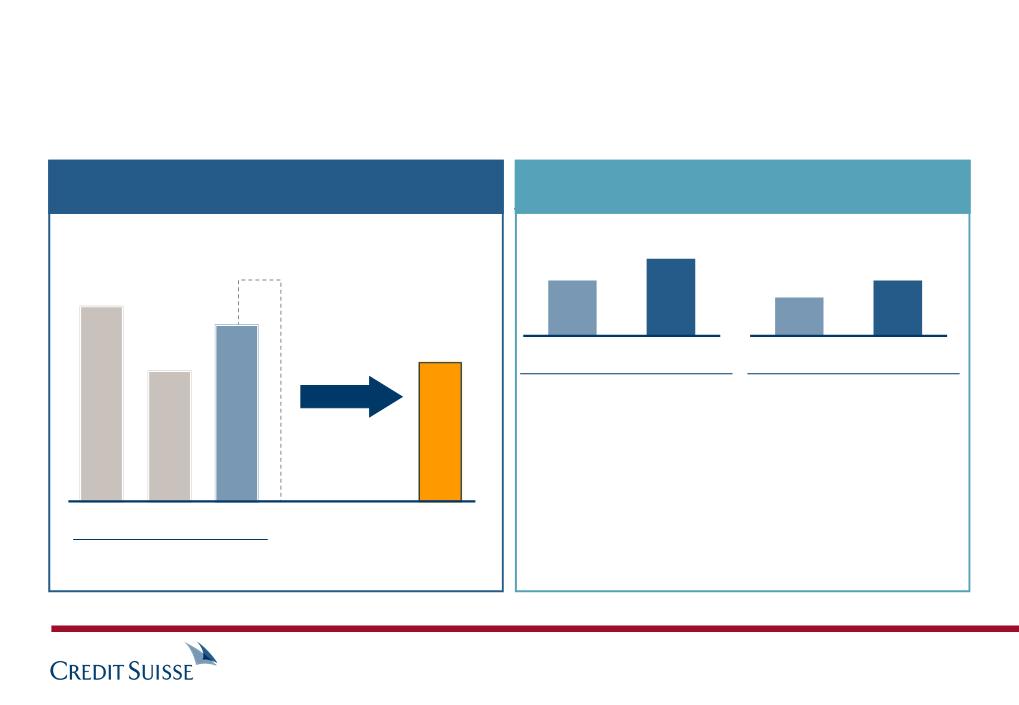
137
End 2010
(Basel 2)
(Basel 2)
Proforma end 2012
(Basel 3, post mitigation)
(Basel 3, post mitigation)
247
+80%
17
at 12.5%
core tier1 ratio
core tier1 ratio
at 10%
CET1 ratio
CET1 ratio
25
+47%
Implied minimum shareholders’ equity calculation: for Basel 2, assumed 12.5% target core tier 1 ratio with hybrid capital representing buffer capital; for Basel 3, assumed 10% CET1 ratio per Swiss capital
regime proposals
regime proposals
in CHF bn
Investment Banking
gross risk-weighted
assets
gross risk-weighted
assets
Implied minimum
shareholders’ equity
shareholders’ equity
First Quarter Results 2011
Slide 41
Investment Banking capital simulation
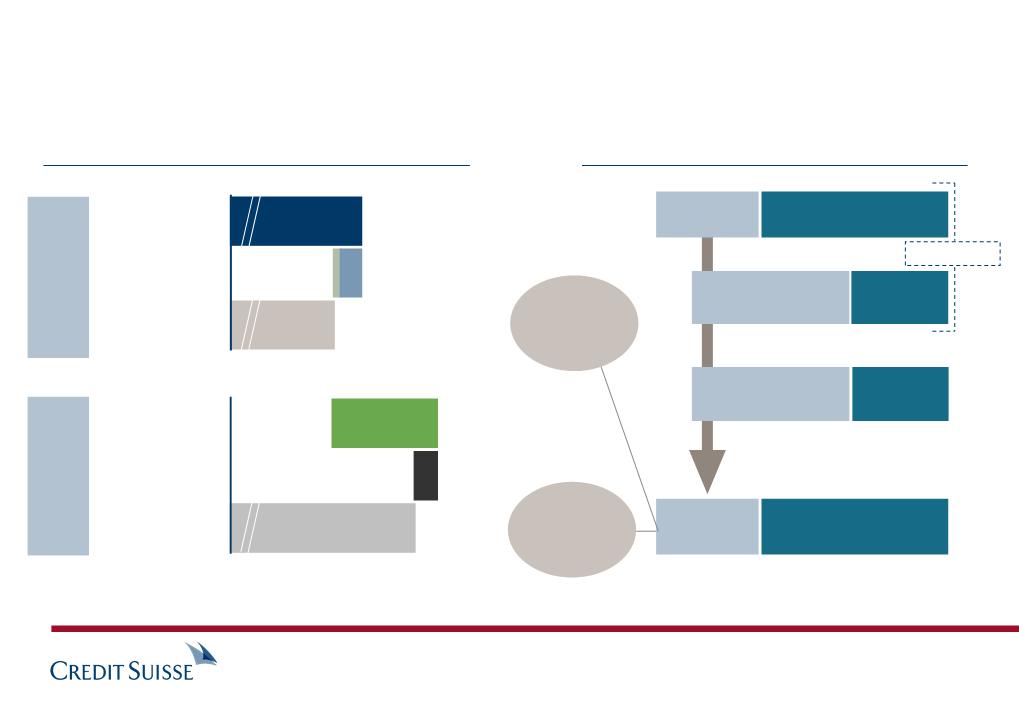
Build
position in
Banking
position in
Banking
Industry
leader-
ship in
Equities
leader-
ship in
Equities
Achieve
capital
efficient
scale in
Fixed
Income
capital
efficient
scale in
Fixed
Income
Overall
First Quarter Results 2011
Slide 42
§ Cash Equities and Prime Services largely unaffected by
Basel 3
Basel 3
§ Focus on derivatives flow businesses, where Basel 3 has
limited impact
limited impact
§ Continue to improve M&A and underwriting market share
§ Lock in #1 position within financial sponsors
§ Business largely unaffected by Basel 3 changes
§ Maintain leadership in RMBS and High-Yield products,
where returns are expected to be good also under Basel 3
where returns are expected to be good also under Basel 3
§ Continue to build capital-efficient scale in Rates and FX
client-flow capabilities
client-flow capabilities
§ Exit wind-down businesses
(pre-tax loss of CHF 0.5 bn in 2010 and 120 m in 1Q11)
(pre-tax loss of CHF 0.5 bn in 2010 and 120 m in 1Q11)
§ Product re-pricing or
enhanced market share
as industry adjusts to
increased capital
requirements
enhanced market share
as industry adjusts to
increased capital
requirements
§ Portfolio focus on
scaleable capital-
efficient and client-
focused businesses
scaleable capital-
efficient and client-
focused businesses
§ Continued cost
discipline with further
benefit from efficiency
gains and the inte-
grated banking model
discipline with further
benefit from efficiency
gains and the inte-
grated banking model
Optimizing returns in Investment Banking
37.7 17.2% 218.7
1.1
0.3
(0.4)
(0.4)
0.2
(6.5)
38.5 18.2% 212.2
(2.7) 30.6
35.8 14.7% 242.8
End 2010 (Basel 2)
Net income
Fair value movements
FX impact
2011 dividend accrual
Other1)
Change in RWA
End 1Q11 (Basel 2)
Basel 2.5 impact
End 1Q11 (Basel 2.5)
Tier 1
RWA
in CHF bn
in CHF bn
Capital
in CHF bn
in CHF bn
Ratio
in %
in %
End 2010
Net income
Share-based compensation
& other share activity2)
& other share activity2)
FX impact
Other
End 1Q11
Shareholders' equity
Common
in CHF bn
in CHF bn
Per share
in CHF
in CHF
Note: numbers may not add to total due to rounding
1) Reflects the issuance and redemption of tier 1 capital, the effect of share-based compensation and the change in regulatory deductions
2) Includes impact from issuance of shares for share-based compensation purposes (14.8 m shares) and reduction in treasury shares (12.2 m shares)
First Quarter Results 2011
Slide 43
33.3 28.35
1.1 0.97
0.2 (0.44)
(0.4) (0.37)
(0.1) (0.15)
34.1 28.36
Tier 1 capital and shareholders' equity roll-forward
Risk-weighted assets in CHF m
Under Basel 2
Incremental Basel 2.5 impact
Total under Basel 2.5
Capital deductions in CHF m
Under Basel 2
Incremental Basel 2.5 impact
Total under Basel 2.5
Private
Banking
Banking
Asset
Management
Management
Investment
Banking
Banking
Corporate
Center
Center
Total
First Quarter Results 2011
Slide 44
64,041 124,233 12,709 11,213 212,196
11 30,032 - 594 30,637
64,052 154,265 12,709 11,807 242,833
306 447 459 22 1,234
- 2,743 - - 2,743
306 3,190 459 22 3,977
Basel 2.5 impact by division
7
1) This price represents the average mark on loans and bonds combined
36
26
(96)%
19
15
13
9
3Q07
4Q
1Q08
2Q
3Q
4Q
1Q09
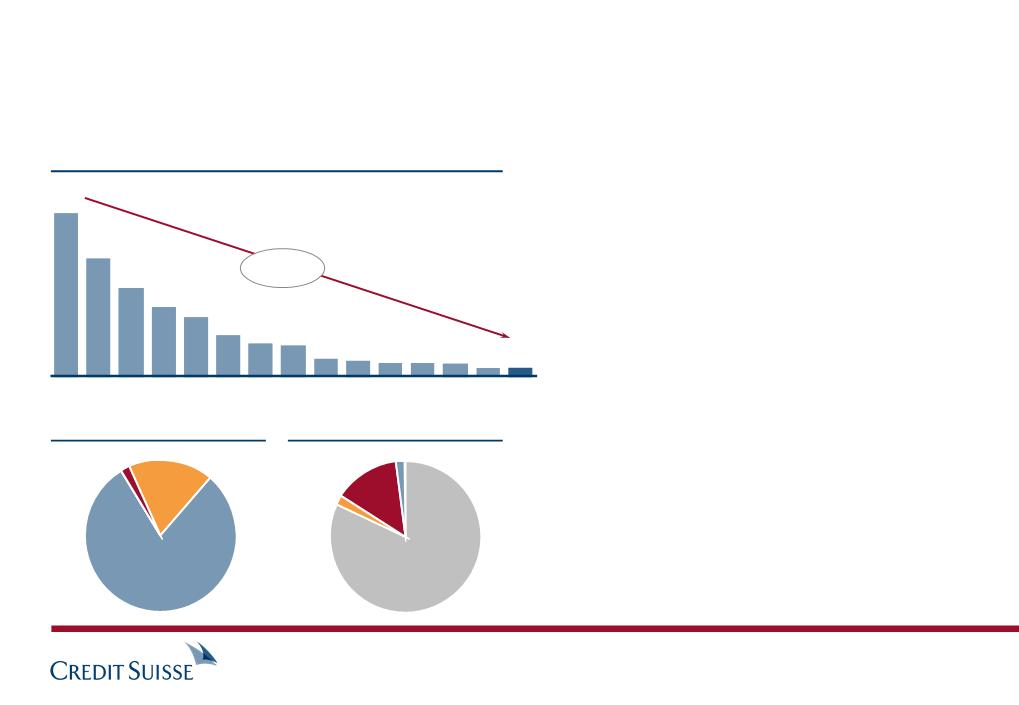
Commercial mortgages (CHF bn)
Exposure by region
§ Average price of remaining positions
is stable at 56%1)
is stable at 56%1)
§ Positions are fair valued;
no reclassifications to accrual book
no reclassifications to accrual book
Other
2%
Asia
2%
US
18%
Continental
Europe (ex. Germany)
Europe (ex. Germany)
80%
Office
82%
82%
Retail 2%
Hotel
21%
Exposure by loan type
2Q
7
3.6
3Q
3.1
4Q
2.7
1Q10
2.6
2Q
2.4
3Q
4Q
Hotel
14%
14%
1.5
1.5
1Q11
First Quarter Results 2011
Slide 45
Commercial mortgage exposure reduction in Investment Banking
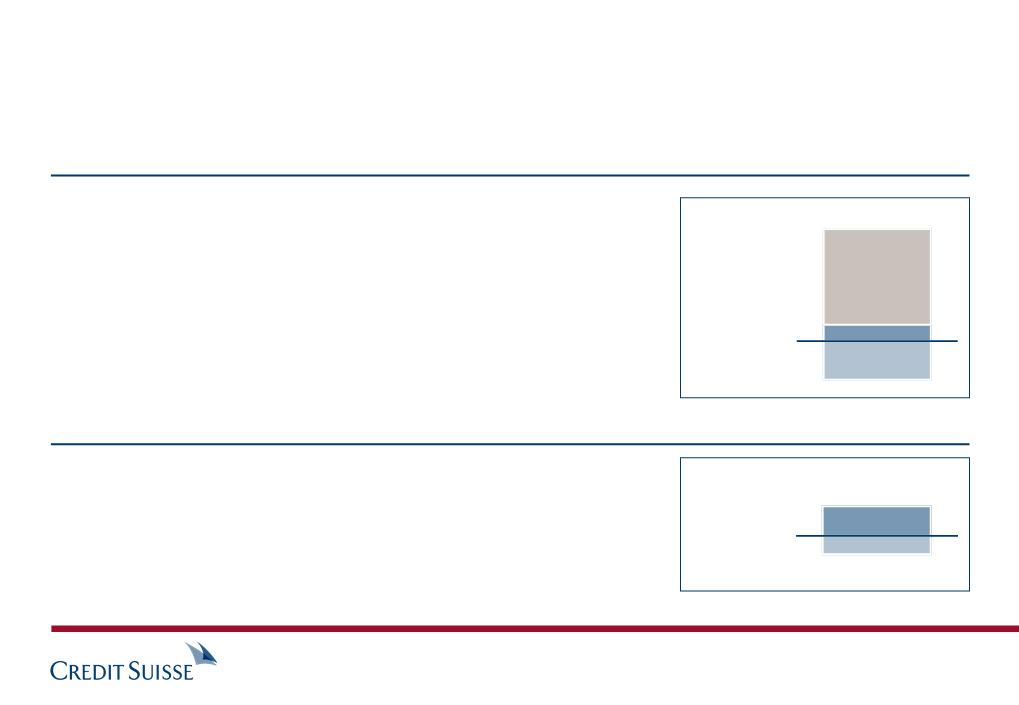
Developed market lending
§ Corporate loan portfolio 76% is investment grade, and is mostly
(92%) accounted for on a fair value basis
(92%) accounted for on a fair value basis
§ Fair value is a forward looking view which balances accounting
risks, matching treatment of loans and hedges
risks, matching treatment of loans and hedges
§ Loans are carried at an average mark of approx. 99% with
average mark of 97% in non-investment grade portfolio
average mark of 97% in non-investment grade portfolio
§ Continuing good performance of individual credits: limited
specific provisions during the quarter
specific provisions during the quarter
Unfunded
commitments
commitments
Loans
Hedges
CHF bn
Emerging market lending
§ Well-diversified by name and evenly spread between EMEA,
Americas and Asia and approx. 25% accounted for on a fair
value basis
Americas and Asia and approx. 25% accounted for on a fair
value basis
§ Emerging market loans are carried at an average mark of
approx. 95%
approx. 95%
§ No significant provisions during the quarter
Note: Average mark data is net of fair value discounts and credit
provisions
provisions
45
8
(18)
Loans
Hedges
CHF bn
12
(7)
First Quarter Results 2011
Slide 46
Investment Banking loan book

Wealth Management Clients: CHF 134 bn
§ Portfolio remains geared towards mortgages (CHF 90 bn) and securities-
backed lending (CHF 37 bn)
backed lending (CHF 37 bn)
§ Lending is based on well-proven, conservative standards
§ Residential real-estate: Prices continue to rise in most regions while rents
are moving sluggishly; Prices have reached considerable levels in lake
Geneva region, partially in the Zurich-Zug area and major tourist spots; Some
risk of major price falls only conceivable in those regions
are moving sluggishly; Prices have reached considerable levels in lake
Geneva region, partially in the Zurich-Zug area and major tourist spots; Some
risk of major price falls only conceivable in those regions
Corporate & Institutional Clients: CHF 53 bn
§ Over 64% collateralized by mortgages and securities
§ Counterparties mainly Swiss corporates incl. real-estate industry
§ Sound credit quality with relatively low concentrations;
§ Portfolio quality improved in line with continued recovery of Swiss economy
§ Ship finance portfolio (CHF 6 bn) remains under special focus due to
increased risk level caused by overcapacity in the market
increased risk level caused by overcapacity in the market
§ Commercial real-estate: Prices moving sideways for office and retail spaces;
outlook raised from negative to stable for both office and retail space due to
quick recovery of the economy from cycle downturn; higher price potential for
central and prime locations
outlook raised from negative to stable for both office and retail space due to
quick recovery of the economy from cycle downturn; higher price potential for
central and prime locations
5% BB+ to BB
2% BB- and below
Portfolio ratings
composition, by CRM
transaction rating
composition, by CRM
transaction rating
Private Banking Loan Book
Total: CHF 187 bn
67%
26%
BBB
AAA to A
Loan book of CHF 187 bn focused on Switzerland; more than 85% collateralized; primarily on accrual accounting basis
First Quarter Results 2011
Slide 47
Private Banking loan book

SIGNATURES
Pursuant to the requirements of the Securities Exchange Act of 1934, the registrant has duly caused this report to be signed on its behalf by the undersigned, thereunto duly authorized.
| CREDIT SUISSE GROUP AG and CREDIT SUISSE AG | ||
| (Registrant) | ||
| By: | /s/ Romeo Cerutti | |
| (Signature)* | ||
| General Counsel | ||
| Credit Suisse Group AG and Credit Suisse AG | ||
| Date: April 27, 2011 | ||
| /s/ Charles Naylor | ||
| Chief Communications Officer | ||
| *Print the name and title under the signature of the signing officer. | Credit Suisse Group AG and Credit Suisse AG |