| On or about May 8, 2012, we will publish our Financial Report 1Q12 which will include additional financial statements disclosures. |
| Financial highlights | |||||||||||
| in / end of | % change | ||||||||||
| 1Q12 | 4Q11 | 1Q11 | QoQ | YoY | |||||||
| Net income (CHF million) | |||||||||||
| Net income/(loss) attributable to shareholders | 44 | (637) | 1,139 | – | (96) | ||||||
| Earnings per share (CHF) | |||||||||||
| Basic earnings/(loss) per share | 0.03 | (0.62) | 0.91 | – | (97) | ||||||
| Diluted earnings/(loss) per share | 0.03 | (0.62) | 0.90 | – | (97) | ||||||
| Return on equity (%, annualized) | |||||||||||
| Return on equity attributable to shareholders | 0.5 | (7.7) | 13.4 | – | – | ||||||
| Core Results (CHF million) 1 | |||||||||||
| Net revenues | 5,878 | 4,473 | 7,813 | 31 | (25) | ||||||
| Provision for credit losses | 34 | 97 | (7) | (65) | – | ||||||
| Total operating expenses | 5,804 | 5,374 | 6,195 | 8 | (6) | ||||||
| Income/(loss) before taxes | 40 | (998) | 1,625 | – | (98) | ||||||
| Core Results statement of operations metrics (%) 1 | |||||||||||
| Cost/income ratio | 98.7 | 120.1 | 79.3 | – | – | ||||||
| Pre-tax income margin | 0.7 | (22.3) | 20.8 | – | – | ||||||
| Effective tax rate | (40.0) | 39.8 | 28.6 | – | – | ||||||
| Net income margin 2 | 0.7 | (14.2) | 14.6 | – | – | ||||||
| Assets under management and net new assets (CHF billion) | |||||||||||
| Assets under management | 1,249.6 | 1,229.5 | 1,282.4 | 1.6 | (2.6) | ||||||
| Net new assets | (7.1) | 0.4 | 19.1 | – | – | ||||||
| Balance sheet statistics (CHF million) | |||||||||||
| Total assets | 1,000,020 | 1,049,165 | 1,016,468 | (5) | (2) | ||||||
| Net loans | 231,696 | 233,413 | 222,510 | (1) | 4 | ||||||
| Total shareholders' equity | 33,585 | 33,674 | 34,057 | 0 | (1) | ||||||
| Tangible shareholders' equity 3 | 24,992 | 24,795 | 25,330 | 1 | (1) | ||||||
| Book value per share outstanding (CHF) | |||||||||||
| Total book value per share | 27.43 | 27.59 | 28.36 | (1) | (3) | ||||||
| Tangible book value per share 3 | 20.41 | 20.32 | 21.10 | 0 | (3) | ||||||
| Shares outstanding (million) | |||||||||||
| Common shares issued | 1,224.5 | 1,224.3 | 1,201.0 | 0 | 2 | ||||||
| Treasury shares | 0.0 | (4.0) | 0.0 | 100 | – | ||||||
| Shares outstanding | 1,224.5 | 1,220.3 | 1,201.0 | 0 | 2 | ||||||
| Market capitalization | |||||||||||
| Market capitalization (CHF million) | 31,507 | 27,021 | 46,876 | 17 | (33) | ||||||
| Market capitalization (USD million) | 34,911 | 28,747 | 51,139 | 21 | (32) | ||||||
| BIS statistics (Basel II.5) 4 | |||||||||||
| Risk-weighted assets (CHF million) | 234,390 | 241,753 | 242,833 | (3) | (3) | ||||||
| Tier 1 ratio (%) | 15.6 | 15.2 | 14.7 | – | – | ||||||
| Core tier 1 ratio (%) | 11.8 | 10.7 | 10.2 | – | – | ||||||
| Number of employees (full-time equivalents) | |||||||||||
| Number of employees | 48,700 | 49,700 | 50,100 | (2) | (3) | ||||||
| 1 Refer to "Credit Suisse Reporting structure and Core Results" in I – Credit Suisse results – Credit Suisse for further information on Core Results. 2 Based on amounts attributable to shareholders. 3 A non-GAAP financial measure. Tangible shareholders' equity is calculated by deducting goodwill and other intangible assets from total shareholders' equity. 4 Reported under Basel II.5 since December 31, 2011. Previously reported under Basel II. Prior periods have been adjusted to conform to the current presentation. Refer to "Treasury management" in II – Treasury, Risk, Balance sheet and Off-balance sheet for further information. | |||||||||||

| Brady W. Dougan, Chief Executive Officer (left) and Urs Rohner, Chairman of the Board of Directors. |
Dear shareholders |
| We had a good start to 2012. We began to see the effects from the measures we announced in mid-2011 to evolve our business model and cost structure, and we benefited from an improved market environment. Our reported results were adversely impacted by accounting driven fair value losses due to the tightening of our own credit spreads. Adjusting for this effect of CHF 1.6 billion, as well as for other significant non-operating items, we delivered a normalized* return on equity of 15.9% for the quarter, consistent with our group target range. On the same basis, we had normalized* Core Results pre-tax income of CHF 1,918 million and normalized* net income attributable to shareholders of CHF 1,355 million. Without these adjustments, we reported net income attributable to shareholders of CHF 44 million. |
| Investing in our client franchise, while at the same time reducing risks and tightly managing costs, has been a priority for us. In the quarter, we achieved a good mix of revenues across our businesses while reducing our normalized* cost run rate on an annualized and foreign exchange-neutral basis by CHF 1.5 billion, which exceeded our previously announced reduction target of CHF 1.2 billion. Our performance in the first quarter is indicative of what our business model can produce and it underscores the strength of the client franchise we have built over the past years. Despite ongoing low levels of client activity in Private Banking, we attracted net new assets of CHF 8.4 billion in the first quarter of 2012, for a total of CHF 149 billion in net new assets since the beginning of 2009. We are pleased that while reducing Basel III risk-weighted assets by 33% over the past year in Investment Banking, we were still able to improve our market share positions and client momentum across businesses. |
| We further reduced risk-weighted assets in the first quarter and are now close to our previously announced year-end 2012 target with Basel III risk-weighted assets of USD 210 billion in Investment Banking. |
Performance of our businesses in 1Q12 |
| In Private Banking, we reported net revenues of CHF 2,651 million, up 3% from the previous quarter driven by higher transaction-based revenues. Private Banking pre-tax income increased 34% from the previous quarter to CHF 625 million, due to slightly lower total operating expenses and slightly higher net revenues. We made good progress in the implementation of the initiative we announced in November 2011 to optimize Private Banking’s business portfolio and enhance profitability. |
| In Investment Banking, we reported net revenues of CHF 4,140 million and pre-tax income of CHF 993 million. Results were significantly higher compared to the previous quarter, driven by higher revenues in fixed income sales and trading, due to client franchise momentum, the execution of our strategy and improved client flow. We also had strong market share momentum across businesses. |
| To date, we have made significant progress in executing the strategy for Investment Banking announced in November 2011. In the first quarter of 2012, we further reduced risk-weighted assets in Investment Banking by 15% to USD 210 billion. In addition, our business mix is more balanced and we saw strong improvements in both capital and operating efficiency. As a result of our strategy, our normalized* after-tax return on Basel III allocated capital increased by four percentage points from a year ago to 19% in the quarter. |
| In Asset Management, we had net revenues of CHF 663 million, up 45% compared to the previous quarter. Asset Management pre-tax income was CHF 250 million. Excluding the gain of CHF 178 million from the partial sale of our stake in Aberdeen Asset Management, pre-tax income was CHF 72 million. While the overall profitability of the division was good, Asset Management recorded significant asset outflows, primarily from a single low margin mandate. We continue to implement our strategy in Asset Management, which focuses on achieving growth in fee-based revenues and investing in multi-asset class solutions, alternative investments and our Swiss business. |
Aligning our capital structure to new regulatory environment |
| During the quarter, we successfully issued CHF 750 million of contingent convertible bonds, thereby fulfilling our expected Swiss requirement for high-trigger contingent capital. Furthermore, our strong liquidity position enabled us to repurchase CHF 4.7 billion in capital instruments, which will no longer qualify for regulatory capital treatment under the proposed Basel III framework, while achieving a net stable funding ratio (NSFR) of 100%. Both measures further strengthened our regulatory capital in preparation for the Basel III requirements. We improved our Basel II.5 core tier 1 ratio to 11.8%, up 1.1 percentage points from the prior quarter. We are convinced that by preparing our business for the new regulatory environment, we will not only contribute to building a more robust financial system but also create a competitive advantage for Credit Suisse. |
| We are encouraged by the progress we have made in the first quarter. We have strong client momentum and at the same time exceeded our risk and cost reduction targets. We are very confident that by executing our strategy consistently, we will be able to deliver our target return on equity of 15% or more over the cycle. |
| Sincerely |
| Urs Rohner Brady W. Dougan |
| April 2012 |
| * Normalized and underlying results in the following table are non-GAAP financial measures. The table includes a reconciliation of certain of these measures. For further information on the calculation of normalized and underlying measures, including the normalized cost run rate for 1Q12 on an annualized, foreign exchange-neutral basis and Investment Banking’s normalized after-tax return on Basel III allocated capital, see the 1Q12 Results Presentation Slides. |
in 1Q12 | Core Results pre-tax income | Income tax expense/ (benefit) | Non- controlling interest | Net income attributable to shareholders | Return on equity (%) | ||||||
| Overview of significant items (CHF million) | |||||||||||
| Reported | 40 | 16 | (12) | 44 | 0.5 | ||||||
| Fair value losses from movement in credit spreads | 1,554 | (444) | 0 | 1,110 | – | ||||||
| Realignment costs | 68 | (21) | 0 | 47 | – | ||||||
| Gain on sale of stake in Aberdeen Asset Management | (178) | 32 | 0 | (146) | – | ||||||
| Underlying | 1,484 | (417) | (12) | 1,055 | 12.4 | ||||||
| 2011 Partner Asset Facility expense | 534 | (165) | 0 | 369 | – | ||||||
| Assumed share-based award expense 1 | (100) | 31 | 0 | (69) | – | ||||||
| Normalized | 1,918 | (551) | (12) | 1,355 | 15.9 | ||||||
| 1 Adjusted for the accelerated compensation expense in 1Q12 by replacing 2011 Partner Asset Facility (PAF2) expense with assumed share-based awards expense for 1Q12. This calculation assumes that share-based awards (with three-year vesting) had been awarded in lieu of PAF2 awards (with accelerated vesting) during 1Q12. | |||||||||||

| On or about May 8, 2012, we will publish and file with the SEC our Financial Report 1Q12, which will include additional disclosures on: |
| –fair value of financial instruments; |
| –loans, allowance for loan losses and credit quality; |
| –derivatives and hedging activities; |
| –investment securities; |
| –guarantees and commitments; |
| –assets pledged or assigned; and |
| –transfers of financial assets and variable interest entities. |
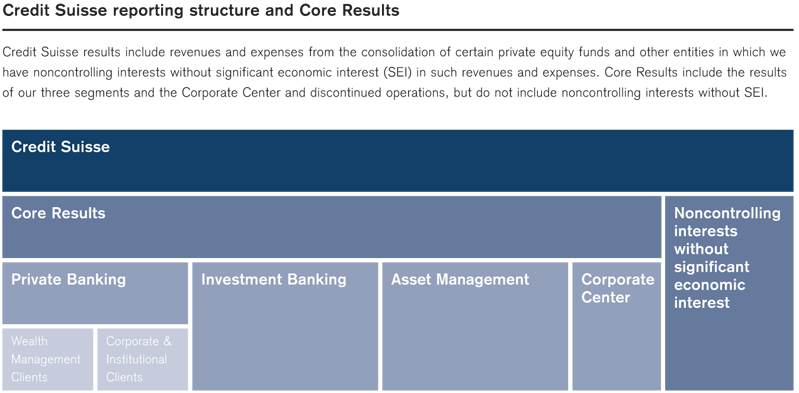
Credit Suisse at a glance
Credit Suisse results
Operating environment
Credit Suisse
Core Results
Private Banking
Wealth Management Clients
Corporate & Institutional Clients
Investment Banking
Asset Management
Assets under management
Treasury, risk, balance sheet and off-balance sheet
Treasury management
Risk management
Balance sheet and off-balance sheet
Condensed consolidated financial statements – unaudited
Condensed consolidated financial statements – unaudited
Notes to the condensed consolidated financial statements – unaudited
Note 1 Summary of significant accounting policies
Note 2 Recently issued accounting standards
Note 3 Business developments
Note 4 Discontinued operations
Note 5 Segment information
Note 6 Net interest income
Note 7 Commissions and fees
Note 8 Trading revenues
Note 9 Other revenues
Note 10 Provision for credit losses
Note 11 Compensation and benefits
Note 12 General and administrative expenses
Note 13 Earnings per share
Note 14 Trading assets and liabilities
Note 15 Investment securities
Note 16 Loans, allowance for loan losses and credit quality
Note 17 Other assets and other liabilities
Note 18 Long-term debt
Note 19 Accumulated other comprehensive income
Note 20 Tax
Note 21 Employee deferred compensation
Note 22 Pension and other post-retirement benefits
Note 23 Derivatives and hedging activities
Note 24 Guarantees and commitments
Note 25 Transfers of financial assets and variable interest entities
Note 26 Financial instruments
Note 27 Assets pledged or assigned
Note 28 Subsidiary guarantee information
Note 29 Litigation
List of abbreviations
Investor information
Financial calendar and contacts
| For purposes of this report, unless the context otherwise requires, the terms “Credit Suisse,” “the Group,” “we,” “us” and “our” mean Credit Suisse Group AG and its consolidated subsidiaries. The business of Credit Suisse AG, the Swiss bank subsidiary of the Group, is substantially similar to the Group, and we use these terms to refer to both when the subject is the same or substantially similar. We use the term “the Bank” when we are only referring to Credit Suisse AG, the Swiss bank subsidiary of the Group, and its consolidated subsidiaries. |
| Abbreviations are explained in the List of abbreviations in the back of this report. |
| Publications referenced in this report, whether via website links or otherwise, are not incorporated into this report. |
| In various tables, use of “–” indicates not meaningful or not applicable. |
Credit Suisse at a glance |
Credit Suisse |
| As one of the world’s leading financial services providers, we are committed to delivering our combined financial experience and expertise to corporate, institutional and government clients and to high-net-worth individuals worldwide, as well as to private clients in Switzerland. Founded in 1856, we have a truly global reach today, with operations in over 50 countries and 48,700 employees from approximately 100 different nations. This worldwide reach enables us to generate a geographically balanced stream of revenues and net new assets and allows us to capture growth opportunities wherever they are. We serve our diverse clients through our three divisions, which cooperate closely to provide holistic financial solutions based on innovative products and specially tailored advice. |
Private Banking |
| Private Banking offers comprehensive advice and a wide range of financial solutions to private, corporate and institutional clients. The Private Banking division comprises the Wealth Management Clients and Corporate & Institutional Clients businesses. In Wealth Management Clients we serve ultra-high-net-worth and high-net-worth individuals around the globe and private clients in Switzerland. Our Corporate & Institutional Clients business serves the needs of corporations and institutional clients, mainly in Switzerland. |
Investment Banking |
| Investment Banking provides a broad range of financial products and services, including global securities sales, trading and execution, prime brokerage and capital raising services, corporate advisory and comprehensive investment research, with a focus on businesses that are client-driven, flow-based and capital-efficient. Clients include corporations, governments, institutional investors, including hedge funds, and private individuals around the world. Credit Suisse delivers its investment banking capabilities via regional and local teams based in major global financial centers. Strongly anchored in Credit Suisse’s integrated model, Investment Banking works closely with the Private Banking and Asset Management divisions to provide clients with customized financial solutions. |
Asset Management |
| Asset Management offers a wide range of investment products and solutions across asset classes, for all investment styles. The division manages global and regional portfolios, separate accounts, mutual funds and other investment vehicles for governments, institutions, corporations and individuals worldwide. Asset Management focuses on becoming a global leader in multi-asset class solutions as well as in alternative investments. To deliver the bank’s best investment performance, Asset Management operates as a global integrated network in close collaboration with the Private Banking and Investment Banking divisions. |
Credit Suisse results |
Operating environment |
Credit Suisse |
Core Results (including Overview of results) |
Private Banking |
Investment Banking |
Asset Management |
Assets under management |
Operating environment |
| The global economy continued to show signs of expansion in 1Q12, though Europe remained relatively weak. The Greek sovereign debt exchange was executed without causing significant financial market dislocations. Equity markets ended the quarter higher, and volatility decreased. Major currencies were largely stable against the US dollar during the quarter, although the Japanese yen declined. |
Economic environment |
| The global economy continued to show signs of expansion in 1Q12, though Europe remained relatively weak, with the gross domestic product of Germany, Italy, the UK and Spain all contracting. Chinese growth slowed somewhat as housing sales contracted and exports declined. The US economy showed signs of further expansion, with labor markets reflecting job growth and a decrease in the unemployment rate. |
| The Greek debt exchange occurred in March, without causing significant financial market dislocations. The voluntary participation rate was 86%, but due to the use of collective action clauses, which allowed the Greek government to declare the restructuring binding on all holders of local law bonds, the overall participation rate reached 96%. Credit default swaps (CDS) contracts were paid out at the end of March, again without causing disruptions. |
| Efforts by European policymakers to manage the region’s debt crisis showed positive signs during the quarter. At the end of March, eurozone member states increased the combined lending power of the European Financial Stability Facility and the European Stability Mechanism from EUR 500 billion to EUR 700 billion. The European Central Bank (ECB) completed its second three-year refinancing program in February, having lent more than EUR 1 trillion to European banks. Increased liquidity resulted in a sharp fall in overnight and short-term interest rates, with 3-month LIBOR below the ECB’s target rate. The increased liquidity also encouraged Italian and Spanish banks to buy significant amounts of government bonds, which contributed to a decline in yields on these bonds. |
| Global inflation continued to slow, with inflation most pronounced in emerging markets. Inflation in developed countries was more persistent than expected. |
| Several central banks continued to ease monetary policy. The Federal Reserve announced it would keep rates low until 2014 instead of 2013 and also published a forecast of the federal funds rate for the first time. The Bank of England expanded its asset purchases further in February, and the central bank of Brazil cut rates. The Bank of Japan (BoJ) announced an official inflation target and expanded its asset purchase program further. |
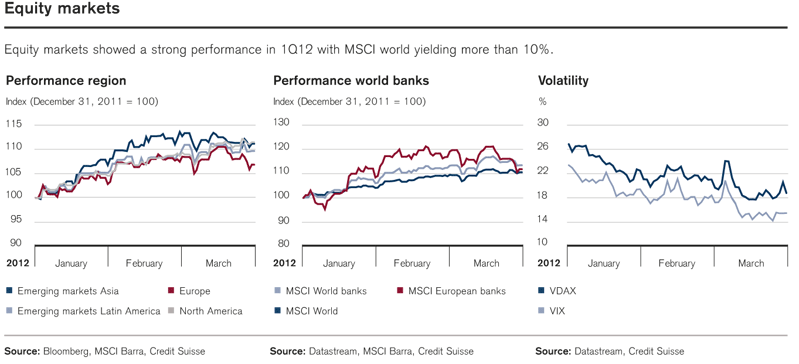
| In 1Q12, equity markets had one of the best quarterly performances of the past decade, with some markets rallying more than 10% (refer to the charts “Equity markets”). Somewhat increased risk appetite and low interest rates were the main drivers, which made riskier assets more attractive compared to defensive assets. Volatility declined to a five-year low, driven by increased liquidity. Traded equity volumes remained subdued on most major exchanges. |
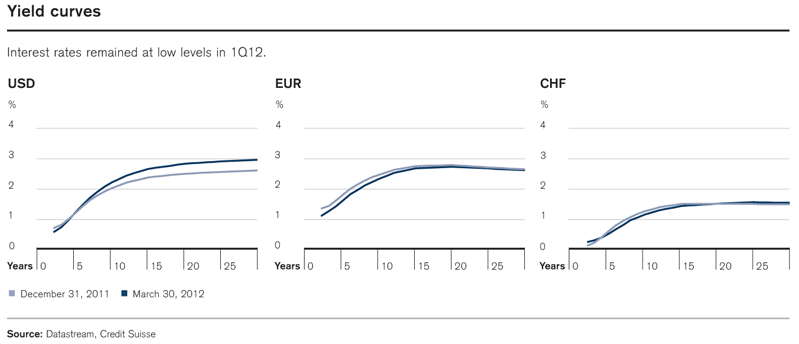
| In fixed income markets, high yield (in EUR) and emerging market (in USD) bonds recorded the strongest total returns in 1Q12. In the investment grade segment, financials outperformed, supported by the perceived decline in contagion risk. In contrast to the previous quarter, European corporate credits outperformed their US counterparts, supported by the successful Greek sovereign debt restructuring (refer to charts "Credit spreads"). For government bonds, performance was mixed. While Italian government bonds recorded strong returns, benchmark government bonds, and in particular long-dated US treasuries, were negatively affected by expectations of future central bank rate increases (refer to the charts "Yield curves"). In this environment, inflation expectations also increased, leading to an outperformance of inflation-linked bonds versus nominal bonds in both the US and Europe. |
| Stronger US economic data, the rise in US long-term yields and increased risk appetite were key drivers in foreign exchange markets in 1Q12. The Japanese yen declined against most currencies as foreign yields rose and the BoJ policies became more expansionary. The Swiss franc remained slightly above the minimum exchange rate of CHF 1.20 per euro previously declared by the Swiss National Bank. Narrowing interest rate spreads between euro and Swiss franc prevented the Swiss franc from weakening. Major currencies, including the euro and British pound, were largely stable against the US dollar. Emerging market currencies benefitted from stable global growth prospects and renewed capital inflows. |
| Commodity markets saw a turnaround in 1Q12 compared to the end of 4Q11 when most commodity prices were under severe selling pressure. Oil prices rose, partly due to political tensions in the Middle East. Gold prices had a strong start at the beginning of the year, though towards the end of the quarter eased in part due to the increase in US bond yields. The Credit Suisse Commodity Benchmark increased more than 5% in 1Q12. |

Sector environment |
| After recent underperformance, the banking sector showed a positive performance in 1Q12 and outperformed the broader market (refer to the charts "Equity markets"). For European banks, this was supported by the Long-Term Refinancing Operation (LTRO) from the ECB. The LTRO facility improved funding access and helped to ease investors’ liquidity concerns. Industry participants continued to take further steps to adjust their business models to reflect the sector's changing regulatory framework, especially in investment banking. Cost pressures remained high in the banking industry, with many institutions continuing cost-cutting initiatives. |
| In 1Q12, in the private banking sector, client activity improved somewhat, but remained at low levels. The strength of the Swiss franc continued to adversely impact Swiss wealth management institutions. The sector continued to adapt to industry-specific regulatory changes, including cross-border business and investor protection requirements. The Swiss real estate market saw sustained strong demand, supported by continued low interest rates. Concerns about the real estate market overheating in certain areas of Switzerland continued and were repeatedly mentioned by the Swiss Financial Market Supervisory Authority (FINMA). |
| In the investment banking sector, global announced and completed mergers and acquisitions (M&A) volumes were lower quarter on quarter and year on year. Global equity underwriting volumes increased 33% from 4Q11, driven primarily by increased follow-on activity, but were 32% lower than 1Q11 as initial public offering (IPO) activity remained subdued. Global debt underwriting volumes increased 84% relative to 4Q11, and were up slightly from the prior-year period. Global equity trading volumes were in line with 4Q11 and lower compared to 1Q11. Fixed income volumes generally increased from 4Q11, but were lower than 1Q11, particularly for treasuries, federal agency and corporate bonds. |
| In the asset management sector, the Dow Jones Credit Suisse Hedge Fund Index posted an increase of 4% for 1Q12. Long/short equity and emerging markets saw the largest gains, with declines in dedicated short bias and managed futures. In the private equity industry, investor confidence improved somewhat, and the proportion of investors looking to make new commitments in 2012 increased. |
| Market volumes (growth in %) | |||||||||
| Global | Europe | ||||||||
| end of 1Q12 | QoQ | YoY | QoQ | YoY | |||||
| Equity trading volume 1 | 0 | 18 | 2 | (21) | |||||
| Announced mergers and acquisitions 2 | (11) | (22) | 5 | (18) | |||||
| Completed mergers and acquisitions 2 | (30) | (34) | (40) | (45) | |||||
| Equity underwriting 2 | 33 | (32) | 264 | 0 | |||||
| Debt underwriting 2 | 84 | 5 | 178 | (7) | |||||
| Syndicated lending - investment grade 2 | (42) | (14) | – | – | |||||
| 1 London Stock Exchange, Borsa Italiana, Deutsche Börse, BME and Euronext. Global also includes New York Stock Exchange and NASDAQ. 2 Dealogic | |||||||||
Credit Suisse |
| In 1Q12, we recorded net income attributable to shareholders of CHF 44 million, including fair value losses of CHF 1.6 billion before tax on our own vanilla debt, stand-alone derivatives relating to certain of our funding liabilities and debit valuation adjustments on structured notes. Diluted earnings per share were CHF 0.03. Our capital position remained strong with a Basel II.5 tier 1 ratio of 15.6%, compared to 15.2% as of the end of 4Q11. |
| Results | |||||||||||
| in / end of | % change | ||||||||||
| 1Q12 | 4Q11 | 1Q11 | QoQ | YoY | |||||||
| Statements of operations (CHF million) | |||||||||||
| Net revenues | 6,047 | 4,488 | 8,156 | 35 | (26) | ||||||
| Provision for credit losses | 34 | 97 | (7) | (65) | – | ||||||
| Compensation and benefits | 3,711 | 3,021 | 4,029 | 23 | (8) | ||||||
| General and administrative expenses | 1,653 | 1,879 | 1,632 | (12) | 1 | ||||||
| Commission expenses | 451 | 480 | 536 | (6) | (16) | ||||||
| Total other operating expenses | 2,104 | 2,359 | 2,168 | (11) | (3) | ||||||
| Total operating expenses | 5,815 | 5,380 | 6,197 | 8 | (6) | ||||||
| Income/(loss) before taxes | 198 | (989) | 1,966 | – | (90) | ||||||
| Income tax expense/(benefit) | (16) | (397) | 465 | (96) | – | ||||||
| Net income/(loss) | 214 | (592) | 1,501 | – | (86) | ||||||
| Net income/(loss) attributable to noncontrolling interests | 170 | 45 | 362 | 278 | (53) | ||||||
| Net income/(loss) attributable to shareholders | 44 | (637) | 1,139 | – | (96) | ||||||
| Earnings per share (CHF) | |||||||||||
| Basic earnings/(loss) per share | 0.03 | (0.62) | 0.91 | – | (97) | ||||||
| Diluted earnings/(loss) per share | 0.03 | (0.62) | 0.90 | – | (97) | ||||||
| Return on equity (%, annualized) | |||||||||||
| Return on equity attributable to shareholders | 0.5 | (7.7) | 13.4 | – | – | ||||||
| Return on tangible equity attributable to shareholders 1 | 0.7 | (10.4) | 18.1 | – | – | ||||||
| Number of employees (full-time equivalents) | |||||||||||
| Number of employees | 48,700 | 49,700 | 50,100 | (2) | (3) | ||||||
| 1 Based on tangible shareholders' equity attributable to shareholders, a non-GAAP financial measure, which is calculated by deducting goodwill and other intangible assets from total shareholders' equity attributable to shareholders. Management believes that the return on tangible shareholders' equity attributable to shareholders is meaningful as it allows consistent measurement of the performance of businesses without regard to whether the businesses were acquired. | |||||||||||
| Credit Suisse and Core Results | |||||||||||||||||||
| Core Results | Noncontrolling interests without SEI | Credit Suisse | |||||||||||||||||
| in | 1Q12 | 4Q11 | 1Q11 | 1Q12 | 4Q11 | 1Q11 | 1Q12 | 4Q11 | 1Q11 | ||||||||||
| Statements of operations (CHF million) | |||||||||||||||||||
| Net revenues | 5,878 | 4,473 | 7,813 | 169 | 15 | 343 | 6,047 | 4,488 | 8,156 | ||||||||||
| Provision for credit losses | 34 | 97 | (7) | 0 | 0 | 0 | 34 | 97 | (7) | ||||||||||
| Compensation and benefits | 3,707 | 3,023 | 4,025 | 4 | (2) | 4 | 3,711 | 3,021 | 4,029 | ||||||||||
| General and administrative expenses | 1,646 | 1,871 | 1,634 | 7 | 8 | (2) | 1,653 | 1,879 | 1,632 | ||||||||||
| Commission expenses | 451 | 480 | 536 | 0 | 0 | 0 | 451 | 480 | 536 | ||||||||||
| Total other operating expenses | 2,097 | 2,351 | 2,170 | 7 | 8 | (2) | 2,104 | 2,359 | 2,168 | ||||||||||
| Total operating expenses | 5,804 | 5,374 | 6,195 | 11 | 6 | 2 | 5,815 | 5,380 | 6,197 | ||||||||||
| Income/(loss) before taxes | 40 | (998) | 1,625 | 158 | 9 | 341 | 198 | (989) | 1,966 | ||||||||||
| Income tax expense/(benefit) | (16) | (397) | 465 | 0 | 0 | 0 | (16) | (397) | 465 | ||||||||||
| Net income/(loss) | 56 | (601) | 1,160 | 158 | 9 | 341 | 214 | (592) | 1,501 | ||||||||||
| Net income/(loss) attributable to noncontrolling interests | 12 | 36 | 21 | 158 | 9 | 341 | 170 | 45 | 362 | ||||||||||
| Net income/(loss) attributable to shareholders | 44 | (637) | 1,139 | – | – | – | 44 | (637) | 1,139 | ||||||||||
| Statement of operations metrics (%) | |||||||||||||||||||
| Cost/income ratio | 98.7 | 120.1 | 79.3 | – | – | – | 96.2 | 119.9 | 76.0 | ||||||||||
| Pre-tax income margin | 0.7 | (22.3) | 20.8 | – | – | – | 3.3 | (22.0) | 24.1 | ||||||||||
| Effective tax rate | (40.0) | 39.8 | 28.6 | – | – | – | (8.1) | 40.1 | 23.7 | ||||||||||
| Net income margin 1 | 0.7 | (14.2) | 14.6 | – | – | – | 0.7 | (14.2) | 14.0 | ||||||||||
| 1 Based on amounts attributable to shareholders. | |||||||||||||||||||
Core Results |
| In 1Q12, we recorded net income attributable to shareholders of CHF 44 million. Net revenues were CHF 5,878 million, and total operating expenses were CHF 5,804 million. |
| Our results included fair value losses of CHF 1.6 billion before tax on our own long-term vanilla debt, stand-alone derivatives relating to certain of our funding liabilities and debit valuation adjustments (DVA) on structured notes. The results also included losses of CHF 261 million from businesses we are exiting in our Investment Banking fixed income business. Revenues were adversely impacted and expenses were favorably impacted by the strengthening of the Swiss franc against all major currencies. Compared to 1Q11, the adverse foreign exchange translation impact on net revenues and income before taxes was CHF 219 million and CHF 106 million. Operating expenses included compensation expense of CHF 534 million related to 2011 Partner Asset Facility (PAF2) deferred compensation awards, which were granted and expensed in 1Q12. |
| We reduced Basel III risk-weighted assets in Investment Banking by 15% compared to 4Q11. In Asset Management, we completed a partial sale of our investment in Aberdeen Asset Management, recognizing a gain of CHF 178 million and improving our capital position. |
| We recorded net asset outflows of CHF 7.1 billion, with net new assets of CHF 8.4 billion in Private Banking from inflows in our ultra-high-net-worth individual (UHNWI) client segment and emerging markets and net asset outflows of CHF 13.7 billion in Asset Management. |
| Core Results | |||||||||||
| in / end of | % change | ||||||||||
| 1Q12 | 4Q11 | 1Q11 | QoQ | YoY | |||||||
| Statements of operations (CHF million) | |||||||||||
| Net interest income | 1,861 | 1,661 | 1,732 | 12 | 7 | ||||||
| Commissions and fees | 3,179 | 2,765 | 3,679 | 15 | (14) | ||||||
| Trading revenues | 180 | (36) | 2,004 | – | (91) | ||||||
| Other revenues | 658 | 83 | 398 | – | 65 | ||||||
| Net revenues | 5,878 | 4,473 | 7,813 | 31 | (25) | ||||||
| Provision for credit losses | 34 | 97 | (7) | (65) | – | ||||||
| Compensation and benefits | 3,707 | 3,023 | 4,025 | 23 | (8) | ||||||
| General and administrative expenses | 1,646 | 1,871 | 1,634 | (12) | 1 | ||||||
| Commission expenses | 451 | 480 | 536 | (6) | (16) | ||||||
| Total other operating expenses | 2,097 | 2,351 | 2,170 | (11) | (3) | ||||||
| Total operating expenses | 5,804 | 5,374 | 6,195 | 8 | (6) | ||||||
| Income/(loss) before taxes | 40 | (998) | 1,625 | – | (98) | ||||||
| Income tax expense/(benefit) | (16) | (397) | 465 | (96) | – | ||||||
| Net income/(loss) | 56 | (601) | 1,160 | – | (95) | ||||||
| Net income attributable to noncontrolling interests | 12 | 36 | 21 | (67) | (43) | ||||||
| Net income/(loss) attributable to shareholders | 44 | (637) | 1,139 | – | (96) | ||||||
| Statement of operations metrics (%) | |||||||||||
| Cost/income ratio | 98.7 | 120.1 | 79.3 | – | – | ||||||
| Pre-tax income margin | 0.7 | (22.3) | 20.8 | – | – | ||||||
| Effective tax rate | (40.0) | 39.8 | 28.6 | – | – | ||||||
| Net income margin 1 | 0.7 | (14.2) | 14.6 | – | – | ||||||
| Number of employees (full-time equivalents) | |||||||||||
| Number of employees | 48,700 | 49,700 | 50,100 | (2) | (3) | ||||||
| 1 Based on amounts attributable to shareholders. | |||||||||||
| Core Results reporting by division | |||||||||||
| in | % change | ||||||||||
| 1Q12 | 4Q11 | 1Q11 | QoQ | YoY | |||||||
| Net revenues (CHF million) | |||||||||||
| Wealth Management Clients | 2,185 | 2,120 | 2,434 | 3 | (10) | ||||||
| Corporate & Institutional Clients | 466 | 455 | 463 | 2 | 1 | ||||||
| Private Banking | 2,651 | 2,575 | 2,897 | 3 | (8) | ||||||
| Investment Banking | 4,140 | 1,113 | 5,066 | 272 | (18) | ||||||
| Asset Management | 663 | 458 | 594 | 45 | 12 | ||||||
| Corporate Center | (1,576) | 327 | (744) | – | 112 | ||||||
| Net revenues | 5,878 | 4,473 | 7,813 | 31 | (25) | ||||||
| Provision for credit losses (CHF million) | |||||||||||
| Wealth Management Clients | 22 | 43 | 12 | (49) | 83 | ||||||
| Corporate & Institutional Clients | 18 | 32 | 0 | (44) | – | ||||||
| Private Banking | 40 | 75 | 12 | (47) | 233 | ||||||
| Investment Banking | (6) | 22 | (19) | – | (68) | ||||||
| Provision for credit losses | 34 | 97 | (7) | (65) | – | ||||||
| Total operating expenses (CHF million) | |||||||||||
| Wealth Management Clients | 1,757 | 1,792 | 1,798 | (2) | (2) | ||||||
| Corporate & Institutional Clients | 229 | 240 | 231 | (5) | (1) | ||||||
| Private Banking | 1,986 | 2,032 | 2,029 | (2) | (2) | ||||||
| Investment Banking | 3,153 | 2,534 | 3,605 | 24 | (13) | ||||||
| Asset Management | 413 | 368 | 419 | 12 | (1) | ||||||
| Corporate Center | 252 | 440 | 142 | (43) | 77 | ||||||
| Total operating expenses | 5,804 | 5,374 | 6,195 | 8 | (6) | ||||||
| Income/(loss) before taxes (CHF million) | |||||||||||
| Wealth Management Clients | 406 | 285 | 624 | 42 | (35) | ||||||
| Corporate & Institutional Clients | 219 | 183 | 232 | 20 | (6) | ||||||
| Private Banking | 625 | 468 | 856 | 34 | (27) | ||||||
| Investment Banking | 993 | (1,443) | 1,480 | – | (33) | ||||||
| Asset Management | 250 | 90 | 175 | 178 | 43 | ||||||
| Corporate Center | (1,828) | (113) | (886) | – | 106 | ||||||
| Income/(loss) before taxes | 40 | (998) | 1,625 | – | (98) | ||||||
| Core Results reporting by region | |||||||||||
| in | % change | ||||||||||
| 1Q12 | 4Q11 | 1Q11 | QoQ | YoY | |||||||
| Net revenues (CHF million) | |||||||||||
| Switzerland | 2,030 | 1,866 | 2,160 | 9 | (6) | ||||||
| EMEA | 1,968 | 1,146 | 2,003 | 72 | (2) | ||||||
| Americas | 2,597 | 732 | 3,486 | 255 | (26) | ||||||
| Asia Pacific | 859 | 402 | 908 | 114 | (5) | ||||||
| Corporate Center | (1,576) | 327 | (744) | – | 112 | ||||||
| Net revenues | 5,878 | 4,473 | 7,813 | 31 | (25) | ||||||
| Income/(loss) before taxes (CHF million) | |||||||||||
| Switzerland | 667 | 423 | 718 | 58 | (7) | ||||||
| EMEA | 396 | (228) | 349 | – | 13 | ||||||
| Americas | 621 | (856) | 1,252 | – | (50) | ||||||
| Asia Pacific | 184 | (224) | 192 | – | (4) | ||||||
| Corporate Center | (1,828) | (113) | (886) | – | 106 | ||||||
| Income/(loss) before taxes | 40 | (998) | 1,625 | – | (98) | ||||||
| A significant portion of our business requires inter-regional coordination in order to facilitate the needs of our clients. The methodology for allocating our results by region is dependent on management judgment. For Private Banking, results are allocated based on the management reporting structure of our relationship managers and the region where the transaction is recorded. For Investment Banking, trading results are allocated based on where the risk is primarily managed and fee-based results are allocated where the client is domiciled. For Asset Management, results are allocated based on the location of the investment advisors and sales teams. | |||||||||||
| Impact from movements in credit spreads |
| Our Core Results revenues are impacted by changes in credit spreads on fair-valued Credit Suisse long-term vanilla debt and DVA relating to certain structured notes liabilities carried at fair value. For segment reporting purposes through the end of 2011, the cumulative fair value gains of CHF 1.5 billion on Credit Suisse long-term vanilla debt as of the opening 1Q10 balance sheet was charged to the segments on a straight-line amortization basis, and the difference between this amortization and the fair valuation on this Credit Suisse debt from changes in credit spreads was included in the Corporate Center. |
| Beginning in 1Q12, we fully reflect the fair value impact from movements in credit spreads on our long-term vanilla debt and DVA on certain structured notes liabilities in the Corporate Center and discontinued the amortization in the segments of the past fair value gains on long-term vanilla debt. DVA on certain structured notes liabilities was previously recorded in the Investment Banking segment and is now recorded in the Corporate Center in order to aggregate all credit-spread impacts on our funding instruments and to reflect that these impacts are driven by the creditworthiness of the Group rather than our Investment Banking segment or the issuer. Prior periods have been reclassified to conform to the current presentation and such reclassifications had no impact on the Group’s net income/(loss) or total shareholders’ equity. |
| Our Core Results are also impacted by fair valuation gains/(losses) on stand-alone derivatives relating to certain of our funding liabilities. These fair valuation gains/(losses) on the stand-alone derivatives are recorded in the Corporate Center, reflect the volatility of cross-currency swaps and yield curve volatility and, over the life of the derivatives, will result in no net gains/(losses). |
| in | 1Q12 | 4Q11 | 1Q11 | ||||
| Net income/(loss) attributable to shareholders, excluding impact from movements in credit spreads (CHF million) | 1,154 | (969) | 1,676 | ||||
| Fair value gains/(losses) on own long-term vanilla debt | (894) | 188 | (309) | ||||
| Fair value gains/(losses) on debit valuation adjustments on structured notes | (482) | 182 | (86) | ||||
| Fair value gains/(losses) on stand-alone derivatives | (178) | 21 | (308) | ||||
| Tax expense/(benefit) | (444) | 59 | (166) | ||||
| Net income/(loss) attributable to shareholders | 44 | (637) | 1,139 | ||||
| Regulatory capital excludes cumulative fair value gains/(losses) related to own long-term vanilla debt and structured notes, net of tax. Refer to “Treasury management” in II – Treasury, risk, balance sheet and off-balance sheet for further information. | |||||||
Results overview |
| Certain reclassifications have been made to prior periods to conform to the current presentation. |
| InPrivate Banking, net revenues of CHF 2,651 million decreased 8% from 1Q11, mainly driven by lower transaction-based revenues. Recurring commissions and fees declined 10% due to lower revenues across most revenue categories. Net interest income was stable in an ongoing low interest rate environment. Compared to 4Q11, transaction-based revenues increased 15%, mainly due to higher brokerage and product issuing fees, reflecting continued low but improved client activity. In 1Q12, Private Banking attracted solid net new assets of CHF 8.4 billion. Wealth Management Clients contributed net new assets of CHF 5.8 billion, driven by inflows from its UHNWI client segment and emerging markets. Wealth Management Clients in Switzerland reported net new assets of CHF 3.3 billion excluding outflows of CHF 4.1 billion related to the integration of Clariden Leu. Corporate & Institutional Clients in Switzerland contributed net new assets of CHF 2.6 billion. |
| InInvestment Banking, net revenues of CHF 4,140 million were down 18% from 1Q11. In 1Q12, consistent with the execution of our refined strategy, we further reduced Basel III risk-weighted assets by USD 38 billion to USD 210 billion. Fixed income sales and trading revenues were significantly higher than 4Q11, driven by client franchise momentum, improved trading conditions and better client flow. We had more balanced results among our macro businesses (global rates and foreign exchange), securitized products and global credit products. We also had a strong performance in emerging markets. Relative to 1Q11, fixed income sales and trading revenues declined 21%, primarily due to a record quarter for securitized products in 1Q11, which benefited from higher inventory levels, and losses incurred in 1Q12 from businesses we are exiting. In 1Q12, we reduced fixed income Basel III risk-weighted assets by 45% from a year ago while revenues declined substantially less, demonstrating improved capital efficiency and resource allocation as a result of our refined strategy. Equity sales and trading revenues were solid despite sustained weak trading volumes, reflecting stable market share positions across key businesses such as prime services and cash equities. A significant improvement in derivatives over 4Q11 was driven by improved market conditions and stronger customer flows. Underwriting and advisory results recovered from a weak 4Q11 due to market share momentum and strong results in debt underwriting, reflecting an increase in new issue activity in high yield and investment grade. |
| InAsset Management, net revenues of CHF 663 million were up 12% from 1Q11, with a pre-tax income margin of 38%. In February, we completed a partial sale of our investment in Aberdeen Asset Management, recognizing a gain of CHF178 million and improving our capital position. We reduced our ownership interest from 19.8% to 9.8%. Excluding this gain, income before taxes was CHF 72 million, down from CHF 175 million in 1Q11. Investment-related gains of CHF 101 million decreased 37% compared with 1Q11, but increased significantly compared with 4Q11. Compared with 1Q11, fee-based revenues decreased 9%, with a decline in placement fees, asset management fees and equity participations income. Our fee-based margin was 40 basis points compared with 41 basis points in 1Q11. |
| > Refer to “Private Banking”, “Investment Banking” and “Asset Management” for further information. |
| Corporate Center includes parent company operations such as Group financing, expenses for projects sponsored by the Group and certain expenses and revenues that have not been allocated to the segments. In addition, the Corporate Center includes consolidation and elimination adjustments required to eliminate intercompany revenues and expenses. In 1Q12, losses before taxes were CHF 1,828 million, including fair value losses on our vanilla debt of CHF 894 million, DVA losses on certain structured notes liabilities of CHF 482 million, fair value losses on stand-alone derivatives of CHF 178 million and CHF 68 million of realignment costs consisting primarily of severance and other compensation expenses relating to the Group-wide cost efficiency initiatives. The fair value losses on own debt reflected the narrowing of credit spreads on senior and subordinated debt across all currencies. Results also included gains relating to our purchase of outstanding hybrid tier 1 and tier 2 capital instruments in a tender offer in March 2012. |
| > Refer to “Impact from movements in credit spreads” for further information. |
| Provision for credit losses were net provisions of CHF 34 million in 1Q12, with net provisions of CHF 40 million in Private Banking and releases of CHF 6 million in Investment Banking. |
| Total operating expensesof CHF 5,804 million were down 6% compared to 1Q11, primarily reflecting 8% lower compensation and benefits. The decrease in compensation and benefits was mainly due to lower discretionary performance-related compensation expense and the favorable foreign exchange translation impact. The lower operating expenses also reflected the benefits from our expense reduction initiative. General and administrative expenses were CHF 1,646 million, up 1% compared to 1Q11. |
| Anincome tax benefit of CHF 16 million in 1Q12 mainly reflected a release of contingency reserves for uncertain tax positions partially offset by an income tax expense on pre-tax income. Deferred tax assets on net operating losses decreased by CHF 464 million to CHF 3,388 million during 1Q12. Overall, net deferred tax assets decreased by CHF 219 million to CHF 8,291 million during 1Q12. The Core Results effective tax rate was (40.0)% in 1Q12, compared to 39.8% in 4Q11. |
| > Refer to “Note 20 – Tax” in III – Condensed consolidated financial statements – unaudited for further information. |
| Assets under management were CHF 1,249.6 billion, up CHF 20.1 billion, or 1.6% compared to the end of 4Q11, mainly reflecting positive market performance partially offset by adverse foreign exchange-related movements. Private Banking recorded net new assets of CHF 8.4 billion in 1Q12, including CHF 5.8 billion from Wealth Management Clients, with inflows particularly from its UHNWI client segment and emerging markets. Asset management recorded net asset outflows of CHF 13.7 billion, with outflows in traditional investments partly offset by inflows in alternative investments. |
| Overview of results | |||||||||||||||||||||||||||||||||||||||||||
| Private Banking | Investment Banking | Asset Management | Corporate Center | Core Results | 1 | Noncontrolling Interests without SEI | Credit Suisse | ||||||||||||||||||||||||||||||||||||
| in / end of period | 1Q12 | 4Q11 | 1Q11 | 1Q12 | 4Q11 | 1Q11 | 1Q12 | 4Q11 | 1Q11 | 1Q12 | 4Q11 | 1Q11 | 1Q12 | 4Q11 | 1Q11 | 1Q12 | 4Q11 | 1Q11 | 1Q12 | 4Q11 | 1Q11 | ||||||||||||||||||||||
| Statements of operations (CHF million) | |||||||||||||||||||||||||||||||||||||||||||
| Net revenues | 2,651 | 2,575 | 2,897 | 4,140 | 1,113 | 5,066 | 663 | 458 | 594 | (1,576) | 327 | (744) | 5,878 | 4,473 | 7,813 | 169 | 15 | 343 | 6,047 | 4,488 | 8,156 | ||||||||||||||||||||||
| Provision for credit losses | 40 | 75 | 12 | (6) | 22 | (19) | 0 | 0 | 0 | 0 | 0 | 0 | 34 | 97 | (7) | 0 | 0 | 0 | 34 | 97 | (7) | ||||||||||||||||||||||
| Compensation and benefits | 1,214 | 1,127 | 1,224 | 2,063 | 1,364 | 2,408 | 263 | 204 | 260 | 167 | 328 | 133 | 3,707 | 3,023 | 4,025 | 4 | (2) | 4 | 3,711 | 3,021 | 4,029 | ||||||||||||||||||||||
| General and administrative expenses | 621 | 757 | 621 | 840 | 890 | 887 | 118 | 130 | 125 | 67 | 94 | 1 | 1,646 | 1,871 | 1,634 | 7 | 8 | (2) | 1,653 | 1,879 | 1,632 | ||||||||||||||||||||||
| Commission expenses | 151 | 148 | 184 | 250 | 280 | 310 | 32 | 34 | 34 | 18 | 18 | 8 | 451 | 480 | 536 | 0 | 0 | 0 | 451 | 480 | 536 | ||||||||||||||||||||||
| Total other operating expenses | 772 | 905 | 805 | 1,090 | 1,170 | 1,197 | 150 | 164 | 159 | 85 | 112 | 9 | 2,097 | 2,351 | 2,170 | 7 | 8 | (2) | 2,104 | 2,359 | 2,168 | ||||||||||||||||||||||
| Total operating expenses | 1,986 | 2,032 | 2,029 | 3,153 | 2,534 | 3,605 | 413 | 368 | 419 | 252 | 440 | 142 | 5,804 | 5,374 | 6,195 | 11 | 6 | 2 | 5,815 | 5,380 | 6,197 | ||||||||||||||||||||||
| Income/(loss) before taxes | 625 | 468 | 856 | 993 | (1,443) | 1,480 | 250 | 90 | 175 | (1,828) | (113) | (886) | 40 | (998) | 1,625 | 158 | 9 | 341 | 198 | (989) | 1,966 | ||||||||||||||||||||||
| Income tax expense/(benefit) | – | – | – | – | – | – | – | – | – | – | – | – | (16) | (397) | 465 | 0 | 0 | 0 | (16) | (397) | 465 | ||||||||||||||||||||||
| Net income/(loss) | – | – | – | – | – | – | – | – | – | – | – | – | 56 | (601) | 1,160 | 158 | 9 | 341 | 214 | (592) | 1,501 | ||||||||||||||||||||||
| Net income/(loss) attributable to noncontrolling interests | – | – | – | – | – | – | – | – | – | – | – | – | 12 | 36 | 21 | 158 | 9 | 341 | 170 | 45 | 362 | ||||||||||||||||||||||
| Net income/(loss) attributable to shareholders | – | – | – | – | – | – | – | – | – | – | – | – | 44 | (637) | 1,139 | – | – | – | 44 | (637) | 1,139 | ||||||||||||||||||||||
| Statement of operations metrics (%) | |||||||||||||||||||||||||||||||||||||||||||
| Cost/income ratio | 74.9 | 78.9 | 70.0 | 76.2 | 227.7 | 71.2 | 62.3 | 80.3 | 70.5 | – | – | – | 98.7 | 120.1 | 79.3 | – | – | – | 96.2 | 119.9 | 76.0 | ||||||||||||||||||||||
| Pre-tax income margin | 23.6 | 18.2 | 29.5 | 24.0 | (129.6) | 29.2 | 37.7 | 19.7 | 29.5 | – | – | – | 0.7 | (22.3) | 20.8 | – | – | – | 3.3 | (22.0) | 24.1 | ||||||||||||||||||||||
| Effective tax rate | – | – | – | – | – | – | – | – | – | – | – | – | (40.0) | 39.8 | 28.6 | – | – | – | (8.1) | 40.1 | 23.7 | ||||||||||||||||||||||
| Net income margin | – | – | – | – | – | – | – | – | – | – | – | – | 0.7 | (14.2) | 14.6 | – | – | – | 0.7 | (14.2) | 14.0 | ||||||||||||||||||||||
| Utilized economic capital and return | |||||||||||||||||||||||||||||||||||||||||||
| Average utilized economic capital (CHF million) | 7,374 | 7,365 | 6,846 | 19,670 | 19,813 | 19,243 | 3,145 | 3,207 | 3,337 | 1,932 | 2 | 1,924 | 2 | 1,109 | 2 | 32,109 | 32,303 | 30,516 | – | – | – | 32,109 | 32,303 | 30,516 | |||||||||||||||||||
| Pre-tax return on average utilized economic capital (%) 3 | 34.2 | 25.7 | 50.4 | 20.9 | (28.5) | 31.3 | 33.2 | 12.5 | 22.0 | – | – | – | 1.1 | (11.7) | 21.9 | – | – | – | 3.1 | (11.6) | 26.3 | ||||||||||||||||||||||
| Balance sheet statistics (CHF million) | |||||||||||||||||||||||||||||||||||||||||||
| Total assets | 353,899 | 350,955 | 341,581 | 756,305 | 804,420 | 779,218 | 27,213 | 28,667 | 28,275 | (141,995) | 4 | (139,626) | 4 | (138,996) | 4 | 995,422 | 1,044,416 | 1,010,078 | 4,598 | 4,749 | 6,390 | 1,000,020 | 1,049,165 | 1,016,468 | |||||||||||||||||||
| Net loans | 197,566 | 196,268 | 185,795 | 34,063 | 37,134 | 36,721 | – | – | – | 67 | 11 | (6) | 231,696 | 233,413 | 222,510 | – | – | – | 231,696 | 233,413 | 222,510 | ||||||||||||||||||||||
| Goodwill | 735 | 743 | 749 | 6,165 | 6,363 | 6,226 | 1,433 | 1,485 | 1,458 | – | – | – | 8,333 | 8,591 | 8,433 | – | – | – | 8,333 | 8,591 | 8,433 | ||||||||||||||||||||||
| Number of employees (full-time equivalents)�� | |||||||||||||||||||||||||||||||||||||||||||
| Number of employees | 24,400 | 25,200 | 25,600 | 20,700 | 20,900 | 20,800 | 2,700 | 2,700 | 2,800 | 900 | 900 | 900 | 48,700 | 49,700 | 50,100 | – | – | – | 48,700 | 49,700 | 50,100 | ||||||||||||||||||||||
| 1 Core Results include the results of our integrated banking business, excluding revenues and expenses in respect of noncontrolling interests without SEI. 2 Includes diversification benefit. 3 Calculated using a return excluding interest costs for allocated goodwill. 4 Under the central treasury model, Group financing results in intra-Group balances between the segments. The elimination of these assets and liabilities occurs in the Corporate Center. | |||||||||||||||||||||||||||||||||||||||||||
| Key performance indicators |
| Our key performance indicators (KPIs) are targets to be achieved over a three to five year period across market cycles. As such, year-to-date results may be more meaningful than individual quarterly results. Our KPIs are assessed annually as part of our normal planning process. |
| in / end of | Target | 1Q12 | 2011 | 2010 | 2009 | ||||||
| Growth (%) | |||||||||||
| Collaboration revenues | 18 - 20% of net revenues | 16.1 | 16.8 | 14.4 | 15.5 | ||||||
| Net new asset growth (annualized) | Above 6% | (2.3) | 3.3 | 5.6 | 4.0 | ||||||
| Efficiency and performance (%) | |||||||||||
| Total shareholder return (Credit Suisse) 1 | Superior return vs. peer group | 16.6 | (39.4) | (23.3) | 80.1 | ||||||
| Total shareholder return of peer group 1, 2 | – | 31.7 | (35.0) | (1.7) | 36.6 | ||||||
| Return on equity attributable to shareholders (annualized) | Above 15% | 0.5 | 6.0 | 14.4 | 18.3 | ||||||
| Core Results pre-tax income margin | Above 28% | 0.7 | 10.8 | 22.2 | 25.5 | ||||||
| Capital (%) | |||||||||||
| Tier 1 ratio (Basel II.5) | Compliance with Swiss "Too Big to Fail" and Basel III | 15.6 | 15.2 | 14.2 | – | ||||||
| 1 Source: Bloomberg. Total shareholder return is calculated as equal to the appreciation or depreciation of a particular share, plus any dividends, over a given period, expressed as a percentage of the share's value at the beginning of the period. 2 The peer group for this comparison comprises Bank of America, Barclays, BNP Paribas, Citigroup, Deutsche Bank, HSBC, JPMorgan Chase, Société Générale and UBS. The total shareholder return of this peer group is calculated as a simple, unweighted average of the return reported by Bloomberg for each of the members of the peer group. | |||||||||||
Information and developments |
| In managing the business, revenues are evaluated in the aggregate, including an assessment of trading gains and losses and the related interest income and expense from financing and hedging positions. For this reason, individual revenue categories may not be indicative of performance. |
| As the Basel Committee on Banking Supervision (BCBS) Basel III framework (Basel III) will not be implemented before January 1, 2013, we have calculated our Basel III risk-weighted assets and capital for purposes of this report in accordance with the currently proposed requirements and our current interpretation of such requirements, including relevant assumptions. Changes in the actual implementation of Basel III would result in different numbers from those shown in this report. |
Progress on strategy implementation |
| In light of increasing regulatory and capital requirements and continued challenging market and economic conditions, we announced that we are adapting our client-focused, capital-efficient strategy to optimize our use of capital and improve our cost structure in order to sustain returns for shareholders. |
| In Private Banking, we made good progress in implementing the initiatives we announced in November 2011 to optimize Private Banking’s business portfolio and enhance profitability, in particular the integration of Clariden Leu. The merger with Clariden Leu was completed on April 2, 2012. |
| In Investment Banking, we further reduced Basel III risk-weighted assets by 15%, or USD 38 billion, to USD 210 billion. USD 33 billion of the reduction was achieved within our fixed income businesses, primarily in our wind-down portfolio. This included continued reduction of trades and positions in global rates, global credit products, emerging markets and legacy positions. In addition, we reduced risk-weighted assets in our ongoing businesses, primarily through the sale of client inventory positions in securitized products, and through a combination of external hedges and other mitigation measures such as the PAF2 transaction. |
| > Refer to “Strategy” in I – Information on the company in the Credit Suisse Annual Report 2011 for further information. |
Hedging-Griffo |
| In November 2007, Banco de Investimentos Credit Suisse (Brasil) S.A. (Credit Suisse Brazil), a wholly owned subsidiary of Credit Suisse AG, acquired a majority interest (50% plus one share) in Hedging-Griffo Investimentos S.A. (Hedging-Griffo), a leading independent asset management and private banking company in Brazil, and entered into option arrangements in respect of the remaining equity interests in Hedging-Griffo. Credit Suisse Brazil intends to acquire the remaining equity interests in Hedging-Griffo as contemplated under the existing option arrangements. The closing of such acquisition will be subject to regulatory approvals. The costs associated with the acquisition will be covered by an issuance of new Group shares (approximately 2% of the issued share capital) out of the Group’s authorized share capital in accordance with its articles of association. This share issuance is currently planned for June 2012 and the newly issued shares will be sold in the market shortly thereafter. |
Compensation and benefits |
| Compensation and benefits for a given year reflect the strength and breadth of the business results and staffing levels and include fixed components, such as salaries, benefits and the amortization of share-based and other deferred compensation from prior-year awards, and a discretionary variable component. The variable component reflects the performance-based variable compensation for the current year. The portion of the performance-based compensation for the current year deferred through share-based and other awards is expensed in future periods and is subject to vesting and other conditions. |
| Deferred compensation for 2011 was awarded in the form of Group shares and PAF2 awards. The PAF2 awards fully vested and compensation expense of CHF 534 million was recognized in 1Q12. |
| > Refer to “Compensation and benefits” in II – Operating and financial review – Core Results in the Credit Suisse Annual Report 2011 for further information. |
Regulatory developments and proposals |
| Government leaders and regulators continued to focus on reform of the financial services industry, including capital, leverage and liquidity requirements, changes in compensation practices and systemic risk. |
| In April 2012, Switzerland and Austria signed a bilateral tax agreement that would regularize assets in Switzerland of Austrian residents, similar in principle to the tax agreements Switzerland recently signed with Germany and the UK. The agreement remains subject to parliamentary approval by the contracting countries. |
| > Refer to “Regulation and supervision” in I – Information on the company in the Credit Suisse Annual Report 2011 for further information. |
Allocations and funding |
| Responsibility for each product is allocated to a segment, which records all related revenues and expenses. Revenue-sharing and service level agreements, which aim to reflect the pricing structure of unrelated third-party transactions, govern the compensation received by one segment for generating revenue or providing services on behalf of another. Corporate services and business support are provided by the Shared Services area and these costs are allocated to the segments and Corporate Center based on their requirements and other relevant measures. |
| We centrally manage our funding activities, with new securities for funding and capital purposes issued primarily by the Bank which lends funds to our operating subsidiaries and affiliates. Capital is distributed to the segments considering factors such as regulatory capital requirements, utilized economic capital and the historic and future potential return on capital. Transfer pricing, using market rates, is used to record net revenues and expenses relating to this funding in each of the segments, and our businesses are also credited to the extent they provide long-term stable funding. |
| > Refer to “Allocations and funding” in II – Operating and financial review – Core Results in the Credit Suisse Annual Report 2011 for further information. |
Fair valuations |
| Fair value can be a relevant measurement for financial instruments when it aligns the accounting for these instruments with how we manage our business. The levels of the fair value hierarchy as defined by the relevant accounting guidance are not a measurement of economic risk, but rather an indication of the observability of prices or valuation inputs. |
| The Financial Report 1Q12, including additional disclosures on fair value of financial instruments, will be published on our website and filed with the US Securities and Exchange Commission (SEC) on or about May 8, 2012. |
| > Refer to “Note 1 – Summary of significant accounting policies” and “Note 26 – Financial instruments” in III – Condensed consolidated financial statements – unaudited for further information. |
Personnel |
| Headcount at the end of 1Q12 was 48,700, down 1,000 from 4Q11 and down 1,400 from 1Q11. This reflected reductions in headcount in connection with our cost efficiency initiatives. |
| Number of employees by division | |||||||||||
| end of | % change | ||||||||||
| 1Q12 | 4Q11 | 1Q11 | QoQ | YoY | |||||||
| Number of employees by division (full-time equivalents) | |||||||||||
| Private Banking | 24,400 | 25,200 | 25,600 | (3) | (5) | ||||||
| Investment Banking | 20,700 | 20,900 | 20,800 | (1) | 0 | ||||||
| Asset Management | 2,700 | 2,700 | 2,800 | 0 | (4) | ||||||
| Corporate Center | 900 | 900 | 900 | 0 | 0 | ||||||
| Number of employees | 48,700 | 1 | 49,700 | 50,100 | (2) | (3) | |||||
| 1 Excludes 1,400 employees in connection with the cost efficiency initiatives. | |||||||||||
Private Banking |
| In 1Q12, we reported income before taxes of CHF 625 million and net revenues of CHF 2,651 million. |
| Net revenues increased 3% from 4Q11, driven by higher transaction-based revenues which increased 15%, reflecting continued low but improved client activity. However, net revenues were 8% lower compared to 1Q11. |
| Total operating expenses reflected the progress on our cost efficiency measures and decreased slightly compared to both 1Q11 and 4Q11. Compensation and benefits included the deferred compensation expense of CHF 67 million from the PAF2 awards, which were granted and expensed in 1Q12. General and administrative expenses were stable compared to 1Q11 and decreased 18% compared to 4Q11. |
| Provision for credit losses were CHF 40 million on our net loan portfolio of CHF 198 billion. |
| Our headcount was 1,200 lower compared to 1Q11 in line with our efficiency measures. In comparison to 4Q11 our headcount decreased 800. |
| In 1Q12, we attracted solid net new assets of CHF 8.4 billion, of which Wealth Management Clients contributed CHF 5.8 billion, driven by inflows from our UHNWI client segment and emerging markets. Wealth Management Clients in Switzerland reported net new assets of CHF 3.3 billion excluding outflows of CHF 4.1 billion related to the integration of Clariden Leu. Corporate & Institutional Clients in Switzerland contributed net new assets of CHF 2.6 billion. |
| Results | |||||||||||
| in / end of | % change | ||||||||||
| 1Q12 | 4Q11 | 1Q11 | QoQ | YoY | |||||||
| Statements of operations (CHF million) | |||||||||||
| Net revenues | 2,651 | 2,575 | 2,897 | 3 | (8) | ||||||
| Provision for credit losses | 40 | 75 | 12 | (47) | 233 | ||||||
| Compensation and benefits | 1,214 | 1,127 | 1,224 | 8 | (1) | ||||||
| General and administrative expenses | 621 | 757 | 621 | (18) | 0 | ||||||
| Commission expenses | 151 | 148 | 184 | 2 | (18) | ||||||
| Total other operating expenses | 772 | 905 | 805 | (15) | (4) | ||||||
| Total operating expenses | 1,986 | 2,032 | 2,029 | (2) | (2) | ||||||
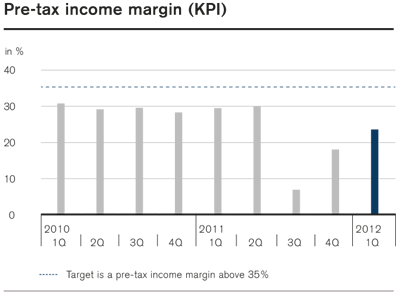
| Income before taxes | 625 | 468 | 856 | 34 | (27) | ||||||
| of which Wealth Management Clients | 406 | 285 | 624 | 42 | (35) | ||||||
| of which Corporate & Institutional Clients | 219 | 183 | 232 | 20 | (6) | ||||||
| Statement of operations metrics (%) | |||||||||||
| Cost/income ratio | 74.9 | 78.9 | 70.0 | – | – | ||||||
| Pre-tax income margin | 23.6 | 18.2 | 29.5 | – | – | ||||||
| Utilized economic capital and return | |||||||||||
| Average utilized economic capital (CHF million) | 7,374 | 7,365 | 6,846 | 0 | 8 | ||||||
| Pre-tax return on average utilized economic capital (%) 1 | 34.2 | 25.7 | 50.4 | – | – | ||||||
| Number of employees (full-time equivalents) | |||||||||||
| Number of employees | 24,400 | 25,200 | 25,600 | (3) | (5) | ||||||
| 1 Calculated using a return excluding interest costs for allocated goodwill. | |||||||||||
| Results (continued) | |||||||||||
| in / end of | % change | ||||||||||
| 1Q12 | 4Q11 | 1Q11 | QoQ | YoY | |||||||
| Net revenue detail (CHF million) | |||||||||||
| Net interest income | 1,168 | 1,167 | 1,176 | 0 | (1) | ||||||
| Recurring commissions and fees | 908 | 910 | 1,007 | 0 | (10) | ||||||
| Transaction-based | 575 | 498 | 714 | 15 | (19) | ||||||
| Net revenues | 2,651 | 2,575 | 2,897 | 3 | (8) | ||||||
| Provision for credit losses (CHF million) | |||||||||||
| New provisions | 81 | 126 | 41 | (36) | 98 | ||||||
| Releases of provisions | (41) | (51) | (29) | (20) | 41 | ||||||
| Provision for credit losses | 40 | 75 | 12 | (47) | 233 | ||||||
| Balance sheet statistics (CHF million) | |||||||||||
| Net loans | 197,566 | 196,268 | 185,795 | 1 | 6 | ||||||
| of which Wealth Management Clients 1 | 140,321 | 139,725 | 133,466 | 0 | 5 | ||||||
| of which Corporate & Institutional Clients | 57,245 | 56,543 | 52,329 | 1 | 9 | ||||||
| Deposits | 258,025 | 257,521 | 248,090 | 0 | 4 | ||||||
| of which Wealth Management Clients 1 | 203,856 | 203,350 | 197,802 | 0 | 3 | ||||||
| of which Corporate & Institutional Clients | 54,169 | 54,171 | 50,288 | 0 | 8 | ||||||
| Number of relationship managers | |||||||||||
| Switzerland | 1,760 | 1,950 | 2,050 | (10) | (14) | ||||||
| EMEA | 1,250 | 1,180 | 1,240 | 6 | 1 | ||||||
| Americas | 560 | 550 | 550 | 2 | 2 | ||||||
| Asia Pacific | 360 | 360 | 360 | 0 | 0 | ||||||
| Wealth Management Clients | 3,930 | 4,040 | 4,200 | (3) | (6) | ||||||
| Corporate & Institutional Clients (Switzerland) | 540 | 520 | 490 | 4 | 10 | ||||||
| Number of relationship managers | 4,470 | 4,560 | 4,690 | (2) | (5) | ||||||
| 1 Wealth Management Clients covers individual clients, including affluent, high-net-worth and ultra-high-net-worth individual clients. | |||||||||||
Results detail |
| The following provides a comparison of our 1Q12 results versus 1Q11 (YoY) and versus 4Q11 (QoQ). |
Net revenues |
| Recurring revenues arise from net interest income, recurring commissions and fees, including performance-based fees, related to assets under management and custody assets, as well as fees for general banking products and services. Net interest income includes a term spread credit on stable deposit funding and a term spread charge on loans. Transaction-based revenues arise primarily from brokerage and product issuing fees, foreign exchange income from client transactions and other transaction-based income. |
| YoY: Down 8% from CHF 2,897 million to CHF 2,651 million |
| The decrease in net revenues was mainly driven by lower transaction-based revenues. Net interest income was stable, as lower deposit and loan margins were offset by higher average deposit and loan volumes. Lower margins reflected the ongoing low interest rate environment with a relatively flat interest rate curve. Recurring commissions and fees declined 10% due to lower revenues across most revenue categories, particularly due to lower investment product management fees, lower discretionary mandates management fees, and lower investment account and services fees. Transaction-based revenues were 19% lower, driven by lower brokerage and product issuing fees, reflecting significantly lower client activity and lower transaction-based volumes across all product lines. Transaction-based revenues included fair value losses on the Clock Finance transaction of CHF 16 million compared to fair value losses of CHF 11 million in 1Q11. |
| QoQ: Up 3% from CHF 2,575 million to CHF 2,651 million |
| The slight increase in net revenues was mainly driven by higher transaction-based revenues. Net interest income was stable, reflecting slightly lower deposit and loan margins on stable average deposit and loan volumes. Recurring commissions and fees were stable, as higher banking services fees were mainly offset by lower investment product management fees. Transaction-based revenues increased 15%, mainly due to higher brokerage and product issuing fees, reflecting continued low but improved client activity and related transaction-based volumes across all product lines. Transaction-based revenues included fair value losses on the Clock Finance transaction of CHF 16 million compared to fair value losses of CHF 8 million in 4Q11. |
Provision for credit losses |
| The Wealth Management Clients loan portfolio is substantially comprised of residential mortgages in Switzerland and loans collateralized by securities. Our corporate and institutional loan portfolio has relatively low concentrations and is mainly secured by mortgages, securities and other financial collateral. |
| YoY: Up from CHF 12 million to CHF 40 million |
| Wealth Management Clients recorded net provisions of CHF 22 million and Corporate & Institutional Clients recorded net provisions of CHF 18 million. Provision for credit losses reflected mainly higher new provisions, resulting from isolated cases in both Wealth Management Clients and Corporate & Institutional Clients. |
| QoQ: Down from CHF 75 million to CHF 40 million |
| Provision for credit losses reflected mainly lower new provisions. In 4Q11, Wealth Management Clients recorded net provisions of CHF 43 million and Corporate & Institutional Clients recorded net provisions of CHF 32 million. |
Operating expenses |
| Compensation and benefits |
| YoY: Stable at CHF 1,214 million compared to CHF 1,224 million |
| Compensation and benefits were stable as measures from our cost efficiency initiative were offset by deferred compensation expense of CHF 67 million from the PAF2 awards, which were granted and expensed in 1Q12. Discretionary performance-related compensation accruals decreased, reflecting lower business performance. |
| QoQ: Up 8% from CHF 1,127 million to CHF 1,214 million |
| The increase reflected deferred compensation expense from the PAF2 awards and higher discretionary performance-related compensation accruals, partially offset by measures from our cost efficiency initiative. |
| General and administrative expenses |
| YoY: Stable at CHF 621 million |
| General and administrative expenses were stable as higher premises and equipment expenses and legal and professional fees were offset by lower expenses in all other categories. |
| QoQ: Down 18% from CHF 757 million to CHF 621 million |
| The decrease was mainly driven by lower legal and professional fees, lower costs related to regulatory requirements and lower non-credit-related provisions and losses. |
Assets under management |
| Overall, assets under management continued to reflect a risk-averse asset mix, with investments in less complex, lower-margin products, also within managed investment products, and a significant portion of assets in cash and money market products. |
| Assets under management of CHF 957.7 billion were CHF 29.8 billion higher compared to the end of 4Q11, driven by positive market movements and net new assets of CHF 8.4 billion which were partially offset by an adverse foreign exchange impact. Wealth Management Clients contributed solid net new assets of CHF 5.8 billion, particularly from our UHNWI client segment and emerging markets. Wealth Management Clients in Switzerland reported net new assets of CHF 3.3 billion excluding outflows of CHF 4.1 billion related to the integration of Clariden Leu. Corporate & Institutional Clients in Switzerland acquired solid net new assets of CHF 2.6 billion. Average assets under management of Wealth Management Clients increased 3.5% compared to 4Q11. |
| Assets under management were stable at CHF 957.7 billion compared to the end of 1Q11, as net new assets were offset by an adverse foreign exchange impact and negative market movements. Average assets under management in Wealth Management Clients decreased 2.3% compared to 1Q11. |
| Assets under management - Private Banking | |||||||||||
| in / end of | % change | ||||||||||
| 1Q12 | 4Q11 | 1Q11 | QoQ | YoY | |||||||
| Assets under management by region (CHF billion) | |||||||||||
| Switzerland | 301.4 | 305.2 | 331.0 | (1.2) | (8.9) | ||||||
| EMEA | 272.9 | 262.4 | 277.1 | 4.0 | (1.5) | ||||||
| Americas | 151.9 | 140.9 | 139.4 | 7.8 | 9.0 | ||||||
| Asia Pacific | 88.3 | 83.0 | 82.1 | 6.4 | 7.6 | ||||||
| Wealth Management Clients | 814.5 | 791.5 | 829.6 | 2.9 | (1.8) | ||||||
| Corporate & Institutional Clients (Switzerland) | 143.2 | 136.4 | 128.3 | 5.0 | 11.6 | ||||||
| Assets under management | 957.7 | 927.9 | 957.9 | 3.2 | 0.0 | ||||||
| Average assets under management (CHF billion) | |||||||||||
| Average assets under management | 945.1 | 910.3 | 951.0 | 3.8 | (0.6) | ||||||
| Assets under management by currency (CHF billion) | |||||||||||
| USD | 302.7 | 296.6 | 303.3 | 2.1 | (0.2) | ||||||
| EUR | 207.3 | 204.5 | 228.4 | 1.4 | (9.2) | ||||||
| CHF | 310.4 | 296.2 | 297.6 | 4.8 | 4.3 | ||||||
| Other | 137.3 | 130.6 | 128.6 | 5.1 | 6.8 | ||||||
| Assets under management | 957.7 | 927.9 | 957.9 | 3.2 | 0.0 | ||||||
| Net new assets by region (CHF billion) | |||||||||||
| Switzerland | (0.8) | (2.3) | 4.7 | (65.2) | – | ||||||
| EMEA | (0.9) | 4.1 | 4.0 | – | – | ||||||
| Americas | 4.3 | 1.3 | 3.0 | 230.8 | 43.3 | ||||||
| Asia Pacific | 3.2 | 0.9 | 4.0 | 255.6 | (20.0) | ||||||
| Wealth Management Clients | 5.8 | 4.0 | 15.7 | 45.0 | (63.1) | ||||||
| Corporate & Institutional Clients (Switzerland) | 2.6 | 3.6 | 2.3 | (27.8) | 13.0 | ||||||
| Net new assets | 8.4 | 7.6 | 18.0 | 10.5 | (53.3) | ||||||
| Growth in assets under management (CHF billion) | |||||||||||
| Net new assets | 5.8 | 4.0 | 15.7 | – | – | ||||||
| Other effects | 17.2 | 25.4 | 5.9 | – | – | ||||||
| of which market movements | 35.0 | 14.6 | 7.4 | – | – | ||||||
| of which currency | (16.0) | 12.2 | 0.1 | – | – | ||||||
| of which other | (1.8) | (1.4) | (1.6) | – | – | ||||||
| Wealth Management Clients | 23.0 | 29.4 | 21.6 | – | – | ||||||
| Corporate & Institutional Clients | 6.8 | 7.1 | 3.4 | – | – | ||||||
| Growth in assets under management | 29.8 | 36.5 | 25.0 | – | – | ||||||
| Growth in assets under management (annualized) (%) | |||||||||||
| Net new assets | 3.6 | 3.4 | 7.7 | – | – | ||||||
| of which Wealth Management Clients | 2.9 | 2.1 | 7.8 | – | – | ||||||
| of which Corporate & Institutional Clients | 7.6 | 11.1 | 7.4 | – | – | ||||||
| Other effects | 9.2 | 13.0 | 3.0 | – | – | ||||||
| Growth in assets under management | 12.8 | 16.4 | 10.7 | – | – | ||||||
| Growth in assets under management (rolling four-quarter average) (%) | |||||||||||
| Net new assets | 3.6 | 4.8 | 5.7 | – | – | ||||||
| of which Wealth Management Clients | 3.4 | 4.7 | 5.8 | – | – | ||||||
| of which Corporate & Institutional Clients | 5.5 | 5.4 | 4.9 | – | – | ||||||
| Other effects | (3.7) | (5.3) | (4.4) | – | – | ||||||
| Growth in assets under management (rolling four-quarter average) | (0.1) | (0.5) | 1.3 | – | – | ||||||
Progress on strategy implementation |
| We made good progress in implementing the initiatives we announced in November 2011 to optimize Private Banking’s business portfolio and enhance profitability, in particular the integration of Clariden Leu. The merger with Clariden Leu was completed on April 2, 2012. Most of Clariden Leu’s business activities remain in Private Banking, while some selected businesses will be managed by other divisions going forward. The further process of integrating Clariden Leu business activities is expected to be completed by the end of 2012. |
Wealth Management Clients |
Net revenues |
| Net interest income |
| YoY: Stable at CHF 868 million compared to CHF 880 million |
| Net interest income was stable, as lower deposit and loan margins were offset by slightly higher average deposit volumes and higher average loan volumes. Average deposit volumes increased despite slightly lower average US dollar and euro exchange rates against the Swiss franc. |
| QoQ: Stable at CHF 868 million compared to CHF 863 million |
| Stable net interest income reflected slightly lower deposit and loan margins on stable average deposit and loan volumes. |
| Recurring commissions and fees |
| YoY: Down 12% from CHF 904 million to CHF 799 million |
| Recurring commissions and fees decreased primarily due to lower investment product management fees, discretionary mandate management fees and investment account and services fees. |
| QoQ: Down 3% from CHF 821 million to CHF 799 million |
| The slight decline in recurring commissions and fees reflected clients moving towards a more conservative risk profile within their asset allocation, resulting in lower investment product management fees. |
| Transaction-based |
| YoY: Down 20% from CHF 650 million to CHF 518 million |
| The decline was driven by substantially lower brokerage and product issuing fees, reflecting significantly lower client activity and lower transaction-based volumes mainly in equities, mutual funds and structured products. |
| QoQ: Up 19% from CHF 436 million to CHF 518 million |
| The increase was mainly due to higher brokerage and product issuing fees, reflecting continued low but improved client activity, and higher transaction-based volumes mainly in equities, bonds and structured products. |
Gross margin |
| Our gross margin was 109 basis points in 1Q12, 9 basis points lower than in 1Q11, mainly reflecting the substantially lower transaction-based revenues. Compared to 4Q11, the gross margin was stable. |
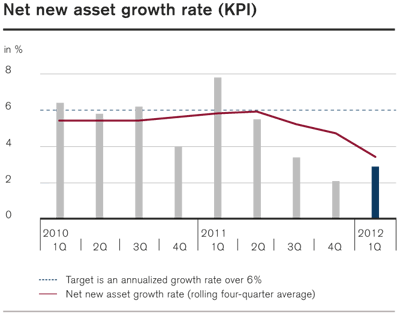
| Results - Wealth Management Clients | |||||||||||
| in / end of | % change | ||||||||||
| 1Q12 | 4Q11 | 1Q11 | QoQ | YoY | |||||||
| Statements of operations (CHF million) | |||||||||||
| Net revenues | 2,185 | 2,120 | 2,434 | 3 | (10) | ||||||
| Provision for credit losses | 22 | 43 | 12 | (49) | 83 | ||||||
| Total operating expenses | 1,757 | 1,792 | 1,798 | (2) | (2) | ||||||
| Income/(loss) before taxes | 406 | 285 | 624 | 42 | (35) | ||||||
| Statement of operations metrics (%) | |||||||||||
| Cost/income ratio | 80.4 | 84.5 | 73.9 | – | – | ||||||
| Pre-tax income margin | 18.6 | 13.4 | 25.6 | – | – | ||||||
| Net revenue detail (CHF million) | |||||||||||
| Net interest income | 868 | 863 | 880 | 1 | (1) | ||||||
| Recurring commissions and fees | 799 | 821 | 904 | (3) | (12) | ||||||
| Transaction-based | 518 | 436 | 650 | 19 | (20) | ||||||
| Net revenues | 2,185 | 2,120 | 2,434 | 3 | (10) | ||||||
| Average assets under management (CHF billion) | |||||||||||
| Average assets under management | 805.1 | 777.5 | 824.2 | 3.5 | (2.3) | ||||||
| Gross margin (annualized) (bp) 1 | |||||||||||
| Net interest income | 43 | 44 | 43 | – | – | ||||||
| Recurring commissions and fees | 40 | 43 | 44 | – | – | ||||||
| Transaction-based | 26 | 22 | 31 | – | – | ||||||
| Gross margin | 109 | 109 | 118 | – | – | ||||||
| 1 Net revenues divided by average assets under management. | |||||||||||
Corporate & Institutional Clients |
Net revenues |
| Net interest income |
| YoY: Stable at CHF 300 million compared to CHF 296 million |
| Stable net interest income reflected lower deposit margins on higher average volumes and stable loan margins on higher average volumes. |
| QoQ: Stable at CHF 300 million compared to CHF 304 million |
| Stable net interest income reflected stable deposit margins on slightly lower average volumes and slightly lower loan margins on stable average volumes. |
| Recurring commission and fees |
| YoY: Up 6% from CHF 103 million to CHF 109 million |
| The increase primarily resulted from higher banking services fees and higher investment account and services fees. |
| QoQ: Up 22% from CHF 89 million to CHF 109 million |
| The increase was mainly due to higher banking services fees. |
| Transaction-based |
| YoY: Down 11% from CHF 64 million to CHF 57 million |
| The decrease was mainly driven by lower brokerage and product issuing fees, partially offset by higher revenues from integrated solutions. Transaction-based revenues included fair value losses on the Clock Finance transaction of CHF 16 million compared to fair value losses of CHF 11 million in 1Q11. |
| QoQ: Down 8% from CHF 62 million to CHF 57 million |
| The decrease was mainly driven by fair value losses on the Clock Finance transaction of CHF 16 million compared to fair value losses of CHF 8 million in 4Q11 and lower revenues from integrated solutions, partially offset by higher brokerage and product issuing fees in 1Q12. |
| Results - Corporate & Institutional Clients | |||||||||||
| in / end of | % change | ||||||||||
| 1Q12 | 4Q11 | 1Q11 | QoQ | YoY | |||||||
| Statements of operations (CHF million) | |||||||||||
| Net revenues | 466 | 455 | 463 | 2 | 1 | ||||||
| Provision for credit losses | 18 | 32 | 0 | (44) | – | ||||||
| Total operating expenses | 229 | 240 | 231 | (5) | (1) | ||||||
| Income before taxes | 219 | 183 | 232 | 20 | (6) | ||||||
| Statement of operations metrics (%) | |||||||||||
| Cost/income ratio | 49.1 | 52.7 | 49.9 | – | – | ||||||
| Pre-tax income margin | 47.0 | 40.2 | 50.1 | – | – | ||||||
| Net revenue detail (CHF million) | |||||||||||
| Net interest income | 300 | 304 | 296 | (1) | 1 | ||||||
| Recurring commissions and fees | 109 | 89 | 103 | 22 | 6 | ||||||
| Transaction-based | 57 | 62 | 64 | (8) | (11) | ||||||
| Net revenues | 466 | 455 | 463 | 2 | 1 | ||||||
Investment Banking |
| We reported income before taxes of CHF 993 million and net revenues of CHF 4,140 million. |
| In 1Q12, consistent with the execution of our refined strategy, we further reduced Basel III risk-weighted assets by USD 38 billion to USD 210 billion. |
| Fixed income sales and trading revenues were significantly higher than 4Q11, driven by client franchise momentum, improved trading conditions and better client flow. We had more balanced results among our macro businesses (global rates and foreign exchange), securitized products and global credit products. We also had a strong performance in emerging markets. Relative to 1Q11, revenues declined 21%, primarily due to a record quarter for securitized products in 1Q11, which benefited from higher inventory levels, and losses incurred in 1Q12 from businesses we are exiting. In 1Q12, we reduced fixed income Basel III risk-weighted assets by 45% from a year ago while revenues declined substantially less, demonstrating improved capital efficiency and resource allocation as a result of our refined strategy. |
| Equity sales and trading revenues were solid, despite sustained weak trading volumes, reflecting stable market share positions across key businesses such as prime services and cash equities. A significant improvement in derivatives over 4Q11 was driven by improved market conditions and stronger customer flows. |
| Underwriting and advisory results recovered from a weak 4Q11 due to market share momentum and strong results in debt underwriting, reflecting an increase in new issue activity in high yield and investment grade. |
| Compensation and benefits in 1Q12 were lower than 1Q11, primarily reflecting lower discretionary performance-related compensation expense, but higher than 4Q11, driven by higher deferred compensation expense of CHF 418 million from the PAF2 awards. Total other operating expenses declined from 1Q11 and 4Q11. |
| Results | |||||||||||
| in / end of | % change | ||||||||||
| 1Q12 | 4Q11 | 1Q11 | QoQ | YoY | |||||||
| Statements of operations (CHF million) | |||||||||||
| Net revenues 1 | 4,140 | 1,113 | 5,066 | 272 | (18) | ||||||
| Provision for credit losses | (6) | 22 | (19) | – | (68) | ||||||
| Compensation and benefits | 2,063 | 1,364 | 2,408 | 51 | (14) | ||||||
| General and administrative expenses | 840 | 890 | 887 | (6) | (5) | ||||||
| Commission expenses | 250 | 280 | 310 | (11) | (19) | ||||||
| Total other operating expenses | 1,090 | 1,170 | 1,197 | (7) | (9) | ||||||
| Total operating expenses | 3,153 | 2,534 | 3,605 | 24 | (13) | ||||||
| Income/(loss) before taxes | 993 | (1,443) | 1,480 | – | (33) | ||||||
| Statement of operations metrics (%) | |||||||||||
| Cost/income ratio | 76.2 | 227.7 | 71.2 | – | – | ||||||
| Pre-tax income margin | 24.0 | (129.6) | 29.2 | – | – | ||||||
| Utilized economic capital and return | |||||||||||
| Average utilized economic capital (CHF million) | 19,670 | 19,813 | 19,243 | (1) | 2 | ||||||
| Pre-tax return on average utilized economic capital (%) 2 | 20.9 | (28.5) | 31.3 | – | – | ||||||
| Number of employees (full-time equivalents) | |||||||||||
| Number of employees | 20,700 | 20,900 | 20,800 | (1) | 0 | ||||||
| 1 Beginning in 1Q12, DVA relating to certain structured notes liabilities and fair value adjustments on Credit Suisse vanilla debt are reflected in the Corporate Center rather than in Investment Banking. As a result, Investment Banking revenues reflect reclassifications of CHF (138) million and CHF 137 million in 4Q11 and 1Q11, respectively, made to prior periods to conform to the current presentation. 2 Calculated using a return excluding interest costs for allocated goodwill. | |||||||||||
| Results (continued) | |||||||||||
| in / end of | % change | ||||||||||
| 1Q12 | 4Q11 | 1Q11 | QoQ | YoY | |||||||
| Net revenue detail (CHF million) | |||||||||||
| Debt underwriting | 428 | 229 | 501 | 87 | (15) | ||||||
| Equity underwriting | 120 | 111 | 201 | 8 | (40) | ||||||
| Total underwriting | 548 | 340 | 702 | 61 | (22) | ||||||
| Advisory and other fees | 213 | 176 | 228 | 21 | (7) | ||||||
| Total underwriting and advisory | 761 | 516 | 930 | 47 | (18) | ||||||
| Fixed income sales and trading | 2,024 | (105) | 2,560 | – | (21) | ||||||
| Equity sales and trading | 1,401 | 761 | 1,599 | 84 | (12) | ||||||
| Total sales and trading | 3,425 | 656 | 4,159 | 422 | (18) | ||||||
| Other | (46) | (59) | (23) | (22) | 100 | ||||||
| Net revenues | 4,140 | 1,113 | 5,066 | 272 | (18) | ||||||
| Average one-day, 98% risk management Value-at-Risk (CHF million) 1 | |||||||||||
| Interest rate & credit spread | 72 | 75 | 80 | (4) | (10) | ||||||
| Foreign exchange | 18 | 14 | 14 | 29 | 29 | ||||||
| Commodity | 4 | 3 | 18 | 33 | (78) | ||||||
| Equity | 22 | 23 | 23 | (4) | (4) | ||||||
| Diversification benefit | (48) | (38) | (58) | 26 | (17) | ||||||
| Average one-day, 98% risk management Value-at-Risk | 68 | 77 | 77 | (12) | (12) | ||||||
| Basel III risk-weighted assets (billion) 2, 3 | |||||||||||
| Risk-weighted assets (CHF) | 190 | 233 | 286 | (18) | (34) | ||||||
| Risk-weighted assets (USD) | 210 | 248 | 312 | (15) | (33) | ||||||
| 1 In June 2011, we made significant changes to our VaR methodology. Risk management VaR for periods prior to implementation has been restated in order to show meaningful trends. 2 Refer to "BIS statistics (Basel II.5)" in II – Treasury, risk, balance sheet and off-balance sheet – Treasury management for information on the currently applicable Basel II.5 framework. 3 As Basel III will not be implemented before January 1, 2013, we have calculated our Basel III risk-weighted assets and capital for purposes of this report in accordance with the currently proposed requirements and our current interpretation of such requirements, including relevant assumptions. Changes in the actual implementation of Basel III would result in different numbers from those shown in this report. | |||||||||||
Results detail |
| The following provides a comparison of our 1Q12 results versus 1Q11 (YoY) and versus 4Q11 (QoQ). Beginning in 1Q12, DVA relating to certain structured note liabilities and fair value adjustments on Credit Suisse vanilla debt are reflected in the Corporate Center rather than in Investment Banking. As a result, Investment Banking results reflect reclassifications made to prior periods to conform to the current presentation. |
Net revenues |
| Debt underwriting |
| YoY: Down 15% from CHF 501 million to CHF 428 million |
| The decrease was primarily due to weaker results from our leveraged finance business, reflecting a decrease in industry-wide high yield issuance activity and slightly lower market share. |
| QoQ: Up 87% from CHF 229 million to CHF 428 million |
| The increase was primarily due to improved performance in leveraged finance, reflecting significantly higher industry-wide high yield issuance activity, improved high yield market share and higher leveraged loan refinancing activity. We also had higher results in investment grade as industry-wide global issuance volumes were stronger. |
| Equity underwriting |
| YoY: Down 40% from CHF 201 million to CHF 120 million |
| The decrease was driven by lower revenues across all products, particularly follow-on offerings, reflecting significantly lower levels of industry-wide equity issuance volumes as market uncertainty remained high. |
| QoQ: Up 8% from CHF 111 million to CHF 120 million |
| The increase was driven by higher revenues from follow-on offerings and IPOs, reflecting improved market share and higher follow-on activity. |
| Advisory and other fees |
| YoY: Down 7% from CHF 228 million to CHF 213 million |
| The decrease reflected lower M&A and other advisory fees and lower private placement fees, consistent with the decline in global industry-wide completed M&A activity. |
| QoQ: Up 21% from CHF 176 million to CHF 213 million |
| The increase was mainly due to higher M&A advisory fees, reflecting an improvement in announced and completed M&A market share partly offset by lower levels of global industry-wide completed M&A activity. |
| Fixed income sales and trading |
| YoY: Down 21% from CHF 2,560 million to CHF 2,024 million |
| The decrease was primarily due to lower revenues in securitized products compared to a record 1Q11, as stable client revenues and higher revenues from our agency residential mortgage-backed securities (RMBS) trading business and asset finance were more than offset by significantly lower revenues from our non-agency RMBS trading business, reflecting a 34% reduction in client inventory levels for securitized products. We also had lower results in global credit products, as declines in leveraged finance and investment grade trading were partly offset by improved results in structured credit and strategic transactions. In addition, we had lower revenues in corporate lending. Results included improved revenues in emerging markets, foreign exchange and global rates, reflecting higher client activity. In the quarter, we incurred losses of CHF 261 million from businesses we are exiting. Fixed income Basel III risk-weighted assets were USD 146 billion, a reduction of 45% from a year ago, while revenues declined by only 21%. |
| QoQ: From CHF (105) million to CHF 2,024 million |
| The increase was driven by significant improvements in securitized products and global credit products, reflecting more favorable trading conditions and improved client activity. We had stronger revenues in global rates, emerging markets and foreign exchange, reflecting strong client momentum and results from our recent platform expansion. In 4Q11, results in securitized products were impacted by valuation reductions on client inventory, losses on sales of client inventory as we reduced risk, subdued client flow and unfavorable market movements on related hedges. Also in 4Q11, global credit products were impacted by valuation reductions on client inventory. In 1Q12, we incurred losses of CHF 261 million from businesses we are exiting, compared to losses of CHF 469 million in 4Q11, of which CHF 320 million related to businesses we are exiting and CHF 149 million from the reduction of risk-weighted assets. Fixed income Basel III risk-weighted assets were reduced by 19% from 4Q11. |
| Equity sales and trading |
| YoY: Down 12% from CHF 1,599 million to CHF 1,401 million |
| The decrease was driven by lower revenues in cash equities, reflecting reduced customer flow as industry trading volumes were lower than a year ago. We also had slightly lower revenues in our derivatives business compared to record revenues in 1Q11, due to weaker client volumes. Prime services revenues remained stable with continued strong market share. |
| QoQ: Up 84% from CHF 761 million to CHF 1,401 million |
| The increase was primarily driven by improved results in derivatives, reflecting a rebound in market conditions and stronger client flow. The increase was also driven by higher revenues in our cash equities, fund-linked products and convertibles businesses. We also had strong results in prime services, reflecting an increase in client balances. |
Provision for credit losses |
| YoY: From CHF (19) million to CHF (6) million |
| The change reflected lower releases and recoveries. |
| QoQ: From CHF 22 million to CHF (6) million |
| The change reflected lower provisions. |
Operating expenses |
| Compensation and benefits |
| YoY: Down 14% from CHF 2,408 million to CHF 2,063 million |
| The decrease reflected lower discretionary performance-related compensation expense, reflecting the lower results, lower salaries and benefits expense related to headcount reductions and lower social security taxes on share award settlements. These were partly offset by higher deferred compensation expense from prior year awards, reflecting CHF 418 million of expenses related to PAF2. |
| QoQ: Up 51% from CHF 1,364 million to CHF 2,063 million |
| The increase was driven by higher deferred compensation expense, reflecting CHF 418 million of expenses related to PAF2 and higher discretionary performance-related compensation expense, reflecting the improved results. |
| General and administrative expenses |
| YoY: Down 5% from CHF 887 million to CHF 840 million |
| The decrease was driven mainly by lower IT investment costs, legal fees and consulting fees. These were partly offset by a CHF 31 million accrual for the UK bank levy, which was enacted in 3Q11. 1Q11 expenses included charitable contributions in lieu of a portion of discretionary performance-related compensation for certain managing directors in the Americas. |
| QoQ: Down 6% from CHF 890 million to CHF 840 million |
| The decrease primarily reflected lower IT investment costs and legal fees. |
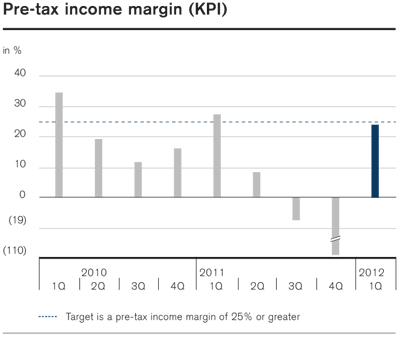
Market share momentum |
| – Ranked #3 byDealogic in global high yield debt issuance with 8.9% market share for 1Q12, up from #5 with 8.0% market share in 2011. |
| – Advanced to number four globally and top five in the Americas for completed M&A volumes byDealogic for 1Q12. |
Progress on strategy implementation |
| To date, we have made significant progress in executing our refined strategy announced in November 2011. In 1Q12, we further reduced Basel III risk-weighted assets by 15%, or USD 38 billion, to USD 210 billion. USD 33 billion of the reduction was achieved within our fixed income businesses, primarily in our wind-down portfolio. This included continued reduction of trades and positions in global rates, global credit products, emerging markets and legacy positions. In addition, we reduced risk-weighted assets in our ongoing businesses, primarily through the sale of client inventory positions in securitized products, and through a combination of external hedges and other mitigation measures such as the PAF2 transaction. The Investment Banking Basel III risk-weighted asset target for year-end 2012 remains at USD 190 billion. |
| Our business portfolio has evolved as a result of our refined strategy. The reduction of inventory levels and risk-weighted assets in fixed income has resulted in a more balanced risk and revenue mix among our macro businesses (global rates and foreign exchange), securitized products and global credit products. |
| In addition, we have increased operating efficiency through a lower expense base, which will contribute to higher returns on capital. |
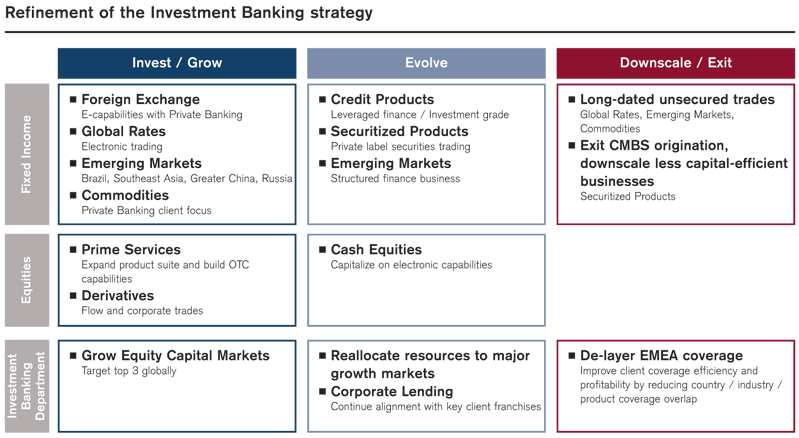
Asset Management |
| In 1Q12, we reported income before taxes of CHF 250 million and net revenues of CHF 663 million, with a pre-tax margin of 38%. |
| In February, we completed a partial sale of our investment in Aberdeen Asset Management, recognizing a gain of CHF 178 million and improving our capital position. We reduced our ownership interest from 19.8% to 9.8%. Excluding this gain, income before taxes was CHF 72 million, down from CHF 175 million in 1Q11 and from CHF 90 million in 4Q11. |
| Investment-related gains decreased 37% compared to 1Q11, but increased significantly compared to 4Q11. Compared to 1Q11, fee-based revenues decreased 9%, with a decline in placement fees, asset management fees and equity participations income. Our fee-based margin was 40 basis points compared to 41 basis points in 1Q11. |
| Operating expenses of CHF 413 million were up 12% compared to 4Q11 and stable compared to 1Q11. They included deferred compensation expense of CHF 46 million from the PAF2 awards, which were granted and expensed in 1Q12. |
| In 1Q12, assets under management decreased 1% to CHF 403.4 billion. We had net asset outflows of CHF 13.7 billion in 1Q12, primarily from multi-asset class solutions, partially offset by inflows in alternative investments. We had positive market performance of CHF 13.8 billion. |
| Results | |||||||||||
| in / end of | % change | ||||||||||
| 1Q12 | 4Q11 | 1Q11 | QoQ | YoY | |||||||
| Statements of operations (CHF million) | |||||||||||
| Net revenues | 663 | 458 | 594 | 45 | 12 | ||||||
| Provision for credit losses | 0 | 0 | 0 | – | – | ||||||
| Compensation and benefits | 263 | 204 | 260 | 29 | 1 | ||||||
| General and administrative expenses | 118 | 130 | 125 | (9) | (6) | ||||||
| Commission expenses | 32 | 34 | 34 | (6) | (6) | ||||||
| Total other operating expenses | 150 | 164 | 159 | (9) | (6) | ||||||
| Total operating expenses | 413 | 368 | 419 | 12 | (1) | ||||||
| Income before taxes | 250 | 90 | 175 | 178 | 43 | ||||||
| Statement of operations metrics (%) | |||||||||||
| Cost/income ratio | 62.3 | 80.3 | 70.5 | – | – | ||||||
| Pre-tax income margin | 37.7 | 19.7 | 29.5 | – | – | ||||||
| Utilized economic capital and return | |||||||||||
| Average utilized economic capital (CHF million) | 3,145 | 3,207 | 3,337 | (2) | (6) | ||||||
| Pre-tax return on average utilized economic capital (%) 1 | 33.2 | 12.5 | 22.0 | – | – | ||||||
| Number of employees (full-time equivalents) | |||||||||||
| Number of employees | 2,700 | 2,700 | 2,800 | 0 | (4) | ||||||
| 1 Calculated using a return excluding interest costs for allocated goodwill. | |||||||||||
| Results (continued) | |||||||||||
| in | % change | ||||||||||
| 1Q12 | 4Q11 | 1Q11 | QoQ | YoY | |||||||
| Net revenue detail by type (CHF million) | |||||||||||
| Asset management fees | 314 | 312 | 327 | 1 | (4) | ||||||
| Placement, transaction and other fees | 41 | 85 | 54 | (52) | (24) | ||||||
| Performance fees and carried interest | 34 | 41 | 34 | (17) | 0 | ||||||
| Equity participations income | 20 | 26 | 32 | (23) | (38) | ||||||
| Fee-based revenues | 409 | 464 | 447 | (12) | (9) | ||||||
| Investment-related gains/(losses) | 101 | 6 | 160 | – | (37) | ||||||
| Equity participations and other gains/(losses) | 170 | (8) | (4) | – | – | ||||||
| Other revenues 1 | (17) | (4) | (9) | 325 | 89 | ||||||
| Net revenues | 663 | 458 | 594 | 45 | 12 | ||||||
| Net revenue detail by investment strategies (CHF million) | |||||||||||
| Alternative investments | 264 | 314 | 276 | (16) | (4) | ||||||
| Traditional investments | 106 | 121 | 129 | (12) | (18) | ||||||
| Diversified investments 2 | 201 | 21 | 41 | – | 390 | ||||||
| Other | (9) | (4) | (12) | 125 | (25) | ||||||
| Net revenues before investment-related gains/(losses) | 562 | 452 | 434 | 24 | 29 | ||||||
| Investment-related gains/(losses) | 101 | 6 | 160 | – | (37) | ||||||
| Net revenues | 663 | 458 | 594 | 45 | 12 | ||||||
| Fee-based margin on assets under management (annualized) (bp) | |||||||||||
| Fee-based margin 3 | 40 | 45 | 41 | – | – | ||||||
| 1 Includes allocated funding costs. 2 Includes revenues relating to management of the 2008 Partner Asset Facility and income from our investment in Aberdeen. 3 Fee-based revenues divided by average assets under management. | |||||||||||
Results detail |
| The following provides a comparison of our 1Q12 results versus 1Q11 (YoY) and versus 4Q11 (QoQ). |
Net revenues |
| Asset management fees |
| YoY: Down 4% from CHF 327 million to CHF 314 million |
| The decrease resulted from lower fees in traditional investments and alternative investments. Lower fees in traditional investments reflected the decrease in average assets under management, resulting in lower fees in equities, multi-asset class solutions, pension advisory services and fixed income. Lower fees in alternative investments resulted from the closure and restructuring of certain product lines and from private equity investment sales in 2011, partially offset by higher fees from our new secondary private equity fund and from increased fees in single manager hedge funds, commodities, exchange-traded funds (ETFs) and real estate. Average assets under management decreased 5.2%. |
| QoQ: Stable at CHF 314 million compared to CHF 312 million |
| The increase in fees in alternative investments was largely offset by a decrease in fees in traditional investments and diversified strategies. In alternative investments, increases in fees from single manager hedge funds, real estate, ETFs and index strategies were partially offset by declines in fees from credit strategies. In traditional investments, lower fees in pension advisory services, fixed income and equities from lower average assets under management in those businesses were partially offset by an increase in fees in multi-asset class solutions. Fees in diversified investments decreased from lower fees from fund administration services. Overall, average assets under management were stable. |
| Placement, transaction and other fees |
| YoY: Down 24% from CHF 54 million to CHF 41 million |
| The decrease reflected lower private equity placement fees. |
| QoQ: Down 52% from CHF 85 million to CHF 41 million |
| The decrease reflected seasonally higher private equity placement fees and higher real estate transaction fees in alternative investments in 4Q11. |
| Performance fees and carried interest |
| YoY: Stable at CHF 34 million |
| Higher performance fees from credit strategies were offset by lower carried interest from realized private equity gains. |
| QoQ: Down 17% from CHF 41 million to CHF 34 million |
| The decrease was mainly due to lower carried interest from realized private equity gains and lower performance fees in single-manager hedge funds, partially offset by higher performance fees in credit strategies and in diversified investments relating to management of the 2008 Partner Asset Facility. |
| Equity participations income |
| YoY: Down 38% from CHF 32 million to CHF 20 million |
| The decrease was due to lower revenues from diversified investments and emerging markets participations in alternative investments. As a result of the partial sale of our investment in Aberdeen in February, we no longer account for this investment under the equity method of accounting and have classified our remaining holdings as available-for-sale securities. As a result, our interest no longer generates equity participations income. This change contributed to lower equity participations income in diversified investments in 1Q12. |
| QoQ: Down 23% from CHF 26 million to CHF 20 million |
| The decrease was mainly due to lower income in single-manager hedge funds and emerging markets participations in alternative investments. |
| Investment-related gains/(losses) |
| YoY: Down 37% from CHF 160 million to CHF 101 million |
| In 1Q12, the gains of CHF 101 million reflected gains in hedge fund investments and in the energy and healthcare sectors. In hedge fund investments, we had gains in our new securitized products master fund. In 1Q11, the gains of CHF 160 million reflected gains in private equity investments, mainly in the commodities, industrial, energy and real estate sectors, and in credit-related investments. |
| QoQ: Up from CHF 6 million to CHF 101 million |
| In 1Q12, the gains of CHF 101 million reflected gains in hedge fund investments and in the energy and healthcare sectors. In 4Q11, the gains of CHF 6 million reflected gains in the industrial and transportation sectors, partially offset by losses in the energy and commodities sectors. |
| Equity participations and other gains/(losses) |
| YoY: Up from CHF (4) million to CHF 170 million |
| The gain in 1Q12 resulted from the partial sale of our ownership interest in Aberdeen, reducing our interest in Aberdeen from 19.8% to 9.8%, partially offset by an impairment of CHF 8 million on investments held by Asset Management Finance LLC (AMF). The loss in 1Q11 reflected an impairment on investments held by AMF. |
| QoQ: Up from CHF (8) million to CHF 170 million |
| The gain in 1Q12 reflected the partial sale of our ownership interest in Aberdeen, partially offset by an impairment on investments held by AMF. The loss in 4Q11 reflected an impairment of a joint venture investment. |
Operating expenses |
| Compensation and benefits |
| YoY: Stable at CHF 263 million compared to CHF 260 million |
| Higher deferred compensation expense, including CHF 46 million related to the PAF2 awards, which were granted and expensed in 1Q12, was partially offset by lower discretionary performance-related compensation expense, lower social security taxes on share award settlements and lower salaries. |
| QoQ: Up 29% from CHF 204 million to CHF 263 million |
| The increase was primarily due to higher deferred compensation expense from the PAF2 awards, higher discretionary performance-related compensation expense and higher severance expenses. |
| General and administrative expenses |
| YoY: Down 6% from CHF 125 million to CHF 118 million |
| The decrease mainly reflected lower advertising expenses, consulting fees and non-income taxes. |
| QoQ: Down 9% from CHF 130 million to CHF 118 million |
| The decrease mainly reflected lower advertising expenses and consulting fees. |
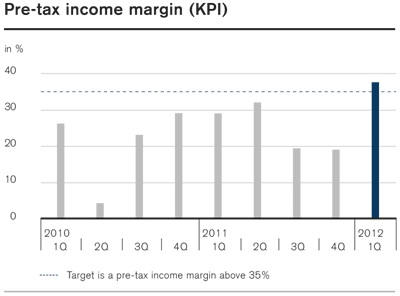
| Assets under management - Asset Management | |||||||||||
| in / end of | % change | ||||||||||
| 1Q12 | 4Q11 | 1Q11 | QoQ | YoY | |||||||
| Assets under management (CHF billion) | |||||||||||
| Alternative investments | 197.1 | 190.9 | 198.9 | 3.2 | (0.9) | ||||||
| of which hedge funds | 25.0 | 24.9 | 27.2 | 0.4 | (8.1) | ||||||
| of which private equity | 27.5 | 28.4 | 30.0 | (3.2) | (8.3) | ||||||
| of which real estate & commodities | 47.6 | 47.1 | 45.5 | 1.1 | 4.6 | ||||||
| of which credit | 18.0 | 19.0 | 18.5 | (5.3) | (2.7) | ||||||
| of which ETF | 15.3 | 14.6 | 15.1 | 4.8 | 1.3 | ||||||
| of which index strategies | 58.7 | 51.5 | 55.6 | 14.0 | 5.6 | ||||||
| of which other | 5.0 | 5.4 | 7.0 | (7.4) | (28.6) | ||||||
| Traditional investments | 205.4 | 216.2 | 236.5 | (5.0) | (13.2) | ||||||
| of which multi-asset class solutions | 99.4 | 109.9 | 122.0 | (9.6) | (18.5) | ||||||
| of which fixed income & equities | 44.5 | 43.0 | 47.6 | 3.5 | (6.5) | ||||||
| of which pension advisory services | 61.5 | 63.3 | 66.9 | (2.8) | (8.1) | ||||||
| Diversified investments | 0.9 | 0.9 | 0.4 | 0.0 | 125.0 | ||||||
| Assets under management 1 | 403.4 | 408.0 | 435.8 | (1.1) | (7.4) | ||||||
| Average assets under management (CHF billion) | |||||||||||
| Average assets under management | 409.5 | 408.1 | 432.1 | 0.3 | (5.2) | ||||||
| Assets under management by currency (CHF billion) | |||||||||||
| USD | 83.5 | 93.5 | 102.4 | (10.7) | (18.5) | ||||||
| EUR | 44.5 | 59.0 | 63.2 | (24.6) | (29.6) | ||||||
| CHF | 250.9 | 233.5 | 247.5 | 7.5 | 1.4 | ||||||
| Other | 24.5 | 22.0 | 22.7 | 11.4 | 7.9 | ||||||
| Assets under management | 403.4 | 408.0 | 435.8 | (1.1) | (7.4) | ||||||
| Growth in assets under management (CHF billion) | |||||||||||
| Net new assets 2 | (13.7) | (9.6) | 4.5 | – | – | ||||||
| Other effects | 9.1 | 7.9 | 5.5 | – | – | ||||||
| of which market movements | 13.8 | 4.0 | 6.3 | – | – | ||||||
| of which currency | (4.8) | 4.0 | (0.4) | – | – | ||||||
| of which other | 0.1 | (0.1) | (0.4) | – | – | ||||||
| Growth in assets under management | (4.6) | (1.7) | 10.0 | – | – | ||||||
| Growth in assets under management (annualized) (%) | |||||||||||
| Net new assets | (13.4) | (9.4) | 4.2 | – | – | ||||||
| Other effects | 8.9 | 7.7 | 5.2 | – | – | ||||||
| Growth in assets under management | (4.5) | (1.7) | 9.4 | – | – | ||||||
| Growth in assets under management (rolling four-quarter average) (%) | |||||||||||
| Net new assets | (4.4) | (0.2) | 3.2 | – | – | ||||||
| Other effects | (3.1) | (4.0) | (2.8) | – | – | ||||||
| Growth in assets under management (rolling four-quarter average) | (7.5) | (4.2) | 0.4 | – | – | ||||||
| Principal investments (CHF billion) | |||||||||||
| Principal investments 3 | 3.4 | 3.4 | 3.3 | 0.0 | 3.0 | ||||||
| 1 Excludes our portion of assets under management from our investment in Aberdeen. 2 Includes outflows for private equity assets reflecting realizations at cost and unfunded commitments on which a fee is no longer earned. 3 Primarily private equity investments. | |||||||||||
Assets under management |
| Assets under management as of the end of 1Q12 were CHF 403.4 billion, 1.1% lower than 4Q11. We had net asset outflows of CHF 13.7 billion in 1Q12, primarily from multi-asset class solutions from which we had redemptions of CHF 14.7 billion from a single fixed income mandate and outflows of CHF 2.7 billion from pension advisory services. We reported inflows of CHF 3.2 billion in alternative investments, primarily in index strategies. The net asset outflows and adverse foreign exchange-related movements were partially offset by positive market performance. Average assets under management were stable. |
| Compared to 1Q11, assets under management were down 7.4%. The decrease primarily reflected net asset outflows, adverse foreign exchange-related movements and negative market performance. Average assets under management decreased 5.2% to CHF 409.5 billion. |
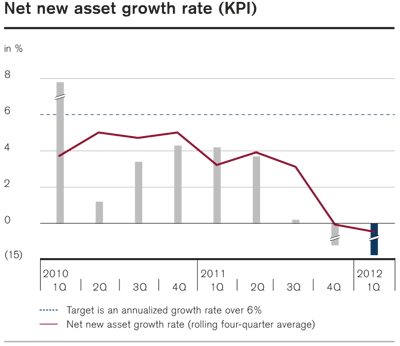
Assets under management |
| We had net asset outflows of CHF 7.1 billion during 1Q12 and assets under management of CHF 1,249.6 billion as of the end of 1Q12. |
Assets under management |
| Assets under management comprise assets that are placed with us for investment purposes and include discretionary and advisory counterparty assets. |
| Discretionary assets are assets for which the customer fully transfers the discretionary power to a Credit Suisse entity with a management mandate. Discretionary assets are reported in the segment in which the advice is provided as well as in the segment in which the investment decisions take place. Assets managed by Asset Management for Private Banking clients are reported in both segments and eliminated at Group level. |
| Advisory assets include assets placed with us where the client is provided access to investment advice but retains discretion over investment decisions. |
| Assets under management and net new assets include assets managed by consolidated entities, joint ventures and strategic participations. Assets from joint ventures and participations are counted in proportion to our share in the respective entity. |
| As of the end of 1Q12, assets under management were CHF 1,249.6 billion, up CHF 20.1 billion, or 1.6%, compared to the end of 4Q11, mainly reflecting positive market performance partially offset by adverse foreign exchange-related movements. |
| Compared to the end of 1Q11, assets under management were down CHF 32.8 billion, or 2.6%. Adverse foreign exchange-related movements and market performance were partly offset by net new assets in Private Banking. |
| In Private Banking, assets under management were CHF 957.7 billion, up CHF 29.8 billion, or 3.2%, compared to the end of 4Q11, and stable compared to the end of 1Q11. In Asset Management, assets under management were CHF 403.4 billion, down CHF 4.6 billion, or 1.1%, compared to the end of 4Q11, and down CHF 32.4 billion, or 7.4%, compared to the end of 1Q11. |
| > Refer to “Private Banking” and “Asset Management” in I – Credit Suisse results and “Note 36 – Assets under management” in V – Consolidated financial statements – Credit Suisse Group in the Credit Suisse Annual Report 2011 for further information. |
Net new assets |
| Net new assets include individual cash payments, security deliveries and cash flows resulting from loan increases or repayments. Interest and dividend income credited to clients, commissions, interest and fees charged for banking services are not included as they do not reflect success in acquiring assets under management. Furthermore, changes due to foreign exchange-related and market movements as well as asset inflows and outflows due to the acquisition or divestiture of businesses are not part of net new assets. |
| Private Banking recorded net new assets of CHF 8.4 billion in 1Q12, including CHF 5.8 billion from Wealth Management Clients, with inflows particularly from its UHNWI client segment and emerging markets. Asset Management recorded net asset outflows of CHF 13.7 billion in 1Q12, with outflows in traditional investments partly offset by inflows in alternative investments. |
Client assets |
| Client assets is a broader measure than assets under management as it includes transactional and custody accounts (assets held solely for transaction-related or safekeeping/custody purposes) and assets of corporate clients and public institutions used primarily for cash management or transaction-related purposes. |
| Assets under management and client assets | |||||||||||
| end of | % change | ||||||||||
| 1Q12 | 4Q11 | 1Q11 | QoQ | YoY | |||||||
| Assets under management (CHF billion) | |||||||||||
| Private Banking | 957.7 | 927.9 | 957.9 | 3.2 | 0.0 | ||||||
| Asset Management | 403.4 | 408.0 | 435.8 | (1.1) | (7.4) | ||||||
| Assets managed by Asset Management for Private Banking clients | (111.5) | (106.4) | (111.3) | 4.8 | 0.2 | ||||||
| Assets under management | 1,249.6 | 1,229.5 | 1,282.4 | 1.6 | (2.6) | ||||||
| of which discretionary assets | 409.8 | 411.6 | 443.6 | (0.4) | (7.6) | ||||||
| of which advisory assets | 839.8 | 817.9 | 838.8 | 2.7 | 0.1 | ||||||
| Client assets (CHF billion) | |||||||||||
| Private Banking | 1,116.0 | 1,083.6 | 1,118.4 | 3.0 | (0.2) | ||||||
| Asset Management | 430.7 | 434.1 | 463.6 | (0.8) | (7.1) | ||||||
| Assets managed by Asset Management for Private Banking clients | (111.5) | (106.4) | (111.3) | 4.8 | 0.2 | ||||||
| Client assets | 1,435.2 | 1,411.3 | 1,470.7 | 1.7 | (2.4) | ||||||
| Growth in assets under management | |||||||
| in | 1Q12 | 4Q11 | 1Q11 | ||||
| Growth in assets under management (CHF billion) | |||||||
| Private Banking | 8.4 | 7.6 | 18.0 | ||||
| Asset Management 1 | (13.7) | (9.6) | 4.5 | ||||
| Assets managed by Asset Management for Private Banking clients | (1.8) | 2.4 | (3.4) | ||||
| Net new assets | (7.1) | 0.4 | 19.1 | ||||
| Private Banking | 21.4 | 28.9 | 7.0 | ||||
| Asset Management | 9.1 | 7.9 | 5.5 | ||||
| Assets managed by Asset Management for Private Banking clients | (3.3) | (4.5) | (2.2) | ||||
| Other effects | 27.2 | 32.3 | 10.3 | ||||
| Private Banking | 29.8 | 36.5 | 25.0 | ||||
| Asset Management | (4.6) | (1.7) | 10.0 | ||||
| Assets managed by Asset Management for Private Banking clients | (5.1) | (2.1) | (5.6) | ||||
| Total growth in assets under management | 20.1 | 32.7 | 29.4 | ||||
| Growth in assets under management (annualized) (%) | |||||||
| Private Banking | 3.6 | 3.4 | 7.7 | ||||
| Asset Management | (13.4) | (9.4) | 4.2 | ||||
| Assets managed by Asset Management for Private Banking clients | 6.8 | (9.2) | 12.9 | ||||
| Net new assets | (2.3) | 0.1 | 6.1 | ||||
| Private Banking | 9.2 | 13.0 | 3.0 | ||||
| Asset Management | 8.9 | 7.7 | 5.2 | ||||
| Assets managed by Asset Management for Private Banking clients | 12.4 | 17.3 | 8.3 | ||||
| Other effects | 8.8 | 10.8 | 3.3 | ||||
| Private Banking | 12.8 | 16.4 | 10.7 | ||||
| Asset Management | (4.5) | (1.7) | 9.4 | ||||
| Assets managed by Asset Management for Private Banking clients | 19.2 | 8.1 | 21.2 | ||||
| Total growth in assets under management | 6.5 | 10.9 | 9.4 | ||||
| Growth in net new assets (rolling four-quarter average) (%) | |||||||
| Private Banking | 3.6 | 4.8 | 5.7 | ||||
| Asset Management | (4.4) | (0.2) | 3.2 | ||||
| Assets managed by Asset Management for Private Banking clients | 1.0 | 2.6 | 5.3 | ||||
| Growth in net new assets | 1.1 | 3.3 | 4.9 | ||||
| 1 Includes outflows for private equity assets reflecting realizations at cost and unfunded commitments on which a fee is no longer earned. | |||||||
Treasury, risk, balance sheet and off-balance sheet |
Treasury management |
Risk management |
Balance sheet and off-balance sheet |
Treasury management |
| During 1Q12, we continued to maintain a strong liquidity and funding position with an estimated Basel III net stable funding ratio (NSFR) of 100% as of the end of the quarter. Our proactive approach to capital management resulted in an increase in our Basel II.5 core tier 1 ratio to 11.8% as of the end of 1Q12 compared to 10.7% as of the end of 4Q11. |
Liquidity and funding management |
Overview |
| Securities for funding and capital purposes are issued primarily by the Bank, our principal operating subsidiary and a US registrant. The Bank lends funds to its operating subsidiaries and affiliates on both a senior and subordinated basis, as needed; the latter typically to meet capital requirements, or as desired by management to support business initiatives. |
| Our internal liquidity risk management framework as agreed with FINMA has been subject to review and monitoring by FINMA and other regulators, as well as rating agencies, for many years. Moreover, our liquidity risk management principles and framework are in line with the Basel III liquidity framework. |
| > Refer to “Treasury management” in III – Treasury, Risk, Balance sheet and Off-balance sheet in the Credit Suisse Annual Report 2011 for further information on liquidity and funding management. |
Liquidity risk management framework |
| Our liquidity and funding policy is designed to ensure that funding is available to meet all obligations in times of stress, whether caused by market events or issues specific to Credit Suisse. We achieve this through a conservative asset/liability management strategy aimed at maintaining a funding structure with long-term wholesale and stable deposit funding and cash well in excess of illiquid assets. To address short-term liquidity stress, we maintain a buffer of cash and highly liquid securities that covers unexpected needs of short-term liquidity. Our liquidity risk parameters reflect various liquidity stress assumptions, which we believe are conservative. We manage our liquidity profile at a sufficient level such that, in the event that we are unable to access unsecured funding, we will have sufficient liquidity to sustain operations for an extended period of time well in excess of our minimum target. |
| The BCBS has issued the Basel III international framework for liquidity risk measurement, standards and monitoring. The framework includes a liquidity coverage ratio (LCR) and a NSFR. The LCR, which is expected to be introduced January 1, 2015 following an observation period which began in 2011, addresses liquidity risk over a 30-day period. The NSFR, which is expected to be introduced January 1, 2018 following an observation period which began in 2012, establishes criteria for a minimum amount of stable funding based on the liquidity of a bank’s assets and activities over a one-year horizon. The BCBS has stated that it will review the effect of these liquidity standards on financial markets, credit extension and economic growth to address unintended consequences. |
| The LCR aims to ensure that banks have a stock of unencumbered high-quality liquid assets available to meet liquidity needs for a 30-day time horizon under a severe stress scenario. The LCR is comprised of two components: the value of the stock of high quality liquid assets in stressed conditions and the total net cash outflows calculated according to specified scenario parameters. The ratio of liquid assets over net cash outflows should always be at least 100%. |
| The NSFR is intended to ensure banks maintain a structurally sound long-term funding profile beyond one year and is a complementary measure to the LCR. The NSFR is structured to ensure that illiquid assets are funded with an appropriate amount of stable long-term funds. The standard is defined as the ratio of available stable funding over the amount of required stable funding and should always be at least 100%. |
| Although the NSFR is not expected to be introduced until 2018 and is still subject to adjustment by the BCBS and FINMA, we are now using the NSFR as the primary tool to monitor our structural liquidity position, to plan funding and as the basis for our funds transfer pricing policy. We estimate that our NSFR was 100% as of the end of 1Q12, which is our target for the end of 2013. Where requirements are unclear or left to be determined by national regulators, we have made our own interpretation to arrive at the current result. |
| > Refer to “Debt issuances and redemptions” and “Capital issuances and redemptions” in Capital management for further information on our liability management activities. |
Funding sources and uses |
| We primarily fund our balance sheet through core customer deposits, long-term debt and shareholders’ equity. A substantial portion of our balance sheet is match funded and requires no unsecured funding. Match funded balance sheet items consist of assets and liabilities with close to equal liquidity durations and values so that the liquidity and funding generated or required by the positions are substantially equivalent. Cash and due from banks is highly liquid. A significant part of our assets, principally unencumbered trading assets that support the securities business, is comprised of securities inventories and collateralized receivables, which fluctuate and are generally liquid. These liquid assets are available to settle short-term liabilities. These assets include our buffer of CHF 142 billion of cash, securities accepted under central bank facilities and other highly liquid unencumbered securities, which can be monetized in a time frame consistent with our short-term stress assumptions. During the quarter, we reduced our short-term liabilities, which is reflected in the reduction of our liquidity buffer, including central bank balances, from CHF 176 billion in 4Q11. Loans, which comprise the largest component of our illiquid assets, are funded by our core customer deposits, with an excess coverage of 21% as of the end of 1Q12, down from 22% in 4Q11. We fund other illiquid assets, including real estate, private equity and other long-term investments and a haircut for the illiquid portion of securities, with long-term debt and equity, where we try to maintain a substantial funding buffer. |
| Our core customer deposits totaled CHF 275 billion as of the end of 1Q12, compared to CHF 278 billion as of the end of 4Q11. The reduction reflected the adverse foreign exchange translation impact due to the strengthening of the Swiss franc against major currencies. Core customer deposits are from clients with whom we have a broad and longstanding relationship. Core customer deposits exclude deposits from banks and certificates of deposits. We place a priority on maintaining and growing customer deposits, as they have proved to be a stable and resilient source of funding even in difficult market conditions. Our core customer deposit funding is supplemented by the issuance of long-term debt. |
| > Refer to the chart “Balance sheet funding structure” for further information. |
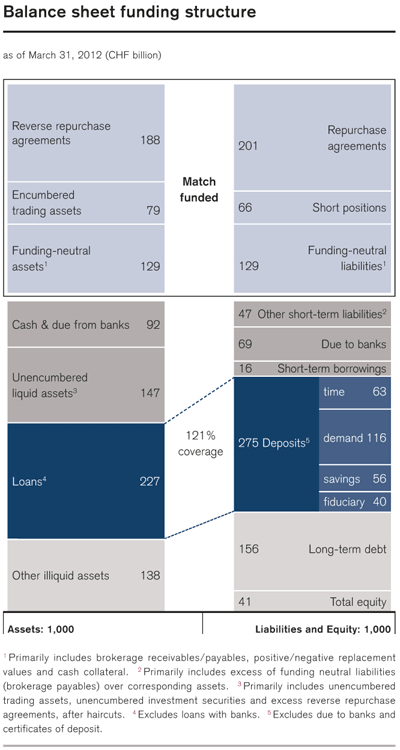 |
Debt issuances and redemptions |
| Our capital markets debt includes senior and subordinated debt issued in US-registered offerings and medium-term note programs, euro market medium-term note programs, Australian dollar domestic medium-term note programs, a Samurai shelf registration statement in Japan and covered bond programs. As a global bank, we have access to multiple markets worldwide and our major funding centers are Zurich, New York, London and Tokyo. |
| We use a wide range of products and currencies to ensure that our funding is efficient and well diversified across markets and investor types. Substantially all of our unsecured senior debt is issued without financial covenants, such as adverse changes in our credit ratings, cash flows, results of operations or financial ratios, which could trigger an increase in our cost of financing or accelerate the maturity of the debt. |
| The percentage of unsecured funding from long-term debt, excluding non-recourse debt associated with the consolidation of variable interest entities (VIEs), was 26% as of the end of 1Q12, stable compared to the end of 4Q11. |
| In 1Q12, the Bank issued CHF 255 million of domestic covered bonds, CHF 3.3 billion of international covered bonds and CHF 220 million of senior debt securities. Domestic covered bonds of CHF 425 million and senior debt of CHF 4.9 billion matured in 1Q12. As of March 31, 2012, we had CHF 14.7 billion of domestic and international covered bonds outstanding. |
| > Refer to “Capital issuances and redemptions” in Capital management for further information. |
| The weighted average maturity of long-term debt was 6.4 years (including certificates of deposits with a maturity of one year or longer, but excluding structured notes, and assuming callable securities are redeemed at final maturity, or in 2030 for instruments without a stated final maturity). |
Credit ratings |
| The maximum impact of a simultaneous one, two or three-notch downgrade by all three major rating agencies in the Bank’s long-term debt ratings would result in additional collateral requirements or assumed termination payments under certain derivative instruments of CHF 1.8 billion, CHF 3.6 billion and CHF 4.2 billion, respectively, as of 1Q12, and would not be material to our liquidity and funding planning. If the downgrade does not involve all three rating agencies, the impact may be smaller. |
| As of the end of 1Q12, we were compliant with the requirements related to maintaining a specific credit rating under these derivative instruments. |
| > Refer to “Credit ratings” in III – Treasury, Risk, Balance sheet and Off-balance sheet – Treasury management – Liquidity and funding management in the Credit Suisse Annual Report 2011 for further information. |
Capital management |
Capital management framework |
| Our capital management framework is intended to ensure that there is sufficient capital to support our underlying risks and to achieve management’s regulatory and credit rating objectives. |
| In January 2011, as required by FINMA, Credit Suisse implemented BCBS’s “Revisions to the Basel II market risk framework” (Basel II.5), for FINMA regulatory capital purposes, with some additional requirements for large Swiss banks known as “Swiss Finish”. |
| > Refer to “Capital management” in III – Treasury, Risk, Balance sheet and Off-balance sheet – Treasury management in the Credit Suisse Annual Report 2011 for further information on Credit Suisse’s capital management framework, regulatory capital and risk-weighted assets. |
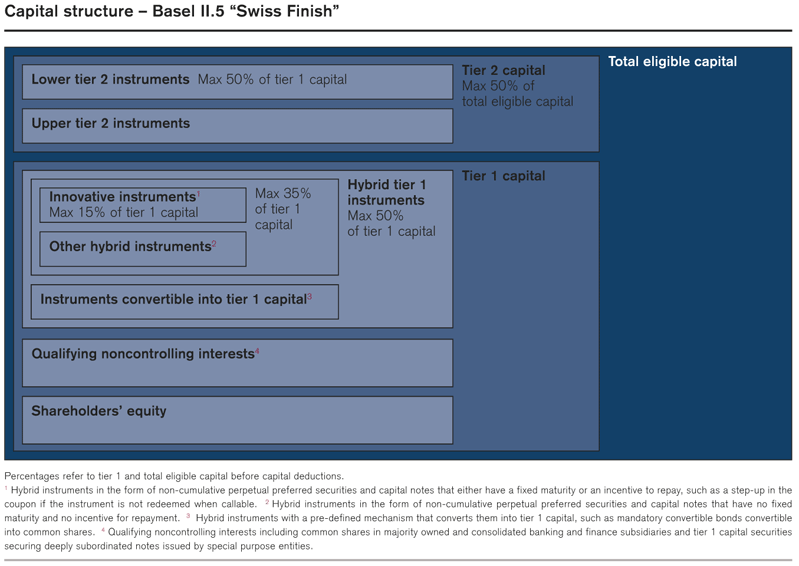 |
Risk-weighted assets |
| Our balance sheet positions and off-balance sheet exposures translate into risk-weighted assets (RWA) that are categorized as market, credit, operational and non-counterparty risk RWA. Market risk RWA reflect the capital requirements of potential changes in the fair values of financial instruments in response to market movements inherent in both the balance sheet and the off-balance sheet items. Credit risk RWA reflect the capital requirements for the possibility of a loss being incurred as the result of a borrower or counterparty failing to meet its financial obligations or as a result of a deterioration in the credit quality of the borrower or counterparty. Operational risk RWA reflect the capital requirements for the risk of loss resulting from inadequate or failed internal processes, people and systems or from external events. Non-counterparty-risk RWA primarily reflect the capital requirements for our premises and equipment. It is not the nominal size, but the nature (including risk mitigation such as collateral or hedges) of the balance sheet positions or off-balance sheet positions that determines the RWA. |
Risk measurement models |
| Within the Basel II.5 framework for FINMA regulatory capital purposes, we implemented new risk measurement models, including an incremental risk charge and stressed Value-at-Risk (VaR). The incremental risk charge is a regulatory capital charge for default and migration risk on positions in the trading books and is intended to complement additional standards being applied to the VaR modeling framework, including stressed VaR. Stressed VaR replicates a VaR calculation on the Group’s current portfolio taking into account a one-year observation period relating to significant financial stress and helps reduce the pro-cyclicality of the minimum capital requirements for market risk. |
| FINMA, in line with the BIS requirements, uses a multiplier to impose an increase in market risk capital for every regulatory VaR backtesting exception over four in the prior rolling 12-month period. For the purposes of this measurement, backtesting exceptions are calculated using a subset of actual daily trading revenues that includes only the impact of daily movements in financial market variables such as interest rates, equity prices and foreign exchange rates on the previous night’s positions. In 1Q12, the market risk capital multiplier remained at FINMA and Bank for International Settlements (BIS) minimum levels and we did not experience an increase in market risk capital. |
| > Refer to “Market risk” in Risk management for further information on Credit Suisse’s risk measurement models and backtesting exceptions. |
| Leverage ratios | |||||||||||||||||
| Group | Bank | ||||||||||||||||
end of | 1Q12 | 4Q11 | 1Q11 | % change QoQ | 1Q12 | 4Q11 | 1Q11 | % change QoQ | |||||||||
| Tier 1 capital (CHF billion) | |||||||||||||||||
| Tier 1 capital | 36.7 | 36.8 | 35.8 | 0 | 33.0 | 33.5 | 31.9 | (1) | |||||||||
| Adjusted average assets (CHF billion) | |||||||||||||||||
| Average assets | 1,019 | 1,038 | 1,041 | (2) | 994 | 1,012 | 1,017 | (2) | |||||||||
| Adjustments: | |||||||||||||||||
| Assets from Swiss lending activities 2 | (146) | (145) | (139) | 1 | (120) | (119) | (114) | 1 | |||||||||
| Cash and balances with central banks | (73) | (81) | (47) | (10) | (71) | (80) | (46) | (11) | |||||||||
| Other | (12) | (15) | (30) | (20) | (11) | (13) | (29) | (15) | |||||||||
| Adjusted average assets | 788 | 797 | 825 | (1) | 792 | 800 | 828 | (1) | |||||||||
| Leverage ratio (%) | |||||||||||||||||
| Leverage ratio | 4.7 | 4.6 | 4.3 | 2 | 4.2 | 4.2 | 3.9 | 0 | |||||||||
| 1 Calculated as the average of the month-end values for the previous three calendar months. 2 Excludes Swiss interbank lending. | |||||||||||||||||
Leverage ratios |
| Both the Group and the Bank must maintain, for FINMA regulatory capital purposes, a minimum leverage ratio of tier 1 capital to total adjusted average assets (on a non-risk-weighted basis) of 3% at the Group and Bank consolidated level and 4% at the Bank on an unconsolidated basis by 2013. |
| The leverage ratios for the Group and Bank were 4.7% and 4.2% as of the end of 1Q12, respectively, compared to 4.6% and 4.2% as of the end of 4Q11. |
| The increase in the leverage ratios compared to 4Q11 reflected lower adjusted average assets, offset by lower tier 1 capital. The adjusted average assets primarily reflected decreases in US dollar Investment Banking assets with only minor foreign exchange translation impacts. |
Regulatory capital – Group |
| Our tier 1 ratio was 15.6% as of the end of 1Q12 compared to 15.2% as of the end of 4Q11, reflecting decreased RWA and stable tier 1 capital. Our core tier 1 ratio was 11.8% as of the end of 1Q12 compared to 10.7% as of the end of 4Q11, reflecting decreased RWA and higher core tier 1 capital. Our total capital ratio was 19.2% as of the end of 1Q12 compared to 20.1% as of the end of 4Q11. |
| Tier 1 capital was CHF 36.7 billion as of the end of 1Q12 compared to CHF 36.8 billion as of the end of 4Q11, reflecting a buy back of hybrid tier 1 instruments (primarily innovative instruments) in connection with a debt tender offer and an adverse foreign exchange translation impact, partially offset by net income (excluding the impact of fair value gains/(losses) on Credit Suisse debt, net of tax). Tier 2 capital was CHF 8.3 billion as of the end of 1Q12 compared to CHF 11.8 billion as of the end of 4Q11, primarily reflecting the buy back of tier 2 capital instruments and an adverse foreign exchange translation impact, partially offset by the issuance of new buffer capital notes. Capital deductions 50% from tier 1 and tier 2 were positively impacted by a reduction in our holdings of securitization tranches with low ratings and the partial sale of our Aberdeen ownership interest. Total eligible capital as of the end of 1Q12 was CHF 45.0 billion compared to CHF 48.7 billion as of the end of 4Q11. |
| BIS statistics (Basel II.5) | |||||||||||||||||
| Group | Bank | ||||||||||||||||
end of | 1Q12 | 4Q11 | 1Q11 | % change QoQ | 1Q12 | 4Q11 | 1Q11 | % change QoQ | |||||||||
| Eligible capital (CHF million) | |||||||||||||||||
| Total shareholders' equity | 33,585 | 33,674 | 34,057 | 0 | 27,369 | 27,502 | 27,181 | 0 | |||||||||
| Goodwill and intangible assets | (8,592) | (8,876) | (9,110) | (3) | (7,458) | (7,735) | (7,970) | (4) | |||||||||
| Qualifying noncontrolling interests | 3,417 | 3,365 | 3,492 | 2 | 4,284 | 4,476 | 4,414 | (4) | |||||||||
| Capital deductions 50% from tier 1 | (1,989) | (2,274) | (3,837) | (13) | (1,931) | (2,224) | (3,772) | (13) | |||||||||
| Other adjustments | 1,201 | 1 | 67 | 221 | – | 1,653 | 552 | 1,647 | 199 | ||||||||
| Core tier 1 capital | 27,622 | 25,956 | 24,823 | 6 | 23,917 | 22,571 | 21,500 | 6 | |||||||||
| Hybrid tier 1 instruments 2 | 9,046 | 3 | 10,888 | 10,948 | (17) | 9,046 | 3 | 10,888 | 10,421 | (17) | |||||||
| Tier 1 capital | 36,668 | 36,844 | 35,771 | 0 | 32,963 | 33,459 | 31,921 | (1) | |||||||||
| Upper tier 2 | 744 | 1,841 | 1,122 | (60) | 767 | 1,900 | 1,693 | (60) | |||||||||
| Lower tier 2 | 9,573 | 12,243 | 11,718 | (22) | 11,367 | 13,493 | 13,251 | (16) | |||||||||
| Capital deductions 50% from tier 2 | (1,989) | (2,274) | (3,837) | (13) | (1,931) | (2,224) | (3,772) | (13) | |||||||||
| Tier 2 capital | 8,328 | 11,810 | 9,003 | (29) | 10,203 | 13,169 | 11,172 | (23) | |||||||||
| Total eligible capital | 44,996 | 48,654 | 44,774 | (8) | 43,166 | 46,628 | 43,093 | (7) | |||||||||
| Risk-weighted assets (CHF million)– | |||||||||||||||||
| Credit risk | 144,121 | 157,237 | 154,594 | (8) | 134,059 | 147,224 | 142,803 | (9) | |||||||||
| Market risk | 43,094 | 40,609 | 47,718 | 6 | 42,347 | 39,810 | 46,620 | 6 | |||||||||
| Non-counterparty risk | 7,275 | 7,819 | 7,333 | (7) | 6,735 | 7,274 | 6,784 | (7) | |||||||||
| Operational risk | 39,900 | 36,088 | 33,188 | 11 | 39,900 | 36,088 | 33,188 | 11 | |||||||||
| Risk-weighted assets | 234,390 | 241,753 | 242,833 | (3) | 223,041 | 230,396 | 229,395 | (3) | |||||||||
| Capital ratios (%) | |||||||||||||||||
| Core tier 1 ratio | 11.8 | 10.7 | 10.2 | – | 10.7 | 9.8 | 9.4 | – | |||||||||
| Tier 1 ratio | 15.6 | 15.2 | 14.7 | – | 14.8 | 14.5 | 13.9 | – | |||||||||
| Total capital ratio | 19.2 | 20.1 | 18.4 | – | 19.4 | 20.2 | 18.8 | – | |||||||||
| 1 Includes cumulative fair value adjustments of CHF (1.1) billion on own vanilla debt and structured notes, net of tax, the 1Q12 dividend accrual on Group shares of CHF (0.2) billion (representing a dividend of CHF 0.75 per share of which 50% is assumed to be distributed in shares) and an adjustment for the accounting treatment of pension plans of CHF 2.9 billion. 2 Non-cumulative perpetual preferred securities and capital notes. FINMA has advised that the Group and the Bank may continue to include as tier 1 capital CHF 0.4 billion and CHF 2.9 billion, respectively, in 1Q12 (4Q11: CHF 0.6 billion and CHF 3.2 billion, respectively; 1Q11: CHF 1.1 billion and CHF 3.1 billion, respectively) of equity from special purpose entities that are deconsolidated under US GAAP. 3 FINMA has advised that a maximum of 35% of tier 1 capital can be in the form of hybrid capital instruments, which will be phased out under Basel III. Hybrid tier 1 capital represented 23.4% and 25.9% of the Group's and the Bank's adjusted tier 1 capital, respectively, as of the end of 1Q12. | |||||||||||||||||
| Tier 1 capital movement | |||||||
| 1Q12 | 4Q11 | 1Q11 | |||||
| Tier 1 capital (CHF million) | |||||||
| Balance at beginning of period | 36,844 | 34,967 | 35,225 | ||||
| Net income | 44 | (637) | 1,139 | ||||
| Adjustments for fair value gains/(losses) reversed for regulatory purposes, net of tax | 1,466 | 1 | (261) | 291 | |||
| Foreign exchange impact on tier 1 capital | (837) | 652 | (402) | ||||
| Other 2 | (849) | 2,123 | (482) | ||||
| Balance at end of period | 36,668 | 36,844 | 35,771 | ||||
| 1 Includes own credit gains realized through the debt tender offer that was completed in March 2012. 2 Reflects the issuance and redemption of tier 1 capital, a dividend accrual, the effect of share-based compensation and the change in regulatory deductions. | |||||||
| RWA decreased to CHF 234.4 billion as of the end of 1Q12 compared to CHF 241.8 billion as of the end of 4Q11 reflecting a decrease in credit risk, including an adverse foreign exchange translation impact, and an increase in operational risk and market risk. Operational risk increased to reflect anticipated changes to our model. The increase, which has been agreed with our regulators for capital purposes and includes a 10% regulatory uplift on operational risk RWA, will be followed by an increase of a similar size in 2Q12. |
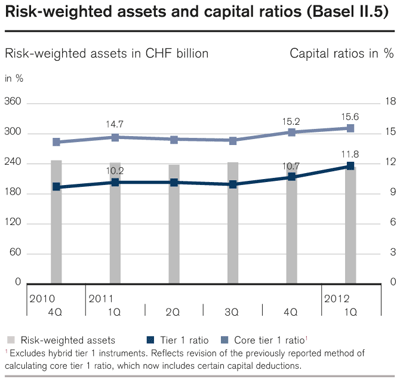 |
| Excluding the foreign exchange translation impact, credit risk in Investment Banking decreased due to reductions in counterparty-related derivative risk resulting from the PAF2 transaction, reductions in derivative and lending exposures and parameter updates primarily related to loss given default. Credit risk in Private Banking decreased reflecting general decreases in exposures and parameter updates on residential mortgages. Market risk increased due to higher stressed VaR relating to increased risks within foreign-exchange products, equities and securitized products, partially offset by lower incremental risk charges mainly within credit products and emerging markets and lower trading book securitizations. |
| > Refer to the table “BIS statistics (Basel II.5)” for further information. |
| > Refer to https://www.credit-suisse.com/investors/en/sub_ financials.jsp for further information on capital ratios of certain significant subsidiaries scheduled to be published as of the end of May 2012. |
| As of the end of 1Q12, we had CHF 3.4 billion of qualifying noncontrolling interests, of which CHF 3.2 billion were core tier 1 capital securities secured by participation securities issued by the Bank. In addition, we had CHF 9.0 billion of hybrid tier 1 instruments, of which CHF 0.8 billion were innovative instruments. The hybrid tier 1 instruments include USD 3.45 billion 11% tier 1 capital notes and CHF 2.5 billion 10% tier 1 capital notes that will be purchased or exchanged for tier 1 buffer capital notes no earlier than October 23, 2013, the first call date of the tier 1 capital notes. |
| > Refer to “Capital issuances and redemptions” in III – Treasury, Risk, Balance sheet and Off-balance sheet – Treasury management – Capital management in the Credit Suisse Annual Report 2011 for further information. |
| Risk-weighted assets by division (Basel II.5) | |||||||||||
| end of | 1Q12 | 4Q11 | 1Q11 | QoQ | YoY | ||||||
| Risk-weighted assets by division (CHF million) | |||||||||||
| Private Banking | 73,439 | 73,260 | 64,052 | 0 | 15 | ||||||
| Investment Banking | 136,700 | 144,147 | 154,265 | (5) | (11) | ||||||
| Asset Management | 12,510 | 12,030 | 12,709 | 4 | (2) | ||||||
| Corporate Center | 11,741 | 12,316 | 11,807 | (5) | (1) | ||||||
| Risk-weighted assets | 234,390 | 241,753 | 242,833 | (3) | (3) | ||||||
| For management purposes, the Group allocates to the divisions risk-weighted asset equivalents related to regulatory capital and certain intangible asset deductions from Group tier 1 capital. | |||||||||||
| Capital | |||||||||||
| end of | % change | ||||||||||
| 1Q12 | 4Q11 | 1Q11 | QoQ | YoY | |||||||
| Shareholders' equity (CHF million) | |||||||||||
| Common shares | 49 | 49 | 48 | 0 | 2 | ||||||
| Additional paid-in capital | 22,262 | 21,796 | 22,565 | 2 | (1) | ||||||
| Retained earnings | 27,097 | 27,053 | 26,455 | 0 | 2 | ||||||
| Treasury shares, at cost | 0 | (90) | 0 | 100 | – | ||||||
| Accumulated other comprehensive income/(loss) | (15,823) | (15,134) | (15,011) | 5 | 5 | ||||||
| Total shareholders' equity | 33,585 | 33,674 | 34,057 | 0 | (1) | ||||||
| Goodwill | (8,333) | (8,591) | (8,433) | (3) | (1) | ||||||
| Other intangible assets | (260) | (288) | (294) | (10) | (12) | ||||||
| Tangible shareholders' equity 1 | 24,992 | 24,795 | 25,330 | 1 | (1) | ||||||
| Shares outstanding (million) | |||||||||||
| Common shares issued | 1,224.5 | 1,224.3 | 1,201.0 | 0 | 2 | ||||||
| Treasury shares | 0.0 | (4.0) | 0.0 | 100 | – | ||||||
| Shares outstanding | 1,224.5 | 1,220.3 | 1,201.0 | 0 | 2 | ||||||
| Par value (CHF) | |||||||||||
| Par value | 0.04 | 0.04 | 0.04 | 0 | 0 | ||||||
| Book value per share (CHF) | |||||||||||
| Total book value per share | 27.43 | 27.59 | 28.36 | (1) | (3) | ||||||
| Goodwill per share | (6.81) | (7.04) | (7.02) | (3) | (3) | ||||||
| Other intangible assets per share | (0.21) | (0.23) | (0.24) | (9) | (13) | ||||||
| Tangible book value per share 1 | 20.41 | 20.32 | 21.10 | 0 | (3) | ||||||
| 1 Management believes that tangible shareholders' equity and tangible book value per share, both non-GAAP financial measures, are meaningful as they are measures used and relied upon by industry analysts and investors to assess valuations and capital adequacy. | |||||||||||
Total shareholders’ equity |
| Our total shareholders’ equity decreased to CHF 33.6 billion as of the end of 1Q12 compared to CHF 33.7 billion as of the end of 4Q11. Total shareholders’ equity was impacted by the decrease in other comprehensive income due to the impact of foreign exchange-related movements on cumulative translation adjustments, partially offset by the net effect of share-based compensation, an increase in unrealized gains relating to available-for-sale securities, treasury share purchases and sales and net income in 1Q12. |
| > Refer to the “Consolidated statements of changes in equity (unaudited)” in III – Condensed consolidated financial statements – unaudited for further information on shareholders’ equity. |
Capital issuances and redemptions |
| In March 2012, pursuant to a tender offer, we repurchased for CHF 4.7 billion outstanding hybrid tier 1 instruments and tier 2 instruments, which will no longer qualify for regulatory capital treatment under the Basel III framework. |
| In March 2012, we completed an issuance of CHF 750 million, 7.125% tier 2 buffer capital notes due in 2022. The tier 2 buffer capital notes will be converted into ordinary Group shares if, prior to Basel III, our core tier 1 ratio falls below 7% or, under Basel III, our common equity tier 1 (CET1) ratio falls below 7%. The tier 2 buffer capital notes may be redeemed by the issuer in March 2017. |
Regulatory capital developments and proposals |
| The BCBS issued the Basel III framework, with higher minimum capital requirements and new conservation and countercyclical buffers, revised risk-based capital measures, a leverage ratio and liquidity standards. Prior to its issuance, the proposed BCBS framework was endorsed by the Group of Twenty Finance Ministers and Central Bank Governors (G-20) in November 2010. Each G-20 nation will need to implement the rules, and stricter or different requirements may be adopted by any G-20 nation. The framework was designed to strengthen the resilience of the banking sector. The new capital standards and capital buffers will require banks to hold more capital, mainly in the form of common equity. The new capital standards will be phased in from January 1, 2013 through January 1, 2019. |
| The Swiss “Too Big to Fail” legislation relating to big banks became effective March 1, 2012. The legislation includes capital and liquidity requirements and rules regarding risk diversification and emergency plans designed to maintain systemically important functions even in the event of threatened insolvency. The legislation on capital requirements builds on Basel III, but goes beyond its minimum standards, requiring the Group and the Bank to have common equity of at least 10% of RWA and contingent capital or other qualifying capital of another 9% of RWA by January 1, 2019. |
| Draft implementing ordinances further detailing the requirements of the “Too Big to Fail” legislation were submitted by the Federal government for public comment in December 2011. The “Too Big to Fail” ordinances implementing the legislation must be adopted by the Federal Council and approved by the Swiss Parliament. The ordinances implementing the legislation are expected to be completed in 2012. The new requirements are to be gradually implemented through the end of 2018. One such draft ordinance includes a provision whereby Swiss banks which qualify as a systemically important financial institution would be required to comply with certain leverage ratio requirements effective January 1, 2013, which is earlier than required under Basel III. |
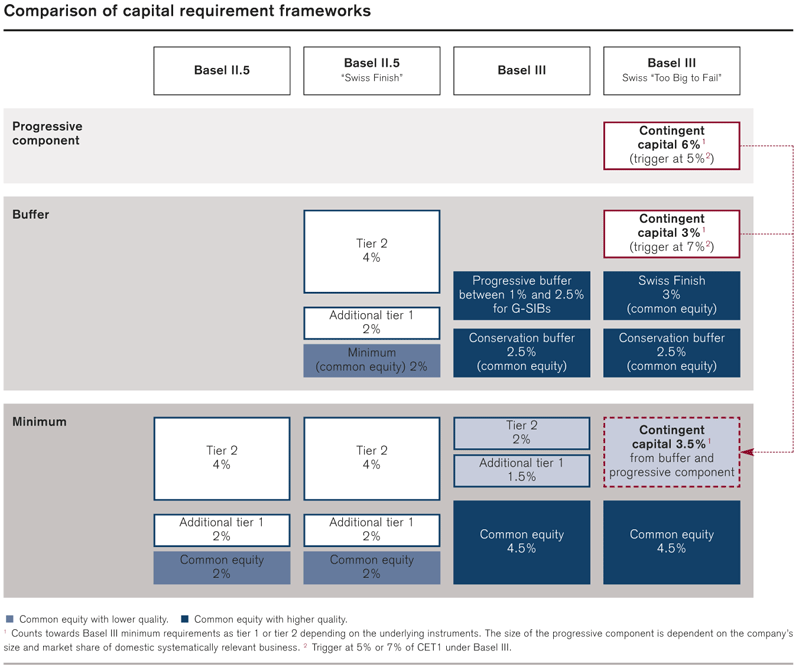 |
| The Swiss Federal Department of Finance initiated hearings in November 2011 to introduce a variable countercyclical capital buffer for all banks, in line with Basel III, in order to strengthen the banking sector’s resilience towards the associated risks during periods of excess credit growth. The countercyclical capital buffer is expected to consist of a maximum of 2.5% of RWA and would be activated and subsequently deactivated by the Federal Council upon request of the Swiss National Bank after consultation with FINMA. The Swiss Federal Department of Finance has proposed that this countercyclical buffer be implemented in 2012. |
| Credit Suisse believes that it can meet the new requirements within the prescribed time frames by building capital through earnings and by issuing contingent capital or other qualifying instruments. |
| > Refer to “Regulatory capital developments and proposals” in III – Treasury, Risk, Balance sheet and Off-balance sheet – Treasury management and “Regulation and supervision” in I – Information on the company in the Credit Suisse Annual Report 2011 for further information, including BCBS Basel III phase-in arrangements. |
| > Refer to the chart “Comparison of capital requirements frameworks” for further information on the new capital conservation buffer. |
Basel III common equity tier 1 (CET1) ratio simulation |
| As Basel III will not be implemented before January 1, 2013, we have calculated our Basel III RWA and capital for purposes of this report in accordance with the currently proposed requirements and our current interpretation of such requirements, including relevant assumptions. Changes in the actual implementation of Basel III would result in different numbers from those shown in this report. |
| We estimate the RWA increase due to Basel III on January 1, 2013 to be CHF 60 billion. We expect substantially all of the Basel III RWA increase to be in the securitized products, global rates, global credit products and equity derivatives businesses in Investment Banking. We expect to reduce Basel III RWA by approximately CHF 14 billion primarily in global rates, securitized products, global credit products, emerging markets and exit businesses in Investment Banking. The RWA reduction reflects our evolving strategy, including the RWA reduction in fixed income. |
| > Refer to “Progress on strategy implementation” in I – Credit Suisse results – Core Results. |
| In addition to the consensus net income and the dividend assumption for 2012, the CET1 ratio simulation assumes a CHF 1.9 billion benefit from the expected settlement of share-based compensation with shares issued from conditional capital and from other expected movements and deductions in regulatory capital in 2012. Within these parameters, we estimate that our CET1 ratio as of January 1, 2013 will be approximately 13.1%. The following presentation is consistent with the phase-in requirements of Basel III. |
| CET1 ratio simulation | |||
| Capital development (CHF billion) | |||
| Total shareholders' equity – March 31, 2012 | 33.6 | ||
| Regulatory deductions: | |||
| Fair value own debt 1 | (1.1) | ||
| Dividend accrual 2 | (0.8) | ||
| CET1 capital – March 31, 2012 | 31.7 | ||
| Consensus net income 2012 3 | 3.2 | ||
| Dividend assumption 2012 4 | (0.2) | ||
| Share-based compensation and other impacts | 1.9 | ||
| CET1 capital – January 1, 2013 | 36.6 | ||
| Risk-weighted assets (RWA) development (CHF billion) | |||
| RWA (Basel II.5) – March 31, 2012 | 234 | ||
| Estimated Basel III changes | 60 | ||
| RWA (Basel III before reduction) | 294 | ||
| Reduction of RWA | (14) | ||
| RWA (Basel III) – January 1, 2013 5 | 280 | ||
| Capital ratio (%) | |||
| CET1 ratio - January 1, 2013 | 13.1 | ||
| 1 Fair value own debt represents the fair value changes from movements in spreads on our own vanilla debt and structured notes, net of tax. 2 Represents the proposal of the Board of Directors to the Annual General Meeting on April 27, 2012, to be paid out of reserves from capital contributions. 3 Bloomberg consensus net income estimate is not endorsed or verified and is used solely for illustrative purposes. Actual net income may differ significantly. 4 Assumed to be the same as the dividend accrual in 1Q12 and is used solely for illustrative purposes. Actual dividends may differ significantly. 5 Under our strategic business plan, business growth will require reallocation of capital, because we are targeting no gross increase in risk-weighted assets. | |||
| For the years 2014 – 2018, there will be a five-year (20% per annum) phase in of goodwill and other Basel III capital deductions (e.g., deferred tax assets and participations in financial institutions). Assuming a fully phased in CHF 8.6 billion of goodwill and CHF 8.2 billion of other capital deductions, the CET1 ratio is estimated to be 7.0% as of January 1, 2013. |
Risk management |
| In 1Q12, our utilized economic capital decreased 5%, overall position risk decreased 7%, average risk management VaR in USD decreased 12% and impaired loans were stable at CHF 1.7 billion. |
Economic capital and position risk |
| Economic capital is used as a consistent and comprehensive tool for risk management, capital management and performance measurement. It is our core Group-wide risk management tool for measuring and reporting all quantifiable risks. Economic capital measures risks in terms of economic realities rather than regulatory or accounting rules and is the estimated capital needed to remain solvent and in business, even under extreme market, business and operational conditions, given our target financial strength (our long-term credit rating). |
| We regularly review our economic capital methodology in order to ensure that the model remains relevant as markets and business strategies evolve. In 1Q12, we made two enhancements to the position risk methodology for risk management purposes. We recalibrated the modeling of private equity exposures within equity trading & investments, including refinements to shock calculation and market data. Within international lending & counterparty exposures, we aligned certain credit risk parameters with an updated FINMA-approved regulatory capital model. Prior-period balances have been restated for the 1Q12 methodology changes in order to show meaningful trends. The total impact of the 1Q12 methodology changes on position risk for the Group as of the end of 4Q11 was a decrease of CHF 441 million, or 4%. |
| For utilized economic capital used for capital management purposes, in addition to adopting the above position risk methodology changes, we increased our operational risk charge to fully reflect expected impacts from the recently initiated modeling review for regulatory capital purposes. Prior-period balances have been restated for the 1Q12 position risk and operational risk methodology changes in order to show meaningful trends. The total impact of these methodology changes on utilized economic capital for the Group as of the end of 4Q11 was a decrease of CHF 465 million, or 1%. |
| > Refer to “Economic capital and position risk” in III – Treasury, Risk, Balance sheet and Off-balance sheet – Risk management in the Credit Suisse Annual Report 2011 for further information on economic capital and position risk. |
| Position risk |
| end of | % change | ||||||||||
| 1Q12 | 4Q11 | 1Q11 | QoQ | YoY | |||||||
| Position risk (CHF million) | |||||||||||
| Fixed income trading 1 | 2,674 | 2,778 | 2,468 | (4) | 8 | ||||||
| Equity trading & investments | 2,099 | 2,123 | 2,219 | (1) | (5) | ||||||
| Private banking corporate & retail lending | 2,085 | 2,182 | 2,017 | (4) | 3 | ||||||
| International lending & counterparty exposures | 3,892 | 4,341 | 4,224 | (10) | (8) | ||||||
| Emerging markets country event risk | 928 | 860 | 579 | 8 | 60 | ||||||
| Real estate & structured assets 2 | 2,155 | 2,111 | 2,616 | 2 | (18) | ||||||
| Simple sum across risk categories | 13,833 | 14,395 | 14,123 | (4) | (2) | ||||||
| Diversification benefit 3 | (2,894) | (2,646) | (2,644) | 9 | 9 | ||||||
| Position risk (99% confidence level for risk management purposes) | 10,939 | 11,749 | 11,479 | (7) | (5) | ||||||
| Prior-period balances have been restated for methodology changes in order to show meaningful trends. | |||||||||||
| 1 This category comprises fixed income trading, foreign exchange and commodity exposures. 2 This category comprises commercial and residential real estate (including RMBS and CMBS), ABS exposure, real estate acquired at auction and real estate fund investments. 3 Reflects the net difference between the sum of the position risk categories and the position risk on the total portfolio. | |||||||||||
Key position risk trends |
| Position risk for risk management purposes as of the end of 1Q12 decreased 7% compared to the end of 4Q11. Excluding the US dollar translation impact, position risk decreased 4%, mainly due to lower investment grade counterparty risk in international lending & counterparty exposures in Investment Banking and decreased mortgage and commercial loan risk in private banking corporate & retail lending. These decreases were partially offset by higher risk in real estate & structured assets due to an increase in RMBS exposure and the unwinding of index hedges, and increased exposures in Latin America in emerging markets country event risk. |
| Compared to the end of 1Q11, position risk for risk management purposes decreased 5%, primarily due to lower RMBS exposure following sales in real estate & structured assets, decreased counterparty risk in international lending & counterparty exposures and lower private equity exposure in equity trading & investments. These reductions were partially offset by increased exposures in Latin America and Eastern Europe in emerging markets country event risk and higher interest rate and foreign exchange exposures in fixed income trading. |
| As part of our overall risk management, we hold a portfolio of hedges. Hedges are impacted by market movements similar to other trading securities and may result in gains or losses which offset losses or gains on the portfolio they were designated to hedge. Due to the varying nature and structure of hedges, these gains or losses may not perfectly offset the losses or gains on the portfolio. |
| Economic capital |
| in / end of | % change | ||||||||||
| 1Q12 | 4Q11 | 1Q11 | QoQ | YoY | |||||||
| Economic capital resources (CHF million) | |||||||||||
| Tier 1 capital 1 | 36,668 | 36,844 | 35,771 | 0 | 3 | ||||||
| Economic adjustments 2 | 2,521 | 2,417 | 6,151 | 4 | (59) | ||||||
| Economic capital resources | 39,189 | 39,261 | 41,922 | 0 | (7) | ||||||
| Utilized economic capital (CHF million) | |||||||||||
| Position risk (99.97% confidence level) | 19,470 | 20,921 | 20,339 | (7) | (4) | ||||||
| Operational risk | 3,754 | 3,754 | 3,468 | 0 | 8 | ||||||
| Other risks 3 | 8,019 | 8,300 | 7,579 | (3) | 6 | ||||||
| Utilized economic capital | 31,243 | 32,975 | 31,386 | (5) | 0 | ||||||
| Utilized economic capital by segment (CHF million) | |||||||||||
| Private Banking | 7,229 | 7,519 | 7,078 | (4) | 2 | ||||||
| Investment Banking | 19,030 | 20,310 | 19,891 | (6) | (4) | ||||||
| Asset Management | 3,065 | 3,224 | 3,329 | (5) | (8) | ||||||
| Corporate Center 4 | 1,937 | 1,927 | 1,108 | 1 | 75 | ||||||
| Utilized economic capital - Credit Suisse 5 | 31,243 | 32,975 | 31,386 | (5) | 0 | ||||||
| Average utilized economic capital by segment (CHF million) | |||||||||||
| Private Banking | 7,374 | 7,365 | 6,846 | 0 | 8 | ||||||
| Investment Banking | 19,670 | 19,813 | 19,243 | (1) | 2 | ||||||
| Asset Management | 3,145 | 3,207 | 3,337 | (2) | (6) | ||||||
| Corporate Center 4 | 1,932 | 1,924 | 1,109 | 0 | 74 | ||||||
| Average utilized economic capital - Credit Suisse 6 | 32,109 | 32,303 | 30,516 | (1) | 5 | ||||||
| Prior-period balances have been restated for methodology changes in order to show meaningful trends. | |||||||||||
| 1 Reported under Basel II.5 for all periods presented. 2 Primarily includes securitization adjustments, anticipated dividends (of which 50% is assumed in 1Q12 and 4Q11 to be distributed in shares) and unrealized gains on owned real estate. Economic adjustments are made to tier 1 capital to enable comparison between capital utilization and resources under the Basel framework. 3 Includes owned real estate risk, expense risk, pension risk, foreign exchange risk between economic capital resources and utilized economic capital, interest rate risk on treasury positions, diversification benefit and an estimate for the impacts of certain methodology changes planned for 2012. 4 Includes primarily expense risk diversification benefits from the divisions and foreign exchange risk between economic capital resources and utilized economic capital. 5 Includes a diversification benefit of CHF 18 million, CHF 5 million and CHF 20 million as of the end of 1Q12, 4Q11, and 1Q11, respectively. 6 Includes a diversification benefit of CHF 12 million, CHF 6 million and CHF 19 million as of the end of 1Q12, 4Q11 and 1Q11, respectively. | |||||||||||
Utilized economic capital trends |
| In 1Q12, our utilized economic capital decreased 5%, mainly due to decreased position risk and lower owned real estate risk in other risks. |
| For Private Banking, utilized economic capital decreased 4%, mainly due to higher economic benefits in relation to our deferred share-based compensation awards in other risks, and decreased position risk for private banking corporate & retail lending. |
| For Investment Banking, utilized economic capital decreased 6%, largely due to decreased position risk in international lending & counterparty exposures and fixed income trading. The decrease was partially offset by lower economic benefits in relation to our deferred share-based compensation awards in other risks. |
| For Asset Management, utilized economic capital decreased 5%, primarily due to decreased position risk in equity trading & investments, and higher economic benefits in relation to our deferred share-based compensation awards in other risks. |
| Corporate Center utilized economic capital was stable. |
Market risk |
Trading portfolios |
| We primarily assume market risk through the trading activities in Investment Banking. The other divisions also engage in trading activities, but to a much lesser extent. Trading risks are measured using VaR along with a number of other risk measurement tools. VaR measures the potential loss in fair value of trading positions due to adverse market movements over a defined time horizon at a specified confidence level. VaR relies on historical data and is considered a useful tool for estimating potential loss in normal markets in which there are no abrupt changes in market conditions. We use risk management VaR for internal risk management purposes and regulatory VaR for regulatory capital purposes. For risk management VaR, we use a one-day holding period and a 98% confidence level. This means there is a 1-in-50 chance of incurring a daily mark-to-market trading loss at least as large as the reported VaR. For regulatory VaR, we present one-day, 99% VaR, which is a ten-day VaR adjusted to a one-day holding period. Our VaR methodology is the same for both VaR measures, except for the confidence levels and holding periods. Other tools, including stress testing, are more appropriate for modeling the impact from severe market conditions. |
| We regularly review our VaR model to ensure that it remains appropriate given evolving market conditions and the composition of our trading portfolio. |
| For regulatory capital purposes, we operate under the Basel II.5 market risk framework which includes an incremental risk charge and stressed VaR. |
| > Refer to “Market risk” in III – Treasury, Risk, Balance sheet and Off-balance sheet – Risk management in the Credit Suisse Annual Report 2011 for further information. |
| In order to show the aggregate market risk in our trading books, the chart entitled “Daily risk management VaR” shows the trading-related market risk on a consolidated basis. |
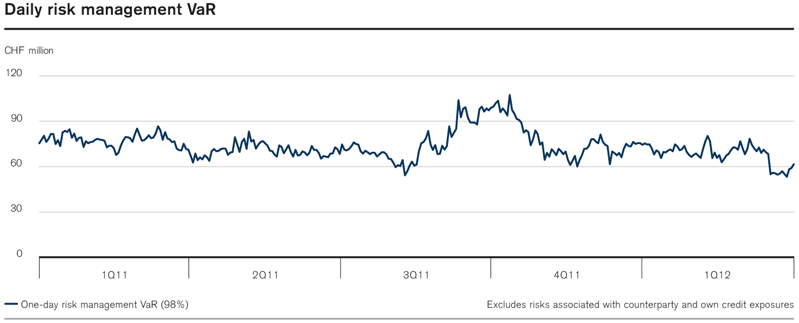 |
| One-day, 98% risk management VaR and one-day, 99% regulatory VaR (CHF) |
| Risk management VaR (98%) | Regulatory VaR (99%) | ||||||||||||||
in / end of | Interest rate & credit spread | Foreign exchange | Commodity | Equity | Diversi- fication benefit | Total | Total | ||||||||
| 1Q12 (CHF million) | |||||||||||||||
| Average | 72 | 18 | 4 | 22 | (48) | 68 | 69 | ||||||||
| Minimum | 59 | 9 | 2 | 14 | – | 1 | 53 | 48 | |||||||
| Maximum | 82 | 26 | 7 | 35 | – | 1 | 80 | 89 | |||||||
| End of period | 61 | 26 | 3 | 17 | (46) | 61 | 55 | ||||||||
| 4Q11 (CHF million) | |||||||||||||||
| Average | 75 | 14 | 3 | 23 | (38) | 77 | 71 | ||||||||
| Minimum | 59 | 7 | 2 | 18 | – | 1 | 60 | 49 | |||||||
| Maximum | 99 | 24 | 5 | 28 | – | 1 | 107 | 89 | |||||||
| End of period | 73 | 12 | 4 | 25 | (40) | 74 | 79 | ||||||||
| 1Q11 (CHF million) | |||||||||||||||
| Average | 81 | 14 | 18 | 22 | (58) | 77 | 132 | ||||||||
| Minimum | 72 | 8 | 14 | 14 | – | 1 | 67 | 103 | |||||||
| Maximum | 91 | 19 | 26 | 47 | – | 1 | 86 | 161 | |||||||
| End of period | 80 | 18 | 14 | 24 | (65) | 71 | 120 | ||||||||
| Excludes risks associated with counterparty and own credit exposures. In June 2011, we made significant changes to our VaR methodology. Risk management VaR for periods prior to implementation has been restated in order to show meaningful trends. For regulatory VaR, these methodology changes have been reflected from implementation only. | |||||||||||||||
| 1 As the maximum and minimum occur on different days for different risk types, it is not meaningful to calculate a portfolio diversification benefit. | |||||||||||||||
| One-day, 98% risk management VaR and one-day, 99% regulatory VaR (USD) |
| Risk management VaR (98%) | Regulatory VaR (99%) | ||||||||||||||
in / end of | Interest rate & credit spread | Foreign exchange | Commodity | Equity | Diversi- fication benefit | Total | Total | ||||||||
| 1Q12 (USD million) | |||||||||||||||
| Average | 78 | 20 | 4 | 23 | (51) | 74 | 75 | ||||||||
| Minimum | 64 | 9 | 2 | 15 | – | 1 | 59 | 53 | |||||||
| Maximum | 90 | 29 | 8 | 37 | – | 1 | 88 | 97 | |||||||
| End of period | 68 | 29 | 3 | 19 | (51) | 68 | 60 | ||||||||
| 4Q11 (USD million) | |||||||||||||||
| Average | 82 | 15 | 3 | 25 | (41) | 84 | 78 | ||||||||
| Minimum | 64 | 8 | 2 | 20 | – | 1 | 65 | 55 | |||||||
| Maximum | 107 | 26 | 5 | 32 | – | 1 | 116 | 97 | |||||||
| End of period | 77 | 13 | 4 | 27 | (42) | 79 | 84 | ||||||||
| 1Q11 (USD million) | |||||||||||||||
| Average | 86 | 15 | 19 | 24 | (62) | 82 | 140 | ||||||||
| Minimum | 75 | 8 | 15 | 15 | – | 1 | 71 | 114 | |||||||
| Maximum | 99 | 20 | 27 | 51 | – | 1 | 94 | 177 | |||||||
| End of period | 87 | 19 | 15 | 26 | (70) | 77 | 130 | ||||||||
| Excludes risks associated with counterparty and own credit exposures. In June 2011, we made significant changes to our VaR methodology. Risk management VaR for periods prior to implementation has been restated in order to show meaningful trends. For regulatory VaR, these methodology changes have been reflected from implementation only. | |||||||||||||||
| 1 As the maximum and minimum occur on different days for different risk types, it is not meaningful to calculate a portfolio diversification benefit. | |||||||||||||||
| We measure VaR in US dollars, as substantially all market risk relates to Investment Banking. |
| Average risk management VaR decreased 12% to USD 74 million from 4Q11. The decrease reflected lower risk across fixed income due to narrowing credit spreads and lower market volatility. This was partially offset by increased positions and the unwinding of hedges in securitized products and increased loan inventory in global credit products. Compared to 1Q11, average risk management VaR decreased 10%, primarily reflecting lower risk across fixed income due to lower market volatility and net sales of RMBS client inventory mainly in 3Q11 and 4Q11. |
| Period-end risk management VaR decreased 14% to USD 68 million from 4Q11, mainly reflecting lower market volatility and narrowing credit spreads. Compared to 1Q11, period-end risk management VaR decreased 12%, also mainly reflecting lower market volatility and narrowing credit spreads. |
| Various techniques are used to assess the accuracy of the VaR model used for trading portfolios, including backtesting. We present backtesting using actual daily trading revenues. Actual daily trading revenues are compared with regulatory 99% VaR calculated using a one-day holding period. A backtesting exception occurs when a trading loss exceeds the daily VaR estimate. We had no such backtesting exceptions in 1Q12. FINMA, in line with BIS requirements, uses a multiplier to impose an increase in market risk capital for every regulatory VaR exception over four in the prior rolling 12-month period calculated using a subset of actual daily trading revenues. |
| > Refer to “Capital management” in Treasury management for further information on the use of our regulatory VaR model in the calculation of trading book market risk capital requirements. |
| The histogram entitled “Actual daily trading revenues” compares the actual daily trading revenues for 1Q12 with those for 4Q11 and 1Q11. The dispersion of trading revenues indicates the day-to-day volatility in our trading activities. In 1Q12, we had no trading loss days, compared to 16 days of trading losses in 4Q11. |
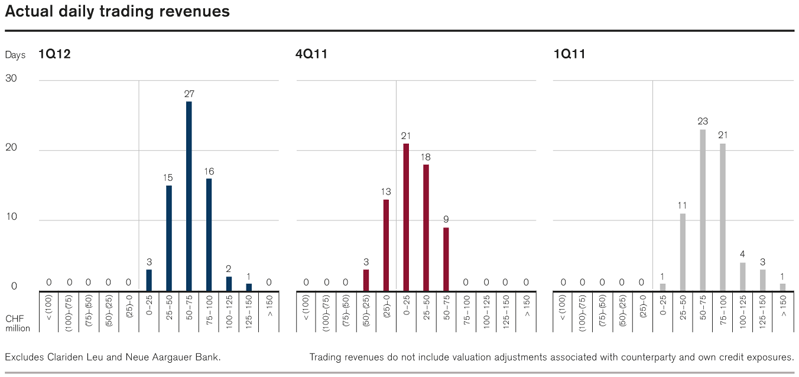 |
Banking portfolios |
| We assume non-trading interest rate risk through interest rate-sensitive positions originated by Private Banking and risk-transferred to Treasury, money market and funding activities by Treasury and the deployment of our consolidated equity as well as other activities, including market making and trading activities involving banking book positions at the divisions, primarily Investment Banking. Savings accounts and many other retail banking products have no contractual maturity date or direct market-linked interest rate and are risk-transferred from Private Banking to Treasury on a pooled basis using replicating portfolios (approximating the re-pricing behavior of the underlying product). Treasury and certain other areas of the Group running interest rate risk positions actively manage the positions within approved limits. |
| The impact of a one basis point parallel increase of the yield curves on the fair value of interest rate-sensitive non-trading book positions would have amounted to a valuation increase of CHF 7.7 million as of the end of 1Q12, compared to a valuation increase of CHF 6.6 million as of the end of 4Q11. |
Credit risk |
| Credit risk is the possibility of a loss being incurred by us as the result of a borrower or counterparty failing to meet its financial obligations or as a result of deterioration in the credit quality of the borrower or counterparty. In the event of a customer default, a bank generally incurs a loss equal to the amount owed by the debtor, less any recoveries from foreclosure, liquidation of collateral, or the restructuring of the debtor company. A change in the credit quality of a counterparty has an impact on the valuation of assets eligible for fair value measurement, with valuation changes recorded in the consolidated statements of operations. |
Sources of credit risk |
| The majority of our credit risk is concentrated in Private Banking and Investment Banking. Credit risk exists within lending products, commitments and letters of credit, and results from counterparty exposure arising from derivatives, foreign exchange and other transactions. |
| Our regular review of the creditworthiness of clients and counterparties does not depend on the accounting treatment of the asset or commitment. Adverse changes in the creditworthiness of counterparties of loans held at fair value are reflected in valuation changes reported directly in revenues, and therefore are not part of the impaired loans balance. |
| > Refer to “Credit risk” in III – Treasury, Risk, Balance sheet and Off-balance sheet – Risk management in the Credit Suisse Annual Report 2011 for further information on credit risk. |
| > Refer to “Note 26 – Financial instruments” in III – Condensed consolidated financial statements – unaudited for further information on counterparty credit risk. |
Selected European credit risk exposures |
| The scope of our disclosure of European credit risk exposure includes all countries of the EU which are rated below AA or its equivalent by at least one of the three major rating agencies and where our gross exposure exceeds our quantitative threshold of EUR 0.5 billion. We believe this external rating is a useful measure in determining the financial ability of countries to meet their financial obligations, including giving an indication of vulnerability to adverse business, financial and economic conditions. |
| The basis for the presentation of the country exposure is our internal risk domicile view. The risk domicile view is based on the domicile of the legal counterparty, i.e., it may include exposure to a legal entity domiciled in the reported country where its parent is located outside of the country. |
| The credit risk exposure in the table is presented on a risk-based view. We present our credit risk exposure and related risk mitigation for the following distinct categories: |
| – Gross credit risk exposure includes the principal amount of loans drawn, letters of credit issued and undrawn portions of committed facilities, the positive replacement value (PRV) of derivative instruments after consideration of legally enforceable netting agreements, the notional value of investments in money market funds and the market values of securities financing transactions and the debt cash trading portfolio (short-term securities) netted at issuer level. |
| – Risk mitigation includes CDS and other hedges, guarantees, insurance and collateral (primarily cash, securities and, to a lesser extent, real estate, mainly for Private Banking exposure to corporates & other). Collateral values applied for the calculation of the net exposure are determined in accordance with our risk management policies and reflect applicable margining considerations. |
| – Net credit risk exposurerepresents gross credit risk exposure net of risk mitigation. |
| – Inventoryrepresents the long inventory positions in trading and non-trading physical debt and synthetic positions, each at market value, all netted at issuer level. Physical debt is non-derivative debt positions (e.g., bonds), and synthetic positions are created through over-the-counter (OTC) contracts (e.g., CDS and total return swaps). |
| Our credit risk exposure to these European countries is managed as part of our risk management process. The Group makes use of country limits and performs scenario analyses on a regular basis, which include analyses on our indirect sovereign credit risk exposures from our exposures to selected European financial institutions. |
| Selected European credit risk exposures |
| Gross credit risk exposure | Risk mitigation | Net credit risk exposure | Inventory | Total credit risk exposure | |||||||||||
| end of 1Q12 | CDS | Other | 1 | Gross | Net | ||||||||||
| Greece (EUR billion) | |||||||||||||||
| Sovereigns | 0.2 | 0.0 | 0.2 | 0.0 | 0.0 | 0.2 | 0.0 | ||||||||
| Financial institutions | 0.1 | 0.0 | 0.1 | 0.0 | 0.0 | 0.1 | 0.0 | ||||||||
| Corporates & other | 0.5 | 0.0 | 0.4 | 0.1 | 0.0 | 0.5 | 0.1 | ||||||||
| Total | 0.8 | 0.0 | 0.7 | 0.1 | 0.0 | 0.8 | 0.1 | ||||||||
| Ireland (EUR billion) | |||||||||||||||
| Sovereigns | 0.0 | 0.0 | 0.0 | 0.0 | 0.0 | 0.0 | 0.0 | ||||||||
| Financial institutions | 1.6 | 0.0 | 1.2 | 0.4 | 0.1 | 1.7 | 0.5 | ||||||||
| Corporates & other | 0.7 | 0.0 | 0.4 | 0.3 | 0.0 | 0.7 | 0.3 | ||||||||
| Total | 2.3 | 0.0 | 1.6 | 0.7 | 0.1 | 2.4 | 0.8 | ||||||||
| Italy (EUR billion) | |||||||||||||||
| Sovereigns | 3.9 | 2.5 | 0.4 | 1.0 | 0.1 | 4.0 | 1.1 | ||||||||
| Financial institutions | 2.2 | 0.0 | 1.6 | 0.6 | 0.3 | 2.5 | 0.9 | ||||||||
| Corporates & other | 2.2 | 0.3 | 1.2 | 0.7 | 0.2 | 2.4 | 0.9 | ||||||||
| Total | 8.3 | 2.8 | 3.2 | 2.3 | 0.6 | 8.9 | 2.9 | ||||||||
| Portugal (EUR billion) | |||||||||||||||
| Sovereigns | 0.2 | 0.2 | 0.0 | 0.0 | 0.0 | 0.2 | 0.0 | ||||||||
| Financial institutions | 0.1 | 0.0 | 0.1 | 0.0 | 0.0 | 0.1 | 0.0 | ||||||||
| Corporates & other | 0.2 | 0.0 | 0.1 | 0.1 | 0.0 | 0.2 | 0.1 | ||||||||
| Total | 0.5 | 0.2 | 0.2 | 0.1 | 0.0 | 0.5 | 0.1 | ||||||||
| Spain (EUR billion) | |||||||||||||||
| Sovereigns | 0.0 | 0.0 | 0.0 | 0.0 | 0.0 | 0.0 | 0.0 | ||||||||
| Financial institutions | 1.4 | 0.0 | 1.1 | 0.3 | 0.3 | 1.7 | 0.6 | ||||||||
| Corporates & other | 1.8 | 0.2 | 0.7 | 0.9 | 0.1 | 1.9 | 1.0 | ||||||||
| Total | 3.2 | 0.2 | 1.8 | 1.2 | 0.4 | 3.6 | 1.6 | ||||||||
| Total (EUR billion) | |||||||||||||||
| Sovereigns | 4.3 | 2.7 | 0.6 | 1.0 | 0.1 | 4.4 | 1.1 | ||||||||
| Financial institutions | 5.4 | 0.0 | 4.1 | 1.3 | 0.7 | 6.1 | 2.0 | ||||||||
| Corporates & other | 5.4 | 0.5 | 2.8 | 2.1 | 0.3 | 5.7 | 2.4 | ||||||||
| Total | 15.1 | 3.2 | 7.5 | 4.4 | 1.1 | 16.2 | 5.5 | ||||||||
| 1 Includes other hedges (derivative instruments), guarantees, insurance and collateral. | |||||||||||||||
| On a gross basis, before taking into account risk mitigation, our risk-based sovereign credit risk exposure to Greece, Ireland, Italy, Portugal and Spain as of the end of 1Q12 was EUR 16.2 billion. Our net exposure to these sovereigns was EUR 5.5 billion. Our non-sovereign risk-based credit risk exposure in these countries as of the end of 1Q12 included net exposure to financial institutions of EUR 2.0 billion and to corporates and other counterparties of EUR 2.4 billion. A significant majority of the purchased credit protection is transacted with banks outside of the disclosed countries; otherwise such credit risk is reflected in the gross and net exposure to each relevant country. |
| In 1Q12, the long-term sovereign debt ratings of the countries listed in the table were affected as follows: Standard & Poor’s lowered the rating by two notches for Italy to BBB+ from A, for Portugal to BB from BBB– and for Spain to A from AA–. Fitch lowered Italy’s rating to A– from A+ and Spain’s to A from AA–, and increased Greece’s rating to B– after an RD (restricted default) rating in March and a C rating in February 2012. Moody’s downgraded Italy to A3 from A2, Portugal to Ba3 from Ba2, Spain to A3 from A1 and Greece to C from Ca. The rating changes did not have a significant impact on the Group’s financial condition, result of operations, liquidity or capital resources. |
Credit risk overview |
| The following table represents credit risk from loans, loan commitments and certain other contingent liabilities, loans held-for-sale, traded loans and derivative instruments before consideration of risk mitigation such as cash collateral and marketable securities or credit hedges. Loan commitments include irrevocable credit facilities for Investment Banking and Private Banking and unused credit limits which can be revoked at our sole discretion upon notice to the client in Private Banking. |
| Credit risk |
| end of | % change | ||||||||||
| 1Q12 | 4Q11 | 1Q11 | QoQ | YoY | |||||||
| Balance sheet (CHF million) | |||||||||||
| Gross loans | 232,655 | 234,357 | 223,516 | (1) | 4 | ||||||
| Loans held-for-sale | 20,147 | 20,457 | 25,514 | (2) | (21) | ||||||
| Traded loans | 3,603 | 3,581 | 4,400 | 1 | (18) | ||||||
| Derivative instruments 1 | 47,744 | 56,254 | 45,426 | (15) | 5 | ||||||
| Total balance sheet | 304,149 | 314,649 | 298,856 | (3) | 2 | ||||||
| Off-balance sheet (CHF million) | |||||||||||
| Loan commitments 2 | 218,199 | 220,560 | 217,800 | (1) | 0 | ||||||
| Credit guarantees and similar instruments | 17,034 | 7,348 | 5,720 | 132 | 198 | ||||||
| Irrevocable commitments under documentary credits | 4,747 | 5,687 | 4,522 | (17) | 5 | ||||||
| Total off-balance sheet | 239,980 | 233,595 | 228,042 | 3 | 5 | ||||||
| Total credit risk | 544,129 | 548,244 | 526,898 | (1) | 3 | ||||||
| Before risk mitigation, for example, collateral, credit hedges. | |||||||||||
| 1 Positive replacement value after netting agreements. 2 Includes CHF 133 billion, CHF 138 billion and CHF 137 billion of unused credit limits as of the end of 1Q12, 4Q11 and 1Q11, respectively, which were revocable at our sole discretion upon notice to the client. | |||||||||||
Loan exposure |
| Compared to the end of 4Q11, gross loans decreased CHF 1.7 billion to CHF 232.7 billion. In Private Banking, gross loans were stable at CHF 198.3 billion, primarily reflecting increases in residential and commercial mortgages, mainly in Switzerland, partially offset by the US dollar translation impact across all loan portfolios. Gross loans in Investment Banking decreased 8% to CHF 34.2 billion, reflecting reduced lending activities due to market conditions and the US dollar translation impact. |
| Gross impaired loans were stable at CHF 1.7 billion as of the end of 1Q12 and reflected reclassifications from potential problem loans to non-performing loans across Private Banking and Investment Banking. A portion of the impaired loans is economically hedged by insurance and other risk mitigation, including CDS. |
| We recorded a net provision for credit losses of CHF 34 million in 1Q12, compared to a net provision of CHF 97 million in 4Q11, with a net provision of CHF 40 million in Private Banking and a net release of CHF 6 million in Investment Banking. |
| > Refer to “Private Banking” and “Investment Banking” in I – Credit Suisse results for further information. |
| Compared to the end of 1Q11, gross loans increased 4%. An increase in Private Banking was primarily due to higher commercial and industrial loans, mortgages and loans to the real estate sector. In Investment Banking, the decrease was mainly related to a decline in loans to financial institutions and lower commercial and industrial loans. Gross impaired loans were stable, as increases in Private Banking were offset by decreases in Investment Banking. |
| Loans |
| Private Banking | Investment Banking | Credit Suisse | 1 | ||||||||||||||||
| end of | 1Q12 | 4Q11 | 1Q11 | 1Q12 | 4Q11 | 1Q11 | 1Q12 | 4Q11 | 1Q11 | ||||||||||
| Loans (CHF million) | |||||||||||||||||||
| Mortgages | 89,598 | 88,255 | 85,449 | 0 | 0 | 0 | 89,598 | 88,255 | 85,449 | ||||||||||
| Loans collateralized by securities | 25,950 | 26,461 | 26,076 | 0 | 0 | 0 | 25,950 | 26,461 | 26,076 | ||||||||||
| Consumer finance | 5,661 | 6,031 | 5,048 | 601 | 664 | 694 | 6,320 | 6,695 | 5,742 | ||||||||||
| Consumer | 121,209 | 120,747 | 116,573 | 601 | 664 | 694 | 121,868 | 121,411 | 117,267 | ||||||||||
| Real estate | 23,648 | 23,287 | 21,558 | 1,957 | 1,898 | 2,288 | 25,605 | 25,185 | 23,846 | ||||||||||
| Commercial and industrial loans | 45,071 | 44,620 | 39,960 | 14,283 | 15,367 | 15,115 | 59,363 | 59,998 | 55,075 | ||||||||||
| Financial institutions | 7,158 | 7,085 | 7,231 | 16,315 | 18,288 | 17,921 | 23,473 | 25,373 | 25,146 | ||||||||||
| Governments and public institutions | 1,261 | 1,278 | 1,232 | 1,085 | 1,112 | 950 | 2,346 | 2,390 | 2,182 | ||||||||||
| Corporate & institutional | 77,138 | 2 | 76,270 | 2 | 69,981 | 2 | 33,640 | 36,665 | 36,274 | 110,787 | 112,946 | 106,249 | |||||||
| Gross loans | 198,347 | 197,017 | 186,554 | 34,241 | 37,329 | 36,968 | 232,655 | 234,357 | 223,516 | ||||||||||
| Net (unearned income) / deferred expenses | (26) | (6) | (7) | (25) | (28) | (25) | (51) | (34) | (32) | ||||||||||
| Allowance for loan losses 3 | (755) | (743) | (752) | (153) | (167) | (222) | (908) | (910) | (974) | ||||||||||
| Net loans | 197,566 | 196,268 | 185,795 | 34,063 | 37,134 | 36,721 | 231,696 | 233,413 | 222,510 | ||||||||||
| Impaired loans (CHF million) | |||||||||||||||||||
| Non-performing loans | 781 | 602 | 677 | 212 | 156 | 266 | 993 | 758 | 943 | ||||||||||
| Non-interest-earning loans | 200 | 230 | 293 | 28 | 32 | 19 | 228 | 262 | 312 | ||||||||||
| Total non-performing and non-interest-earning loans | 981 | 832 | 970 | 240 | 188 | 285 | 1,221 | 1,020 | 1,255 | ||||||||||
| Restructured loans | 0 | 5 | 0 | 8 | 13 | 41 | 8 | 18 | 41 | ||||||||||
| Potential problem loans | 476 | 603 | 324 | 21 | 77 | 100 | 497 | 680 | 424 | ||||||||||
| Total other impaired loans | 476 | 608 | 324 | 29 | 90 | 141 | 505 | 698 | 465 | ||||||||||
| Gross impaired loans 3 | 1,457 | 1,440 | 1,294 | 269 | 278 | 426 | 1,726 | 1,718 | 1,720 | ||||||||||
| of which loans with a specific allowance | 1,274 | 1,286 | 1,098 | 199 | 261 | 392 | 1,473 | 1,547 | 1,490 | ||||||||||
| of which loans without a specific allowance | 183 | 154 | 196 | 70 | 17 | 34 | 253 | 171 | 230 | ||||||||||
| Allowance for loan losses (CHF million) | |||||||||||||||||||
| Balance at beginning of period 3 | 743 | 699 | 782 | 167 | 184 | 235 | 910 | 883 | 1,017 | ||||||||||
| Net movements recognized in statements of operations | 37 | 77 | 13 | (10) | 19 | (1) | 27 | 96 | 12 | ||||||||||
| Gross write-offs | (41) | (51) | (52) | (2) | (42) | (9) | (43) | (93) | (61) | ||||||||||
| Recoveries | 17 | 7 | 7 | 2 | 2 | 1 | 19 | 9 | 8 | ||||||||||
| Net write-offs | (24) | (44) | (45) | 0 | (40) | (8) | (24) | (84) | (53) | ||||||||||
| Provisions for interest | 6 | 4 | 0 | 2 | 4 | 2 | 8 | 8 | 2 | ||||||||||
| Foreign currency translation impact and other adjustments, net | (7) | 7 | 2 | (6) | 0 | (6) | (13) | 7 | (4) | ||||||||||
| Balance at end of period 3 | 755 | 743 | 752 | 153 | 167 | 222 | 908 | 910 | 974 | ||||||||||
| of which individually evaluated for impairment | 561 | 544 | 555 | 106 | 106 | 157 | 667 | 650 | 712 | ||||||||||
| of which collectively evaluated for impairment | 194 | 199 | 197 | 47 | 61 | 65 | 241 | 260 | 262 | ||||||||||
| 1 Includes Asset Management and Corporate Center, in addition to Private Banking and Investment Banking. 2 Includes loans secured by financial collateral and mortgages. The value of financial collateral and mortgages, considered up to the amount of the related loans, was CHF 61,267 million, CHF 62,036 million and CHF 57,698 million as of the end of 1Q12, 4Q11 and 1Q11, respectively. 3 Impaired loans and allowance for loan losses are only based on loans which are not carried at fair value. | |||||||||||||||||||
PAF2 transaction |
| Our results are impacted by the risk of counterparty defaults and the potential for changes in counterparty credit spreads related to our derivative trading activities. In 1Q12, we entered into the 2011 Partner Asset Facility transaction (PAF2 transaction) to hedge the counterparty credit risk of a referenced portfolio of derivatives and their credit spread volatility. The hedge covers approximately USD 12 billion notional amount of expected positive exposure from our counterparties, and is addressed in three layers: (i) first loss (USD 0.5 billion), (ii) mezzanine (USD 0.8 billion) and (iii) senior (USD 11 billion). The first loss element is retained by us and actively managed through normal credit procedures. The mezzanine layer was hedged by transferring the risk of default and counterparty credit spread movements to eligible employees in the form of PAF2 awards, as part of their deferred compensation granted in the annual compensation process. |
| We have purchased protection on the senior layer to hedge against the potential for future counterparty credit spread volatility. This was executed through a CDS, accounted for at fair value, with a third-party entity. We also have a credit support facility with this entity that requires us to provide funding to it in certain circumstances. Under the facility, we may be required to fund payments or costs related to amounts due by the entity under the CDS, and any funded amount may be settled by the assignment of the rights and obligations of the CDS to us. The credit support facility is accounted for on an accrual basis. The transaction overall is a four-year transaction, but can be extended to nine years. We have the right to terminate the third-party transaction for certain reasons, including certain regulatory developments. |
Balance sheet and off-balance sheet |
| Total assets were CHF 1,000.0 billion, total liabilities were CHF 959.2 billion and total equity was CHF 40.9 billion. Both total assets and total liabilities were down 5% for the quarter, driven in both cases by the foreign exchange translation impact and a decrease from operating activities. The majority of our transactions are recorded on our balance sheet, however, we also enter into transactions that give rise to both on and off-balance sheet exposure. |
| Balance sheet summary |
| end of | % change | ||||||||||
| 1Q12 | 4Q11 | 1Q11 | QoQ | YoY | |||||||
| Assets (CHF million) | |||||||||||
| Cash and due from banks | 89,449 | 110,573 | 73,360 | (19) | 22 | ||||||
| Central bank funds sold, securities purchased under resale agreements and securities borrowing transactions | 192,068 | 236,963 | 204,491 | (19) | (6) | ||||||
| Trading assets | 300,597 | 279,553 | 314,201 | 8 | (4) | ||||||
| Net loans | 231,696 | 233,413 | 222,510 | (1) | 4 | ||||||
| Brokerage receivables | 42,801 | 43,446 | 47,275 | (1) | (9) | ||||||
| All other assets | 143,409 | 145,217 | 154,631 | (1) | (7) | ||||||
| Total assets | 1,000,020 | 1,049,165 | 1,016,468 | (5) | (2) | ||||||
| Liabilities and equity (CHF million) | |||||||||||
| Due to banks | 39,035 | 40,147 | 41,113 | (3) | (5) | ||||||
| Customer deposits | 304,943 | 313,401 | 293,295 | (3) | 4 | ||||||
| Central bank funds purchased, securities sold under repurchase agreements and securities lending transactions | 167,457 | 176,559 | 141,078 | (5) | 19 | ||||||
| Trading liabilities | 114,500 | 127,760 | 134,846 | (10) | (15) | ||||||
| Long-term debt | 155,631 | 162,655 | 175,877 | (4) | (12) | ||||||
| Brokerage payables | 67,569 | 68,034 | 64,693 | (1) | 4 | ||||||
| All other liabilities | 110,021 | 119,524 | 122,278 | (8) | (10) | ||||||
| Total liabilities | 959,156 | 1,008,080 | 973,180 | (5) | (1) | ||||||
| Total shareholders' equity | 33,585 | 33,674 | 34,057 | 0 | (1) | ||||||
| Noncontrolling interests | 7,279 | 7,411 | 9,231 | (2) | (21) | ||||||
| Total equity | 40,864 | 41,085 | 43,288 | (1) | (6) | ||||||
| Total liabilities and equity | 1,000,020 | 1,049,165 | 1,016,468 | (5) | (2) | ||||||
Balance sheet |
| Total assets were CHF 1,000.0 billion as of the end of 1Q12, down CHF 49.1 billion, or 5%, from the end of 4Q11, driven by the foreign exchange translation impact and a decrease from operating activities. Excluding the foreign exchange translation impact, total assets decreased CHF 18.9 billion. |
| Compared to the end of 4Q11, central bank funds sold, securities purchased under resale agreements and securities borrowing transactions decreased CHF 44.9 billion, or 19%, primarily driven by decreases in resale and stock borrowing positions and a decrease in reverse repurchase transactions. Cash and due from banks decreased CHF 21.1 billion, or 19%, mainly driven by decreases in central bank holdings. Net loans decreased CHF 1.7 billion, or 1%, reflecting reduced lending activity in Investment Banking, partially offset by increases in residential and commercial mortgages in Private Banking. Brokerage receivables decreased CHF 0.6 billion, or 1%, reflecting decreased client-flow business and the foreign exchange translation impact. Trading assets increased CHF 21.0 billion, or 8%, driven by increases in equity securities across most businesses. All other assets decreased CHF 1.8 billion, or 1%, including decreases of CHF 5.5 billion in other investments and all other assets, partially offset by an increase of CHF 3.6 billion in securities received as collateral. |
| Total liabilities were CHF 959.2 billion as of the end of 1Q12, down CHF 49.0 billion, or 5%, from the end of 4Q11, driven by the foreign exchange translation impact and a decrease from operating activities. Excluding the foreign exchange translation impact, total liabilities decreased CHF 18.6 billion. |
| Compared to the end of 4Q11, trading liabilities decreased CHF 13.3 billion, or 10%, primarily due to decreases in derivative instruments. Central bank funds purchased, securities sold under repurchase agreements and securities lending transactions decreased CHF 9.1 billion, or 5%, mainly driven by the foreign exchange translation impact. Customer deposits decreased CHF 8.5 billion, or 3%, mainly due to decreases in certificates of deposit and time deposits. Long-term debt decreased CHF 7.0 billion, or 4%, mainly reflecting decreases in subordinated debt in connection with the repurchase of outstanding hybrid tier 1 instruments and tier 2 instruments, and decreases in non-recourse liabilities from consolidated VIEs. Due to banks decreased CHF 1.1 billion, or 3%, mainly due to the maturing of deposits. Brokerage payables decreased CHF 0.5 billion, or 1%, mainly due to the foreign exchange translation impact. All other liabilities decreased CHF 9.5 billion, or 8%, including decreases of CHF 9.8 billion in short-term borrowings and CHF 3.3 billion in other liabilities and an increase of CHF 3.6 billion in obligations to return securities received as collateral. |
| > Refer to “Funding sources and uses” and “Capital management” in Treasury management for further information, including on our funding of the balance sheet and the leverage ratio. |
Off-balance sheet |
| We enter into off-balance sheet arrangements in the normal course of business. Off-balance sheet arrangements are transactions or other contractual arrangements with, or for the benefit of, an entity that is not consolidated. These transactions include derivative instruments, guarantees and similar arrangements, retained or contingent interests in assets transferred to an unconsolidated entity in connection with our involvement with special purpose entities (SPEs), and obligations and liabilities (including contingent obligations and liabilities) under variable interests in unconsolidated entities that provide financing, liquidity, credit and other support. |
| > Refer to “Treasury management” in II – Treasury, risk, balance sheet and off-balance sheet in the Credit Suisse Annual Report 2011 and “Note 24 – Guarantees and commitments” and “Note 29 – Litigation” in III – Condensed consolidated financial statements – unaudited for further information. |
Condensed consolidated financial statements – unaudited |
Condensed consolidated financial statements unaudited |
Notes to the condensed consolidated financial statements unaudited |
| On or about May 8, 2012, we will publish and file with the SEC our Financial Report 1Q12, which will include additional disclosures on: |
| –fair value of financial instruments; |
| –loans, allowance for loan losses and credit quality; |
| –derivatives and hedging activities; |
| –investment securities; |
| –guarantees and commitments; |
| –assets pledged or assigned; and |
| –transfers of financial assets and variable interest entities. |
| The accompanying notes to the condensed consolidated financial statements – unaudited are an integral part of these statements. |
Condensed consolidated financial statements – unaudited |
| Consolidated statements of operations (unaudited) |
| in | 1Q12 | 4Q11 | 1Q11 | |||||
| Consolidated statements of operations (CHF million) | ||||||||
| Interest and dividend income | 5,295 | 5,093 | 5,452 | |||||
| Interest expense | (3,411) | (3,436) | (3,699) | |||||
| Net interest income | 1,884 | 1,657 | 1,753 | |||||
| Commissions and fees | 3,172 | 2,757 | 3,671 | |||||
| Trading revenues | 189 | (27) | 2,011 | |||||
| Other revenues | 802 | 101 | 721 | |||||
| Net revenues | 6,047 | 4,488 | 8,156 | |||||
| Provision for credit losses | 34 | 97 | (7) | |||||
| Compensation and benefits | 3,711 | 3,021 | 4,029 | |||||
| General and administrative expenses | 1,653 | 1,879 | 1,632 | |||||
| Commission expenses | 451 | 480 | 536 | |||||
| Total other operating expenses | 2,104 | 2,359 | 2,168 | |||||
| Total operating expenses | 5,815 | 5,380 | 6,197 | |||||
| Income/(loss) before taxes | 198 | (989) | 1,966 | |||||
| Income tax expense/(benefit) | (16) | (397) | 465 | |||||
| Net income/(loss) | 214 | (592) | 1,501 | |||||
| Net income/(loss) attributable to noncontrolling interests | 170 | 45 | 362 | |||||
| Net income/(loss) attributable to shareholders | 44 | (637) | 1,139 | |||||
| Earnings per share (CHF) | ||||||||
| Basic earnings/(loss) per share | 0.03 | (0.62) | 0.91 | |||||
| Diluted earnings/(loss) per share | 0.03 | (0.62) | 0.90 | |||||
| Consolidated statements of comprehensive income (unaudited) |
| in | 1Q12 | 4Q11 | 1Q11 | ||||
| Comprehensive income (CHF million) | |||||||
| Net income/(loss) | 214 | (592) | 1,501 | ||||
| Gains/(losses) on cash flow hedges | 14 | (6) | (17) | ||||
| Foreign currency translation | (1,117) | 909 | (582) | ||||
| Unrealized gains/(losses) on securities | 184 | (8) | (40) | ||||
| Actuarial gains/(losses) | 73 | (699) | 27 | ||||
| Net prior service cost | (22) | 385 | 3 | ||||
| Other comprehensive income/(loss), net of tax | (868) | 581 | (609) | ||||
| Comprehensive income/(loss) | (654) | (11) | 892 | ||||
| Comprehensive income/(loss) attributable to noncontrolling interests | (9) | 268 | 209 | ||||
| Comprehensive income/(loss) attributable to shareholders | (645) | (279) | 683 | ||||
| Consolidated balance sheets (unaudited) |
| end of | 1Q12 | 4Q11 | 1Q11 | ||||
| Assets (CHF million) | |||||||
| Cash and due from banks | 89,449 | 110,573 | 73,360 | ||||
| Interest-bearing deposits with banks | 2,570 | 2,272 | 1,437 | ||||
| Central bank funds sold, securities purchased under resale agreements and securities borrowing transactions | 192,068 | 236,963 | 204,491 | ||||
| Securities received as collateral, at fair value | 33,761 | 30,191 | 37,033 | ||||
| of which encumbered | 21,747 | 20,447 | 20,734 | ||||
| Trading assets, at fair value | 300,597 | 279,553 | 314,201 | ||||
| of which encumbered | 78,605 | 73,749 | 88,210 | ||||
| Investment securities | 5,604 | 5,160 | 6,483 | ||||
| Other investments | 12,294 | 13,226 | 16,166 | ||||
| Net loans | 231,696 | 233,413 | 222,510 | ||||
| of which encumbered | 552 | 471 | 553 | ||||
| allowance for loan losses | (908) | (910) | (974) | ||||
| Premises and equipment | 6,878 | 7,193 | 6,669 | ||||
| Goodwill | 8,333 | 8,591 | 8,433 | ||||
| Other intangible assets | 260 | 288 | 294 | ||||
| Brokerage receivables | 42,801 | 43,446 | 47,275 | ||||
| Other assets | 73,709 | 78,296 | 78,116 | ||||
| of which encumbered | 2,302 | 2,255 | 2,534 | ||||
| Total assets | 1,000,020 | 1,049,165 | 1,016,468 | ||||
| Consolidated balance sheets (unaudited) (continued) |
| end of | 1Q12 | 4Q11 | 1Q11 | ||||
| Liabilities and equity (CHF million) | |||||||
| Due to banks | 39,035 | 40,147 | 41,113 | ||||
| Customer deposits | 304,943 | 313,401 | 293,295 | ||||
| Central bank funds purchased, securities sold under repurchase agreements and securities lending transactions | 167,457 | 176,559 | 141,078 | ||||
| Obligation to return securities received as collateral, at fair value | 33,761 | 30,191 | 37,033 | ||||
| Trading liabilities, at fair value | 114,500 | 127,760 | 134,846 | ||||
| Short-term borrowings | 16,331 | 26,116 | 23,023 | ||||
| Long-term debt | 155,631 | 162,655 | 175,877 | ||||
| Brokerage payables | 67,569 | 68,034 | 64,693 | ||||
| Other liabilities | 59,929 | 63,217 | 62,222 | ||||
| Total liabilities | 959,156 | 1,008,080 | 973,180 | ||||
| Common shares | 49 | 49 | 48 | ||||
| Additional paid-in capital | 22,262 | 21,796 | 22,565 | ||||
| Retained earnings | 27,097 | 27,053 | 26,455 | ||||
| Treasury shares, at cost | 0 | (90) | 0 | ||||
| Accumulated other comprehensive income/(loss) | (15,823) | (15,134) | (15,011) | ||||
| Total shareholders' equity | 33,585 | 33,674 | 34,057 | ||||
| Noncontrolling interests | 7,279 | 7,411 | 9,231 | ||||
| Total equity | 40,864 | 41,085 | 43,288 | ||||
| Total liabilities and equity | 1,000,020 | 1,049,165 | 1,016,468 | ||||
| end of | 1Q12 | 4Q11 | 1Q11 | ||||
| Additional share information | |||||||
| Par value (CHF) | 0.04 | 0.04 | 0.04 | ||||
| Authorized shares (million) | 1,868.1 | 1,868.1 | 1,468.3 | ||||
| Common shares issued (million) | 1,224.5 | 1,224.3 | 1,201.0 | ||||
| Treasury shares (million) | 0.0 | (4.0) | 0.0 | ||||
| Shares outstanding (million) | 1,224.5 | 1,220.3 | 1,201.0 | ||||
| Consolidated statements of changes in equity (unaudited) |
| Attributable to shareholders | |||||||||||||||||||
Common shares | Additional paid-in capital | Retained earnings | Treasury shares, at cost | Accumu- lated other compre- hensive income | Total share- holders' equity | Non- controlling interests | Total equity | Number of common shares outstanding | |||||||||||
| 1Q12 (CHF million) | |||||||||||||||||||
| Balance at beginning of period | 49 | 21,796 | 27,053 | (90) | (15,134) | 33,674 | 7,411 | 41,085 | 1,220,322,988 | 1 | |||||||||
| Purchase of subsidiary shares from non- controlling interests, not changing ownership 2, 3 | – | – | – | – | – | – | (117) | (117) | – | ||||||||||
| Sale of subsidiary shares to noncontrolling interests, not changing ownership 3 | – | – | – | – | – | – | 7 | 7 | – | ||||||||||
| Net income/(loss) | – | – | 44 | – | – | 44 | 170 | 214 | – | ||||||||||
| Total other comprehensive income/(loss), net of tax | – | – | – | – | (689) | (689) | (179) | (868) | – | ||||||||||
| Issuance of common shares | – | 4 | – | – | – | 4 | – | 4 | 180,858 | ||||||||||
| Sale of treasury shares | – | 32 | – | 1,821 | – | 1,853 | – | 1,853 | 74,369,036 | ||||||||||
| Repurchase of treasury shares | – | – | – | (1,734) | – | (1,734) | – | (1,734) | (70,484,278) | ||||||||||
| Share-based compensation, net of tax | – | 397 | 4 | – | 3 | – | 400 | – | 400 | 125,316 | |||||||||
| Financial instruments indexed to own shares 5 | – | 41 | – | – | – | 41 | – | 41 | – | ||||||||||
| Cash dividends paid | – | – | – | – | – | – | (13) | (13) | – | ||||||||||
| Changes in redeemable noncontrolling interests | – | (8) | 6 | – | – | – | (8) | – | (8) | – | |||||||||
| Balance at end of period | 49 | 22,262 | 27,097 | 0 | (15,823) | 33,585 | 7,279 | 40,864 | 1,224,513,920 | 7 | |||||||||
| 1 At par value CHF 0.04 each, fully paid, net of 4,010,074 treasury shares. In addition to the treasury shares, a maximum of 643,807,004 unissued shares (conditional and authorized capital) were available for issuance without further approval of the shareholders. 2 Distributions to owners in funds include the return of original capital invested and any related dividends. 3 Transactions with and without ownership changes related to fund activity are all displayed under "not changing ownership". 4 Includes a net tax benefit of CHF 19 million from the excess fair value of shares delivered over recognized compensation expense. 5 The Group had purchased certain call options on its own shares to economically hedge share-based compensation awards. In accordance with US GAAP, these call options were designated as equity instruments and, as such, were initially recognized in shareholders' equity at their fair values and not subsequently remeasured. 6 Represents the accrued portion of the redemption value of redeemable noncontrolling interests in Credit Suisse Hedging-Griffo Investimentos S.A. Refer to "Other commitments" in Note 24 – Guarantees and commitments for further information. 7 At par value CHF 0.04 each, fully paid. A maximum of 643,620,119 unissued shares (conditional and authorized capital) were available for issuance without further approval of the shareholders. | |||||||||||||||||||
| Consolidated statements of changes in equity (unaudited) (continued) |
| Attributable to shareholders | |||||||||||||||||||
Common shares | Additional paid-in capital | Retained earnings | Treasury shares, at cost | Accumu- lated other compre- hensive income | Total share- holders' equity | Non- controlling interests | Total equity | Number of common shares outstanding | |||||||||||
| 4Q11 (CHF million) | |||||||||||||||||||
| Balance at beginning of period | 48 | 21,159 | 27,804 | 0 | (15,492) | 33,519 | 8,959 | 42,478 | 1,203,003,992 | ||||||||||
| Purchase of subsidiary shares from non- controlling interests, changing ownership | – | 5 | – | – | – | 5 | (101) | (96) | – | ||||||||||
| Purchase of subsidiary shares from non- controlling interests, not changing ownership | – | – | – | – | – | – | (1,664) | (1,664) | – | ||||||||||
| Sale of subsidiary shares to noncontrolling interests, not changing ownership | – | – | – | – | – | – | 28 | 28 | – | ||||||||||
| Net income/(loss) | – | – | (637) | – | – | (637) | 29 | (608) | – | ||||||||||
| Total other comprehensive income/(loss), net of tax | – | – | – | – | 358 | 358 | 223 | 581 | – | ||||||||||
| Issuance of common shares | 1 | 444 | – | – | – | 445 | – | 445 | 21,329,070 | ||||||||||
| Sale of treasury shares | – | (25) | – | 1,653 | – | 1,628 | – | 1,628 | 72,803,244 | ||||||||||
| Repurchase of treasury shares | – | – | – | (1,745) | – | (1,745) | – | (1,745) | (76,904,351) | ||||||||||
| Share-based compensation, net of tax | – | 344 | – | 2 | – | 346 | 1 | 347 | 91,033 | ||||||||||
| Cash dividends paid | – | – | (114) | – | – | (114) | (14) | (128) | – | ||||||||||
| Changes in redeemable noncontrolling interests | – | (131) | – | – | – | (131) | (50) | (181) | – | ||||||||||
| Balance at end of period | 49 | 21,796 | 27,053 | (90) | (15,134) | 33,674 | 7,411 | 41,085 | 1,220,322,988 | ||||||||||
| Consolidated statements of changes in equity (unaudited) (continued) |
| Attributable to shareholders | |||||||||||||||||||
Common shares | Additional paid-in capital | Retained earnings | Treasury shares, at cost | Accumu- lated other compre- hensive income | Total share- holders' equity | Non- controlling interests | Total equity | Number of common shares outstanding | |||||||||||
| 1Q11 (CHF million) | |||||||||||||||||||
| Balance at beginning of period | 47 | 23,026 | 25,316 | (552) | (14,555) | 33,282 | 9,733 | 43,015 | 1,173,946,065 | ||||||||||
| Purchase of subsidiary shares from non- controlling interests, changing ownership | – | (1) | – | – | – | (1) | – | (1) | – | ||||||||||
| Purchase of subsidiary shares from non- controlling interests, not changing ownership | – | – | – | – | – | – | (375) | (375) | – | ||||||||||
| Sale of subsidiary shares to noncontrolling interests, changing ownership | – | (7) | – | – | – | (7) | 7 | – | – | ||||||||||
| Sale of subsidiary shares to noncontrolling interests, not changing ownership | – | – | – | – | – | – | 93 | 93 | – | ||||||||||
| Net income/(loss) | – | – | 1,139 | – | – | 1,139 | 357 | 1,496 | – | ||||||||||
| Total other comprehensive income/(loss), net of tax | – | – | – | – | (456) | (456) | (153) | (609) | – | ||||||||||
| Issuance of common shares | 1 | 622 | – | – | – | 623 | – | 623 | 14,846,351 | ||||||||||
| Sale of treasury shares | – | 138 | – | 4,663 | – | 4,801 | – | 4,801 | 111,799,533 | ||||||||||
| Repurchase of treasury shares | – | – | – | (4,380) | – | (4,380) | – | (4,380) | (105,810,094) | ||||||||||
| Share-based compensation, net of tax | – | (1,071) | – | 269 | – | (802) | (1) | (803) | 6,238,938 | ||||||||||
| Financial instruments indexed to own shares | – | (15) | – | – | – | (15) | – | (15) | – | ||||||||||
| Cash dividends paid | – | – | – | – | – | – | (11) | (11) | – | ||||||||||
| Changes in redeemable noncontrolling interests | – | (127) | – | – | – | (127) | (90) | (217) | – | ||||||||||
| Change in scope of consolidation, net | – | – | – | – | – | – | (329) | (329) | – | ||||||||||
| Balance at end of period | 48 | 22,565 | 26,455 | 0 | (15,011) | 34,057 | 9,231 | 43,288 | 1,201,020,793 | ||||||||||
| Consolidated statements of cash flows (unaudited) |
| in | 1Q12 | 1Q11 | |||
| Operating activities of continuing operations (CHF million) | |||||
| Net income | 214 | 1,501 | |||
| Adjustments to reconcile net income/(loss) to net cash provided by/(used in) operating activities of continuing operations (CHF million) | |||||
| Impairment, depreciation and amortization | 304 | 267 | |||
| Provision for credit losses | 34 | (7) | |||
| Deferred tax provision | (156) | 394 | |||
| Share of net income from equity method investments | 25 | (22) | |||
| Trading assets and liabilities, net | (34,373) | 11,867 | |||
| (Increase)/decrease in other assets | 371 | (9,070) | |||
| Increase/(decrease) in other liabilities | 696 | 4,909 | |||
| Other, net | 2,932 | (888) | |||
| Total adjustments | (30,167) | 7,450 | |||
| Net cash provided by/(used in) operating activities of continuing operations | (29,953) | 8,951 | |||
| Investing activities of continuing operations (CHF million) | |||||
| (Increase)/decrease in interest-bearing deposits with banks | (459) | 84 | |||
| (Increase)/decrease in central bank funds sold, securities purchased under resale agreements and securities borrowing transactions | 36,576 | 11,341 | |||
| Purchase of investment securities | (167) | (807) | |||
| Proceeds from sale of investment securities | 199 | 1,927 | |||
| Maturities of investment securities | 93 | 809 | |||
| Investments in subsidiaries and other investments | (279) | (591) | |||
| Proceeds from sale of other investments | 645 | 778 | |||
| (Increase)/decrease in loans | (727) | (3,918) | |||
| Proceeds from sales of loans | 348 | 69 | |||
| Capital expenditures for premises and equipment and other intangible assets | (315) | (267) | |||
| Proceeds from sale of premises and equipment and other intangible assets | 4 | 2 | |||
| Other, net | 236 | (13) | |||
| Net cash provided by/(used in) investing activities of continuing operations | 36,154 | 9,414 | |||
| Consolidated statements of cash flows (unaudited) (continued) |
| in | 1Q12 | 1Q11 | |||
| Financing activities of continuing operations (CHF million) | |||||
| Increase/(decrease) in due to banks and customer deposits | (4,280) | 11,396 | |||
| Increase/(decrease) in short-term borrowings | (9,007) | 1,511 | |||
| Increase/(decrease) in central bank funds purchased, securities sold under repurchase agreements and securities lending transactions | (2,591) | (23,934) | |||
| Issuances of long-term debt | 13,485 | 13,182 | |||
| Repayments of long-term debt | (18,886) | (11,186) | |||
| Issuances of common shares | 4 | 623 | |||
| Sale of treasury shares | 1,853 | 4,801 | |||
| Repurchase of treasury shares | (1,734) | (4,380) | |||
| Dividends paid/capital repayments | (13) | (11) | |||
| Excess tax benefits related to share-based compensation | 19 | 0 | |||
| Other, net | (4,144) | (862) | |||
| Net cash provided by/(used in) financing activities of continuing operations | (25,294) | (8,860) | |||
| Effect of exchange rate changes on cash and due from banks (CHF million) | |||||
| Effect of exchange rate changes on cash and due from banks | (2,031) | (1,637) | |||
| Net cash provided by/(used in) discontinued operations (CHF million) | |||||
| Net cash provided by/(used in) operating activities of discontinued operations | 0 | 25 | |||
| Net increase/(decrease) in cash and due from banks (CHF million) | |||||
| Net increase/(decrease) in cash and due from banks | (21,124) | 7,893 | |||
| Cash and due from banks at beginning of period | 110,573 | 65,467 | |||
| Cash and due from banks at end of period | 89,449 | 73,360 | |||
| Supplemental cash flow information (unaudited) |
| in | 1Q12 | 1Q11 | |||
| Cash paid for income taxes and interest (CHF million) | |||||
| Cash paid for income taxes | 250 | 450 | |||
| Cash paid for interest | 3,526 | 3,819 | |||
Notes to the condensed consolidated financial statements – unaudited |
| Note 1 Summary of significant accounting policies |
Basis of presentation |
| The accompanying unaudited condensed consolidated financial statements of Credit Suisse Group AG (the Group) are prepared in accordance with accounting principles generally accepted in the US (US GAAP) and are stated in Swiss francs (CHF). These condensed consolidated financial statements should be read in conjunction with the US GAAP consolidated financial statements and notes thereto for the year ended December 31, 2011, included in the Credit Suisse Annual Report 2011. |
| > Refer to “Note 1 – Summary of significant accounting policies” in V – Consolidated financial statements – Credit Suisse Group in the Credit Suisse Annual Report 2011 for a description of the Group’s significant accounting policies. |
| Certain financial information, which is normally included in annual consolidated financial statements prepared in accordance with US GAAP, but not required for interim reporting purposes, has been condensed or omitted. Certain reclassifications have been made to the prior period’s consolidated financial statements to conform to the current period’s presentation. These condensed consolidated financial statements reflect, in the opinion of management, all adjustments that are necessary for a fair presentation of the condensed consolidated financial statements for the periods presented, except with respect to the additional disclosures on fair value of financial instruments, loans, allowance for loan losses and credit quality, derivatives and hedging activities, investment securities, guarantees and commitments, assets pledged or assigned, and transfers of financial assets and VIEs. These disclosures will be included in the Financial Report 1Q12 to be published on our website and filed with the SEC on or about May 8, 2012. The presentation of the 4Q11 consolidated statements of operations and consolidated statements of changes in equity and the 1Q11 consolidated balance sheet have been added for convenience of the reader and are not a required presentation under US GAAP. The results of operations for interim periods are not indicative of results for the entire year. |
| In preparing these condensed consolidated financial statements, management is required to make estimates and assumptions which affect the reported amounts of assets and liabilities and disclosure of contingent assets and liabilities as of the date of the condensed consolidated balance sheets and the reported amounts of revenues and expenses during the reporting period. Actual results could differ from those estimates. |
| Note 2 Recently issued accounting standards |
Recently adopted accounting standards |
| The following provides the most relevant recently adopted accounting standards. |
| > Refer to “Note 2 – Recently issued accounting standards” in V – Consolidated financial statements – Credit Suisse Group in the Credit Suisse Annual Report 2011 for a description of accounting standards adopted in 2011. |
| ASC Topic 220 – Comprehensive Income |
| In December 2011, the Financial Accounting Standards Board (FASB) issued Accounting Standards Update (ASU) 2011-12, “Deferral of the Effective Date for Amendments to the Presentation of Reclassifications of Items Out of Accumulated Other Comprehensive Income in Accounting Standards Update No. 2011-05” (ASU 2011-12), an update to Accounting Standards Codification (ASC) Topic 220 – Comprehensive Income. The amendment delays the effective date of those changes in ASU 2011-05 that relate to the presentation of reclassification adjustments. ASU 2011-12 was effective upon issuance and its adoption did not impact the Group’s financial condition, results of operations or cash flows. |
| In June 2011, the FASB issued ASU 2011-05, “Presentation of Comprehensive Income” (ASU 2011-05), an update to ASC Topic 220 – Comprehensive Income. ASU 2011-05 was issued to improve the comparability, consistency and transparency of financial reporting. The amendment provides the entity with an option to present total comprehensive income either in a single continuous statement or in two separate but consecutive statements. The amendments do not change the items that must be reported in other comprehensive income. ASU 2011-05 was required to be applied retrospectively and is effective for interim and annual reporting periods beginning after December 15, 2011. ASU 2011-05 is an update only for presentation purposes and as such its adoption on January 1, 2012 did not impact the Group’s financial position, results of operations or cash flows. |
| ASC Topic 350 – Intangibles – Goodwill and Other |
| In September 2011, the FASB issued ASU 2011-08, “Testing Goodwill for Impairment” (ASU 2011-08), an update to ASC Topic 350 – Intangibles – Goodwill and Other. The amendments in ASU 2011-08 permit an entity to qualitatively assess whether the fair value of the reporting unit is less than the carrying amount. Based on the qualitative assessment, if an entity determines that it is more likely than not that the fair value of the reporting unit is less than the carrying amount, then the entity must perform step one of the goodwill impairment test by calculating the fair value of the reporting unit and comparing the fair value to the carrying amount of the reporting unit. If the carrying amount of the reporting unit exceeds its fair value, then the entity is required to perform the second step of the goodwill impairment test to measure the amount of the impairment loss, if any. ASU 2011-08 was required to be applied prospectively for annual and interim goodwill impairment tests performed for fiscal years beginning after December 15, 2011. The adoption of ASU 2011-08 on January 1, 2012 did not have a material impact on the Group’s financial condition, results of operations or cash flows. |
| ASC Topic 820 – Fair Value Measurement |
| In May 2011, the FASB issued ASU 2011-04, “Amendments to Achieve Common Fair Value Measurement and Disclosure Requirements in U.S. GAAP and IFRSs” (ASU 2011-04), an update to ASC Topic 820 – Fair Value Measurement. ASU 2011-04 results in common fair value measurement and disclosure requirements in US GAAP and IFRS. The amendments in ASU 2011-04 include clarifications about the application of existing fair value measurement requirements and changes to principles for measuring fair value. ASU 2011-04 also requires additional disclosures about fair value measurements. ASU 2011-04 was required to be applied prospectively and was effective for interim and annual reporting periods beginning after December 15, 2011. The adoption of ASU 2011-04 on January 1, 2012 did not have a material impact on the Group’s financial condition, results of operations or cash flows. |
| ASC Topic 860 – Transfers and Servicing |
| In April 2011, the FASB issued ASU 2011-03, “Reconsideration of Effective Control for Repurchase Agreements” (ASU 2011-03), an update to ASC Topic 860 – Transfers and Servicing. Current guidance prescribes when an entity may or may not recognize a sale upon the transfer of financial assets subject to repurchase agreements. That determination is based, in part, on whether the entity has maintained effective control over the transferred financial assets. ASU 2011-03 removes from the assessment of effective control the criterion requiring the transferor to have the ability to repurchase or redeem the financial assets. ASU 2011-03 was effective for the first interim or annual reporting period beginning on or after December 15, 2011 and was required to be applied prospectively to transactions or modifications of existing transactions that occur on or after the effective date. The adoption of ASU 2011-03 on January 1, 2012 did not have a material impact on the Group’s financial condition, results of operations or cash flows. |
Standards to be adopted in future periods |
| ASC Topic 210 – Balance Sheet |
| In December 2011, the FASB issued ASU 2011-11, “Disclosures about Offsetting Assets and Liabilities” (ASU 2011-11), an update to ASC Topic 210 – Balance Sheet. ASU 2011-11 is effective for interim and annual reporting periods beginning on or after January 1, 2013. An entity should provide the required disclosures retrospectively for all comparative periods presented. ASU 2011-11 is an update for presentation and as such will not impact the Group’s financial position, results of operation or cash flows. |
| ASC Topic 360 – Property, Plant and Equipment |
| In December 2011, the FASB issued ASU 2011-10, “Derecognition of in Substance Real Estate – a Scope Clarification, a consensus of the FASB Emerging Issues Task Force” (ASU 2011-10), an update to ASC Topic 360 – Property, Plant and Equipment. ASU 2011-10 is effective for interim and annual reporting periods beginning on or after June 15, 2012. The Group is currently evaluating the impact of the adoption of ASU 2011-10 on the Group’s financial condition, results of operations or cash flows. |
| Note 3 Business developments |
| Credit Suisse AG merged with Clariden Leu AG on April 2, 2012, assuming all of its rights and obligations. The process of integrating all the business activities of Clariden Leu is expected to be completed by the end of 2012. |
| In November 2007, Banco de Investimentos Credit Suisse (Brasil) S.A. (Credit Suisse Brazil), a wholly owned subsidiary of Credit Suisse AG, acquired a majority interest (50% plus one share) in Hedging-Griffo Investimentos S.A. (Hedging-Griffo), a leading independent asset management and private banking company in Brazil, and entered into option arrangements in respect of the remaining equity interests in Hedging-Griffo. Credit Suisse Brazil intends to acquire the remaining equity interests in Hedging-Griffo as contemplated under the existing option arrangements. The closing of such acquisition will be subject to regulatory approvals. The costs associated with the acquisition will be covered by an issuance of new Group shares (approximately 2% of the issued share capital) out of the Group’s authorized share capital in accordance with its articles of association. This share issuance is currently planned for June 2012 and the newly issued shares will be sold in the market shortly thereafter. |
| Note 4 Discontinued operations |
| The Group did not discontinue any operations in 1Q12. |
| Note 5 Segment information |
Overview |
| The Group is a global financial services company domiciled in Switzerland. The Group���s business consists of three segments: Private Banking, Investment Banking and Asset Management. The three segments are complemented by Shared Services, which provides support in the areas of finance, operations, human resources, legal and compliance, risk management and IT. Corporate Center includes parent company operations such as Group financing, expenses for projects sponsored by the Group and certain expenses that have not been allocated to the segments. In addition, Corporate Center includes consolidation and elimination adjustments required to eliminate intercompany revenues and expenses. |
| Beginning in 1Q12, we fully reflect the fair value impact from movements in credit spreads on our long-term vanilla debt and DVA on certain structured notes liabilities in the Corporate Center and discontinued the amortization in the segments of the past fair value gains on long-term vanilla debt, primarily in Investment Banking. DVA on certain structured notes liabilities was previously recorded in the Investment Banking segment and is now recorded in the Corporate Center in order to aggregate all credit-spread impacts on our funding instruments and to reflect that these impacts are driven by the creditworthiness of the Group rather than our Investment Banking segment or the issuer. Prior periods have been reclassified to conform to the current presentation and such reclassifications had no impact on the Group’s net income/(loss) or total shareholders’ equity. |
| > Refer to “Note 5 – Segment information” in V – Consolidated financial statements – Credit Suisse Group in the Credit Suisse Annual Report 2011 for further information on segment information, revenue sharing and cost allocation, funding and taxes. |
| Net revenues and income before taxes |
| in | 1Q12 | 4Q11 | 1Q11 | ||||
| Net revenues (CHF million) | |||||||
| Private Banking | 2,651 | 2,575 | 2,897 | ||||
| Investment Banking 1 | 4,140 | 1,113 | 5,066 | ||||
| Asset Management | 663 | 458 | 594 | ||||
| Corporate Center | (1,576) | 327 | (744) | ||||
| Noncontrolling interests without SEI | 169 | 15 | 343 | ||||
| Net revenues | 6,047 | 4,488 | 8,156 | ||||
| Income/(loss) before taxes (CHF million) | |||||||
| Private Banking | 625 | 468 | 856 | ||||
| Investment Banking 1 | 993 | (1,443) | 1,480 | ||||
| Asset Management | 250 | 90 | 175 | ||||
| Corporate Center | (1,828) | (113) | (886) | ||||
| Noncontrolling interests without SEI | 158 | 9 | 341 | ||||
| Income/(loss) before taxes | 198 | (989) | 1,966 | ||||
| 1 Beginning in 1Q12, DVA relating to certain structured notes liabilities and fair value adjustments on Credit Suisse vanilla debt are reflected in the Corporate Center rather than in Investment Banking. As a result, Investment Banking revenues reflect reclassifications of CHF (138) million and CHF 137 million in 4Q11 and 1Q11, respectively, made to prior periods to conform to the current presentation. | |||||||
| Total assets |
| end of | 1Q12 | 4Q11 | 1Q11 | ||||
| Total assets (CHF million) | |||||||
| Private Banking | 353,899 | 350,955 | 341,581 | ||||
| Investment Banking | 756,305 | 804,420 | 779,218 | ||||
| Asset Management | 27,213 | 28,667 | 28,275 | ||||
| Corporate Center 1 | (141,995) | (139,626) | (138,996) | ||||
| Noncontrolling interests without SEI | 4,598 | 4,749 | 6,390 | ||||
| Total assets | 1,000,020 | 1,049,165 | 1,016,468 | ||||
| 1 Under the central treasury model, Group financing results in intra-Group balances between the segments. The elimination of these assets and liabilities occurs in the Corporate Center. | |||||||
| Note 6 Net interest income |
| in | 1Q12 | 4Q11 | 1Q11 | ||||
| Net interest income (CHF million) | |||||||
| Loans | 1,213 | 1,212 | 1,222 | ||||
| Investment securities | 21 | 21 | 31 | ||||
| Trading assets | 2,666 | 2,345 | 2,677 | ||||
| Central bank funds sold, securities purchased under resale agreements and securities borrowing transactions | 772 | 840 | 707 | ||||
| Other | 623 | 675 | 815 | ||||
| Interest and dividend income | 5,295 | 5,093 | 5,452 | ||||
| Deposits | (388) | (434) | (404) | ||||
| Short-term borrowings | (20) | (22) | (18) | ||||
| Trading liabilities | (1,274) | (1,151) | (1,376) | ||||
| Central bank funds purchased, securities sold under repurchase agreements and securities lending transactions | (370) | (377) | (343) | ||||
| Long-term debt | (1,287) | (1,342) | (1,470) | ||||
| Other | (72) | (110) | (88) | ||||
| Interest expense | (3,411) | (3,436) | (3,699) | ||||
| Net interest income | 1,884 | 1,657 | 1,753 | ||||
| Note 7 Commissions and fees |
| in | 1Q12 | 4Q11 | 1Q11 | ||||
| Commissions and fees (CHF million) | |||||||
| Lending business | 307 | 265 | 342 | ||||
| Investment and portfolio management | 979 | 989 | 1,070 | ||||
| Other securities business | 21 | 23 | 15 | ||||
| Fiduciary business | 1,000 | 1,012 | 1,085 | ||||
| Underwriting | 411 | 182 | 542 | ||||
| Brokerage | 989 | 841 | 1,208 | ||||
| Underwriting and brokerage | 1,400 | 1,023 | 1,750 | ||||
| Other services | 465 | 457 | 494 | ||||
| Commissions and fees | 3,172 | 2,757 | 3,671 | ||||
| Note 8 Trading revenues |
| in | 1Q12 | 4Q11 | 1Q11 | ||||
| Trading revenues (CHF million) | |||||||
| Interest rate products | (332) | 1,308 | 1,063 | ||||
| Foreign exchange products | 1,037 | (1,163) | 678 | ||||
| Equity/index-related products | 185 | 214 | 513 | ||||
| Credit products | (990) | (586) | (475) | ||||
| Commodity, emission and energy products | 71 | (14) | 74 | ||||
| Other products | 218 | 214 | 158 | ||||
| Trading revenues | 189 | (27) | 2,011 | ||||
| Represents revenues on a product basis which are not representative of business results within segments, as segment results utilize financial instruments across various product types. | |||||||
| > Refer to “Note 8 – Trading revenues” in V – Consolidated financial statements – Credit Suisse Group in the Credit Suisse Annual Report 2011 for further information on trading revenues and managing trading risks. |
| Note 9 Other revenues |
| in | 1Q12 | 4Q11 | 1Q11 | ||||
| Other revenues (CHF million) | |||||||
| Noncontrolling interests without SEI | 144 | 18 | 323 | ||||
| Loans held-for-sale | (10) | (27) | 18 | ||||
| Long-lived assets held-for-sale | (2) | (83) | (1) | ||||
| Equity method investments | 31 | 40 | 6 | ||||
| Other investments | 232 | 10 | 249 | ||||
| Other | 407 | 143 | 126 | ||||
| Other revenues | 802 | 101 | 721 | ||||
| Note 10 Provision for credit losses |
| in | 1Q12 | 4Q11 | 1Q11 | ||||
| Provision for credit losses (CHF million) | |||||||
| Provision for loan losses | 27 | 96 | 12 | ||||
| Provision for lending-related and other exposures | 7 | 1 | (19) | ||||
| Provision for credit losses | 34 | 97 | (7) | ||||
| Note 11 Compensation and benefits |
| in | 1Q12 | 4Q11 | 1Q11 | ||||
| Compensation and benefits (CHF million) | |||||||
| Salaries and variable compensation | 3,314 | 2,569 | 3,503 | ||||
| Social security | 219 | 172 | 322 | ||||
| Other 1 | 178 | 280 | 204 | ||||
| Compensation and benefits 2 | 3,711 | 3,021 | 4,029 | ||||
| 1 Includes pension and other post-retirement expense of CHF 112 million, CHF 206 million and CHF 134 million in 1Q12, 4Q11 and 1Q11, respectively. 2 Includes severance and other compensation expense relating to headcount reductions of CHF 45 million and CHF 338 million as of 1Q12 and 4Q11, respectively. | |||||||
| Note 12 General and administrative expenses |
| in | 1Q12 | 4Q11 | 1Q11 | ||||
| General and administrative expenses (CHF million) | |||||||
| Occupancy expenses | 288 | 328 | 264 | ||||
| IT, machinery, etc. | 343 | 413 | 327 | ||||
| Provisions and losses | 69 | 75 | 47 | ||||
| Travel and entertainment | 90 | 120 | 104 | ||||
| Professional services | 435 | 559 | 485 | ||||
| Amortization and impairment of other intangible assets | 14 | 8 | 7 | ||||
| Other | 414 | 376 | 398 | ||||
| General and administrative expenses | 1,653 | 1,879 | 1,632 | ||||
| Note 13 Earnings per share |
| in | 1Q12 | 4Q11 | 1Q11 | ||||
| Basic net income attributable to shareholders (CHF million) | |||||||
| Net income/(loss) attributable to shareholders | 44 | (637) | 1,139 | ||||
| Preferred securities dividends | – | (114) | – | ||||
| Net income/(loss) attributable to shareholders for basic earnings per share | 44 | (751) | 1,139 | ||||
| Available for common shares | 41 | (751) | 1,074 | ||||
| Available for unvested share-based payment awards | 3 | 0 | 65 | ||||
| Diluted net income attributable to shareholders (CHF million) | |||||||
| Net income/(loss) attributable to shareholders for basic earnings per share | 44 | (751) | 1,139 | ||||
| Income impact of assumed conversion on contracts that may be settled in shares or cash 1 | (1) | – | – | ||||
| Net income/(loss) attributable to shareholders for diluted earnings per share | 43 | (751) | 1,139 | ||||
| Available for common shares | 40 | (751) | 1,074 | ||||
| Available for unvested share-based payment awards | 3 | 0 | 65 | ||||
| Weighted-average shares outstanding (million) | |||||||
| Weighted-average shares outstanding for basic earnings per share available for common shares | 1,244.2 | 1,206.7 | 1,184.4 | ||||
| Dilutive contracts that may be settled in shares or cash 2 | 6.9 | – | – | ||||
| Dilutive share options and warrants | 4.5 | 0.0 | 2.6 | ||||
| Dilutive share awards | 1.7 | 0.0 | 1.2 | ||||
| Weighted-average shares outstanding for diluted earnings per share available for common shares 3 | 1,257.3 | 1,206.7 | 4 | 1,188.2 | |||
| Weighted-average shares outstanding for basic/diluted earnings per share available for unvested share-based payment awards | 81.0 | 71.0 | 72.1 | ||||
| Earnings per share available for common shares (CHF) | |||||||
| Basic earnings/(loss) per share available for common shares | 0.03 | (0.62) | 0.91 | ||||
| Diluted earnings/(loss) per share available for common shares | 0.03 | (0.62) | 0.90 | ||||
| 1 Reflects changes in the fair value of the PAF2 units which are reflected in the results of the Group until the awards are finally settled. 2 Reflects weighted-average shares outstanding on PAF2 units. 3 Weighted-average potential common shares relating to instruments that were not dilutive for the respective periods (and therefore not included in the diluted earnings per share calculation above) but could potentially dilute earnings per share in the future were 28.5 million, 33.8 million and 44.9 million for 1Q12, 4Q11 and 1Q11, respectively. 4 Due to the net loss in 4Q11, 7.3 million weighted-average share options and warrants outstanding and 17.7 million weighted-average share awards outstanding were excluded from the diluted earnings per share calculation, as the effect would be antidilutive. | |||||||
| Note 14 Trading assets and liabilities |
| end of | 1Q12 | 4Q11 | 1Q11 | ||||
| Trading assets (CHF million) | |||||||
| Debt securities | 154,676 | 145,035 | 152,989 | ||||
| Equity securities 1 | 87,340 | 66,904 | 97,037 | ||||
| Derivative instruments 2 | 44,505 | 52,548 | 43,614 | ||||
| Other | 14,076 | 15,066 | 20,561 | ||||
| Trading assets | 300,597 | 279,553 | 314,201 | ||||
| Trading liabilities (CHF million) | |||||||
| Short positions | 65,696 | 67,639 | 86,693 | ||||
| Derivative instruments 2 | 48,804 | 60,121 | 48,153 | ||||
| Trading liabilities | 114,500 | 127,760 | 134,846 | ||||
| 1 Including convertible bonds. 2 Amounts shown net of cash collateral receivables and payables. | |||||||
| Cash collateral receivables and payables |
| end of | 1Q12 | 4Q11 | 1Q11 | ||||
| Cash collateral receivables (CHF million) | |||||||
| Receivables netted against derivative positions | 32,420 | 36,474 | 23,349 | ||||
| Receivables not netted 1 | 12,317 | 15,809 | 12,672 | ||||
| Total | 44,737 | 52,283 | 36,021 | ||||
| Cash collateral payables (CHF million) | |||||||
| Payables netted against derivative positions | 34,778 | 37,639 | 26,972 | ||||
| Payables not netted 1 | 10,948 | 11,934 | 12,794 | ||||
| Total | 45,726 | 49,573 | 39,766 | ||||
| 1 Recorded as cash collateral on derivative instruments in Note 17 – Other assets and other liabilities. | |||||||
| Note 15 Investment securities |
| The required disclosures for investment securities will be included in the Financial Report 1Q12, which will be published on our website and filed with the SEC on or about May 8, 2012. |
| Management determined that the unrealized losses on debt securities are primarily attributable to general market interest rate, credit spread or exchange rate movements. No significant impairment charges were recorded as the Group does not intend to sell the investments, nor is it more likely than not that the Group will be required to sell the investments before the recovery of their amortized cost bases, which may be maturity. |
| Note 16 Loans, allowance for loan losses and credit quality |
| Loans are divided in two portfolio segments, “consumer” and “corporate & institutional”. Consumer loans are disaggregated into the classes of mortgages, loans collateralized by securities and consumer finance. Corporate & institutional loans are disaggregated into the classes of real estate, commercial and industrial loans, financial institutions and governments and public institutions. |
| The determination of the loan classes is primarily driven by the customer segmentation in the two business divisions, Private Banking and Investment Banking, that are engaged in credit activities. |
| The Group assigns both counterparty and transaction ratings to its credit exposures. The counterparty rating reflects the probability of default (PD) of the counterparty. The transaction rating reflects the expected loss, considering collateral, on a given transaction if the counterparty defaults. Credit risk is assessed and monitored on the single obligor and single obligation level as well as on the credit portfolio level as represented by the classes of loans. Credit limits are used to manage counterparty credit risk. |
| > Refer to “Note 18 – Loans, allowance for loan losses and credit quality” in V – Consolidated financial statements – Credit Suisse Group in the Credit Suisse Annual Report 2011 for further information on loans, allowance for loan losses, credit quality and impaired loans. |
| The required disclosures on loan purchases, reclassifications and sales, credit quality and impaired loans will be included in the Financial Report 1Q12, which will be published on our website and filed with the SEC on or about May 8, 2012. |
| Loans |
| end of | 1Q12 | 4Q11 | 1Q11 | ||||
| Loans (CHF million) | |||||||
| Mortgages | 89,598 | 88,255 | 85,449 | ||||
| Loans collateralized by securities | 25,950 | 26,461 | 26,076 | ||||
| Consumer finance | 6,320 | 6,695 | 5,742 | ||||
| Consumer | 121,868 | 121,411 | 117,267 | ||||
| Real estate | 25,605 | 25,185 | 23,846 | ||||
| Commercial and industrial loans | 59,363 | 59,998 | 55,075 | ||||
| Financial institutions | 23,473 | 25,373 | 25,146 | ||||
| Governments and public institutions | 2,346 | 2,390 | 2,182 | ||||
| Corporate & institutional | 110,787 | 112,946 | 106,249 | ||||
| Gross loans | 232,655 | 234,357 | 223,516 | ||||
| Net (unearned income)/deferred expenses | (51) | (34) | (32) | ||||
| Allowance for loan losses | (908) | (910) | (974) | ||||
| Net loans | 231,696 | 233,413 | 222,510 | ||||
| Gross loans by location (CHF million) | |||||||
| Switzerland | 148,181 | 146,737 | 139,993 | ||||
| Foreign | 84,474 | 87,620 | 83,523 | ||||
| Gross loans | 232,655 | 234,357 | 223,516 | ||||
| Impaired loan portfolio (CHF million) | |||||||
| Non-performing loans | 993 | 758 | 943 | ||||
| Non-interest-earning loans | 228 | 262 | 312 | ||||
| Total non-performing and non-interest-earning loans | 1,221 | 1,020 | 1,255 | ||||
| Restructured loans | 8 | 18 | 41 | ||||
| Potential problem loans | 497 | 680 | 424 | ||||
| Total other impaired loans | 505 | 698 | 465 | ||||
| Gross impaired loans | 1,726 | 1,718 | 1,720 | ||||
| Allowance for loan losses |
| 1Q12 | 4Q11 | 1Q11 | |||||||||||||||||
Consumer | Corporate & institutional | Total | Consumer | Corporate & institutional | Total | Consumer | Corporate & institutional | Total | |||||||||||
| Allowance for loan losses (CHF million) | |||||||||||||||||||
| Balance at beginning of period | 289 | 621 | 910 | 270 | 613 | 883 | 279 | 738 | 1,017 | ||||||||||
| Net movements recognized in statements of operations | 22 | 5 | 27 | 45 | 51 | 96 | 12 | 0 | 12 | ||||||||||
| Gross write-offs | (26) | (17) | (43) | (39) | (54) | (93) | (24) | (37) | (61) | ||||||||||
| Recoveries | 11 | 8 | 19 | 9 | 0 | 9 | 6 | 2 | 8 | ||||||||||
| Net write-offs | (15) | (9) | (24) | (30) | (54) | (84) | (18) | (35) | (53) | ||||||||||
| Provisions for interest | 3 | 5 | 8 | (1) | 9 | 8 | 1 | 1 | 2 | ||||||||||
| Foreign currency translation impact and other adjustments, net | (4) | (9) | (13) | 5 | 2 | 7 | 7 | (11) | (4) | ||||||||||
| Balance at end of period | 295 | 613 | 908 | 289 | 621 | 910 | 281 | 693 | 974 | ||||||||||
| 1Q12 | 4Q11 | 1Q11 | |||||||||||||||||
end of | Consumer | Corporate & institutional | Total | Consumer | Corporate & institutional | Total | Consumer | Corporate & institutional | Total | ||||||||||
| Allowance for loan losses (CHF million) | |||||||||||||||||||
| Balance at end of period | 295 | 613 | 908 | 289 | 621 | 910 | 281 | 693 | 974 | ||||||||||
| of which individually evaluated for impairment | 230 | 437 | 667 | 222 | 428 | 650 | 211 | 501 | 712 | ||||||||||
| of which collectively evaluated for impairment | 65 | 176 | 241 | 67 | 193 | 260 | 70 | 192 | 262 | ||||||||||
Credit quality of loans held at amortized cost |
| Management monitors the credit quality of loans through its credit risk management processes, which are structured to assess, quantify, measure, monitor and manage risk on a consistent basis. This process requires careful consideration of proposed extensions of credit, the setting of specific limits, monitoring during the life of the exposure, active use of credit mitigation tools and a disciplined approach to recognizing credit impairment. |
| Management evaluates many factors when assessing the credit quality of loans. These factors include the volatility of default probabilities, rating changes, the magnitude of potential loss, internal risk ratings, and geographic, industry and other economic factors. For the purpose of credit quality disclosures, the Group uses internal risk ratings as credit quality indicators. |
| The Group employs a set of credit ratings for the purpose of internally rating counterparties. Credit ratings are intended to reflect the risk of default of each obligor or counterparty. Ratings are assigned based on internally developed rating models and processes, which are subject to governance and internally independent validation procedures. |
| > Refer to “Credit quality of loans held at amortized cost” in V – Consolidated financial statements – Credit Suisse Group – Note 18 – Loans, allowance for loan losses and credit quality in the Credit Suisse Annual Report 2011 for further information on internal ratings and the scope of the credit quality disclosures. |
Impaired loans |
| > Refer to “Impaired loans” in V – Consolidated financial statements – Credit Suisse Group – Note 18 – Loans, allowance for loan losses and credit quality in the Credit Suisse Annual Report 2011 for further information on impaired loan categories and allowance for specifically identified credit losses on impaired loans. |
| Note 17 Other assets and other liabilities |
| end of | 1Q12 | 4Q11 | 1Q11 | ||||
| Other assets (CHF million) | |||||||
| Cash collateral on derivative instruments | 12,317 | 15,809 | 12,672 | ||||
| Cash collateral on non-derivative transactions | 2,454 | 2,083 | 1,769 | ||||
| Derivative instruments used for hedging | 3,239 | 3,706 | 1,811 | ||||
| Assets held-for-sale | 20,634 | 21,205 | 26,597 | ||||
| of which loans | 20,147 | 20,457 | 25,514 | ||||
| of which real estate | 459 | 732 | 1,064 | ||||
| Assets held for separate accounts | 14,707 | 14,407 | 16,001 | ||||
| Interest and fees receivable | 5,389 | 6,090 | 5,400 | ||||
| Deferred tax assets | 8,609 | 8,939 | 8,612 | ||||
| Prepaid expenses | 680 | 601 | 782 | ||||
| Failed purchases | 1,338 | 1,513 | 1,088 | ||||
| Other | 4,342 | 3,943 | 3,384 | ||||
| Other assets | 73,709 | 78,296 | 78,116 | ||||
| Other liabilities (CHF million) | |||||||
| Cash collateral on derivative instruments | 10,948 | 11,934 | 12,794 | ||||
| Cash collateral on non-derivative transactions | 996 | 1,002 | 66 | ||||
| Derivative instruments used for hedging | 2,181 | 1,998 | 1,017 | ||||
| Provisions 1 | 1,104 | 1,113 | 1,613 | ||||
| of which off-balance sheet risk | 65 | 65 | 518 | ||||
| Liabilities held for separate accounts | 14,707 | 14,407 | 16,001 | ||||
| Interest and fees payable | 6,576 | 7,142 | 6,956 | ||||
| Current tax liabilities | 747 | 767 | 856 | ||||
| Deferred tax liabilities | 318 | 429 | 431 | ||||
| Failed sales | 6,258 | 6,888 | 7,548 | ||||
| Other | 16,094 | 17,537 | 14,940 | ||||
| Other liabilities | 59,929 | 63,217 | 62,222 | ||||
| 1 Includes provisions for bridge commitments. | |||||||
| Note 18 Long-term debt |
| end of | 1Q12 | 4Q11 | 1Q11 | ||||
| Long-term debt (CHF million) | |||||||
| Senior | 122,792 | 123,632 | 131,074 | ||||
| Subordinated | 19,762 | 24,165 | 24,648 | ||||
| Non-recourse liabilities from consolidated VIEs | 13,077 | 14,858 | 20,155 | ||||
| Long-term debt | 155,631 | 162,655 | 175,877 | ||||
| Note 19 Accumulated other comprehensive income |
Gains/ (losses) on cash flow hedges | Cumulative translation adjustments | Unrealized gains/ (losses) on securities | Actuarial gains/ (losses) | Net prior service credit/ (cost) | Accumu- lated other compre- hensive income | ||||||||
| 1Q12 (CHF million) | |||||||||||||
| Balance at beginning of period | (66) | (11,778) | 99 | (3,751) | 362 | (15,134) | |||||||
| Increase/(decrease) | (1) | (939) | 185 | 31 | 0 | (724) | |||||||
| Increase/(decrease) due to equity method investments | 15 | 0 | 0 | 0 | 0 | 15 | |||||||
| Reclassification adjustments, included in net income | 0 | 1 | (1) | 42 | (22) | 20 | |||||||
| Balance at end of period | (52) | (12,716) | 283 | (3,678) | 340 | (15,823) | |||||||
| 4Q11 (CHF million) | |||||||||||||
| Balance at beginning of period | (60) | (12,464) | 107 | (3,052) | (23) | (15,492) | |||||||
| Increase/(decrease) | (9) | 686 | (8) | (725) | 382 | 326 | |||||||
| Increase/(decrease) due to equity method investments | 3 | 0 | 0 | 0 | 0 | 3 | |||||||
| Reclassification adjustments, included in net income | 0 | 0 | 0 | 26 | 3 | 29 | |||||||
| Balance at end of period | (66) | (11,778) | 99 | (3,751) | 362 | (15,134) | |||||||
| 1Q11 (CHF million) | |||||||||||||
| Balance at beginning of period | (33) | (11,470) | 117 | (3,136) | (33) | (14,555) | |||||||
| Increase/(decrease) | 2 | (434) | (29) | 0 | 0 | (461) | |||||||
| Increase/(decrease) due to equity method investments | (5) | 0 | 0 | 0 | 0 | (5) | |||||||
| Reclassification adjustments, included in net income | (14) | 5 | (11) | 27 | 3 | 10 | |||||||
| Balance at end of period | (50) | (11,899) | 77 | (3,109) | (30) | (15,011) | |||||||
| Note 20 Tax |
| The tax benefit recorded in 1Q12 reflected a release of contingency reserves for uncertain tax positions partially offset by an income tax expense on pre-tax income. |
| Overall, net deferred tax assets decreased CHF 219 million to CHF 8,291 million as of the end of 1Q12 compared to 4Q11. The decrease in net deferred tax assets primarily related to foreign exchange translation losses of CHF 307 million. |
| The presentation of net deferred tax assets related to net operating losses, net deferred tax assets on temporary differences and net deferred tax liabilities is in accordance with ASC Topic 740 – Income Taxes guidance to interim reporting. Nettable gross deferred tax liabilities are allocated on a pro-rata basis to gross deferred tax assets on net operating losses and gross deferred tax assets on temporary differences. This approach is aligned with the underlying treatment of netting gross deferred tax assets and liabilities under the Basel III framework. Valuation allowances have been allocated against such deferred tax assets on net operating losses first with any remainder allocated to such deferred tax assets on temporary differences. This presentation is considered the most appropriate disclosure given the underlying nature of the gross deferred tax balances. |
| As of March 31, 2012, the Group had accumulated undistributed earnings from foreign subsidiaries of CHF 8.7 billion which are considered indefinitely reinvested. The Group would need to accrue and pay taxes on these undistributed earnings if such earnings were repatriated. No deferred tax liability was recorded in respect of those amounts as these earnings are considered indefinitely reinvested. It is not practicable to estimate the amount of unrecognized deferred tax liabilities for these undistributed foreign earnings. |
| The Group is currently subject to ongoing tax audits and inquiries with the tax authorities in a number of jurisdictions, including the US, the UK and Switzerland. Although the timing of the completion of these audits is uncertain, it is reasonably possible that some of these audits and inquiries will be resolved within 12 months of the reporting date. It is reasonably possible that there will be a decrease between zero and CHF 24 million in unrecognized tax benefits within 12 months of the reporting date. |
| The Group remains open to examination from federal, state, provincial or similar local jurisdictions from the following years onward in these major countries: Switzerland – 2008; the US – 2006; Japan – 2005; the Netherlands – 2005; and the UK – 2003. |
| Effective tax rate |
| in | 1Q12 | 4Q11 | 1Q11 | ||||
| Effective tax rate (%) | |||||||
| Effective tax rate | (8.1) | 40.1 | 23.7 | ||||
| Net deferred tax assets |
| end of | 1Q12 | 4Q11 | Change | ||||
| Net deferred tax assets (CHF million) | |||||||
| Deferred tax assets | 8,609 | 8,939 | (330) | ||||
| of which net operating losses | 3,388 | 3,852 | (464) | ||||
| of which deductible temporary differences | 5,221 | 5,087 | 134 | ||||
| Deferred tax liabilities | (318) | (429) | 111 | ||||
| Net deferred tax assets | 8,291 | 8,510 | (219) | ||||
| Note 21 Employee deferred compensation |
| The Group’s current and previous deferred compensation plans include share awards, performance share awards, 2011 Partner Asset Facility (PAF2) awards, Adjustable Performance Plan awards, Restricted Cash Awards, Scaled Incentive Share Units (SISUs), Incentive Share Units (ISUs), 2008 Partner Asset Facility awards and other cash awards. |
| > Refer to “Note 27 – Employee deferred compensation” in V – Consolidated financial statements – Credit Suisse Group in the Credit Suisse Annual Report 2011 for further information. |
| The following tables show the expense for deferred compensation awards recognized in the consolidated statements of operations, the estimated unrecognized expense for deferred compensation awards granted in 1Q12 and prior periods and the associated remaining requisite service period over which the unrecognized expense will be recognized. The estimated unrecognized deferred compensation expense was based on the fair value of each award on the date of grant and included the current estimated outcome of relevant performance criteria and estimated future forfeitures but no estimate for future mark-to-market adjustments. |
| Deferred compensation expense |
| in | 1Q12 | 4Q11 | 1Q11 | |||
| Deferred compensation expense (CHF million) | ||||||
| Share awards | 206 | 189 | 200 | |||
| Performance share awards | 103 | 0 | 0 | |||
| 2011 Partner Asset Facility awards 1 | 534 | 0 | 0 | |||
| Adjustable Performance Plan awards | 108 | 217 | 370 | |||
| Restricted Cash Awards | 41 | 51 | 101 | |||
| Scaled Incentive Share Units | 30 | 101 | 117 | |||
| Incentive Share Units | 19 | 50 | 36 | |||
| 2008 Partner Asset Facility awards 1 | 49 | 16 | 53 | |||
| Other cash awards | 90 | 86 | 112 | |||
| Total deferred compensation expense | 1,180 | 710 | 989 | |||
| 1 Compensation expense includes the change in underlying fair value of the indexed assets during the period. | ||||||
| Estimated unrecognized deferred compensation expense |
| end of | 1Q12 | ||
| Estimated unrecognized deferred compensation expense (CHF million) | |||
| Share awards | 1,364 | ||
| Performance share awards | 432 | ||
| Adjustable Performance Plan awards | 442 | ||
| Restricted Cash Awards | 120 | ||
| Scaled Incentive Share Units | 177 | ||
| Incentive Share Units | 64 | ||
| Other cash awards | 112 | ||
| Total | 2,711 | ||
| Aggregate remaining weighted-average requisite service period (years) | |||
| Aggregate remaining weighted-average requisite service period | 1.4 | ||
1Q12 activity |
| In 1Q12, the Group granted share awards, performance share awards and PAF2 awards as part of the 2011 variable compensation. Expense recognition for these awards began in 1Q12 and will continue over the remaining service or vesting period of each respective award. |
| Share awards |
| In 1Q12, the Group granted 22.4 million share awards at a weighted-average share price of CHF 23.92. One third of the share awards vest on each of the three anniversaries of the grant date. Each share award entitles the holder to receive one Group share, subject to certain conditions. |
| Performance share awards |
| In 1Q12, the Group granted 23.7 million performance share awards at a weighted-average share price of CHF 23.90. One third of the performance share awards vest on each of the three anniversaries of the grant date. Each performance share award entitles the holder to receive one Group share. However, unlike share awards, the unvested performance share award is subject to a downward adjustment in the event of a divisional loss or a negative Group ROE. |
| 2011 Partner Asset Facility |
| In 1Q12, the Group granted PAF2 awards with a total deferred variable compensation value of CHF 499 million. PAF2 awards are essentially fixed income structured notes that are exposed to a portion of the credit risk that arises in the Group’s derivative activities. The compensation expense was recognized in 1Q12 as the awards were fully vested as of March 31, 2012. |
| Share-based award activity |
| 1Q12 | |||||||||
Number of awards (in millions) | Share awards | Performance share awards | SISU awards | ISU awards | |||||
| Share-based award activities | |||||||||
| Balance at beginning of period | 48.1 | – | 14.7 | 13.3 | |||||
| Granted | 22.4 | 23.7 | 0.0 | 0.0 | |||||
| Settled | (0.3) | 0.0 | 0.0 | 0.0 | |||||
| Forfeited | (0.1) | 0.0 | 0.0 | 0.0 | |||||
| Balance at end of period | 70.1 | 23.7 | 14.7 | 13.3 | |||||
| of which vested | 12.6 | 0.0 | 5.6 | 9.1 | |||||
| of which unvested | 57.5 | 23.7 | 9.1 | 4.2 | |||||
| Note 22 Pension and other post-retirement benefits |
| The Group previously disclosed that it expected to contribute CHF 639 million to the Swiss and international defined benefit plans and other post-retirement defined benefit plans in 2012. As of the end of 1Q12, CHF 270 million of contributions had been made. |
| Components of total pension costs |
| in | 1Q12 | 4Q11 | 1Q11 | ||||
| Total pension costs (CHF million) | |||||||
| Service costs on benefit obligation | 95 | 88 | 88 | ||||
| Interest costs on benefit obligation | 128 | 137 | 138 | ||||
| Expected return on plan assets | (194) | (208) | (209) | ||||
| Amortization of recognized prior service cost/(credit) | (14) | 4 | 4 | ||||
| Amortization of recognized actuarial losses | 57 | 36 | 37 | ||||
| Net periodic pension costs | 72 | 57 | 58 | ||||
| Curtailment losses/(gains) | (15) | 0 | 1 | ||||
| Special termination benefits | 6 | 10 | 0 | ||||
| Total pension costs | 63 | 67 | 59 | ||||
| Note 23 Derivatives and hedging activities |
| The required disclosures for derivatives and hedging activities and related contingent credit risk will be included in the Financial Report 1Q12, which will be published on our website and filed with the SEC on or about May 8, 2012. |
| > Refer to “Note 30 – Derivatives and hedging activities” in V – Consolidated financial statements – Credit Suisse Group in the Credit Suisse Annual Report 2011 for further information. |
| Note 24 Guarantees and commitments |
Guarantees |
| In the ordinary course of business, guarantees are provided that contingently obligate Credit Suisse to make payments to third parties if the counterparty fails to fulfill its obligation under a borrowing or other contractual arrangement. The total gross amount disclosed within the Guarantees table reflects the maximum potential payment under the guarantees. The carrying value represents the Group’s current best estimate of payments that will be required under existing guarantee arrangements. |
| Guarantees provided by the Group are classified as follows: credit guarantees and similar instruments, performance guarantees and similar instruments, securities lending indemnifications, derivatives and other guarantees. |
| > Refer to “Guarantees” in V – Consolidated financial statements – Credit Suisse Group – Note 31 – Guarantees and commitments in the Credit Suisse Annual Report 2011 for a detailed description of guarantees. |
| Guarantees |
end of | Maturity less than 1 year | Maturity greater than 1 year | Total gross amount | Total net amount | 1 | Carrying value | Collateral received | ||||||
| 1Q12 (CHF million) | |||||||||||||
| Credit guarantees and similar instruments | 3,372 | 13,662 | 17,034 | 16,410 | 146 | 2,271 | |||||||
| Performance guarantees and similar instruments | 5,090 | 4,801 | 9,891 | 9,030 | 74 | 3,252 | |||||||
| Securities lending indemnifications | 16,033 | 0 | 16,033 | 16,033 | 0 | 16,033 | |||||||
| Derivatives 2 | 19,419 | 11,885 | 31,304 | 31,304 | 1,366 | – | 3 | ||||||
| Other guarantees | 4,112 | 1,051 | 5,163 | 5,139 | 4 | 2,622 | |||||||
| Total guarantees | 48,026 | 31,399 | 79,425 | 77,916 | 1,590 | 24,178 | |||||||
| 4Q11 (CHF million) | |||||||||||||
| Credit guarantees and similar instruments | 3,273 | 4,075 | 7,348 | 6,613 | 50 | 2,455 | |||||||
| Performance guarantees and similar instruments | 5,598 | 4,706 | 10,304 | 9,394 | 73 | 3,381 | |||||||
| Securities lending indemnifications | 15,005 | 0 | 15,005 | 15,005 | 0 | 15,005 | |||||||
| Derivatives 2 | 27,593 | 23,800 | 51,393 | 51,393 | 3,650 | – | 3 | ||||||
| Other guarantees | 3,972 | 1,003 | 4,975 | 4,939 | 4 | 2,268 | |||||||
| Total guarantees | 55,441 | 33,584 | 89,025 | 87,344 | 3,777 | 23,109 | |||||||
| 1 Total net amount is computed as the gross amount less any participations. 2 Excludes derivative contracts with certain active commercial and investment banks and certain other counterparties, as such contracts can be cash settled and the Group had no basis to conclude it was probable that the counterparties held, at inception, the underlying instruments. 3 Collateral for derivatives accounted for as guarantees is not significant. | |||||||||||||
| Deposit-taking banks and securities dealers in Switzerland and certain other European countries are required to ensure the payout of privileged deposits in case of specified restrictions or compulsory liquidation of a deposit-taking bank. In Switzerland, deposit-taking banks and securities dealers jointly guarantee an amount of up to CHF 6 billion. Upon occurrence of a payout event triggered by a specified restriction of business imposed by FINMA or by the compulsory liquidation of another deposit-taking bank, the Group’s contribution will be calculated based on its share of privileged deposits in proportion to total privileged deposits. Based on FINMA’s estimate for the Group’s banking subsidiaries in Switzerland, the Group’s share in the deposit insurance guarantee program for the period July 1, 2011 to June 30, 2012 is CHF 0.7 billion. These deposit insurance guarantees were reflected in other guarantees. |
PAF2 transaction |
| Our results are impacted by the risk of counterparty defaults and the potential for changes in counterparty credit spreads related to our derivative trading activities. In 1Q12, we entered into the 2011 Partner Asset Facility transaction (PAF2 transaction) to hedge the counterparty credit risk of a referenced portfolio of derivatives and their credit spread volatility. The hedge covers approximately USD 12 billion notional amount of expected positive exposure from our counterparties, and is addressed in three layers: (i) first loss (USD 0.5 billion), (ii) mezzanine (USD 0.8 billion) and (iii) senior (USD 11 billion). The first loss element is retained by us and actively managed through normal credit procedures. The mezzanine layer was hedged by transferring the risk of default and counterparty credit spread movements to eligible employees in the form of PAF2 awards, as part of their deferred compensation granted in the annual compensation process. |
| We have purchased protection on the senior layer to hedge against the potential for future counterparty credit spread volatility. This was executed through a CDS, accounted for at fair value, with a third-party entity. We also have a credit support facility with this entity that requires us to provide funding to it in certain circumstances. Under the facility, we may be required to fund payments or costs related to amounts due by the entity under the CDS, and any funded amount may be settled by the assignment of the rights and obligations of the CDS to us. The credit support facility is accounted for on an accrual basis. The transaction overall is a four-year transaction, but can be extended to nine years. We have the right to terminate the third-party transaction for certain reasons, including certain regulatory developments. |
Representations and warranties on residential mortgage loans sold |
| In connection with Investment Banking’s sale of US residential mortgage loans, the Group has provided certain representations and warranties relating to the loans sold. The Group has provided these representations and warranties relating to sales of loans to: the US government-sponsored enterprises Fannie Mae and Freddie Mac (GSEs); institutional investors, primarily banks; and non-agency, or private label, securitizations. The loans sold are primarily loans that the Group has purchased from other parties. The scope of representations and warranties, if any, depends on the transaction, but can include: ownership of the mortgage loans and legal capacity to sell the loans; loan-to-value ratios and other characteristics of the property, the borrower and the loan; validity of the liens securing the loans and absence of delinquent taxes or related liens; conformity to underwriting standards and completeness of documentation; and origination in compliance with law. If it is determined that representations and warranties were breached, the Group may be required to repurchase the related loans or indemnify the investors to make them whole for losses. Whether the Group will incur a loss in connection with repurchases and make whole payments depends on: the extent to which claims are made; the validity of such claims (including the likelihood and ability to enforce claims); whether the Group can successfully claim against parties that sold loans to the Group and made representations and warranties to the Group; the residential real estate market, including the number of defaults; and whether the obligations of the securitization vehicles were guaranteed or insured by third parties. |
| Representations and warranties relating to residential mortgage loans sold to non-agency securitization vehicles are more limited in scope than those relating to residential mortgage loans sold to GSEs, and it can be more difficult to establish causation and standing in making a repurchase claim for breach of representations and warranties on residential mortgage loans sold in non-agency securitizations. The Group is involved in litigation relating to representations and warranties on residential mortgage loans sold. |
| > Refer to “Note 29 – Litigation” for further information. |
| Repurchase claims on residential mortgage loans sold that are, or become during the reporting period, subject to arbitration or litigation proceedings, are not included in the Guarantees and commitments disclosure of repurchase claims and related loss contingencies and provisions but are addressed in litigation and related loss contingencies and provisions. |
| Additional information on representations and warranties on residential mortgage loans sold will be included in the Financial Report 1Q12, which will be published on our website and filed with the SEC on or about May 8, 2012. |
Disposal-related contingencies and other indemnifications |
| The Group has certain guarantees for which its maximum contingent liability cannot be quantified. These guarantees include disposal-related contingencies in connection with the sale of assets or businesses, and other indemnifications. These guarantees are not reflected in the “Guarantees” table. |
| > Refer to “Disposal-related contingencies and other indemnifications” in V – Consolidated financial statements – Credit Suisse Group – Note 31 – Guarantees and commitments in the Credit Suisse Annual Report 2011 for a description of these guarantees. |
Other commitments |
| Other commitments of the Group are classified as follows: irrevocable commitments under documentary credits, loan commitments, forward reverse repurchase agreements and other commitments. |
| > Refer to “Guarantees” in V – Consolidated financial statements – Credit Suisse Group – Note 31 – Guarantees and commitments in the Credit Suisse Annual Report 2011 for a detailed description of guarantees. |
| Other commitments |
end of | Maturity less than 1 year | Maturity greater than 1 year | Total gross amount | Total net amount | 1 | Collateral received | |||||
| 1Q12 (CHF million) | |||||||||||
| Irrevocable commitments under documentary credits | 4,712 | 35 | 4,747 | 4,596 | 2,046 | ||||||
| Loan commitments | 155,615 | 62,584 | 218,199 | 2 | 212,960 | 143,377 | |||||
| Forward reverse repurchase agreements | 49,408 | 0 | 49,408 | 49,408 | 49,408 | ||||||
| Other commitments | 1,530 | 2,005 | 3,535 | 3,535 | 55 | ||||||
| Total other commitments | 211,265 | 64,624 | 275,889 | 270,499 | 194,886 | ||||||
| 4Q11 (CHF million) | |||||||||||
| Irrevocable commitments under documentary credits | 5,644 | 43 | 5,687 | 5,207 | 2,372 | ||||||
| Loan commitments�� | 157,701 | 62,859 | 220,560 | 2 | 215,343 | 144,278 | |||||
| Forward reverse repurchase agreements | 28,885 | 0 | 28,885 | 28,885 | 28,885 | ||||||
| Other commitments | 1,457 | 2,151 | 3,608 | 3,608 | 33 | ||||||
| Total other commitments | 193,687 | 65,053 | 258,740 | 253,043 | 175,568 | ||||||
| 1 Total net amount is computed as the gross amount less any participations. 2 Includes CHF 132,596 million and CHF 138,051 million of unused credit limits as of the end of 1Q12 and 4Q11, respectively, which were revocable at our sole discretion upon notice to the client. | |||||||||||
| In November 2007, Credit Suisse Brazil, a wholly owned subsidiary of Credit Suisse AG, acquired a majority interest (50% plus one share) in Hedging-Griffo and entered into option arrangements in respect of the remaining equity interests in Hedging-Griffo. |
| > Refer to “Note 3 – Business developments” for further information. |
| The Group estimated the redemption value of the put option to be BRL 1,225 million (CHF 607 million). As of the end of 1Q12, the estimated purchase price had been fully accrued in the balance of the redeemable noncontrolling interest in other liabilities. |
| Note 25 Transfers of financial assets and variable interest entities |
| The required disclosures for transfers of financial assets and VIEs will be included in the Financial Report 1Q12, which will be published on our website and filed with the SEC on or about May 8, 2012. |
| In the normal course of business, the Group enters into transactions with, and makes use of, SPEs. An SPE is an entity in the form of a trust or other legal structure designed to fulfill a specific limited need of the company that organized it and are generally structured to isolate the SPE’s assets from creditors of other entities, including the Group. The principal uses of SPEs are to assist the Group and its clients in securitizing financial assets and creating investment products. The Group also uses SPEs for other client-driven activity, such as to facilitate financings, and Group tax or regulatory purposes. |
Transfers of financial assets |
| Securitizations |
| The majority of the Group’s securitization activities involve mortgages and mortgage-related securities and are predominantly transacted using SPEs. In a typical securitization, the SPE purchases assets financed by proceeds received from the SPE’s issuance of debt and equity instruments, certificates, commercial paper (CP) and other notes of indebtedness. These assets and liabilities are recorded on the balance sheet of the SPE and not reflected on the Group’s consolidated balance sheet, unless either the Group sold the assets to the entity and the accounting requirements for sale were not met or the Group consolidates the SPE. |
| The Group purchases commercial and residential mortgages for the purpose of securitization and sells these mortgage loans to SPEs. These SPEs issue commercial mortgage-backed securities (CMBS) and residential mortgage-backed securities (RMBS) that are collateralized by the assets transferred to the SPE and that pay a return based on the returns on those assets. Investors in these mortgage-backed securities typically have recourse to the assets in the SPEs, unless a third-party guarantee has been received to further enhance the creditworthiness of the assets. The investors and the SPEs have no recourse to the Group’s assets. The Group is typically an underwriter of, and makes a market in, these securities. |
| The Group also transacts in re-securitizations of previously issued RMBS securities. Typically, certificates issued out of an existing securitization vehicle are sold into a newly created and separate securitization vehicle. Often, these re-securitizations are initiated in order to repackage an existing security to give the investor a higher rated tranche. |
| The Group also uses SPEs for other asset-backed financings relating to client-driven activity and for Group tax or regulatory purposes. Types of structures included in this category include Collateralized Debt Obligations (CDOs), leveraged finance, repack and other types of transactions, including life insurance structures, emerging market structures set up for financing, loan participation or loan origination purposes, and other alternative structures created for the purpose of investing in venture capital-like investments. CDOs are collateralized by the assets transferred to the CDO vehicle and pay a return based on the returns on those assets. Leveraged finance structures are used to assist in the syndication of certain loans held by the Group, while repack structures are designed to give a client collateralized exposure to specific cash flows or credit risk backed by collateral purchased from the Group. In these asset-backed financing structures investors typically only have recourse to the collateral of the SPE and do not have recourse to the Group’s assets. |
| When the Group transfers assets into an SPE, it must assess whether that transfer is accounted for as a sale of the assets. Transfers of assets may not meet sale requirements if the assets have not been legally isolated from the Group and/or if the Group’s continuing involvement is deemed to give it effective control over the assets. If the transfer is not deemed a sale, it is instead accounted for as a secured borrowing, with the transferred assets as collateral. |
| Gains and losses on securitization transactions depend, in part, on the carrying values of mortgages and CDOs involved in the transfer and are allocated between the assets sold and any beneficial interests retained according to the relative fair values at the date of sale. |
| The Group does not retain material servicing responsibilities from securitization activities. |
Continuing involvement in transferred financial assets |
| The Group may have continuing involvement in the financial assets that are transferred to an SPE, regardless of whether the transfer was accounted for as a sale or a secured borrowing. |
| > Refer to “Transfer of financial assets” in V – Consolidated financial statements – Credit Suisse Group – Note 32 – Transfer of financial assets in the Credit Suisse Annual Report 2011 for a detailed description of continuing involvement in transferred financial assets. |
Variable interest entities |
| As a normal part of its business, the Group engages in various transactions that include entities that are considered variable interest entities (VIEs) and are grouped into three primary categories: CDOs, CP conduits and financial intermediation. |
| > Refer to “Transfer of financial assets” in V – Consolidated financial statements – Credit Suisse Group – Note 32 – Variable interest entities in the Credit Suisse Annual Report 2011 for a detailed description of VIEs, CDOs, CP conduit or financial intermediation. |
| Collateralized debt obligations |
| The Group engages in CDO transactions to meet client and investor needs, earn fees and sell financial assets. The Group may act as underwriter, placement agent or asset manager and may warehouse assets prior to the closing of a transaction. |
| Commercial paper conduit |
| The Group continues to act as the administrator and provider of liquidity and credit enhancement facilities for one asset-backed CP conduit, Alpine, a client-focused multi-seller conduit vehicle. |
| The overall average maturity of the conduit’s outstanding CP was approximately 19 days and 18 days as of 1Q12 and 4Q11, respectively. As of 1Q12 and 4Q11, Alpine had the highest short-term ratings from Moody’s and Dominion Bond Rating Service and was rated A-1 by Standard & Poors and F-1 by Fitch. The majority of Alpine’s purchased assets were highly rated loans or receivables in the consumer sector, including auto loans or leases, student loans and credit card receivables. As of 1Q12 and 4Q11, those assets had an average rating of AA, based on the lowest of each asset’s external or internal rating, and an average maturity of 2.6 years and 2.5 years as of 1Q12 and 4Q11, respectively. |
| Financial intermediation |
| The Group has significant involvement with VIEs in its role as a financial intermediary on behalf of clients. |
| Financial intermediation consists of securitizations, funds, loans and other vehicles. |
| Note 26 Financial instruments |
Concentrations of credit risk |
| Credit risk concentrations arise when a number of counterparties are engaged in similar business activities, are located in the same geographic region or when there are similar economic features that would cause their ability to meet contractual obligations to be similarly impacted by changes in economic conditions. |
| > Refer to “Note 33 – Financial instruments” in V – Consolidated financial statements – Credit Suisse Group in the Credit Suisse Annual Report 2011 for further information on the Group’s concentrations of credit risk. |
Fair value of financial instruments |
| The required disclosures for the fair value of financial instruments will be included in the Financial Report 1Q12, which will be published on our website and filed with the SEC on or about May 8, 2012. |
| A significant portion of the Group’s financial instruments are carried at fair value. Deterioration of financial markets could significantly impact the fair value of these financial instruments and the results of operations. |
| The fair value of the majority of the Group’s financial instruments is based on quoted prices in active markets or observable inputs. These instruments include government and agency securities, certain CP, most investment grade corporate debt, certain high yield debt securities, exchange-traded and certain OTC derivative instruments and most listed equity securities. |
| In addition, the Group holds financial instruments for which no prices are available and which have little or no observable inputs. For these instruments, the determination of fair value requires subjective assessment and judgment, depending on liquidity, pricing assumptions, the current economic and competitive environment and the risks affecting the specific instrument. In such circumstances, valuation is determined based on management’s own judgments about the assumptions that market participants would use in pricing the asset or liability, including assumptions about risk. These instruments include certain OTC derivatives, including equity and credit derivatives, certain corporate equity-linked securities, mortgage-related and CDO securities, private equity investments, certain loans and credit products, including leveraged finance, certain syndicated loans and certain high yield bonds, and life finance instruments. |
| The fair value of financial assets and liabilities is impacted by factors such as benchmark interest rates, prices of financial instruments issued by third parties, commodity prices, foreign exchange rates and index prices or rates. In addition, valuation adjustments are an integral part of the valuation process when market prices are not indicative of the credit quality of a counterparty, and are applied to both OTC derivatives and debt instruments. The impact of changes in a counterparty’s credit spreads (known as credit valuation adjustments) is considered when measuring the fair value of assets and the impact of changes in the Group’s own credit spreads (known as DVA) is considered when measuring the fair value of its liabilities. For OTC derivatives, the impact of changes in both the Group’s and the counterparty’s credit standing is considered when measuring their fair value, based on current CDS prices. The adjustments also take into account contractual factors designed to reduce the Group’s credit exposure to a counterparty, such as collateral held and master netting agreements. For hybrid debt instruments with embedded derivative features, the impact of changes in the Group’s credit standing is considered when measuring their fair value, based on current funded debt spreads. |
| Based on the Group’s regular review of observable parameters used in its pricing models, in 2Q11 the Group adopted a change in estimate relating to the use of overnight indexed swap interest rate yield curves, instead of other reference rates such as LIBOR, in determining the fair value of certain collateralized derivatives, resulting in a loss of CHF 12 million in Investment Banking fixed income sales and trading revenue in 1Q12. |
| The Group applies the exception provided by ASC Topic 820, Fair Value Measurement, that permits a reporting entity to measure the fair value of a group of financial assets and financial liabilities on the basis of the price that would be received to sell a net long position or paid to transfer a net short position for a particular risk exposure in an orderly transaction between market participants at the measurement date. Under this exception, the Group applies bid and offer adjustments to net portfolios of cash securities and/or derivative instruments to adjust the value of the net position from a mid-market price to the appropriate bid or offer level that would be realized under normal market conditions for the net long or net short position for a specific market risk. In addition, the Group applies this exception to reflect the net exposure to credit risk for its derivative instruments where the Group has legally enforceable agreements with its counterparties that mitigate credit risk exposure in the event of default. Valuation adjustments are recorded in a reasonable and consistent manner that results in an allocation to the relevant disclosures in the notes to the financial statements as if the valuation adjustment had been allocated to the individual unit of account. |
| The Group has availed itself of the simplification in accounting offered under the fair value option, primarily in the Investment Banking and Asset Management segments. This has been accomplished generally by electing the fair value option, both at initial adoption and for subsequent transactions, on items impacted by the hedge accounting requirements of US GAAP. That is, for instruments for which there was an inability to achieve hedge accounting and for which the Group is economically hedged, the Group has elected the fair value option. Likewise, where the Group manages an activity on a fair value basis but previously has been unable to achieve fair value accounting, the Group has utilized the fair value option to align its risk management reporting to its financial accounting. |
| Fair value hierarchy |
| The levels of the fair value hierarchy are defined as follows: |
| – Level 1: Quoted prices (unadjusted) in active markets for identical assets or liabilities that the Group has the ability to access. This level of the fair value hierarchy provides the most reliable evidence of fair value and is used to measure fair value whenever available. |
| – Level 2: Inputs other than quoted prices included within level 1 that are observable for the asset or liability, either directly or indirectly. These inputs include: (i) quoted prices for similar assets or liabilities in active markets; (ii) quoted prices for identical or similar assets or liabilities in markets that are not active, that is, markets in which there are few transactions for the asset or liability, the prices are not current or price quotations vary substantially either over time or among market makers, or in which little information is publicly available; (iii) inputs other than quoted prices that are observable for the asset or liability; or (iv) inputs that are derived principally from or corroborated by observable market data by correlation or other means. |
| – Level 3: Inputs that are unobservable for the asset or liability. These inputs reflect the Group’s own assumptions about the assumptions that market participants would use in pricing the asset or liability (including assumptions about risk). These inputs are developed based on the best information available in the circumstances, which include the Group’s own data. The Group’s own data used to develop unobservable inputs is adjusted if information indicates that market participants would use different assumptions. |
| Note 27 Assets pledged or assigned |
| The required disclosures for assets pledged or assigned will be included in the Financial Report 1Q12, which will be published on our website and filed with the SEC on or about May 8, 2012. |
| The Group received collateral in connection with resale agreements, securities lending and loans, derivative transactions and margined broker loans. A substantial portion of the collateral received by the Group was sold or repledged in connection with repurchase agreements, securities sold not yet purchased, securities borrowings and loans, pledges to clearing organizations, segregation requirements under securities laws and regulations, derivative transactions and bank loans. |
| Note 28 Subsidiary guarantee information |
| Credit Suisse Group (Guernsey) I Limited or Credit Suisse Group (Guernsey) III Limited, each of which is a Guernsey incorporated non-cellular company limited by shares, may issue contingent convertible securities fully and unconditionally guaranteed by the Group. Credit Suisse Group (Guernsey) I Limited and Credit Suisse Group (Guernsey) III Limited are each wholly-owned finance subsidiaries of the Group. There are various legal and regulatory requirements, including the satisfaction of a solvency test under Guernsey law, applicable to some of the Group’s subsidiaries that limit their ability to pay dividends or distributions and make loans and advances to the Group. |
| On March 26, 2007, the Group and the Bank issued full, unconditional and several guarantees of Credit Suisse (USA), Inc.’s outstanding US SEC-registered debt securities. In accordance with the guarantees, if Credit Suisse (USA), Inc. fails to make any timely payment under the agreements governing such debt securities, the holders of the debt securities may demand payment from either the Group or the Bank, without first proceeding against Credit Suisse (USA), Inc. The guarantee from the Group is subordinated to senior liabilities. Credit Suisse (USA), Inc. is an indirect, wholly owned subsidiary of the Group. |
| Condensed consolidating statements of operations |
in 1Q12 | Credit Suisse (USA), Inc. consolidated | Bank parent company and other subsidiaries | 1 | Bank | Group parent company | Other Group subsidiaries | 1 | Credit Suisse Group | |||||
| Condensed consolidating statements of operations (CHF million) | |||||||||||||
| Interest and dividend income | 1,841 | 3,257 | 5,098 | 31 | 166 | 5,295 | |||||||
| Interest expense | (1,034) | (2,352) | (3,386) | (31) | 6 | (3,411) | |||||||
| Net interest income | 807 | 905 | 1,712 | 0 | 172 | 1,884 | |||||||
| Commissions and fees | 960 | 1,988 | 2,948 | 2 | 222 | 3,172 | |||||||
| Trading revenues | 740 | (380) | 360 | 0 | (171) | 189 | |||||||
| Other revenues | 286 | 532 | 818 | 28 | 2 | (44) | 802 | ||||||
| Net revenues | 2,793 | 3,045 | 5,838 | 30 | 179 | 6,047 | |||||||
| Provision for credit losses | (4) | 17 | 13 | 0 | 21 | 34 | |||||||
| Compensation and benefits | 1,159 | 2,454 | 3,613 | 12 | 86 | 3,711 | |||||||
| General and administrative expenses | 417 | 1,191 | 1,608 | (29) | 74 | 1,653 | |||||||
| Commission expenses | 56 | 356 | 412 | 0 | 39 | 451 | |||||||
| Total other operating expenses | 473 | 1,547 | 2,020 | (29) | 113 | 2,104 | |||||||
| Total operating expenses | 1,632 | 4,001 | 5,633 | (17) | 199 | 5,815 | |||||||
| Income/(loss) before taxes | 1,165 | (973) | 192 | 47 | (41) | 198 | |||||||
| Income tax expense/(benefit) | 399 | (376) | 23 | 3 | (42) | (16) | |||||||
| Net income/(loss) | 766 | (597) | 169 | 44 | 1 | 214 | |||||||
| Net income/(loss) attributable to noncontrolling interests | 186 | 19 | 205 | 0 | (35) | 170 | |||||||
| Net income/(loss) attributable to shareholders | 580 | (616) | (36) | 44 | 36 | 44 | |||||||
| 1 Includes eliminations and consolidation adjustments. 2 Primarily consists of dividend income from investments in Group companies (CHF 7 million from non-bank subsidiaries) and revenues from investments accounted for under the equity method. | |||||||||||||
| Condensed consolidating statements of operations |
in 1Q11 | Credit Suisse (USA), Inc. consolidated | Bank parent company and other subsidiaries | 1 | Bank | Group parent company | Other Group subsidiaries | 1 | Credit Suisse Group | |||||
| Condensed consolidating statements of operations (CHF million) | |||||||||||||
| Interest and dividend income | 2,018 | 3,240 | 5,258 | 44 | 150 | 5,452 | |||||||
| Interest expense | (1,264) | (2,397) | (3,661) | (42) | 4 | (3,699) | |||||||
| Net interest income | 754 | 843 | 1,597 | 2 | 154 | 1,753 | |||||||
| Commissions and fees | 1,106 | 2,292 | 3,398 | 2 | 271 | 3,671 | |||||||
| Trading revenues | 753 | 1,292 | 2,045 | 0 | (34) | 2,011 | |||||||
| Other revenues | 486 | 247 | 733 | 1,123 | 2 | (1,135) | 721 | ||||||
| Net revenues | 3,099 | 4,674 | 7,773 | 1,127 | (744) | 8,156 | |||||||
| Provision for credit losses | 1 | (20) | (19) | 0 | 12 | (7) | |||||||
| Compensation and benefits | 1,186 | 2,726 | 3,912 | 25 | 92 | 4,029 | |||||||
| General and administrative expenses | 443 | 1,159 | 1,602 | (42) | 72 | 1,632 | |||||||
| Commission expenses | 72 | 420 | 492 | 0 | 44 | 536 | |||||||
| Total other operating expenses | 515 | 1,579 | 2,094 | (42) | 116 | 2,168 | |||||||
| Total operating expenses | 1,701 | 4,305 | 6,006 | (17) | 208 | 6,197 | |||||||
| Income/(loss) before taxes | 1,397 | 389 | 1,786 | 1,144 | (964) | 1,966 | |||||||
| Income tax expense | 352 | 97 | 449 | 5 | 11 | 465 | |||||||
| Net income/(loss) | 1,045 | 292 | 1,337 | 1,139 | (975) | 1,501 | |||||||
| Net income attributable to noncontrolling interests | 370 | 25 | 395 | 0 | (33) | 362 | |||||||
| Net income/(loss) attributable to shareholders | 675 | 267 | 942 | 1,139 | (942) | 1,139 | |||||||
| 1 Includes eliminations and consolidation adjustments. 2 Primarily consists of dividend income from investments in Group companies (CHF 158 million and CHF 7 million from bank and non-bank subsidiaries, respectively) and revenues from investments accounted for under the equity method. | |||||||||||||
| Condensed consolidating balance sheets |
end of 1Q12 | Credit Suisse (USA), Inc. consolidated | Bank parent company and other subsidiaries | 1 | Bank | Group parent company | Other Group subsidiaries | 1 | Credit Suisse Group | |||||
| Assets (CHF million) | |||||||||||||
| Cash and due from banks | 7,869 | 81,278 | 89,147 | 28 | 274 | 89,449 | |||||||
| Interest-bearing deposits with banks | 84 | 5,737 | 5,821 | 0 | (3,251) | 2,570 | |||||||
| Central bank funds sold, securities purchased under resale agreements and securities borrowing transactions | 127,260 | 64,799 | 192,059 | 0 | 9 | 192,068 | |||||||
| Securities received as collateral | 36,377 | (2,616) | 33,761 | 0 | 0 | 33,761 | |||||||
| Trading assets | 103,896 | 194,538 | 298,434 | 0 | 2,163 | 300,597 | |||||||
| Investment securities | 0 | 3,872 | 3,872 | 0 | 1,732 | 5,604 | |||||||
| Other investments | 6,444 | 5,524 | 11,968 | 33,857 | (33,531) | 12,294 | |||||||
| Net loans | 22,021 | 188,855 | 210,876 | 4,906 | 15,914 | 231,696 | |||||||
| Premises and equipment | 1,058 | 5,325 | 6,383 | 0 | 495 | 6,878 | |||||||
| Goodwill | 574 | 6,624 | 7,198 | 0 | 1,135 | 8,333 | |||||||
| Other intangible assets | 100 | 159 | 259 | 0 | 1 | 260 | |||||||
| Brokerage receivables | 14,495 | 28,284 | 42,779 | 0 | 22 | 42,801 | |||||||
| Other assets | 15,383 | 57,975 | 73,358 | 179 | 172 | 73,709 | |||||||
| Total assets | 335,561 | 640,354 | 975,915 | 38,970 | (14,865) | 1,000,020 | |||||||
| Liabilities and equity (CHF million) | |||||||||||||
| Due to banks | 142 | 51,203 | 51,345 | 4,505 | (16,815) | 39,035 | |||||||
| Customer deposits | 0 | 279,493 | 279,493 | 0 | 25,450 | 304,943 | |||||||
| Central bank funds purchased, securities sold under repurchase agreements and securities lending transactions | 145,148 | 22,345 | 167,493 | 0 | (36) | 167,457 | |||||||
| Obligation to return securities received as collateral | 36,377 | (2,616) | 33,761 | 0 | 0 | 33,761 | |||||||
| Trading liabilities | 24,484 | 89,312 | 113,796 | 0 | 704 | 114,500 | |||||||
| Short-term borrowings | 15,867 | (745) | 15,122 | 0 | 1,209 | 16,331 | |||||||
| Long-term debt | 35,236 | 117,165 | 152,401 | 769 | 2,461 | 155,631 | |||||||
| Brokerage payables | 46,504 | 21,110 | 67,614 | 0 | (45) | 67,569 | |||||||
| Other liabilities | 10,597 | 48,321 | 58,918 | 111 | 900 | 59,929 | |||||||
| Total liabilities | 314,355 | 625,588 | 939,943 | 5,385 | 13,828 | 959,156 | |||||||
| Total shareholders' equity | 17,058 | 10,311 | 27,369 | 33,585 | (27,369) | 33,585 | |||||||
| Noncontrolling interests | 4,148 | 4,455 | 8,603 | 0 | (1,324) | 7,279 | |||||||
| Total equity | 21,206 | 14,766 | 35,972 | 33,585 | (28,693) | 40,864 | |||||||
| Total liabilities and equity | 335,561 | 640,354 | 975,915 | 38,970 | (14,865) | 1,000,020 | |||||||
| 1 Includes eliminations and consolidation adjustments. | |||||||||||||
| Condensed consolidating balance sheets |
end of 4Q11 | Credit Suisse (USA), Inc. consolidated | Bank parent company and other subsidiaries | 1 | Bank | Group parent company | Other Group subsidiaries | 1 | Credit Suisse Group | |||||
| Assets (CHF million) | |||||||||||||
| Cash and due from banks | 3,698 | 106,569 | 110,267 | 13 | 293 | 110,573 | |||||||
| Interest-bearing deposits with banks | 87 | 5,635 | 5,722 | 0 | (3,450) | 2,272 | |||||||
| Central bank funds sold, securities purchased under resale agreements and securities borrowing transactions | 153,625 | 82,862 | 236,487 | 0 | 476 | 236,963 | |||||||
| Securities received as collateral | 34,189 | (4,066) | 30,123 | 0 | 68 | 30,191 | |||||||
| Trading assets | 91,458 | 184,616 | 276,074 | 0 | 3,479 | 279,553 | |||||||
| Investment securities | 0 | 3,513 | 3,513 | 0 | 1,647 | 5,160 | |||||||
| Other investments | 6,719 | 6,160 | 12,879 | 34,137 | (33,790) | 13,226 | |||||||
| Net loans | 24,658 | 187,613 | 212,271 | 5,603 | 15,539 | 233,413 | |||||||
| Premises and equipment | 1,110 | 5,590 | 6,700 | 0 | 493 | 7,193 | |||||||
| Goodwill | 597 | 6,859 | 7,456 | 0 | 1,135 | 8,591 | |||||||
| Other intangible assets | 112 | 168 | 280 | 0 | 8 | 288 | |||||||
| Brokerage receivables | 17,951 | 25,493 | 43,444 | 0 | 2 | 43,446 | |||||||
| Other assets | 16,114 | 61,845 | 77,959 | 190 | 147 | 78,296 | |||||||
| Total assets | 350,318 | 672,857 | 1,023,175 | 39,943 | (13,953) | 1,049,165 | |||||||
| Liabilities and equity (CHF million) | |||||||||||||
| Due to banks | 92 | 51,392 | 51,484 | 4,697 | (16,034) | 40,147 | |||||||
| Customer deposits | 0 | 287,699 | 287,699 | 0 | 25,702 | 313,401 | |||||||
| Central bank funds purchased, securities sold under repurchase agreements and securities lending transactions | 151,655 | 24,904 | 176,559 | 0 | 0 | 176,559 | |||||||
| Obligation to return securities received as collateral | 34,189 | (4,066) | 30,123 | 0 | 68 | 30,191 | |||||||
| Trading liabilities | 29,291 | 97,407 | 126,698 | 0 | 1,062 | 127,760 | |||||||
| Short-term borrowings | 15,881 | 8,762 | 24,643 | 0 | 1,473 | 26,116 | |||||||
| Long-term debt | 40,029 | 119,378 | 159,407 | 1,444 | 1,804 | 162,655 | |||||||
| Brokerage payables | 47,847 | 20,328 | 68,175 | 0 | (141) | 68,034 | |||||||
| Other liabilities | 10,124 | 51,813 | 61,937 | 128 | 1,152 | 63,217 | |||||||
| Total liabilities | 329,108 | 657,617 | 986,725 | 6,269 | 15,086 | 1,008,080 | |||||||
| Total shareholders' equity | 16,979 | 10,523 | 27,502 | 33,674 | (27,502) | 33,674 | |||||||
| Noncontrolling interests | 4,231 | 4,717 | 8,948 | 0 | (1,537) | 7,411 | |||||||
| Total equity | 21,210 | 15,240 | 36,450 | 33,674 | (29,039) | 41,085 | |||||||
| Total liabilities and equity | 350,318 | 672,857 | 1,023,175 | 39,943 | (13,953) | 1,049,165 | |||||||
| 1 Includes eliminations and consolidation adjustments. | |||||||||||||
| Note 29 Litigation |
| The Group is involved in a number of judicial, regulatory and arbitration proceedings concerning matters arising in connection with the conduct of its businesses. The Group’s material judicial, regulatory and arbitration proceedings, related provisions and estimate of the aggregate range of reasonably possible losses that are not covered by existing provisions are described inNote 37 – Litigation in V – Consolidated financial statements – Credit Suisse Group in the Credit Suisse Annual Report 2011 and updated below. Some of these proceedings have been brought on behalf of various classes of claimants and seek damages of material and/or indeterminate amounts. |
| The Group accrues litigation provisions (including fees and expenses of external lawyers and other service providers) in connection with certain judicial, regulatory and arbitration proceedings when losses, additional losses or ranges of loss are probable and reasonably estimable. The Group reviews its judicial, regulatory and arbitration proceedings each quarter to determine the adequacy of its litigation provisions and may increase or release provisions based on management’s judgment and the advice of counsel. Further increases or releases of litigation provisions may be necessary in the future as developments in such litigations, claims or proceedings warrant. |
| It is inherently difficult to determine whether a loss is probable or even reasonably possible or to estimate the amount of any loss or loss range for many of these matters. In presenting the condensed consolidated financial statements, management makes estimates regarding the outcome of these matters, records a provision and takes a charge to income when losses with respect to such matters are probable and can be reasonably estimated. Estimates, by their nature, are based on judgment and currently available information and involve a variety of factors, including, but not limited to, the type and nature of the litigation, claim or proceeding, the progress of the matter, the advice of legal counsel, the Group’s defenses and its experience in similar cases or proceedings, as well as its assessment of matters, including settlements, involving other defendants in similar or related cases or proceedings. Factual and legal determinations must be made before a loss, additional losses or ranges of loss can be reasonably estimated for any proceeding or matter. |
| Most matters pending against the Group seek damages of an indeterminate amount. While certain matters specify the damages claimed, such claimed amount may not represent reasonably possible losses. The Group’s aggregate litigation provisions include estimates of losses, additional losses or ranges of loss for proceedings for which such losses are probable and can be reasonably estimated. The Group does not believe that it can estimate an aggregate range of reasonably possible losses for certain of its proceedings because of the complexity of the proceedings, the novelty of some of the claims, the early stage of the proceedings and limited amount of discovery that has occurred and/or other factors. The Group’s estimate of the aggregate range of reasonably possible losses that are not covered by existing provisions is zero to CHF 2.3 billion. |
| In 1Q12, the Group recorded net litigation provisions of CHF 68 million. After taking into account its litigation provisions, the Group believes, based on currently available information and advice of counsel, that the results of its proceedings, in the aggregate, will not have a material adverse effect on the Group’s financial condition. However, in light of the uncertainties involved in such proceedings, including those proceedings brought by regulators or other governmental authorities, the ultimate resolution of such proceedings may exceed current litigation provisions and any excess may be material to operating results for any particular period, depending, in part, upon the operating results for such period. |
LIBOR-related matters |
| Regulatory authorities in a number of jurisdictions, including the US, UK, EU and Switzerland, have opened investigations into the setting of LIBOR and other reference rates with respect to a number of currencies, as well as the pricing of certain related derivatives. These investigations have included a review of the activities of various financial institutions, including the Group. The Group has been a member of the rate-setting panels for US Dollar LIBOR, Swiss Franc LIBOR and Euro LIBOR, but not any other LIBOR panels or other reference rate panels, including Euribor or Tibor panels. The Group is cooperating fully with these investigations. |
List of abbreviations |
| A | ||
| ADS | American Depositary Share | |
| AMF | Asset Management Finance | |
| ASC | Accounting Standards Codification | |
| ASU | Accounting Standards Update | |
| B | ||
| BCBS | Basel Committee on Banking Supervision | |
| BIS | Bank for International Settlements | |
| bp | basis point | |
| BRL | Brazilian Real | |
| C | ||
| CDO | Collateralized Debt Obligation | |
| CDS | Credit Default Swap | |
| CET1 | Common Equity Tier 1 | |
| CMBS | Commercial Mortgage-backed Securities | |
| CP | Commercial Paper | |
| D | ||
| DVA | Debit Valuation Adjustment | |
| E | ||
| ECB | European Central Bank | |
| EMEA | Europe, Middle East and Africa | |
| ETF | Exchange-Traded Funds | |
| EU | European Union | |
| F | ||
| FASB | Financial Accounting Standards Board | |
| FINMA | Swiss Financial Market Supervisory Authority | |
| G | ||
| G-20 | Group of Twenty Finance Ministers and Central Bank Governors | |
| G-SIB | Global Systemically Important Bank | |
| GSE | Government-Sponsored Enterprise | |
| I | ||
| IPO | Initial Public Offering | |
| ISU | Incentive Share Unit | |
| IT | Information Technology | |
| K | ||
| KPI | Key Performance Indicator | |
| L | ||
| LCR | Liquidity Coverage Ratio | |
| LIBOR | London Interbank Offered Rate | |
| M | ||
| M&A | Mergers and Acquisitions | |
| N | ||
| NSFR | Net Stable Funding Ratio | |
| O | ||
| OTC | Over-The-Counter | |
| P | ||
| PAF2 | 2011 Partner Asset Facility | |
| Q | ||
| QoQ | Quarter on Quarter | |
| R | ||
| RMBS | Residential Mortgage-backed Securities | |
| RWA | Risk-Weighted Assets | |
| S | ||
| SEC | US Securities and Exchange Commission | |
| SEI | Significant Economic Interest | |
| SISU | Scaled Incentive Share Unit | |
| SPE | Special Purpose Entity | |
| U | ||
| UK | United Kingdom | |
| UHNWI | Ultra-High-Net-Worth Individual | |
| US | United States of America | |
| US GAAP | Accounting Principles Generally Accepted in the US | |
| V | ||
| VaR | Value-at-Risk | |
| VIE | Variable Interest Entity | |
| VIX | Chicago Board Options Exchange Market Volatility Index | |
| Y | ||
| YoY | Year on Year | |
Investor information |
| Share data | |||||||||
| in / end of | |||||||||
| 1Q12 | 2011 | 2010 | 2009 | ||||||
| Share price (common shares, CHF) | |||||||||
| Average | 24.38 | 31.43 | 45.97 | 45.65 | |||||
| Minimum | 20.99 | 19.65 | 37.04 | 22.48 | |||||
| Maximum | 27.20 | 44.99 | 56.40 | 60.40 | |||||
| End of period | 25.73 | 22.07 | 37.67 | 51.20 | |||||
| Share price (American Depositary Shares, USD) | |||||||||
| Average | 26.60 | 35.36 | 44.16 | 42.61 | |||||
| Minimum | 22.18 | 21.20 | 36.54 | 19.04 | |||||
| Maximum | 29.69 | 47.63 | 54.57 | 59.84 | |||||
| End of period | 28.51 | 23.48 | 40.41 | 49.16 | |||||
| Market capitalization | |||||||||
| Market capitalization (CHF million) | 31,507 | 27,021 | 44,683 | 60,691 | |||||
| Market capitalization (USD million) | 34,911 | 28,747 | 47,933 | 58,273 | |||||
| Dividend per share (CHF) | |||||||||
| Dividend per share | – | 0.75 | 1, 2 | 1.30 | 2 | 2.00 | |||
| 1 Proposal of the Board of Directors to the Annual General Meeting on April 27, 2012, to be paid out of reserves from capital contributions. The distribution will be payable in cash or, subject to any legal restrictions applicable in shareholders’ home jurisdictions, in new shares of Credit Suisse Group at the option of the shareholder. 2 Paid out of reserves from capital contributions. | |||||||||
| Ticker symbols / stock exchange listings | |||||
| Common shares | ADS | 1 | |||
| Ticker symbols | |||||
| Bloomberg | CSGN VX | CS US | |||
| Reuters | CSGN.VX | CS.N | |||
| Telekurs | CSGN,380 | CS,065 | |||
| Stock exchange listings | |||||
| Swiss security number | 1213853 | 570660 | |||
| ISIN number | CH0012138530 | US2254011081 | |||
| CUSIP number | – | 225 401 108 | |||
| 1 One American Depositary Share (ADS) represents one common share. | |||||
| Bond ratings | |||||||
| as of April 23, 2012 | Moody's | Standard & Poor's | Fitch Ratings | ||||
| Credit Suisse Group ratings | |||||||
| Short-term | P-1 | A-1 | F1 | ||||
| Long-term | Aa2 | A | A | ||||
| Outlook | Review for possible downgrade | Negative | Stable | ||||
| Credit Suisse (the Bank) ratings | |||||||
| Short-term | P-1 | A-1 | F1 | ||||
| Long-term | Aa1 | A+ | A | ||||
| Outlook | Review for possible downgrade | Negative | Stable | ||||
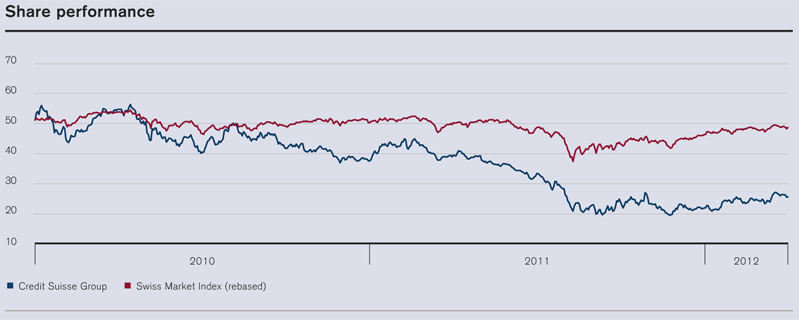
Financial calendar and contacts |
| Financial calendar | |||
| Annual General Meeting | Friday, April 27, 2012 | ||
| Second quarter 2012 results | Thursday, July 26, 2012 | ||
| Third quarter 2012 results | Thursday, October 25, 2012 | ||
| Investor relations | |||
| Phone | +41 44 333 71 49 | ||
| investor.relations@credit-suisse.com | |||
| Internet | www.credit-suisse.com/investors | ||
| Media relations | |||
| Phone | +41 844 33 88 44 | ||
| media.relations@credit-suisse.com | |||
| Internet | www.credit-suisse.com/news | ||
| Additional information | |||
| Results and financial information | www.credit-suisse.com/results | ||
| Printed copies | Credit Suisse AG | ||
| Publikationenbestellungen/TLSA 221 | |||
| P.O. Box | |||
| 8070 Zurich | |||
| Switzerland | |||
| US share register and transfer agent | |||
| ADS depositary bank | Deutsche Bank Trust Company Americas | ||
| Address | Credit Suisse c/o | ||
| American Stock Transfer & Trust Co. | |||
| Peck Slip Station | |||
| P.O. Box 2050 | |||
| New York, NY 10272-2050 | |||
| United States | |||
| US and Canada phone | +1 800 301 35 17 | ||
| Phone from outside US and Canada | +1 718 921 81 37 | ||
| DB@amstock.com | |||
| Swiss share register and transfer agent | |||
| Address | Credit Suisse Group AG | ||
| Dept. RXS | |||
| 8070 Zurich | |||
| Switzerland | |||
| Phone | +41 44 332 26 60 | ||
| Fax | +41 44 332 98 96 | ||
| Foreign currency translation rates | |||||||||||||
| End of | Average in | ||||||||||||
| 1Q12 | 4Q11 | 1Q11 | 1Q12 | 4Q11 | 1Q11 | ||||||||
| 1 USD / 1 CHF | 0.90 | 0.94 | 0.91 | 0.91 | 0.90 | 0.93 | |||||||
| 1 EUR / 1 CHF | 1.20 | 1.22 | 1.30 | 1.21 | 1.22 | 1.28 | |||||||
| 1 GBP / 1 CHF | 1.44 | 1.45 | 1.47 | 1.45 | 1.42 | 1.49 | |||||||
| 100 JPY / 1 CHF | 1.10 | 1.21 | 1.10 | 1.16 | 1.16 | 1.14 | |||||||
| Cautionary statement regarding forward-looking information |
| This report contains statements that constitute forward-looking statements within the meaning of the Private Securities Litigation Reform Act of 1995. In addition, in the future we, and others on our behalf, may make statements that constitute forward-looking statements. Such forward-looking statements may include, without limitation, statements relating to the following: |
| – our plans, objectives or goals; |
| – our future economic performance or prospects; |
| – the potential effect on our future performance of certain contingencies; and |
| – assumptions underlying any such statements. |
| Words such as “believes,” “anticipates,” “expects,” “intends” and “plans” and similar expressions are intended to identify forward-looking statements but are not the exclusive means of identifying such statements. We do not intend to update these forward-looking statements except as may be required by applicable securities laws. |
| By their very nature, forward-looking statements involve inherent risks and uncertainties, both general and specific, and risks exist that predictions, forecasts, projections and other outcomes described or implied in forward-looking statements will not be achieved. We caution you that a number of important factors could cause results to differ materially from the plans, objectives, expectations, estimates and intentions expressed in such forward-looking statements. These factors include: |
| – the ability to maintain sufficient liquidity and access capital markets; |
| – market and interest rate fluctuations and interest rate levels; |
| – the strength of the global economy in general and the strength of the economies of the countries in which we conduct our operations, in particular the risk of continued slow economic recovery or downturn in the US or other developed countries in 2012 and beyond; |
| – the direct and indirect impacts of continuing deterioration or slow recovery in residential and commercial real estate markets; |
| – adverse rating actions by credit rating agencies in respect of sovereign issuers, structured credit products or other credit-related exposures; |
| – the ability to achieve our strategic objectives, including improved performance, reduced risks, lower costs and more efficient use of capital; |
| – the ability of counterparties to meet their obligations to us; |
| – the effects of, and changes in, fiscal, monetary, trade and tax policies, and currency fluctuations; |
| – political and social developments, including war, civil unrest or terrorist activity; |
| – the possibility of foreign exchange controls, expropriation, nationalization or confiscation of assets in countries in which we conduct our operations; |
| – operational factors such as systems failure, human error, or the failure to implement procedures properly; |
| – actions taken by regulators with respect to our business and practices in one or more of the countries in which we conduct our operations; |
| – the effects of changes in laws, regulations or accounting policies or practices; |
| – competition in geographic and business areas in which we conduct our operations; |
| – the ability to retain and recruit qualified personnel; |
| – the ability to maintain our reputation and promote our brand; |
| – the ability to increase market share and control expenses; |
| – technological changes; |
| – the timely development and acceptance of our new products and services and the perceived overall value of these products and services by users; |
| – acquisitions, including the ability to integrate acquired businesses successfully, and divestitures, including the ability to sell non-core assets; |
| – the adverse resolution of litigation and other contingencies; |
| – the ability to achieve our cost-efficiency goals and cost targets; and |
| – our success at managing the risks involved in the foregoing. |
| |
| We caution you that the foregoing list of important factors is not exclusive. When evaluating forward-looking statements, you should carefully consider the foregoing factors and other uncertainties and events, as well as the information set forth in “Risk factors” in the Appendix of our Annual Report 2011. |

| Our 2011 annual publication suite consisting of Annual Report, Company Profile and Corporate Responsibility Report is available on our website www.credit-suisse.com/investors |
| Photography: Alberto Venzago |
| Production: Management Digital Data AG |
| Printer: Swissprinters Zürich AG |