UNITED STATES
SECURITIES AND EXCHANGE COMMISSION
Washington, D.C. 20549
______________
Form 6-K
______________
REPORT OF FOREIGN PRIVATE ISSUER PURSUANT TO RULE 13a-16 OR 15d-16
UNDER THE SECURITIES EXCHANGE ACT OF 1934
April 25, 2012
Commission File Number 001-15244
CREDIT SUISSE GROUP AG
(Translation of registrant’s name into English)
Paradeplatz 8, CH 8001 Zurich, Switzerland
(Address of principal executive office)
______________
Commission File Number 001-33434
CREDIT SUISSE AG
(Translation of registrant’s name into English)
Paradeplatz 8, CH 8001 Zurich, Switzerland
(Address of principal executive office)
______________
Indicate by check mark whether the registrant files or will file annual reports under cover of Form 20-F or Form 40-F.
Form 20-F  | Form 40-F  |
Indicate by check mark if the registrant is submitting the Form 6-K in paper as permitted by Regulation S-T Rule 101(b)(1):
Note: Regulation S-T Rule 101(b)(1) only permits the submission in paper of a Form 6-K if submitted solely to provide an attached annual report to security holders.
Indicate by check mark if the registrant is submitting the Form 6-K in paper as permitted by Regulation S-T Rule 101(b)(7):
Note: Regulation S-T Rule 101(b)(7) only permits the submission in paper of a Form 6-K if submitted to furnish a report or other document that the registrant foreign private issuer must furnish and make public under the laws of the jurisdiction in which the registrant is incorporated, domiciled or legally organized (the registrant’s “home country”), or under the rules of the home country exchange on which the registrant’s securities are traded, as long as the report or other document is not a press release, is not required to be and has not been distributed to the registrant’s security holders, and, if discussing a material event, has already been the subject of a Form 6-K submission or other Commission filing on EDGAR.
Indicate by check mark whether the registrant by furnishing the information contained in this Form is also thereby furnishing the information to the Commission pursuant to Rule 12g3-2(b) under the Securities Exchange Act of 1934.
Yes | No |
If “Yes” is marked, indicate below the file number assigned to the registrant in connection with Rule 12g3-2(b): 82-.
| CREDIT SUISSE GROUP AG | ||
Paradeplatz 8 P.O. Box CH-8070 Zurich Switzerland | Telephone +41 844 33 88 44 Fax +41 44 333 88 77 media.relations@credit-suisse.com | |
Media Release |
Credit Suisse Group 1Q12 normalized* net income attributable to shareholders of CHF 1,355 million and return on equity of 15.9%; Credit Suisse Group 1Q12 reported net income of CHF 44 million and return on equity of 0.5%, primarily due to fair value losses of CHF 1,554 million before taxes resulting from a significant tightening in own credit spreads Private Banking with net revenues of CHF 2,651 million and pre-tax income of CHF 625 million; · Net new assets of CHF 8.4 billion; · Good progress on strategic realignment in Private Banking, including the integration of Clariden Leu; · Significant cost and profit improvement measures executed in 1Q12 Investment Banking with net revenues of CHF 4,140 million and pre-tax income of CHF 993 million; · Further reduced risk-weighted assets by USD 38 billion or 15% in 1Q12 and by 33% since 1Q11; · Increased operating efficiency through lower cost base; normalized* after-tax return of 19% on Basel III allocated capital up from 15% in 1Q11; · Strong client market share momentum across businesses Asset Management with net revenues of CHF 663 million; pre-tax income of CHF 250 million; · Excluding a gain of CHF 178 million from the partial sale of an investment in Aberdeen Asset Management, pre-tax income of CHF 72 million; · Net asset outflows of CHF 13.7 billion, primarily from a single low margin mandate Reduced 1Q12 normalized* expense run rate on an annualized and FX-neutral basis by CHF 1.5 billion versus annualized 1H11 run rate, exceeding previously announced CHF 1.2 billion reduction target Continued strong capitalization and funding: · Basel II.5 core tier 1 ratio increased by 1.1 percentage points to 11.8%, Basel II.5 tier 1 ratio increased by 0.4 percentage points to 15.6%; · Successful issuance of CHF 750 million of high-trigger contingent convertible bonds, thereby fulfilling Swiss high-trigger requirement, and repurchase of CHF 4.7 billion in capital instruments ineffective under Basel III; · Net stable funding ratio (NSFR) of 100% |
| Media Release | |
April 25, 2012 Page 2/12 |
Exceeded previously announced Basel III risk-weighted-assets reduction plan targets with overall RWA for the Group of CHF 294 billion; Investment Banking RWA of USD 210 billion already close to previously announced year-end 2012 reduction target of USD 190 billion
Zurich, April 25, 2012 Credit Suisse Group reports 1Q12 Core Results normalized* pre-tax income of CHF 1,918 million, normalized* net income attributable to shareholders of CHF 1,355 million, normalized* return on equity of 15.9%; net income attributable to shareholders of CHF 44 million; diluted earnings per share of CHF 0.03
Brady W. Dougan, Chief Executive Officer, said: “We had a good start to 2012. We began to see the effects from the measures we announced in mid-2011 to evolve our business model and cost structure and we benefited from an improved market environment. Our reported results were adversely impacted by accounting driven fair value losses due to tightening of our own credit spreads. Adjusted for this effect of CHF 1.6 billion, as well as for other significant non-operating items, we delivered a normalized* return on equity of 15.9% for the quarter, consistent with our group target range.”
He continued: “Investing in our client franchise while at the same time reducing risks and tightly managing costs has been a priority for us. In the quarter, we achieved a good mix of revenues across our businesses while reducing our annualized cost run rate by CHF 1.5 billion, which exceeded our previously announced reduction target of CHF 1.2 billion. Our performance in the first quarter is indicative of what our business model can produce and it underscores the strength of the client franchise we have built over the past years. Despite ongoing low levels of client activity in Private Banking, we attracted net new assets of CHF 8.4 billion in the first quarter 2012, for a total of CHF 149 billion in net new assets since the beginning of 2009. We are pleased that while reducing Basel III risk-weighted assets by 33% over the past year in Investment Banking, we were able to improve our market share positions and client momentum across businesses.”
He concluded: “We further reduced risk-weighted assets in the first quarter, and are now close to our previously announced year-end 2012 target with Basel III risk-weighted assets of USD 210 billion in Investment Banking. During the quarter, we successfully issued CHF 750 million of contingent convertible bonds, thereby fulfilling our expected Swiss requirement for high-trigger contingent capital. Furthermore, our strong liquidity position enabled us to repurchase CHF 4.7 billion in capital instruments which will no longer qualify for regulatory capital treatment under the proposed Basel III framework while achieving a NSFR of 100%. Both measures further strengthened our regulatory capital in preparation for the Basel III requirements.”
| Media Release | |
April 25, 2012 Page 3/12 |
| normalized* | reported | |||
| in CHF million (unless otherwise stated) | 1Q12 | 1Q12 | 4Q11 | 1Q11 |
| Net income/loss attributable to shareholders | 1,355 | 44 | (637) | 1,139 |
| Diluted earnings per share (CHF) | 1.01 | 0.03 | 0.62 | 0.90 |
| Return on equity attributable to shareholders (annualized) | 15.9% | 0,5% | (7.7%) | 13.4% |
| Basel II.5 Tier 1 ratio (end of period) | - | 15.6% | 15.2% | 14.7% |
| Assets under management (CHF billion) | - | 1,249.6 | 1,229.5 | 1,282.4 |
| Core results | ||||
| Net revenues | 7,254 | 5,878 | 4,473 | 7,813 |
| Provision for credit losses | 34 | 34 | 97 | (7) |
| Total operating expenses | 5,302 | 5,804 | 5,374 | 6,195 |
| Income/loss before taxes | 1,918 | 40 | (998) | 1,625 |
| * These normalized results are non-GAAP financial measures. See page 6 of this media release for reconciliation information. | ||||
Segment Results
Private Banking
Private Banking, which comprises the global Wealth Management Clients business and the Swiss Corporate & Institutional Clients business, reported net revenues of CHF 2,651 million and income before taxes of CHF 625 million in 1Q12. Net revenues increased 3% from 4Q11, mainly driven by higher transaction-based revenues. Total operating expenses were 2% lower compared to 4Q11, driven by lower general and administrative expenses.
The Wealth Management Clients business reported net revenues of CHF 2,185 million, 10% below 1Q11 and 3% above 4Q11 both mainly due to transaction-based revenues. Income before taxes was CHF 406 million in 1Q12 compared to CHF 624 million in 1Q11 and to CHF 285 million in 4Q11. Total operating expenses were CHF 1,757 million, slightly below 1Q11, due to lower commission expenses and lower compensation and benefits, while general and administrative expenses were slightly higher. Compared to 4Q11, total operating expenses were slightly lower, despite full recognition of the deferred compensation expense from the PAF2 awards, which were granted and expensed in 1Q12. Provision for credit losses increased to CHF 22 million compared to CHF 12 million in 1Q11, but decreased compared to CHF 43 million in 4Q11, due to lower new provisions. The gross margin of 109 basis points decreased 9 basis points compared to 1Q11, reflecting the substantially lower transaction-based revenues and lower recurring commissions and fees. The gross margin was stable versus 4Q11.
The Corporate & Institutional Clients business, which provides comprehensive coverage for all the financial service needs of corporate and institutional clients in Switzerland and for banks worldwide, reported net revenues of CHF 466 million, stable compared to 1Q11 and slightly up compared to 4Q11, mainly due to higher recurring commissions and fees. Income before taxes of CHF 219 million in 1Q12 was down 6% compared to 1Q11 due to higher provision for credit losses and up 20% compared to
| Media Release | |
April 25, 2012 Page 4/12 |
4Q11, mainly due to lower provisions for credit losses. Total operating expenses were stable compared to 1Q11 and decreased 5% compared to 4Q11.
Investment Banking
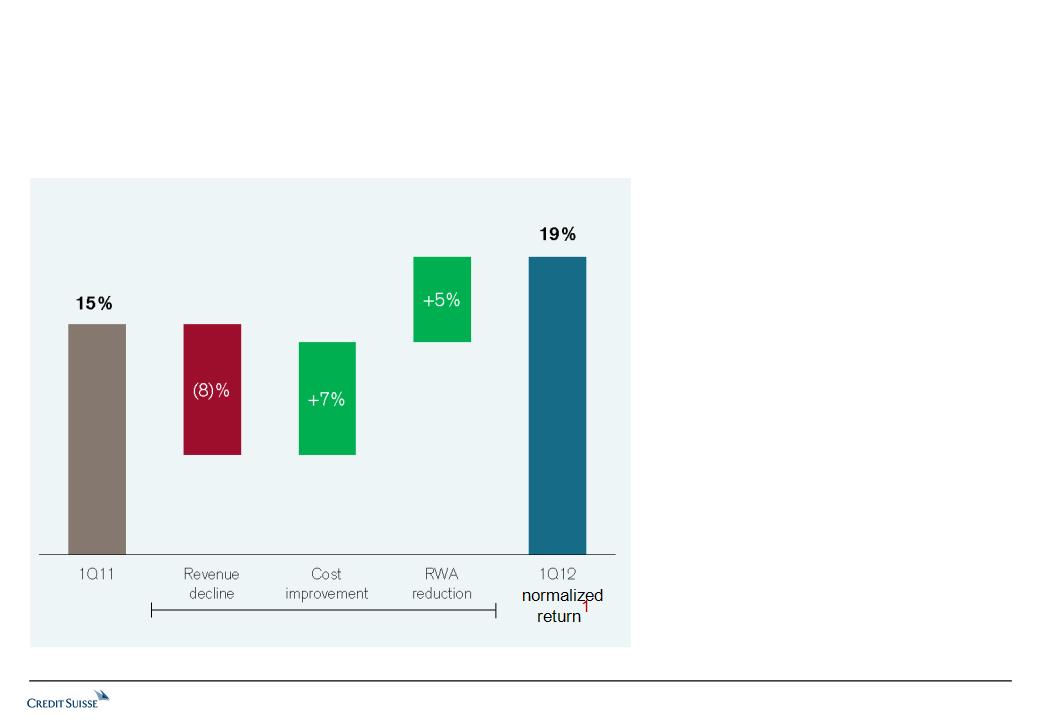
In 1Q12, Investment Banking reported net revenues of CHF 4,140 million and income before taxes of CHF 993 million. Investment Banking’s normalized* after-tax return on Basel III allocated capital increased from 15% in 1Q11 to 19% in 1Q12, reflecting a more balanced business mix, continued market share momentum, significant Basel III risk-weighted asset reduction and increased operating efficiency.
In the quarter, consistent with the execution of the refined strategy in Investment Banking, Basel III risk-weighted assets were further reduced by USD 38 billion to USD 210 billion. Compared to the first quarter 2011, risk-weighted assets were reduced by 33% from USD 312 billion.
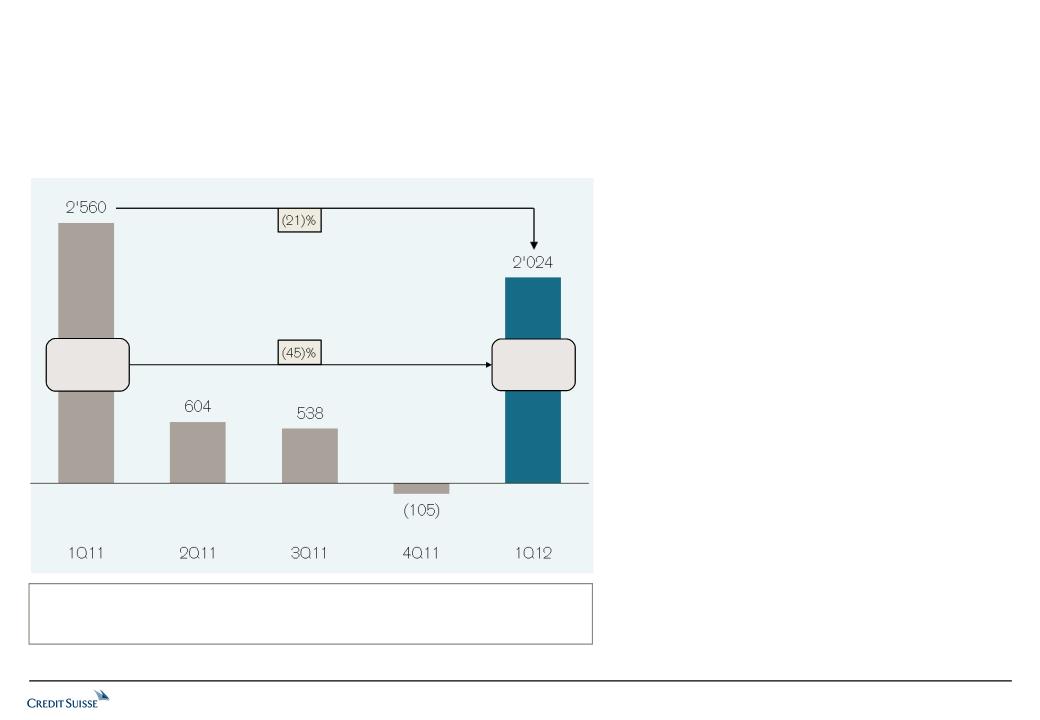
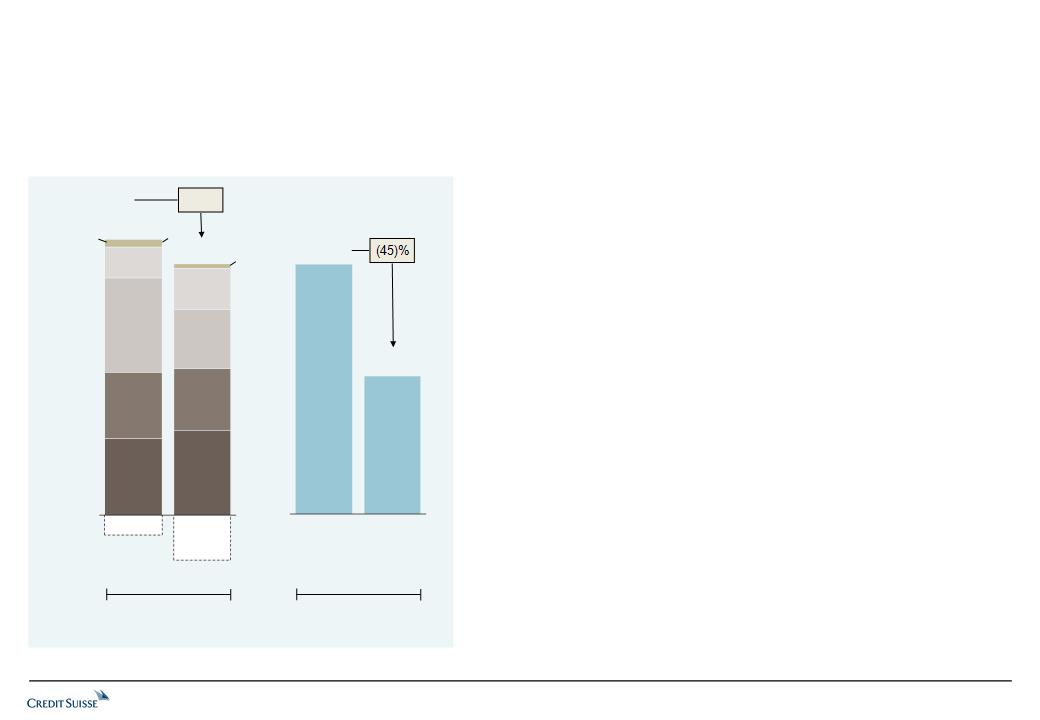
Fixed income sales and trading revenues of CHF 2,024 million were significantly higher compared to 4Q11, driven by client momentum, the execution of our strategy, improved trading conditions and better client flow. We had more balanced results among our macro businesses (global rates and foreign exchange), securitized products and global credit products, and a strong performance in emerging markets. Relative to 1Q11, fixed income sales and trading revenues were 21% lower. This was primarily due to a record quarter for securitized products in 1Q11, which benefited from higher inventory levels, and losses in 1Q12 from businesses we are exiting versus revenues in 1Q11. Since 1Q11, fixed income Basel III risk-weighted assets were reduced by 45%, while revenues declined by substantially less, demonstrating improved capital efficiency and resource allocation resulting from the refined strategy in Investment Banking.
Equity sales and trading revenues of CHF 1,401 million were solid, despite sustained weak trading volumes, reflecting stable market share positions across key businesses such as prime services and cash equities. A significant improvement in derivatives over 4Q11 was driven by improved market conditions and stronger customer flows. Results were 84% higher than in 4Q11 but 12% lower than in 1Q11, primarily driven by client volumes and activity levels.
Underwriting and advisory revenues of CHF 761 million increased 47% from a weak 4Q11, driven by market share momentum and strong debt underwriting results, reflecting an increase of new issue activity in high yield and investment grade. Revenues decreased 18% relative to 1Q11, reflecting low industry-wide volumes.
Compensation and benefits of CHF 2,063 million were higher than in 4Q11, driven by higher deferred compensation expense of CHF 418 million related to the PAF2 awards, but lower than in 1Q11, primarily reflecting lower discretionary performance-related compensation expense. Total other operating expenses declined from 1Q11 and 4Q11.
Asset Management
Asset Management reported net revenues of CHF 663 million and income before taxes of CHF 250 million with a pre-tax margin of 38%.
In February 2012 a partial sale of our investment in Aberdeen Asset Management was completed, resulting in a gain of CHF 178 million. This sale reduced Credit Suisse’s investment in Aberdeen from
| Media Release | |
April 25, 2012 Page 5/12 |
19.8% to 9.8%. Excluding this gain, income before taxes was CHF 72 million, down from CHF 175 million in 1Q11 and from CHF 90 million in 4Q11.
Investment-related gains of CHF 101 million decreased 37% from 1Q11 but increased significantly compared to 4Q11.
Fee-based revenues of CHF 409 million decreased 9% compared to 1Q11, with a decline in placement fees, asset management fees and equity participations income. Our fee-based margin was 40 basis points compared to 41 basis points in 1Q11.
Total operating expenses of CHF 413 million were up 12% compared to 4Q11 and remained stable compared to 1Q11. They include higher deferred compensation expense of CHF 46 million from the PAF2 awards.
| in CHF million | 1Q12 | 4Q11 | 1Q11 | Change in % | Change in % | |
| vs. 4Q11 | vs. 1Q11 | |||||
| Private | Net revenues | 2,651 | 2,575 | 2,897 | 3 | (8) |
| Banking | Provision for credit losses | 40 | 75 | 12 | (47) | 233 |
| Total operating expenses | 1,986 | 2,032 | 2,029 | (2) | (2) | |
| Income before taxes | 625 | 468 | 856 | 34 | (27) | |
| Investment | Net revenues | 4,140 | 1,113 | 5,066 | 272 | (18) |
| Banking | Provision for credit losses | (6) | 22 | (19) | - | (68) |
| Total operating expenses | 3,153 | 2,534 | 3,605 | 24 | (13) | |
| Income/(loss) before taxes | 993 | (1,443) | 1,480 | - | (33) | |
| Asset | Net revenues | 663 | 458 | 594 | 45 | 12 |
| Management | Provision for credit losses | 0 | 0 | 0 | - | - |
| Total operating expenses | 413 | 368 | 419 | 12 | (1) | |
| Income before taxes | 250 | 90 | 175 | 178 | 43 | |
Net new assets
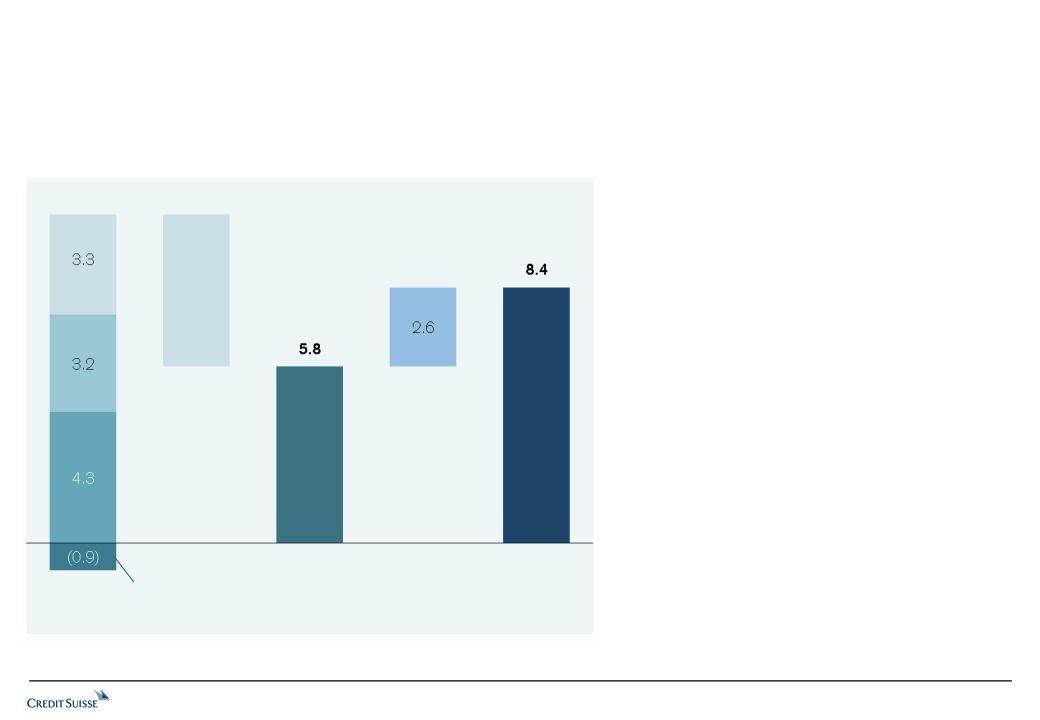
Credit Suisse Group reported net asset outflows of CHF 7.1 billion in 1Q12. Private Banking attracted net new assets of CHF 8.4 billion. Wealth Management Clients contributed net new assets of CHF 5.8 billion, driven by inflows mainly from its ultra-high-net-worth individual client segment and emerging markets. Corporate & Institutional Clients in Switzerland reported inflows of CHF 2.6 billion. Asset Management recorded net asset outflows of CHF 13.7 billion, primarily from a single low margin mandate.
Capital and liquidity
Credit Suisse continued to conservatively manage its liquidity with an estimated NSFR of 100%. Credit Suisse’s capital position remains very strong, with a Basel II.5 core tier 1 ratio of 11.8% and a Basel II.5 tier 1 ratio of 15.6% as of the end of 1Q12 up 1.1 percentage points and 0.4 percentage points versus 4Q11, respectively. This increase was driven by the stronger performance of the Group and strong regulatory capital generation during the quarter.
| Media Release | |
April 25, 2012 Page 6/12 |
Corporate Center
The Corporate Center recorded a loss before taxes of CHF 1,828 million in 1Q12, including net fair value losses on own debt of CHF 894 million, debit valuation adjustments on certain structured note liabilities of CHF 482 million and on stand-alone derivatives of CHF 178 million. The fair value losses on debt reflected the narrowing of credit spreads on senior and subordinated debt across all currencies. This compares to a loss before taxes of CHF 886 million in 1Q11 and a loss before taxes of CHF 113 million in 4Q11.
Beginning in 1Q12, DVA relating to certain structured note liabilities and fair value adjustments on Credit Suisse debt are fully reflected in the Corporate Center rather than allocated across the Corporate Center and the segments. Therefore, the segments’ results reflect reclassifications made to prior periods to conform to the current presentation.
Benefits of the integrated bank
Credit Suisse generated CHF 948 million in collaboration revenues from the integrated bank in 1Q12.
* Normalized and underlying results in the following table are non-GAAP financial measures. The table below includes a reconciliation of certain of these measures. For further information on the calculation of normalized and underlying measures, including the normalized measures in table on page 3, normalized cost run rate for 1Q12 on an annualized, FX-neutral basis and Investment Banking's normalized after-tax return on Basel III allocated capital, see the 1Q12 Results Presentation Slides.
| Overview of significant items in 1Q12 | |||||
| in CHF million | Core Results pre-tax income | Income tax expense/(benefit) | Non-controlling interests | Net income attributable to shareholders | Return on equity |
| Reported results | 40 | 16 | (12) | 44 | 0.5% |
Fair value losses from movement in own credit spreads1 | 1,554 | (444) | - | 1,110 | |
| Realignment costs | 68 | (21) | - | 47 | |
| Gain on sale of stake in Aberdeen Asset Management | (178) | 32 | - | (146) | |
| Underlying results | 1,484 | (417) | (12) | 1,055 | 12.4% |
| PAF2 related expense | 534 | (165) | - | 369 | |
Assumed share-based award expense2 | (100) | 31 | - | (69) | |
| Normalized results | 1,918 | (551) | (12) | 1,355 | 15.9% |
1Fair value gains/losses on own liabilities are an element of fair value accounting under US GAAP. They reflect the volatility of the Group's credit spreads and, over the life of the respective liability, will result in no gains or losses. | |||||
2 Adjusted for the accelerated compensation expense in 1Q12 by replacing PAF2 expense with assumed share-based awards expense for 1Q 12. This calculation assumes that share-based awards (with three-year vesting) had been awarded in lieu of PAF2 awards (with accelerated vesting) during 1Q12. | |||||
Information
Media Relations Credit Suisse AG, telephone +41 844 33 88 44, media.relations@credit-suisse.com
Investor Relations Credit Suisse AG, telephone +41 44 333 71 49, investor.relations@credit-suisse.com
| Media Release | |
April 25, 2012 Page 7/12 |
Credit Suisse AG
Credit Suisse AG is one of the world's leading financial services providers and is part of the Credit Suisse group of companies (referred to here as 'Credit Suisse'). As an integrated bank, Credit Suisse offers clients its combined expertise in the areas of private banking, investment banking and asset management. Credit Suisse provides advisory services, comprehensive solutions and innovative products to companies, institutional clients and high-net-worth private clients globally, as well as to retail clients in Switzerland. Credit Suisse is headquartered in Zurich and operates in over 50 countries worldwide. The group employs approximately 48,700 people. The registered shares (CSGN) of Credit Suisse's parent company, Credit Suisse Group AG, are listed in Switzerland and, in the form of American Depositary Shares (CS), in New York. Further information about Credit Suisse can be found at www.credit-suisse.com.
Cautionary statement regarding forward-looking information \non-GAAP information\ Basel III disclosures
This press release contains statements that constitute forward-looking statements within the meaning of the Private Securities Litigation Reform Act of 1995. In addition, in the future we, and others on our behalf, may make statements that constitute forward-looking statements. Such forward-looking statements may include, without limitation, statements relating to the following:
| – | our plans, objectives or goals; |
| – | our future economic performance or prospects; |
| – | the potential effect on our future performance of certain contingencies; and |
| – | assumptions underlying any such statements. |
Words such as “believes,” “anticipates,” “expects,” “intends” and “plans” and similar expressions are intended to identify forward-looking statements but are not the exclusive means of identifying such statements. We do not intend to update these forward-looking statements except as may be required by applicable securities laws. By their very nature, forward-looking statements involve inherent risks and uncertainties, both general and specific, and risks exist that predictions, forecasts, projections and other outcomes described or implied in forward-looking statements will not be achieved. We caution you that a number of important factors could cause results to differ materially from the plans, objectives, expectations, estimates and intentions expressed in such forward-looking statements. These factors include:
| – | the ability to maintain sufficient liquidity and access capital markets; |
| – | market and interest rate fluctuations and interest rate levels; |
| – | the strength of the global economy in general and the strength of the economies of the countries in which we conduct our operations, in particular the risk of continued slow economic recovery or downturn in the US or other developed countries in 2012 and beyond; |
| – | the direct and indirect impacts of continuing deterioration or slow recovery in residential and commercial real estate markets; |
| – | adverse rating actions by credit rating agencies in respect of sovereign issuers, structured credit products or other credit-related exposures; |
| – | the ability to achieve our strategic objectives, including improved performance, reduced risks, lower costs, and more efficient use of capital; |
| – | the ability of counterparties to meet their obligations to us; |
| – | the effects of, and changes in, fiscal, monetary, trade and tax policies, and currency fluctuations; |
| – | political and social developments, including war, civil unrest or terrorist activity; |
| – | the possibility of foreign exchange controls, expropriation, nationalization or confiscation of assets in countries in which we conduct our operations; |
| – | operational factors such as systems failure, human error, or the failure to implement procedures properly; |
| – | actions taken by regulators with respect to our business and practices in one or more of the countries in which we conduct our operations; |
| – | the effects of changes in laws, regulations or accounting policies or practices; |
| – | competition in geographic and business areas in which we conduct our operations; |
| – | the ability to retain and recruit qualified personnel; |
| – | the ability to maintain our reputation and promote our brand; |
| – | the ability to increase market share and control expenses; |
| – | technological changes; |
| – | the timely development and acceptance of our new products and services and the perceived overall value of these products and services by users; |
| – | acquisitions, including the ability to integrate acquired businesses successfully, and divestitures, including the ability to sell non-core assets; |
| – | the adverse resolution of litigation and other contingencies; |
| – | the ability to achieve our cost efficiency goals and cost targets; and |
| – | our success at managing the risks involved in the foregoing. |
We caution you that the foregoing list of important factors is not exclusive. When evaluating forward-looking statements, you should carefully consider the foregoing factors and other uncertainties and events, as well as the information set forth in our Annual Report 2011 under “Risk factors” in the Appendix.
This press release contains non-GAAP financial information. Information needed to reconcile such non-GAAP financial information to the most directly comparable measures under GAAP can be found in the 1Q12 Credit Suisse Financial Release and the 1Q12 Results Presentation Slides.
As Basel III will not be implemented before January 1, 2013, our Basel III risk-weighted assets were calculated for purposes of this release in accordance with the currently proposed requirements and our current interpretation of such requirements, including relevant assumptions. Changes in the requirements upon implementation of Basel III would result in different numbers from those used in the release.
| Media Release | |
April 25, 2012 Page 8/12 |
Presentation of Credit Suisse Group’s 1Q12 results via audio webcast and telephone conference
Date Wednesday, April 25, 2012
Time 09:00 Zurich / 08:00 London / 03:00 New York
Speakers Brady W. Dougan, Chief Executive Officer
David Mathers, Chief Financial Officer
The presentations will be held in English.
Audio webcast www.credit-suisse.com/results
Telephone Switzerland: +41 44 580 40 01
Europe: +44 1452 565 510
US: +1 866 389 9771
Reference: Credit Suisse Group quarterly results
| Q&A session | Following the presentations, you will have the opportunity to ask questions via the telephone conference. |
Playback Replay available approximately two hours after the event by visiting
www.credit-suisse.com/results or by dialing:
Switzerland:+41 44 580 34 56
Europe: +44 1452 550 000
US: +1 866 247 4222
Conference ID: 69079829#
| Media Release | |
April 25, 2012 Page 9/12 |
| Financial highlights | |||||||||||
| in / end of | % change | ||||||||||
| 1Q12 | 4Q11 | 1Q11 | QoQ | YoY | |||||||
| Net income (CHF million) | |||||||||||
| Net income/(loss) attributable to shareholders | 44 | (637) | 1,139 | – | (96) | ||||||
| Earnings per share (CHF) | |||||||||||
| Basic earnings/(loss) per share | 0.03 | (0.62) | 0.91 | – | (97) | ||||||
| Diluted earnings/(loss) per share | 0.03 | (0.62) | 0.90 | – | (97) | ||||||
| Return on equity (%, annualized) | |||||||||||
| Return on equity attributable to shareholders | 0.5 | (7.7) | 13.4 | – | – | ||||||
| Core Results (CHF million) 1 | |||||||||||
| Net revenues | 5,878 | 4,473 | 7,813 | 31 | (25) | ||||||
| Provision for credit losses | 34 | 97 | (7) | (65) | – | ||||||
| Total operating expenses | 5,804 | 5,374 | 6,195 | 8 | (6) | ||||||
| Income/(loss) before taxes | 40 | (998) | 1,625 | – | (98) | ||||||
| Core Results statement of operations metrics (%) 1 | |||||||||||
| Cost/income ratio | 98.7 | 120.1 | 79.3 | – | – | ||||||
| Pre-tax income margin | 0.7 | (22.3) | 20.8 | – | – | ||||||
| Effective tax rate | (40.0) | 39.8 | 28.6 | – | – | ||||||
| Net income margin 2 | 0.7 | (14.2) | 14.6 | – | – | ||||||
| Assets under management and net new assets (CHF billion) | |||||||||||
| Assets under management | 1,249.6 | 1,229.5 | 1,282.4 | 1.6 | (2.6) | ||||||
| Net new assets | (7.1) | 0.4 | 19.1 | – | – | ||||||
| Balance sheet statistics (CHF million) | |||||||||||
| Total assets | 1,000,020 | 1,049,165 | 1,016,468 | (5) | (2) | ||||||
| Net loans | 231,696 | 233,413 | 222,510 | (1) | 4 | ||||||
| Total shareholders' equity | 33,585 | 33,674 | 34,057 | 0 | (1) | ||||||
| Tangible shareholders' equity 3 | 24,992 | 24,795 | 25,330 | 1 | (1) | ||||||
| Book value per share outstanding (CHF) | |||||||||||
| Total book value per share | 27.43 | 27.59 | 28.36 | (1) | (3) | ||||||
| Tangible book value per share 3 | 20.41 | 20.32 | 21.10 | 0 | (3) | ||||||
| Shares outstanding (million) | |||||||||||
| Common shares issued | 1,224.5 | 1,224.3 | 1,201.0 | 0 | 2 | ||||||
| Treasury shares | 0.0 | (4.0) | 0.0 | 100 | – | ||||||
| Shares outstanding | 1,224.5 | 1,220.3 | 1,201.0 | 0 | 2 | ||||||
| Market capitalization | |||||||||||
| Market capitalization (CHF million) | 31,507 | 27,021 | 46,876 | 17 | (33) | ||||||
| Market capitalization (USD million) | 34,911 | 28,747 | 51,139 | 21 | (32) | ||||||
| BIS statistics (Basel II.5) 4 | |||||||||||
| Risk-weighted assets (CHF million) | 234,390 | 241,753 | 242,833 | (3) | (3) | ||||||
| Tier 1 ratio (%) | 15.6 | 15.2 | 14.7 | – | – | ||||||
| Core tier 1 ratio (%) | 11.8 | 10.7 | 10.2 | – | – | ||||||
| Number of employees (full-time equivalents) | |||||||||||
| Number of employees | 48,700 | 49,700 | 50,100 | (2) | (3) | ||||||
| 1 Refer to "Credit Suisse Reporting structure and Core Results" in I – Credit Suisse results – Credit Suisse for further information on Core Results. 2 Based on amounts attributable to shareholders. 3 A non-GAAP financial measure. Tangible shareholders' equity is calculated by deducting goodwill and other intangible assets from total shareholders' equity. 4 Reported under Basel II.5 since December 31, 2011. Previously reported under Basel II. Prior periods have been adjusted to conform to the current presentation. Refer to "Treasury management" in II – Treasury, Risk, Balance sheet and Off-balance sheet for further information. | |||||||||||
| Media Release | |
April 25, 2012 Page 10/12 |
| Core Results | |||||||||||
| in / end of | % change | ||||||||||
| 1Q12 | 4Q11 | 1Q11 | QoQ | YoY | |||||||
| Statements of operations (CHF million) | |||||||||||
| Net interest income | 1,861 | 1,661 | 1,732 | 12 | 7 | ||||||
| Commissions and fees | 3,179 | 2,765 | 3,679 | 15 | (14) | ||||||
| Trading revenues | 180 | (36) | 2,004 | – | (91) | ||||||
| Other revenues | 658 | 83 | 398 | – | 65 | ||||||
| Net revenues | 5,878 | 4,473 | 7,813 | 31 | (25) | ||||||
| Provision for credit losses | 34 | 97 | (7) | (65) | – | ||||||
| Compensation and benefits | 3,707 | 3,023 | 4,025 | 23 | (8) | ||||||
| General and administrative expenses | 1,646 | 1,871 | 1,634 | (12) | 1 | ||||||
| Commission expenses | 451 | 480 | 536 | (6) | (16) | ||||||
| Total other operating expenses | 2,097 | 2,351 | 2,170 | (11) | (3) | ||||||
| Total operating expenses | 5,804 | 5,374 | 6,195 | 8 | (6) | ||||||
| Income/(loss) before taxes | 40 | (998) | 1,625 | – | (98) | ||||||
| Income tax expense/(benefit) | (16) | (397) | 465 | (96) | – | ||||||
| Net income/(loss) | 56 | (601) | 1,160 | – | (95) | ||||||
| Net income attributable to noncontrolling interests | 12 | 36 | 21 | (67) | (43) | ||||||
| Net income/(loss) attributable to shareholders | 44 | (637) | 1,139 | – | (96) | ||||||
| Statement of operations metrics (%) | |||||||||||
| Cost/income ratio | 98.7 | 120.1 | 79.3 | – | – | ||||||
| Pre-tax income margin | 0.7 | (22.3) | 20.8 | – | – | ||||||
| Effective tax rate | (40.0) | 39.8 | 28.6 | – | – | ||||||
| Net income margin 1 | 0.7 | (14.2) | 14.6 | – | – | ||||||
| Number of employees (full-time equivalents) | |||||||||||
| Number of employees | 48,700 | 49,700 | 50,100 | (2) | (3) | ||||||
| 1 Based on amounts attributable to shareholders. | |||||||||||
| Media Release | |
April 25, 2012 Page 11/12 |
| Consolidated statements of comprehensive income (unaudited) |
| in | 1Q12 | 4Q11 | 1Q11 | ||||
| Comprehensive income (CHF million) | |||||||
| Net income/(loss) | 214 | (592) | 1,501 | ||||
| Gains/(losses) on cash flow hedges | 14 | (6) | (17) | ||||
| Foreign currency translation | (1,117) | 909 | (582) | ||||
| Unrealized gains/(losses) on securities | 184 | (8) | (40) | ||||
| Actuarial gains/(losses) | 73 | (699) | 27 | ||||
| Net prior service cost | (22) | 385 | 3 | ||||
| Other comprehensive income/(loss), net of tax | (868) | 581 | (609) | ||||
| Comprehensive income/(loss) | (654) | (11) | 892 | ||||
| Comprehensive income/(loss) attributable to noncontrolling interests | (9) | 268 | 209 | ||||
| Comprehensive income/(loss) attributable to shareholders | (645) | (279) | 683 | ||||
| Consolidated balance sheets (unaudited) |
| end of | 1Q12 | 4Q11 | 1Q11 | ||||
| Assets (CHF million) | |||||||
| Cash and due from banks | 89,449 | 110,573 | 73,360 | ||||
| Interest-bearing deposits with banks | 2,570 | 2,272 | 1,437 | ||||
| Central bank funds sold, securities purchased under resale agreements and securities borrowing transactions | 192,068 | 236,963 | 204,491 | ||||
| Securities received as collateral, at fair value | 33,761 | 30,191 | 37,033 | ||||
| of which encumbered | 21,747 | 20,447 | 20,734 | ||||
| Trading assets, at fair value | 300,597 | 279,553 | 314,201 | ||||
| of which encumbered | 78,605 | 73,749 | 88,210 | ||||
| Investment securities | 5,604 | 5,160 | 6,483 | ||||
| Other investments | 12,294 | 13,226 | 16,166 | ||||
| Net loans | 231,696 | 233,413 | 222,510 | ||||
| of which encumbered | 552 | 471 | 553 | ||||
| allowance for loan losses | (908) | (910) | (974) | ||||
| Premises and equipment | 6,878 | 7,193 | 6,669 | ||||
| Goodwill | 8,333 | 8,591 | 8,433 | ||||
| Other intangible assets | 260 | 288 | 294 | ||||
| Brokerage receivables | 42,801 | 43,446 | 47,275 | ||||
| Other assets | 73,709 | 78,296 | 78,116 | ||||
| of which encumbered | 2,302 | 2,255 | 2,534 | ||||
| Total assets | 1,000,020 | 1,049,165 | 1,016,468 | ||||
| Media Release | |
April 25, 2012 Page 12/12 |
| Consolidated balance sheets (unaudited) (continued) |
| end of | 1Q12 | 4Q11 | 1Q11 | ||||
| Liabilities and equity (CHF million) | |||||||
| Due to banks | 39,035 | 40,147 | 41,113 | ||||
| Customer deposits | 304,943 | 313,401 | 293,295 | ||||
| Central bank funds purchased, securities sold under repurchase agreements and securities lending transactions | 167,457 | 176,559 | 141,078 | ||||
| Obligation to return securities received as collateral, at fair value | 33,761 | 30,191 | 37,033 | ||||
| Trading liabilities, at fair value | 114,500 | 127,760 | 134,846 | ||||
| Short-term borrowings | 16,331 | 26,116 | 23,023 | ||||
| Long-term debt | 155,631 | 162,655 | 175,877 | ||||
| Brokerage payables | 67,569 | 68,034 | 64,693 | ||||
| Other liabilities | 59,929 | 63,217 | 62,222 | ||||
| Total liabilities | 959,156 | 1,008,080 | 973,180 | ||||
| Common shares | 49 | 49 | 48 | ||||
| Additional paid-in capital | 22,262 | 21,796 | 22,565 | ||||
| Retained earnings | 27,097 | 27,053 | 26,455 | ||||
| Treasury shares, at cost | 0 | (90) | 0 | ||||
| Accumulated other comprehensive income/(loss) | (15,823) | (15,134) | (15,011) | ||||
| Total shareholders' equity | 33,585 | 33,674 | 34,057 | ||||
| Noncontrolling interests | 7,279 | 7,411 | 9,231 | ||||
| Total equity | 40,864 | 41,085 | 43,288 | ||||
| Total liabilities and equity | 1,000,020 | 1,049,165 | 1,016,468 | ||||
| end of | 1Q12 | 4Q11 | 1Q11 | ||||
| Additional share information | |||||||
| Par value (CHF) | 0.04 | 0.04 | 0.04 | ||||
| Authorized shares (million) | 1,868.1 | 1,868.1 | 1,468.3 | ||||
| Common shares issued (million) | 1,224.5 | 1,224.3 | 1,201.0 | ||||
| Treasury shares (million) | 0.0 | (4.0) | 0.0 | ||||
| Shares outstanding (million) | 1,224.5 | 1,220.3 | 1,201.0 | ||||
First Quarter 2012 Results
Presentation to Investors and Media
April 25, 2012

Disclaimer
Cautionary statement regarding forward-looking statements
This presentation contains forward-looking statements within the meaning of the Private Securities Litigation Reform Act
of 1995. Forward-looking statements involve inherent risks and uncertainties, and we might not be able to achieve the
predictions, forecasts, projections and other outcomes we describe or imply in forward-looking statements. A number of
important factors could cause results to differ materially from the plans, objectives, expectations, estimates and intentions
we express in these forward-looking statements, including those we identify in "Risk Factors" in our Annual Report on
Form 20-F for the fiscal year ended December 31, 2011 and in "Cautionary statement regarding forward-looking
information" in our first quarter report 2012 filed with the US Securities and Exchange Commission and in other public
filings and press releases. We do not intend to update these forward-looking statements except as may be required by
applicable laws.
Statement regarding non-GAAP financial measures
This presentation also contains non-GAAP financial measures. Information needed to reconcile such non-GAAP financial
measures to the most directly comparable measures under GAAP can be found in this presentation and in our first
quarter report 2012.
measures to the most directly comparable measures under GAAP can be found in this presentation and in our first
quarter report 2012.
Statement regarding Basel 3 disclosures
As Basel 3 will not be implemented before January 1, 2013, we have calculated our Basel 3 risk-weighted assets and
capital for purposes of this presentation in accordance with the currently proposed requirements and our current
interpretation of such requirements, including relevant assumptions. Changes in the requirements upon implementation of
Basel 3 would result in different numbers from those shown in this presentation.
April 25, 2012
2

Introduction
Brady W. Dougan, Chief Executive Officer
Key messages
April 25, 2012
4
Strong
operating
results in
1Q12
operating
results in
1Q12
Benefit from
taking early
measures to
transition
businesses to
the new
environment
taking early
measures to
transition
businesses to
the new
environment
Normalized results are non-GAAP financial measures. A reconciliation to reported results is included on slide 7 and in the supplemental slides of this presentation.
Substantial expense run-rate reduction of CHF 1.5 bn (annualized), exceeding our previously announced target of CHF
1.2 bn
1.2 bn
Further reduced Basel 3 risk-weighted assets (RWA) to firm-wide CHF 294 bn; now close to end 2012 target
Investment Banking delivered a 19% normalized return on Basel 3 allocated capital, driven by strong momentum in
client market shares, further reduced RWA and improved cost efficiency
client market shares, further reduced RWA and improved cost efficiency
Private Banking with good progress on measures to enhance profitability, including integration of Clariden Leu
Normalized net income of CHF 1.4 bn with an after-tax return on equity of 16%
− Tightening of credit spreads on own liabilities lead to charges of CHF (1.6) bn pre-tax
Reported net income of CHF 44 mn
Further
strengthening
of capital and
balance sheet
strengthening
of capital and
balance sheet
Successfully completed the high-trigger contingent capital requirements and repurchased CHF 4.7 bn of capital
instruments not effective under Basel 3
instruments not effective under Basel 3
Basel 2.5 Core tier 1 ratio increased from 10.7% to 11.8%
Basel 3 CET1 ratio of 13% at end 2012, well in excess of 6% FINMA requirement, and "look through" CET1 ratio of 7%,
increasing to 10% by end 2013
increasing to 10% by end 2013
Basel 3 Net Stable Funding Ratio (NSFR) further increased to 100%

Financial results
David Mathers, Chief Financial Officer

Core results overview
April 25, 2012
6
Underlying in CHF mn
Net revenues
Pre-tax income
Net income attributable to shareholders
Diluted earnings per share in CHF
Pre-tax income margin
Return on equity
Net new assets in CHF bn
Reported in CHF mn
Net revenues
Pre-tax income
Net income attributable to shareholders
Diluted earnings per share in CHF
Return on equity
Underlying results and normalized results are non-GAAP financial measures. A reconciliation to reported results is included on slide 7 and in the supplemental slides of this presentation.
Normalized
1Q12 1Q12 4Q11 1Q11
1Q12 1Q12 4Q11 1Q11
7,254 4,082 8,516
1,918 1,484 (976) 2,328
1,355 1,055 (632) 1,676
1.01 0.79 (0.62) 1.33
26% 20% - 27%
15.9% 12.4% (7.7)% 19.6 %
(7.1) 0.4 19.1
5,878 4,473 7,813
40 (998) 1,625
44 (637) 1,139
0.03 (0.62) 0.90
0.5% (7.7)% 13.4%
April 25, 2012
7
in CHF mn
Reported
Fair value losses from
movement in own credit spreads
movement in own credit spreads
Realignment costs
Gain on partial sale of stake in Aberdeen AM
Underlying, adjusted for movements in
own credit spreads, realignment costs and
the gain on sale of Aberdeen stake
PAF2 related expense
Assumed share plan-based award expense1
Normalized for PAF2 impact
1 This calculation assumes that share-plan-based awards (with 3-year vesting) had been awarded in lieu of PAF2 awards (with accelerated vesting)
Overview of significant items in 1Q12
Pre-tax Tax Noncontrolling Net Return
income impact interests income on equity
income impact interests income on equity
40 16 (12) 44 0.5%
1,554 (444) - 1,110
68 (21) - 47
(178) 32 - (146)
1,484 (417) (12) 1,055 12.4%
��
534 (165) - 369
(100) 31 - (69)
1,918 (551) (12) 1,355 15.9%
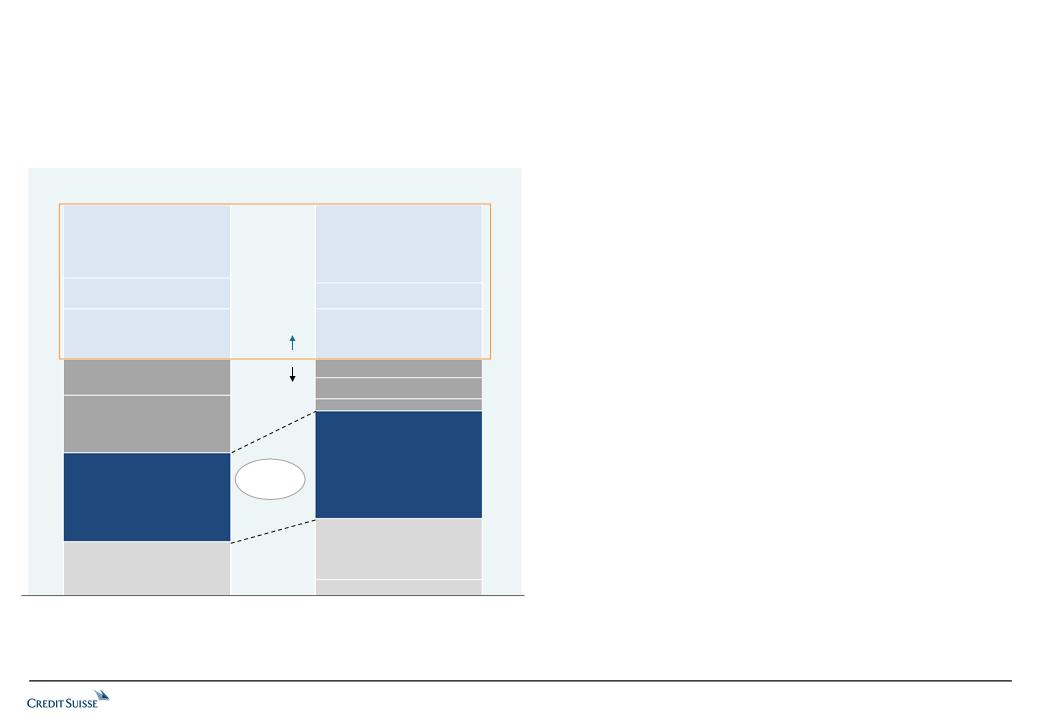
Changes from 2Q12
Changes in reporting
April 25, 2012
8
Reclassification
DVA on structured notes,
previously recorded in Investment
Banking revenues, to be recorded in
Corporate Center revenues
previously recorded in Investment
Banking revenues, to be recorded in
Corporate Center revenues
Discontinuation of the amortization
of DVA on long-term vanilla debt in
all three divisions' revenues
(PB/IB/AM)
of DVA on long-term vanilla debt in
all three divisions' revenues
(PB/IB/AM)
Clariden Leu
integration
integration
Full integration of Clariden Leu into respective business lines in the three divisions (PB/IB/AM)
Changes in 1Q12
DVA on
structured notes
liabilities and on
long-term
vanilla debt
structured notes
liabilities and on
long-term
vanilla debt
A reconciliation to previously reported results is included in the supplemental slides to this presentation
Rationale
Combining all funding related DVA gains/losses into
a single reporting line within Corporate Center
a single reporting line within Corporate Center
Improve transparency of financial performance in
the divisional results
the divisional results
Revenue impacts are driven by changes in the
perceived credit-worthiness of the Group, rather than
the divisions
perceived credit-worthiness of the Group, rather than
the divisions
No indication of any changes in relevant accounting
standards in the near future
standards in the near future
April 25, 2012
9
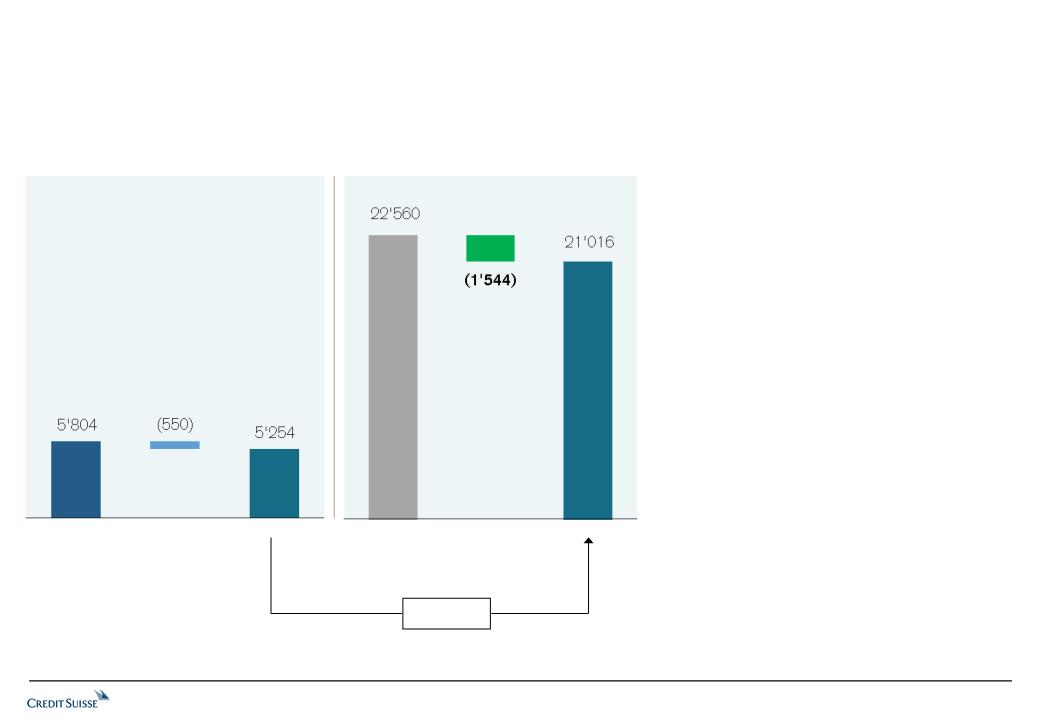
Annualized CHF 1.5 bn expense reduction in 1Q12;
exceeded CHF 1.2 bn target by 25%
exceeded CHF 1.2 bn target by 25%
Exceeded annualized
CHF 1.2 bn
expense reduction target
by CHF 0.3 bn in 1Q12
CHF 1.2 bn
expense reduction target
by CHF 0.3 bn in 1Q12
Good progress towards
additional CHF 0.8 bn
expense reduction
by end 2013
additional CHF 0.8 bn
expense reduction
by end 2013
Streamlining operations and support infrastructure
Implementing vendor management initiative
Savings from the integration of Clariden Leu in Private Banking
Annualized total expenses reduced by CHF 1.5 bn1
− Increased compensation cost flexibility, with CHF 2.1 bn reduction in
unamortized deferred compensation compared to 2011
unamortized deferred compensation compared to 2011
− Actual net headcount reduction of 2,000 from end 2Q11, in line with
target reduction
target reduction
− Included reduced non-compensation expense by CHF 0.3 bn, despite
increased expense from the UK bank levy
increased expense from the UK bank levy
Total expense savings
of CHF 2.0 bn by end 2013
of CHF 2.0 bn by end 2013
Total expected implementation cost of CHF 1.2 bn, of which CHF 847 mn
and CHF 68 mn expensed in 2011 and 1Q12, respectively
and CHF 68 mn expensed in 2011 and 1Q12, respectively
1 See slide 10 for calculation details
April 25, 2012
10
1Q12
All data for Core Results; The 1Q12 PAF2 adjustment assumes that share-plan-based awards (with 3-year vesting) had been awarded in lieu of PAF2 awards (with accelerated vesting)
Total savings of CHF (1,544) mn contribution: CHF (1,315) mn in Investment Banking, CHF (230) mn in Private Banking, CHF (192) mn in Asset Management and CHF 193 mn in Corporate Center
1 CHF 142 mn recorded in 2Q11
1H11 excluding
realignment costs1
(annualized)
realignment costs1
(annualized)
Achieved CHF 1.5 bn expense reduction in 1Q12
Excluding PAF2,
realignment costs,
and FX impact
realignment costs,
and FX impact
Savings
1Q12 vs. 1H11 comparison (annualized)
Target for annual savings of CHF 1.2 bn was
− Based on FX-neutral 1H11 results
− Excluding PAF2 and realignment costs
− Increasing to CHF 2 bn by end 2013
Actual expense savings amount to over
CHF 1.5 bn; exceeding original goal by 25%
CHF 1.5 bn; exceeding original goal by 25%
Differences in discretionary variable compensation
accrual are an immaterial contributor to overall
expense reduction
accrual are an immaterial contributor to overall
expense reduction
1Q12 vs. 1Q11 comparison
1Q12 reported operating expenses are
down CHF 391 mn, or 6%, from 1Q11
(compensation expense down 8%,
other expenses down 3%)
down CHF 391 mn, or 6%, from 1Q11
(compensation expense down 8%,
other expenses down 3%)
Annualized
Operating expense reduction in CHF mn
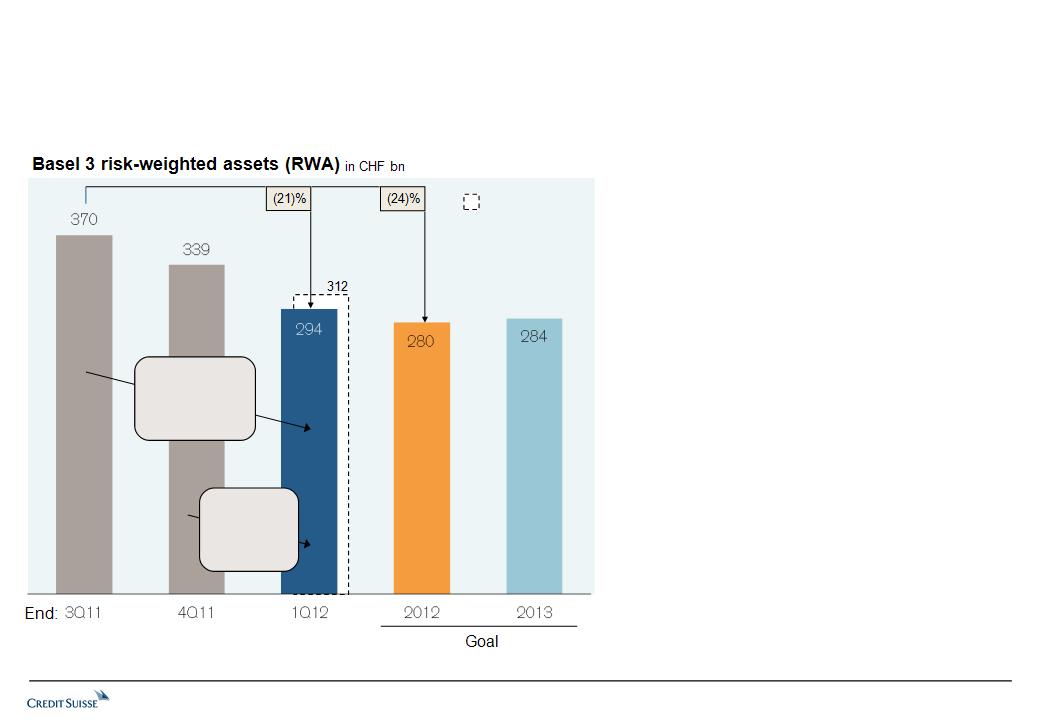
Reduction in Basel 3 RWA exceeds stated goal; strong
progress towards stated end 2012 goal
progress towards stated end 2012 goal
April 25, 2012
11
Significantly accelerated reduction in Basel 3
risk-weighted assets continued with a reduction
of CHF 45 bn, or 13%, in 1Q12
risk-weighted assets continued with a reduction
of CHF 45 bn, or 13%, in 1Q12
Achieving our accelerated RWA reduction goal
will give businesses more ability to grow,
primarily in Private Banking
will give businesses more ability to grow,
primarily in Private Banking
CHF 45 bn
reduction
achieved in
1Q12
reduction
achieved in
1Q12
CHF 76 bn
reduction
achieved in last
6 months
reduction
achieved in last
6 months
Goal as
announced at
4Q11 results
announced at
4Q11 results

Private Banking results reflect moderate increase in
transaction volumes and significant expense reduction
transaction volumes and significant expense reduction
April 25, 2012
12
Revenues improved from 4Q11 driven by higher
transaction volumes
transaction volumes
Reduced expense run-rate by CHF 230 mn
from 1H111
from 1H111
Savings from 1,300, or 5%, headcount reductions from
peak in 2Q11 not yet fully reflected in 1Q12 results
peak in 2Q11 not yet fully reflected in 1Q12 results
Strengthening of Swiss franc adversely impacted pre-
tax income by CHF 34 mn vs. 1Q11
tax income by CHF 34 mn vs. 1Q11
Pre-tax income margin improved to 24% from 4Q11
CHF 8.4 bn of net asset inflows adversely impacted by
outflows from Clariden Leu integration of CHF 4.1 bn
(represents 4% of Clariden Leu AuM)
outflows from Clariden Leu integration of CHF 4.1 bn
(represents 4% of Clariden Leu AuM)
in CHF mn
Net revenues
Provision for credit losses
Compensation and benefits
of which PAF2 related
Other operating expenses
Total operating expenses
Pre-tax income
Pre-tax income margin
Net new assets in CHF bn
1 See slide 10 for calculation details
1Q12 4Q11 1Q11
2,651 2,575 2,897
40 75 12
1,214 1,127 1,224
67
772 905 805
1,986 2,032 2,029
625 468 856
24% 18% 30%
8.4 7.6 18.0
Wealth Management with stable gross margin; some recovery in
transaction activity from 4Q11
transaction activity from 4Q11
April 25, 2012
13
2,434
2,149
2,120
118
31
44
43
114
28
43
43
109
22
43
44
752
813
824
Gross margin in basis points
805
778
Net revenues in CHF mn
+4%
1 Including gain from the sale of real estate of CHF 72 mn
Average Assets under management in CHF bn
2,185
109
26
40
43
2,331
115
28
45
42
5771
Net interest income remained stable as impact
from continued low interest rate environment was
offset by higher volumes
from continued low interest rate environment was
offset by higher volumes
Recurring commissions & fees decreased
slightly given the continued growth in the UHNW
client segment combined with a generally more
risk-averse asset mix
slightly given the continued growth in the UHNW
client segment combined with a generally more
risk-averse asset mix
Transaction-based revenues increased due to
higher brokerage and product issuing fees
higher brokerage and product issuing fees
Compared to 4Q11
Private Banking net new asset inflow of CHF 8.4 bn
April 25, 2012
14
1Q12 net new assets in CHF bn
Wealth
Management
Clients
Management
Clients
Americas
Asia
Pacific
Pacific
Europe, Middle
East and Africa
(EMEA)
East and Africa
(EMEA)
Switzerland
(excluding
Clariden Leu)
(excluding
Clariden Leu)
Corporate &
Institutional
Clients
Institutional
Clients
Private
Banking
Banking
Clariden
Leu
Leu
(4.1)
Continued solid growth from ultra-high-net-worth
clients and most emerging markets
clients and most emerging markets
Solid inflows in home market Switzerland
masked by CHF 4.1 bn asset outflows due to
Clariden Leu integration
(represents 4% of Clariden Leu AuM)
masked by CHF 4.1 bn asset outflows due to
Clariden Leu integration
(represents 4% of Clariden Leu AuM)
EMEA with moderate outflows in Western
Europe in an ongoing difficult market environment
and limited inflows in Eastern European
markets
Europe in an ongoing difficult market environment
and limited inflows in Eastern European
markets
9.9
Profitability initiatives on track
April 25, 2012
15
Ultra-high-
net-worth
net-worth
Onshore
Cross-
border
Ongoing strong asset inflows, representing more than 2/3rd of Wealth Management inflows
Continuous upgrading of relationship manager base, with 13 additional UHNW dedicated hires
Achievements in 1Q12
Market-specific efficiency and growth programs initiated and on track
– Branch network streamlining in Italy (closure of 16 branches)
– Target model for efficient use of Western Europe infrastructure defined; start of first market implementation
planned for mid 2012
planned for mid 2012
– Selected investments in attractive growth markets
– Integration of acquired business in Japan well on track; doubling assets to around CHF 5 bn
Clariden
Leu
Integration well on track (e.g., legal merger, retention of key relationship managers and clients)
~550 headcount reduction, asset outflows in line with expectations
Expected steady state annual pre-tax income improvement of CHF ~110 mn
Increase focus of our investments on (U)HNW segment in economically attractive markets
Streamlining our coverage model for international affluent clients to go live mid-2012

Corporate & Institutional Clients business continues
to deliver strong results
to deliver strong results
April 25, 2012
16
Strong pre-tax margin of 47%
Strong net new asset contribution
Credit provisions decreased QoQ
The loan portfolio quality remained very strong
– Over 65% collateralized by mortgages and securities
– Counterparties mainly Swiss corporates, including
real estate industry
real estate industry
– Sound credit quality with low concentrations
in CHF mn
Net revenues
Provision for credit losses
Total operating expenses
Pre-tax income
Pre-tax income margin
Net new assets in CHF bn
1Q12 4Q11 1Q11
466 455 463
18 32 -
229 240 231
219 183 232
47% 40% 50%
2.6 3.6 2.3

Investment Banking results demonstrate progress in
strategy implementation
strategy implementation
April 25, 2012
17
in CHF mn
Advisory and underwriting
Fixed income sales & trading
Equity sales & trading
Other
Net revenues
Provision for credit losses
Compensation and benefits
of which PAF2
Other operating expenses
Total operating expenses
Pre-tax income
Pre-tax income margin
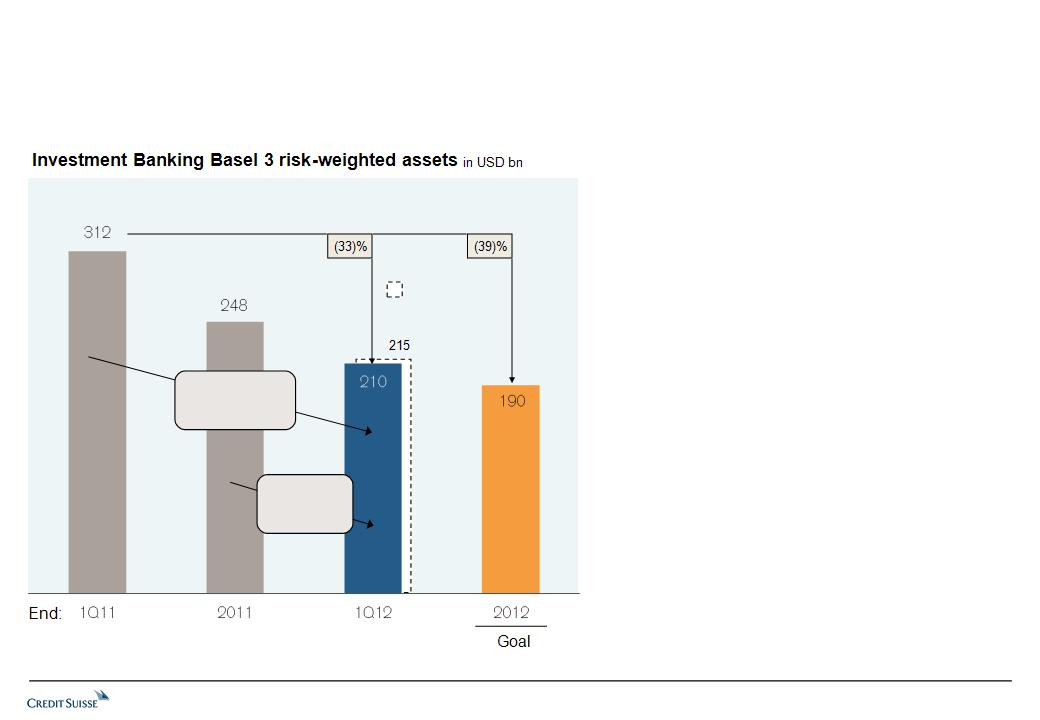
Basel 3 RWA in USD bn
Significant progress in executing the strategy we outlined
in November 2011 to increase capital and operating
efficiency
in November 2011 to increase capital and operating
efficiency
– More balanced risk and revenue contribution across our
major business lines
major business lines
– Continued market share momentum
– Reduced Basel 3 RWA by USD 38 bn from 4Q11 and
USD 102 bn from 1Q11
USD 102 bn from 1Q11
– Reduced expense run-rate by CHF 1.3 bn from 1H111
Delivered a 19% return on capital vs. 15% in 1Q11
(normalized after-tax return on Basel 3 allocated capital2)
(normalized after-tax return on Basel 3 allocated capital2)
1 See slide 10 for calculation details
2 A reconciliation of normalized after-tax return on Basel 3 allocated capital is included in the supplemental slides of this presentation
1Q12 4Q11 1Q11
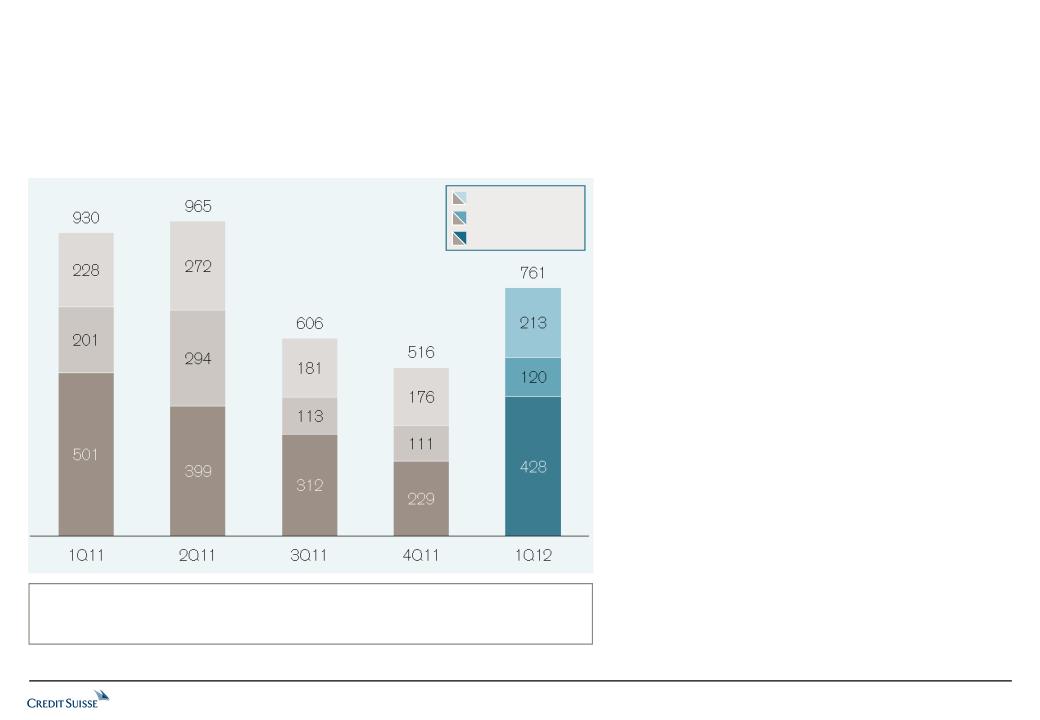
761 516 930
2,024 (105) 2,560
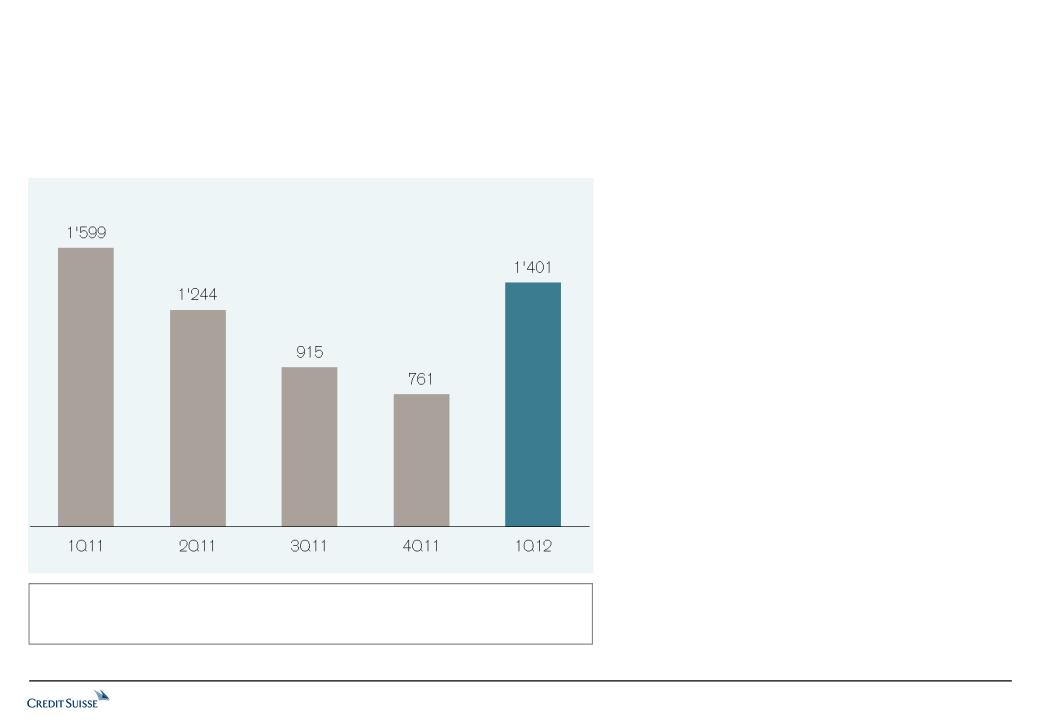
1,401 761 1,599
(46) (59) (23)
4,140 1,113 5,066
(6) 22 (19)
2,063 1,364 2,408
418 - -
1,090 1,170 1,197
3,153 2,534 3,605
993 (1,443) 1,480
24% - 29%
210 248 312
Fixed Income results driven by client franchise momentum,
execution of refined strategy and improved client flow
execution of refined strategy and improved client flow
April 25, 2012
18
Basel 3
RWA
USD 146 bn
RWA
USD 146 bn
Basel 3
RWA
USD 264 bn
RWA
USD 264 bn
Fixed income sales & trading revenues in CHF mn
Higher results in Rates and FX driven by franchise
momentum and increased client flow
momentum and increased client flow
Robust Emerging Markets results due to improved
client activity levels and trading conditions
client activity levels and trading conditions
Improvement in Credit reflects new issue activity and
more favorable market conditions due to improved
investor risk appetite
more favorable market conditions due to improved
investor risk appetite
Solid results in Securitized Products reflect
substantially restructured business and demonstrate
strength of client franchise
substantially restructured business and demonstrate
strength of client franchise
– High quality revenue stream with greater balance
between non-agency RMBS, agency RMBS and
asset finance
between non-agency RMBS, agency RMBS and
asset finance
– Significantly lower client inventory levels with
51% reduction of Basel 3 RWAs from 1Q11
51% reduction of Basel 3 RWAs from 1Q11
Revenue decline from 1Q11 primarily reflects:
– Lower revenues from Securitized Products
compared to a record result in 1Q11, which
benefited from higher inventory levels
compared to a record result in 1Q11, which
benefited from higher inventory levels
– CHF 261 mn of revenue losses from businesses
we are exiting vs. CHF 10 mn revenues in 1Q11
we are exiting vs. CHF 10 mn revenues in 1Q11
2,757
695
634
(120)
2,225
Fixed income sales & trading revenues in USD mn
Increased capital efficiency and more balanced business mix with
stronger contribution from Macro businesses
stronger contribution from Macro businesses
April 25, 2012
19
Significant progress in executing strategy
– Shift in capital and resource allocation to support client
franchise
franchise
– Revenue decline of 19% while Basel 3 RWA reduced by 45%
over same period
over same period
– Improved capital efficiency with 33% increase in revenue per
Basel 3 RWA usage2
Basel 3 RWA usage2
– Improved operating efficiency
More diversified revenue contribution across Macro businesses
(Rates, FX), Credit, Securitized Products and Emerging Markets
(Rates, FX), Credit, Securitized Products and Emerging Markets
Macro businesses: completed platform build-out via technology
investments and senior hires in Rates and FX to support market
share expansion and increase franchise strength
investments and senior hires in Rates and FX to support market
share expansion and increase franchise strength
Optimized inventory levels to support client flow while minimizing
risks - inventory reduction since 1Q11:
risks - inventory reduction since 1Q11:
– 31% in non-agency RMBS (in Securitized Products)
– 57% in Investment Grade (in Credit)
– 29% in High Yield (in Credit)
1Q11
1Q12
1 Wind-down and other primarily comprises revenues from businesses we are exiting and funding costs
2 Based on annualized quarterly revenue to average Basel 3 RWA balances
Securitized
Products
Products
Revenues
in USD mn
in USD mn
Basel 3 RWA
in USD bn
in USD bn
Fixed income sales & trading in USD
Commod.
Emerging
Markets
Markets
Credit
Macro
(Rates, FX)
Wind-down
and other1
and other1
(19)%
2,757
2,225
12%
37%
26%
30%
(8)%
3%
20%
29%
30%
42%
(23)%
2%
264
146
1Q11
1Q12
20
April 25, 2012
Solid and stable Prime Services results
reflecting higher client balances and market
leadership, underscored by established global
top 3 ranking
reflecting higher client balances and market
leadership, underscored by established global
top 3 ranking
Small decline in Derivatives revenues from
1Q11 reflecting weaker client volumes;
significant improvement over 4Q11 with higher
volumes across flow and structured products
reflecting improved market conditions
1Q11 reflecting weaker client volumes;
significant improvement over 4Q11 with higher
volumes across flow and structured products
reflecting improved market conditions
Cash Equities revenues reflect stable market
share in spite of sustained weak market volumes
share in spite of sustained weak market volumes
Solid Equity sales & trading results across businesses with
sustained market share positions
sustained market share positions
Equity sales & trading revenues in CHF mn
1,724
1,457
1,107
839
1,543
Equity sales & trading revenues in USD mn
21
Equity underwriting
Advisory
Debt underwriting
Strong debt underwriting results reflecting a
rise in new issue activity in high yield and
investment grade as well as market share
improvements from 4Q11
rise in new issue activity in high yield and
investment grade as well as market share
improvements from 4Q11
Equity underwriting results remain subdued given
low industry issuance volumes; modest increase in
follow-on activity
low industry issuance volumes; modest increase in
follow-on activity
Improved advisory results due to increased
market share relative to 4Q11
market share relative to 4Q11
Market share momentum
Global High Yield: up to #3 from #5 in 2011
Global Completed M&A: up to #4 from #6 in 2011
Global ECM: maintained #5 ranking
April 25, 2012
Underwriting & advisory recovering from weak 4Q11 driven by
strong results in debt underwriting
strong results in debt underwriting
Underwriting & Advisory revenues in CHF mn
1,003
1,129
723
565
840
Underwriting & Advisory revenues in USD mn
22
Continued Basel 3 RWA reduction of USD 38 bn, or
15%, in 1Q12
15%, in 1Q12
Basel 3 RWAs decreased by 33% since 1Q11
(USD 102 bn) through reduced risks in both ongoing
and wind-down businesses
(USD 102 bn) through reduced risks in both ongoing
and wind-down businesses
Minimal costs from RWA reduction (approx. USD
20 mn) in the quarter; further RWA reduction costs
in 2012 likely, depending on market conditions
20 mn) in the quarter; further RWA reduction costs
in 2012 likely, depending on market conditions
April 25, 2012
Basel 3 RWA reduction of USD 38 bn, or 15%, in the quarter
USD 102 bn
achieved since
1Q11
achieved since
1Q11
USD 38 bn
reduction in
1Q12
reduction in
1Q12
Goal as
announced at
4Q11 results
announced at
4Q11 results
April 25, 2012
23
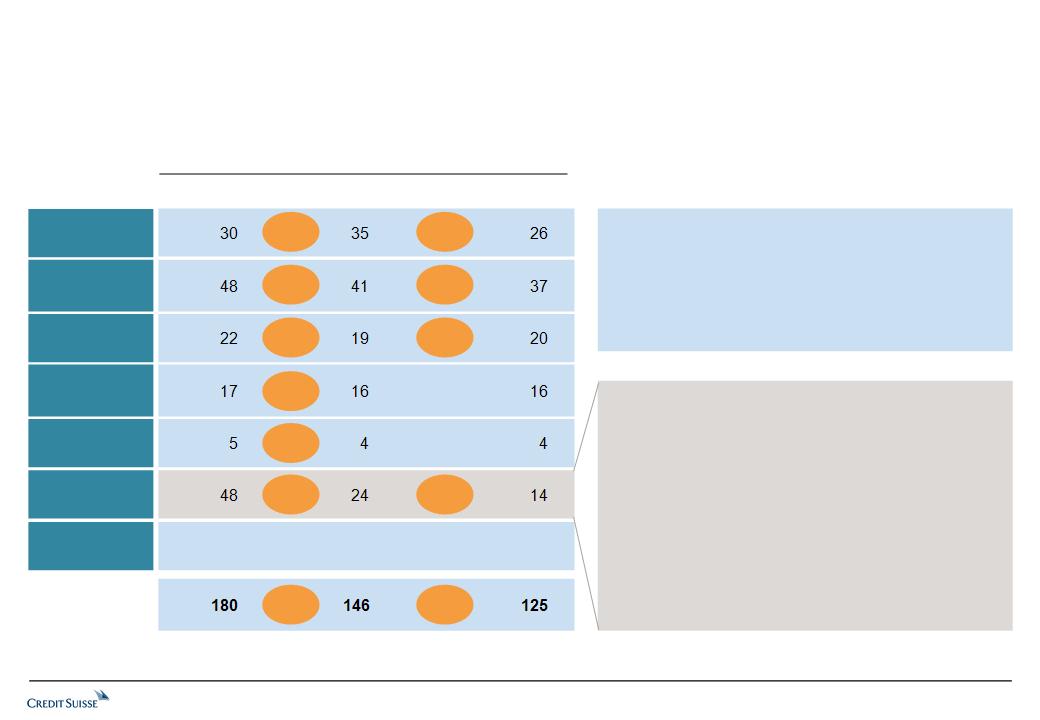
Fixed Income Basel 3 RWA reduction of 19% in 1Q12 primarily in
wind-down businesses
wind-down businesses
10 7 8
Macro
(Rates & FX)
(Rates & FX)
Fixed Income
Securitized
Products
Products
Credit
Emerging
Markets
Markets
Commodities
Other1
Wind-down
Basel 3 risk-weighted assets in USD bn
4Q11 1Q12 Goal end 2012
(19)%
(14)%
Ongoing businesses: Reduced by USD 10 bn
Wind-down businesses: Reduced by USD 24 bn
Continued reduction of long-dated trades in Rates
Substantial risk reduction of remaining Credit
correlation book
correlation book
Continued reduction of legacy wind-down portfolio
through asset sales
through asset sales
Continued reduction of exposures in legacy Emerging
Markets positions
Markets positions
Transfer of risk to PAF2
Continued reduction of low-rated inventory positions
in Securitized Products
in Securitized Products
Counterparty credit risk management across loans
and derivatives
and derivatives
(50)%
(42)%
(20)%
(6)%
(14)%
+5%
(15)%
(10)%
+17%
(26)%
1 Includes Fixed Income other, CVA management and Fixed Income treasury
-
-
24
April 25, 2012
Significant progress in executing strategy
outlined in November 2011
outlined in November 2011
– More balanced business mix
– Continued market share momentum
– Significant Basel 3 RWA reduction of USD
102 bn from 1Q11
102 bn from 1Q11
– Increased operating efficiency through
lower expense base
lower expense base
Improved capital efficiency with 17%
increase in revenue per Basel 3 RWA usage1
compared to 1Q11
increase in revenue per Basel 3 RWA usage1
compared to 1Q11
Significant increase in normalized after-tax
return on Basel 3 allocated capital to 19%
return on Basel 3 allocated capital to 19%
A reconciliation of normalized after-tax return on Basel 3 allocated capital is included in the supplemental slides of this presentation
1 Based on annualized quarterly revenue to average Basel 3 RWA balances
Impact on normalized return
Investment Banking normalized after-tax return on Basel 3 allocated capital
Increase in normalized return achieved through progress in
executing strategy to improve capital and operating efficiency
executing strategy to improve capital and operating efficiency

April 25, 2012
25
Higher Asset Management results with gain on Aberdeen sale,
offsetting reduced investment-related gains and lower fee revenues
offsetting reduced investment-related gains and lower fee revenues
Fee-based revenues decline due to
YoY: market and FX impacts
QoQ: lower placement and performance fees, which are
seasonally biased to 4Q results
seasonally biased to 4Q results
Investment-related gains reduced to CHF 101 mn due to
lower gains on the private equity portfolio (vs. 1Q11)
lower gains on the private equity portfolio (vs. 1Q11)
Other revenues include CHF 178 mn gain on partial sale of
participation in Aberdeen AM (remaining stake <10%)
participation in Aberdeen AM (remaining stake <10%)
1 Equity participations and other gains/losses and other revenues
in CHF mn
Fee-based revenues
Investment-related gains/(losses)
Other revenues1
Net revenues
Compensation and benefits
of which PAF2 related
Other operating expenses
Total operating expenses
Pre-tax income
Fee-based margin
Pre-tax income margin
Net new assets in CHF bn
Assets under management in CHF bn
1Q12 4Q11 1Q11
409 464 447
101 6 160
153 (12) (13)
663 458 594
263 204 260
46
150 164 159
413 368 419
250 90 175
40 45 41
38% 20% 29%
(13.7) (9.6) 4.5
403 408 436
April 25, 2012
26
Asset Management with inflows in targeted growth areas, offset
by outflows from low fee products
by outflows from low fee products
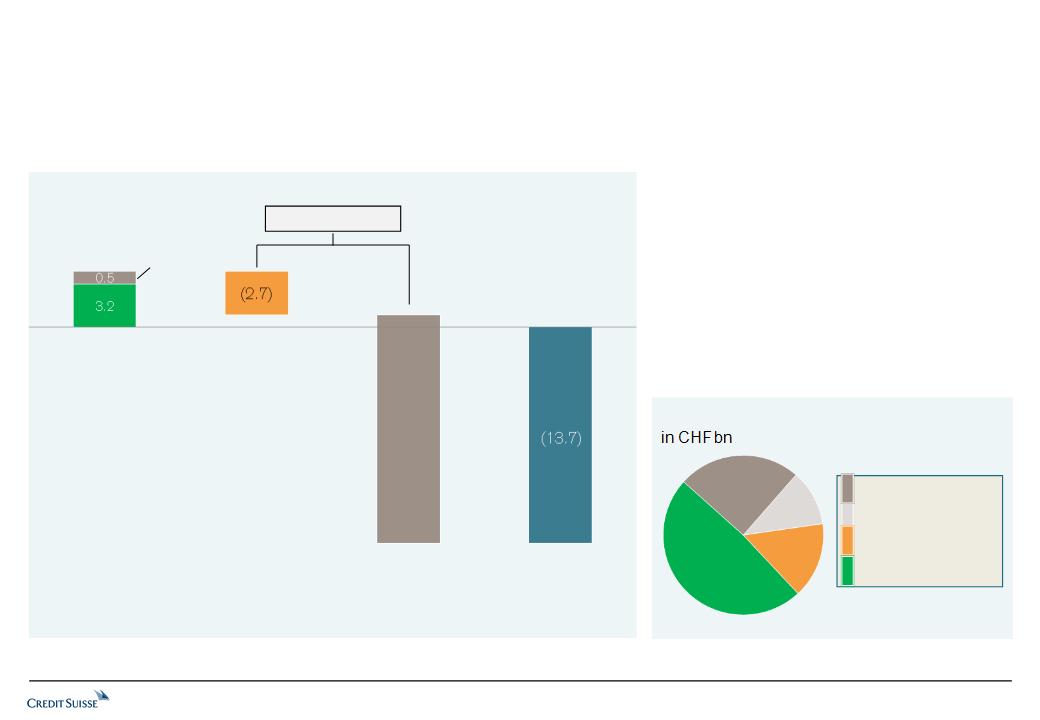
Net new assets 1Q12 in CHF bn
Inflows of CHF 3.7 bn, primarily in
alternative investments, offset outflows of
from low margin mandates
alternative investments, offset outflows of
from low margin mandates
Anticipated annual management fees from
CHF 3.7 bn inflows exceed the revenues
reduction from outflows from low margin
businesses
CHF 3.7 bn inflows exceed the revenues
reduction from outflows from low margin
businesses
AuM declined slightly during 1Q12 as
outflows were partially offset by positive
market movements
outflows were partially offset by positive
market movements
Inflows excl. pension
advisory services and
single client mandate
advisory services and
single client mandate
Single client
mandate
mandate
Total
1Q12
1Q12
Pension advisory
services
services
(14.7)
Low gross margin
Alternative
investments
investments
Traditional
investments1
investments1
3.7
1 Multi-asset class solutions, fixed income & equities
2 Including CHF 0.9 bn from diversified investments
Assets under management by category
Multi-asset class solutions
Fixed income & equities2
Pension advisory services
197.1
99.4
45.4
61.5
Alternative investments
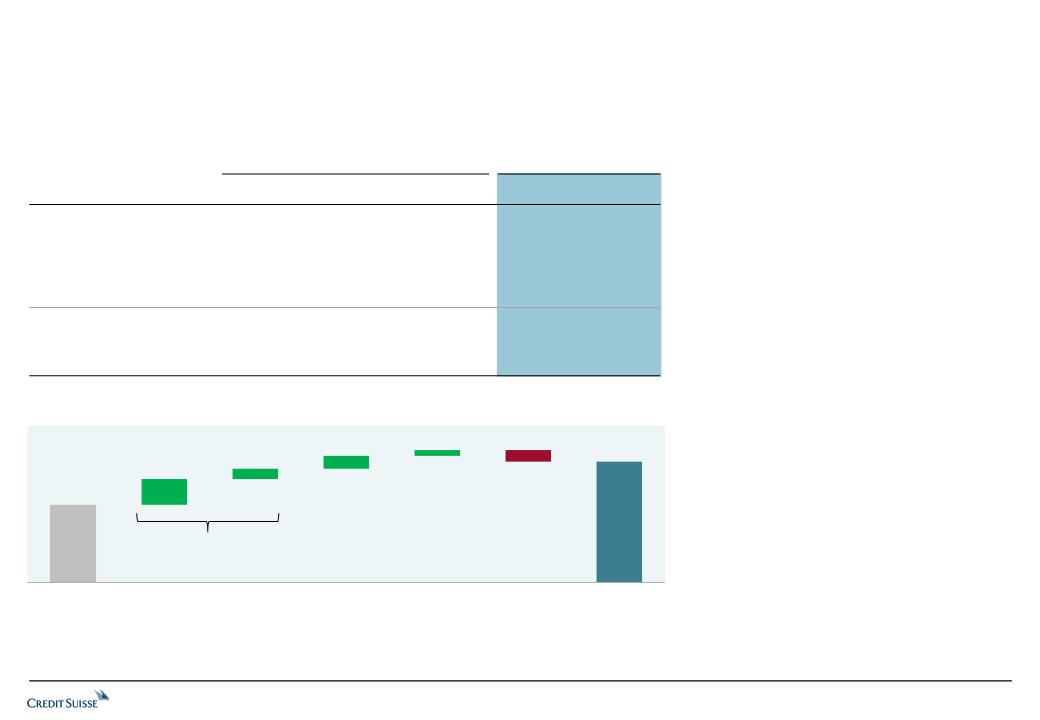
Improved core tier 1 ratio by 110 basis points to 11.8%
April 25, 2012
27
Further improvement in capital ratios
In addition to Basel 2.5 core capital of CHF
27.6 bn, Credit Suisse has additional loss
-absorbing conditional capital of CHF
8.2 bn2
27.6 bn, Credit Suisse has additional loss
-absorbing conditional capital of CHF
8.2 bn2
1 Excludes hybrids instruments 2 Buffer Capital Notes (BCN) of CHF 2.6 bn issued and CHF 5.6 bn committed to be exchanged in October 2013 as per February 2011 agreement
End
2011
2011
Net income
before
movements in
own credit
spreads
before
movements in
own credit
spreads
Share plan
obligation
accrual
obligation
accrual
Tier 1& 2
capital
repurchases
capital
repurchases
Lower
deductions
for stake in
Aberdeen
deductions
for stake in
Aberdeen
FX, dividend
accrual and
other
accrual and
other
End
1Q12
1Q12
Core Tier 1 capital movement 1Q12 in CHF bn
+1.0
+0.4
+0.5
+0.2
(0.5)
26.0
27.6
Underlying net income represents the
bulk of capital generation in 1Q12
bulk of capital generation in 1Q12
Other movements includes pro rata
dividend accrual at CHF 0.75 per share
and assumes 50% payment in shares
dividend accrual at CHF 0.75 per share
and assumes 50% payment in shares
Organic capital generation of CHF
1.4 bn in 1Q12
1.4 bn in 1Q12
in CHF bn
Core tier 1 capital
Risk-weighted assets
234.4 241.8 242.8 (7.4) (8.4)
Core tier 1 ratio1
Tier 1 ratio
Basel 2.5 change
1Q12 4Q11 1Q11 QoQ YoY
Tier 1 capital
27.6 26.0 24.8 +1.6 +2.8
Tier 1 capital 36.7 36.8 35.8 (0.1) +0.9
Tier 1 capital 36.7 36.8 35.8 (0.1) +0.9
11.8% 10.7% 10.2% 1.1% +1.6%
15.6% 15.2% 14.7% +0.4% +0.9%
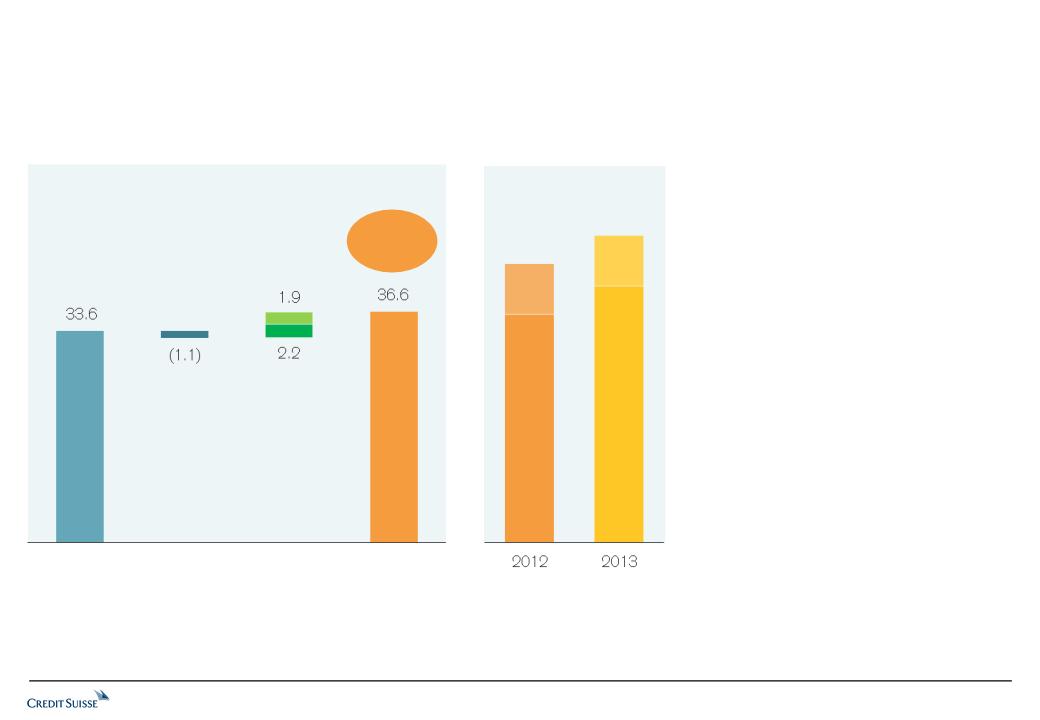
Solid Basel 3 end 2012 Common Equity Tier 1 ratio of 13.1%
April 25, 2012
28
1 Cumulative fair value changes from movements in spreads on our vanilla debt and structured notes, net of tax
2 Bloomberg consensus net income estimates for 2012 less 1Q12 reported net income, less 2011 and 2012 dividend
accrual of CHF 0.75 per share. Assumes 50% of dividends will be distributed as cash and 50% as shares. Not
endorsed or verified and used solely for illustrative purposes. Actual net income and dividends may differ
significantly.
accrual of CHF 0.75 per share. Assumes 50% of dividends will be distributed as cash and 50% as shares. Not
endorsed or verified and used solely for illustrative purposes. Actual net income and dividends may differ
significantly.
17.6%
16.0%
Common equity
tier 1 capital
(CET1)
tier 1 capital
(CET1)
Additional
issued and to
be exchanged
loss-absorbing
capital4
issued and to
be exchanged
loss-absorbing
capital4
Solid end 2012 capital
ratios with CET1 ratio of
13.1%, as per proposed
FINMA capital ordinances
ratios with CET1 ratio of
13.1%, as per proposed
FINMA capital ordinances
Additional 2.9% layer
from loss-absorbing
contingent capital
from loss-absorbing
contingent capital
Ratios well in excess of
6% FINMA requirement
6% FINMA requirement
Basel 3 CET1 capital simulation in CHF bn
Regulatory
deductions1
deductions1
Retained
earnings
20122
earnings
20122
Other
impacts3
impacts3
End:
Basel 3 ratios in %
CET1 ratio
13.1%
2.9%
2.9%
14.7%
13.1%
3 Benefit from the expected settlement of share-based compensation included in consensus net income with shares
issued from conditional capital and other expected movements and deductions in regulatory capital
issued from conditional capital and other expected movements and deductions in regulatory capital
4 Buffer Capital Notes (BCN) of CHF 2.6 bn issued and CHF 5.6 bn committed to be exchanged in October 2013 as
per February 2011 agreement.
per February 2011 agreement.
Shareholders'
equity
1Q12
CET1
capital
end 2012
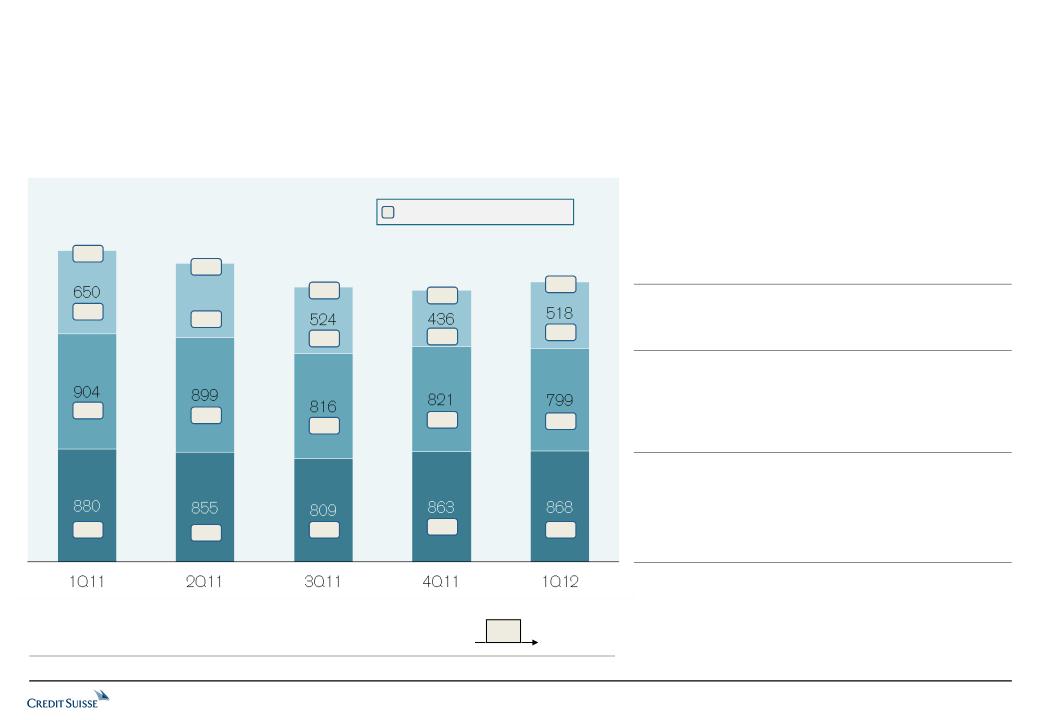
Strong funding and liquidity
April 25, 2012
29
Assets
Equity & Liabilities
1 Primarily brokerage receivables/payables, positive/negative replacement values and cash collateral 2 Primarily includes excess of funding neutral liabilities (brokerage payables) over corresponding assets 3 Primarily includes
unencumbered trading assets, investment securities and excess reverse repo agreements, after haircuts 4 As of March 2012. Represents ratio of notional amount of covered bonds (incl. Swiss Pfandbrief) issued in relation to notional
amount of mortgages outstanding for Credit Suisse AG
unencumbered trading assets, investment securities and excess reverse repo agreements, after haircuts 4 As of March 2012. Represents ratio of notional amount of covered bonds (incl. Swiss Pfandbrief) issued in relation to notional
amount of mortgages outstanding for Credit Suisse AG
Reverse 188
repo
Encumbered 79
trading assets
1,000
1,000
Funding- 129
neutral assets1
Cash & due from
banks 92
Unencumbered 147
liquid assets3
Loans 227
Other 138
longer-maturity assets
Repo 201
Short positions 66
Funding- 129
neutral liabilities1
Short-term borrowings 16
Other short-term liab.2 47
Deposits 275
Long-term debt 156
Total equity 41
121%
coverage
Match
funded
funded
396
604
Due to banks 69
Assets and liabilities by category, end 1Q12 in CHF bn
Well prepared for Basel 3 liquidity requirements
- Basel 3 Net Stable Funding Ratio (1-year) at 100%
- Short-term (30 days) liquidity under Swiss regulation
well in excess of requirement; approach similar to the
Basel 3 "Liquidity coverage ratio (LCR)"
well in excess of requirement; approach similar to the
Basel 3 "Liquidity coverage ratio (LCR)"
Regulatory leverage ratio improved to 4.7%
Funding and CDS spreads remain amongst the lowest in
peer group
peer group
Significant amount of balance sheet remains
unencumbered;utilized only 15%4 of Swiss mortgage book
for secured long-term funding

Summary
Brady W. Dougan, Chief Executive Officer
Summary
April 25, 2012
31
Strong
start into
1Q12
start into
1Q12
Delivering on
targets
targets
Normalized results are non-GAAP financial measures. A reconciliation to reported results is included on slide 7 and in the supplemental slides of this presentation.
Substantial expense run-rate reduction of CHF 1.5 bn (annualized)
Further reduced Basel 3 risk-weighted assets
Investment Banking with significantly increased capital efficiency, a more balanced
business mix and strong momentum in client market shares
business mix and strong momentum in client market shares
Private Banking with good progress on measures to enhance profitability
Normalized net income of CHF 1.4 bn with an after-tax return on equity of 16%
Continuing to
strengthen
capital and
balance sheet
strengthen
capital and
balance sheet
Basel 2.5 Core tier 1 ratio increased from 10.7% to 11.8%
Basel 3 CET1 ratio of 13% at end 2012, well in excess of 6% FINMA requirement
Basel 3 Net Stable Funding Ratio further increased to 100%

Supplementary information

Table of contents
April 25, 2012
33
Reconciliation from reported to underlying results
Reconciliation to normalized return on Basel 3 allocated capital in Investment Banking
Reclassification for movements in own credit spreads
Results in Corporate Center
Collaboration revenues
Divisional compensation to revenue ratio
Revenue and expenses currency mix
"Look through" Common Equity Tier 1 simulation (Basel 3)
Investment Banking results in USD
Continued client market share momentum in Investment Banking
Selected European credit risk exposure
Loan portfolio characteristics
Slide
34 to 35
36
37 to 38
39
40
41
42
43
44
45
46
47 to 48
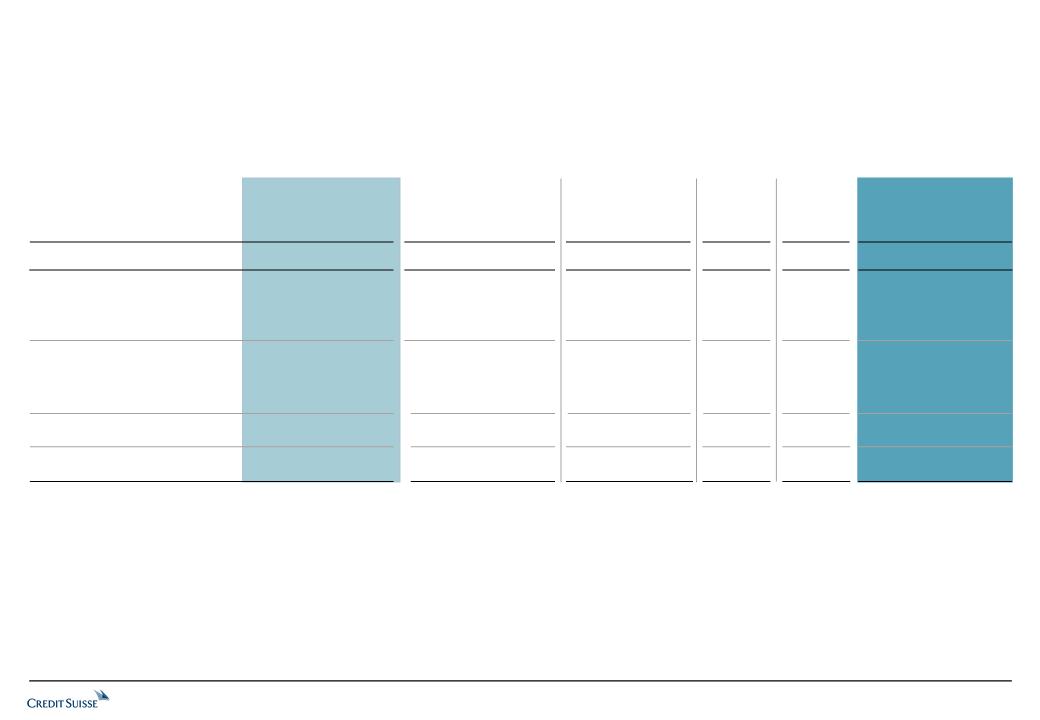
April 25, 2012
34
Reconciliation from reported to underlying results 1Q12 and 2011
Net revenues
Prov. for credit losses / (release)
Total operating expenses
Pre-tax income
Income tax expense
Noncontrolling interests
Net income
Return on equity
Reported
Underlying
Impact from movements
in credit spreads on own
liabilities
in credit spreads on own
liabilities
Sale of
Aberdeen
AM stake
Aberdeen
AM stake
CHF mn
Note: numbers may not add to total due to rounding
Business realignment
costs
costs
Non-credit-
related
provision
related
provision
2011 1Q12 2011 1Q12 2011 1Q12 2011 1Q12 2011 1Q12
25,429 5,878 (1,616) 1,554 - - - (178) 23,813 7,254
187 34 - - - - - - 187 34
22,493 5,804 - - (847) (68) (478) - 21,168 5,736
2,749 40 (1,616) 1,554 847 68 478 (178) 2,458 1,484
671 (16) (465) 444 206 21 50 (32) 462 417
125 12 - - - - - - 125 12
1,953 44 (1,151) 1,110 641 47 428 (146) 1,871 1,055
6.0% 0.5% 5.7% 12.4%
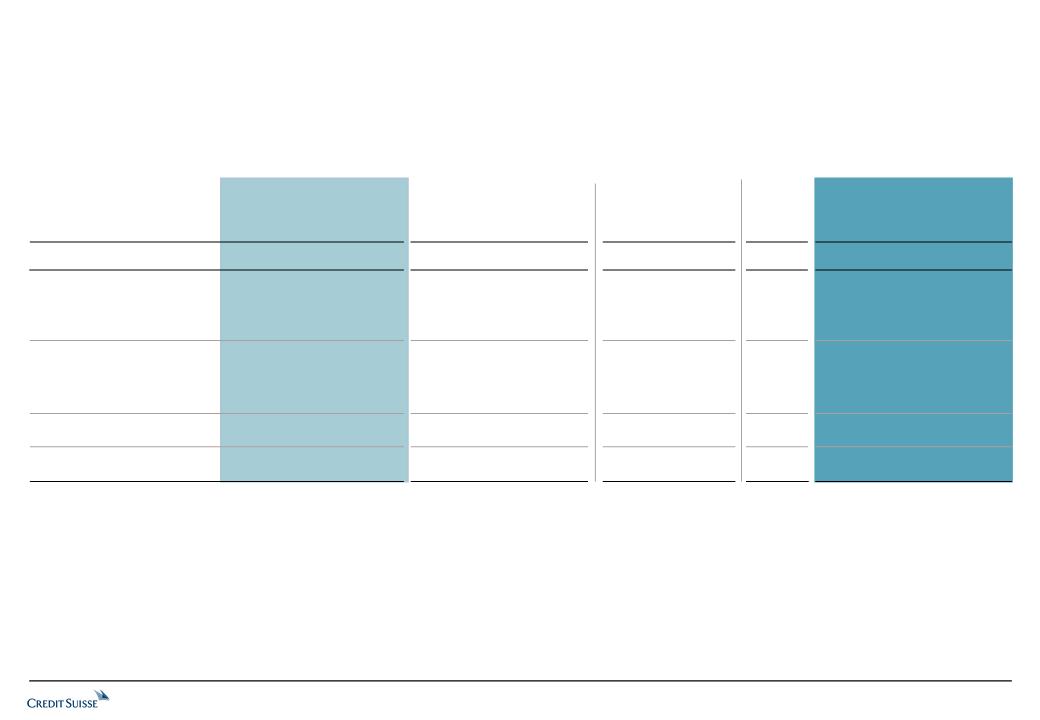
April 25, 2012
35
Reconciliation from reported to underlying quarterly results 2011
Net revenues
Prov. for credit losses / (release)
Total operating expenses
Pre-tax income
Income tax expense
Noncontrolling interests
Net income
Return on equity
Reported
Underlying
Business realignment
costs
costs
Non-credit-
related
provision
related
provision
Note: numbers may not add to total due to rounding
CHF mn
Impact from movements in
credit spreads on own
liabilities
credit spreads on own
liabilities
1Q11 2Q11 3Q11 4Q11 1Q11 2Q11 3Q11 4Q11 2Q11 3Q11 4Q11 3Q11 1Q11 2Q11 3Q11 4Q11
7,813 6,326 6,817 4,473 703 (104) (1,824) (391) - - - - 8,516 6,222 4,993 4,082
(7) 13 84 97 - - - - - - - - (7) 13 84 97
6,195 5,227 5,697 5,374 - - - - (142) (291) (414) (478) 6,195 5,085 4,928 4,960
1,625 1,086 1,036 (998) 703 (104) (1,824) (391) 142 291 414 478 2,328 1,124 (19) (975)
465 271 332 (397) 166 (29) (543) (59) 48 82 76 50 631 290 (79) (380)
21 47 21 36 - - - - - - - - 21 47 21 36
1,139 768 683 (637) 537 (75) (1,281) (332) 94 209 338 428 1,676 787 39 (631)
13.4% 9.7% 8.7% (7.7)% 1 9.6% 19.6% 9.7% 0.5% (7.7)%
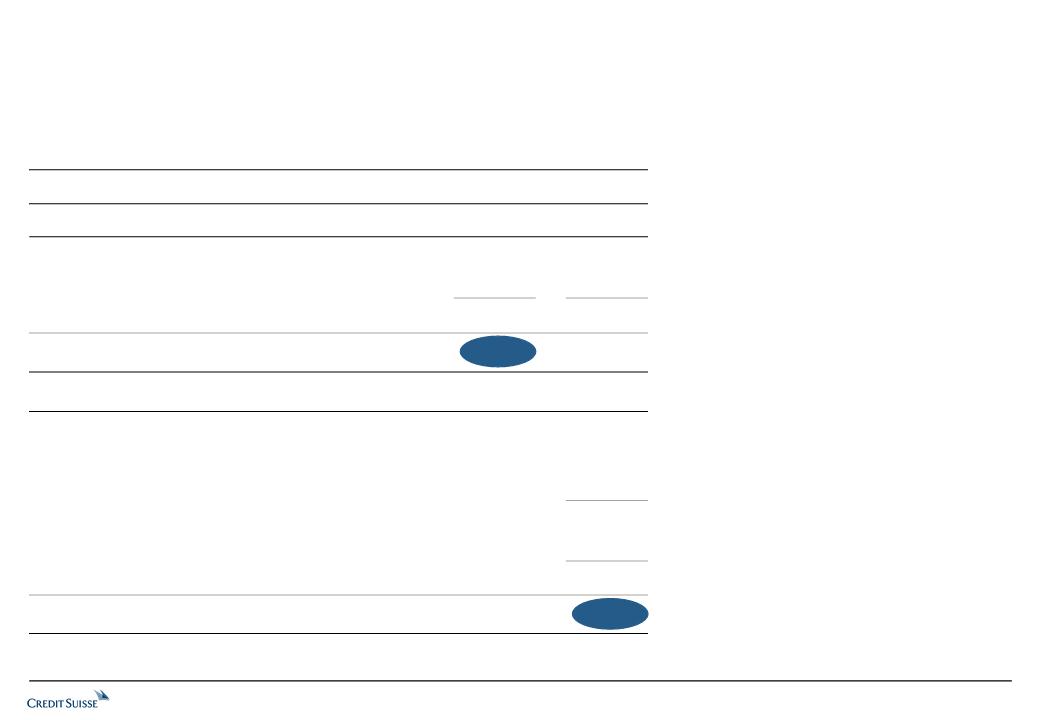
in USD mn
Reported pre-tax income
Income tax expense (assumes 25% tax rate)
Implied net income
Implied return on assumed allocated capital
Reconciliation of reported to normalized after-tax return on Basel
3 allocated capital in Investment Banking
3 allocated capital in Investment Banking
April 25, 2012
36
in USD bn
Assumed allocated capital (10% of average Basel 3 RWAs)
1 This calculation assumes that share-plan-based awards (with 3-year vesting) had been awarded in lieu of PAF2 awards (with accelerated vesting)
in USD mn
Reported pre-tax income
PAF2 related expense
Assumed share plan-based award expense
Normalized pre-tax income for PAF2 impact1
Income tax expense (assumes 25% tax rate)
Normalized net income
Normalized return on assumed allocated capital
1,592 1,088
(398) (272)
1,194 816
15% 14%
1Q11 1Q12
32.1 22.9
1,088
462
(82)
1,468
(367)
1,101
19%
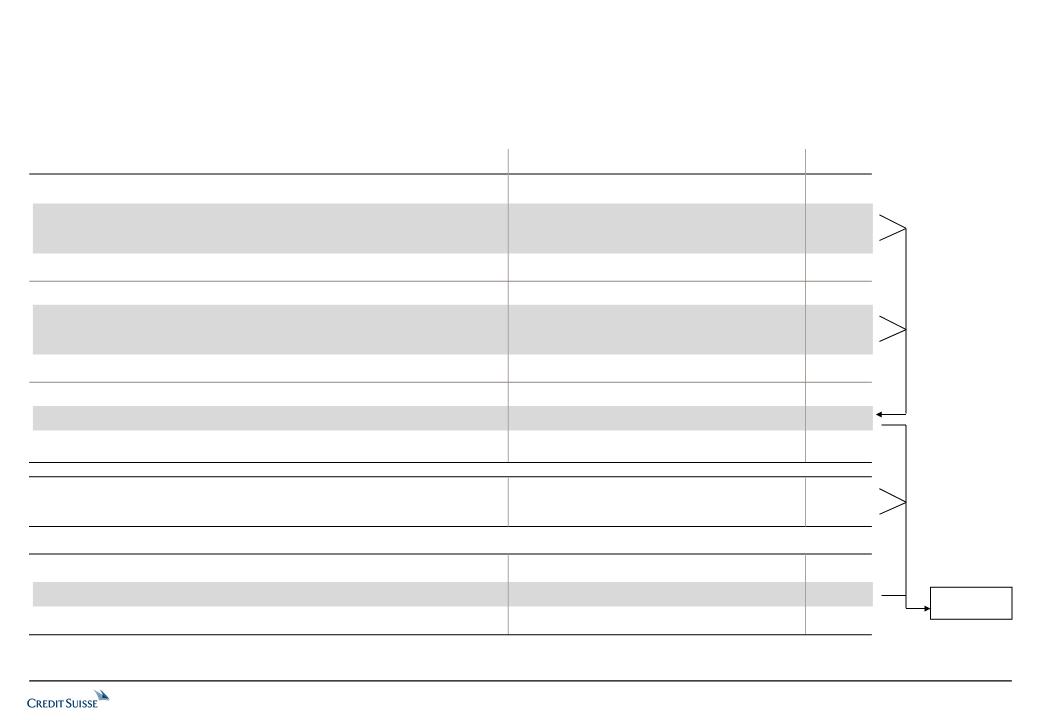
in CHF mn
Previously reported
reclassified fair value changes on own long-term debt
reclassified DVA changes on structured notes
Fixed income sales and trading revenues
Previously reported
reclassified fair value changes on own long-term debt
reclassified DVA changes on structured notes
Equity sales and trading revenues
Previously reported
reclassification impact
Investment Banking net revenues
Reclassification impact on revenues in Private Banking
Reclassification impact on revenues in Asset Management
Previously reported
reclassification impact
Corporate Center revenues
Reclassification of revenues from movements in
own credit spreads
own credit spreads
37
April 25, 2012
Zero group-
wide impact
wide impact
2010 1Q11 2Q11 3Q11 4Q11 2011
6,446 2,493 595 762 36 3,886
209 47 43 42 45 177
10 20 (34) (266) (186) (466)
6,665 2,560 604 538 (105) 3,597
5,884 1,529 1,269 1,182 758 4,738
23 5 5 5 5 20
63 65 (29) (272) (2) (238)
5,970 1,599 1,245 915 761 4,520
16,214 4,929 2,822 2,494 1,251 11,496
305 137 (15) (491) (138) (507)
16,519 5,066 2,807 2,003 1,113 10,989
4 1 1 1 1 4
14 3 3 3 3 12
448 (603) 78 1,242 193 910
(323) (141) 11 487 134 491
125 (744) 89 1,729 327 1,401

April 25, 2012
38
Divisional reclassification of revenues and pre-tax income for
movements in own credit spreads
movements in own credit spreads
Previously reported
Net revenues
Pre-tax income
Reclassification impact1
Newly reported
Net revenues
Pre-tax income
Private Banking
1 Reclassified for fair value changes on own long-term vanilla debt
2 Reclassified for fair value changes on own long-term vanilla debt and fair value changes on debit valuation adjustments on structured notes
CHF mn
Previously reported
Net revenues
Pre-tax income
Reclassification impact2
Newly reported
Net revenues
Pre-tax income
Investment Banking
CHF mn
Previously reported
Net revenues
Pre-tax income
Reclassification impact1
Newly reported
Net revenues
Pre-tax income
Asset Management
CHF mn
Previously reported
Net revenues
Pre-tax income
Reclassification impact2
Newly reported
Net revenues
Pre-tax income
Corporate Center
CHF mn
2010 1Q11 2Q11 3Q11 4Q11 2011
11,631 2,896 2,797 2,610 2,574 10,877
3,426 855 843 183 467 2,348
4 1 1 1 1 4
11,635 2,897 2,798 2,611 2,575 10,881
3,430 856 844 184 468 2,352
2010 1Q11 2Q11 3Q11 4Q11 2011
2,332 591 629 471 455 2,146
503 172 202 92 87 553
14 3 3 3 3 12
2,346 594 632 474 458 2,158
517 175 205 95 90 565
2010 1Q11 2Q11 3Q11 4Q11 2011
16,214 4,929 2,822 2,494 1,251 11,496
3,531 1,343 231 (190) (1,305) 79
305 137 (15) (491) (138) (507)
16,519 5,066 2,807 2,003 1,113 10,989
3,836 1,480 216 (681) (1,443) (428)
2010 1Q11 2Q11 3Q11 4Q11 2011
448 (603) 78 1,242 193 910
(660) (745) (190) 951 (247) (231)
(323) (141) 11 487 134 491
125 (744) 89 1,729 327 1,401
(983) (886) (179) 1,438 (113) 260

Results in the Corporate Center
April 25, 2012
39
Reported pre-tax-income / (loss)
Losses / (gains) from movements
in credit spreads on own liabilities
in credit spreads on own liabilities
Business realignment costs
Underlying pre-tax income / (loss)
Note: Underlying results are non-GAAP financial measures
CHF mn
The underlying Corporate Center pre-tax results reflect:
consolidation and elimination adjustments
expenses for centrally sponsored projects
certain expenses and revenues that have not been allocated to the segments
1Q11 2Q11 3Q11 4Q11 2011 1Q12
(886) (178) 1,438 (113) 261 (1,828)
703 (104) (1,824) (391) (1,616) 1,554
- 142 291 414 847 68
(183) (140) (95) (90) (508) (206)
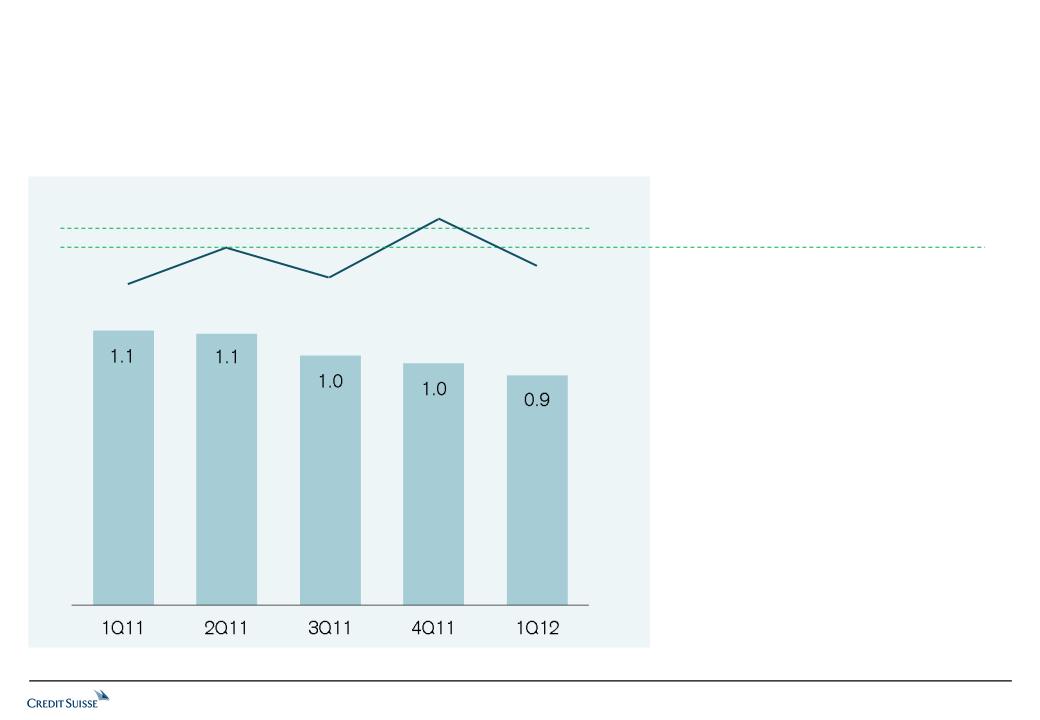
Collaboration revenues
April 25, 2012
40
Collaboration revenues in CHF bn and as % of net revenues (core results)
Lower collaboration revenues given
challenging market conditions and reduced
client activity, contribution to overall Credit
Suisse result continues to be significant
challenging market conditions and reduced
client activity, contribution to overall Credit
Suisse result continues to be significant
CHF 2.2 bn of assets referred to
Private Banking, of which CHF 1.3 bn net new
assets
Private Banking, of which CHF 1.3 bn net new
assets
CHF 0.3 bn in new mandates for
Asset Management
Asset Management
Collaboration revenues target range of
18% to 20% of net revenues
18% to 20% of net revenues
14%
18%
15%
22%
16%
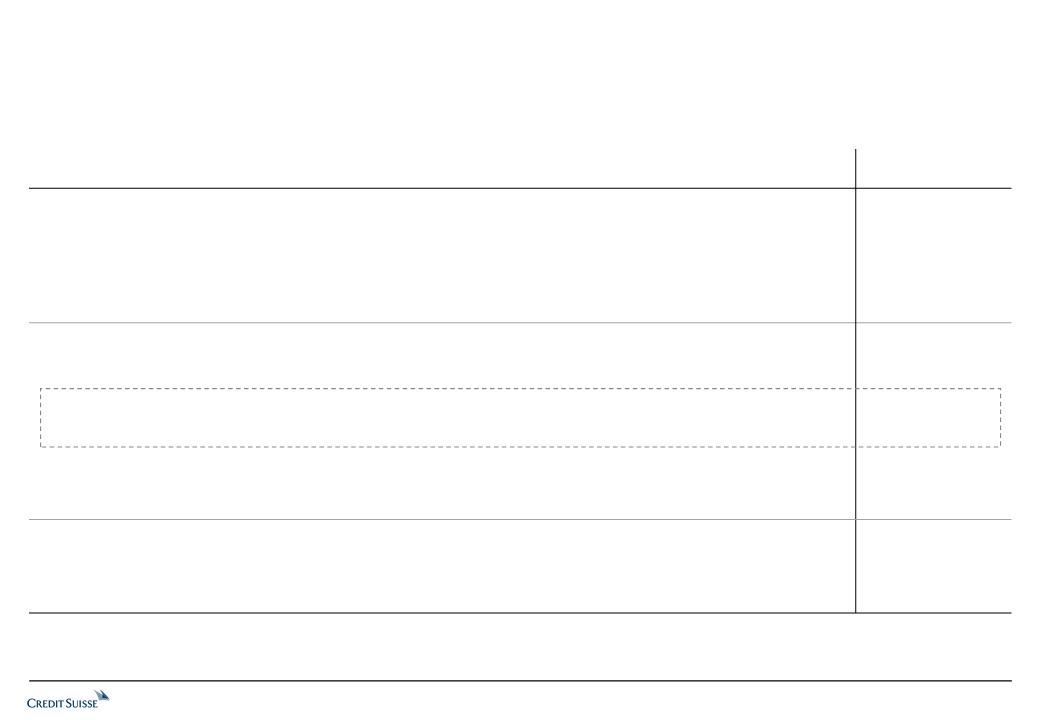
Divisional compensation to revenue ratio
April 25, 2012
41
in CHF mn
Net revenues
Reported
Underlying (same as reported, if blank)
Compensation expenses
Reported
Underlying (same as reported, if blank)
PAF2 related expense
Assumed share plan-based award expense1
Normalized (same as reported, if blank)
Compensation/revenue ratio
Reported
Underlying
Normalized
Private Banking Investment Banking Asset Management Core Results
Core Results include the results of the Corporate Center not shown on this slide
Underlying results and normalized results are non-GAAP financial measures. A reconciliation from underlying to reported results is included in the supplemental slides of this presentation.
1 This calculation assumes that share-plan-based awards (with 3-year vesting) had been awarded in lieu of PAF2 awards (with accelerated vesting)
1Q11 1Q12 1Q11 1Q12 1Q11 1Q12 1Q11 1Q12
2,897 2,651 5,066 4,140 594 663 7,813 5,878
485 8,516 7,254
1,224 1,214 2,408 2,063 260 263 4,025 3,707
1,214 2,063 263 3,659
(67) (418) (46) (534)
16 74 11 100
1,163 1,719 228 3,225
42.3% 45.8% 47.5% 49.8% 43.8% 39.7% 51.5% 63.1%
42.3% 45.8% 47.5% 49.8% 43.8% 54.2% 47.3% 50.4%
42.3% 43.9% 47.5% 41.5% 43.8% 47.0% 47.3% 44.5%

Currency mix
April 25, 2012
42
Net revenues 5,878 27% 46% 23% -2% 6%
Total expenses1 5,838 31% 41% 5% 9% 14%
Contribution
1 Total operating expenses and provisions for credit losses
2 Based on 1Q12 revenue and expense levels, currency mix and average exchange rates
Sensitivity analysis2
A 10% movement in the USD/CHF
exchange rate affects 1Q12 PTI by
CHF 35 mn
exchange rate affects 1Q12 PTI by
CHF 35 mn
A 10% movement in the EUR/CHF
exchange rate affects 1Q12 PTI by
CHF 103 mn
exchange rate affects 1Q12 PTI by
CHF 103 mn
Credit Suisse Core Results
CHF mn 1Q12 CHF USD EUR GBP Other
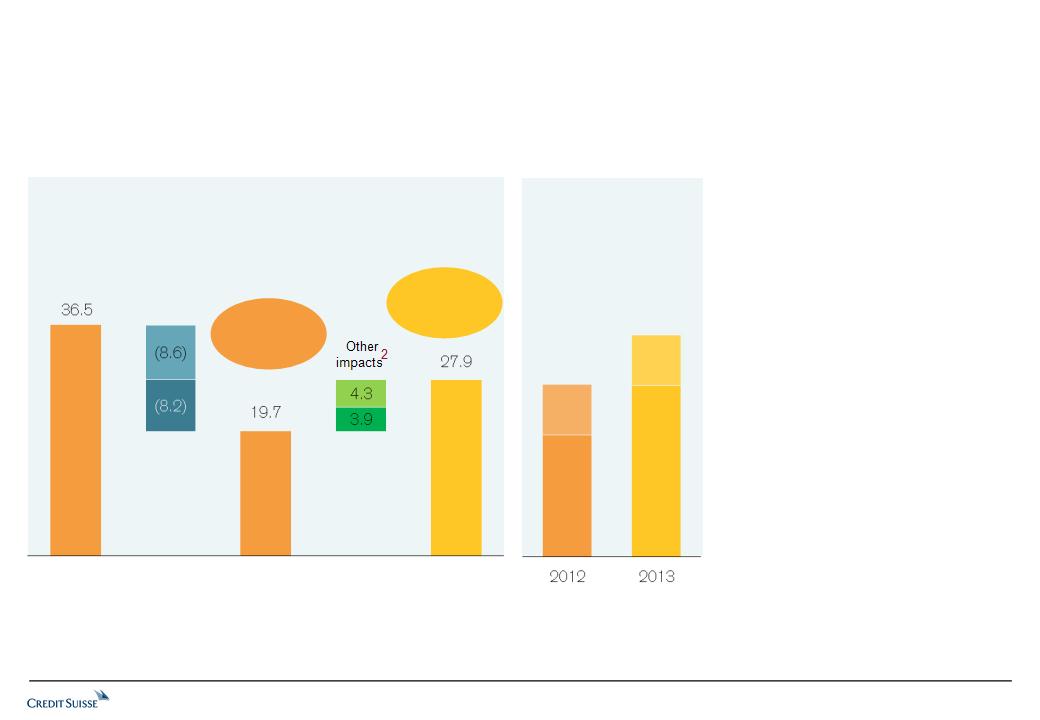
"Look through" Common Equity Tier 1 simulation (Basel 3)
April 25, 2012
43
1 Bloomberg consensus 2013 net income estimates and assumes 2013 dividend to be the same as the dividend
accrual in 2012. Assumes 50% of dividends will be distributed as cash and 50% as shares. Not endorsed or
verified and used solely for illustrative purposes. Actual net income and dividends may differ significantly.
accrual in 2012. Assumes 50% of dividends will be distributed as cash and 50% as shares. Not endorsed or
verified and used solely for illustrative purposes. Actual net income and dividends may differ significantly.
12.7%
9.9%
Common equity
tier 1 capital
(CET1)
tier 1 capital
(CET1)
Additional
issued and to
be exchanged
loss-absorbing
capital3
issued and to
be exchanged
loss-absorbing
capital3
Comments on "look
through" view:
through" view:
Assumes full transition to
2019 capital structure
already as of 1.1.2013
2019 capital structure
already as of 1.1.2013
Does not reflect regulatory
transition requirements
under BIS or as per FINMA
transition requirements
under BIS or as per FINMA
Not relevant for trigger
mechanism of recent BCN
transactions
mechanism of recent BCN
transactions
Illustrative Basel 3 CET1 "look through" capital
simulation in CHF bn
simulation in CHF bn
Regulatory
deductions
deductions
Retained
earnings
20131
earnings
20131
End:
"Look through"
Basel 3 ratios
Basel 3 ratios
Goodwill
"Look
through" CET1
ratio 7.0%
"Look
through" CET1
ratio 9.8%
2.9%
2.9%
9.8%
7.0%
2 Lower regulatory deductions of CHF 3.0 bn (primarily deferred tax assets) and assumes CHF 1.2 bn benefit
from the expected settlement share-based compensation with shares issued from conditional capital and from
other movements and deductions in capital.
from the expected settlement share-based compensation with shares issued from conditional capital and from
other movements and deductions in capital.
3 Buffer Capital Notes (BCN) of CHF 2.6 bn issued and CHF 5.6 bn committed to be exchanged in October
2013 as per February 2011 agreement.
2013 as per February 2011 agreement.
CET1 capital
end 2012
end 2012
"Look through"
CET1 capital
end 2012
"Look through"
CET1 capital
end 2013

Investment Banking results in USD
in USD mn
Debt underwriting
Equity underwriting
Advisory and other fees
Fixed income sales & trading
Equity sales & trading
Other
Net revenues 1
Provision for credit losses
Compensation and benefits 2
Other operating expenses
Total operating expenses
Pre-tax income
Pre-tax income margin
1 Excludes debit valuation adjustments (DVA) relating to certain structured note liabilities and fair value adjustments on Credit Suisse vanilla debt in current and prior periods
2 Includes PAF2 expense of 462 mn in 1Q12
44
April 25, 2012
1Q12 4Q11 3Q11 2Q11 1Q11
472 251 368 467 540
132 120 140 344 217
235 194 215 318 246
2,225 (120) 634 695 2,757
1,543 839 1,107 1,457 1,724
(51) (65) (74) (7) (25)
4,555 1,220 2,390 3,273 5,459
(7) 25 67 17 (21)
2,273 1,491 1,729 1,687 2,596
1,201 1,291 1,414 1,322 1,293
3,474 2,782 3,143 3,009 3,889
1,088 (1,587) (820) 247 1,592
24% - - 8% 29%
Trend
Global DCM
Global high yield
Global ECM
Global announced
Global completed
#10/4%
#4/9%
#7/6%
#6/14%
#8/13%
#1/12%
#6/5%
#3/8%
#6/6%
#4/17%
#4/15%
#1/8%
#10/4%
#5/8%
#5/7%
#4/14%
#6/14%
#1/9%
Global IPO
#5/6%
#5/7%
#4/7%
Prime services2
US investment
grade
grade
US rates
US high yield
US leveraged loans
Global foreign
exchange4
exchange4
US securitized
products
products
US cash equities
US electronic trading
1 Rank from Greenwich Associates, market share based on Credit Suisse estimates
2 Rank and market share based on Credit Suisse estimates
3 Rank and market share from Greenwich Associates; 2012 survey not yet available
4 Rank and market share from Euromoney foreign exchange survey; 2012 data not yet available
5 Rank and market share from Dealogic
6 Emerging markets Dealogic data includes India, China, Indonesia, Brazil, Mexico, Russia, Middle East
and Africa
and Africa
Securities (Rank/market share)
Equities1
Fixed Income3
Underwriting and advisory (Rank/market share)
2011
2009
2010
Trend
M&A5
Debt Capital Markets5
Equity Capital Markets5
Total fees
Emerging Markets6
45
April 25, 2012
#9/4%
#3/9%
#5/8%
#7/16%
#4/13%
#1/9%
#4/7%
2012
2011
2009
2010
Top 3/
>10%
#3/13%
#3/15%
#6/8%
#8/6%
#5/9%
#8/7%
#6/9%
#7/8%
#2/15%
#3/12%
#3/14%
#2/18%
#3/13%
#3/14%
#9/3%
#8/4%
#8/5%
#3/13%
#3/13%
#1/14%
#2/12%
#1/13%
#1/13%
#1/8%
#1/11%
#1/11%
2012
#3/15%
-
#1/12%
#1/10%
-
-
-
-
-
Client market share momentum in Investment Banking
Selected European credit risk exposure at end 1Q12
April 25, 2012
46
Total Italy Spain Portugal Greece Ireland
Sovereigns
Exposure in EUR bn
Financial
institutions
institutions
Gross
Net
6.1 2.5 1.7 0.1 0.1 1.7whereof inventory 0.7 0.3 0.3 0.0 0.0 0.1
2.0 0.9 0.6 0.0 0.0 0.5Corporates&
other
other
Gross 5.7 2.4 1.9 0.2 0.5 0.7
Net 2.4 0.9 1.0 0.1 0.1 0.3
whereof inventory 0.3 0.2 0.1 0.0 0.0 0.0
Net
whereof inventory 0.1 0.1 0.0 0.0 0.0 0.0
1.1 1.1 0.0 0.0 0.0 0.0 Gross 4.4 4.0 0.0 0.2 0.2 0.0
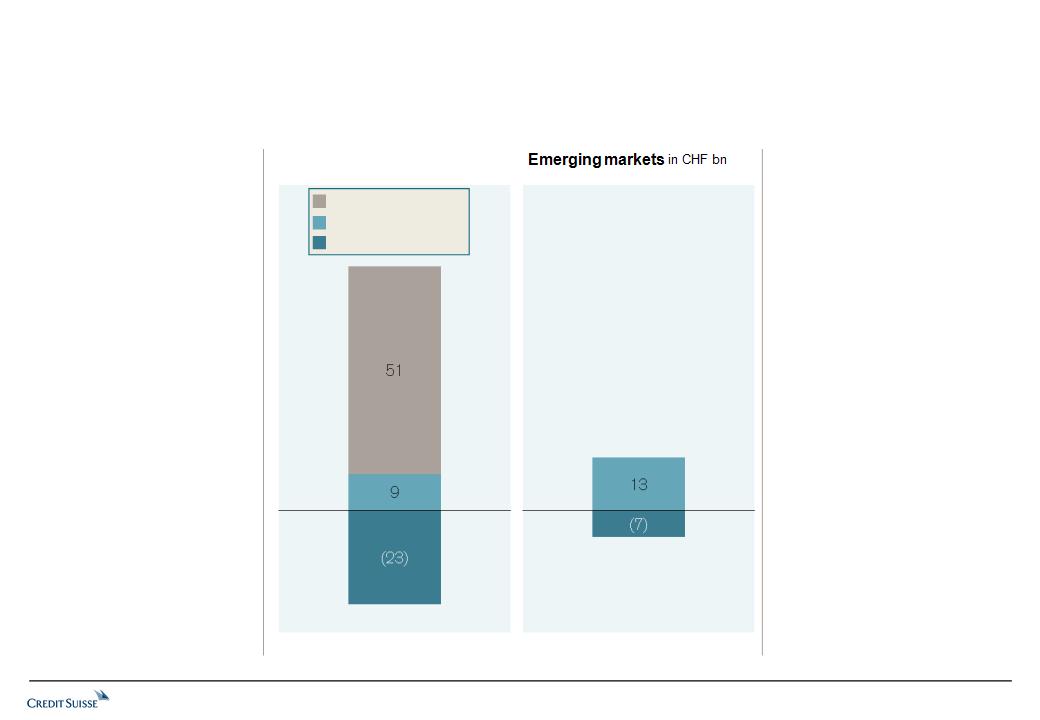
Average mark data is net of fair value discounts and credit provisions
47
April 25, 2012
Investment Banking loan book
Corporate loan portfolio is 75%
investment grade, and is mostly
(83%) accounted for on a fair
value basis
investment grade, and is mostly
(83%) accounted for on a fair
value basis
Fair value is a forward looking
view which balances accounting
risks, matching treatment of loans
and hedges
view which balances accounting
risks, matching treatment of loans
and hedges
Loans are carried at an average
mark of approx. 98% with average
mark of 97% in non-investment
grade portfolio
mark of approx. 98% with average
mark of 97% in non-investment
grade portfolio
Continuing good performance of
individual credits: no specific
provisions during the quarter
individual credits: no specific
provisions during the quarter
Developed markets in CHF bn
Funded loans
Unfunded commitments
Hedges
Well-diversified by name and
evenly spread between EMEA,
Americas and Asia and approx.
35% accounted for on a fair
value basis
evenly spread between EMEA,
Americas and Asia and approx.
35% accounted for on a fair
value basis
Emerging market loans are
carried at an average mark of
approx. 95%
carried at an average mark of
approx. 95%
No significant provisions during
1Q12
1Q12
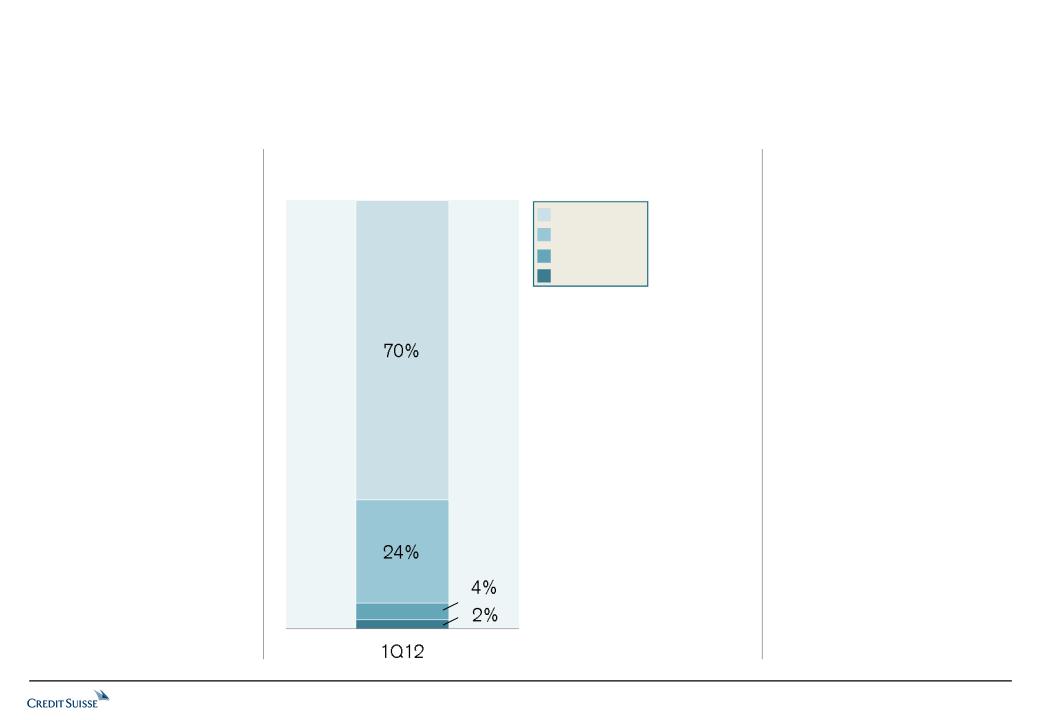
Portfolio ratings composition, by
transaction rating
transaction rating
Private Banking total loan
book of CHF 198 bn
book of CHF 198 bn
focused on Switzerland
more than 85%
collateralized
collateralized
BB+ to BB
BBB
BB- and below
AAA to A
48
April 25, 2012
Private Banking loan book
Wealth Management Clients
(CHF 140 bn)
(CHF 140 bn)
Portfolio remains geared towards
mortgages (CHF 95 bn) and
securities-backed lending
(CHF 38 bn)
mortgages (CHF 95 bn) and
securities-backed lending
(CHF 38 bn)
Lending is based on well-proven,
conservative standards
conservative standards
Lombard lending with excellent
credit quality despite increased
market volatility
credit quality despite increased
market volatility
Real estate prices are under special
focus
focus
Corporate & Institutional
Clients (CHF 58 bn)
Clients (CHF 58 bn)
Over 65% collateralized by
mortgages and securities
mortgages and securities
Counterparties mainly Swiss
corporates incl. real estate
industry
corporates incl. real estate
industry
Sound credit quality with low
concentrations
concentrations

SIGNATURES
Pursuant to the requirements of the Securities Exchange Act of 1934, the registrant has duly caused this report to be signed on its behalf by the undersigned, thereunto duly authorized.
| CREDIT SUISSE GROUP AG and CREDIT SUISSE AG | ||
| (Registrant) | ||
| By: | /s/ Brady W. Dougan Brady W. Dougan Chief Executive Officer Credit Suisse Group AG and Credit Suisse AG | |
/s/ David R. Mathers David R. Mathers Chief Financial Officer | ||
| Date: April 25, 2012 | Credit Suisse Group AG and Credit Suisse AG |